UNITED STATES
SECURITIES AND EXCHANGE COMMISSION
WASHINGTON, D.C. 20549
FORM 20-F
SECURITIES EXCHANGE ACT OF 1934
OR
EXCHANGE ACT OF 1934
For the fiscal year ended December 31, 2022
OR
EXCHANGE ACT OF 1934
OR
EXCHANGE ACT OF 1934
Date of event requiring this shell company report ______________
For the transition period from ________ to _______
Commission file number 1-14014
|
|
|
(Exact name of registrant as specified in its
charter)
|
|
|
|
(Jurisdiction of incorporation or organization)
|
|
Of our subsidiary
|
|
|
|
|
|
|
|
|
|
(Address of principal executive offices)
|
|
|
|
Chief Financial Officer
|
|
Credicorp Ltd
|
|
|
|
|
|
|
|
|
|
Phone (+
|
|
Facsimile (+
|
|
(Name, Telephone, Email and/or Facsimile number and Address of Company Contact Person)
|
Securities registered or to be registered pursuant to Section 12(b) of the Act.
|
Title of each class
|
Trading Symbol(s)
|
Name of each exchange on which registered
|
||
|
|
|
|
Securities registered or to be registered pursuant to Section 12(g) of the Act. None
Securities for which there is a reporting obligation pursuant to Section 15(d) of
the Act. None
Indicate the number of outstanding shares of each of the issuer’s classes of capital or common stock as of the close of the
period covered by the annual report.
Common Shares, par value $5.00 per share 94,382,317
Indicate by check mark if the registrant is a well-known seasoned issuer, as defined in Rule 405 of the Securities Act.
If this report is an annual or transition report, indicate by check mark if the registrant is not required to file reports
pursuant to Section 13 or 15(d) of the Securities Exchange Act of 1934.
Yes ☐ No ☒
Indicate by check mark whether the registrant (1) has filed all reports required to be filed by Section 13 or 15(d) of the
Securities Exchange Act of 1934 during the preceding 12 months (or for such shorter period that the registrant was required to file such reports), and (2) has been subject to such filing requirements for the past 90 days.
Indicate by check mark whether the registrant has submitted electronically every Interactive Data File required to be submitted
pursuant to Rule 405 of Regulation S-T (§232.405 of this chapter) during the preceding 12 months (or for such shorter period that the registrant was required to submit such files).
Indicate by check mark whether the registrant is a large accelerated filer, an accelerated filer, a non-accelerated filer, or
an emerging growth company. See the definitions of “large accelerated filer,” “accelerated filer,” and “emerging growth company” in Rule 12b-2 of the Exchange Act
|
|
☒
|
Accelerated filer
|
☐
|
|
|
Non-accelerated filer
|
☐
|
Emerging Growth Company
|
|
If an emerging growth company that prepares its financial statements in
accordance with U.S. GAAP, indicate by check mark if the registrant has elected not to use the extended transition period for complying with any new or revised financial accounting standards† provided pursuant to Section 13(a) of the Exchange Act ☐
† The term “new or revised financial accounting standard” refers to any update issued by the Financial Accounting Standards Board to its
Accounting Standards Codification after April 5, 2012.
Indicate by check mark whether the registrant has filed a report on and attestation to its management’s assessment of the effectiveness of its internal
control over financial reporting under Section 404(b) of the Sarbanes-Oxley Act (15 U.S.C. 7262(b)) by the registered public accounting firm that prepared or issued its audit report. ☒
If securities are registered pursuant to Section 12(b) of the Act, indicate by check mark whether the
financial statements of the registrant included in the filing reflect the correction of an error to previously issued financial statements. 
Indicate by check mark whether any of those error corrections are restatements that required a
recovery analysis of incentive based compensation received by any of the registrant’s executive officers during the relevant recovery period pursuant to §240.10D-1(b).
Indicate by check mark which basis of accounting the registrant has used to prepare the financial
statements included in this filing:
|
U.S. GAAP ☐
|
|
Other ☐
|
|
by the International Accounting Standards Board ☒
|
If “Other” has been checked in response to the previous question, indicate by check mark which financial statement item the
registrant has elected to follow.
Item 17 ☐ Item 18 ☐
If this is an annual report, indicate by check mark whether the registrant is a shell company (as defined in Rule 12b-2 of the
Exchange Act).
Yes ☐ No ☒
| 2 | ||||
|
10
|
||||
|
12
|
||||
|
14
|
||||
|
14
|
||||
|
14
|
||||
|
14
|
||||
|
14
|
||||
|
17
|
||||
|
17
|
||||
|
17
|
||||
|
52
|
||||
|
52
|
||||
|
60
|
||||
|
60
|
||||
|
75
|
||||
|
75
|
||||
|
97
|
||||
|
100
|
||||
|
105
|
||||
|
107
|
||||
|
113
|
||||
|
116
|
||||
|
116
|
||||
|
120
|
||||
|
124
|
||||
|
128
|
||||
|
129
|
||||
|
129
|
||||
|
133
|
||||
|
168
|
||||
|
168
|
||||
|
172
|
||||
|
175
|
||||
|
188
|
||||
|
190
|
||||
|
190
|
||||
|
191
|
||||
|
191
|
||||
|
191
|
||||
|
191
|
||||
|
203
|
||||
|
222
|
||||
|
232
|
||||
|
242
|
||||
|
259
|
||||
|
269
|
||||
|
269
|
||||
|
273
|
||||
|
274
|
||||
|
274
|
||||
2
|
285
|
|||
|
287
|
|||
|
293
|
|||
|
294
|
|||
|
295
|
|||
|
295
|
|||
|
295
|
|||
|
299
|
|||
|
300
|
|||
|
300
|
|||
|
306
|
|||
|
307
|
|||
|
307
|
|||
|
307
|
|||
|
307
|
|||
|
309
|
|||
|
309
|
|||
|
310
|
|||
|
310
|
|||
|
310
|
|||
|
310
|
|||
|
314
|
|||
|
314
|
|||
|
315
|
|||
|
326
|
|||
|
326
|
|||
|
327
|
|||
|
327
|
|||
|
327
|
|||
|
328
|
|||
|
330
|
|||
|
332
|
|||
|
333
|
|||
|
334
|
|||
|
340
|
|||
|
343
|
|||
|
358
|
|||
|
359
|
|||
|
359
|
|||
|
360
|
|||
|
360
|
|||
|
360
|
|||
|
360
|
|||
|
360
|
|||
|
360
|
|||
|
360
|
|||
|
360
|
|||
|
361
|
|||
|
365
|
|||
|
365
|
|||
|
366
|
|||
3
|
366
|
|||
|
369
|
|||
|
370
|
|||
|
370
|
|||
|
370
|
|||
|
371
|
|||
|
377
|
|||
|
381
|
|||
|
381
|
|||
|
381
|
|||
|
381
|
|||
|
381
|
|||
|
381
|
|||
|
382
|
|||
ABBREVIATIONS
|
Abbreviations
|
Meaning
|
|
|
AFP
|
Administradora de Fondo de Pensiones or Private Pension Funds Administrators
|
|
|
ALCO
|
Asset and Liabilities Committee
|
|
|
ALM
|
Asset and Liabilities Management
|
|
|
AML
|
Anti-Money Laundering
|
|
|
AMV
|
Autorregulador del Mercado de Valores de Colombia or Colombia’s Stock Market Self-regulator
|
|
|
ANPDP
|
Autoridad Nacional de Protección de Datos Personales del Perú or National Authority
for the Protection of Personal Data of Peru
|
|
|
APS
|
Autoridad de Fiscalización y Control de Pensiones y Seguros de Bolivia or Supervision and Control Authority for Pensions and
Insurance of Bolivia
|
|
|
ARRC
|
Alternative Reference Rates Committee
|
|
|
ASB
|
Atlantic Security Bank, currently ASB Bank Corp.
|
|
|
ASBANC
|
Asociación de Bancos del Perú or Association of Banks of Peru
|
|
|
ASFI
|
Autoridad Supervisora del Sistema Financiero or Financial System Supervisory Authority – Bolivia
|
|
|
ASHC
|
Atlantic Security Holding Corporation
|
|
|
ASOMIF
|
Asociación de Instituciones de Microfinanzas del Peru or Association of Microfinance Institutions of Peru
|
|
|
ATM
|
Automated Teller Machine (cash machine)
|
|
|
Bancompartir
|
Banco Compartir S.A., now Mibanco Colombia
|
|
|
BCB
|
Banco Central de Bolivia or Bolivian Central Bank
|
|
|
BCCh
|
Banco Central de Chile or Central Bank of Chile
|
|
|
BCM
|
Business Continuity Management
|
|
|
BCP Bolivia
|
Banco de Crédito de Bolivia S.A.
|
|
|
BCP Consolidated
|
BCP Consolidated includes BCP Stand-alone, Mibanco and Solución Empresa Administradora Hipotecaria
|
|
|
BCP Miami
|
Banco de Crédito del Perú, Miami Agency
|
|
|
BCP Panama
|
Banco de Crédito del Perú, Panama Branch
|
|
|
BCP Stand-alone
|
Banco de Crédito del Perú including BCP Panama (Panama Branch) and BCP Miami (Miami Agency), but excluding subsidiaries
|
|
|
BCRP
|
Banco Central de Reserva del Perú or Peruvian Central Bank
|
|
|
BLMIS
|
Bernard L. Madoff Investment Securities LLC.
|
|
|
BOB
|
Bolivianos – Bolivian Currency
|
|
|
Bps
|
Basis Points
|
|
|
BVL
|
Bolsa de Valores de Lima or Lima Stock Exchange
|
|
|
CAS
|
Contrato Administrativo de Servicios or Administrative Contracting of Services
|
|
|
CCSI
|
Credicorp Capital Securities Inc.
|
|
|
CEO
|
Chief Executive Officer
|
|
CET1
|
Common Equity Tier I
|
|
|
CGU
|
Cash-Generating Unit
|
|
|
CID
|
Corporate and International Division
|
|
|
CIMA
|
Cayman Islands Monetary Authority
|
|
|
CINO
|
Chief Innovation Officer
|
|
|
CLP
|
Chilean Peso – Chilean Currency
|
|
|
CMF
|
Comisión para el Mercado Financiero or Financial Markets Commission of Chile
|
|
|
CODM
|
Chief Operating Decision Maker
|
|
|
CoE
|
Center Of Excellence
|
|
|
COFIDE
|
Corporación Financiera de Desarrollo S.A. or Peruvian Government-Owned Development Bank
|
|
|
CONFIEP
|
Confederación Nacional de Instituciones Empresariales Privadas or National Confederation of Private Business Institutions in Peru
|
|
|
COO
|
Chief Operating Officer
|
|
|
Consolidated Supervision of Financial and Mixed Conglomerates Regulation
|
SBS Resolution No. 11823-2010, Reglamento para la Supervisión Consolidada de los Conglomerados Financieros y Mixtos
|
|
|
COOPACS
|
Cooperativa de Ahorro y Créditos de Peru or Savings and Loans Associations of Peru
|
|
|
COP
|
Colombian Peso – Colombian Currency
|
|
|
COSO
|
Committee of Sponsoring Organizations of the Treadway Commission
|
|
|
CPS
|
Comisión de Protección Social or Social Protection Committee of Peru
|
|
|
CSF
|
Cybersecurity Framework
|
|
|
Credicorp Capital
|
Credicorp Capital Ltd., formerly Credicorp Investments Ltd.
|
|
|
Credicorp Capital Bolsa
|
Credicorp Capital Sociedad Agente de Bolsa S.A., formerly Credibolsa SAB S.A.
|
|
|
Credicorp Capital Chile
|
Credicorp Capital Chile S.A., operating subsidiary of Credicorp Capital Holding Chile
|
|
|
Credicorp Capital Colombia
|
Credicorp Capital Colombia S.A., formerly Correval S.A.
|
|
|
Credicorp Capital Fondos
|
Credicorp Capital Sociedad Administradora de Fondos S.A., formerly Credifondo SAFI S.A.
|
|
|
Credicorp Capital Holding Chile
|
Credicorp Capital Holding Chile S.A., holding subsidiary of Credicorp Capital Ltd.
|
|
|
Credicorp Capital Holding Colombia
|
Credicorp Capital Holding Colombia S.A.S., holding subsidiary of Credicorp Capital Ltd.
|
|
|
Credicorp Holding Colombia
|
Credicorp Holding Colombia S.A.S., holding subsidiary of Credicorp Ltd., which holds Credicorp Capital Colombia S.A.S. and Mibanco – Banco de la Microempresa de Colombia S.A.
|
|
|
Credicorp Capital Holding Peru
|
Credicorp Capital Holding Peru S.A., holding subsidiary of Credicorp Capital Ltd.
|
|
|
Credicorp Capital Peru
|
Credicorp Capital Peru S.A.A., operating subsidiary of Credicorp Capital Holding Peru, and formerly BCP Capital S.A.A.
|
|
|
Credicorp Capital Servicios Financieros
|
Credicorp Capital Servicios Financieros S.A., formerly BCP Capital Financial Services S.A.
|
|
|
Credicorp Capital Titulizadora
|
Credicorp Capital Sociedad Titulizadora S.A., formerly Credititulos S.A.
|
|
CRS
|
Common Reporting Standards
|
|
|
CTF
|
Counter-Terrorism Financing
|
|
|
Culqi
|
Compañia Incubadora de Soluciones Moviles S.A.
|
|
|
DANE
|
Departamento Administrativo Nacional de Estadísticas or Colombian National Statistics Bureau
|
|
|
D&S
|
Disability and Survivorship
|
|
|
Deposit Insurance Fund
|
Fondo de Seguro de Depósitos or Deposit Insurance Fund of Peru
|
|
|
DIAN
|
Dirección de Impuestos y Aduanas Nacionales de Colombia or Taxes and National Customs Authority of Colombia
|
|
|
DTA
|
Deferred Tax Assets
|
|
|
Edpymes
|
Empresas de Crédito or Small and Micro Firm Development Institution, formerly Empresas de
Desarrollo de Pequeña y Microempresa (Legislative Decree No. 1531)
|
|
|
Edyficar
|
Empresa Financiera Edyficar S.A. – Perú
|
|
|
EIR
|
Effective Interest Rate
|
|
|
Encumbra
|
Empresa Financiera Edyficar S.A.S. – Colombia
|
|
|
EPS
|
Entidad Prestadora de Salud or Health Care Facility
|
|
|
ENPS
|
Employee Net Promoter Score
|
|
|
ES Act
|
Economic Substance Act 2018 (as amended) of Bermuda
|
|
|
EY
|
Ernst & Young LLP
|
|
|
FAE
|
Fondo de Apoyo Empresarial del Perú or Business Support Fund of Peru
|
|
|
FAE-Mype
|
Fondo de Apoyo Empresarial a la Mype del Perú or SME Business Support Fund of Peru
|
|
|
FATCA
|
Foreign Account Tax Compliance Act
|
|
|
FCA
|
Financial Conduct Authority – United Kingdom
|
|
|
FED
|
Board of Governors of the U.S. Federal Reserve System
|
|
|
FFIEC
|
Federal Financial Institutions Examination Council
|
|
|
FIBA
|
Financial and International Business Association, formerly Florida International Bankers Association
|
|
|
FINRA
|
Financial Industry Regulatory Authority – US
|
|
|
Fintech
|
Financial Technology
|
|
|
FMV
|
Fair market value
|
|
|
Fondemi
|
Fondo de Desarrollo de la Microempresa del Perú or SMEs Development Fund of Peru
|
|
|
GAAP
|
Generally Accepted Accounting Principles
|
|
|
GDP
|
Gross Domestic Product
|
|
|
Grupo Pacífico
|
Pacífico Compañía de Seguros y Reaseguros S.A. and consolidated subsidiaries
|
|
|
IASB
|
International Accounting Standards Board
|
|
|
IBA
|
ICE Benchmark Administration Limited
|
|
|
IBNR
|
Incurred but not reported
|
|
|
ICBSA
|
Inversiones Credicorp Bolivia S.A.
|
|
INDECOPI
|
Instituto Nacional de Defensa de la Competencia y de la Protección de la Propiedad Intelectual del Perú or National Institute
for the Defense of Competition and the Protection of Intellectual Property
|
|
|
IFRS
|
International Financial Reporting Standards
|
|
|
IGA
|
Intergovernmental Agreements
|
|
|
IIA
|
Institute of Internal Auditors
|
|
|
IMF
|
International Monetary Fund
|
|
|
IMO
|
Innovation Management Office
|
|
|
INE
|
National Statistics Institute of Chile
|
|
|
INEI
|
Instituto Nacional de Estadística e Informática or Peruvian National institute of Statistic and Informatics
|
|
|
IPO
|
Initial Public Offering
|
|
|
IRS
|
Internal Revenue Service
|
|
|
ISACA
|
Information Systems Audit and Control Association
|
|
|
IT
|
Information Technology
|
|
|
IUs
|
Innovation Units
|
|
|
KRI
|
Key Risk Indicators
|
|
|
LCR
|
Liquidity Coverage Ratio
|
|
|
LGD
|
Loss Given Default
|
|
|
LIBOR
|
London Interbank Offered Rate
|
|
|
LoB
|
Lines of Business
|
|
|
LTV
|
Loan to Value
|
|
|
MEF
|
Ministry of Economy and Finance of Peru
|
|
|
Merger Control Law
|
Law No. 31112, Ley que establece el control previo de operaciones de concentración empresarial
|
|
|
Mibanco
|
Mibanco, Banco de la Microempresa S.A.
|
|
|
Mibanco Colombia
|
Mibanco, Banco de la Microempresa de Colombia S.A.
|
|
|
MMD
|
Middle-Market Banking Division
|
|
|
Mype
|
Micro y Pequeña Empresa or Micro and Small Enterprise
|
|
|
NIM
|
Net Interest Margin
|
|
|
NIST
|
National Institute of Standards and Technology
|
|
|
NPS
|
Net Promoter Score
|
|
|
NYSE
|
New York Stock Exchange
|
|
|
OECD
|
Organization for Economic Cooperation and Development
|
|
|
P&C
|
Property and Casualty
|
|
|
Pacífico Seguros
|
Pacífico Compañía de Seguros y Reaseguros S.A.
|
|
|
PEN
|
Peruvian Sol (S/) – Peruvian Currency
|
|
|
Peruvian Banking and Insurance Law
|
Law No. 26702, Ley General del Sistema Financiero y del Sistema de Seguros y Orgánica de la Superintendencia de Banca y Seguros
|
|
|
PPS
|
Peruvian Private Pension System
|
|
|
RBG
|
Retail Banking Group
|
|
|
ROAA
|
Return on Average Assets
|
|
ROAE
|
Return on Average Equity
|
|
|
ROE
|
Return on equity
|
|
|
RWAs
|
Risk-Weighted Asset
|
|
|
S&P
|
Standard and Poor’s
|
|
|
SBP
|
Superintendencia de Bancos de Panamá or Superintendency of Banks of Panama
|
|
|
SBS
|
Superintendencia de Banca, Seguros y Administradoras Privadas de Fondos de Pensiones or Superintendence of Banks, Insurance and
Pension Funds – Peru
|
|
|
SCTR
|
Seguro Complementario de Trabajo de Riesgo or Complementary Work Risk Insurance
|
|
|
SEAH
|
Solución Empresa Administradora Hipotecaria S.A.
|
|
|
SEC
|
U.S. Securities and Exchange Commission
|
|
|
SFC
|
Superintendencia Financiera de Colombia or Financial Superintendence of Colombia
|
|
|
SME
|
Small and Medium Enterprise
|
|
|
SME – Business
|
SME-Business Credicorp Segment
|
|
|
SME – Pyme
|
SME-Pyme Credicorp Segment
|
|
|
SMV
|
Superintendencia del Mercado de Valores or Superintendence of the Securities Market – Peru
|
|
|
SOFR
|
Secured Overnight Financing Rate
|
|
|
SUNAT
|
Superintendencia Nacional de Aduanas y de Administración Tributaria or Superintendence of Tax Administration – Peru
|
|
|
SUSALUD
|
Superintendencia Nacional de Salud del Perú or National Health Superintendence of Peru
|
|
|
Soles
|
Peruvian currency (S/ - PEN)
|
|
|
Tenpo
|
Tenpo SpA (formerly Krealo SpA)
|
|
|
Tyba
|
Credicorp Capital Negocios Digitales S.A.S.
|
|
|
U.S. Dollar
|
United States currency (also $, US$, Dollars or U.S. Dollars)
|
|
|
USA
|
United States of America (USA, U.S.A., US or U.S.)
|
|
|
USDPEN
|
Currency exchange rate between the U.S. Dollar and the Peruvian Sol
|
|
|
Usury Law Regulation
|
Law No. 31143, Ley que protege de la usura a los consumidores de los servicios financieros
|
|
|
VaR
|
Value at Risk
|
|
|
VAT
|
Value-added tax
|
|
|
Wally
|
Wally POS S.A.C.
|
|
|
WBG
|
Wholesale Banking Group
|
|
|
WHO
|
World Health Organization
|
|
|
WTI
|
West Texas Intermediate
|
Credicorp Ltd. is a Bermuda exempted company (and is referred to in this Annual Report as Credicorp, the Company, the Group, we, or us, each of which means either Credicorp Ltd.
as a separate entity or as an entity together with our consolidated subsidiaries, as the context may require). We maintain our financial books and records in Peruvian Soles and present our financial statements in accordance with International
Financial Reporting Standards (IFRS), as issued by the International Accounting Standards Board (IASB). IFRS differ in certain respects from Generally Accepted Accounting Principles (GAAP) in the United States.
We operate primarily through our four lines of business (LoBs): Universal Banking, Microfinance, Insurance & Pensions, and Investment Banking & Wealth Management.
Additionally, we complement the operations of our LoBs through our innovation portfolio which is managed by the Innovation Committee at the Credicorp level. For more information about our innovation portfolio and strategy, please review “ITEM 4.
INFORMATION ON THE COMPANY – 4.B Business Overview – (1) Credicorp Overview – Our Innovation Strategy”.
Our eight main operating subsidiaries are:
| • |
Within Universal Banking: (i) Banco de Crédito del Perú S.A. (BCP Stand-alone), a Peruvian financial institution; and (ii) Banco de Crédito de Bolivia S.A. (BCP Bolivia) a commercial bank that operates in Bolivia and that we hold through
Inversiones Credicorp Bolivia S.A. (ICBSA);
|
| • |
Within Microfinance: (iii) Mibanco, Banco de la Microempresa S.A. (Mibanco), a Peruvian banking entity oriented toward the micro and small business sector; and (iv) Mibanco – Banco de la Microempresa de Colombia S.A. (Mibanco Colombia),
which resulted from the merger between Banco Compartir S.A. (Bancompartir) and Edyficar S.A.S. (Encumbra), which we hold through Credicorp Holding Colombia S.A.S.;
|
| • |
Within Insurance and Pensions: (v) Pacífico Compañía de Seguros y Reaseguros S.A. (Pacífico Seguros and, together with its consolidated subsidiaries, Grupo Pacífico), an entity that contracts and manages all types of general risk and
life insurance, reinsurance and property investment and financial operations; and (vi) Prima AFP, a private pension fund; and
|
| • |
Finally, within Investment Banking and Wealth Management: (vii) Credicorp Capital Ltd. (together with its subsidiaries) was formed in 2012, and (viii) ASB Bank Corp., resulted from the merger between ASB Bank Corp. and Atlantic Security
Bank, which we hold through Atlantic Security Holding Corporation (ASHC).
|
For information about these LoBs, see “ITEM 4. INFORMATION ON THE COMPANY – 4.B Business Overview – (2) Lines of Business (LoBs)”.
As of and for the year ended December 31, 2022, BCP Stand-alone represented 75.1% of our total assets and 70.4% of our equity attributable to Credicorp’s equity holders (that
is, its shareholders). Unless otherwise specified, the financial information for BCP Stand-alone, BCP Bolivia, Mibanco, Mibanco Colombia, ASB Bank Corp., Grupo Pacífico, Prima AFP and Credicorp Capital included in this Annual Report is presented in
accordance with IFRS and before eliminations for consolidation purposes. See “ITEM 3. KEY INFORMATION – 3.A Selected Financial Data” and “ITEM 4. INFORMATION ON THE COMPANY – 4.A History and Development of the Company”. We refer to BCP Stand-alone,
BCP Bolivia, Mibanco, Mibanco Colombia, Grupo Pacífico, Prima AFP, Credicorp Capital and ASB as our main operating subsidiaries.
“ITEM 3. KEY INFORMATION – 3.A Selected Financial Data” contains key information related to our performance. This information was obtained mainly from our consolidated financial
statements as of December 31, 2020, 2021 and 2022.
Unless otherwise specified or the context otherwise requires, references in this Annual Report to “S/”, “Sol”, “local currency” or “Soles” are to Peruvian Soles (each Sol is
divided into 100 centimos (cents)), and references to “$”, “US$,” “Dollars”, “US Dollars” or “U.S. Dollars” are to United States Dollars. In addition, references to USDPEN are the currency exchange rate between the U.S. Dollar and the Peruvian Sol.
Some of our subsidiaries, namely Atlantic Security Holding and five of its subsidiaries (Atlantic Security International Financial Services Inc (ASIF), ASB Bank Corp., Atlantic
Private Equity Investment Advisor, Atlantic Security Private Equity General Partner, Credicorp Capital Cayman GP), Credicorp Capital USA Inc. (with its subsidiaries Credicorp Capital Advisors LLC., Credicorp Capital LLC. and Tyba LLC.) and
Credicorp Capital Asset Management Administradora General de Fondos maintain their operations and balances in US Dollars and other currencies. As a result, in certain instances throughout this Annual Report, we have translated US Dollars and other
currencies to Soles. You should not construe any of these translations as representations that the US Dollar amounts actually represent such equivalent Sol amounts or that such US Dollar amounts could be converted into Soles at the rate indicated,
as of the dates mentioned herein, or at all. Unless otherwise indicated, these Sol amounts have been translated from US Dollar amounts at an exchange rate of S/3.814= US$1.00, which is the December 31, 2022 exchange rate set by the Peruvian
Superintendence of Banks, Insurance and Pension Funds (Superintendencia de Banca, Seguros y Administradoras Privadas de Fondos de Pensiones or SBS by its Spanish initials), S/3,987 and S/3,621 per dollar as of December 31, 2021 and 2020,
respectively. Converting US Dollars to Soles on a specified date (at the prevailing exchange rate on that date) may result in the presentation of Sol amounts that are different from the Sol amounts that would result by converting the same amount of
US Dollars on a different specified date (at the prevailing exchange rate on such date). Our Bolivian subsidiary operates in Bolivianos (BOB). For consolidation purposes, our Bolivian subsidiary’s financial statements are also presented in Soles.
Our Colombian and Chilean subsidiaries operate in Colombian Pesos (COP) and Chilean Pesos (CLP), respectively, and their financial statements are also converted into Soles for consolidation purposes.
Our management’s criteria for translating foreign currency, for the purpose of preparing Credicorp’s consolidated financial statements, are described in “ITEM 5. OPERATING AND
FINANCIAL REVIEW AND PROSPECTS – 5.A Operating Results – (3) Critical Accounting Policies – 3.3 Foreign Exchange”.
Certain statements contained in this Annual Report are not historical facts, including, without limitation, certain statements made in the sections titled “ITEM 3. KEY
INFORMATION”, “ITEM 4. INFORMATION ON THE COMPANY”, “ITEM 5. OPERATING AND FINANCIAL REVIEW AND PROSPECTS” and “ITEM 11. QUANTITATIVE AND QUALITATIVE DISCLOSURES ABOUT RISK MANAGEMENT”, which are forward-looking statements within the meaning of
Section 27A of the U.S. Securities Act of 1933, as amended, and Section 21E of the U.S. Securities Exchange Act of 1934, as amended (the Exchange Act). You can find many of these statements by looking for words such as “believes”, “expects”,
“anticipates”, “estimates”, “intends”, “plans”, “goal”, “seek”, “project”, “strategy”, “future”, “likely”, “should”, “will”, “would”, “may”, or other similar expressions referring to future periods.
Forward-looking statements are based only on our management’s current views and assumptions and involve known and unknown risks and uncertainties that could cause actual
results, performance, or events to differ materially from those expressed or implied in the forward-looking statements. Therefore, actual results, performance, or events may be materially different from those in the forward-looking statements due
to, without limitation, the following factors:
| a) |
Economic conditions and regulatory framework in Peru and markets in which we operate;
|
| b) |
The occurrence of natural disasters or political or social instability in Peru and markets in which we operate;
|
| c) |
The adequacy of the dividends that our subsidiaries are able to pay to us, which may affect our ability to pay dividends to shareholders and corporate expenses;
|
| d) |
Performance of, and volatility in, financial markets, including in Latin America and other emerging markets;
|
| e) |
The frequency, severity, and types of insured loss events;
|
| f) |
Fluctuations in interest rate and liquidity levels;
|
| g) |
Foreign currency exchange rates, including the Sol/US Dollar exchange rate;
|
| h) |
Deterioration in the quality of our loan portfolio;
|
| i) |
Increasing levels of competition in Peru and markets in which we operate;
|
| j) |
Developments and changes in laws and regulations affecting the financial sector and adoption of new international guidelines;
|
| k) |
Changes in the policies of central banks and/or foreign governments;
|
| l) |
Effectiveness of our risk management policies and of our operational and security systems;
|
| m) |
Emerging cybersecurity and environmental risks;
|
| n) |
Losses associated with counterparty exposures;
|
| o) |
The coronavirus disease 2019 (COVID-19) pandemic and/or other public health crises beyond our control; and
|
| p) |
Changes in Bermuda laws and regulations applicable to so-called non-resident entities.
|
See “ITEM 3. KEY INFORMATION - 3.D Risk Factors” and “ITEM 5. OPERATING AND FINANCIAL REVIEW AND PROSPECTS” for additional information and other such factors.
Any forward-looking statement made by us in this Annual Report is based only on information currently available to us and is made only as of the date on which it is made, and
you are cautioned not to place any undue reliance on any such statement. We are not under any obligation to, and we expressly disclaim any obligation to, update or alter any forward-looking statements contained in this Annual Report, whether as a
result of new information, future events or otherwise.
| ITEM 1. |
IDENTITY OF DIRECTORS, SENIOR MANAGEMENT AND ADVISERS
|
Not applicable.
| ITEM 2. |
OFFER STATISTICS AND EXPECTED TIMETABLE
|
Not applicable.
| ITEM 3. |
KEY INFORMATION
|
| A. |
Selected Financial Data
|
The following table presents a summary of our consolidated financial information at the dates and for the periods indicated. This selected financial data is presented in Soles.
You should read this information in conjunction with and qualify this information in its entirety by reference to, the consolidated financial statements, which are also presented in Soles.
The summary of our consolidated financial data as of, and for the years ended, December 31, 2020, 2021 and 2022 were derived from the consolidated financial statements audited
by Gaveglio, Aparicio y Asociados S.C.R.L, a member firm of PricewaterhouseCoopers International Limited, independent registered public accountants.
The report of Gaveglio, Aparicio y Asociados S.C.R.L on the consolidated financial statements as of December 31, 2021, and 2022 and for the years ended December 31, 2020, 2021
and 2022 appears elsewhere in this Annual Report.
SELECTED FINANCIAL DATA
|
Year ended December 31,
|
||||||||||||||||
|
2020
|
2021
|
2022
|
2022
|
|||||||||||||
|
(In thousands of Soles, except percentages, ratios, and per common share data)
|
In thousands
of US Dollars (1)
|
|||||||||||||||
|
INCOME STATEMENT DATA:
|
||||||||||||||||
|
IFRS:
|
||||||||||||||||
|
Interest and similar income
|
11,547,648
|
11,850,406
|
15,011,282
|
3,935,837
|
||||||||||||
|
Interest and similar expenses
|
(2,978,696
|
)
|
(2,490,802
|
)
|
(3,493,187
|
)
|
(915,885
|
)
|
||||||||
|
Net Interest, similar income and expenses
|
8,568,952
|
9,359,604
|
11,518,095
|
3,019,952
|
||||||||||||
|
Provision for credit losses on loan portfolio (2)
|
(6,080,289
|
)
|
(1,558,951
|
)
|
(2,158,555
|
)
|
(565,957
|
)
|
||||||||
|
Recoveries of written-off loans
|
159,781
|
346,728
|
347,017
|
90,985
|
||||||||||||
|
Provision for credit losses on loan portfolio, net of recoveries
|
(5,920,508
|
)
|
(1,212,223
|
)
|
(1,811,538
|
)
|
(474,972
|
)
|
||||||||
|
Net interest, similar income and expenses, after provision for credit losses on loan portfolio
|
2,648,444
|
8,147,381
|
9,706,557
|
2,544,980
|
||||||||||||
|
Commissions and fees
|
2,912,778
|
3,493,734
|
3,640,319
|
954,462
|
||||||||||||
|
Net gain on foreign exchange transactions
|
638,238
|
922,917
|
1,084,151
|
284,256
|
||||||||||||
|
Net gain on securities
|
523,082
|
28,650
|
5,468
|
1,434
|
||||||||||||
|
Net gain on derivatives held for trading
|
(13,401
|
)
|
221,064
|
65,187
|
17,092
|
|||||||||||
|
Net result from exchange differences
|
58,539
|
(3,215
|
)
|
(16,158
|
)
|
(4,236
|
)
|
|||||||||
|
Other income
|
289,037
|
266,567
|
329,382
|
86,361
|
||||||||||||
|
Total non-interest income
|
4,408,273
|
4,929,717
|
5,108,349
|
1,339,369
|
||||||||||||
|
Net premiums earned
|
2,428,060
|
2,671,530
|
2,873,295
|
753,355
|
||||||||||||
|
Net claims incurred for life, general and health insurance contracts
|
(1,708,113
|
)
|
(2,341,917
|
)
|
(1,929,890
|
)
|
(506,002
|
)
|
||||||||
|
Acquisition cost
|
(361,814
|
)
|
(333,334
|
)
|
(281,807
|
)
|
(73,888
|
)
|
||||||||
|
Total other expenses (3)
|
(7,190,689
|
)
|
(7,740,561
|
)
|
(8,620,615
|
)
|
(2,260,256
|
)
|
||||||||
|
Profit before income tax
|
224,161
|
5,332,816
|
6,855,889
|
1,797,558
|
||||||||||||
|
Income tax
|
109,977
|
(1,660,987
|
)
|
(2,110,501
|
)
|
(553,356
|
)
|
|||||||||
|
Net profit
|
334,138
|
3,671,829
|
4,745,388
|
1,244,202
|
||||||||||||
|
Attributable to:
|
||||||||||||||||
|
Credicorp’s equity holders
|
346,894
|
3,584,582
|
4,633,096
|
1,214,760
|
||||||||||||
|
Non-controlling interest
|
(12,756
|
)
|
87,247
|
112,292
|
29,442
|
|||||||||||
|
Number of shares as adjusted to reflect changes in capital (4)
|
79,467,865
|
79,531,948
|
79,533,095
|
-
|
||||||||||||
|
Net basic earnings per common share attributable to Credicorp’s equity holders (5)
|
4.37
|
45.09
|
58.26
|
15.28
|
||||||||||||
|
Net dilutive earnings per common share attributable to Credicorp’s equity holders (5)
|
4.36
|
44.99
|
58.13
|
15.24
|
||||||||||||
|
Cash dividends declared per common share Soles (6)
|
5.0
|
15.0
|
-
|
-
|
||||||||||||
|
As of December 31,
|
||||||||||||||||
|
2020
|
2021
|
2022
|
2022
|
|||||||||||||
|
(In thousands of Soles, except percentages, ratios, and per common share data)
|
In thousands
of US Dollars (1)
|
|||||||||||||||
|
STATEMENT OF FINANCIAL POSITION DATA:
|
||||||||||||||||
|
IFRS:
|
||||||||||||||||
|
Total assets
|
237,406,163
|
244,846,740
|
236,753,609
|
62,074,884
|
||||||||||||
|
Total loans (7)
|
137,659,885
|
147,597,412
|
148,626,374
|
38,968,635
|
||||||||||||
|
Allowance for loan losses (2)
|
(10,435,623
|
)
|
(9,071,011
|
)
|
(8,530,986
|
)
|
(2,236,756
|
)
|
||||||||
|
Total deposits (8)
|
141,660,321
|
149,596,545
|
147,020,787
|
38,547,663
|
||||||||||||
|
Equity attributable to Credicorp’s equity holders
|
24,945,870
|
26,496,767
|
28,988,140
|
7,600,456
|
||||||||||||
|
Non-controlling interest
|
499,777
|
540,672
|
591,569
|
155,105
|
||||||||||||
|
Total equity
|
25,445,647
|
27,037,439
|
29,579,709
|
7,755,561
|
||||||||||||
|
As of and for the year ended December 31,
|
||||||||||||
|
2020
|
2021
|
2022
|
||||||||||
|
SELECTED RATIOS
|
||||||||||||
|
IFRS:
|
||||||||||||
|
Net interest margin (NIM) (9)
|
4.30
|
%
|
4.10
|
%
|
5.09
|
%
|
||||||
|
Return on average total assets (ROAA) (10)
|
0.16
|
%
|
1.49
|
%
|
1.92
|
%
|
||||||
|
Return on average equity (ROAE) (11)
|
1.36
|
%
|
13.94
|
%
|
16.70
|
%
|
||||||
|
Operating efficiency (12)
|
45.09
|
%
|
44.96
|
%
|
43.66
|
%
|
||||||
|
Operating expenses as a percentage of average assets (13)
|
3.11
|
%
|
3.12
|
%
|
3.49
|
%
|
||||||
|
Equity attributable to Credicorp’s equity holders as a percentage of period end total assets
|
10.51
|
%
|
10.82
|
%
|
12.24
|
%
|
||||||
|
Regulatory capital as a percentage of risk weighted assets – BIS ratio (14)
|
16.44
|
%
|
16.71
|
%
|
19.31
|
%
|
||||||
|
Total internal overdue loan amounts as a percentage of total loans (15)
|
3.40
|
%
|
3.77
|
%
|
4.00
|
%
|
||||||
|
Allowance for direct loan losses as a percentage of total loans
|
7.19
|
%
|
5.74
|
%
|
5.30
|
%
|
||||||
|
Allowance for loan losses as a percentage of total loans and other off-balance-sheet items (16)
|
6.58
|
%
|
5.32
|
%
|
5.03
|
%
|
||||||
|
Allowance for direct loan losses as a percentage of total internal overdue loans (17)
|
211.26
|
%
|
152.40
|
%
|
132.40
|
%
|
||||||
|
Allowance for direct loan losses as a percentage of impaired loans (18)
|
100.94
|
%
|
75.13
|
%
|
73.79
|
%
|
||||||
|
Dividend payout ratio (19)
|
114.42
|
%
|
33.27
|
%
|
-
|
|||||||
|
Equity to assets ratio (20)
|
11.05
|
%
|
10.21
|
%
|
10.46
|
%
|
||||||
|
Shareholders’ equity to assets ratio (21)
|
11.28
|
%
|
10.41
|
%
|
10.24
|
%
|
||||||
Note: Total internal overdue loans include overdue and under legal collection loans.
| (1) |
Translated for convenience only from Sol amounts to US Dollar amounts using exchange rates of S/3.814 = US$1.00, which is the December 31, 2022 exchange rate set by the SBS, for statement of financial position data and of S/3.838 =
US$1.00, which is the average exchange rate on a monthly basis in 2022, for income statement data (for consistency with the annual amounts being translated).
|
| (2) |
Allowance for loan losses include provisions and reserves with respect to direct loans losses and indirect loans losses or off-balance sheet items such as guarantees and standby letters, performance bonds, and import and export letters
of credit. The 2022 provision for credit losses decreased from 2021. This decrease was mainly due to the flow of write-offs carried out during 2022, which mainly impacted the BCP consumer segment and to the small and microenterprise segment
in both BCP and Mibanco Perú; In addition, it was due, although to a lesser extent, to the decrease in the US$/Sol exchange rate. The above effects were partially offset by the deterioration of the macroeconomic component, which had a
greater impact on the consumer and small and microenterprise segments at BCP, and by entering segments of greater profitability and risk in small and microenterprises at BCP.
|
| (3) |
Total other expenses include salaries and employee benefits, administrative expenses, depreciation and amortization, depreciation for right-of-use assets, impairment loss on goodwill and others.
|
| (4) |
The number of shares consists of capital stock (see Note 18(a) to the consolidated financial statements) less treasury stock (see Note 18 (b) to the consolidated financial statements).
|
| (5) |
Basic earnings per share is calculated by dividing the net profit for the year attributable to Credicorp’s equity holders by the weighted average number of ordinary shares outstanding during the year, excluding the average number of
ordinary shares purchased and held as treasury stock (see Note 30 to the consolidated financial statements). Dilutive earnings per share is calculated by dividing by the weighted average number of ordinary shares outstanding during the
year, including the average number of ordinary shares purchased and held as treasury stock.
|
| (6) |
Dividends declared per share based on net profit attained for the financial years 2020 and 2021 were declared in Soles and paid in US Dollars on October 7, 2021, and June 10, 2022, respectively, using the weighted exchange rate
registered by the SBS for the transactions at the close of business on October 7, 2021, and June 10, 2022, respectively. As of the date of this Annual Report, no dividends have been declared in 2023.
|
| (7) |
“Total loans” refers to “loans, net of unearned income” as disclosed in our consolidated financial statements, which equals direct loans plus accrued interest minus unearned interest. See Note 7 to the consolidated financial statements.
In addition to loans outstanding, we had off-balance-sheet items, including those mentioned in Note (2) above that amounted to S/20,973.8 million, S/22,914.3 and S/20,928.1 million, as of December 31, 2020, 2021 and 2022, respectively. See
Note 21 to the consolidated financial statements.
|
| (8) |
Total deposits exclude interest payable. See Note 14 to the consolidated financial statements.
|
| (9) |
Net interest similar income and expenses as a percentage of average interest-earning assets, computed as the average of period-beginning and period-ending balances.
|
| (10) |
Net profit attributable to Credicorp’s equity holders as a percentage of average total assets, computed as the average of period-beginning and period-ending balances.
|
| (11) |
Net profit attributable to Credicorp’s equity holders as a percentage of average equity attributable to our equity holders, computed as the average of period-beginning and period-ending balances.
|
| (12) |
Sum of salaries and employee benefits, administrative expenses, depreciation and amortization, acquisition cost and association in participation, all as percentage of the sum of net interest income, commissions and fees, net gain from
exchange differences, net gain in associates, net premiums earned, net gain on foreign exchange transactions and net result on derivatives held for trading. Acquisition cost includes net fees, underwriting expenses and underwriting income.
|
| (13) |
Sum of salaries and employee benefits, administrative expenses, depreciation and amortization and acquisition cost, all as percentage of average total assets.
|
| (14) |
Regulatory capital calculated in accordance with guidelines established by the Basel Committee on Banking Regulations and Supervisory Practices of International Settlements (Basel Committee Accord) as adopted by the SBS. See “ITEM 5.
OPERATING AND FINANCIAL REVIEW AND PROSPECTS – 5.B Liquidity and Capital Resources - (1) Capital Adequacy Requirements for Credicorp.”
|
| (15) |
Depending on the type of loan, BCP Stand-alone and Mibanco consider corporate, large business and medium business loans to be internal overdue loans for after 15 days; and overdrafts, small and micro business to be internal overdue loans
after 30 days. For consumer, mortgage and leasing loans the past-due installments are considered internal overdue after 30 to 90 days and after 90 days, the outstanding balance of the loan is considered internal overdue. ASB considers
internal overdue loans all overdue loans when the scheduled principal and/or interest payments are overdue for more than 30 days. BCP Bolivia considers loans as internal overdue after 30 days.
|
| (16) |
Other off-balance-sheet items primarily consist of guarantees and stand-by letters, performance bonds, and import and export letters of credit. See Note 21 to the consolidated financial statements.
|
| (17) |
Allowance for direct loan losses, as a percentage of all internal overdue loans without accounting for collateral securing such loans.
|
| (18) |
Allowance for direct loan losses as a percentage of direct loans classified as impaired debt. See “ITEM 4. INFORMATION ON THE COMPANY - 4.B Business Overview – (7) Selected Statistical Information – 7.3 Loan Portfolio – 7.3.7
Classification of the Loan Portfolio”.
|
| (19) |
Dividends declared based on net profit attained for the financial years 2020 and 2021 divided by net profit attributable to our equity holders of the year 2020 and 2021, respectively. Dividends for 2022 results have not been declared
yet.
|
| (20) |
Average equity attributable to our equity divided by average total assets, both averages computed as the average of month-ending balances.
|
| (21) |
Average equity attributable to our equity shareholders divided by average total assets, both averages computed as the average of month-ending balances.
|
| 3. B |
Capitalization and Indebtedness
|
Not applicable.
| 3. C |
Reasons for the Offer and Use of Proceeds
|
Not applicable.
| 3. D |
Risk Factors
|
Our businesses are affected by many external and other factors in the markets in which we operate. Different risk factors can impact our businesses, our ability to operate
effectively and our business strategies. You should consider the risk factors carefully and read them in conjunction with all the information in this document. You should note that the risk factors described below are not the only risks to
consider. Rather, these are the risks that we currently consider material. There may be additional risks that we consider immaterial or of which we are unaware, and any of these risks could have similar effects to those set forth below.
Macroeconomic Risks
Our geographic location exposes us to risks related to Peruvian political, social, and economic conditions.
Our geographic location exposes us to risks related to Peruvian political, social, and economic conditions.
Most operations of BCP Stand-alone, Grupo Pacífico, Prima AFP, and a significant part of Credicorp Capital’s and Mibanco operations are located in Peru. In
addition, while ASB Bank Corp. is based in Panama rather than in Peru, most of its customers are located in Peru. Therefore, our results primarily depend on economic activity in Peru. Changes in economic conditions, both international and domestic,
government policies or social uncertainty can alter the financial health and normal development of our businesses. These changes may include, but are not limited to, high inflation, currency depreciation, currency exchange controls, caps on
interest rates, confiscation of private property, financial regulation, among others. Similarly, terrorist activity, political and social unrest and corruption scandals can adversely impact our operations.
According to the IMF staff concluding statement of the 2023 article IV mission (February 9), the outlook is very uncertain and downside risks prevail. The
main external risks to their outlook include: spillovers from Russia’s war in Ukraine, an abrupt global slowdown with an associated commodity price volatility, and a possible de-anchoring of inflation expectations forcing a further tightening in
the global financial conditions. Domestic risks to the outlook include an intensification of political uncertainty, social unrest over political developments and natural disasters.
Peru experienced one of its worst social and political crises in decades after a failed coup on December 7, 2022, by former president Pedro Castillo, caused
massive protests. On the day of a debate by Peru’s congress on a third motion to impeach Castillo, in a message to the Nation, Castillo announced the temporary dissolution of Peru’s congress, new elections for a congress with the power to reform
Peru’s constitution and the restructuring of Peru’s justice system. The police and armed forces released a joint statement saying that any act contrary to the established constitutional order is a violation of the constitution and that they will
not abide by it. Within hours of his speech, Peru’s congress had voted to remove Castillo from office due to moral incapacity and he was arrested on charges of rebellion and conspiracy. In turn, Vice President Dina Boluarte was sworn in as Peru’s
first female president and has indicated that she plans to govern until 2026, which is the year Castillo’s term would have ended.
Since Boluarte took office, social unrest exacerbated and erupted, mainly in southern regions of Peru, where Castillo has more support. Protesters have demanded the resignation of President Boluarte, the shutdown of Peru’s congress and immediate general elections. Protests have been violent; as of late January 2023, more than 50 civilians had died
during social demonstrations, there have been many road blockages, and several regional airports have had to suspend operations temporarily as infrastructure was damaged. These protests were ongoing and concentrated in Puno as of late March 2023,
and there could be no assurance as to when these protests would stop, despite reports in March that there were signs that the protests had started to wane.
On December 20, 2022, Peru’s congress approved a bill that sought to end the current presidential mandate in July 2024 and called for general elections.
However, as the bill constituted a constitutional amendment, a second vote was required. On March 14, 2023, the congress’s constitutional commission rejected the initiative to advance the general elections to 2023. It was the fifth time the
constitutional reform bill was rejected since December. The current presidential mandate is scheduled to end in 2026.
It is important to recall that the general elections of 2021 resulted in an environment of political and social polarization, as Pedro
Castillo, a leader of a teachers’ union and of indigenous heritage, was elected president in a very narrow (only 44,263 votes of difference) second round win against the right-wing candidate Keiko Fujimori, who is the daughter of ex-president
Alberto Fujimori. Between July 2021 and December 2022, Castillo appointed 5 different prime ministers and named more than 70 ministers. In October 2022, Castillo was also accused by Peru’s top prosecutor of overseeing a criminal organization run
from the presidential palace with the purpose of monopolizing, controlling and steering bidding processes in order to obtain illicit gains. The complaint also included two ministers who served under
Castillo.
Among the main risks presented by the next government are intentions to impose more state control over the economy, potential changes to Peru’s current constitution (which was
enacted in 1993), strict interest rate controls and lack of technical expertise. For a new constitution to replace the current one through a constituent assembly, a constitutional reform proposal would need to be approved by Peru’s congress, either
through an absolute majority (87 votes) in two consecutive legislatures or simple a majority (66 votes) ratified in a referendum.
Social and political instability in Peru is not new. The country has experienced various instances of instability ranging from domestic terrorism (during
the 1980’s) to military coups and a succession of regimes. Although the risk of renewed domestic terrorism is not expected, any violence derived from the drug trade, or a resumption of large-scale terrorist activities could hurt our operations.
Additionally, some regimes during the 1970s and 1980s heavily intervened in the economy in pursuit of various economic policies and priorities, including expropriation, nationalization and new taxation policies. These interventions altered the
country’s economic environment, financial system and agricultural sector, among other components.
There have also been several political disputes between the government and the opposition in recent decades. Since 2001, more than ten different political
organizations have nominated candidates for President in each of the five election processes, showing low approval rating for all candidates (usually around 20%–30% approval ratings). Since August 2016 until February 2023, Peru has had 6
presidents, 3 congresses and 16 prime ministers.
According to the Peruvian National institute of Statistic and Informatic (Instituto
Nacional de Estadísticas e Informática or INEI by its Spanish initials), high levels of poverty in Peru have historically been a contributing factor to social conflict. Between 2004 and 2019 (pre pandemic) according to INEI, Peru’s poverty
rate decreased from almost 60% of the population to 20%. In 2020, due to the economic shock resulting from the COVID-19 pandemic, the poverty rate increased to 30%, erasing nearly all gains from the last decade. Even though the poverty rate fell to
26% in 2022, it remains above pre-pandemic levels.
There can be no assurance that Peru will not continue facing political, economic or social problems in the future or that these problems will not adversely
affect our business, financial conditions, and results of operations. There is always the possibility that, as has happened before, a political faction could promote policies to respond to social unrest with a speech that includes, among other
things, expropriation, nationalization, suspension of the enforcement of creditors’ rights and new taxation policies.
Another source of risk is related to political and social unrest in areas where mining and oil and gas operations take place. In recent years,
Peru has experienced protests against mining projects in several regions around the country. In 2021, as Peru’s then president, Castillo called for the nationalization of certain gas and mining
operations. Mining is an important part of the Peruvian economy. According to INEI, the mining and hydrocarbons sector represented 14.4% of GDP (mining 12.2% and hydrocarbons 2.2%) in 2022. The country’s exports are highly concentrated in the
mining industry; in 2022 free on board (FOB) exports of metallic mining represented 52.5% of total exports (copper represents half of this mining exports), with tax revenues from the sector representing 14.4% of total tax revenue in 2022.
On several occasions, local communities have opposed these operations and accused them of polluting the environment, specifically rivers, hurting
agricultural and other traditional economic activities, as well as complained of not receiving the benefits in terms of growth and wealth generated by the mining projects. For example, in 2021, politicized social unrest in Apurimac surrounded the
Las Bambas mining project, which produced approximately 11% of Peru’s total copper production in 2022. Las Bambas’ majority owner, MMG, stated that if the routes to the mine continued to be blocked by different politicized members of communities
surrounding the mine and routes to the mine, they will not be able to operate. In April 2022, Las Bambas shut down for 51 days, after protesters from two communities entered the mine and settled inside. The recent social protests of late 2022 and
early 2023 have also affected Las Bambas’ operations as road blockages prevented the arrival of key inputs. In another example, on January 12, 2023, Minsur announced the temporary suspension of operations in its San Rafael tin mine, in Peru’s Puno
region, as a measure of solidarity with the families of people who died in recent protests in the region. And on February 6, 2023, Buenaventura temporarily suspended operations at its Julcani silver mine after protesters entered and destroyed part
of the mine's facilities.
These and other delays or cancellations of mining projects could reduce Peruvian economic growth and business confidence, thereby hurting the financial
system both directly (many mining projects are at least partially financed by local financial institutions) and indirectly (overall economic activity could decelerate). Any such effect on the financial system could have a material adverse effect on
our business and result of operations.
Beyond the mining, and oil and gas sectors, the ongoing protests may also have negatively affected the tourism, hospitality, transportation, and retail
sectors. These sectors have also been affected by other developments in recent years, such as climate change. These Peruvian political and social developments may also affect foreign investment sentiment and therefore economic development. Having
said that, and due to ongoing social and political risks, in January 2023, Moody’s changed Peru’s credit rating outlook from stable to negative and kept the rating in Baa1.
Our banking and capital market operations in neighboring countries expose us to risk related to political and
economic conditions in those countries.
ICBSA, Credicorp Capital Holding Colombia, Credicorp Capital Holding Chile and ASB Bank Corp. expose us to risks related to Bolivian,
Colombian, Chilean and Panamanian political and economic conditions, respectively. These economies suffered unprecedented GDP contractions in 2020 due to the COVID-19 pandemic and have experienced an
uneven recovery as a result of different policy responses and economic structures. Colombia and Chile returned to pre-pandemic levels in 2021 while Panama and Bolivia did so in 2022. The negative effect of the pandemic on poverty and inequality,
combined with inflation rates (driven by high energy and food prices) not seen in these countries in decades, inflamed an already complex social environment characterized by elevated levels of inequality and dissatisfaction with authorities.
According to data from the World Bank, Colombia is the second most unequal country in the region, as measured by the Gini index. In general, the higher the Gini index, which measures the rate of social inequality, of a country, the more unequal
it is. Brazil has the highest Gini index in the region; Panama has the third-highest.
In recent years, neighboring countries in Latin America in which we have banking and capital market operations have experienced widespread social unrest and
several left-wing leaders have been chosen as presidents:
| • |
Chile: In October 2019, Chile experienced massive and violent demonstrations that forced Sebastian Piñera’s government to sign off on a referendum on a new constitution. In late 2021, Gabriel Boric, a
36-year-old left-wing leader, was elected as Chile’s president for a four-year term. After voters rejected the text for a new constitution in September 2022, Chile’s congress approved a new constituent process, which will likely result in
ongoing uncertainty in the political and social arenas until the next referendum on forming a constituent assembly takes place.
|
| • |
Colombia: In 2021, the proposal of an unpopular tax reform triggered its most serious public unrest in recent memory. Gustavo Petro, also a left-wing candidate and former guerrilla fighter, won the 2022
general election, making history as the first left-wing president to be elected in the country. He was also elected for a four-year term.
|
| • |
Panama: In 2022, rising living costs, especially of gasoline prices (which at one point in 2022 were almost 80% higher than at the same point in 2021), sparked the largest social protests in at least three
decades. The next presidential election will be held in May 2024.
|
| • |
Bolivia: Luis Arce, also from the left-wing, was elected president for a five-year term in 2020. Between late 2022 and January 2023, protests took place in Santa Cruz, which represents a larger proportion of
Bolivia’s GDP than any other city.
|
These protests have had a negative effect on economic activity and businesses in general in countries in which we have operations. Given these developments,
we cannot provide any assurance that Peru will not experience any residual effects from events in neighboring countries, such as the possibility of the base of protesters in Peru extending to the middle class, which may have a materially adverse
effect on our business and result of operations. Significant changes to Bolivian, Colombian, Chilean and Panamanian political and economic conditions could have an adverse effect on our business, financial conditions, and results of operations.
Bolivia
During 2022, the Bolivian economy continued to recover, supported by the performance of several economic sectors including transport, services, energy and
construction. Moreover, the war between Russia and Ukraine prolonged the rise in various commodity prices, which supported revenue from the exports of minerals, gas and some agricultural products. The effects of price inflation caused by the war,
however, were cushioned by subsidies implemented by Bolivia’s government. However, the increase in the price of oil generated additional pressure on Bolivia’s trade balance during the last quarter of 2022, reducing the surplus relative to 2021.
Similar to 2021, in 2022, there was slight increase in foreign currency deposits in the financial system, while the foreign-exchange reserves maintained the decreasing trend observed since 2015.
Notwithstanding increased government revenues from the mining sector and the end of certain pandemic-related emergency measures, which lowered Bolivia’s
fiscal deficit from 12.7% of GDP in 2020 to 9.3% of GDP in 2021, Bolivia has continued to fund approximately one-third of its budget deficit through its central bank. This has caused a marked decrease in Bolivia’s international reserves. According
to data published by the Bolivian Central Bank on February 8, 2023, its foreign reserves stood at US$ 3.5 billion (down from a peak of more than US$ 15 billion in 2014), the lowest level since 1996, of which gold reserves were US$ 2.6 billion and
foreign currency reserves stood at US$ 372 million. While the official exchange rate remained at approximately 6.96 bolivianos per Dollar, the unofficial exchange rate had reached as high as 7.40 bolivianos per Dollar as of February 8, 2023.
Consequently, in recent weeks, the Bolivian Central Bank began the direct sale of Dollars from its already low foreign reserves to meet public demand and exchanged most of its holdings of Special Drawing Rights (SDRs), which are international
reserve assets created by the International Monetary Fund to supplement the official reserves of its member countries, with the Central Bank’s holdings of SDRs decreasing from US$ 538 million as of February 8, to US$ 225 million as of February 28,
2023. The Bolivian Central Bank is also negotiating loans of up to US$1.4 billion from multilateral organizations, and as of March 2023, the Bolivian congress had approved loans from multiple lenders totaling approximately US$ 770 million. On March
14, 2023, Fitch cut Bolivia's sovereign rating from B to B-, and its outlook from stable to negative; and on March 24 Moody’s downgraded Bolivia’s rating from B2 to Caa1 and placed it on review for further downgrade.
According to local estimates, Bolivia’s GDP grew by approximately 4.0% in 2022. For 2023, the Ministry of Economy and the Central Bank have projected a
growth rate of 4.9%, driven by internal consumption, high commodities’ prices, and economic policies that promote macroeconomic stability and the industrialization of certain key economic sectors. Furthermore, the government expects a progressive
reduction in the fiscal deficit in 2023 (7.5% of GDP) and a stable level of inflation (3.3% by the end of the year). However, the continued possibility of political conflicts and social unrest constitutes a risk factor that may affect the economic
outlook for 2023.
Additionally, the lending quotas and caps on interest rates that were established in the financial services law (Ley de Servicios Financieros, No. 393),
which was enacted in 2013, and the mandatory deferrals and refinancings schemes instituted in 2020 and 2021 to mitigate the impacts of the COVID-19 pandemic, continued to negatively impact interest margins on banks, therefore reducing their ability
to generate enough capital to maintain the growth in their lending portfolios.
Colombia
According to the Colombian National Statistics Bureau (DANE), the Colombian economy exhibited a GDP growth of 7.5% in 2022, one of the highest growth rates globally. The strong
performance of the Colombian economy has been related to the highest level of terms of trade in several decades, as well as the remarkable evolution of consumption as household spending maintained strong momentum throughout the year amid
record-high remittances from abroad and a continuous reopening of the economy, which pushed services consumption. On its part, the government maintained an expansionary stance, similar to that observed during the first year of the COVID-19
pandemic, which also significantly supported domestic demand.
While economic activity consistently outperformed expectations in 2022, persistent challenges remain. First, despite the ongoing normalization in the monetary policy stance,
inflation pressures remain acute, postponing the period when it is expected to reach the target range of the monetary authority (early 2025). Thus, the estimate of the real neutral interest rate has increased and now is near 2.5%, compared to 1.5%
before the pandemic. Second, despite the favorable terms of trade observed last year, the current account deficit remains one of the largest among emerging countries (close to 5.7% of GDP in 2021 and 6.2% in 2022). The accumulated inflation was
superior than 13% in a context with an reference interest rate of 12%. Finally, although the fiscal deficit in 2022 was better than initially expected (5.5% as GDP) and the updated fiscal framework points towards its further reduction in 2023 (3.8%
of GDP), there are still concerns about the high levels of debt and its expected process of reduction in a context of larger pressures for public spending. The depreciation of the Colombian peso respect the us dollar is more than 20% last year.
We expect the Colombian economy to grow 1% in 2023 amid the higher likelihood of a global recession, a very high domestic inflation that will take a toll on private consumption,
tighter financial conditions both locally and abroad, higher taxes, and higher political uncertainty. In any case, should the Colombian economy grow 1% in 2023, it would be 11% larger than before the COVID-19 pandemic by Dec-23 after averaging
compound annual growth of 6.6% between 2020 and 2023, well above the initial forecasts (in fact, activity ended up expanding in 2021 and 2022 at a rate that was roughly twice the initial estimate). Accordingly, we think that the expected slowdown
next year will be part of a necessary adjustment to reduce the potential economic imbalances that have arisen from the strong dynamism of private consumption, which currently is nearly 18% above pre-Covid levels.
Undoubtedly, politics has taken center stage after the election of the first left-leaning president in Colombia’s history, Mr. Gustavo Petro. The first months of Petro’s
government have been marked by higher levels of uncertainty, and underperformance of Colombian financial assets, as well as a reduction in both consumer and business sentiment. Overall, the higher uncertainty has been primarily the result of some
comments and proposals from the President and members of his cabinet that have raised concerns about the future of the economy and economic policy. After successfully passing a tax reform for 1.3% of GDP (focused on higher taxes for high-income
individuals and the oil sector), investors are now focused on topics such as the government’s energy transition proposal, which originally sought to halt the granting of new oil and gas exploration contracts and created concerns given the
significance of the sector for Colombia’s external and fiscal accounts and the announced reforms in health and pension systems. The pension proposal is of special interest considering the potential impact on the private pension funds system and
thus, on the financing of the government and the development of capital markets.
Chile
According to the Central Bank of Chile (BCCh), the Chilean economy expanded 2.9% in 2022. During 2H22, the economy proved to be more resilient than expected, leading to
systematic upward revisions to the GDP growth forecast for the year. Per a survey of economists released by the BCCh, the market consensus in September 2022 expected Chilean GDP growth in 2022 of 1.9%, which was increased to 2.5% in the December
2022 survey. The expansion of the Chilean economy has been linked to increased private consumption along with higher-than-expected investment activity.
On the fiscal front, the government evidenced a strong discipline on the back of 23% y/y drop in fiscal spending according to the most recent Public Finances report released by
the Minister of Finance. As a result, Chile achieved its first fiscal surplus (1.1% of GDP) in almost a decade in 2022. The figure was explained by a higher tax collection linked to lithium revenues, temporary taxes and larger dividend payments by
companies.
According to the National Statistics Institute (INE by its Spanish initials), in December 2022, inflation stood at 12.8% year over year the highest level in decades. The figure
was driven by a strong domestic demand (on the back of pension fund withdrawals and fiscal transfers), higher global costs, the peso depreciation and the rise in commodity prices due to the conflict in Ukraine. The inflationary process was thus
linked to global factors together with local elements, with the latter playing a larger role.
For 2023, we expect the economy to continue resolving the large macroeconomic imbalances. We forecast a recession for the Chilean economy with the GDP contracting (0.5%)
compared to the previous year. In any case, we estimate that the recession will be milder than is expected by market consensus, which forecast a GDP decline of (1%) as per the February 2023 Consensus Forecast report. In our opinion, the economy has
proven to be more resilient than expected in previous quarters, and from a statistical point of view, the higher carry-over effect supports a less gloomy scenario. In addition, different fundamentals support a less pessimistic view, such as the
decline in political uncertainty, lower interest rates and a marginal improvement in investment prospects.
In any case, volatility continues to be elevated, and our base case is subject to risks with the major concerns for the year as follows: i) a new pension fund withdrawal which
would erode institutional confidence and will increase economic imbalances; ii) a deeper global recession which would reduce the external impulse and increase financial market volatility; iii) an increase in political uncertainty due to a more
radicalized constitutional process than currently envisioned; and iv) higher external and domestic inflation persistence which would keep interest rates high for longer.
On the political front, in September 2022, Chileans rejected the new constitution with 62% of the total votes according to the National Electoral Service (SERVEL). In our
opinion, the result shows that most of the Chileans are critical with respect to the degree of changes they want for the country. In this context, for this year the Congress agreed on the roadmap for a new constitutional process. The proposal
includes 12 constitutional basic principles, an Expert Committee composed by 24 members elected by the Congress, a Constitutional Council composed of 50 members elected by popular vote, a technical committee, and an exit plebiscite. As a result, in
Dec-23, Chileans will vote again on a new constitutional proposal. In our opinion, controversial issues such as central bank independence, property and water rights, expropriation, the political and justice systems, mining concessions and
indigenous rights, among others, should have high-level discussion given the rejection of the previous proposal. Although political uncertainty is expected to continue to be high, all these elements suggest a much more moderate process and draft,
in our opinion.
Panama
In 2022, the recovery gained momentum and the economy finally began running above 2019 levels. In 2022, the GDP grew 10.8%, bolstered by the resumption of
the construction of Panama’s third metro line, recovering private investment and increased activity through the Panama Canal. On a sector-by-sector basis, construction, transport, and commerce contributed the most to Panama’s economic growth.
Panama’s economy continues to build on the GDP base effect resulting from unprecedented GDP contraction of 17.7% in 2020, as Panama’s economic
structure left it vulnerable to the COVID-19 pandemic. In 2021, GDP rebounded 15.8%, one of the highest growth rates in the region, favored by the vaccination process that allowed a gradual easing of the
temporary containment measures. The global economic recovery, big infrastructure projects and copper production from Minera Cobre Panamá (the largest private investment project in the country’s history) have driven substantial economic growth in
the last couple of years. Copper exports increased from cero to USD 2.9 billion in the twelve months accumulated till September 2022.
Amid this continued economic growth, rising living costs, especially increasing gasoline prices, sparked the largest social protests in at least three
decades in mid-2022. These protests led the government to temporarily subsidize the price of gasoline for three months, at a cost of approximately 0.3% of GDP that was expected to be offset with current spending cuts. Other factors behind social
unrest were high inequality, with Panama being the third most unequal country in the region (as measured by Gini index, according to World Bank data), and a greater public perception of corruption in the political arena. At the end of 2022,
inflation was at 2.9% from the end of 2021.
In that sense, beyond 2022 there is a risk that pressures for greater social spending will continue in an already challenging fiscal
environment. In October 2022, Moody’s changed Panama’s credit rating outlook from stable to negative (with the rating maintained at Baa2) given rising fiscal pressures stemming from an increasingly rigid spending structure related to upward
trends in wages, transfers and interest payments. Standard & Poor’s (S&P) had also reduced its outlook to negative (BBB) in August 2021. Conversely, in February, Fitch improved the outlook from
negative to stable and left the rating at BBB-, only one notch above investment grade. These developments followed downgrades from all three credit agencies between 2020 and 2021 as Panama’s fiscal position weakened. Panama’s public debt, as a
percentage of GDP, peaked at year-end 2020 at 68.0% of GDP, fell to 64% at year-end 2021 and fell further to 62% at year-end 2022. The 2022 level represents an increase of more than 20 percentage points from the year-end since 2018 rate of 40% of
GDP.
Finally, according to the IMF, exiting the FATF’s (Financial Action Task Force) grey list of jurisdictions under increased monitoring is key to preserving
Panama’s position as a regional financial center. In February 2023, the FATF again expressed significant concern that Panama had failed to complete its action plan and strongly urged them to do so by 2023.
Economic and market conditions in other countries may affect the Peruvian economy and the market price of Peruvian
securities.
Peru is a small, open economy highly integrated with the rest of the world and is affected by movements in the external environment (growth of main trade
partners, changes in commodity prices, and movements in external rates and global financial markets). As such, any major deterioration of the international economy can have materially adverse effects on the Peruvian economy and markets, as well as
in our businesses and operational results. A global recession was the big fear heading into 2023 and although the outlook has improved somewhat, it is still one of the top 2023 risks.
In January 2023, the World Bank published its Global Economic Prospects report, which projected that global growth would slow to 1.7% (at nominal exchange
rates) this year, its third-weakest pace in nearly three decades, other than global recessions, and roughly half the growth rate that had been forecast seven months prior. They added that any additional adverse shocks could push the global economy
into recession. In a separate report published in September 2022, the World Bank argued that the risk of a global recession in 2023 had risen amid simultaneous interest rate hikes, synchronized by central banks around the world in 2022 to the
greatest extent in the past five decades.
Global economic activity will be weighed by continuous disruptions from the war between Russia and Ukraine, tighter financial conditions, lower disposable
incomes as real wages have fallen and a lower contribution to consumption from “pent-up demand”.
The recent policy U-turn from China, with the easing of its highly restrictive COVID-19 stance and the measures taken to shore up the real estate sector,
plus a resilient labor market in the United States, has made the outlook less gloomy. China’s 2023 GDP forecast was revised upwards to 5.3% by the IMF as the economic reopening was received positively. Also, the International Monetary Fund (IMF)
estimates that U.S. GDP will grow by 1.4% in 2023 as better-than-expected labor market data has increased the probability of a soft economic landing.
There are also signs that inflation has moderated, with overall measures slowing down in most countries. In the United States, for instance,
by February 2023, inflation had slowed to 6.0% from February 2022, the lowest rate since September 2021 and significantly down from the peak of 9.1% in June 2022; core inflation (which excludes food and
energy) stood at 5.5% in February 2023, which represented the lowest rate since December 2021. Inflation has slowed down due to the drop in energy prices, reduced pressure on supply chains, normalization of some prices affected by the COVID-19
pandemic (new and used cars, car rentals and hotel rates) and reduction in prices of various goods due to lower demand (as of February 2023, on a month-to-month basis, the price of durable goods had fallen in 4 of the previous 6 months and the
price of non-durable goods had fallen in 5 of the previous 8 months). However, services inflation is resulting stickier than expected.
Even though there are some bright spots, the global economy generally still faces more downside
risk. According to the IMF’s January World Economic Outlook, downside risks include: i) a stall of China’s economic recovery amid greater-than-expected economic disruptions from future waves of COVID-19 infections or a sharper-than-expected
slowdown in the property sector; ii) inflation that remains stubbornly high amid continued labor market tightness and growing wage pressures, requiring tighter monetary policies and resulting in a sharper slowdown in activity; iii) an escalation
of the war in Ukraine that could destabilize energy or food markets and further fragment the global economy and; iv) a sudden repricing in financial markets that could tighten financial conditions, especially in emerging market and developing
economies.
If a global recession materializes it could affect Peru’s economic growth mainly through i) lower commodity prices and ii) lower external demand. The
country’s exports are highly concentrated in the mining industry; copper and gold exports share of total exports was 40% in 2022. In addition, an important source of fiscal revenue comes from mining (14.4% of tax revenue in 2022). Therefore,
Peruvian trade responds significantly to fluctuations in metal prices, especially gold and copper. In 2022, Peru’s trade surplus declined to US$9.6 billion from a record of US$14.9 billion in 2021, affected by lower terms of trade. The average
copper price for 2022 was USD 3.99 per pound, 6% lower than the average of USD 4.23 per pound in 2021, while oil prices increased 40% over the same period (to USD 99.0. per barrel). In addition to changes in prices, Peru is also vulnerable to
fluctuations in foreign demand, especially from China and the United States, Peru’s main trade partners. The European Union is also an important buyer of Peruvian goods, especially of non-traditional ones. So, lower than expected growth from these
countries would pose risks to Peru’s economic growth as it may impact exports and foreign direct investment.
For further detail please refer to “ITEM 5. OPERATING AND FINANCIAL REVIEW AND PROSPECTS – 5.A Operating Results – (2) Political and Macroeconomic
Environment.”
Likewise, a reduction of growth in Latin America can also impact the Peruvian economy and our business, especially regarding Chile, Colombia, Bolivia and
Panama, where we have operations, as well as Brazil and Mexico, which have a broad impact throughout the region because of their size.
Furthermore, financial conditions in global markets also affect the Peruvian economy, affecting interest rates for local corporate bonds and influencing the
exchange rate. Monetary policy tightening in developed economies, particularly by the Federal Reserve in the United States, could adversely affect economic activity in Peru since it strengthens the US Dollar and increases interest rates, thereby
reducing access to funding for some local businesses. Also, since the Peruvian economy has some level of loans denominated in US Dollars (23.5% of loans to the private sector and 35.7% of deposits as of December 2022), which is referred to as
financial dollarization, potential financial balance sheet position effects should be considered because a higher exchange rate could increase debt burdens for individuals and businesses that have taken loans in dollars but earn their income in
local currency.
Geopolitical tensions and conflict, including the conflict between Russia and Ukraine, could
have economic effects that could negatively impact the Peruvian economy.
We are subject to geopolitical risks, including economic sanctions, acts or threats of international or domestic terrorism, actions taken by governments in response,
state-sponsored cyberattacks or campaigns, civil unrest and/or military conflicts, which could adversely affect business and economic conditions abroad and in the markets in which we operate. For example, in early
2022, geopolitical tensions intensified as Russia invaded Ukraine on February 24 and NATO backed Ukraine with various forms of support short of direct intervention. The war between these two countries and its effect on supply caused commodity
prices to spike during the first half of 2022, especially for commodities for which Russia and Ukraine had an important share of global production like crude oil, natural gas, wheat, and fertilizers. The conflict triggered a commodity rally, with
the price of West Texas Intermediate (WTI), a crude oil benchmark used as a reference price in the United States, reaching almost USD 124 per barrel (its highest level since 2008), while the prices of natural gas, wheat, copper, aluminum and
palladium reached historic highs. These price increases exacerbated inflation that the world was already experiencing.
The war is not over yet, and actions are still being taken and/or considered against Russia. These measures could have global repercussions and remain an
important risk in 2023. For instance, according to the Wall Street Journal, in January 2023 the US and Germany outlined plans to send dozens of modern battle tanks to Ukraine, marking significant new Western assistance. Russia may also launch one
or more new offensives against Ukraine. Any escalation of the conflict may exacerbate economic issues already arising from it. Additionally, on February 5, the European Union adopted further price caps for Russian petroleum products (such as diesel
and fuel oil) to hit their revenues even harder and reduce its ability to wage war in Ukraine, according to the European Commission Statement. These caps supplement the price cap for crude oil in force since December 2022, and their effects on
energy markets are still uncertain.
The conflict still poses upside risks to commodity prices. A scenario where the war escalates and these prices increase significantly, as in the first half
of 2022, would represent a negative shock on real disposable income as it would make agricultural products and basic products more expensive, along with higher transportation costs due to higher oil prices. Emerging economies with high levels of
poverty remain particularly vulnerable to this shock which could fuel new waves of social unrest.
In addition, in Peru, where we conduct most of our business, the escalation of this conflict may have impacts on the economy despite Russia
and Ukraine representing around 3.5% of world GDP in Purchasing Power Parity (PPP) terms. It could renew inflationary pressures globally and force central banks, including the BCRP, to pursue an even further restrictive monetary policy stance.
Another geopolitical risk is related to tensions in the relationship between China and United States. Throughout 2018 and 2019, there was a trade dispute
between both countries that included the imposition of tariffs on both U.S. and Chinese products on several occasions, denouncements regarding currency manipulation and filing actions in the World Trade Organization, among others, which negatively
affected global demand and commodity prices. More recently, political tensions escalated after the United States shot down a suspected Chinese surveillance balloon and U.S. Representative Nancy Pelosi, the former speaker of the House, visited
Taiwan, which China claims as part of its territory.
Legal and Regulatory Risks
Regulatory changes and adoption of new international guidelines to sectors in which we operate could impact our
earnings and adversely affect our operating performance.
Because we are subject to regulation and/or supervision in Peru, Bolivia, Colombia, Chile, Cayman Islands, the United States of America, Mexico, Spain and
Panama, changes to the regulatory framework in any of these countries or changes in tax laws could adversely affect our business.
Financial Services Activities
We are, most directly, subject to extensive supervision and regulation through Law No. 26702, Ley General del Sistema Financiero y del Sistema
de Seguros y Orgánica de la Superintendencia de Banca y Seguros (the Peruvian Banking and Insurance Law), which establishes the regulatory and supervisory framework for companies that operate in the Peruvian financial and insurance system; and
the regulations enacted by SBS, which is the primary banking, insurance and private pension funds regulatory agency in Peru, including SBS Resolution No. 11823-2010, Reglamento para la Supervisión Consolidada de los Conglomerados Financieros y Mixtos (the Consolidated Supervision of Financial and Mixed Conglomerates Regulation).
The SBS and the BCRP supervise and regulate BCP Stand-alone and Mibanco’s operations. Peru’s constitution and the SBS’s statutory charter grant the SBS the
authority to oversee and control banks and other financial institutions, including private pension funds and insurance companies. The SBS and the BCRP have general administrative responsibilities over BCP Stand-alone and Mibanco, including setting
their capital and reserve requirements. In past years, the BCRP has, on numerous occasions, changed the deposit reserve requirements applicable to Peruvian commercial banks, as well as the rate of interest paid on deposit reserves and the amount of
deposit reserves on which no interest is payable by the BCRP. Such changes in the supervision and regulation of BCP Stand-alone and Mibanco may adversely affect our results of operations and financial condition. See “ITEM 4. INFORMATION ON THE
COMPANY – 4.B Business Overview – (6) Supervision and Regulation – 6.2 Subsidiaries – 6.2.1 Peru” for additional information regarding the regulation of BCP Stand-alone and Mibanco by the SBS and the BCRP.
Furthermore, changes in regulation related to consumer protection made by these agencies may also affect our business. In March 2021, a new
interest rate ceiling law was approved under Law No. 31143, Ley que protege de la usura a los consumidores de los servicios financieros (the Usury Law Regulation). This law grants the BCRP the power to set maximum and minimum interest rates, on a
semi- annual basis, to regulate the market for consumer loans, small consumer loans, small and medium enterprises (SMEs) loans and credit card loans. Additionally, the Usury Law Regulation states that if a debtor is late in payment, only default interest will be charged. The collection of penalties or other commissions or expenses from debtors, as well as the capitalization of interest is
prohibited by the Usury Law Regulation. The Usury Law Regulation also establishes that (i) the commissions and expenses applicable to consumer loans, small consumer
loans, small and medium enterprises loans, and credit card loans must imply the provision of an additional and/or complementary service to the transaction entered into by the clients; (ii) the financial institution must justify the transfer of
the cost to the client; and (iii) the value of the service must be supported by a technical, economic and legal report, which must be submitted to the SBS.
The Superintendence of the Securities Market of Peru (Superintendencia del Mercado de Valores or SMV by its Spanish initials) also supervises
certain of our subsidiaries such as BCP Consolidated, Credicorp Capital Sociedad Agente de Bolsa (Credicorp Capital Bolsa), Credicorp Capital Sociedad Administradora de Fondos (Credicorp Capital Fondos), Credicorp Capital Peru S.A.A. (Credicorp
Capital Peru) and Credicorp Capital Sociedad Titulizadora S.A. (Credicorp Capital Titulizadora). Additionally, some of our subsidiaries are under the supervision of the Peruvian Financial Intelligence Unit (Unidad de Inteligencia Financiera del Perú or UIF-Perú by its Spanish initials) and all of our subsidiaries that operate in Peru must comply with the provisions regulated by the Peruvian Consumer Protection
Authority (Instituto Nacional de Defensa de la Competencia y de la Protección de la Propiedad Intelectual or INDECOPI by its Spanish initials) and the Peruvian Data Privacy Authority (Autoridad Nacional de Protección de Datos Personales or ANPDP
by its Spanish initials).
We are also regulated by other governmental entities in other jurisdictions. In Colombia, we are subject to supervision and regulation through the Unit of
Financial Regulation (Unidad de Proyección Normativa y Estudios de Regulación Financiera or URF by its Spanish initials), the Financial Superintendence of Colombia (Superintendencia Financiera de Colombia or SFC by its Spanish initials) and the
Colombian Stock Market Self-Regulator (Autorregulador del Mercado de Valores de Colombia or AMV by its Spanish initials). In Chile, we are subject to supervision and regulation through the Financial Markets Commission of Chile (Comisión para el
Mercado Financiero or CMF by its Spanish initials). See “ITEM 4. INFORMATION ON THE COMPANY – 4.B Business Overview – (6) Supervision and Regulation – 6.2 Subsidiaries – 6.2.4. Colombia and 6.2.5 Chile”.
In Bolivia, we are subject to the supervision of the Bolivian Financial Authority (Autoridad de Supervisión del Sistema
Financiero or ASFI by its Spanish initials) and of the Bolivian Pensions and Insurance Authority (Autoridad de Fiscalización y Control de Pensiones y Seguros or APS by its Spanish initials).
BCP Miami is regulated, supervised, and examined by the Florida Office of Financial Regulation (OFR) and by the Board of Governors of
the U.S. Federal Reserve System (FED). Our direct and indirect nonbanking subsidiaries doing business in the United States are also subject to the authority of relevant U.S. financial regulatory agencies depending
on their U.S. activities.
Further, Credicorp Capital LLC., our U.S. broker-dealer, is regulated, supervised, and examined by the U.S. Securities and Exchange Commission (SEC) and the
Financial Industry Regulatory Authority, Inc. (FINRA). Additionally, Credicorp Capital Advisors LLC., our U.S. financial advisor, is also regulated by the SEC.
In the Cayman Islands, we are subject to the regulation of the Cayman Islands Companies Law for ASHC. Effective August 2, 2021, Atlantic Security Bank
(Cayman Islands) and ASB Bank Corp. (Panama) merged, with the latter being the surviving entity. ASB Bank Corp. is supervised by its principal regulators, the Superintendence of Banks of Panama (Superintendencia de
Bancos de Panamá or SBP by its Spanish initials) and, with respect to activities relating to its securities investment business, the Superintendency of the Securities Market of the Republic of Panama (Superintendencia
del Mercado de Valores de Panamá or Panamá SMV by its Spanish initials).
Changes in the supervision and regulation of our subsidiaries in other countries may adversely affect our results of operations and financial condition.
For details on income tax review by the tax authorities on the jurisdictions in which we operate, please refer to Note 19(a) and (d) of the consolidated
financial statements. Also, for further information refer to “ITEM 4. INFORMATION ON THE COMPANY – 4.B Business Overview – (6) Supervision and Regulation – 6.2 Subsidiaries”.
Insurance
Our Property and Casualty (P&C) and Life insurance business is carried out by Pacífico Seguros, which is part of Grupo Pacífico. The insurance business is subject to
regulation by the SBS. New legislation or regulations may adversely affect Grupo Pacífico’s ability to underwrite and price risks accurately, which in turn would affect underwriting results and business profitability. Grupo Pacífico is unable to
predict whether and to what extent new laws and regulations that may affect its business will be adopted in the future.
While Grupo Pacífico is unable to predict with any certainty the timing of the passage or adoption of any new laws or regulations, or the effects those laws or regulations may
have on its operations, profitability and financial condition in future years, we expect Peru to adopt new legislation in the coming years that will change the regulation of insurance companies. The legislation may be similar to the measure enacted
by the European Union through Solvency II, a regulatory capital framework that seeks to further reduce the insolvency risk faced by insurance companies in the European Union by improving the regulation
regarding the amount of capital that insurance companies there must hold.
The Peruvian regulator has been working on the implementation of the risk-based capital model, which seeks to guarantee that insurance companies maintain the necessary capital
to face the risks inherent to their activity in the face of possible stress scenarios (similar to the Solvency II regulation that applies to European insurers). It is expected that this model will come into force before the year 2026. In the first
quantitative exercise that was carried out, the results for the company showed that Pacífico Seguros has an excess of the capital that would be required.
Pension fund
In May 2022, the government and congress approved another withdrawal of funds, pursuant to which a total of S/ 6.3 billion was withdrawn, representing 66%
of the funds available for withdrawal. If the Peruvian government decides to approve a new withdrawal, this would impact the management of the funds, as well as the Premium operation; and we would work to collect more funds in the form of voluntary
contributions.
In May 2021, the Peruvian government and congress approved a new withdrawal of funds, pursuant to which a total of S/9.2 billion was withdrawn, representing
79% of the funds available for withdrawal. In August 2021, Peru’s congress approved and published a law that reduces from 55 to 50 the age to access early retirement for men.
In March and April 2020, in response to the COVID-19 crisis, the Peruvian government and congress took measures to provide liquidity to affiliates by
allowing them to draw down their funds. These measures had an impact on funds under management and on income in the AFPs’ system in 2020. In the case of Prima AFP, total fund withdrawals amounted S/7.5 billion, representing 70% of the funds that
were available for withdrawal. In November 2020, as the COVID-19 crisis continued, the Peruvian government and congress allowed a second withdraw of funds which reached approximately S/2.4 billion approximately. This withdrawal took effect between
December 2020 and February 2021.
In 2016, Peru’s congress approved a reform that allows affiliates to withdraw up to 95.5% of their pension funds when they reach the retirement age (65
years) and unemployment early retirement age (50 and 55 years for women and men, respectively). This initiative may motivate affiliates that haven’t reached the age of retirement to apply to an early retirement regime by altering their employment
situation.
As such, as it pertains to affiliates close to retirement, the withdrawal of 95.5% of their funds could impact AFP’s funds under management and Prima AFP’s
operations. Therefore, in 2019, to reinforce this reform and cushion the level of early withdrawals, the government approved new strict restrictions for this retirement alternative for those affiliates who qualify for early retirement. Although
this can help to mitigate the risk that a massive number of affiliates request early withdrawals, and so reduce the impact of early retirement on funds under management, the risk of retirements of funds is still on the table.
In 2012, the Peruvian government passed a law to reform the Peruvian Private Pension System (PPS), which attempted to expand coverage workers affiliated
with the PPS (which are referred to generally as “affiliates”), encourage market competition, and decrease administration fees in the PPS.
See “ITEM 4. INFORMATION ON THE COMPANY – 4.B Business Overview – (6) Supervision and Regulation – 6.2 Subsidiaries – 6.2.1 Peru”.
Taxation
Changes in U.S. laws or regulations applicable to our business, such as the U.S. Foreign Account Tax Compliance Act (FATCA), the National
Defense Authorization Act (NDAA) and the Anti-Money Laundering Act of 2020 (AMLA 2020) regulations, as well as other international regulations such as the Organization for Economic Co-operation
and Development’s (OECD’s) Common Reporting Standards (CRS), may have an adverse effect on our financial and operational performance, by significantly increasing our compliance obligations.
For a discussion of Peruvian, Chilean, and Colombian tax regulation, see “ITEM 10. ADDITIONAL INFORMATION – 10.E Taxation”.
Credicorp, as a Bermuda exempted company, may be adversely affected by any change in Bermuda law or regulation.
Pursuant to the Economic Substance Act 2018 (as amended) of Bermuda (the “ES Act”), which came into force on January 1, 2019, a registered entity, other
than an entity which is resident for tax purposes in certain jurisdictions outside Bermuda (that is, a non-resident entity), that carries on as a business with any one or more of the “relevant activities” referred to in the ES Act is considered to
be in the scope of economic substance requirements to ensure that the entity is engaged in real economic activity in Bermuda and must comply with those requirements. The ES Act may require in-scope Bermuda-registered entities which are engaged in
such “relevant activities” to be directed and managed in Bermuda, have an adequate level of qualified employees in Bermuda, incur an adequate level of annual expenditure in Bermuda, maintain physical offices and premises in Bermuda or perform core
income-generating activities in Bermuda. “Relevant activities” under the ES Act include the following: banking, insurance, fund management, financing, leasing, headquarters, shipping, distribution and service center, intellectual property and
holding entities. Based on the current guidance issued pursuant to the ES Act, which was revised at the beginning of 2023, the Bermuda Registrar of Companies will consider “relevant activities” to be carried on as a business by an entity, and so
view that entity as within the scope of the ES Act, whether or not the entity earns any gross revenue in respect of such activity during the relevant financial period.
Both Credicorp Ltd. and Credicorp Capital Ltd. are Bermuda exempted companies, so the ES Act applies to them. Both companies are also
considered “pure equity holding” entities under the ES Act. All entities subject to the ES Act that undertake “relevant activities” including all “pure equity holding” entities, must file annually with
the Registrar of Companies an Economic Substance Declaration (the “ESD”), providing information in relation to the previous financial year (relevant financial period). The ESD will require the disclosure of certain key information applicable to
an analysis of economic substance requirements. Pure equity holding entities are currently subject to reduced economic substance requirements, including the requirement to have adequate people for holding and managing equity participations, and
adequate premises in Bermuda. An entity conducting the relevant activity of having a headquarters in Bermuda which generates gross revenue is required to satisfy the requirements under the ES Act in respect of that activity for that relevant
financial period. However, an entity that earns no gross revenue in respect of such activity in any relevant financial period will not be required to satisfy the requirements under the ES Act in respect of that activity for that relevant
financial period.
The Registrar of Companies is responsible for monitoring and enforcing the economic substance regime. The ES Act provides for civil penalties,
subject to rights of appeal, of up to US$250,000 for non-compliance with the applicable economic substance requirements. If, after the applicable civil penalties have been exhausted, an entity continues to fail to comply, the Registrar of
Companies may apply to the Supreme Court of Bermuda for an order in such terms as it thinks fit. This may include an order to strike the entity off the Register of Companies. The ES Act also criminalized knowingly providing false declaration
information to the Registrar of Companies, which is punishable by penalties of up to US$10,000, imprisonment for two years or both.
Other offshore jurisdictions released similar legislation that affects some of our offshore
entities (including ASHC in the Cayman Islands). This other legislation imposes similar requirements and penalties.
The announcement and implementation of the discontinuance of the London Interbank Offered Rate (LIBOR) may result in differences in the
calculation of the applicable interest rate or payment amount depending on the terms of the governing instruments and increase operational and other risks to us and other industry participants.
The U.K. Financial Conduct Authority (FCA), which regulates LIBOR, announced in July 2017 that it would no longer require banks to submit rates for LIBOR
beyond 2021. Following a consultation process, on March 5, 2021, ICE Benchmark Administration Limited (IBA) announced that it would cease publication of most LIBOR settings on December 31, 2021, with the exception of U.S. dollar LIBOR setting for
overnight and 1, 3, 6 and 12 month periods, which will continue to be published until June 30, 2023. The FCA has advised IBA that it has no intention of requiring it to publish any LIBOR settings beyond the cessation dates for such settings. As a
result of these announcements, regulators and market participants in various jurisdictions have been working to identify alternative reference rates that are compliant with the standards of the International Organization of Securities Commissions
(IOSCO). In the United States, the Alternative Reference Rates Committee (the ARRC), a group of market participants organized by the Federal Reserve and the Federal Reserve Bank of New York, has recommended the Secured Overnight Financing Rate
(SOFR) as its preferred alternative benchmark rate for US dollar LIBOR. U.S. federal bank regulatory agencies have also issued guidance on planning for and implementing a successful transition from LIBOR to SOFR.
Nonetheless, since LIBOR was referenced in hundreds of trillions of dollars of global transactions in a broad range of financial products, its
discontinuance may result in differences in the calculation of the applicable interest rate or payment amount depending on the terms of the governing instruments and increase operational and other risks to us and other industry participants.
Since the first half of 2018, Credicorp has had a multidisciplinary group working to define and execute a transition plan away from LIBOR and into SOFR and
other alternative reference rates. This group has Credicorp’s CFO and BCP’s Head of the Treasury Division as senior sponsors. The group has measured exposure and risks of the transition in terms of products, clients, funding, contracts, and
infrastructure, among others. For each exposure, we have established an individual plan aligned, as far as possible, to the recommendations published by the ARRC and we are starting to execute them.
In addition, in November 2021, the SBS recommended that supervised institutions not offer new contracts using LIBOR as a reference rate and that they
instead use robust market-standard alternative rates. Considering these developments, we decided to follow the SBS’s recommendation and have stopped offering products indexed to LIBOR, instead using SOFR as our main alternative reference rate since
January 2022. Nevertheless, we continue monitoring other benchmark rate(s) that could gain acceptance as LIBOR replacements as well as our exposure, along with any new risks that may emerge in connection with new developments and the release of
information.
During the transition, infrastructure and contracts have been the biggest challenges, along with ongoing changes in the market. In 2022, we
worked on various fronts to address the transition, such as improving and testing data and systems, defining and applying fallback language for the main template agreements of our financial products (now including most contracts where we assume a
liability and for new client loans originated at BCP) and coordinating across all relevant teams.
We consider Credicorp’s net exposure to LIBOR to be non-material, as it represents approximately 0.55% of our assets and 0.14% of our liabilities, as of
December 31, 2022.
It may be difficult to serve process on or enforce judgments
against us or our principals residing outside of the United States or to assert claims against our officers or Directors.
A significant majority of our Directors and officers live outside the United States (principally in Peru). Most of our assets and those of our
principal subsidiaries are located outside the United States. As a result, it may not be possible for investors to effect service of process within the United States upon us or our principals to initiate a civil suit under the United States
securities laws in United States courts. We have also been advised by our Peruvian counsel that judgments or decisions obtained under the United States federal securities laws may not be recognized and
enforceable in Peru unless certain requirements under Peruvian law for so-called exequatur proceedings, including as to jurisdiction, due process and consistency with Peruvian law, are deemed to have been satisfied. Similarly, our Bermuda counsel
have advised us that courts in Bermuda may not enforce judgments obtained in other jurisdictions, or entertain actions in Bermuda, against us or our Directors or officers under the securities laws of those jurisdictions. In addition, judgments of
United States courts obtained in actions under the United States federal securities laws may not be enforceable in other non-U.S. jurisdictions in which we or our principals operate or have assets.
In addition, our Bye-laws contain a broad waiver by our shareholders of any claim or right of action, both individually and on our behalf,
against any of our officers or Directors. This waiver limits the rights of shareholders to assert claims against our officers and Directors for any action taken by an officer or Director. It also limits the rights of shareholders to assert claims
against officers for the failure of an officer or Director to take any action in the performance of his or her duties, except with respect to any matter involving willful negligence, willful default, fraud, or dishonesty on the part of the
officer or Director. As a result, it may be more difficult for our minority shareholders to assert claims against us, or our Directors and officers, as compared to the shareholders of a U.S. company.
Industry and Market Risks
We operate in a competitive environment that may limit our potential to grow and may put pressure on our margins and
reduce our profitability.
BCP Stand-alone and Mibanco have experienced increased competition, including increased pressure on margins. This is primarily a result of the following:
| • |
Highly liquid foreign-owned commercial banks and microfinance institutions in the market;
|
| • |
Local and foreign financial services, wealth management and capital markets institutions, with substantial capital, technology, and marketing resources; and
|
| • |
Local pension funds that lend to BCP Stand-alone’s corporate customers through securities issuances.
|
Larger Peruvian companies have gained access to new sources of capital through the local and international capital markets, and BCP Stand-alone’s existing
and new competitors, including non-banking institutions such as fintech companies, have increasingly made inroads into the higher margin, middle market, and retail banking sectors. Such increased competition has affected BCP Stand-alone’s loan
growth as well as reduced the average interest rates that BCP Stand-alone can charge to its customers.
Competitors may also dedicate greater resources to, and be more successful in, the development of technologically advanced products and services that may
compete directly with BCP Stand-alone’s and Mibanco’s products and services. Such competition would adversely affect the acceptance of BCP Stand-alone’s and Mibanco’s products and/or lead to adverse changes in the spending and saving habits of BCP
Stand-alone’s and Mibanco’s customer base. If competing entities are successful in developing products and services that are more effective or less costly than the products and services developed by BCP Stand-alone and Mibanco, BCP Stand-alone’s
and Mibanco’s products and services may be unable to compete successfully. BCP Stand-alone and Mibanco may not be able to maintain their respective market shares if they are not able to match their competitors’ loan pricing or keep pace with their
development of new products and services. Even if BCP Stand-alone’s and Mibanco’s products and services prove to be more effective than those developed by other entities, such other entities may be more successful in marketing their products and
services than BCP Stand-alone and Mibanco because of their greater financial resources, higher sales and marketing capacity or other similar factors.
We also face increasing competition from non-banking competitors in markets for some of our products and services. These non-banking competitors, including
fintech and startup companies and other technology companies, have emerged in recent years as digitalization has played a larger role, and these competitors may adversely affect our results of operations. Some of these competitors operate under
different or reduced levels of regulation in comparison to the regular banking supervision that applies to BCP Stand-alone and Mibanco. Therefore, these non-banking competitors are not subject to the same specific solvency or liquidity requirements
as banks.
As of March 31, 2023, Yape and Plin, which is a functionality in the mobile app of different banks in Peru that allow it users to transfer money using phone
numbers, became interoperable as BCRP stipulated through Circular No. 0024 and in July 2023, that all other financial institutions with mobile wallets should be integrated to this interoperability initiative. With interoperability, the risk of
increased competition for Yape arises. For more information about this initiative, please see “ITEM 5. OPERATING AND FINANCIAL REVIEW AND PROSPECT – 5.D Trend Information – Market Conditions".
As a result of Peru’s better economic growth, some international banks and microfinance institutions have sought and obtained authorization to open
representative offices in Peru. With the increased competition, more individuals will have access to credit, and the percentage of the population using banking services will likely climb. This also will eventually put downward pressure on interest
rates. Any negative impact on BCP Stand-alone and Mibanco as a result of increased competition could have a material adverse effect on our results of operations and financial condition. For further detail about the competitive market in our LoBs,
see “ITEM 4. INFORMATION ON THE COMPANY – 4.B. Business Overview – (5) Competition”.
Our business and results of operations could be negatively impacted by another wave of COVID-19, a new variant of
COVID-19, a different pandemic outbreak or other public health crises beyond our control.
In March 2020, the World Health Organization (WHO) declared the COVID-19 outbreak a pandemic. This extremely rare event, the likes of which
had not been seen in over 100 years, forced governments around the world to take important measures to mitigate contagion, such as the closure of international borders, severe mobilization restrictions and lockdowns. As a result, global gross
domestic product (GDP) contracted sharply in 2020 (lowest since the Great Depression of 1929) and the economies in which Credicorp operates (mainly Peru, Bolivia, Colombia, Chile and Panama) were severely affected by two factors: (i) the effect
on the global economy (such as the economic growth of our main trade partners like China and the United States, as well as lower commodity prices, mainly metals and oil), during the first half of 2020. At
the worst of the crisis, WTI oil prices fell around 80% YTD and copper 25% YTD); and (ii) the local effect of government measures to stop the COVID-19 outbreak, such as quarantines, forced economic shutdowns, and populist initiatives. In 2020,
GDP fell 11.0% in Peru, 6.0% in Chile, 7.1% in Colombia, 8.7% in Bolivia and 17.7% in Panama.
Major disruptions for exchange rates and global capital flows were triggered by the pandemic. The value of emerging markets currencies against the US
dollar, including those from Latin America, dropped substantially. The Brazilian real (BRL), Mexican Peso (MXN), Colombian Peso (COP) and Chilean Peso (CLP) all reached historic highs (lower value) at the beginning of the pandemic. The last two,
COP and CLP, have recently depreciated to new highs against the US dollar due to idiosyncratic problems. In October 2021, the Peruvian Sol weakened to its highest level against the US dollar.
To mitigate the negative effects of the pandemic on health and economic outcomes, governments around the globe made ample use of drastic fiscal measures
that consisted of additional spending or forgone revenue, including direct transfers and tax relief measures, and provided liquidity support, through loans and government guarantees (like the “Reactiva Program” in Peru). Central banks delivered
massive monetary stimulus by reducing policy rates to the zero lower bound in most developed and emerging economies and announcing quantitative easing programs to purchase sovereign and corporate bonds. Furthermore, in Bolivia, Chile and Peru early
withdrawals from pension funds were approved as a source of relief for households.
These measures, however, came with a cost. Lower economic growth and higher spending weakened debt metrics significantly and caused credit rating agencies
(CRAs) to issue many sovereign downgrades. According to Kramer (2021), between January 2020 and March 2021, three CRAs issued a total of 99 sovereign rating downgrades on 48 countries, affecting 35% of their rated sovereign portfolio. For instance,
between 2020 and 2022, Chile’s sovereign credit rating was downgraded by one notch by Fitch and S&P to A- and A, respectively; Colombia lost its investment grade rating from Fitch and S&P; Perú and Panamá suffered downgrades from the three
agencies and are now two and one notch above investment grade, respectively, when we consider the lowest rating of the three CRAs.
Another wave of COVID-19, a new variant of COVID-19 or a different pandemic outbreak (whether like COVID-19 or of a more deadly pathogen), would bring risks
to the global economy and to Peru’s economy and our operations. A new pandemic, or a new wave of COVID-19 or a variant thereof could again deteriorate fiscal metrics and reduce economic outcomes. Hence, it would put new downward pressure on credit
ratings. Actions taken by governmental authorities and other third parties in response to this risk may negatively impact our business, results of operations and financial condition.
As a result of COVID-19, the economies in which Credicorp operates (mainly Peru, Bolivia, Colombia, Chile and Panama) were severely disrupted
by two factors: (i) the effect on the global economy (lower economic growth of our main trade partners like China and the U.S.) , as well as lower commodity prices and (ii) the local effect of government measures to stop the COVID-19 outbreak
such as quarantines, economic shutdowns, greater fiscal expenditure, higher public debt, and expansionary monetary policy. This pandemic circle that forced lockdowns in the economy with the fall of GDP during 2020, and the increase of public debt
to afford COVID-19 programs resulted in a higher Debt-to-GDP rate for almost all countries. These realities, together with the higher fiscal deficit and a very expansionary monetary policy worldwide, have resulted in a high level of global inflation not seen since the 1980s.
These factors significantly impacted macroeconomic variables in the countries where we operate, which might adversely affect our results. As a consequence,
some of the main economic indicators affected include exchange rates, interest rates, credit spreads, commodity prices, GDP and sovereign government debt.
For further detail, see “ITEM 5. OPERATING AND FINANCIAL REVIEW AND PROSPECTS – 5.A Operating Results – (2) Political and Macroeconomic Environment”
Another pandemic outbreak or other international public health crisis may adversely affect the credit risk of Credicorp’s loan portfolio. Resulting
temporary closures, mobility restrictions, increases in unemployment rates and insufficient liquidity could negatively affect our business volume and the portfolio quality of our credit and investment portfolios.
Additionally, our insurance business may be impacted negatively given the possible increase in the level of claims, mainly in the life and health segment.
Regarding our pension fund business, possible government measures or pension reforms may lead to higher demand for early redemptions from clients, which
could impact our revenues through a reduction in the management fees.
Prolonged economic stress and market disruptions may generate pressure on our liquidity management and lead to increased volatility in
financial markets, such as disruption in fixed and equity income global markets (resulting in the fall of stock prices, including the price of Credicorp). Moreover, the increase in liquidity risk may result in limited and/or costly access to
financing sources, an inability to access capital markets, an increase in draws of outstanding credit lines and a change in the expected level of cash inflow as consequences of large-scale changes to loan
interest rates or other terms.
In terms of non-financial risks, the contagion of a disease may affect our ability to continue operating. Additionally, the possibility of lockdowns may
cause some of our suppliers to stop providing us with services for business continuity.
Our financial statements, particularly our interest-earning assets and interest-bearing liabilities, could be exposed
to fluctuations in interest rates, foreign currency exchange rates and exchange controls, which may adversely affect our financial condition and results of operations.
Since January 1, 2014, the functional currency of our financial statements has been the Sol; however, the Group’s subsidiaries generate revenues in Soles,
US Dollars, Bolivian Bolivianos, Colombian Pesos and Chilean Pesos. As a consequence, the fluctuation of our functional currency against other currencies, or any exchange controls implemented in the countries in which we operate, could have an
adverse impact on our financial condition and results of operations.
Except in specific circumstances, the Peruvian government generally does not impose restrictions on companies’ ability to transfer Soles, US Dollars or
other currencies from Peru to other countries, or to convert Peruvian currency into other currencies. Nevertheless, Peru has implemented restrictive exchange controls in its history, and the Peruvian government might, in the future, consider it
necessary to implement restrictions on such transfers, payments or conversions. For further information, see “ITEM 10. ADDITIONAL INFORMATION – 10.D Exchange Controls”.
The interest income we earn on our interest-earning assets, and the interest expense we pay on our interest-bearing liabilities, could be affected by
changes in domestic and international market interest rates, which are sensitive to many factors beyond our control, including monetary policies and domestic and international economic and political conditions.
We have implemented several policies to manage the interest rate risk exposure and seek proactively to update the interest rate risk profile to minimize
losses and optimize net revenues; however, sudden and/or significant volatility in market interest rates could have a material adverse effect on our financial condition and results of operations. For further information, see “ITEM 11. QUANTITATIVE
AND QUALITATIVE DISCLOSURES ABOUT RISK MANAGEMENT – Sensitivity to Changes in Interest Rates.”
We also face foreign exchange risk on credit that we extend through our banking business, which is
primarily conducted through BCP Stand-alone. To address this risk, BCP Stand-alone identifies borrowers that may not meet their debt obligations due to currency mismatches, by performing sensitivity analyses of the credit ratings of companies and
the debt-service capacities of individuals. Then, we classify borrowers according to their level of foreign exchange credit risk exposure. We monitor these clients, and, on an ongoing basis, we revise
our risk policies for underwriting loans and managing our portfolio of foreign currency-denominated loans. However, these policies may not sufficiently address our foreign exchange risk, resulting in
adverse effects on our financial condition and results of operations.
We have taken steps to manage the gap between our foreign currency-denominated assets and liabilities in several ways, including closely matching their
volumes and maturities. Nevertheless, a sudden and significant depreciation of the Sol could have a material adverse effect on our financial condition and results of operations. For further information, see “ITEM 11. QUANTITATIVE AND QUALITATIVE
DISCLOSURES ABOUT RISK MANAGEMENT – Foreign Currency Exchange Rate Risk”.
Liquidity risks are inherent in our business activities.
Liquidity risk is the risk of being unable to meet funding obligations as they come due, to capitalize on growth opportunities as they arise or pay
dividends without incurring unacceptable losses, costs or risks. This risk is inherent in any retail and commercial banking business and can be heightened by a number of factors such as over-reliance on a particular source of funding, changes in
credit ratings or market-wide phenomena such as market dislocation. The Group's liquidity arises primarily from customer deposits, principal and interest payments on loans and investment securities, net cash flow from operating activities and other
sources. We must maintain sufficient funds to respond to the needs of depositors and borrowers.
Our liquidity, business activities and profitability may be adversely affected by an inability to access the debt
capital markets or to sell assets during periods of market-wide or firm-specific liquidity constraints.
Our ability to borrow on a secured or unsecured basis, and the cost of doing so, can be affected by increases in interest rates or credit spreads, a
downturn in the geographic markets in which our loans are concentrated, the availability of credit, regulatory requirements relating to liquidity or the market perceptions of risk relating to us, certain of our counterparties or the banking sector
or the financial services sector as a whole, including our perceived or actual creditworthiness, as well as other factors that may be outside our control. An inability to obtain financing in the unsecured long-term or short-term debt capital
markets, or to access the secured lending markets, could have a substantial adverse effect on our liquidity. In challenging credit markets, our funding costs may increase or we may be unable to raise funds to support or expand our businesses,
adversely affecting our results of operations.
If we are unable to raise needed funds in the capital markets (including through offerings of equity, regulatory capital securities and other debt), we may
need to liquidate unencumbered assets to meet our liabilities. In a time of reduced liquidity, we may be unable to sell some of our assets, or we may need to sell assets at depressed prices, which in either case could adversely affect our results
of operations and financial condition.
The Group relies significantly on its deposits for funding.
The Group benefits from short-term funding sources, including primarily demand deposits, securities lending and time deposits. The Group's ability to
generate deposits depends on its reputation, customer service, and competitive pricing. Our access to deposits may also be affected by the liquidity needs of our depositors, particularly in an inflationary environment where they may be compelled to
withdraw deposits in order to cover rising expenses. As a part of our liquidity management, we must ensure we can respond effectively to potential volatility in our customers’ deposit balances.
Although we have been able to replace maturing or withdrawn deposits and advances historically as necessary, we might not be able to replace such funds in
the future, especially if a large number of our depositors, or depositors with high deposit balances, sought to empty their accounts in a short period of time. We could encounter difficulty meeting a significant deposit outflow, which could
negatively affect our profitability or reputation. In circumstances in which our ability to generate needed liquidity is impaired, we may need access to non-core funding such as borrowings from the BCRP, and other emergency sources. While we
maintain access to these non-core funding sources, some sources are dependent on the availability of collateral and the counterparty’s willingness and ability to lend. Any long-term decline in deposit funding would adversely affect our liquidity,
and we may not be able to manage the risk of deposit volatility effectively.
Our investment at fair value through profit or loss and fair value through other comprehensive income expose us to
market price volatility, liquidity declines and fluctuations in foreign currency exchange rates, which may result in losses that could adversely affect our business, financial condition and operating results. In addition, our investment at
amortized cost may expose us to market price volatility and liquidity shortcomings if sales of those investments become required for liquidity purposes.
Price, liquidity and foreign exchange risks are inherent in the Group’s securities. Our investments at fair value through profit or loss may lead to gains
or losses when sold or marked to market. Our investments at fair value through other comprehensive income may require us to record unrealized gains or losses through other comprehensive income when those investments marked to market and in realized
gains or losses when sold. Both types of investments at fair value may fluctuate from period to period due to numerous factors that are beyond our control, such as foreign currency exchange rates, interest rate levels, counterparty credit, risks
and general market volatility. Losses from trading activities and realized or unrealized losses could have an adverse effect on our business, financial condition and operating results.
Our investments at amortized cost may lead to gains or losses when sold due to liquidity requirements. These gains or losses occur due to numerous factors
that are beyond our control, including interest rate levels, counterparties' credit risk, and general market volatility.
Business Performance Risks
A deterioration in the quality of our loan portfolio may adversely affect our results of operations.
Given that a significant percentage of our income is related to lending activities, a significant deterioration of loan quality would have a material
adverse effect on our business, financial condition, and results of operations. We are subject to concentration default risks in our loan portfolio. Problems with one or more of our largest borrowers may adversely affect our financial condition and
results of operations. While loan portfolio risk associated with lending to certain economic sectors or clients in certain market segments can be mitigated through adequate diversification, our pursuit of opportunities in which we can charge higher
interest rates, and thereby increase revenue may have an impact in the profile of loan portfolio and exposure at risk.
In addition, loan concentration in commercial sectors is particularly salient in Peru and any significant deterioration in such sectors may have a material
adverse effect on our business, financial condition, and results of operations. For additional detail on the composition of our loan portfolio see “ITEM 4. INFORMATION ON THE COMPANY – 4.B Business Overview – (7) Selected Statistical Information –
7.3 Loan portfolio and – 7.3.3 Concentrations of loan portfolio and lending limits”. Our current strategy includes increasing our exposure to market segments with heightened credit risk, including middle-market and consumer segments, such as
unsecured small companies and consumer loans and consumer mortgages, which have higher risk profiles as compared to loans to large corporate customers. Given the changing composition of our loan portfolio and the possible adverse changes in the
environment in which we operate, our future results may differ significantly from our past results.
Finally, the Group relies heavily on the use of models all throughout the credit management process (prospecting, admission, portfolio monitoring and
collection). This requires a comprehensive governance framework seeking excellent standards in the construction and monitoring of these models. Those standards mitigate the impact that severe or unexpected changes in the macro and micro economic
environment could have on the risk quality of our portfolio, especially in the consumer and SME segments.
Errors or inaccuracies in models can generate adverse economic impacts
Model risk is defined as the possibility of incurring in economic losses due to bad decisions that are made based on erroneous or imprecise models.
Deficiencies at the model level may be generated by problems with data quality, methodologies, implementations and/or uses. This risk is relevant because Credicorp uses models in processes relative to credit acceptance, portfolio follow-up,
provisions, pricing, internal calculations of economic capital and other aspects. In light of the aforementioned, Credicorp mitigates this risk by relying on a specialized management model, adequate governance and a specialized team.
Accurate underwriting and setting of premiums are important risk management tools for primary insurance companies,
including Grupo Pacífico. But we face the risks that the estimates underlying our underwriting and premiums may be inaccurate.
Grupo Pacífico’s operating performance and financial condition depend on its ability to underwrite and set premium rates accurately across a full spectrum
of risks. In order to be profitable, Grupo Pacífico must generate sufficient premiums to offset losses, loss adjustment expenses and underwriting expenses.
To price premium rates accurately, Grupo Pacífico must:
• Collect and analyze a substantial volume of data;
• Provide sufficient resources to its technical units;
• Develop, test, and apply appropriate rating formula;
• Closely monitor changes in trends in a timely fashion; and
• Predict both severity and frequency with reasonable accuracy.
If Grupo Pacífico fails to accurately assess the risks that it assumes, or does not accurately estimate its retention, it may fail to
establish adequate premium rates. Failure to establish adequate premium rates could reduce income and have a material adverse effect on our operating results or financial condition. Moreover, there is inherent uncertainty in the process of
establishing life insurance reserves and P&C loss reserves. Reserves are estimates based on actuarial and statistical projections at a given point in time of what Grupo Pacífico ultimately expects to pay out on claims and of the related costs
of adjusting those claims, based on the facts and circumstances then known. Factors affecting these projections include, among others: (i) in the case of life insurance reserves, changes in mortality or longevity rates, interest rates,
persistency rates and regulation; and (ii) in the case of P&C loss reserves, morbidity, changes in medical costs, repair costs and regulation. Any negative effect of inaccurate estimates or projections on Grupo Pacífico could have a material adverse effect on our results of operations and financial condition.
While reinsurance is an important tool in risk management of any primary insurance company that enables risk
diversification that in turns helps to reduce losses, we face the possibility that the reinsurance companies will be unable to honor their contractual obligations.
Credicorp assumes reinsurance risk in the normal course of business for our insurance contracts when applicable. Premiums and claims on assumed reinsurance
are recognized as revenue or expenses in the same manner as they would be if the reinsurance were considered direct business, considering the product classification of the reinsured business.
While Credicorp’s internal requirements in regard to reinsurer counterparty credit risk, as set by Grupo Pacífico’s risk management unit and approved by the
Risk Committee, are more stringent than local regulatory requirements and include diversified placement of reinsurance, a failure by one or more of our counterparty reinsurance companies to honor their contractual obligations could have a material
adverse effect on our financial condition and results of operations.
Risks not contemplated in our insurance policies may affect our results of operations.
We maintain insurance in amounts that we believe to be adequate to cover risks related to our operations, including, among others, internal and external
fraud, computer crime, professional liability for services we provide, Directors and officers liability and general liability against general claims involving bodily injuries and property damage. However, it is possible that the terms and
conditions of the insurance policies we have will not cover a specific event or incident, or that our insurance will cover only part of the losses that we may incur. The insurance policies of Credicorp and its subsidiaries are contracted with Grupo
Pacífico. Grupo Pacífico reinsures the policies in the cases it deems appropriate due to the materiality of the risk.
The adoption of IFRS 17 may impact our results of operations.
IFRS 17 is an international standard regarding insurance contracts that was issued by the International Standards Board in 2017 and is intended to provide
transparent reporting about a company's financial position and risk. The IFRS 17 standard requires a company to measure its insurance contracts using updated estimates and assumptions that reflect the timing of cash flows and any uncertainty
relating to those insurance contracts. Compliance with IFRS 17 will therefore result in fundamental changes in the recognition, measurement, presentation and disclosure of information on insurance and reinsurance contracts, as well as in their
related processes. Insurance contracts combine financial and service characteristics and, in many cases, generate long-term variable cash flows. To properly reflect these characteristics, IFRS 17 combines the measurement of future cash flows with
the results of the insurance contract during the period in which the service is provided and requires the presentation of the financial results of the provisions for the service. This allows Companies, through the choice of an accounting policy
option, to recognize such financial results in the income statement or in other financial results. IFRS 17 is effective for financial reporting periods beginning on or after January 1, 2023.
With the participation of the business units involved in the relevant processes, the Group has been making adjustments to its processes, architecture,
controls and corporate governance in order to implement the IFRS 17 standard, as well as to prepare the necessary financial and management reports. In addition, the progress achieved was also presented to the Audit Committee.
To assist with implementation of this process, the Group made the decision to use the computer platform of Fidelity National Information Services (FIS), a
provider specializing in insurance business worldwide, and has been supported in its implementation by firms such as Deloitte and Management Solutions, based in Spain. The implementation includes extensive tests performed regarding the accounting
of insurance contracts under IFRS 17. In parallel, the progress of the work has been presented to external auditors.
IFRS 17 is expected to have the following business-specific impacts depending on the type of risks present in the relevant business:
| • |
P&C Businesses Risks: The Group expects a reduction in insurance liabilities due to reserves discount, which is expected to be low given the current interest rate environment as well as the nature of this
risk in terms of the reserve duration.
|
| • |
Life Businesses Risks: The Group anticipates that there will be an increase in insurance liabilities related to the interest rates effect and to the constitution of an explicit future profit margin known as
the contractual service margin. The variation in reserves, as a result of discounting liabilities for reserves, will result in a decrease in equity.
|
Finally, management of the Group constantly evaluates the impacts on the presentation and disclosure in the Group’s Financial Statements related to
insurance operations and believes that the Group’s implementation of the IFRS 17 standard will not have a material impact on the Group’s regulatory capital needs.
Acquisitions and strategic partnerships may not perform as expected, which could have an adverse effect on our
business, financial condition, and results of operations.
Acquisitions and strategic partnerships, including those made in our investment banking and wealth management, insurance and microfinance businesses, may
not perform as expected since our assessment could be based on assumptions with respect to operations, profitability and other matters that may subsequently prove to be incorrect. Future acquisitions, investments and alliances may not produce the
anticipated synergies or perform in accordance with our expectations, which could have an adverse effect on our business, financial condition, and results of operation.
For example, in 2020, the Group recorded a gross impairment loss totaling S/64.0 million (equivalent to US$17.7 million or 68,134 million Colombian Pesos
(COP)) for its investment in Mibanco Colombia (formerly Bancompartir) as a result of its assessment of the recoverable amount. In this assessment, the fair value of Mibanco Colombia was estimated to be 366,691 million COP (equivalent to US$95.7
million or S/346.5 million), which was less than its book value of 434,825 million COP (equivalent to US$113.4 million or S/410.6 million). In 2021 and in 2022, the Group did not record any gross impairment loss. For further detail, please see Note
11(b) (Intangible Assets and Goodwill) to the consolidated financial statements.
Credicorp’s increasing investments in digital transformation and disruptive initiatives may fail to achieve the
ambitions, efficiencies and other performance improvements that it is pursuing.
As part of its transformation strategy, Credicorp is increasing investments in developing digital capabilities such as IT, data analytics and cybersecurity.
The Company is attracting digital talent, evolving its agile culture to maximize client experience and strengthening its self-disruptive mindset. Moreover, Credicorp is increasing its investments in innovation and disruptive initiatives. The
Company may fail to achieve ambitions related to acquisition of clients, income generation, efficiency and other performance improvements described in “ITEM 4. INFORMATION ON THE COMPANY – 4.B Business Overview – (1) Credicorp Overview”.
Credicorp continues to invest in its technology and digital capabilities across its franchises, including digital platforms and cloud-based
solutions. Credicorp has also been pursuing productivity and operational performance improvements through evolving its diverse business models. For example, in microfinance, Mibanco has leveraged data and analytics to develop centralized credit
assessment capabilities and generate loan offers to current clients and has leveraged alternative channels such as mobile banking, call center, home banking, among others to increase loan disbursements. In addition, Credicorp has been making
other investments in new ventures within its LoBs, such as our Yape mobile application, and through its corporate venture capital center Krealo, which is investing in startup fintech such as Tenpo SpA
(Tenpo), Credicorp Capital Negocios Digitales S.A.S. (Tyba), Compañia Incubadora de Soluciones Moviles S.A. (Culqi) and Wally POS S.A.C. (Wally), among others. For additional detail about Credicorp Innovation strategy and our investment in
disruptive initiatives please see ITEM 4. INFORMATION ON THE COMPANY – 4.B Business Overview – (1) Credicorp Overview – Our Innovation Strategy.
If Credicorp fails to adequately invest in its digital and innovation strategy, our ability to compete or to provide superior customer experience could be
adversely affected. There is no guarantee, however, that these or other initiatives at Credicorp will achieve the ambitions, efficiencies, profitability or other performance improvements that the Company is pursuing or that they will have any
benefits at all.
Furthermore, Credicorp´s digital investments involve execution complexity, and could result in additional losses, charges or other negative financial
impacts. For example, Credicorp may not be able to achieve its objectives related to monetization of disruptive initiatives.
Credicorp’s digital investment and other initiatives may continue to evolve as its business strategies, the market environment and regulatory expectations
change, which could make the initiatives more costly and more challenging to implement and limit their effectiveness. Moreover, Credicorp’s ability to achieve expected returns on its investments and costs savings depends partially on factors that
it cannot control, including, among others, interest rates; inflation; impacts related to the pandemic; customer, client and competitor actions; and ongoing regulatory changes.
Our ability to pay dividends to shareholders and to pay corporate expenses may be adversely affected by the ability
of our subsidiaries to pay dividends to us.
As a holding company, our ability to make dividend payments, if any, and to pay corporate expenses will depend upon the receipt of dividends and other
distributions from our operating subsidiaries. Our principal operating subsidiaries are BCP Stand-alone, BCP Bolivia, Mibanco, Grupo Pacífico, ASB Bank Corp., Prima AFP and Credicorp Capital. Subject to certain minimum liquidity, reserve, and
capital adequacy requirements under applicable regulations, we are able to cause our subsidiaries to declare dividends. If our subsidiaries do not have funds available, or are otherwise restricted from paying us dividends, we may be limited in our
ability to pay dividends to shareholders. Currently, apart from the minimum capital requirements, there are no restrictions on the ability of BCP Stand-alone, BCP Bolivia, Mibanco, Grupo Pacífico, ASB Bank Corp., Prima AFP or Credicorp Capital to
pay dividends abroad. In addition, our right to participate in the distribution of assets of any subsidiary, upon any subsidiary’s liquidation or reorganization (and thus the ability of holders of our securities to benefit indirectly from such
distribution), is subject to the prior claims of creditors of that subsidiary, except where we are considered an unsubordinated creditor of the subsidiary. Accordingly, our securities will effectively be subordinated to all existing and future
liabilities of our subsidiaries, and holders of our securities should look only to our assets for payments.
Since our main Peruvian subsidiaries pay dividends considering the accumulated results shown in the financial statements prepared under local GAAP
applicable to financial entities, there could be differences between local GAAP and IFRS. The main difference between these is concentrated in the application of IFRS 9, for both the methodology used to determine the provision for credit losses in
loan portfolio and for the determination of financial income for loans. For 2022, the application of IFRS 9 resulted in provision reversal for credit losses in the loan portfolio being S/318.0 million lower than under local GAAP and income tax
being S/93.8 million higher than under local GAAP. The effects of these differences, net of income tax, resulted in net profit being S/224.2 million higher under IFRS than under local GAAP.
Finally, the value of any dividend paid by our operating subsidiaries that declare dividends in a currency different from Credicorp’s dividends (such as ASB
Bank Corp., BCP Bolivia, Credicorp Capital Holding Chile, and Credicorp Capital Holding Colombia) is subject to the impact of the depreciation of the dividend’s currency against Credicorp’s functional currency. This depreciation would have a
negative impact on our ability to pay dividends to shareholders. For further details about Credicorp’s Dividend Policy refer to “ITEM 8. FINANCIAL INFORMATION – 8.A Consolidated Statements and Other Financial Information – (3) Dividend Policy”.
Operational Risks
A failure in, or breach of, our operational or security systems, fraud by employees or outsiders, other operational
errors, and the failure of our system of internal controls to discover and rectify such matters could temporarily interrupt our businesses, increasing our costs and causing losses.
The risk of security breaches is present due the constant adoption of technologies and the
interoperability between them, digital profiles and digitalization of processes, as well as in the data transfer between remote workers, cloud servers and office workers because of the transition to a more permanent hybrid workforce. Likewise,
cyber risk could cause a significant loss of customer data or confidential information, loss of revenue, loss of customers and legal risks, which would directly affect our business and operation. In addition to this, the increased use of
information technologies (IT) and other IT resources can increase both technological risks as a result of some failure or problem in the management of technological tools, and operational risks due to deficiencies or failures in the processes or
resources.
We also have third-party services that store, transmit and process our confidential information and that of our clients, which constitutes the outsourcing
risk. In addition, we have seen an increase in recent years in the number and sophistication of cyberattacks not only against financial institutions but also their providers worldwide. These cyberattacks have used new techniques and tools and
exploited previously unidentified vulnerabilities, and there can be no assurance that we or our service providers will successfully prevent or detect all cyberattacks that could affect our business. [Riesgos incluirá los riesgos que han surgido
debido a la interoperabilidad de Yape y Plin]
Our anti-money laundering and counter-terrorist financing measures might not prevent third parties from using us as a
conduit for such activities, which could damage our reputation or expose us to fines, sanctions or legal enforcement, which could have a material adverse effect on our business, financial condition, and results of operation.
As financial institutions, our subsidiaries must comply with significant anti-money laundering and counter-terrorist financing laws and regulations, as well
as applicable international standards and recommendations such as the ones provided by the FATF and local directives. In line with these requirements, our group has developed a comprehensive risk-based approach strategy to implement an Anti-Money
Laundering (AML) and Counter-Terrorism Financing (CTF) Program, that seeks to prevent third parties from channeling illicit funds through Credicorp. At Credicorp, our financial institutions have continued to face many of the AML/CTF risks such as
fines, commercial sanctions, or legal enforcement.
In Peru, the SBS published the Anti-Money Laundering and Anti-Financing of Terrorism (AML/AFT) Risk Management Regulation in 2015 (SBS Resolution No.
2660-2015 and subsequent amendments), which includes provisions that extend the duties and functions of the Compliance Officer, make clear the obligation of companies to carry out customer classification under strict terms, establish enhanced due
diligence for high risk customers and set out the guidelines for transferring funds, as well as many other specific details for daily transactions. These guidelines result in higher operational costs, due to the significant investment in technology
required to keep up with the strict terms of the regulation.
Environmental, Social and Governance Risks
Natural disasters in Peru could disrupt our businesses and affect our results of operations and financial condition.
In Peru, we are exposed to risks of natural disasters that in some cases may be exacerbated by climate change, such as floods, mudslides and droughts. We
are also exposed to disasters unrelated to climate change, such as earthquakes. Earthquakes in Peru are common occurrences as the country is located in a seismic zone: the interface between the Nazca and South American tectonic plates. Peru has
been adversely affected by earthquakes in the past, including a 7.9 magnitude earthquake that struck the central coast of Peru in 2007. The country is also vulnerable to the El Niño Phenomenon (El Niño), an oceanic and atmospheric phenomenon that
causes a warming of temperatures in the Pacific Ocean and provokes heavy rains off the coast of Peru that may result in floods and mudslides in the north and central Andean regions. Due to its very strong intensity, the 1997-1998 El Niño destroyed
crops and infrastructure equivalent to 2.2% of Peru’s GDP. In early 2017, El Niño adversely affected agricultural production, transportation services, tourism and commercial activity, caused widespread damage to infrastructure, displaced many
people and resulted in a deceleration of growth from 4.0% in 2016 to 2.5% in 2017. According to Peru’s fiscal council, El Niño caused US$6.2 billion in damages (equivalent to 2.9% of Peru’s GDP) in affected regions in the first half of 2017 through
damages to bridges, roadways, housing, and educations services, among others.
At the beginning of 2023, heavy rains have intensified in many areas on the North Coast of the country due to unusually warming of temperatures in the
Pacific Ocean and the wake of cyclone Yaku. This scenario has caused river overflow risk, mudslides, floods, lack of food and water in some towns. In addition, The National Service of Meteorology and Hydrology of Peru (Servicio Nacional de
Meteorología e Hidrología del Perú or SENAMHI by its Spanish initials) and The National Study of the El Niño Phenomenon (Estudio Nacional del Fenómeno El Niño or ENFEN by its Spanish initials), local climate events specialist, maintained a state of
“El Niño costero alert” since it expects El Niño conditions (warmer than normal superficial sea temperatures) to continue developing at least until July this year, and in its april 12th report estimated a moderate magnitude. The same institution
had estimated a higher probability of a phenomenon of weak magnitude in its march 30th report. While the actual magnitude of this weather phenomenon this or next year is still highly uncertain, it will continue to negatively affect Peru’s GDP from
time to time and may affect the financial situation of some of Credicorp’s clients and the quality of our loan portfolio.
Additionally, similar natural disasters, or other types of disasters, could impair our operational capacity. Our business continuity plans
include emergency response, disaster recovery, operations continuity, crisis management, data protection and recovery, and critical systems redundancy. Although we test our business continuity plans annually, these plans may prove to be
ineffective, which could have a material adverse effect on our ability to carry out our businesses, especially if an incident or disaster affects computer-based data systems or damages customer or other data. In addition, if a significant number
of our employees were affected by the natural disaster, our ability to conduct business could be impaired. Our subsidiary Grupo Pacífico is further exposed to risks associated with natural disasters due to the policies that it underwrites. To
protect Grupo Pacífico’s solvency and liquidity, our insurance business historically has reinsured substantial portions of its earthquake-related risks through automatic quota share and excess of loss reinsurance;
however, there can be no assurance that a major catastrophe would not have a material adverse impact on our results of operations or financial condition or that our reinsurance policies will be an effective hedge against our exposure to risks
resulting from natural disasters.
We may incur financial losses and damages to our reputation from environmental, social and governance (ESG) risks. In
recent years, these risks have been recognized as increasingly relevant since they can affect the creation of long-term value for stakeholders of the Company.
In recent years, these risks have been recognized as increasingly relevant since they can affect the creation of long-term value for stakeholders of the Company. Environmental
issues may affect our businesses, mainly our banking and asset management business, as the relationship with some of our clients may be damaged if the Company is perceived as not being environmentally responsible. Also, we may suffer from
reputational risk if the projects or companies we finance, or invest into, cause environmental damage. Among these issues, climate change is an important matter to Credicorp, potentially exposing the organization to physical and transition risks,
which may impact traditional risks, such as credit, operational, reputational and others.
Social issues related to managing employees, customers and/or communities’ relationships may affect our business mainly through talent or capabilities deficit, high training
costs, compliance failures, operational inefficiencies, and reputational risks. And finally, corporate governance issues may affect our business mainly through reputational risk, if we are perceived by stakeholders as a company that has any
controversy related to transparency, Board structure and remuneration or stakeholder governance.
Credicorp Ltd. (New York Stock Exchange (NYSE) and Lima Stock Exchange (Bolsa de Valores de Lima or BVL by its Spanish initials) trading code: BAP) is an exempted company that
was formed in Bermuda on August 17, 1995, pursuant to the Bermuda Companies Act 1981 to act as a holding company for, and to coordinate the policy and administration of our subsidiaries, which include BCP Stand-alone, BCP Bolivia, Mibanco, Mibanco
Colombia, Grupo Pacífico, Prima AFP, Credicorp Capital and ASB Bank Corp. We currently hold, directly and indirectly, 97.74% of BCP, 99.96% of BCP Bolivia, 99.92% of Mibanco, 85.58% of Mibanco Colombia, 98.86% of Grupo Pacífico, 100.00% of Prima
AFP, 100.00% of Credicorp Capital and 100.00% of ASHC (and 100.00% of ASB Bank Corp. through ASHC). See “ITEM 4. INFORMATION ON THE COMPANY – 4.C Organizational Structure”. In Bermuda, Credicorp operates under the Bermuda Companies Act 1981 (as to
date amended).
Our principal activity is to coordinate and manage the business plans of our subsidiaries to implement a universal banking service mainly in Peru, Bolivia, Colombia, Chile, and
Panama and to develop our Insurance and Pension and Investment Banking and Wealth Management businesses. Though we primarily focus on the aforementioned countries, we also make limited investments in other countries in the same region. Our
registered address in Bermuda is at Clarendon House, 2 Church Street, Bermuda, the phone number is +1 441 295 5950 and the address of our Internet website is https://www.grupocredicorp.com/ (which website, and the information on such website, are
not incorporated in this Form 20-F). The management and administrative office (that is, principal place of business) of our principal subsidiary, Banco de Credito del Peru, is located at Calle Centenario 156, La Molina, Lima 12, Peru, and its phone
number is +51-1-313-2000.
The SEC maintains an Internet website that contains reports of issuers that file electronically with the SEC. Our electronic filings with the SEC are available to the public
from the SEC’s Internet website at http://www.sec.gov. (Trading Code – BAP)
As of December 31, 2022, our total assets were S/236.8 billion and our equity attributable to Credicorp’s equity holders was S/29.0 billion. Our net profit attributable to
Credicorp’s equity holders in 2020, 2021 and 2022 was S/346.9 million, S/3,584.6 million and S/ 4,633.1 million, respectively. See “ITEM 3. KEY INFORMATION – 3.A Selected Financial Data” and “ITEM 5. OPERATING AND FINANCIAL REVIEW AND PROSPECTS”.
On December 20, 2017, Credicorp’s Board of Directors resolved to organize Credicorp’s subsidiaries in four LoBs: Universal Banking; Microfinance; Insurance and Pensions; and
Investment Banking and Wealth Management. These changes took effect on April 1, 2018. During the same year, the Corporate Venture Capital Arm of the group was formed, developing Krealo in March 2018.
Universal Banking
On April 18, 2018, Credicorp Ltd., through its subsidiaries Grupo Crédito S.A. and BCP Stand-alone, acquired 3.23% and 0.06%, respectively, of the share capital of Mibanco from
minority shareholders for approximately S/129.0 million and S/2.4 million, respectively. Additionally, on May 22 and 23, 2018, BCP Stand-alone acquired 1.22% and 0.05%, respectively, of the share capital of Mibanco from minority shareholders for
approximately S/47.3 million and S/1.9 million, respectively. These acquisitions of non-controlling interest were recorded as equity transactions. Through these acquisitions, Credicorp Ltd. increased its interest in the share capital of Mibanco
from 93.18% to 97.74%.
On May 7, 2018, Credicorp Ltd. sold to its subsidiary Grupo Crédito S.A. 220,113,636 shares of BCP Stand-alone owned by Credicorp Ltd., which represented 2.77% of BCP
Stand-alone’s share capital. The amount paid per share was S/6.61. Following this sale, Credicorp, in conjunction with its subsidiary Grupo Credito, continued to own 97.7% of the shares of BCP Stand-alone.
In July 2022, Grupo Crédito S.A. established Yape Market S.A.C, a company focused on the promotion and management of sales and placement of products and services through
electronic means. Grupo Crédito S.A. currently owns a 99.99% stake in Yape Market S.A.C.
Microfinance
On June 28, 2019, Credicorp Ltd., through its subsidiary Credicorp Holding Colombia S.A.S., reached an agreement with the majority shareholders of Banco Compartir S.A.
(Bancompartir) to acquire a majority stake in Bancompartir, which provides microfinance and SME financing solutions to micro entrepreneurs and was one of the top four microfinance banks in Colombia. On December 2, 2019, Credicorp Ltd. announced
that after obtaining the necessary regulatory approvals, it completed the acquisition of 77.46% of the capital stock of Bancompartir for approximately US$76.0 million, as part of Credicorp Ltd.’s strategy of expanding its microfinance business in
Latin America.
On October 30, 2020, Credicorp Ltd. confirmed the merger of Bancompartir and Edyficar S.A.S. (Encumbra), to be integrated under the name Mibanco – Banco de la Microempresa de
Colombia S.A. (Mibanco Colombia). The merged entity had a consolidated loan portfolio of more than US$270 million as of December 31, 2020. Its operating model focuses on achieving financial inclusion and social development serving and accompanying
small and micro entrepreneurs in line with the business strategy proposed by Credicorp.
Insurance and Pensions
In 2015, Grupo Pacífico signed an agreement with Banmedica to participate as equal partners in the health insurance and medical services business. Grupo Pacífico transferred the
majority control of the Pacífico Seguros corporate health insurance business and medical services to Banmedica. In 2018, UnitedHealth Group, one of the world's largest healthcare companies, acquired Banmedica, becoming Pacífico’s new partner in
Peru. Consequently, the Pacífico Seguros’ corporate health insurance business and medical services are no longer consolidated with Grupo Pacífico for accounting purposes and are reported as an investment in associates.
Investment Banking and Wealth Management
During 2012, Credicorp initiated the creation of a regional investment banking platform. During the same year, the firm acquired a 51% stake in Correval S.A. Comisionista de
Bolsa in Colombia and 60.6% of IM Trust S.A. Corredores de Bolsa in Chile. In 2013, Credicorp Capital Peru was created and included Credicorp Capital Bolsa, Credicorp Capital Titulizadora, Credicorp Capital Fondos and BCP Stand-alone’s investment
banking activities. On September 30, 2016, Credicorp Capital Peru concluded the acquisition of the remaining stake in Correval S.A. Comisionista de Bolsa in Colombia and IM Trust S.A. Corredores de Bolsa in Chile. As a result of these acquisitions,
Credicorp Capital became the owner of 100% of both companies. During these years Credicorp wanted to consolidate the brand name of Credicorp Capital on the whole region, so the group decided to name Correval S.A. Comisionista de Bolsa in Colombia
as Credicorp Capital Colombia and IM Trust S.A. Corredores de Bolsa in Chile as Credicorp Capital Chile.
On February 12, 2019, Credicorp Ltd., through its subsidiary Credicorp Holding Colombia S.A.S., reached an agreement with the shareholders of Ultraserfinco S.A. Comisionista de
Bolsa, a financial services company in Colombia, to acquire a 100% stake in Ultraserfinco S.A. Comisionista de Bolsa and its subsidiaries, which include 100% of Ultra Holding Group Inc., which in turn holds 100% of Ultralat Group Inc. (including
100% of Ultralat Investment Advisor and 100% of Ultralat Capital Market, LLC. (UCM)), for approximately US$43.0 million. On November 1, 2019, after obtaining the necessary regulatory approvals, the acquisition of 100% of the capital stock of
Ultraserfinco S.A. Comisionista de Bolsa was completed through Credicorp Holding Colombia S.A.S. and Credicorp Capital Fiduciaria S.A. Ultraserfinco S.A. Comisionista de Bolsa had several subsidiaries including Ultralat, a company regulated by the
SEC. On February 1, 2021, we finalized a merger between CCSI and UCM, which resulted in Credicorp Capital LLC.
On August 2, 2021, we finalized the merger by absorption between Atlantic Security Bank (Cayman Islands) and ASB Bank Corp. (Panama), with the latter being the surviving entity.
ASB Bank Corp. is a financial institution incorporated under the laws of Panama, with an International Banking License and a securities brokerage license, issued by the SBP and the Panamá SMV, respectively.
On March 15, 2022, Credicorp incorporated CC Asset Management Mexico S.A. de C.V., an unregulated legal entity (specifically, a variable capital corporation) in Mexico. This
entity will distribute mutual funds and investment funds through private offerings. The company was constituted as a subsidiary of Credicorp Capital Ltd.
Corporate Venture Capital – Krealo
Credicorp LoBs are complemented by Krealo, Credicorp's venture capital investment arm. Krealo identifies and invests in opportunities that complement Credicorp's business lines.
In January 2019, Grupo Crédito S.A. incorporated Tenpo S.P.A. (formerly Krealo S.P.A.) in Chile with the purpose of constituting investments in companies, real estate and
movable capital. Tenpo S.P.A. (formerly Krealo S.P.A.) acquired 100% of Tenpo Technologies S.P.A. (formerly Tenpo S.P.A.), a company dedicated to the commercialization of services, digital products, information technology and telecommunications,
and 100% of Tenpo Prepago S.A. (formerly Multicaja Prepago S.A.), a company dedicated to the issuance and operation of prepaid cards
In January 2019, Grupo Crédito S.A. acquired a 91.36% of Compañía Incubadora de Soluciones Móviles S.A. ("Culqi"). Currently, Grupo Crédito S.A.directly and indirectly owns 100%
of Culqi. Culqi was created in December 2013 and is mainly engaged in the development and operation of an online payment technology platform for digital businesses.
In September 2019, Grupo Crédito S.A. acquired an 85.00% stake in Fondo de Inversión Independencia II, an entity that grants personal loans via a digital platform.
We acquired Wally POS S.A.C. in January 2022 with the purpose of facilitating the management of client businesses through electronic tools and software that allow control of key
aspects such as electronic invoicing, inventory control, and reports.
We acquired Sami Shop S.A.C in June 2022, which is a company that offers e-commerce platforms to small, medium and large companies.
Both companies, Wally and Sami Shop, were initially acquired by Grupo Credito S.A. In December 2022, the two companies were transferred to Krealo Management S.A.
Krealo Management S.A. was incorporated in September 2022 with the purpose of being a Peruvian holding company. Krealo Management S.A. currently owns 99.99% of Wally POS S.A.C.,
99.99% of Sami Shop S.A.C. and 59.96% of Monokera S.A.S.
In November 2022, Krealo Ltd. was created in Bermuda as a wholly owned subsidiary of Credicorp. Krealo Ltd.’s purpose is to be a holding company.
In December 2022, Krealo Management acquired a 59.96% stake in Monokera S.A.S, a company that offers e-commerce platforms for selling insurance products.
Other support companies
In June 2021, Grupo Crédito S.A. established Ventive Servicios De Consultoría España, S.L with the purpose of providing specialized digital capabilities services to the
Credicorp Group.
Subsequent Events
| • |
IFRS 17 is effective for financial statements corresponding to reporting periods beginning on or after January 1, 2023 and will be
applied for the first time in our consolidated statement of financial position on January 1, 2023, which will also restate the financial information of the comparative period. IFRS 17 was issued in May 2017 as a replacement for IFRS 4
“Insurance Contracts” and requires a current measurement model where estimates are re-measured in each reporting period. Insurance contracts are measured using the components of:
|
| o |
Discounted probability weighted cash flows;
|
| o |
An explicit risk adjustment; and
|
| o |
A contractual service margin that represents the unearned technical utility of the contract which is recognized as revenue during the coverage period.
|
IFRS 17 applies to all types of insurance contracts (life insurance, non-life insurance and reinsurance), regardless of the type of entities that issue them, as well as certain
guarantees and financial instruments with certain characteristics of discretionary participation. The general objective of IFRS 17 is to provide an accounting model that is more useful and uniform for insurance entities. Unlike IFRS 4, which relies
heavily on the application of existing local accounting policies, IFRS 17 provides a comprehensive model for insurance contracts, covering all relevant accounting aspects.
IFRS 17 will imply fundamental changes in the recognition, measurement, presentation and disclosure of information in insurance and
reinsurance contracts, as well as in their related processes. Insurance contracts combine financial and service characteristics, and in many cases, generate long-term variable cash flows. To adequately reflect these characteristics, IFRS 17
combines the measurement of future cash flows with the recording of the results of the insurance contract, during the period in which the service is provided, and requires the separate presentation of the financial results of the results of the
provision of the service, allowing companies, through the election of an accounting policy option, to recognize such financial results in the income statement or in other comprehensive income.
Under strict governance and participation of the units involved, the Group has made adjustments to its processes, architecture, controls and corporate
governance in order to implement the standard, as well as have the necessary financial and management reports.
In this process, the Group made the decision to use the computer platform of a provider specialized in insurance business worldwide, Fidelity National
Information Services, and has been supported by international consultants. The implementation includes extensive tests related to the validation of insurance contracts under IFRS 17 in order to ensure the accuracy and completeness of the
information to be recorded in the Financial Statements.
The adoption of IFRS 17 will have the following impacts depending on the type of risk in which the Group operates:
| o |
Equity Risks: The Group expects a reduction in insurance liabilities as a result of the projection of the claims reserve and its subsequent discount, and a low impact is estimated given the current interest
rate environment, as well as the nature of this risk insofar as to the duration of the reservation.
|
| o |
Life Risks: Regarding the Life businesses, the Group anticipates that there will be an increase in insurance liabilities, mainly, due to the establishment of an explicit future profit margin known as the
contractual service margin and, to a lesser extent, to the effect of interest rates.
|
The Group decided to recognize market changes in interest rates in equity. The choice reflects how the Group accounts for its financial assets under IFRS 9.
IFRS 17 is effective from the financial statements beginning on January 1, 2023, and the effects of applying it for the first time will be recognized in our consolidated statement of financial position on January 1, 2023, date of initial
application, restating the financial information of the comparative period.
Based on current estimates, the adoption of IFRS 17 is not expected to have a significant impact on net equity on January 1, 2023, which is the initial
application date.
| • |
On January 12, 2023, the SBS announced its regulatory capital alignment with Basel III. For more information on regular capital changes, please see “ITEM 4. INFORMATION ON THE COMPANY – (6) Supervision and regulation – 6.2 Subsidiaries –
(iii) Peruvian Commercial Banks Regulation – BCP Stand-alone and Mibanco”.
|
| • |
On January 13, 2023, Law No. 31670 was published, that allows access to a minimum retirement pension and expands the voluntary contribution alternatives for members of Private Pension Fund Administration System (PPS). The law seeks to
improve the pension culture through the determination of retirement targets establishing that:
|
| 1. |
Affiliates may set a target of provisional saving in their individual funded account.
|
| 2. |
The minimum pension will be decided by the affiliates, being an amount not less than the basket of basic goods determined by the National Institute of Statistics and Informatics.
|
| 3. |
Members may use the surplus of the individually funded account (i) by transferring it to their voluntary contributions account for non-pension purposes and freely disposing of it or (ii) by issuing negotiable guarantees for an amount
equivalent to the excess of the individually funded accounts. These guarantees have a maturity of two years from their issuance.
|
Regulations under this new law has been published on April 18, 2023 and the SBS must issue the complementary operational rules for the application of these regulations in the
coming weeks.
| • |
On March 30, 2023, Credicorp acquired Joinnus, which is a platform for ticket sales for sports and entertainment events. This acquisition diversifies Credicorp’s portfolio of digital products.
|
| • |
At the Company’s 2023 Annual General Shareholders Meeting, on March 27, 2023, Credicorp Ltd.’s shareholders voted to approve the appointment of the new Board of Directors, which will hold office for the
2023-2026 period. New board members Nuria Aliño Pérez and Pedro Rubio Feijóo succeed Fernando Fort and Irzio Pinasco, both of whom decided to retire. Additionally, seven existing directors were re-elected. These appointments increase female
board representation to 33.3%. The new members, who further diversify Credicorp’s board and add extensive professional expertise in digital transformation within the financial services sector, fintech investing, sustainability development,
and wholesale and investment banking, will offer fresh perspectives to guide collaborative decision-making.
|
Nuria Aliño Pérez
Mrs. Aliño is an accomplished Spanish corporate and investment banking professional with over 25 years of experience in developed and developing markets
with roles spanning corporate finance, private equity/venture capital, impact investing, fintech transactions and digital strategy.
Since 2016, she has held positions with the World Bank Group's lnternational Finance Corporation (IFC) as Head of Partnerships and lnnovations, Digital
Finance Services and currently as Open Banking & Digital Transformation Specialist, providing guidance on the digital transformation strategies to financial institutions in the emerging markets.
Prior to her work with the IFC, she spent three years as an advisor to the General Manager of IDB lnvest (the lnter-American Development Bank’s investment
arm). Mrs. Aliño also spent over 15 years with BBVA in corporate and investment banking where she concluded her tenure as Chief lnvestment Officer for the Industrial Holding Group.
Mrs. Aliño serves as a board member and chair of the Sustainability Committee at Soltec Power Holding, a global developer of integral solutions for
sustainable solar energy listed on the Spanish stock market since 2019. She has held additional advisory board roles for tech companies and private equity and venture capital firms in Latin America and Europe.
Since 2019, Mrs. Aliño has been a faculty member of teaching programs in the United States and Spain for digital transformation of microfinance
institutions, financial inclusion and financial service disruption for programs in the United States and Spain.
Mrs. Aliño also served as member of Strategic Committee at BHD Bank, Dominican Republic, and Senior Strategic and Growth advisor at Veridas.
She holds a Master of Sciences in Law and a Bachelor of Economics and Business Administration from Universidad Pontificia Comillas in Spain.
Pedro Rubio Feijóo
Mr. Rubio is a Peruvian executive who brings 40 years of experience with Credicorp banking businesses, both domestically and internationally. Through his
role on the boards of various subsidiaries, Mr. Rubio has gained broad insight into the Group's businesses.
He began his career at Banco de Crédito del Perú in 1983 as a commercial executive, then went on to hold increasingly senior roles including Head of the
lnternational Business Department, CEO of Banco Tequendama, in Bogotá, Colombia, and Head of the Corporate and Business.
Banking Division. Until March 2018, he acted as Senior Vice President of Wholesale Banking at Banco de Crédito del Perú and reported directly to the CEO.
Mr. Rubio is currently a board member for various Credicorp subsidiaries, including Banco de Crédito del Perú, Prima AFP, Credicorp Capital Ltd., Credicorp
Capital Holding Perú S.A., ASB Bank Corp., Banco de Crédito de Bolivia and Inversiones Credicorp Bolivia S.A.
Mr. Rubio has a degree in Industrial Engineering from North Carolina State University in the United States.
The Directors of Credicorp Ltd. that will hold office for the 2023 – 2026 period are:
| o |
Antonio Abruña Puyol
|
| o |
Nuria Aliño Pérez
|
| o |
María Teresa Aranzábal Harreguy
|
| o |
Alexandre Gouvêa
|
| o |
Patricia Lizárraga Guthertz
|
| o |
Raimundo Morales Dasso
|
| o |
Leslie Pierce Diez-Canseco
|
| o |
Luis Romero Belismelis
|
| o |
Pedro Rubio Feijóo
|
| • |
At the Company’s 2023 Annual General Shareholders Meeting on March 27, 2023, the shareholders of Credicorp Ltd. approved the designation of Tanaka, Valdivia y Asociados SCRL, a member of EY International, to
act as independent external auditors of Credicorp and its subsidiaries for fiscal year 2023 and authorized our Board of Directors to delegate the approval of the independent external auditor’s annual fees to its Audit Committee.
|
| • |
On March 31, 2023, Fitch Ratings affirmed the credit rating of Credicorp Ltd. at ‘BBB’ with a negative outlook.
|
| 4. B |
Business Overview
|
Credicorp is the financial services holding company with the longest continuous operations in Peru with over 130 years of experience in the financial sector. We are organized
into four LoBs: (1) Universal Banking, and (2) Insurance and Pensions, which mainly serves the overall Peruvian market, together with (3) Microfinance and (4) Investment Banking and Wealth Management, which has a strong presence in Latin America.
Throughout its history, Credicorp has leveraged the strength of its franchises and has evolved towards customer-centricity, innovation, and growth, and has consolidated into a
Group with more than 36,000 employees and operations mainly in six countries: Peru, Bolivia, Colombia, Chile, Panama and USA. We have a purpose, a vision and values oriented towards the creation of value for our stakeholders and the societies of
countries where we operate.
Our Purpose
Contributing to improvement of lives by driving the changes that our countries need.
Our Vision
To be a sustainable financial services leader in Latin America. We are purpose-led, future-oriented and focused on creating superior and sustainable value for our employees,
customers, shareholders, and the countries we operate in.
Our Values
| • |
Respect: We have an open-door culture that respects and values people, their beliefs and decisions, always promoting a participatory, collaborative and horizontal work environment.
|
| • |
Fairness: We act in a fair and equitable manner in the treatment and recognition of people, seeking equal rights, responsibilities and opportunities for all.
|
| • |
Honesty: We promote transparency and seek to act consistent with what we believe and say; this is the only way we will continue to build relationships of trust.
|
| • |
Sustainability: Because people are at the center of everything we do, we carefully serve their needs, seeking to guarantee social, economic and environmental well-being, for the present and for the future.
|
Our North Stars
| • |
Efficiency
|
| • |
Customer Experience
|
| • |
Growth
|
Sustainability Strategy
Sustainability Governance
For Credicorp, integrating sustainability in the day-to-day management of our businesses is vital to ensuring effective implementation of Credicorp’s corporate sustainability
strategy. The sustainability governance structure’s objective is to increase the visibility of sustainability within the organization and establish clear responsibilities for the strategy and its successful execution at the Credicorp and
subsidiary levels.
We opted to add a series of roles to the existing governance structures to drive implementation and align actions at the subsidiary level with the sustainability strategy
developed at the corporate parent level. Involving the Board and the leaders of the organization in this process has been key to its success.
Sustainability Governance Structure
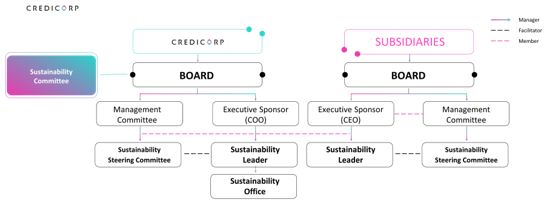
|
Forum / Team
|
Description
|
|
|
Sustainability Committee
|
The Sustainability Committee reviews Credicorp’s sustainability strategy and initiatives.
|
|
|
Sustainability Executive Sponsors (CEO, COO)
|
To ensure that adequate responsibility is assumed for the implementation of the Sustainability Program at the corporate parent level, we designated an executive
sponsor to supervise the sustainability strategy. Note that at the subsidiaries’ level, this role corresponds to their respective CEO.
|
|
|
Sustainability Steering Committee
|
The objective of this committee is to ensure that the sustainability strategy is adequately executed in all of the subsidiaries and at every level.
|
|
|
Sustainability Leader at Credicorp
|
The sustainability leader at Credicorp reports directly to Credicorp’s Sustainability Executive Sponsor (COO) and oversees the Sustainability Office.
|
|
|
Sustainability Office
|
The Sustainability Office works alongside the Sustainability Executive Sponsor, sustainability leaders and project leaders at all the subsidiaries to ensure
synergy development and consistency as it supports the execution of different initiatives.
|
|
|
Sustainability Leaders (Subsidiaries)
|
Each subsidiary has designated sustainability leaders to supervise the implementation plan at the company level and monitor the initiatives’ progress.
|
For further information about the Sustainability Committee, please see “ITEM 6. DIRECTORS, SENIOR MANAGEMENT AND EMPLOYEES – 6.C Board Practices”.
Integrating Sustainability in our Business Model
Implementing our strategy entails integrating sustainability in our business model (products, services, channels, among others). To accomplish this, we work on various platforms
associated with each of our strategic pillars:
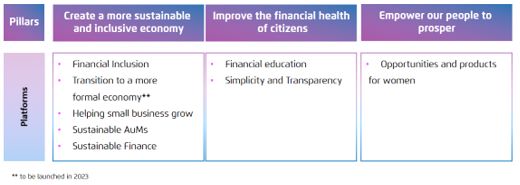
Below we provide examples of products and services that we develop in each pillar.
Pillar 1: Create a more sustainable and inclusive economy:
At Credicorp, we are conscious that we are a significant player in and have notable shares of the markets in which we operate and, accordingly, must assume a proportionate role
in promoting a more sustainable and inclusive economy. For this reason, our main ambitions include diverse efforts to drive the financial inclusion of people, as well as micro and small businesses. Our main initiatives on the financial inclusion
front in 2022 included working with IPSOS to develop our second assessment of financial inclusion to measure gaps and monitor the evolution of inclusion in eight countries in Latin America. Additionally, our subsidiaries worked to create solutions
that are aligned with our financial inclusion and education objectives, which were rolled out for micro, small and medium businesses and individuals through our main inclusive products: Yape (BCP Stand-alone); Crédito Mujer (Mibanco); Crediagua and
microfinance loans (Mibanco); and inclusive insurance (Pacífico Seguros). In this regard, Yape has become one of the main conduits for low-value payments and transfers in Peru. On its part, Credito Mujer empowers female entrepreneurs by providing
easier access to loans and financial education, thus helping them to achieve more financial freedom. In addition, Crediagua enables clients in low-income communities to fund necessary sanitary improvements such as access to potable water and
sanitation. Finally, Pacifico Seguros offers low-cost insurance to customers in lower socio-economic groups through banking channels (BCP and Mibanco) and raises awareness about insurance products.
To fulfill our strategic objective to create a more sustainable and inclusive economy, our advances in environmental management are also fundamental. We are working on a
corporate environmental strategy and our aspiration is to be our clients’ ally in their transition to more sustainable practices. Through our Sustainable Finance platform, we work to develop and offer financial solutions that motivate our clients
to reduce their environmental impact: green financing, eco-factoring, green bonds, sustainable financial products, among others. In 2022, we published our Corporate Policy for Sustainable and Responsible Investment. We seek to be agents of change
in the financial market by directing capital flows to sectors that develop increasingly sustainable practices and, in the stewardship front, by providing advice to clients and the companies in which we invest. A key enabler in this regard in our
ESG Risk Management, which is transversal in scope and involves multidisciplinary teams with representatives from the Risk, Loan, Business and Sustainability Areas. The focus here is on transition, as opposed to merely identifying exclusions. We
approved our first Environmental Taxonomy and developed mechanisms to identify environmental risks in prioritized sectors. For more information regarding environmental risk please see ITEM 3. KEY INFORMATION – 3.D Risk Factors – “Natural disasters
in Peru could disrupt our businesses and affect our results of operations and financial condition” and “We may incur financial losses and damages to our reputation from environmental, social and governance (ESG) risks. In recent years, these risks
have been recognized as increasingly relevant since they can affect the creation of long-term value for stakeholders of the Company.” Importantly, we began the base period of our commitment to becoming carbon neutral at our direct operations by
2032 by aligning methods and scopes of measurements across subsidiaries. The assessment of our emissions is developed under the ISO 14064-1, a GHG Protocol compatible standard, and is verified by a third party.
Pillar 2: Improve the financial health of citizens:
Experience has shown us that financial inclusion is highly correlated with financial education, and both are considered fundamental and inherent to our purpose and highly linked
to our business model.
Financial education helps people develop a deeper understanding of the financial products and services available in the market so that they can make better decisions. We are
convinced that a solid financial culture strengthens Peruvian’s trust of financial institutions, builds their confidence as users and promotes healthy relations with money and the adequate use of financial products and services. Financial
education is a key enabler of responsible financial inclusion.
At Credicorp, we have worked on different initiatives for financial education, including (a) mass communication of educational content, (b) on-site and online training programs
and (c) education efforts for businesses. Each initiative seeks to impart knowledge and present tools to clients and the public in general to position them to take full advantage of everything the financial system has to offer. We seek to align
different initiatives across our subsidiaries, expand our scope using digital channels and key partnerships, and share successful cases that can be replicated at the Group’s companies.
We seek to build trust and long-term relationships with our clients by improving the simplicity and transparency of our communications and solutions so that clients can
understand the conditions and costs attached to our products and services. To this end, personalized solutions and recommendations are provided to help clients achieve their goals and make better financial decisions.
Finally, we believe that our businesses must undergo digital transformation to continue pursuing our purpose to contribute to improving lives and accelerating the changes needed
in the countries in which we operate. We have begun implementing our corporate innovation system to strengthen our innovation and entrepreneurial culture at the corporate level, align spaces where we can innovate and optimize returns on our
innovation portfolio. This system focuses on the initiatives that are considered the most disruptive, given that they i) seek to generate new sources of income through new business models, ii) can compete with our traditional businesses and/or iii)
are supported by the most advanced technological components.
Pillar 3: Empower our people to prosper:
As a Group, we seek to empower people both in and outside the organization so that they can thrive. We promote a diverse and inclusive workforce with equal opportunities to
strengthen creativity and innovation, ensure long-term prosperity, and boost our employees’ motivation. For this purpose, we continue to implement our Gender Equality Program, which promotes equitable treatment at every level of the organization.
In 2022, we fine-tuned governance of the Gender Equity Program to ensure that its guidelines are more functional and aligned with the decisions and focus of the chain of governance, which includes the Senior Committee for Gender Equity, Credicorp’s
Management Committee and the CEOs of each line of business. Together with our efforts to achieve equality at our companies through equitable treatment, we have implemented initiatives to promote the development of our human capital. In a constantly
changing environment, our workforce will require critical abilities in the area of digital knowledge, data management and agility. For this reason, the corporate office of Human Management and Development is strengthening training programs to
bolster these skills and is working to ensure that the roll out is structured, phased, and organized in every company in the Group. In that sense, in 2022, Credicorp implemented the Credicorp Learning Community to promote the growth and development
of our leadership and contribute to accelerating business transformation. The High Specialization Fund was also launched to provided financing at preferential rates to Credicorp’s employees who wish to study at top universities. Also, agility was
established as a corporate capability with the goal of accelerating the agile transformation process of Credicorp companies.
We believe that human rights constitute a material issue to business sustainability and as such, have developed and articulated a comprehensive approach to human rights. We
included our public commitment in our Code of Ethics and Credicorp’s Board of Directors approved our Corporate Human Rights Policy. This policy was approved in April 2022 and was developed using as an input the framework of the Guiding Principles
on Business and Human Rights of the United Nations (UN).
In addition, we are committed to promoting spaces and initiatives that empower people by generating conditions for their complete inclusion in society and the economy. At
Credicorp, we are aware that the gender gap in the region is significant, and we drive efforts to explore and develop business opportunities with women in mind through the platform “Opportunities and Products for Women”. Four companies in the Group
Mibanco Peru, BCP Bolivia, Credicorp Capital and BCP Peru (through Yape) are actively analyzing data on our products to identify gaps or gender differences in client behavior or use of products. This analysis provides valuable information to
improve product design and user experiences. In particular, Mibanco Peru has developed Crédito Mujer, which offers microloans to women from the lower income segment and with limited access to financial services in Peru, and Mujeres Pa´lante, which
provides financing for working capital and fixed assets to women entrepreneurs in Colombia.
The three pillars described above are aligned with our core business operations and with the United Nations Sustainability Development Goals (SDGs), specifically with the
following SDGs:
|
SDG and
Objectives
|
PLATFORM AND
INITIATIVE
|
SDG
|
PLATFORM OR INITIATIVE
|
||
 5.1 5.2 y 5.5
|
• Internal
Gender Equity Program
• Opportunities
and products for women
|
 10.2 y 10.5
|
• Internal Gender Equity Program
• Opportunities and products for women
• Financial inclusion
• Sustainable finance
• Social Responsibility
• Compliance Policies
|
||
 8.2 8. 3 8.4 8.5 8.6 8.8 8.10
|
• Help for small businesses to grow
• Financial inclusion
• Financial education
• Sustainable AuMs
• Social Responsibility
• Compliance Policies
• Human Rights
|
 13.1 13.2
|
• ESG Risk Management (Climate)
• Assets under Management (AuMs)
• Sustainable Finance
• Direct Environmental Impact
|
||
 9.3 9.4
|
• Helping businesses grow
• Financial Inclusion
• Sustainable finance
• Sustainable AuMs
|
 16.2 16.4 16.5 16.6 16.7
|
• Human Rights
• Simplicity and Transparency
• Internal Gender Equity Program
• Corporate Governance
• Compliance and Ethics
|
||
 17.3 17.10 17.16 17.17 17.18 17.19
|
• Sustainable Finance
• Financial Inclusion
• Financial Education
• Social Responsibility
• Compliance and ethics
|
To achieve our vision of sustainability, we have identified the business initiatives that we must pursue based on their relevance to the market and to the products and services
that improve our competitiveness. These efforts ensure that sustainability is at the core of our business model. We have also determined which internal changes must be made to our operating model so that it provides an adequate launchpad for
initiatives and catalyzes our impact. The business initiatives are concentrated in platforms while internal changes are situated in enablers.
Integrating Sustainability in our Operating Model
Our enablers are the fronts through which we integrate sustainability in our operating model. They act as levers for the internal changes that the organization needs to make to
successfully execute the sustainability strategy. The working fronts that we have prioritized correspond to the main corporate functions at Credicorp:
|
Operating Function
/ Area
|
SUSTAINABILITY ENABLERS
|
|
|
Human Resource
Management and
Development
|
Drive change management
Build the workforce of the future
Champion diversity, inclusion and gender equality
|
|
|
Risks
|
Integrate ESG factors into risk management framework
|
|
|
Finance
|
Be a steward of long-term value creation
Optimize communications and reporting to capital markets
|
|
|
Compliance and Ethics
|
Encourage people to do the right thing
At Credicorp, we have established a set of fundamental policies, including our Human Rights Policy and our Anti-Corruption Policy, as well as our Code
of Ethics.
|
|
|
Corporate Governance
|
Enhance corporate governance frameworks
|
|
|
Others
|
Social Responsibility
Reduce direct environmental footprint
|
Our Innovation Strategy
Our digital strategy is fundamental to our goal of successfully executing our purpose, following our values and advancing towards the future
guided by our north stars. With an overarching group strategy, we are deepening our digital and transformation processes to capture opportunities efficiently while expanding our total addressable market and strengthening our operational
drivers.
Our transformation journey began in 2015, when BCP Stand-alone decided to raise the bar in customer satisfaction while pursing greater efficiency. Later, this path was followed
by Grupo Pacífico, Mibanco, Prima AFP and Credicorp Capital. Each of our LoBs has created an independent innovation lab, each of which is part of an innovation unit, and more importantly, has embarked on a cultural and digital transformation.
Throughout all these years we have been innovating by constantly challenging, transforming and disrupting ourselves in order to anticipate and adapt to the increasingly fast
changing megatrends that could impact our customers, capture digital opportunities and generate long-term profitability. This has been achieved by the digital capabilities we have been developing such as:
a) Having a self-disruptive mindset,
b) Strengthening an agile and user experience culture,
c) Capturing digital talent, and;
d) Developing solid tech capabilities.
And by leveraging our competitive strengths:
a) Diversified and independent LoBs,
b) Strong brand and extensive network of long-term client relationships,
c) Sound management with resilient track record, and;
d) Solid balance sheet and risk discipline.
During 2022, we started the implementation of our corporate innovation system at the Credicorp Ltd. level. This system is focused on
disruptive initiatives; that is, those that (i) are aimed at achieving new revenue streams through new business models, (ii) may compete with our own traditional businesses, and (iii) could rely on heavy technological components. The system is
steered by the Chief Innovation Officer (CINO), with the support of the recently created Innovation Management Office (IMO). The CINO and the IMO are in charge of (i) the definition of an innovation strategy at a corporate level, (ii) the
management of the disruptive initiative portfolio, and (iii) the development of the necessary enablers to foster and improve innovation efforts. We periodically review and evaluate potential disruptive
initiatives so that we manage them within funds, financial limits and metrics structured as a portfolio. The CINO steers this activity, which is performed along with the Finance Department and validated by the Innovation Committee.
The system and its governance reflect an entrepreneurial and decentralized innovation model. Major decisions around strategy and portfolio management are
made by a central Innovation Committee, while the sourcing and development of initiatives are executed by decentralized Innovation Units (IUs), which operate within our LoBs. Thanks to this arrangement, we benefit from, on the one hand, a central
decision body that ensures alignment of innovation to corporate goals and enables a fast decision process on the most complex issues; and, on the other, from being close to our customers, leveraging information already managed by our LoBs, and
fostering rapid change and adoption in the overall organization.
The Innovation Committee, which is the system’s central body, is composed by Credicorp’s CEO, COO, and CINO as voting members, while Credicorp’s CFO and
Krealo’s CEO participate regularly. This committee works closely with, and makes recommendations to, the Board of Directors, which holds the power over material decisions involving innovation strategy and ambition, and key venture graduations
(e.g., spin-offs, spin-ins, write-offs, others). The Innovation Committee interacts with other forums through crossed participants and other ways of coordination. For instance, we established the Valuation Committee, which defines the methodologies
and parameters for the valuation of ventures. This committee is chaired by the CFO. We also implemented an Innovation Table, chaired by the CINO, which serves as an open discussion and coordination space for the IUs’ leaders. The following picture
summarizes the main participants in our innovation system:
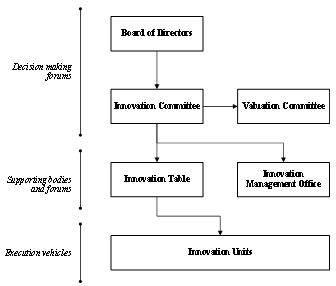
The IUs receive different roles depending on their capabilities and the system and LoBs’ needs. Those roles are held by: (i) innovation labs,
which focus on inside-out innovation and operate mainly from ideation to the product-market-fit stage; (ii) Krealo, our corporate venture capital arm, which brings outside-in innovation, principally through the acquisition of ventures with some
proven market fit; (iii) a special unit that escalates ideas with potential once product market fit has been established; and (iv) some specific ventures that are key to our strategy. For further information see “ITEM 4. INFORMATION ON
THE COMPANY – 4.A History and development of the Company”.
In terms of components, our innovation system covers strategic and enabling elements. The strategic elements include innovation domains, innovation ambition
and allocation of resources, and governance and performance management. These are necessary to provide guidance to the IUs and structure to the system. The enabling components are topics such as talent, culture, organization, or IT functions.
The innovation domains are spaces in which there might be opportunities to disrupt, given our corporate strategy and priorities, our internal
capabilities, and relevant market trends and developments. Thus, they offer visibility to the IUs on where to explore for new initiatives. We organize these domains in three horizons to help structure, prioritize, and take disciplined capital
allocation decisions. In horizon 1, we group the domains that are closer to our core businesses and geographies and, thus, are spaces we should mainly strengthen. In horizon 2, we include adjacent markets or niches in which we have identified an opportunity to enter or to reinforce our presence. Finally, in horizon 3, we explore trends with heavy technological components that might completely transform the way we operate.
To achieve our innovation ambition, we have identified limits to track our investment in the disruptive portfolio (including the impact to ROE), ensuring
that our profitability and financial health remains in line with our corporate goals. These limits allow us to allocate funds to the horizons, and to either current initiatives acceleration or escalation, or new initiatives origination and
development. The Innovation Committee provides the priorities for the assignments of capital, but the LoBs commit the specific funds as part of their strategies and budget needs, in accordance with our entrepreneurial and decentralized innovation
system.
Finally, for performance management, we have defined a set of metrics that help us monitor the disruptive portfolio performance and make timely decisions.
These metrics evaluate various aspects of our portfolio, which we group into three dimensions: (i) fund activity, which measures the size of the portfolio and the efficiency with which we use resources (time and money) and kill initiatives with
little potential; (ii) strategic performance, which reflects, for instance, diversification, generation of incremental revenues and clients to Credicorp and to Credicorp’s LoBs, or speed of escalation; and (iii) financial performance, which, in
general, assesses the optimal risk/return profile of our portfolio.
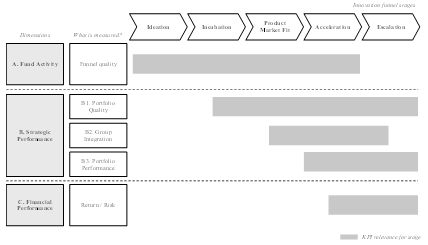
Corporate Venture Capital – Krealo
As part of our innovation efforts at the holding level, in 2018, Credicorp set up Krealo, an initiative that has evolved from our open innovation arm to Credicorp’s Corporate
Venture Capital, bringing innovation from the outside-in. Krealo focuses on external innovation by investing in opportunities that complement current and future LoBs. Krealo functions independently to other LoBs, with a similar flexibility to
venture capital funds, coupled with the control, network and scalability of Credicorp.
Krealo’s purpose is to identify, screen, and invest in opportunities by building and/or acquiring new features. Krealo currently manages six ventures across Peru, Chile, and
Colombia including: Tenpo, which aims to be a neobank, or online bank, in Chile; Tyba, an online digital broker in Colombia, Chile, and Peru; Culqi, an offline and online payments company in Peru; Wally, a point-of-sale (POS) software-as-a-service
(SAAS) business in Peru; Sami Shop, an ecommerce platform provider for businesses also in Peru; and Monokera, an insurance technology platform in Colombia. Krealo seeks to create both financial and strategic value for (i) Credicorp and (ii) the
ventures:
| (i) |
Regarding Credicorp, Krealo creates strategic value by:
|
| a. |
Boosting Credicorp’s current businesses: As an example, Tyba, through its 100% digital onboarding, allows its users to invest in funds in amounts less than US$25, therefore expanding the total addressable market in the Wealth Management
business of Credicorp.
|
| b. |
Creating new businesses for Credicorp: Tenpo, which aims to be our neobank in Chile, has become Credicorp’s first step into Chilean retail banking through its product offering. With approximately 2,000,000 registered downloads and more
than 1,900,000 clients since July 2019, Tenpo is democratizing financial services in Chile.
|
| (ii) |
Regarding the ventures, Krealo creates strategic value by:
|
| a. |
Providing independence to the ventures with constant support in areas of expertise including growth, IT, data, cybersecurity, among others.
|
| b. |
Acting as a long-term strategic partner, willing to support ventures with capital and expertise throughout their development.
|
| c. |
Offering flexible deal structures with the aim of generating financial and strategic value.
|
| d. |
Helping ventures grow faster by offering partnerships with LoBs, regulatory and financial expertise, relationships with industry leaders and the financial ecosystem, and the opportunity to leverage in Credicorp’s distribution channel
(both by selling their products through Credicorp channels and selling Credicorp products through the ventures channels).
|
Krealo seeks to become one of the most relevant actors in the Andean Venture Capital ecosystem by continuing to invest in fintech or startups with financial services angles.
Going forward, our strategic focus is to scale our businesses and increase user engagement. We strive to reduce our customer acquisition costs by leveraging organic channels, as
well as partnerships with Credicorp’s companies and other market leaders. Furthermore, we are developing more products within our ventures to improve the stickiness of our solutions, generate cross-selling opportunities and keep our customers
within our ecosystem with wider options according to their needs.
The Best Place for The Best Talent
To meet our transformation and growth objectives successfully, we seek to attract and retain the best talent, all while managing their potential, development and succession with
a comprehensive value proposition that strikes a balance between human and business perspectives. In 2022, our talent strategy paralleled our business innovation strategy, which is detailed in the previous section, including by focusing on
developing and attracting talent with technological and digital capacities while accelerating initiatives for gender equity.
We know that this is a competitive environment for talent and are committed to evolving our model to offer, current and potential employees, opportunities that focus on their
personal development, flexibility and wellbeing, including attractive compensation and a hybrid approach for many employees. Our hybrid/remote work from home approach is generating new opportunities and modalities for us by facilitating borderless
hiring.
Risk Rating
In March 2022, S&P Global Ratings confirmed the credit rating of Credicorp Ltd. at ‘BBB’ and the outlook as negative. At the same time, as a result of the change in rating
and outlook for Peru’s long-term sovereign debt, S&P Global Ratings changed the credit rating from ‘BBB+’ to ‘BBB’ and the outlook from negative to stable for seven Peruvian financial entities, including BCP Stand-alone and Mibanco. In April
2022, Fitch Ratings affirmed Credicorp Ltd.’s risk ratings at ‘BBB’ with a stable outlook. In December 2022, however, Fitch Ratings and S&P Global Ratings changed the outlook for some Peruvian financial entities, including BCP Stand-alone and
Mibanco, in accordance with the review to the Peruvian long-term sovereign rating, from stable to negative. Despite the change in Credicorp risk rating, Credicorp has a solid balance sheet and funding management. Therefore, this change does not
represent a significant change regarding the balance sheet or funding management.
Credicorp’s LoBs’ Contributions
According to IFRS, an operating segment is a component of an entity that engages in business activities from which it may earn revenues and incur expenses, whose operating
results are regularly reviewed by the Chief Operating Decision Maker (CODM), who makes decisions about resources allocated for the segment and assesses its performance, and for which discrete financial information is available.
The following tables provide certain financial information about our LoBs as of and for the years ended December 31, 2022, and 2021:
|
As of and for the year ended December 31, 2022
|
||||||||||||||||||||||||||||||||
|
External income (1)
|
Net interest, similar
income and
expenses
|
Non-interest
income,
net (2)
|
Total assets
|
|||||||||||||||||||||||||||||
|
(Soles in millions, except percentages)
|
||||||||||||||||||||||||||||||||
|
Amount
|
% Total
|
Amount
|
% Total
|
Amount
|
% Total
|
Amount
|
% Total
|
|||||||||||||||||||||||||
|
Universal Banking
|
||||||||||||||||||||||||||||||||
|
BCP Stand-alone
|
13,510
|
58.8
|
7,828
|
68.0
|
3,139
|
54.4
|
177,907
|
75.1
|
||||||||||||||||||||||||
|
BCP Bolivia
|
865
|
3.8
|
325
|
2.8
|
167
|
2.9
|
12,698
|
5.4
|
||||||||||||||||||||||||
|
Insurance and Pension funds
|
||||||||||||||||||||||||||||||||
|
Grupo Pacífico
|
3,763
|
16.4
|
727
|
6.3
|
620
|
10.7
|
15,905
|
6.7
|
||||||||||||||||||||||||
|
Prima AFP
|
354
|
1.5
|
-
|
-
|
354
|
6.1
|
735
|
0.3
|
||||||||||||||||||||||||
|
Microfinance
|
-
|
-
|
-
|
-
|
||||||||||||||||||||||||||||
|
Mibanco
|
2,750
|
12.0
|
2,139
|
18.6
|
31
|
0.5
|
17,226
|
7.3
|
||||||||||||||||||||||||
|
Mibanco Colombia
|
375
|
1.6
|
236
|
2.0
|
45
|
0.8
|
1,530
|
0.6
|
||||||||||||||||||||||||
|
Investment Banking and Wealth Management
|
923
|
4.0
|
98
|
0.9
|
666
|
11.5
|
14,051
|
5.9
|
||||||||||||||||||||||||
|
Other segments
|
453
|
1.9
|
165
|
1.4
|
748
|
13.1
|
3,476
|
1.5
|
||||||||||||||||||||||||
|
Eliminations
|
-
|
-
|
-
|
-
|
-
|
-
|
(6,774
|
)
|
(2.8
|
)
|
||||||||||||||||||||||
|
Total consolidated
|
22,993
|
100.0
|
11,518
|
100.0
|
5,770
|
100.0
|
236,754
|
100.0
|
||||||||||||||||||||||||
|
(1)
|
Corresponds to total interest and similar income, non-interest income (includes income and expenses on commissions) and net earned premiums from insurance activities.
|
|
(2)
|
Corresponds to total non-interest income (include income and expenses for commissions) and insurance underwriting result.
|
|
As of and for the year ended December 31, 2021
|
||||||||||||||||||||||||||||||||
|
External income (1)
|
Net interest, similar
income and
expenses
|
Non-interest
income,
net (2)
|
Total assets
|
|||||||||||||||||||||||||||||
|
(Soles in millions, except percentages)
|
||||||||||||||||||||||||||||||||
|
Amount
|
% Total
|
Amount
|
% Total
|
Amount
|
% Total
|
Amount
|
% Total
|
|||||||||||||||||||||||||
|
Universal Banking
|
||||||||||||||||||||||||||||||||
|
BCP Stand-alone
|
11,146
|
57.3
|
6,192
|
66.2
|
3,262
|
66.3
|
184,740
|
75.4
|
||||||||||||||||||||||||
|
BCP Bolivia
|
891
|
4.6
|
337
|
3.6
|
157
|
3.2
|
13,800
|
5.6
|
||||||||||||||||||||||||
|
Insurance and Pension funds
|
||||||||||||||||||||||||||||||||
|
Grupo Pacífico
|
3,544
|
18.2
|
610
|
6.5
|
228
|
4.6
|
16,491
|
6.7
|
||||||||||||||||||||||||
|
Prima AFP
|
407
|
2.1
|
(4
|
)
|
-
|
406
|
8.2
|
840
|
0.3
|
|||||||||||||||||||||||
|
Microfinance
|
||||||||||||||||||||||||||||||||
|
Mibanco
|
2,114
|
10.9
|
1,860
|
19.9
|
-12
|
(0.2
|
)
|
16,163
|
6.6
|
|||||||||||||||||||||||
|
Mibanco Colombia
|
302
|
1.6
|
229
|
2.4
|
35
|
0.7
|
1,393
|
0.6
|
||||||||||||||||||||||||
|
Investment Banking and Wealth Management
|
866
|
4.5
|
89
|
1.0
|
767
|
15.6
|
14,744
|
6.0
|
||||||||||||||||||||||||
|
Other segments
|
182
|
0.8
|
47
|
0.4
|
80
|
1.6
|
3,377
|
1.4
|
||||||||||||||||||||||||
|
Eliminations
|
-
|
-
|
-
|
-
|
-
|
-
|
(6,701
|
)
|
(2.6
|
)
|
||||||||||||||||||||||
|
Total consolidated
|
19,452
|
100.0
|
9,360
|
100.0
|
4,923
|
100.0
|
244,847
|
100.0
|
||||||||||||||||||||||||
|
(1)
|
Corresponds to total interest and similar income, non-interest income (includes income and expenses on commissions) and net earned premiums from insurance activities.
|
|
(2)
|
Corresponds to total non-interest income (include income and expenses for commissions) and insurance underwriting result.
|
The following table sets forth the contribution to the consolidated net profit attributable to our equity holders by each of LoBs and main subsidiaries:
|
2020
|
2021
|
2022
|
||||||||||||||||||||||
|
(Soles in millions, except percentages)
|
||||||||||||||||||||||||
|
Amount
|
% Total
|
Amount
|
% Total
|
Amount
|
% Total
|
|||||||||||||||||||
|
Universal Banking
|
||||||||||||||||||||||||
|
BCP Stand-alone
|
606
|
174.6
|
3,312
|
92.4
|
4,161
|
89.8
|
||||||||||||||||||
|
BCP Bolivia
|
(74
|
)
|
(21.3
|
)
|
72
|
2.0
|
68
|
1.5
|
||||||||||||||||
|
Insurance and Pension
|
||||||||||||||||||||||||
|
Grupo Pacífico
|
192
|
55.3
|
(129
|
)
|
(3.6
|
)
|
447
|
9.6
|
||||||||||||||||
|
Prima AFP
|
148
|
42.7
|
146
|
4.1
|
110
|
2.4
|
||||||||||||||||||
|
Microfinance
|
||||||||||||||||||||||||
|
Mibanco
|
(371
|
)
|
(106.9
|
)
|
260
|
7.3
|
415
|
9.0
|
||||||||||||||||
|
Mibanco Colombia
|
(97
|
)
|
(28.0
|
)
|
37
|
1.0
|
11
|
0.2
|
||||||||||||||||
|
Investment Banking and Wealth Management
|
192
|
55.3
|
164
|
4.6
|
107
|
2.3
|
||||||||||||||||||
|
Other segments and eliminations (1)
|
(249
|
)
|
(71.7
|
)
|
(277
|
)
|
(7.8
|
)
|
(686
|
)
|
(14.8
|
)
|
||||||||||||
|
Total
|
347
|
100.0
|
3,585
|
100.0
|
4,633
|
100.0
|
||||||||||||||||||
(1) As of December 31, 2022, 2021 and 2020, it includes Credicorp Ltd., Grupo Crédito S.A. and ASHC which mainly includes expenses and others.
The following table shows our LoBs and main subsidiaries’ respective percentage contributions to our total equity attributable to Credicorp’s equity holders:
|
2020
|
2021
|
2022
|
||||||||||||||||||||||
|
(Soles in millions, except percentages)
|
||||||||||||||||||||||||
|
Amount
|
% Total
|
Amount
|
% Total
|
Amount
|
% Total
|
|||||||||||||||||||
|
Universal Banking
|
||||||||||||||||||||||||
|
BCP Stand-alone
|
16,122
|
64.6
|
18,300
|
69.1
|
20,394
|
70.4
|
||||||||||||||||||
|
BCP Bolivia
|
691
|
2.8
|
835
|
3.1
|
860
|
3.0
|
||||||||||||||||||
|
Insurance and Pension
|
||||||||||||||||||||||||
|
Grupo Pacífico
|
2,971
|
11.9
|
2,279
|
8.6
|
2,381
|
8.2
|
||||||||||||||||||
|
Prima AFP
|
700
|
2.8
|
575
|
2.2
|
497
|
1.7
|
||||||||||||||||||
|
Microfinance
|
||||||||||||||||||||||||
|
Mibanco
|
2,110
|
8.5
|
2,363
|
8.9
|
2,781
|
9.6
|
||||||||||||||||||
|
Mibanco Colombia
|
215
|
0.9
|
234
|
0.9
|
241
|
0.8
|
||||||||||||||||||
|
Investment Banking and Wealth Management (1)
|
2,503
|
10.0
|
2,990
|
11.3
|
2,477
|
8.5
|
||||||||||||||||||
|
Other segments and eliminations (2)
|
(366
|
)
|
(1.5
|
)
|
(1,079
|
)
|
(4.1
|
)
|
(643
|
)
|
(2.2
|
)
|
||||||||||||
|
Total
|
24,946
|
100.0
|
26,497
|
100
|
28,988
|
100.0
|
||||||||||||||||||
(1) Investment Banking and Wealth Management mainly includes Credicorp Capital Ltd and subsidiaries and ASB Bank Corp.
(2) Includes Grupo Crédito S.A., CCR Inc., Inversiones Credicorp Bolivia, BCP Emisiones Latam 1 S.A., SEAH and others.
For a description of the principal markets in which we compete, please refer to “ITEM 4. INFORMATION ON THE COMPANY – 4.B Business Overview – (2) Lines of Business (LoBs), – (5)
Competition, and – (6) Supervision and Regulation” and Note 31 to Credicorp’s consolidated financial statements. For a breakdown of total income and operating income by geographic market for each of the last three fiscal years, as well as other
historical information about our LoBs, please refer to Note 31 to Credicorp’s consolidated financial statements.
Our Universal Banking LoB, which focuses on lending and investment, is organized into (i) retail banking activities, including our Individuals, SME-Business, SME-Pyme (small and
micro firm) segments, which are carried out by BCP Stand-alone’s Retail Banking Group (RBG); (ii) wholesale banking activities, including our corporate and middle-market banking business segments, which are carried out by BCP Stand-alone’s
Wholesale Banking Group (WBG); (iii) treasury activities, including asset and liabilities management (ALM); sales and trading; and foreign exchange and derivatives distribution, which are carried out by BCP Stand-alone’s Treasury function; and (iv)
wholesale and retail banking activities in Bolivia, which are carried out by BCP Bolivia.
The majority of our banking business is carried out through BCP Stand-alone, the leading bank in Peru by loans and deposits with close to 30% market share in loans and 32%
market share in deposits according to the SBS. We conduct banking activities in Bolivia through BCP Bolivia, a full-service commercial bank.
2.1.1 BCP Stand-alone
| (I) |
BCP Stand-alone’s Overview
|
BCP Stand-alone has one agency in Miami and one branch in Panama. See “ITEM 4. INFORMATION ON THE COMPANY – 4.C Organizational Structure – (1) Credicorp – (i) BCP.” BCP
Stand-alone’s operations are supervised and regulated by the SBS, SMV and the BCRP in Peru, by the Office of Financial Regulation of the State of Florida Department of Financial Services and the FED in the United States, and by the SBP in Panama.
As of and for the year ended December 31, 2022, BCP Stand-alone represented 75.1% of our total assets, and 70.4% of our equity attributable to Credicorp’s equity holders.
BCP Stand-alone’s purpose and values
BCP Stand-alone’s purpose is “Transforming plans into reality”. We aim to support our clients by always being with them, encouraging and transforming their dreams and plans into
reality, while building Peru’s story of development and progress and deepening our connection to communities to generate value for all stakeholders and ensure long-term sustainability.
We believe our values are key elements to fulfilling our purpose and shaping our culture. We call it our WOW culture because it helps us to provide the best Customer Experience
with a team committed to achieving our customers’ goals and dreams. Our values guide our employees and shareholders to work towards our purpose and reflect the role we want in Peruvian society. Our values are:
| • |
Customer Centricity
|
| • |
Test and Learn
|
| • |
Risk-conscious and righteous
|
| • |
Collaboration
|
| • |
Give your Best
|
| • |
Boost your Skills
|
BCP Stand-alone Strategy
Through BCP Stand-alone’s strategy we aim to: (i) be number one in customer experience and (ii) have the best efficiency ratio in Latin America.
Experience:
| • |
Deepening our connection to communities: We do business taking into consideration our role in the society and our different stakeholders.
|
| • |
The best experience: We offer a WOW experience in each touchpoint with our customers; and aim to provide solutions to their needs; and to support them at critical moments.
|
Efficiency
| • |
New sources and optimization of income: We continually develop new products and services to serve our customers and provide financial solutions to more Peruvians. In addition, we focus on optimizing our current revenue streams to their
highest potential.
|
| • |
The most efficient bank in the region: We optimize our products and processes with an overall portfolio perspective. We incorporate technology and innovation to offer the most cost-efficient option.
|
We work to develop key internal capabilities, our enablers, that will help us to stay on course towards our ambitions. Our enablers are:
| • |
IT: We seek to bring value to the market by increasing the amount, quality, and speed in our tech releases.
|
| • |
Data and Analytics: We seek to capture and exploit data in the most effective and intelligent manner.
|
| • |
Cybersecurity: We are focusing our efforts on the most effective strategies to reduce our exposure to cybersecurity risk.
|
We believe that our enablers leveraged by our talent and an agile mindset culture, will allow us to achieve our key objectives.
IT, Data and Analytics:
During 2022, in addition to the improvement of our key mobile app and web channels, we prioritized our operational stability to cope with increased digital transaction volumes.
We continued transforming our legacy technologies using API services, aiming for flexibility, efficiency and less dependency in our core systems, while at the same time,
leveraging Development Security Operations (DevSecOps) practices.
We leverage artificial intelligence and advanced analytics to identify and improve the decision-making process of the different businesses of BCP Stand-alone. Our Center of
Excellence in Advanced Analytics works closely with the business teams to apply machine learning and advanced optimization techniques. We are developing internal capabilities in cognitive AI techniques to reduce costs and increase customer
experience with automatization. We continuously search for new analytics opportunities and the adoption of existing ones to capture the potential of data and analytics in the company.
We use internally developed initiatives to study our customer population (including current customers and non-customers) by using non-traditional data sources, as well as data
from our digital channels. The data capture strategies, algorithms and data models support lead generation (for people and enterprises) and updating of customers’ contact information.
Cybersecurity
We are focusing our efforts on the most effective strategies to reduce our exposure to cybersecurity risk and achieve our objective risk appetite at a significantly lower cost,
applying the appropriate level of control to the relevant areas of potential risk. For this reason, we maintain an important investment program, which allows us to have the necessary technologies and processes to keep our operations and assets
safe.
We have defined the following cybersecurity priorities:
| a. |
Cybersecurity governance structure: The structure consists of three lines of defense (IT Security, Cybersecurity and Audit). Additionally, we have implemented corporate cybersecurity policies.
|
| b. |
Adoption of the National Institute of Standards and Technology (NIST) cybersecurity framework (CSF): We have taken the NIST CSF as a base; and, using the U.S. Federal Financial Institutions Examination Council (FFIEC) Cybersecurity
Assessment Tool, we have performed a self-assessment to determine our risk profile. Based on the results, we are implementing the required controls, as well as a work plan with periodic objectives.
|
| c. |
Awareness program: The technology to prevent cyber-attacks is not enough; the weakest point in an organization is, usually, an internal user incorrectly handling digital tools and exposed to possible cyber-attacks. Therefore, since 2018,
BCP Stand-alone has implemented an awareness strategy, defining parameters and best practices to train users to prevent and respond to cyber-attacks.
|
| d. |
Cybersecurity risk indicators: As part of the BCP Stand-alone business strategy, cybersecurity risk indicators form a central part of the monitoring and follow-up control of our cybersecurity ecosystem.
|
| e. |
Third-party governance: To ensure that the information we share with third parties is handled in accordance with our standards, all third parties are considered an extension of our functions and technological networks; and therefore, we
aim to ensure that they adhere to our security guidelines.
|
| f. |
Implementation of security technologies: We have a cybersecurity architecture based on technological risks where our technological threat model responds to the constant change in digital paradigms.
|
| g. |
Security Assurance: In response to the prevention of cyberattacks, BCP Stand-alone conducts due diligence to promote a correct level of response to new threats.
|
| h. |
Secure software development: As part of its digital transformation strategy, BCP Stand-alone ensures the correct delivery of software developments with the highest standards.
|
To continue satisfactory development of our enablers, we rely on our talent and an agile culture mindset. Therefore, we are attracting, upskilling and retaining diverse tech
talent. We recruit and hire specialized data, analytics and IT professionals from Credicorp’s international hubs in different countries on various continents. We offer our tech talent the opportunity to develop leading edge capabilities in an
environment in which we aim to lead in technology.
BCP Stand-alone has an agile organization scheme which was consolidated by 1) implementing an agile management model to promote the alignment, prioritization, and accountability
of initiatives; 2) developing high performance agile teams that focus on initiatives that improve time to market, productivity and quality in our squads, which are our agile, autonomous and multidisciplinary teams that work within our Tribes and
Centers of Excellence (CoEs); and 3) strengthening our chapters, which are highly specialized people that compose our CoEs, by raising the quality level of the service they offer to our squads. Tribes and CoEs are how we refer to our agile
organizations dedicated to the creation and evolution of our highly specialized and strategic capabilities.
Where we stand today….
At BCP Stand-alone, we began our transformation process long ago and our digital journey started in 2015 as a fundamental part of our strategy and business development. Today,
at BCP Stand-alone, we monitor and manage results and asset allocation by business segments, sub-segments, products, and channels as we seek out opportunities to optimize results.
Regarding customer experience, our strategy started by improving the basic aspects of the experience. Hence, we worked to reduce the waiting time in agencies, reduce the
abandonment of calls in our customer contact center, ensure the stability of the digital channels and finally, reduce complaints. Likewise, we also worked on improving the four pillars of BCP Stand-alone's customer experience, which are trust,
products, price and service. To support the service pillar, we assess customer satisfaction, aspire to resolve the main reasons for customer dissatisfaction; and enhance factors that we believe lead customers to promote our business.
We continue to make progress in digitizing our customers by launching new functions and products in our mobile applications. In 2017, retail digital sales represented only 7% of
total units sold, but in 2022, our digital sales accounted for over 61% of total units sold, of which products such as advance on wages, savings accounts and Yapecard, which is a digital account enrolled directly from our Yape mobile application,
had higher levels of units sold digitally. We have also increased our share of digital clients, which were 23% of individual clients in 2017 and reached 67% in 2022. Digital clients are retail customers who comply with at least with one of three
conditions: (i) carry out at least 50% of their monetary transactions through digital channels, (ii) carry out at least 50% of their non-monetary transactions through digital channels, or (iii) bought products digitally in the last 12 months. To
achieve these results, we have improved the experience in our digital channels and have increased our mobile banking users from 0.8 million in 2017 to over 5.6 million in 2022. Moreover, in 2017, we launched Yape, which has since become the largest
digital wallet in Peru, according to BCP Stand-alone’s research unit, with over 11 million users by the end of 2022. We increased our volume of loans and deposits per employee (by 43% from 2017 to 2022) and reduced our branches (by 25% from 2017 to
2022) placing us among the most efficient financial institutions in Latin America according to BCP Stand-alone’s research unit analysis of the efficiency ratio of its main regional peers. We have also continued increasing our spending and
investment in IT (by 116% from 2017 to 2022) to achieve further improvements in our efficiency indicators in the medium term.
(II) BCP Stand-alone’s Business Segments
(II.I) Retail Banking Group (RBG)
As of December 31, 2022, retail banking-related loans represented 50.8% of BCP Stand-alone’s total loans, while retail banking-related deposits represented 64.5% of BCP
Stand-alone’s total deposits.
The following table shows the client segmentation for RBG. This segmentation was a result of an analysis that addressed multiple factors such as the size and volume of activity
for each client, the clients’ affiliation with other companies or groups and their credit ratings.
|
Client Segmentation
|
|||
|
Business
|
Segment
|
Group
|
Client Income/Sales/Total debt
|
|
Retail Banking
Group (RBG)
|
Individuals
|
Enalta
|
Individual monthly income at least S/20,000; or more than US$200,000 in asset under management (not including severance indemnity deposits) in each month for the previous 6 months
|
|
Affluent
|
Individual monthly income from S/5,000 to S/20,000 in each month for the previous 6 months
|
||
|
Consumer
|
Focus on medium- and low-income individuals (less than S/5,000 of individual monthly income)
|
||
|
SME
|
Business
|
Annual sales from S/5.6 million to S/33 million; or total debt from S/1.2 million to S/10 million
|
|
|
Pyme
|
Annual sales up to S/5.6 million; or total debt up to S/1.2 million
|
||
Customer satisfaction at RBG
In 2022, as part of our continuous improvement processes, we evaluated various factors that we could improve to provide the best retail banking service in our markets. In
collaboration with Bain & Company, creators of the net promoter score (NPS), we changed our customer satisfaction measurement methodologies as follows:
• We began using the NPS as a new core indicator. We previously used the CSAT (T2B) index to monitor the quality of our customer experience. We believe that the
satisfaction element of this index was more focused on specific experiences, while NPS focuses on the recommendation and construction of a more long-term relationship associated with loyalty.
• We began using a new methodology for collecting information about customer satisfaction. Our customer satisfaction surveys are now limited to the main clients of
the most important banks in the market, and are considered “blind studies”, as the client is not told which bank commissioned the survey that he/she is answering. By focusing on the experience of the customers most related to each bank, this
methodology is expected to result in better quality information and a fairer comparison among competitors.
Individuals’ business segments within RBG are:
Enalta
Enalta services include investment advisory, securities-based lending, financial planning, and day-to-day banking services such as loans and cash accounts. In addition to
regular branches, Enalta clients have access to eight exclusive branches (seven in Lima and one in Arequipa), where they are able to make financial transactions in a secure, private space, as well as experience personalized advice of investment,
insurance and loan experts who offer exclusive, invitation-only products. Nevertheless, the services mentioned are not only available for the client itself, but also for their household, which allows for additional financial relationships. The
Enalta segment has close to 50,000 clients.
Affluent
Customers in RBG’s Affluent segment receive a differentiated value proposition that includes dedicated remote customer service, such as specialized account managers,
preferential service by tellers at branches, an exclusive call center number, and preferential interest rates on loans. Approximately 80% of these clients are serviced through specialized remote account managers responsible for improving per-client
profitability and achieving long-term relationships through personalized service, cross-selling, and share-of-wallet strategies. We believe we offer greater personalized services than other banks in Peru, with more products and therefore a stronger
value proposition. The Affluent segment has approximately 334,000 clients, of which 273,000 are served by 298 relationship managers.
Consumer Banking
Our Consumer Banking segment is in charge of developing strategies for the retail customers who are not included in affluent banking or small business banking. Its customer base
consists of approximately 10.3 million (only considers clients with at least one product) medium-to-low-income individuals. Consumer Banking focuses on customers who receive their payroll through BCP Stand-alone (which represents around 1.4 million
clients). Its strategies vary from basic acquisition of new accounts for wage-earners with special terms regarding fees and interest rates, to more sophisticated, aggressive cross-sell and retention programs that may include non-banking benefits
(such as access to discounts on non-banking products) and access to payroll advances.
The main products offered to individuals are:
Mortgage
According to the SBS and the Association of Banks of Perú (Asociación de Bancos del Peru or ASBANC by its Spanish initials), as of December 31, 2022, BCP Stand-alone was the
largest mortgage lender in Peru, with a market share of 32.08%.
One of the product lines responsible for recent growth in BCP Stand-alone’s mortgage lending to low-income customer is loans funded by the credit program of the Peruvian Housing
Development Bank (Fondo MiVivienda). The Fondo MiVivienda credit program provides government-funded loans with down payment aid for the purchase of properties valued up to S/464,200. This program seeks to cover the deficit in housing for
lower-income population segments.
According to the Fondo MiVivienda, during the year 2022, BCP Stand-alone made over 4,262 MiVivienda loans, representing the largest number of MiVivienda loans in the financial
system. In addition, as of December 31, 2022, BCP Stand-alone had a MiVivienda market share of 31.6% according to SBS and the Association of Banks of Peru (Asociación de Bancos del Perú or ASBANC by its Spanish initials).
Mortgage loans are associated with low losses because of their low LTV, as they are backed by the home equity guarantee. These loans have the added benefit of generating
opportunities for cross selling other banking products.
Credit Card & Consumer Loans
BCP Stand-alone’s current credit card balances increased from S/4,362 million as of December 31, 2021, to S/4,961 million as of December 31, 2022, due the optimization of our
risk models and pricing strategy, combined with the implementation of new commercial campaigns. The balances as of December 31, 2022, represent the highest year-end total since our pre-pandemic credit balance levels as of December 31, 2019. In
addition, in 2022, average credit card sells grew 38% compared to 2021, and digital channels sales grew 135% compared to 2021. Active credit card holders increased 27% with respect to 2021 and average gross payment volume increased 36% compared to
2021. As a consequence, our credit card market share in Peru increased 51 basis points (bps) from December 31, 2021, to December 31, 2022, according to the SBS and the Association of Banks of Peru (Asociación de Bancos del Perú or ASBANC by its
Spanish initials).
At BCP Stand-alone, we are focused on improving the shopping experience of our cardholders. In 2022, we launched Apple Pay with our VISA debit and credit cards, we promoted BCP
Mobile Payments, and we carried out a recurring educational campaign to educate our customers on how to enable/disable the option on their mobile banking application so that they can safely make online purchases.
During 2022, consumer loans showed a significant recovery in line with economic reactivation after the COVID-19 pandemic. We achieved record levels of loan origination, with
over S/780 million originated in 2022.
At the beginning of 2022, we focused on increasing our product offering to allow more customers to start building a credit record and be included in the financial system. To
reach these objectives, we offered 157,947 customers low credit limits and gradually increased limits for customers with good payment behavior. We also improved the evaluation filters to allow customers to access better offers.
We also improved our value proposition by using an elasticity model to set interest rates. Consumer loans without collateral balances grew from S/6,095 million in 2021 to
S/8,288 million in 2022 (representing 36% growth), and digital sales accounted for 83% of total loans sold in 2022 (an increase of 6% compared to 2021).
The SME segments within RBG are:
SME-Pyme
The SME-Pyme segment served approximately 2.0 million clients as of December 31, 2022 (compared to 0.7 million clients in 2021). The
increase in the number of clients is due to a migration of clients from Consumer Banking due to a new definition of individuals that qualify as SME-Pyme. The SME-Pyme credit portfolio totaled S/19,243
million as of December 31, 2022 (compared to S/19,787 million as of December 31, 2021), with the decrease due mainly to the repayment of Reactiva Peru (or Reactiva) loans that had been issued by the Peruvian government during the COVID-19 pandemic and the small credit portfolio of clients that migrated from Consumer Banking. Additionally, our SME-Pyme segment had a market share of 20.0% in Peru as of December 2022, according to the SBS. In 2022, we continued to serve our clients while digitizing our processes and systems. Finally, in 2022, SME-Pyme started
using the NPS as its new customer satisfaction methodology.
SME-Business
The SME-Business segment served approximately 11,841 clients as of December 31, 2022. In 2022, SME-Business experienced a reduction in loans and deposits, which decreased 19%
and 7%, respectively, from December 31, 2021, to December 31, 2022, mainly driven by lower Reactiva Peru loans and deposits. Excluding the effects of the Reactiva Peru Program, SME-Business’s loans balance increased by 6.9% over the same period.
According to the SBS and ASBANC, BCP Stand-alone closed October 2022 with 36.99% in loan market share in Peru, keeping BCP Stand-alone in first place in market share. Furthermore, according to our internal customer satisfaction survey led by Ipsos
Peru, 85% of our SME-Business clients indicated that they were satisfied or highly satisfied with BCP Stand-alone products and services in 2022 compared to 90% in 2021. SME-Business is migrating to the new NPS methodology and indicator in 2023.
Distribution Channels
Digital channels
|
Mobile Banking: In 2022, more than 452.9 million monetary transactions were channeled through mobile banking at BCP Stand-alone, which represented growth of 21.34%
compared to the number of such transactions in 2021. This growth was driven by client migration to digital channels.
|
|
Internet Banking: Transactions through Internet banking at BCP Stand-alone grew 10.07% from 2021 to 2022, with a total of 45.0 million monetary transactions in 2022.
|
|
Yape: Yape registered higher growth in monetary transactions than any of our other channels from 2021 to 2022, reporting expansion of 206.8% in monetary transactions from
391.3 million in 2021 to 1,200.2 million in 2022.
|
|
Cocos y Lucas: In December 2019, BCP Stand-alone launched its platform to change soles and dollars, Cocos y Lucas. This offered clients a new alternative for exchange
transactions. Transactions through Internet banking at Cocos y Lucas grew 5.8% from 2021 to 2022, with a total of 427 thousand FX transactions, which represented S/879.6 million transacted in 2022.
|
For more detail about Yape, please see “Retail Banking Innovations”.
Self-service channels
|
ATMs: In 2022, BCP Stand-alone’s ATM monetary transactions increased 10.39% from 2021 levels. BCP Stand-alone increased its ATM pool by 61 from the end of 2021 to close
2022 at 2,283 units.
|
|
Kioskos BCP: Kioskos BCP are digital self-service platforms at which customers can open savings accounts and/or pick up debit cards. Approximately 8.5 million transactions
were conducted through Kioskos BCP in 2022, which represented a 28.12% increase from 2021.
|
Physical channels
|
BCP Agentes: BCP Agentes are legally separated points of contact at allied SMEs with which we contract to enable our clients to carry out certain transactions. BCP Agentes
continue to constitute a highly effective channel for providing services to our clients given their wide availability in Peru. At the end of 2022, BCP Stand-alone had 9,580 BCP Agentes, which reflected an increase of 1,526 BCP Agentes
compared to the end of 2021. BCP Agentes conducted 411.6 million monetary transactions in 2022, which represents an increase of 15.22% compared to 2021.
|
|
Branches: At the end of 2022, BCP Stand-alone had 336 branches, which represented a reduction of 21 branches compared to the end of 2021. This decline was attributable to
an increase in client digitalization levels related to the COVID-19 pandemic, which led us to optimize our network.
|
Retail Banking Innovations
Yape
In Peru, we offer Yape, an app used to make money transfers and payments through a cell phone. Yape users can send or receive money transfers to their bank accounts linked to
their cell phone number and/or a unique QR code, make cell phone credit recharges (Mobile Top-Ups), pay for basic services, request credit, view promotions, and other functions.
We intend to make Yape into Peruvians’ go-to app. To achieve this, Yape has three main ambitions. The first ambition is to become the main payment network in Peru, competing
with cash. To accomplish this, Yape focuses on small-amount payments that are otherwise made in cash. Yape’s second ambition is to be present in its users’ day-to-day lives. Yape’s third ambition is to seek to provide solutions for Yape users’
financial needs. Yape started this journey with the launch of microloans in August 2022.
Yape is Credicorp’s main vehicle to support financial inclusion for the almost two-thirds of Peruvians which today do not have access to banking services in the country. For
this purpose, we launched Yapecard, which is a digital account enrolled directly from Yape, in May 2020. Peruvian citizens 18 years of age or older can register with an ID and use Yape without previously owning a BCP Stand-alone bank account
(subject to meeting the bank’s compliance criteria). During 2022, Yapecard was a key contributor in the distribution and payment of the Bono 600 and Bono Yanapay
bonuses given by the Peruvian government to more than 290,000 Peruvians who were not users of the formal banking system. Yape has also carried out financial education campaigns in seven regions of Peru, allowing us to reach more than 50,000
Peruvians.
As of December 2022, Yape had more than 11 million users, 160 million monthly average transactions, S/66 billion transferred annually, and more than 2.2 million small businesses
affiliated. More than 70% (a 30% increase compared to 2021) of Yape clients use Yape regularly for an average of 19 transactions per month (a 58% increase compared to 2021). The average monthly number of new Yape users grew from 288,451 in 2021 to
300,000 in 2022, of whom more than 200,000 were already BCP Stand-alone clients and approximately 90,000 enrolled with a Yapecard.
In late 2021, Yape started its monetization process by launching features that solve users’ day-to-day needs with two main objectives at the core of its design: i) simplicity
(always keeping the users’ journey and interface simple and easy) and ii) value (all features adding tangible value to the users and the organization). To achieve these main objectives, during 2022, Yape grew its Mobile Top-Ups business, which was
launched in late 2021 to allow users to buy cell phone credit from the Yape app, and on which more than 9.5 million monthly transactions were made in 2022, to become the main top-ups channel for BCP Stand-alone (with a share of 81% of BCP
Stand-alone’s mobile top-ups in 2022). The Mobile Top-Ups feature allows Yape to capture income as a share of the interchange fee charged by payment facilitators to merchants. BCP Stand-alone’s other top-ups channels include Mobile Banking (12% of
BCP Stand-alone’s mobile top-ups in 2022) and BCP Agentes (7% share).
Yape QR business payments, a feature launched in July 2021, has experienced remarkable growth in just a short period of time. In December 2022, the Yape QR business payments
service recorded S/102.7 million in Gross Payment Volume (GPV) and 2.7 million transactions, reflecting significant growth from December 2021, which saw GPV of S/10.4 million and 253,909 transactions. These figures demonstrate a monthly average
growth rate of 21% for GPV and 22% for transactions from December 2021 to December 2022, Yape QR business payments had a monthly average of S/40.3 million in GPV for 2022, an increase of 486% from the monthly average of S/6.9 million in the last
six months of 2021. In the last six months of 2022, there was an average of 1.7 million transactions per month, reflecting a growth of 933% compared to the monthly average of 167,432 transactions in the last six months of 2021. We believe that both
features have achieved initial success in being integrated into a growing share of Yape users’ day-to-day lives. The Mobile Top-Ups feature allows Yape to capture income as a share of the interchange fee charged by payment facilitators to
merchants.
To provide customers with more value options and connect them with the financial world, and to consolidate Yape as a digital channel, the following functionalities were launched
in 2022: Microloans (August), Yape Promos (September) and Checkout (November). In December 2022, more than 3.4 million Yape clients used one or more of these new features.
(II.II) Wholesale Banking Group (WBG)
As of December 31, 2022, wholesale banking loans represented 46.8% of BCP Stand-alone’s total loans, while wholesale banking deposits represented 33.6% of BCP Stand-alone’s
total deposits. WBG competes with local and foreign banks in Peru. WBG’s average daily balances amounted to S/56,470 million in 2022 (a 6.8% increase from 2021), compared to average daily balances of S/52,892 million in 2021 (a 1.6% increase from
2020). It also maintained its leadership in the Peruvian Wholesale Banking market with a 36.9% market share in loans, according to the SBS and ASBANC. It has also established longstanding client relationships with major industrial and commercial
groups in Peru. The WBG provides its customers with cash management solutions, short- and medium-term loans in local and foreign currencies, foreign trade-related financing, and lease and project financing.
The following table shows the client segmentation of BCP Stand-alone’s WBG segments. This segmentation was a result of an analysis, which addressed multiple factors such as the
size and volume of activity for each client, the clients’ affiliation with other companies or groups and their credit ratings.
|
Client Segmentation
|
||
|
Business
|
Group
|
Client Income/Sales/Total debt
|
|
WBG (1)
|
Corporate
|
Annual sales higher than $100 million
|
|
(Approximately S/399 million)
|
||
|
Middle-Market
|
Annual sales from $10 million to $100 million
(Approximately S/ 39 million to S/399 million)
|
|
(1) Converted into Soles at the exchange rate of S/3.8140 per US Dollar, December 31, 2022, as provided by the SBS.
WBG is divided into the following divisions and support areas:
Corporate and International Division (CID)
Corporate and International Division (CID)
The CID served 3,101 clients as of December 31, 2022. The CID provides financing for capital expenditures and investments, sales, international trade, and inventories. It offers
medium- and long-term financing, financial leases, and project financing and includes the following subdivisions:
| 1. |
Corporate banking subdivision, which provides loans and other credit and financial services. This subdivision focuses on serving large companies in Peru, which we consider to be those with annual sales of over US$100 million, corporate
governance, audited financial statements, and dominant market positions in their particular brands or product areas. Even if clients do not meet any of these criteria, the CID may provide services to firms under this category if they belong
to a large economic group of an important industry to Peru’s economy.
|
| 2. |
International banking and leasing subdivision, which manages relationships with financial institutions (locally and abroad) and provides trade products, international operational services, and financial leasing products.
|
| • |
BCP Stand-alone’s Correspondent Banking Unit focuses on obtaining and providing short-term funding for international trade, as well as medium-term lines of credit funded by international commercial banks and other countries’ governmental
institutions. This unit also earns fees by confirming letters of credit and guarantees issued by international banks and by providing other international payment and trade finance services. The unit also provides funding to some other Latin
American banks which send their international trade and guarantee flows to Peru through BCP Stand-alone. BCP Stand-alone’s Correspondent Banking Unit also promotes international trade activities with its local clients by structuring trade
products and services, organizing and sponsoring conferences, and advising customers through a wide range of trade products.
|
Through the CID, BCP Stand-alone assists its corporate clients with financial services, cash management solutions, and short- and medium-term financing. BCP Stand-alone’s
corporate banking loans, measured in average daily balances and including Reactiva program loans, decreased from S/30,801 million in 2020 to S/29,992 million in 2021 but increased to S/33,387 million by December 2022.
BCP Stand-alone has a leading position in the Peruvian banking system with 37.4% of the market share for corporate banking loans, according to the SBS and ASBANC, despite the
intense competition of foreign banks that may offer lower rates to the market since they finance their operations at lower costs from their headquarters jurisdictions.
Middle-Market Banking Division (MMD)
The MMD served 7,427clients as of October 31, 2022. Regarding MMD, we note the following:
| (i) |
The MMD serves mid-sized companies, organizations, and institutions. MMD considers a mix of different characteristics in identifying potential clients, such as annual revenues, financial leverage, overall debt, product penetration, and
complexity. The MMD clients’ annual revenues generally range between US$10 million to US$100 million and are serviced nationwide by 12 BCP Stand-alone regional managers and multiple industry-focused service teams.
|
| (ii) |
MMD focuses principally on serving for-profit and non-profit organizations, state-owned companies, and other significant institutions.
|
| (iii) |
Furthermore, the Institutional Banking Unit, which operates within the MMD, serves 1,586 clients throughout Peru. In Lima, a specialized MMD team serves governmental entities, educational institutions, religious organizations,
international bodies, non-governmental organizations, civil associations, and regulated entities, such as microfinance institutions, insurance companies, pension funds, and other private funds. BCP Stand-alone has also deployed specialized
MMD teams in the largest provinces in Peru. In the smaller provinces in Peru, MMD is supported by the Retail Banking Division team in attending to our customers' needs.
|
| (iv) |
The cash management and transactional services subdivision, which operates within the MMD, develops products and services to support clients’ daily cash management activities, collections payments, and investments, among others.
|
The MMD loan portfolio was S/21,260 million as of December 31, 2020, S/22,900 million as of December 31, 2021, and S/23,083 million as of December 31, 2022. By December 31,
2022, BCP Stand-alone had a market share of 36.7% in the Peruvian middle-market segment, according to the SBS and ASBANC.
The products offered to middle-market clients are similar to those offered to corporate banking clients. The major types of products are:
| (1) |
Revolving credit lines to finance working capital needs and international trade financing;
|
| (2) |
Standby letters of credit and bond guarantees;
|
| (3) |
Structured long-term and medium-term financing, through loans or financial leasing; and
|
| (4) |
Cash management, transactional products, and electronic banking.
|
WBG Transformation
As part of WBG's transformation process, we created Tribes that, through the use of the agile methodology, allow us to better understand customer pain points and create new
products that help us solve them. These Tribes are:
| (1) |
Tribe of Business Credit Products: Giving their business clients efficient financial solutions through an outstanding and unique experience that satisfies their main needs.
|
| (2) |
Tribe of Transactional Products for Businesses: Giving their business clients integral solutions that simplify their cash management processes and generate customer loyalty.
|
| (3) |
Tribe of Digital Platforms for Businesses: Giving their business clients an outstanding and unique digital experience to become their ‘top of mind’ choice.
|
Our talent, with the support of enablers, has allowed us to develop initiatives to improve the customer experience through more efficient processes and services. In the WBG we
aim to address our clients' preferences by improving business profitability, preserving risk quality, and enhancing our digital platforms. Our strategy has been focused on the following points:
| • |
Collections process enhancement: Due to greater competition in the non-lending business, we have implemented projects focused on digitalizing our clients’ collections journey, providing them with an
improved customer experience and maintaining our leadership position in the Peruvian collection market. During 2022, we deployed campaigns to attract new users and worked closely with Yape to enable its application as an additional channel
for our Wholesale Banking clients to collect payments from their customers.
|
| • |
A unique and powerful digital platform offering: Update of our online banking platform for companies named Office Banking, aiming to deliver the best digital
platform in the local financial market that allows us to accompany our clients in all their journeys, offering a digital end to end solution with 24/7 accessibility to our product and services portfolio.
|
| • |
Operational stability improvement: We aim to assure the security and availability of our platforms.
|
| • |
Financial ecosystems and Open API development: We focus on creating an interconnected services network that allows users to satisfy multiple needs through a single integrated digital experience.
|
Profitability Management
We elaborated pricing advisory analysis for lending and non-lending products offered to our clients, with the aim to recommend prices based on a 360 view of our clients. In
addition, we established monthly management Pricing Committees to help sales teams to implement these pricing recommendations, and to monitor revenues resulting from these actions.
We also, focused on pricing digitalization to improve customer experience and convenience. Thus, we worked together with Wholesale Tribes to implement a pricing feature on our
digital platform for one of our financing products, allowing some of our clients to self-disburse loans at a predefined price, without requiring further manual intervention by relationship managers.
Sustainable Finance
WBG is committed to the sustainability objectives of Credicorp, which intends to create a more sustainable and inclusive economy. In 2022, we offered green financing
alternatives to our WBG clients, such as green loans and eco-factoring credit lines, which are working capital credit lines to finance the accounts payable of sustainable suppliers with a special rate with the aims of empowering them to finance
projects within particular sectors (specifically, renewable energy, clean transportation, green building and sustainable water resource management), promoting seeking for sustainable utilization of natural resources in their operations and
promoting formalization of SMEs. We have granted six green loans for sustainable development projects and initiatives and conducted ESG financing training for the commercial team of the WBG.
(II.III) Treasury
BCP Stand-alone’s Treasury function is divided into four primary units: (1) the ALM Group, (2) the Sales and Trading Unit, (3) the Foreign Exchange and Derivatives Distribution
Unit, and (4) the Treasury Tribe.
ALM Group
The ALM Group is responsible for managing BCP Stand-alone’s statement of financial position and for taking reasonable interest rate and liquidity risks under the oversight of
our Asset and Liabilities Committee (ALCO). The ALM Group is also responsible for maintaining our investment portfolio, Liquidity Coverage Ratio (LCR) and Capital Management. In addition, the ALM Group participates in money and debt capital
markets, oversees reserve requirements, and manages BCP Stand-alone’s liquidity. The ALM Group has been active in auctions held by the BCRP for certificates of deposit as well as in financing its funding needs, interbank transactions, guaranteed
negotiable notes, and other instruments.
Sales and Trading Unit
BCP Stand-alone’s Sales and Trading Unit manages both foreign exchange and interest rate risk exposure and investments for proprietary positions purposes. The managed risk
originates mainly from client liquidity transactions and from open proprietary positions. Market risk exposures and limits are independently defined by the Market Risk Unit and closely monitored by the Treasury Risk Unit. Additionally, an Investor
Sales team within the Sales and Trading Unit actively reaches out to institutional investors, providing direct access to market maker prices and liquidity. The Sales and Trading Unit includes both a Foreign Exchange Desk and an Interest Rates Desk
that manages risk as follows:
| • |
Foreign Exchange: The Foreign Exchange Desk provides liquidity for spot and forward transactions for its clients and other market makers in US Dollar-Peruvian Soles (USDPEN), other Latin-American currencies, and G-10 currencies. The
Foreign Exchange Trading Desk also manages foreign exchange volatility book for USDPEN. Additionally, the desk participates in foreign exchange transactions related to different instruments designed by the BCRP to smooth out any currency
volatility.
|
| • |
Interest Rates (IR): The Interest Rates Desk manages the investments and risk originated from both fixed-income and swap transactions from clients and from proprietary positions. BCP Stand-alone’s fixed-income portfolio consists mainly
of government bonds (both in local and hard currency) from Latin-American countries and US Treasuries. The Interest Rates Desk is one of the main liquidity providers in the Peruvian government bond market, where it is a leading participant
of the Market Maker Program of the Ministry of Economy and Finance of Peru (MEF).
|
Foreign Exchange and Derivatives Distribution Unit
BCP Stand-alone’s Foreign Exchange and Derivatives Distribution Unit helps companies with their foreign exchange needs (spot and hedging) through its Distribution Desk. The
broad portfolio of foreign exchange products provided to its client base has allowed the Foreign Exchange and Derivatives Distribution Unit to position itself as a benchmark in the foreign exchange business in the Peruvian market.
Treasury Tribe
The Treasury Tribe is responsible for providing technological support to the different units that make up the Treasury function through the enabling of platforms and
technological tools; as well as, through the implementation of different initiatives that allow business scalability. The Tribe is made up of six squads — five for the development of initiatives related to products (Exchange, Foreign Exchange &
Derivatives, Investments & Funding, Liquidity and ALM) and one for shared requirements across those products.
Role in LIBOR Transition
The Treasury team has been leading the transition process from LIBOR to other references rates. During this process, the group has measured the exposure and risks regarding the
transition in terms of products, clients, funding, contracts, training, infrastructure, and other areas.
BCP Stand-alone has adopted most of the recommendations given by the ARRC convened by the FED. Specifically, Treasury and commercial bank products have been conformed to use
SOFR and Term SOFR, administrated by CME Group, as the main alternative floating reference rates. These new alternative rates have been implemented in BCP Stand-alone’s systems that register and valuate contracts. BCP Stand-alone also has adopted
the Fallbacks Protocol of the International Swaps and Derivatives Association (ISDA), amended legacy contracts, and advised its clients about changes in the market and current trends. The Treasury team has also trained the commercial teams and kept
them up to date, in order to offer the most accurate information to BCP Stand-alone’s clients.
(III) BCP Stand-alone’s lending policies and procedures
BCP Stand-alone has adopted a risk appetite framework and established objective metrics and thresholds to periodically monitor the Bank’s evolving risk profile. The framework
was approved by the Bank’s Board of Directors and is managed and monitored by the Risk Management Division within BCP Stand-alone’s Central Risk Management Group. The adoption of a risk appetite framework reflects BCP Stand-alone’s commitment to
aligning its forward-looking business strategy with its corporate risk vision.
BCP Stand-alone’s uniform credit policies and approval and review procedures are based upon conservative criteria. These policies are administered in accordance with guidelines
established by the Peruvian financial sector laws and SBS regulations. For further information, see “ITEM 4. INFORMATION ON THE COMPANY – 4.B Business Overview – (6) Supervision and Regulation”.
BCP Stand-alone’s credit approval process is based primarily on an evaluation of each borrower’s repayment capacity and commercial and historical credit behavior. BCP
Stand-alone determines a corporate borrower’s repayment capacity by analyzing the historical and projected financial condition of the company and of the industry in which it operates. Other factors that BCP Stand-alone analyzes include the
company’s current management and the quality of any collateral to be provided. In addition, BCP Stand-alone’s credit officers analyze the corporate client’s ability to repay obligations, estimate the probability of default of the client using an
internal risk rating model, and define the maximum credit exposure that BCP Stand-alone wants to hold with the client.
The process of standardized risk model building, and monitoring based on new sources of information and innovative statistical techniques was crucial to the Group transformation
to endure decisions in the credit process, such as admission, monitoring, and recovery. In particular, more complex models with enriched data allow for the inclusion of lesser-known customers into the BCP Stand-alone portfolio and the more precise
estimation of income and sales, which otherwise would have been done by physical means. These models are continuously monitored in order to assess their accuracy and are revised if necessary. During 2022, we completed our return to analytic
normalcy, by dismantling almost all the assumptions on risk behavior in origination and portfolio segments added during the COVID-19 pandemic. However, in some risk parameters such as LGD, we are using some assumptions made during 2020 which are
still deemed adequate under our periodic monitoring. We also continued the development of new admission models based on nontraditional data sources.
BCP Stand-alone evaluates individual and small business borrowers by considering the client’s repayment capacity, a documented set of policies (including, among other issues,
the client’s financial track record and the degree of knowledge of the client) and credit scores, which assign loan-loss probabilities relative to the expected return of each market segment. Nowadays a significant part of BCP Stand-alone’s loan
application decisions for individuals and SME applicants, are made through automatic means. However, more sophisticated loans application decisions are made by credit officers who use credit scores and profitability models as inputs for their
evaluations. In 2022, BCP’s Credit Risk Department completed its second year operating in an agile framework, in which tribes and squads follow an agile operating model that allows them to plan, prioritize and focus on initiatives that directly
contribute to established objectives, providing flexibility and agility, in order to create value for our clients.
Under the agile framework, tribes and squads consist of diverse team members such as risk specialists, data scientists, risk policy implementation members, among others, that
previously worked more separately and more remotely in distinct units. Operating under cross-functional squads has created a better understanding and alignment of goals in a timely schedule, through increased and improved communication and
collaboration. Squads achieve a faster and more effective exchange of data, information, and knowledge. Consequently, BCP’s Retail Risk Division has used the framework to enhance the bank’s abilities to more precisely and timely identify and assess
the specific segments and subsegments that may require adjustments in credit policies and processes in order to be optimally managed.
Our performance in the small business and personal lending areas depends largely on BCP Stand-alone’s ability to obtain reliable credit and client information about prospective
borrowers. BCP Stand-alone has a large body of transactional information that is used in credit risk models. Also, the SBS has an extensive credit bureau, which has expanded its credit exposure database service to cover businesses and individuals
that have borrowed any amounts from Peruvian financial institutions.
BCP Stand-alone periodically reviews the payment behavior of its diverse portfolios and segments with a deep level of granularity as part of its monitoring process. These
assessments allow for the early identification, evaluation and management of changes in credit quality, which leads to a timely evaluation and calibration of the expected loss models. In order to ensure the appropriate levels of accuracy and
performance of our admission and behavior models, we keep developing methodological improvements, that include the expansion of our universe of data and variables, as well as the introduction of adjustments for economic trends or volatility (e.g.,
inflation).
BCP Stand-alone has a strictly enforced policy that limits the lending authority of its loan officers. It also has procedures to ensure that these limits are adhered to before a
loan is disbursed. Under BCP Stand-alone’s credit approval process, the lending authority for WBG is centralized into a specialized credit risk analysis division. This division is operated by officers and committees that have specific lending
limits set by client and economic group. Likewise, for RBG, there is another specialized credit risk analysis division that also operates with lending limits by product portfolio. In addition to the controls built into the loan approval workflow
systems, the credit risk management divisions and internal auditors regularly review credit approvals to ensure compliance with lending policies.
For the WBG, in accordance with international standards, BCP Stand-alone has established lending authority limits based on risk rating (probability of default) and particular
guarantees of the borrower. Requests for credit facilities in excess of the limits set for credit officers are reviewed by the Credits Committee, Executive Committee or, if the amount requested is sufficiently large, by BCP Stand-alone’s Board of
Directors. In addition, BCP Stand-alone has concentration limits in the loan portfolio by industry, which is based on its target risk appetite and market share.
BCP Stand-alone believes that an important factor to maintain the quality of its loan portfolio is the selection and training of its loan and risk officers. BCP Stand-alone
requires loan officers to have degrees in economics, accounting, business administration or related fields from competitive local or foreign universities. In addition, training for new loan officers begins with a three-month program that covers all
aspects of banking and finance. Subsequently, loan officers receive training in specific matters throughout their careers at BCP Stand-alone. Laterally hired officers are generally required to have prior experience as loan officers.
BCP Stand-alone operates in substantial part as a secured lender. As of December 31, 2022, approximately S/ 56.4 billion of its loan portfolio and off-balance-sheet exposure was
secured by collateral, which represents 41.9% of its total loan portfolio excluding overseas branch office BCP Panama and overseas agency BCP Miami, as compared to 45.0% in 2021 and 47.2% in 2020. The decrease since 2020 was driven in large part by
the repayment of loans guaranteed under the Reactiva Peru Program (which provides coverage of between 80% and 95% of principal value). Excluding loans guaranteed under the Reactive Peru Program, 38.6% of the portfolio was secured by collateral in
2022 as compared to 38.3% in 2021.
Liquid collateral is a small portion of BCP Stand-alone’s total collateral. BCP Stand-alone requires collateral for the extension of credit depending on the risk profile and the
business segment of the client, among other factors. When BCP Stand-alone requires collateral, it is usually valued at between 110% and 150% of the principal amount of the credit facility granted. The appraisal of illiquid collateral, in particular
real estate assets, machinery and equipment, is performed by independent experts. BCP Stand-alone’s internal audit division conducts selected revisions and analyses on borrowers’ financial statements, consistent with the local banking regulations
of the jurisdictions in which it operates.
In BCP Stand-alone’s credit monitoring unit, we continue to improve the anticipation of credit deterioration for Wholesale Banking and Business Banking customers. In addition
to reactive alerts, in 2022 we added anticipatory alerts to our process, which alert about the possible deterioration of clients in the next six to nine months. This model uses transactional flows (cash flows in current accounts, both in and out)
as input.
Additionally, we have a sectorial taxonomy for risk management in case of unexpected events. This map is prepared by segmenting the portfolio by economic activities and
identifying the risks for each sector. In 2022 we added sustainable activities to this taxonomy, focusing on the environment. In relation to rescheduled loans and loans under the Reactiva 1 and Reactiva 2 programs, we continue to perform quarterly
portfolio monitoring for different risk variables in order to identify the level of portfolio risk. These variables include rating, type of credit according to SBS, classification, credit exchange risk, and unique risk, among others. Likewise, we
carry out an individual follow-up on a quarterly basis according to the alerts of each client.
2.1.2 BCP Bolivia
| (I) |
BCP Bolivia Overview
|
BCP Bolivia’s activities include wholesale banking and retail banking. As of December 31, 2022, BCP Bolivia had total assets of S/12,697.8 million, which include total net loans
of S/8,856.3 million, customer deposits of S/10,168.0 million, and shareholders’ equity of S/859.8 million. BCP Bolivia’s ROAE in 2022 was 8.21%.
As of December 31, 2022, BCP Bolivia’s loans represented approximately 8.3% of total loans in the Bolivian banking system, and its deposits represented approximately 8.3% of
total deposits in the Bolivian banking system, according to ASFI.
The following table shows the client segmentation of BCP Bolivia. This segmentation is a result of an analysis, which addresses multiple factors such as the size (by income,
sales, and/or debt) and volume of activity for each client, the clients’ affiliation with other companies or groups, and their credit ratings.
|
Client Segmentation (1)
|
||
|
Business
|
Group
|
Income/Sales/Total Debt
|
|
Wholesale Banking
|
Large companies (2)
|
Annual sales higher than approximately S/60 million
|
|
Medium companies (3)
|
Annual sales from approximately S/4 million to S/60 million
|
|
|
Retail Banking (5)
|
Small business (5)
|
Annual sales from approximately S/0.1 million to S/4 million
|
|
Micro business (5)
|
Annual sales of at least approximately S/0.1 million
|
|
|
Consumer (6)
|
Payroll workers and self-employed workers
|
|
|
Mortgage Banking (7)
|
Payroll workers, independent professionals, and business owners
|
|
| (1) |
Converted into Soles at the exchange rate of S/3.814 per U.S. Dollar, December 31, 2022 - SBS.
|
| (2) |
Loans to Large companies account for 37% of BCP Bolivia’s total loans. This segment accounts for approximately 314 customers.
|
| (3) |
Loans to Medium companies account for 13% of BCP Bolivia‘s total loans. This segment accounts for approximately 557 customers.
|
| (4) |
At the end of 2022, retail banking loans accounted for 50% of total loans of BCP Bolivia, while retail banking deposits accounted for 31% of BCP Bolivia's total deposits.
|
| (5) |
Small and Micro business banking accounts for 10% of total loans of BCP Bolivia, small business banking serves approximately 6,334 clients while Micro Business serves approximately 10,209 business clients.
|
| (6) |
Consumer banking accounts for 10% of total loans of BCP Bolivia. Its customer base consists of approximately 58,448 Payroll and self-employed workers. Our strategies are based on cross-selling and retention programs that expand benefits
to non-banking products.
|
| (7) |
This segment serves 11,487 customers, representing 30% of BCP Bolivias’s total loans.
|
| (II) |
BCP Bolivia Strategy
|
Our purpose is “To Give Opportunities”. We aim to make our stakeholders' dreams possible, encouraging and generating opportunities that allow them to build
their future, while contributing to the development and growth of the country.
At BCP Bolivia, we have four key objectives that guide our journey: (i) managing the most profitable loan portfolio among peers, (ii) being
number one in customer experience, (iii) being number one in digital solutions, and (iv) being the main payment network in Bolivia. To meet these objectives, we work with two enablers: (i) data and analytics, and (ii) agility.
In order to become the main payment network in Bolivia, BCP Bolivia launched Soli in 2016. Soli has since become our mobile wallet, with which we seek to develop digital ecosystems, promote digital transformation, and lead the world of payments in Bolivia. Today, more
than 95% of Bolivians use cash for all their purchases. With Soli, users can now pay their utilities' bills, add credit to their smartphones, make all sorts of payments, and receive money from any bank
account or another Soli account. We want to eradicate cash and become an integral part of Bolivians’ daily life with a tool that provides the best payment experience; easy, fast, and free.
Distribution Channels
Digital channels
| • |
Soli: As part of our commitment to increasing access to banking products and services, BCP Bolivia fosters the development of an ecosystem for digital payments with the
mobile app Soli, launched in 2016, which at the end of 2022 had 442,000 users. In 2022, transactions via the app Soli represented 17% of BCP Bolivia’s total monetary transactions (up from 10% in 2021).
|
| • |
Mobile banking: Monetary transactions executed through mobile banking represented 25% of BCP Bolivia’s total monetary transactions in 2022 (up from 22% in 2021).
|
Self-service channels
| • |
ATMs: BCP Bolivia had 312 units on December 31, 2022, which accounted for 20% of its total monetary transaction volume in 2022.
|
Physical channels
| • |
BCP Agentes: BCP Bolivia added 336 new BCP Agentes in 2022, bringing the total number of BCP Agentes to 1,355 as of December 31, 2022. Monetary transactions through BCP
Agentes represented 17% of BCP Bolivia’s total monetary transactions in 2022 (up from 19% in 2021).
|
| • |
Branches: BCP Bolivia reported a total of 45 branches at the end of 2021 and 2022. Monetary transactions in BCP Bolivia’s branches continued to decline in 2022 and
represented only 4% of BCP Bolivia’s total monetary transactions in 2022 (down from 6% in 2021).
|
(II) BCP Bolivia ESG Program
BCP Bolivia’s ESG program has three strategic pillars: (i) financial inclusion, which is implemented mainly through technological development and digital
channels that allow users to carry out most of their transactions without having to go to a bank; our main financial inclusion project in Bolivia is Soli, our mobile wallet; (ii) financial education, an initiative that includes the projects "BCP
Customer Academy" and "Financial Education for Entrepreneurial Women"; and (iii) our commitment with Gender Equality, which led us to reduce the gender gap. Currently, 49% of BCP Bolivia’s staff are females.
(I) Microfinance Overview
The Microfinance LoB is focused on offering commercial banking activities and specialized financial services to small and micro business clients in Peru and
Colombia through Mibanco. Mibanco Colombia was created in October 2020 after a reverse merger between Edyficar S.A.S. (known commercially as Encumbra) and Bancompartir (the surviving entity). According to the Economist, the Mibanco franchise is the
leading Microfinance group in the Americas and the second largest private microfinance bank in the world with a loan portfolio of S/15,317 million and approximately 1.9 million clients, representing around 7.9% of Credicorp’s total assets and 10.4%
of the equity attributable to Credicorp’s equity holders. As of December 31, 2022, Mibanco Peru represented around 92.0% of the total loans of the Microfinance LoB.
For further information see “ITEM 4. INFORMATION ON THE COMPANY – 4.A History and development of the Company”.
Mibanco’s Purpose
Mibanco’s purpose is to transform lives and accompany our clients as they write their success stories. By doing so, we expand financial inclusion in the
markets in which we operate. Microfinance is a social business, and its success depends on the social development of our clients, employees, and communities.
Transformation Strategy
Mibanco’s transformation strategy is focused on migrating its traditional business model, which is intensive in people and offices, to a
multichannel hybrid model supported by data and analytics. The hybrid model, implemented without compromising Mibanco’s differentiated focus on the customer, has resulted in increased efficiencies, allowing Mibanco to strengthen
relationships with its clients, while also expanding its potential reach.
This model is anchored by the high-touch relationship that Mibanco strives to retain with its clients and is based on three main capabilities:
| • |
Centralized intelligence driving better risk assessment
|
| • |
The introduction of alternative distribution channels
|
| • |
Impeccable execution by our relationship managers
|
This new approach will be enabled by a combination of four key areas developed by the best talent:
| • |
Data and analytics
|
| • |
Risk models
|
| • |
Cybersecurity
|
| • |
IT architecture
|
We are successfully deploying Mibanco’s transformation strategy, which has resulted in three primary outcomes: (i) increased productivity and capacity to serve more clients, as
demonstrated by an increase of approximately 6.6% from December 31, 2021 to December 31, 2022, in the number of clients served per relationship manager to 179 and an increase of approximately 6.3% over the same period, in the number of loans
disbursed per relationship manager; (ii) enhanced experiences for our clients and our colleagues, as demonstrated by increases in both our client NPS and employee NPS, which reached 34% and 60%, respectively in 2022 (compared to 31% and 53% in
2021, respectively); and (iii) sustainable business growth.
In Peru alone, there are over 5 million unbanked entrepreneurs across the country, which we are best positioned to reach based on our countrywide and digital network. We
believe there is a comparable market opportunity in Colombia, where has a microfinance sector of similar size to Mibanco Peru ’s loan portfolio but an economy with approximately 1.5 times the GDP of Peru’s. We believe there is an opportunity to replicate, through the “Mibanco Way,” the improvements that we are already seeing in Peru in terms of productivity, cost of risk and efficiency.
2.2.1 Mibanco Peru
The following table shows how Mibanco segments its clients. This segmentation is based on an analysis that considers multiple factors, such as business size
and client income, sales, and/or total debt, among others, as well as the client’s affiliation with other companies or groups and their credit ratings.
|
Client Segmentation (1)
|
|
|
Group
|
Income/Sales/Total debt
|
|
SME – medium (2)
|
Annual sales up to S/20 million
|
|
Total debt higher than S/300,000, without issued debt in the capital markets
|
|
|
SME – small (3)
|
Total debt from S/20,000 to S/300,000
|
|
Microbusiness (4)
|
Total debt up to S/20,000
|
|
Consumer (5)
|
Focus on debt unrelated to business
|
|
Mortgage (6)
|
Focus on individuals for the acquisition and construction of homes and granting mortgages
|
| (1) |
As of December 31, 2022, Mibanco had 951,298 registered clients. All portfolio percentages and customer counts in this note and the following notes to this table are given as of December 31, 2022, unless
otherwise disclosed.
|
| (2) |
Mibanco’s SME – medium segment focuses on financing production, trade, or service activities for companies that (1) have total debt in the last six months higher than S/300,000, (2) annual sales up to S/20
million in the last 2 consecutive years, and (3) have not participated in the capital markets. This segment represents 3% of Mibanco’s total loans and 3,626 of its clients.
|
| (3) |
Mibanco’s SME – small segment focuses on financing production, trade, or service activities for companies that have total debt between S/20,000 and S/300,000 in the last six months (without including mortgage
loans). This segment represents 67% of Mibanco’s total loans and 245,830 of its clients.
|
| (4) |
Mibanco’s microbusiness segment focuses on financing production, trade, or service activities for companies that have total debt up to S/20,000 in the last 6 months (without including mortgage loans).
Microbusiness loans represent 23% of Mibanco’s total loans and 596,723 of its clients.
|
| (5) |
Mibanco’s consumer segment focuses on financing individuals to cover payments of goods and services or expenses unrelated to business. Consumer loans represent 4% of Mibanco’s total loans and 104,746 of its
clients.
|
| (6) |
Mibanco’s mortgage segment focuses on financing individuals’ acquisition, construction, renovation, remodeling, expansion, improvement, and subdivision of homes. Mortgage loans represent 3% of Mibanco’s total
loans and 5,282 of its clients. Mibanco’s mortgage segment has a policy of limiting LTV to up to 90%.
|
Distribution Channels
Digital channels
| • |
Mibanco Mobile App: In 2022, 10.7 million transactions were processed through Mibanco’s Mobile App, which represented an increase of 23% compared to the 2021 total.
Additionally, 195,182 loans were requested through the app in 2022 (S/387.1 million in disbursements in 2022).
|
| • |
Mibanco Web: Mibanco’s web page processed 1.4 million transactions in 2022, which represented growth of 16% compared to 2021. Additionally, 33,157 loans were requested
through the web in 2022, for which Mibanco had disbursed S/55.0 million in 2022.
|
| • |
Yape: Since June 2020, Mibanco’s clients have been able to create a Yape account with their bank account. As of 2022, 180,205 Yape users have a Mibanco bank account linked
to their Yape account.
|
| • |
Yevo: Yevo, our digital community for entrepreneurs, had 236,901 affiliates at the end of 2022, and offers these affiliates tools to boost their business, financial
services, and education.
|
Physical channels
| • |
Agentes Kasnet: As part of the services offered to its clients, Mibanco has an agreement with Agentes Kasnet, a network of Multibank correspondents in Peru. At the end of
2022, 14,380 Agentes Kasnet were available for Mibanco clients.
|
| • |
Branches: At the end of 2022, Mibanco had 297 branches; 263 were own branches while 34 belonged to Banco de la Nacion, a Peruvian state-owned bank that offers services to
Mibanco clients under a special agreement.
|
| 2.2.2 |
Mibanco Colombia
|
The following table shows how Mibanco Colombia segments its clients. This segmentation is based on an analysis that considers multiple factors, such as
business size, client income, assets and/or total debt, among others, as well as the client’s affiliation with other companies or groups and their credit ratings.
|
Client Segmentation
|
|
|
Group
|
Income/Sales/Total debt (1)
|
|
Commercial (2)
|
Debt not categorized as micro, consumer, or mortgage.
|
|
Micro (3)
|
Total debt up to 120 statutory minimum wages (equivalent to S/95,000).
|
|
Consumer (4)
|
Focus on debt unrelated to business.
|
|
Mortgage (5)
|
Focus on individuals for acquisition, construction of homeownership and granted with mortgages.
|
| (1) |
Converted into Soles at the exchange rate of S/0.000786 per Colombian Peso as of December 31, 2022. As of December 31, 2022, Mibanco had 151,883 registered clients. All portfolio percentages and customer
counts in this table and the associated notes are as of December 31, 2022, unless otherwise disclosed.
|
| (2) |
Mibanco’s commercial segment focuses on all credits other than Micro, Consumer and Mortgage. Commercial loans represent 24.7% of Mibanco’s total loans and 7,074 of its clients.
|
| (3) |
Mibanco’s microbusiness segment focuses on financing production, trade, or service activities for companies that have total debt up to 120 statutory minimum wages (approximately S/95 thousand) and workers up
to 10. Microbusiness loans represent 71.9% of Mibanco’s total loans and 142,922 of its clients.
|
| (4) |
Mibanco’s consumer segment focuses on financing individuals to cover payments of goods and services or expenses unrelated to business. Consumer loans represent 0.2% of Mibanco’s total loans and 720 of its
clients.
|
| (5) |
Mibanco’s mortgage segment focuses on financing individuals’ acquisition, construction, renovation, remodeling, expansion, improvement, and subdivision of homes. Mortgage loans represent 3.2% of Mibanco’s
total loans and 1,167 of its clients.
|
2.3.1 Grupo Pacífico
(I) Grupo Pacífico Overview
We conduct our insurance business exclusively through Grupo Pacífico, which operates in Peru and Bolivia and is the second-largest Peruvian insurance company by written premiums
in 2022, according to the SBS and Peru’s National Health Superintendence (Superintendencia Nacional de Salud or SUSALUD by its Spanish Initials). Grupo Pacífico provides a broad range of insurance products
focusing on three business areas: P&C insurance, life insurance, and corporate health insurance and medical services. Grupo Pacífico, like other major Peruvian insurance companies, sells its products both directly (through its own sales force)
and through independent brokers, bancassurance, and sponsors.
For further information see “ITEM 4. INFORMATION ON THE COMPANY – 4.A History and development of the Company”.
Grupo Pacífico Purpose
Protect People's Happiness
Grupo Pacífico’s purpose is to protect people’s happiness. Therefore, we aim to increase the reach of our services and products so that we can protect more people every year
while providing customer-centric service and an amazing experience, especially in the moments when people’s happiness is most affected. We believe that by fulfilling our purpose, we will support Peru’s development, strengthen our relationship with
our community and create a foundation for long-term sustainability.
Grupo Pacífico’s strategy is focused on striving to achieve three pillars:
| • |
Being the best in growth:
|
| o |
Protecting more customers by developing new products and distribution channels and taking advantage of our Credicorp channels.
|
| • |
Offering the best experience
|
| o |
Surprising our customers with an extraordinary journey and by putting them in the center of everything we do.
|
| • |
Having the best efficiency ratio in the local market.
|
| o |
To keep leading the insurance market in efficiency so that we can offer the best protection to our customers and value to all our stakeholders.
|
Grupo Pacífico’s strategy is propelled by the development of key internal enablers:
| • |
Agile Transformation: Our transformation continued to progress in 2022. As of the end of 2022, Grupo Pacífico had finished implementing its agile operating model at scale and 38% of its employees were working under that model.
|
| • |
Data Analytics: We have started the implementation of the core elements of our data lake, a centralized data repository designed to host, process, and protect great amounts of data, that can be later used for business development through
analytical models. In addition, we changed the way of working, by going from an analytics team that works in a silo to an analytics specialist that sits inside multiple business teams.
|
Our enablers are supported by the best talent, and we seek to align profiles and key capabilities by upskilling and reskilling.
Strategic Axes
Digitalization
The need for both digital sales and digital client servicing has scaled significantly as a result of the COVID-19 pandemic and has become a part of our client’s basic needs
during 2022. Therefore, we keep seeking to be at the forefront of this development. In 2022, Credicorp’s digital premiums, which are the premiums sold through our digital channels, increased by 24% from 2021, totaled S/78 million in 2022, compared
to S/62.7 million in 2021.
We also seek to automate our processes. We continue to scale our self-service claim process for our retail home insurance product, a claim process that is supported by
artificial intelligence software. We also started to pilot the use of this technology in the auto claim process.
Customer Centric
On the axis of customer-centric services, use of our app, Mi Espacio Pacífico, continues to grow, with an increase of 26% in the number of registered users at year-end 2022
compared to year-end 2021. In addition, our chatbot channel, Vera, resolved over 48,000 customer requests, such as policy downloads, requests for roadside assistance and requests for policy quotes, in 2022.
During 2022, Grupo Pacífico continued to focus on delivering a great experience to its customers and aimed to have the best customer experience in the Peruvian insurance sector as
measured by our NPS. Despite the impact of recent COVID-19 waves on our health services, we have 30, plus 14 points, compared to 2019, when we started to track this result. In addition, we received two awards for customer experience in the
insurance market: the CX Index, a ranking made by Datum Peru, and CX Index by Activa Perú and Adolfo Ibañez, a university from Chile, and a third award for best experience in digital channels called “Business Creativity” organized by the Peruvian
University of Applied Sciences (or UPC by its Spanish initials).
Credicorp Channels
Grupo Pacífico’s digitalization and customer experience are both supported by the development of its digital customer-centric services and taking advantage of the reach provided by
Credicorp channels.
Additionally, Grupo Pacifico's focus on leveraging Credicorp channels continues to have positive results. In 2022, Grupo Pacifico's premiums through Credicorp channels, such as
BCP Stand-alone and Mibanco, increased by 17%, from S/949 million in 2021 to S/1,107 million in 2022. In addition, we continue to expand our digital channels, such as in Mibanco, where digital sales increased by 114.7% from 2021 to 2022, and Yape,
where during the last quarter of 2022 we launched our first insurance product, we sold 6.8 thousand personal injury insurance policies.
Distribution Channels
Digital channels
| • |
Mi Espacio Pacífico App: In 2022, 345 thousand clients used Grupo Pacífico’s app, compared to 274 thousand in 2021.
|
| • |
Pacífico Web: In 2022, over 8.1 million visits were made to Grupo Pacífico’s website, compared with the 6.1 million reported in 2021.
|
Physical channels
| • |
Branches: At the end of 2022, Grupo Pacifico had 6 branches (compared to 26 branches in 2021). Due to the social distancing measures enacted during the pandemic, Grupo
Pacifico temporarily closed its offices and branches to the public. Nevertheless, the company has continued providing its clients with the services they need. Grupo Pacifico implemented a specialized call center with 14 executives and 2
supervisors, all working on-site, in order to continue providing its clients with the services they need.
|
(II) Risk Rating
Grupo Pacífico managed to reaffirm the solidity and solvency of the company, maintaining its international credit ratings despite the Peruvian context. AM Best affirmed Grupo
Pacífico’s long-term issuer credit rating at “A-” with a stable outlook in December 2022, Fitch affirmed Grupo Pacífico’s credit rating at “BBB+” with a stable outlook in April 2022 and Moody’s affirmed Grupo Pacífico’s credit rating at “Baa2” with
a stable outlook in July 2022.
2.3.2 Prima AFP
(I) Prima AFP Overview
Credicorp conducts its pension fund business through Prima AFP, the second largest participant in the pensions business in Peru, as measured by funds, affiliates and
collections, according to the SBS. Prima AFP operates through individual capitalization accounts and provides its affiliates with retirement, disability, survival, and burial benefits. For this purpose, Prima AFP collects affiliates’ mandatory and
voluntary contributions, and invests the funds in local and foreign financial markets. The funds that Prima AFP holds in custody for its affiliates are non-attachable and are autonomous assets, which are not affected by Prima AFP’s financial
results. Prima AFP offers four types of funds, which differ by risk profile and the asset classes in which they invest. The investment and risk management policies are defined by internal committees and supervised by the SBS and the SMV.
For further information see “ITEM 4. INFORMATION ON THE COMPANY – 4.B Business Overview – (5) Competition – 5.3 Insurance & Pensions – 5.3.2 Prima AFP” and “Item 4.
INFORMATION ON THE COMPANY – 4.B Business Overview – (6) Supervision and regulation – 6.2. Subsidiaries – 6.2.1 Peru.”
In 2022, Peruvian companies continued to face new challenges due to high political uncertainty and the COVID-19 pandemic. The PPS was impacted by the Peruvian government's
approval of a new law allowing clients to withdraw part of their funds. The newly permitted withdrawals negatively impacted both the managed portfolio and the financial results of the company; however, in recent months the portfolio has been
recovering at a good pace.
Despite these developments, in 2022, Prima AFP continued to focus on:
| (i) |
Digitalization of the client service model by improving its digital channels and digitalizing several services to give its customers a better experience.
|
| (ii) |
Execution of infrastructure and technology projects to improve time to market, simplify technological complexity and take advantage of updated technology.
|
| (iii) |
Strengthening cybersecurity by executing an investment plan to reduce the risk of cyberattacks and protect our clients.
|
| (iv) |
Improving efficiency by optimizing processes and structures and controlling expenses.
|
| (v) |
Operating under an environmental, social, and governance (ESG) model with special attention on (i) responsible investing, (ii) building trust through transparency and simplicity, and (iii) educating society on the PPS.
|
| (vi) |
Transition to an agile model.
|
Distribution Channels
Digital channels
| • |
Prima AFP’s App: Approximately 5 million sessions were initiated in Prima AFP’s mobile app in 2022, compared to 6 million in 2021. This decrease was due primarily to a
smaller number of affiliates having a balance available for withdrawal in 2022.
|
| • |
Prima AFP’s Web: In 2022, more than 1 million sessions were initiated through Prima AFP’s web page, which was a similar total to 2021. Users can use the web page to check
contributions, find details on fund movements and balances and request a change in fund risk level.
|
Physical channels
| • |
Branches: As of December 31, 2022, Prima AFP has 7 offices nationwide. In October 2022, the
SBS authorized the permanent closure of 8 branches and the re-opening of 7 offices that had been temporarily closed due to the COVID-19 pandemic, due to the end of the national state of emergency.
|
Credicorp Capital carries out its investment banking and wealth management operations in the Latin America region through Credicorp Capital Peru, Credicorp Capital Colombia,
Credicorp Capital Chile, Credicorp Capital US, CC Asset Management Mexico, and ASB Bank Corp., which are active in the Peruvian, Colombian and Chilean markets, respectively.
In 2018, we created the Investment Banking & Wealth Management LoB by adding BCP Stand-alone’s Wealth Management Division and ASB to Credicorp Capital to operate as a single
regional wealth management model within one business unit. This new structure facilitates sharing of best practices and delivery of a regional value proposition, with ASB supporting all wealth management business units and clients (instead of
focusing on Peru-based wealth management customers).
With operations in Chile, Peru, Colombia, Panama, Mexico and the United States, we are consolidating our leadership position through five main business units: Asset Management,
Capital Markets, Corporate Finance, Wealth Management and Trust Services. ASB Bank Corp. manages our banking operation in Panama that supports our Wealth Management business, consolidates some of our Capital Markets Trading Strategies and
increasingly provides its balance sheet to support our Corporate Finance business unit.
Asset Management
Through our regional platform, our Asset Management business unit offers a wide array of products, including mutual funds, alternative funds, and portfolio management, as well
as structured products, to a broad base of clients, including those in our retail, private and high-net-worth, corporate, and institutional segments. We also act as a third-party distributor in Latin America, representing other global asset
managers.
Capital Markets
Our capital markets business unit has an active role in secondary markets, particularly with equity and fixed-income products, as well as exchange rate products and derivatives.
Our participation in the placement of equity and debt instruments, vis-à-vis our corporate finance team, is also active, especially for corporate issuances in local markets. We also have proprietary investments, with trading books managed in Peru,
Colombia, Chile, and Panama.
Corporate Finance
Our corporate finance business unit provides advisory services for the structuring of mid- and long-term financing and the structuring and placement of equity and fixed-income
instruments in capital markets. It also offers a wide range of financial advisory services and advisory services for mergers and acquisitions.
Wealth Management
We run a financial and investment advisory model tailored to high-net-worth and ultra-high-net-worth individuals under a comprehensive value proposition where we offer our
clients a broad range of products (including investment advisory, investment management, long-term financial planning, banking services, and credit solutions), an expert advisory model (in which a single relationship manager coordinates the various
financial services for their clients) and a multi-platform network that provides access to local, regional and international markets, including the United States.
Trust Services
Through our subsidiaries in Colombia and Peru, we offer products and services focused on the management and future planning of our retail and institutional client’s cash flows.
We manage family, corporate, and real estate trusts led by an advisory and structuring expert commercial team, complemented by legal support with specialized knowledge in this business.
Digital channels
| • |
Via BCP: BCP Stand-alone’s web channel, through which its clients can view their investments in mutual funds and in the stock market. Likewise, through Via BCP, clients
can perform mutual funds subscription and redemption operations.
|
| • |
Tyba: Our online application that operates as a digital broker in Colombia and Peru, allowing clients to manage their personal finances, making investments according to
their own risk profile and tailored to their own investment plans. It provides a simple and secure means for clients to access investment products in a digital platform, allowing investments with a minimum amount of US$100, S/100 or COP
100,000.
|
| • |
CC Invest: Online web and mobile app investment platform that allows our clients in Peru, Colombia and Chile to invest in globally diversified portfolios in the most simple
and efficient way. By opening an investment account online, clients can start investing with a minimum amount of US$ 25,000, supported by a specialized digital advisor.
|
Physical channels and Telephone
| • |
Offices: Credicorp Capital’s clients can be served through its 13 regional offices, which are distributed across Peru, Colombia, and Chile, and also have points of contact
in Mexico, the United States and Panama. Additionally, BCP clients can access some of Credicorp Capital’s investment products through its network of agencies across Peru.
|
| • |
Call center: Through a specialized team, we serve and advise our Capital Market clients in the intermediation of fixed-income and variable-income securities in Peru,
Colombia, and Chile.
|
Our Compliance and Ethics management system is a key enabler in Credicorp's sustainability framework. We seek to meet the needs both of our businesses and stakeholders through:
(i) ensuring the clarity of the terms and conditions of financial products and services, (ii) providing a framework and monitoring it to ensure a good work environment and equal opportunities for all employees, and (iii) ensuring responsibility and
integrity through all our businesses.
Credicorp and all its subsidiaries, using a comprehensive approach based on international best practices and our principles and ethical values, have established 11 corporate
compliance and ethics programs that cover local and international regulations and mitigate conduct risks by encouraging ethical behavior in order to protect the reputation of the company. These programs are the following:
| • |
Anti-money laundering and countering the financing of terrorism (AML/CFT)
|
| • |
Financial stability
|
| • |
Fiscal transparency (FATCA & CRS)
|
| • |
Regulatory compliance
|
| • |
Ethics and conduct
|
| • |
Anti-corruption
|
| • |
Market abuse prevention
|
| • |
Personal data protection
|
| • |
Occupational safety and health
|
| • |
Market conduct
|
| • |
Antitrust
|
The programs listed above are overseen by the Chief Compliance and Ethics Officer who has full autonomy to carry out functions and duties independently. The Chief reports
directly to our Board of Directors through the Sustainability Committee, providing regular and consolidated reports about the performance of the compliance and ethics programs at all our subsidiaries. Each subsidiary has a Compliance and Ethics
Officer, who works with a specialized team and reports to the head office.
Anti-money laundering and Countering the financing of terrorism (AML/CFT)
Through this program, we manage all the procedures and policies related to the risks of entrance or movement of money from illicit activities. In 2022, we continued to face the presence of new digital
businesses. In this increasingly dynamic context, we have adapted our customer experience and services to all our stakeholders with effective policies, guidelines, and robust AML controls, in order to meet the new demands that are defined by an
intensive use of technology as a preferred form of connection. Therefore, we are strongly committed to using innovative technologies for these new business models that present additional challenges to traditional KYC (Know Your Customer)
strategies.
Furthermore, all of Credicorp’s subsidiaries have continued to manage the AML/CFT program based on KRIs (Key Risk Indicators), aiming for a solid governance, searching for
efficiencies, identifying automation opportunities, and using technology and analytics. We continue directing our efforts to minimize risks, meet our clients’ needs and develop fast and efficient processes that help us achieve our key business
goals.
In 2023, we will continue to automate our critical processes, in addition to covering emerging risks related to new products and business models, thus working to ensure
responsible business at Credicorp.
Financial stability
Our Financial Stability Program supports our compliance with the applicable regulations derived from the U.S. Dodd-Frank, Wall Street Reform and Consumer Protection Act
(Dodd-Frank Act), the European Market Infrastructure Regulation (EMIR) and the European Bank Recovery and Resolution Directive. During 2021, we focused on carrying out actions for the exchange of information with counterparts regarding the
regulations that make up the Financial Stability Program. We also took actions to comply with the requirements of the Initial Margin Rules of the Financial Market Infrastructure Act, which require financial counterparties and large non-financial
counterparties with a volume of non-centrally cleared derivatives (AANA) above certain phase-in thresholds to exchange bilateral initial margin from the applicable compliance date.
Fiscal Transparency
The Fiscal Transparency Unit within Credicorp oversees the implementation of two international regulations, FATCA and the OECD’s CRS, which are the global standards for the
automatic exchange of financial information between governments and contributes to the global effort against tax evasion and increased collection through exchange of financial information among participating countries. These standards apply to all
of Credicorp’s financial institutions. Understanding FATCA and CRS requirements and having a comprehensive tax transparency compliance program are essential for financial institutions to limit non-compliance risk and meet the obligations set out by
applicable country Intergovernmental Agreements (IGAs) with the U.S. Internal Revenue Service (IRS) and the commitments signed with the OECD. During 2022, Credicorp sent more than 75 FATCA and CRS reports (compared to 80 reports in 2021) to the
tax authorities of a total of eight countries, which demonstrates our commitment to international standards for the prevention of tax evasion. This process begins at the moment that the customer is enrolled in our systems and the related Know Your
Customer due diligence processes are commenced.
FATCA at Credicorp: Credicorp has investment vehicles located in countries under IGA Model I (Bahamas, Luxembourg, Colombia, the Cayman
Islands and Panama), IGA Model II (Bermuda and Chile), and General Regulation (Bolivia, Mexico and EE.UU.). Obligations include complying with client due diligence, client annual reporting and financial counterparties exchange of status
information. Peruvian financial institutions comply with all the obligations of “agreement in substance” while the government and the U.S. Department of the Treasury continue with the negotiations to sign an IGA Model I. Given this status, in 2018
the MEF announced that the Annual Client Reporting obligation would be on hold while negotiations continue.
CRS at Credicorp: Credicorp has financial institutions located in countries that started CRS implementation in 2016 (Colombia, the
Cayman Islands and Luxembourg), 2017 (Panama and Chile), 2019 (Peru). In the countries that adopted CRS in 2016 and 2017, our main activities will continue to focus on (i) keeping the information of our clients and counterparts updated, (ii)
sending annual reports to tax authorities and (iii) completing the certifications and audits according to the laws applicable to each country
In Peru, the implementation of CRS is part of the mandatory requirements of the OECD to grant full membership status to Peru. Therefore, all Credicorp financial institutions in
Peru, including BCP, Grupo Pacífico, Mibanco, Prima AFP, Credicorp Capital Bolsa, Credicorp Capital Fondos, and Credicorp Capital Titulizadora, are obliged to comply. As part of these commitments, since 2020, our Peruvian companies have submitted
the annual report to the Superintendence of Tax Administration of Peru (Superintendencia Nacional de Aduanas y de Administración Tributaria de Perú or SUNAT by its Spanish initials).
Regulatory compliance
At Credicorp and its subsidiaries, we are committed to complying and following external legal mandates set forth by regulatory entities, such as the SBS or the relevant
governments. We seek to ensure the implementation of all the regulatory frameworks applicable to each of the companies, using methodologies with a comprehensive approach based on risk and international best practices in order to reduce risks that
would arise from regulatory noncompliance, like sanctions and reputational risks. We keep working to implement our regulatory obligations while remaining committed to the success of our clients, employees, and other stakeholders.
Ethics and conduct
This program manages our Corporate Code of Ethics (the Code) and complementary Ethics Policies to provide guidelines for employees to avoid misconduct and provide tools to
properly manage potential conflict of interest scenarios. It is also responsible for the management of our complaints system called Alerta GenÉTICA.
The Code, approved by the Board of Directors, is the conduct reference for Directors and employees, who must comply with it each year. The Code is reviewed periodically, but in
2021 we started an important project to renew our commitment to our stakeholders by updating our Code. This updating process ended in July 2022 when we launched our new code campaign "Ethics to the Next Level", under which we seek to position the
Code at the top of minds of our employees. Our main message is that our new Code will allow us to take our ethics to the next level because it helps us to act correctly, not only by complying with the rules but out of conviction, to achieve a
positive impact on our environment. Among the most important campaign initiatives are the following:
| o |
Live broadcasts of General Managers together with the Compliance and Ethics Managers where the importance of the Code was reinforced and the campaign launch video was broadcast.
|
| o |
“Leadership to the next level” event where managers from the different business units discussed the most important aspects of the Code applicable to leadership. More than 500 leaders from all over Credicorp participated in this event.
|
| o |
Branding of main offices of Empresas Credicorp in which several interaction events were carried out; more than 1500 employees participated.
|
| o |
Landing webpage to provide more than 1,500 Credicorp leaders with important information about the Code and with a group activity that they can carry out with their teams.
|
| o |
Videos and digital communications to raise awareness of the Code’s main features.
|
During 2022, we updated our Code of Conduct for Suppliers and Third Parties because we seek for the third parties with whom we interact to share our values of respect, fairness,
honesty and sustainability. This document is aligned with the Sustainability approach and our new Code of Ethics, and reinforces topics such as Human Rights, Social Responsibility and Occupational Health and Safety.
To manage potential conflict of interests, Directors and employees must submit relevant information periodically, including their outside business activities. We also have
policies to manage operations between Credicorp's related parties, where relevant transactions are disclosed to the Sustainability Committee and to other stakeholders. In 2022, we updated the guidelines to manage potential conflicts of interest.
We also continuously foster awareness of our “Alerta GenÉTICA” ethics and compliance hotline through communication campaigns and training and encourage stakeholders to use the
hotline.
In 2022, we released our first public human rights statement and began a human rights risk assessment. As part of the process, trainings and workshops were carried out for the
leaders of the main areas involved, such as Labor Relations, Credit Risk and Purchases Negotiations, to establish the risks and their impact so that their contributions and those of their teams can be made from a human rights perspective.
Anti-corruption
At Credicorp and its subsidiaries, we are aligned with the United Nations SDGs, adopting a zero-tolerance attitude towards corruption and applying policies to promote a fair and
equitable environment, in order to encourage changes in society and value relationships based on integrity.
In this sense, we are respectful of the regulations aimed at strengthening prevention and investigation mechanisms that contribute to the fight against corruption, such as Law
30424 in Peru with its regulations and amendments, the U.S. Foreign Corrupt Practices Act (FCPA) and the UK Bribery Act. At Credicorp, there is no tolerance for corruption.
Credicorp's Corporate Policy to Prevent Corruption and Bribery provides guidelines to all Credicorp subsidiaries to ensure transparent relationships with their stakeholders,
minimize related risks, and comply with local and international regulations. This policy has been implemented through the development of a prevention model in each of Credicorp's subsidiaries, focusing on four fronts:
| • |
Risk Assessments
|
| • |
Training and Awareness
|
| • |
Continuous monitoring
|
| • |
Supervision
|
As part of the efforts of the Corporate Anti-Corruption Program, which is a Credicorp unit, both BCP Stand-alone and Pacífico Seguros have obtained the ISO 37001 - Anti-Bribery
Management System certification; likewise, as part of the company’s strategy, Mibanco aims to achieve the same certification next year.
BCP Stand-alone also holds the Anti-Bribery Certification "Empresarios por la Integridad" in Peru, which uses a process based on third-party audits to demonstrate compliance
with anti-bribery requirements at an entity-wide level.
Market abuse prevention
Through Credicorp’s Market Abuse Prevention program, guidelines and controls are established to prevent insider trading and market manipulation.
As a result of risk assessments performed in 2021 in one of our subsidiaries, in 2022 we were able to implement guidelines and alerts to mitigate risks of insider trading and
market manipulation in our Investment Banking business.
Furthermore, Credicorp Capital Colombia confirmed its compliance with the Asset Manager Code of the CFA Institute, being the fifth subsidiary of Credicorp to comply with the
Code, along with Prima AFP, Credicorp Capital Peru, Pacífico Seguros and Credicorp Capital Chile.
Personal data protection
At our companies, we strive to protect and ensure the privacy of our users’ personal information. We guarantee absolute confidentiality and use the highest security standards in
accordance with the Personal Information Protection Law No. 29733 and the related regulation, approved by Supreme Decree, No. 003-2013-JUS (the “Personal Data Protection Statutes”).
Our companies, as so-called personal data bank owners, must comply with these rules’ guiding principles for the protection of personal data. Also, as personal data bank owners,
we are required to secure the consent of the personal data owners to process and transfer their personal data, taking into account the provisions of the Personal Data Protection Statutes, which are part of Credicorp's internal compliance policy.
We ensure the exercise of protected rights that may be exercised by the personal data owner. To this end, we must make available channels, procedures and information to tend to
these requests within the timeframes established under the Personal Data Protection Statutes and the rules.
Consequently, our corporate personal data protection policy has the following goals:
| a) |
Establishing general guidelines for the processing and transfer of personal data of stakeholders such as employees, users, customers and suppliers of all our companies.
|
| b) |
Ensuring that our companies comply with the Personal Data Protection Statutes.
|
| c) |
Advise all employees of our companies of the impact of non-compliance with the applicable standards of personal data protection.
|
Occupational safety and health
Credicorp has an Occupational Health and Safety Program, the purpose of which is to guarantee and maintain safe and healthy environments for all employees, suppliers, visitors,
and customers to prevent work accidents and occupational diseases.
Credicorp redefined its occupational health strategy in 2022, focusing on prevention and health promotion campaigns that promote employee self-care, through various activities
such as dissemination of communications, videos, training, among others.
In the occupational risk prevention area, this year Credicorp is working on the continuous improvement of its processes seeking to timely identify the conditions that represent
a potential risk to the safety and health of its employees, through inspections of work environments at a national level.
Market conduct
Credicorp’s market conduct program is aimed at promoting good business practices with customers, mitigating the risk of marketing and design of products that do not meet the
needs of clients, ensuring information transparency, giving clarity of the terms and conditions of financial products and services and properly managing claims for customers. These actions allow us to encourage ethical behavior, in order to protect
the reputation of the company and achieve sustainable relationships with our customers.
During 2022, we implemented new regulatory requirements related to an update of Peru’s Usury Law Regulation, which establishes maximum interest rates for consumer products and
eliminates certain commissions. We also deployed new controls to ensure compliance with market conduct regulations.
Antitrust
Reinforcing Credicorp's commitment to compete freely in the markets where it operates, since the end of 2021, Credicorp has decided to formalize and begin the implementation of
its Antitrust Compliance Program. With the assistance of EY in elaborating a risk matrix in 2021 at BCP Stand-alone, the main processes with exposure to free competition risks were identified. During 2022, teams related to those processes were
trained and preventive monitoring of compliance was implemented.
In 2020, INDECOPI, the regulatory entity of the Law for the Repression of Anticompetitive Conduct, issued a compliance guide that companies can use as a reference to implement
their prevention model. BCP Stand-alone decided to adopt this standard to implement the program. Of the eight elements considered by the model, BCP Stand-alone has implemented seven of them so far: (1) Tone from the top, (2) Appointment of
Compliance Officer, (3) Risk Management, (4) Controls and Protocols, (5) Training, (6) Monitoring, and (7) Complaints System.
In 2022, our internal audit unit focused on creating a permanent risk-based framework to evaluate the effectiveness and efficiency of Credicorp’s risk management, control, and
governance processes. The unit’s objectives are improving and protecting the corporation’s value through an agile and timely independent assessment, as well as data-based advising and risk analysis. For this purpose, our internal audit unit
formulated the Annual Audit Plan using a risk-based audit methodology, which is aligned with the rules of The Institute of Internal Auditors Global (the “IIA”) and approved by the SBS.
This year, we defined our new purpose, mission and vision:
| • |
Purpose: To protect Credicorp's sustainability.
|
| • |
Mission: To ensure and advise continuously and dynamically on strategic issues and key risks, through the intensive use of technology, data, innovation, anticipation and
motivated talent.
|
| • |
Vision: To be a leader in the audit practice at a global level, oriented to our purpose.
|
We will pursue our purpose, mission and vision through the development of actions and plans based on four pillars:
| 1. |
Role positioning
|
| 2. |
Digital transformation
|
| 3. |
Culture and talent
|
| 4. |
Management Optimization
|

As in 2013 and 2018, in April 2022, we once again obtained the International Quality Certification for the Internal Audit Activity with a rating of "General Compliance" granted
by the IIA in the External Quality Assessment, in accordance with IIA Standard 1312. This level of compliance, the highest according to the governing body's methodology, demonstrates that the Internal Audit function complies with the Fundamental
Principles for the Professional Practice of Internal Auditing, the definition of the profession, the Code of Ethics and the Standards issued by the IIA. Likewise, for the twelfth consecutive year, we carried out an Internal Quality Assessment, in
compliance with IIA Standard 1311, the result of which was "Generally Compliant" in the application of the Quality Assurance and Improvement Program.
We have adopted the Ambition Model developed by the Netherlands Institute of Internal Auditors. To do this, we established the potential level and the gaps to be covered to move
from the Integrated to the Managed level in the four key activities: internal audit services and functions, professional practices, performance management, and people management and governance.
During 2022, the Credicorp Corporate Auditor continued his role as a member of the Board of IIA Global, the highest governing body of the institution, and member of its Audit
Committee. The Board is made up of 17 representatives of the different chapters of the Institute, who were elected during the IIA’s Annual Business Meeting. Furthermore, Grupo Pacífico’s Chief Auditor was re-elected in 2021 as Chairman of the Lima
Chapter of the Information Systems Audit and Control Association (ISACA). In 2022 the Credicorp Head of Audit - Microfinance segment was appointed as member of the board of directors of the Peruvian chapter of the Institute of Internal Audit.
Consistent with recommended industry practices, Credicorp continued to apply the Cybersecurity Assessment Tool (CAT) of the FFIEC, OWASP – Mobile & Application Security
Standard, Cloud Security Alliance’s (CSA), NIST CSF, Critical Security Controls (CIS) and MITRE ATT&CK Framework. In addition, Credicorp implemented a centralized methodology to apply data analytics in a coordinated and integrated manner and
began to apply a decentralized data analytics model following best practices and promoted the use of Agile audit methodology guidelines.
In 2022, we achieved important advances in two of the main action fronts of data analytics: the construction of analytical models that allow us to identify suspicious
transactions or transactions with a greater probability of error, and the digitization of audit tests, which may reduce the time incurred during the review. In addition, we developed automated solutions with the objective of reducing manual and
repetitive tasks in our internal processes. Finally, we offered 388 hours of specialized training to the audit team to promote the use of data analytics and automation.
We also made progress in the use of machine learning in our audit activities with the introduction of Computer Assisted Audit Techniques (CAAT) such as supervised, unsupervised
and grouping models. One of these models, used to forecast branches with areas of improvement in internal control at Mi Banco Colombia, was honored with a second-place award in the “Hackathon” organized by the Latin American Committee for Internal
Audit and Risk Assessment (Comité Latinoamericano de Auditoría Interna y Evaluación de Riesgos) committee of the Latin American Federation of Banks (Federación
Latinoamericana de Bancos or FELABAN by its Spanish initials).
Additionally, due to the growth in the number of models and the increase in the complexity of the methodologies applied, in addition to the projects carried out with traditional
methodology, a method has been developed to audit models in an agile way called "Special Model Audits". The purpose of Special Model Audits is to cover the existing review needs and to be able to identify in a shorter time the deficiencies that may
exist in different processes. With the application of this method in projects during 2022, we achieved important advances in our methodology to audit MRM (model risk management), increased the coverage of model review and monitored first and second
line controls related to the development, calibration, implementation, and monitoring of models.
In 2022, we provided 19,070 hours of training to our internal auditors, with an average of 83 hours per auditor (above the 40 hours per auditor recommended by international
practices) in topics related to fraud prevention, IFRS 9, new cybersecurity frameworks such as those promulgated by the IIA, NIST or the FFIEC, internal quality assessment, data analytics, risk management, programming language, anti-money
laundering, validation of models and other topics of financial and operational audit.
As of December 31, 2022, there are 51 financial institutions and four state-owned banks (Banco de la Nación, COFIDE, Banco Agropecuario (Agrobanco) and Fondo MiVivienda) in the
Peruvian universal banking sector.
|
Private Financial System as of December 31, 2022 (1)
|
||||||||||||||||
|
Number of
entities
|
Assets
(Soles in
thousands)
|
Deposits
(Soles in
thousands)
|
Loans
(Soles in
thousands)
|
|||||||||||||
|
Banking Sector (2)
|
17
|
502,134,165
|
325,989,814
|
356,584,532
|
||||||||||||
|
Financial firms (3)
|
9
|
16,491,304
|
8,093,880
|
14,085,654
|
||||||||||||
|
Municipal savings banks (4)
|
12
|
38,924,079
|
27,682,378
|
33,008,550
|
||||||||||||
|
Rural savings banks (5)
|
6
|
2,845,574
|
1,763,836
|
2,373,741
|
||||||||||||
|
Edpymes (6)
|
7
|
3,862,443
|
-
|
3,281,340
|
||||||||||||
|
Total
|
51
|
564,257,565
|
363,529,909
|
409,333,816
|
||||||||||||
Source: SBS
(1) The total Private Financial entities does not include savings and loans associations (COOPACS), because the information for COOPACS is not yet publicly available from the
SBS.
(2) “Banca Multiple” under SBS definition and terminology
(3) “Empresas Financieras” under SBS definition and terminology
(4) “Cajas Municipales” under SBS definition and terminology
(5) “Cajas Rurales” under SBS definition and terminology
(6) The same name under SBS definition and terminology (as defined below under “– 5.2 Microfinance – 5.2.1 Peruvian microfinance system”).
(i) Banking Sector
The Banking Sector includes universal banks, offering financial services to retail and wholesale clients, among others. The following table sets forth the percentages, by
assets, deposits, and loans, represented by the major Peruvian banking institutions.
|
As % of total Private Financial System
|
As % of Banking Sector
|
|||||||||||||||||||||||
|
as of December 31, 2022
|
Assets
|
Deposits
|
Loans
|
Assets
|
Deposits
|
Loans
|
||||||||||||||||||
|
BCP Stand-alone
|
31.6
|
%
|
32.6
|
%
|
30.0
|
%
|
35.5
|
%
|
36.3
|
%
|
34.5
|
%
|
||||||||||||
|
BBVA Banco Continental
|
17.4
|
%
|
18.2
|
%
|
17.9
|
%
|
19.5
|
%
|
20.3
|
%
|
20.5
|
%
|
||||||||||||
|
Scotiabank Peru
|
13.1
|
%
|
11.4
|
%
|
14.0
|
%
|
14.7
|
%
|
12.7
|
%
|
16.1
|
%
|
||||||||||||
|
Interbank
|
11.8
|
%
|
12.1
|
%
|
11.1
|
%
|
13.3
|
%
|
13.5
|
%
|
12.7
|
%
|
||||||||||||
|
Banco Interamericano de Finanzas
|
3.4
|
%
|
3.5
|
%
|
3.3
|
%
|
3.8
|
%
|
3.9
|
%
|
3.8
|
%
|
||||||||||||
|
Mibanco
|
3.0
|
%
|
2.5
|
%
|
3.4
|
%
|
3.4
|
%
|
2.8
|
%
|
3.9
|
%
|
||||||||||||
Source: SBS
As of December 31, 2022, BCP Stand-alone ranked first among all Peruvian multiple banks by assets, deposits, and loans, according to the SBS.
As of December 31, 2022, the principal Peruvian non-state financial institutions reported total loan balances of S/ 258,836 million in local currency and of US$25,629 million in
foreign currency (in comparison to S/259,007 million and US$22,830 million as of December 31, 2021, respectively). These figures represented a contraction in local currency loan balances of (0.1%) and an expansion in foreign currency loan balances
of 7.4% from December 31, 2021 (compared to expansion of 6.4.% and 10.1%, respectively, from December 31, 2020, to December 31, 2021). As a result, the dollarization of loans reached 27.4% as of December 31, 2022 (compared to 26.0% as of December
31, 2021, and 25.4% as of December 31, 2020).
As of December 31, 2022, Peru’s total amount of multiple banking deposits were S/325,990 million, and the multiple banking dollarization rate for deposits was 40.6% (compared to
43.0% as of December 31, 2021, and 37.9% as of December 31, 2020). It should be noted that, as part of its plan to decrease the dollarization level of loans in the Peruvian financial system and reduce the risks of currency depreciation associated
with borrowing in US Dollars, the BRCP established a de-dollarization program beginning in January 2015. For further information, see “ITEM 4. INFORMATION ON THE COMPANY – 4.B Business Overview – (6) Supervision and Regulation – 6.2 Subsidiaries –
6.2.1 Peru – (i) Peruvian Regulators”.
Peruvian banks’ capital ratio (regulatory capital divided by risk-weighted assets (RWAs) was 14.45% as of December 31, 2022, which was above the 10% legal minimum that became
effective in July 2011 and represented a decrease of 53 basis points from the capital ratio reported as of December 31, 2021 (14.92%). As of 2021, the ratio decreased by 60 basis points from a ratio of 15.52% as of December 31, 2020.
Peru’s loan portfolio quality indicators generally improved in 2022. As of December 31, 2022, the internal overdue ratio reached 3.95%, 18bps above than the ratio reported as of
December 31, 2021 (3.77%). As of 2021, the ratio had decreased 3 basis points compared to December 31, 2020 (3.80%). Also, the internal overdue, refinanced, and re-structured loans over total loans ratio was 5.73% as of December 31, 2022, 8 basis
points higher than the 5.65% ratio reported at year-end 2021 (compared to 5.52% in 2020). Similarly, the coverage ratio of Peru’s internal overdue loan portfolio was 148.46% as of December 31, 2022 (compared to 155.54% as of December 31, 2021, and
177.68% as of December 31, 2020).
The liquidity of the Peruvian banking system remained at moderately high levels. As of December 31, 2022, the local currency liquidity ratio and the foreign currency liquidity
ratio were 26.96% and 48.01%, respectively (compared to 33.64% and 51.35% in 2021, and to 52.2% and 49.2% in 2020, respectively). The decrease in the local currency liquidity ratio is consistent with bank customers drawing down their deposits as
the economy reactivated after the COVID-19 pandemic. These liquidity ratio levels were well above the minimums required by SBS regulations, which was 8% for local currency and 20% for foreign currency as of December 31, 2022.
(ii) Other financial institutions
BCP Stand-alone also faces strong competition from credit providers other than banking institutions, primarily with respect to consumer loans and SME-Pyme loans. SME-Pyme loan
providers from non-bank financial institutions lent S/31.16 billion to borrowers in 2022, compared to S/28.34 billion in 2021, and S/25.76 billion in 2020, according to the SBS. In 2022, overall SME-Pyme loans to customers of non-bank financial
institutions represented 53.30% of the total loans in the Peruvian financial system (compared to 52.33 % in 2021 and 47.79% in 2020).
Consumer loan providers from other financial institutions lent S/15.8 billion to borrowers in 2022, compared to S/13.4 billion in 2021 and S/14.0 billion in 2020, according to
the SBS. In 2022, overall loans to consumers of other financial institutions represented 18.8% of total loans in the financial system (compared to 19.4% in 2021 and 21.2% in 2020).
(iii) Recent Competitive Developments
In recent years, several foreign companies have shown interest in entering the Peruvian universal banking market, while financial companies already in Peru have taken steps to
expand operations and develop new businesses. In addition, non-traditional players, such as fintech and startup companies, began to operate in the financial sector in recent years. These new strong competitors may adversely affect our results, as
they provide similar products and services. In particular, the following authorizations and applications from and to the SBS may be significant to our competitive environment in Peru:
| (1) |
In April 2020, the SBS authorized the operation of Bank of China (Peru) S.A. as a multiple operation banking company. Bank of China already has a representative office in Peru.
|
| (2) |
In February 2021, the RappiBank digital platform was launched through an alliance between Interbank and Rappi. The platform offers digital financial services such as digital savings accounts, debit cards and credit cards.
|
| (3) |
In March 2021, the Peruvian congress approved the Usury Law Regulation, which protects consumers of financial services from usury. This law establishes caps on the interest rates charged by financial institutions, which must be within
the limit proposed by the BCRP. Likewise, the law also prohibits the capitalization of interest and the collection of a penalty or other commission or expense in the event of non-compliance or delay in the payment of the loan.
|
| (4) |
In June 2021, Law No. 31112, Ley que establece el control previo de operaciones de concentración empresarial (the Merger Control Law), a law regarding pre-merger control for certain business transactions, entered in force. The Merger
Control Law established that any transaction that involves a change of control or causes ownerships to cross certain thresholds set by such law and can result in action in concert must have the authorization of INDECOPI to be consummated.
The Merger Control Law also vested in INDECOPI the pre-merger control of transactions within the scope of the regulation and supervision of the SBS and/or SMV, without prejudice to pre-merger control of a prudential nature and financial
stability within the responsibility of the SBS and/or SMV.
|
| (5) |
In September 2021, the SBS authorized the organization of a banking company under the corporate name Banco BCI Perú. It will operate as a subsidiary of the Chilean banking company BCI, which had already been authorized to carry out its
international expansion in Peru in September 2019.
|
| (6) |
Since 2021, along with our traditional competitors, new technology-driven entities such as fintech and startup companies, showed greater interest in the financial sector, in line with higher digitization under the COVID-19 context. We
highlight specific strategic alliances between these and current financial institutions competitors such as: (i) BBVA: Kontigo, (ii) Banco Interamericano de Finanzas: Microwd, and (iii) Interbank: RappiBank and Kambista.
|
| (7) |
During 2022, more international technology-driven entities such as fintech and startup companies entered in Peru, for example we have Payflow (Spain), Zulu (Colombia), Tapi (Argentina), or Trii (Colombia) among others. With an increasing
digital population, the Peruvian market is becoming more attractive to international players.
|
| (8) |
In July 2022, SBS Resolution N. 504-2021, Reglamento para la Gestión de la Seguridad de la Información y la Ciberseguridad, which contains new requirements regarding multifactor authentication and digital procurement criteria, entered in
force.
|
According to The Economist Intelligence, Peru and Colombia have the most conducive environments for financial inclusion. We are aware that a large portion
of microbusiness owners in both countries are currently unbanked, which constitutes an opportunity to contribute to these economies while growing our businesses.
5.2.1 Peruvian microfinance system
As of December 31, 2022, the Peruvian microfinance system is mainly regulated by the SBS and is comprised of entities that vary in size, client segments,
and ambit of geographic action: one bank, which is Mibanco; nine financial firms, 12 municipal savings banks, six rural savings banks and seven development entities for small and microbusinesses (Edpymes). The Peruvian microfinance system also
includes 349 savings and loan associations (Cooperativa de Ahorro y Créditos or COOPACS by its Spanish initials), which have small portfolios and target specific geographic areas.
As of December 31, 2022, the Peruvian microfinance system (excluding COOPACS) represented around 66% of the total entities regulated by the Peruvian
financial system, with microfinance loans totaling approximately S/66.7 billion (16% of Peruvian Financial System). As of December 31, 2022, according to the SBS, microfinance customers represented 58.1% of borrowers in the regulated Peruvian
financial system.
|
Peruvian Microfinance System as of December 2022
|
||||||||||||||||
|
Number of
entities
|
Assets (Soles in
thousands)
|
Loans (Soles in
thousands)
|
Deposits (Soles
in thousands)
|
|||||||||||||
|
Multiple banking
|
1
|
16,943,558
|
13,966,295
|
9,145,081
|
||||||||||||
|
Financial firms
|
9
|
16,491,304
|
14,085,654
|
8,093,880
|
||||||||||||
|
Municipal savings banks
|
12
|
38,924,046
|
33,008,550
|
27,682,378
|
||||||||||||
|
Rural savings banks
|
6
|
2,845,574
|
2,373,741
|
1,763,836
|
||||||||||||
|
Edpymes
|
7
|
3,862,443
|
3,281,340
|
-
|
||||||||||||
|
Savings and loan associations (COOPACS) (1)
|
349
|
N/A
|
N/A
|
N/A
|
||||||||||||
|
Total
|
384
|
79,066,925
|
66,715,580
|
46,685,175
|
||||||||||||
(1) In 2019, SBS began overseeing COOPACS and according to the latest financial information available, at the end of 2019, 131 COOPACS reported (aggregate) a total of S/13.2
billion in assets, S/9.8 billion in loans and S/9.7 billion in deposits.
Source: SBS
According to the SBS, as of December 31, 2022, Mibanco led the Peruvian market for loans in the micro and small business segments regulated by SBS, with
shares of 23.0% and 21.8% respectively (compared to 26.6% and 20.5%, respectively, as of December 31, 2021 and 28.6% and 18.2%, respectively, as of December 31, 2020).
Municipal savings banks are important players in the microfinance system in Peru. In 2022, 12 municipal savings banks were operating and represented 49% of
the total loans at year-end. The business model used by municipal savings associations is similar to the traditional relational model used by Mibanco, which conducts an on-site cash flow assessment of the customer. The municipal savings
associations operate in municipal government ambits, and as such, their ability to innovate and modify products and processes is limited by the existence of multiple layers of approval.
The first half of 2022 was characterized by rapid economic recovery while the second half was affected by the political instability and violent protests due
to social unrest. This situation caused a decline in the disbursements during the last quarter of 2022. In this context, Mibanco worked to keep its portfolio quality aligned with its risk appetite, and its internal overdue loan coverage ratio was
128.6% in IFRS as of December 31, 2022. In Peruvian GAAP, as of December 31, 2022, Mibanco’s internal overdue loan coverage ratio was 140.8% and the average for municipal savings banks was 151.7% Mibanco’s global capital ratio was 14.7% at year-end
2022, which exceeded the 14.6% global capital ratio reported by municipal savings banks at year-end 2022. Furthermore, in 2022, the ROE for Mibanco was 17.8%, which exceeded the 8.8% ROE collectively reported by the municipal savings banks system.
Recent competitive developments
The most relevant news and developments in the Peruvian microfinance system from 2020 to 2022 were:
| • |
In January 2020, Urgent Decree No. 013-2020 introduced a new regulatory framework that contemplates establishing crowdfunding platforms to finance entrepreneurial projects, micro and small-sized companies and
startups in Peru.
|
| • |
In 2020, Peru’s Ministry of Production (Ministerio de la Producción) signed a new trust agreement with COFIDE for the
administration of Peru’s Microenterprise Development Fund (Fondemi by its Spanish initials). Fondemi is intended to fund loans of up to S/100,000 to medium and small businesses. These resources will be offered to clients through financial institutions, municipal savings banks, rural savings banks, Edpymes and non-governmental organizations (NGOs).
|
| • |
In 2020, most of the developments and regulations affecting the Peruvian microfinance system were related to government relief measures in the context of COVID-19. In March 2020, through Multiple Resolution (Oficio Múltiple) No. 11170-2020-SBS, the SBS authorized entities in the Peruvian financial system to modify loan contracts to extend grace periods for borrowers. This allowed clients to repay debts over
longer periods without generating the usual negative marks on credit histories that are generated when grace periods expire without payment. For more information, please refer to the following section: ITEM 3 KEY INFORMATION – 3.D Risk
Factors – Our business and results of operations may continue to be negatively impacted by the COVID-19 outbreak or other public health crises beyond our control.
|
| • |
In December 2020, through Multiple Official Letter No. 42138-2020, the SBS provided that, exceptionally and subject to prior authorization, companies in the financial system may reduce their capital stock,
legal reserve and/or other equity accounts for the purpose of constituting new specific and/or generic provisions (including voluntary) for their credit portfolio.
|
| • |
In March 2021, by means of Ministerial Resolution No. 119-2021-EF/15, the entities of the Peruvian financial system were authorized to grant guaranteed credits obtained for a
single time under the Reactiva Peru Program, with a new grace period of 6 to 12 months, which allows rescheduling in 24 months or, in
exceptional cases, in 36 months.
|
| • |
In March 2021, the Peruvian congress approved the Usury Law Regulation, which protects consumers of financial services from usury. This law establishes caps on the interest rates charged by the financial institutions, which must be
within the limit proposed by the BCRP. Likewise, the law also prohibits the capitalization of interest and the collection of a penalty or other commission or expense in the event of non-compliance or delay in the payment of the loan.
|
| • |
In April 2021, through Law No. 31171, dependent workers were allowed to withdraw their severance indemnity deposits in order to cover
the economic needs caused by the COVID-19 pandemic. A single withdrawal was allowed and had to be made before December 31, 2021. The withdrawal could be up to 100% of their accumulated severance indemnity deposits on the date of
withdrawal.
|
| • |
In 2021, the SBS intervened in more than 10 COOPACS that had incurred a total loss of their equity. Among the most important of these COOPACS were AELUCOOP and Credicoop Arequipa. The SBS attributed these losses to mismanagement by their
directors, alleged criminal actions committed by the directors and failure to carry out an adequate analysis of debtors’ ability to pay.
|
| • |
In April 2022, through Multiple Resolution (Oficio Múltiple) No. 05830-2022 SBS, the minimum requirement of 100% in the Liquidity Coverage Ratio in local and foreign currency, which had been temporarily
suspended due to the State of Emergency declared by Supreme Decree No. 044-2020-PCM as a result of the COVID-19 pandemic, was reinstated.
|
| • |
In May 2022, through Law No. 31480, dependent workers were again allowed to withdraw their severance indemnity deposits in order to cover the economic needs caused by the COVID-19 pandemic. A single
withdrawal was allowed and had to be made before December 31, 2023. The withdrawal could be up to 100% of their accumulated severance indemnity deposits on the date of withdrawal.
|
| • |
In July 2022, through Resolution No. 01087-2022, the SBS created the Savings and Loan Associations Deposit Insurance Fund to start collecting insurance premiums from savings and loan associations in Peru.
This insurance will provide coverage after 24 months of contribution (July 2024) up to a maximum of S/ 5,000 for savings and loan associations with total assets less than 32,200 Tax Units (Unidades Impositivas Tributarias or UITs by their
Spanish initials) (S/148.2 million) and up to a maximum of S/10,000 for savings and loan associations with total assets higher than 32,200 Tax Units (S/148.2 million) for each contributor.
|
| • |
In July 2022, through Resolution No. 02192-2022, the SBS approved the dispositions for the application of policies, procedures, and monitoring of maximum interest rates for consumer loans and small and
microenterprise of the Usury Law Regulation (Law No. 31143).
|
| • |
In August 2022, the global capital limit changed from 8.0% to 8.5%, after the previous relaxation of operating limits in the Banking Law (Urgent Decree No. 037-2021) associated with the Equity Strengthening
Program for Institutions Specialized in Microfinance was terminated by Urgent Decree No. 003-2022.
|
| • |
In December 2022, through Ministerial Resolution No. 277-2022-EF/15, the guidelines and conditions of financial instruments of the CRECER Fund for factoring companies not included in the scope of the Banking
Law No. 26702 were approved. CRECER was created in September 2018, through
|
| • |
Decree Law No. 1399, for financing, granting guarantees and other financial products, necessary to promote the development of micro, small and medium-sized companies, as well as export companies.
|
| • |
In December 2022, through Urgent Decree No. 026-2022, an extension until June of 2023 was approved for the reprogramming of loans guaranteed under the Reactiva and FAE-Texco programs, which are Business
Support Fund programs for the textile and clothing sector, mainly to mitigate the impact of the economic and social crisis.
|
5.2.2 Colombian microfinance system
The Colombian microfinance system is regulated by the SFC. As of November 2022, Colombian microfinance institutions represented around 28% of the total
entities regulated by the Colombian financial system, with microfinance loans totaling approximately 18.6 billion Colombian pesos. Mibanco Colombia, which is considered part of Colombia’s multiple banking sector, was ranked fourth in the Colombian
microfinance system with a market share of 13.12% of loans in this segment according to the SFC. Microfinance institutions reported a presence in 1,086 municipalities (97% of total municipalities in the country) and 52.0% of the microentrepreneurs
were women, according to the Association of Microfinance Institutions of Colombia (or Asomicrofinanzas by its Spanish initials).
|
Colombian Financial System in December 2022
|
||||||||||||||||||||
|
Number of
entities
|
Assets (Pesos
in millions)
|
Deposits
(Pesos in
millions)
|
Total Loans (Pesos
in millions)
|
Microfinance Loans
(Pesos in millions)
|
||||||||||||||||
|
Multiple banking
|
29
|
924,121,052
|
572,309,836
|
642,472,798
|
15,949,568
|
|||||||||||||||
|
Financial corporations
|
5
|
27,525,820
|
6,382,925
|
0
|
0
|
|||||||||||||||
|
Finance company
|
11
|
16,505,562
|
8,579,558
|
14,445,764
|
417,771
|
|||||||||||||||
|
Financial cooperatives
|
5
|
4,812,741
|
2,975,613
|
4,245,021
|
764,004
|
|||||||||||||||
|
Microfinance institutions
|
19
|
N/A
|
N/A
|
N/A
|
1,819,391
|
|||||||||||||||
|
Total
|
69
|
972,965,175
|
590,247,932
|
661,163,583
|
18,950,734
|
|||||||||||||||
Source: SFC and Asomicrofinanzas
Recent competitive developments
The most relevant new developments in the Colombian microfinance sector were:
The most relevant new developments in the Colombian microfinance sector were:
| • |
Electronic payments on existing cash transfer programs such as Families in Action (Familias en Acción or FA by its Spanish initials), Youth in Action (Jóvenes en Acción or JA by its Spanish initials) and Colombia Elderly (Colombia Mayor or CM by its Spanish initials) increased during the COVID-19 pandemic.
|
| • |
In April 2020, through Decree No. 518 of 2020, the Solidarity Income Program (Programa Ingreso Solidario or IS by its Spanish initials) was created to support impoverished households by providing monetary support to individuals
who were not included in the FA, CM, JA and VAT Refund (Devolución del IVA or DI
by its Spanish initials) programs. The program has banked 2.5 million individuals who were previously not included in the formal system.
|
| • |
In 2020, “Unidos por Colombia” was created to guarantee US$12 billion to fund loans for any company in Colombia but with particular emphasis on providing funds to
small and medium businesses (SMEs) and microbusinesses with guarantees that cover up to 60% of the loans granted by banks and non-banking entities, including microfinance institutions.
|
| • |
In July 2020, Bill No. 122-2020, created the Law for Entrepreneurial Endeavors, which seeks to encourage the growth, consolidation, and sustainability of entrepreneurship to increase social wellbeing and
generate equity in the country. The measures imposed by this new bill include differentiated rates according to the size of the company and the reduction of departmental registration taxes.
|
| • |
In June 2021, the first bond issue with a gender focus in the Colombian market was launched by Bancamia S.A. The issue had a value of US$54 million and was intended to fund the granting of loans to 50,000 women in vulnerable situations.
|
5.3.1 Grupo Pacífico
The Peruvian insurance market, which includes P&C, life, and corporate health insurance market, is comprised of 17 active companies, of
which 8 are dedicated to P&C and lifelines, 6 are dedicated exclusively to P&C and 3 are dedicated exclusively to life. According to the SBS and SUSALUD, as of December 31, 2022, four companies (Rimac, Grupo Pacífico, La Positiva and Mapfre) represented a combined 81.1% market share in terms of written premiums, and the leading two companies had a combined market share of 57.2%, both according to the SBS.
In 2022, Grupo Pacífico was the second-largest insurance company in Peru in terms of written premiums, with a consolidated market share of 26.5% (compared
to 26.7% in 2021), according to the SBS and SUSALUD. Grupo Pacífico had a 5.4% written premium increase from 2021 to 2022, which was lower than the Peruvian average growth of 6.3%, in line with the higher economic activity. However, Grupo Pacífico
remains the largest insurance company in the life and health insurance market with 26.1% and 44.2% of market share respectively according to the SBS and SUSALUD. The following table lists the Peruvian market share of each of the top six insurers by
annual written premiums in 2022:
|
Market Share by Annual Written Premiums (1)
|
2020
|
2021
|
2022
|
|||||||||
|
1. Rimac
|
32.1
|
%
|
30.9
|
%
|
30.7
|
%
|
||||||
|
2. Grupo Pacífico
|
28.9
|
%
|
26.7
|
%
|
26.5
|
%
|
||||||
|
3. La Positiva
|
11.6
|
%
|
11.7
|
%
|
11.1
|
%
|
||||||
|
4. Mapfre
|
12.1
|
%
|
11.6
|
%
|
12.9
|
%
|
||||||
|
5. Interseguro
|
4.5
|
%
|
6.2
|
%
|
5.6
|
%
|
||||||
|
6. Protecta
|
2.5
|
%
|
3.3
|
%
|
2.7
|
%
|
||||||
|
Annual Written Premiums (Soles in millions)
|
16,542
|
20,417
|
21,703
|
|||||||||
Source: SBS + SUSALUD
(1) P&C + Life + Corporate Health Insurance Businesses
Grupo Pacífico has a relatively well-diversified product portfolio, with composition comparable to that of the overall Peruvian insurance industry. In
contrast to the Latin-American region, Peru maintains a low insurance penetration level: as of December 31, 2022, the region has an insurance penetration level of 3.0%, while Peru´s was 2.1% in 2022, according to the SBS and BCRP.
In 2022, the Peruvian insurance market registered an increase of 6.3% in terms of total direct premiums (S/21,703 million compared to S/20,417 million in 2021), explained by the country’s economic recovery, as well as lower confinement and social distancing measures to face the COVID-19
pandemic, as compared to 2021. This increase is mainly due to the P&C segment, for which production increased 6.2% from 2021 to 2022, and to the life segment, for which production increased 5.7% from 2021 to 2022.
Life and P&C insurance market
In September 2013, the SBS initiated a reform to the PPS that established a tender process for the exclusive right to manage the PPS’s collective insurance
policies for disability and survivorship (D&S) and burial expenses. As a result of the SBS’s reform, these exclusive rights were offered for the collective insurance contract. In 2017 and 2019, Grupo Pacífico won the third, fourth and fifth
tender processes, which allowed the company to continue in the D&S business from 2017 to 2022. Grupo Pacífico won the latest D&S tender process (SISCO VI regime), which allows it to continue in the D&S business from January 1, 2023, to
December 31, 2023.
In 2022, total written premiums in the Peruvian life and P&C insurance sectors increased 5.9% compared to 2021, a smaller increase than the 26.2% increase from 2020 to 2021
(after a decrease of 0.7% from 2019 to 2020). Written premiums in the Peruvian life and P&C insurance market totaled S/18,746 million in 2022, higher than S/17,695 million registered in 2021. Total written premiums in the Peruvian life
insurance business increased 5.7% from 2021 to 2022, and those in the Peruvian P&C business grew 6.2% from 2021 to 2022, according to the SBS. For comparison, in the same year, Peru’s GDP increased by 2.7%, according to the BCRP.
According to the SBS, in 2022, Grupo Pacífico’s written premiums in Peru’s consolidated life and P&C businesses were 23.7% of the Peruvian market, compared to 24.1% in 2021.
Grupo Pacífico’s written premiums in 2022 were the second largest of any company in Peru’s consolidated life and P&C insurance market.
Life insurance market
In 2022, written premiums in Peru’s life insurance market totaled S/9,740.8 million, which represents an increase of 5.7% from 2021, according to the SBS. This was mainly
attributable to Credit Life (which increased 24.3% from 2021), Group life (which increased 22.5% from 2021), and to D&S (which increased 12.9% from 2021).
According to the SBS, in 2022, Grupo Pacífico had the largest market share in the Peruvian life insurance market by written premiums (26.1%), which was lower than its market share of 26.7% in 2021.
In 2022, Grupo Pacífico’s written premiums increased 3.4% from 2021, lower than Peru’s average growth of 5.7%. The increase in Grupo Pacífico’s written premiums was primarily attributable to D&S, which increased 13.4% from 2021 due to an
increase in premium collections under the new SISCO V regime (a public bidding process as a result of which the insurance companies that will collectively manage the risks of disability, survival and burial of AFP
members for the period 2023 are selected) as a result of a higher premium rate; group life, which increased 23.3% from 2021 due to Complementary Work Risk Insurance (Seguro Complementario de Trabajo de Riesgo or SCTR by its Spanish
initials) and statutory life product sales growth; and to credit life, which increased 10.6% from 2021, mainly driven by the bancassurance channel.
P&C insurance market
In 2022, the written premiums of Peru’s P&C insurance market totaled S/9,005.5 million, which represents an increase of 6.2% from 2021, according to the SBS. This result was
primarily attributable to commercial lines due to fire risk premiums (which increased 16.5% from 2021), earthquake insurance premiums (which increased 7.9% from 2021), premiums for theft insurance for credit cards (which increased 13.0% from 2021),
liability insurance premiums (which increased 6.4% from 2021) and transportation risks premiums (which increased 9.0% from 2021), and to automobile premiums (which increased 4.1% from 2021), mandatory traffic accident third-party liability
insurance premiums (SOAT by its Spanish initials) (which increased 2.9% from 2021) and medical assistance premiums (which increased 5.7% from 2021).
According to the SBS, Grupo Pacífico had the second largest market share in Peru’s P&C sector (21.1% in 2022, which is lower than its 21.3% market share in 2021). Grupo
Pacífico’s written premiums increased 5.0% from 2021, which is lower than Peru’s average growth rate of 6.2%. The increase in Grupo Pacífico’s written premiums was mainly driven by commercial lines premiums (which increased 4.0% from 2021), due to
higher volume of transportation risks policy renewals, theft insurance for credit cards, aviation and liability insurance; medical assistance premiums (which increased 5.5% from 2021), due to growth in premium renewals for comprehensive health and
oncological products; and automobile premiums (which increased 6.7% from 2021), due to an increase in renewals in the brokers, bancassurance and digital sales channels.
Corporate Health Insurance and Medical Services market
According to SUSALUD, in 2022, written premiums in Peru’s health insurance market totaled S/2,957.0 million, which represented an increase of 8.7% compared to the previous year.
Based on figures from SUSALUD, Grupo Pacífico had Peru’s largest market share in the health insurance market in 2022 (44.2%, compared to 43.5% in 2021).
5.3.2 Prima AFP
The PPS consists of four companies, and Prima AFP is the second largest of the four by funds under management. According to the SBS, as of December 31, 2022, funds under
management in the PPS reached S/105.9 billion, of which Prima AFP managed S/31.8 billion. According to SBS data, Prima AFP had a market share of 30.1% in 2022, essentially unchanged from its market share in 2021 (30.1%) and lower than its 30.2%
market share in 2020.
According to the SBS, on December 31, 2022, the PPS reached 8.8 million affiliates, of which 2.3 million were Prima AFP’s customers. This represented a market share of 26.6% for
Prima AFP, lower than its market shares of 28.5% and 30.3% as of year-end 2021 and 2020, respectively, also according to SBS data.
Collections in the PPS in 2022 reached S/14.5 billion, of which S/4.1 billion was collected by Prima AFP. This represented a market share of 28.1% for Prima AFP, lower than its
market shares of 28.9% and 31.4% as of year-end 2021 and 2020, respectively, also according to SBS data.
As discussed below under “PPS Reforms”, the Peruvian government began a process of reforming the PPS in 2012 through the passage of the PPS Reform Law. This reform contemplated
a tender process to be held every 24 months, in which the AFP that offers the lowest management fee wins the tender. As a result, new workers who enter the PPS become members of the tender holder and remain in it for at least 24 months.
The following table shows the PPS tender processes held to date and their respective winners:
|
No.
|
Date Held
|
Period
|
Winner
|
|
-
|
September 2012
|
October 2012 – May 2013
|
Prima AFP
|
|
1st
|
December 2012
|
June 2013 – May 2015
|
AFP Habitat
|
|
2nd
|
December 2014
|
June 2015 – May 2017
|
AFP Habitat
|
|
3rd
|
December 2016
|
June 2017 – May 2019
|
Prima AFP
|
|
4th
|
December 2018
|
June 2019 – May 2021
|
AFP Integra
|
|
5th
|
December 2020
|
June 2021 - May 2023
|
AFP Integra
|
|
6th
|
December 2022
|
June 2023 - May 2025
|
AFP Integra
|
Our Investment Banking and Wealth Management LoB is organized into five main business units: Asset Management, Capital Markets, Corporate Finance, Wealth Management and Trust
Services. In addition, there is a regional Business Support team and a centrally managed Treasury Department.
Asset Management
In Asset Management, Credicorp Capital’s proprietary funds total market reduced its size considerably since 2021, driven by significant local outflows from Peru in 2022 due to
high political uncertainty. However, Credicorp Capital maintained the leading market position in mutual funds in Peru among institutional clients and individuals, with a market share of 30.0% by total market assets under management, according to
the SMV. We are also developing alternative funds in real estate, infrastructure, and private debt at a regional level and offer third-party funds from global asset managers to our clients.
Capital Markets
In capital markets, our brokerage house in Peru reaffirmed its leadership, holding the largest market share in equities (27% of traded value) and the second largest in fixed
income (41% of traded volume), excluding the volumes outside of the stock market, according to the BVL. Similarly, our brokerage company in Colombia held the second largest market share among brokers in equities (16% of traded value) and the
largest in fixed income (26% of traded volume) according to the Colombian Stock Exchange. In Chile, we held the fifth largest market share in equities (6%) and the second largest in fixed-income proprietary accounts (7%), in terms of traded volume,
according to the Santiago Stock Exchange.
Corporate Finance
In Corporate Finance, our teams are mainly recognized in Peru and Chile, while the team in Colombia continues to build up its reputation. These teams offer lending and capital
markets solutions for corporations’ financing needs and offer them advisory services for mergers and acquisitions.
Wealth Management
In Wealth Management, while the team is consolidated in Peru, we seek to capitalize on the growth opportunity in Colombia and Chile. In this business, we compete in a regional
market led by global banks and financial institutions, especially in the ultra-high-net-worth segment.
Trust Services
In Peru, we have a strong leadership position in fiduciary and custody services to retail and institutional clients, but further growth is limited by market size. On the other
hand, we have a relatively low market share in fiduciary services in Colombia (less than 5% measured by number of trust deeds), according to the Association of Fiduciaries of Colombia (Asociación de Fiduciarias de Colombia).
Credicorp Ltd. is an exempted company located in Bermuda. Credicorp maintains a presence and conducts its activities in Peru, Cayman Islands, Bolivia, Colombia, Chile, Mexico,
Spain, Panama, the United States, and Luxembourg through its different LoBs and subsidiaries.
Other than as described under “ITEM 3. KEY INFORMATION - 3. D Risk Factors - Credicorp, as a Bermuda exempted company, may be adversely affected by any change in Bermuda law or
regulation,” there are no applicable regulations under Bermuda law that are likely to materially impact our operations as they are currently structured. Under Bermuda law, there is no regulation applicable to Credicorp as a holding company that
would require that we separate the operations of our subsidiaries incorporated and existing outside Bermuda.
Our common shares are listed on the NYSE. We are therefore subject to regulation by the NYSE and the SEC as a “foreign private issuer”. We also must comply with the
Sarbanes-Oxley Act of 2002.
We are subject to certain requirements set forth by the Peruvian Banking and Insurance Law, as well by certain banking resolutions issued by the SBS, including the Consolidated
Supervision of Financial and Mixed Conglomerates Regulation. These regulations affect us primarily in the areas of reporting, risk control guidelines, limitations, ratios, and capital requirements.
Since our common shares are listed on the BVL in addition to the NYSE, we are subject to certain reporting requirements to the SMV and the BVL. See “Item 9. The Offer and
Listing – 9.C Markets – (2) Market Regulation”. The SMV issued SMV Resolution 016-2019-SMV/01 - “Guidelines for the qualification of Independent Directors”, which are not binding rules; but recommendations to the issuers listed on the BVL and under
SMV supervision.
(i) Capital Adequacy Requirements
SBS Resolution No. 11823-2010 established the methodologies for calculating the regulatory capital and capital requirements for financial and mixed conglomerates. Article 4 of
SBS Resolution No.11823-2010 identifies two categories of consolidated groups: (i) the financial system consolidated group and (ii) the insurance system consolidated group. A combined group of companies formed by these two categories of entities is
called a financial group. The financial system consolidated group, the insurance system consolidated group, and the financial group are each required to hold regulatory capital that is greater than or equal to the capital requirements applicable to
each respective group.
The capital requirements applicable to the financial group are the sum of the capital requirements applicable to the financial system consolidated group and to the insurance
system consolidated group. The capital requirements applicable to the financial system consolidated group and to the insurance system consolidated group are the sum of the capital requirements applicable to the companies that belong to each
respective group. For unsupervised companies, regulatory capital is required to be the greater of: (i) 10% of third-party assets or (ii) the ratio of third-party assets over total assets multiplied by the sum of paid-in-capital, legal reserves,
supplementary capital premiums, voluntary reserves distributable only with prior SBS approval, and retained earnings with capitalization agreements net of current and past years’ losses.
Article 6 of SBS Resolution No. 11823-2010 provides that regulatory capital of the consolidated groups comprises the sum of basic capital and supplementary capital and is
calculated as follows:
| • |
Basic Capital: Basic Capital or Tier 1 capital is comprised of:
|
| (i) |
paid-in-capital (which includes common stock and perpetual non-cumulative preferred stock), legal reserves, supplementary capital premiums, voluntary reserves distributable only with prior SBS approval, and retained earnings with
capitalization agreements (that is, earnings that the shareholders or the Board of Directors, as the case may be, have committed to capitalize as common stock); and
|
| (ii) |
other elements that have characteristics of permanence and loss absorption that are in compliance with regulations enacted by the SBS;
|
Items deducted from Tier 1 capital include:
| (a) |
current and past years’ losses;
|
| (b) |
deficits of loan loss provisions;
|
| (c) |
goodwill resulting from corporate reorganizations or acquisitions; and
|
| (d) |
half of the amount referred to in “Deductions” below. Absent any Tier 2 capital, 100% of the amount referred to in “Deductions” below must be deducted from Tier 1 capital.
|
The elements referred to in item (ii) above should not exceed 17.65% of the amount resulting from adding components (i) of Basic Capital or Tier 1 capital
net of the deductions in (a), (b), and (c) in the list above.
| • |
Supplementary Capital: Supplementary capital comprises the sum of Tier 2 and Tier 3 capital. Tier 2 capital elements include:
|
| (a) |
paid-in-capital, legal reserves, supplementary capital premiums, and voluntary reserves that may be reduced without prior consent from the SBS;
|
| (b) |
the eligible portion of the consolidated redeemable subordinated debt and of any other components that have characteristics of debt and equity as provided by the SBS;
|
| (c) |
for banks using the SBS standardized approach method, the generic loan loss provision up to 1.25% of total credit RWAs; or, alternatively, for banks using the internal ratings-based (IRB) method, the generic loan loss provision up to
0.6% of total credit RWAs (pursuant to Article 189 of Law No. 26702); and
|
| (d) |
half of the amount referred to in “Deductions” below. Tier 3 capital comprises consolidated redeemable subordinated debt that is incurred with the sole purpose of covering market risk.
|
| • |
Deductions: The following elements are deducted from Tier 1 and Tier 2 capital:
|
| (i) |
for the financial system consolidated group, all investments in shares and subordinated debt issued by other local or foreign financial institutions and insurance companies; for the insurance system consolidated group, all investments in
shares and subordinated debt issued by other local or foreign insurance companies;
|
| (ii) |
all investments in shares and subordinated debt issued by entities that are part of the holding but do not belong to any of the consolidated groups;
|
|
|
(iii) |
for the financial system group, the amount by which (a) an investment in shares issued by a real sector company which is neither part of the holding nor part of the negotiable portfolio exceeds 15% of the financial system consolidated
group’s regulatory capital; and (b) the amount by which the aggregate amount of all investments in shares issued by real sector companies which are not part of the conglomerate and which are not part of the financial system consolidated
group’s negotiable portfolio exceeds 60% of the regulatory capital.
|
Article 7 of SBS Resolution No. 11823-2010 provides that the following limits apply when calculating regulatory capital: (i) the aggregate amount of supplementary capital must
not exceed the aggregate amount of basic capital; (ii) the amount of redeemable Tier 2 subordinated instruments must be limited to 50% of the amount resulting from the sum of Tier 1 elements in “Basic Capital” above; and (iii) the amount of Tier 3
capital must be limited to 250% of the sum of Tier 1 elements.
Article 10 of SBS Resolution No.11823-2010 provides that regulatory capital of the financial group is comprised of the sum of basic capital and supplementary capital, and is
calculated as follows:
| • |
Basic Capital: Basic Capital or Tier 1 capital comprises:
|
| (i) |
paid-in-capital (which includes common stock and perpetual non-cumulative preferred stock), legal reserves, supplementary capital premiums, voluntary reserves distributable only with prior SBS approval, and retained earnings with
capitalization agreements (that is, earnings that the shareholders or the Board of Directors, as the case may be, have committed to capitalize as common stock); and
|
| (ii) |
other elements that have characteristics of permanence and loss absorption that are in compliance with regulations enacted by the SBS.
|
|
|
• |
Items deducted from Tier 1 capital include:
|
| (i) |
current and past years’ losses;
|
| (ii) |
deficits of loan loss provisions;
|
| (iii) |
goodwill resulting from corporate reorganizations or acquisitions; and
|
| (iv) |
half of the amount referred to in “Deductions” below. Absent any Tier 2 capital, 100% of the amount referred to in “Deductions” below must be deducted from Tier 1 capital.
|
| • |
Supplementary Capital: Supplementary capital is comprised of the sum of Tier 2 and Tier 3 capital. Tier 2 capital elements include:
|
| (i) |
paid-in-capital, legal reserves, supplementary capital premiums, and voluntary reserves that may be reduced without prior consent from the SBS;
|
| (ii) |
the eligible portion of the consolidated redeemable subordinated debt and of any other components that have characteristics of debt and equity as provided by the SBS;
|
| (iii) |
the generic loan loss provision included in the supplementary capital of the financial consolidated group; and
|
| (iv) |
half of the amount referred to in “Deductions” below.
|
Tier 3 capital comprises consolidated redeemable subordinated debt computed in the consolidated groups.
| • |
Deductions: The following elements are deducted from Tier 1 and Tier 2 capital:
|
| (i) |
all investments in shares and subordinated debt issued by other local or foreign financial institutions and insurance companies;
|
| (ii) |
all investments in shares and subordinated debt issued by entities that are part of the conglomerate but do not belong to any of the consolidated groups; and
|
| (iii) |
all investments in shares issued by real sector companies that are not part of the conglomerate and the negotiable portfolio, computed as deductions in the financial system consolidated group.
|
For further information, see “ITEM 5. OPERATING AND FINANCIAL REVIEW AND PROSPECTS – 5. B Liquidity and Capital Resources – (1) Capital Adequacy and Solvency Management – (1.1)
Credicorp”.
(ii) Other Regulations
The Dodd-Frank Act imposes obligations on swap dealers in respect of swap transactions, including trading relationship documentation and disclosure obligations.
EMIR is a European Union regulation aimed at reducing systemic counterparty risk by increasing transparency of both parts in over-the-counter transactions.
Credicorp complies with these Dodd-Frank Act and EMIR requirements through implementation of ISDA Protocols, addressing management of existing relationships and compliance with
counterparty requirements.
6.2.1 Peru
Credicorp’s main subsidiaries, BCP Stand-alone, Mibanco, Grupo Pacífico, Prima AFP, and Credicorp Capital Peru, are located in Peru and they offer banking and financial
services. Furthermore, they are regulated by Peruvian laws and supervised by the Peruvian Financial Regulators mentioned below.
In Peru, financial institutions, insurance companies and pension funds are regulated by the Peruvian Banking and Insurance Law. In general, the law provides for loan loss
reserve standards, brings asset risk weighting in line with Basel Committee on Banking Regulations and Supervisory Practices of International Settlements (Basel Committee) guidelines, empowers the SBS to supervise financial holding companies, and
includes specific treatment of a series of recently developed products in the capital markets and derivatives areas.
| (i) |
Peruvian Regulators
|
The Peruvian Central Bank (BCRP)
The BCRP’s primary role is to ensure the stability of the Peruvian monetary system. The BCRP regulates Peru’s money supply, administers international
reserves, issues currency, targets inflation ranges and determines Peru’s balance of payments and other monetary accounts. The BCRP’s Board of Directors develops and oversees monetary policy, establishes reserves requirements for entities within
the financial system and approves guidelines for the management of international reserves. All entities within the Peruvian financial system are required to comply with the decisions of the BCRP.
The monetary policy of the BCRP has been conducted under an inflation-targeting scheme since January 2002. The BCRP seeks to anchor inflation expectations
through the announcement of an inflation target range of 1% to 3% and makes monetary policy decisions by using a reference rate for the interbank market interest rate. Depending on economic conditions, the BCRP changes its reference interest rate
preventively to keep inflation in the target range. Once a month, the Board of Directors approves and announces the monetary program through a policy statement which includes a brief description of the recent macroeconomic evolution, the decision
about the reference interest rate and rationale behind said decision, as well as interest rates for BCRP operations with the financial system.
The BCRP’s recent rate-hiking cycle has increased the reference interest rate from 0.25% in July 2021 to 7.75% in January 2023. The cycle began with a 25bps
hike in August 2021, followed by 12 consecutive hikes of 50bps each, and slowed down to another 5 consecutive hikes of 25bps each. In February 2023, the BCRP decided to keep the reference interest rate stable for the first time after 18 consecutive
months of rate hikes.
The following table summarizes the reference interest rate changes from March 2020 to April 2023:
|
Changes in BCRP's reference interest rate
(March 2020 – February 2023)
|
|
|
No.
|
Date Held
|
|
March 2020
|
1.25%
|
|
April 2020
|
0.25%
|
|
August 2021
|
0.50%
|
|
September 2021
|
1.00%
|
|
October 2021
|
1.50%
|
|
November 2021
|
2.00%
|
|
December 2021
|
2.50%
|
|
January 2022
|
3.00%
|
|
February 2022
|
3.50%
|
|
March 2022
|
4.00%
|
|
April 2022
|
4.50%
|
|
May 2022
|
5.00%
|
|
June 2022
|
5.50%
|
|
July 2022
|
6.00%
|
|
August 2022
|
6.50%
|
|
September 2022
|
6.75%
|
|
October 2022
|
7.00%
|
|
November 2022
|
7.25%
|
|
December 2022
|
7.50%
|
|
January 2023
|
7.75%
|
Additionally, the BCRP is also responsible for managing the liquidity in the financial system so that the interbank rate stays close to the reference rate.
Policy instruments include (i) market instruments, (ii) discount window instruments and (iii) reserve requirements.
| (i) |
Market instruments
|
To remove liquidity from the financial system
BCRP Deposit Certificates (BCRP CD): BCRP CDs are used to regulate the liquidity of the
financial system through the sterilization of banks’ surplus liquidity. They are issued through an auction mechanism for terms of between one month and three years. In January 2023, the aggregate value of
outstanding BCRP CDs was S/13.2 billion.
BCRP Adjustable Deposit Certificates (BCRP CDRs): In addition to sterilizing banks’ surplus liquidity, BCRP CDRs target the reduction of depreciation
pressures on the USDPEN exchange rate as the certificate is readjusted subject to the variation in the exchange rate between the issue date and maturity date. The aggregate outstanding value of BCRP CDRs declined from S/7.8 billion in February 2021
to zero in October 2022. As of February 2023, there are no BCRP CDRs outstanding.
BCRP Deposit Certificates payable in US Dollars (BCRP CDLDs): BCRP CDLDs were created in 2010 to address downward pressures on the
exchange rate related to banks’ forward contracts. Through BCRP CDLDs, the BCRP issues a deposit certificate denominated in Soles but for which payment on the issue date and maturity date is done in US
Dollars. This is equivalent to a temporary purchase of dollars in the spot market sterilized by issuing BCRP CDs. This instrument has been used only twice–first at the end of 2010 and beginning of 2011 and second in 2017. Since March 2018, there
are no BCRP CDLDs outstanding.
BCRP Deposit Certificates at variable rate (BCRP CDVs): The yield of BCRP CDVs is subject to
adjustment based on the reference interest rate or the overnight interbank index, as determined by the BCRP. BCRP CDVs are used to sterilize liquidity in an environment of high uncertainty about future
interest rates that reduces BCRP CD demand. Because of the current macroeconomic scenario of high inflation and high interest rates, the instrument has been used intensively since August 2021. In January
2023, the aggregate value of outstanding BCRP CDVs was S/15.5 billion.
BCRP Term-deposits (BCRP DPs): BCRP DPs were created in 2010 in a context of significant short-term capital inflows to remove liquidity from the
system when it replaced the issuance of BCRP CDs with terms of one month or less with BCRP DPs. In January 2023, the aggregate value of outstanding BCRP DPs was S/6.7 billion.
To inject liquidity into the financial system
Reverse-repo: Through reverse repurchase agreements (repos), the BCRP can buy from financial system entities, with the commitment that those
entities repurchase on an agreed date, all the CDs issued by the BCRP, treasury notes and treasury bonds issued in Soles. This is done through an auction mechanism and the regular terms of these transactions are between one business day and one
week. Since 2008, reverse-repo transactions in US Dollars have been authorized as a way to inject liquidity in US Dollars. In April 2020, pension funds were authorized to participate in these transactions in the case of securities issued by the
Republic of Peru that are registered in CAVALI. In January 2023, the value of outstanding reverse-repos was S/9.4 billion, which is 34.4% less than in September 2022.
Credit-repo transactions: In April 2009, the BCRP was authorized to purchase credit portfolios temporarily represented in securities.
In May 2020, the Peruvian government, through Legislative Decree No. 1508, created a program for the guarantee of credit portfolios of financial entities to provide liquidity support. The size of the
program was S/7 billion and could be expanded up to an additional 20%. Under this framework, in May 2021, through Circular No. 011-2021-BCRP, the BCRP created credit-repo transactions with a government guarantee for liquidity support. The value of outstanding credit-repo transactions in January 2023 was S/6.3 billion.
Government-backed credit repo transactions: Government-backed credit repo transactions were established under the Reactiva Peru Program
framework in April 2020. In these transactions, the entities involved (banks and other financial companies) sell to BCRP securities representatives of credits guaranteed by the Peruvian government,
receive Soles and, at the same time, agree to repurchase those securities at a future date. The BCRP determines the rate it will charge for the funds and the allocation variable is the maximum interest rate that entities are willing to charge for
these guaranteed credits. The BCRP adjudicates the auctioned funds starting with the bids that have the lowest rate. In this way, it encourages lower credit rates that are ultimately determined through market mechanisms. The outstanding value of
government-backed credit Repo transactions reached a peak of S/50.7 billion in December 2020 and has decreased since then to S/16.9 billion in January 2023.
Repo-transactions conditioned on credit portfolio rescheduling: From June 2020 to October 2021, repo transactions conditioned on credit portfolio
rescheduling were established to incentivize financial entities to reduce their loan interest rates. Under this program, the entities sell securities (reverse-repo, foreign exchange swaps and credit-repo) or foreign currency to the BCRP, receive
domestic currency and are obliged, at the same time, to repurchase those securities or foreign currency at a future date, against the payment of Soles. The terms of these transactions ranged from 6 to 48 months and were completed only if the
financial entities rescheduled their clients’ loan portfolios or loans bought from other financial entities in an amount at least of the size the repo transaction. In addition, the BCRP set conditions that included a requirement to set the interest
rate applicable to rescheduled credits at a minimum discount of 200 bps to the original interest rate. The effects of these transactions were reflected in better conditions for debtors in the financial system and aimed at a faster recovery from the
COVID-19 pandemic’s negative shock to the local economy.
Repo-transactions conditioned on long-term credit expansion: Repo transactions conditioned on long-term credit expansion were
established in April 2021 and concluded in December 2021, with the objective of improving the monetary policy transmission channel and continue strengthening the expansion of credit to the private sector. This program worked in a similar way to
the repo transactions conditioned on credit portfolio rescheduling mentioned above, but the completion of these transactions occurred only if financial institutions increased their outstanding amount of corporate loans or mortgages in domestic currencies with terms of at least three years compared to January 1, 2021, levels.
Currency repos: Since March 2007, the BCRP has been allowed to use currency repos to inject liquidity in soles against US Dollar
delivery. Through these transactions, the BCRP temporarily purchases dollars from financial institutions that commit to repurchase them at a future date. Since April 2011, this instrument has also been used to inject liquidity in Dollars. Aggregate outstanding currency repos in January 2023 totaled S/782 million. To accelerate the de-dollarization process, in December 2014, the BCRP established two new types of currency repos: (1) Repo –
Expansion, which would provide liquidity in local currency to financial institutions for an amount up to 20% of such institution’s Total Liabilities Subject to Reserve Requirements (TOSE by its Spanish Initials) in US Dollars, and under no
circumstance could the median reserve requirement for which decrease below 25%; and (2) Repo – Substitution, which would provide local currency to financial institutions at spot foreign exchange prices to finance the re-denomination of their
loans in US Dollars. The outstanding amount of both instruments has been zero 2019.
Interest rate swaps: Interest rate swaps were launched to empower the transmission of monetary policy and incentivize the expansion of long-term
credit. The BCRP can carry out these transactions via auction or direct placements with terms between 3 and 7 years. Through these derivatives, the BCRP assumes the commitment to pay a variable interest rate in exchange for the financial entity's
commitment to pay a fixed interest rate. Thus, the BCRP provides the financial system entities a hedging instrument for future interest rates hikes, which then incentivizes them to make long term loans. The aggregate outstanding amount of these
transactions was S/1.7 billion as of January 31, 2023.
Reduce FX volatility
Buy-sell USD in the spot market: The BCRP intervenes in the exchange rate market at its discretion to reduce PEN volatility. These interventions are
sterilized by other monetary operations to keep the interbank interest rate around the reference level. In 2022, the BCRP sold US$1.2 billion in the spot market, equivalent to 10% of 2021 net sales, with the intervention concentrated in the second
half of 2022. Between January 2023 and mid-February 2023, the BCRP intervened in the spot market once, selling US$1 million.
FX swaps: Foreign exchange swaps were initiated in 2014 to reduce exchange rate volatility generated by pressures in the derivatives market. With an
FX swap sell, the BCRP provides exposure to the exchange rate by committing to pay a fixed rate in foreign currency plus the exchange rate variation, in exchange for receiving an interest rate in domestic currency that can be variable or fixed.
With this transaction, the parties typically exchange only net payments rather than the full nominal amounts. As of December 31, 2022, the BCRP’s stock of FX swaps sell remained stable at approximately S/ 38.1 billion (compared to S/37.8 billion in
2021).
| (ii) |
Discount window instruments
|
Credit for monetary regulation (rediscounts): Rediscounts have the purpose of covering temporary liquidity imbalances of financial institutions. The
financial entity that requests the use of this facility has to provide collateral (BCRP CDs, Treasury notes, Treasury bonds, CDR BCRP, private sector bonds with at least credit rating AA, among others).
Direct reverse-repo: Similar to the reverse-repos and currency-repos explained above, through direct reverse-repos, the BCRP can provide liquidity
that financial entities demand directly, instead of through an auction, and accept a greater range of collateral.
Purchase of Treasury bonds in domestic currency: The objective of this instrument is to reduce the volatility of Treasury bonds caused by
uncertainty in global financial markets and the sales by pension funds due to the withdrawal of pension fund accounts approved by Peru’s congress. The BCRP bought S/3.5 billion of sovereign bonds between November and December 2021, lower than the
legal limit of 5% of the 2021 monetary base (S/4.9 billion).
Overnight deposits: Overnight domestic and foreign currency deposits (deposits repaid the next business day) of financial entities were established
in 1998 and are used to remove the excess liquidity at the end of the day.
| (iii) |
Reserve requirements
|
Under Law No. 26702, banks and financial institutions are required to maintain legal reserve requirements for certain obligations. The BCRP
establishes the reserve requirements that financial entities are required to meet in Peru as a percentage of their obligations in foreign and domestic currency such as demand and time deposits, savings accounts, securities, certain bonds,
and funds administered by banks. Additionally, the BCRP requires reserves on amounts due to foreign banks and other foreign financial institutions. Since January 2011, obligations of foreign subsidiaries and affiliates also have been subject to the
reserve requirement.
In August 2021, through Circular No. 024-2021, the BCRP decided to: (i) establish a marginal reserve rate of 25% of the average obligations during a base period, which
corresponds to July 2021; (ii) establish a minimum media reserve requirement rate of 4%, which rose to 4.25% in October 2021 and to 4.50% in November 2021; and (iii) increase the minimum level of current account deposits that entities subject to
reserve requirements must keep at the BCRP as reserve funds from 0.75% to 1.00% in October 2021.
Additionally, the BCRP increased the minimum legal reserve requirement rate to 4.50% in November 2021, to 4.75% in December 2021 and to 5.00% in January 2022. Later, further
gradual increases were to 5.25% in February 2022, 5.50% in March 2022, 5.75% in April 2022 and 6.0% in May 2022, with the objective of complementing the reference interest rate hiking cycle and have a better control of liquidity.
The reserve requirement is the larger amount between: (i) the rate that results from a marginal reserve rate of 25% over the increase of TOSE with respect to July 2021 and (ii)
the rate that results from applying the minimum legal reserve rate of 6.0% from May 2022. Banks can have excess funds which the BCRP remunerates. By December 2022, the average effective reserve requirement ratio for domestic currency was 6.2%, an
increase from levels around 4% at the beginning of 2021.
Regarding reserve requirements in foreign currency, according to the BCRP, in a context of partial dollarization, this tool has constituted an important support for financial
system liquidity as its rate is higher than the one in domestic currency, due to the greater liquidity risk implied by intermediation in foreign currency. Since July 2018, the marginal rate has been 35%. Furthermore, to reduce credit dollarization,
the BCRP imposes additional US dollar reserve requirements on financial institutions based on limits to the credit balance in US dollars for total credit, as well as mortgage and vehicle loans. This was suspended between April 2020 and April 2021.
Additionally, the reserve rate for obligations with terms less than two years with foreign financial entities stands at 9%. Thus, by December 2022, the average effective reserve requirement ratio for foreign currency was 34.7%.
The Superintendence of Banks, Insurance and Pension Funds (SBS)
The SBS is the regulatory authority in charge of supervising and regulating all financial, insurance and pension fund institutions in Peru. Peru’s constitution and Peruvian
Banking and Insurance Law, which contains the statutory charter of the SBS, grant the SBS the authority to oversee and control banks and financial institutions (apart from brokerage firms, which are regulated by the SMV), insurance and reinsurance
companies, companies that receive deposits from the general public, AFPs and those that carry out activities linked or complementary to the corporate purpose of said companies mentioned in the Peruvian Banking and Insurance Law. The SBS is also
responsible for supervising the BCRP to ensure that it abides by its statutory charter and Byelaws.
The SBS has administrative, financial, and operating autonomy. Its objectives include protecting the public interest, ensuring the financial stability of the institutions over
which it has authority and punishing violators of its regulations. Its responsibilities include: (i) reviewing and approving, with the assistance of the BCRP, the establishment and organization of subsidiaries of the institutions it regulates; (ii)
overseeing mergers, dissolutions and reorganizations of banks, financial institutions and insurance companies; (iii) supervising financial, insurance and related companies from which information on an individual or consolidated basis is required,
through changes in ownership and management control (this supervision also applies to holding companies that are not banks, such as Credicorp); (iv) reviewing the byelaws and amendments to byelaws of these companies; (v) issuing criteria governing
the transfer of bank shares, when permitted by law, for valuation of assets and liabilities and for minimum capital requirements; (vi) controlling the bank’s Risk Assessment Center, to which all banks are legally required to provide information
regarding all businesses and individuals with whom they deal without regard to the amount of credit risk (the information provided is made available to all banks to allow them to monitor individual borrowers’ overall exposure to Peru’s banks), and
(vii) overseeing compliance with the maximum interest rates set by the BCRP. The SBS is also responsible for setting criteria for the establishment of financial or mixed conglomerates in Peru and for supervising these entities. As a result, in
addition to its supervision of BCP Stand-alone, Mibanco, Grupo Pacífico and Prima AFP, the SBS also supervises Credicorp Ltd. because Credicorp Ltd. is a financial conglomerate conducting most of its operations in Peru.
The Superintendence of the Securities Market (SMV)
The SMV is the Peruvian government institution in charge of: (i) promoting the securities markets, (ii) making sure fair competition takes place in the securities markets, (iii)
supervising the management of businesses that trade in the securities markets, and (iv) regulating such businesses’ activities and accounting practices. The SMV enjoys functional, administrative, economic, technical, and budgetary autonomy relative
to other branches of the Peruvian government. Financial institutions such as banks, insurance companies, pension funds and brokerage firms must inform the SMV of significant events that affect their business and are required to provide financial
statements to both the SMV and the BVL each quarter. Those institutions are also regulated by the SMV when they conduct operations in the local Peruvian securities market.
National Institute for the Defense of Competition and the Protection of Intellectual Property (INDECOPI)
INDECOPI regulates the protection of the consumer rights set forth in Law No. 29571, Código de Protección y Defensa del Consumidor (the “Consumer Protection and Defense Code”),
which applies to all transactions that have effects within the Peruvian territory. INDECOPI has the power to impose fines on us if we do not comply with the laws and regulations regarding protection of consumer rights.
National Authority for the Protection of Personal Data (ANPDP)
The ANPDP regulates and oversees compliance with the provisions of Law No. 29733, Ley de Protección de Datos Personales (Personal Data Protection Law) and its regulations, which
apply even to companies domiciled abroad, to the extent that they collect personal data from Peruvian users through media located within Peruvian territory. The ANPDP has the authority to impose fines on us if we violate the laws and regulations
regarding data privacy.
| (ii) |
Supervised Institutions
|
Under Peruvian law, financial institutions are classified as universal banks, insurance companies, pension funds, finance companies and other financial institutions such as
small business finance companies, savings and loan corporations, financial services companies, investment banks, mutual housing associations, municipal savings and credit associations and savings and credit cooperatives.
Financial institutions must obtain the SBS’s authorization before beginning operations. BCP Stand-alone and Mibanco are each classified as a universal bank, Grupo Pacífico is
classified as an insurance company, and Prima AFP is classified as a pension fund company.
Universal Banks
A universal bank, or bank, is defined by the Peruvian Banking and Insurance Law as an enterprise whose principal business consists of (i) receiving money from the public,
whether by deposits or by any other form of contract, and (ii) using such money (together with the bank’s own capital and funds obtained from other sources) to grant loans or discount documents, or in operations that are subject to market risks.
Banks are permitted to carry out various types of financial operations, including the following:
| • |
receiving demand deposits, time deposits, savings deposits, and deposits in trust;
|
| • |
granting direct loans;
|
| • |
discounting or advancing funds against bills of exchange, promissory notes, and other credit instruments;
|
| • |
granting mortgage loans and accepting bills of exchange in connection with the mortgage loans;
|
| • |
granting conditional and unconditional guarantees;
|
| • |
issuing, confirming, receiving, and discounting letters of credit;
|
| • |
acquiring and discounting certificates of deposit, warehouse receipts, bills of exchange and invoices of commercial transactions;
|
| • |
performing credit operations with local and foreign banks, as well as making deposits in those institutions;
|
| • |
issuing and placing local currency and foreign currency bonds, as well as promissory notes and negotiable certificates of deposits;
|
| • |
issuing certificates in foreign currency and entering into foreign exchange transactions;
|
| • |
purchasing banks and non-Peruvian institutions that conduct financial intermediation or securities exchange transactions in order to maintain an international presence;
|
| • |
purchasing, holding, and selling gold and silver, as well as stocks and bonds listed on one of the Peruvian stock exchanges and issued by companies incorporated in Peru;
|
| • |
acting as financial agent for investments in Peru for external parties;
|
| • |
purchasing, holding, and selling instruments evidencing public debt, whether internal or external, as well as obligations of the BCRP;
|
| • |
making collections, payments, and transfers of funds;
|
| • |
receiving securities and other assets in trust and leasing safety deposit boxes; and
|
| • |
issuing and administering credit cards and accepting and performing trust functions.
|
In addition, banks may carry out financial leasing operations by forming separate departments or subsidiaries. Banks may also promote and direct operations in foreign commerce,
underwrite initial public offerings, and provide financial advisory services apart from the administration of their clients’ investment portfolios. By forming a separate department within the bank, a bank may also act as a trustee for trust
agreements.
Under Peruvian law, universal banks may conduct brokerage operations and administer mutual funds but must do so through subsidiaries. However, universal bank employees may
market the financial products of the bank’s brokerage and mutual fund subsidiaries. Banks are prohibited from issuing insurance policies but are not prohibited from distributing insurance policies issued by insurance companies.
Peruvian branches of foreign banks enjoy the same rights and are subject to the same obligations as Peruvian universal banks. Multinational banks, with operations in various
countries, may perform the same activities as universal Peruvian banks, although their foreign activities are not subject to Peruvian regulations. To carry out banking operations in local Peruvian markets, multinational banks must maintain capital
in Peru of at least the minimum amount that is required for Peruvian banks. For more information about banks’ capital requirements, please see “ITEM 4. INFORMATION ON THE COMPANY – (6) Supervision and regulation – (i) Peruvian Commercial Banks
Regulation - BCP Stand-alone and Mibanco – Capital adequacy requirements and ITEM 5. OPERATING AND FINANCIAL REVIEW AND PROSPECTS – 5.B Liquidity and Capital Resources.”
Those universal banks who violate the Peruvian Banking and Insurance Law and its underlying regulations may be subject to administrative sanctions and criminal penalties.
Additionally, the SBS and the BCRP have the authority to issue fines to financial institutions and their directors and officers if they violate the laws or regulations of Peru, or their own institutions’ byelaws.
Insurance companies
Since the Peruvian insurance industry was deregulated in 1991, insurance companies have been authorized to conduct all types of operations and to enter into all forms of
agreements that are needed to offer risk coverage to customers. Insurance companies may also invest in financial and non-financial assets in order to maintain liquidity and capital requirements to pay their clients when claim occurs.
Peru’s law No. 26702 and Law No. 29946, Ley del contrato de Seguro (the “Peruvian Insurance Contract Law”), which are discussed below,
are the main laws governing insurance companies and insurance in Peru. The SBS is the government agency charged with the supervision and regulation of all insurance companies. The incorporation of an insurance company requires prior authorization
of the SBS. Also, the SMV supervises and regulates insurance companies through Peru’s Law No. 26126 and its amendments.
On May 27, 2013, Insurance Law No. 29946 became effective. Law No. 29946 governs all insurance contracts, except for those that are expressly governed by other regulations. It
substantially changes how insurance policies are offered by insurance companies, regulates the information provided by the insured and includes changes to termination and arbitration clauses included in insurance contracts. Law No. 29946 also
provides a list of terms and conditions that cannot be included in any insurance contract and ensures that any changes in the contract can only be made if 45 days’ notice is given to the policyholder prior to renewal of the policy. Other measures
include restrictions on the duration and renewal of contracts, consumer protection rules, and regulations governing how to address non-payment of premium installments required under insurance contracts.
In September 2013, the SBS established a tender process for the exclusive right to manage collective insurance policy for D&S and burial expenses of the PPS as part of its
reform.
Peruvian insurance companies must submit regular reports to the SBS concerning their operations. In addition, the SBS conducts on-site reviews on an annual basis, primarily to
evaluate compliance with solvency margin, reserve and investment requirements and rules governing the recognition of premium income. If the SBS determines that a company is unable to meet the solvency margin or technical reserve requirements or is
unable to pay claims as they become due, it may either liquidate the company or permit it to merge with another insurance company.
Under Peruvian law, insurance companies may engage in certain credit risk operations, such as guarantees, bonds, and trusteeships, but are prohibited from offering other banking
services, operating mutual funds, or offering portfolio management services. In addition, insurance companies may not conduct brokerage operations for third parties.
Peruvian insurance companies are also prohibited by an SBS resolution (SBS Resolution No. 3930-2017) from having an ownership interest in other insurance or reinsurance
companies of the same class unless such risks are offset by insurance companies acting as subsidiaries and that risk is withdrawn from the principal insurance company’s activities. This resolution also prohibits Peruvian insurance companies from
having an ownership interest in private pension funds.
Peruvian law establishes certain minimum capital requirements for insurance and reinsurance companies, which must be satisfied by cash investments in the company.
Pension Funds
The operations of pensions funds in Peru are regulated by the Unified Text of the Private System for the Administration of Fund Act, approved by Supreme Decree No. 054-97-EF,
and modified by Law No. 29903, which has been in force in Peru since August 2013.
Under Peruvian legislation, AFPs must have only one business activity: managing pension funds through individual capitalization accounts, sourced by mandatory and/ or voluntary
contributions. AFPs must also provide benefits for retirement, disability, and survivorship and finance funeral expenses.
Finance companies
Under the Peruvian Banking and Insurance Law, finance companies are authorized to carry out the same operations as banks, except for (i) issuing loans as overdrafts in checking
accounts and (ii) participating in derivative operations. These operations can be carried out by finance companies only if they fulfill the requirements stated by the SBS.
Other financial institutions
The Peruvian financial system has a number of less significant entities that may provide credit, accept deposits, or otherwise act as financial intermediaries on a limited
basis. Leasing companies specialize in financial leasing operations where goods are leased over the term of the contract and in which one party has the option of purchasing the goods at a predetermined price. Savings and loans associations or
cooperatives may accept certain types of savings deposits and provide other similar financial services.
Peru also has numerous mutual housing associations, municipal savings and credit associations, savings and credit cooperatives and municipal credit bureaus. Over the past seven
years, the entry of new participants, including foreign banks and non-bank financial institutions, has increased the level of competition in Peru.
| (iii) |
Peruvian Commercial Banks Regulation - BCP Stand-alone and Mibanco
|
Management of operational risk requirements
SBS Resolution No. 37-2008, Reglamento de la Gestión Integral de Riesgos (Risk Management Regulation), which had set forth the guidelines for enterprise risk management, was
replaced by SBS Resolution No. 272-2017, Reglamento de Gobierno Corporativo y de la Gestión Integral de Riesgos (the “Corporate Governance and Risk Management Regulation”), which introduced the following guidelines regarding risk management:
| a. |
Risk management must consider the macroeconomic environment that affects the markets in which the company operates;
|
| b. |
New types of risk were incorporated in the regulation: (a) money laundering and terrorist financing risk, defined as the possibility of the company being used for money laundering and terrorist financing purposes; and (b) reinsurance
risk, defined as the possibility of losses caused by the insufficiency of reinsurance coverage contracted by the assigning insurance company; and,
|
| c. |
Liquidity may be understood as the possibility of losses due to anticipated or forced sale of assets at unusual discounts for the company to meet its obligations, as well as not being able to close open positions or cover positions in
sufficient quantity. Before this modification, it was understood as the possibility of losses caused by the failure to comply with the financing requirements and the application of funds arising from the mismatches of cash flows
requirements.
|
In addition, the Corporate Governance and Risk Management Regulation provides that companies must incorporate a centralized unit or units specialized in specific risk
management. Under the previous regulation, this was optional. The SBS may require companies to create specialized risk units if considered necessary. Under the previous regulation, if the company did not have a specialized risk unit, it was
understood that these functions had been assigned to the CEO. With the new regulation, this provision has been eliminated.
Companies must submit their annual risk reports to the SBS within 90 days from the end of each year.
Credicorp, following these SBS requirements, as well as the guidelines issued by the Basel Committee and the advice of international consultants, has appointed a specialized
team responsible for operational risk management across our organization. This team reports regularly to our risk committee, top managers, and the Board of Directors.
In evaluating operational risks and potential consequences, we mainly assess risks related to critical processes, critical suppliers, critical information assets, technological
components, new products and significant changes to our services and channels. To support the operational risk management process, we have developed a Business Continuity Management (BCM) discipline, which involves the implementation of continuity
plans for critical business processes, incident management, and training and testing. In addition, our methodology and data processing team has developed procedures to register, collect, analyze, and report operational risk losses, using advanced
models for operational risk capital allocation. We also have monitoring and reporting procedures that are designed to monitor KRIs and other performance metrics.
We intend to be guided by the risk control standards of international financial institutions that are noted for their leadership in this field. Our overall objective is to
implement an efficient and permanent monitoring system to control operational risks, while training our operational units to mitigate risks directly.
Pursuant to Section 404 of the U.S. Sarbanes-Oxley Act of 2002, we are required to make certain certifications regarding our internal controls over financial reporting. We have
developed internal methods to identify and evaluate risk and controls over our critical processes to determinate how effective internal controls are over financial reporting using the Committee of Sponsoring Organizations of the Treadway Commission
(COSO) 2013 Internal Control Framework.
Capital adequacy requirements
Capital adequacy requirements applicable to us are set forth in Peru’s Law No. 26702 and Legislative Decree No. 1028. Legislative Decree No. 1028 was aimed at adapting Law No.
26702 to the capital guidelines and standards established by the second Basel Committee Accord (Basel II). Capital adequacy requirements are also included in Peruvian GAAP guidelines. Pursuant to Basel II guidelines, financial institutions are
required to hold regulatory capital that is greater than or equal to the sum of (i) 10% of credit RWAs, and (ii) 10 times the amount required to cover market and operational risks.
Since July 2009, Peruvian financial institutions generally have applied a standardized approach to calculate their capital requirements related to credit, market, and
operational risk. As an alternative to the standardized approach, financial institutions may request authorization from the SBS to use different models for calculating the reserve amount associated with any of these three risks. In July 2009, the
SBS started accepting applications to use alternative models, referred to as Internal Models Methods. If the amount of an institution’s reserve requirements would be higher using the standard model than it would be using the approved Internal
Models Method, then the institution will have to maintain between 80% and 95% of the standard amount during a phase-in period. Even after the phase-in period, institutions using an Internal Models Method are subject to regulatory capital floors.
On July 20, 2011, the SBS issued SBS Resolution No. 8425-2011, establishing the methodologies and the implementation schedule of additional capital requirements consistent with
certain aspects of the Basel International Regulatory Framework for Banks (Basel III), which is a comprehensive set of reform measures and guidelines, followed by the SBS, to strengthen the regulation, supervision, and risk management of the
banking sector. The additional capital requirements include requirements to cover concentration, excessive interest rate risk in the banking book and systemically important risk. Additionally, pro-cyclical capital requirements were established.
These additional requirements were fully implemented in July 2016.
SBS Resolution No. 8548-2012, adopted in 2012, modified the regulatory capital requirements for credit RWAs in SBS Resolution No. 14354-2009 and established a schedule for
implementing the modifications.
On February 24, 2016, the SBS issued Resolution 975-2016 (the “Subordinated Debt Regulation”), which aims to improve the quality of banks’ total regulatory capital and align
Peruvian regulation towards Basel III, by modifying:
| • |
The characteristics that subordinated debt must meet to be considered in the calculation of total regulatory capital; and
|
| • |
The calculation of RWAs.
|
Under the Subordinated Debt Regulation, subordinated debt issued prior to the regulation that did not meet the requirements was to be recognized as total regulatory capital,
according to the following:
| • |
Tier 1 subordinated debt: as of January 2017, and for 10 years following, Tier 1 subordinated debt is subject to a 10% discount. However, the amount not computable as Tier 1 regulatory capital may be computed as a Tier 2 instrument if it
has a residual maturity equal to or greater than 15 years.
|
| • |
In November 2019, BCP Stand-alone redeemed the total amount of its Tier 1 subordinated debt issuance (issued in 2009) totaling US$250 million. Thus, as of December 2019, neither Tier 1 nor Tier 2 of BCP’s regulatory capital was comprised
of non-compliant Tier 1 subordinated debt.
|
| • |
Tier 2 subordinated debt: during the five years prior to maturity, the principal balance will be discounted by 20%. In the year prior to its maturity, the Tier 2 subordinated debt will not be considered in the calculation of Tier 2. This
treatment did not change compared to previous regulation. As a result, Tier 2 Subordinated debt issued previous to the rule was grandfathered.
|
In addition, the Subordinated Debt Regulation also included changes to the calculation of RWAs of the following accounting items:
| • |
Intangibles (excluding goodwill);
|
| • |
Deferred tax assets (DTAs) that are originated by operating losses; and
|
| • |
DTAs that are associated with temporary differences and that exceed the threshold of 10% of the “adjusted total capital”. In each case, DTAs are to be net of deferred income tax liabilities.
|
These assets will experience a gradual increase in their risk weights (until they reach a maximum of 1,000% in 2026) to replicate the deductions established by Basel III. The
RWAs calculated based on these risk weights will be used exclusively for calculating the Basel III ratios.
SBS Resolution No. 4280-2018, adopted in October 2018, modified the risk weight applied to intangibles (excluding goodwill) to speed up the increase in this risk weight towards
100%, with the purpose of closing the regulatory gap with Basel III guidelines, which clearly require intangibles to be fully deducted from core capital measurements.
In March 2020, as the scale of the global COVID-19-induced economic shock became apparent, the SBS passed Resolution 1264-2020, which suspended the countercyclical capital
requirements for the banking system, unlocking a significant capital buffer for local banks, which was built during the last several years, in order to prevent a credit contraction.
Furthermore, in April 2020, the Ministry of Finance and the BCRP engineered and launched a large credit-enhancement program, Reactiva Peru, in response to the economic crisis,
which comprised government guarantees for a broad range of loans to local enterprises. This program successfully promoted the expansion of credit to local enterprises in 2020 without consuming significant capital requirements to local banks.
As some of the restrictions and consequences due to COVID-19 continued in early 2021, Presidential Urgent Decree No. 037-2021 was approved in March 2021. The minimum global
capital ratio, which is the minimum requirement mandated by the regulator, was temporarily reduced from 10% to 8%. This gave an additional buffer to financial institutions until the economic outlook start presenting stronger signs of improvement.
The same decree ordered the minimum global capital ratio to be lifted back to 10% in March 2022.
In December 2021, the SBS issued Resolution 3718-2021, modifying cyclical provisions from Resolution 11356-2008 and, as an extension, the activation of the countercyclical
capital buffer. Among the main changes were decreasing the threshold for the activation of the countercyclical rule from 5% to 4% for the average of annualized percentage change in GDP for the last 30 months and the minimum rates for the cyclical
provision component. The countercyclical capital buffer cannot be activated before January 1, 2024.
Additionally, in December 2021, the SBS adopted Resolution 3921-2021, which adds capital rules regarding the domestic systemically important capital requirement, which is a
requirement similar to the D-SIB under Basel III where an additional requirement is calculated based on the relative size of the bank within the local financial system. This additional requirement affects both BCP Stand-alone and Mibanco by
increasing Credicorp’s regulatory capital requirement. The changes have a transition phase of two years, with 75% of the additional requirements taking effect in December 2022 and the full requirement to become effective in December 2023.
Also, in the same decree, the temporarily reduction of the minimum global capital ratio was extended and is contemplated to be raised again to 8.5% beginning September 2022,
9.0% beginning March 2023, 9.5% beginning September 2023 and finally back to 10% in March 2024.
Regulatory capital from January 2023.
In March 2022, Legislative Decree 1531 was passed by the Government, revising the regulatory capital definition rules in Banking Law 26702. Changes were aimed at better
compliance with the standards established by Basel III. The new regulatory capital framework defines three minimum requirement limits: CET1 at 4.5%, Tier 1 Capital at 6.0% and total regulatory capital at 10%. The definitions of capital buffers are
expected to be revised in a forthcoming regulation. Although the main changes made by Legislative Decree 1531 are effective as of January 2023, the SBS has not yet enacted regulations related to the implementation of the law.
Among other changes, Legislative Decree 1531 changed the definition of regulatory capital to the following:
Regulatory Tier 1 Capital is composed by Common Equity Tier 1 (CET1) and Additional Tier 1 (AT1) capital:
CET 1:
a) Common shares and other capital instruments, as long as they have been paid and comply with the conditions indicated by the SBS;
b) Issue premium of common shares and other capital instruments indicated in subparagraph a);
c) Earnings from prior years and from the year in progress, in accordance with the provisions of the SBS;
d) Unrealized gains, as designated by the SBS;
e) Legal reserves and optional reserves;
f) Donations that meet the conditions designated by the SBS;
g) Other elements defined by the SBS by means of a general rule; and
h) Regulatory adjustments that include the following deductions:
i. Losses from prior years and from the current year;
ii. Unrealized losses, as allowed by the SBS;
iii. Shortfall in provisions determined by the SBS;
iv. Goodwill, resulting from reorganizations or acquisitions;
v. Intangible assets, other than those indicated in item iv;
vi. Deferred income tax assets originated due to carryover losses;
vii. Deferred income tax assets, net of deferred income tax liabilities, originated due to temporary differences that exceed the threshold established by the SBS;
viii. Investments in equity instruments computable in common equity tier 1, issued by companies in the financial or insurance system, in Peru or abroad; and
ix. Others defined in Legislative Decree 1531.
Additional Tier 1 Capital:
a) Equity instruments and subordinated debt that meet the conditions indicated by the SBS (with subordinated debt instruments required to comply with the provisions of article
233 of Legislative Decree 1531.
b) Share premium of capital instruments indicated in item a);
c) Other elements defined by the Superintendency by means of a general rule; and
d) Regulatory adjustments that include the following Deductions from Additional Tier 1 Capital:
i. Direct or indirect holding of instruments of capital and/or subordinated debt computable in the Additional Tier 1 capital, which have been issued by the company itself and
that are kept in the treasury. Also includes owned computable instruments in Additional Tier 1 capital for which there is a present or contingent obligation to acquire them by virtue of contractual obligations;
ii. Investments in equity and/or subordinated debt instruments computable in Additional Tier 1 Capital issued by companies in the financial or insurance system, in Peru or
abroad.
iii. Equity instruments and subordinated debt eligible for Additional Tier 1 Capital, issued by companies with which a company consolidates financial statements, including
certain holding companies and subsidiaries, in accordance with rules established by the SBS;
iv. The amount of the items that must be deducted from Tier 2 effective equity that exceed the limit of such effective level 2 assets; and
v. Other deductions determined by the SBS through a general regulation.
Regulatory Tier 2 Capital, which includes the following elements:
a) Equity instruments and subordinated debt, not included in the Regulatory Tier 1 Capital, which meet the conditions indicated by the SBS (with subordinated debt instruments
required to comply with the provisions of article 233 of Legislative Decree 1531);
b) Share premium of capital instruments indicated in item a);
c) For banks using the SBS standardized approach method, the generic loan loss provision up to 1.25% of credit RWAs; or, alternatively, for banks using the internal ratings-based
(IRB) method, the generic loan loss provision up to 0.6% of total credit RWAs (pursuant to Article 189 of Law No. 26702);
d) Other elements defined by the SBS by means of a general rule; and
e) Regulatory adjustments that include the following Tier 2 net worth deductions:
i. Direct or indirect holding of instruments of capital and/or subordinated debt computable as part of Regulatory Tier 2 Capital, which have been issued by the company itself
and that are kept in the treasury. This includes owned computable instruments in the Tier 2 capital for which there is a present or contingent obligation to acquire them by virtue of contractual obligations;
ii. Investments in equity and/or debt instruments computable in the Regulatory Tier 2 Capital, issued by companies in the financial or insurance system, in Peru or abroad;
iii. Equity instruments and subordinated debt computable in Regulatory Tier 2 Capital, issued by companies with which a company consolidates financial statements, including
holding companies and subsidiaries including certain holding companies and subsidiaries, in accordance with rules established by the SBS; and
iv. Other deductions determined by the SBS through a general regulation.
Legislative Decree 1531 also provides that the following limits apply when calculating regulatory capital:
1. Additional Tier 1 Capital must not exceed one-third of Common Equity Tier 1 Capital. The excess above said limit can be including certain holding companies as Regulatory Tier 2 Capital.
2. Regulatory Tier 2 Capital should not be greater than two-thirds of the Regulatory Tier 1 Capital. The excess over said limit is not computable in total regulatory capital.
Internal Common Equity Tier 1 (CET1)
In November 2013, BCP Stand-alone’ s Board of Directors decided to track the Basel III ratio known as CET1. CET1 comprises:
| • |
paid-in-capital (which includes common stock and perpetual non-cumulative preferred stock);
|
| • |
legal and other capital reserves;
|
| • |
accumulated earnings;
|
| • |
unrealized profits (losses);
|
| • |
deficits of loan loss provisions;
|
| • |
intangibles;
|
| • |
net deferred taxes that rely on future profitability;
|
| • |
goodwill resulting from corporate reorganizations or acquisitions; and
|
| • |
100% of the amount referred to in “Deductions” above.
|
In December 2022, the pending resolutions referred to in the amendments to the Banking Law 26702 – established by Legislative Decree 1531 on March 2022 – were published (SBS
N°03950-2022, SBS N°03951-2022, No. 03952-2022, No. 03953-2022, No. 03954-2022, and No. 03955-2022). Below we highlight the main changes defined in this set of resolutions:
| • |
SBS Resolution No. 03952-2022 ordered the minimum total regulatory capital ratio to be gradually raised back to 10% from 8% under the following schedule: in September 2022 to 8.5%, in March 2023 to 9%, in September 2023 to 9.5% and in
March 2024 to 10%.
|
| • |
SBS Resolution No. 03954-2022 defined capital requirement buffers: conservation buffer, domestic systemically importance buffer and countercyclical buffer.
|
| o |
The conservation buffer was first introduced in local regulation. This buffer requires maintaining an additional capital of 2.5% of RWAs and it should be covered by CET1 capital. This requirement will have a transition phase of four
years until December 2026.
|
| o |
Domestic systemically important capital requirement and countercyclical capital requirements (when activated) should be covered with CET1 capital.
|
| • |
SBS Resolution No. 03953-2022 defined additional capital requirements. These requirements were maintained from previous regulation and should be covered with Regulatory Tier 2 Capital.
|
| • |
SBS Resolution No. 03950-2022 defined the new subordinated debt regulation. No material changes were introduced compared to the previous regulation (SBS Resolution No. 975-2016).
|
CET1 Internal Targets
In October 2018, BCP Stand-alone’s Risk Committee approved an increase in CET1 ratio limits for BCP Stand-alone and Mibanco, targeting them at 11% and 15%, respectively. These
limits are part of their risk appetite framework. BCP Stand-alone’s CET1 ratio is estimated based on BCP Stand-alone’s understanding, expectations and interpretation of the proposed Basel III requirements in Peru.
From January 21, 2022, the Risk Committee has decided to start monitoring the CET1 with IFRS balances, not local ones.
Surveillance, intervention and liquidation
The bankruptcy of financial institutions in Peru is regulated by the Peruvian Banking and Insurance Law and the rules and regulations enacted thereunder, including SBS
Resolution No. 0455-99, Reglamento de los Regímenes Especiales de la Liquidación de las Empresas del Sistema Financiero y del Sistema de Seguros (the Banking Intervention and Liquidation Regulations).
Pursuant to the Peruvian Banking and Insurance Law, the SBS has the authority to seize the operations and assets of a bank. Under such regulations, prior to being liquidated and
dissolved, banks undergo two separate and distinct stages: (i) a surveillance period (régimen de vigilancia) and (ii) an intervention period (intervención).The SBS will submit a bank to a surveillance or intervention regime if certain events occur,
such as if the bank: (i) interrupts payments on its liabilities, (ii) repeatedly fails to comply with the regulations of the SBS or the BCRP, (iii) repeatedly violates the law or the provisions of the bank’s bylaws, (iv) repeatedly manages its
operations in an unauthorized or unsound manner or (v) has its regulatory capital fall or be reduced by more than 50%.
The SBS may initiate surveillance of a financial institution when the financial institution breaches certain material obligations, or the overall financial stability of the
institution becomes at risk. Surveillance could last for a period of up to 45 days, which may be renewable once for the same period of time. Within seven business days from the date on which the surveillance is commenced by the SBS against a
financial institution, the institution must propose a recovery plan that, if approved by the SBS, should be expected to bring the financial institution to financial stability.
To the extent that a financial institution subject to surveillance by the SBS breaches the recovery plan approved by the SBS or otherwise becomes subject to intervention, the
SBS must issue a public resolution stating that such financial institution has been intervened by the SBS.
Upon the publication of the SBS intervention resolution, the financial institution is subject to an automatic stay, protecting the assets of the intervened company, which is no
longer allowed to operate and the SBS is granted the ability to administer and dispose of part or all of the assets and liabilities of such company. Hence, the following actions are temporarily suspended: (i) collection of debts (judicially or
administratively), (ii) execution of any judicial order, (iii) creation of liens, and (iv) making payments, advances, or offsetting debts; although statute regulates some specific cases where offsetting is admitted during the stay.
During the intervention regime, rather than seizing the operations and assets of a bank, the SBS may adopt other measures, including (i) placing additional requirements on the
bank, (ii) ordering it to increase its capital stock or divest certain or all of its assets, or (iii) imposing a special supervision regime during which the bank must adhere to a financial restructuring plan.
The SBS intervention regime stops a bank’s operations for up to 45 days, which may be extended once for an additional 45-day period of time. During this time, the SBS may
institute measures such as: (i) canceling losses by reducing reserves, capital, and subordinated debt, (ii) segregating certain assets and liabilities for transfer to another financial institution, and (iii) merging the intervened bank with an
acquiring institution according to the program established by Presidential Urgent Decree No. 108-2000. After the intervention, the financial institution typically undergoes liquidation and is dissolved unless it is merged with an acquiring
institution, as described in clause (iii) above.
Once the dissolution of the financial institution is declared by resolution issued by the SBS, the settlement process begins and all payments are made in accordance with the
payments priority provided in the Peruvian Banking and Insurance Law: (a) wages and social benefits of the bank’s employees, (b) return of saving deposits (the portion not covered by the Deposit Insurance Fund), (c) tax obligations, and (d) the
rest of the obligations under general rules of payment.
Liens created against bank’s assets survive the dissolution, but the following rules apply:
| 1. |
Each encumbered asset is sold separately;
|
| 2. |
The proceeds of the sales are deposited separately from the rest of the bank’s assets to preferentially pay the secured obligations;
|
| 3. |
If the wages and social benefits of the bank’s employees are fully paid with the rest of the company’s assets, the proceeds described in clause (2) above are used to pay the secured obligations. Otherwise,
they are used to complete such payments, reducing pro-rata the amount available for payment of secured obligations;
|
| 4. |
If the secured obligations are fully paid and there is an excess from the proceeds described in clause (2) above, the balance is added to the rest of the bank’s assets; and
|
| 5. |
If the secured obligations are not fully paid, the unpaid balance is treated as an unsecured obligation and may be collected, if possible, against the rest of the bank’s assets.
|
Legal reserve requirements
In accordance with Peruvian regulation (article 67 of Law No. 26702), a reserve of up to at least 35% of paid-in capital of the Group’s subsidiaries operating in Peru is
required to be established through annual transfers of at least 10% of their net profit.
Lending activities requirements
Law No. 26702 sets the maximum amount of credit that a financial institution may extend to a single borrower, whether the borrower is an individual or an economic group. SBS
Resolution No. 5780-2015 establishes that an “economic group” is one that has a single or common risk exposure and includes a person, such person’s close relatives and the companies in which such person or his or her close relatives have
significant share ownership or decision-making capability. Significant decision-making capability is deemed to be present when, among other factors, a person or group can exercise material and continuous influence over the decisions of a company,
when a person or company holds seats on the Board of Directors or has principal officers in another company, or when it can be assumed that one company or person is the beneficiary of credit facilities granted to another company.
The limit on credit that may be extended to any single borrower varies according to the type of borrower and the collateral received. The credit limit for any Peruvian borrower
is 10% of a bank’s regulatory capital, applied to both unconsolidated and consolidated records, which may be increased to up to 30% if the loan is collateralized in a manner acceptable under Law No. 26702. If a financial institution exceeds these
limits, the SBS may impose a fine on the institution. As of December 31, 2020, 2021 and 2022, the 10.0% unconsolidated credit limit per borrower of BCP Stand-alone for unsecured loans was S/1,940.8 million, S/2,121.0 million, S/2,277.2 million and
S/2,336.4 million, respectively. As of December 31, 2020, 2021 and 2022, the 30.0% credit limit for secured loans was S/6,363.1 million and S/6,831.6 million and S/7,009.3 million, respectively.
Effective since April 2021, the BCRP, pursuant to article 52 of its Organic Law, established caps on interest rates that could be charged by commercial banks and other financial
institutions for SME and personal loans. In the case of Banco de Crédito del Peru, the application of these caps only had a marginal impact on consumer loans.
In addition, according to SBS Resolution No. 6941-2008, as amended, banks and other financial entities must adopt a system to manage the risk of over-indebtedness that (a)
allows the mitigation of such risk before and after making the loan, (b) permits permanent monitoring of the portfolio to identify over-indebted borrowers and (c) includes the periodic evaluation of the control mechanisms being used and corrective
actions or required improvements, as the case may be.
Interest rates caps
On March 18, 2021, the Usury Law Regulation was enacted. It establishes, among other provisions, that the BCRP has the power to set caps on active interest rates of the
financial system for consumer credits, low amount consumer credits (less than 2 Tax Units) and credits to micro and small enterprises (Micro y Pequeña Empresas or Mype by their Spanish initials). Through Circular No. 0008-2021-BCRP of April 2021,
the BCRP determined that this interest rate cap is equivalent to twice the average interest rate for consumer loans in the financial system.
The interest rate cap will be calculated semi-annual based on the interest rates of consumption loans in the financial system between two and seven months prior to its validity.
For the period between November 2022 and April 2023, the annual interest rate cap stands at 87.91% in domestic currency and 68.27% in foreign currency.
Portfolio classification requirement
In order to comply with the SBS regulation, we have a loan portfolio classified in accordance with SBS Resolution No. 11356-2008 and it was amended as of July 1, 2010. For this
reason, a bank's portfolio is classified into eight different categories: corporate, large companies, medium-sized companies, small companies, micro-companies. Commercial, consumer revolving, non-renewable consumer, and residential mortgage loans.
Related party transactions requirements
The Peruvian Banking and Insurance Law regulates transactions between financial institutions on the one hand and related parties or affiliates on the other. The SBS and the SMV
have also enacted regulations that define indirect ownership, related parties, and economic groups, in order to limit transactions with related parties and affiliates. These regulations also provide standards for the supervision of financial and
mixed conglomerates formed by financial institutions.
The total amount of loans to directors, employees, or close relatives of any such persons may not exceed 7% of a bank’s regulatory capital. All loans made to any single director
or employee borrower, considering his or her close relatives, may not exceed 0.35% of regulatory capital (that is, 5% of the overall 7% limit).
Pursuant to the Peruvian Banking and Insurance Law, the aggregate amount of loans to related party borrowers considered to be part of an economic group (as defined above) may
not exceed 30% of a bank’s regulatory capital. For purposes of this test, related party borrowers include (i) any person holding, directly or indirectly, 4% or more of a bank’s shares, (ii) directors, (iii) certain principal executive officers of a
bank, and (iv) people affiliated with the administrators of the bank. Loans to individual related party borrowers are also subject to the limits on lending to a single borrower described under “ITEM 4. INFORMATION ON THE COMPANY – 4.B Business
Overview – (6) Supervision and Regulation – 6.2 Subsidiaries – 6.2.1 Peru”. All loans to related parties must be made on terms no more favorable than the best terms that BCP Stand-alone or Mibanco offers to the public.
Ownership restrictions
The Peruvian Banking and Insurance Law establishes certain restrictions on the ownership of a bank’s shares. Banks must have a minimum of two shareholders. Among other
restrictions, those convicted of drug trafficking, money laundering, terrorism, or other felonies, and those who are directors, employees or advisors of public entities that regulate and supervise the activities of banks, are subject to ownership
limitations. All transfers of shares in a bank must be recorded at the SBS. Transfers involving the acquisition by any individual or corporation, whether directly or indirectly, of more than 10% of a bank’s capital stock require prior authorization
from the SBS. The SBS may deny authorization to such transfer of shares if the purchasers (or their shareholders, directors, or employees, in the case of juridical persons) are legally disabled or have engaged in illegal activity in the area of
banking, finance, insurance or reinsurance, or if objections are raised on the basis of the purchaser’s moral fitness or economic solvency, among other reasons. The decision of the SBS on such matters is final and cannot be overturned by the
courts. If a transfer is made without obtaining the prior approval of the SBS, the purchaser shall be fined with an amount equivalent to the value of the transferred shares and is obligated to sell the shares within 30 days, or the fine is doubled.
In addition, the purchaser is not allowed to exercise its voting rights at the shareholders’ meetings. Foreign investors receive the same treatment as Peruvian nationals under the limitations described above.
Additionally, the Merger Control Law, which entered into force on June 14, 2021, provides that any transaction that causes ownerships to cross the threshold set by such law and
can result in action in concert, must have the authorization of INDECOPI. According to the Merger Control Law, the prior concentration control operations of economic agents included in the scope of the regulation and supervision of the SBS and/or
SMV is carried out by INDECOPI, without prejudice to prior control of a prudential nature and financial stability that corresponds to the SBS and/or SMV. The merger transaction proceeds if there is due authorization from INDECOPI and from the SBS
and/or the SMV accordingly. In the case of merger transactions operations that include companies in the financial system that take deposits from the public or insurance companies, that show relevant and imminent risks or compromise the stability of
the aforementioned companies or the systems that they integrate, only the prior control of the SBS is required in its area of competence, given the reserved nature of said situation, which must be determined by the SBS.
Finally, under the Peruvian Banking and Insurance Law, individuals or corporations that acquire, directly or indirectly, 1% of the capital stock of a bank in a period of 12
months, or acquire a 3% or more share participation, have the obligation to provide the information that the SBS may require to identify such individuals’ or corporations’ main economic activities and asset structure.
Risk rating requirements
Law No. 26702 and SBS Resolutions No. 672 and 18400-2010 require that all financial companies be rated by at least two risk rating companies on a semi-annual basis, in addition
to the SBS’s assessment. Criteria to be considered in the rating include risk management and control procedures, loan quality, financial strength, profitability, liquidity, and financial efficiency. Five risk categories are assigned, from “A”
(lowest risk) to “E” (highest risk), allowing for sub-categories within each category. In September 2022, the Moody’s Local PE Clasificadora de Riesgos S.A. and Apoyo y
Asociados Internacionales S.A.C. rating agencies affirmed their respective “A+” risk rating for BCP Stand-alone. In September 2021, both rating agencies affirmed their “A” risk rating for Mibanco. As of December 2022, BCP Stand-alone and
Mibanco maintained the risk rating of “A+” and “A”, respectively, with both rating agencies.
Deposit insurance fund
The Peruvian Banking and Insurance Law provides for mandatory deposit insurance to protect the deposits of financial institutions by establishing the Deposit Insurance Fund for
individuals, associations, not-for-profit companies, and demand deposits of non-financial companies. Financial institutions must pay an annual premium calculated and based on the type of deposits accepted by the entity and the risk classification
of such entity, as rated by the SBS and at least two independent risk-rating agencies. The annual premium, as, begins at 0.45% of total funds on deposit and increases to 1.45%, which is applicable to banks in the highest risk category. BCP
Stand-alone and Mibanco are currently classified in the lowest risk category and pay the 0.45% set by SBS Resolution No. 0657-99.
The maximum amount that a customer is entitled to recover from the Deposit Insurance Fund is S/125,714.00 for the period starting from March 2023 until May 2023.
| (iv) |
Peruvian Insurance Companies Regulation - Grupo Pacífico
|
Solvency requirements
Pursuant to Law No. 26702, the SBS regulates the solvency margin of Peruvian insurance companies. The solvency margin calculations consider the amount of premiums written and
losses incurred during a specified period prior to the date of the calculation.
Insurance companies must also maintain solvency equity, which must be the greater of (i) the solvency margin and (ii) the minimum capital requirement, as established by law. The
required amount of solvency equity is recalculated at least quarterly. If an insurance company has outstanding credit risk operations, part of the solvency equity must be set aside for its coverage.
Legal reserve requirements
Peruvian law also requires that all insurance companies establish a legal guarantee reserve for policyholders by setting aside 10% of income before taxes until the reserve
reaches at least 35% of paid-in capital.
Technical reserve requirements
Pursuant to Law No. 26702 and regulations issued by the SBS, Peruvian insurance companies must establish technical reserves. Law No. 26702 also requires insurance companies to
create a reserve for incurred but not reported (IBNR) claims that are reflected as a liability in their consolidated financial statements. Reserves for IBNR claims are estimated by using generally accepted actuarial reserving methods. See Note 3(e)
to our consolidated financial statements. Finally, Grupo Pacífico is required by the SBS to establish pre-event reserves for risk of catastrophes, which, in accordance with IFRS principles, are not considered in our financial statements. See “ITEM
5. OPERATING AND FINANCIAL REVIEW AND PROSPECTS – 5.A Operating results – (6) Lines of Business (LoBs) – 6.3 Insurance & Pensions – (i) Grupo Pacífico”.
According to a new regulation regarding actuarial management, SBS Resolution No. 3863-2016, the actuarial function must (i) ensure the use of real and adequate parameters in
both pricing and technical reserves calculation and (ii) guarantee the consistency of the results obtained. Likewise, based on the sufficiency evaluation analysis, actuarial management must propose changes in the methodologies applied in the
calculation of technical or additional reserves.
Investment requirements
Pursuant to Law No. 26702 and SBS Resolution No. 1041-2016, the total amount of an insurance company’s solvency equity and technical reserves must be permanently supported by
diversified assets, which may not be pledged or otherwise encumbered. The investment regulations further state that deposits in and bonds of a single financial institution together cannot exceed 7% of the total of an insurer’s solvency equity and
technical reserves combined. In general, no more than 15% of an insurance company’s combined solvency equity and technical reserves may be invested in instruments (including stocks and bonds) issued by a company or group of companies. In order for
an insurance company to invest in non-Peruvian securities, the securities must be rated investment grade by an internationally recognized credit rating agency and the asset class must be authorized by Peruvian SBS regulations. Securities owned by
insurance companies must be registered in the Public Registry of Securities of Peru or the comparable registry of their respective country.
Related party transactions requirements
Law No. 26702 provides that insurance companies may not extend credit to or guarantee the obligations of employees or members of their Board of Directors, except for certain
home mortgage loans to employees.
Ownership restrictions
Law No. 26702 sets forth the same types of restrictions regarding the ownership and transfer of insurance company shares as it does regarding the ownership and transfer of
shares in banks. See “ITEM 4. INFORMATION ON THE COMPANY – 4.B Business overview – (6) Supervision and Regulation – 6.2 Subsidiaries – 6.2.1. Peru”.
Market Conduct Regulation
During 2021 and 2022, Peruvian insurance companies have been involved in implementing a series of improvements in market conduct rules, as set forth in SBS Resolutions No.
4143-2019 and No. 1840-2022, including in their practices in relationships with customers, in the offer or promotion of insurance products, and the transparency of information and the management of claims.
| (v) |
Peruvian Pension Fund Regulation – Prima AFP
|
Minimum capital requirements
SBS authorization is required for an AFP to begin operations. Peruvian law requires a minimum capital requirement, paid in cash by shareholders. There are certain limitations on
the ownership and transfer of AFP shares. Additionally, Peruvian law requires that companies maintain a legal reserve funded with 10% of their net profit, until the reserve reaches the equivalent of 20% of their share capital
Investment limits
The SBS has set investment limits, which restrict investments in certain asset classes, economic groups, and issuers. In addition, some of these limits differ according to the
fund’s risk profile. The general limits are:
| • |
The total amount invested in instruments issued or guaranteed by the Peruvian State cannot exceed 30% of the fund value;
|
| • |
The total amount invested in instruments issued or guaranteed by the BCRP cannot exceed 30% of the fund value;
|
| • |
The combined total amount invested in instruments issued or guaranteed by the Peruvian State and the BCRP cannot exceed 40% of the fund value; and
|
| • |
The total amount invested in instruments issued by governments, financial institutions, and non-financial institutions whose commercial activities are mostly abroad cannot exceed 50% of the fund value.
|
The SBS requires that AFPs ensure a minimum yield. Part of the guarantee is the obligatory reserve requirement, which is paid with resources belonging to the AFPs. The amount
depends on the assets in the portfolio, but it is approximately 1% of the AFP’s funds under management.
PPS Reforms
PPS Reform and changes of the PPS between 2012 and 2017
Since 2012, the PPS has undergone several reforms and changes applied by the Peruvian government and its regulators. The most relevant changes from 2012 to 2017 were the
following:
| • |
In 2012, a tender process held every 24 months was incorporated. In this process the AFP that offers the lowest management fee wins the tender. As a result, new workers who enter the PPS become members of the tender holder and remain in
it for at least 24 months.
|
| • |
In 2014, new local and foreign investment regulations made the PPS registration process for new investment securities more flexible. It allows AFPs to make non-complex investments and use derivatives instruments under certain restriction
without authorization from the SBS.
|
| • |
In 2015, SBS Resolution No. 5540-2015 was also published and regulates the new Fund Type Zero, which is mandatory for participants from the age of 65 and up who opt for a statutory retirement pension. The Fund Type Zero became effective
on April 1, 2016 and invests only in national currency short-term instruments and debt securities.
|
| • |
In April 2016, Peruvian Law No. 30425 (further modified by Law No. 30478) was passed and came into force in Peru. Among the most relevant changes, the law allows affiliates to: (i) withdraw up to 95.5% of their pension funds when they
reach the age of 65 (retirement age); (ii) use up to 25% of their pension funds as the down payment or amortization of a mortgage loan used to buy a first house; and (iii) in the case of affiliates with terminal illness, withdraw up to 50%
of their pension funds. The new law also extended the Special Regime of Early Retirement until December 31, 2018, for affiliates who had been unemployed for at least 12 months. The Regime applies to men and women who are at least 55 and 50
years old respectively, and pensioners who choose the retirement program.
|
| • |
In 2017, BCRP raised the foreign investment limit up to 46% for pension funds to encourage AFPs to diversify their investments.
|
For further detail please refer to Credicorp’s previous 2019 20-F document, see “ITEM 4. INFORMATION ON THE COMPANY – 4.B Business Overview – (9) Supervision and Regulation –
9.5 Prima AFP”.
Changes to PPS in 2018
Between February and September 2018, the BCRP raised the foreign investment limit for pension funds at a rate of 0.5 percentage points per month until it reached the 50% limit
set by the SBS.
In 2018, the withdrawals of funds in Prima AFP totaled approximately S/2,992 million.
Changes to PPS in 2019
On April 3, 2019, Peru’s congress permanently approved the Special Regime of Early Retirement for affiliates with a minimum age of 55 years old for men and 50 years old for
women, who are unemployed for at least 12 consecutive months, and who prove an income of less than S/29,400 (7 UIT), to receive independent employment (4th category)
income during their unemployment period. These modifications were promulgated by Peruvian Law No. 30939.
Peru’s congress also approved new criteria to apply for Ordinary Early Retirement. Ordinary Early Retirement is available to affiliates with a minimum age of 55 years old for
men and 50 years old for women, who have a pension fund that allows them to access a pension of at least 40% of the average income received during the last 120 months. These modifications were promulgated by Peruvian Law No. 30939. In 2019, the
withdrawals of funds in Prima AFP totaled approximately S/2,797 million.
Changes to PPS in 2020
In 2020, to help the population during the COVID-19 pandemic, the Peruvian government and congress took measures to provide liquidity to private pensioners by allowing them to
draw down their funds. These measures decreased funds under management and fee income at Prima AFP in 2020 and 2021.
Changes to PPS in 2021
On May 7, 2021, Law No. 31192 was published. It authorized affiliates of the Private Pension Fund Administration System to make a one-time withdrawal of up to S/17,200 from
their funds.
On August 6, 2021, Law No. 31332, which reduces from 55 to 50 the minimum age for men to access early retirement, was published.
Changes to PPS in 2022
On May 20, 2022, Law No. 31478 was published. It authorized affiliates of the Private Pension Fund Administration System to make a one-time withdrawal of up to S/18,400 from
their funds.
For further information about the measures taken by the government, see “ITEM 3. KEY INFORMATION – 3.D Risk Factors – Regulatory changes and adoption of new international
guidelines to sectors in which we operate could impact our earnings and adversely affect our operating performance” and “ITEM 5. OPERATING AND FINANCIAL REVIEW AND PROSPECTS – 5.A Operating results – (2) Political and Macroeconomic Environment”.
Peruvian Investment Banking & Wealth Management Regulation - Credicorp Capital Peru
Credicorp Capital Peru is the main shareholder of Credicorp Capital Sociedad Agente de Bolsa S.A., Credicorp Capital Sociedad Titulizadora S.A., and Credicorp Capital S.A.
Sociedad Administradora de Fondos. These entities are supervised directly by the SMV. The SMV is a specialized technical body attached to the MEF, aimed to ensure the protection of investors and the efficiency and transparency of the markets, as
well as the diffusion of the information required for such purposes. The SMV enjoys functional, administrative, economic, technical, and budgetary autonomy.
Peru’s Securities Market Law (Legislative Decree No. 861), as amended, governs the public offering and trading of securities listed on the SMV and the BVL. The BVL, as the only
stock exchange in Peru, also provides internal regulations that form part of the regulations and administrative rulings that govern the offering and trading of securities.
6.2.2 Cayman Islands
Cayman Islands Regulation - Atlantic Security Holding Corporation (ASHC)
ASHC is an entity regulated under the Cayman Islands Companies Law, duly supervised by the Cayman Island Monetary Authority (CIMA). Under the law of the Cayman Islands, ASHC is
subject to the following continuing requirements: (i) to remain in good standing under the Cayman Islands Companies Law, including the filing of annual and other returns and the payment of annual fees; (ii) to file any change in the information or
documents required to be provided and to pay annual fees with the Registrar of Companies; (iii) to file certain prescribed forms with CIMA on a quarterly basis; (iv) to file audited accounts with CIMA within three months of each financial year (in
the case of a locally incorporated bank, which is not part of a substantial international banking group, a senior officer or board member discusses these accounts each year at a meeting with CIMA); and (v) to file an annual questionnaire.
6.2.3 Bolivia – BCP Bolivia, Inversiones Credicorp Bolivia S.A., Credifondo Sociedad Administradora de Fondos de Inversión S.A, Credibolsa S.A. Agencia de
Bolsa
Bolivian Regulators
Pursuant to Supreme Decree No. 29894, in May 2009, the ASFI was vested with the authority to regulate the Bolivian banking system. The ASFI also supervises brokerage and mutual
fund management activities that Credicorp Ltd. conducts through BCP Bolivia’s affiliates, Credibolsa and Credifondo. These affiliates operate under the Securities Markets Law No. 1834, enacted on March 31, 1998. Additionally, the Central Bank of
Bolivia (Banco Central de Bolivia or BCB by its Spanish initials) regulates financial intermediation and deposit activities, determines monetary and foreign exchange policy, and establishes reserve requirements on deposits.
Regulation of Bolivian Financial Institutions
Until November 2013, the Bolivian banking system operated under the Law of Banks and Financial Entities (Law No. 1488), enacted on April 14, 1993, and later modified by Law No.
3076 of June 20, 2005. On August 21, 2013, the Bolivian government enacted a new Banking Law (Law No. 393), which became effective on November 21, 2013. This new law envisions a more active role of government in the financial services industry and
emphasizes the social objective of financial services.
On December 10, 2010, through the enactment in Bolivia of Law No. 065 (Ley de Pensiones), the supervision of all insurance activities in
Bolivia was transferred from the ASFI to the APS (Autoridad de Fiscalización y Control de Pensiones y Seguros). Our life and P&C insurance affiliates in Bolivia, which operate under the commercial name
Crediseguro, are thus regulated, and supervised by the APS.
In 2012, the Bolivian government imposed an additional income tax of 12.5% on earnings before taxes, which applied to all financial institutions with a ratio of earnings before
taxes to equity in excess of 13%. The additional income tax rate was subsequently increased to 22% in December 2015, and to 25% in March 2017, and was made applicable to all financial institutions with a ratio of earnings before taxes to equity in
excess of 6%. Starting in 2021, the additional income tax applies also to Crediseguro, Credibolsa and Credifondo.
In 2013, Supreme Decree No. 1842 set interest rate caps for social housing loans ranging from 5.5% to 6.5%, and for loans to productive sectors (agriculture, tourism,
manufacture, etc.). The Decree established loan quotas pursuant to which, by December 31, 2018, and afterwards, at least 60% of the loan portfolio of all universal banks needs to be comprised of loans to productive sectors and social housing loans,
with a sublimit that establishes that loans to productive sectors must represent at least 25% of the portfolio.
Further to Law No. 393, in 2014, the Bolivian government, through Supreme Decrees No. 2136 and No. 2137, instructed banks in Bolivia to contribute 6% of that year’s total
profits for the creation of a guarantee fund – to be administered by the banks - intended to provide guarantees of up to 50% of the amount financed of productive sector and social housing loans. From 2015 to 2019, and again in 2021, the government
instructed banks to contribute 6% of those years’ profits to replenish either the existing guarantee funds or to make contributions to a newly created seed capital fund administered by the government-owned development bank.
In response to the COVID-19 pandemic, on April 1, 2020, the Bolivian government enacted Law No. 1294, which established the automatic deferral of all loan installments (capital,
interest, and other charges) payable to financial institutions for the duration of Bolivian Coronavirus Pandemic Emergency Declaration. These deferred installments will start to be collected after the final installment established on the original
payment schedule. Supreme Decree No. 4206 established an initial deferral period from March 2020 to May 2020, which was subsequently extended to August 2020 through Supreme Decree No. 4248, and then to December 2020 through Law No. 1319.
On December 2, 2020, the Bolivian government issued Supreme Decree No. 4409, establishing that the capital portion of the installments that had been deferred in 2020 would not
accrue interest until their cancellation. Supreme Decree No. 4409 also established that once the deferral period has concluded, upon request of the borrowers that had their installments deferred, banks must refinance and/or reschedule their loans,
based on the borrowers’ economic situation and payment capacity. The refinanced and/or rescheduled loans have the benefit of a six-month grace period during which no interest or capital payments are required from the borrower. The collection of the
amount of interest accrued but not collected during the aforementioned grace period will be made pro rata during the new term of the loan.
On December 28, 2020, the Bolivian government enacted Law No.1356, eliminating the tax exemption for capital gains generated in the Bolivian Stock Exchange and introducing an
additional income tax of 25% applicable to all brokerage houses, mutual fund administrators and insurance companies with a ratio of earnings before taxes to equity in excess of 6%.
In accordance with Bolivian regulation, a reserve of up to at least 50% of paid-in capital of the Group’s subsidiaries operating in Bolivia is required to be established through
annual transfers of at least 10% of their net profit.
6.2.4 Colombia
Colombian Regulation – Credicorp Holding Colombia, Mibanco Colombia & Credicorp Capital Colombia
Credicorp Holding Colombia S.A.S. is the main shareholder of Credicorp Capital Colombia S.A., Credicorp Capital Fiduciaria S.A., Credicorp Capital Servicios S.A.S., Credicorp
Negocios Digitales S.A.S., Credicorp Capital Corporación Financiera S.A. and Mibanco Colombia S.A.
The SFC is an entity whose main function is to oversee Colombia’s financial sectors. Although it has an important role in monitoring and surveillance, it also has certain
regulatory powers that permit it to issue regulations through regulatory circular letters, laws and decrees. Separately, the AMV supervises and regulates the conduct of securities intermediaries, as well as the certification of those who carry out
such activities. The AMV is a private entity and is the product of a self-regulatory scheme established after the termination of Law No. 964 of 2005.
The regulation of the financial sector and the securities market in Colombia is directed by Colombia’s congress, which issues laws, and the Colombian Ministry of Finance’s URF,
which issues decrees. Also, the Taxes and National Customs Authority (Dirección de Impuestos y Aduanas Nacionales or DIAN by its Spanish initials) oversees the regulation related to FATCA and CRS.
The Superintendence of Industry and Commerce is the national authority for the protection of fair competition, personal data and legal metrology. The Superintendence of Industry
and Commerce also protects the rights of consumers and administers the National System of Industrial Property, through the exercise of its administrative and jurisdictional functions.
Finally, the Colombian Ministry of Commerce, Industry and Tourism’s Superintendence of Corporations (Superintendencia de Sociedades) is a regulatory agency that oversees
commercial corporations that are not under the supervision of other Superintendencies.
6.2.5 Chile
Chilean Regulation – Credicorp Capital Chile
The CMF is responsible for the supervision of entities in the securities market, insurance, banks, financial institutions, and other financial entities. The CMF regulates
Credicorp Capital Chile through the Chilean stock exchange market. The CMF ensures that supervised institutions comply with laws, regulations, statutes, and other provisions governing the functioning of these markets. The CMF also authorizes
companies to manage mutual and investment funds (known as Mutual Fund Administrators and General Fund Management or AFM and AGF, respectively, by their Spanish initials) and supervises such companies and their managed funds by monitoring their
legal, financial, and accounting information to ensure compliance with applicable laws and regulations.
Chilean regulators have established several laws, regulations, and rules to address the various sectors of the stock market. One of those laws is the Chilean Securities Market
Law, which governs the functioning of the Chilean market, its corporations, management of third-party funds (investment funds, mutual funds, pension funds and others), and deposit and custody of securities.
6.2.6 Panama
International Bank Regulation – BCP Panama
BCP Panama is a branch of BCP Stand-alone, registered in the Republic of Panama in 2002, under an international license issued by the Panamanian Superintendency of Banks (the
“SBP”) in accordance with Law Decree No. 9 of February 26, 1998, as amended.
BCP Panama is subject to an inspection made by auditors and inspectors of the SBP to determine, among other things, BCP Panama’s compliance with Panamanian banking laws,
including Law Decrees No. 2 of February 22, 2008, and No. 23 of April 27, 2015 (the Law on the Prevention of Money Laundering, Terrorism Financing and Financing of Proliferation of Weapons of Mass Destruction).
ASB Bank Corp.
ASB Bank Corp., a subsidiary of ASHC, is regulated by the SBP, registered in 2020 under an international banking license issued by the SBP, in accordance with Law Decree No. 9
of February 26, 1998, as amended.
As a holder of this license, ASB Bank Corp. can manage banking operations carried out outside of Panamanian territory from an office located in Panama. Likewise, it grants the
right to exercise any other activity authorized by the SBP. ASB Bank Corp. may not take deposits from any person residing in the Republic of Panama.
ASB Bank Corp. is also regulated and holds a securities broker license issued by the Panama SMV that enables the entity to act as securities broker, manager, and custodian. It
is required to comply with regulations pertaining to corporate governance; minimum working capital and liquidity requirements to meet obligations with customers and vendors; adequate accounting practices and recordkeeping; provision of regulatory
reports; adherence to confidentiality standards, code of ethics and prevention of conflict of interest; and adequate anti-money laundering and terrorism finance laundering controls, policies, and programs, among others.
ASB Bank Corp. must receive prior approval from the SBP and the Panamá SMV for: (i) any proposed changes in the Board of Directors or senior officers; (ii) the issuance,
transfer or other disposal of shares (it is uncommon for a waiver to be granted with respect to shares related matters except in the case of a branch of a substantial international bank and where the shares are widely held and publicly traded);
(iii) any significant change in the business plan filed on the original licenses applications; or (iv) to open a subsidiary, branch, agency, or representative office outside the Republic of Panama.
6.2.7 United States
International Bank Regulation – BCP Miami
BCP Miami is licensed to operate as an international bank agency in the State of Florida and was authorized to transact business by the Comptroller of Florida on September 3,
2002. BCP Miami is regulated, supervised, and examined by the Office of Financial Regulation of the State of Florida Department of Financial Services and by the FED through the Federal Reserve Bank of Atlanta. Our
direct and indirect nonbanking subsidiaries doing business in the United States also are subject to the authority of relevant U.S. financial regulatory agencies depending on their U.S. activities.
Investment Banking and Wealth Management Company Regulation – Credicorp Capital LLC.
Credicorp Capital LLC. is a broker-dealer registered with FINRA and the SEC. Credicorp Capital LLC. is owned by Credicorp Capital Limited, which is wholly owned by Credicorp
Ltd. Headquartered in Brickell, Florida, Credicorp Capital LLC. provides brokerage services through a clearing agreement with Pershing, LLC. As of November 30, 2021, there were five registered principals at Credicorp Capital LLC., all of whom are
Series 7 and Series 24 licensed. At the trading desk, all registered representatives maintain their Series 7 and Series 63 licenses.
Credicorp Capital LLC. has an affiliated SEC investment adviser (CRD No. 290081), Credicorp Capital Advisors LLC. They share the same Board of Directors and ownership.
In the following tables, we have set forth certain selected statistical information and ratios regarding our business for the periods indicated. You should read the selected statistical information in conjunction
with the information included in “ITEM 5. OPERATING AND FINANCIAL REVIEW AND PROSPECTS – 5.A Operating Results” and the consolidated financial statements (and the notes that accompany the consolidated financial statements). The statistical
information and discussion and analysis given below for the years 2020 through 2022 reflect our consolidated financial position as well as that of our subsidiaries, as of December 31, 2020, 2021 and 2022 and our results of operations for the
years then ended.
7.1 Average statements of financial position. Income from interest-earning assets and interest paid on interest-bearing liabilities
The tables below set forth selected statistical information based on our average statements of financial position prepared on a consolidated basis. Except as otherwise indicated, we have classified average
balances by currency (Soles or foreign currency, primarily US Dollars) rather than by the domestic or international nature of the balance. For the years 2020, 2021 and 2022, the average balances are computed as the average of period-beginning
and period-ending balances on a monthly basis. Any of these month-end balances that were denominated in US Dollars have been converted into Soles using the applicable SBS exchange rate as of the date of such balance. Our management believes
that the stated averages are representative of our operations, and that it would be too costly to produce daily averages using daily book balances in IFRS but does not believe that the stated averages present trends in a materially different
manner from those that would be presented by daily averages.
Average Statements of Financial Position
Assets, Interest Earned and Average Interest Rates (1)
|
Year ended December 31,
|
||||||||||||||||||||||||||||||||||||
|
2020
|
2021
|
2022
|
||||||||||||||||||||||||||||||||||
|
ASSETS:
|
Average
|
Interest
|
Nominal
|
Average
|
Interest
|
Nominal
|
Average
|
Interest
|
Nominal
|
|||||||||||||||||||||||||||
|
Balance
|
Earned
|
Avg. Rate
|
Balance
|
Earned
|
Avg. Rate
|
Balance
|
Earned
|
Avg. Rate
|
||||||||||||||||||||||||||||
|
(in thousands of Soles, except percentages)
|
||||||||||||||||||||||||||||||||||||
|
Interest-earning assets:
|
||||||||||||||||||||||||||||||||||||
|
Deposits in BCRP
|
||||||||||||||||||||||||||||||||||||
|
Soles
|
4,158,501
|
10,551
|
0.20
|
%
|
5,210,865
|
31,505
|
0.60
|
%
|
1,846,079
|
54,425
|
2.95
|
%
|
||||||||||||||||||||||||
|
Foreign Currency
|
19,792,862
|
41,908
|
0.21
|
21,370,530
|
2,293
|
0.01
|
23,012,886
|
319,395
|
1.39
|
|||||||||||||||||||||||||||
|
Total
|
23,951,363
|
52,459
|
0.22
|
26,581,395
|
33,798
|
0.13
|
24,858,965
|
373,820
|
1.50
|
|||||||||||||||||||||||||||
|
Deposits in other Banks
|
||||||||||||||||||||||||||||||||||||
|
Soles
|
520,306
|
3,826
|
0.74
|
407,357
|
1,642
|
0.40
|
466,371
|
15,484
|
3.32
|
|||||||||||||||||||||||||||
|
Foreign Currency
|
6,568,981
|
18,528
|
0.28
|
9,010,149
|
14,197
|
0.16
|
6,081,790
|
69,227
|
1.14
|
|||||||||||||||||||||||||||
|
Total
|
7,089,287
|
22,354
|
0.32
|
9,417,506
|
15,839
|
0.17
|
6,548,161
|
84,711
|
1.29
|
|||||||||||||||||||||||||||
|
Investment securities
|
||||||||||||||||||||||||||||||||||||
|
Soles
|
30,422,192
|
983,791
|
3.23
|
34,968,222
|
1,089,913
|
3.12
|
29,425,119
|
1,511,124
|
5.14
|
|||||||||||||||||||||||||||
|
Foreign Currency
|
14,395,322
|
388,373
|
2.70
|
19,931,263
|
436,880
|
2.19
|
18,016,806
|
502,570
|
2.79
|
|||||||||||||||||||||||||||
|
Total
|
44,817,514
|
1,372,164
|
3.06
|
54,899,485
|
1,526,793
|
2.78
|
47,441,925
|
2,013,694
|
4.24
|
|||||||||||||||||||||||||||
|
Total loans (1)
|
||||||||||||||||||||||||||||||||||||
|
Soles
|
84,042,922
|
7,695,726
|
9.16
|
94,750,905
|
7,789,085
|
8.22
|
98,249,290
|
9,751,575
|
9.93
|
|||||||||||||||||||||||||||
|
Foreign Currency
|
45,916,114
|
2,332,108
|
5.08
|
47,791,467
|
2,381,595
|
4.98
|
50,142,223
|
2,667,706
|
5.32
|
|||||||||||||||||||||||||||
|
Total
|
129,959,036
|
10,027,834
|
7.72
|
142,542,372
|
10,170,680
|
7.14
|
148,391,513
|
12,419,281
|
8.37
|
|||||||||||||||||||||||||||
|
Total dividend-earning assets
|
||||||||||||||||||||||||||||||||||||
|
Soles
|
484,417
|
8,123
|
1.68
|
358,451
|
23,794
|
6.64
|
319,684
|
14,864
|
4.65
|
|||||||||||||||||||||||||||
|
Foreign Currency
|
307,482
|
17,480
|
5.68
|
110,104
|
16,843
|
15.3
|
64,491
|
14,362
|
2.27
|
|||||||||||||||||||||||||||
|
Total
|
791,899
|
25,603
|
3.23
|
468,555
|
40,637
|
8.67
|
384,175
|
29,226
|
7.61
|
|||||||||||||||||||||||||||
|
Total interest-earning assets
|
||||||||||||||||||||||||||||||||||||
|
Soles
|
119,628,338
|
8,702,017
|
7.27
|
135,695,800
|
8,935,939
|
6.59
|
130,306,543
|
11,347,472
|
8.71
|
|||||||||||||||||||||||||||
|
Foreign Currency
|
86,980,761
|
2,798,397
|
3.22
|
98,213,513
|
2,851,808
|
2.90
|
97,318,196
|
3,573,260
|
3.67
|
|||||||||||||||||||||||||||
|
Total
|
206,609,099
|
11,500,414
|
5.57
|
233,909,313
|
11,787,747
|
5.04
|
227,624,739
|
14,920,732
|
6.55
|
|||||||||||||||||||||||||||
|
Noninterest-earning assets:
|
||||||||||||||||||||||||||||||||||||
|
Cash and due from banks
|
||||||||||||||||||||||||||||||||||||
|
Soles
|
2,946,320
|
2,941,680
|
2,963,365
|
|||||||||||||||||||||||||||||||||
|
Foreign Currency
|
2,159,340
|
2,824,559
|
2,637,554
|
|||||||||||||||||||||||||||||||||
|
Total
|
5,105,660
|
5,766,239
|
5,600,919
|
|||||||||||||||||||||||||||||||||
|
Allowance for direct loan losses
|
||||||||||||||||||||||||||||||||||||
|
Soles
|
(6,530,146
|
)
|
(7,487,480
|
)
|
(6,468,723
|
)
|
||||||||||||||||||||||||||||||
|
Foreign Currency
|
(1,390,331
|
)
|
(1,767,750
|
)
|
(1,658,855
|
)
|
||||||||||||||||||||||||||||||
|
Total
|
(7,920,477
|
)
|
(9,255,230
|
)
|
(8,127,578
|
)
|
||||||||||||||||||||||||||||||
|
Premises and equipment
|
||||||||||||||||||||||||||||||||||||
|
Soles
|
1,383,640
|
1,094,085
|
920,802
|
|||||||||||||||||||||||||||||||||
|
Foreign Currency
|
882,677
|
929,155
|
977,511
|
|||||||||||||||||||||||||||||||||
|
Total
|
2,266,317
|
2,023,240
|
1,898,313
|
|||||||||||||||||||||||||||||||||
|
Other non-interest-earning assets, derivatives and other interest income
|
||||||||||||||||||||||||||||||||||||
|
Soles
|
8,873,581
|
32,965
|
8,198,900
|
50,773
|
5,922,999
|
63,239
|
||||||||||||||||||||||||||||||
|
Foreign Currency
|
3,723,751
|
14,269
|
6,286,945
|
11,886
|
6,770,983
|
27,311
|
||||||||||||||||||||||||||||||
|
Total
|
12,597,332
|
47,234
|
14,485,845
|
62,659
|
12,693,982
|
90,550
|
||||||||||||||||||||||||||||||
|
Total non-interest-earning assets
|
||||||||||||||||||||||||||||||||||||
|
Soles
|
6,673,395
|
32,965
|
4,747,185
|
50,773
|
3,338,443
|
63,239
|
||||||||||||||||||||||||||||||
|
Foreign Currency
|
5,375,437
|
14,269
|
8,272,909
|
11,886
|
8,727,193
|
27,311
|
||||||||||||||||||||||||||||||
|
Total
|
12,048,832
|
47,234
|
13,020,094
|
62,659
|
12,065,636
|
90,550
|
||||||||||||||||||||||||||||||
|
Total average assets
|
||||||||||||||||||||||||||||||||||||
|
Soles
|
126,301,733
|
8,734,982
|
6.92
|
140,442,985
|
8,986,712
|
6.40
|
133,644,986
|
11,410,711
|
8.54
|
|||||||||||||||||||||||||||
|
Foreign Currency
|
92,356,198
|
2,812,666
|
3.05
|
106,486,422
|
2,863,694
|
2.69
|
106,045,389
|
3,600,571
|
3.40
|
|||||||||||||||||||||||||||
|
Total
|
218,657,931
|
11,547,648
|
5.28
|
246,929,407
|
11,850,406
|
4.80
|
239,690,375
|
15,011,282
|
6.26
|
|||||||||||||||||||||||||||
| (1) |
Figures for total loans include internal overdue loans, but do not include accrued but unpaid interest on such internal overdue loans in the year in which such loans became internal overdue loans. Accrued interest is included.
|
Average Statements of Financial Position
Liabilities and Equity, Interest Paid and Average Interest Rates (1)
|
2020
|
2021
|
2022
|
||||||||||||||||||||||||||||||||||
|
LIABILITIES
|
Average
|
Interest
|
Nominal
|
Average
|
Interest
|
Nominal
|
Average
|
Interest
|
Nominal
|
|||||||||||||||||||||||||||
|
Balance
|
Paid
|
Avg. Rate
|
Balance
|
Paid
|
Avg.
Rate
|
Balance
|
Paid
|
Avg.
Rate
|
||||||||||||||||||||||||||||
|
Interest-bearing liabilities:
|
||||||||||||||||||||||||||||||||||||
|
Savings deposits
|
||||||||||||||||||||||||||||||||||||
|
Soles (1)
|
24,980,192
|
146,089
|
0.58
|
%
|
30,138,029
|
173,193
|
0.57
|
%
|
30,055,712
|
157,252
|
0.52
|
%
|
||||||||||||||||||||||||
|
Foreign Currency (1)
|
17,761,179
|
76,798
|
0.43
|
22,670,476
|
93,930
|
0.41
|
25,110,372
|
101,432
|
0.40
|
|||||||||||||||||||||||||||
|
Total
|
42,741,371
|
222,887
|
0.52
|
52,808,505
|
267,123
|
0.51
|
55,166,084
|
258,684
|
0.47
|
|||||||||||||||||||||||||||
|
Time deposits
|
||||||||||||||||||||||||||||||||||||
|
Soles (1)
|
20,014,910
|
610,238
|
3.05
|
17,277,160
|
328,679
|
1.90
|
19,364,597
|
966,149
|
4.99
|
|||||||||||||||||||||||||||
|
Foreign Currency (1)
|
19,931,021
|
394,083
|
1.98
|
19,857,929
|
355,248
|
1.79
|
21,103,285
|
510,093
|
2.42
|
|||||||||||||||||||||||||||
|
Total
|
39,945,931
|
1,004,321
|
2.51
|
37,135,089
|
683,927
|
1.84
|
40,467,882
|
1,476,242
|
3.65
|
|||||||||||||||||||||||||||
|
Due to banks and correspondents
|
||||||||||||||||||||||||||||||||||||
|
Soles
|
4,110,388
|
227,246
|
5.53
|
4,230,960
|
228,427
|
5.4
|
5,169,521
|
389,057
|
7.53
|
|||||||||||||||||||||||||||
|
Foreign Currency
|
3,914,547
|
108,291
|
2.77
|
2,460,979
|
44,438
|
1.81
|
2,547,427
|
95,132
|
3.73
|
|||||||||||||||||||||||||||
|
Total
|
8,024,935
|
335,537
|
4.18
|
6,691,939
|
272,865
|
4.08
|
7,716,948
|
484,189
|
6.27
|
|||||||||||||||||||||||||||
|
Bonds
|
||||||||||||||||||||||||||||||||||||
|
Soles
|
3,741,617
|
203,617
|
5.44
|
3,468,936
|
177,481
|
5.12
|
3,265,683
|
169,023
|
5.18
|
|||||||||||||||||||||||||||
|
Foreign Currency
|
12,360,656
|
701,957
|
5.5
|
13,662,502
|
659,496
|
4.83
|
13,384,236
|
559,195
|
4.18
|
|||||||||||||||||||||||||||
|
Total
|
16,102,273
|
905,574
|
5.49
|
17,131,438
|
836,977
|
4.89
|
16,649,919
|
728,218
|
4.37
|
|||||||||||||||||||||||||||
|
Payables from repurchase agreements
|
||||||||||||||||||||||||||||||||||||
|
Soles
|
18,007,100
|
204,409
|
1.14
|
22,800,403
|
155,808
|
0.68
|
15,931,118
|
192,581
|
0.98
|
|||||||||||||||||||||||||||
|
Foreign Currency
|
2,309,341
|
46,947
|
2.03
|
2,312,115
|
28,384
|
1.23
|
1,678,249
|
6,308
|
1.69
|
|||||||||||||||||||||||||||
|
Total
|
20,316,441
|
251,356
|
1.24
|
25,112,518
|
184,192
|
0.73
|
17,609,367
|
198,889
|
1.05
|
|||||||||||||||||||||||||||
|
Total interest-bearing liabilities
|
||||||||||||||||||||||||||||||||||||
|
Soles
|
70,854,207
|
1,391,599
|
1.96
|
77,915,488
|
1,063,588
|
1.37
|
73,786,631
|
1,874,062
|
2.54
|
|||||||||||||||||||||||||||
|
Foreign Currency
|
56,276,744
|
1,328,076
|
2.36
|
60,964,001
|
1,181,496
|
1.94
|
63,823,569
|
1,272,160
|
1.99
|
|||||||||||||||||||||||||||
|
Total
|
127,130,951
|
2,719,675
|
2.14
|
138,879,489
|
2,245,084
|
1.62
|
137,610,200
|
3,146,222
|
2.29
|
|||||||||||||||||||||||||||
|
Other liabilities and equity:
|
||||||||||||||||||||||||||||||||||||
|
Demand deposits (2)
|
||||||||||||||||||||||||||||||||||||
|
Soles (1)
|
23,333,665
|
78,880
|
0.34
|
27,352,388
|
66,943
|
0.24
|
23,109,185
|
111,883
|
0.48
|
%
|
||||||||||||||||||||||||||
|
Foreign Currency (1)
|
23,382,041
|
65,381
|
0.28
|
32,632,889
|
61,222
|
0.19
|
29,992,532
|
71,692
|
0.24
|
|||||||||||||||||||||||||||
|
Total
|
46,715,706
|
144,261
|
0.31
|
59,985,277
|
128,165
|
0.21
|
53,101,717
|
183,575
|
0.35
|
|||||||||||||||||||||||||||
|
Other liabilities, derivatives and other interest expenses
|
||||||||||||||||||||||||||||||||||||
|
Soles
|
10,115,435
|
34,788
|
10,607,850
|
26,107
|
11,315,649
|
24,468
|
||||||||||||||||||||||||||||||
|
Foreign Currency
|
10,033,400
|
79,973
|
11,740,807
|
91,446
|
10,034,524
|
138,922
|
||||||||||||||||||||||||||||||
|
Total
|
20,148,835
|
114,761
|
22,348,657
|
117,553
|
21,350,173
|
163,390
|
||||||||||||||||||||||||||||||
|
Equity attributable to Credicorp equity holders
|
||||||||||||||||||||||||||||||||||||
|
Soles
|
||||||||||||||||||||||||||||||||||||
|
Foreign Currency
|
24,168,217
|
25,207,194
|
27,071,268
|
|||||||||||||||||||||||||||||||||
|
Total
|
24,168,217
|
25,207,194
|
27,071,268
|
|||||||||||||||||||||||||||||||||
|
Non-controlling interest
|
||||||||||||||||||||||||||||||||||||
|
Soles
|
||||||||||||||||||||||||||||||||||||
|
Foreign Currency
|
494,222
|
508,790
|
557,017
|
|||||||||||||||||||||||||||||||||
|
Total
|
494,222
|
508,790
|
557,017
|
|||||||||||||||||||||||||||||||||
|
Total non-interest-bearing liabilities and equity
|
||||||||||||||||||||||||||||||||||||
|
Soles
|
33,449,100
|
113,668
|
37,960,238
|
93,050
|
34,424,834
|
136,351
|
||||||||||||||||||||||||||||||
|
Foreign Currency
|
58,077,880
|
145,354
|
70,089,680
|
152,668
|
67,655,341
|
210,614
|
||||||||||||||||||||||||||||||
|
Total
|
91,526,980
|
259,022
|
108,049,918
|
245,718
|
102,080,175
|
346,965
|
||||||||||||||||||||||||||||||
|
Total average liabilities and equity
|
||||||||||||||||||||||||||||||||||||
|
Soles
|
104,303,307
|
1,505,267
|
1.44
|
115,875,726
|
1,156,638
|
1.00
|
108,211,465
|
2,010,413
|
1.86
|
|||||||||||||||||||||||||||
|
Foreign Currency
|
114,354,624
|
1,473,429
|
1.29
|
131,053,681
|
1,334,164
|
1.02
|
131,478,910
|
1,482,774
|
1.13
|
|||||||||||||||||||||||||||
|
Total
|
218,657,931
|
2,978,696
|
1.36
|
246,929,407
|
2,490,802
|
1.01
|
239,690,375
|
3,493,187
|
1.46
|
|||||||||||||||||||||||||||
| (1) |
Interest and average rate paid include the amount paid for the applicable deposit insurance fund.
|
| (2) |
We typically do not pay interest for demand deposits; however, in exceptional circumstances the Group pays interest on certain demand deposits of corporate clients that hold balances exceeding certain amounts. See “7.4 Deposits” for
the amounts of non-interest-bearing demand deposits and interest-bearing demand deposits as of December 31, 2020, 2021 and 2022. Interest paid on demand deposits is not considered material.
|
7.1.1 Changes in net interest, similar income, and expense: volume and rate analysis
The table below sets forth the net effect on annual variation in interest income and interest expense of increases and decreases due to changes in volume and rate. Volume and rate variations have been calculated
based on variations in average balances over the period and changes in average rates on interest-earning assets and interest-bearing liabilities from one period to the other. The net changes in “Interest and similar income” and “Interest and
similar expense” attributable to both changes in functional currency (Sol) and changes in foreign currency also are presented in the table:
|
2021/2020
|
2022/2021 | |||||||||||||||||||||||
|
Increase/(Decrease) due to changes in:
|
Increase/(Decrease) due to changes in:
|
|||||||||||||||||||||||
|
Volume
|
Rate
|
Net Change
|
Volume
|
Rate
|
Net Change
|
|||||||||||||||||||
|
(in thousands of Soles)
|
||||||||||||||||||||||||
|
Interest and similar income (1):
|
||||||||||||||||||||||||
|
Interest-earning deposits in BCRP
|
||||||||||||||||||||||||
|
Soles
|
4,516
|
16,438
|
20,954
|
(59,771
|
)
|
82,691
|
22,920
|
|||||||||||||||||
|
Foreign Currency
|
1,755
|
(41,370
|
)
|
(39,615
|
)
|
11,485
|
305,617
|
317,102
|
||||||||||||||||
|
Total
|
6,271
|
(24,932
|
)
|
(18,661
|
)
|
(48,286
|
)
|
388,308
|
340,022
|
|||||||||||||||
|
Deposits in other banks
|
||||||||||||||||||||||||
|
Soles
|
(643
|
)
|
(1,541
|
)
|
(2,184
|
)
|
1,099
|
12,743
|
13,842
|
|||||||||||||||
|
Foreign Currency
|
5,366
|
(9,697
|
)
|
(4,331
|
)
|
(18,973
|
)
|
74,003
|
55,030
|
|||||||||||||||
|
Total
|
4,723
|
(11,238
|
)
|
(6,515
|
)
|
(17,874
|
)
|
86,746
|
68,872
|
|||||||||||||||
|
Investment securities
|
||||||||||||||||||||||||
|
Soles
|
144,351
|
(38,229
|
)
|
106,122
|
(228,718
|
)
|
649,929
|
421,211
|
||||||||||||||||
|
Foreign Currency
|
135,349
|
(86,842
|
)
|
48,507
|
(47,683
|
)
|
113,373
|
65,690
|
||||||||||||||||
|
Total
|
279,700
|
(125,071
|
)
|
154,629
|
(276,401
|
)
|
763,302
|
486,901
|
||||||||||||||||
|
Total loans (2)
|
||||||||||||||||||||||||
|
Soles
|
930,389
|
(837,030
|
)
|
93,359
|
317,407
|
1,645,083
|
1,962,490
|
|||||||||||||||||
|
Foreign Currency
|
94,352
|
(44,865
|
)
|
49,487
|
121,106
|
165,005
|
286,111
|
|||||||||||||||||
|
Total
|
1,024,741
|
(881,895
|
)
|
142,846
|
438,513
|
1,810,088
|
2,248,601
|
|||||||||||||||||
|
Total dividend-earning assets
|
||||||||||||||||||||||||
|
Soles
|
(5,237
|
)
|
20,908
|
15,671
|
(2,188
|
)
|
(6,742
|
)
|
(8,930
|
)
|
||||||||||||||
|
Foreign Currency
|
(20,707
|
)
|
20,070
|
(637
|
)
|
(8,568
|
)
|
6,087
|
(2,481
|
)
|
||||||||||||||
|
Total
|
(25,944
|
)
|
40,978
|
15,034
|
(10,756
|
)
|
(655
|
)
|
(11,411
|
)
|
||||||||||||||
|
Total interest-earning assets
|
||||||||||||||||||||||||
|
Soles
|
1,113,434
|
(879,512
|
)
|
233,922
|
(412,105
|
)
|
2,823,638
|
2,411,533
|
||||||||||||||||
|
Foreign Currency
|
343,775
|
(290,364
|
)
|
53,411
|
(29,435
|
)
|
750,887
|
721,452
|
||||||||||||||||
|
Total
|
1,457,209
|
(1,169,876
|
)
|
287,333
|
(441,540
|
)
|
3,574,525
|
3,132,985
|
||||||||||||||||
|
Interest and similar expense:
|
||||||||||||||||||||||||
|
Demand deposits
|
||||||||||||||||||||||||
|
Soles
|
11,710
|
(23,648
|
)
|
(11,938
|
)
|
(15,464
|
)
|
60,404
|
44,940
|
|||||||||||||||
|
Foreign Currency
|
21,611
|
(25,770
|
)
|
(4,159
|
)
|
(5,632
|
)
|
16,102
|
10,470
|
|||||||||||||||
|
Total
|
33,321
|
(49,418
|
)
|
(16,097
|
)
|
(21,096
|
)
|
76,506
|
55,410
|
|||||||||||||||
|
Savings deposits
|
||||||||||||||||||||||||
|
Soles
|
29,902
|
(2,798
|
)
|
27,104
|
(452
|
)
|
(15,489
|
)
|
(15,941
|
)
|
||||||||||||||
|
Foreign Currency
|
20,784
|
(3,652
|
)
|
17,132
|
9,982
|
(2,480
|
)
|
7,502
|
||||||||||||||||
|
Total
|
50,686
|
(6,450
|
)
|
44,236
|
9,530
|
(17,969
|
)
|
(8,439
|
)
|
|||||||||||||||
|
Time deposits
|
||||||||||||||||||||||||
|
Soles
|
(67,777
|
)
|
(213,782
|
)
|
(281,559
|
)
|
71,929
|
565,541
|
637,470
|
|||||||||||||||
|
Foreign Currency
|
(1,376
|
)
|
(37,459
|
)
|
(38,835
|
)
|
26,190
|
128,655
|
154,845
|
|||||||||||||||
|
Total
|
(69,153
|
)
|
(251,241
|
)
|
(320,394
|
)
|
98,119
|
694,196
|
792,315
|
|||||||||||||||
|
Due to banks and correspondents and issued bonds
|
||||||||||||||||||||||||
|
Soles
|
6,588
|
(5,407
|
)
|
1,181
|
60,654
|
99,976
|
160,630
|
|||||||||||||||||
|
Foreign Currency
|
(33,229
|
)
|
(30,624
|
)
|
(63,853
|
)
|
2,395
|
48,299
|
50,694
|
|||||||||||||||
|
Total
|
(26,641
|
)
|
(36,031
|
)
|
(62,672
|
)
|
63,049
|
148,275
|
211,324
|
|||||||||||||||
|
Bonds
|
||||||||||||||||||||||||
|
Soles
|
(14,395
|
)
|
(11,741
|
)
|
(26,136
|
)
|
(10,459
|
)
|
2,001
|
(8,458
|
)
|
|||||||||||||
|
Foreign Currency
|
67,245
|
(88,045
|
)
|
(20,800
|
)
|
(12,529
|
)
|
(87,772
|
)
|
(100,301
|
)
|
|||||||||||||
|
Total
|
52,850
|
(99,786
|
)
|
(46,936
|
)
|
(22,988
|
)
|
(85,771
|
)
|
(108,759
|
)
|
|||||||||||||
|
Payables from repurchase agreements
|
||||||||||||||||||||||||
|
Soles
|
43,583
|
(92,184
|
)
|
(48,601
|
)
|
(64,990
|
)
|
101,763
|
36,773
|
|||||||||||||||
|
Foreign Currency
|
45
|
(18,608
|
)
|
(18,563
|
)
|
(5,082
|
)
|
(16,994
|
)
|
(22,076
|
)
|
|||||||||||||
|
Total
|
43,628
|
(110,792
|
)
|
(67,164
|
)
|
(70,072
|
)
|
84,769
|
14,697
|
|||||||||||||||
|
Total interest-bearing liabilities
|
||||||||||||||||||||||||
|
Soles
|
117,538
|
(445,549
|
)
|
(328,011
|
)
|
(80,614
|
)
|
891,088
|
810,474
|
|||||||||||||||
|
Foreign Currency
|
100,727
|
(247,307
|
)
|
(146,580
|
)
|
56,209
|
34,456
|
90,665
|
||||||||||||||||
|
Total
|
218,265
|
(692,856
|
)
|
(474,591
|
)
|
(24,405
|
)
|
925,544
|
901,139
|
|||||||||||||||
|
(1)
|
Annual changes due to interest earned or spent are reflected in the volume and rate indicated. Which is calculated as follows:
|
|
-
|
Volume: The variation in volume from one year to the next, multiplied by the average rate yield.
|
|
-
|
Rate: The average volume from one year to the next, multiplied by the rate yield variance
|
|
-
|
Net change: The sum of the volume and the calculated rate.
|
|
(2)
|
Figures for total loans include internal overdue loans, but do not include accrued but unpaid interest on such internal overdue loans in the year in which such loans internal overdue
loans. Accrued interest is included.
|
7.1.2 Average interest-earning assets, net interest margin (NIM), and yield spread
The following table shows, for each of the periods indicated, the levels of average interest-earning assets, net interest income, gross yield, NIM and yield spread by currency, all on a nominal basis:
|
Year ended December 31,
|
||||||||||||
|
2020
|
2021
|
2022
|
||||||||||
|
(in thousands of Soles, except percentages)
|
||||||||||||
|
Average interest-earning assets (1)
|
||||||||||||
|
Soles
|
119,628,338
|
135,695,800
|
130,306,543
|
|||||||||
|
Foreign Currency
|
86,980,761
|
98,213,513
|
97,318,196
|
|||||||||
|
Total
|
206,609,099
|
233,909,313
|
227,624,739
|
|||||||||
|
Net interest income from interest-earning assets
|
||||||||||||
|
Soles
|
7,310,418
|
7,872,351
|
9,473,410
|
|||||||||
|
Foreign Currency
|
1,470,321
|
1,670,312
|
2,301,100
|
|||||||||
|
Total (2)
|
8,780,739
|
9,542,663
|
11,774,510
|
|||||||||
|
Gross yield (3)
|
||||||||||||
|
Soles
|
7.27
|
%
|
6.59
|
%
|
8.71
|
%
|
||||||
|
Foreign Currency
|
3.22
|
%
|
2.90
|
%
|
3.67
|
%
|
||||||
|
Weighted-average rate
|
5.57
|
%
|
5.04
|
%
|
6.55
|
%
|
||||||
|
NIM (4)
|
||||||||||||
|
Soles
|
6.11
|
%
|
5.80
|
%
|
7.27
|
%
|
||||||
|
Foreign Currency
|
1.69
|
%
|
1.70
|
%
|
2.36
|
%
|
||||||
|
Weighted-average rate
|
4.25
|
%
|
4.08
|
%
|
5.17
|
%
|
||||||
|
Yield spread (5)
|
||||||||||||
|
Soles
|
5.31
|
%
|
5.22
|
%
|
6.17
|
%
|
||||||
|
Foreign Currency
|
0.86
|
%
|
0.97
|
%
|
1.68
|
%
|
||||||
|
Weighted-average rate
|
3.43
|
%
|
3.42
|
%
|
4.27
|
%
|
||||||
|
(1)
|
Monthly average balances.
|
|
(2)
|
Net interest income includes the interest earned on total interest-earning assets and interest paid on total interest-bearing liabilities, as shown in section “7.1 Average statements
of financial position and income from interest-earning assets”.
|
|
(3)
|
Gross yield is interest income divided by average interest-earning assets.
|
|
(4)
|
NIM represents “Net interest income from interest-earning assets” divided by “Average interest-earning assets”, both computed on a monthly basis.
|
|
(5)
|
Yield spread on a nominal basis, represents the difference between gross yield on average interest-earning assets and average cost of interest-bearing liabilities.
|
7.1.3 Interest-earning deposits with other banks
The following table shows the short-term funds deposited with other banks. These deposits are denominated by currency as of the dates indicated. Deposits held in countries other than Peru are denominated in
several currencies; however, the majority of these deposits are denominated in US Dollars. All currencies were converted to Soles using the applicable SBS exchange rate as of the dates indicated.
|
Year ended December 31,
|
||||||||||||
|
2020
|
2021
|
2022
|
||||||||||
|
(in thousands of Soles)
|
||||||||||||
|
Sol-denominated:
|
||||||||||||
|
BCRP
|
6,980,064
|
2,500,242
|
717,206
|
|||||||||
|
Commercial banks
|
436,218
|
280,009
|
504,155
|
|||||||||
|
Total Sol-denominated
|
7,416,282
|
2,780,251
|
1,221,361
|
|||||||||
|
Foreign Currency-denominated:
|
||||||||||||
|
BCRP (US Dollars)
|
19,023,351
|
22,679,713
|
22,945,184
|
|||||||||
|
Commercial banks (US Dollars)
|
1,838,676
|
6,700,668
|
2,470,951
|
|||||||||
|
Commercial banks (other currencies)
|
298,073
|
234,776
|
259,720
|
|||||||||
|
Total Foreign Currency-denominated
|
21,160,100
|
29,615,157
|
25,675,855
|
|||||||||
|
Total
|
28,576,382
|
32,395,408
|
26,897,216
|
|||||||||
As of December 31, 2020, 2021 and 2022, the Group classified its investments in one of the categories defined by IFRS 9 based on the business model for managing the financial assets and the characteristics of the
contractual cash flows of the investment.
For information about how we classify and measure investments, refer to Note 3(f) (Significant Accounting Policies: Financial Instruments: Initial recognition and subsequent measurement) to the consolidated
financial statements.
The following table shows, for 2020, 2021 and 2022, the fair value of our investments at fair value through profit or loss, investments at fair value through other comprehensive income and the amortized cost of
our investments at amortized cost under IFRS 9, in each case, without accrued interest and broken down by type of security at the dates indicated.
|
Year ended December 31,
|
||||||||||||
|
2020
|
2021
|
2022
|
||||||||||
|
(in thousands of Soles)
|
||||||||||||
|
Sol-denominated:
|
||||||||||||
|
Government treasury bonds
|
15,861,567
|
14,610,773
|
15,307,031
|
|||||||||
|
Certificates of deposit BCRP
|
15,364,282
|
8,337,432
|
7,019,479
|
|||||||||
|
Corporate bonds
|
5,353,190
|
5,235,958
|
4,297,784
|
|||||||||
|
Securitization instruments
|
373,133
|
398,089
|
384,891
|
|||||||||
|
Subordinated bonds
|
155,426
|
121,442
|
108,830
|
|||||||||
|
Negotiable Certificates of Deposit
|
-
|
6,755
|
5,951
|
|||||||||
|
Equity securities
|
484,417
|
358,450
|
319,686
|
|||||||||
|
Restricted mutual funds
|
436,770
|
365,774
|
350,805
|
|||||||||
|
Other investments of equity
|
327,352
|
144,886
|
197,921
|
|||||||||
|
Other investments of debt
|
95,664
|
165,391
|
73,424
|
|||||||||
|
Total Sol-denominated
|
38,451,801
|
29,744,950
|
28,065,802
|
|||||||||
|
Foreign currency- denominated:
|
||||||||||||
|
Government treasury bonds
|
2,697,579
|
3,325,653
|
3,560,187
|
|||||||||
|
Certificates of deposit BCRP
|
1,872,875
|
1,111,142
|
-
|
|||||||||
|
Corporate bonds
|
8,231,914
|
10,072,583
|
9,028,802
|
|||||||||
|
Securitization instruments
|
377,515
|
324,868
|
327,900
|
|||||||||
|
Subordinated bonds
|
159,318
|
295,182
|
384,994
|
|||||||||
|
Negotiable Certificates of Deposit
|
900,292
|
627,106
|
579,807
|
|||||||||
|
Equity securities
|
307,482
|
110,105
|
64,489
|
|||||||||
|
Participation in RAL Funds
|
278,819
|
323,139
|
167,781
|
|||||||||
|
Restricted mutual funds
|
111
|
180
|
512
|
|||||||||
|
Other investments of equity
|
1,180,787
|
2,243,315
|
2,297,427
|
|||||||||
|
Other investments of debt
|
187,691
|
195,636
|
336,166
|
|||||||||
|
Total foreign currency- denominated
|
16,194,383
|
18,628,909
|
16,748,065
|
|||||||||
|
Total securities holdings (1)
|
54,646,184
|
48,373,859
|
44,813,867
|
|||||||||
| (1) |
Excludes accrued interest, which amounts to S/528.3 million, S/578.7 million and S/617.4 million as of December 31, 2020, 2021 and 2022, respectively. Also excludes provision for credit losses on investment at amortized cost.
|
The allowance for decline in value of marketable securities is debited from the value of each individual security.
The weighted-average yield on our Sol-denominated interest-earning investment securities was 3.2% in 2020, 3.1% in 2021 and 5.1% in 2022.
The weighted-average yield on our foreign currency-denominated portfolio was 2.7% in 2020, 2.2% in 2021 and 2.8% in 2022. The total weighted-average yield of our investment securities was 3.1% in 2020, 2.8 in
2021 and 4.2% in 2022.
The weighted-average yield on our Sol-denominated dividend-earning assets was 1.7% in 2020, 6.6% in 2021 and 4.7% in 2022. The weighted-average yield on our foreign currency-denominated portfolio was 5.7% in
2020, 15.3% in 2021 and 2.3% in 2022. The total weighted-average yield of our dividend-earning assets was 3.2% in 2020, 8.7% in 2021 and 7.6% in 2022.
As of December 31, 2022, the investments at fair value through other comprehensive income and investments at amortized cost pledged as collateral amounted to S/4,648.6 million. The following tables show the
weighted average yield separate by maturity of investments at fair value through other comprehensive income and at amortized cost in each case, without accrued interest as of December 31, 2022:
Investments at fair value with changes in other comprehensive income:
|
Without
maturity
|
Within 1 year
|
Weighted
average yield (1)
|
After 1 year
but within
3 years |
Weighted
average
yield (1)
|
Maturing after
3 years but
within 5 years
|
Weighted
average
yield (1)
|
Maturing after
5 years but
within 10
years
|
Weighted
average
yield (1)
|
After 10 years
|
Weighted
average
yield (1)
|
Total
|
|||||||||||||||||||||||||||||||||||||
|
(in thousands of Soles)
|
||||||||||||||||||||||||||||||||||||||||||||||||
|
Sol-denominated:
|
||||||||||||||||||||||||||||||||||||||||||||||||
|
Government treasury bonds
|
-
|
5,934
|
6.81
|
%
|
1,227,866
|
5.90
|
%
|
949,133
|
6.70
|
%
|
1,944,284
|
7.41
|
%
|
1,606,788
|
7.07
|
%
|
5,734,005
|
|||||||||||||||||||||||||||||||
|
Certificates of deposit BCRP
|
-
|
7,019,479
|
7.34
|
%
|
-
|
-
|
-
|
-
|
-
|
-
|
-
|
-
|
7,019,479
|
|||||||||||||||||||||||||||||||||||
|
Corporate bonds
|
-
|
484,663
|
8.11
|
%
|
674,116
|
7.64
|
%
|
809,740
|
8.27
|
%
|
1,258,639
|
7.91
|
%
|
1,066,710
|
8.77
|
%
|
4,293,868
|
|||||||||||||||||||||||||||||||
|
Securitization instruments
|
-
|
-
|
-
|
22,804
|
10.37
|
%
|
14,203
|
8.19
|
%
|
77,395
|
8.61
|
%
|
269,497
|
10.20
|
%
|
383,899
|
||||||||||||||||||||||||||||||||
|
Negotiable Certificates of Deposit
|
-
|
5,950
|
8.76
|
%
|
-
|
-
|
-
|
-
|
-
|
-
|
-
|
-
|
5,950
|
|||||||||||||||||||||||||||||||||||
|
Subordinated bonds
|
-
|
17,368
|
4.68
|
%
|
55,156
|
6.99
|
%
|
6,834
|
8.07
|
%
|
29,472
|
9.54
|
%
|
-
|
-
|
108,830
|
||||||||||||||||||||||||||||||||
|
Other investments of debt
|
-
|
33,883
|
2.22
|
%
|
-
|
-
|
12,398
|
4.67
|
%
|
21,024
|
5.45
|
%
|
6,119
|
9.56
|
%
|
73,424
|
||||||||||||||||||||||||||||||||
|
Equity securities
|
318,737
|
-
|
-
|
-
|
-
|
-
|
-
|
-
|
-
|
-
|
-
|
318,737
|
||||||||||||||||||||||||||||||||||||
|
Total Sol-denominated
|
318,737
|
7,567,277
|
1,979,942
|
1,792,308
|
3,330,814
|
2,949,114
|
17,938,192
|
|||||||||||||||||||||||||||||||||||||||||
|
Foreign Currency-denominated:
|
||||||||||||||||||||||||||||||||||||||||||||||||
|
Government treasury bonds
|
-
|
2,041,861
|
3.77
|
%
|
180,821
|
5.07
|
%
|
152,452
|
6.83
|
%
|
132,994
|
4.71
|
%
|
286,578
|
5.95
|
%
|
2,794,706
|
|||||||||||||||||||||||||||||||
|
Corporate bonds
|
-
|
889,570
|
6.37
|
%
|
1,657,795
|
5.85
|
%
|
2,189,073
|
5.66
|
%
|
1,851,127
|
6.58
|
%
|
1,899,265
|
6.34
|
%
|
8,486,830
|
|||||||||||||||||||||||||||||||
|
Securitization instruments
|
-
|
21,737
|
4.58
|
%
|
30,253
|
4.41
|
%
|
10,774
|
4.66
|
%
|
65,855
|
6.55
|
%
|
154,406
|
11.72
|
%
|
283,025
|
|||||||||||||||||||||||||||||||
|
Negotiable Certificates of Deposit
|
-
|
162,036
|
4.42
|
%
|
179,883
|
3.59
|
%
|
217,406
|
4.01
|
%
|
17,019
|
4.39
|
%
|
3,464
|
2.58
|
%
|
579,808
|
|||||||||||||||||||||||||||||||
|
Subordinated bonds
|
-
|
149,196
|
5.52
|
%
|
37,072
|
6.03
|
%
|
12,793
|
6.50
|
%
|
32,522
|
6.78
|
%
|
19,693
|
5.81
|
%
|
251,276
|
|||||||||||||||||||||||||||||||
|
Other investments of debt
|
-
|
15,114
|
7.01
|
%
|
22,712
|
8.41
|
%
|
-
|
-
|
-
|
-
|
-
|
-
|
37,826
|
||||||||||||||||||||||||||||||||||
|
Equity securities
|
17,618
|
-
|
-
|
-
|
-
|
-
|
-
|
-
|
-
|
-
|
-
|
17,618
|
||||||||||||||||||||||||||||||||||||
|
Total Foreign Currency-denominated
|
17,618
|
3,279,514
|
2,108,536
|
2,582,498
|
2,099,517
|
2,363,406
|
12,451,089
|
|||||||||||||||||||||||||||||||||||||||||
|
Total securities holdings:
|
336,355
|
10,846,791
|
4,088,478
|
4,374,806
|
5,430,331
|
5,312,520
|
30,389,281
|
|||||||||||||||||||||||||||||||||||||||||
|
(1)
|
Yields on non-taxable investment securities have not been calculated on a tax-equivalent basis because the effect of such calculation would not be material.
|
Investments at amortized cost:
|
Without
maturity
|
Within 1 year
|
Weighted
average
yield (1)
|
After 1 year
but within
3 years |
Weighted
average
yield (1)
|
Maturing after
3 years but
within 5 years
|
Weighted
average
yield (1)
|
Maturing after
5 years but
within 10
years
|
Weighted
average
yield (1)
|
After 10 years
|
Weighted
average
yield (1)
|
Total
|
|||||||||||||||||||||||||||||||||||||
|
(in thousands of Soles)
|
||||||||||||||||||||||||||||||||||||||||||||||||
|
Sol-denominated:
|
||||||||||||||||||||||||||||||||||||||||||||||||
|
Government treasury bonds
|
-
|
113,485
|
6.86
|
%
|
1,249,514
|
6.65
|
%
|
433,902
|
6.70
|
%
|
4,778,322
|
7.75
|
%
|
2,997,803
|
8.10
|
%
|
9,573,026
|
|||||||||||||||||||||||||||||||
|
Total Sol-denominated
|
-
|
113,485
|
1,249,514
|
433,902
|
4,778,322
|
2,997,803
|
9,573,026
|
|||||||||||||||||||||||||||||||||||||||||
|
Foreign Currency-denominated:
|
||||||||||||||||||||||||||||||||||||||||||||||||
|
Government treasury bonds
|
-
|
114,262
|
7.06
|
%
|
-
|
-
|
-
|
-
|
-
|
-
|
-
|
-
|
114,262
|
|||||||||||||||||||||||||||||||||||
|
Corporate bonds
|
-
|
264,309
|
6.91
|
%
|
172,354
|
5.71
|
%
|
5,895
|
6.76
|
%
|
-
|
-
|
-
|
-
|
442,558
|
|||||||||||||||||||||||||||||||||
|
Subordinated bonds
|
-
|
17,190
|
5.71
|
%
|
14,628
|
6.47
|
%
|
17,779
|
4.59
|
%
|
-
|
-
|
-
|
-
|
49,597
|
|||||||||||||||||||||||||||||||||
|
Other investments of debt
|
-
|
25,522
|
6.96
|
%
|
20,034
|
7.42
|
%
|
2,028
|
7.53
|
%
|
-
|
-
|
-
|
-
|
47,584
|
|||||||||||||||||||||||||||||||||
|
Total Foreign Currency-denominated
|
-
|
421,283
|
207,016
|
25,702
|
-
|
-
|
654,001
|
|||||||||||||||||||||||||||||||||||||||||
|
Total securities holdings:
|
-
|
534,768
|
1,456,530
|
459,604
|
4,778,322
|
2,997,803
|
10,227,027
|
|||||||||||||||||||||||||||||||||||||||||
| (1) |
Yields on non-taxable investment securities have not been calculated on a tax-equivalent basis because the effect of such calculation would not be material.
|
The maturities of our investment securities classified as fair value through other comprehensive income, as of December 31, 2022, are described in “ITEM 11. QUANTITATIVE AND QUALITATIVE DISCLOSURES ABOUT RISK
MANAGEMENT”.
As of December 31, 2020, 2021 and 2022, the Group had in investments at fair value with changes in other comprehensive income 153,760, 83,494 and 70,253 certificates of deposit of the BCRP, respectively, which
are instruments issued at discount through public auction, negotiated in the Peruvian secondary market and payable in soles.
Pursuant to the criteria described below, our management has determined that the unrealized losses of our investments at fair value through other comprehensive income, as of December 31, 2020, 2021 and 2022,
amounting to S/94.4 million, S/999.0 million and S/2,011.4 million, respectively, were temporary, and we intend to hold each investment for a sufficient period of time to allow for a potential recovery in fair value. This holding period will
last until the earlier of the investment’s recovery or maturity.
As of December 31, 2020, 2021 and 2022, for debt instruments measured at amortized cost or fair value through other comprehensive income, the management establishes a three-stage expected credit loss model, based
on whether there has been a significant increase in the credit risk of the financial asset since its initial recognition. These three stages determine the amount of expected credit loss (ECL) to be recognized at each reporting date.
The ECL is an estimate that considers multiple forward-looking macro-economic scenarios that result in more timely recognition of credit losses.
Management considers a number of factors to determine whether to hold an investment, including (i) a quantitative estimate of the expected recovery period (which may extend to maturity), (ii) the severity of the
impairment and (iii) its strategy with respect to the security or portfolio. If management determines it is not desirable to hold the security for a sufficient period of time to allow for a potential recovery in the security’s amortized cost,
we record the unrealized loss in our consolidated income statement.
Except where otherwise specified, references to loans in this section 7.3 are to our direct loans. Our direct loans are distinct from our indirect loans (which are discussed in Note 21(a) of our consolidated
financial statements) and our due from customers on banker’s acceptances (which are discussed in Note 3(r) of our consolidated financial statements).
7.3.1 Loans by type of loan
The following table shows our loans by type of loan, at the dates indicated:
|
As of December 31,
|
||||||||||||
|
2020
|
2021
|
2022
|
||||||||||
|
(in thousands of Soles)
|
||||||||||||
|
Loans (1)
|
120,842,725
|
126,247,209
|
125,790,501
|
|||||||||
|
Leasing receivables
|
5,775,917
|
6,446,450
|
6,174,850
|
|||||||||
|
Discounted notes
|
1,483,723
|
2,718,321
|
2,982,291
|
|||||||||
|
Factoring receivables
|
2,153,689
|
3,572,697
|
3,976,898
|
|||||||||
|
Advances and overdrafts in current account
|
52,807
|
69,238
|
219,932
|
|||||||||
|
Refinanced and restructured loans
|
1,669,395
|
1,800,465
|
2,100,018
|
|||||||||
|
Total performing loans
|
131,978,256
|
140,854,380
|
141,244,490
|
|||||||||
|
Internal overdue loans
|
4,685,569
|
5,562,439
|
5,945,779
|
|||||||||
|
Unearned interest
|
(201,429
|
)
|
(99,669
|
)
|
(80,857
|
)
|
||||||
|
Accrued interest
|
1,197,489
|
1,280,262
|
1,516,962
|
|||||||||
|
Total loans (2)
|
137,659,885
|
147,597,412
|
148,626,374
|
|||||||||
| (1) |
The credit card loans balance amounts to S/5,629.2 million, S/5,626.0 million and S/6,187.9 million for the years 2020, 2021 and 2022, respectively.
|
| (2) |
“Total loans” refers to “loans, net of unearned income” as disclosed in our consolidated financial statement, which refers to direct loans minus unearned interest plus accrued interest. See Note 7 to the consolidated financial
statements. In addition to loans outstanding, we had off-balance-sheet items that amounted to S/20,973.8 million, S/22,914.3 million, and S/20,928.1 million, as of December 31, 2020, 2021 and 2022 respectively. See Note 21 to the
consolidated financial statements.
|
The loan portfolio categories set forth in the table above are based on internal classifications, which apply to loans generated by BCP Stand-alone, SEAH, Mibanco, BCP Bolivia, Mibanco Colombia and ASB. We
categorize loans as follows:
| • |
Loans: Basic term loans documented by promissory notes and other extensions of credit, such as mortgage loans, credit cards and other consumer loans in various forms, including trade finance loans to importers and exporters on
specialized terms adapted to the needs of the international trade transaction.
|
| • |
Leasing receivables: Transactions that involve our acquisition of an asset and the financial leasing of that asset to a client.
|
| • |
Discounted notes: Loans discounted at the outset (the client signs a promissory note or other evidence of indebtedness for the principal amount payable at a future date). Discounted loans also include discounting of drafts, where we
make a loan supported by a draft signed by one party and discounted by another party, with recourse to both parties.
|
| • |
Factoring receivables: The sale of title of a company’s account receivables to a bank (or financial company). The receivables are sold without recourse, and the bank cannot recover from the seller in the event that the accounts are
uncollectible. For factoring loans, the seller receives funds from the bank prior to the average maturity date based on the invoice amount of the receivable, less cash discounts and allowances for estimated claims and returns, among
other items.
|
| • |
Advances and overdrafts in current account: Extensions of credit to clients by way of an overdraft facility in the client’s checking account. This category also includes secured short-term advances.
|
| • |
Refinanced loans: Loans that were refinanced because the client was unable to pay at maturity. A loan is categorized as a refinanced loan when the debtor is experiencing payment problems and asks for a new payment schedule that will
allow the debtor to comply with the installments. This policy is based on internal models and past experience as well as IFRS.
|
| • |
Internal overdue loans: Includes overdue loans and under legal collection loans. See “ITEM 4. INFORMATION ON THE COMPANY – 4.B Business Overview – (7) Selected statistical information – 7.3 Loan Portfolio – 7.3.9 Internal overdue
Loan Portfolio” for further detail.
|
7.3.2 Loans by economic activity
The following table shows our total loan portfolio composition, net of unearned interest, based on the borrower’s principal economic activity:
|
As of December 31,
|
||||||||||||||||||||||||
|
2020
|
2021
|
2022
|
||||||||||||||||||||||
|
(in thousands of Soles, except percentages)
|
||||||||||||||||||||||||
|
Amount
|
% Total
|
Amount
|
% Total
|
Amount
|
% Total
|
|||||||||||||||||||
|
Economic Activity
|
||||||||||||||||||||||||
|
Mortgage Loans
|
20,568,378
|
14.94
|
21,831,460
|
14.79
|
23,235,575
|
15.63
|
||||||||||||||||||
|
Commerce
|
26,440,537
|
19.21
|
28,675,217
|
19.43
|
27,514,281
|
18.51
|
||||||||||||||||||
|
Manufacturing
|
20,204,843
|
14.68
|
23,450,465
|
15.89
|
23,692,696
|
15.94
|
||||||||||||||||||
|
Consumer Loans
|
14,205,774
|
10.32
|
16,014,227
|
10.85
|
19,913,501
|
13.40
|
||||||||||||||||||
|
Realty Business and Leasing Services
|
12,648,755
|
9.19
|
12,019,162
|
8.14
|
10,509,631
|
7.07
|
||||||||||||||||||
|
Communication, Storage and Transportation
|
8,047,222
|
5.85
|
7,717,777
|
5.23
|
6,790,684
|
4.57
|
||||||||||||||||||
|
Community Services
|
7,897,438
|
5.74
|
8,014,016
|
5.43
|
6,773,948
|
4.56
|
||||||||||||||||||
|
Agriculture
|
4,330,378
|
3.15
|
4,864,701
|
3.30
|
5,041,284
|
3.39
|
||||||||||||||||||
|
Construction
|
4,066,692
|
2.95
|
4,099,452
|
2.78
|
3,778,676
|
2.54
|
||||||||||||||||||
|
Electricity, Gas and Water
|
3,742,212
|
2.72
|
4,637,316
|
3.14
|
4,965,556
|
3.34
|
||||||||||||||||||
|
Mining
|
3,702,900
|
2.69
|
4,774,821
|
3.24
|
4,027,209
|
2.71
|
||||||||||||||||||
|
Hotels and Restaurants
|
3,077,985
|
2.24
|
3,039,811
|
2.06
|
2,867,916
|
1.93
|
||||||||||||||||||
|
Financial Services
|
2,891,472
|
2.10
|
1,395,138
|
0.95
|
4,343,651
|
2.92
|
||||||||||||||||||
|
Education, Health and Other Services
|
1,855,636
|
1.35
|
1,962,405
|
1.33
|
1,715,239
|
1.15
|
||||||||||||||||||
|
Fishing
|
677,858
|
0.49
|
640,932
|
0.43
|
597,439
|
0.40
|
||||||||||||||||||
|
Others
|
2,305,745
|
1.66
|
3,279,919
|
2.22
|
1,422,983
|
0.97
|
||||||||||||||||||
|
Sub total
|
136,663,825
|
99.28
|
146,416,819
|
99.21
|
147,190,269
|
99.03
|
||||||||||||||||||
|
Unearned interest
|
(201,429
|
)
|
(0.15
|
)
|
(99,669
|
)
|
(0.07
|
)
|
(80,857
|
)
|
(0.05
|
)
|
||||||||||||
|
Earned interest
|
1,197,489
|
0.87
|
1,280,262
|
0.86
|
1,516,962
|
1.02|
|
||||||||||||||||||
|
Total
|
137,659,885
|
100.00
|
147,597,412
|
100.00
|
148,626,374
|
100.00
|
||||||||||||||||||
As of December 31, 2022, 91.32% and 6.23% of the loan portfolio was concentrated in Peru and Bolivia, respectively, which represent, separately, more than 57.33% and 3.91% of total assets of the Group,
respectively. As of December 31, 2021, 89.57% and 6.50% of the loan portfolio was concentrated in Peru and Bolivia, respectively.
7.3.3 Concentrations of loan portfolio and lending limits
As of December 31, 2022, loans and other off-balance-sheet exposure to our 20 largest customers (considered as economic groups) equaled S/18,644.4 million and represented 12.54% of our total loan portfolio. See
“ITEM 4. INFORMATION ON THE COMPANY – 4.B Business Overview (6) Supervision and Regulation – 6.2 Subsidiaries – 6.2.1 Peru” for the definition of “economic group”. Our total loans and other off-balance-sheet exposure outstanding to each of
these customers ranged from S/627.3 million to S/1,758.8 million, including 11 customers with over S/801.6 million. Total loans and other off-balance-sheet exposure outstanding to our 20 largest customers were ranked in the following risk
categories as of December 31, 2022: Class A (normal)—99.89%; Class B (potential problems)—0.11%; Class C (substandard)—0.00%; Class D (doubtful)—0.00% percent; and Class E (loss)—0.00%. For further information, see “– 7.3 Loan Portfolio – 7.3.7
Classification of the Loan Portfolio”.
BCP Stand-alone’s loans to a single borrower are subject to lending limits imposed by Law No. 26702. See “ITEM 4. INFORMATION ON THE COMPANY – 4.B Business Overview – (6) Supervision and Regulation – 6.2
Subsidiaries – 6.2.1 Peru”. The lending limits depend on the nature of the borrower involved and the type of collateral received. The sum of BCP Stand-alone’s loans and deposits in either another Peruvian universal bank or Peruvian financial
institution, plus any guarantees of third-party performance received by BCP Stand-alone from such institution, may not exceed 30% of BCP Stand-alone’s regulatory capital (as defined by the SBS). The sum of BCP Stand-alone’s loans and deposits
in non-Peruvian financial institutions, plus any guarantees of third-party performance received by BCP Stand-alone from such institutions, are limited to 5%, 10% or 30% of BCP Stand-alone’s regulatory capital, depending upon the level of
government supervision of the institution and whether the institution is recognized by the BCRP as an international bank of prime credit quality. The limits on lending to non-Peruvian financial institutions increase to 50% of BCP Stand-alone’s
regulatory capital if the amount by which such loans exceed the 5%, 10% or 30% limits is backed by certain letters of credit.
BCP Stand-alone’s loans to Directors and employees and their relatives have an aggregate limit of 7% of regulatory capital and an individual limit of 5% of such global limit.
Loans to non-Peruvian individuals or companies that are not financial institutions have a limit of 5% of BCP Stand-alone’s regulatory capital. However, this limit increases to 10% if the additional 5% is
guaranteed by a mortgage or certain publicly traded securities. The limit rises to 30% if the additional amount is guaranteed by certain banks or by cash deposits in BCP Stand-alone. Lending on an unsecured basis to individuals or companies
residing in Peru that are not financial institutions is limited to 10% of BCP Stand-alone’s regulatory capital. This limit rises to 15% if the additional 5% is guaranteed by a mortgage, certain securities, equipment or other collateral, and to
20% if the additional amount is either backed by certain debt instruments guaranteed by other local banks or a foreign bank determined by the BCRP to be of prime credit quality, or by other highly liquid securities at market value. The
single-borrower lending limit for loans backed by a cash deposit at BCP Stand-alone or by debt obligations of the BCRP is 30% of BCP Stand-alone’s regulatory capital.
Considering the regulatory capital of BCP Stand-alone, which amounted to S/23,364.3 million on December 31, 2022, BCP Stand-alone’s legal lending limits varied from S/1,168.2 million to S/11,682.2 million. The
Group’s consolidated lending limits, based on our regulatory capital on a consolidated basis of S/22,772.2 million on December 31, 2021, ranged from S/1,138.6 million to S/11,386.1 million. As of December 31, 2022, BCP Stand-alone was in
compliance with the lending limits of Law No. 26702.
As of December 31, 2022, we complied with the applicable legal lending limits in each of the jurisdictions in which we operate. These limits are calculated quarterly based upon our consolidated equity plus
reserves for impaired loans not specifically identified at quarter-end. We have also set internal lending limits, which are more restrictive than those imposed by law. A limited number of exceptions to our internal limits have been authorized
by our Board of Directors based on the credit quality of the borrower, the term of the loan, and the amount and quality of collateral provided. We may, in appropriate and limited circumstances, increase or choose to exceed these internal limits
as long as our credit exposure does not exceed the legal lending limits.
We may experience an adverse impact on our financial condition and results of operations if (i) customers to which we have significant credit exposure are not able to satisfy their obligations to us, and any
related collateral is not sufficient to cover these obligations, or (ii) a reclassification of one or more of these loans or other off-balance sheet exposure results in an increase in provisions for loan losses.
7.3.4 Loan portfolio denomination
The following table presents our Sol and foreign currency-denominated loan portfolio at the dates indicated:
|
As of December 31,
|
||||||||||||||||||||||||
|
2020
|
2021
|
2022
|
||||||||||||||||||||||
|
(in thousands of Soles, except percentages)
|
||||||||||||||||||||||||
|
Total loan portfolio:
|
||||||||||||||||||||||||
|
Sol-denominated
|
92,956,345
|
67.53
|
%
|
97,825,661
|
66.28
|
%
|
96,869,077
|
65.18
|
%
|
|||||||||||||||
|
Foreign Currency-denominated
|
44,703,540
|
32.47
|
%
|
49,771,751
|
33.72
|
%
|
51,757,297
|
34.82
|
%
|
|||||||||||||||
|
Total loans (1)
|
137,659,885
|
100.00
|
%
|
147,597,412
|
100.00
|
%
|
148,626,374
|
100.00
|
%
|
|||||||||||||||
| (1) |
Includes unearned interest and accrued interest
|
7.3.5 Maturity composition of the performing loan portfolio
The following table sets forth an analysis of our performing loan portfolio on December 31, 2022, by type and by time remaining to maturity. Loans are stated before deduction of the allowance for loan losses.
|
Maturing
|
||||||||||||||||||||
|
Amount at
December 31,
2022
|
Within 12
months
|
After 1 year but
within 5 years
|
After 5 years but
within 15 years
|
After 15 years
|
||||||||||||||||
|
(in thousands of Soles, except percentages)
|
||||||||||||||||||||
|
Loans
|
119,602,591
|
54,979,776
|
35,876,391
|
25,328,630
|
3,417,794
|
|||||||||||||||
|
Credit Cards
|
6,187,910
|
4,083,485
|
1,322,782
|
781,158
|
485
|
|||||||||||||||
|
Leasing receivables
|
6,174,850
|
2,861,606
|
3,116,543
|
196,701
|
-
|
|||||||||||||||
|
Discounted notes
|
2,982,291
|
2,896,353
|
2,085
|
83,853
|
-
|
|||||||||||||||
|
Factoring receivables
|
3,976,898
|
3,976,898
|
-
|
-
|
-
|
|||||||||||||||
|
Refinanced loans
|
2,100,018
|
512,398
|
831,749
|
753,991
|
1,880
|
|||||||||||||||
|
Advances and overdrafts in current account
|
219,932
|
219,932
|
-
|
(1
|
)
|
1
|
||||||||||||||
|
Total
|
141,244,490
|
69,530,448
|
41,149,550
|
27,144,332
|
3,420,160
|
|||||||||||||||
|
Internal overdue loans and under legal collection loans
|
5,945,779
|
|||||||||||||||||||
|
Unearned interest
|
(80,857
|
)
|
||||||||||||||||||
|
Accrued interest
|
1,516,962
|
|||||||||||||||||||
|
Total Loans
|
148,626,374
|
|||||||||||||||||||
|
% of total performing loan portfolio
|
100.00
|
%
|
49.23
|
%
|
29.13
|
%
|
19.22
|
%
|
2.42
|
%
|
||||||||||
7.3.6 Loan portfolio by interest rate type
The following table sets forth the breakdown of our loan portfolio as of December 31, 2022 by interest rate type, currency, and remaining maturity:
|
Amount at
December 31, 2022
|
Maturing
After 1 year
|
|||||||
|
(in thousands of Soles)
|
||||||||
|
Variable Rate
|
||||||||
|
Sol-denominated
|
58,885
|
45,640
|
||||||
|
Loans
|
58,885
|
45,640
|
||||||
|
Foreign Currency-denominated
|
2,433,162
|
2,063,686
|
||||||
|
Loans
|
2,366,314
|
2,006,436
|
||||||
|
Refinanced loans
|
4
|
4
|
||||||
|
Internal overdue loans and under legal collection loans
|
66,844
|
57,246
|
||||||
|
Total
|
2,492,047
|
2,109,326
|
||||||
|
Fixed Rate
|
||||||||
|
Sol-denominated
|
96,361,099
|
49,812,669
|
||||||
|
Loans
|
79,151,306
|
42,349,251
|
||||||
|
Leasing receivables
|
2,112,675
|
1,323,442
|
||||||
|
Credit cards
|
5,413,862
|
1,057,136
|
||||||
|
Factoring receivables
|
1,254,560
|
-
|
||||||
|
Discounted notes
|
1,618,363
|
-
|
||||||
|
Advances and overdrafts in current account
|
35,918
|
-
|
||||||
|
Refinanced loans
|
1,435,857
|
628,207
|
||||||
|
Internal overdue loans and under legal collection loans
|
5,338,558
|
4,454,633
|
||||||
|
Foreign Currency-denominated
|
48,337,123
|
19,792,047
|
||||||
|
Loans
|
38,026,086
|
16,608,643
|
||||||
|
Leasing receivables
|
4,062,175
|
1,978,647
|
||||||
|
Credit cards
|
774,048
|
248,183
|
||||||
|
Factoring receivables
|
1,727,731
|
3,941
|
||||||
|
Discounted notes
|
2,358,535
|
-
|
||||||
|
Advances and overdrafts in current account
|
184,014
|
1,206
|
||||||
|
Refinanced loans
|
664,157
|
446,882
|
||||||
|
Internal overdue loans and under legal collection loans
|
540,377
|
504,545
|
||||||
|
Total
|
144,698,222
|
69,604,716
|
||||||
|
Sub total
|
147,190,269
|
71,714,042
|
||||||
|
Unearned interest
|
(80,857
|
)
|
||||||
|
Accrued interest
|
1,516,962
|
|||||||
|
Total loans
|
148,626,374
|
|||||||
7.3.7 Classification of the loan portfolio
We classify Credicorp’s loan portfolio in accordance with internal practices. According to these criteria, all loans and other credits are classified into one of four categories based upon the purpose of the
loan. These categories are:
| (1) |
Commercial loans, which generally finance the production and sale of goods and services, including commercial leases, as well as credit card debt on cards held by business entities.
|
| (2) |
Microbusiness loans, which are exclusively targeted for the production and sale of goods and services, are made to individuals or companies with no more than S/300,000 in total loans received from the financial system (excluding
mortgage loans).
|
| (3) |
Consumer loans, which are generally granted to individuals, including credit card transactions, overdrafts on personal demand deposit accounts, leases, and financing goods or services not related to a business activity.
|
| (4) |
Residential mortgage loans, which are all the loans granted to individuals for the purchase, construction, remodeling, subdivision or improvement of the individual’s home, in each case backed by a mortgage. Mortgage loans made to
Directors and employees of a company are also considered residential mortgage loans. Mortgage-backed loans are considered commercial loans.
|
The following table sets forth our loan portfolio by class at the dates indicated:
|
As of December 31,
|
||||||||||||
|
2020
|
2021
|
2022
|
||||||||||
|
(in thousands of Soles)
|
||||||||||||
|
Commercial loans
|
79,899,769
|
87,006,950
|
81,668,900
|
|||||||||
|
Residential mortgage loans
|
20,568,378
|
21,831,460
|
23,235,575
|
|||||||||
|
Micro-business loans
|
21,989,904
|
21,582,601
|
22,372,293
|
|||||||||
|
Consumer loans
|
14,205,774
|
15,995,808
|
19,913,501
|
|||||||||
|
Total
|
136,663,825
|
146,416,819
|
147,190,269
|
|||||||||
|
Accrued interest
|
1,197,489
|
1,280,262
|
1,516,962
|
|||||||||
|
Unearned interest
|
(201,429
|
)
|
(99,669
|
)
|
(80,857
|
)
|
||||||
|
Total loans
|
137,659,885
|
147,597,412
|
148,626,374
|
|||||||||
We employ a range of policies and practices to mitigate credit risk. Our usual practice is to take security for fund advances. We implement guidelines on the acceptability of specific classes of collateral or
credit risk mitigation. The principal collateral types for loans and advances are mortgages over residential properties, liens over business assets (such as premises, inventory and accounts receivable), and liens over financial instruments
(such as debt securities and equities).
Long term financing and lending to corporate entities are generally secured, while revolving individual credit facilities are generally unsecured. In order to minimize credit loss, we seek additional collateral
as soon as impairment indicators become apparent.
We determine the appropriate collateral to hold as security for financial assets (other than loans) according to the nature of the instrument. Debt securities, treasury and other eligible bills are generally
unsecured, except for asset-backed securities and other similar instruments, which are secured by portfolios of financial instruments.
Our management monitors the market value of collateral, requests additional collateral in accordance with the underlying agreement, and monitors the market value of the additional collateral obtained during its
review of the allowance for impairment losses. Our policy is to dispose of repossessed properties in an orderly manner. We use the proceeds to reduce or repay the outstanding claim. In general, we do not use repossessed properties for our own
business.
We review our loan portfolio on a continuing basis and we classify our loans based upon risk by assessing the following factors: (i) the payment history of the particular loans, (ii) the history of our dealings
with the borrower, (iii) the borrower’s management, (iv) the borrower’s operating history, (v) the borrower’s repayment capability, (vi) the borrower’s availability of funds, (vii) the status of collaterals or guarantees, (viii) the borrower’s
financial statements, (ix) the general risk of the sector in which the borrower operates, (x) the borrower’s risk classification made by other financial institutions and (xi) other relevant factors.
In accordance with IFRS7, we classify our loan portfolio, according to its credit risk quality, in one of the three following levels:
| • |
Loans neither past due nor impaired: this level comprises those direct loans which are zero days past due and which are not in default.
|
| • |
Past due but unimpaired loans: this level comprises those direct loans for which debtors have failed to make a payment on the contractually agreed due date but are not in default.
|
| • |
Impaired loans: this level comprises all the direct loans in default.
|
We continually review our loan portfolio to assess the completeness and accuracy of our loan classifications.
We assess financial guarantees and letters of credit in the same way we assess loans.
When a borrower is in a country where there is an increased risk of difficulty servicing external debt, we assess the political and economic conditions in that country and factor additional country risk into our
assessment.
When we determine that a loan is uncollectible, it is written off against the provision for loan impairment. We write off these loans after all necessary procedures have been completed and the amount of the loss
is determined. Subsequent recoveries of amounts previously written off decrease the amount of the provision for loan impairment in our consolidated income statements.
The following tables show our direct loan portfolio at the dates indicated:
|
As of December 31, 2022
|
||||||||||||||||||||
|
(in thousands of Soles, except percentages)
|
||||||||||||||||||||
|
Level of Risk
|
Stage 1
|
Stage 2
|
Stage 3
|
Total
|
||||||||||||||||
|
Classification
|
Amount
|
Amount
|
Amount
|
Amount
|
% Total
|
|||||||||||||||
|
Neither past due nor impaired
|
113,364,093
|
19,078,232
|
-
|
132,442,325
|
90.0
|
|||||||||||||||
|
Past due but not impaired
|
1,673,074
|
2,406,229
|
-
|
4,079,303
|
2.8
|
|||||||||||||||
|
Impaired debt
|
-
|
-
|
10,668,641
|
10,668,641
|
7.2
|
|||||||||||||||
|
Total (1)
|
115,037,167
|
21,484,461
|
10,668,641
|
147,190,269
|
100.0
|
|||||||||||||||
|
As of December 31, 2021
|
||||||||||||||||||||
|
(in thousands of Soles, except percentages)
|
||||||||||||||||||||
|
Level of Risk
|
Stage 1
|
Stage 2
|
Stage 3
|
Total
|
||||||||||||||||
|
Classification
|
Amount
|
Amount
|
Amount
|
Amount
|
% Total
|
|||||||||||||||
|
Neither past due nor impaired
|
110,764,795
|
21,522,072
|
-
|
132,286,867
|
90.3
|
|||||||||||||||
|
Past due but not impaired
|
1,037,432
|
1,809,327
|
-
|
2,846,759
|
1.9
|
|||||||||||||||
|
Impaired debt
|
-
|
-
|
11,283,193
|
11,283,193
|
7.7
|
|||||||||||||||
|
Total (1)
|
111,802,227
|
23,331,399
|
11,283,193
|
146,416,819
|
100
|
|||||||||||||||
|
As of December 31, 2020
|
||||||||||||||||||||
|
(in thousands of Soles, except percentages)
|
||||||||||||||||||||
|
Level of Risk
|
Stage 1
|
Stage 2
|
Stage 3
|
Total
|
||||||||||||||||
|
Classification
|
Amount
|
Amount
|
Amount
|
Amount
|
% Total
|
|||||||||||||||
|
Neither past due nor impaired
|
105,185,254
|
19,489,880
|
-
|
124,675,134
|
91.2
|
|||||||||||||||
|
Past due but not impaired
|
841,400
|
1,341,067
|
-
|
2,182,467
|
1.6
|
|||||||||||||||
|
Impaired debt
|
-
|
-
|
9,806,224
|
9,806,224
|
7.2
|
|||||||||||||||
|
Total (1)
|
106,026,654
|
20,830,947
|
9,806,224
|
136,663,825
|
100
|
|||||||||||||||
|
(1)
|
Without unearned interest and accrued interest. Includes internal overdue loans (overdue loans and under legal collection loans).
|
7.3.8 Classification of the loan portfolio based on the borrower’s payment performance
We classify a loan as internal overdue according to three criteria: (i) the number of days past-due based on the contractually agreed due date; (ii) the banking subsidiary; and (iii) the type of loan. In that
sense:
| • |
BCP Stand-alone, SEAH and Mibanco consider loans as internal overdue: (i) after 15 days for corporate, large business and medium business loans; (ii) after 30 days for small and micro business loans, and (iii) after 30 days for
overdrafts. In the case of consumer, mortgage and leasing loans, the past-due installments are considered overdue after 30 to 90 days; after 90 days, the outstanding balance of the loan is considered overdue.
|
| • |
Mibanco Colombia considers loans as internal overdue: (i) after 90 days for commercial loans; (ii) after 60 days for micro business loans; (iii) after 60 days for consumer loans and (iv) after 30 days for mortgage loans.
|
| • |
ASB considers loans as internal overdue when they are 1 or more days past due.
|
| • |
BCP Bolivia considers loans as internal overdue when they have 30 or more days past due.
|
Furthermore, with regards to refinanced loans, Credicorp’s policy categorizes a loan as “refinanced” when a debtor is experiencing payment problems and asks for a new payment schedule that will allow the debtor
to comply with the installments. This policy is based on internal models and experience as well as IFRS.
Finally, non-performing loans are composed of internal overdue, refinanced, and restructured loans. For further detail on non-performing loans, see Note 34.1(c) to the consolidated financial statements.
|
As of December 31,
|
||||||||||||
|
2020
|
2021
|
2022
|
||||||||||
|
(in thousands of Soles, except percentages)
|
||||||||||||
|
Current
|
131,978,256
|
140,854,380
|
141,244,490
|
|||||||||
|
Internal overdue loans:
|
||||||||||||
|
Overdue up to 90 days
|
984,630
|
1,353,655
|
1,264,336
|
|||||||||
|
Overdue 90 days or more
|
3,700,939
|
4,208,784
|
4,681,343
|
|||||||||
|
Subtotal internal overdue
|
4,685,569
|
5,562,439
|
5,945,779
|
|||||||||
|
Total
|
136,663,824
|
146,416,819
|
147,190,269
|
|||||||||
|
Accrued interest
|
1,197,489
|
1,280,262
|
1,516,962
|
|||||||||
|
Unearned interest
|
(201,429
|
)
|
(99,669
|
)
|
(80,857
|
)
|
||||||
|
Total direct loans
|
137,659,885
|
147,597,412
|
148,626,374
|
|||||||||
|
Internal overdue loans amount as % of total loans (1)
|
3.40
|
%
|
3.8
|
%
|
4.0
|
%
|
||||||
| (1) |
Without unearned interest and accrued interest. Includes overdue loans (overdue loans and under legal collection loans).
|
For IFRS 7 disclosure requirements on past-due loans, see Note 34.1 to the consolidated financial statements.
7.3.9 Internal overdue loan portfolio
The following table analyzes our internal overdue loans portfolio by the type of loan at the dates indicated:
|
As of December 31,
|
||||||||||||
|
2020
|
2021
|
2022
|
||||||||||
|
(in thousands of Soles)
|
||||||||||||
|
Internal overdue loan amounts:
|
||||||||||||
|
Loans
|
3,984,422
|
4,866,319
|
5,013,193
|
|||||||||
|
Discounted notes
|
53,006
|
22,309
|
34,338
|
|||||||||
|
Advances and overdrafts in demand deposits
|
38,758
|
53,827
|
69,524
|
|||||||||
|
Leasing transactions
|
176,604
|
207,817
|
209,015
|
|||||||||
|
Refinanced and restructured loans
|
432,779
|
412,167
|
619,709
|
|||||||||
|
Total internal overdue loans
|
4,685,569
|
5,562,439
|
5,945,779
|
|||||||||
|
Less: Allowance for loan losses (1)
|
(10,435,623
|
)
|
(9,071,011
|
)
|
(8,530,986
|
)
|
||||||
|
Total internal overdue loans portfolio net of allowance
|
(5,750,054
|
)
|
(3,508,572
|
)
|
(2,585,207
|
)
|
||||||
| (1) |
Includes allowance for direct and indirect credits (see section “(7) Selected Statistical Information – 7.3.11 Allowance for loan losses”).
|
7.3.10 Total Non-performing loans
Non-performing loans include internal overdue loans (S/5,945.8 million as of December 31, 2022), as well as current refinanced and restructured loans (S/2,100.0 million as of December 31, 2022). Therefore,
non-performing loans amounted to S/8,045.8 million. As of December 31, 2022, our delinquency ratio (internal overdue-loan ratio) was 4.0% and our non-performing loan ratio (including internal overdue and refinanced and restructured loans) was
5.4%. As of December 31, 2021, our delinquency ratio was 3.8% and our non-performing loan ratio was 4.99%. See “ITEM 5. OPERATING AND FINANCIAL REVIEW AND PROSPECTS – 5.A Operating Results – (5) Financial Position – 5.1 Total Assets – Portfolio
quality”. For the ratio of non-performing loans to total loans and the ratio of allowance for loan losses to non-performing loans (which we refer to as coverage of non-performing loans) as of December 31, 2020, 2021 and 2022, see “ITEM 5.
OPERATING AND FINANCIAL REVIEW AND PROSPECTS – 5.A Operating Results – (4) Historical Discussion and Analysis – 4.2 Financial performance.”
7.3.11 Allowance for loan losses
The following tables show the changes in our allowance for loan losses during the periods indicated. The first table corresponds to years 2020, 2021 and 2022 under IFRS 9 methodology:
|
Year ended
December 31,
2020
|
Year ended
December 31,
2021
|
Year ended
December 31,
2022
|
||||||||||
|
(in thousands of Soles)
|
||||||||||||
|
Allowance for loan losses at the beginning of the year
|
5,507,759
|
10,435,623
|
9,071,011
|
|||||||||
|
Credit loss of the period:
|
||||||||||||
|
New loans and liquidation, net
|
(128,653
|
)
|
(919,447
|
)
|
(541,836
|
)
|
||||||
|
Changes in PD, LGDs, EADs
|
6,208,942
|
2,478,398
|
2,700,391
|
|||||||||
|
Write-offs and forgiven
|
(1,269,118
|
)
|
(3,066,382
|
)
|
(2,575,258
|
)
|
||||||
|
Sale of loan portfolio
|
(23,490
|
)
|
(40,833
|
)
|
(10,340
|
)
|
||||||
|
Exchange difference and others (1)
|
140,183
|
183,652
|
(112,982
|
)
|
||||||||
|
Total allowance for loan losses at the end of the year
|
10,435,623
|
9,071,011
|
8,530,986
|
|||||||||
|
(1)
|
Corresponds to the effect of fluctuation in the exchange rate for foreign currency loans. Considering that the functional currency is the Peruvian Sol, and that the main impact of
foreign currency is the US Dollar; the effects presented in this account are primarily driven by changes in the Sol/US Dollar exchange rate.
|
For a discussion of the risk elements in the loan portfolio and the factors considered in determining the amount of specific reserves, see “ITEM 4. INFORMATION ON THE COMPANY – 4.B Business Overview – 7.3.7
Classification of the Loan Portfolio” and “– 7.3.8 Classification of the loan portfolio based on the borrower’s payment performance”. The balance of the allowance for loan losses as of December 31, 2020, 2021 and 2022 are included in Note 7(c)
to the consolidated financial statements.
As of December 31, 2022, the allowance for loan losses was S/8,531.0 million which meant a decrease of 6.0% compared to S/9,071.0 million in 2021. The allowance for loan losses, as of December 31, 2022, included
S/7,872.4 million for direct loans losses and S/658.6 million for indirect loan losses or off-balance-sheet exposure losses as compared to S/8,477.3 million and S/593.7 million, respectively, in 2021. The allowance for indirect loans is
included in the “Other liabilities” caption of our consolidated statement of financial position. See Notes 7(c) and 13(a) to the consolidated financial statements. For the ratio of the allowance for loan losses to total loans as of December 31,
2020, 2021 and 2022, see “ITEM 3. KEY INFORMATION – 3.A Selected Financial Data.”
The write-off process is performed with prior approval of our board of Directors and the SBS. Potential write-offs are considered by the board of Directors on a case-by-case basis.
Provision for credit losses on loan portfolio, net of recoveries, increased to S/1,811.5 million in 2022 from S/1,212.2 million in 2021. The increase is primarily explained by the update of our estimates for key
macroeconomic variables such as inflation, interest rates and GDP growth, as well as the negative impact that increasing inflation had on payment behavior compared to an extraordinary low provisions base in 2021, which represented an decrease
from S/5,920.5 million in 2020.
7.3.12 Allocation of allowance for loan losses
The following table sets forth the amounts of our allowance for loan losses attributable to commercial, microbusiness, consumer, and residential mortgage loans at the dates indicated (see also Note 7(c) to the
consolidated financial statements):
|
As of December 31,
|
||||||||||||
|
2020
|
2021
|
2022
|
||||||||||
|
Allowance for loan losses for:
|
(in thousands of Soles)
|
|||||||||||
|
Commercial loans
|
3,616,932
|
3,991,453
|
3,912,043
|
|||||||||
|
Microbusiness
|
3,144,154
|
2,208,049
|
1,970,027
|
|||||||||
|
Consumer loans
|
2,765,113
|
1,896,776
|
1,680,768
|
|||||||||
|
Residential mortgage loans
|
909,424
|
974,733
|
968,148
|
|||||||||
|
Total
|
10,435,623
|
9,071,011
|
8,530,986
|
|||||||||
Credicorp's total allowance for loan losses decreased by 6.0% from December 31, 2021, to December 31, 2022. This was mainly driven by: (i) the flow of write-offs made throughout the year, which mainly impacted
consumer loans at BCP Stand-alone and microbusiness and consumer loans at both BCP Stand-alone and Mibanco, and (ii) to a lesser extent, the decrease of the USD/PEN exchange rate. The previous effects were partially offset by the deterioration
of the macroeconomic view (both observed and projected), which had a higher impact on consumer and microbusiness loans at BCP Stand-alone, and by efforts to penetrate higher yield and riskier segments mainly on microbusiness loans at BCP
Stand-alone.
The main methodological calibrations made in the internal credit risk models during 2022 were:
| • |
PD models: according to our internal governance scheme, we continued following up the performance of PD models and implementing the necessary calibrations to maintain an appropriate measurement of our loan portfolio’s credit risk.
|
| • |
LGD models: we holistically calibrated this parameter for Consumer and SME loans in order to maintain an appropriate measurement of our loan portfolio’s estimated loss at the time of the default. This calibration included the update
of recovery data, methodological assumptions and certain revisions to better reflect the collateral of mortgage-backed retail banking loans at default on the estimation of the recovery rate.
|
7.3.13 Credit Ratios
The following table sets forth our ratio of allowance for loan losses to total loans outstanding and, for both total loans and each type of loan, net write-offs to average loans outstanding, as well as the
components of these ratios, at and for the years ended December 31, 2020, 2021 and 2022.
|
At and for the year ended December 31,
|
||||||||||||
|
2020
|
2021
|
2022
|
||||||||||
|
(in thousands of Soles, except percentages)
|
||||||||||||
|
Allowance for loan losses to total loans outstanding:
|
7.91
|
%
|
6.44
|
%
|
6.04
|
%
|
||||||
|
Allowance for loan losses
|
(10,435,623
|
)
|
(9,071,011
|
)
|
(8,530,986
|
)
|
||||||
|
Total loans outstanding
|
131,978,256
|
140,854,380
|
141,244,490
|
|||||||||
|
Total net write-offs to average loans outstanding:
|
1.0
|
%
|
2.2
|
%
|
1.7
|
%
|
||||||
|
Total net write-offs
|
(1,193,770
|
)
|
(2,929,332
|
)
|
(2,432,154
|
)
|
||||||
|
Average loans outstanding
|
125,100,978
|
136,243,721
|
141,061,602
|
|||||||||
|
Net write-offs to average loans outstanding:
|
||||||||||||
|
Loans:
|
||||||||||||
|
Average amount outstanding
|
107,303,800
|
118,371,601
|
120,729,263
|
|||||||||
|
Net write-offs
|
(622,502
|
)
|
(1,936,112
|
)
|
(1,499,973
|
)
|
||||||
|
Net write-offs to average amount outstanding
|
0.6
|
%
|
1.6
|
%
|
1.2
|
%
|
||||||
|
Credit cards:
|
||||||||||||
|
Average amount outstanding
|
7,085,872
|
5,140,892
|
5,746,531
|
|||||||||
|
Net write-offs
|
(277,898
|
)
|
(498,625
|
)
|
(401,468
|
)
|
||||||
|
Net write-offs to average amount outstanding
|
3.9
|
%
|
9.7
|
%
|
7.0
|
%
|
||||||
|
Leasing receivables:
|
||||||||||||
|
Average amount outstanding
|
5,960,427
|
6,010,948
|
6,254,236
|
|||||||||
|
Net write-offs
|
-
|
-
|
-
|
|||||||||
|
Net write-offs to average amount outstanding
|
0.0
|
%
|
0.0
|
%
|
0.0
|
%
|
||||||
|
Discounted notes:
|
||||||||||||
|
Average amount outstanding
|
1,559,482
|
1,999,481
|
2,589,806
|
|||||||||
|
Net write-offs
|
-
|
-
|
-
|
|||||||||
|
Net write-offs to average amount outstanding
|
0.0
|
%
|
0.0
|
%
|
0.0
|
%
|
||||||
|
Factoring receivables:
|
||||||||||||
|
Average amount outstanding
|
1,668,337
|
2,623,819
|
3,624,665
|
|||||||||
|
Net write-offs
|
-
|
-
|
-
|
|||||||||
|
Net write-offs to average amount outstanding
|
0.0
|
%
|
0.0
|
%
|
0.0
|
%
|
||||||
|
Advances and overdrafts in current account:
|
||||||||||||
|
Average amount outstanding
|
192,572
|
147,567
|
163,025
|
|||||||||
|
Net write-offs
|
-
|
-
|
-
|
|||||||||
|
Net write-offs to average amount outstanding
|
0.0
|
%
|
0.0
|
%
|
0.0
|
%
|
||||||
|
Refinanced loans:
|
||||||||||||
|
Average amount outstanding
|
1,330,488
|
1,949,413
|
1,954,076
|
|||||||||
|
Net write-offs
|
(293,370
|
)
|
(494,595
|
)
|
(474,340
|
)
|
||||||
|
Net write-offs to average amount outstanding
|
22.0
|
%
|
25.4
|
%
|
24.3
|
%
|
||||||
The ratio of allowance for loan losses to total loans outstanding decreased from 7.91% in 2020 to 6.44% in 2021, due to a decrease in the allowance for loan losses resulting from PD and LGD estimates decreasing
as uncertainty related to the pandemic partially dissipated. The diminished uncertainty was partially offset by higher perceived risk to the Peruvian macroeconomic outlook due to political uncertainty. The allowance for loan losses also
decreased due to an elevated level of write-offs in 2021 compared to 2019 and 2020, which was driven by defaults that had been postponed while clients were receiving government and Credicorp support and deferments to mitigate the impacts of the
COVID-19 pandemic during 2020.
In 2022, this ratio decreased to 6.04% due to a decrease in the allowance for loan losses, which was mainly driven by: (i) the flow of write-offs made throughout the year, which mainly impacted Consumer loans at
BCP Stand-alone and Microbusiness and Consumer loans at both BCP Stand-alone and Mibanco, (ii) to a lesser extent, the decrease of the exchange rate USD PEN. The previous effects were partially offset by the deterioration of the macroeconomic
view (both observed and projected), which had a higher impact on Consumer and Microbusiness loans at BCP Stand-alone, and by efforts to penetrate higher yield and riskier segments mainly on Microbusiness loans at BCP Stand-alone.
The following table presents the components of our deposit base at the dates indicated:
|
As of December 31,
|
||||||||||||
|
2020
|
2021
|
2022
|
||||||||||
|
(in thousands of Soles)
|
||||||||||||
|
Demand deposits:
|
||||||||||||
|
Sol-denominated
|
27,879,297
|
23,765,622
|
21,756,004
|
|||||||||
|
Foreign currency-denominated
|
26,651,058
|
34,864,039
|
26,711,244
|
|||||||||
|
Total
|
54,530,355
|
58,629,661
|
48,467,248
|
|||||||||
|
Savings deposits:
|
||||||||||||
|
Sol-denominated
|
29,944,969
|
32,409,764
|
30,331,360
|
|||||||||
|
Foreign currency-denominated
|
20,124,160
|
24,535,498
|
24,437,685
|
|||||||||
|
Total
|
50,069,129
|
56,945,262
|
54,769,045
|
|||||||||
|
Time deposits:
|
||||||||||||
|
Sol-denominated
|
12,214,773
|
12,607,182
|
18,267,699
|
|||||||||
|
Foreign currency-denominated (1)
|
15,906,321
|
15,316,621
|
19,210,570
|
|||||||||
|
Total
|
28,121,094
|
27,923,803
|
37,478,269
|
|||||||||
|
Severance indemnity deposits
|
||||||||||||
|
Sol-denominated
|
5,512,943
|
2,733,699
|
2,669,127
|
|||||||||
|
Foreign currency-denominated
|
2,223,804
|
1,283,366
|
1,155,502
|
|||||||||
|
Total
|
7,736,747
|
4,017,065
|
3,824,629
|
|||||||||
|
Bank certificates
|
||||||||||||
|
Sol-denominated
|
512,509
|
497,103
|
541,980
|
|||||||||
|
Foreign currency-denominated
|
690,487
|
830,587
|
876,760
|
|||||||||
|
Total
|
1,202,996
|
1,327,690
|
1,418,740
|
|||||||||
|
Total deposits:
|
||||||||||||
|
Sol-denominated
|
76,064,491
|
72,013,370
|
73,566,170
|
|||||||||
|
Foreign currency-denominated
|
65,595,830
|
76,830,111
|
72,391,761
|
|||||||||
|
Total deposits and obligations without interest payable
|
141,660,321
|
148,843,481
|
145,957,931
|
|||||||||
|
(1)
|
The presentation of certificates of deposits that were identified as negotiable were modified from term deposits to bonds in 2021.
|
Our total deposits and obligations without interest payable decreased 1.9% from December 31, 2021, to December 31, 2022, which is attributable to a decrease in the level of total savings and demand deposits,
mainly at BCP Stand-alone. The decrease in savings and demand deposits was driven by the amortization of Reactiva loans.
The following table presents the non-interest-bearing demand deposits and the interest-bearing demand deposits at the dates indicated:
|
As of December 31,
|
||||||||||||
|
2020
|
2021
|
2022
|
||||||||||
|
(in thousands of Soles)
|
||||||||||||
|
Sol-denominated:
|
||||||||||||
|
Non-interest-bearing demand deposits
|
24,454,469
|
21,084,666
|
19,707,991
|
|||||||||
|
Interest-bearing demand deposits
|
3,424,828
|
2,680,956
|
2,048,013
|
|||||||||
|
Total
|
27,879,297
|
23,765,622
|
21,756,004
|
|||||||||
|
Foreign currency-denominated:
|
||||||||||||
|
Non-interest-bearing demand deposits
|
23,168,650
|
30,766,541
|
23,638,160
|
|||||||||
|
Interest-bearing demand deposits
|
3,482,408
|
4,097,498
|
3,073,084
|
|||||||||
|
Total
|
26,651,058
|
34,864,039
|
26,711,244
|
|||||||||
Deposits are generally insured to mitigate depositor losses in the event of financial institution bankruptcy. The insured value of any deposit will vary depending on the country where the bank is located. As of
December 31, 2022, deposits in Peru are insured by the Deposit Insurance Fund up to a maximum of S/125,603 (US$32,932) per depositor; in Colombia they are insured by the “Financial Institutions Guarantee Fund” (Fogafín) up to a maximum of
S/39,300 (US$10,304) per depositor; in Bolivia they are insured by the Saver Protection Fund (FPAH) up to a maximum of S/53,627 (US$14,061) per depositor; in Panama deposits are not insured. In Peru, the insurance coverage supports nominal
deposits, under any modality, of natural and private non-profit legal persons, as well as demand deposits of other legal persons. Said amount includes all insured deposits that a depositor has in the same financial institution. As of December
31, 2020, 2021 and 2022 the total insured deposits of the Group, which were estimated with the methodologies and assumptions used for regulatory requirements, totaled S/45,835.1 million, S/51,330.3 million and S/53,555.5 million, respectively.
As of December 31, 2020, 2021 and 2022, the total uninsured deposits, without considering interest, totaled S/95,825.2 million, S/97,513.2 million and S/92,402.4 million, respectively.
Below are the Group’s aggregate estimated uninsured time deposits as of December 31, 2021, and December 31, 2022:
|
As of December 31,
|
||||||||
| 2021 |
2022 | |||||||
|
Time deposits:
|
(in thousands of Soles)
|
|||||||
|
Maturing within 60 days
|
11,929,905
|
13,682,607
|
||||||
|
Maturing after 61 but within 90 days
|
1,442,319
|
2,453,651
|
||||||
|
Maturing after 91 but within 180 days
|
3,293,932
|
4,434,455
|
||||||
|
Maturing after 181 but within 360 days
|
3,233,596
|
5,466,573
|
||||||
|
Maturing after 361 days
|
5,514,827
|
6,861,927
|
||||||
|
Total time deposits
|
25,414,579
|
32,899,213
|
||||||
(1) Credicorp
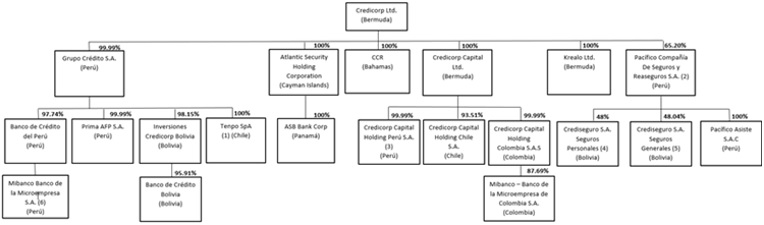
The following tables show our organizational structure and the organization of our main subsidiaries as of December 31, 2022, indicating in each case its country of incorporation and ownership interest in the
identified entities:
| (1) |
Grupo Crédito S.A. also holds 100% of Tenpo Spa.
|
| (2) |
Grupo Crédito S.A. holds 33.66% of Pacífico Compañía de Seguros y Reaseguros S.A.
|
| (3) |
Credicorp Capital Holding Peru S.A. holds 85.07% of Credicorp Capital Peru S.A.A., and Credicorp Capital Ltd holds an additional 12.795% of Credicorp Capital Peru S.A.A.
|
| (4) |
Pacífico Compañia de Seguros y Reaseguros S.A. controls Crediseguros S.A. Seguros Personales. Inversiones Credicorp Bolivia S.A holds 51.95% of Crediseguros S.A. Seguros Personales.
|
| (5) |
Pacífico Compañia de Seguros y Reaseguros S.A. controls Crediseguros S.A. Seguros Generales. Inversiones Credicorp Bolivia S.A holds 51.87% of Crediseguros S.A. Seguros Generales.
|
| (6) |
Grupo Crédito S.A. holds 4.99% of Mibanco Banco de la Microempresa S.A.
|
As of December 31, 2022, we owned 295 properties (281 in Peru, 10 in Bolivia and 4 in Colombia) and leased 686 properties (482 in Peru, 57 in Bolivia ,141 in Colombia, 3 in Chile, 1 in Panama and 2 in United
States), which we use for the operation of our branch network and our business. We own the buildings where our headquarters are located in Lima, Peru and La Paz, Bolivia. As of December 31, 2022, we had 672 bank branches, of which 338 were BCP
Stand-alone branches, 45 were BCP Bolivia branches and 289 were Mibanco branches in Peru.
There are no significant encumbrances on any of our properties, and both our owned and leased properties have multi-risk property insurance. The respective policy is renewed annually and covers our properties
against the risks of fire, natural disasters, and socio-political risks among others.
During the year 2022, the principal disbursement was related mainly to the purchase of furniture and fixtures, for the conditioning and remodeling of its various agencies and administrative offices. For more
details on the balance of properties, plants and equipment in progress, see Note 10 to the consolidated financial statements.
For further details about Credicorp’s Leases Policy see Note 3 “Significant Accounting Policies, j) Leases”.
| ITEM 4A. |
UNRESOLVED STAFF COMMENTS
|
None.
| ITEM 5. |
OPERATING AND FINANCIAL REVIEW AND PROSPECTS
|
a) General Economic Conditions
In 2022, the global economy experienced a broad-based slowdown weighed by the highest inflation in decades, driven by supply chain disruptions related to COVID-19, the war between Russia and
Ukraine which drove commodity prices near record highs and pressures stemming from pent up demand in the services sector. China’s stringent zero COVID-19 policy and tightening financial conditions as Central Banks reacted raising rates rapidly
also had a negative effect on growth. In Peru, the economy slowed down to 2.7%, as private investment fell, business confidence remained low and policy stimulus was withdrawn. However, private consumption remained strong, especially in the
1H22, driven by the release of pent-up demand, the recovery of employment and availability from savings in pension funds (AFPs) and Severance indemnity deposits.
Inflation, measured using the Consumer Price index of Metropolitan Lima (CPI), closed 2022 at 8.5% YoY, the highest in 26 years and above the upper bound of the BCRP´s target range between 1%
and 3% for a second year in a row. To avoid inflation expectations de-anchoring and with the goal of returning inflation to its target range, the BCRP adopted an aggressive rate-hiking cycle, as did most developing and emerging countries. The
BCRP increased its monetary policy rate from 0.25% in July 2021 to 7.50% in December 2022.
b) Credicorp 2022 Financial Performance
In 2022, Credicorp generated S/4,633.1 million of net profit attributable to its equity holders, with net basic earnings of S/58.3 per common share attributable to its equity holders, as compared with S/3,584.6
million of net profit attributable to its equity holders, with net basic earnings of S/44.9 per common share attributable to its equity holders in 2021. This translates to a return on average assets (ROAA) of 1.92% and a return on average
equity (ROAE) of 16.70% in 2022, up from 1.49% and 13.94%, respectively, in 2021.
As of December 31, 2022, loans, net of unearned income, totaled S/148,626.4 million, representing an increase of 0.7% compared to S/147,597.4 million as of December 31, 2021. This growth was driven by fishing and
agricultural campaigns in Wholesale Banking, an uptick in growth in consumer loans and an improvement in loan growth through the hybrid model at Mibanco and partially offset by the repayment of Reactiva Program loans. Total deposits without
interest payable were S/147,020.8 million as of December 31, 2022, representing a decrease of S/2,575.8 million from S/149,596.5 million as of December 31, 2021. This drop was mainly driven by a 17.3% decline in Demand Deposits, from S/58,629.7
million as of December 31, 2021, to S/48,467.2 as of December 31, 2022. This migration into Time Deposits and away from Demand and Savings Deposits was because of the high interest rate environment. The decrease in Demand Deposits was
attributable to both amortizations of Reactiva loans and a normalization in liquidity levels.
In 2022, net interest income was S/11,518.1 million, up from S/9,359.6 million in 2021, representing an increase of 23.1%. This increase was primarily driven by our disciplined pricing management strategy in an
environment of increasing market rates. In addition, the shift towards higher yield assets also enabled our return on assets to surpass the impact of the rate hikes on our funding cost, which was buffered by BCP’s deposit mix, which primarily
consists of low-cost deposits. In this context, NIM was 5.07% in 2022, 97bps above the figure reported in 2021, in line with higher interest rates.
The provisions for credit losses on loan portfolio, net of recoveries, totaled S/1,811.5 million for 2022, representing an increase of 49.4% from unusually low credit losses provisions of S/1,212.2 million for
2021. This change was mainly driven by the impact of higher inflation in consumer segment, growth in disbursements to higher risk segments in Pyme and inclusion maturities of specific vintages at Mibanco. Thus, the cost of risk in 2022 was
1.22% as compared to 0.82% in 2021. Additionally, the expansion registered by the non-performing loan portfolio, led to a subsequent decrease in the coverage ratio for the non-performing loan portfolio, which was 97.9% in 2022, as compared to
115.3% in 2021.
In 2022, other income totaled S/5,108.3 million, representing a 3.6% increase compared to S/4,929.7 million in 2021. This was attributable to an increase in fee income and gains on foreign exchange transactions
spurred by new services in our digital channels. In this context, net gain on foreign exchange transactions carried the most significant impact, with an increase of S/161.2, million or 17.5%, compared to 2021.
Credicorp’s underwriting result was S/661.6 million in 2022, representing an increase of S/665.3 million, compared to (S/3.7) million in 2021. This increase was attributable to fewer claims in the Life business
and to growth in net earned premiums in both the Life and P&C businesses due to higher sales and price adjustments following economic reactivation.
The efficiency ratio in 2022 improved by 150bps to 44.4% (as compared to 45.9% in 2021), which was due to an increase in income, primarily in net interest income.
c) LoBs Highlights
|
Universal Banking
ROAE BCP Stand-alone: 21.3% BCP Bolivia: 8.0% |
Microfinance
ROAE Mibanco: 16.5% Mibanco Colombia: 3.7% |
|
|
• BCP Stand-alone net interest income was S/8,043.2 million in 2022,
up by S/1,784.4 million, or 28.5%, compared to 2021.
|
• Mibanco net interest income was S/2,139.1 million in 2022, up 15.0%
compared to the S/1,860.4 total for 2021.
|
|
|
• BCP Stand-alone cost of risk was 1.00% in 2022, up 35bps from 2021.
|
• Mibanco cost of risk was 3.48% in 2022, up 33bps from 3.15% in
2021.
|
|
|
• BCP Stand-alone other income was S/4,529.2
million in 2022, up by S/588.8 million, or 14.9%, from 2021.
|
• Mibanco non-interest income in 2022 was S/126.9 million, up 15.0%
from S/98.8 million in 2021.
|
|
|
• BCP Stand-alone efficiency ratio was 40.8% for 2022, down by 265bps
compared to 43.4% from 2021.
|
• Mibanco efficiency ratio was 51.3% for 2022, down by 430bps
compared to 55.4% for 2021.
|
|
|
• BCP Stand-alone CET1 ratio was 12.59% in 2022, compared to 11.91%
from 2021.
|
• Mibanco CET1 ratio was 16.46% in 2022, compared to 15.24% in 2021.
|
|
Insurance and Pension Funds
ROAE
Grupo Pacífico: 19.2%
Prima AFP: 20.4%
|
Investment Banking and Wealth Management
ROAE
Credicorp Capital: 9.3%
Atlantic Security Bank: 6.3%
|
|
|
• Grupo Pacífico net earned premiums were S/2,881.3 million in 2022, up
7.2% from S/2,686.7 million in 2021.
|
• Credicorp Capital net income was S/54.3 million, down 3.4% from
S/56.3 million reported in 2021.
|
|
|
• Grupo Pacífico net claims were S/1,929.9 million, down 17.8% from
S/2,346.5 million in 2021.
|
• ASB Bank Corp. net income was S/52.2 million, down by 51.5% with
respect to S/107.7 million reported in 2021.
|
|
|
• Grupo Pacífico insurance underwriting result was S/210.7 million in
2022, compared to S/378.2 million in 2021.
|
• Total assets under management in the Asset Management business were
S/67,116 million as of December 31, 2022, down from S/94,438 million as of December 31, 2021.
|
|
|
• Grupo Pacífico loss ratio was 67.0% in 2022, down 2,030 bps compared
to 87.3% in 2021.
|
• Total assets under management in the Wealth Management business were
S/57,675 million in 2022, compared to S/64,530 million in 2021.
|
|
|
• Prima AFP income from commission was S/373.7 million, down 1.3% from
S/378.7 million in 2021.
|
| a) |
2022 Events and Developments
|
| • |
On January 27, 2022, Credicorp’s Board of Directors resolved to appoint Mr. Cesar Rivera as Head of Insurance and Pensions. Mr. Rivera succeeded Mr. Alvaro Correa effective as of February 1, 2022. Mr. Rivera maintained his position
as CEO of Pacífico Seguros, which is a subsidiary of Credicorp.
|
| • |
On January 27, 2022, Credicorp’s Board of Directors resolved to appoint Ms. Francesca Raffo as CINO of Credicorp, reporting to the CEO of Credicorp. This appointment was effective as of February 1, 2022.
|
(2) Political and Macroeconomic Environment
Although Credicorp Ltd. is incorporated in Bermuda, the Group, through BCP Stand-alone, has been present in the Peruvian financial sector for over 130 years. It is important to note that most of the operations
and customers of BCP Stand-alone, Prima AFP, Mibanco, and a significant part of Credicorp Capital’s and Grupo Pacífico’s operations and customers are located in Peru. In addition, although ASHC is based outside of Peru, a substantial number of
its customers are also located in Peru. Therefore, our results of operations and financial health could be affected by political and economic changes or policies in Peru.
For further details, see “ITEM 3. KEY INFORMATION – 3.D Risk Factors – Our geographic location exposes us to risk related to Peruvian political, social and economic conditions”.
Political Environment
Historically, Peru has experienced political instability, including domestic terrorism, military coups, and a succession of regimes that featured heavy government intervention. In 1995, when Credicorp was
established, President Alberto Fujimori was re-elected, despite the administration being accused of authoritarian behavior, which included dissolving Peru’s congress in 1992 and crafting a new constitution in 1993. In 2000, Fujimori was ousted
and succeeded by a transitional government led by Valentin Paniagua, who called for elections to be held in April 2001.
The presidents who have been elected since 2001 include Alejandro Toledo, from 2001 to 2006; Alan Garcia, from 2006 to 2011; Ollanta Humala from 2011 to 2016; and Pedro Pablo Kuczynski, whose term began in 2016
and was set to end in 2021. Since early 2017, Peruvian prosecutors have been investigating former and current local officials for allegedly accepting bribes from Odebrecht, a Brazilian construction company implicated in the Lava Jato
investigation. In the midst of this investigation, in December 2017, Peru’s congress proposed a motion to remove the president; however, the motion failed to gain the required 87 votes for approval. In March 2018, the congress presented a
second motion to remove the president. On March 21, 2018, President Kuczynski resigned amid political turmoil. His resignation was accepted on March 22, and on March 23, 2018, Martin Vizcarra, Kuczynski’s former vice-president, took office as
President for a term ending on July 28, 2021.
Under President Vizcarra’s term, political turmoil continued. On December 9, 2018, a nationwide referendum was held to address the following issues: (i) re-election of members of Peru’s congress, (ii) reforms
regarding financing for political parties, (iii) a reform of the judiciary system, and (iv) return to the bicameral parliamentary system. All the reforms, other than the bicameral parliament, were approved. Moreover, President Vizcarra
dissolved the congress on September 30, 2019, after it delivered two votes of no-confidence to two different cabinets during the same presidential term and called for parliamentary elections on January 26, 2020. Hours after Vizcarra’s decision,
the congress responded approving his suspension of presidential functions and the vice president, Mercedes Araoz, was sworn in as President. On January 15, 2020, the Constitutional Court ruled that the dissolution of Peru’s congress was
constitutional. The parliamentary elections of January 2020 delivered a new congress with a plan to carry out its functions until July 2021. After a first presidential vacancy motion failed in September 2020, in November 2020, the congress
presented a second presidential vacancy motion based on corruption allegations against Vizcarra in his term as a Regional Governor from 2011 to 2014. The motion succeeded, with 105 votes cast in favor. On November 10, 2020, Manuel Merino,
president of Peru’s congress, assumed control of the government. This political move generated riots across the country, mainly in Lima and particularly among the young adult population. On November 15, 2020, President Merino resigned, amid
extremely high political turmoil and uncertainty that had not seen in Peru in 20 years. Peru’s congress elected a new Directive Board led by Francisco Sagasti, and on November 16, 2020, Sagasti assumed the presidency for a term set to end on
July 28, 2021.
In 2021, the political environment worsened after Pedro Castillo, of the far-left party Peru Libre, won the presidential elections with 50.13% of the votes on the second round against Keiko Fujimori, daughter of
the ex-president Alberto Fujimori. It was the third consecutive loss for the presidential candidate Fujimori. These results brought about an important fragmentation of Peru’s congress, with 10 political parties becoming part of the congress’s
composition. This fragmentation of political forces was noted by all major rating agencies. According to Fitch Ratings, severe tensions between the president and congress had produced a gridlock and hampered government effectiveness. Also, risk
perception and political and regulatory uncertainty in Peru increased following continuous messages from the executive promoting greater state control of the economy, changes towards a new system of universal pension plans, the expropriation of
various mining and hydrocarbon operations, and a new constituent assembly. As a result of this risky and uncertain environment, in September 2021 the credit rating agency Moody's reduced Peru's foreign-currency long-term debt credit rating to
Baa1 from A3 and changed the country’s outlook level from negative to stable. In October 2021, the rating agency Standard and Poor’s kept Peru's credit rating at A- but lowered the outlook to negative from stable.
Between July 2021 and December 2022, Castillo appointed 5 prime ministers and named more than 70 other governmental ministers. On December 7, 2022, Castillo announced the temporary
dissolution of Peru’s congress, the execution of new elections for a congress with constituent powers, and the restructuring of the justice system only hours before a debate on his third vacancy motion. The police and armed forces rejected the
attempted coup and the same day Peru’s congress voted to remove him from office due to moral incapacity. Castillo was arrested under charges of rebellion and conspiracy and is currently in jail. In turn, Vice President Dina Boluarte was sworn
in as Peru’s first female president. Social unrest erupted, primarily focused in the southern regions where Castillo still has an important base and followers. Protests have been violent and at least sixty people have died during social
demonstrations.
Boluarte, initially appointed a cabinet, led by former state prosecutor Pedro Angulo, whose members were widely regarded as technocratic but with limited political capacity. On December 21,
2022, Boluarte reshuffled her cabinet and promoted the country's Defense Minister, Alberto Otarola, to Prime Minister. Mr. Otarola is a lawyer from Ancash with prior public policy experience as Minister of Defense during the presidency of
Ollanta Humala. Alex Contreras, an orthodox economist with more than 15 years of public policy experience, was ratified as the new head of the MEF. Further changes. Changes inside Otarola’s cabinet have occurred due to the social crisis with
the resignations of the Labor, Production and Culture Ministers.
It is currently unclear if the election date will be brought forward since Peru’s congress has now twice rejected the constitutional reform bill to advance the general elections to 2023.
Macroeconomic Environment
The adoption of market-oriented macroeconomic policies since the early 1990s, and two decades of strong macroeconomic fundamental outlook for Peru’s economy along with stable credit ratings have allowed the
country to grow at an average annual rate of 4.9% from 2001 to 2019, according to data from the BCRP. Between 2000 and 2013, the Peruvian economy, on average, outperformed the global economy primarily due to favorable metal prices and financial
conditions. Nonetheless, since 2014, the Peruvian economy has been affected by several economic shocks such as decline in metal prices, contraction of public investment, the El Niño Phenomenon of 2017, the Lava-Jato investigations, the COVID-19
pandemic, higher inflation due to global factors, and political turmoil. As such, the average annual growth rate for the Peruvian economy from 2014 through 2019, before the global COVID-19 pandemic, stood at 3.1% and remained among the highest
of the Latin American region economies. After the pandemic shock of 2020, the economy rebounded 13.6% in 2021 and grew 2.7% in 2022.
Peruvian economic policy has been based on three main pillars: trade policy, fiscal policy and monetary policy. Peru has maintained an open trade policy for more than two decades. Some examples of Peru’s open
trade policy include free trade agreements with the United States in effect since 2009, with China since 2011, with the European Union since 2013, and with Chile, Colombia and Mexico in the Pacific Alliance. In addition, after the withdrawal of
the United States from the TPP, the remaining Pacific Rim countries, including Peru, entered into the Comprehensive and Progressive Agreement for the Trans-Pacific Partnership in 2018.
Peruvian policymakers have kept a conservative and prudent approach to fiscal policy and government spending, and Peru’s fiscal policy evolved since 1999 to promote sound macroeconomic fundamentals. Peru’s
debt-to-GDP ratio fell from 51.5% in 1999 to 26.6% in 2019 (pre-pandemic) as the government cut spending and privatized most state-run enterprises. Peru’s fiscal position also benefited from the accumulation of surpluses in various years in the
period from 2004 to 2013, which helped Peru face the pandemic in 2020 and 2021. After the COVID-19 shock which lead the fiscal deficit to increase to 8.9% of GDP, the government has returned to its path of fiscal responsibility with the fiscal
deficit falling to 2.5% of GDP in 2021 and to 1.6% of GDP in 2022. The ratio of debt to GDP has stayed around 34%, one of the lowest in emerging markets.
In1999, the government approved the Law of Responsibility and Fiscal Transparency (Law No. 27245) , which included a set of macroeconomic fiscal rules that gradually evolved in the years leading up to 2019. The
main rules were as follows: (a) the fiscal deficit must not exceed 1% of GDP; (b) public debt cannot exceed 30% of GDP. In exceptional cases of financial volatility, and only if other fiscal rules are met, a temporal deviation of 4 percentage
points of GDP is allowed; (c) non-financial spending by the government is limited by long-run real GDP growth of the economy (+/- 1 %). Compliance with this rule assumes mutual compliance with the two prior fiscal rules; and (d) Current
spending by the government, excluding for maintenance, cannot exceed the long-run real GDP growth of the economy (-1%). Amid the COVID-19 pandemic, fiscal rules were suspended exceptionally for the years 2020 and 2021, by Legislative Decree
No.1457, published on April 12, 2020. In 2021, by Urgency Decree N° 079-2021, the rules for 2022 were established: (i) a cap of 3.7% of GDP for the fiscal deficit and (ii) a limit of 38% of GDP for the public debt. In April 2022, a bill setting
the fiscal rules for the following years was approved by the Peru’s president and is still pending approval from its congress. This bill includes the following as its main rules: (i) the fiscal deficit should not exceed 2.4% of GDP in 2023, 2%
of GDP in 2024, 1.5% of GDP in 2025 and 1.0% of GDP starting 2026 onward; and (ii) public debt should not be higher than 38% of GDP, and in a maximum timeframe of 10 years, public debt should be below 30% of GDP.
On the topic of Peru’s monetary policy, the BCRP obtained its constitutional independence in 1992 and officially presides over a reserve banking system. Since 2007, the BCRP has had an inflation target of 2.0%
(+/-1%), the lowest in Latin America, reflecting the BCRP’s commitment to price stability. The BCRP has foreign reserves that, at the end of 2022, totaled US$71.9 billion (approximately 30% of Peru’s GDP), among the highest levels worldwide. As
of February 3, 2023, these foreign reserves totaled at US$74.3 billion. The BCRP also has other mechanisms to provide liquidity to Peru’s domestic financial system. In coordination with the SBS, the BCRP also sets regulations for the financial
system, including pension funds. The SBS is the entity in charge of regulating all financial institutions, insurance companies and pension funds administrators.
Regarding the exchange rate, the BCRP abandoned its exchange rate peg (also known as a fixed exchange rate) in August 1990 and moved to a so-called dirty floating exchange rate regime (also known as a managed
float). Since its inception, the dirty floating exchange rate regime has been subject to intervention by the central bank to smooth out exchange rate volatility. One key motivation to intervene in this manner in the FX market is Peru’s high
degree of financial dollarization, although it is on a clearly decreasing path. BCRP’s current dirty floating exchange rate regime pursues a discretionary type of intervention, based on daily assessments of FX market conditions.
For further information, see “Item 4.B Business Overview – (6) Supervision and Regulation – 6.2 Subsidiaries – 6.2.1 Peru”.
Macroeconomic Results
In 2020, the global economy was shocked by the COVID-19 pandemic, which led to historical economic contraction, amid the effects of quarantines implemented to mitigate contagion. Lower revenues and higher
spending significantly weakened fiscal accounts, resulting in higher fiscal deficits as percentages of GDP than had been seen in decades and credit rating downgrades. In that context, in 2020, the Peruvian economy contracted 11%. As a result of
higher fiscal expenditure, in December 2020, Fitch revised Peru’s sovereign credit rating outlook in long-term foreign currency from Stable to Negative while affirming its BBB+ rating. According to Fitch, Peru has a negative outlook due to a
weakened government balance sheet and a deterioration of policy predictability, as congressional populist measures were adopted. Fitch’s reasoning was that the weakening of political cohesiveness and other political institutions since 2016 had
undermined the government’s capacity to adopt wide-ranging fiscal, political and productivity-enhancing economic reforms.
In 2021, despite a highly fragmented political environment that resulted in weak business expectations, the Peruvian economy rebounded 13.6%, showing strong resilience helped by the reopening of the economy, an
acceptable vaccination process and historically high terms of trade as commodity prices rallied (such as the average price of copper increasing 51% compared to 2020). Other factors that contributed to the rebound were: (i) the disposal of
savings from pension funds accounts and (ii) expansionary monetary and fiscal policies. In the last quarter of 2021, Peru’s GDP recovered to pre-pandemic levels.
In 2022, the economy slowed down to 2.7%, as private investment fell, business confidence remained low and policy stimulus was withdrawn. However, private consumption remained strong, especially in the first half
of 2022, driven by the release of pent-up demand, the recovery of employment and availability from savings in AFPs and Severance Indemnity deposits. In the second half of 2022, the rebound in consumption after the acute effects of the COVID-19
pandemic faded and was limited almost entirely to inbound tourism from abroad.
Heading into 2023, the signs of weakness in the economy were clearer. Peru’s GDP grew approximately 1.7% from the last quarter of 2021 to in the last quarter of 2022, as primary sectors recovered mainly due to
the beginning of commercial operations of Quellaveco (with the mining sector growing 6.9% over the same period), while the non-primary sectors continued to slow down as private consumption dynamism lost strength (with private consumption
growing only 2.3% in the last quarter of 2022 compared to the last quarter of 2021), as compared to 4.7% in the first half of 2022 from the first half of 2021.
Inflation became a universal issue, as almost every country in the world grappled with soaring prices in 2022 and Peru was no exception. As measured using the CPI, prices in Peru increased 8.5% from year-end 2021
to year-end 2022, the largest annual increase in 26 years and significantly above the upper bound of the BCRP´s target range of 1% to 3% for a second year in a row. Throughout the year, inflation in Peru was mainly driven by higher commodity
prices, in both the energy and agricultural sectors (with, from year-end 2021 to year-end 2022, WTI increasing 39%, the price of wheat increasing 28% and the price of corn increasing 19%), along with prices for certain services still affected
by the post-pandemic reopening. Both the energy and agricultural price increases were reflected in related categories on the CPI over the same period: (i) Food and Beverages (+42%); (ii) Restaurants and Hotels (+18%); and (iii) Transportation
(+17%). In the same period, core inflation (excluding food and energy) rose to 5.6%, close to its highest in 22 years.
To avoid the anchoring of its targeted inflation expectations and in an attempt to return inflation to its target range, the BCRP adopted an aggressive hiking rate cycle, as did most developing and emerging
countries. The BCRP increased its monetary policy rate from 0.25% in July 2021 to 7.50% in December 2022. On January 12, 2023, it raised its rate again by 25bps to 7.75%, a new historical high. The monetary authority, which since September 2022
had slowed its pace of interest rate hikes from 50bps to 25bps per meeting, surprised markets by deciding not to increase its rate at its February 2023 meeting. According to the BCRP, this pause does not imply the end of the hiking cycle.
Hence, future rate hikes will be conditional on new information regarding inflation and its determinants, including the macroeconomic effects of recent social conflicts.
Regarding the members of the BCRP Board of Directors, in October 2021, Peru’s newly elected government and congress ratified Julio Velarde as the BCRP’s president (a position that he has held since 2006) and
elected three of the six directors on the Board to join Velarde: the economists Roxana Barrantes, José Távara and Germán Alarco. Congress appointed the other three directors: Carlos Oliva (ex-Minister of Finance), Diego Macera, and Inés Marylin
Choy. The Board of the BCRP is made up of 7 members: 1 president of the Board of directors and 6 directors. The executive branch appoints the chairman of the board and three directors, while the congress appoints another three directors and
ratifies the BCRP’s president.
In Peru, the current account deficit for 2022 was 4.3% of GDP, compared to 2.3% of GDP for 2021. The increase in the deficit is mainly associated with the reduction of the trade surplus to US$9.6 billion from
US$14.9 billion the previous year. From 2021 to 2022, exports grew 4.3% (volume +2.0% and export prices +1.8%) while imports grew 16.7% (volume +2.7% and import prices +13.7%). Additionally, terms of trade fell 10.4% in 2022, the first year of
losses after two consecutive years of increases (with 2021 seeing Peru’s highest terms of trade in almost 50 years), because of lower copper export prices and higher oil import prices. In December 2022, the terms of trade stood around the
levels of late 2019 and early 2020 and 12% below the all-time high reached in June 2021.
According to the BCRP, the USDPEN the end of 2022 was at 3.8125, an appreciation of 4.1% compared to the end of 2021. Compared to the currency exchange rates of the Latin-American region, the USDPEN was the one
that increased the most in 2022, after the Brazilian Real (5.1%) and Mexican peso (5.0%). This was in a year where the global dollar (DXY) reached its highest in two decades as the FED enacted an aggressive rate-hiking cycle. In 2022, the
USDPEN fluctuated between a minimum of 3.64 at the beginning of April and a maximum of 4.00 at the end of October. The political events of December 2022 (including the attempted coup of Pedro Castillo, the approval of his removal by Peru’s
congress and the swearing in of Dina Boluarte as the new president of Peru) and January 2023 have had a limited effect on the exchange rate. However, against the appreciation pressures seen on other Latam currencies in the beginning of 2023 as
external conditions improve for Emerging Markets, the sol has remained relatively stable and is down 0.2% against the dollar from the end of 2022 to March 8th,
2023.
In this context, in 2022, the BCRP sold US$1.2 billion in the spot market, equivalent to 10% of 2021 net sales, with most of the intervention concentrated in the first half of 2022. Outstanding FX swaps remained
stable at PEN 38.1 billion (PEN 37.8 billion in 2021). In 2023, through mid-February, the BCRP had intervened only once in the spot market. selling US$1 million. Finally, Peru’s net international reserves at the end of 2022 were US$71.9 billion
(US$78.5 billion in 2021), approximately 31% of GDP (one of the world’s highest percentages and were US$74.4 billion as of February 8, 2023.
With respect to the fiscal accounts, Peru has made a remarkable effort to return the deficit to acceptable levels, decreasing its deficit from 8.9% of GDP in 2020 to 2.5% in 2021 and to 1.6% in 2022, among the
lowest ratios in the region. The 2022 reduction can be explained, to a large extent, by an increase in tax revenues (12.7%), while current expenditures fell 0.9% due to lower expenses associated with COVID-19 and investment spending grew 19.1%.
We believe solid fiscal performance within the framework of responsibility and sustainability is one of Peru’s strongest fiscal fundamentals. This strategy supports the low debt-to-GDP ratios that the Peruvian economy has exhibited over the
last two years, also among the lowest ratios in the region.
However, under the social and political crisis, in December 2022, S&P changed the outlook for Peru´s long-term debt in foreign currency to negative from stable (and kept the credit rating at BBB) due to the
challenging relationship between the executive and legislative branches, which has in turn limited the government’s ability to implement timely policies. S&P added that they could lower the ratings by one notch if prolonged political
impasse or further adverse developments reduce the predictability of policymaking or worsen institutional stability. In October, Fitch made a similar move, changing the outlook for Peru to negative and keeping the rating at BBB. In January
2023, Moody’s followed suit and now assigns Peru a negative outlook on its Baa1 rating.
|
Macroeconomic Indicators for Peru
|
2019
|
2020
|
2021
|
2022
|
|
GDP (Millions of US Dollars)
|
232,447
|
205,553
|
225,861
|
241,146
|
|
Real GDP (% change)
|
2.2
|
(11.0)
|
13.6
|
2.7
|
|
Inflation
|
1.9
|
2.0
|
6.4
|
8.5
|
|
Reference Rate
|
2.25
|
0.25
|
2.50
|
7.50
|
|
Fiscal Balance (% GDP)
|
(1.6)
|
(8.9)
|
(2.5)
|
(1.6)
|
|
Public Debt (% GDP)
|
26.6
|
34.6
|
35.9
|
34.0
|
|
Financial System Loans (% change)
|
6.4
|
12.9
|
7.0
|
3.1
|
|
Current Account Balance (% GDP)
|
(0.7)
|
1.2
|
(2.3)
|
(5.0)
|
|
Exchange rate, end of period
|
3.31
|
3.62
|
3.99
|
3.81
|
|
Exchange rate, (% change)
|
(1.7)
|
9.4
|
10.2
|
(4.5)
|
In 2021, the Public Treasury successfully issued global bonds in March and October/November, denominated in USD and Euros. In March 2021, the Public Treasury issued the following USD-denominated bonds: (i)
US$1.75 billion through the reopening of the 2031 bond and (ii) US$1.25 billion in bonds maturing in 2041 and US$1 billion in bonds maturing in 2051. It also issued EUR 825 million in a 2033 bond. Between October and November 2021, the Public
Treasury issued USD-denominated bonds with a reopening in 2051 for USD 750 million, and two new sustainable bond references maturing in 2034 for US$2.25 billion and in 2072 for US$1 billion; in addition, it issued a new social bond reference
maturing in 2036 for EUR 1 billion. In total, the Public Treasury issued US$8 billion and EUR 1.85 billion in global bonds. The March issuance, at a competitive cost, was intended to finance the financial requirements set forth in the Public
Sector Budget Law for Fiscal Year 2021, a bill passed in late 2020 by Peru’s congress in order to address the budgetary needs of the country. The October/November issuances were intended to finance the country’s fiscal needs for 2022.
In 2022, the Public Treasury did not issue bonds in international markets, as conditions were not favorable.
|
Macroeconomic Indicators 2022
|
Bolivia
|
Colombia
|
Chile
|
Panama
|
|
|
Real GDP (% change)
|
4.0
|
7.5
|
2.4
|
10.8
|
|
|
Inflation
|
3.1
|
13.1
|
12.8
|
2.9
|
|
|
Reference rate
|
N.A.
|
12.0
|
11.25
|
N.A.
|
|
|
Public debt (as % GDP)
|
80.5
|
64.1
|
36.0
|
62.0
|
|
|
Exchange rate, end of period
|
6.93
|
4,851
|
870
|
N.A.
|
|
|
Exchange rate, (% change)
|
0.0
|
19.3
|
(0.1)
|
N.A.
|
N.A. – Not Applicable
In Bolivia, GDP grew around 4.0% in 2022, according to local estimates, as the economy continues to recover from the COVID-19 pandemic, driven largely by sectors including transport, energy, services and
construction. The rise in commodity prices, especially energy and soft commodities, exacerbated by the war between Russia and Ukraine, favored the exports of minerals, gas, and some agricultural products. Unlike most countries in the world,
Bolivia did not suffer from a shock to disposable income stemming from inflationary pressures, because the government adopted a series of subsidies. However, the increase in oil prices did put additional pressure on the trade balance during the
last quarter of 2022, reducing the country’s fiscal surplus compared to 2021. For its part, the international reserves continued the decrease first observed in 2015 and closed the year at US$3.8 billion, an amount equivalent to 4 months of
imports. Lastly, fiscal imbalances persisted, with a deficit between 7% and 8% of GDP and public debt at approximately 80% of GDP at year-end 2022. As a result, on December 6, 2022, S&P cut Bolivia’s credit rating by one notch, to B with
stable outlook, and stated in its report that political challenges in Bolivia had worsened with increasing regional tensions and divisions within the ruling coalition, with political impasse raising the risk of further erosion of external
liquidity in a context of tight external market conditions.
Colombia’s GDP grew 7.5% in 2022, one of the highest growth rates in the world, related to: (i) positive terms of trade not seen in decades with average oil prices 40% higher in 2022 than 2021, (ii) the
remarkable evolution of consumption as household spending remained strong due to record-high remittances and the continuous reopening of the economy and (iii) the expansionary fiscal stance maintained by the government. Regarding inflation,
despite the Central Bank’s effort to contain the rise in inflation, pressures remain acute. Since 2021, the Central Bank has increased its interest rate by 1,100bps. from 1.75% to 12.75%. Despite favorable terms of trade, the Colombia’s account
deficit remains one of the largest ratios among emerging countries (6.2% in 2022). Although the fiscal deficit in 2022 was better than initially expected (5.5% of GDP) there are still concerns about the elevated levels of public debt (64.1% of
GDP). It is important to recall that in 2022, politics took center stage after the election of the first left-leaning President in the history, Gustavo Petro. His first months as government were marked by high uncertainty, reflected in a clear
underperformance of Colombian financial assets. The exchange rate closed 2022 with a depreciation of 20.8% (end of period) and reached a historic high of USDCOP 5061 on November 7, 2022. Finally, after successfully approving a tax reform for
1.3% of GDP, attention has shifted to topics like the energy transition proposal and the announced reforms in health and pension systems.
In Chile, the economy grew 2.4% in 2022, according to preliminary estimates. The performance of the Chilean economy has been related to the positive evolution of private consumption and a higher-than-expected
dynamism of investment. As such, domestic pressures fueled on the back of pension fund withdrawals and fiscal transfers played a key role in driving inflation up to 12.8% at the end of 2022, the highest in decades. Hence, the Central Bank
raised its interest rate from 0.75% in July 2021 to 11.25% in October 2022 and has kept it stable during the last four meetings. On the fiscal front, Chilean the government evidenced strong discipline, with the fiscal balance showing its first
surplus in almost a decade of 1.1% of GDP, explained by higher tax collection linked to lithium revenues, temporary taxes and larger dividend payments by companies. Lastly, on the political front, after the text for a new constitution was
rejected in September 2022, Chile’s congress approved a new constituent process and Chileans will vote again on a new constitution in December 2023. Additionally, pension and tax reform are currently under discussion at the congressional
commission level.
Panama’s economic activity grew 10.8% in 2022, gaining momentum and finally running above 2019 levels. This economic growth was largely driven by the resumption of the construction of Panama’s third metro line,
recovering private investment, increased activity through the Canal de Panamá and copper production from Minera Cobre Panamá (the largest private investment project in the country’s history). Panama’s total copper exports grew from minimum
levels to USD 2.9 billion in 2022. Rising living costs in Panama, especially of gasoline prices, which increased almost 80% from levels the year prior at one point in 2022, sparked the largest social protests in at least three decades in
mid-2022. Other factors behind social unrest were high inequality, given Panama’s position as the third most unequal country in the region as measured by the Gini index, according to World Bank data), and a greater public perception of
corruption in the political arena. As a result, in October, Moody’s changed the credit rating outlook from stable to negative (keeping the rating at Baa2) given rising fiscal pressures stemming from an increasingly rigid spending structure
related to upward trends in wages, transfers and interest payments. Public debt, as a percentage of GDP, peaked in 2020 at 68% of GDP, fell to 64% in 2021 and was 62% in 2022, representing an increase of more than 20 percentage points from 2018
(when it was 40% of GDP).
For further information, see “ITEM 3. KEY INFORMATION – 3.D Risk Factors – “Economic and market conditions in other countries may affect the Peruvian economy and the market price of Peruvian securities” and “Our
business and results of operations could continue to be negatively impacted by the COVID-19 outbreak or other public health crises beyond our control.”
3.1 Basis of presentation, use of estimates and changes in accounting policies
The accompanying consolidated financial statements have been prepared in accordance with IFRS as issued by the IASB. For further details, refer to Notes to the consolidated financial statements, “3. Significant
Accounting Policies, a) Basis of presentation and use of estimates”.
3.2 Consolidation
The consolidated financial statements comprise the financial statements of Credicorp and its controlled subsidiaries for all the years presented. Control is achieved when Credicorp is exposed, or has rights, to
variable returns from its involvement with the investee and has the ability to affect those returns through its power over the investee. For further details refer to Notes to the consolidated financial statements, “3. Significant Accounting
Policies, b) Basis of Consolidation.”
3.3 Functional, presentation and foreign currency transactions
Functional and presentation currency
Credicorp and its Subsidiaries operating in Peru consider the Peruvian Sol to be their functional and presentation currency since it reflects the nature of the economic events and relevant circumstances for most
of the Group’s entities, taking into account their major transactions and/operations. These include: loans granted, financing obtained, sale of insurance premiums, interests and similar income, interest and similar expenses, as well as a
significant percentage of their purchases. These transactions and/or operations are agreed to and settled in Soles.
Transactions and balances in foreign currency
Foreign currency transactions are those entered into in a currency other than the functional currency. These transactions are initially recorded by the Group’s entities at the exchange rates of their functional
currencies at the transaction dates. For further detail refer to Notes to the consolidated financial statements, “3. Significant Accounting Policies, c) Functional, presentation and foreign currency transactions.”
3.4 Recognition of income and expenses from banking activities
Effective interest rate method:
Interest income is recorded using the effective interest rate (EIR) method for all financial instruments measured at amortized cost and at fair value through other comprehensive income. Interest expenses
corresponding to the liabilities measured at amortized cost are also recorded using the EIR.
The EIR is the rate that discounts future cash flows that are estimated to be paid or received during the life of the instrument or a shorter period, if appropriate, to the gross carrying amount of the financial
asset or financial liability. The EIR (and, therefore, the amortized cost of the financial asset or liability) is calculated by taking into account any discount, premium and transaction costs that are an integral part of the EIR of the
financial instrument, without including the expected credit loss.
Interest income and expenses:
The Group calculates interest income by applying the EIR to the gross carrying amount of those financial assets that are not impaired.
When a financial asset becomes impaired and, therefore, is considered in Stage 3 (as set out in Note 3(i) to the consolidated financial statements), the Group calculates interest income by applying the EIR at the
carrying amount of the asset, net of its provision for credit loss. If the criteria for the recognition of the financial asset in Stage 3 are no longer met, the Group recalculates interest income in gross terms.
Interest income and expenses accrued from all financial instruments that generate interest, including those related to financial instruments carried at fair value through profit or loss, are recorded under the
heading “Interest and similar income” and “interest and similar expenses” of the consolidated statement of income.
Dividends
Dividends are recorded as income when they are declared.
Commissions and fees
Commission income (which is not an integral part of the EIR) and fees are recorded as they accrue. Commissions and fees include, among other things, the commission charged for the banking service in general such
as account maintenance, shipping, transfers, loan syndication fees and contingent credit fees.
Non-interest income and expenses
All non-interest income and expenses are recorded in the period in which the performance obligation is satisfied.
3.5 Insurance activities
Insurance contracts are those contracts in which the Group (the insurer) has accepted a significant insurance risk from another party (the policyholder) by agreeing to compensate the policyholder if a specified
uncertain future event (the insured event) adversely affects the policyholder. These contracts also include reinsurance contracts that the Group holds.
Once a contract has been classified as an insurance contract, it remains an insurance contract for the remainder of its lifetime, even if the insurance risk reduces significantly during this period, unless all
rights and obligations are extinguished or expire.
The life insurance contracts provided by the Group include retirement, disability and survivor contracts, individual life contracts (including "Investment Link" insurance contracts), among others. The non-life
insurance contracts issued by the Group mainly include the following risks: vehicle, fire and allied lines, technical lines and health.
Reinsurance
The Group cedes insurance risk in the normal course of its operations for most of its businesses. Reinsurance assets represent balances due from reinsurance companies. Reinsurance ceded is placed on both a
proportional and non-proportional basis.
Amounts recoverable from reinsurers are estimated in a manner consistent with the outstanding claims reserve or settled claims and ceded premiums, associated with the ceded policies and in accordance with the
related reinsurance contracts.
Reinsurance assets are reviewed for impairment at each reporting date of the consolidated statement of financial position or more frequently when an indication of impairment arises during the reporting year.
Impairment occurs when there is objective evidence as a result of an event that occurred after initial recognition of the reinsurance asset that the Group may not receive all outstanding amounts due under the terms of the contract and the event
has a reliably measurable impact on the amounts that the Group will receive from the reinsurer. The impairment loss is recorded in the consolidated statement of income.
Ceded reinsurance arrangements do not relieve the Group from its obligations to policyholders.
The Group also assumes reinsurance risk in the normal course of its business for non-life insurance contracts when applicable. Premiums and claims on assumed reinsurance are recognized as revenue or expenses in
the same manner as they would be if the reinsurance were considered direct business, considering the classification of the reinsured insurance contract.
Reinsurance liabilities represent balances due to reinsurance companies. Amounts payable are estimated in a manner consistent with the related reinsurance contract.
Premiums and claims are presented as gross amounts for reinsurance ceded. Reinsurance assets or liabilities are written off when contractual rights are terminated or expire or when the contract is transferred to
a third party.
Reinsurance contracts that do not transfer significant insurance risk are not material to the insurance segment.
Insurance receivables
Insurance receivables are recognized when they are enforceable and measured on initial recognition at the fair value of the consideration received or receivable. Subsequent to initial recognition, insurance
receivables are measured at amortized cost.
As of December 31, 2021, and 2022, the carrying amount of the insurance receivables is similar to their fair value due to their short term. The carrying value of insurance receivables is reviewed for impairment
whenever events or circumstances indicate that the carrying amount may not be recoverable. The impairment loss is recorded in the consolidated statement of income.
“Investment Link” assets
“Investment Link” assets represent financial instruments held for purposes of funding a group of life insurance contracts and for which investment gains and losses are allocated directly to the policyholders who
bear the investment and reinvestment risk. Each account has specific characteristics and the assets are carried at fair value. The balances of each account are legally segregated and are not subject to claims that arise out of any other
business of the Group. The liabilities linked to these contracts are equal in amount to the assets that support them, net of the commissions that the Group charges for the management of these contracts.
Deferred acquisition costs (DAC)
DAC comprise the direct costs that originate with and are related to traditional life and Investment Link insurance contracts, which are deferred; all other acquisition costs are recognized as an expense when
incurred. The direct acquisition costs are composed primarily of agent commissions corresponding to the underwriting and policy issuance costs.
Subsequent to initial recognition, these costs are amortized on a straight line basis based on the average expiration period of the related insurance contracts. Amortization is recorded in the consolidated
statement of income.
DAC for general insurance and health products are amortized over the period in which the related revenues are earned.
DAC are derecognized when the related contracts are either settled or disposed of.
An impairment review is performed at the date of the consolidated statement of financial position or more frequently when an indication of impairment arises. When the recoverable amounts are less than the
carrying value, an impairment loss is recognized in the consolidated statement of income. DAC is also considered in the liability adequacy test for each reporting period.
Reinsurance commissions
Commissions on reinsurance contracts for ceded premiums are amortized on a straight line basis over the term of the coverage of the related insurance contract.
3.5.1 Insurance contracts liabilities
(i) Life insurance contract liabilities:
Life insurance liabilities are recognized when contracts are entered into.
The technical reserves maintained by the Group include the reserves of all of the business lines, comprising both the mathematical reserves and those of ongoing risk, as well as the reserves for outstanding
claims, settled claims, claim settlement costs, and claims incurred but not reported (IBNR), as applicable to each line.
Due to the nature of the business, the mathematical reserves of the pension lines represent the main part of the Group’s reserves, with life annuities as the major source of reserves due to the important volume
of premiums and as a result of having only single premiums. In order to determine the mathematical reserves of this business, the discounted present value of the expected future pensions is calculated on the basis of mortality tables and
interest rates. Those mathematical reserves are based on the market value of the assets portfolio that back the liabilities. Additionally, the constituted reserves include the amount required to cover the maintenance expenses related to the
administration of the payment of future pensions.
The mathematical reserves of the income lines are determined by the sum of the value discounted from future expected pensions to be paid during a defined or undefined period, calculated on the basis of the
current mortality and morbidity tables, and the market discount interest rates of the investment portfolio. During 2018, the Group adopted the new mortality tables approved and published by the SBS through SBS Resolution No.886-2018; these
tables reflect recent changes in the life expectancy.
The Group also uses discount rates in measuring annuities, in order to reflect the market value in the measurement of insurance liabilities, as of December 31, 2020, 2021 and 2022, the Group uses the market rate
for harvests of the portfolio of its financial assets for pension flows shifted by currency (market rates).
As of December 31, 2021 and 2022, adjustments to liabilities on each date of the consolidated statement of financial position are recorded in the consolidated statement of income (due to the effects of variation
in the mortality table) and in the consolidated statement of comprehensive income (due to the effect of the market rate); both effects included in the consolidated statements of comprehensive income as of December 31, 2021 and 2022. The
liability is written off when the contract expires, is eliminated or cancelled.
Likewise, in the Individual Life business, the Group offers both risk-only products and risk and savings products, with the latter constituting the highest percentage of reserves in the line. Risk and savings
products are differentiated between those with guaranteed interest rates and others without an interest guarantee. The reserve for risk and savings products with guaranteed interest rates is equal to the balance of the policy accounts plus
uncredited excess interest, and the reserve for those with an interest guarantee is equal to the balance of the policy accounts. These accounts are constituted of the premiums collected, tax deductions, expenses and the cost of the insurance
and the accreditation of interest based on the performance of the portfolio that supports said reserves.
Life insurance claims include reserves for reported claims and estimates of incurred claims that have not been reported (SONR or IBNR) to the Group. As of December 31, 2022, the reserves for incurred and
unreported claims were determined based on the Chain Ladder methodology (a generally accepted actuarial method), whereby the weighted average of the evolution of past claims is projected into the future.
This projection is based on historical occurrence ratios of accumulated claims. Due to the COVID-19 pandemic, as of December 31, 2022, 2021 and 2020, IBNR reserves were calculated in two parts:
a) IBNR reserve for regular claims (based on the Chain Ladder methodology) and
b) IBNR reserve for the expected excess mortality (deaths above the average number of cases in the pre-pandemic months).
For part a), the reserves were determined maintaining the expected loss ratio of the periods prior to the pandemic; and for part b), the IBNR reserves were determined based on the estimate of additional deaths to
the average (excess mortality) of each portfolio and subtracting additional claims to the average already reported to the Group. The excess mortality of each portfolio is calculated taking into account the excess mortality experienced in the
country by geographic location and age ranges and the representation of the portfolio of insured in those same segments. In general, claims reserves have been estimated using prudential criteria due to the uncertainty in the claims rate caused
by the pandemic.
At each reporting date, an assessment is made as to whether the life insurance liabilities are adequate, net of the related DAC, through a liability adequacy test in accordance with the provisions of IFRS 4. As
of December 31, 2021 and 2022, the Group's Management concluded that the liabilities are sufficient and, therefore, has not recognized any additional liability for life insurance contracts.
(ii) Non-life insurance contract liabilities (including general and health insurance).
Non-life insurance contract liabilities are recognized when the contract term begins.
Claims reserves are based on the latest estimated cost of all claims incurred but not settled as of the date of the consolidated statement of financial position, whether reported or unreported, together with
related claim costs and value of expected drawdown, salvage and other recoveries. There may be delays in the notification of the settlement of certain types of claims, therefore, the final cost of these cannot be known with certainty at the
date of the consolidated statement of financial position.
Claims occurred but not reported are estimated and included in the provision (liabilities). The reserves for claims that have not been reported are determined based on the Chain Ladder methodology (a generally
accepted actuarial method) that considers the statistical analysis of the experience in reporting claims of the Group, the expected costs of the claims to be reported and when appropriate, adjustments in the last estimated periods based on the
frequency and/or severity of the cases to better reflect the current conditions.
During the years 2021 and 2022, the Group incorporated the following factors into its estimate of the reserve for incurred and unreported claims (IBNR) of the general insurance businesses: adjustments in the
expected frequency of claims during the months of confinement, stoppages of transportation and activities in the country, and the decrease in the insured portfolio, which later recovered.
In the case of Medical Assistance (AMED), the IBNR estimate included the estimate of regular claims as well as the IBNR estimate for COVID claims, which had a different frequency and cost than regular claims.
No provision for stabilization or catastrophic reserves is recognized. The liability is written off when the contract expires, is eliminated or cancelled.
The technical reserves for non-life insurance contracts comprise the provision for unearned premiums, which represents the premiums received for risks that have not yet expired. In general, the reserve is
released during the term of the contract and is recognized as premium income.
On each reporting date, the Group reviews the risks of current insurance contracts and performs a liability adequacy test, as established by IFRS 4, to determine if there is any excess of expected claims over
unearned premiums. If these estimates show that the amount of unearned premiums is insufficient, the deficiency is recognized in the consolidated statement of income as a provision for liability adequacy. As of December 31, 2021, and 2022,
Management concluded that the liabilities are sufficient and, therefore, has not recognized any additional liabilities from non-life insurance contracts.
Revenue Recognition:
(i) Gross premiums
Life insurance contracts
Gross life insurance premiums are recognized as income when they become due from the policyholder. For single premium businesses, revenue is recognized on the date the insurance contract is effective.
Non-life insurance contracts
Gross non-life insurance direct and accepted premiums comprise the total written premiums and are recognized on the policy issuance date as an account receivable. At the same time, a reserve for unearned
premiums is recognized, which represents the premiums whose risks remain current. Unearned premiums are recognized as income in the contract period, which is also the coverage and risk period.
(ii) Fees and commission income
The insured of the “Investment Link” insurance contracts remunerate the Group for policy administration services, investment administration services, redemptions and other fees. These fees are recognized as
income in the consolidated statement of income for the period in which the services are provided.
Recognition of benefits, claims and expenses:
(i) Benefits and claims
Benefits and claims for life insurance contracts include the cost of claims that arise during the year, including internal and external costs related to handling the claims, that are directly linked to the
processing and settlement of claims. Claims for death, survival and disability are recorded based on notifications received. Pension payments are recognized when they accrue.
Health and general insurance claims include all claims that occurred during the year, whether reported or not, the internal and external costs of handling such claims that are directly linked to the processing
and settlement of claims, a reduction for the value salvage and other recoveries and any adjustments to claims from prior years.
(ii) Ceded premiums
Ceded premiums include the total premiums payable for the coverage of the insurance contracts and are recognized on the date that the insurance contract commences. Unearned ceded premiums are deferred over the
term of the related insurance contract.
(iii) Reinsurance claims
Reinsurance claims are recognized when the related gross insurance claim is recognized in accordance with the terms of the relevant contract.
For further details, refer to Notes to the consolidated financial statements, “3. Significant Accounting Policies, e) Insurance activities.”
3.6 Financial Instruments: Initial recognition and subsequent measurement
As of December 31, 2021, and 2022, the Group classified financial assets in one of the categories defined by IFRS 9: financial assets at fair value through profit or loss, at fair value through other
comprehensive income and at amortized cost, based on:
| ◾ |
The business model for managing the financial assets and
|
| ◾ |
The characteristics of the contractual cash flows of the financial asset.
|
The business model: explains how the financial assets are managed to generate cash flows and does not depend on Management’s intention regarding to an individual instrument. Financial assets can be managed for
the purpose of: (i) obtaining contractual cash flows; (ii) obtaining contractual cash flows and sale; or iii) others. In order to evaluate a business model, the Group considers the risks affecting the performance of the business model, and the
manner in which the performance of the business model is evaluated and reported to Management. If the cash flows are carried out in a manner other than what is expected by the Group, the classification of the remaining financial assets in this
business model is not modified.
When the financial asset is held in business models i) or ii), it requires the application of the “Solely Payments of Principal and Interest” (SPPI) test. This test evaluates the cash flows generated by a
financial instrument in order to verify if the contractual terms of the financial asset give rise on specified dates to cash flows that are solely payments of principal and interest. In order to conform to this concept, the cash flows must
solely include the consideration of the time value of money and the credit risk. If the contractual terms introduce risk exposure or cash flow volatility, such as the exposure to changes in the prices of capital instruments or the prices of raw
materials, the financial asset is classified at fair value through profit or loss. Hybrid contracts must be evaluated as a whole, including all the integrated characteristics. The accounting of a hybrid contract that contains an embedded
derivative is carried out jointly; in other words, the entire instrument is measured at fair value through profit or loss.
The reclassification of financial assets will take place when the business model that manages the financial assets is changed. We expect this type of change to be rare. These changes are
determined by approval of the Group's management as a result of external or internal changes, which must be significant for the Group's operations and demonstrable to third parties. Financial liabilities are never reclassified. When the Group
changes its business model for the management of financial assets, it will reclassify all affected financial assets prospectively from the reclassification date. The Group will not restate previously recognized gains, losses or interest
(including gains or losses due to impairment of value).
For further detail refer to Notes to the consolidated financial statements, “3. Significant Accounting Policies, f) Financial instruments: Initial recognition and subsequent measurement.”
3.7 De-recognition of financial assets and financial liabilities
3.7.1 Financial assets
A financial asset (or, where applicable a part of a financial asset or a part of a group of similar financial assets) is derecognized when: (i) the rights to receive cash flows from the asset have expired; or
(ii) Credicorp has transferred its rights to receive cash flows from the asset or has assumed an obligation to pay the received cash flows in full without material delay to a third party under a pass-through arrangement; and either Credicorp
has transferred substantially all the risks and rewards of the asset, or Credicorp has neither transferred nor retained substantially all the risks and rewards of the asset, but has transferred control of the asset.
When the Group has transferred its right to receive cash flows from an asset or has entered into a pass-through arrangement, it evaluates if and to what extent it has retained the risks and rewards of ownership.
When it has neither transferred nor retained substantially all of the risks and rewards of the asset, nor transferred control of the asset, the Group continues to recognize the transferred asset to the extent of the Group’s continuing
involvement.
In that case, the Group also recognizes the associated liability. The transferred asset and the associated liability are measured on a basis that reflects the rights and obligations that the Group has retained.
Continuing involvement that takes the form of a guarantee over the transferred asset is measured at the lower of (i) the original carrying amount of the asset, and (ii) the maximum amount of consideration that
the Group could be required to repay.
3.7.2 Financial liabilities
A financial liability is derecognized when the obligation under the liability is discharged, cancelled or expires. When an existing financial liability is replaced by another from the same lender on
substantially different terms, or the terms of an existing liability are substantially modified, such exchange or modification is treated as a de-recognition of the original liability and the recognition of a new liability. The difference
between the carrying amount of the original financial liability and the consideration paid is recognized in the consolidated statements of income.
3.8 Offsetting financial instruments
Financial assets and liabilities are offset and the net amount is reported in the consolidated statements of financial position when there is a legally enforceable right to offset the recognized amounts and
management has the intention to settle on a net basis or realize the assets and settle the liability simultaneously.
3.9 Impairment of financial assets
As of December 31, 2020, 2021 and 2022, the Group applies a three-stage approach to measure the provision for credit loss, using an impairment model based on the expected credit losses as established in IFRS 9,
for the following categories:
:
| • |
Financial assets at amortized cost,
|
| • |
Debt instruments classified as investments at fair value through other comprehensive income, and
|
| • |
Indirect loans that are presented in off-balance accounts.
|
Financial assets classified or designated at fair value through profit or loss and the equity instruments designated at fair value through other comprehensive income, are not subject to an impairment evaluation.
Financial assets migrate through three stages according to the change in the credit risk from the initial recognition.
For further details, refer to Note 3(i) (Significant Accounting Policies: Impairment of financial assets) to the consolidated financial statements.
3.10 Leases
Policy applicable from January 1, 2019
As of December 31, 2021, and 2022, the Group maintains mainly leased premises, used as offices, agencies, servers, and technological platforms, which were registered in accordance with the provisions of IFRS 16
for Leases. This standard state that a contract is, or contains, a lease if the contract transfers the right to control the use of an identified asset for a period of time in exchange for a consideration.
Initial Recognition
The lease contracts are recorded in the consolidated statement of financial position as a right-of-use asset and a lease liability as of the date the leased asset is available for use.
The right-of-use assets are initially recognized at cost including the following:
- The amount of the initial measurement of the lease liability.
- Any lease payment paid to the lessor before the start date or on the same date.
- Direct costs incurred and costs for dismantling or rehabilitation, if any.
Lease liabilities include the present value of fixed payments and variable lease payments that are based on an index or rate. Lease payments that will be made under renewal options with reasonable certainty of
being exercised are included in the measurement of the liability.
Lease payments are discounted using the interest rate implicit in the lease, if that rate could be determined easily, or the incremental interest rate by loans of the lessee, which is the interest rate that the
lessee would have to pay for borrowing for a similar term, the funds necessary to obtain an asset of similar value asset by the right-of-use in a similar economic environment with similar terms, guarantees and conditions.
In determining the term of the lease, Management considers all the facts and circumstances that create an economic incentive to exercise the extension option, or not to exercise a termination option. Likewise,
the estimation of the extension or termination options will be revalued only if an event or changes in the circumstances occur within the control of the entity that affects said estimate.
Subsequent Recognition
The right-of-use asset is generally depreciated in a straight line during the shortest period of the asset's useful life and the lease term. If the Group is reasonably certain of exercising a purchase option, the
right-of-use asset depreciates over the useful life of the underlying asset.
The Group has chosen to measure the asset at cost less depreciation and accumulated impairment loss, with adjustments for any new measurement of the lease liability. Depreciation is calculated in a straight line
within the term of the lease.
The liability will be recorded at its amortized cost, that is, it will be increased to reflect the accrued interest. This is recognized under the section titled “Interest, returns and similar expenses” of the
consolidated statement of income. The fees paid will be subtracted.
Likewise, the balance of the liability will be reviewed in the following cases:
- When there is a change in the expected amount to be paid under a residual value guarantee.
- When there is a change in future lease installments to reflect the variation in an index or interest rate.
- When there is a change in the terms of the lease.
- When there is a change in the evaluation of an option to purchase the underlying asset.
The changes will be recorded as an adjustment of the lease liability and the right of use, unless the book value of the right of use has been reduced to zero, in which case it must be recorded against the
consolidated statement of income.
Short-term leases with little significant value are recognized in a straight line as an expense in the “Administrative expenses” item of the consolidated statement of income.
The accounting treatment of lessors continues with a similar model to that of IAS 17. Thus, lessors continue to distinguish between financial and operating leases.
3.11 Business combination
Business combinations made are accounted for using the acquisition method in accordance with IFRS 3 “Business Combination”, regardless of whether they are equity instruments or other acquired assets.
The acquisition cost is the sum of the consideration paid for the acquisition measured at fair value at the acquisition date and the amount of the share in the non-controlling interest acquired. For each business
combination, the Group decides whether to measure the non-controlling interest in the acquire at fair value or at the proportional share in the identifiable net assets of the acquired. Acquisition-related costs are recognized as expenses and
are included as “Administrative expenses” in the consolidated statement of income.
When the Group acquires a business, it assesses the financial assets and liabilities assumed for its own classification and denomination according to the contractual terms, economic circumstances and prevailing
conditions at the date of acquisition. This includes the separation of embedded derivative contracts signed by the acquire.
Any contingency transferred by the acquirer is recognized at fair value at the acquisition date. The contingency classified as an asset or liability that is a financial instrument and is within the scope of IFRS
9 “Financial instruments”, is measured at fair value with changes recognized in the consolidated statement of income or consolidated statement of comprehensive income. If the contingency is not within the scope of IFRS 9, it is measured in
accordance with the applicable IFRS. A contingency that is classified as equity should not be measured again and its subsequent settlement is accounted for within equity.
The acquisition of a non-controlling interest is recorded directly in net equity, and any difference between the amount paid and the acquired net assets is recorded as an equity transaction. Accordingly, the
Group recognizes no additional goodwill after the acquisition of the non-controlling interest, nor does it recognize any profit or loss from the disposal of the non-controlling interest.
If there is a contractual obligation to acquire the shares of the non-controlling interest through a put option, the Group will initially recognize a liability at fair value through profit or loss equivalent to
the market value of the non-controlling interest against the account "Reserves and others” in equity. After its initial recognition, the liability is measured at fair value and changes are recorded in the income statement until the option is
exercised. If the option expires without being exercised, the liability is derecognized by adjusting net equity.
Equity attributable to the non-controlling interest is shown separately in the consolidated statement of financial position. Profit attributable to the non-controlling interest is shown separately in the
consolidated statement of income and consolidated statement of comprehensive income.
If a business combination achieved in stages, the acquisition date and the value of the previous participation of the acquirer is measured again at a fair value at the date of acquisition. The gains or losses
arising from such remedy are recognized in profit or loss. Likewise, in accordance with IFRS 3, from the date of acquisition of a company that isn't under common control, the acquirer has a subsequent 12-month period to be able to adjust the
initial recognition of goodwill. In 2022, the Group did not carry out any business combinations.
Combinations of entities under common control
A business combination between entities, or businesses under common control is outside the scope of IFRS 3, because it corresponds to a business combination in which all the entities or businesses that are
combined are controlled, ultimately, by the same part or parts, before and after the business combination. In these transactions, the Group recognizes the assets acquired under the interest unification method, whereby the assets and liabilities
of the combined companies are reflected at their book values and no goodwill is recognized as a result of the combination.
3.12 Goodwill
Goodwill is the excess of the aggregate of the consideration transferred and the fair value recognized for the acquisition of the net value of the identifiable net assets acquired and liabilities assumed. If the
fair value of the net assets acquired exceeds the aggregate consideration transferred, then the gain is recognized in the consolidated statement of income.
After initial recognition, goodwill is measured at cost less any accumulated impairment losses. For the purpose of impairment testing, goodwill acquired in a business combination is, from the acquisition date,
allocated to each of the Group’s cash-generating units (CGUs) that are expected to benefit from the combination, irrespective of whether other assets or liabilities of the acquire are assigned to these units.
Where goodwill has been allocated to a CGU and part of the operation within that unit is disposed of, the goodwill and the assets disposed of are included in the carrying amount of the operation when determining
the gain or loss on disposal. Goodwill disposed of in these circumstances is measured based on the relative values of the disposed operation and the portion of the CGU retained.
Impairment is determined for goodwill by assessing the recoverable amount of each CGU (or group of CGUs) to which the goodwill relates. Where the recoverable amount of the CGU is less than its carrying amount, an
impairment loss is recognized. Impairment losses relating to goodwill cannot be reversed in future periods.
3.13 Impairment of non-financial assets
The Group assesses at each reporting date, whether there is an indicator that an asset may be impaired. If any indication exists, or when annual impairment testing for an asset is required, the Group estimates
the asset’s recoverable amount. An asset’s recoverable amount is the higher of the value of the asset or the CGU less costs to sell and its value in use, and is determined for each individual asset, unless the asset does not generate cash
inflows that are largely independent of those from other assets or groups of assets.
When the carrying amount of an asset or CGU exceeds its recoverable amount, the asset is considered impaired and is written down to its recoverable amount. In assessing value in use, the estimated future cash
flows are discounted to their present value using a pre-tax discount rate that reflects current market assessments of the time value of money and the risks specific to the asset. In determining fair value less costs to sell, recent market
transactions, if any, are considered. If this type of transaction cannot be identified, an appropriate valuation model is used. These calculations are verified against valuation multiples, quoted share prices for publicly traded subsidiaries or
other available fair value indicators.
For non-financial assets, excluding goodwill, an assessment is made at each reporting date of whether there is an indication that previously recognized impairment losses may no longer exist or may have decreased.
If such an indication exists, the Group estimates the recoverable amount. A previously recognized impairment loss is reversed only if there has been a change in the estimates used to determine the asset’s recoverable amount since the last
impairment loss was recognized.
The reversal is limited so that the carrying amount of the asset does not exceed its recoverable amount, nor exceed the carrying amount that would have been determined, net of depreciation, had no impairment loss
been recognized for the asset in prior years. Such reversal is recognized in the consolidated statement of income.
3.14 Derivative financial instruments and hedge accounting
Credicorp negotiates derivative financial instruments in order to satisfy clients’ needs. Credicorp may also take positions with the expectation of profiting from favorable movements in prices, rates or indexes.
Credicorp also uses derivative instruments to manage exposures to interest rates and foreign currency. In order to manage particular risks, Credicorp applies hedge accounting for transactions which meet the specified criteria. For further
details about the accounting policies used for Derivative financial instruments, refer to Note 3(y) (Significant Accounting Policies: Derivative financial instruments and hedge accounting) to the consolidated financial statements.
3.15 Fair value measurement
Fair value is the price that would be received to sell an asset or paid to transfer a liability in an orderly transaction between market participants at the measurement date. The fair value measurement is based
on the presumption that the transaction to sell the asset or transfer the liability takes place either:
- In the principal market for the asset or liability, or
- In the absence of a principal market, in the most advantageous market for the asset or liability.
The principal or the most advantageous market must be accessible by the Group. Additionally, the fair value of a liability reflects its non-performance risk.
When available, the Group measures the fair value of an instrument using the quoted price in an active market for that instrument. A market is regarded as active if transactions for the asset or liability take
place with sufficient frequency and volume to provide pricing information on an ongoing basis.
If there is no quoted price in an active market, then the Group uses valuation techniques that maximize the use of relevant observable inputs and minimize the use of unobservable inputs.
The chosen valuation technique incorporates all of the factors that market participants would consider in pricing a transaction.
All assets and liabilities for which fair value is measured or disclosed in the consolidated financial statements are categorized within the fair value hierarchy, described as follows, based on the lowest level
of input used that is significant to the fair value measurement as a whole:
- Level 1: Quoted (unadjusted) market prices in active markets for identical assets or liabilities.
- Level 2: Valuation techniques for which the lowest level input that is significant to the fair value measurement is directly or indirectly observable.
- Level 3: Valuation techniques for which the lowest level input that is significant to the fair value measurement is unobservable.
For assets and liabilities that are recognized at fair value in the consolidated financial statements on a recurring basis, the Group determines whether transfers have occurred between levels in the hierarchy by
re-assessing categorization at the end of each reporting period.
For the purpose of fair value disclosures, the Group has determined classes of assets and liabilities on the basis of the nature, characteristics, and risks of the asset or liability and the level of the fair
value hierarchy as explained above.
3.16 Segment reporting
The Group reports financial and descriptive information about its reportable segments. Reportable segments are operating segments or aggregations of operating segments that meet specified criteria.
Operating segments are a component of an entity for which separate financial information is available that is evaluated regularly by the entity’s CODM in making decisions about how to allocate resources and in
assessing performance. Generally, financial information is required to be reported on the same basis as it is used internally for evaluating operating segments’ performance and deciding how to allocate resources to segments.
3.17 Fiduciary activities, management of funds and pension funds
The Group provides custody, trustee, investment management, and advisory services to third parties that result in the holding of assets on their behalf. These assets and income arising thereon are excluded from
the consolidated financial statements, as they are not assets of the Group.
Commissions generated for these activities are included as “Commissions and fees” in the consolidated statement of income.
3.18 Cash and cash equivalents
For the purpose of the consolidated statements of cash flows, cash and cash equivalents comprise balances of cash and non-restricted balances with central banks, overnight deposits, time deposits and amounts due
from banks with original maturities of three months or less, excluding restricted balances.
Cash collateral pledged as a part of repurchase agreements are presented as “Cash collateral, reverse repurchase agreement and securities borrowings” in the consolidated statement of financial position.
Cash collateral pledged as a part of derivative financial instrument and others are presented in “Other assets” in the consolidated statement of financial position.
3.19 Repurchase and reverse repurchase agreements and securities lending and borrowing
Securities sold under repurchase agreements at a specified future date are not derecognized from the consolidated statement of financial position as the Group retains substantially all of the risks and rewards of
ownership. The cash received is recorded as an asset in “Cash and due from banks” and the corresponding obligation to return it is recognized too, including accrued interest, as a liability in “Payables from repurchase agreements and securities
lending”, reflecting the transaction’s economic substance as a loan to the Group. The difference between the sale and repurchase price was treated as interest expense and accrued over the life of the agreement using the effective interest rate
and was recognized in “Interest and similar expenses” in the consolidated statement of income.
As part of this transaction the Group grants assets as collateral. When the counterparty receives securities and has the right to sell or re-pledge, the Group reclassifies those securities in “Investments at fair
value through other comprehensive income pledged as collateral” or “Amortized cost investments pledged as collateral”, as appropriate, in the consolidated statement of financial position. When the counterparty receives cash as collateral that
will be restricted until the maturity of the contract, the Group reclassifies the cash in “Cash collateral, reverse repurchase agreements and securities borrowings” in the consolidated statement of financial position, which includes accrued
interest that is calculated according to the effective interest rate method.
Likewise, when the counterparty receives a loan portfolio, the Group maintains these loans in "Loan portfolio, net" in the statement of financial position, whose control is kept in off-balance sheet accounts.
On the other hand, securities purchased under reverse repurchase agreements on a specified future date are not recognized in the consolidated statement of financial position. Cash granted is recorded as an
outgoing asset in “Cash and due from banks” account and the corresponding right to charge it, including accrued interest, is recorded in “Cash collateral, reverse repurchase agreements and securities borrowing”, reflecting the transaction’s
economic substance as a loan granted by the Group. The difference between the purchase and resale price is recorded in “Interest and similar income” in the consolidated statement of income and is accrued over the life of the agreement using the
effective interest rate method.
If securities purchased under reverse repurchase agreement are subsequently sold to third parties, the obligation to return the securities is recorded as a short sale in the consolidated statement of financial
position as “Financial liabilities at fair value through profit or loss” and measured at fair value, with any gains or losses included in the consolidated statement of income as “Net gain on securities”.
Securities lending and borrowing transactions are usually collateralized by securities. The transfer of the securities to counterparties is only reflected in the consolidated statement of financial position if
the risks and rewards of ownership are also transferred.
Credicorp monitors the results of its operating segments separately for the purpose of making decisions about resource allocation and performance assessment. Regarding
Credicorp’s LoBs, total external income from the universal banking LoB amounted to 62.8%, 61.9%, and 62.5% of Credicorp’s total external income (which corresponds to total interest and similar income, including income and expenses on
commissions and net premiums earned from insurance activities) in 2020, 2021 and 2022, respectively. Therefore, the following historical discussion and analysis is presented principally for the universal banking LoB, except when otherwise
indicated, and is based upon information contained in our consolidated financial statements and should be read in conjunction therewith. The discussion in this section regarding interest rates is based on nominal interest rates.
The financial information and the discussion and analysis presented below for 2020, 2021 and 2022 reflects the financial position and results of operations of our
subsidiaries. For further details, see “ITEM 3. KEY INFORMATION – 3.A Selected Financial Data.”
4.1 Consolidated contributions
See “Item 4.B Business Overview – (1) Credicorp” for the contribution to the consolidated net profit attributable to our equity
holders by each of our principal LoBs and subsidiaries, as well as for the percentage contribution to Credicorp total assets, total revenues, net profit, and equity attributable to Credicorp’s equity holders.
4.2 Financial performance
In 2022, we recorded a net profit, after non-controlling interest, of S/4,633.1 million (compared to S/3,584.6 million in 2021 and S/346.9 million in 2020). This represented
an increase of 29.3% as compared to the results in 2021. The increase was attributable to higher net income in Universal Banking, Microfinance and Insurance and Pensions, which stemmed from higher interest rates (for Universal Banking and
Microfinance) and claims reductions (for Insurance and Pensions). In addition, other expenses grew due to IT expenses driven by (i) higher volume of transactions (ii) development of new capabilities,
functionalities, and cybersecurity improvements and (iii) an increase in IT specialized employees in line with our strategy. Other general expenses driven by (i) an increase in the LoBs and transactional
levels through payment methods, and (ii) higher prices driven by inflation. Higher variable compensation due to an (i) uptick in the commercial results of the companies. And disruptive initiatives to maintain our leadership in the long term. These investments are becoming more relevant in our total cost structure and although they are on the way to cash flow neutrality, they still exhibit efficiency
ratios above 100%. In 2022, ROAE was 16.70% (compared to 13.94% in 2021 and 1.36% in 2020), and ROAA was 1.92% (compared to 1.49% in 2021 and 0.16% in 2020).
The main factors behind Credicorp’s results were:
| • |
The growth in total loans was 0.7% in year-end balances and 11.3% in average-daily balances. This increase was led by fishing and agricultural campaigns in the Wholesale Banking Group and an uptick in growth in the consumer segment
corresponding to economic reactivation at BCP Stand Alone. Mibanco also contributed to this increase, due to an improvement in loan growth through its hybrid model.
|
| • |
The cost of risk increased by 40bps from 2021, to 1.22% in 2022. This higher cost of risk was driven primarily by (i) the impact of inflation throughout the year in the consumer segment, (ii) growth in disbursements to higher risk
segments on SME-Pyme loans and (iii) the inclusion of maturities of specific vintages within Mibanco’s risk model. See also “ITEM 5. OPERATING AND FINANCIAL REVIEW AND PROSPECTS – 5.A Operating Results – (5) Financial Position – 5.1
Total Assets – Portfolio quality”.
|
| • |
Interest income, which is the most important component of income, rose 26.7% in 2022. This growth was driven mainly by the uptick in market rates in 2022, which impacted the yield on interest-earning assets. Additionally, the shift
to a higher-yield asset structure, which reflected growth in structural loans, favorably impacted this result. Interest expenses rose 40.3%, driven by growth in market rates, which subsequently impacted the cost of funding.
Additionally, fund migration from low-cost deposits to time deposits also contributed to higher interest expenses. In this context, Net Interest Income (NII) rose 23.1% from 2021 to 2022. At the end of 2022, Net Interest Margin (NIM)
was 5.07%, which reflects growth of 97bps from to the end of 2021. Additionally, due to the increase in the cost of risk, Risk Adjusted Net Interest Margin increased at a slower pace, from 3.57% in 2021 to 4.27% in 2022 (97 bps).
|
| • |
Other core income increased by 3.6% as compared to 2021. This was driven primarily by (i) an increase in Net gain on foreign exchange transactions (17.5%) as a result of market volatility and (ii) an increase in fee income (4.2%)
driven by growth in transactions, ongoing migration to digital channels and points of sale (POS); and an uptick in disbursements of personal loans.
|
| • |
Total insurance underwriting results (net earned premiums, less claims and acquisition cost) moved into positive territory as a result of higher net earned premiums in both the Life and P&C businesses, a significant decrease in
net claims in the Life Business, which reflected a drop in COVID-19 claims, and lower acquisition costs, corresponding to a reduction in commissions.
|
| • |
Operating Expenses increased 11.4%, mainly due to (i) expenses related to digital transformation and disruptive initiatives; and (ii) an increase in variable compensation in line with growth in net income.
|
| • |
The efficiency ratio decreased by 129bps, to 43.7%, primarily due to an expansion in net interest income.
|
Main ratios
|
2020
|
2021
|
2022
|
2021 – 2020
|
2022 – 2021
|
||||||||||||||||
|
(Expressed in basis points)
|
||||||||||||||||||||
|
ROAE (1)
|
1.36
|
%
|
13.94
|
%
|
16.70
|
%
|
1,258
|
276
|
||||||||||||
|
ROAA (2)
|
0.16
|
%
|
1.49
|
%
|
1.92
|
%
|
133
|
43
|
||||||||||||
|
NIM (3)
|
4.30
|
%
|
4.10
|
%
|
5.07
|
%
|
(20
|
)
|
97
|
|||||||||||
|
Funding cost (4)
|
1.79
|
%
|
1.29
|
%
|
1.83
|
%
|
(50
|
)
|
55
|
|||||||||||
|
Cost of risk (5)
|
4.30
|
%
|
0.82
|
%
|
1.22
|
%
|
(348
|
)
|
40
|
|||||||||||
|
Loan to deposit (6)
|
97.18
|
%
|
98.66
|
%
|
101.09
|
%
|
149
|
243
|
||||||||||||
|
Internal overdue ratio (7)
|
3.40
|
%
|
3.77
|
%
|
4.00
|
%
|
37
|
23
|
||||||||||||
|
Non-performing loan ratio (8)
|
4.62
|
%
|
4.99
|
%
|
5.41
|
%
|
37
|
42
|
||||||||||||
|
Coverage of Internal overdue loans (9)
|
211.26
|
%
|
152.40
|
%
|
132.40
|
%
|
(5,886
|
)
|
(2,000
|
)
|
||||||||||
|
Coverage on Non-performing loans (10)
|
155.76
|
%
|
115.14
|
%
|
97.84
|
%
|
(4,063
|
)
|
(1,729
|
)
|
||||||||||
|
Operating efficiency (11)
|
45.08
|
%
|
44.95
|
%
|
43.66
|
%
|
(13
|
)
|
(129
|
)
|
||||||||||
(1) Net profit attributable to Credicorp / Average* equity before non-controlling interest.
(2) Net profit attributable to Credicorp / Average* assets.
(3) NIM / Average* interest earning assets.
(4) Interest expense / Average* total funding.
(5) Provisions for loan losses, net of recoveries / Total loans.
(6) Total loans, net of unearned income / Total deposits and obligations.
(7) Internal overdue loans / Total loans. For the definition of Internal overdue loans see “ITEM 3. KEY INFORMATION – 3. A Selected financial data, Note (14).”
(8) Non-performing loans / Total loans. Non-performing loans = Internal Overdue Loans + Refinanced Loans + Restructured Loans
(9) Allowance for loan losses / Internal overdue loans.
(10) Allowance for loan losses / Non-performing loans.
(11) (Salaries and employee benefits + Administrative expenses + Depreciation and amortization + Acquisition cost + Association in participation) / (Net interest income + Commissions and fees + Net gain from exchange differences + Net gain
in associates + Net premiums earned + Net gain on foreign exchange transactions + Net loss(gains) on financial assets designated at fair value through profit or loss + Net gain on derivatives held for trading + Net loss from exchange
differences). Acquisition cost includes net fees, underwriting expenses, and underwriting income.
* Averages are determined as the average of period-beginning and period-ending balances.
For more details, see “ITEM 5. OPERATING AND FINANCIAL REVIEW AND PROSPECTS – 5.A. Operating results – (4) Historical Discussion and Analysis – 4.3 Results of Operations for
the Three Years Ended December 31, 2020, 2021 and 2022.”
4.3 Results of operations for the three years ending on December 31, 2020, 2021 and 2022
The following table sets forth, for the years 2020, 2021 and 2022, the principal components of our net profit:
|
Year ended December 31,
|
||||||||||||
|
2020
|
2021
|
2022
|
||||||||||
|
(in thousands of Soles)
|
||||||||||||
|
Interest and similar income
|
11,547,648
|
11,850,406
|
15,011,282
|
|||||||||
|
Interest and similar expenses
|
(2,978,696
|
)
|
(2,490,802
|
)
|
(3,493,187
|
)
|
||||||
|
Net interest, similar income and expenses
|
8,568,952
|
9,359,604
|
11,518,095
|
|||||||||
|
Provision for credit losses on loan portfolio
|
(6,080,289
|
)
|
(1,558,951
|
)
|
(2,158,555
|
)
|
||||||
|
Recoveries of written-off loans
|
159,781
|
346,728
|
347,017
|
|||||||||
|
Provision for credit losses on loan portfolio, net of recoveries
|
(5,920,508
|
)
|
(1,212,223
|
)
|
(1,811,538
|
)
|
||||||
|
Net interest, similar income and expenses, after provision for credit losses on loan portfolio
|
2,648,444
|
8,147,381
|
9,706,557
|
|||||||||
|
Total non-interest income
|
4,408,273
|
4,929,717
|
5,108,349
|
|||||||||
|
Total insurance underwriting results
|
358,133
|
(3,721
|
)
|
661,598
|
||||||||
|
Total other expenses
|
(7,190,689
|
)
|
(7,740,561
|
)
|
(8,620,615
|
)
|
||||||
|
Profit before income tax
|
224,161
|
5,332,816
|
6,855,889
|
|||||||||
|
Income tax
|
109,977
|
(1,660,987
|
)
|
(2,110,501
|
)
|
|||||||
|
Net profit
|
334,138
|
3,671,829
|
4,745,388
|
|||||||||
|
Net profit attributable to:
|
||||||||||||
|
Credicorp’s equity holders
|
346,894
|
3,584,582
|
4,633,096
|
|||||||||
|
Non-controlling interest
|
(12,756
|
)
|
87,247
|
112,292
|
||||||||
The net profit attributable to our equity holders for 2022 reflected an increase of 29.3% compared to 2021. This result was primarily due to higher net interest, similar
income and expenses (increase of 23.1% compared to 2021), which is mainly due to the increase in financial income as a result of rising interest rates, which grew significantly in 2022, both in soles and in dollars, compared to historically low
rates in 2021. Likewise, this growth is partially offset by the increase in financial expenses that is affected by the same increase in market rates; and a 38.5% increase in our provision for credit losses on loan portfolio, as compared to
2021. This decrease was mainly due to the flow of write-offs carried out during 2022, which mainly impacted the BCP consumer segment and the small and microenterprise segment in both BCP and Mibanco Perú. This decrease was also due, although to
a lesser extent, to the decrease in the US$/Sol exchange rate.
The net profit attributable to our equity holders for 2021 reflected an increase of 933.3%, as compared to 2020. This result was primarily due to (i) a 74.4% decrease in our
provision for credit losses on loan portfolio, as compared to 2020, stemming reduction in the probability of default of our clients driven by the economy reactivation, (ii) higher net interest, similar income and expenses (increase of 9.2%, as
compared to 2020) as government loans began to be replaced by structural loans, and (iii) higher total non-interest income as a result of an increase in fee income (attributable to higher transaction rates and new services in our digital
channels), as well as an increase in net gain on foreign exchange transactions.
For more detail about our main financial indicators, see “ITEM 5. OPERATING AND FINANCIAL REVIEW AND PROSPECTS – 5.A. Operating Results – (4) Historical Discussion and
Analysis – 4.2 Financial performance – 4.3.1 Net interest, similar income and expenses.”
| 4.3.1 |
Net Interest, similar income, and expenses
|
The following table sets forth the components of net interest, similar income, and expenses:
|
Year ended December 31,
|
||||||||||||
|
2020
|
2021
|
2022
|
||||||||||
|
(in thousands of Soles)
|
||||||||||||
|
Interest and similar income:
|
||||||||||||
|
Interest on loans
|
10,027,834
|
10,170,680
|
12,419,281
|
|||||||||
|
Interest on investments at fair value through other comprehensive income
|
1,097,952
|
1,152,542
|
1,593,047
|
|||||||||
|
Interest on due from banks
|
74,813
|
49,637
|
458,531
|
|||||||||
|
Interest on investments at amortized cost
|
226,516
|
323,689
|
382,097
|
|||||||||
|
Interest on investments at fair value through profit or loss
|
47,696
|
50,562
|
38,550
|
|||||||||
|
Dividends received
|
25,603
|
40,637
|
29,226
|
|||||||||
|
Other interest and similar income
|
47,234
|
62,659
|
90,550
|
|||||||||
|
Total interest income
|
11,547,648
|
11,850,406
|
15,011,282
|
|||||||||
|
Interest and similar expenses:
|
||||||||||||
|
Interest on deposits and obligations
|
(1,188,335
|
)
|
(865,474
|
)
|
(1,688,245
|
)
|
||||||
|
Interest on bonds and notes issued
|
(905,574
|
)
|
(836,977
|
)
|
(728,218
|
)
|
||||||
|
Interest on due to banks and correspondents
|
(557,141
|
)
|
(435,426
|
)
|
(683,078
|
)
|
||||||
|
Deposit Insurance Fund
|
(183,132
|
)
|
(213,741
|
)
|
(230,255
|
)
|
||||||
|
Interest on lease liabilities
|
(32,295
|
)
|
(27,374
|
)
|
(25,054
|
)
|
||||||
|
Other interest and similar expense
|
(112,219
|
)
|
(111,810
|
)
|
(138,337
|
)
|
||||||
|
Total interest expense
|
(2,978,696
|
)
|
(2,490,802
|
)
|
(3,493,187
|
)
|
||||||
|
Net interest, similar income and expenses
|
8,568,952
|
9,359,604
|
11,518,095
|
|||||||||
Net interest income grew by 23.1%, from 2021 to 2022, mainly due to our disciplined repricing strategy in an environment of rising rates. Furthermore, the shift towards a
higher-yield asset structure, combined with a competitive funding structure also contributed to this result. In 2021, net interest income grew by 9.2%, as compared to 2020, due to the increase in interest income and the reduction in interest
expenses.
Interest and similar income grew by 26.7% in 2022, as compared to 2021, after growing 2.6% in 2021, as compared to 2020. The increase in 2022 was mainly due to the higher
interest rate environment and the increase in our structural loans.
The average balance of our foreign currency denominated loan portfolio increased by 4.9% to S/50.1 billion in 2022, as compared to S/47.8 billion in 2021, which was an 4.1%
increase compared to S/45.9 billion in 2020. The average balance of the Sol-denominated loan portfolio increased by 3.7% to S/98.2 billion in 2022, compared to S/94.8 billion in 2021, which was a 12.7% increase from S/84.0 billion in 2020.
The average nominal interest rates earned on loans decreased from 7.7% in 2020 to 7.1% in 2021 and increase to 8.4% in 2022. The average nominal interest rate for foreign
currency-denominated loans decreased from 5.1% in 2020 to 5.0% in 2021 and increased to 5.3% in 2022. Average nominal interest rates for Sol-denominated loans decreased from 9.2% in 2020 to 8.2% in 2021 and increased to 9.9% in 2022.
Interest and similar expenses increased by 40.2% in 2022 compared to the level registered in 2021. In 2021, interest expense registered a reduction of 16.4% compared to
2020. The 2022 increase in interest expenses was attributable to a higher cost of funds due to higher market rates and fund migrations from low-cost deposits to time deposits.
Average interest-bearing foreign currency denominated deposits increased in 2022 by 1.4% to S/76,206.2 million from S/75,161.3 million in 2021. This followed a 23.1%
increase in 2021 from S/61,074.2 million in 2020. Our average interest-bearing Sol-denominated deposits decreased by 3.0% in 2022 to S/72,529.5 million from S/74,767.6 million in 2021 and increased by 9.4% in 2021from S/68,328.8 million in
2020.
Average nominal interest rates paid on foreign currency-denominated deposits was 0.9%, 0.7%, and 0.9% in 2020, 2021 and 2022, respectively. Average nominal interest paid on
Sol-denominated deposits increased from 1.2% in 2020 to 0.8% in 2021 and increased to 1.7% in 2022. NIM (net interest income divided by average interest-earning assets) was 5.07% in 2022, 4.10% in 2021 and 4.30% in 2020. For more detail, see
“ITEM 4. INFORMATION ON THE COMPANY – 4.B Business Overview – (7) Selected Statistical Information”.
4.3.2 Provisions for loan losses
The following tables set forth the changes in our allowance for loan losses:
|
Year ended December 31,
|
||||||||||||
|
2020
|
2021
|
2022
|
||||||||||
|
(in thousands of Soles)
|
||||||||||||
|
Provision for credit losses on loan portfolio
|
(6,080,289
|
)
|
(1,558,951
|
)
|
(2,158,555
|
)
|
||||||
|
Recoveries of written-off loans
|
159,781
|
346,728
|
347,017
|
|||||||||
|
Provision for credit losses on loan portfolio, net of recoveries
|
(5,920,508
|
)
|
(1,212,223
|
)
|
(1,811,538
|
)
|
||||||
Provisions for credit losses on loan portfolios, net of recoveries, increased by 49.4% in 2022 to S/1,811.5 million as compared to S/1,212.2 million in 2021 and to S/5,920.5
million in 2020. The expansion reflects higher provisions established across Credicorp’s banking businesses, particularly for BCP Stand-alone and Mibanco. The increase, over unusually low levels of provisions for credit losses in 2021, was
primarily driven by:
| • |
Retail Banking: particularly in the Consumer and SME-Pyme segments, mainly due to (i) the negative impact of growth in actual inflation on payment behavior and (ii) an uptick in disbursements to segments characterized by a higher
risk profile on one hand and higher margins on the other.
|
| • |
Mibanco: mainly driven by (i) unusually low provisions in 2021, resulting from disbursements that were more heavily concentrated among clients with better risk profiles and higher collections in a post-pandemic environment; and (ii)
the incorporation of maturities of a set number of specific vintages in the risk model for 2022. Since May 2022, Mibanco has reviewed its credit risk appetite and migrated to lower risk segments.
|
Total recoveries of written-off loans reached S/347.0 million in 2022, as compared to S/346.7 million in 2021.
4.3.3 Other Income
The following table reflects the components of our other income:
|
Year ended December 31,
|
||||||||||||
|
2020
|
2021
|
2022
|
||||||||||
|
(in thousands of Soles)
|
||||||||||||
|
Commissions and fees
|
2,912,778
|
3,493,734
|
3,640,319
|
|||||||||
|
Net gain on foreign exchange transactions
|
638,238
|
922,917
|
1,084,151
|
|||||||||
|
Net gains on securities
|
523,082
|
28,650
|
5,468
|
|||||||||
|
Net gains on derivatives held for trading
|
(13,401
|
)
|
221,064
|
65,187
|
||||||||
|
Net gain from exchange difference
|
58,539
|
(3,215
|
)
|
(16,158
|
)
|
|||||||
|
Other
|
289,037
|
266,567
|
329,382
|
|||||||||
|
Total other income
|
4,408,273
|
4,929,717
|
5,108,349
|
|||||||||
Other income, excluding net premiums earned, increased by 3.6% to S/5,108.3 million in 2022, compared to S/4,929.7 million in 2021, which in turn represented an increase of
11.9% from S/ 4,408.3 million in 2020. The expansion of other income in 2022 was primarily driven by higher commissions and fees, as well as increased net gain on foreign exchange transactions.
Commissions and fees increased by 4.2% to S/3,640.3 million in 2022 as compared to S/3,493.7 million in 2021, which in turn represented an increase of 19.9% from S/ 2,912.8
million in 2020. The expansion in commissions and fees from 2021 to 2022 was primarily due to higher transaction rates in line with economic reactivation and new services released in our digital channels.
Net gains on foreign exchange transactions increased by 17.5% to S/1,084.1 million in 2022 as compared to S/922.9 million in 2021, which in turn represented an increase of
44.6% from S/ 638.2 million in 2020. Expansion in net gains was a result of higher transaction rates in a context of market volatility.
4.3.4 Insurance Premiums and Claims on Insurance Activities
The following table reflects the earned premiums and claims incurred in connection with our insurance activities:
|
Year ended December 31,
|
||||||||||||
|
2020
|
2021
|
2022
|
||||||||||
|
(in thousands of Soles)
|
||||||||||||
|
Gross written premiums
|
3,641,917
|
4,279,422
|
4,483,200
|
|||||||||
|
Technical reserve adjustment
|
(781,460
|
)
|
(923,849
|
)
|
(635,056
|
)
|
||||||
|
Gross written premiums after adjustments
|
2,860,457
|
3,355,573
|
3,848,144
|
|||||||||
|
Premiums ceded to reinsurers, net
|
(548,024
|
)
|
(738,706
|
)
|
(798,976
|
)
|
||||||
|
Results of assets designated at fair value through profit or loss
|
115,627
|
54,663
|
(175,873
|
)
|
||||||||
|
Net premiums earned
|
2,428,060
|
2,671,530
|
2,873,295
|
|||||||||
|
Net claims incurred for life insurance
|
(1,244,771
|
)
|
(1,777,295
|
)
|
(1,295,549
|
)
|
||||||
|
Net claims incurred for general insurance
|
(194,739
|
)
|
(254,616
|
)
|
(317,729
|
)
|
||||||
|
Net claims incurred for health insurance
|
(268,603
|
)
|
(310,006
|
)
|
(316,612
|
)
|
||||||
|
Acquisition cost
|
(361,814
|
)
|
(333,334
|
)
|
(281,807
|
)
|
||||||
|
Total net premiums and claims
|
358,133
|
(3,721
|
)
|
661,598
|
||||||||
For further details, please see Notes 25 and 26 to the consolidated financial statements.
| 4.3.5 |
Other Expenses
|
The following table reflects the components of our expenses:
|
Year ended December 31,
|
||||||||||||
|
2020
|
2021
|
2022
|
||||||||||
|
(in thousands of Soles)
|
||||||||||||
|
Salaries and employee benefits
|
(3,312,954
|
)
|
(3,668,476
|
)
|
(4,052,780
|
)
|
||||||
|
Administrative expenses
|
(2,383,718
|
)
|
(2,953,717
|
)
|
(3,505,101
|
)
|
||||||
|
Depreciation and amortization
|
(497,910
|
)
|
(521,967
|
)
|
(532,169
|
)
|
||||||
|
Impairment loss on goodwill
|
(63,978
|
)
|
-
|
-
|
||||||||
|
Depreciation for right-of-use assets
|
(172,005
|
)
|
(161,287
|
)
|
(151,335
|
)
|
||||||
|
Others
|
(760,124
|
)
|
(435,114
|
)
|
(379,230
|
)
|
||||||
|
Total other expenses
|
(7,190,689
|
)
|
(7,740,561
|
)
|
(8,620,615
|
)
|
||||||
Salaries and employee benefits increased by 10.5% to S/4,052.7 million in 2022 as compared to S/3,668.4 million in 2021, which in turn represented an increase of 10.7% from
S/ 3,313.0 million in 2020. The increase from 2021 to 2022 was mainly due to an increase in variable compensation in line with higher net income and to increased hiring of personnel specializing in disruptive projects and IT.
Administrative, general and tax expenses increased by 18.7% to S/3,505.1 million in 2022 as compared to S/2,953.7 million in 2021, which in turn represented an increase of
23.8% from S/ 2,383.7 million in 2020. The increase from 2021 to 2022 was attributable to higher investments and expenses related to digital transformation, software improvements, expenses for transactions and fidelity programs, and disruptive
initiatives.
| 4.3.6 |
Exchange difference
|
The exchange difference reflects exposure to appreciation of net monetary positions in foreign currencies, principally US Dollars, in 2020, 2021 and 2022, to Peruvian Soles.
We recorded a net gain from exchange difference of S/58.5 million, net loss from exchange difference of S/3.2 million and S/16.2 million, in 2020, 2021 and 2022 respectively.
Credicorp manages foreign exchange risk by monitoring and controlling the position values due to changes in exchange rates. We measure our performance in Soles (since 2014,
when we changed our functional currency from US Dollars) such that if the net foreign exchange position (mainly US Dollar) is an asset, any depreciation of Soles with respect to the relevant foreign currency would positively affect Credicorp’s
consolidated statements of financial position. The current position in a foreign currency comprises exchange rate-linked assets and liabilities in that currency. An institution’s open position in individual currencies comprises assets,
liabilities and off-balance sheet items denominated in the respective foreign currency for which the institution itself bears the risk; any appreciation/depreciation of the foreign exchange would affect the consolidated statements of income.
As of December 31, 2020, 2021 and 2022, Credicorp’s net foreign exchange balance is the sum of its positive open non-Soles positions (net long position) less the sum of its
negative open non-Soles positions (net short position). For further details, see “ITEM 11. QUANTITATIVE AND QUALITATIVE DISCLOSURES ABOUT RISK MANAGEMENT – (13) Foreign Currency Exchange Rate Risk".
| 4.3.7 |
Income Taxes
|
We are not subject to income taxes, taxes on capital gains, capital transfers or equity or estate duty under Bermuda law. However, some of our subsidiaries are subject to
income tax and taxes on dividends paid to us, depending on the legislation of the jurisdictions in which they generate income.
Peru
Our Peruvian subsidiaries, including BCP Stand-alone, are subject to corporate taxation on income under Peruvian Tax Law. At December 31, 2021, and 2022, the Peruvian
statutory income tax rate was 29.5% on taxable profit after calculating the workers’ profit sharing, which is determined using a 5.0% rate.
An additional 5.0% withholding tax is applied to dividends, which we register as income tax based on the liquid amount received from BCP Stand-alone, Grupo Credito S.A. and
Pacífico Seguros. Through Legislative Decree No. 1261, published on December 11, 2016, the withholding tax on dividends for the profits generated was increased according to the following terms:
|
Rate for the profits generated in the years
|
%
|
|
Until 2014
|
4.1
|
|
2015 and 2016
|
6.8
|
|
From 2017 onward
|
5.0
|
Peruvian tax legislation is applicable to legal entities established in Peru, and on an individual (not consolidated) basis. Our non-Peruvian subsidiaries are not subject to
taxation in Peru and their assets are not included in the calculation of the Peruvian extraordinary tax on net assets.
The SUNAT has the right to review and, if necessary, amend the annual income tax returns filed by Peruvian subsidiaries up to four years after their filing date. Income tax
returns of the major subsidiaries open for examination by the tax authorities are as follows:
|
-
|
Banco de Crédito del Perú S.A.
|
2016 to 2021
|
|
|
-
|
Mibanco, Banco de la Microempresa S.A.
|
2017 to 2021
|
|
|
-
|
Pacífico Compañía de Seguros y Reaseguros S.A.
|
2018 to 2021
|
|
|
-
|
Credicorp Capital Servicios Financieros S.A.
|
2018 to 2021
|
|
|
-
|
Credicorp Capital Perú S.A.A.
|
2018 to 2021
|
|
|
-
|
Credicorp Capital Holding Perú S.A.A.
|
2018 to 2021
|
The SUNAT is currently auditing the 2018 income tax return of Banco de Crédito del Perú. No material issues have been raised in connection with this audit.
Bolivia
The income tax rate in Bolivia is 25.0% as of December 31, 2021 and December 31, 2022. Financial entities have an additional rate if the ROE exceeds 6.0%; in that case, they
must consider an additional 25.0%, with which the rate would be 50.0%. Situation that as of the 2022 administration, was also established for brokerage firms, investment fund management companies and insurance entities.
Chile
With the change in Chile's tax legislation in 2020, two new regimes, which are currently in force, were established: the general regime and the Pro SME regime, for smaller
companies. Credicorp Capital Holding Chile, like all its subsidiaries, is taxed under the general tax regime, whose first category income tax rate for domiciled legal entities remains at 27.0% as of December 31, 2022.
On the other hand, natural or legal persons not domiciled in Chile will be subject to a tax called "Additional income tax" whose rates range between 4.0% and 35.0%,
depending on the nature of the rent. Additionally, Chile has signed agreements to avoid double taxation with different countries, so that certain income could be released from withholding taxes or for the use of reduced rates.
Colombia
In the case of Colombia, according to Law No.2155 of 2021 issued on September 14, 2021, the income tax rate for the year 2022 is 35.0 percent of taxable income. Financial
institutions must pay an additional 3.0 percent over the general tax rate; therefore, they will pay 38.0 percent from 2022 to 2024.
Additionally, the additional rate will be applicable only to Colombian financial institutions that in the corresponding tax year have a taxable income equal to or greater
than 120,000 Tax Value Unit (UVT), which as of December 31, 2022 is equivalent to a total of S/3.6 million and S/4.7 million as of December 31, 2021. In this sense, Credicorp Capital Colombia, Credicorp Capital Fiduciaria and Mibanco Colombia
must pay income tax taking into consideration the above.
In the event that the company receives occasional profits, quoted and established by the National Government in the Tax Statute and that are not subject to income tax, the
company must apply a differential rate of 10.0 percent on associated net profit and expense, respectively.
The Colombian Tax Reform Law No.2155 of 2021 repeals paragraph 1 of article 115 of the Tax Statute, which would allow from the year 2022 to take 100.0 percent of the
industry and commerce tax as a discount for income tax, notices and boards. Therefore, only 50.0 percent of the industry and commerce tax, notices and boards can be taken as a tax discount.
In addition to the Tax Reform Law No.2155 of 2021, the possibility of reducing the time available for inspection of the income tax return and complementary for the taxable
periods 2022 and 2023 is established as follows:
|
Increase in net income tax compared to the previous year
|
Firmness
of the
declaration
|
|
35%
|
6 months
|
|
25%
|
12 months
|
The Bolivian, Chilean and Colombian tax authorities have the power to review and, if applicable, make a new determination for the income tax the subsidiaries to Credicorp
located in said countries, upon presentation of their Income Tax declarations. Additionally, in the case of Colombia, a period of 6 years was established for the taxpayers obliged to apply Transfer Prices or taxpayers who report tax losses. The
annual income tax declarations pending examination by the overseas tax authorities are the following:
| - | Banco de Crédito de Bolivia S.A. | 2014 to 2021 |
| - | Mibanco Colombia S.A.S. | 2019 to 2021 |
| - | Credicorp Capital Colombia S.A. | 2016 to 2021 |
| - | Credicorp Capital Holding Chile S.A. | 2020 to 2021 |
Since tax regulations are subject to interpretation by the different tax authorities where Credicorp subsidiaries are located, it is not possible to determine at the present
date whether any significant additional liabilities may arise from any eventual tax examinations of the Credicorp subsidiaries. Any resulting unpaid taxes, tax penalties or interest that may arise will be recognized as expenses in the year in
which they are determined. However, Management of Credicorp and its Subsidiaries and their legal counsel consider that any additional tax assessments would not have a significant impact on the consolidated financial statements as of December
31, 2021 and 2022.
5.1 Total Assets
The following table shows changes to the principal assets of Credicorp from 2020 through 2022:
|
2020
|
2021
|
2022
|
2021-2022
|
2020-2021
|
||||||||||||||||
|
(in millions of Soles)
|
% Change
|
% Change
|
||||||||||||||||||
|
Cash and due from banks
|
36,753
|
39,321
|
34,184
|
(13.1
|
)
|
7.0
|
||||||||||||||
|
Cash collateral, reverse repurchase agreements and securities borrowings
|
2,394
|
1,767
|
1,102
|
(37.6
|
)
|
(26.2
|
)
|
|||||||||||||
|
Investments:
|
||||||||||||||||||||
|
At fair value through profit or loss
|
6,467
|
5,929
|
4,199
|
(29.2
|
)
|
(8.3
|
)
|
|||||||||||||
|
At fair value through other comprehensive income
|
43,744
|
34,758
|
30,786
|
(11.4
|
)
|
(20.5
|
)
|
|||||||||||||
|
Amortized cost
|
4,962
|
8,266
|
10,446
|
26.4
|
66.6
|
|||||||||||||||
|
Net loans
|
127,761
|
139,120
|
140,754
|
1.2
|
8.9
|
|||||||||||||||
|
Other assets (1)
|
15,325
|
15,686
|
15,283
|
(2.4
|
)
|
2.2
|
||||||||||||||
|
Total assets
|
237,406
|
244,847
|
236,754
|
(3.3
|
)
|
3.1
|
||||||||||||||
(1) Includes financial assets designated at fair value through profit and loss, premiums and other policies receivable, accounts receivable from reinsurers and
coinsurers, property, furniture and equipment, due from customers on acceptances, intangible assets and goodwill, and other assets. Also include the payment in favor of Latam Airlines Group S.A. Sucursal Peru for US$128.0 million
(equivalent in soles to S/488.4 million) on account of the Latam Pass Miles that the Bank has been crediting to its customers for the use of their credit and debit cards, and other BCP Latam Pass financial products. Customers can use these
miles directly with Latam to exchange tickets, goods or services offered by them.
As of December 31, 2022, Credicorp had total assets of S/236.8 billion, a decrease of 3.3% as compared to the total assets of S/244.8 billion in 2021. In 2020, total assets
were S/237.4 billion.
As of December 31, 2022, our total loans, which correspond to direct loans including accrued interest and excluding unearned interest, were S/148.6 billion, which
represented 62.8% of total assets. Loans, net of allowance for loan losses, totaled S/140.8 billion in 2022, representing growth of 1.2% from 2021. As of December 31, 2021, total loans totaled S/147.6 billion, representing 60.3% total assets,
and net of allowance for loan losses, totaled S/139.1billion. From December 31, 2020, to December 31, 2021, loans net of allowance for loan losses increased by 8.9%. As of December 31, 2020, total loans totaled S/137.7 billion, representing
58.0% total assets, and net of allowance for loan losses totaled S/127.8 million. From December 31, 2019, to December 31, 2020, our loans net of allowance for loan losses increased by 5.6%.
Our total deposits with the BCRP decreased to S/24,160.7 million as of December 31, 2022, from S/25,359.6 million as of December 31, 2021 (our total deposits with the BCRP
were S/26,003.4 million in 2020). As of December 31, 2022, 2021 and 2020, our securities holdings include investments at fair value through profit or loss, investments at fair value through other comprehensive income and amortized cost
investments, which amount to S/45,431.2 million, S/48,952.5 million and S/55,173.7 million, respectively.
| • |
Loan evolution
|
The increase of 0.7% of Credicorp’s total loans from 2021 to 2022 was a result of agricultural campaigns in the Wholesale Banking Group and an uptick in growth in the consumer segment
corresponding to economic reactivation at BCP Stand Alone. Mibanco also contributed to this increase, due to an improvement in loan growth through its hybrid model.
|
2020
|
2021
|
2022
|
2021 - 2020
|
2022- 2021
|
2022 - %
|
2021 - %
|
||||||||||||||||||||||||||||||
|
Total year-end balances
|
(in millions of Soles)
|
% Change
|
Local Currency
|
Foreign Currency (1)
|
Local Currency
|
Foreign Currency(1)
|
||||||||||||||||||||||||||||||
|
BCP Stand-alone (2)
|
113,465
|
122,752
|
123,708
|
8.2
|
0.8
|
68.4
|
31.6
|
70.3
|
29.7
|
|||||||||||||||||||||||||||
|
Mibanco
|
12,929
|
13,513
|
14,089
|
4.5
|
4.3
|
99.9
|
0.1
|
99.8
|
0.2
|
|||||||||||||||||||||||||||
|
Bolivia
|
8,838
|
9,597
|
9,254
|
8.6
|
(3.6
|
)
|
0.4
|
99.6
|
-
|
100.0
|
||||||||||||||||||||||||||
|
ASB Bank Corp.
|
2,710
|
2,652
|
2,446
|
(2.1
|
)
|
(7.8
|
)
|
3.0
|
97.0
|
1.1
|
98.9
|
|||||||||||||||||||||||||
|
Others (3)
|
(282
|
)
|
(917
|
)
|
(871
|
)
|
N/A
|
N/A
|
N/A
|
N/A
|
N/A
|
N/A
|
||||||||||||||||||||||||
|
Total loans
|
137,660
|
147,597
|
148,626
|
7.2
|
0.7
|
65.2
|
27.9
|
66.3
|
33.7
|
|||||||||||||||||||||||||||
| (1) |
Includes mainly US dollar currency and other foreign currencies (BOB, COP, and CLP).
|
| (2) |
Includes BCP Panama and BCP Miami, does not include the loan by BCP to Credicorp for the sale of Banco de Credito e Inversiones de Chile shares.
|
| (3) |
Includes other banking and elimination for consolidation.
|
In 2022, growth in loans was primarily attributable to the increase in the loan portfolio of BCP Stand-alone, whose loan book grew by 4.1% in average daily balances in line
with the following dynamics:
| • |
Wholesale Banking, which includes the Middle Market and Corporate Banking segments, was the largest contributor to total growth, led by the Corporate segment (an increase of S/3,147.8 million, or 10.4% in average daily balances),
which increase was driven by its active participation in fishing and agricultural campaigns during the year. Average daily balances in Middle Market Banking grew S/312.8 million, or 1.3%, from 2021 to 2022.
|
| • |
Average daily balances in Retail Banking grew S/1,322.6 million, or 2.1%, from 2021 to 2022. This growth was driven by growth in the following sectors: Consumer (which increased S/1,918.0 million or 19.0%), Mortgages (which increased
S/1,444.23 million or 8.0%) and Credit Cards (which increased S/712.1 million or 18.4%). Average daily balances in the SME-Business and SME-Pyme segments dropped 16.6% and 4.7%, respectively, after grace periods for Reactiva loans
expired and clients started making payments on these government-backed loans.
|
Growth in the total portfolio was also due to the increase in Mibanco’s loan balances of 7.5% in average daily balances compared to 2021, which increase was primarily
associated with growth in loan disbursements through alternative channels such as mobile banking, call center, home banking, among others as the Mibanco hybrid model begins to migrate customers to these channels.
BCP Bolivia’s loan portfolio decreased S/138.7 million, or 1.5%, from 2021 to 2022, mainly because of the volatility of the exchange rate for the Bolivianos against the
Soles.
Lastly, ASB Bank Corp. loans continued losing participation and registered a decline of S/282.4 million, or 12.1%, from 2021 to
2022. It is important to note that ASB Bank Corp.’s main business is in the asset and wealth management industry.
The following table shows the composition of Credicorp’s loan portfolio for loans issued in local currency in year-end balances:
|
2020
|
2021
|
2022
|
2021 - 2020
|
2022 - 2021
|
||||||||||||||||
|
Local currency
year-end balances
|
(in millions of Soles)
|
% Change
|
||||||||||||||||||
|
BCP Stand-alone
|
81,036
|
86,298
|
84,601
|
6.5
|
(2.0
|
)
|
||||||||||||||
|
Mibanco
|
12,881
|
13,480
|
14,068
|
4.7
|
4.4
|
|||||||||||||||
The following table shows the composition of Credicorp’s loan portfolio in foreign currency in year-end balances:
|
2020
|
2021
|
2022
|
2021 – 2020
|
2022 – 2021
|
||||||||||||||||
|
Foreign currency
year-end balances
|
(in millions of US Dollars)
|
% Change
|
||||||||||||||||||
|
BCP Stand-alone
|
8,956
|
9,143
|
10,253
|
2.1
|
12.1
|
|||||||||||||||
|
Mibanco
|
13
|
8
|
5
|
(38.5
|
)
|
(37.5
|
)
|
|||||||||||||
|
BCP Bolivia
|
2,441
|
2,407
|
2,417
|
(1.4
|
)
|
(0.4
|
)
|
|||||||||||||
|
ASB Bank Corp.
|
748
|
658
|
622
|
(12.0
|
)
|
(5.5
|
)
|
|||||||||||||
The following table shows the composition of Credicorp’s loan portfolio, measured in average daily balances.
|
2020
|
2021
|
2022
|
2021-2020
|
2022 – 2021
|
||||||||||||||||
|
(in millions of Soles)
|
% Change
|
% Change
|
||||||||||||||||||
|
BCP Stand-alone
|
106,514
|
116,546
|
121,330
|
9.40
|
%
|
4.10
|
%
|
|||||||||||||
|
Wholesale Banking
|
52,527
|
53,923
|
57,384
|
2.70
|
%
|
6.42
|
%
|
|||||||||||||
|
Corporate*
|
30,786
|
30,129
|
33,277
|
(2.10
|
%)
|
10.45
|
%
|
|||||||||||||
|
Middle-Market*
|
21,741
|
23,795
|
24,107
|
9.40
|
%
|
1.31
|
%
|
|||||||||||||
|
Retail Banking
|
53,987
|
62,623
|
63,946
|
16.00
|
%
|
2.11
|
%
|
|||||||||||||
|
SME-Business*
|
8,474
|
10,989
|
9,170
|
29.70
|
%
|
(16.56
|
%)
|
|||||||||||||
|
SME-Pyme
|
14,390
|
19,638
|
18,706
|
36.50
|
%
|
(4.75
|
%)
|
|||||||||||||
|
Mortgage*
|
16,969
|
18,042
|
19,487
|
6.30
|
%
|
8.00
|
%
|
|||||||||||||
|
Consumer
|
9,166
|
10,082
|
12,000
|
10.00
|
%
|
19.02
|
%
|
|||||||||||||
|
Credit card
|
4,988
|
3,871
|
4,583
|
(22.40
|
%)
|
18.39
|
%
|
|||||||||||||
|
Mibanco
|
11,431
|
13,095
|
14,075
|
14.60
|
%
|
7.48
|
%
|
|||||||||||||
|
Mibanco Colombia
|
811
|
995
|
1,142
|
22.70
|
%
|
14.69
|
%
|
|||||||||||||
|
BCP Bolivia
|
8,002
|
8,951
|
8,813
|
9.1
|
%
|
(1.55
|
%)
|
|||||||||||||
|
ASB Bank Corp.
|
2,410
|
2,339
|
2,056
|
(2.2
|
%)
|
(12.08
|
%)
|
|||||||||||||
|
Total loans
|
129,168
|
141,926
|
147,416
|
9.90
|
%
|
3.87
|
%
|
|||||||||||||
| • |
Portfolio quality
|
In terms of portfolio quality, our internal overdue ratio (which includes loans under legal collection) was 4.00% at the end of 2022, 24bps higher than the 3.76% ratio
recorded at the end of 2021 (3.40% at the end of 2020). The reported increase over the last year reflects the higher pace of growth in internal overdue loans balances compared to the growth of the total portfolio, as the Government Program
Portfolio (which includes Reactiva Peru and FAE loans) grace periods expired. The non-performing loan ratio increased by 43bps from 4.98% in 2021 to 5.41% in 2022. This was mainly due to growth of overdue and refinanced loans, which was
primarily attributable to a deterioration in client debt service capacities after grace periods expired and new facilities were offered to clients. As of December 31, 2022, the Government Program (GP) Portfolio represented 6% of Credicorp’s
total portfolio (in comparison to 13% as of December 31, 2021). It is important to highlight that a large part of the GP Portfolio is backed by state guarantees, whose recovery processes for loans over 90 days past due are currently underway
with the relevant regulatory entities.
The non-performing loan ratio for Credicorp’s structural portfolio, which excludes the GP Portfolio, increased by 9bps from 4.86% in 2021 to 4.95% in 2022.
An analysis of the structural non-performing loan ratio by business segment shows that:
| • |
Wholesale Banking: The structural non-performing loan ratio increased 56bps due to specific clients who refinanced loans in 2022 (2.73% for the structural non-performing loan ratio in 2022 and 2.17% in 2021). As of December 2022, the
non-performing loan portfolio was mainly composed of refinanced loans for specific clients from the real estate and tourism sectors, which were highly affected by the pandemic. The resulting non-performing loan ratio for this segment
was partially offset by an increase in loan volumes.
|
| • |
SME-Business: The delinquency ratio increased by 120 bps in 2022 (from 11.35% and 10.15% in 2022 and 2021, respectively). This was primarily due to a reduction in loan volumes during 2022.
|
| • |
SME-Pyme: An improvement of 60 basis points was registered, situating its non-performing loan ratio at 15.12% versus 15.72% in 2021. This improvement was driven by an increase in loan volumes despite and due to non-performing loan
balances being affected by higher write-offs.
|
| • |
Mortgage: In 2022, the ratio stood at 3.45% versus 3.56% in 2021. The improvement in the Mortgage segment non-performing loan ratio was driven by a constant growth of loan volumes during the year.
|
| • |
Consumer: The delinquency level in the Consumer sector registered a decline from 7.24% in 2021 to 4.78% in 2022. This was primarily driven by a contraction in the overdue loan portfolio as write-offs were registered during the second
half of the year.
|
| • |
Credit Card: The segment registered a slight increase of 6 bps in its delinquency ratio, which stood at 3.36% in 2022, versus 3.30% in 2021. This is the result of entry into new customer markets with higher margins and greater
associated risk.
|
| • |
Mibanco: Mibanco showed a decrease in the delinquent portfolio balances, in line with the increase in write-offs. The non-performing loan ratio reduced by 206bps, from 7.02% in 2021 to 4.96% in 2022.
|
| • |
BCP Bolivia: The non-performing loan ratio increased by 146bps, from 1.31% in 2021 to 2.77% in 2022, due to loan volume contraction.
|
It is important to keep in mind that traditional delinquency ratios such as internal overdue loan and non-performing loan ratios continue to be distorted by the presence of
loans with real estate collateral (commercial and residential properties). This means that a significant portion of loans that are more than 150 days past due cannot be written off (despite the fact that provisions have been set aside) without
initiating a judicial process to liquidate the collateral, which may take several years to conclude.
The Structural Coverage ratio of non-performing loans decreased from 132.0% in 2021 to 112.2% at the end of 2022. This decrease was mainly driven by an increase in the
Wholesale Banking non-performing loans portfolio due to the refinancing of long-term debt of specific clients in the real estate and tourism sectors. The increase in refinanced loans in Wholesale Banking has led to this segment’s share of the
total non-performing loans portfolio increasing from 14% in 2019 to 22% at the end of 2022. It should be noted that the allowance for loan losses at Wholesale Banking has not grown at the same pace as these refinanced loans because we have
liquid guarantees. Therefore, despite the increase in non-performing loans in Wholesale Banking, the provisions for credit losses in this segment have not grown as quickly as non-performing loans.
5.2 Total Liabilities
|
2020
|
2021
|
2022
|
2022 - 2021
|
2021 - 2020
|
||||||||||||||||
|
in millions of Soles
|
% Change
|
|||||||||||||||||||
|
Time deposits
|
28,121
|
27,924
|
37,478
|
34.2
|
(0.7
|
)
|
||||||||||||||
|
Demand deposits
|
54,530
|
58,630
|
48,467
|
(17.3
|
)
|
7.5
|
||||||||||||||
|
Saving deposits
|
50,069
|
56,945
|
54,769
|
(3.8
|
)
|
13.7
|
||||||||||||||
|
Severance indemnity deposits
|
7,737
|
4,017
|
3,825
|
(4.8
|
)
|
(48.1
|
)
|
|||||||||||||
|
Bank's negotiable certificates
|
1,203
|
1,328
|
1,419
|
6.9
|
10.4
|
|||||||||||||||
|
Interest payable
|
705
|
753
|
1,063
|
41.1
|
6.8
|
|||||||||||||||
|
Total deposits
|
142,365
|
149,597
|
147,021
|
(1.7
|
)
|
5.1
|
||||||||||||||
|
Payables from repurchase agreements and security lending
|
27,924
|
22,014
|
12,967
|
(41.1
|
)
|
(21.2
|
)
|
|||||||||||||
|
Due to banks and correspondents
|
5,978
|
7,213
|
8,937
|
23.9
|
20.7
|
|||||||||||||||
|
Bonds and notes issued
|
16,320
|
17,823
|
17,007
|
(4.6
|
)
|
9.2
|
||||||||||||||
|
Other liabilities (1)
|
19,374
|
21,163
|
21,242
|
0.4
|
9.2
|
|||||||||||||||
|
Total liabilities
|
211,961
|
217,810
|
207,174
|
(4.9
|
)
|
2.8
|
||||||||||||||
| (1) |
Includes banker’s acceptances outstanding, accounts payable to reinsurers, lease liabilities, financial liabilities at fair value through profit or loss, technical reserves for insurance claims and premiums, deferred tax
liabilities, net, and other liabilities.
|
As of December 31, 2022, we had total liabilities of S/207.1 billion, a 4.9% decrease from S/217.8 billion as of December 31, 2021, which was a 2.7% increase as compared to
S/212.0 billion in 2020.
As of December 31, 2022, we had total deposits of S/147.0 billion, a 1.7% decrease from S/149.6 billion on December 31, 2021, which was a 5.1% increase compared to S/142.4
billion in 2020. The decrease in 2022 was primarily due to (i) a decrease in demand deposits that was specifically driven by companies, which moved to amortize Reactiva loans to cover seasonal and other liquidity requirements; and (ii) a
decrease in savings deposits, which was attributable to a decrease in captures of savings in local currency. This decrease in demand and savings deposits was partially offset by an increase in time deposits, which was mainly associated with
fund migration from low-cost deposits to time deposits in a context of higher interest rates for both local currency and foreign currency.
According to the SBS, as of December 31, 2022, Credicorp accounted for 42.0% of total savings deposits, 43.3% of total demand deposits, 32.5% of total time deposits, and
40.3% of total deposits in the Peruvian banking system, the highest of any Peruvian bank in all these types of deposits. In addition, as of December 31, 2022, we were in possession of 48.0% of the entire Peruvian banking system’s severance
indemnity deposits. We have traditionally attracted a high percentage of the savings, demand, and time deposits market because of our reputation as a sound institution, our extensive branch network, and the quality of our service.
As of December 31, 2022, our total due to banks and correspondents was S/8.9 billion, representing a 23.9% increase from S/7.2 billion as of December 31, 2021, which in turn
represented a 20.7% increase from S/6.0 billion as of December 31, 2020.
As of December 31, 2022, our total bonds and notes issued were S/17.0 billion, a 4.6% decrease from S/17.8 billion as of December 31, 2021, which was a 9.3% increase as
compared to S/16.3 billion in 2020. The decrease in 2022 was attributable to bonds issued in BCP Stand-alone that matured during the year.
As of December 31, 2022, our payables from repurchase agreements and security lending were S/13.0 billion, a 41.1% decrease from S/22.0 billion as of December 31, 2021,
which was a 21.1% decrease compared to S/27.9 billion in 2020. During 2022, BCRP instruments witnessed a significant decrease, primarily in BCP Stand-alone and to a lesser extent in Mibanco, driven by the progressive amortization of Reactiva
loans disbursements offered by the Peruvian government.
5.2.1 Funding Structure
At the end of 2022, Credicorp’s total funding was S/185.2 billion, which represents a 5.3% decrease as compared to S/195.6 billion at the end of 2021 (and S/191.5 billion
at the end of 2020).
Credicorp’s funding structure shows a decrease in total deposits throughout 2022, despite an increase of time deposits driven by higher interest rates. At the end of 2022,
deposits registered a funding share of 79.4%, as compared to 76.9% at the end of 2021 (and 74.4% at the end of 2020).
The decrease in deposits was mainly associated with a decrease in both demand deposits and savings deposits, which decreased by 17.3% and 3.8%, respectively, as compared to
2021. The shares of savings deposits and non-interest-bearing demand deposits decreased within the deposits mix (66.7% at the end of 2022, as compared to 72.7% in 2021 and 68.6% in 2020). Both types of deposits are considered low-cost
alternatives within the deposits mix.
With respect to other funding sources, our analysis shows a decrease in 2022 in the volume of BCRP instruments, which represented 6.1% of total funding as of December 31,
2022 (compared to 10.1% of total funding on December 31, 2021). This decrease was a result of the amortization of Reactiva Program funding instruments. It is important to mention that these funding sources were administrated at low rates.
5.3 Total Equity
|
2020
|
2021
|
2022
|
2022 - 2021
|
2021-2020
|
||||||||||||||||
|
in millions of Soles
|
% Change
|
|||||||||||||||||||
|
Capital stock
|
1,319
|
1,319
|
1,319
|
-
|
-
|
|||||||||||||||
|
Treasury stock
|
(208
|
)
|
(208
|
)
|
(208
|
)
|
-
|
-
|
||||||||||||
|
Capital surplus
|
192
|
229
|
231
|
0.9
|
19.3
|
|||||||||||||||
|
Reserves
|
21,430
|
21,364
|
23,660
|
10.7
|
(0.3
|
)
|
||||||||||||||
|
Other reserves
|
1,866
|
237
|
(650
|
)
|
(374.3
|
)
|
(87.3
|
)
|
||||||||||||
|
Retained earnings
|
347
|
3,556
|
4,636
|
30.4
|
924.8
|
|||||||||||||||
|
Equity before non-controlling interest
|
24,946
|
26,497
|
28,988
|
9.4
|
6.2
|
|||||||||||||||
|
Non-controlling interest
|
500
|
540
|
592
|
9.6
|
8.0
|
|||||||||||||||
|
Total equity
|
25,446
|
27,037
|
29,580
|
9.4
|
6.3
|
|||||||||||||||
As of December 31, 2022, we had total equity of S/29.6 billion, which represented a 9.4% increase from S/27.0 billion as of December 31, 2021, which was an 6.3% increase
compared to S/25.4 billion as of December 31, 2020.
During 2020, 2021 and 2022, we had 94,382,317 issued shares each at US$5.00 par value.
As provided in Note 18 to our consolidated financial statements, on December 31, 2022, 14,849,223 of our issued shares were treasury stock. The term "treasury stock," as
used in this Annual Report and our consolidated financial statements, follows the IFRS definition of treasury stock, which includes (i) shares acquired and held by subsidiaries and members of the consolidated group and (ii) shares sold, issued
or cancelled in connection with employee share option plans, employee share purchase plans and all other share-based payments arrangements. The term “treasury stock” is not related to the term "treasury shares" as used under the Companies Act
1981 of Bermuda, which defines “treasury shares” (in Section 42B of such Act) as shares that (i) were (or are treated as having been) acquired directly by the company that issued the shares and have not been cancelled and (ii) have been
continuously held by the company since they were acquired. Credicorp is not allowed to hold "treasury shares" as such term is used under Bermuda Law. Under Bermuda law, a company cannot (i) exercise any rights with respect to treasury shares,
including any right to attend and vote at meetings or (ii) pay dividends with respect to treasury shares.
We present below the following table presents our treasury stock as of December 31, 2022:
|
As of December 31, 2022
|
||||||||||||||||||||||||
|
Shares of the
Group
|
Shared-based
payment (1)
|
Total
treasury stock
|
||||||||||||||||||||||
|
Soles in thousands
|
Units
|
Soles in thousands
|
Units
|
Soles in thousands
|
Units
|
|||||||||||||||||||
|
Atlantic Security Holding Corporation
|
204,326
|
14,620,846
|
-
|
-
|
204,326
|
14,620,846
|
||||||||||||||||||
|
BCP
|
-
|
-
|
1,684
|
120,505
|
1,684
|
120,505
|
||||||||||||||||||
|
Grupo Crédito S.A.
|
324
|
23,214
|
324
|
23,214
|
||||||||||||||||||||
|
Pacífico Seguros
|
-
|
-
|
288
|
20,606
|
288
|
20,606
|
||||||||||||||||||
|
Credicorp Capital Servicios Financieros
|
-
|
-
|
210
|
15,007
|
210
|
15,007
|
||||||||||||||||||
|
Mibanco
|
-
|
-
|
199
|
14,260
|
199
|
14,260
|
||||||||||||||||||
|
ASB Bank Corp.
|
-
|
-
|
165
|
11,791
|
165
|
11,791
|
||||||||||||||||||
|
Prima AFP
|
-
|
-
|
76
|
5,406
|
76
|
5,406
|
||||||||||||||||||
|
Other entities
|
-
|
-
|
246
|
17,588
|
246
|
17,588
|
||||||||||||||||||
|
Total
|
204,326
|
14,620,846
|
3,192
|
228,377
|
207,518
|
14,849,223
|
||||||||||||||||||
(1) Correspond to Credicorp’s long-term compensation program that were granted to its employees and senior management, for which they have the right to vote. These stocks are not vested at December 31, 2022.
For further detail refer to Note 20 to the consolidated financial statements and ITEM 7. MAJOR SHAREHOLDERS AND RELATED PARTY TRANSACTIONS – 7. A Major Shareholders.
At meetings held on April 28, 2022, February 25, 2021 and February 27, 2020, the Board of Directors decided to transfer S/2,354.9 million, S/347.0 million and S/1,977.1
million, respectively, from “Retained earnings” to “Reserves”.
During 2022, 2021 and 2020, Credicorp paid cash dividends, net of the effect of treasury stock, of approximately US$318.5 million, US$96.5 million and US$702.1 million,
respectively (equivalent to approximately S/1,196.4 million, S/398.8 million and S/2,392.8 million, respectively). During the years 2022, 2021 and 2020, cash dividend payouts per share totaled US$4.0, US$1.2 and US$8.8, respectively (equivalent
to S/15.0, S/5.0 and S/30.0, respectively). In accordance with current Peruvian legislation, there is no restriction for overseas remittance of dividends or the repatriation of foreign investment. At December 31, 2022, 2021 and 2020 dividends
paid by our Peruvian subsidiaries to Credicorp were subject to a 5.0% withholding tax.
5.4 Off-Balance Sheet Arrangements
We record various contractual obligations as liabilities in our consolidated financial statements. We do not recognize other contractual arrangements, such as
off-balance-sheet exposures, as liabilities in our consolidated financial statements. These other contractual arrangements are required to be registered in off-balance-sheet accounts. We enter into these off-balance-sheet arrangements in the
ordinary course of business to provide support to our clients and to hedge risks in our statement of financial position, including through use of guarantees, letters of credit, derivatives and swaps.
The following table reflects our off-balance sheet arrangements as of December 31, 2020, 2021 and 2022:
|
Year ended December 31,
|
||||||||||||
|
2020
|
2021
|
2022
|
||||||||||
|
(in thousands of Soles)
|
||||||||||||
|
Off-balance-sheet exposure
|
||||||||||||
|
Guarantees and stand-by letters
|
18,562,120
|
20,455,238
|
18,244,865
|
|||||||||
|
Import and export letters of credit
|
2,411,690
|
2,459,105
|
2,683,190
|
|||||||||
|
Sub Total
|
20,973,810
|
22,914,343
|
20,928,055
|
|||||||||
|
Responsibilities under credit line agreements (*)
|
86,074,859
|
88,382,322
|
86,597,041
|
|||||||||
|
Derivatives (notional amount)
|
||||||||||||
|
Forwards
|
22,030,623
|
28,618,406
|
34,224,865
|
|||||||||
|
Currency swaps
|
9,095,243
|
15,935,149
|
16,000,208
|
|||||||||
|
Options
|
426,848
|
576,398
|
362,324
|
|||||||||
|
Interest rate swaps
|
22,162,392
|
27,634,201
|
11,760,821
|
|||||||||
|
Cross currency swaps
|
1,096,911
|
806,290
|
1,421,297
|
|||||||||
|
Futures
|
32,589
|
72,165
|
48,819
|
|||||||||
|
Sub Total
|
54,844,606
|
73,642,609
|
63,818,334
|
|||||||||
|
Total
|
161,893,275
|
184,939,274
|
171,343,430
|
|||||||||
(*) Lines of credit include consumer loans and other consumer loan facilities (credit card receivables) granted to customers and are cancelable upon related notice to the
customer.
In the normal course of business, our banking subsidiaries are parties to transactions with off-balance-sheet risk. These transactions expose them to additional credit risks
relative to amounts recognized in the consolidated statements of financial position.
Credit risk for off-balance sheet financial instruments is defined as the possibility of sustaining a loss as a result of any other party to a financial instrument failing
to perform in accordance with the terms of the contract. The exposures to losses are represented by the contractual amount specified in the related contracts. We apply the same credit policies in making commitments and conditional obligations
as we do for on-balance sheet instruments (see Note 21(a) of the consolidated financial statements), including the requirement to obtain collateral when necessary. The type and amount of collateral held varies, but may include deposits in
financial institutions, securities or other assets. Many contingent transactions are expected to expire without any performance being required. Therefore, the total committed amounts do not necessarily represent future cash requirements.
Credicorp has currency-forwards derivatives. Currency-forwards are commitments to buy or sell currency at a future date at a contracted price. Risk arises from the
possibility that the counterparty to the transaction will not perform as agreed and from the changes in the prices of the underlying currencies. As of December 31, 2022, and 2021, the nominal amounts for forward currency purchase and sale
agreements, which in general have maturities of less than one year, were approximately S/34,224.9 million and S/28,618.4 million, respectively.
These agreements are entered into to satisfy client requirements and are recognized in the consolidated financial statements at their fair value. As of December 31, 2022,
and 2021, the forward contracts’ net position was US Dollars of approximately S/2,796.2 million and S/539.9 million, respectively.
Credicorp’s swap contracts include interest rate and currency swap contracts, as well as cross-currency swap contracts. Interest rate and currency swap contracts are
derivatives contracts, where counterparties exchange variable interest rates for fixed interest rates or different currencies, respectively, in the terms and conditions established at the contract’s inception. The risk arises each time the
projected level of the variable rate during the term of the contract is higher than the swap rate, as well as from non-compliance with contractual terms by one of the parties. As of December 31, 2022, the notional amount of open interest rate
and currency swap contracts was approximately S/27,761.0 million, compared to approximately S/43,569.4 million as of December 31, 2021, see Note 13(c) to the consolidated financial statements.
Cross-currency swap contracts involve the exchange of interest payments based on two different currency principal balances and referenced interest rates. They generally also
include the exchange of principal amounts at the start and end of the contract. As of December 31, 2022, the notional amount of cross-currency swap contracts was approximately S/1,421.3 million compared to approximately S/806.3 million as of
December 31, 2021; see Note 13(c) to the consolidated financial statements.
As of December 31, 2022, the fair values of the asset and liability forward-exchange contracts, options, futures and interest rate and cross-currency swaps amounted to
approximately S/1,478.7 million and S/1,345.7 million, respectively (compared to approximately S/1,661.6 million and S/1,524.8 million as of December 31, 2021) and are included under the “Other assets and other liabilities” section of the
consolidated statements of financial position, respectively, see Note 13(c) to the consolidated financial statements.
6.1 Universal Banking
6.1.1 BCP Stand-alone
Asset Structure
At the end of 2022, BCP Stand-alone’s total assets amounted to S/180.6 billion, which represents a 3.4% increase compared to S/187.6 billion in 2021 (and S/182.9 billion in
2020). The decrease in total assets in 2022 was mainly explained by a decrease in cash and due from banks that we believe was driven by clients using funds to repay government backed-loans. This reduction was partially offset by the growth of
the loan portfolio, which grew by 0.8% in 2022 to S/123.7 billion, compared to S/122.8 billion in 2021 (and S/113.5 billion in 2020).
In 2022, BCP Stand-alone’s total loans grew 4.1%, in average daily balances, mainly driven by growth in Wholesale Banking led by the Corporate segment which participated
actively in lending during the fishing and agricultural campaigns during 2022. Growth in Retail Banking was driven by Consumer loans due to an uptick in cash disbursement in 2022.
For further analysis of our asset structure, please see “Item 5.A Operating results – (5) Financial position – 5.1 Total Assets – Loan
evolution”.
Portfolio Quality
The internal overdue loan ratio at BCP Stand-alone increased to 3.93% in 2022, compared to 3.67% in 2021 (which represented an increase from 3.19% in 2020). This was mainly
driven by the SME segments, specifically due to clients from new segments with higher risk profiles and commensurately higher margins. For further analysis of the ratio per business segment, see “Item 5.A Operating results – (5) Financial
position – 5.1 Total Assets – Portfolio quality” (bullets one to six).
BCP Stand-alone’s provisions for credit losses on loan portfolio, net of recoveries increased by 55.6%, with respect to 2021 (in comparison to the 82.4% decrease in 2021
with respect to 2020) attributable to (i) updates to macroeconomic projections to reflect a deterioration in inflation, which mainly impacted the Consumer and Credit Card segments; and (ii) deterioration in payment behavior in the consumer
sector, which was affected by higher inflation in 2022. In this context, BCP Stand-alone’s cost of risk situated at 1.00% in 2022 (in comparison to 0.65% in 2021), after presenting historic lows in 2021.
Funding Structure
At the end of 2022, BCP Stand-alone’s total funding decreased by 12.5% (in comparison to an increase of 0.8% in 2021 and 35.0% in 2020), due to lower Deposits and BCRP
instruments, which decreased by 2.6% and 40.9%, respectively fueled by amortizations of Reactiva loans.
Total deposits fell to S/120.6 billion (as compared to S/123.8 billion in 2021, which represented an increase from S/118.3 billion in 2020). The drop was mainly driven by
demand deposits and savings deposits, which decreased 16.1% and 3.6%, respectively.
Financial Ratios
BCP Stand-alone’s net earnings contribution to Credicorp totaled S/4,160.8 million in 2022, which represented an increase of 25.6% with regard to the S/3,312.2 million
reported in 2021 (and S/605.8 million in 2020). This was a result of the lower level of higher net interest income, fee income and net gain from foreign exchange transactions in line with economy reactivation during 2022.
BCP Stand-alone’s ROAE contribution to Credicorp was 22.0% in 2022 (compared to 19.7% in 2021 and 1.4% in 2020). The higher contribution in 2022 reflects (i) an increase in
net interest income as government program loans with lower rates were replaced by structural loans with higher rates and (ii) an increase in fee income as a result of higher transactional volumes and higher foreign exchange transaction in the
context of high volatility in FX rates.
NIM stood at 4.57% in 2022, representing an increase of 105basis points with regard to 2021’s NIM of 3.52% (and 3.94% in 2020). This rise was in line with higher market
rates and the impact of the amortization of Reactiva loans in BCP balances.
In 2022, the efficiency ratio at BCP Stand-alone stood at 40.8% (versus 43.4% in 2021 and 40.9% in 2020). This was a result of growth in Net Interest Income, Fee Income and
FX transactions. Nonetheless, Administrative and General Expenses grew due to digital transformation investment and expenses in technology, data analysis and consultancy; and Salaries and Employee Benefits increase in line with earnings
increase.
6.1.2 BCP Bolivia
Asset Structure
By the end of 2022, BCP Bolivia’s total assets amounted to S/12.7 billion, which represents an 8.0% decrease compared to S/13.8 billion in 2021. The decrease in Bolivia’s
loan portfolio was approximately 3.4%. At the same time, temporary and permanent investments also decreased by 15.8%. Adjusting for variations in the Peruvian Sol to the Boliviano exchange rate, in 2022 total assets would have decreased by
3.3%, the loan portfolio would have increased by 1.5%, and temporary and permanent investments would have decreased by 11.6%.
Portfolio Quality
The past-due ratio has increased from 0.97% in 2021 to 2.59% in 2022.
Funding Structure
By the end of 2022, BCP Bolivia decreased its total liabilities by 8.7%, in comparison to the increase of 10.0% in 2021. This includes a decrease in total customer deposits
of 3.9%. Adjusting for variations in the Peruvian Sol to Boliviano exchange rate, total liabilities would have decreased by 4.1% and total deposits would have increased by 0.9%.
Net profit
BCP Bolivia’s net profit amounted to S/68.0 million in 2022, which represents a 5.9% decrease compared to S/72.3 million in 2021. Adjusting for variations in the Peruvian
Sol to Boliviano exchange rate, the decrease would have been 3.0%.
6.2 Microfinance
6.2.1 Mibanco Peru
Asset Structure
Total assets at Mibanco were S/17.2 billion as of December 31, 2022 (compared to S/16.2 billion as of December 31, 2021, and S/15.6 billion as of
December 31, 2020). The 6.6% increase in total assets in 2022 reflects growth in the loan portfolio and an increase in short-term investments to make excess liquidity more profitable.
On December 31, 2022, Mibanco’s loans totaled S/14.1 billion, which represents 4.3% growth compared to 2021 (compared to 4.5% from 2020 to
2021 and 20.5% from 2019 to 2020). This growth was driven by structural loans, the majority of which were concentrated in the small business segment, which registered a 13.0% increase in its loan level in 2022 (compared to an increase of
12.5% in 2021 and 15.1% in 2020). This increase was partially offset by a decrease in the microbusiness segment of 12.2% in 2022 (compared to a decrease of 11.1% in 2021 and a increase of 46.5% in
2020). The small business and micro business segments represented a higher share of total loans in 2022, with shares of 66.8% and 22.8% respectively (as compared to 61.5% and 27.0% in 2021 and 56.5% and 31.4% in 2020). Finally, Mibanco’s loan
portfolio represented 80.9% of total interest-earning assets in 2022 (as compared to 83.3% in 2021).
Cash and investments increased by 22.65% in 2022 (as compared to a decrease of 18.13% in 2021 and an increase of 23.57% in 2020). This growth was attributable to a
year-over-year increase in liquid assets to address outflows from retail time deposits.
Portfolio Quality
Despite the deterioration observed in credit quality during 2020 due to the impact of the
COVID-19 pandemic on the economy, Mibanco’s credit quality improved in 2022 and the cost of risk was 3.5% by the end of 2022 (as compared to 3.2% and 8.4% at the end of 2021 and 2020, respectively). This increase in cost of risk was primarily
mainly driven by higher loan volume in riskier segments and was partially offset by methodological changes in the risk model during the second quarter of 2022. The coverage ratio for total loans in 2022 was situated at 7.1% (as compared to
8.5% and 14.1% in 2021 and 2020 respectively).
Funding Structure
On December 31, 2022, total liabilities at Mibanco amounted to S/14.4 billion, which represent an increase of 4.7% as compared to S/13.8 billion at the
end of 2021 (and S/13.5 billion at the end of 2020). In 2022, Mibanco's funding strategy reflected an increase in retail time deposits and new bond issuances.
In 2022, average total deposits continued to represent the largest source of funding, accounting
for 64.5% (as compared to 61.1% in 2021 and 64.0% in 2020) of average total liabilities. The significant growth in retail time deposits was driven by a higher market rates. The significant growth in bonds and subordinated debt, for which in
2022 the average balance was S/552.7 million (up 193.5% from S/188.3 million in 2021), was driven by new issuances of certificated deposits due to higher funding requirements, as the loan volumes increased significantly during the year. The
drop of 14.3% in Due to Banks and correspondents was driven by the prepayment of government-backed Reactiva and FAE-Mype loans and the corresponding debt with the BCRP. This new funding structure and higher market rates led our funding costs
to rise to 5.61% by the end of 2022 (as compared to 2.22% at the end of 2021 and 2.28% at the end of 2020).
In this context, Mibanco took advantage of more stable funding, particularly retail time deposits and certificates of deposit to cover its funding needs as they provide lower rates in a context of rising market rates.
Financial ratios
Net earnings at Mibanco totaled S/424.9 million in 2022, as compared to S/266.1 million in net earnings in 2021 (and S/379.0 million in net losses in
2020). Net earnings attributable to Credicorp totaled S/415.5 in 2022, as compared to S/260.2 million in 2021, and compared to net losses of S/370.5 million in 2020.
Mibanco’s ROAE contribution to Credicorp was 16.5% in 2022, compared to its contributions of 11.9% and (18.1%) in 2021 and 2020,
respectively. The increase in Mibanco’s ROAE contribution reflects (i) an increase in net interest income driven by higher structural loan volumes and higher market rates and (ii) an increase in non-interest income driven by higher fees from
bancassurances as a result of an increase in transaction levels in 2022. The aforementioned increase was partially offset by (i) an increase in net provisions
for loan losses, in line with higher loan volumes and higher delinquencies in specific vintages and (ii) higher operating expenses due to the execution of strategic initiatives and higher professional expenses due to improved financial
performance.
NIM was situated at 13.2% in 2022 which represents an increase of 139bps as compared to NIM in 2021 (11.9% in 2021 and 10.8% in 2020). The
increase in NIM was fueled by growth in the loan portfolio, higher interest rates and a more profitable asset mix, which was partially offset by a simultaneous increase in interest expenses due to
higher market interest rates.
In 2022, Mibanco’s efficiency ratio was 51.3%, which represents an improvement as compared to the 55.8% and 63.1% ratios registered for
2021 and 2020, respectively. This result was primarily attributable to an increase in net interest income, which was partially offset by increased operating expenses due to higher personnel expenses
resulting from improved financial performance and execution of strategic initiatives.
6.2.2 Mibanco Colombia
At Mibanco Colombia, the loan portfolio totaled $1,532.5 billion Colombian pesos at year-end, which represents an increase of 42% year-over-year. The year’s growth was
sustained by an increase in productivity as measured by monthly loans disbursed per executive, which grew from 11.8 disbursements per executive in 2021 to 14.2 disbursements in 2022. The microcredit segment continues to represent the largest
share of the loan portfolio, representing 71.91% of total gross loans at the end of December 2022.
The increases in interest income and other income were in line with the growth in gross loan amounts. Interest income grew 41% and nonfinancial income grew 54%
year-over-year, according to the growth of credits.
Our funding cost grew 801 bps from 2021 to 2022, which was primarily attributable to an increase in the reference rate, which grew 900bps as a result of the inflationary
pressures of the region. As of December 31, 2022, the reference rate was 12%.
Improvements in collections and disbursement management leveraged in data analytics generated a significant decrease in net provisions for loan losses. The 30-day
non-performing loan ratio was 3.7% at year-end 2022, 232bps less than at year-end 2021. As a result, Mibanco’s cost of risk was 2.7% at year-end 2022.
Finally, Mibanco Colombia’s operating expenses increased 26%, due to a 30% increase in the number of our loan officers during 2022. In addition, important expenses were made
such as: new branches (+12), digital transformation, organizational culture and strengthening of administrative positions. These facts generated a efficiency ratio of 82.8% for the end of 2022.
| 6.3 |
Insurance & Pensions
|
6.3.1 Grupo Pacífico
Net Profits
Grupo Pacífico’s net profit before non-controlling interest was S/451.7 million in 2022, S/582.2 million higher than the (S/130.5) million loss reported in 2021 (compared to
S/194.6 million in 2020). This higher net profit was mainly associated with:
| • |
An increase in net profit for the Life insurance business, which totaled S/282.8 million in 2022, S/624.7 million higher than the (S/341.9) million loss reported in 2021 (compared to a (S/53.7) million loss in 2020). This increase
was primarily due to (i) a decrease in net claims as a consequence of a drop in excess mortality for COVID-19, (ii) growth in the level of net earned premiums, which reflected economic reactivation and (iii) higher net financial income.
|
| • |
An increase in net profit for Corporate health insurance and medical services (only 50% of these business profits correspond to Grupo Pacífico, given its partnership with Banmedica), which totaled S/73.2 million in 2022, 10.2% higher
than the S/53.8 million reported in 2021 and higher the S/59.9 million reported in 2020.
|
| • |
An increase in net profit for the Crediseguro business, which represented S/11.7 million in 2022, 70.5% higher than the S/8.4 million reported in 2021 and the S/7.3 million in 2020.
|
These results were partially offset by:
| • |
A decrease in net profit for the P&C insurance business, which totaled S/83.0 million in 2022, 44.1% lower than the S/148.5 million reported in 2021 (compared to S/180.7 million in 2020). This decrease is attributable to an
increase in net claims as a result of higher case frequency in Cars and Commercial Lines (due to fewer confinement measures imposed by the government in 2022 compared to 2021), which was partially offset by an increase in written
premiums.
|
Grupo Pacífico’s net profit contribution to Credicorp was S/446.6 million in 2022, S/575.9 million higher than the (S/129.3) million loss reported in 2021 and higher than
the S/192.0 million gain reported in 2020.
Grupo Pacífico reported written premiums of S/4,538.4 million in 2022, which represented an increase of 4.6% compared to 2021. This increase was mainly attributable to the
Group Life, Disability and survivorship, Credit Life, medical assistance, personal lines, automobile, and commercial lines, but offset by reductions in the annuities and individual lifelines.
Written premiums (1)
|
2020
|
2021
|
2022
|
||||||||||
|
(in thousands of Soles)
|
||||||||||||
|
TOTAL WRITTEN PREMIUMS (2)
|
3,707,525
|
4,339,198
|
4,538,430
|
|||||||||
|
P&C Business
|
1,656,302
|
1,813,579
|
1,903,216
|
|||||||||
|
Commercial Lines
|
478,822
|
586,832
|
597,799
|
|||||||||
|
Personal Lines (3)
|
332,545
|
343,639
|
370,513
|
|||||||||
|
Automobile
|
349,202
|
348,943
|
371,547
|
|||||||||
|
Medical Assistance
|
495,733
|
534,165
|
563,358
|
|||||||||
|
Life Business
|
1,991,417
|
2,460,277
|
2,560,698
|
|||||||||
|
Annuities Line
|
473,303
|
606,710
|
513,018
|
|||||||||
|
Credit Life
|
521,296
|
552,019
|
609,733
|
|||||||||
|
Individual Life
|
403,782
|
485,005
|
467,332
|
|||||||||
|
Group Life
|
223,556
|
250,321
|
328,351
|
|||||||||
|
Disability and Survivorship
|
369,480
|
566,222
|
642,264
|
|||||||||
|
Crediseguro
|
59,806
|
65,344
|
74,516
|
|||||||||
(1) The association with Banmedica stipulates that the corporate health insurance business and medical services (network of clinics, medical centers, and laboratories) must be reported as an
investment in subsidiaries and are not consolidated in the Grupo Pacífico financial statements. Both businesses are managed by Banmedica, and Grupo Pacífico receives 50% of net earnings.
(2) Without eliminations
(3) From the year 2019 the Personal Accident line is included in Personal Lines in P&C Business.
Financial Ratios
Grupo Pacífico’s ROAE was 19.2% in 2022, higher than its ROAE (5.0%) in 2021. This was explained by (i) higher underwriting results in the Life business due to lower cases
of COVID-19 generated as a consequence of the improvement in the health situation and (ii) higher net financial income due to higher inflation and the positive effect of better rates on our investment portfolio, thanks to high credit quality
and professional investment management. These effects were attenuated by higher general expenses due to increased personnel and third-party service expenses, and higher claims in the P&C business attributable to growth in claims through the
Cars and Commercial Lines due to an uptick in claims frequency.
|
ROAE (1)
|
2020
|
2021
|
2022
|
|||||||||
|
Grupo Pacífico
|
6.7
|
%
|
(5.0
|
%)
|
19.2
|
%
|
||||||
|
Grupo Pacífico (2)
|
8.2
|
%
|
(6.0
|
%)
|
20.2
|
%
|
||||||
| (1) |
Annualized and average are determined as the average of period beginning and period ending. Includes 50% of corporate health insurance and medical services business results due to the agreement with Banmedica. Figures do not
include eliminations for Credicorp’s consolidation purposes.
|
| (2) |
Exclude unrealized gains or losses.
|
P&C Insurance Business
Grupo Pacífico’s P&C insurance business achieved net profit of S/83.0 million in 2022, which was 44.1% lower than the S/148.5 million reported in 2021. This decrease is
attributable to (i) lower underwriting results due to higher net claims and net fees, (i) higher operating expenses and (iii) lower translation results and other income. This was partially offset by higher financial net income.
The 2022 underwriting results decreased 1.8% from 2021, which decrease was mainly attributable to an increase in net claims and higher fees and partially offset by an
increase in net premiums and lower underwriting expenses.
Net claims increased 11.4% in 2022, which increase was attributable to growth in claims (i) in the Cars business unit due to the increase in the frequency of reported cases
as a result of the normalization of activities compared to last year, and (ii) in Commercial Lines as a result of increased severity in Transportation and all Contractors Risk. As a result, the loss ratio in 2022 was 49.5% higher than 46.7% in
2021 because of the increase in claims as discussed above and this result is approaching pre-pandemic levels.
Written premiums totaled S/1,903.2 million in 2022, which represented an increase of 4.9% compared to 2021 and reflected growth across all lines. This increase is
attributable to (i) Commercial Lines, due to the volume of policy renewals in Fire, Third-party Liability and Transportation Risks; (ii) Medical Assistance, due to growth in premium renewals for comprehensive health and oncological products;
(iii) Cars, due to an increase in renewals in the Brokers and Digital Sales channels; and (iv) Personal lines, due to an increase in policy issuances for the credit card product through digital sales and Personal Accidents. The aforementioned
increase was lower than market growth (+11.0%). However, Pacífico maintained its second place in the P&C business with a 21.4% market share as of December 31, 2022 (versus 20.7% at the end of 2021), according to the SBS.
The acquisition cost ratio showed an improvement to 20.4% in 2022, compared to the 21.0% recorded the previous year, due to lower underwriting expenses. The ratio of general
expenses to net earned premium increased from 22.4% in 2021 to 23.8% in 2022, due to higher personnel and third-party service expenses.
Finally, financial income showed an increase over the previous year (+21.8%), as a result of higher interest on investments and deposits in banks.
Net Profit and Selected Ratios for Grupo Pacífico’s - P&C business (1)
|
2020
|
2021
|
2022
|
||||||||||
|
(in thousands of Soles)
|
||||||||||||
|
Written premiums
|
1,656,303
|
1,813,578
|
1,903,223
|
|||||||||
|
Ceded premiums
|
(484,783
|
)
|
(572,362
|
)
|
(576,506
|
)
|
||||||
|
Reserves
|
(2,607
|
)
|
(24,147
|
)
|
(45,624
|
)
|
||||||
|
Net earned premiums
|
1,168,913
|
1,217,069
|
1,281,094
|
|||||||||
|
Net claims
|
(484,617
|
)
|
(568,784
|
)
|
(633,894
|
)
|
||||||
|
Acquisition cost (2)
|
(256,896
|
)
|
(256,183
|
)
|
(261,971
|
)
|
||||||
|
Underwriting result
|
427,400
|
392,102
|
385,229
|
|||||||||
|
Net financial income
|
56,190
|
34,201
|
41,665
|
|||||||||
|
Total expenses
|
(267,490
|
)
|
(272,894
|
)
|
(304,908
|
)
|
||||||
|
Other income/loss
|
11,362
|
21,126
|
10,086
|
|||||||||
|
Translation result
|
5,269
|
21,116
|
(8,126
|
)
|
||||||||
|
Gain (loss) from Grupo Pacífico and Banmedica agreement
|
(52,020
|
)
|
(47,176
|
)
|
(40,955
|
)
|
||||||
|
Income tax
|
-
|
-
|
-
|
|||||||||
|
Income before minority interest
|
180,711
|
148,475
|
82,992
|
|||||||||
|
Non-controlling interest
|
-
|
-
|
-
|
|||||||||
|
Net profit
|
180,711
|
148,475
|
82,992
|
|||||||||
|
Loss ratio (3)
|
41.5
|
%
|
46.7
|
%
|
49.5
|
%
|
||||||
|
Acquisition cost ratio (4)
|
22.0
|
%
|
21.0
|
%
|
20.4
|
%
|
||||||
|
Operating expenses / net earned premiums
|
22.9
|
%
|
22.4
|
%
|
23.8
|
%
|
||||||
|
Combined ratio of P&C (5)
|
86.3
|
%
|
90.2
|
%
|
93.7
|
%
|
||||||
| (1) |
Financial statements without consolidation adjustments.
|
| (2) |
Fees + Underwriting expenses, net
|
| (3) |
Net claims / Net earned premiums.
|
| (4) |
Acquisition cost / net earned premiums
|
| (5) |
(Net claims / Net earned premiums) + [(Acquisition cost + Total expenses) / Net earned premiums].
|
Life Insurance Business
Grupo Pacífico’s life insurance business’s net profit was S/282.8 million in 2022, compared to net losses of S/341.9 million reported in 2021. This increase was mainly
attributable to (i) a significant decrease in net claims, (ii) an important growth in written premiums and lower reserves, (iii) higher net financial income and (iv) higher translations results. These increases were attenuated by higher
acquisition costs and total expenses, in addition to lower other income.
In 2022, net claims decreased by 27% compared to 2021, due to lower excess mortality as a result of the advancement of COVID-19 vaccination with the third and fourth doses,
decreasing the level of excess mortality significantly compared to that generated in 2021 as a consequence of the second wave of the pandemic (which mainly affected D&S and Credit Life). This decrease in net claims resulted in a decreased
loss ratio from 80.5% in 2021 to 36.8% in 2022.
Grupo Pacífico’s life insurance business reported written premiums of S/2,560.7 million in 2022, which represented an increase of 4.1% compared to 2021. This result is
explained by the country’s economic recovery, mainly attributable to (i) Group Life, primarily by SCTR as a result of rate adjustments in the Mining and Fishing portfolio, and also due to the acquisition of new accounts, (ii) D&S, due to
higher premium collection from SISCO V, and (ii) Credit life, through the bancassurance channel due to higher sales. These effects were attenuated by the decrease in premiums attributable to (i) Annuities, due to decline in sales of Individuals
Annuities and Survivorship Annuities, and (ii) Individual Life, through direct channels and bancassurance due to lower sales. All these effects contributed to maintaining Grupo Pacífico’s top position in the market in terms of written premiums,
according to the SBS.
The acquisition cost increased in 2022 compared to 2021, mainly due to the increase in fees in Credit life and Group Life primarily as a result of SCTR’s institution of
higher insurance premiums. The acquisition cost ratio decreased in 2022, to 31.0% from 33.0% in 2021, due to the increases in premiums.
Financial income grew by 7.9% in 2022 compared to 2021 as a result of optimal investment management in terms of profitability and control, and the greater impact of
inflation, despite the volatile context of the capital markets as a result of internal political instability, external factors and the impacts of the pandemic.
Net Profit and Selected Ratios for Grupo Pacífico’s- Life business (1)
|
2020
|
2021
|
2022
|
||||||||||
|
(in thousands of Soles)
|
||||||||||||
|
Written premiums
|
1,991,417
|
2,460,276
|
2,560,698
|
|||||||||
|
Ceded premiums
|
(108,054
|
)
|
(206,584
|
)
|
(242,161
|
)
|
||||||
|
Reserves
|
(654,610
|
)
|
(852,876
|
)
|
(787,424
|
)
|
||||||
|
Net earned premiums
|
1,228,753
|
1,400,816
|
1,531,113
|
|||||||||
|
Net claims
|
(1,210,213
|
)
|
(1,742,093
|
)
|
(1,276,025
|
)
|
||||||
|
Acquisition cost (2)
|
(439,226
|
)
|
(462,563
|
)
|
(475,076
|
)
|
||||||
|
Underwriting result
|
(420,686
|
)
|
(803,840
|
)
|
(219,988
|
)
|
||||||
|
Net financial income
|
499,805
|
619,928
|
669,013
|
|||||||||
|
Total expenses
|
(130,005
|
)
|
(138,822
|
)
|
(168,249
|
)
|
||||||
|
Other income/loss
|
4,511
|
2,353
|
(1,774
|
)
|
||||||||
|
Translations results
|
(7,314
|
)
|
(21,567
|
)
|
(3,807
|
)
|
||||||
|
Income before minority interest
|
(53,689
|
)
|
(341,948
|
)
|
282,809
|
|||||||
|
Non-controlling interest
|
-
|
-
|
-
|
|||||||||
|
Net profit
|
(53,689
|
)
|
(341,948
|
)
|
282,809
|
|||||||
|
Loss ratio (3)
|
55.5
|
%
|
80.5
|
%
|
36.8
|
%
|
||||||
|
Acquisition cost ratio (4)
|
35.7
|
%
|
33.0
|
%
|
31.0
|
%
|
||||||
|
Operating expenses / net earned premiums
|
10.6
|
%
|
9.9
|
%
|
11.0
|
%
|
||||||
|
Combined ratio of Life (5)
|
104.1
|
%
|
123.5
|
%
|
78.8
|
%
|
||||||
| (1) |
Financial statements without consolidation adjustments.
|
| (2) |
Fees + underwriting expenses, net
|
| (3) |
(Net claims + Financial Income without real estate sales, impairment loss and fluctuation)/ Net earned premiums.
|
| (4) |
Acquisition cost / net earned premiums
|
| (5) |
(Net claims + Financial Income without real estate sales, impairment loss and fluctuation + Reserves / Net earned premiums) + [(Acquisition cost + Total expenses) / Net earned premiums].
|
Corporate Health and Medical Services Insurance Business
Corporate health insurance and medical services achieved a net profit of S/146.5 million in 2022, which was 36.2% higher than the S/107.6 million reported in 2021. This
increase in net profit can be attributed to a higher net profit in corporate health insurance, as a result of a higher renewal premiums, and an increase in medical services income, which was mainly attributable to health clinics and specialized
clinics (S/109.5 million in 2022 versus S/102.4 million in 2021) as a result of an increase in the demand for services.
Net Profit and Selected Ratios for Grupo Pacífico’s Corporate Health Insurance & Medical
Services (1)
|
2020
|
2021
|
2022
|
||||||||||
|
(in thousands of Soles)
|
||||||||||||
|
Written premiums
|
1,131,466
|
1,195,094
|
1,306,102
|
|||||||||
|
Ceded premiums
|
(12,706
|
)
|
(15,086
|
)
|
18,064
|
|||||||
|
Reserves (2)
|
651
|
(7,610
|
)
|
(3,709
|
)
|
|||||||
|
Net earned premiums
|
1,119,411
|
1,172,398
|
1,291,747
|
|||||||||
|
Net claims
|
(854,107
|
)
|
(1,019,908
|
)
|
1,076,901
|
|||||||
|
Acquisition cost (3)
|
(57,659
|
)
|
(62,093
|
)
|
77,594
|
|||||||
|
Underwriting result
|
207,645
|
90,397
|
137,251
|
|||||||||
|
Net financial income
|
5,851
|
6,217
|
9,030
|
|||||||||
|
Total expenses
|
(86,281
|
)
|
(88,112
|
)
|
84,337
|
|||||||
|
Other income/loss
|
3,199
|
3,502
|
1,178
|
|||||||||
|
Translation results
|
3,352
|
6,659
|
-3,410
|
|||||||||
|
Income tax
|
(42,202
|
)
|
(13,436
|
)
|
22,706
|
|||||||
|
Net profit Corporate health insurance
|
91,564
|
5,227
|
37,007
|
|||||||||
|
Medical Services
|
28,180
|
102,352
|
109,470
|
|||||||||
|
Net profit
|
119,744
|
107,579
|
146,477
|
|||||||||
|
Loss ratio (4)
|
76.3
|
%
|
87.0
|
%
|
83.4
|
%
|
||||||
|
Acquisition cost ratio (5)
|
5.2
|
%
|
5.3
|
%
|
6.0
|
%
|
||||||
|
Operating expenses / net earned premiums
|
7.7
|
%
|
7.5
|
%
|
6.5
|
%
|
||||||
|
Combined ratio (6)
|
89.2
|
%
|
99.8
|
%
|
95.9
|
%
|
||||||
| (1) |
Financial statements without consolidation adjustments, only 50% of this business profits corresponds to Grupo Pacifico, given the partnership with Banmedica.
|
| (2) |
The number reported for 2020 is positive because it is a release of reserves.
|
| (3) |
Fees + underwriting expenses, net
|
| (4) |
(Net claims)/ Net earned premiums.
|
| (5) |
Acquisition cost / net earned premiums
|
| (6) |
(Net claims / Net earned premiums) + [(Acquisition cost + Total expenses) / Net earned premiums].
|
Underwriting, Actuarial and Reinsurance
Underwriting guidelines for substantially all the risks associated with the P&C and corporate health insurance businesses are developed by profit centers in
collaboration with the actuarial staff. Grupo Pacífico’s P&C insurance business unit has an engineering staff that ensures that most medium and medium-to-large commercial properties are insured for risks prior to underwriting, while third
party surveyors are employed to inspect smaller and/or lower risk properties. Pricing and underwriting guidelines, rates, and approval thresholds for these risks, are periodically reviewed by the staff, reported to the Risk and Pricing
Committees, and continuously monitored to ensure that they are within competitive market conditions and profitability targets.
Grupo Pacífico’s P&C insurance business transfers risks to reinsurers in order to limit maximum aggregate potential losses and minimize exposures to large individual
risks. Reinsurance companies are chosen based on the evaluation of the credit quality of the reinsurer, financial rating, terms of coverage and price. The P&C insurance business acts as a reinsurer on a very limited basis, providing excess
facultative reinsurance capacity to other Peruvian insurers that are unable to satisfy their reinsurance requirements and/or the interests of Peruvian clients in the Latin American region.
Historically, Grupo Pacífico’s P&C insurance business has obtained reinsurance for a substantial portion of its earthquake-related (and other catastrophic risks)
insurance portfolio through quota share and excess of loss reinsurance treaties. The insurance business has property catastrophe reinsurance coverage that covers its probable maximum loss under local regulatory requirements. However, there is
no guarantee that a major catastrophe would not have a material adverse impact on Grupo Pacífico’s financial condition and/or its operations.
In 2022, Grupo Pacífico’s total ceded reinsurance premiums totaled approximately US$ 213 million (approximately 18.3% of total group written premiums), of which
approximately 89% were ceded to carriers with A- and above ratings.
Grupo Pacífico’s life insurance business holds excess loss reinsurance contracts for its individual life, personal accident, group life and credit life products; in the case
of work compensation risk insurance and D&S products, a quota share contract is held. Catastrophic reinsurance contracts cover all of Grupo Pacífico’s lifelines (Individual Life, Personal Accident, Group Life, Credit Life, SCTR and
D&S), except for the annuity line. Life premiums ceded to reinsurers represented less than 8.5% of the life insurance businesses written premiums in 2021.
Investment Portfolio
Grupo Pacífico’s investments are primarily made to meet its solvency equity ratio and provide reserves for its claims. Investments are managed by product within the P&C
and life insurance businesses and are designed to contain sufficient assets to match the company’s liabilities. Grupo Pacífico has adopted strict policies related to investment decisions that are reviewed and approved by Grupo Pacífico’s Board
of Directors on a monthly basis. Grupo Pacífico invests in local and international markets, emphasizing investments in Peru, the United States, and Latin America.
As of December 31, 2022, the value of Grupo Pacífico’s investment portfolio was S/12,697 million, which included mainly S/10,977 million in fixed-income instruments, S/616
million in investment properties, S/578 million in equity securities, and S/525 million in alternative investments. This diversified portfolio follows an asset-liability management strategy focused on cash flow, duration, and currency matching
of assets (portfolio) and liabilities (reserves), as well as on supporting Grupo Pacífico’s capital structure. Grupo Pacífico’s financial income increased by 9% in 2022 to S/710.5 million from S/654.3 million in 2021.
6.3.2 Prima AFP
As of December 31, 2022, the number of affiliates in Prima AFP was 2.3 million, similar to 2021 (2.3 million) and lower than 2.4 million in 2020.
Prima AFP’s funds under management reached S/31.8 billion in 2022, which was 20.6% lower than the S/40.1 billion in 2021 and 36.0% lower than the S/49.8 billion in 2020. The
decrease was mainly due to fund withdrawal approved by the government in response to the COVID-19 pandemic. In 2022, the nominal annual yield for Fund 0 was 5.2%, with negative nominal annual yields of (5.3%), (7.0%), and (8.2%) for Funds 1, 2,
and 3, respectively. Since 2006, Prima AFP’s nominal annualized yields were 5.7%, 6.6% and 5.7% for Funds 1, 2 and 3 respectively.
Prima AFP’s revenues were S/373.7 million in 2022, lower than S/378.7 million in 2021 and higher than S/352.1 in 2020.
Additionally, operating expenses amounted to S/188.9 million in 2022, which was an increase as compared to S/187.8 million in 2021 and S/160.4 million in 2020. This increase
was mainly due to higher personnel expenses and penalties for property return.
Prima AFP’s net profit was S/109.5.million in 2022, which was a decrease compared to S/146.1 million and S/148.1 million in 2021 and 2020, respectively. In 2022, Prima AFP’s
ROAE decreased to 20.4% compared to 22.9% in 2021 and 21.2% in 2020.
The following table summarizes the administration fees charged by the AFPs’ for PPS in 2022:
|
Remuneration
scheme
|
Mixed-commission scheme
|
|||||||||||
|
AFP
|
Monthly fee on
salary
|
Monthly fee on
salary
|
Annual fee on
funds
|
|||||||||
|
Prima AFP
|
1.60
|
%
|
0.18
|
%
|
1.25
|
%
|
||||||
|
AFP Integra
|
1.55
|
%
|
0.00
|
%
|
0.79
|
%
|
||||||
|
Profuturo AFP
|
1.69
|
%
|
0.28
|
%
|
1.20
|
%
|
||||||
|
AFP Habitat
|
1.47
|
%
|
0.23
|
%
|
1.25
|
%
|
||||||
As of December 31, 2022, Prima AFP had S/735.0 million in assets (compared to S/839.8 million and S/1,107.7 million as of December 31, 2021, and December 31, 2020,
respectively), S/238.2 million in liabilities (compared to S/265.2 million and S/407.5 million as of December 31, 2021 and December 31, 2020, respectively), and shareholders’ equity of S/496.8 million (compared to S/574.6 million and S/700.2
million as of December 31, 2021 and December 31, 2020, respectively).
6.4 Investment Banking and Wealth Management
Our Investment Banking and Wealth Management LoB registered a net profit attributable to Credicorp of S/106.5 million in 2022. Throughout this year, we went through periods
of high political uncertainty and economic instability in the region (Latam), in addition to adverse global macroeconomic conditions. We faced a particularly challenging context in which both structural and circumstantial changes began to
materialize in the markets we operate in, including, among others, the significant market contraction for the Mutual Funds business in Peru, the client’s preference for offshore platforms to mitigate country-related risks, the diminished
investment capacity and liquidity of institutional clients, and the loss of assets value due to market conditions. These changes had a considerable impact on the performance and dynamism of our business units, recording revenues 13% lower
compared to the previous year.
Nonetheless, despite the difficult conditions and adversities faced this year, we continued to develop key strategic projects for our future growth with a transformational
focus that will allow us to generate scale and achieve our aspirational goals.
6.4.1 Corporate Finance
Our Corporate Finance business was affected by a context in which both economic and market conditions proved unfavorable for the execution of corporate transactions. However,
we succeeded in executing a series of large-scale transactions throughout 2022, including the structuring of the loans granted to Empresa de Generación Huanza S.A. and Inmobiliaria Pardo in Peru, and to FIP Aqua in Chile, in addition to the
M&A advisory provided to Pesco (also in Chile). Overall, our Corporate Finance business revenues grew 2% from 2021 to 2022, supported by a remarkable growth in Chile.
6.4.2 Asset Management
In our Asset Management business, 2021 market conditions established by an unstable political and social context led to early withdrawals from local
traditional funds, particularly in Peru, where our mutual funds lost assets under management by 47% by the end of the year and the market structurally reduced its total size by 29%. In 2022, local market conditions did not show any recovery, as
assets migrated last year by private banking and institutional clients to offshore platforms were kept abroad to mitigate the risk in the region, and institutional clients lost liquidity due to government-approved withdrawals in favor of its
clients. As a result, recovering assets under management was challenging, despite the significant efforts made by the company throughout the year. In 2022, the Peruvian local mutual funds market showed an additional contraction of 12% compared
to 2021, according to the SMV.
In 2021, local asset outflows were partially offset as some of these funds migrated to our offshore platforms, where we offer proprietary
funds under regional strategies (such as our Vision Global funds and Luxembourg funds) and offer third-party funds to our private banking clients. Clients were attracted by an offer of products that maintained international standards and
competitive returns, as well as an investment team with knowledge and specialization in the Latin American market. Nevertheless, in 2022, the demand for these products fell below expectations as
clients preferred to keep a substantial amount of their funds as deposits.
In addition, our Asset Management business was affected by lower assets market value due to global macroeconomic conditions for
investments. This had an impact on our traditional proprietary funds business, but also on the third-party fund distribution business, which was also affected by the diminished investment capacity and liquidity of institutional
clients, making it difficult to raise new funds. This business was particularly affected in Chile, where Allianz´s licenses issues led to additional asset outflows.
By the end of the year, total assets under management, including institutional and retail clients, exceeded S/67 billion, representing a decrease of 30%
compared to the previous year, as revenues dropped 24%.
Asset Management Assets under Management
|
2020
|
2021
|
2022
|
||||||||||
|
(in millions of Soles)
|
||||||||||||
|
Assets under management – Peru (1)
|
34,815
|
30,212
|
24,009
|
|||||||||
|
Assets under management – Colombia
|
23,906
|
27,842
|
23,050
|
|||||||||
|
Assets under management – Chile
|
37,112
|
37,987
|
20,057
|
|||||||||
|
Total assets under management
|
95,834
|
96,040
|
67,116
|
|||||||||
|
Total assets under custody
|
85,127
|
83,538
|
89,457
|
|||||||||
| (1) |
Includes assets under management in ASB Bank Corp. Includes assets under management for which there is a service agreement between ASB and Credicorp Capital for the latter to perform functions as
Portfolio Manager (ASB Bank Corp. funds in millions of Soles are: S/6,490, S/10,672 and S/7,030 in 2020, 2021 and 2022 respectively).
|
6.4.3 Capital Markets
Our Capital Markets business was significantly affected by a context of global rising inflation and interest rates, local political uncertainty and social instability.
Revenues in the management of proprietary trading positions, including long and short positioning strategies, together with hedging strategies with derivatives instruments, were lower than expected but exceeded those achieved in 2021 by more
than 90%. On the other hand, in our sales business, revenues from individuals decreased compared to those in 2021 (a year in which clients settled part of their equity positions and traded volumes peaked), as same as those from institutional
clients (as traded volumes remained lower than expected throughout the year). Revenues from corporate clients in Colombia and Chile grew 15% compared to 2021, boosted by FX transactions capitalizing on the volatility of the foreign exchange
markets. Overall, revenues for our Capital Markets Business increased compared to those registered in 2021 by 14%.
Capital Markets Securities Portfolio
|
Traded volume
|
2020
|
2021
|
2022
|
|||||||||
|
(in millions of Soles)
|
||||||||||||
|
Equity securities – Peru 1
|
8,753
|
10,485
|
5,652
|
|||||||||
|
Fixed income – Peru 1
|
49,032
|
58,321
|
55,059
|
|||||||||
|
Equity securities – Colombia 2
|
12,027
|
10,521
|
8,082
|
|||||||||
|
Fixed income – Colombia 2
|
148,028
|
141,427
|
133,937
|
|||||||||
|
Equity securities – Chile 3
|
13,422
|
18,969
|
17,626
|
|||||||||
|
Fixed income – Chile 3
|
59,710
|
35,485
|
35,025
|
|||||||||
(1) Peru: BVL information. Fixed-income data also includes information from Datatec platform. Does not include repo operations.
(2) Colombia: Colombia Stock Exchange information. Fixed-income data also includes Banco de la República’s information. Does not include repo
operations.
(3) Chile: Santiago Stock Exchange information. Fixed-income data includes financial intermediation operations. Equity securities include operations with investment fund shares and foreign
stock. Does not include repo operations.
6.4.4 Wealth Management
Our Wealth Management business saw similar results across countries. Overall, total revenues decreased 14% as compared to 2021 and assets under management reached a total of
S/58.2 billion, a contraction of 11% compared to 2021, mostly driven by a significant market value loss.
In Peru, revenues fell by 15% compared to 2021 as assets under management did not meet expectations, recording net outflows in a context where global and local conditions
limited liquidity events for our clients. Revenues decreased in both onshore and offshore platforms, driven by a lower demand for third-party funds (as mentioned above), lower traded volumes in brokerage, lower lending volumes and a reduction
in Vicctus (our Multi Family Office service) fees. On the other hand, revenues were boosted by margin income from deposits (as funds migrated to our offshore platform last year remained on balance pending for more profitable investment
opportunities).
In Colombia and Chile, revenues dropped 28% and 8% compared to 2021, respectively, as income from asset management products did not meet expectations.
Wealth Management Assets under Management
|
2020
|
2021
|
2022
|
||||||||||
|
(in millions of Soles)
|
||||||||||||
|
Assets under management – Peru (1)
|
41,357
|
43,786
|
38,648
|
|||||||||
|
Assets under management – Colombia
|
10,344
|
10,124
|
7,034
|
|||||||||
|
Assets under management – Chile
|
10,428
|
11,393
|
11,460
|
|||||||||
|
Total assets under management (2)
|
62,129
|
65,303
|
58,164
|
|||||||||
|
Total Clients (3)
|
5,300
|
5,911
|
4,770
|
|||||||||
(1) Includes assets under management booked in ASB Bank Corp and BCP Wealth Management business.
(2) Includes Asset Management products for S/19,958, S/19,689 and S/15,526 million as of 2020, 2021 and 2022, respectively. Includes AUMs from US persons in US for S/ 1,022.
(3) Estimated. Includes clients with net worth over US$1 million. Figures include the effect of annual customer
re-segmentation. In 2022, 520 Peruvian clients and 620 Colombian clients were transferred to other segments
6.4.5 Other Relevant Businesses
Our Trust Services Business, which mainly includes income from custody of securities in Peru and administration of trusts in Peru and Colombia, had a positive year in 2022
with a growth of 9% as compared to 2021. Finally, the long-term portfolio managed in ASB Bank Corp. went from a balance of US$488 million at the end of 2021 to US$452 million at the end of 2021, aligned with the defined Strategic Asset
Allocation for this year.
(1) Capital Adequacy and Solvency Management
1.1 Credicorp
Our solvency buffers, measured by either regulatory or internal capital ratios, are deemed appropriate in order to comply with both current and expected capital requirements and support our
business growth in the coming years. In a similar fashion, our working capital and other liquidity measures are deemed sufficient for current and projected business and regulatory requirements.
The following table shows regulatory capital and capital adequacy requirements applicable to the financial group under IFRS rules, as of December 31, 2020, 2021, and 2022:
|
Regulatory Capital and Capital Adequacy Ratios
|
||||||||||||
|
2020
|
2021
|
2022
|
||||||||||
|
In millions of Soles
|
||||||||||||
|
Capital stock
|
1,319
|
1,319
|
1,319
|
|||||||||
|
Treasury stocks
|
(208
|
)
|
(208
|
)
|
(208
|
)
|
||||||
|
Capital surplus
|
193
|
229
|
232
|
|||||||||
|
Legal and other capital reserves (1)
|
21,430
|
21,364
|
23,703
|
|||||||||
|
Minority interest (2)
|
443
|
420
|
471
|
|||||||||
|
Loan loss reserves (3)
|
1,838
|
2,001
|
2,129
|
|||||||||
|
Perpetual subordinated debt
|
-
|
-
|
-
|
|||||||||
|
Subordinated debt
|
5,491
|
6,125
|
5,771
|
|||||||||
|
Investments in equity and subordinated debt of financial and insurance companies
|
(716
|
)
|
(713
|
)
|
(889
|
)
|
||||||
|
Goodwill
|
(821
|
)
|
(797
|
)
|
(772
|
)
|
||||||
|
Deduction for subordinated debt limit (50% of Tier I excluding deductions) (4)
|
-
|
-
|
-
|
|||||||||
|
Deduction for Tier I limit (50% of regulatory capital) (4)
|
-
|
-
|
-
|
|||||||||
|
Total Regulatory Capital (A)
|
28,969
|
29,742
|
31,714
|
|||||||||
|
Tier I (5)
|
15,313
|
15,352
|
16,955
|
|||||||||
|
Tier II (6) + Tier III (7)
|
13,657
|
14,389
|
14,799
|
|||||||||
|
Financial Consolidated Group (FCG) Regulatory Capital Requirements
|
20,136
|
18,530
|
22,506
|
|||||||||
|
Insurance Consolidated Group (ICG) Capital Requirements
|
1,304
|
1,431
|
1,563
|
|||||||||
|
FCG Capital Requirements related to operations with ICG (8)
|
(467
|
)
|
(513
|
)
|
(471
|
)
|
||||||
|
ICG Capital Requirements related to operations with FCG (9)
|
-
|
-
|
-
|
|||||||||
|
Total Regulatory Capital Requirements (B)
|
20,973
|
19,447
|
23,598
|
|||||||||
|
Regulatory Capital Ratio (A) / (B)
|
1.38
|
1.53
|
1.35
|
|||||||||
|
Required Regulatory Capital Ratio (10)
|
1.00
|
1.00
|
1.00
|
|||||||||
(1) Legal and other capital reserves include restricted capital reserves (PEN 13,465 million) and optional capital reserves (PEN 5,972 million).
(2) Minority interest includes Tier 1 (PEN 000 million)
(3) Up to 1.25% of total RWAs of Banco de Credito del Peru, Solución Empresa Administradora Hipotecaria, Mibanco and Atlantic Security Bank.
(4) Tier 2 + Tier 3 cannot be more than 50% of total regulatory capital.
(5) Tier 1 = capital + restricted capital reserves + Tier 1 minority interest – goodwill – (0.5 x investment in equity and subordinated debt of financial and insurance companies) +
perpetual subordinated debt.
(6) Tier 2 = subordinated debt + Tier 2 minority interest tier + loan loss reserves – (0.5 x investment in equity and subordinated debt of financial and insurance companies).
(7) Tier 3 = Subordinated debt covering market risk only.
(8) Includes regulatory capital requirements of the financial consolidated group.
(9) Includes regulatory capital requirements of the insurance consolidated group.
(10) Regulatory Capital / Total Regulatory Capital Requirements (legal minimum = 1.00).
1.2 BCP Stand-alone and Mibanco
BCP Stand-alone and Mibanco actively manage their capital resources, in order to comply with both solvency regulatory requirements and their own internal
limits.
For transparency purposes and to demonstrate the calculation of the CET1 ratio, Credicorp periodically discloses BCP Stand-alone and Mibanco’s adjusted total
RWAs.
The following table presents regulatory capital information for BCP Stand-alone and Mibanco as of December 31, 2020, 2021 and 2022:
|
BCP Stand-alone Regulatory Capital and Capital Adequacy Ratios (in millions of Soles)
|
||||||||||||
|
2020
|
2021
|
2022
|
||||||||||
|
Capital stock
|
11,067
|
11,317
|
12,176
|
|||||||||
|
Legal and other capital reserves
|
6,167
|
6,708
|
6,760
|
|||||||||
|
Accumulated earnings with capitalization agreement
|
-
|
-
|
-
|
|||||||||
|
Loan loss reserves (1)
|
1,596
|
1,735
|
1,838
|
|||||||||
|
Perpetual subordinated debt
|
-
|
-
|
-
|
|||||||||
|
Subordinated debt
|
4,817
|
5,397
|
5,149
|
|||||||||
|
Unrealized gain (loss)
|
-
|
-
|
-
|
|||||||||
|
Investment in subsidiaries and others, net of unrealized profit and net income
|
(2,315
|
)
|
(2,264
|
)
|
(2,437
|
)
|
||||||
|
Investment in subsidiaries and others
|
(2,298
|
)
|
(2,436
|
)
|
(2,844
|
)
|
||||||
|
Unrealized profit and net profit in subsidiaries
|
(17
|
)
|
172
|
408
|
||||||||
|
Goodwill
|
(122
|
)
|
(122
|
)
|
(122
|
)
|
||||||
|
Total regulatory capital
|
21,210
|
22,772
|
23,364
|
|||||||||
|
Tier 1 (2)
|
14,784
|
15,143
|
16,219
|
|||||||||
|
Tier 2 (3) + Tier 3 (4)
|
6,426
|
7,629
|
7,145
|
|||||||||
|
Total RWAs
|
142,043
|
152,376
|
161,939
|
|||||||||
|
Credit RWAs
|
125,874
|
137,707
|
145,968
|
|||||||||
|
Market RWAs (5)
|
4,859
|
2,409
|
1,560
|
|||||||||
|
Operational RWAs
|
11,309
|
12,260
|
14,411
|
|||||||||
|
Capital ratios
|
||||||||||||
|
Tier 1 ratio (6)
|
10.41
|
%
|
9.94
|
%
|
10.02
|
%
|
||||||
|
CET1 ratio IFRS (7)
|
11.09
|
%
|
11.92
|
%
|
12.59
|
%
|
||||||
|
BIS ratio (8)
|
14.93
|
%
|
14.94
|
%
|
14.43
|
%
|
||||||
|
RWAs / Regulatory capital
|
6.70
|
6.69
|
6.93
|
|||||||||
(1) Up to 1.25% of total RWAs.
(2) Tier 1 = Capital + Legal and other capital reserves + Accumulated earnings with capitalization agreement + (0.5 x Unrealized profit and net profit in subsidiaries) – Goodwill – (0.5 x Investment in
subsidiaries) + Perpetual subordinated debt (maximum amount that can be included is 17.65% of Capital + Reserves + Accumulated earnings with capitalization agreement + Unrealized profit and net profit in subsidiaries – Goodwill).
(3) Tier 2 = Subordinated debt + Loan loss reserves + (0.5 x Unrealized profit and net profit in subsidiaries) – (0.5 x Investment in subsidiaries).
(4) Tier 3 = Subordinated debt covering market risk only. Tier 3 has existed since 1Q10.
(5) It includes capital requirement to cover price and rate risk.
(6) Tier 1 / RWAs
(7) CET1 = Capital + Reserves – 100% of applicable deductions (investment in subsidiaries, goodwill, intangibles, and net deferred taxes that rely on future profitability) + retained earnings + unrealized gains. It
is calculated under IFRS balance sheets.
(8) Regulatory Capital / RWAs (legal minimum = 10% since July 2011).
In 2021, CET1 was reported according to local accounting standards (11.84%). Prior to 2022, the risk appetite was defined pursuant to local accounting principles. That year the
CET1 under IFRS was 11.92%. In 2022, we began measuring risk appetite under IFRS, and for 2022 CET1 was reported under IFRS (12.59%). For 2022, CET1 under local accounting was 12.02%.
As of December 31, 2022, BCP Stand-alone’s regulatory capital was 14.43% of its unconsolidated RWAs. As of December 31, 2021, and December 31, 2020, BCP
Stand-alone’s regulatory capital was 14.94% and 14.93% of its unconsolidated RWAs, respectively.
|
Mibanco – Regulatory Capital and Capital Adequacy Ratios (in millions of Soles)
|
||||||||||||
|
2020
|
2021
|
2022
|
||||||||||
|
Total regulatory capital
|
2,450
|
2,305
|
2,328
|
|||||||||
|
Tier (1)
|
2,184
|
1,962
|
1,963
|
|||||||||
|
Tier 2 (2)
|
266
|
343
|
365
|
|||||||||
|
Total RWAs
|
12,357
|
14,056
|
15,850
|
|||||||||
|
Credit RWAs
|
10,315
|
12,018
|
14,346
|
|||||||||
|
Market RWAs (3)
|
135
|
149
|
97
|
|||||||||
|
Operational RWAs
|
1,907
|
1,889
|
1,408
|
|||||||||
|
Capital ratios
|
||||||||||||
|
Tier 1 ratio (4)
|
17.67
|
%
|
13.96
|
%
|
12.38
|
%
|
||||||
|
CET1 ratio IFRS (5)
|
17.70
|
%
|
15.24
|
%
|
16.46
|
%
|
||||||
|
BIS ratio (6)
|
19.82
|
%
|
16.40
|
%
|
14.69
|
%
|
||||||
|
RWAs / Regulatory capital
|
5.04
|
6.10
|
6.81
|
|||||||||
| (1) |
Tier 1 = Capital + Legal and other capital reserves + Accumulated earnings with capitalization agreement + (0.5 x Unrealized profit and net profit in subsidiaries) – Goodwill – (0.5 x Investment in subsidiaries) + Perpetual
subordinated debt (maximum amount that can be included is 17.65% of Capital + Reserves + Accumulated earnings with capitalization agreement + Unrealized profit and net profit in subsidiaries – Goodwill
|
| (2) |
Tier 2 = Subordinated debt + Loan loss reserves + (0.5 x Unrealized profit and net profit in subsidiaries) – (0.5 x Investment in subsidiaries).
|
| (3) |
It includes capital requirement to cover price and rate risk.
|
| (4) |
Tier 1 / RWAs
|
| (5) |
CET1 = Capital + Reserves – 100% of applicable deductions (investment in subsidiaries, goodwill, intangibles and net deferred taxes that rely on future profitability) + retained earnings + unrealized gains.
|
| (6) |
Regulatory Capital / RWAs (legal minimum = 10% since July 2011)
|
As of December 31, 2022, Mibanco Peru’s regulatory capital was 14.69% of its unconsolidated RWAs. As of December 31, 2021, and December 31, 2020, Mibanco Peru’s regulatory
capital was 16.40% and 19.82% of its unconsolidated RWAs, respectively.
As of December 31, 2022, Mibanco’s CET1 ratio was 16.46% of its unconsolidated RWAs and above its corresponding CET1 limit of 15.00%.
In 2021, Mibanco’s CET1 was reported according to local accounting standards (14.87%). Prior to 2022, the risk appetite was defined pursuant to local accounting principles. In
2021, the CET1 under IFRS was 15.24%. In 2022, we began measuring risk appetite under IFRS, and as a result have reported Mibanco’s 2022 CET1 under IFRS (16.46%).
1.3 Grupo Pacífico
Grupo Pacífico’s solvency indicators, given the equity requirements of the insurance business, have allowed Grupo Pacífico to satisfy its obligations to its policyholders
and thus have an adequate level of financial leverage.
The following table shows the regulatory capital adequacy requirements applicable to Grupo Pacífico, as of December 31, 2020, 2021 and 2022:
|
As of December 31,
|
||||||||||||
|
Grupo Pacífico Regulatory Ratios
(in thousands of Soles)
|
2020
|
2021
|
2022
|
|||||||||
|
(A) Capital Adequacy
|
1,749,908
|
1,683,534
|
1,700,171
|
|||||||||
|
(B) Regulatory Capital Requirement
|
1,304,266
|
1,430,566
|
1,562,893
|
|||||||||
|
(B.1) Solvency I Required capital
|
966,023
|
1,059,693
|
1,157,327
|
|||||||||
|
(B.2) Security Fund
|
337,581
|
370,329
|
404,534
|
|||||||||
|
(B.3) Credit risk
|
-
|
-
|
0
|
|||||||||
|
(B.4) Other Capital Requirement
|
662
|
544
|
1,032
|
|||||||||
|
(C) Leverage
|
910,440
|
1,063,610
|
976,304
|
|||||||||
|
Surplus 1 = (A) - (B)
|
445,642
|
252,968
|
137,279
|
|||||||||
|
Ratio (A)/(B)
|
1.34
|
1.18
|
1.09
|
|||||||||
|
Surplus 1 = (A) - (C)
|
839,468
|
619,924
|
723,867
|
|||||||||
|
Ratio (A)/(C)
|
1.92
|
1.58
|
1.74
|
|||||||||
(2) Cash flows and Capital Expenditures
The following table shows net cash from operating, investing and financing activities, for the periods indicated:
|
2020
|
2021
|
2022
|
||||||||||
|
In thousands of Soles
|
||||||||||||
|
Net cash flow from operating activities
|
12,685,573
|
3,972,994
|
(1,134,877
|
)
|
||||||||
|
Net cash flows from investing activities
|
(1,872,106
|
)
|
(3,727,711
|
)
|
(1,094,965
|
)
|
||||||
|
Net cash flows from financing activities
|
(2,088,460
|
)
|
(465,296
|
)
|
(1,600,815
|
)
|
||||||
Operating Activities
Net cash flow from operating activities decreased S/5,108 million from 2021 to 2022, which was primarily attributable to an increase in investments at fair value through
other comprehensive income, a decrease in payables from repurchase agreements associated with government programs and securities lending and a decrease in deposits and obligations. This was partially offset by reduced loan activity resulting
from a reduction in loans associated with government programs, decreased investments at fair value through profit or loss and increased amounts due to banks and correspondents and other liabilities.
Net cash flow from operating activities decreased S/8,714 million from 2020 to 2021, mainly due to a reduction in payables from repurchase agreements associated with
government programs and securities lending and a decrease in deposits and obligations. This was partially offset by a decrease in investments at fair value through other comprehensive income and the lower requirement of cash in loans, as a
result of a reduction in loans associated with government programs.
Investing Activities
Variations in net cash flow from investing activities were mainly due to lower purchases and higher investment sales at amortized cost mainly in BCP. The exact opposite
happened in 2021 compared to 2020, where the cash used was higher by S/1,856 million.
In 2022, 2021 and 2020 intangible assets consumed cash of S/704 million, S/532 million and S/535 million, respectively, mainly driven by digital transformation efforts and
disruptive initiatives.
Financing Activities
In 2022, net cash flows used in financing activities were S/1,600.08 million, which represented S/1,135.5 million more used in financing activities than in 2021. This
increase was mainly due to dividends paid increasing from S/398.8 million in 2021 to S/1,196.4 million in 2022, which in turn resulted from increased net profits as the COVID-19 pandemic crisis waned.
Net cash flow used in financing activities were S/465.3 million in 2021, which represented S/1,623.2 million less used in financing activities than in 2020. This decrease
was mainly due to dividends paid decreasing from S/2,392.8 million in 2020 to S/398.8 million in 2021, which in turn resulted from decreased net profits due to the COVID-19 pandemic.
(3) Liquidity Risk
We manage our assets and liabilities to ensure that we have sufficient liquidity to meet our present and future financial obligations and take advantage of appropriate
business opportunities as they arise. Liquidity risk represents the potential for loss as a result of limitations on our ability to adjust future cash flows to meet the needs of depositors and borrowers and to fund operations on a timely and
cost-effective basis. Financial obligations arise from withdrawals of deposits, repayment on maturity of purchased funds, extensions of loans or other forms of credit, and working capital needs.
The growth of our deposit base over the years has enabled us to significantly increase our lending activity. BCP Stand-alone and Mibanco are subject to SBS Resolution No.
9075-2012, enacted in December 2012, which set responsibilities for liquidity management within the different committees and risk units, and established minimum liquidity ratios. The ratio of liquid assets as a percentage of short-term
liabilities, as defined by the SBS, must exceed 8% for Soles-based transactions and 20% for foreign exchange transactions. The aggregate average daily ratios of BCP Stand-alone and Mibanco during December 2022 was 25.51% and 46.59% for Soles
and foreign exchange transactions, respectively, demonstrating our excess liquidity. We have never defaulted on any of our debt or been forced to reschedule any of our obligations. Even during the early 1980s, when the government of Peru and
many Peruvian companies and banks were forced to restructure their debt as a result of the Latin American debt crisis and government restrictions, BCP Stand-alone and Grupo Pacífico complied with all of their payment obligations.
The available sources of excess liquidity for Soles and foreign exchange transactions for BCP Stand-alone are as follows. Information with respect to BCP Stand-alone and
Mibanco has been aggregated for December 2020, 2021, and 2022:
|
2020
|
2021
|
2022
|
||||||||||
|
SOLES RATIO
|
in thousands of Soles
|
in thousands of Soles
|
in thousands of Soles
|
|||||||||
|
CURRENT ASSETS
|
||||||||||||
|
Cash
|
2,946,602
|
2,797,386
|
2,596,202
|
|||||||||
|
Deposits in BCRP and Deposits in Peruvian and foreign banks
|
6,743,088
|
4,540,407
|
2,498,705
|
|||||||||
|
Peruvian Government treasury bonds and BCRP certificates of deposit
|
25,040,078
|
16,335,655
|
13,429,836
|
|||||||||
|
Others
|
0
|
6
|
14,526
|
|||||||||
|
Total
|
34,729,771
|
23,673,455
|
18,539,269
|
|||||||||
|
CURRENT LIABILITIES
|
||||||||||||
|
Demand deposits
|
28,242,834
|
25,822,361
|
23,109,806
|
|||||||||
|
Saving deposits
|
28,622,004
|
31,353,804
|
29,310,510
|
|||||||||
|
Time deposits
|
12,824,488
|
13,527,441
|
17,514,832
|
|||||||||
|
Others
|
1,851,829
|
1,723,288
|
2,746,755
|
|||||||||
|
Total
|
71,541,155
|
72,426,894
|
72,681,903
|
|||||||||
|
Current ratio
|
48.55
|
32.69
|
25.51
|
|||||||||
|
2020
|
2021
|
2022
|
||||||||||
|
FOREIGN EXCHANGE RATIO
|
in thousands of Soles
|
in thousands of Soles
|
in thousands of Soles
|
|||||||||
|
CURRENT ASSETS
|
||||||||||||
|
Cash
|
361,969
|
500,024
|
491,737
|
|||||||||
|
Deposits in BCRP and Deposits in Peruvian and foreign banks
|
5,775,043
|
6,092,995
|
6,304,832
|
|||||||||
|
Peruvian Government treasury bonds and BCRP certificates of deposit
|
748,933
|
350,250
|
19,219
|
|||||||||
|
Others
|
18,915
|
19,650
|
18,316
|
|||||||||
|
Total
|
6,904,860
|
6,962,919
|
6,834,104
|
|||||||||
|
CURRENT LIABILITIES
|
||||||||||||
|
Demand deposits
|
6,124,288
|
7,388,298
|
6,579,017
|
|||||||||
|
Saving deposits
|
4,756,948
|
5,158,353
|
5,573,210
|
|||||||||
|
Time deposits
|
2,268,408
|
1,626,094
|
1,896,550
|
|||||||||
|
Others
|
953,841
|
20,722
|
620,368
|
|||||||||
|
Total
|
14,103,485
|
14,193,466
|
14,669,146
|
|||||||||
|
Current ratio
|
48.96
|
49.06
|
46.59
|
|||||||||
As the economy gradually recovers and the central bank withdraws liquidity injection measures, liquidity surpluses in Soles are returning to pre-pandemic levels. This trend
suggests a normalization of market conditions.
The capability of replacing interest-bearing deposits at their maturity is a key factor in determining liquidity requirements, as well as the exposure to interest and
exchange rate risks. RBG, as well as BCP Stand-alone’s private banking group, have developed a diversified and stable deposit base that, in each case, provides us with a low-cost source of funding. This deposit base has traditionally been one
of our greatest strengths. The deposit-gathering strategy has focused on products considered to be BCP Stand-alone’s core deposits: demand deposits, savings, time deposits, and severance indemnity deposits. Other sources of funds and liquidity,
which are mostly short- and long-term borrowings from correspondent banks and other financial institutions, issued bonds, and notes issued, are of a considerably lower significance compared to our core deposits.
Corporate policies have been implemented by the Group for liquidity risk management. These policies are consistent with the appropriate characteristics of each operating
segment, where each of the Group companies operates. The Risk Committee establishes limits and autonomy models to determine the adequate liquidity indicators to be managed.
Throughout 2022 the Group continuously assessed and monitored the sufficiency of its liquid assets in order to cover or mitigate contingencies that could stress the funding
requirements of the Group's companies.
Universal banking and Microfinance
Liquidity risk exposure is based on indicators such as the Internal Liquidity Coverage Ratio (ILCR) which measures the amount of liquid assets available to meet needs that
would result from cash outflows within a given stress scenario for a period of 30 days, and the Internal Net Stable Funding Ratio, which is intended to ensure that long-term assets are financed with a minimum number of stable liabilities within
a prolonged liquidity crisis scenario (funding crisis); the latter indicator functions as a minimum compliance mechanism that supplements the ILCR. The core limits of these indicators are 100% and any excess is presented to the Credicorp
Treasury and ALM Risk Committee, Credicorp Risk Committee and ALM Committee of the respective subsidiary. Furthermore, Credicorp has internal appetite risk limits that are monitored and reported on to the Credicorp Treasury and ALM Risk
Committee.
Insurance
Liquidity risk management follows a particular approach reflecting the nature of the business. For annually renewable businesses, the focus of liquidity is the quick
availability of resources in the event of a systemic event (for example, an earthquake). For this purpose, there are minimum investment indicators in place relating to local cash/time deposits and foreign fixed-income instruments of high
quality and liquidity.
For long-term insurance businesses, given the nature of the products offered and the contractual relationship with customers, the liquidity risk is not material. Rather, the
focus is on maintaining a sufficient flow of assets and matching their maturities with the maturities of obligations (for example, through the mathematical reserve). For this purpose, there are indicators that measure the asset/liability
sufficiency and adequacy, as well as calculations of economic capital subject to interest rate risk.
Pension funds
Liquidity risk management is differentiated between the fund administrator and the funds being managed. Liquidity risk management regarding the fund administrator is focused
on meeting periodic operating expense needs, which are supported by the collection of commissions. The fund administrator does not record unexpected outflows of liquidity because its main financial obligations are payroll payments, taxes,
reserve requirements and other accounts payable to suppliers. Liquidity risk in the funds managed (pension funds) is focused on meeting liquidity requirements due to scheduled pension payments, funds transfers to other AFPs, withdrawals of
voluntary contributions, or anything else deemed necessary to be included in estimations. For this purpose, the company holds highly liquid assets as part of the managed portfolios to meet these cash requirements.
Investment banking
Liquidity risk principally affects the security brokerage. In managing this risk, limits on the use of liquidity have been implemented to promote matching maturities by
dealing desk. Follow-up liquidity assessments are performed on a daily basis for a short-term horizon covering imminent settlements. If short-term unmatched maturities are observed, repurchase agreements are used. On the other hand, structural
risk is not significant given the low levels of debt, which are monitored regularly using financial planning tools.
Funding Sources
The following table presents the components of our funding sources at the dates indicated:
|
As of December 31,
|
||||||||||||
|
2020
|
2021
|
2022
|
||||||||||
|
(in thousands of Soles, except percentages)
|
||||||||||||
|
Core Deposits:
|
||||||||||||
|
Demand deposits
|
54,530,355
|
58,629,661
|
48,467,248
|
|||||||||
|
Savings deposits
|
50,069,129
|
56,945,262
|
54,769,045
|
|||||||||
|
Severance indemnity deposits
|
7,736,747
|
4,017,065
|
3,824,629
|
|||||||||
|
Total core deposits
|
112,336,231
|
119,591,988
|
107,060,922
|
|||||||||
|
Other Deposits:
|
||||||||||||
|
Time deposits
|
28,121,094
|
27,923,803
|
37,478,269
|
|||||||||
|
Bank certificates
|
1,202,996
|
1,327,690
|
1,418,740
|
|||||||||
|
Total deposits
|
141,660,321
|
148,843,481
|
145,957,931
|
|||||||||
|
Payables from repurchase agreements and security lending
|
27,923,617
|
22,013,866
|
12,966,725
|
|||||||||
|
Due to banks and correspondents
|
5,913,487
|
7,111,461
|
8,801,911
|
|||||||||
|
Bonds and notes issued
|
16,181,568
|
17,688,735
|
16,851,889
|
|||||||||
|
Total sources of funds
|
191,678,993
|
195,657,543
|
184,578,456
|
|||||||||
|
Core deposits as a percentage of total deposits
|
79.3
|
%
|
80.3
|
%
|
73.4
|
%
|
||||||
|
Core deposits as a percentage of total sources of liquid funds
|
58.6
|
%
|
61.1
|
%
|
58.0
|
%
|
||||||
BCP Stand-alone is required to keep deposits with the BCRP as legal reserves. The amount of required deposits in the BCRP is determined as a percentage of the deposits and
other liabilities owed by BCP Stand-alone to its clients. The current requirement is approximately 6.01% of BCP Stand-alone’s Soles-denominated deposits and approximately 34.55% of BCP Stand-alone’s US Dollar-denominated deposits as of December
31, 2021. For further detail, see “ITEM 4. INFORMATION ON THE COMPANY – 4.B Business Overview - (6) Supervision and Regulation – 6.2 Subsidiaries – 6.2.1 Peru.”
The following table presents our deposits at the BCRP and our investments in the BCRP’s certificates of deposit at the dates indicated:
|
As of December 31,
|
||||||||||||
|
2020
|
2021
|
2022
|
||||||||||
|
(in thousands of Soles, except percentages)
|
||||||||||||
|
Funds at the BCRP
|
||||||||||||
|
Deposits
|
26,003,415
|
25,359,565
|
24,160,723
|
|||||||||
|
Certificates of deposit
|
17,237,157
|
9,448,574
|
7,019,479
|
|||||||||
|
Total funds at the BCRP
|
43,240,572
|
34,808,139
|
31,180,202
|
|||||||||
|
Total funds at BCRP as a percentage of total deposits (*)
|
30.5
|
%
|
23.4
|
%
|
21.2
|
%
|
||||||
(*) Total deposits exclude interest payable.
As of December 31, 2022, we had uncommitted credit lines, including long-term facilities that are mainly used for project financing, of which no significant amount was drawn
down. We have also received long term funding from COFIDE and other international lenders. These funding sources have average annual rates (including Libor) ranging from 2.23% to 9.45% in soles and from 0.40% to 17.04% in foreign currency. As
of December 31, 2022, we maintain S/8,801.9 million in due to banks and correspondents, secured by the collection of BCP Stand-alone’s (including its foreign branches) instructing correspondent banks to make a payment of a certain amount to a
beneficiary that is not an FI. For further details, see Notes 15(a), (b) and (c) to the consolidated financial statements. As of December 31, 2020, 2021 and 2022, borrowed funds due to banks and correspondents, including payable interests,
amounted to S/5,978.3 million, S/7,212.9 million and S/8,937.4 million, respectively.
In addition, another source of funds arises out of issuing bonds and notes. The following table presents our principal issued bonds from 2020 to 2022:
|
Years ended December 31,
|
||||||||||||
|
2020
|
2021
|
2022
|
||||||||||
|
(in millions of Soles)
|
||||||||||||
|
Issued bonds
|
||||||||||||
|
Senior notes
|
1,920
|
173
|
114
|
|||||||||
|
Corporate bonds
|
-
|
-
|
87
|
|||||||||
|
Subordinated bonds
|
3,312
|
2,134
|
-
|
|||||||||
|
Total issuance
|
5,232
|
2,307
|
201
|
|||||||||
In June 2022, BCP Stand-alone issued US$30.0 million (equivalent to S/114.0 million) of senior notes due in 2027, with a fixed annual interest rate of 5.05%.
Additionally, in January 2022, Mibanco Colombia S.A. issued US$112.5 million (equivalent to S/87.0 million) of corporate bonds due in 2025, with a fixed annual interest rate
of 9.00%.
Not applicable.
The following list sets forth the most important trends, uncertainties and events that are reasonably likely to have a material effect on our revenues, income from
continuing operations, profitability, liquidity, or capital resources, or that would cause reported financial information not necessarily to be indicative of future operating results or financial condition. Some of these trends, uncertainties
and events are beyond our ability to influence.
For further information about these and other key risks and uncertainties for the Group, please see “ITEM 3. KEY INFORMATION – 3.D Risk Factors.”
Macroeconomic and Social Context
Timely and complete achievement of our strategic targets and aspirations may be adversely affected by reduced revenue-generating capacities of some of
our core businesses if macroeconomic and social risks crystallize. These risks include but are not limited to slow growth in Peru’s GDP and private consumption, the effects of tightened monetary policy, continuing social unrest and resulting
protests and destructive natural phenomena.
In a context of global economic slowdown and elevated uncertainty around key economic variables, we expect Peru’s GDP will grow between 1.8% and 2.2% in
2023 due to the lagged effect of monetary tightening on activity, lower purchasing power due to cumulative inflation of approximately 20% from December 2021 to December 2023 and contraction of both public and private investment. We anticipate
that private consumption will grow more slowly than in 2022 as the post-COVID-19 rebound fades. We also expect that the social unrest of January and February and the heavy rain and floods of March will serve as drags on GDP in the first quarter
of the year. Regarding monetary policy, in January 2023, the BCRP raised its interest rate by 25 basis points to 7.75%, a new historical high, and surprised markets by maintaining this rate In its February meeting. According to the BCRP, this
pause does not imply the end of the hiking cycle. Hence, future rate hikes will be conditional on new information regarding inflation and its determinants, including the macroeconomic effects of recent social conflicts.
For further information regarding GDP expectations from the countries where Credicorp operates, see “ITEM 4. INFORMATION ON THE COMPANY".
Since December 2022, Peruvians have lived with political uncertainty due to the protests caused by social unrest after Dina Boluarte took over as the president of Peru.
Protests primarily focused on the southern regions of the country where Castillo still has an important base and followers. The protests have resulted in at least 50 reported deaths and two Mibanco agencies were set on fire. BCP Stand-alone and Mibanco have granted payment facilities to their customers in the geographical areas and economic sectors affected by the protests. As of the end of March, these
payment facilities did not represent a material impact on Credicorp’s operations. Local authorities expect the protests to continue in the coming months to a lesser extent and, therefore, we estimate
that future protests may have repercussions repercussion in loan disbursement and in our customers payment behavior.
For further information about political tension, social unrest and protest, please see “ITEM 5. OPERATING AND FINANCIAL REVIEW AND PROSPECTS – 5.A
Operating results – Political environment”.
In March 2023, the National Meteorological and Hydrological Service of Peru (SENAMHI by its Spanish initials) reported the presence of Cyclone Yaku off the northern coast of Peru and stated that this natural phenomenon could become an unusual Niño phenomenon on the Peruvian coast. Since March 8, the coast of Peru has been hit by heavy rains,
causing rising and overflowing rivers, flooding of villages and dragging of crops and activation of river ravines. Consequently, multiple casualties, missing persons, damage to livestock, loss of property, damage to homes and livelihoods
(commerce and tourism) have been reported. As of the end of March, these payment facilities did not represent a material impact on Credicorp’s operations. The rains are expected to continue and so it is too early to measure the impacts on our
borrowers’ ability to repay the amounts that they owe to us under existing loans or their capacity to borrow from us in the future.
Market conditions
Recent regulatory developments in Peru may adversely affect the evolution of our loan portfolio, our NIM, the quality of our loan portfolio and our operating efficiency.
On January 13, 2023, Law No. 31670 was published. This law allows Peruvians access to a minimum retirement pension and expands the voluntary contribution alternatives for
members of the Private Pension Fund Administration System (PPS). The law seeks to set a retirement target by establishing that (i) affiliates may set a target of provisional saving; (ii) a minimum pension will be decided by the affiliates,
being an amount not less than the basket of basic goods determined by the National Institute of Statistics and Informatics, and (iii) the affiliates may use the excess of the individually funded account.
On October 7, 2022, the BCRP approved, through Circular No. 0024, a regulation governing interoperability of payment services provided by providers, agreements and payment
systems. This regulation covers mobile wallet applications such as Yape. The circular stipulates that mobile wallets Yape and PLIN should comply with interoperability standards by no later than March 31, 2023. As of March 31, 2023 Credicorp had
fully complied with the BCRP requirements regarding the interoperability. In July 2023, all other financial institutions that would like to integrate to this interoperability initiative. There will be added a feature of interoperable QR codes.
For Credicorp this represents an opportunity because interoperability will accelerate the financial inclusion in Peru, which in turn helps to improve
the financial health of citizens and help to reduce poverty. Moreover, the payments ecosystem in Peru, where Yape is the main player, will continue growing. Finally, Yape offers many more features in addition to instant payments (mobile
top-ups, payments of services, promos, low-ticket investments, micro loans, and more to come), and as such is better prepared to attract new customers and access a larger universe of potential clients.
The challenges, or risks that arise for Yape with interoperability are: (1) the increased competition, since other players will have access to Yape
clients ecosystem where, as explained above, Yape is well prepared to compete, and (2) increased operational risk, given quality of service and stability of operations will depend on more players / service providers at the ecosystem.
The evolution of the above macroeconomic factors and market conditions may impact Credicorp’s results and operations in the following ways:
| • |
Loans: Lending activity is expected to slow compared to 2022 due to lower expectations of macroeconomic growth.
|
| • |
NIM: While BCRP’s monetary policy will depend on the inflation environment and its determinants, we expect high levels of market interest rates to remain through the third quarter of this year. Moreover, Credicorp will continue to
focus on growing in retail segments and maintaining its competitive funding base. As a result, we expect to maintain an upward trend in NIM through 2023.
|
| • |
Portfolio quality and cost of risk: We expect that the cost of risk of Credicorp’s loan portfolio will increase to slightly above pre-pandemic levels in 2023. This trend reflects (i) higher uncertainty related to recent political,
social and climate events; (ii) an on-going trend back to pre-pandemic figures at each segment’s level; and (iii) the shift of our loan portfolio mix towards retail segments.
|
| • |
Operating efficiency: In 2023, we will continue to invest in digital transformation and disruptive initiatives, which prepare us to adapt fast in our changing environment and strengthen our long-term competitiveness.
|
In a medium-term perspective, we review our strategic initiatives on a constant basis, and are well prepared to implement tactic moves to rapidly adapt accordingly to navigate
our changing environment:
| • |
We are conscious that we have a responsibility to positively impact the communities in which we operate. We are committed to collaborating to create a more sustainable and inclusive economy, to improve the financial health of the
population and to empower our customers and employees to thrive. In order to accomplish this commitment, we are leveraging new digital capabilities. Our digital transformation and innovation strategy is key to continue creating value
for all of our stakeholders. We continue to invest in its technology and digital capabilities across its franchises, including digital platforms and channels and cloud-based solutions.
|
| • |
Universal Banking: Maintaining our clients’ experience and operating efficiency remain our priorities.
|
| o |
At BCP Stand-alone, we will continue to focus on client experience while optimizing operating efficiency by leveraging data analytics to continue evolving our segmentation, understanding of clients’ behavior, and evolving an integral
value proposition for each segment.
|
| o |
At Yape, we will continue to focus on growth and monetization. Yape continue growing its active customers base, level of usage per active customer and the number of user generating income, where the initiative is expected to be cash
flow neutral by 2024. Interoperability offers an upside for the medium term growth and monetization trend in Yape, as it will accelerate financial inclusion in Peru. Yape is developing new features to better serve our customers, and
aspires to become a super app.
|
| • |
Microfinance: We seek to consolidate our presence at the base of the pyramid as it continues to accompany client growth.
|
| o |
At Mibanco Peru, we will continue to evolve our hybrid model by leveraging technological and analytical capabilities to strengthen our relationships with clients.
|
| o |
At Mibanco Colombia, we aspire to implement and consolidate the hybrid model to optimize productivity, enhance customer experience, which should help to improve profitability.
|
| • |
Insurance and Pensions:
|
| o |
At Pacífico, we will continue to focus in customer experience, leveraging digital capabilities and mainly Credicorp’s distribution channels to foster growth.
|
| o |
At Prima AFP, we will continue to be proactive in collaborative efforts to develop proposals to reform the regulatory framework and create awareness programs. The objective is to evolve toward an inclusive and sustainable pension
system, which continues to serve as a mechanism to channel savings to long-term investment and contributes to our economy’s growth.
|
| • |
Investment Banking & Wealth Management: We have identified key levers to reach our long-term profitability targets. We will focus on strengthening the Asset Management and Wealth Management businesses to drive our growth in a new
scenario in the region.
|
The audited annual consolidated financial statements have been prepared according to International Financial Reporting Standards (IFRS), issued by the International
Accounting Standards Board (IASB).
The preparation of the consolidated financial statements in accordance with IFRS requires that management make estimates and assumptions that affect the reported figures of
assets, liabilities, income, and expenses and disclose significant events in the notes to the consolidated financial statements.
Our estimates and assumptions are continually evaluated and are based on historical experience and other factors, including the reasonable expectation of future events that
are believed to be reasonable under current circumstances. The final results could differ from these estimates; however, Management expects that the variations, if any, will not have a significant effect on the consolidated financial
statements.
Key areas involving a high degree of judgment with respect to our estimates and assumptions in the consolidated financial statements include:
| (1) |
the calculation of the impairment of the portfolio of loans and financial investments,
|
| (2) |
the measurement of the fair value of the financial investments,
|
| (3) |
the assessment of the impairment of the goodwill,
|
| (4) |
The calculation of the technical reserves for insurance claims and premiums,
|
| (5) |
the measurement of the fair value of derivative financial instruments, and
|
| (6) |
the valuation of share-based payment plans.
|
Other estimates include the estimated useful life of intangible assets, property, furniture and equipment, and deferred income tax assets and liabilities.
We believe that our judgments, estimates and assumptions are appropriate under the circumstances and that our audited annual consolidated financial statements fairly
present, in all material respects, the financial positions of Credicorp as of December 31, 2021, and 2022 and the results of our operations and cash flows for the years ended December 31, 2020, 2021 and 2022, in accordance with IFRS.
For more information about our critical accounting estimates and judgments, see: “Note 3 Significant accounting policies, a) Basis of presentation, use of estimates and
changes in accounting policies” to the consolidated financial statements; “Note 34.1 Credit Risk” and “Note 34.2 Market Risk Management” for a discussion of risk and sensitivity of certain items; “ITEM 3. KEY INFORMATION – 3.D Risk Factors” of
this Annual Report on Form 20-F; and “ITEM 5. OPERATING AND FINANCIAL REVIEW AND PROSPECTS” of this Form 20-F for more information.
(1) Board of Directors
The following table sets forth information about the Directors of Credicorp Ltd. at the end of 2022:
|
Name
|
Position
|
Years served as a Director (1)
|
Birth Date
|
|
|
Luis Enrique Romero Belismelis
|
Chairman
|
13
|
09/01/1961
|
|
|
Raimundo Morales Dasso
|
Vice Chairman
|
14
|
11/09/1946
|
|
|
Fernando Fort Marie
|
Director
|
40
|
01/23/1940
|
|
|
Patricia Lizarraga Guthertz
|
Director
|
5
|
07/14/1966
|
|
|
Irzio Pinasco Menchelli
|
Director
|
4
|
12/22/1965
|
|
|
Antonio Abruña Puyol
|
Director
|
2
|
04/08/1954
|
|
|
Alexandre Gouvêa
|
Director
|
2
|
02/12/1959
|
|
|
Maria Teresa Aranzabal Harreguy
|
Director
|
2
|
02/22/1963
|
|
|
Leslie Pierce Diez Canseco
|
Director
|
2
|
12/31/1948
|
(1) In Credicorp or BCP Stand-alone as of December 31, 2022.
At the Company’s 2023 Annual General Shareholders Meeting, on March 27, 2023, Credicorp Ltd.’s shareholders voted to approve the appointment of the new Board of Directors,
which will hold office for the 2023-2026 period. New board members Nuria Aliño Pérez and Pedro Rubio Feijóo succeed Fernando Fort and Irzio Pinasco, both of whom decided to retire. Additionally, seven existing directors were re-elected. For
further information on the changes to the Board of Directors since December 31, 2022, see “ITEM 4. INFORMATION ON THE COMPANY – 4. A History and development of the Company – Subsequent Events.”
Luis Enrique Romero Belismelis
Mr. Romero has served as the Chairman of the Board and Executive Chairman of Credicorp Ltd. since June 9, 2020 and has been a Director since March 31, 2017.
Through his role on the boards of various subsidiaries, Mr. Romero has gained broad insight into the Group's businesses.
He is also Chairman of the Board of Banco de Crédito del Perú since April 5, 2021 and Director since March 31, 2009.
He is a member and Chairman of the Board of Grupo Crédito S.A. since October 29, 2020, as well as a Director of Pacífico Compañía de Seguros y Reaseguros, Credicorp Perú
S.A.C., Mibanco - Banco de la Microempresa S.A., Pacífico S.A. EPS and Atlantic Security Holding Corporation.
Mr. Romero has vast experience as Head of Finance and General Manager in different companies in the consumer and services sector related to Grupo Romero. Currently, Mr.
Romero is a director of the Peruvian listed companies Inversiones Centenario S.A.A., and Alicorp S.A.A., and is also a director of various private companies, which are part of Grupo Romero.
Mr. Romero holds a bachelor's degree in Economics from Boston University (United States).
Raimundo Morales Dasso
Mr. Morales has been Vice Chairman of the Boards of Directors of Credicorp Ltd. and Banco de Crédito del Perú since March 28, 2008 and March 31, 2009,
respectively. He is also a director of Grupo Crédito S.A., Pacífico Compañía de Seguros y Reaseguros, Solución Empresa Administradora Hipotecaria S.A. and Atlantic Security Holding Corporation. Currently, he serves as Chairman of Credicorp's
Risk Committee.
He joined Banco de Crédito del Perú in 1980 and held different management positions, such as Executive Vice President of Wholesale Banking and Credit
Risk Management, as well as CEO from 1990 to 2008. Additionally, he served as Chairman of the Board of Directors and General Manager of Atlantic Security Bank (now ASB Bank Corp., a subsidiary of Credicorp). Mr. Morales led Credicorp's initial
public offering of shares on the New York Stock Exchange (NYSE) in October 1995.
He also has experience in a range of organizations, including the Peruvian Bank Association (ASBANC) and Association of AFP, and of National
Confederation of Private Business Institutions of Peru (CONFIEP), of which he served as Vice-Chairman. Prior to joining Credicorp, Mr. Morales worked for 10 years at Wells Fargo Bank in its offices in San Francisco and Miami (United States),
São Paulo (Brazil), Caracas (Venezuela), and Buenos Aires (Argentina). The last position he held at Wells Fargo was Regional Vice President.
He also serves as a member of the boards of directors of Peruvian listed companies Fosfatos del Pacífico S.A., and Cementos Pacasmayo S.A.A., as well as
of Salmueras Sudamericanas S.A., private company wich is part of Pacasmayo Group.
Mr. Morales has a bachelor's degree in Economics and Administration from the Universidad del Pacífico (Peru) and holds an MBA from Wharton Graduate
School of Finance of the University of Pennsylvania (United States).
Fernando Fort Marie
Mr. Fort has been a Director of Credicorp Ltd. since March 30, of 1999 and of Grupo Credito S.A., since October 29, 2020. He is also member of Atlantic
Security Holding Corporation Board of Directors. Mr. Fort has been Director of Banco de Credito del Peru since 1979 to 2021, except for the years among 1988 to 1990.
Mr. Fort retired from the Board of Directors of Credicorp effective in April 2023. See “ITEM 4. INFORMATION ON THE COMPANY – 4. A History and
development of the Company – Subsequent Events.”
He is a senior partner at Estudio Fort, Bertorini, Godoy & Asociados, which specializes in business advisory services. In the past he has given
advice to firms with international presence such as Pepsico, lnc., lnternational Finance Corporation (IFC), Alcatel, lnternational Telephone & Telegraph (ITT), Sheraton Hotels, Volvo Corp., Sandvik, Procter & Gamble, Crown Cork,
Chrysler Corp., among others.
He has been a member of the board of numerous other private companies in Peru. He currently acts as a member of the Boards of Inversiones Centenario
S.A.A., Hermes Transportes Blindados SAC and Fort, Bertorini, Godoy & Pollari Abogados S.A.
Mr. Fort is an attorney at law and graduated from the Pontificia Universidad Católica del Perú (Peru).
Patricia Lizarraga Guthertz - Independent Director
Ms. Lizárraga has been a member of the Boards of Directors of Credicorp Ltd. and Banco de Crédito del Perú since March 31 and March 22, 2017,
respectively. She has also been a Member of the Board of Directors of Grupo Crédito S.A. since October 29, 2020. Since June 2020, she serves as the Chairwoman of Credicorp's Audit Committee.
Ms. Lizárraga is an experienced Wall Street executive with over 25 years working in international mergers & acquisitions, capital markets, private
equity and valuation experience with Allen & Company, Donaldson Lufkin & Jenrette, and Citigroup. She is the founder and CEO of Hypatia Capital Group, since 2007, and founder and major shareholder of family group Del Ande Alimentos.
Ms. Lizárraga's board experience includes serving as both President of the Board and Chair of the Audit Committee of non-profit organizations, as well
as serving on the board of private companies. She has served as President of the Privatization Committee of Toll Roads of Peru. She is also a member of the John Hancock Fund Complex Board of Directors.
Ms. Lizárraga received her Bachelor of Arts degree from Yale University (United States) and her MBA from Harvard Business School (United States).
Irzio Pinasco Menchelli – Independent Director
Mr. Pinasco has been Director of Credicorp Ltd. and of Grupo Credito S.A. since June 5, and October 29, of 2020, respectively. He has also been a Member
of the Board of Directors of Banco de Crédito del Peru since March 28, 2018.
Mr Pinasco is a Peruvian executive with more than 30 years of experience leading companies in diverse economic areas. Currently he is Executive
Director of Acurio Restaurantes, a leader in the internationalization of Peruvian gastronomy where he served as CEO between 2006 and 2019. In addition to his extensive business and professional activities, Mr. Pinasco chaired the Organization
Committee of the Copa América football tournament held in Perú in 2004. He was founder, promoter and director of Decajon.com (2000 - 2003) and Business Director of Grupo Romero (1997 - 2000), leading the concession of Puerto de Matarani, among
other functions.
He is a Promoter/Director of Sigma Safi, a leading investment fund manager in Perú, and of Cinco Millas S.A.C.
Mr. Pinasco holds a bachelor´s degree in Economics and International Relations from Brown University (United States) and an MBA from Columbia Business
School (United States). He has also completed a specialization in Marketing for Executives at ESAN (Peru).
Antonio Abruña Puyol – Independent Director
Mr. Abruña has been a member of the Boards of Directors of Credicorp Ltd. and Grupo Crédito S.A. since June 5 and October 29, 2020, respectively. He has
also been a member of the Board of Directors of Banco de Crédito del Perú since March 31, 2021.
Mr. Abruña is a Spanish-Peruvian attorney-at-law and one of Peru's leading legal scholars. With decades of extensive experience as a legal scholar and
administrator of academic institutions, he has been instrumental in helping to shape the system of justice in Peru. Mr. Abruña has served as Rector of the Universidad de Piura (Peru) since 2018. He previously served as Rector of the university
from 2003 to 2012 where he has had a long and successful career. He participated in the creation of the Faculty of Law, for which he is a professor, and has been dean. He has held other academic and administrative positions and participated in
various projects of the university.
Mr. Abruña was part of the Special Commission appointed by the Peruvian government to designate the seven members of the National Justice Council. He
was the representative in Peru of the lstituto per la Cooperazione Universitaria (ICU). He is currently director of Universia Peru.
Mr. Abruña has a law degree from the Universidad Complutense de Madrid (Spain) and a doctorate in Law from the Universidad de Navarra (Spain).
Alexandre Gouvêa – Independent Director
Mr. Gouvea has been a member of the Boards of Directors of Credicorp Ltd. and Banco de Crédito del Perú since June 5 and June 24, 2020, respectively. He
has also been a Director of Grupo Credito S.A. since October 29, 2020. Since February 2023, he also sits on the board of Monokera, an insurtech company recently acquired in Colombia by Credicorp's Corporate Venture Capital Krealo. Currently, he
is Chairman of the Compensation and Nominations Committee of Credicorp and Grupo Crédito S.A.
Mr. Gouvea has 30 years of international experience at McKinsey & Co. He specializes in providing advice to financial services clients. Mr. Gouvea
is an expert in retail banking and insurance (including its technological transition and digital transformation). He has provided financial services in Latin America and built the Organizations Practice and the Recovery and Transformation Unit
of McKinsey & Co. He was also previously a director of McKinsey & Co. Mr. Gouvea served as a member of the board of directors of leading publicly listed Brazilian retailers, Lojas Renner between 2019 and January 2023. He also spent over
8 years on the board of nonprofit, Habitat for Humanity lnternational.
Mr. Gouvea has a degree in Mechanical Engineering from Universidade Federal do Rio de Janeiro (Brazil) and has an MBA from UCLA's Anderson School of Management (United
States).
Maria Teresa (Maite) Aranzabal Harreguy - Independent Director
Mrs. Aranzábal has been a member of the Boards of Directors of Credicorp Ltd. and Banco de Crédito del Perú since June 5 and June 24, 2020, respectively. She has also been a
Director of Grupo Crédito S.A. since October 29, 2020. Currently, she is Chairwoman of the Sustainability Committee of Credicorp and Grupo Credito S.A.
Mrs. Aranzábal is a highly accomplished Spanish executive with decades of experience in advising leading global public and private companies as well as in senior executive
roles with responsibilities for strategy, business development and international expansion. Throughout her international career, she has worked across a variety of sectors, spanning retail banking, retail, fashion, consumer goods and real
estate. She brings relevant experience from serving on the boards of public and private companies as well as non-profit organizations.
She began her career at McKinsey & Co. in Spain and Argentina, where she consulted with clients in various industries, including retail banking. She
then joined Grupo Cortefiel, a family-owned retailer, where she successfully led business development, strategy and international growth. She also collaborated with Advent lnternational, a private equity firm, as retail expert, and was later in
charge of the turnaround of KA lnternational (a retail business, with € 40 million in annual sales).
Mrs. Aranzábal currently leads Alir Consulting and Trade, her own consulting company, which specializes in retail and real estate. She is also a member of the Board of
Directors of the Hijos de Rivera Corporation and Vice President of the Board of Trustees of the Novia Salcedo Foundation.
Mrs. Aranzábal has a degree in Business Administration from ICADE (Spain), and an MBA from The Wharton School of the University of Pennsylvania (United States).
Leslie Pierce Diez Canseco
Mr. Pierce has been a member of the Board of Directors of Credicorp Ltd. and Grupo Crédito S.A. since October 16 and October 29, 2020, respectively. He
has served as a Member of the Board of Directors of Banco de Crédito del Perú since March 31, 2021, and of Atlantic Security Holding Corporation since April 30, 2021.
Mr. Pierce has served in executive leadership positions, primarily of Peruvian companies, for almost 40 years. He served as CEO of Alicorp S.A.A.,
Peru's largest consumer goods company with operations throughout Latin America, from 1991 to 2011. Prior to that, Mr. Pierce served as a Vice Minister of Commerce in the Ministry of Economy and Finance of Peru from 1983 to 1984.
Mr. Pierce currently serves as a Director in a number of private businesses, including Compañía Latinoamericana de Radiodifusion S.A., Ceramica Lima
S.A., Transber S.A.C, lnka Crops. S.A, Empresa Siderúrgica del Perú S.A.A., HV Contratistas S.A., Redondos S.A., Inversiones Agrícolas Caña Brava, Maquinarias S.A., Corporacion Primax S.A., Canvia and Negocios Industriales Real Nirsa S.A.
(Ecuador). He also participates in philanthropic organizations such as Vida Peru, Banco de Alimentos del Peru and Crea+.
Mr. Pierce holds a bachelor's degree in Economics from Pontificia Universidad Católica de Peru (Peru) and a post-graduate degree in Economics from
Pontificia Universidad Católica de Chile (Chile).
Corporate Secretary
Conyers Corporate Services (Bermuda) Limited serves as Credicorp’s Corporate Secretary. Mr. Guillermo Morales Valentin is Credicorp’s Deputy Secretary.
(2) Senior Management
Credicorp believes that a unified financial group with a coordinated strategy is best able to take advantage of growth in the Peruvian economy and achieve synergies from
cross-selling financial services and products (such as through BCP’s extensive branch network). Pursuant to Credicorp’s Bye-laws, the Board of Directors has the power to delegate its authority to oversee the day-to-day management of the company
to one or more Directors or officers.
The following table sets forth the name, position(s), and principal Credicorp entities for each member of our senior management:
|
Position(s) (1)
|
Name
|
Entity(ies)
|
|
Executive Chairman
|
Luis Romero B.
|
Credicorp
|
|
Chief Executive Officer
|
Gianfranco Ferrari
|
Credicorp
|
|
Chief Risk Officer
|
Reynaldo Llosa
|
Credicorp, BCP Stand-alone
|
|
Chief Financial Officer
|
Cesar Rios
|
Credicorp, BCP Stand-alone
|
|
Chief Operating Officer
|
Alejandro Perez-Reyes
|
Credicorp
|
|
Chief Innovation Officer
|
Francesca Raffo
|
Credicorp, BCP Stand-alone
|
|
Head of Universal Banking (Credicorp), CEO (BCP Stand-alone)
|
Diego Cavero
|
Credicorp, BCP Stand-alone
|
|
Head of Microfinance (Credicorp), CEO (Mibanco)
|
Javier Ichazo
|
Credicorp, Mibanco
|
|
Head of Insurance & Pensions (Credicorp), CEO (Grupo Pacífico)
|
Cesar Rivera
|
Credicorp, Grupo Pacífico
|
|
Head of Investment Banking and Wealth Management (Credicorp), CEO (Credicorp Capital)
|
Eduardo Montero
|
Credicorp, Credicorp Capital
|
|
Chief Corporate Audit Officer
|
Jose Esposito
|
Credicorp, BCP Stand-alone
|
|
Chief Compliance and Ethics Officer
|
Barbara Falero
|
Credicorp, BCP Stand-alone
|
|
Head of Legal
|
Guillermo Morales
|
Credicorp
|
|
Head of Talent Management
|
Ursula Alvarez
|
Credicorp
|
|
Head of Corporate Affairs
|
Enrique Pasquel
|
Credicorp
|
| 1. |
At Credicorp or in any subsidiary as of April 23, 2023.
|
Gianfranco Ferrari
Mr. Ferrari was born in 1965. Mr. Ferrari has been appointed as CEO of Credicorp Ltd. in January 2022. Previously, he held the position of Deputy CEO and Head of Universal
Banking of Credicorp Ltd. and was the CEO of Banco de Credito del Peru from April 2018. He has worked at Credicorp Ltd. since 1995.
Mr. Ferrari’s extensive and diverse experience includes strategic roles as Head of Corporate Banking & Corporate Finance, Head of Retail Banking & Wealth Management
at Banco de Credito del Peru, and CEO of BCP Bolivia from 2005 to 2008. He led the acquisition of Edyficar in 2009 and Mibanco in 2014. In 2015, he began leading our Digital Transformation Strategy. He is also member of the Board of BCP
Stand-alone and BCP Bolivia.
Mr. Ferrari holds a degree in Business Administration from Universidad del Pacífico (Peru) and has an MBA from Kellogg Graduate School of Management, Northwestern University
(United States).
Reynaldo Llosa
Mr. Llosa was born in 1961. Mr. Llosa is the Chief Risk Officer of Credicorp Ltd. and Banco de Credito del Peru since January 2012. Previously, Mr. Llosa held various
positions at BCP Stand-alone as Head of Risk, Head of Middle-Market Banking, and Head of Corporate Banking. Currently, he is member of the Board at Mibanco and Banco de Credito de Bolivia.
Mr. Llosa holds a bachelor’s degree in Business Administration from St. Mary's University in San Antonio, Texas (United States), and an MBA with specialization in Finance from Kellogg Graduate
School of Management, Northwestern University (United States).
Cesar Rios
Mr. Rios was born in 1967. Mr. Rios has served as the CFO of Credicorp Ltd. and Banco de Credito del Peru since April 2018. He has worked at Credicorp since 1993, when he
joined as a Corporate Finance associate. In 1997, he was appointed as the CFO and COO of Banco Capital in Salvador, following Credicorp’s acquisition. In 2003, Mr. Rios re-joined BCP Stand-alone, where he worked in strategic roles such as Head
of Credit and Operating Risk in the Risk Management Unit, Head of Collections for Retail Banking, and Head of Corporate Strategy, which includes corporate strategy, internal consulting, mergers and acquisitions, and business incubation. In
2013, he became Head of Financial Planning and Control at BCP.
Currently, Mr. Rios is a board member of several of Credicorp’s subsidiaries, including Mibanco, Solución Empresa Administradora Hipotecaria, among others.
Mr. Rios holds a bachelor’s degree in engineering from Pontificia Universidad Católica (Peru); a master’s degree from ESAN Escuela de Administración de Negocios para
Graduados (Peru); and an MBA from the Massachusetts Institute of Technology’s Sloan Fellows Program (United States).
Alejandro Perez-Reyes
Mr. Perez Reyes was born in 1976. Mr. Perez Reyes is the Chief Operating Officer of Credicorp Ltd. since January 2022. Previously, he served as COO and Country Head of
Credicorp Capital Peru until December 2021. Additionally, he held the position of Investment Manager of Prima AFP, a Pension Fund where he managed US$ 10 billion in assets. He has worked in Credicorp group since 1999, where he has also been
Head of Financial Derivatives and Structured Products of Banco de Credito del Peru and Investment Manager of Credifondo SAF.
Mr. Perez-Reyes has a bachelor’s degree in Economics from the University of Lima (Peru) and an MBA from Harvard University (United States).
Francesca Raffo
Ms. Raffo was born in 1969. Ms. Raffo was appointed Credicorp’s Chief Innovation Officer in February 2022 and has also been Retail Banking Deputy CEO at BCP since June 2020.
Ms. Raffo’s successful career at BCP spans 26 years and includes heading BCP’s transformation, managing the Satisfied Customers Division, creating BCP's first Innovation
Center and leading the Marketing Services. Ms. Raffo joined BCP in 1994 as a member of the Process Reengineering pioneer team and subsequently led various strategic projects within Retail Banking.
Ms. Raffo holds a bachelor’s degree in Business Administration and an MBA in Management Information Systems, both from The American University in Washington D.C. (United
States).
Diego Cavero
Mr. Cavero was born in 1968. Mr. Cavero is the CEO of BCP and Head of Universal Banking since January 2022. Previously he was Deputy CEO at BCP focusing on Wholesale
Banking. He was named Wholesale Banking Managing Director since March 2018 and was Head of the Efficiency, Administration and Processes Division from 2017 to March 2018. In the year 2013, Mr. Cavero led the creation of the Efficiency Division
and the implementation of the Efficiency Program at BCP. He was responsible for various management positions at the Wholesale Banking Division, such as Head of Corporate Banking. Mr. Cavero oversaw the launching of BCP’s Representative Offices
in Chile and Colombia. Prior to this, Mr. Cavero was CEO of BCP Bolivia from 2008 to 2012 and served at various BCP’s Boards of Directors as well.
Mr. Cavero is currently member of BCP Bolivia Board of Directors. He started working at Credicorp Ltd. in 1994.
Mr. Cavero earned a degree in Business Administration at Universidad de Lima and holds an MBA from University of Texas, United States.
Javier Ichazo
Mr. Ichazo was born in 1969. Mr. Ichazo is the CEO of Mibanco and Head of Microfinance of Credicorp. He began his career at Banco de Credito del Peru in 1996 and held
different positions in various regions of Peru. In addition to his extensive knowledge in banking and finance, Mr. Ichazo brings his experience serving as Business Manager at Banco de Credito del Peru from 2004 to 2017.
Mr. Ichazo is the Chairman of the Board of Mibanco Colombia, and Vice Chairman of the Board of ASOMIF (Association of Microfinance Institutions of Peru or Asociación de
Instituciones de Microfinanzas del Peru).
Mr. Ichazo holds a bachelor’s degree in Economics and Administration from the University of Piura (Peru) and holds an MBA from the School of Management of the University of
Piura (Peru).
Cesar Rivera
Mr. Rivera was born in 1964. Mr. Rivera is the CEO of Pacífico Seguros since January 2020. With over 25 years of experience in the Pensions and Insurance sector, Mr. Rivera
has also held the positions of CEO at Santander Life Insurance Company in Peru, Deputy CEO at American Life Insurance Company (ALICO) at Argentina, and CEO at Pacífico Vida Life Insurance Company (August 2017).
Mr. Rivera has served as a teacher at the Universidad de Piura at the Business and Economy Faculty from 1988 to 1992 and was a member of the Board of Directors in the
Iberoamerican Foundation for Occupational Health and Safety (FISO by its Spanish initials) from 2008 to 2017. Currently, he is a member of the Boards of Directors of Prima AFP, Mibanco SA and Crediseguro Personas and Crediseguro Generales at
BCP Bolivia.
Mr. Rivera has a degree in Industrial Engineering from the Universidad de Piura and an MBA from ESAN. He also holds a Diploma in Corporate Finance from the Universidad del
Pacífico (Peru). He has studied different programs in management and technical areas, such as the Management Program at Wharton School University of Pennsylvania (United States), and the Life Insurance Program at the Swiss Insurance Training
Centre in Zurich (Switzerland).
Eduardo Montero
Mr. Montero was born in 1971. Mr. Montero is the Head of Investment Banking and Wealth Management of Credicorp Ltd. and the CEO of Credicorp Capital Ltd. since January 2019.
He has worked at Credicorp since 1994. His extensive experience in the organization includes expertise in different areas such as Corporate Finance, Business Solutions, as well as Personal Banking and Wealth Management at Banco de Credito del
Peru. He also held the position of CEO at ASB, BCP Miami and Credicorp Securities (United States).
Mr. Montero holds a bachelor's degree in economics from Lehigh University (United States), and an MBA from the Wharton School of Business at the University of Pennsylvania
(United States).
Jose Esposito
Mr. Esposito was born in 1964. Mr. Esposito has been the Chief Corporate Audit Officer of Credicorp Ltd. since January 2010. He is member of the Board of Directors of the
Institute of Internal Auditors Global, and formerly Chairman of the Financial Services Guidance Committee Board of IIA Global. Mr. Esposito has also served as Chairman of the Committee of Internal Auditors of the Latin American Federation of
Banks (FELABAN) and Chairman of the Committee of Internal Auditors of ASBANC. Currently, he is a lecturer in the Master of Finance program at the Universidad del Pacífico and Director of the specialization in Integral Risk Management.
Since 1996, Mr. Esposito has worked for various Credicorp Ltd. His last position prior to leading the Audit Division at Credicorp Ltd. was at Pacífico Peruano Suiza Companía
de Seguros y Reaseguros S.A., where he was CFO and the Controller’s Officer. He was also Vice Chairman of the Board of Directors of Pacífico Salud EPS S.A., Vice Chairman and Director of the Board of the Lima Stock Exchange, Director of Cavali
ICLV S.A. and Chairman of the Board and General Manager of Credibolsa SAB S.A.
Mr. Esposito holds a bachelor’s degree in Economics from Universidad del Pacífico, Lima (Peru); and a master’s degree in Economics from the University of Wisconsin –
Milwaukee, (United States). He also held the designation of Certified Internal Auditor (CIA) and Risk Management Assurance (CRMA) by the Institute of Internal Auditors Global (IIA); Risk and Information Systems Control (CRISC) by ISACA; and
Anti-Money Laundering Certified Associate (AML/CA) from the Florida International Bankers Association and Florida International University (United States).
Barbara Falero
Ms. Falero was born in 1972. Ms. Falero has been the Chief Compliance and Ethics Officer at Credicorp Ltd. and Banco de Credito del Peru since February 2008 and reports
directly to Credicorp Ltd.’s Board. Before her arrival at Peru, Ms. Falero was the Compliance Officer and Vice President of BCP Miami Agency. Prior to that, she worked as a regulator for the Federal Reserve Bank of Atlanta for six years in
supervision and regulation of international banks.
Ms. Falero has been the President of the Committee of Compliance Officers of ASBANC and during a three-year period, was a Member of the Advisory Committee of the Florida
International Bankers Association (FIBA). Ms. Falero has also held various other positions including as the Community Reinvestment Officer at BAC Florida Bank in Miami, Florida.
Ms. Falero holds a bachelor’s degree in Finance from Florida International University, (United States) and an MBA from St. Thomas University in Miami, Florida, (United
States).
Guillermo Morales
Mr. Morales was born in 1966. Mr. Morales has been the Head of Legal at Credicorp Ltd. since April 2018 and Head of Legal Division of BCP since January 2010. Previously, Mr.
Morales was the Manager of the Legal Advisory Area at BCP from September 2007 to December 2009, Legal Manager at Grupo Santander Peru SA from January 2003 to July 2007 and Legal Manager at Banco Santander Central Hispano Peru from April 2000 to
December 2002. He has also served as Director of Edelnor SAA, Red Eléctrica del Sur (Redesur) and Universidad de Peru SA.
Mr. Morales holds a law degree from the Pontificia Universidad Católica del Perú, (Peru), and a Master of Laws (LL.M) from the University of Texas at Austin, (United
States).
Ursula Alvarez
Ms. Alvarez was born in 1976. Ms. Alvarez has been the Head of Talent Management since 2009. She began working at BCP in 2006 as Manager of Selection in Human Development
Management. Ms. Alvarez holds a bachelor’s degree in Psychology from the University of Lima (Peru) and a master’s degree in Development from the Universidad de los Andes in Bogota (Colombia).
Enrique Pasquel
Mr. Pasquel was born in 1979. Mr. Pasquel has served as the Head of Corporate Affairs at Credicorp Ltd. since April 2018 and Head of Corporate Affairs of BCP since 2017.
Previously, between 2011 and 2017, he worked at El Comercio newspaper, where he held the positions of Deputy Opinion Editor, Politics Editor, and Deputy Editor in Chief. Before his journalist career, he was an attorney in INDECOPI, the Peruvian
antitrust agency, where he served as Commissioner of the Bureaucratic Barriers Commission and Technical Secretary of the Competition Chamber.
Mr. Pasquel holds a law degree from Pontificia Universidad Católica del Perú, (Peru), and a Master of Laws (LL.M.) from Yale Law School (United States).
The following section contains the compensations of the members of Credicorp Ltd.’s Board of Directors and senior management for 2020, 2021, and 2022:
|
As of December 31,
|
||||||||||||
|
|
2020
|
2021
|
2022
|
|||||||||
|
|
(in thousands of Soles)
|
|||||||||||
|
|
||||||||||||
|
Director’s compensation (1)
|
6,106
|
6,862
|
7,850
|
|||||||||
|
Senior Management Compensation (2)
|
||||||||||||
|
i) Remuneration
|
32,396
|
45,164
|
40,201
|
|||||||||
|
ii) Stock awards (3)
|
22,756
|
10,351
|
28,450
|
|||||||||
|
Total
|
61,258
|
62,377
|
76,501
|
|||||||||
(1) This item includes the amounts received from Credicorp Ltd. and from its subsidiaries by the nine Directors of Credicorp Ltd. as exclusive compensation for their role as Directors serving in
the Board of Directors, in the Audit Committee, in Compensation and Nomination Committee, in Sustainability Committee and in Risk Committee of Credicorp Ltd., and in the Board of Directors and in the Executive Committee of Credicorp Ltd.’s
subsidiaries; The members of the Board of Directors are listed in ITEM 6. DIRECTORS, SENIOR MANAGEMENT AND EMPLOYEES - 6.A Directors and Senior Management - (1) Board of Directors.
(2) The members of senior management according to ITEM 6. DIRECTORS, SENIOR MANAGEMENT AND EMPLOYEES - 6. A Directors and Senior Management.
(3) This item includes the related income taxes assumed by the Group. The amounts correspond to the expenses accrued in the period for the services rendered.
Credicorp and its subsidiaries do not set aside or accrue funds to provide pension, retirement, or similar benefits for the directors and other members in management”.
For further details about the compensation of Directors and Senior Management, see “ITEM 6. DIRECTORS, SENIOR MANAGEMENT AND EMPLOYEES – 6.C Board Practices”.
Board of Directors Compensation
We are not required to disclose our directors’ compensation in our home country. Moreover, we do not disclose to our shareholders, or otherwise make available our directors’
compensation to the public, information as to the compensation on an individual basis of any member of Credicorp Ltd.’s Board or of our senior management.
Board Remuneration
The remuneration of the Directors of Credicorp Ltd. and its subsidiaries is approved at their respective Annual General Meetings (AGM).
The total compensation of the Members of Credicorp Ltd.’s Board of Directors is composed of a gross annual remuneration of US$50,000 to each Director, as approved beginning
June 5, 2020; gross annual remuneration of US$40,000 to each Director who serves in the Audit Committee; and up to US$1,500 per attended session to each Director who participates in one or more of the Board Committees other than the Audit
Committee.
Additionally, the Directors of Credicorp Ltd. who also serve as Directors of its subsidiaries might receive a remuneration from such subsidiary. Those who participate in the
Board of Directors of BCP Stan-alone, the main subsidiary of Credicorp Ltd., receive a gross annual remuneration of US$130,000 each and US$1,500 for each session attended by each Director serving on its Executive Committee.
Directors received no other compensation or benefits in their capacities as directors of Credicorp Ltd. in 2022. Neither Credicorp Ltd. nor any of its subsidiaries has any
type of agreement with Credicorp Ltd.’s Directors providing for benefits upon termination of their term as Directors.
Senior Management Compensation
Our senior management’s compensation can be classified as follows:
| • |
Remuneration
|
The remuneration scheme for members of our senior management comprises a fixed remuneration and a variable remuneration. Variable remuneration has two different components:
(i) a legal component, which all employees receive based on the net profit of the Company for each fiscal year in accordance with the laws of the country of each subsidiary and (ii) an incentive-based component, which is determined based on the
achievement of objectives and goals established for the year. These remunerations are approved by the Corporate Compensation Committee.
| • |
Stock awards
|
In March of each year, Credicorp grants common shares to members of its senior management as part of the long-term compensation program for these senior managers. These
granted shares are vested over the three subsequent years, with up to 33.3% of the granted shares vesting per year. Credicorp assumes the payment of the related income-tax on behalf of its employees, which depends on the country of residence
and the annual compensation of the employee.
The shares used for grants to members of senior management are obtained through repurchases in the market. We present below the treasury stock granted to Credicorp’s senior
management and employees during the years 2020, 2021, and 2022, and granted but unvested shares as of December 31, 2020, 2021, and 2022.
|
Year ended December 31,
|
As of December 31,
|
|||||||||||||||||||||||
|
2020
|
2021
|
2022
|
2020
|
2021
|
2022
|
|||||||||||||||||||
|
Granted shares in units
|
Granted but unvested shares in units
|
|||||||||||||||||||||||
|
Senior Management
|
36,806
|
15,142
|
32,715
|
64,204
|
48,488
|
55,078
|
||||||||||||||||||
|
Employees
|
139,124
|
73,365
|
83,911
|
229,402
|
181,035
|
173,299
|
||||||||||||||||||
|
Total
|
175,930
|
88,507
|
116,626
|
293,606
|
229,523
|
228,377
|
||||||||||||||||||
Board Structure
Credicorp’s management is the responsibility of its Board of Directors, which, pursuant to Credicorp’s Bye-laws, is composed of nine members. As of April 29, 2023, five
Directors are independent. Directors may be, but are not required to be, shareholders. Directors are elected, and their remuneration is determined, at the Annual General Meeting of Shareholders. Directors hold office for three-year terms. Current
Directors were elected at the Annual General Meeting of Shareholders held on March 27, 2023 and will hold office until the Annual General Meeting of Shareholders in 2026. See “ITEM 4. INFORMATION ON THE COMPANY
– 4. A History and development of the Company – Subsequent Events.” The Board of Directors has the power to appoint any person as a Director to fill a vacancy as a result of the death, disability, disqualification, or resignation of any
Director for the remainder of such Director’s term. Pursuant to Credicorp’s Bye-laws, the required quorum for business to take place during a Board meeting is a simple majority of the Directors. A resolution in writing signed by all directors
will be valid as if it had been passed at a Board meeting duly called and constituted. For further details, see “ITEM 6. DIRECTORS, SENIOR MANAGEMENT AND EMPLOYEES – 6.A Directors and Senior Management”.
Board Decision-making
For the purposes of complying with the Bermuda Government’s Economic Substance regulations, the Board of Directors decided to limit its decisions to matters pertaining to the
strategy, objectives, and goals of the Company, as well as main action plans and policies, risk control and management, annual budgets, business plans and control of their implementation, supervision of main expenses, investments, and
acquisitions and dispositions, among other decisions of a “passive” nature related to the Company, beginning in October 29, 2020.
Following these changes, the Board of Directors of Grupo Crédito S.A., a subsidiary of Credicorp, has the authority to make “active” decisions pertaining to Credicorp’s
subsidiaries, such as making relevant strategic or management decisions, incurring expenditures on behalf of affiliates, coordinating group activities, and providing credit facilities to its affiliates.
Board Committee Structure
The Boards of Directors (and Board Committees) of Credicorp and Grupo Crédito S.A. are composed of the same individuals and the management structure in both companies has been
standardized. Credicorp’s and Grupo Crédito S.A.’s Boards of Directors, acting on the recommendation of the Compensation and Nominations Committee, decide on the appointment, ratification or removal of committee members. Directors who are members
of committees are appointed to an initial term of up to three-years and maintain such appointments only while being a member of the Board. Regarding Board Committees, the Board of Directors of each of Credicorp and Grupo Crédito S.A. designates a
chairperson among its members and approves the respective charters.
On February 5, 2020, the Board of Directors agreed to simplify the structure of its committees, reducing the number of committees from seven to four. As a result, the
Executive Committee and the Investment Committee were eliminated, and the Compensation Committee and the Nominating Committee were integrated.
On June 3, 2020, the Board of Directors approved new criteria to define which Directors are categorized as independent. International references for best practice were
utilized to improve and broaden the independence criteria. The new scope can be found in Credicorp’s Corporate Governance Policy, which is available on Credicorp’s web page.
For the purposes of complying with the Bermuda Government’s Economic Substance regulations, Credicorp’s Board of Directors decided to limit its decisions to “passive” matters
related to the Company, beginning on October 29, 2020. For further details, see “ITEM 6. DIRECTORS, SENIOR MANAGEMENT AND EMPLOYEES – 6.C Board Decision-Making”.
On December 17, 2020, the Board of Directors of Credicorp approved an initiative to broaden the scope of the Corporate Governance Committee, which was renamed to
“Sustainability Committee” to reflect its goal to lead and supervise Credicorp’s Sustainability program. For further information, see “ITEM 4. INFORMATION ON THE COMPANY – 4.B Business Overview – (1) Credicorp Overview – Our ESG Approach.”
Credicorp’s Board of Directors has established the following Committees:
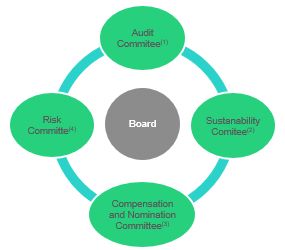
| (1) |
The Audit Committee was created on October 31, 2002.
|
| (2) |
The Corporate Governance Committee was created on June 23, 2010. On December 17, 2020, it expanded its functions and was renamed as the Sustainability Committee.
|
| (3) |
The Compensation and Nominations Committee was formed on June 5, 2020, as a result of the integration of the Compensation Committee (created on January 25, 2012) and the Nominations Committee (created on March 28, 2012).
|
| (4) |
The Risk Committee was created on March 28, 2012.
|
(1) Audit Committee
The Audit Committee membership is composed of three Directors from Credicorp (although, extraordinarily, the Audit Committee has two independent directors during a transition
period after the recent appointment of a new Board of Directors, which will appoint the new members of the Audit Committee at their next meeting, which will be held on April 27, 2023). The Committee must include at least one member who is
considered to be a financial expert and at least one member should be a woman. The Chairman must not be a member of the Committee. All members of the Committee must be independent, according to the definition of independence set forth by Rule
10A-3 under the Securities Exchange Act of 1934 (the “Exchange Act”). In order to be considered independent, an Audit Committee member must not (i) accept from Credicorp or any of its subsidiaries, directly or indirectly, any consulting, advisory
or other compensatory fee, other than the compensation paid to him or her in his/her capacity as a Director with the exception of retirement plans that meet the conditions established by the SEC; nor (ii) be an affiliated person of Credicorp or
its subsidiaries (that is, they must not own or control, directly or indirectly, more than 10% of the Company's voting shares and they must not be an executive officer of Credicorp, according to Rule 10A-3 under the Exchange Act and the U.S.
SEC).
The Committee has the purpose of carrying out the supervision, monitoring and independent review of:
| • |
The processes for submission of the financial and accounting information of Credicorp and subsidiaries (hereinafter “Credicorp” or “the Corporation”);
|
| • |
The internal control procedures of Credicorp and subsidiaries; specifically, the financial reporting internal control system;
|
| • |
The audits conducted on the financial statements of Credicorp and subsidiaries;
|
| • |
The completeness of the financial statements of Credicorp and subsidiaries;
|
| • |
The procedures for the receipt, retention and treatment of complaints regarding accounting, internal accounting controls and auditing matters, through Credicorp’s Complaint System; and
|
| • |
The appointment of the independent auditor and the internal auditor of the Corporation.
|
The Audit Committee safeguards the interests of investors and oversees compliance with the rules of the SEC and other regulatory entities.
The Audit Committee should act as supervisor of Credicorp's financial information system, helping to ensure that:
| • |
Management implements an adequate internal control system; in particular, the financial reporting internal control systems;
|
| • |
Appropriate procedures to objectively and regularly assess the Corporation's internal control system; and
|
| • |
External auditors, through their own assessment, review the accounting and financial policies applied in the preparation of the Corporation's financial statements.
|
Furthermore, the Committee must facilitate communication among the external auditors, general managements of Credicorp and subsidiaries, the Internal Audit Division of BCP, in
charge of the internal audit duties of Credicorp, hereinafter, the “Internal Audit Division”, and the Board of Directors of Credicorp.
There are currently two members on the Audit Committee: Ms. Patricia Lizarraga Guthertz (financial expert, independent, Chairwoman since June 9, 2020, and Member since April
26, 2017) and Ms. Maria Teresa Aranzabal Harreguy (independent, member of the Audit Committee since June 9, 2020). On June 9, 2020, Mr. Raimundo Morales Dasso was named advisor to this committee. In 2022, Credicorp’s Audit Committee held fourteen
meetings.
The Board of Directors has also assigned the Audit Committee the responsibility of overseeing the audit committees at all of Credicorp’s subsidiaries, to the extent permitted
by local regulations. Credicorp’s Audit Committee therefore functions as the statutory audit committee for all Credicorp subsidiaries, with the exception of Credicorp Capital Colombia, Credicorp Holding Colombia, Credicorp Capital Chile, ASB Bank
Corp. (formerly ASB), Mibanco Colombia (formerly Bancompartir), BCP Bolivia and ICBSA, which are bound by special audit committee requirements set by local regulators. The Audit Committee receives periodic information from the chief audit
executive for all of Credicorp’s subsidiaries, including Credicorp Capital Colombia, Credicorp Holding Colombia, Credicorp Capital Chile, ASB Bank Corp., Mibanco Colombia, BCP Bolivia and ICBSA. Therefore, in practice, Credicorp’s Audit Committee
oversees all of its subsidiaries’ systems of internal control. For further information, please refer to "Item 16G. A The New York Stock Exchange – Corporate Governance.”
(2) Sustainability Committee
On December 17, 2020, the Board of Directors renamed the Corporate Governance Committee as the Sustainability Committee. Credicorp’s Sustainability
Committee is comprised of five Directors from Credicorp. At least two members should be independent: one of them chairs the Committee, and one should be a woman.
The current members of the Sustainability Committee include Mrs. Maria Teresa Aranzabal (Chairwoman, independent), Mr. Antonio Abruña (independent), Mrs. Patricia Lizarraga
(independent director), and Mr. Leslie Pierce (non-independent). In 2022, Credicorp’s Sustainability Committee held five meetings.
The Sustainability Committee is responsible, among other functions, for (i) reviewing Credicorp's Sustainability and ESG strategy and initiatives and following up its most
relevant activities, including the Sustainability program; (ii) proposing to the Board of Directors and ensure the execution of good practices and sustainability and corporate governance policies to be implemented throughout the Company; (iii)
supervising the development of the strategic initiatives of the Corporate Compliance and Ethics Division, including assessing performance of said Division as well as reviewing its Strategic Plan and objectives, annual work plan and periodic
reports, and changes in policies; (iv) supervising the operation of the complaints system; (v) ensuring the adequate attention to conflicts of interest or ethics of Directors and senior executives, as well as transparency in relationships with
related parties; and (vi) proposing to the Board of Directors the independence criteria of the Directors and the members of the Audit Committee and reviewing them periodically to ensure their validity over time.
(3) Compensation and Nominations Committee
Until June 5, 2020, Credicorp's Board of Directors had separate committees for Compensation and Nominations. These committees were subsequently combined to form the
Compensation and Nominations Committee. Credicorp’s Compensation and Nominations Committee consists of five Directors from Credicorp. At least two members should be independent: one of them chairs the Committee, and one should be a woman.
The current members of the Compensation Committee include Mr. Alexandre Gouvêa (Chairman, independent), Mr. Luis Romero Belismelis (non-independent), Mr. Raimundo Morales
(non-independent), Mr. Antonio Abruña (independent) and Mrs. Maria Teresa Aranzabal (independent). The Compensation and Nominations Committee held eleven meetings in 2022.
Credicorp does not have a fully independent Compensation and Nominations Committee. When the Committee was created, the Board of Directors determined that the most important
criterion to select Directors to serve on the Committee was deep knowledge of the organization and its people, which, coupled with the leadership and continuity provided by senior management, ensures that the organization functions efficiently.
The Board of Directors believes that each individual on the Committee makes quality, independent judgments in the best interests of Credicorp with regard to all relevant issues and that the committee’s structure currently represents the best
possible configuration to ensure that goals are met.
The Compensation and Nominations Committee is responsible for (i) selecting and recommending to the Board of Directors the candidates to be proposed to the General Meeting of
Shareholders of Credicorp, as well as to fill any vacancies; (ii) evaluating candidates for the Board of Directors to determine if they meet Credicorp's independence criteria; (iii) proposing to the Board of Directors of Credicorp, for submission
to the General Meeting of Shareholders, the attendance fees and remuneration levels of the members of the Boards of Directors and Committees of Credicorp; and (iv) defining the general guidelines of the Compensation Policy that must be
implemented in Credicorp.
(4) Risk Committee
Credicorp’s Risk Committee’s consists of five Directors from Credicorp or its subsidiaries. At least one member must be independent, and one should be a woman.
The current members of the Risk Committee include Mr. Raimundo Morales (Chairman, non-independent), Mr. Luis Romero Belismelis (Chairman of the Board of Directors,
non-independent), Mr. Alexandre Gouvêa (independent), Mrs. Patricia Lizarraga (independent), and Mr. Pedro Rubio (non-independent Director of BCP and other subsidiaries).
The Risk Committee’s duties are: (i) acknowledging and informing Credicorp’s Board of Directors the level of compliance with the risk appetite and the level of exposure
assumed by the Group; (ii) acknowledging the relevant improvements in the comprehensive risk management of the Group; and (iii) proposing the Board the risk appetite and risk tolerance acceptable for Credicorp Ltd.
As of December 31, 2022, Credicorp had 36,968 employees (including full-time and part-time employees), as set forth in the following table:
|
As of December 31,
|
||||||||||||||||
|
2019
|
2020
|
2021
|
2022
|
|||||||||||||
|
Universal Banking
|
||||||||||||||||
|
BCP Stand-alone (1)
|
17,005
|
16,770
|
17,435
|
17,744
|
||||||||||||
|
Inversiones Credicorp Bolivia (ICBSA) (2)
|
1,802
|
1,724
|
1,632
|
1,763
|
||||||||||||
|
Microfinance
|
||||||||||||||||
|
Mibanco
|
11,553
|
10,781
|
9,878
|
9,725
|
||||||||||||
|
Mibanco Colombia (3)
|
527
|
2,076
|
2,357
|
2,665
|
||||||||||||
|
Insurance and Pensions
|
||||||||||||||||
|
Grupo Pacífico (4)
|
2,904
|
2,984
|
2,562
|
2,444
|
||||||||||||
|
Prima AFP
|
616
|
631
|
610
|
572
|
||||||||||||
|
Investment Banking and Wealth Management
|
||||||||||||||||
|
ASB Bank Corp.
|
147
|
167
|
139
|
152
|
||||||||||||
|
Credicorp Capital Ltd. (5)
|
1,216
|
1,601
|
1,652
|
1,787
|
||||||||||||
|
Others
|
||||||||||||||||
|
Grupo Crédito S.A.(6)
|
58
|
72
|
93
|
116
|
||||||||||||
|
Total Credicorp
|
35,828
|
36,806
|
36,358
|
36,968
|
||||||||||||
| (1) |
BCP Stand-alone includes employees from BCP Miami and BCP Panama.
|
| (2) |
ICBSA includes BCP Bolivia, Credibolsa, Credifondo, Crediseguro Seguros Personales and Crediseguro Seguros Generales.
|
| (3) |
Mibanco Colombia is a result of the merger of Encumbra and Bancompartir. 2019 figures only include Encumbra employees.
|
| (4) |
Does not include the employees of the acquired private hospitals. Pacífico corporate health insurance employees are not included since 2015.
|
| (5) |
Includes Credicorp Capital Colombia, Credicorp Capital Chile, Credicorp Capital Securities, Credicorp Capital USA and Credicorp Capital Peru.
|
| (6) |
Started operations in April 2018. Previously called Credicorp Peru.
|
All bank employees in Peru have the option of belonging to an employee union. The last strike of employees of BCP Stand-alone occurred in 1991 and did not
interfere with our operations. In July 2013, we were informed of the establishment of the BCP Stand-alone independent employee union, which represented 0.17% of the BCP Stand-alone’s employees at that time. Today, the employee union represents
1.06% of the total employees of BCP Stand-alone. The relationship with this union has been cordial with an agreement reached in April 2016, an arbitration award and collective bargaining agreement valid from August 2016 to December 2018, and a
last collective bargaining agreement that ran from January 2019 to December 2020. During the years 2021 and 2022, BCP and the BCP employee union have held more than 25 negotiation meetings in which we have not been able to reconcile interests;
therefore, during the current year we will seek different alternatives without affecting what is essential for each part.
Board of Directors
The following persons were beneficial owners of the listed numbers of common shares of Credicorp Ltd. (as the term “beneficial owner” is defined in Form 20-F) as of December 31, 2022.
|
Director
|
Share Ownership
|
Percentage
|
||||||
|
Luis Enrique Romero B.
|
11,551,019
|
(1)
|
12.24
|
%
|
||||
|
Raimundo Morales D.
|
-
|
-
|
||||||
|
Fernando Fort M.
|
-
|
-
|
||||||
|
Patricia Lizarraga G.
|
-
|
-
|
||||||
|
Antonio Abruña P.
|
-
|
-
|
||||||
|
Maite Aranzábal H.
|
-
|
-
|
||||||
|
Alexandre Gouvêa
|
-
|
-
|
||||||
|
Irzio Pinasco M.
|
-
|
-
|
||||||
|
Leslie Pierce D.
|
-
|
-
|
||||||
(1) Includes beneficially owned shares of the Romero family (Mr. Luis Enrique Romero B. and their family or companies owned or controlled by them).
Common shares held by our Directors and our senior management do not have voting rights different from shares held by our other shareholders. As of December 31, 2022, there
are no stock options granted by Credicorp to acquire any of Credicorp’s outstanding common shares.
Senior Management
Excluding Mr. Luis Romero Belismelis, our Executive Chairman, whose share ownership is set forth above, as of December 31, 2022, members of our senior management, as defined
in “ITEM 6. DIRECTORS, SENIOR MANAGEMENT AND EMPLOYEES” own 158,040 Credicorp shares, which represents 0.17% of our total outstanding shares. While each member of our senior management owns Credicorp shares, none (other than our Executive
Chairman) owns more than 1% of our total outstanding shares.
Employees
As of December 31, 2022, Credicorp’s employees, excluding members of our senior management, own 396,641 Credicorp shares (granted by Credicorp as part of Credicorp’s long-term
compensation program for its key employees and purchased by Credicorp’s employees), which represents 0.42% of our total outstanding shares.
As of December 31, 2022, Credicorp had issued 94,382,317 common shares, of which 14,620,846 were held by ASHC. Under Bermuda law, ASHC has the right to vote the common shares
it owns. In order to restructure long term holdings, substantially all of our common shares held by BCP Stand-alone and Grupo Pacífico were transferred to ASHC in April 2004. The table below provides details about the percentage of Credicorp’s
common shares owned by holders of 5% or more of our total common shares, as of February 14, 2023.
|
Owner
|
Common Shares
|
Percent of Class
(1)
|
||||||
|
Atlantic Security Holding
Corporation
|
14,620,846
|
15.49
|
%
|
|||||
|
Romero family (2)
|
11,551,019
|
12.24
|
%
|
|||||
|
Dodge & Cox
|
5,104,662
|
5.41
|
%
|
|||||
| (1) |
As a percentage of all issued and outstanding shares (including shares held by ASHC).
|
| (2) |
It includes common shares directly or indirectly owned by Luis Romero Belismelis and his family or companies owned or controlled by them. Mr. Romero B. is the Chairman of the Board.
|
Voting rights of major shareholders are not different from voting rights of other shareholders. Each share has right to one vote, including the shares owned by Atlantic
Security Holding Corporation.
Approximately 9.92% of Credicorp’s total issued and outstanding common shares are currently held in 3,837 individual accounts with Cavalli, a Peruvian security clearing
company.
As of December 31, 2022, Credicorp had 79,533,094 floating common shares (excluding the 14,620,846 shares held by ASHC and 228,377 shares held by Credicorp’s subsidiaries that
correspond to Credicorp’s long-term compensation program for its key employees). For more details regarding our treasury stock see Note 18 (b) to our consolidated financial statements. Approximately 89.50% of the 94,382,317 Credicorp’s issued
common shares were held in the United States. There were approximately fifty registered holders of Credicorp’s common shares in the United States. Because many of these common shares were held by brokers or other nominees, and because of the
impracticability of obtaining accurate residence information for all beneficial shareholders, the number of registered holders in the United States is not a representative figure of the beneficial holders or of the residence of beneficial
holders. Credicorp is neither directly nor indirectly controlled by another corporation or by any foreign government.
Under Bermuda law, Credicorp is not subject to any restrictions on transactions with affiliates, other than such restrictions as are applicable to Bermuda companies generally.
Credicorp’s Bye-laws provide that a Director may not vote with respect to any contract or proposed contract or arrangement in which that Director has an interest or a conflict of interest. Credicorp has not engaged in any transactions with
related parties except through our subsidiaries.
Credicorp’s consolidated financial statements as of December 31, 2020, 2021 and 2022 include transactions with related parties, including (i) related companies such as
associates or others, (ii) its Board of Directors, (iii) its senior management, (iv) close members of the families of its Directors or members of its senior management and (v) enterprises that are controlled by these individuals or entities
through majority shareholding or their role as chairman or principal executive officer in those companies.
Transactions between the Credicorp companies and those related to Credicorp that exceed US$1 million must have the approval either of the Board of Directors involved or of the
body to which this Board has delegated the responsibility. The Finance Areas of each company are responsible of identifying these operations and escalating them to the Board of Directors.
Transactions between Credicorp companies and between Credicorp companies and their employees (without being limited to banking, financial, securities brokerage, investment,
other financial services, payments of tariffs and regulatory contributions) that are made in the normal course of its operations, at market prices and values, or in substantially the same terms, including yields, interest rates and collateral, as
compared to those prevailing at the same time with third parties, and that do not imply a higher collectability risk and do not present any additional unfavorable terms for Credicorp, are expressly exempted from this requirement. These
transactions are considered pre-approved by Credicorp's Board of Directors and may be reported to the Sustainability Committee in order to ensure good practices and detect potential conflicts of interest. For the daily approval of these
transactions, the current policies and regulations of each Credicorp company will be followed.
The following table shows Credicorp’s main transactions with related companies as of and for the years ended December 31, 2020, 2021 and 2022.
|
Year ended December 31,(3)
|
||||||||||||
|
2020
|
2021
|
2022
|
||||||||||
|
Statement of financial situation
|
(in thousands of soles)
|
|||||||||||
|
Direct loans
|
2,116,881
|
1,888,433
|
1,804,837
|
|||||||||
|
Investments (1) (2)
|
1,192,424
|
920,852
|
800,021
|
|||||||||
|
Deposits
|
(1,619,461
|
)
|
(970,072
|
)
|
(1,138,115
|
)
|
||||||
|
Derivatives at fair value
|
155,146
|
30,026
|
336,867
|
|||||||||
|
Statement of income -
|
||||||||||||
|
Interest income related to loans – income
|
52,670
|
39,355
|
38,896
|
|||||||||
|
Interest expense related to deposits – expense
|
(15,386
|
)
|
(15,999
|
)
|
(24,143
|
)
|
||||||
|
Non-interest income
|
23,523
|
9,967
|
13,232
|
|||||||||
|
Contingent risks and commitments
|
||||||||||||
|
Total performance bonds, and stand-by letters of credit
|
475,440
|
503,880
|
433,639
|
|||||||||
| (1) |
In 2022, the balance mainly consists of S/158.1 million of corporate bonds, S/157.0 million of shares of Alicorp S.A.A., S/155.3 million of corporate bonds issued by Cementos Pacasmayo S.A. and S/126.8 million of shares of Inversiones
Centenario. The decrease in the balance mainly results from fluctuations that negatively affected investments in shares of Inversiones Centenario and corporative bonds of Alicorp S.A.A. and Cementos Pacasmayo S.A.
|
| (2) |
In 2021, the balance mainly includes S/183.3 million of corporate bonds, S/178.6 million of corporate bonds issued by Cementos Pacasmayo S.A., S/137.7 million of shares of Alicorp S.A.A. and S/184.8 million of shares of Inversiones
Centenario.
|
| (3) |
Excludes transactions with subsidiaries.
|
Credicorp has entered into these transactions with related parties in the ordinary course of business and in accordance with normal market terms, including interest rate and
collateral, which were available to other customers for comparable transactions at that time, and they did not involve more than the normal risk of collectability or present other unfavorable features. Outstanding loan balances at year-end were
guaranteed by the related party. The Peruvian financial system law prohibits us from giving more favorable conditions to related parties. On December 31, 2022, direct loans to related companies were secured by collateral, which had maturities
between January 2022 and June 2029, at an annual soles average interest rate of 6.86% and at an annual foreign currency average interest rate of 4.59% (as of December 31, 2021, maturities between January 2022 and December 2029, at an annual soles
average interest rate of 6.03 percent and at an annual foreign currency average interest rate of 3.36 percent). As of December 31, 2022, we recorded an S/8.5 million allowance for loan losses for doubtful debt in connection with loans to related
parties. As of December 31, 2021, this provision amounted to S/19.7 million. The amount of this provision is adjusted on a continuous basis and based on the financial position of each related party and the market in which it operates.
As of December 31, 2022, the related company that had the largest debt balance of direct loans with Credicorp was in the cement sector with a total balance of S/300.5 million.
This balance included short-term financing. Interest rates of the operations ranged from 5.82% to 8.93% in soles. As of December 31, 2021, the related company that had the largest debt balance of direct loans with Credicorp was in the cement
sector with a total balance of S/450.8 million. This balance included short-term financing. Interest rates of the operations ranged from 1.55% to 2.62% in soles and 1.80% in dollars. As of December 31, 2020, the related company that had the
largest debt balance of direct loans with Credicorp was in the real estate sector with a total balance of S/239.0 million. This balance included short-term financing, as well as medium-term operations. Interest rates of the operations ranged from
6.05% to 6.33% in soles and from 2.80% + 3 month Libor to 3.08% + 3 month Libor.
As of December 31, 2020, 2021 and 2022, Credicorp’s Directors, officers and employees had been involved, directly and indirectly, in credit transactions with certain
subsidiaries of the Group, as permitted by Peruvian Banking and Insurance Law No. 26702, which regulates and limits certain transactions with employees, Directors and officers of a bank and insurance company. On December 31, 2020, 2021 and 2022,
direct loans to employees, Directors, senior management, and their family members amounted to S/1.1 billion, S/1.1 billion and S/1.2 billion, respectively. These loans have been granted in the ordinary course of business and on market terms as
allowed by regulations promulgated under Section 402 of the Sarbanes-Oxley Act. Therefore, no privileged conditions have been granted on any type of loans to Directors and executive officers. These loans are paid monthly and earn interest at
rates that are similar to market rates for comparable loans.
In 2022, Credicorp and subsidiaries made payments totaling approximately USD 33.2 million to the following related suppliers: Hermes Transportes Blindados, Grupo Centenario
and subsidiaries, Grupo Falabella Peru and subsidiaries, ENEL Distribución Peru SAA. and AI Inversiones Palo Alto II SAC. This information is being disclosed in accordance with our Corporate Policy on Related Parties, which came into effect in
December 2019.
Subsidiaries Transactions
The following table shows Credicorp’s main transactions with subsidiaries companies as of and for the years ended December 31, 2020, 2021 and 2022 which does not consider
related party transactions.
|
As of December 31,
|
||||||||||||
|
2020
|
2021
|
2022
|
||||||||||
|
Statement of financial situation
|
(in thousands of soles)
|
|||||||||||
|
Direct loans / receivables (1)
|
1,997,763
|
3,104,188
|
3,067,625
|
|||||||||
|
Investments
|
245,624
|
115,642
|
163,200
|
|||||||||
|
Funds / Deposits (2)
|
(1,939,364
|
)
|
(2,917,660
|
)
|
(1,359,011
|
)
|
||||||
|
Derivatives at fair value receivable / payable (*)
|
10,092
|
20,392
|
17,190
|
|||||||||
|
Statement of income -
|
||||||||||||
|
Interest income related to loans – income (**)
|
85,196
|
58,270
|
118,627
|
|||||||||
|
Interest expense related to deposits – expense (**)
|
(3,337
|
)
|
(1,499
|
)
|
(12,972
|
)
|
||||||
|
Non-interest income (**)
|
64,930
|
76,645
|
79,743
|
|||||||||
|
Off-balance sheet
|
||||||||||||
|
Total performance bonds, and stand-by letters of credit
|
280,878
|
331,920
|
440,577
|
|||||||||
(1) The loans granted by these companies are recognized as receivable by the group companies that received the placement. These transactions are eliminated from the Statement of
Financial Position.
(2) Funds available from various group companies are received by these
subsidiaries as deposits. These operations are eliminated in the Statement of Financial Position.
(*) Accounts receivable for derivatives held by group companies will be accounts payable for the subsidiaries with which the derivative is agreed and vice versa. These transactions are eliminated
from the Statement of Financial Position.
(**) Income recognized by group companies will be an expense for the subsidiaries with which the transaction was agreed. These transactions are eliminated from the statement of income.
(***) The table does not consider related party transactions.
The main direct loans and receivables between subsidiaries of the group are:
|
Loan Grantor
|
Loan Recipient
|
At December 2022
(in thousands of Soles)
|
|||
|
Sol-denominated:
|
|||||
|
BCP Stand-alone
|
Mi Banco - Banco de Microempresa
|
1,705,227
|
|||
|
BCP Stand-alone
|
Credicorp Capital Servicios Financieros
|
21,930
|
|||
|
BCP Stand-alone
|
SEAH
|
34,572
|
|||
|
BCP Stand-alone
|
Credicorp Capital Peru SAA
|
10,000
|
|||
|
BCP Stand-alone
|
ASB Bank Corp
|
7,170
|
|||
|
BCP Stand-alone
|
Credicorp Capital SAFI
|
6,813
|
|||
|
BCP Stand-alone
|
Cia. Incubadora de Soluciones Moviles S.A.C. (Culqi)
|
4,600
|
|||
|
BCP Stand-alone
|
Wally POS S.A.C.
|
1,922
|
|||
|
BCP Stand-alone
|
Pacífico Compañía de Seguros y Reaseguros S.A.
|
84
|
|||
|
BCP Stand-alone
|
Grupo Crédito
|
28
|
|||
|
Others
|
81,314
|
||||
|
Total Sol-denominated
|
1,873,660
|
||||
|
Foreign Currency-denominated:
|
|||||
|
ASHC
|
Atlantic Security International Financial Services Inc.
|
872,748
|
|||
|
BCP Stand-alone
|
Credicorp Capital Chile S.A.
|
211,071
|
|||
|
BCP Stand-alone
|
Credicorp Capital SAB
|
40,157
|
|||
|
ASB Bank Corp
|
Credicorp Capital Chile S.A.
|
32,775
|
|||
|
BCP Stand-alone
|
SEAH
|
25,867
|
|||
|
BCP Stand-alone
|
Credicorp Capital SAFI
|
8,977
|
|||
|
ASB Bank Corp
|
Atlantic Security Holding Corp
|
1,335
|
|||
|
Others
|
1,035
|
||||
|
Total Foreign Currency-denominated
|
1,193,965
|
||||
|
Total
|
3,067,625
|
||||
Credicorp invests the liquidity from its US$500 million bond issue in mutual funds, in investments made through investment management agreements (IMAs) with third parties, and
in direct investments in bonds. With respect to the proceeds of the bond issue, as of December 31, 2022, investments in mutual funds totaled US$251.4 million, investments with third parties under IMAs totaled US$224.1 million, and investments in
bonds held to maturity totaled US$5.9 million. Credicorp Ltd. itself only maintains passive investments, such as deposits, mutual funds and bonds held to maturity, while investments with third parties under IMAs and any active management of
liquidity is carried out by ASIFS (Atlantic Security International Financial Services Inc.), an operating subsidiary of ASHC, which is in turn a subsidiary of Credicorp Ltd. The flow of financing for investments with third parties under IMAs is
through capital contributions from Credicorp Ltd. to ASHC, then through non-interest loans from ASHC to ASIFS, which as of December 31, 2022, totaled US$228.8 million. During the twelve-month period ended December 31, 2022, the largest
outstanding amount of the non-interest loan from ASHC to ASIFS was US$228.8 million.
Main loans granted between group companies in soles amount to S/1,873.7 million with an average rate of 3.3% and with maturity between January 2023 and May 2025; in dollars
amount to S/1,194.0 million with an average rate of 5.41% and with maturity between January 2023 and August 2023.
Not applicable.
Our annual consolidated financial statements, audited by an independent registered public accounting firm and accompanied by an audit report, are included beginning on page
F-1 of this Annual Report.
(1) Legal Proceedings
We, along with our subsidiaries, are involved in certain legal proceedings that arise in the normal course of conducting business. We do not believe that any liabilities that
may result from such proceedings would have a material adverse effect on our financial condition or results of operations, or on the financial condition or results of operations of any of our subsidiaries.
The following is a description of material litigation in which we or our subsidiaries are engaged in as of the date of this Annual Report, or that has had, in the recent past,
significant effects on the Company’s financial position or profitability.
Madoff Trustee Litigation. In September 2011, the Trustee for the liquidation of Bernard L. Madoff Investment Securities LLC. (BLMIS)
and the substantively consolidated estate of Bernard L. Madoff (the Madoff Trustee) filed a complaint (the Madoff Complaint) against Credicorp’s subsidiary, ASB (now ASB Bank Corp.), in the U.S. Bankruptcy Court for the Southern District of New
York (the Bankruptcy Court). The Madoff Complaint seeks recovery of approximately US$120.0 million in principal amount, which is alleged to be equal to the amount of redemptions between the end of 2004 and the beginning of 2005 of ASB-managed
Atlantic U.S. Blue Chip Fund assets invested in Fairfield Sentry Limited (Fairfield Sentry), together with fees, costs, interest, and expenses. The Madoff Complaint seeks the recovery of these redemptions from ASB Bank Corp. as “subsequent
transfers” or “avoided transfers” from BLMIS to Fairfield Sentry, which Fairfield Sentry in turn subsequently transferred to ASB Bank Corp. The Madoff Trustee has filed similar “claw back” actions against numerous other alleged “subsequent
transferees” that invested in Fairfield Sentry and its sister entities, which, in turn, invested in and redeemed funds from BLMIS.
There has been significant briefing on issues related to these Madoff Trustee actions, and these cases have been pending for many years. In November 2016, the Bankruptcy Court
issued a Memorandum Decision Regarding Claims to Recover Foreign Subsequent Transfers (the Memorandum Decision) holding that the recovery of certain subsequent foreign transfers is barred under the doctrine of comity and/or extraterritoriality,
and dismissed the claims brought by the Madoff Trustee against a number of parties, including ASB Bank Corp. In March 2017, the Madoff Trustee filed an appeal (the Appeal) of the Memorandum Decision to the United States Court of Appeals for the
Second Circuit, which reversed the Dismissal Order and remanded the matter to the Bankruptcy Court (the Second Circuit Opinion). In April 2019, the defendant-appellees, including ASB Bank Corp., filed, and the Second Circuit granted, a motion to
stay the issuance of the mandate pending the filing of a petition for a writ of certiorari in the United States Supreme Court. The petition for a writ of certiorari was filed in the United States Supreme Court in August 2019. On or about June 1,
2020, the United States Supreme Court denied the petition for a writ of certiorari. Following the denial of the petition for writ of certiorari, the judgment for dismissal by the Bankruptcy Court was vacated and the matter was remanded back to
the Bankruptcy Court. The case now remains pending in the Bankruptcy Court. On March 25, 2022, ASB Bank Corp. filed a Motion to Dismiss the Madoff Complaint. On May 24, 2022, the Madoff Trustee filed its opposition to the Motion to Dismiss. On
July 14, 2022, ASB Bank Corp. filed its reply to memorandum of law in further support of its Motion to Dismiss. On November 18, 2022, the Bankruptcy Court entered its Memorandum Decision, which denied the Motion to Dismiss presented by ASB Bank
Corp., and on December 2, 2022, the Bankruptcy Court entered its corresponding order denying the Motion to Dismiss, which order established February 1, 2023, as the deadline for ASB Bank Corp. to file an answer to the Madoff Complaint. While
management believes that ASB Bank Corp. has defenses against the Madoff Trustee’s claims and intends to defend against any action by the Madoff Trustee, in view of recent judicial decisions in cases not involving ASB, certain defenses are no
longer available. In this context, Credicorp has constituted a provision that management considers reasonable with the information available today.
Fairfield Litigation. In April 2012, Fairfield Sentry (In Liquidation) and its representative, Kenneth Krys (the Fairfield
Liquidator), filed a complaint (the Fairfield Complaint) against ASB (now ASB Bank Corp.) in the Bankruptcy Court (the Fairfield v. ASB Adversary Proceeding). The Fairfield Complaint seeks to recover US$115.2 million in principal amount from ASB
Bank Corp., representing the amount of ASB’s Bank Corp.’s redemptions of certain investments in Fairfield Sentry, together with fees, costs, interest, and expenses. These are essentially the same funds that the Madoff Trustee seeks to recover in
the Madoff Trustee litigation as described above. After the Fairfield Complaint was filed, the Bankruptcy Court procedurally consolidated the Fairfield V. ASB Bank Corp. Adversary Proceeding with other adversary actions brought by the Fairfield
Liquidator against former investors in Fairfield Sentry.
Similar to the Madoff Trustee litigation described above, the Fairfield v. ASB Bank Corp. Adversary Proceeding, and related adversary actions have been pending for many years.
In October 2016, the Fairfield Liquidator filed a Motion for Leave to Amend (the Motion for Leave) various complaints, including the Fairfield Complaint. Certain defendants, including ASB Bank Corp., filed a motion to dismiss (the Motion to
Dismiss) and a consolidated memorandum of law (i) in opposition to the Motion for Leave and (ii) in support of the Motion to Dismiss. In December 2018, the Bankruptcy Court entered a memorandum decision granting in part and denying in part the
Motion to Dismiss and the Motion for Leave (the Memorandum Decision). In March 2019, the Fairfield Liquidator submitted a form of a stipulated order dismissing the adversary proceeding against ASB Bank Corp. (the Dismissal Order), as directed by
the Bankruptcy Court, but filed notices of appeal, including of the dismissal of the claims asserted against ASB Bank Corp. and other defendants, in May 2019. On or about August 24, 2022, the District Court entered its Opinion and Order, which
Opinion and Order affirmed the Bankruptcy Court’s orders, including the Dismissal Order. The Fairfield Liquidator has appealed the District Court’s Opinion and Order to the Court of Appeals for the Second Circuit. The appeal remains pending.
Management believes that ASB Bank Corp. has defenses against the Fairfield Liquidator’s claims alleged in the Amended Complaint and the Fairfield Liquidator’s appeal.
(2) Government Investigations
The former Chairman and the current Vice Chairman of the Board of Directors of Credicorp, in their respective capacities as Chairman of the Board and as a Director of BCP
Stand-alone, were summoned as witnesses by Peruvian prosecutors, along with 26 other Peruvian business leaders, to testify in connection with a judicial investigation that is being carried out regarding contributions made to the electoral
campaign of a political party in the 2011 Peruvian presidential elections. Our former Chairman testified on November 18, 2019, and our Vice Chairman testified on December 9, 2019. The former Chairman informed prosecutors that in 2010 and 2011
Credicorp made donations totaling US$3.65 million to the political party Fuerza Popular during the 2011 Peruvian presidential campaign (in total amounts of US$1.7 million in 2010 and US$1.95 million in 2011). These contributions were made in
coordination with the General Manager of Credicorp at that time. While the amount of these contributions exceeded the limits then permitted under Peruvian electoral law, the law in place at that time provided no sanction for contributors, and
instead only for the recipient of the campaign contribution.
The former Chairman also informed prosecutors that in 2016, three subsidiaries of Credicorp (BCP Stand-alone, Mibanco and Grupo Pacífico) made donations totaling S/711,000
(approximately US$200,000) to the political party Peruanos Por el Kambio. These contributions were made in compliance both with Peruvian electoral law and with Credicorp’s own political contributions guidelines, adopted in 2015. These guidelines
provided details on the procedures for obtaining approval for contributions and outlined the specific required conditions for transparent contributions.
The Peruvian SMV has initiated a sanctioning process against Credicorp, for failing to disclose to the market, in due course, the political campaign contributions in the years
2011 and 2016. The SMV also has initiated a sanctioning process against three subsidiaries of Credicorp (BCP Stand-alone, Mibanco and Grupo Pacífico), for failing to disclose to the market, in due course, the political campaign contributions made
in connection with the 2016 presidential elections. The SMV notified Credicorp, BCP Stand-alone, Mibanco and Grupo Pacífico with first instance Resolutions on these proceedings. The mentioned Resolutions imposed pecuniary sanctions (fines) on
Credicorp and the three subsidiaries as a consequence of these sanctioning processes. Credicorp, BCP Stand-alone, Mibanco and Grupo Pacífico appealed the Resolutions.
On December 8, 2021, Credicorp informed that the Peruvian SMV was notified of the resolution issued by the Provisional Superior Chamber Specialized in Administrative
Litigation of the Superior Court of Justice of Lima (the “Court”), pursuant to which the Court has admitted for consideration Credicorp’s contentious-administrative claim challenging the SMV’s resolution (by negative administrative silence), with
reference to the appeal filed by Credicorp mentioned in the prior paragraph.
Under the Resolution, the SMV resolved to sanction Credicorp with two fines. The first fine was 300 Tax Units, (approximately US$270,000) and the second fine was 210 UITs
(approximately US$207,375). The fines were imposed in both cases for allegedly having infringed (categorized as “very serious”) (“muy grave” in Spanish) certain provisions of the Peruvian Securities Law. The charges made by the SMV against
Credicorp were that the company had affected the transparency of the stock market by not having disclosed relevant information to the market regarding Credicorp's cash contributions to the political party Fuerza Popular during the 2011 Peruvian
presidential campaign (first charge) and that the company had affected the transparency of the stock market by not having disclosed relevant information to the market regarding Credicorp’s agreement to make contributions to the political party
Peruanos por el Kambio during the 2016 Peruvian presidential campaign (second charge).
Because Credicorp was neither in agreement with the categorization of the facts nor with the sanctions imposed, Credicorp filed an appeal challenging the Resolution.
Subsequently, after the expiration of the term to resolve in the appeal (second administrative instance), Credicorp asserted its right to negative administrative silence and to resort to the Judiciary. Notwithstanding, Credicorp proceeded to pay
the fines imposed by the SMV, in compliance with Peruvian law.
Thus, since Credicorp’s contentious-administrative claim filed was admitted for consideration by the Court, the administrative procedure has terminated with respect to
Credicorp, and the matter is now subject to the decision of the Judiciary.
On March 4, 2022, Grupo Pacífico was informed that the SMV was notified of the resolution issued by the Court, pursuant to which the Court has admitted for consideration Grupo
Pacífico’s contentious-administrative claim challenging the SMV´s resolution (by negative administrative silence), with reference to the appeal filed by Grupo Pacífico mentioned above. Thus, since Grupo Pacífico’s mentioned claim was admitted for
consideration by the Court, the administrative procedure has terminated with respect to Grupo Pacífico, and the matter is now subject to the decision of the Judiciary.
On July 4, 2022, BCP Stand-alone informed that the Peruvian SMV was notified of the resolution issued by the Court, pursuant to which the Court has admitted for consideration
BCP Stand-alone’s contentious-administrative claim challenging the SMV´s resolution (by negative administrative silence), with reference to the appeal filed by BCP Stand-alone mentioned above. Thus, since BCP Stand-alone’s mentioned claim was
admitted for consideration by the Court, the administrative procedure has terminated with respect to BCP Stand-alone, and the matter is now subject to the decision of the Judiciary.
On July 5, 2022, Mibanco was informed that the Peruvian SMV was notified of the resolution issued by the Court, pursuant to which the Court has admitted for consideration
Mibanco´s contentious-administrative claim challenging the SMV’s resolution (by negative administrative silence), with reference to the appeal filed by Mibanco mentioned above. Thus, since Mibanco´s mentioned claim was admitted for consideration
by the Court, the administrative procedure has terminated with respect to Mibanco, and the matter is now subject to the decision of the Judiciary.
Credicorp believes that neither the contributions disclosed by our former Chairman and the current Vice Chairman in 2019 nor the related SMV sanctioning processes pose a
significant risk of material liability to the Company. Furthermore, Credicorp does not believe that either of the contributions will have material effect on the Company’s business, financial position, or profitability.
On November 11, 2021, Credicorp disclosed that its incoming CEO, Mr. Gianfranco Ferrari de las Casas, informed the company that he was notified of a Prosecutor’s Decision
issued by the Corporate Supraprovincial Prosecutor's Office Specialized in Officer Corruption Offenses Special Team – Fourth Court Division (Fiscalía Supraprovincial Corporativa Especializada en Delitos de
Corrupción de Funcionarios Equipo Especial – Cuarto Despacho). Through such notice, Mr. Ferrari was informed that he had been included in the preparatory investigation carried out against Mr.
Yehude Simon M. and an additional 65 individuals on the grounds of, in his particular case, alleged primary complicity in the alleged crime against the public administration, aggravated collusion, incompatible negotiation or improper use of
position and criminal organization detrimental to the Peruvian State, in connection with the financial advisory services provided by BCP Stand-alone to the Olmos Project.
Credicorp has reviewed the performance of the officers of Banco de Crédito del Perú in relation to the financial advisory services provided by the Bank in connection with the
Olmos Project and has concluded that the facts under investigation do not give rise to any liability of Banco de Credito del Peru or its officers. Credicorp bases this view on the qualified opinion of external consultants specializing in the
matter. Therefore, Credicorp considers that the opening of the aforementioned preparatory investigation will not have any impact on the normal operation of the company, nor will affect the dedication and performance of its officers in undertaking
their regular duties.
| (4) |
Regulatory Sanctions
|
In April 2022, the SBS imposed a fine on Pacífico Seguros in the amount of twenty UIT (approximately US$23,945) for serious infringement related to its actuarial function. The
company’s management acknowledged the infringement and adopted all necessary measures to prevent any further occurrence.
Also, in April 2022, the SBS imposed a fine on Mibanco in the amount of twenty UIT (approximately US$23,945) for serious infringement related to one office closure without SBS
authorization. The company’s management acknowledged the infringement and adopted all necessary measures to prevent any further occurrence.
In May 2022, the SMV imposed a fine on Prima AFP S.A in the amount of three and a half UIT (approximately US$3,919) for serious infringement related to not having disclosed
relevant information to the market regarding the start of the FY 2020 audit. The company’s management acknowledged the infringement and adopted all necessary measures to prevent any further occurrence.
In June 2022, the SBS imposed a fine on Pacífico Seguros in the amount of twenty-five UIT (approximately US$29,947) for serious infringement related to inappropriate attention
of an SBS information requirement. The company’s management acknowledged the infringement and adopted all necessary measures to prevent any further occurrence.
| (5) |
Dividend Policy
|
Under Bermuda law, a dividend may only be declared and paid if the Company is able to (i) pay its liabilities as they become due, and (ii) the realizable value of its assets
is not less than the aggregate value of its liabilities, issued share capital and share premium accounts.
Each year, the Company intends to declare and pay dividends in cash of at least 25% of the Company’s consolidated net profits based on the last audited financial accounts. The
Board of Directors shall take into consideration the following when deciding whether to distribute dividends:
| • |
There being dividends from the Company’s subsidiaries;
|
| • |
That the declaration and payment of dividends shall not cause the Company to breach any applicable laws or adversely impact on the equity growth requirements of the Company or its subsidiaries;
|
| • |
The financial performance of the Company;
|
| • |
The overall business and the economic-financial conditions affecting the Company; and
|
| • |
Any other factors that the Board may deem relevant.
|
The Board of Directors may in its sole discretion declare and pay a dividend below 25%, if any of the aforementioned conditions fail to be met. Subject to the foregoing, it is
expected that dividend payments are to be made once a year within 90 calendar days of the meeting held by the Board to approve the dividend declaration and payment. No interim dividends are to be paid. This policy has been in force since 2016 and
it will continue to be applicable until amended or rescinded by the Board of Directors. For further details about the risk associated with our ability to pay dividends, please refer to “ITEM 3. KEY INFORMATION – 3.D Risk Factors – Our ability to
pay dividends to shareholders and to pay corporate expenses may be adversely affected by the ability of our subsidiaries to pay dividends to us.”
Furthermore, the Board of Directors of the Company, in its session held on December 23, 2021, resolved that, subject to the provisions of Credicorp’s Dividend Policy, the
Board expects that Credicorp will declare dividends, if any, each year in the month of April or thereafter once the Company’s subsidiaries have agreed the declaration and date of payment of any dividends in their respective shareholder and board
meetings. This decision was made in accordance with Credicorp’s Dividend Policy.
The following table shows the cash and stock dividends that we paid based on the results of our operations in the periods indicated:
|
Year ended December 31,
|
Number of Shares Entitled
to Dividends
|
Cash
Dividends
Per Share
|
Stock
Dividends
Per Share
|
|||||||||||||
|
2001
|
94,382,317
|
US$
|
0.10
|
0.00
|
||||||||||||
|
2002
|
94,382,317
|
US$
|
0.40
|
0.00
|
||||||||||||
|
2003
|
94,382,317
|
US$
|
0.30
|
0.00
|
||||||||||||
|
2004
|
94,382,317
|
US$
|
0.40
|
0.00
|
||||||||||||
|
2005
|
94,382,317
|
US$
|
0.80
|
0.00
|
||||||||||||
|
2006
|
94,382,317
|
US$
|
1.10
|
0.00
|
||||||||||||
|
2007
|
94,382,317
|
US$
|
1.30
|
0.00
|
||||||||||||
|
2008
|
94,382,317
|
US$
|
1.50
|
0.00
|
||||||||||||
|
2009
|
94,382,317
|
US$
|
1.70
|
0.00
|
||||||||||||
|
2010
|
94,382,317
|
US$
|
1.95
|
0.00
|
||||||||||||
|
2011
|
94,382,317
|
US$
|
2.30
|
0.00
|
||||||||||||
|
2012
|
94,382,317
|
US$
|
2.60
|
0.00
|
||||||||||||
|
2013
|
94,382,317
|
US$
|
1.90
|
0.00
|
||||||||||||
|
2014
|
94,382,317
|
US$
|
2.1873
|
0.00
|
||||||||||||
|
2015
|
94,382,317
|
US$
|
2.3160
|
0.00
|
||||||||||||
|
2016
|
94,382,317
|
S/
|
12.2865
|
0.00
|
||||||||||||
|
2016
|
94,382,317
|
S/
|
15.7000
|
0.00
|
||||||||||||
|
2017
|
94,382,317
|
S/
|
14.1726
|
0.00
|
||||||||||||
|
2018
|
94,382,317
|
S/
|
20.0000
|
0.00
|
||||||||||||
|
2018
|
94,382,317
|
S/
|
8.0000
|
0.00
|
||||||||||||
|
2019(1)
|
94,382,317
|
S/
|
30.0000
|
0.00
|
||||||||||||
|
2020(2)
|
94,382,317
|
S/
|
5.0000
|
0.00
|
||||||||||||
|
2021(3)
|
94,382,317
|
S/
|
15.0000
|
0.00
|
||||||||||||
|
2022(4)
|
94,382,317
|
S/
|
-
|
0.00
|
||||||||||||
| (1) |
At a meeting held on February 27, 2020, the Board of Directors declared a cash dividend of S/30.0000 per common share. The cash dividend will be paid in US Dollars using the weighted exchange rate registered by the SBS for the
transactions at the close of business on May 6, 2020. The US Dollar dividend amount will be rounded up to four decimals. The aforementioned cash dividend was paid on May 8, 2020, to those shareholders that were registered as shareholders
of Credicorp as of the close of business on April 13, 2020.
|
| (2) |
At a meeting held on February 25, 2021, the Board of Directors discussed the probability of approving a distribution of dividends for the results obtained in 2020. Due to the uncertainty in the health and economic expectations of Peru
and the countries in which we operate, this decision will be defined in the following directories agreed during 2021, taking into account the evolution of the pandemic and its possible impact on the solvency, liquidity and profitability
of Credicorp. At a meeting held on August 26, 2021, the Board of Directors declared a cash dividend of S/5.0000 per common share. The cash dividend was paid in U.S. Dollars using the weighted exchange rate registered by the SBS for the
transactions at the close of business on October 5, 2021. The U.S. Dollar dividend amount will be rounded up to four decimals. The aforementioned cash dividend was paid on October 7, 2021, to those shareholders that are registered as
shareholders of Credicorp as of the close of business on September 15, 2021.
|
| (3) |
In a meeting held on April 28, 2022, the Board of Directors of Credicorp Ltd. declared a cash dividend of S/15.0000 per share. The cash dividend will be paid in US dollars using the weighted exchange rate recorded by the SBS for
transactions at the close of business on June 08, 20202. The dividend amount in US dollars will be rounded to four decimal places. The aforementioned cash dividend will be paid on June 10, 2022, to those shareholders who are registered as
shareholders of Credicorp at the close of operations on May 20, 2022.
|
| (4) |
Cash dividends for the result of 2022 have not been declared yet.
|
There have not been any significant changes since the date of our consolidated financial statements.
Our common shares have been traded on the NYSE since October 25, 1995. Our common shares also trade on the BVL. They are quoted in US Dollars and trade under the symbol BAP on
both exchanges.
As of December 31, 2022, Credicorp had issued 94,382,317 registered common shares with a nominal par value of US$5.00 per share. Under Credicorp’s Bye-laws, any holder of such
shares is entitled to one vote per share, to such dividends as the Board of Directors may from time to time declare and to the surplus assets of Credicorp in the event of a winding-up or dissolution. Credicorp’s shareholders do not have
preemptive purchase rights under the Company’s Bye laws.
Not applicable.
The BVL is the principal non-U.S. trading market for our common shares.
(1) Trading
As of December 2022, there were 241 companies listed on the BVL, which is Peru’s only securities exchange and was established in 1970. Trading on the BVL is primarily done on
an electronic trading system, though trading may also occur in an open outcry auction floor session. Trading hours occur from Monday through Friday as follows:
|
From the second Sunday of March through the first Sunday of November of each year:
|
Pre-Opening
|
07:30
|
-
|
08:20
|
|
Opening session:
|
08:20
|
-
|
08:30
|
|
|
Trading I:
|
08:30
|
-
|
14:22
|
|
|
Trading II
|
14:22
|
-
|
14:52
|
|
|
Closing session:
|
14:52
|
-
|
15:00
|
|
|
Closing Price publication
|
15:00
|
-
|
15:02
|
|
|
Trading at closing price:
|
15:02
|
-
|
15:10
|
|
|
Post-Closing
|
15:10
|
-
|
15:30
|
|
|
From the first Sunday of November through the second Sunday of March of each year:
|
Pre-Opening
|
07:30
|
-
|
09:00
|
|
Opening session:
|
09:00
|
-
|
09:30
|
|
|
Trading I:
|
09:30
|
-
|
15:22
|
|
|
Trading II
|
15:22
|
-
|
15:52
|
|
|
Closing session:
|
15:52
|
-
|
16:00
|
|
|
Closing Price publication
|
16:00
|
-
|
16:02
|
|
|
Trading at closing price:
|
16:02
|
-
|
16:10
|
|
|
Post-Closing
|
16:10
|
-
|
16:30
|
Transactions during both the open trading and the electronic sessions are executed through brokerage firms and stockbrokers on behalf of their clients. Brokers submit their
orders in strict accordance with written instructions, following the chronological order in which they were received. The orders specify the type of security ordered or offered as well as the amounts and price of the sale or purchase. In general,
share prices are allowed to increase or decrease up to 15% for Peruvian companies, and up to 30% for foreign companies, within a single trading day.
In the first quarter of 2020, at the midst of the COVID-19 pandemic when governments around the world were adopting lockdowns to mitigate the spread of the virus, the BVL
General Index fell 30.8% as risk aversion and uncertainty was affecting global financial markets. The BVL is driven largely by movements in the equity markets of the United States and by commodity prices; and during the same period, the S&P
500 index in the US fell 20.2% and copper prices fell 22.2%. The BVL Index reached its lowest price of 13,539 points on April 3, 2020. After that, financial markets began to recover, supported by unprecedented monetary and fiscal stimulus
deployed by governments around the world as well as by the development of COVID-19 vaccines. Between its low on April 2020 and mid-February 2021, the BVL index rose 71%, in line with the recovery of the price of copper that increased from USD
2.10 per pound on March 23, 2020 to USD 4.29 per pound on February 25, 2021. In February 2021, new restrictive measures were taken by various governments around the world as a new COVID-19 variant appeared. In Peru, additionally, the first round
of the presidential elections took place on April 11, 2021, with Pedro Castillo, left-wing candidate, and Keiko Fujimori, right-wing candidate, advancing to a second round. In the second round on June 6, 2021, Castillo was elected president. As a
result, the BVL behaved more independently other financial markets (such as the S&P 500 and copper prices) and fell 33% from its peak in February to its bottom in August 2021. At that point, it started to recover and ended 2021 at 21,111
points, representing an increase of 1.4% compared to year-end 2020.
2022 was a tough year for financial markets. The war between Russia and Ukraine, the global inflationary shock, the COVID-19 zero tolerance stance of China and the
simultaneous hiking cycle adopted by most Central Banks in the world drove market sentiment. Besides, Peru was immersed in constant political uncertainty. In the first quarter of 2022, the BVL index benefited from the commodity price rally that
drove copper to a record of USD/lb. 4.84. In the second quarter of 2022, the BVL index fell 26%, in line with the S&P 500, as the FED started hiking rates in March 2022. In the second half of 2022, the BVL index gradually recovered as copper
prices stabilized and rebounded late in the year when the Chinese authorities announced the end of their restrictive stance against the spread of COVID-19. The BVL index ended 2022 at 21,330 points, a rise of just 1.04% compared to the end of
2021. In this context, emerging markets were also affected by the significant appreciation of the US dollar, especially during the first three quarters of 2022, when it reached its highest value in two decades.
The total amount traded on the BVL was US$3.7 billion in 2022, below the levels of the last three years (US$5.7 billion in 2021, US$5.8 billion in 2020 and US$5.5 billion in
2019). These figures are still far from the record level obtained in 2007, in which trading volume reached US$12.4 billion. The Peruvian stock market capitalization amounted to US$ 141.7 billion in 2022 compared to US$148.5 billion in 2021,
US$165.5 billion in 2020 and US$162.0 billion in 2019.
(2) Market Regulation
Peru’s Securities Market Law (Legislative Decree No. 861) addresses matters such as transparency and disclosure, takeovers and corporate actions, capital market instruments
and operations, the securities markets and broker-dealers, and risk rating agencies. The SMV, which is a governmental entity attached to the MEF, was given additional responsibilities relating to the supervision, regulation, and development of
the securities market, while the BVL and its member firms were given the status of self-regulatory organizations. Additionally, a unified system of guarantees and capital requirements was established for the BVL and its member firms.
The SMV is governed by a five-member board, which includes the Securities Market Superintendent, who presides over the board, and four directors appointed by the executive
branch: one proposed by the MEF, one proposed by BCRP, one by SBS and one Independent Director. SMV has broad regulatory powers, which include studying, promoting, and establishing rules for the securities market, supervising its participants,
and approving the registration of public offerings of securities.
SMV supervises the securities markets and the dissemination of information to investors. It also (i) governs the operations of the Public Registry of Securities and Brokers,
(ii) regulates mutual funds and their management companies, (iii) monitors compliance with accounting regulations by companies under its supervision as well as the accuracy of financial statements and (iv) registers and supervises auditors who
provide accounting services to those companies under SMV’s supervision.
On August 22, 1995, the SMV approved regulations governing the public offering of securities in Peru by entities organized outside of Peru and, for the first time, authorized
foreign companies to be listed on the BVL. On October 25, 1995, we became the first non-Peruvian company to list our shares on the BVL. For further details, see “ITEM 4. INFORMATION ON THE COMPANY – 4.B Business Overview – (6) Supervision and
Regulation – 6.2 Subsidiaries – 6.2.1 Peru”.
Pursuant to the Securities Market Law, the BVL must maintain a guarantee fund that is funded by its member firms. The actual contributions to be made by the 24 member firms of
the BVL are based on volume traded over the exchange. In addition to the guarantee fund managed by the BVL, each member firm is required to maintain a guarantee for operations carried out outside the exchange in favor of SMV. Such guarantees are
generally established through bank guarantees issued by local banks.
Not applicable.
Not applicable.
Not applicable.
Not applicable.
The registration number of Credicorp with the Registrar of Companies in Bermuda is EC21045.
The following sections set forth certain information concerning Credicorp’s Board of Directors and its share capital, and a summary of certain significant provisions of
Credicorp’s Memorandum of Association and Bye-laws and Bermuda corporate law. This description does not purport to be complete and is qualified by reference to Credicorp’s Memorandum of Association and Bye-laws and to applicable corporate law.
For further information on Credicorp’s current Bye-laws, as amended in 2020, see Exhibit 1.1 to this Annual Report.
|
(1)
|
Credicorp Ltd.’s Objects
|
The objects under which Credicorp is formed and incorporated are located in Item 6 of its Memorandum of Association and are:
| (1) |
To act and perform all the functions of a holding Company in all of its branches and to coordinate the policy and administration of any subsidiary Company or companies wherever incorporated or carrying on business or of any group of
companies of which Credicorp or any subsidiary Company is a member, or which are in any manner controlled directly or indirectly by Credicorp;
|
| (2) |
To carry on the business of an investment Company and for that purpose to acquire and hold, whether in the name of Credicorp or in that of any nominee, shares, stocks, debentures, debenture stock, bonds, notes, obligations, and
securities issued or guaranteed by any Company however incorporated or carrying on business; and
|
| (3) |
Certain other standard objects of Bermuda exempted companies as set out in the Second Schedule to the Bermuda Companies Act 1981.
|
Credicorp’s business falls within the scope of its objects under its Memorandum of Association.
|
(2)
|
Directors
|
Credicorp’s business is managed and conducted by the Board of Directors, which is fixed by Credicorp’s Bye-laws at nine Directors. For additional information regarding the
membership and operation of Credicorp’s Board of Directors, see “ITEM 6. DIRECTORS, SENIOR MANAGEMENT AND EMPLOYEES – 6. A Directors and Senior Management” and “– 6. C Board Practices”.
Each Director holds office for a period (the “Election Period”) commencing at the annual general meeting in which the Director was elected and ending at the annual general
meeting in the third successive year of his election or until his successor is elected or appointed subject to his office being vacated.
There are no age limit requirements regarding retirement or non-retirement of Directors. Holding shares is not a requirement in order to be appointed as a Director of the
Company.
The office of Director shall be vacated if the Director: (i) is removed from office pursuant to Credicorp’s Bye-laws or is prohibited from being a Director by law; (ii) is or
becomes bankrupt or makes any arrangement or composition with his creditors generally; (iii) is or becomes of unsound mind or dies; or (iv) resigns his or her office by notice in writing to the Company. At any general meeting, the shareholders
may authorize the Board to fill for the remainder of the Election Period any vacancy in their numbers left unfilled at the general meeting. Shareholders in general meeting or the Board shall have the power to appoint any person as a Director to
fill a vacancy on the Board for the remainder of the Election Period occurring as a result of the death, disability, disqualification, or resignation of any Director.
A Director may not vote in respect of any contract or proposed contract or arrangement in which such Director is interested or in respect of which such Director has a conflict
of interest.
Directors’ remuneration is determined by Credicorp’s shareholders in general meetings. Directors living outside Lima may also be paid all travel, hotel, and other expenses
properly incurred in attending meetings of the Board of Directors, meetings of any committee appointed by the Board of Directors, general meetings of the Company, or any meetings in connection with the business of the Company or their duties as
Directors generally.
Any Director, or any Director’s firm, partner, or any Company with whom any Director is associated, may act in a professional capacity for Credicorp, and such Director or such
Director’s firm, partner or such Company may be entitled to remuneration for professional services as if such Director were not a Director, provided that a Director or Director’s firm, partner or such Company is not authorized to act as auditor
of the Company.
The Board of Directors may exercise all the powers of the Company to borrow money and to mortgage or charge its undertaking, property and uncalled share capital, or any part
thereof. The Board of Directors may also issue debentures, debenture stock, and other securities whether outright or as security for any debt, liability, or obligation of the Company or any third party.
|
(3)
|
Common Shares
|
Credicorp’s Memorandum of Association and Bye-laws provide for its share capital to be a single class of common shares, with a par value of $5.00 per share, subject to any
resolution of the shareholders to the contrary. To date, Credicorp has issued 94,382,317 common shares with a par value of US$5.00 per share, each fully paid.
Under Credicorp’s Bye-laws, any holder of Credicorp’s common shares is entitled to one vote per share, such dividends as the Board of Directors may from time to time declare,
and the surplus assets of Credicorp in the event of winding-up or dissolution. Unclaimed dividends do not earn interest. Dividends unclaimed for three years after they are declared revert back to the Company, and shareholders do not have any
rights to such dividends. For more information regarding Credicorp’s dividend policy and applicable Bermuda law, refer to “ITEM 8. FINANCIAL INFORMATION – 8. A Consolidated Statements and Other Financial Information (3) Dividend Policy”.
Subject to applicable law, in the event of a winding-up or dissolution of the Company, whether voluntary or involuntary or for the purpose of a reorganization or otherwise, or
upon any distribution of share capital, the holders of our common shares will be entitled to the surplus assets of the Company.
Credicorp can, from time to time, purchase its own shares in accordance with Section 42A of the Companies Act 1981 of Bermuda. Section 42A of the Companies Act 1981 of Bermuda
provides that a Company cannot purchase its shares if there are reasonable grounds for believing that the Company is, or after the purchase would be, unable to pay its liabilities as they become due. Shares purchased under Section 42A are treated
as cancelled, and the amount of the Company’s issued capital, but not its authorized share capital, is diminished by the nominal value of the cancelled shares.
Under Section 46 of the Companies Act 1981 of Bermuda, where permitted under its memorandum of association and bye-laws, shareholders of a Bermuda company may resolve in a
general meeting to reduce the company’s share capital. No company shall reduce the amount of its share capital unless: (i) it publishes a notice in an appointed newspaper not more than 30 and not less than 15 days before the date on which the
reduction in share capital is to become effective, stating (a) the amount of share capital as last determined by the company; (b) the amount by which the share capital is to be reduced; and (c) the date on which the reduction will become
effective; and (ii) on the date the reduction is to be effected, there are no reasonable grounds for believing that the company is, or after the reduction would be, unable to pay its liabilities as they become due. Subject to the foregoing, the
Company may reduce its share capital in any way, including by (i) extinguishing or reducing the liability on any of its shares in respect of capital not paid up; (ii) with or without extinguishing or reducing liability on any of its shares,
cancelling any paid up capital that is lost or unrepresented by available assets; or (iii) with or without extinguishing or reducing liability of any of its shares, and with or without reducing the number of such shares, paying off any paid-up
capital that is in excess of the requirements of the Company. Subject to Credicorp’s Bye-laws, when share capital is to be reduced by cancellation of part of a class of shares, the shares to be cancelled must be selected (i) by lot, in such
manner as the Directors determine; (ii) as nearly as may be in proportion to the number of shares of the class registered in the name of each shareholder; or (iii) in such other manner as the Directors, with the consent of the majority of
shareholders of the share class to be cancelled, determine. When shares are to be cancelled to reduce the Company’s share capital, the shares shall be acquired at the lowest price at which the shares are obtainable, in the opinion of the
Directors, but not exceeding an amount, if any, stated in the Bye-laws. Credicorp’s Bye-laws do not state any amount or price at which shares are to be cancelled when undertaking a share capital reduction of this kind. There are no conditions in
our Memorandum of Association or Bye-laws governing changes in our share capital that are more stringent than those required under Bermuda law.
The rights of Credicorp’s shareholders can be changed by amendment of Credicorp’s Bye-laws. Amendments, rescissions, or alterations to Credicorp’s Bye-laws generally require
approval by a resolution of its Board of Directors and a resolution of the shareholders passed by a majority of the votes cast in accordance with the provisions of the Bye-laws. Amending Bye-laws 4.11 and 4.23 of Credicorp’s Bye-laws, regarding
the number of Directors, tenure, election process and filling of vacancies, among other matters, requires affirmative votes of at least two-thirds of the total issued voting shares of the Company. Bye-law amendments may be made at the annual
general meeting or at a special general meeting.
Credicorp’s annual general meeting is held each year to consider and adopt resolutions, to receive the report of the auditors and the consolidated financial statements for the
last financial year, to elect Directors, to consider fees payable to Directors, to appoint auditors and to consider other matters properly brought before the meeting. At least fourteen days’ notice of an annual general meeting shall be given to
each shareholder. Notice of an annual general meeting will state the date, place, and time at which the meeting is to be held, that the election of Directors will take place at the meeting, and as far as practicable, the other business to be
conducted at the meeting. At least ten days’ notice of a special general meeting shall be given to each shareholder. Notice of a special general meeting will state the date, time, place, and the general nature of the business to be considered at
the meeting. Subject to the provisions of the Bermuda Companies Act 1981 and Credicorp’s Bye-laws, any question proposed for the consideration of the shareholders at any general meeting will be decided by the affirmative votes of a majority of
the votes cast in accordance with the provisions of Credicorp’s Bye-laws. In the case of a tie, the resolution fails.
Subject to compliance with applicable laws, there are no limitations on the rights to own our securities, or on the rights of non-resident or foreign shareholders to hold or
exercise voting rights on those securities, which are imposed by the Companies Act 1981 of Bermuda or by the Memorandum of Association or Bye-laws of Credicorp.
There is no provision of the Company’s Memorandum of Association or Bye-laws that would delay, defer, or prevent a change in control of the Company and that would operate only
with respect to a merger, acquisition or corporate restructuring involving the Company (or any of its subsidiaries).
Assuming Credicorp remains listed on an appointed stock exchange, there are no Bye-law provisions or provisions of Bermuda law governing the ownership threshold above which
ownership of Credicorp shares must be disclosed. Under Peruvian law, any individual or legal entity who acquires, directly or indirectly, 1% or more of the share capital of a Company operating in the financial and insurance systems (or that is
engaged in activities that are either associated with or complementary to the purpose of such companies) in a 12-month period, or who obtains a shareholder stake of 3% or more, must provide the SBS with the information that the SBS requests to
identify the shareholder’s main economic activities and the structure of its assets. In addition, the acquisition of shares of a Company operating in the financial or insurance system exceeding 10% of the Company’s share capital (or resulting,
when aggregated with previous holdings, in the holding of 10% of the Company’s share capital) by a single individual or entity, whether directly or indirectly, require prior authorization from the SBS. In order to acquire more than 10% of the
share capital of a legal person domiciled in Peru that holds shares in a financial or insurance company, prior authorization from the SBS is required. If the shareholder is a legal person that is not domiciled in Peru, such as Credicorp, the SBS
must be informed if there is a modification in the composition of the shareholders in proportions that exceed 10%, indicating the names of such shareholders.
Under Peruvian securities market regulation, any issuer with shares registered in a centralized exchange, such as Credicorp, must present to the SMV a list of its shareholders
who hold more than 0.5% of its capital stock and update the list within the first 15 calendar days of the following month in which a change occurs. The issuer also must update the Securities Market Public Register with information on shareholders
holding 4% or more of its share capital following any change.
Under the U.S. Securities Exchange Act of 1934, as amended, holders of more than 5% of our shares are generally required to report their holdings to the SEC on Schedule 13D or
Schedule 13G, as applicable. This is an obligation of the shareholder, not of Credicorp Ltd. as the issuer of the shares.
As of the date hereof, we have not, nor have our subsidiaries, entered into any material contracts in the immediately preceding two years other than those contracts entered
into in the ordinary course of our business.
We rely almost exclusively on dividends from Grupo Crédito S.A., BCP Stand-alone, BCP Bolivia, ASHC, Grupo Pacífico, Credicorp Capital, and our other subsidiaries for the
payment of dividends to holders of our common shares. To the extent that our subsidiaries are legally restricted from paying us dividends, our ability to pay dividends on our common shares will be adversely affected.
Although substantially all of the clients of BCP Stand-alone, ASB, and Grupo Pacífico are located in Peru, as of December 31, 2022, approximately 31.6% of BCP Stand-alone’s
loan portfolio, 97.0% of ASB’s loan portfolio, and 49.1% of Grupo Pacífico’s written premiums were denominated in US Dollars (29.7%, 97.2% and 53.4%; and 28.6%, 100.0% and 49.0%; in 2021 and 2020, respectively).
Since March 1991, there have been no exchange rate controls in Peru, and all foreign exchange transactions are based on market exchange rates. The Peruvian constitution
establishes equal treatment between national and foreign investment in Article 63, and Legislative Decree No. 662 allows foreign holders of equity shares of Peruvian companies to receive and repatriate 100% of the cash dividends distributed by
the Company. These investors are allowed to purchase foreign exchange at market exchange rates through any member of the Peruvian banking system.
One circumstance that could lead to depreciation is a decline in Peruvian foreign reserves to inadequate levels. Although the current level of Peru’s foreign reserves (US$
71.9 billion or 31% of GDP as of December 31, 2022) compares favorably with those of other Latin American countries, there can be no assurance that Peru will be able to maintain adequate foreign reserves levels to meet its foreign
currency-denominated obligations. See “Item 4. Information on the Company – 4.B Business Overview – (7) Peruvian Government and Economy”.
We have been designated as a non-resident for Bermuda exchange control purposes under the Bermuda Exchange Control Act 1972 and associated regulations and are able to conduct
our day-to-day operations free of Bermuda exchange control formalities. We are able to pay dividends, distribute capital, and open and maintain bank accounts in any foreign currency without reference to the Bermuda Monetary Authority.
The disclosures in the following sections describe certain material implications to shareholders under the tax laws of Bermuda, Peru, Chile, Colombia, and the United States,
but are not intended to provide legal advice to investors. Investors should consult with their own tax advisers in these and other jurisdictions. For details on income tax review by the tax authorities in on the jurisdictions in which we operate,
please refer to Note 19 (a) and (d) to the consolidated financial statements.
Credicorp’s dividends are paid without withholding tax at the source.
|
10.1
|
Bermuda regulation
|
As of the date of this report, there is no Bermuda income or profits tax, withholding tax, capital gains tax, capital transfer tax, estate duty, or inheritance tax that we
must pay or that our shareholders must pay with respect to their shares. We have obtained assurance from the Minister of Finance of Bermuda under the Exempted Undertakings Tax Protection Act 1966 that, in the event that any legislation is enacted
in Bermuda imposing any tax computed on profits or income, or computed on any capital asset, gain or appreciation or any tax in the nature of estate duty or inheritance tax, such tax shall not, until March 31, 2035, be applicable to us or to any
of our operations or to our shares, debentures, or other obligations. This assurance, however, does not cover any tax applicable to persons who ordinarily reside in Bermuda or to any taxes that we must pay with respect to real property that we
own or lease in Bermuda.
As an exempted company, we are liable to pay in Bermuda an annual government fee based on our authorized share capital and the premium on our issued common shares, which
amounted to approximately US$18,670 (Bermuda annual government fee for 2017 and 2018.) However, with effect beginning in 2019, the annual government fee increased to US$19,605.
|
10.2
|
Peruvian regulation
|
On February 15, 2011, the Peruvian government enacted Law No. 29663, which was subsequently amended on July 21, 2011, by Law No. 29757. This law partially modifies the
country’s income tax regime by (i) subjecting to taxation in Peru capital gains derived from an indirect transfer of shares issued by a domiciled entity and (ii) introducing more types of income that will qualify as Peruvian source income. Under
the law, an indirect transfer of shares issued by a domiciled entity occurs, and is subject to the Peruvian Income Tax (at a 0%, 5% or 30% rate) when the shares of a non-domiciled entity, which in turn owns (directly or indirectly through other
entities) shares issued by a domiciled entity, are transferred, provided that both of the following conditions are met:
| (1) |
During the 12 months prior to the transfer, the fair market value (FMV) of the shares of the domiciled entity owned by the non-domiciled entity equals 50% or more of the FMV of the shares of the non-domiciled entity. There is a
rebuttable presumption that this condition is met if the non-domiciled entity is a resident in a tax haven; and
|
| (2) |
During any given 12-month period, shares representing 10% or more of the non-domiciled entity’s share capital are transferred.
|
The Legislative Decree No. 1424 (published on September 13, 2018) established an additional rule according to which if the "total amount" of the domiciled entity’s shares
indirectly transferred is equal to or exceeds 40,000 Peruvian Tax Units (approximately US$48 million), an indirect transfer of Peruvian shares would always be deemed to be triggered, regardless of whether either of conditions (1) or (2) above are
met. This new rule based on the sales price is in force as of January 1, 2019, jointly with the general rule referred above.
On April 21, 2020, Supreme Decree No. 085-2020-EF established that, for purposes of determining the FMV of the non-domiciled shares and the Peruvian entities, the following
methods must be followed:
• Higher listed value: In the case of shares listed on the Stock Exchange, the market value will be the highest listed value.
• Discounted cash flow (DCF): In the case of shares that are not listed on the Stock Exchange, the market value will be the discounted cash flow value in
case the entity evidences a predictable horizon of future cash flows or has elements such as licenses, authorizations or intangibles that allows the existence of such cash flows to be anticipated. If the Company has several business units, a
projection must be made for each business unit.
The DCF methodology of the Company will be applied if there is no expectation of debt linked to the economic activity or business unit of the Company; otherwise, the DCF
methodology of the shareholder will apply.
For the development of the projection, the following will be considered:
(1) The cash flow period should be at least 10 years. If the Company has a shorter duration, the balance of the duration will be considered.
(2) If the Company's cash flow is
applied, the discount rate is the weighted average cost of capital, which must consider the opportunity cost of capital and the cost of debt. If the shareholder's cash flow is applied, the opportunity cost of capital must be considered as the
discount rate, which includes the minimum profitability expected by the shareholder at market value.
(3) Continuity value, when the Company is expected to receive income for an unspecified period of time or the residual value, as applicable.
In case the domiciled entity directly or indirectly owns shares of another or other domiciled entities and/or non-domiciled entities, the market value of such
shares must include the market value of these other companies.
For the determination of the discounted cash flow value to be credited, the taxpayer must have a technical report containing at least the following
information: (i) an executive summary; (ii) an analysis of the sector in which the Company operates; (iii) an analysis of the Company; (iv) valuation; and (v) annexes that accredit the results obtained.
| • |
Equity Participation Value (EPV): If the methods described above are not complied with, the EPV is calculated on the basis of the last audited balance sheet of the issuing Company closed within 90 days
prior to the disposal. This is applicable in the case of entities that are under the supervision of the SMV, or entities authorized to perform the same functions in other jurisdictions. If, within 90 days prior to the sale, a reduction in
the share capital of the non-resident entity is made, the balance sheet of the non-resident entity will be the one corresponding before the reduction.
|
| • |
Residual Method: If the previous methods are not applicable, the EPV will be one of the following:
|
| 1. |
The EPV shall be the result of dividing the equity value of the entity based on the last balance sheet closed within 90 days prior to the disposal, in accordance with the accounting standards officialized or approved by the competent
body of the country, increased by the average monthly active market rate in local currency (TAMN), and by the number of shares issued, provided the following conditions are met:
|
| • |
The entity's shares are not listed on a stock exchange or in any centralized trading mechanism, and;
|
| • |
The entity is not under the control and supervision of an entity that is entitled to perform the same functions as the SMV under its country of residence.
|
| 2. |
The EPV will be the appraised value established within the six months prior to the date of the transfer.
|
The tax rate will apply according to the following table:
|
Tax rate
|
|
|
Exempt (0%)
|
Income derived from the transfer of securities in the Lima Stock Exchange will be exempt from the Income Tax until December 31, 2022, as long as they have a stock
market presence and; if in a period of 12 months, the tax-payer or its related parties, through a single or successive operation, do not transfer 10% or more of the total shares issued by the respective Company.
|
|
5%
|
If the aforementioned requirements are not met and the transfer of shares is realized through the Lima Stock Exchange by a non-domiciled subject.
|
|
30%
|
If the transfer of shares is not realized through the BVL by a non-domiciled subject, even if the shares are listed in the Lima Stock Exchange.
|
In addition, the following obligations were imposed on domiciled entities that have “economic relationships” (defined below) with non-domiciled sellers:
| • |
Reporting to the SUNAT the direct or indirect transfer of its shares, and;
|
| • |
To the extent that shares of a domiciled company are being directly or indirectly transferred by a non-domiciled seller, the domiciled company is jointly liable for the income tax that is not paid by the non-domiciled seller when such
seller and the Peruvian domiciled company are deemed to be economically related for Peruvian Income Tax purposes for any period of time, within 12 months prior to the transfer. However, the joint income tax liability does not apply when
the purchaser or acquirer of the transferred shares is a domiciled individual or entity.
|
According to Supreme Decree No. 275-2013-EF, enacted on November 7, 2013, which defined the concept of “economic relationships”, a domiciled entity is considered to be
economically related to a non-domiciled seller, if, in any given time within the 12-month period prior to the transfer, at least one of the following conditions is met:
| o |
The non-domiciled seller owns more than 10% of the equity of the domiciled entity, directly or through a third party;
|
| o |
10% or more of the equity of each of the domiciled entity and the non-domiciled seller is owned by common shareholders;
|
| o |
The domiciled entity and the non-domiciled seller have one or more common Directors, managers, or administrators, with authority over financial, operative, and commercial agreements;
|
| o |
The domiciled entity and the non-domiciled seller prepare joint consolidated financial statements; or
|
| o |
The non-domiciled seller has a dominant influence on the decisions of the administrative areas of the domiciled entity, or vice-versa.
|
|
10.3
|
Chilean Regulation
|
The Chilean Statutory Income Tax rate to resident legal entities has been 27% under the semi-integrated regime of 2018. Foreign individual or legal resident entities are
subject to a 35% dividend withholding tax. This tax applies at the moment of the effective remittance of the dividend and the corporate income tax can be used as a credit. In the case of non-treaty country resident shareholders, the corporate tax
credit is limited to 65% of the corporate income tax associated to such dividend. Therefore, in this case, the total tax burden for foreign taxpayers, subject to a 35% tax rate, will be 44.45%. Nonetheless, the “65% limit” does not apply to those
investors domiciled or resident in a country with which Chile has a Double Taxation Treaty in force. Additionally, a transitory rule provides that this benefit will also be applicable to those investors who are residents of countries with which
Chile has a Double Taxation Treaty subscribed and pending ratification, to the extent that the treaty was signed prior to December 31, 2020. This transitory rule will be in effect until December 31, 2025. The Group is under the Income Tax
semi-integrated system.
|
10.4
|
Colombian Regulation
|
The Colombian general corporate income tax rate of 35% remains unchanged (for 2022 and the following years). In addition, a temporary surtax will be applied to financial
institutions whose taxable income equal to or exceeds approximately US$1 million. Credicorp Capital Colombia, Credicorp Capital Fiduciaria, and Mibanco Colombia, are now subject to the surtax rate of 5%, applicable from 2022 until 2027.
Therefore, the combined income tax rate for financial institutions in Colombia is 40% for 2023 onwards. Without prejudice of the provisions established in tax treaties, distribution of dividends to non-residents will now be subject to a 20%
dividend tax (previously was of 10%). If the corresponding profits were not taxed at the level of the distributing company, the corporate income tax rate would be applied over the dividends (35% general rate; however, for financial institutions,
this rate could be 40% from 2023 to 2027), and after that, the 20% dividend tax is applied. Foreign portfolio investment is also subject to the 20% withholding tax. However, in the case of previously untaxed corporate profits, instead of applying
the general income tax rate, a withholding tax of 25% will be assessed. Corporate profits earned up to December 31, 2016, are not subject to withholding tax on dividends, even though the distribution occurs from and after January 1, 2017.
Finally, as of 2023, profits distributed to Colombian companies are also subject to the 10% withholding tax rate (currently at 7.5%). In any case, the tax paid by the Colombian company over the dividends can be transferred to its foreign
investors. Therefore, they are entitled to use it as a tax credit against their own taxes when they receive dividends.
|
10.5
|
Material U.S. Federal Income Tax Consequences
|
This section describes certain material U.S. federal income tax consequences of the purchase, ownership and disposition of our common shares held by U.S. Shareholders (as
defined below) that hold our common shares as capital assets for U.S. federal income tax purposes (generally, property held for investment). This summary is based on the U.S. Internal Revenue Code of 1986, as amended (the Code), applicable
regulations of the U.S. Department of the Treasury promulgated thereunder (the Treasury Regulations), IRS rulings and decisions, and judicial decisions thereon and existing interpretations thereof, all in effect on the date of this Annual Report.
These authorities may be subject to different interpretations or changes, possibly with retroactive effect, so as to result in U.S. federal income tax consequences different from those summarized below.
We have not sought any ruling from the IRS in respect of the statements made and the conclusions reached in this discussion, and there can be no assurance that the IRS will
agree with such statements and conclusions, or that the IRS will not challenge any of the positions taken by us and that such challenge, if any, will not be sustained. A different treatment from that described below could adversely affect the tax
consequences of the ownership and disposition of our common shares as set forth in this summary.
This summary does not purport to deal with all aspects of U.S. federal income taxation that may be relevant to a particular holder in light of such holder’s circumstances. In
particular, this summary does not address all of the tax consequences that may apply to members of a special class of holders subject to special rules, including:
| (1) |
dealers in securities or currencies;
|
| (2) |
persons subject to special tax accounting rules under Section 451(b) of the Code;
|
| (3) |
regulated investment companies;
|
| (4) |
real estate investment companies;
|
| (5) |
traders in securities that elect to use a mark-to-market method of accounting for securities holdings;
|
| (6) |
tax-exempt organizations;
|
| (7) |
banks, insurance companies, or any other financial institution;
|
| (8) |
persons that actually or constructively own 10% or more, by vote or value, of our common shares;
|
| (9) |
persons subject to alternative minimum tax;
|
| (10) |
persons that hold our common shares as part of a straddle or a hedging, conversion, or other integrated transaction for U.S. federal income tax purposes;
|
| (11) |
persons that purchase or sell common shares as part of a wash sale for U.S. federal income tax purposes;
|
| (12) |
partnerships or other pass-through entities (including grantor trusts) and investors therein; or
|
| (13) |
persons whose functional currency is not the US Dollar.
|
If a partnership (including any entity treated as a partnership for U.S. federal income tax purposes) is a beneficial owner of common shares, the U.S. federal income tax
treatment of a partner in that partnership generally will depend on the status of the partner and the activities of the partnership. Partners of a partnership holding common shares should consult their own tax advisors regarding the U.S. federal
income tax consequences to them.
Prospective investors of our common shares should consult their own tax advisors regarding the U.S. federal, state, local, and non-U.S. and other tax consequences of owning
and disposing of the common shares in their particular circumstances.
This summary applies to U.S. Shareholders. As used in this section 10.5, a "U.S. Shareholder" means a beneficial owner of our common shares who or that is, for U.S. federal
income tax purposes, any of the following:
| • |
an individual who is a citizen or resident of the United States,
|
| • |
a corporation, or other entity taxable as a corporation, created or organized under the laws of the United States, any state thereof or the District of Columbia,
|
| • |
an estate whose income is subject to U.S. federal income tax regardless of its source, or
|
| • |
a trust if a U.S. court can exercise primary supervision over the trust's administration and one or more U.S. persons (as defined in the Code and Treasury Regulations) are authorized to control all substantial decisions of the trust.
|
Taxation of Dividends
Subject to the discussion of the “passive foreign investment company” rules below, the gross amount of any distributions of cash or property with respect to our common shares
generally will be treated as dividends for U.S. federal income tax purposes to the extent paid out of our current or accumulated earnings and profits, as determined under U.S. federal income tax principles. Distributions in excess of current and
accumulated earnings and profits, as determined for U.S. federal income tax purposes, will be treated first as a return of capital that is applied against and reduces the U.S. Shareholder's adjusted tax basis in the common shares, but not below
zero, and thereafter as capital gain realized on the sale or other disposition of the common shares. Because we do not maintain calculations of our earnings and profits under U.S. federal income tax principles, it is expected that distributions
generally will be reported to U.S. Shareholders as dividends. The amount of any distribution paid in a foreign currency will be equal to the U.S. dollar value of such currency, translated at the spot rate of exchange on the date such distribution
is received, regardless of whether the payment is in fact converted into U.S. dollars at that time.
Any dividends that a U.S. Shareholder receives will be includable in such holder’s gross income as ordinary income on the day such holder actually or constructively receives
them. Such dividends will not be eligible for the dividends-received deduction generally allowed to certain corporate U.S. Shareholders. Dividends paid by us generally will be non-U.S. source income for purposes of the U.S. “foreign tax credit”
rules. The rules governing U.S. foreign tax credits are complex and involve the application of rules that depend on the particular circumstances of each U.S. Shareholder. Therefore, each U.S. Shareholder should consult his, her or its own tax
advisor with respect to the availability of U.S. foreign tax credits in such U.S. Shareholder’s particular circumstances. Please note that the U.S. Department of the Treasury has issued final and proposed Treasury Regulations that substantially
modified the requirements for foreign income taxes to be creditable for U.S. federal income tax purposes. Therefore, each U.S. Shareholder is encouraged to reevaluate with his, her or its own tax advisors whether foreign income taxes would be
creditable for U.S. federal income tax purposes in light of the recent changes.
Subject to certain limitations, including certain limitations based on taxable income and filing status, and subject to certain minimum holding period requirements, dividends
paid to non-corporate U.S. Shareholders, including individuals, may be eligible for a reduced rate of taxation if we are deemed to be a “qualified foreign corporation” for U.S. federal income tax purposes. A qualified foreign corporation includes
a non-U.S. corporation if (1) its stock is readily tradable on an established securities market in the United States or (2) it is eligible for the benefits of a comprehensive income tax treaty with the United States that meets certain
requirements. However, a corporation is not a qualified foreign corporation if it is a “passive foreign investment company” (as discussed below) for the taxable year in which the dividend is paid or the preceding taxable year. The common shares
are traded on the NYSE, an established securities market. The United States does not have a comprehensive income tax treaty with Bermuda or Peru. Each U.S. Shareholder should consult his, her or its own tax advisor regarding the treatment of
dividends and such holder's eligibility for a reduced rate of taxation.
Taxation of Capital Gains
Subject to the discussion of the “passive foreign investment company" rules below, a U.S. Shareholder generally will recognize gain or loss on the sale or exchange of common
shares equal to the difference between the amount realized on the sale or exchange and the U.S. Shareholder’s adjusted tax basis in the common shares. Such gain or loss will be capital gain or loss and will be long-term capital gain or loss if
the common shares were held for more than one year. Gain or loss, if any, recognized by a U.S. Shareholder generally will be treated as U.S.-source gain or loss for U.S. foreign tax credit limitation purposes. Therefore, U.S. Shareholders may not
be able to use any U.S. foreign tax credit arising from any Peruvian tax imposed on the sale or exchange of common shares unless the credit can be applied (subject to applicable limitations) against tax due on other non-U.S. source income. A U.S.
Shareholder’s adjusted tax basis in its common shares generally is equal to its purchase price for such shares, adjusted according to U.S. federal income tax principles. Long-term capital gains recognized by non-corporate U.S. Shareholders
generally will be subject to tax at reduced rates. The deductibility of capital losses is subject to limitations. Each U.S. Shareholder should consult his, her or its own tax advisor regarding the taxation of capital gains and deductibility of
capital losses in light of their particular facts and circumstances.
Passive Foreign Investment Company (PFIC)
A non-U.S. corporation will be classified as a passive foreign investment company (PFIC) for U.S. federal income tax purposes if either:
| • |
75% or more of its gross income for the taxable year is passive income; or
|
| • |
on a quarterly average for the taxable year by value (or by adjusted basis, if it is not a publicly traded corporation and it is a so-called controlled foreign corporation (as the definition of that term is modified under the PFIC
rules) or it so elects), 50% or more of its assets produce or are held for the production of passive income.
|
For the purposes of this test, such non-U.S. corporation will be treated as owning its proportionate share of the assets and earning its proportionate share of the income of
any other corporation in which it owns, directly or indirectly, 25% or more (by value) of the stock.
We have not determined whether we have previously been a PFIC for any year, or whether we are currently, or will be a PFIC in future years. Furthermore, because this
determination is made on an annual basis, no assurance can be given that we will not be classified as a PFIC in future taxable years. If we are classified as a PFIC for U.S. federal income tax purposes, a U.S. Shareholder that does not make an
election to treat us as a “qualified electing fund” and did not make a “mark-to-market” election, each as described below, will be subject to the following U.S. federal income tax consequences:
| 1. |
“Excess distributions” we make to a U.S. Shareholder will be taxed in a special way. “Excess distributions” are amounts received by a U.S. Shareholder with respect to our common shares in any taxable year that exceed 125% of the
average distributions received by the U.S. Shareholder from us in the shorter of either of the three previous years or the U.S. Shareholder’s holding period for such common shares before the current taxable year. Excess distributions must
be allocated ratably to each day that a U.S. Shareholder has held our common shares. A U.S. Shareholder must include amounts allocated to the current taxable year and to any non-PFIC years in his or her gross income as ordinary income for
that year. A U.S. Shareholder must pay U.S. federal income tax on amounts allocated to each prior taxable PFIC year at the highest marginal tax rate in effect for that year on ordinary income and the tax is subject to an interest charge
at the rate applicable to deficiencies for U.S. federal income tax.
|
| 2. |
The entire amount of gain that is realized by a U.S. Shareholder upon the sale or other disposition of our common shares will also be considered an excess distribution and will be subject to U.S. federal income tax as described above.
|
| 3. |
A U.S. Shareholder’s adjusted tax basis in shares that were acquired from a U.S. decedent would not receive a step-up to fair market value (FMV) as of the date of the decedent’s death but instead would be equal to the decedent’s
adjusted tax basis, if lower than such value.
|
The special PFIC rules do not apply to a U.S. Shareholder if the U.S. Shareholder makes an election to treat us as a “qualified electing fund” in the first taxable year in
which the U.S. Shareholder owns our common shares and if we comply with certain reporting requirements. Instead, a shareholder of a qualified electing fund is required for each taxable year to include in income a pro rata share of the ordinary
earnings of the qualified electing fund as ordinary income and a pro rata share of the net capital gain of the qualified electing fund as long-term capital gain, subject to a separate election to defer payment of taxes, which deferral is subject
to an interest charge. The election generally is made on a shareholder-by-shareholder basis and may be revoked only with the consent of the IRS. A U.S. Shareholder makes the election by attaching a completed IRS Form 8621, which includes the PFIC
annual information statement, to a timely filed U.S. federal income tax return. Even if an election is not made, a U.S. Shareholder generally must file a completed IRS Form 8621 in each year that we are a PFIC. U.S. Shareholders should be aware
that, for each taxable year, if any, that we are a PFIC, we can provide no assurances that we will satisfy the record keeping requirements of a PFIC, or that we will make available to U.S. Shareholders the information such U.S. Shareholders
require to make a “qualified electing fund” election with respect to us.
A U.S. Shareholder who owns PFIC shares that are publicly traded could elect to mark the shares to market annually, recognizing as ordinary income or loss each year an amount
equal to the difference as of the close of the taxable year between the FMV of the PFIC shares and the U.S. Shareholder’s adjusted tax basis in the PFIC shares. If such a mark-to-market election is made, then the rules set forth above would not
apply for periods covered by the election. Assuming that we are trading on the NYSE, our common shares are expected to be treated as publicly traded for purposes of the mark-to-market election and, therefore, such election should be able to be
made if we are classified as a PFIC. A mark-to-market election is, however, subject to complex and specific rules and requirements, and U.S. Shareholders are strongly urged to consult their tax advisors concerning this election if we are
classified as a PFIC.
U.S. Shareholders are urged to consult their tax advisors regarding the adverse tax consequences of owning our common shares if we are, or become, a PFIC, and the possibility
of making certain elections designed to lessen those adverse consequences.
Medicare Tax on Net Investment Income
A U.S. Shareholder that is an individual or estate, or a trust that does not fall into a special class of trusts that is exempt from such tax, is subject to a 3.8% tax (the
"Medicare tax") on the lesser of (i) such holder’s "net investment income" (or "undistributed net investment income" in the case of an estate or trust) for the relevant taxable year and (ii) the excess of such holder’s modified adjusted gross
income for the taxable year over a certain threshold (which in the case of individuals is between $125,000 and $250,000, depending on the individual's circumstances and tax filing status). A U.S. Shareholder’s net investment income generally
includes its dividend income and its net gains from the disposition of our common shares unless such dividends or net gains are derived in the ordinary course of the conduct of a trade or business (other than a trade or business that consists of
certain passive or trading activities). A U.S. Shareholder that is an individual, estate or trust is urged to consult his, her or its own tax advisor regarding the applicability of the Medicare tax in respect of its investment in our common
shares.
Information with Respect to Foreign Financial Assets
Owners of “specified foreign financial assets” with an aggregate value in excess of $50,000 on the last day of the taxable year, or $75,000 at any time during the taxable
year, may be required to file information reports with respect to such assets with their U.S. federal income tax returns. Depending on your circumstances, higher threshold amounts may apply. “Specified foreign financial assets” include any
financial accounts maintained by non-U.S. financial institutions, as well as any of the following, but only if they are held for investment and not held in accounts maintained by financial institutions: (i) stocks and securities issued by
non-U.S. persons, (ii) financial instruments and contracts that have non-U.S. issuers or counterparties, and (iii) interests in non-U.S. entities. Our common shares may be treated as specified foreign financial assets, and the holders of those
shares may be subject to this information reporting regime. Failure to file information reports may subject holders to penalties. Holders should consult their own tax advisors regarding their obligation to file information reports with respect to
the common shares.
Backup Withholding and Information Reporting
Dividends paid, if any, on our common shares to a U.S. Shareholder may be subject to information reporting and, unless a U.S. Shareholder either furnishes its taxpayer
identification number or otherwise establishes an exemption, may also be subject to U.S. backup withholding tax (currently at a rate of 24%). In addition, information reporting generally will apply to payments of proceeds from the sale, exchange,
redemption or other disposition of our common shares by a paying agent, including a broker, within the United States to a U.S. Shareholder. A paying agent within the United States will be required to impose backup withholding on any payments of
the proceeds from the sale, exchange redemption or other disposition of the common shares within the United States to a U.S. Shareholder if such U.S. Shareholder fails to furnish its correct taxpayer identification number or otherwise fails to
establish an exemption or comply with such backup withholding requirements. Backup withholding is not an additional tax and may be refunded (or credited against the U.S. Shareholder’s U.S. federal income tax liability, if any), provided that
certain required information is furnished to the IRS. The information reporting requirements may apply regardless of whether withholding is required.
Foreign Account Tax Compliance Act (FATCA)
Sections 1471 through 1474 of the Code (commonly known as the Foreign Account Tax Compliance Act, or FATCA) impose, under certain circumstances, a 30% U.S. federal withholding
tax on certain payments to certain non-U.S. financial institutions that fail to comply with certain information reporting, account identification, withholding, certification and other FATCA-related requirements in respect of their direct and
indirect U.S. shareholders and/or U.S. accountholders. To avoid becoming subject to FATCA withholding, we may be required to report information to the Bermuda government or the IRS regarding our U.S. Shareholders. Each U.S. Shareholder should
consult his, her or its own tax advisor to obtain a more detailed explanation of FATCA and to learn how FATCA might affect that U.S. Shareholder in his, her or its particular circumstances.
|
10.6
|
Double tax treaties
|
As of January 25, 2021, Peru has tax treaties with the following jurisdictions: Brazil, Canada, Chile, Mexico, Portugal, South Korea, Switzerland, and the member countries of
the Andean Pact (Bolivia, Colombia, and Ecuador). Peru has also signed a tax treaty with Japan, which went into effect on January 29, 2021, for information exchange purposes and will be effective on January 1, 2022 for income tax purposes. Peru
does not have a tax treaty with Bermuda, and the United States does not have a comprehensive income tax treaty with Bermuda or Peru.
Not applicable.
Not applicable.
As a foreign private issuer, we are subject to the information reporting requirements of the Exchange Act. As such we must file or furnish reports and other information to the
SEC, which typically may be inspected at the public reference facilities of the SEC, at 100 F Street, N.E., Washington, D.C. 20549. The public reference room is open to the public on Wednesdays, from 10 a.m. to 3:30 p.m. Members of the public who
have questions about the information available from the public reference room should contact the Commission’s Office of FOIA Services by email at oiapa@sec.gov, or by telephone at 202-551-7900.
In addition, the SEC maintains a website at which the documents concerning the Group that have been filed or furnished electronically may be inspected. These documents can be
obtained in electronic form at http://www.sec.gov, as well as from certain commercial document retrieval services. Neither information contained on the SEC’s website nor information gathered from commercial document retrieval services forms part
of this Form 20-F.
Not applicable.
The following section describes the risks to which Credicorp is exposed and the management tools used to measure and control these. As a result of its financial activities,
including lending, borrowing, trading and investing, the Group faces risks which could incur potential losses if adverse changes occur.
The Group’s principal activity consists of receiving deposits from customers, mainly at fixed rates and for different periods, and investing these funds in high-quality
assets, using financial instruments (such as derivatives) to cover potential risk factors and to take advantage of market movements on securities, bonds, currencies and interest rates. Additionally, the Group places these deposits with legal
entities and individuals, considering the financial costs and expected profitability.
We also seek to raise margins by lending to commercial and retail customers through a range of financial products. These activities involve not only on-balance sheet loans and
advances but also off-balance sheet facilities and other commitments, such as letters of credit and performance bonds.
Given the Group’s activities, it has a framework for risk appetite, a cornerstone of its risk management. The risk management processes involve continuous identification,
measurement, treatment, and monitoring of potential risk. The Group is exposed, principally, to credit, non-financial risks, market risk, liquidity risk, model risk and insurance technical risk.
In order to carry out adequate risk management, Credicorp has established a structure of governance with different levels of oversight.
Governance Structure
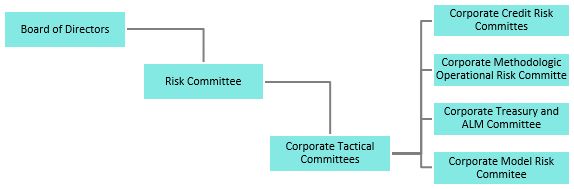
The highest level of risk governance oversight for Credicorp Ltd. and Grupo Crédito S.A. is the Board of Directors:
| • |
Credicorp’s Board of Directors is responsible for the approval of the levels of risk appetite that Credicorp Ltd. is prepared to assume. The Board of Directors also oversees the Group’s level of compliance with the risk appetite and
level of risk exposure, as well as the relevant improvements in the risk management approaches of the Group.
|
| • |
Grupo Crédito S.A.’s Board of Directors is responsible for the overall risk management approach and the approval of the levels of risk appetite that Grupo Crédito S.A. and subsidiaries are prepared to assume. Furthermore, it approves
the guidelines and policies for comprehensive risk management. The Board also establishes an organizational culture that emphasizes the importance of risk management, oversees the internal control system and ensures compliance to the risk
appetite.
|
| • |
The Board of Directors of each subsidiary is responsible for aligning the risk management approach established by Credicorp’s Board of Directors to fit their particular context. To that end, each Board establishes a framework for risk
appetite, policies and guidelines.
|
The second level of oversight of risk governance for Credicorp Ltd. and Crédito S.A. is the Risk Committee:
| • |
The Credicorp Risk Committee, representing Credicorp’s Board of Directors, proposes risk appetite levels for Credicorp Ltd. Furthermore, it considers the level of compliance with the risk appetite and the level of risk exposure, as
well as the relevant improvements, when assessing the Group’s comprehensive risk management.
|
| • |
The Grupo Credito Risk Committee, representing Crédito S.A.’s Board of Directors (including risk management of Credicorp subsidiaries), defines the strategies used for the adequate management of the different types of risks and the
supervision of risk appetite. In addition, the committee establishes principles, policies and guidelines for risk management.
|
For more information about The Board of Directors, The Risk Committees and its functions, please refer to the following section: ITEM 6. DIRECTORS, SENIOR MANAGEMENT AND
EMPLOYEES – 6.C Board Practices.
The Grupo Credito Risk Committee (including risk management of Credicorp subsidiaries) is supported by the following committees, which report periodically on all relevant
changes or issues relating to the risks being managed:
| a) |
Corporate Credit Risk Committees
|
The Corporate Credit Risk Committees (retail and wholesale) are responsible for reviewing the level of the credit risk appetite, limits of exposure and implementation of
corrective measures in case of deviations. In addition, the committees propose credit risk management guidelines within the framework of governance and organization for the comprehensive management of credit risks. Furthermore, the committees
propose the approval of any changes to the credit risk management functions and report important findings to the Risk Committee.
| b) |
Corporate Methodologic Operational Risk Committee
|
The Corporate Methodologic Operational Risk Committee is responsible for monitoring the operational risk indicators of each of the Group’s companies and the progress of the
implementation of operational risk and business continuity methodologies. Additionally, the committees share best practices relevant to major challenges faced by the Group’s companies.
| c) |
Corporate Treasury and ALM Risk Committee
|
The Corporate Treasury and Assets Liability Management (ALM) Risk Committee is responsible for analyzing and proposing objectives, guidelines and policies for the treasury and
ALM risk management of the Group’s companies. Furthermore, the committee is responsible for monitoring the market risk indicators and appetite limits for Credicorp and each of the Group’s companies. Additionally, it receives reports regarding the
actions to implement corrective measures in case of deviations regarding the levels of risk appetite and tolerance assumed by the Group’s companies. Furthermore, the committee is responsible for proposing the approval of any changes in the
treasury and ALM risk management functions and for reporting any findings to the Risk Committee.
| d) |
Corporate Model Risk Committee
|
The Corporate Model Risk Committee is responsible for analyzing and proposing corrective actions in case of deviations from the model risk appetite limits. Furthermore, the
committee proposes the creation and/or modification of the model risk management governance structure. It also monitors the data and analytics strategy of the Group and the health status of its model portfolio. Additionally, it is responsible for
informing the Risk Committee about exposures related to model risk, involving variations in the risk profile.
In order to carry out the correct risk management, Credicorp maintains a management structure according to its needs and based on the risks to which it is exposed.
Credicorp Risk Management Structure
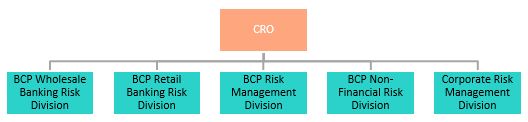
Chief Risk Officer (CRO)
The CRO is responsible for implementing policies, procedures, methodologies, and actions to identify, measure, monitor, mitigate, report and control the different types of
risks to which the Group is exposed. It also participates in the creation of the strategic plans of the business units to ensure compliance to the risk appetite metrics approved by the Board of Directors. Furthermore, it emphasizes the importance
of each unit’s role in defining and identifying actions regarding risk management.
Likewise, the CRO is responsible of the level of compliance with the risk appetite and the level of exposure assumed by Grupo Crédito S.A. and other Credicorp subsidiaries.
Also, it reports the relevant improvements in the comprehensive risk management of Grupo Crédito S.A. and other Credicorp subsidiaries. In addition, it proposes to the Credicorp Risk Committee the risk appetite levels for Credicorp Ltd.
All issues regarding Credicorp’s corporate risk management are under the responsibility of Credicorp's CRO, who is also the CRO of Credicorp Ltd. and Grupo Crédito S.A. So
that this responsibility can be adequately fulfilled, it was decided that those three positions should be held by the same person. Credicorp’s CRO reports to the CEO but has full independence regarding risk decisions, which are discussed in
Credicorp’s Risk Committee.
The Central Risk Management units with corporate risk functions are the following:
| a. |
Wholesale Banking Risk Division
|
This Division is responsible for proposing credit policies and criteria for evaluating and managing credit risks assumed by lending to wholesale clients. It evaluates and
approves loan proposals and suggests their approval to the higher instances for those that exceed its autonomy. These policies and criteria are established based on policies set by the Board of Directors and in accordance with the laws and
regulations applicable. In addition, it measures the evolution of the risk faced by wholesale clients and identifies possible signs of deterioration in their payment capacity, taking actions to mitigate or resolve them.
| b. |
Retail Banking Risk Division
|
The Retail Banking Risk Division is responsible for managing the risk profile of the retail portfolio and promoting retail credit risk specific guidelines that are consistent
with the overall guidelines and risk policies set by the Board of Directors. Additionally, it participates in defining the products and campaigns aligned with these policies; as well as in the design, optimization and integration of credit
assessment tools and income estimation for credit management.
| c. |
Risk Management Division
|
The Risk Management Division is responsible for ensuring that risk management directives and policies comply with those established by the Board of Directors. In addition, it
is responsible for supervising the process of risk management and coordinating with the Group’s companies involved in the process, promoting standard risk management aligned with best practices. It also has the task of informing the Board of
Directors of global exposure to risks, by type of risk, as well as the specific exposure of each of the Group’s companies.
| d. |
Non-Financial Risks Division
|
The Non-Financial Risks Division is responsible for defining a non-financial risks strategy aligned with the objectives and risk appetite set by the Board. This strategy seeks
to strengthen the management process, generate synergies, optimize resources and achieve better results among the units responsible for managing non-financial risks. Additionally, in order to achieve its objectives, the Division promotes
corporate risk culture, develops risk skills and tools, defines non-financial risk indicators and generates and keep track of strategic projects and initiatives.
The Non-Financial Risks Division is composed of the following units: Non-Financial Risk COE, Non-Financial Risk Tribe and Corporate Security and Cybercrime Operations Center.
| e. |
Corporate Risk Management Division
|
The Corporate Risk Division´s scope the risk management of Credicorp’s subsidiaries (not including BCP Stand-alone) and is responsible for managing day-to-day risk under the
risk appetite framework approved by our senior management; ensuring that corporate policies and guidelines are applied uniformly between the subsidiaries. This Division also proposes strategic initiatives for better risk management, proposes
criteria and methodologies to facilitate the process of risk management and submits risk management reports to the Corporate CRO and the Corporate Risk Committees.
To manage the risks to which it is exposed, Credicorp uses different guidelines. This allows Credicorp to maintain adequate risk levels to generate value for the organization
and investors.
Risk Appetite
The Board of Directors annually approves the risk appetite framework defining the maximum level of risk that the organization is willing to tolerate, as it seeks to attain its
strategic and financial objectives. In order to ensure consistency with the Group's corporate risk vision, the Board of Directors, through the corporate Risk Committee, has the function of reviewing and approving the risk appetite of each
subsidiary, considering its business model. This risk appetite framework is based on "core" and "specific" metrics:
| • |
Core metrics: are intended to preserve the organization’s strategic pillars, defined as solvency, liquidity, profit and growth, income stability, balance sheet structure and cybersecurity risk.
|
| • |
Specific metrics: are intended to monitor on a qualitative and quantitative basis the various risks to which every company of the Group is exposed, as well as defining a tolerance threshold of each of those risks, so that the risk
profile set by the Board of Directors is preserved and any risk concentration is anticipated on a more granular basis.
|
Risk appetite is measured based on the following guidelines:
| (1) |
A risk appetite statement establishes general principles and the qualitative declarations that complement the risk strategy.
|
| (2) |
A metric scorecard is used to define the levels of risk exposure in the different strategic pillars.
|
| (3) |
Risk limits allow control over the risk-taking process within the tolerance threshold established by the Board. Limits also provide accountability for the risk-taking process and define guidelines regarding the target risk profile.
|
| (4) |
A governance scheme seeks to guarantee compliance to the framework through different roles and responsibilities assigned to the units involved.
|
| (5) |
The risk appetite is integrated in the processes of strategic and capital guidelines, as well as in the definition of the budget exercise, facilitating the strategic decision-making process of the organization.
|
During 2022, the Board decided to end the temporary modifications to the Group’s risk appetite approach, which were implemented in 2020 to facilitate crisis management for
business and risk units. This return to normality took place in a context of stronger financial results observed on the risk appetite scorecard. Additionally, we improved the monitoring of cybersecurity and technological obsolescence cascading
down these metrics into the business units’ risk appetite scorecard.
Credicorp's governance and risk management seek to adequately manage the risks to which we are exposed as an organization.
The Group is exposed to credit risk, which is the probability of suffering losses caused by debtors or counterparties failing to comply with payment obligations in on or off
the balance sheet.
Credit risk is the most important risk affecting the Group’s business due to relevance of the Universal Banking and Microfinance LoB and its exposure to this type of risk;
therefore, Management carefully manages its exposure to credit risk. Credit risk exposures arise principally from lending activities that lead to direct loans, though they also result from investment activities. There is also credit risk in
off-balance sheet financial instruments, such as contingent credits (indirect loans), which expose Credicorp to risks similar to direct loans. Likewise, credit risk can also arise from derivative financial instruments as counterparty risk in
those derivatives that currently show positive fair values.
Credit risk levels are defined based on risk exposure limits, which are frequently monitored. Risk exposure limits are established in relation to one borrower or group of
borrowers, geography, and industry segments. Furthermore, the risk limits by product, industry sector and geographical area are approved by the Risk Committee.
| a. |
Credit Risk Measurement
|
All exposures to credit risk (direct or indirect) are mitigated by the Group’s control processes and policies. Exposure to credit risk is managed through regular analysis of
the ability of debtors and potential debtors to meet interest and principal repayment obligations and changes in the credit limits as appropriate.
As part of managing credit risk, provisions for impairment of its portfolio are assigned as of the date of the statement of financial position.
Provisions for loan losses
In accordance with IFRS9 standard, all the financial assets classified or designated as an amortized cost, debt instruments classified as investments at fair value through
other comprehensive income, and indirect loans presented in off-balance accounts are subject to an impairment evaluation.
Measurement of expected credit losses
Measurement of expected credit losses is mainly based on three parameters: probability of default (PD), loss given default (LGD), and exposure at default (EAD), discounted at
the reporting date using the effective interest rate. The estimates, pursuant to IFRS9 parameters, consider not only past due information, but also all relevant credit information, including actual conditions and expected macroeconomic effects in
three scenarios (base, optimistic and pessimistic).
The definitions of the three parameters are as follows:
| • |
Probability of Default (PD): This is a measurement assigned internally to customers and is designed to estimate their probability of default within a specific time horizon. This measurement is obtained through three main components:
(i) the observed credit risk of the portfolio, (ii) the macroeconomic conditions of the main countries where Credicorp operates, and (iii) the individual credit risk of each loan, which is measured through scoring and rating tools. The
definition of default in IFRS9 is consistent with the one used for internal credit risk management purposes, as follows:
|
| 1. |
In the case of retail products, clients are in default if (i) at a specific moment, they are 60 or more days past due, except for mortgages, for which we allow 120 days; or (ii) if they have operations in one of the following
situations: refinanced, restructured, pre-judicial, judicial or write off.
|
| 2. |
In wholesale banking, clients are in default if (i) they pass to Wholesale Collections; (ii) they have an internal classification of deficient with recurrence, doubtful or loss; (iii) they have operations in refinanced, restructured,
pre-judicial, judicial or write off; or (iv) they have significant qualitative signs of impairment. For clients in default with significant exposure, the Risk Management Division makes a specific analysis for each one of them to determine
the expected credit loss, considering the following criteria (among others): (i) the knowledge of the specific situation of the client, (ii) the collaterals and guarantees, (iii) the available financial information, (iv) the actual
condition and perspective of the sector in which the client operates.
|
| • |
Loss Given Default (LGD): This is a measurement that estimates the severity of the loss that would be incurred at the time of the default. It is based on the difference between the contractual cash flows owed and those that the lender
would expect to receive, even after the liquidation of the guarantees (for example: deposits or the equivalent, commodity warrants, immovable properties, ships, machinery and equipment). LGD also considers all the costs incurred during
the recovery process.
|
It is important to mention that when the Group writes off a position, it adjusts the LGD to 100% to add the allowance necessary to reach the required level, in accordance with
our internal policy of write-offs, in which Credicorp’s subsidiaries do not have reasonable expectations of recovering the financial asset in its entirety or a portion thereof.
| • |
Exposure at Default (EAD): This is a measurement that estimates the exposure at the time that the customer goes into default, considering changes in future exposure, for example, in the case of prepayments and/or greater utilization of
unused lines.
|
Provisions for credit losses are measured on each reporting date following a three-stage model of expected credit losses based on the degree of a financial asset’s credit
impairment:
| (1) |
Stage 1: For financial assets with credit risk that has not increased significantly since their initial recognition, a reserve is recognized for losses equivalent to the credit losses expected to occur from defaults in the following 12
months. For those instruments with a maturity of less than 12 months, a probability of default corresponding to the remaining term until maturity is used.
|
| (2) |
Stage 2: For financial assets that have presented a significant increase in credit risk since their initial recognition, but are not considered impaired, a reserve is recognized for losses equivalent to the credit losses expected to
occur during the remaining life of the asset.
|
The definition of “significant increase in credit risk” used on the reporting date compared with the origination date considers the following criteria:
| • |
Whether an account has been more than 30 days in arrears.
|
| • |
Absolute and relative risk thresholds have been assigned by portfolio and risk level, which depend on the credit risk of the subject instrument on the reporting date and the origination date. For example, less risky PD assets have a
broad threshold to move in without migrating to stage 2, in comparison to risky PD assets for which a small increase in PD can force them to migrate to stage 2.
|
| • |
Whether follow-up systems, alerts and monitoring of risk portfolios are integrated, as established by the current risk policy in the Wholesale and Retail Banking segments.
|
| • |
Alignment criteria are applied to clients that have more than 20% of their position in stage 2. All the rest of their assets in stage 1 get automatically classified as stage 2.
|
| (3) |
Stage 3: For financial assets classified as defaults, with objective evidence of impairment on the reporting date, a provision for these assets reflects the expected credit losses during the residual life of the assets. Alignment
criteria are also applied at this stage.
|
The fundamental difference in the measurement of expected credit losses between stage 1 and stage 2 is the PD horizon. The estimates for stage 1 use a 12-month time horizon,
while the estimates for stage 2 calculate the expected credit loss based on the remaining life of the asset and consider the effect of the significant increase in credit risk. Finally, estimates for stage 3 are based on a “best estimate”
approach, according to the collection process of each asset.
For portfolios that are not material, the Group extrapolates the expected credit loss ratio of portfolios with comparable characteristics.
In 2022, the main methodological calibrations made in the group’s internal credit risk models were as follows:
| • |
PD models: in accordance with our internal governance scheme, we continued monitoring the performance of PD models and implementing the necessary calibrations to maintain an appropriate measurement of our loan portfolio’s credit risk.
|
| • |
LGD models: We holistically calibrated this parameter for consumer and SME loans in order to maintain an appropriate measurement of our loan portfolio’s estimated loss at the time of default. In 2022, this calibration included updates
to recovery data, methodological assumptions and certain revisions to better reflect the effects of collateral of mortgage-backed retail banking loans at default on estimation of the recovery rate.
|
The macroeconomic projections were updated as explained in the following paragraphs.
The Group’s expected credit losses are a weighted estimate of three macroeconomic scenarios: base, optimistic and pessimistic; which are based on macroeconomic projections
provided by the internal team of economic research and approved by senior management; these projections are made for the main countries in which Credicorp operates. In each scenario, the Group considers a wide variety of prospective information
as economic inputs, including the growth of the GDP, the inflation rate and the exchange rate.
The macroeconomic scenarios consider the fact that Peru is a small and open economy, dependent on the international environment; with about 60.0% of GDP growth volatility
explained by external factors. These external factors include Peru’s terms of trade, growth of Peru’s main trade partners, and external interest rates. Information on each of these factors is collected to project each scenario for the next three
years.
The aforementioned variables are then incorporated into economic models for the Peruvian economy along with local variables (fiscal and monetary). Two types of models can be
distinguished: (i) the structural forecasting model, and (ii) the financial programming model. The first is a stochastic dynamic general equilibrium model constructed with expectations. The second is constructed based on the main identities of
national accounts according to the financial programming methodology designed by the International Monetary Fund (IMF) and a set of econometric models.
Through this process, Credicorp obtains figures for GDP growth, inflation, exchange rate and other variables for the years 2021, 2022 and 2023.
We estimate that Peru’s GDP will grow approximately between 1.8% and 2.2% in 2023 due to:
| • |
Lower global growth;
|
| • |
The lagged effect on activity as a result of monetary tightening (increase this year in interest rates in dollars and soles by the Central Banks);
|
| • |
Cumulative inflation from December 2021 to December 2023 of approximately 20 percent that has eroded consumer purchasing power;
|
| • |
Decreased public investment by subnational authorities;
|
| • |
Deterioration of private investment in the absence of large new projects and weak business expectations; and
|
| • |
Exhaustion of the post–COVID-19 rebound effect (other than for international inbound tourism).
|
For 2022, probabilities of 50.0%, 25.0% and 25.0% were considered for the base, optimistic and pessimistic scenarios respectively. As a result, we estimated our provision based on
an expected value of the three GDP projections, that gave us a growth of around 2.3% for 2022.
The probabilities assigned to each scenario and projection year are validated by fan chart analysis, which uses a probability function to identify and analyze:
| • |
The central tendency of the projections.
|
| • |
The dispersion that is expected around this value.
|
| • |
The values that are higher or lower than the central value that are more or less probable.
|
The following table provides a comparison of the reported expected credit loss for Credicorp’s loan portfolio and the expected credit loss under the three scenarios:
|
At December 31,2022
|
Optimistic Scenario
|
Base Case Scenario
|
Pessimistic Scenario
|
Reported ECL under IFRS9
|
|
(in thousands of Soles)
|
||||
|
Total Loans
|
8,457,825
|
8,517,295
|
8,631,531
|
8,530,986
|
For further information about the IFRS9 measurement of the expected credit loss, see Note 3(i) to the consolidated financial statements.
For historical data regarding our loan loss reserves, see “ITEM 4. INFORMATION ON THE COMPANY – 4.B Business Overview – (7) Selected Statistical Information – 7.3 Loan Portfolio –
7.3.12 Allocation of Loan Loss Reserves”.
ESG Risks Management
Credicorp manages ESG topics by focusing on the incorporation of factors to mitigate risks, preserve value and generate it in its loan books and investment portfolios. Below are the 2022 achievements
related to the scope of the ESG Risk Team from the different fronts:
Environmental Taxonomy
| • |
The BCP Environmental Taxonomy was approved for 12 economic sectors and 3 transversal sectors (Energy Efficiency, Circular Economy, and Water Management and Sanitation).
|
| • |
The Sustainable Operations Committee was created for labeling and referral to special funding.
|
| • |
The Wholesale Banking team was trained in the eligibility criteria of the BCP Environmental Taxonomy and related toolkits were implemented for use by senior and middle managers. This was done through 14 training sessions
for Business and Corporate Banking, based on the impact on their portfolios, finally training 200 employees.
|
Appetite
| • |
The list of exclusions with an ESG focus was updated and approved and its implementation within the Credit Process and in the analysis of the BCP Treasury started, updating the impacting credit policies. The exclusion list
was approved in corporate risk forums that include members of the Board.
|
| • |
Based on exposure variables and environmental impact, we employ a qualitative approach which will allow us to know in-depth the makeup of the Wholesale Banking portfolio from an ESG perspective. This approach will encourage
placements in sectors with positive environmental impact such as real estate, energy, cement, steel, fisheries, textiles and agriculture, which are aligned to BCP Environmental Taxonomy eligibility criteria.
|
Organization, Governance and Culture
| • |
ESG Governance was integrated into existing forums (investment, credit and risk committees) for decision-making and for the definition of roles related to ESG issues.
|
| • |
Training was carried out among high-level of management and employees in the Risk and Business teams regarding issues related to ESG risk management.
|
Identification, Evaluation and Treatment
The main environmental, social and governance risks for our financial activities were prioritized through a multidisciplinary evaluation, which included our Risk and Business
units, specialized consulting, conversations with leading banks in the sector, review of external sources (for example, MSCI, the Sustainability Accounting Standards Board and, IFC) and internal sources (through current Environmental
Questionnaires) and dialogues with relevant clients of different sectors.
| • |
The 10 sectors with the greatest materiality (and climate impact) and the most relevant ESG risks for each sector were identified. The sectors identified were Hydrocarbons, Energy, Fishing, Mining, Agriculture, Construction
Materials, Transportation, Textiles, Construction, and Real Estate. They represent approximately 35% of the total exposure of the wholesale portfolio. The wholesale portfolio is diversified (made up of more than 30 sectors)
and a monthly control is carried out on the established limits, which is reported to the respective risk instances, reaching the BCP Risk Committee.
|
| • |
The environmental risks identified were classified as physical, transition and anthropic risks.
|
| • |
Until 2021, there were questionnaires for 4 sectors. In 2022, a proposal for 10 ESG questionnaires was developed, complementing the 4 already existing questionnaires. The proposed questionnaires, which finance clients must
answer annually, are based on the indicated sectorial prioritization, including questions related to environmental, social and governance aspects.
|
| • |
The report of the independent appraisers with respect to BCP’s guarantees was enhanced through inclusion of questions on environmental and social variables.
|
For the BCP Treasury investment portfolio, methodologies have been adapted to include ESG factors in issuer analysis and decision-making.
Likewise, in our Retail operations, for BCP (Small and Medium Enterprises, Real Estate, Mortgage, Vehicle) and Mi Banco in the scope of the ESG Risk team began sharing best
practices for the integration of ESG factors in each of the mentioned business units.
On the investment business front, after defining the aspirations of the participating subsidiaries, work plans were established for each of them, seeking to achieve corporate
alignment in the different approaches to ESG risk management, while recognizing that the participating subsidiaries are at different starting points.
During 2022, of ESG aspects have been integrated in the strategies of each subsidiary, which has resulted in the following achievements:
| • |
Approval and alignment to Credicorp's corporate exclusions, for both financing and investments. The credit policies for financing have been adapted to include the new definition of excluded activities.
|
| • |
Integration of ESG governance principles in the current forums (investment, credit, risk committees) for decision-making and for the definition of roles related to ESG issues in the three lines of defense of each
subsidiary: business, risk and audit.
|
| • |
Responsible Investment Policies were developed and published for each of the following subsidiaries: Credicorp Capital, Prima AFP and Pacífico Seguros and Sustainability Reports, which integrate ESG aspects in the
evaluation of assets and Climate Change Policy, were implemented for Prima AFP.
|
| • |
Creation of methodologies to incorporate ESG factors in issuer analysis and decision making.
|
| • |
Training for directors, senior managers and employees of the financing and investment areas in the risk and business teams regarding ESG issues.
|
The Non-Financial Risks Division is composed of the following units: (i) Non-Financial Risk CoE, (ii) Non-Financial Risk Tribe, and (iii) Corporate Security and Cybercrime
Operations Center.
Non-Financial Risk CoE - Operational Risk
Operational risk is the possibility of the occurrence of losses arising from inadequate processes, human error, failure of IT, relations with third parties or external events.
Operational risks are tied to internal fraud, external fraud, labor relations, job security, relations with customers, business products and practices, damages to material assets, business and systems interruption, and failures in
process execution, delivery, and management of processes. Operational risks exclude strategic and reputational risks (with the exception of companies under Colombian regulations, under which reputational risk is included in
operational risk). Operational risks can lead to financial losses and have legal or regulatory consequences.
In order to develop an efficient risk culture, the Group records operational risks and their respective process controls. The Risk Map, which is a document that lists all the risks
that could affect the organization and their characteristics, permits their monitoring, prioritization and proposed treatment. The Group also carries out an active cybersecurity and fraud prevention management program, which is
aligned with the best international practices.
Moreover, the business continuity management system enables the establishing, implementing, operating, monitoring, reviewing, maintaining and improving of business continuity based
on best practices and regulatory requirements. The Group implements recovery strategies for the resources that support important products and services, which are periodically tested to measure the effectiveness of such strategies.
Information security management is carried out through a systematic process, which is documented and known by the entire organization, pursuant to best practices and regulatory requirements. The Group designs and develops the
guidelines described in the policies and procedures to have strategies for the availability, confidentiality, and integrity of the information of assets of the organization. To manage operational risk, cybersecurity, fraud prevention
and business continuity, corporate guidelines are used, and methodologies and best practices are shared among the Group's companies.
Finally, in the event of the materialization of operational risks, the Group maintains a diverse portfolio with non-financial risk transfer options, mainly through its contracted
insurance policies. These policies cover losses arising from fraud, civil and professional liability, cyber risks, and damage to physical assets, among other things. The coverage needs of key areas and new emerging risks are
constantly being analyzed, leading to modifications to the existing policies and the incorporation of new insurances, taking into account the Group’s risk appetite and the expected and unexpected levels of our losses. This practice
allows us to optimize the Group's insured risk profile.
Cybersecurity
Credicorp focuses on the most efficient strategies to reduce exposure to cybersecurity risk and, thereby, meet the Group's risk appetite. We are aware that incidents of
cybersecurity in the financial sector have grown exponentially in terms of frequency and resulting damage to the reputations of affected organizations. Our clients’ trust is fundamental to our business; and as such, we prioritize
strengthening our cybersecurity infrastructure and address this strategic front in all of our lines of business. Credicorp applies different levels of controls to the different exposed areas and companies. To this end, it maintains an
investment program, which allows it to have the technologies and processes necessary to keep the Group's operations and assets safe.
Value creation at companies and effective digitalization go hand-in-hand. As part of this digital transformation, cybersecurity has become a critical enabler to ensure business
continuity, resilience, and data privacy. We have made cybersecurity-related changes to how we work to contemplate long-term remote or hybrid work models. This is particularly challenging in that it entails both protecting security
and providing employees with efficient access to their applications and work tools.
As part of cybersecurity management, the Group has lines of action to mitigate risks, as well as implementation priorities and improvements that take into account the different
realities of its companies. These lines of action include:
| • |
Cybersecurity strategy, which is constantly reviewed in light of global developments, as well as applicable, standards, frameworks and regulations, in order to guarantee business continuity, resilience and data privacy.
Given its importance, cybersecurity at Credicorp involves the entire organization, both at the corporate level and at the subsidiary level; and we have implemented strategies, policies, and guidelines standardizing the levels
of compliance with cybersecurity controls in each of the Group's companies.
|
| • |
Adoption of NIST 800-53 and the Secure Controls Framework (SCF) as coverage frameworks, as well as the FFIEC Cybersecurity Assessment Tool, ISO 27002, NIST CSF and CSA, among other tools and frameworks, which allow
cybersecurity controls to be adapted for each of the Group companies.
|
| • |
Credicorp has developed a set of information security and cybersecurity policies for risk management and the protection of information, personal data and technological assets. Our Information Security Policy provides a
reference framework to guide management of Credicorp’s information assets. The scope of this policy applies to both the group’s employees and third-party providers with access to confidential information.
|
| • |
An awareness program, including constant training that generates a culture of cybersecurity consciousness in all the Group's companies. We make sure that our employees are prepared and committed to cybersecurity to ensure
that the measures, processes and technologies of the Cybersecurity Program are applied effectively.
|
| • |
Cybersecurity indicators, to ensure alignment between the operations and business strategies of group companies.
|
| • |
Governance of third parties, to ensure adherence to and compliance with the Group's policies by third parties.
|
| • |
The implementation of security technologies, to protect all of the Group’s business processes.
|
| • |
Security assurance, applying due diligence, reinforcing cybersecurity controls in frequency, quantity and rigor to promote a correct level of response to new threats.
|
| • |
Integration of secure software development frameworks that allows adequate management and remediation of vulnerabilities in an early and timely manner.
|
Corporate Security and Cybernetic Crime
The Corporate Security and Cybercrime Operations Center is responsible for detecting and responding to fraud incidents and physical security. These tasks are carried out through
teams specialized in transactional monitoring, cybercrime investigations, physical security, electronic security, disaster risk management and strategic intelligence activity. These capabilities are designed to safeguard the security
of the collaborators, clients, suppliers and assets of the organization. Finally, this Operations Center has established a solid relationship with stakeholders and financial institutions in the region.
Management has in place an integral security scheme for Credicorp which includes variables for detection, response and recovery. The implemented strategy consists of training for
clients (both internal and external), inspections at headquarters and agencies, generation of early alerts for possible risks, real-time monitoring and continuous reporting, specialized forensic investigation and cyber intelligence.
Within this, state-of-the-art technological tools for transactional monitoring, video surveillance and advanced risk profile analysis models have been implemented for the detection of internal fraud.
Market Risk
The Group is exposed to market risk, which is the risk that the fair value or future cash flows of a financial instrument will fluctuate because of changes in market prices. Market
risks arise from open positions in interest rates, currency, commodities and equity products; all of which are exposed to general and specific market movements and changes in the level of volatility of prices such as interest rates,
credit spreads, foreign exchange rates and equity prices. Due to the nature of the Group’s current activities, commodity price risk has not been approved; thus, this type of instrument is not traded.
1. Market Risk Measurements
The Group separates exposures to market risk into two groups: (i) risks arising from value fluctuation of trading portfolios recognized at fair value through profit or loss, due to
movements of market rates or prices (Trading Book) and (ii) risks arising from changes in the structural positions of non-trading portfolios, due to movements of the interest rates, prices and foreign exchange ratios (Banking Book).
Most of the structural portfolios are recorded at amortized cost and at fair value with changes in other comprehensive income.
The risks that trading portfolios (Trading book) face are managed through Value at Risk (VaR) historical simulation techniques; while non-trading portfolios (Banking Book) are
monitored using rate sensitivity metrics, which are a part of ALM.
Trading Book
The trading book is characterized by liquid positions in stocks, bonds, foreign currencies and derivatives, arising from transactions in which the Group acts as counterparty with
the customers or with the market. This portfolio includes investments and derivatives classified by Management as held for trading.
Value at Risk (VaR)
Based on a number of assumptions about changes in market conditions, we apply VaR to our trading portfolios to estimate the market risk of our positions and our maximum losses.
Daily calculation of VaR is a statistically-based estimate of the potential loss on our current portfolio caused by adverse market movements.
VaR expresses the “maximum” amount the Group might lose, but only to a certain level of confidence (99%). There is therefore a specified statistical probability (1%) that actual
loss could be greater than the VaR estimate.
The time period used to calculate VaR is one day. However, because the VaR model assumes a ten-day “holding period” within which positions can be closed, the one-day VaR is
amplified to a ten-day time frame and calculated by multiplying the one-day VaR by the square root of 10. This adjustment is exact only if the changes in the portfolio in the following days have a normal distribution identical and
independent; otherwise, the 10-day VaR is an approximation.
VaR limits and assumptions are set based on the risk appetite and trading strategy of each subsidiary. The assessment of past movements is based on historical one-year data and 133
market risk factors, which are comprised as follows: 36 market curves, 71 stock prices, 22 mutual funds values and 4 volatility series. The Group applies these historical changes into rates to its current positions (a method known as
historical simulation). Management believes that the market risk factors incorporated into its VaR model are adequate to measure the market risk to which the Group’s trading book is exposed.
The use of this approach does not prevent losses outside of these limits in the event of more significant market movements. Losses exceeding the VaR figure should occur, on average
under normal market conditions, not more than once every hundred days. VaR limits have been established to control and keep track of our risks taken. These risks arise from the size of our positions and/or the volatility of the risk
factors embedded in each financial instrument. Regular reports are prepared for the Treasury and ALM Risk Committee, our risk management committees and our senior officers.
VaR results are used to generate economic capital estimates by market risk, which are periodically monitored and are part of the overall risk appetite of each subsidiary.
Furthermore, Credicorp has internal appetite risk limits for the trading book which are monitored and reported to the Credicorp Market Risk Committee. In VaR calculations, the foreign exchange effect is not included and as such the
calculation is measured assuming a constant exchange rate. For further information, see “ITEM 11. QUANTITATIVE AND QUALITATIVE DISCLOSURES ABOUT RISK MANAGEMENT – (13) Foreign Currency Exchange Rate Risk”.
During 2022, Credicorp’s VaR increased due to higher interest rate risk resulting from greater exposure to fixed-income assets in the Colombian market. The VaR remains contained
within the limits of the risk appetite established by the Group's Risk Management and its subsidiaries.
As of December 31, 2020, 2021 and 2022, our VaR by risk type were as follows:
|
2020
|
2021
|
2022
|
||||||||||
|
in thousands of Soles
|
||||||||||||
|
Interest rate risk
|
163,981
|
35,721
|
74,343
|
|||||||||
|
Price risk
|
6,529
|
4,637
|
5,219
|
|||||||||
|
Volatility risk (1)
|
708
|
2,662
|
2,032
|
|||||||||
|
Diversification effect
|
(857
|
)
|
(4,916
|
)
|
(7,347
|
)
|
||||||
|
Consolidated VaR by risk type (2)
|
170,361
|
38,104
|
74,247
|
|||||||||
| (1) |
Volatility risk
|
| (2) |
Amplified to the holding period, adjusted by a 10-days period of liquidation.
|
In VaR calculation, financial instruments from the trading book were taken.
On the other hand, the instruments recorded as fair values through profit or loss, which are not part of the selling business model are considered as part of the sensitivity
analysis of rates and market prices in the next section (11.11). See the chart of sensitivity of earnings at risk, net economic value and price sensitivity.
The information disclosed in these charts addresses the VaR calculation for the entire consolidated Group. However, minimum, maximum and average VaR calculations are estimated only
for BCP Stand-alone’s trading book. The reason for this is that, although there is a daily VaR calculation for all subsidiaries with trading book positions, the entire Group is consolidated once a month in order to calculate a VaR for
reporting purposes and to monitor the economic capital limit. Therefore, since there is not a sufficient sample for the Group, minimum, maximum and average VaR are calculated only for the BCP Stand-alone subsidiary. Nonetheless, the
Company believes it is relevant information considering that BCP Stand-alone’s trading risk is close to the total trading risk of the Group’s portfolio.
For the years ending on December 31, 2020, 2021 and 2022, BCP Stand-alone’s VaR statistics were as follows:
|
2020
|
2021
|
2022
|
||||||||||
|
in thousands of Soles
|
||||||||||||
|
Average daily
|
36,949
|
22,839
|
22,096
|
|||||||||
|
Highest
|
114,59
|
46,435
|
37,025
|
|||||||||
|
Lowest
|
1,659
|
12,045
|
11,506
|
|||||||||
Backtesting
Backtesting is performed on the trading book to verify the predictive power of the VaR calculations. Backtesting compares results of the positions considered for the calculation of
VaR and the calculation of the VaR from the previous day. Backtesting exceptions occur when real losses exceed the estimated VaR for the previous day. In order for a backtesting analysis to be considered valid, it should be based on a
minimum of 252 observations. Every month, backtesting exceptions are analyzed and reports are prepared to explain the results. These reports are presented to the Treasury and ALM Risk Committee and our Senior Officers. Backtesting is
estimated only for BCP Stand-alone’s trading book, since it should be based on a minimum of 252 observations and the Group’s VaR is consolidated only once a month for reporting purposes and to monitor the Group’s economic capital
limit.
VaR Backtesting – VaR (1-Day, 99% in millions of Soles) – 2022:
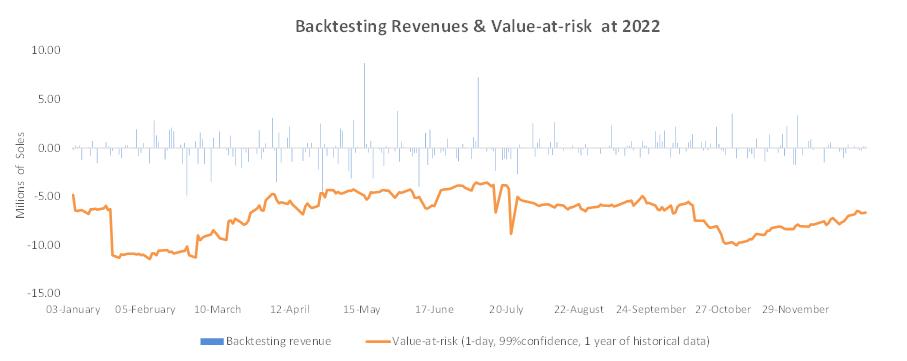
The backtesting analysis uses the Kupiec “proportion of failures” test to determine if the number of exceptions is statistically different from the one expected by the VaR
confidence level. Since the test uses the last 252 observations and a 99% VaR confidence level, the model will indicate an underestimation of the probability of large losses from the sixth exception, unless a fitting factor is applied
to the VaR to correct the model underestimation.
During 2022, BCP Stand-alone did not record any backtesting exceptions. According to the selected test, we believe that the VaR model is statistically correct.
Stress test
A stress test is used to calculate the maximum loss that the Group incurs in light of daily shocks to the market risk factors from March 18, 2008, until the effective date of the
stress test. The maximum loss is considered the outcome for the stress test.
The methodology for the stress test assumes a certain “holding period” until positions can be closed (1 - 10 days). The time period used to calculate the losses is one day;
however, the final figures are amplified to a 10-day time period and the final calculation is determined by multiplying the one-day losses times by the square root of 10. This adjustment will be exact only if the changes in the
portfolio in the following days follow a normal distribution that is identical and independent; otherwise, the worst loss of the ten-day period will be an approximation.
The results of our stress test as of December 31, 2020, 2021, 2022, by risk type, were as follows:
|
2020
|
2021
|
2022
|
||||||||||
|
in thousands of Soles
|
||||||||||||
|
Interest rate risk
|
163,981
|
35,721
|
74,343
|
|||||||||
|
Price risk
|
6,529
|
4,637
|
5,219
|
|||||||||
|
Volatility risk (1)
|
708
|
2,662
|
2,032
|
|||||||||
|
Diversification effect
|
(857
|
)
|
(4,916
|
)
|
(7,347
|
)
|
||||||
|
Consolidated VaR by risk type
|
170,361
|
38,104
|
74,247
|
|||||||||
| (1) |
Volatility risk is the potential loss that result from fluctuations in option implied volatilities
|
Given the possibility of any scenario of local or international uncertainty, continuous evaluations of stress test scenarios were carried out in order to anticipate potential
losses for the Group and generate action plans to mitigate losses. Additionally, we reviewed the current models and methodologies was carried out to ensure that volatility was included in the market risk indicators and valuations of
the instruments.
Banking Book
The management of risks associated with long-term and structural positions is called ALM. Non-trading portfolios, which comprise the banking book, are exposed to different
sensitivities that can deteriorate the value of the Group’s assets relative to its liabilities and hence can reduce the Group’s net worth. Management of the Banking Book includes management of interest rates and the analysis of the
repricing GAP.
Interest Rate Risk
The ALM-related interest rate risk arises from eventual changes in interest rates that may adversely affect the expected gains (risk gains) or market value of financial assets and
liabilities reported on the statement of financial position (net economic value). The Group assumes the exposure to the interest rate risk that may affect their fair value as well as the cash flow risk of future assets and
liabilities.
The Risk Committee sets the guidelines regarding the level of unmatched repricing of interest rates that can be tolerated, which is periodically monthly monitored by our ALCO.
Corporate policies include guidelines for the management of the Group’s exposure to the interest rate risk. These guidelines are implemented considering the features of each
segment of business in which the Group entities operate.
In this regard, Group companies that are exposed to the interest rate risk are those in which earnings are based on interest, such as credits, investments and technical reserves.
Interest rate risk management at BCP Stand-alone, BCP Bolivia, Mibanco, ASB, Grupo Pacífico and Mibanco Colombia is carried out by performing a repricing gap analysis, sensitivity analysis of the financial margin (EAR) and sensitivity
analysis of the net economic value (EVE). These calculations consider different rate shocks in stress scenarios.
Repricing Gap- Analysis
Repricing gap analysis identifies the term structure of interest rate mismatches within the Group’s balance and out of balance assets and liabilities. Different time bucket schemes
may be used in the report. Through this analysis, Management can identify the time period in which interest rate variations may have potential impacts.
The tables below provide information about our financial instruments that are sensitive to interest rates, including deposits, bonds and other obligations, and summarize our
exposure to interest rate risks as of December 31, 2020, 2021 and 2022. It includes the Group’s financial instruments at carrying amounts, categorized into columns based on the earlier of their contractual repricing date and
maturity/call date. The products are distributed according to their contractual behavior or distribution assumptions (for those without contractual maturity). In addition, some credit products prepayment assumptions are considered.
|
As of December 31, 2020
|
||||||||||||||||||||||||||||
|
Up to 1
|
1 to 3
|
3 to 12
|
1 to 5
|
More than 5
|
Non-interest
|
Total
|
||||||||||||||||||||||
|
month
|
months
|
months
|
years
|
years
|
bearing
|
|||||||||||||||||||||||
|
in thousands of Soles
|
||||||||||||||||||||||||||||
|
Assets
|
||||||||||||||||||||||||||||
|
Cash, due from banks, receivables from reverse repurchase agreements and security borrowing
|
20,110,489
|
1,607,867
|
2,052,436
|
7,682,481
|
149,669
|
7,544,354
|
39,147,296
|
|||||||||||||||||||||
|
Investments
|
4,639,795
|
11,068,740
|
2,777,817
|
8,783,106
|
20,934,358
|
502,455
|
48,706,271
|
|||||||||||||||||||||
|
Loans, net
|
12,721,639
|
15,427,902
|
31,709,621
|
54,248,434
|
16,352,436
|
(2,698,907
|
)
|
127,761,125
|
||||||||||||||||||||
|
Financial assets designated at fair value through profit and loss
|
-
|
-
|
-
|
-
|
-
|
823,270
|
823,270
|
|||||||||||||||||||||
|
Premiums and other policies receivables
|
897,086
|
25,288
|
9,472
|
5,377
|
-
|
-
|
937,223
|
|||||||||||||||||||||
|
Accounts receivable from re-insurers and co-insurers
|
726
|
164,184
|
730,963
|
1,930
|
675
|
20,941
|
919,419
|
|||||||||||||||||||||
|
Other assets
|
83,113
|
2,961
|
34,482
|
9,539
|
-
|
2,176,901
|
2,306,996
|
|||||||||||||||||||||
|
Total assets
|
38,452,848
|
28,296,942
|
37,314,791
|
70,730,867
|
37,437,138
|
8,369,014
|
220,601,600
|
|||||||||||||||||||||
|
Liabilities
|
||||||||||||||||||||||||||||
|
Deposits and obligations
|
38,284,217
|
10,646,664
|
18,968,119
|
62,281,065
|
9,594,605
|
2,590,832
|
142,365,502
|
|||||||||||||||||||||
|
Payables from repurchase agreements, security lending, due to banks and correspondents
|
620,946
|
2,900,084
|
7,709,973
|
19,573,712
|
3,042,388
|
54,771
|
33,901,874
|
|||||||||||||||||||||
|
Financial Liabilities designated at fair value through profit or loss
|
-
|
-
|
-
|
-
|
-
|
561,602
|
561,602
|
|||||||||||||||||||||
|
Accounts payable to reinsurers and coinsurers
|
72,060
|
209,035
|
40,349
|
17,002
|
-
|
-
|
338,446
|
|||||||||||||||||||||
|
Technical, insurance claims reserves and reserves for unearned premiums
|
296,493
|
810,514
|
1,355,486
|
3,133,235
|
5,752,899
|
326,449
|
11,675,076
|
|||||||||||||||||||||
|
Bonds and notes issued
|
3
|
425,231
|
1,238,141
|
13,867,807
|
616,225
|
172,000
|
16,319,407
|
|||||||||||||||||||||
|
Other liabilities
|
601,545
|
49,851
|
8,185
|
-
|
-
|
3,247,834
|
3,907,415
|
|||||||||||||||||||||
|
Equity
|
-
|
-
|
-
|
-
|
-
|
25,445,647
|
25,445,647
|
|||||||||||||||||||||
|
Total liabilities and equity
|
39,875,264
|
15,041,379
|
29,320,253
|
98,872,821
|
19,006,117
|
32,399,135
|
234,514,969
|
|||||||||||||||||||||
|
Off-Balance sheet items
|
||||||||||||||||||||||||||||
|
Derivatives assets
|
547,271
|
1,307,322
|
557,277
|
341,564
|
-
|
-
|
2,919,134
|
|||||||||||||||||||||
|
Derivatives liabilities
|
112,357
|
1,017,607
|
360,010
|
1,046,481
|
238,600
|
-
|
2,775,055
|
|||||||||||||||||||||
|
Total Off-Balance Sheet items
|
434,914
|
289,715
|
197,267
|
(704,917
|
)
|
(238,600
|
)
|
-
|
(21,621
|
)
|
||||||||||||||||||
|
Marginal gap
|
(987,502
|
)
|
13,545,278
|
8,191,805
|
(28,846,871
|
)
|
18,192,421
|
(24,030,121
|
)
|
(13,934,990
|
)
|
|||||||||||||||||
|
Accumulated gap
|
(987,502
|
)
|
12,557,776
|
20,749,581
|
(8,097,290
|
)
|
10,260,831
|
(13,934,990
|
)
|
-
|
||||||||||||||||||
|
As of December 31, 2021
|
||||||||||||||||||||||||||||
|
Up to 1
|
1 to 3
|
3 to 12
|
1 to 5
|
More than 5
|
Non-interest
|
Total
|
||||||||||||||||||||||
|
month
|
months
|
months
|
years
|
years
|
bearing
|
|||||||||||||||||||||||
|
in thousands of Soles
|
||||||||||||||||||||||||||||
|
Assets
|
||||||||||||||||||||||||||||
|
Cash, due from banks, receivables from reverse repurchase agreements and security borrowing
|
21,200,113
|
835,072
|
2,164,640
|
8,430,195
|
180,678
|
8,276,990
|
41,087,688
|
|||||||||||||||||||||
|
Investments
|
7,712,405
|
1,134,280
|
3,825,114
|
11,313,394
|
18,660,101
|
378,708
|
43,024,002
|
|||||||||||||||||||||
|
Loans, net
|
16,062,211
|
18,690,355
|
38,761,519
|
48,659,533
|
17,619,885
|
(673,399
|
)
|
139,120,104
|
||||||||||||||||||||
|
Financial assets designated at fair value through profit and loss
|
-
|
-
|
-
|
-
|
-
|
974,664
|
974,664
|
|||||||||||||||||||||
|
Premiums and other policies receivables
|
882,182
|
24,565
|
9,162
|
5,194
|
-
|
-
|
921,103
|
|||||||||||||||||||||
|
Accounts receivable from re-insurers and co-insurers
|
1,138
|
315,184
|
876,680
|
3,985
|
1,392
|
-
|
1,198,379
|
|||||||||||||||||||||
|
Other assets
|
299,648
|
49,697
|
171,495
|
-
|
62,519
|
1,832,448
|
2,415,807
|
|||||||||||||||||||||
|
Total assets
|
46,087,697
|
21,049,153
|
45,808,610
|
68,412,301
|
36,524,575
|
10,789,411
|
228,741,747
|
|||||||||||||||||||||
|
Liabilities
|
||||||||||||||||||||||||||||
|
Deposits and obligations
|
38,932,350
|
13,763,617
|
21,336,061
|
65,231,646
|
8,349,313
|
2,727,875
|
150,340,862
|
|||||||||||||||||||||
|
Payables from repurchase agreements, security lending, due to banks and correspondents
|
2,414,504
|
2,423,081
|
9,915,571
|
11,713,052
|
2,724,155
|
36,449
|
29,226,812
|
|||||||||||||||||||||
|
Financial Liabilities designated at fair value through profit or loss
|
-
|
-
|
-
|
-
|
-
|
325,571
|
325,571
|
|||||||||||||||||||||
|
Accounts payable to reinsurers and coinsurers
|
98,755
|
286,473
|
55,296
|
23,301
|
-
|
-
|
463,825
|
|||||||||||||||||||||
|
Technical, insurance claims reserves and reserves for unearned premiums
|
312,617
|
873,375
|
1,468,165
|
3,387,967
|
6,151,093
|
341,294
|
12,534,511
|
|||||||||||||||||||||
|
Bonds and notes issued
|
70
|
122,746
|
553,109
|
15,935,158
|
399,728
|
68,018
|
17,018,829
|
|||||||||||||||||||||
|
Other liabilities
|
135,776
|
23,896
|
2,735
|
57,390
|
-
|
4,163,736
|
4,383,533
|
|||||||||||||||||||||
|
Equity
|
-
|
-
|
-
|
-
|
-
|
27,037,439
|
27,037,439
|
|||||||||||||||||||||
|
Total liabilities and equity
|
41,894,072
|
17,493,188
|
33,330,937
|
96,348,514
|
17,564,289
|
34,700,382
|
241,391,382
|
|||||||||||||||||||||
|
Off-Balance sheet items
|
||||||||||||||||||||||||||||
|
Derivatives assets
|
221,370
|
700,009
|
167,250
|
486,430
|
-
|
-
|
1,575,059
|
|||||||||||||||||||||
|
Derivatives liabilities
|
43,164
|
222,228
|
223,146
|
1,001,554
|
-
|
-
|
1,490,092
|
|||||||||||||||||||||
|
Total Off-Balance Sheet items
|
178,206
|
477,781
|
(55,896
|
)
|
(515,124
|
)
|
-
|
-
|
84,967
|
|||||||||||||||||||
|
Marginal gap
|
(4,441,831
|
)
|
4,033,746
|
12,421,777
|
(28,451,337
|
)
|
18,900,286
|
(23,910,971
|
)
|
(12,564,668
|
)
|
|||||||||||||||||
|
Accumulated gap
|
(4,441,831
|
)
|
8,475,577
|
20,897,354
|
(7,553,983
|
)
|
11,346,303
|
(12,564,668
|
)
|
-
|
||||||||||||||||||
|
As of December 31, 2022
|
||||||||||||||||||||||||||||
|
Up to 1
|
1 to 3
|
3 to 12
|
1 to 5
|
More than 5
|
Non-interest
|
Total
|
||||||||||||||||||||||
|
month
|
months
|
Months
|
years
|
years
|
bearing
|
|||||||||||||||||||||||
|
in thousands of Soles
|
||||||||||||||||||||||||||||
|
Assets
|
||||||||||||||||||||||||||||
|
Cash, due from banks, receivables from reverse repurchase agreements and security borrowing
|
15,413,219
|
1,339,844
|
2,635,747
|
8,875,620
|
184,437
|
6,836,829
|
35,285,696
|
|||||||||||||||||||||
|
Investments
|
6,172,000
|
2,549,230
|
3,090,034
|
10,798,265
|
18,285,331
|
337,030
|
41,231,890
|
|||||||||||||||||||||
|
Loans, net
|
18,513,077
|
20,548,048
|
38,917,974
|
46,932,699
|
15,367,868
|
474,306
|
140,753,972
|
|||||||||||||||||||||
|
Financial assets designated at fair value through profit and loss
|
-
|
-
|
-
|
-
|
-
|
768,801
|
768,801
|
|||||||||||||||||||||
|
Premiums and other policies receivables
|
874,575
|
24,364
|
9,056
|
5,129
|
-
|
-
|
913,124
|
|||||||||||||||||||||
|
Accounts receivable from re-insurers and co-insurers
|
1,056
|
283,959
|
816,834
|
3,576
|
1,249
|
-
|
1,106,674
|
|||||||||||||||||||||
|
Other assets
|
74,712
|
-
|
-
|
-
|
-
|
2,531,629
|
2,606,341
|
|||||||||||||||||||||
|
Total assets
|
41,048,639
|
24,745,445
|
45,469,645
|
66,615,289
|
33,838,885
|
10,948,595
|
222,666,498
|
|||||||||||||||||||||
|
Liabilities
|
||||||||||||||||||||||||||||
|
Deposits and obligations
|
36,293,889
|
13,244,363
|
24,789,328
|
61,459,266
|
8,201,016
|
3,032,925
|
147,020,787
|
|||||||||||||||||||||
|
Payables from repurchase agreements, security lending, due to banks and correspondents
|
2,919,374
|
2,193,016
|
5,582,701
|
7,368,172
|
3,160,922
|
679,951
|
21,904,136
|
|||||||||||||||||||||
|
Financial Liabilities designated at fair value through profit or loss
|
-
|
-
|
-
|
-
|
-
|
191,010
|
191,010
|
|||||||||||||||||||||
|
Accounts payable to reinsurers and coinsurers
|
89,444
|
259,463
|
50,083
|
21,104
|
-
|
-
|
420,094
|
|||||||||||||||||||||
|
Technical, insurance claims reserves and reserves for unearned premiums
|
307,871
|
830,562
|
1,384,568
|
3,203,832
|
5,923,438
|
340,688
|
11,990,959
|
|||||||||||||||||||||
|
Bonds and notes issued
|
48,301
|
73,546
|
3,186,038
|
13,330,687
|
357,352
|
11,270
|
17,007,194
|
|||||||||||||||||||||
|
Other liabilities
|
552,438
|
74,149
|
2,916
|
-
|
-
|
4,160,258
|
4,789,761
|
|||||||||||||||||||||
|
Equity
|
-
|
-
|
-
|
-
|
-
|
29,579,709
|
29,579,709
|
|||||||||||||||||||||
|
Total liabilities and equity
|
40,211,317
|
16,675,099
|
34,995,634
|
85,383,061
|
17,642,728
|
37,995,811
|
232,903,650
|
|||||||||||||||||||||
|
Off-Balance sheet items
|
||||||||||||||||||||||||||||
|
Derivatives assets
|
171,485
|
830,415
|
450,835
|
931,208
|
-
|
-
|
2,383,943
|
|||||||||||||||||||||
|
Derivatives liabilities
|
149,938
|
46,232
|
165,610
|
1,844,839
|
95,350
|
-
|
2,301,969
|
|||||||||||||||||||||
|
Total Off-Balance Sheet items
|
21,547
|
784,183
|
285,225
|
(913,631
|
)
|
(95,350
|
)
|
-
|
81,974
|
|||||||||||||||||||
|
Marginal gap
|
858,869
|
8,854,529
|
10,759,236
|
(19,681,403
|
)
|
16,100,807
|
(27,047,216
|
)
|
(10,155,178
|
)
|
||||||||||||||||||
|
Accumulated gap
|
858,869
|
9,713,398
|
20,472,634
|
791,231
|
16,892,038
|
(10,155,178
|
)
|
-
|
||||||||||||||||||||
Investments and derivatives classified by our management as held for trading are not considered in our repricing gap analysis, because these instruments are included in the trading
book. Instead of repricing gap analysis, we use VaR methodology to assess risk arising from these instruments. Other assets and other liabilities include only financial accounts.
The COVID-19 outbreak implied changes in customer behavior patterns and government programs that represented a high level of uncertainty and risk for the Group’s balance sheet
structure and its consequent exposure to interest rate risk in the banking book. To effectively deal with this environment, efforts were focused on analyzing government stimulus packages, the creation of financial relief products for
clients, the evolution in the composition of assets and liabilities both in volume and in characteristics, collecting all these aspects in key risk metrics and analytical reports to ensure a level of exposure to interest rate risks
consistent with the Group's risk appetite level.
Sensitivity to Changes in Interest Rates
The sensitivity analysis of a reasonable possible change in interest rates on the ALM book comprises an assessment of the sensibility of the financial margin, which seeks to
measure the potential changes in interest accruals over a period of time due to the expected parallel movement of the interest rate curves, as well as the sensitivity of the net economic value, which is a long-term metric measured as
the difference between the economic value of net assets and liabilities before and after a variation in interest rates.
The sensitivity of the financial margin is the effect of the assumed changes in interest rates on the net interest income before income tax for one year and is based on non-trading
financial assets and financial liabilities held at December 31, 2020, 2021 and 2022, including the effect of derivatives instruments. The sensitivity of net economic value is calculated by reassessing the financial assets and
liabilities that comprise the banking book, including the effect of any associated hedge and derivative instruments designated as a cash flow hedge. In managing interest rate risk, no distinction is made by accounting category of the
investments comprising the banking book, including instruments classified as fair value through other comprehensive income and amortized cost investments.
The tables below summarize our exposure to interest rate changes as of December 31, 2020, 2021 and 2022:
|
As of December 31, 2020
|
||||||||||||||||||||||||
|
Currency
|
Interest rates changes in
|
Sensitivity of
|
Sensitivity of
|
|||||||||||||||||||||
|
basis points
|
financial margin
|
economic value
|
||||||||||||||||||||||
|
in thousands of Soles
|
||||||||||||||||||||||||
|
Peruvian Currency
|
+/-
|
50
|
+/-
|
19,640
|
-/+
|
|
391,821
|
|||||||||||||||||
|
Peruvian Currency
|
+/-
|
75
|
+/-
|
29,459
|
-/+
|
|
587,731
|
|||||||||||||||||
|
Peruvian Currency
|
+/-
|
100
|
+/-
|
39,279
|
-/+
|
|
783,642
|
|||||||||||||||||
|
Peruvian Currency
|
+/-
|
150
|
+/-
|
58,919
|
-/+
|
|
1,175,462
|
|||||||||||||||||
|
US Dollar
|
+/-
|
50
|
+/-
|
47,929
|
+/-
|
345,185
|
||||||||||||||||||
|
US Dollar
|
+/-
|
75
|
+/-
|
71,894
|
+/-
|
517,777
|
||||||||||||||||||
|
US Dollar
|
+/-
|
100
|
+/-
|
95,859
|
+/-
|
690,369
|
||||||||||||||||||
|
US Dollar
|
+/-
|
150
|
+/-
|
143,788
|
+/-
|
1,035,554
|
||||||||||||||||||
|
As of December 31, 2021
|
||||||||||||||||||||||||
|
Currency
|
Interest rates changes in
|
Sensitivity of
|
Sensitivity of
|
|||||||||||||||||||||
|
basis points
|
financial margin
|
economic value
|
||||||||||||||||||||||
|
in thousands of Soles
|
||||||||||||||||||||||||
|
Peruvian Currency
|
+/-
|
50
|
+/-
|
45,487
|
-/+
|
|
340,772
|
|||||||||||||||||
|
Peruvian Currency
|
+/-
|
75
|
+/-
|
68,231
|
-/+
|
|
511,158
|
|||||||||||||||||
|
Peruvian Currency
|
+/-
|
100
|
+/-
|
90,975
|
-/+
|
|
681,544
|
|||||||||||||||||
|
Peruvian Currency
|
+/-
|
150
|
+/-
|
136,462
|
-/+
|
|
1,022,316
|
|||||||||||||||||
|
US Dollar
|
+/-
|
50
|
+/-
|
115,376
|
+/-
|
413,488
|
||||||||||||||||||
|
US Dollar
|
+/-
|
75
|
+/-
|
173,064
|
+/-
|
620,232
|
||||||||||||||||||
|
US Dollar
|
+/-
|
100
|
+/-
|
230,752
|
+/-
|
826,976
|
||||||||||||||||||
|
US Dollar
|
+/-
|
150
|
+/-
|
346,128
|
+/-
|
1,240,463
|
||||||||||||||||||
|
As of December 31, 2022
|
||||||||||||||||||||||||
|
Currency
|
Interest rates changes in
|
Sensitivity of
|
Sensitivity of
|
|||||||||||||||||||||
|
basis points
|
financial margin
|
economic value
|
||||||||||||||||||||||
|
in thousands of Soles
|
||||||||||||||||||||||||
|
Peruvian Currency
|
+/-
|
50
|
+/-
|
40,037
|
-/+
|
|
209,066
|
|||||||||||||||||
|
Peruvian Currency
|
+/-
|
75
|
+/-
|
60,056
|
-/+
|
|
313,598
|
|||||||||||||||||
|
Peruvian Currency
|
+/-
|
100
|
+/-
|
80,075
|
-/+
|
|
418,131
|
|||||||||||||||||
|
Peruvian Currency
|
+/-
|
150
|
+/-
|
120,112
|
-/+
|
|
627,197
|
|||||||||||||||||
|
US Dollar
|
+/-
|
50
|
+/-
|
102,016
|
+/-
|
341,233
|
||||||||||||||||||
|
US Dollar
|
+/-
|
75
|
+/-
|
153,023
|
+/-
|
511,849
|
||||||||||||||||||
|
US Dollar
|
+/-
|
100
|
+/-
|
204,031
|
+/-
|
682,465
|
||||||||||||||||||
|
US Dollar
|
+/-
|
150
|
+/-
|
306,047
|
+/-
|
1,023,698
|
||||||||||||||||||
The interest rate sensitivities set out in the tables above are illustrative only and are based on simplified scenarios. These figures represent the effect of the preform movements
in the net interest income based on the projected yield curve scenarios and the Group’s current interest rate risk profile. This effect, however, does not incorporate actions that would be taken by Management to mitigate the impact of
this interest rate risk. In addition, the Group proactively seeks to change the interest rate risk profile to minimize losses and optimize net revenues. The projections above also assume that interest rate of all maturities move by
the same amount and, therefore, do not reflect the potential impact on net interest income of some rates changing while others remain unchanged.
As of December 31, 2020, 2021 and 2022, investments in equity securities and funds that are non-trading, recorded at fair value through other comprehensive income and at fair value
through profit or loss, respectively, are not considered as comprising investment securities for interest rate sensitivity calculation purposes; however, 10%, 25% and 30% changes in market prices are conducted to these
price-sensitivity securities.
The market price sensitivity tests as of December 31, 2020, 2021 and 2022are presented below:
|
Equity at fair value through
other comprehensive income
|
Changes in market prices
%
|
2020
|
2021
|
2022
|
||||||||||||
|
in thousands of Soles
|
||||||||||||||||
|
Equity securities
|
+/- 10
|
50,255
|
37,783
|
32,649
|
||||||||||||
|
Equity securities
|
+/- 25
|
125,638
|
94,457
|
81,621
|
||||||||||||
|
Equity securities
|
+/- 30
|
150,765
|
113,348
|
97,946
|
||||||||||||
|
Funds at fair value through profit
or loss
|
Changes in market prices
%
|
2020
|
2021
|
2022
|
||||||||||||
|
in thousands of Soles
|
||||||||||||||||
|
Mutual funds
|
+/- 10
|
96,665
|
157,130
|
158,478
|
||||||||||||
|
Mutual funds
|
+/- 25
|
241,661
|
392,825
|
396,195
|
||||||||||||
|
Mutual funds
|
+/- 30
|
289,994
|
471,390
|
475,434
|
||||||||||||
|
Restricted mutual funds
|
+/- 10
|
43,688
|
36,595
|
35,132
|
||||||||||||
|
Restricted mutual funds
|
+/- 25
|
109,220
|
91,489
|
87,829
|
||||||||||||
|
Restricted mutual funds
|
+/- 30
|
131,064
|
109,786
|
105,395
|
||||||||||||
|
Fund of Liquid Assets Requirement (RAL)
|
+/- 10
|
27,882
|
32,314
|
16,778
|
||||||||||||
|
Fund of Liquid Assets Requirement (RAL)
|
+/- 25
|
69,705
|
80,785
|
41,945
|
||||||||||||
|
Fund of Liquid Assets Requirement (RAL)
|
+/- 30
|
83,646
|
96,942
|
50,334
|
||||||||||||
|
Investment Funds
|
+/- 10
|
36,160
|
49,837
|
91,062
|
||||||||||||
|
Investment Funds
|
+/- 25
|
90,399
|
124,591
|
227,654
|
||||||||||||
|
Investment Funds
|
+/- 30
|
108,479
|
149,510
|
273,185
|
||||||||||||
|
Hedge Funds
|
+/- 10
|
12,694
|
17,682
|
28
|
||||||||||||
|
Hedge Funds
|
+/- 25
|
31,735
|
44,204
|
70
|
||||||||||||
|
Hedge Funds
|
+/- 30
|
38,081
|
53,045
|
84
|
||||||||||||
|
Exchange Traded Funds
|
+/- 10
|
3,209
|
10,531
|
2,504
|
||||||||||||
|
Exchange Traded Funds
|
+/- 25
|
6,391
|
26,326
|
6,261
|
||||||||||||
|
Exchange Traded Funds
|
+/- 30
|
9,626
|
31,592
|
7,513
|
||||||||||||
Foreign Currency Exchange Rate Risk
The Group is exposed to fluctuations in foreign currency exchange rates, which impact net open monetary positions and equity positions in a different currency than the group’s
functional currency.
The group’s monetary position is made up of the net open position of monetary assets, monetary liabilities and off-balance sheet items expressed in foreign currency for which the
entity itself assumes the risk; as well as the equity position generated by the investment in the group’s subsidiaries whose functional currency is different from soles. In the first case, any appreciation/depreciation of the foreign
currency would affect the consolidated income statement, on the contrary, in the case of the equity position, any appreciation/depreciation of the foreign currency will be recognized in other comprehensive income.
The Group manages foreign currency exchange risk, which affects the income statement, by monitoring and controlling currency positions exposed to movements in exchange rates. The
market risk units of each subsidiary establish limits for said positions, which are approved by their own committees, and monitor and follow up the limits considering their foreign exchange trading positions, their most structural
foreign exchange positions, as well as their sensitivities.
Additionally, there is a monetary position limit at the Credicorp level, which is monitored and reported to the Group’s Risk Committee.
On the other hand, the Group manages foreign currency exchange risk whose fluctuation is recognized in other comprehensive income, monitoring and controlling equity positions and
their sensitivities, which are reported to the Group’s Risk Committee.
Net foreign exchange gains/losses recognized in the consolidated statement of income are disclosed in the following items:
• Net gain on foreign exchange transactions
• Net gain on speculative derivatives
• Net gain from exchange difference
Transactions in foreign currency are made at free market exchange rates of the countries where Credicorp’s subsidiaries are established. As of December 31, 2020, 2021, and 2022,
the net open monetary position with effect on results and the equity position of the group was as follows:
|
Other
|
||||||||
|
2020
|
US Dollars
|
currencies
|
||||||
|
Total monetary assets
|
68,649,158
|
1,204,923
|
||||||
|
Total monetary liabilities
|
(70,735,019
|
)
|
(427,092
|
)
|
||||
|
(2,085,861
|
)
|
777,831
|
||||||
|
Currency derivatives
|
1,746,886
|
(364,886
|
)
|
|||||
|
Accounting hedge (investment abroad) (*)
|
490,385
|
-
|
||||||
|
Net monetary position with effect on consolidated statement of income
|
151,410
|
412,945
|
||||||
|
Net monetary position with effect on equity
|
998,175
|
1,583,837
|
||||||
|
Net monetary position
|
1,149,585
|
1,996,782
|
||||||
|
Other
|
||||||||
|
2021
|
US Dollars
|
currencies
|
||||||
|
Total monetary assets
|
79,005,337
|
503,809
|
||||||
|
Total monetary liabilities
|
(81,716,408
|
)
|
(415,951
|
)
|
||||
|
(2,711,071
|
)
|
87,858
|
||||||
|
Currency derivatives
|
2,142,654
|
(55,696
|
)
|
|||||
|
Accounting hedge (investment abroad) (*)
|
912,337
|
-
|
||||||
|
Net monetary position with effect on consolidated statement of income
|
343,920
|
32,162
|
||||||
|
Net monetary position with effect on equity
|
1,021,603
|
1,864,335
|
||||||
|
Net monetary position
|
1,365,523
|
1,896,497
|
||||||
|
Other
|
||||||||
|
2022
|
US Dollars
|
currencies
|
||||||
|
Total monetary assets
|
77,853,626
|
364,108
|
||||||
|
Total monetary liabilities
|
(79,016,765
|
)
|
(217,568
|
)
|
||||
|
(1,163,139
|
)
|
146,540
|
||||||
|
Currency derivatives
|
353,166
|
(12,7382
|
)
|
|||||
|
Accounting hedge (investment abroad) (*)
|
872,750
|
-
|
||||||
|
Net monetary position with effect on consolidated statement of income
|
62,777
|
19,158
|
||||||
|
Net monetary position with effect on equity
|
785,030
|
1,872,697
|
||||||
|
Net monetary position
|
847,807
|
1,891,855
|
||||||
(*) There is an accounting hedge of net investment abroad where part of our liability position in dollars related to the balance of the item "bonds and notes issued", which was designated to hedge our
permanent investment in Atlantic Security Holding Corporation. For further detail, refer to Note 17 to the consolidated financial statements, Bonds and Notes Issued, (iv) Senior notes - Credicorp Ltd.
We manage foreign exchange risk by monitoring and controlling the position values based on changes in exchange rates. Since 2014, we have measured the performance of these
positions in Soles, our functional currency.
As of December 31, 2020, 2021 and 2022, the monetary position with effect on equity in other currencies is mainly made up of the equity of subsidiaries in Bolivian pesos for
S/764.6 millions, S/928.6 million and S/954.7 million, respectively, in Colombian pesos for S/570.4 million, S/628.6 million and S/566.7 million, respectively and, in Chilean pesos for S/245.7 million, S/304.4 million and S/348.0
million, respectively.
The following tables show the sensitivity analysis of the main currencies to which the Group is exposed and which affect the consolidated income statement and other comprehensive
income as of December 31, 2020, 2021 and 2022. The analysis determines the effect of a reasonably possible variation of the exchange rate against the sun for each of the currencies independently, considering all other variables
constant. A negative amount shows a potential net reduction in the consolidated income statement and other comprehensive income, while a positive amount reflects a potential increase.
The following is a sensitivity analysis of the foreign exchange position with an effect on consolidated results, with the US dollar as the main currency of exposure. This analysis
is shown as of December 31, 2020, 2021 and 2022:
|
Sensitivity Analysis
|
Change in Currency
Rates
|
2020
|
2021
|
2022
|
||||||||||||
|
%
|
in thousands of Soles
|
|||||||||||||||
|
Depreciation
|
||||||||||||||||
|
Sol against US Dollar
|
5
|
7,210
|
16,377
|
2,989
|
||||||||||||
|
Sol against US Dollar
|
10
|
13,765
|
31,265
|
5,707
|
||||||||||||
|
Appreciation
|
||||||||||||||||
|
Sol against US Dollar
|
5
|
(7,969
|
)
|
(18,101
|
)
|
(3,304
|
)
|
|||||||||
|
Sol against US Dollar
|
10
|
(16,823
|
)
|
(38,213
|
)
|
(6,975
|
)
|
|||||||||
The following is the sensitivity analysis of the foreign exchange position with effect in other comprehensive income, being the US dollar, the Bolivian Peso, the Colombian Peso and
the Chilean Peso the main currencies of exposure. This analysis is shown as of December 31, 2022, 2021 and 2020:
|
Sensitivity Analysis
|
Change in Currency
Rates
|
2020
|
2021
|
2022
|
||||||||||||
|
%
|
in thousands of Soles
|
|||||||||||||||
|
Depreciation
|
||||||||||||||||
|
Sol against US Dollar
|
5
|
47,532
|
48,648
|
37,382
|
||||||||||||
|
Sol against US Dollar
|
10
|
90,743
|
92,873
|
71,366
|
||||||||||||
|
Appreciation
|
||||||||||||||||
|
Sol against US Dollar
|
5
|
(52,536
|
)
|
(53,769
|
)
|
(41,317
|
)
|
|||||||||
|
Sol against US Dollar
|
10
|
(110,908
|
)
|
(113,511
|
)
|
(87,226
|
)
|
|||||||||
|
Sensitivity Analysis
|
Change in Currency
Rates
|
2020
|
2021
|
2022
|
||||||||||||
|
%
|
in thousands of Soles
|
|||||||||||||||
|
Depreciation
|
||||||||||||||||
|
Sol against Peso Boliviano
|
5
|
36,408
|
44,220
|
45,462
|
||||||||||||
|
Sol against Peso Boliviano
|
10
|
69,507
|
84,421
|
86,791
|
||||||||||||
|
Appreciation
|
||||||||||||||||
|
Sol against Peso Boliviano
|
5
|
(40,241
|
)
|
(48,875
|
)
|
(50,247
|
)
|
|||||||||
|
Sol against Peso Boliviano
|
10
|
(84,953
|
)
|
(103,181
|
)
|
(106,078
|
)
|
|||||||||
|
Sensitivity Analysis
|
Change in Currency
Rates
|
2020
|
2021
|
2022
|
||||||||||||
|
%
|
in thousands of Soles
|
|||||||||||||||
|
Depreciation
|
||||||||||||||||
|
Sol against Colombian Peso
|
5
|
27,160
|
29,933
|
26,984
|
||||||||||||
|
Sol against Colombian Peso
|
10
|
51,851
|
57,145
|
51,515
|
||||||||||||
|
Appreciation
|
||||||||||||||||
|
Sol against Colombian Peso
|
5
|
(30,019
|
)
|
(33,084
|
)
|
(29,825
|
)
|
|||||||||
|
Sol against Colombian Peso
|
10
|
(63,373
|
)
|
(69,844
|
)
|
(62,963
|
)
|
|||||||||
|
Sensitivity Analysis
|
Change in
Currency Rates
|
2020
|
2021
|
2022
|
||||||||||||
|
%
|
in thousands of Soles
|
|||||||||||||||
|
Depreciation
|
||||||||||||||||
|
Sol against Peso Chileno
|
5
|
11,701
|
14,494
|
16,571
|
||||||||||||
|
Sol against Peso Chileno
|
10
|
22,338
|
27,671
|
31,636
|
||||||||||||
|
Appreciation
|
||||||||||||||||
|
Sol against Peso Chileno
|
5
|
(12,933
|
)
|
(16,020
|
)
|
(18,316
|
)
|
|||||||||
|
Sol against Peso Chileno
|
10
|
(27,302
|
)
|
(33,820
|
)
|
(38,667
|
)
|
|||||||||
Liquidity Risk
Liquidity risk is the risk that the Group is unable to meet its short-term payment obligations associated with its financial liabilities when they fall due and to replace funds
when they are withdrawn. In this sense, the company that is facing a liquidity crisis would be failing to comply with the obligations to pay depositors and with commitments to lend or satisfy other operational cash needs.
For further information about liquidity risk management, please refer to ITEM 5. OPERATING AND FINANCIAL REVIEW AND PROSPECTS – 5.B Liquidity and Capital Resources - (3)
Liquidity Risk
Model risk is defined as the probability of loss resulting from decisions (credit, market, among others) based on the use of poorly designed and/or poorly implemented models. The
main sources of this risk are: deficiencies in data, errors in the model (from design to implementation) or wrong use of the model.
The Group uses models for different purposes, such as credit admission, capital calculation, monitoring behavior of payment, determination of loan reserves, market risk and
liquidity. Model risk management is structured around a set of processes known as the life cycle of the model. The phases of the life cycle of the model in the Group are: identification, planning, development, internal validation,
approval, implementation and use, and monitoring and control.
Management of model risk is proportional to the importance of each model. To this end, a tiered approach is used to synthesize the level of importance of a model, from which the
level of model management is then determined.
Both our operational risk, which measures the probability of loss of the business operations, and our insurance activity risk, which measures the real cost of claims and benefit
payments and the timing thereof, are important for the Group’s risk management. How we identify, evaluate, measure, treat and control operational risk and insurance activity risk is defined and explained in the following notes to our
audited consolidated financial statements: 34.4 Operational risk and 34.8 Risk of the insurance activity.
The main risk faced by the Group related to insurance contracts is that the real cost of claims and payments, or the opportunity cost of claims and payments, may differ from what
was expected. The magnitude of this risk is influenced by the frequency of claims, the severity of claims, the real benefits paid and the development of long-term claims. Therefore, the Group seeks to ensure that sufficient reserves
are available to cover these obligations. The Group constantly monitors the adequacy of its technical reserves by taking appropriate measures against possible adverse results. It also contracts with independent, recognized actuarial
services firms to conduct periodic reviews regarding the sufficiency of reserves for the companies that make up the Insurance & Pensions LoB.
Not applicable.
Neither we, nor any of our subsidiaries, have ever defaulted on any of our debt or have ever been forced to reschedule any of our obligations.
None of our dividends are in arrears, and there has not been any other material delinquency not cured within 30 days relating to any class of preferred stock of our significant
subsidiaries. Credicorp Ltd. does not have any preferred stock outstanding.
There has not been any modification to the rights of security holders.
Our management, with the participation of and under the supervision of our principal executive officer and principal financial officer, has evaluated the effectiveness of the
design and operation of our disclosure controls and procedures (as defined in Exchange Act Rules 13a-15(e) and 15d-15(e)) as of December 31, 2022. Based on this evaluation, our management,
principal executive officer, and principal financial officer have concluded that our disclosure controls and procedures are effective in ensuring that information that we are required to disclose in reports that we file or submit
under the Exchange Act is recorded, processed, summarized, and reported within the time periods specified in SEC rules and forms.
Our Board of Directors and management are responsible for establishing and maintaining adequate internal control over financial reporting. Our framework for internal control over
financial reporting is designed to provide reasonable assurance regarding the reliability of financial reporting and the preparation and fair presentation of published financial statements in accordance with International Financial
Reporting Standards, or IFRS, as issued by the IASB.
Our framework for internal control over financial reporting includes policies and procedures that:
| • |
pertain to the maintenance of records that, in reasonable detail, accurately and fairly reflect transactions and dispositions of assets;
|
| • |
provide reasonable assurance that transactions are recorded as necessary to permit preparation of financial statements, and our receipts and expenditures are being made only in accordance with authorizations of our
management and IFRS; and
|
| • |
provide reasonable assurance regarding prevention or timely detection of unauthorized acquisition, use, or disposition of our assets that could have a material effect on our financial statements.
|
Because of inherent limitations, internal controls over financial reporting may not prevent or detect misstatements. Also, projections about the effectiveness of our internal
controls are subject to the risk that controls will become inadequate because of changes in conditions or deterioration in compliance with policies or procedure.
Our management assessed the effectiveness of our internal control over financial reporting as of December 31, 2022, based on the framework set forth by the COSO in Internal
Control-Integrated Framework. Based on this assessment, our management identified no material weakness in our internal control over financial reporting and concluded that, as of December 31, 2022, our internal control over financial
reporting was effective, which means that each of the relevant components and seventeen principles are present and functioning and the five components operate together in an integrated manner.
The effectiveness of the entity’s internal control over financial reporting as of December 31, 2022, has been audited by Gaveglio, Aparicio y Asociados S.C.R.L located in Lima,
Peru with PCAOB ID 1316, an independent registered public accounting firm, which report is included on page F-3 of this annual report.
To the Board of Directors and Shareholders of Credicorp Ltd.
Opinions on the Financial Statements and Internal Control over Financial Reporting
We have audited the
accompanying consolidated statement of financial position of Credicorp Ltd. and its subsidiaries (the “Company”) as of December 31, 2022 and 2021, and the related consolidated statements of income, comprehensive income, changes in net equity and cash flows for
each of the three years in the period ended December 31, 2022, including the related notes (collectively referred to as the “consolidated financial statements”). We also have
audited the Company's internal control over financial reporting as of December 31, 2022, based on criteria established in Internal Control - Integrated Framework (2013) issued by the Committee of Sponsoring Organizations of the Treadway Commission (COSO).
In our opinion, the consolidated financial statements referred to above present fairly, in all material respects, the financial position of the
Company as of December 31, 2022 and 2021, and the results of its operations and its cash flows for each of the three years in the period ended December 31, 2022 in conformity with International Financial Reporting Standards as issued by the International
Accounting Standards Board. Also, in our opinion, the Company maintained, in all material respects, effective internal control over financial
reporting as of December 31, 2022, based on criteria established in Internal Control - Integrated Framework (2013) issued by the COSO.
Basis for Opinions
The Company's management is responsible for these consolidated financial statements, for maintaining effective internal control over financial reporting, and for its assessment of the effectiveness of internal control
over financial reporting, included in the accompanying Management's Annual Report on Internal Control over Financial Reporting. Our
responsibility is to express opinions on the Company’s consolidated financial statements and on the Company's internal control over financial reporting based on our audits. We are a public accounting firm registered with the
Public Company Accounting Oversight Board (United States) (PCAOB) and are required to be independent with respect to the Company in accordance with the U.S. federal securities laws and the applicable rules and regulations of the
Securities and Exchange Commission and the PCAOB.
We conducted our audits in accordance with the standards of the PCAOB. Those standards require that we plan and perform the audits to obtain reasonable assurance about whether the consolidated financial
statements are free of material misstatement, whether due to error or fraud, and whether effective internal control over financial reporting was maintained in all material respects.
Our audits of the consolidated financial statements included performing procedures to assess the risks of material misstatement of the
consolidated financial statements, whether due to error or fraud, and performing procedures that respond to those risks. Such procedures included examining, on a test basis, evidence regarding the amounts and disclosures in the
consolidated financial statements. Our audits also included evaluating the accounting principles used and significant estimates made by management, as well as evaluating the overall presentation of the consolidated financial statements.
Our audit of internal control over financial reporting included obtaining an understanding of internal control over financial reporting, assessing the risk that a material weakness exists, and testing and evaluating the design and
operating effectiveness of internal control based on the assessed risk. Our audits also included performing such other procedures as we considered necessary in the circumstances. We believe that our audits provide a reasonable basis for
our opinions.
Definition and Limitations of Internal Control over Financial Reporting
A company’s internal control over financial reporting is a process designed to provide reasonable assurance regarding the reliability of financial
reporting and the preparation of financial statements for external purposes in accordance with generally accepted accounting principles. A company’s internal control over financial reporting includes those policies and procedures that (i)
pertain to the maintenance of records that, in reasonable detail, accurately and fairly reflect the transactions and dispositions of the assets of the company; (ii) provide reasonable assurance that transactions are recorded as necessary
to permit preparation of financial statements in accordance with generally accepted accounting principles, and that receipts and expenditures of the company are being made only in accordance with authorizations of management and directors
of the company; and (iii) provide reasonable assurance regarding prevention or timely detection of unauthorized acquisition, use, or disposition of the company’s assets that could have a material effect on the financial statements.
Because of its inherent limitations, internal control over financial reporting may not prevent or detect misstatements. Also, projections of any
evaluation of effectiveness to future periods are subject to the risk that controls may become inadequate because of changes in conditions, or that the degree of compliance with the policies or procedures may deteriorate.
Critical Audit Matters
The critical audit matters communicated below are matters arising from the current period audit of the consolidated financial statements that were
communicated or required to be communicated to the audit committee and that (i) relate to accounts or disclosures that are material to the consolidated
financial statements and (ii) involved our especially challenging, subjective, or complex judgments. The communication of critical audit matters does not alter in any way our opinion on the consolidated financial statements, taken as a whole, and we are not, by communicating the critical audit matters below, providing separate opinions on the critical audit matters or on the
accounts or disclosures to which they relate.
Allowance for loan losses
As described in Notes 3 f, 3 i, 7 and 34.1 to the consolidated financial statements, the amount recognized as allowance for loan
losses is S/8,531 million as of December 31, 2022. As disclosed by management, the allowance is management’s estimate of expected credit losses that result from models with a series of underlying assumptions with regard to the choice of
the variable inputs and their interdependencies. The impairment model for expected credit loss reflects the present value of all the cash flows related to the events of default, at (i) twelve months or (ii) the lifetime of the financial
instrument depending on the impairment of the credit from inception in a three-stage model. The measurement of the expected credit loss is mainly based on the product of probability of default (PD), obtained mainly through rating and
scoring tools; loss given default (LGD) and exposure at default (EAD), discounted at the reporting date and considering the expected macroeconomic effects. The expected credit loss reflects a result weighted by probability that considers
a range of multiple outcomes based on reasonable and supportable forecasts. In addition, for commercial debtors with the highest debt that are in default, management performs an individual review to determine the expected loss in each
case, in which it considers, among others, the financial information available and the coverage of real guarantees.
The principal considerations for our determination that performing procedures relating to the allowance for loan losses is a critical audit matter
are: (i) the significant judgement by management when developing its estimate, which in turn led to a high degree of auditor judgment, subjectivity; and (ii) the effort in evaluating the significant judgment and assumptions used in the
determination of PD, LGD and EAD, related to rating and scoring tools, prospective information, the determination of stages based on the impairment of the credit since its initial recognition and the individual review for commercial
debtors in default. Also, the audit effort involved the use of professionals with specialized skill and knowledge.
Addressing the matter involved performing procedures and evaluating audit evidence in connection with forming our overall opinion on the consolidated
financial statements. These procedures included testing the effectiveness of controls relating to the Company’s allowance estimation process, which included controls over data inputs, models and assumptions adopted by management, and the
calculation of the allowance for loan losses. These procedures also included, among others, (i) testing the completeness and accuracy of the data used in the estimate and the mathematical accuracy of the impairment calculation for the
credit portfolios and; (ii) evaluating the appropriateness of the models utilized for the estimation of the expected credit loss and the reasonableness of the significant assumptions related to the determination of PD, LGD and EAD, as
well as rating and scoring tools, prospective information and the individual review performed on commercial debtors in default. The procedures included the involvement of professionals with specialized skill and knowledge to assist in
testing management’s process for estimating expected credit loss allowance.
Valuation of the mathematical reserves for annuities
As described in Notes 3 e, 16 and 34.6 to the consolidated financial statements, the amount recognized as mathematical reserves for annuities is
S/6,254 million as of December 31, 2022. As disclosed by management, the valuation of the Company’s mathematical reserves for annuities depends on significant judgment selecting actuarial methodologies and assumptions regarding future
events. The main assumptions used in the valuation of the mathematical reserves for annuities are: (i) the mortality tables; and (ii) the discount rates. Changes in each of these assumptions could result in significant impacts in the
valuation of the mathematical reserves for annuities and in the respective impacts reflected in the consolidated financial statements.
The principal considerations for our determination that performing procedures relating to mathematical reserves for annuities is a critical audit
matter are: (i) the significant judgement by management when developing its estimate, which in turn led to a high degree of auditor judgment, subjectivity; and (ii) the effort in evaluating the significant judgment and the main
assumptions related to the mortality tables and discount rates. Also, the audit effort involved the use of professionals with specialized skill and knowledge.
Addressing the matter involved performing procedures and evaluating audit evidence in connection with forming our overall opinion on the consolidated
financial statements. These procedures included testing the effectiveness of controls relating to the valuation of the mathematical reserves for annuities, which includes controls over data inputs, assumptions, and calculation of the
mathematical reserves. These procedures also included, among others, testing the completeness, accuracy and relevance of underlying data used in the model, the appropriateness of discount rates, and the involvement of professionals with
specialized skill and knowledge to assist in testing management’s process for the valuation of the mathematical reserves for annuities, including evaluating the appropriateness of the methodologies and models and evaluating the
reasonableness of the main assumptions related to the mortality tables and discount rates.
/s/Gaveglio, Aparicio y Asociados S.C.R.L.
Lima, Peru
April 25, 2023
We have served as the Company’s auditor since 2015.
Countersigned by
| (partner) | |
|
/s/Gustavo Villafana
|
|
|
Peruvian Certified Public Accountant Registration No. 46192
|
|
During the period covered by this Annual Report, no changes were made to our internal control over financial reporting that have materially affected, or are likely to materially
affect, our internal control over financial reporting.
At the Annual General Meeting of Shareholders held on June 5, 2020, shareholders elected the members of the Board of Directors of Credicorp as discussed in “ITEM 6. DIRECTORS, SENIOR
MANAGEMENT AND EMPLOYEES – 6. A Directors and Senior Management”. Furthermore, our Board of Directors, in its meeting held on June 9, 2020, appointed the following members to the Audit Committee: Ms. Patricia Lizarraga Guthertz
(independent, chair of the Audit Committee since June 2020), Mr. Irzio Pinasco Menchelli (independent, member of the Audit Committee) and Ms. Maria Teresa Aranzabal Harreguy (independent, member of the Audit Committee). Mr. Raimundo
Morales Dasso, former Chairman of the Audit Committee, has been appointed as Advisor. Mr. Pinasco retired from the Board of Directors of Credicorp effective in April 2023. See “ITEM 4. INFORMATION ON
THE COMPANY – 4. A History and development of the Company – Subsequent Events.” The new Board of Directors of Credicorp will appoint the new members of the Audit Committee at their next meeting, which will be held on April 27, 2023.
Ms. Lizarraga and Ms. Aranzabal are “independent” as defined in Rule 10A-3 under the Exchange Act and in Section 303A.02 of the NYSE Listed Company Manual.
Ms. Lizarraga, our Audit Committee Financial Expert as determined by the Board of Directors, is Director of BCP Stand-alone and Credicorp Ltd. Ms. Lizarraga is an experienced Wall
Street executive with over 25 years’ experience working in international mergers and acquisitions, capital markets, private equity, and valuation experience. She is the founder and CEO of Hypatia Capital Group and a major shareholder of
family group Grupo del Ande. Ms. Lizarraga’s Board experience includes serving as both President of the Board and Chairman of the Audit Committee of non-profit organizations, as well as private company Board experience. She served as
President of the Privatization Committee of Toll Roads of Peru. Ms. Lizarraga received her Bachelor of Arts degree from Yale University and her MBA from Harvard Business School.
We have adopted a code of ethics (Código de Ética) that applies to our Board of Directors and to our CEO, our chief financial officer, and our other principal
executive officers, as well as to all of our other employees. In addition, we have adopted a code of ethics for professionals with financial responsibility (Código de Ética Para Profesionales con Responsabilidad Financiera) that applies
to employees with financial management responsibilities. Our code of ethics and code of ethics for professionals with financial responsibility are available on the corporate governance section of our web site at https://www.grupocredicorp.com/,
or at https://credicorp.gcs-web.com/corporate-governance/governance-documents (in English).
Audit Committee Pre-Approval Policies and Procedures
The Audit Committee must approve all of the services that the independent external auditor provides as part of its responsibility to supervise the internal auditor’s work. The Audit
Committee provides two types of approvals as set forth below:
| (1) |
The Audit Committee grants a “general approval” in advance for services that the independent external auditor may provide. After a general approval is given, further approval from the Audit Committee is required. A general
approval is valid for 12 months from the date of approval unless the Audit Committee determines a different period shall apply. The Audit Committee is regularly informed of the services provided through the general approval
process.
|
| (2) |
The Audit Committee also grants “specific approval” on case-by-case basis for services that do not have general approval. All of the services that are not granted general approval need specific approval from the Audit
Committee before any agreement is signed with the independent external auditor to provide such services. Any service that exceeds approved costs or budgets will need specific approval from the Audit Committee. The Audit
Committee has set a limit on all tax and other fees, which cannot be greater than 35% of total auditor’s fees during a fiscal year. The Audit Committee may change this limit based upon our corporate needs and the complexity of
the service provided by the independent external auditor. When considering granting any type of approval, the Audit Committee takes into account whether the requested services are consistent with the SEC’s rules regarding the
independence of the independent external auditor.
|
As necessary, the Audit Committee supervises the execution of services provided by the independent external auditor. It approves, when necessary, any modification in the terms,
conditions, fees, and extent of the audit services. The Audit Committee may give a general approval for other audit services where the independent external auditor is in the best position to provide those services. Such services
typically include audit services required by regulations, financial audits for our subsidiaries or affiliates, and services associated with the presentation of documents to the SEC or other documents published in connection with the
trading of our shares.
The Audit Committee may award a general approval to audit-related services if the committee believes that these services will not negatively affect the integrity of the independent
external auditor and are consistent with SEC rules.
Consistent with SEC rules, the Audit Committee requires that all tax services provided by the independent external auditor be subject to its approval. The Audit Committee may grant a
specific approval for other services provided by the independent external auditor as long as they do not impair the independence of the independent external auditor and are permissible under SEC rules.
Gaveglio, Aparicio y Asociados S.C.R.L, a member firm of PricewaterhouseCoopers International Limited was Credicorp’s independent external auditor from January 1, 2015, until
December 31, 2022.
The Audit Committee, in its meeting held in April 26, 2022 decided to initiate a selection process to select the external auditor of Credicorp for fiscal years 2023 to 2027. The
process had two stages: in the first, the 4 most prestigious international audit firms would be invited to present their work plans, methodology and preliminary teams of professionals and a second stage, where after choosing the best
two from the first stage, they presented their detailed audit strategy, work team, scope of the audit and costs in greater detail. The firms KPMG International Limited, Deloitte, PricewaterhouseCoopers and Ernst & Young LLP (EY)
were invited to the first stage, held on June 20, 2022. The second stage was held at the Committee session on August 23, 2022. Based on the presentations, working documents, consultations and comparative analyses, the Audit Committee
decided at its meeting held on September 27, 2022 to select EY as Credicorp's external auditor for fiscal years 2023 – 2027, subject to the firm’s performance, which will be evaluated at the end of each year during its appointment, and
to recommend to the Board of Directors its appointment.
In the Annual General Meeting of Shareholders held on March 27, 2023, the shareholders of Credicorp approved the designation of Tanaka, Valdivia y Asociados SCRL a member of EY
International, to act as independent external auditors of Credicorp and subsidiaries for the fiscal year 2023 and authorized our Board of Directors to delegate the approval of the independent external auditor’s annual fees to its Audit
Committee.
The following table sets forth, for each of the years indicated, the fees agreed to for our independent external auditors, Gaveglio, Aparicio y Asociados S.C.R.L., for the audit of
our financial statements, for assurance and related services, for tax compliance, tax advice and tax planning and for other services and products for each of the years ended December 31, 2020, 2021 and 2022.
|
Year-end December 31,
|
||||||||||||
|
2020
|
2021
|
2022
|
||||||||||
|
(in thousands of Soles)
|
||||||||||||
|
Audit
|
21,106
|
24,624
|
25,758
|
|||||||||
|
Audit Related Fees
|
-
|
-
|
-
|
|||||||||
|
Tax
|
410
|
663
|
724
|
|||||||||
|
All Other
|
489
|
244
|
62
|
|||||||||
|
Total
|
22,005
|
25,531
|
26,544
|
|||||||||
Audit Fees
Audit fees correspond to audit services performed (i) reviewing the consolidated financial statements of Credicorp and its subsidiaries, (ii) establishing the procedures that the
independent auditor needs to perform in order to form an opinion about Credicorp’s consolidated financial statements, and (iii) complying with the statutory requirements applicable to Credicorp’s subsidiaries. Audit fees also include
the audit work in connection with reviews of interim financial information. During 2022, the Audit Committee approved all fees but there were no services approved by the Audit Committee pursuant to paragraph (c)(7)(i)(C) of Rule 2-01 of
Regulation S-X.
Audit fees agreed for Gaveglio, Aparicio y Asociados S.C.R.L. amounted to S/24.6 million for 2021 and S/25.7 million for 2022. The increase in audit fees in
2022 compared to 2021 was mainly due to more audited reports from the Subsidiaries in Panama and Chile, review of the implementation of IFRS 17 in Pacífico and foreign exchange differences. Auditors' fees were increased from 2021 to
2022 by US$ 0.5 million, equivalent to S/ 1.1 million.
Audit-Related Fees
Audit-related fees in the above table are the aggregate fees billed by Gaveglio, Aparicio y Asociados S.C.R.L. for assurance and related services that are reasonably related to the
performance of the audit or review of Credicorp financial statements and are not reported under “audit fees”. This line item includes services such as attestation reports for our subsidiaries as required by statute or regulations. In
2020, 2021 and 2022, Credicorp has not received audited related services.
Tax Fees
Tax fees relate to tax services which include all services performed by Credicorp’s independent auditor’s tax personnel, except those services specifically related to the review and
preparation of Credicorp’s financial statements, and which principally consist of tax compliance and advisory services approved by the Audit Committee.
Tax fees agreed to for Gaveglio, Aparicio y Asociados S.C.R.L. totaled S/663,000 for 2021 and S/724,000 for 2022. The increase in tax fees in 2022 compared to 2021 was mainly due to
BCP fees for higher tax advisory and consulting services.
All Other Fees
In 2022, the other fees were mainly related to the Purchase Price Allocation review for business combination to Tenpo. In 2021, the other fees were mainly related to the review of
accounting hedges to Credicorp Ltd, advice on economic substance to CCR Inc. and review of the design and operational effectiveness of the controls of Credicorp Capital S.A. Corredores de Bolsa. In 2020, the other fees were mainly
related to advice on economic substance to Credicorp Ltd and specialized COSO training services to BCP.
Audit fees corresponding to “Taxes” and “All other” paid in 2020, 2021 and 2022 were subject to the 35% limit described under “Audit Committee Pre-Approval Policies and Procedures”
above.
All other fees agreed to for Gaveglio, Aparicio y Asociados S.C.R.L. totaled S/244,000 for 2021 and S/62,000 for 2021.
Not applicable.
During 2022, purchases of our common shares were made in open market operations on behalf of our clients.
In addition, we and our affiliated purchasers repurchased common shares for our 2022 long-term retention plan for certain employees, as explained in Notes 3(x) and 20 to the
consolidated financial statements. The following table sets forth, for each month in 2022 in which such repurchases occurred, the total number of shares purchased, and the average price paid per share. None of the repurchased shares
were purchased as part of publicly announced plans or programs.
|
Period
|
Total Number of Shares Purchased (1)
|
Average Price Paid per Share
|
Total Number of Shares Purchased as Part of Publicly Announced Plans or Programs
|
Maximum Number (or Approximate Dollar Value) of Shares that May Yet Be Purchased Under the Plans or Programs
|
|
March 2022
|
137,604
|
US$163.37
|
-
|
-
|
|
(1)
|
Shares repurchased in open-market transactions.
|
In March 2022, 137,604 shares were repurchased in open market operations at an average price paid per share of US$163.37. None of the repurchased shares were acquired as part of
publicly announced plans or programs.
Not applicable.
The NYSE’s corporate governance rules, codified in Section 303A of the NYSE’s Listed Company Manual, apply, with certain exceptions for foreign private issuers like Credicorp, in
full to companies listing common equity securities on the exchange. The chart below provides a brief description of the significant differences between our corporate governance practices and those followed by U.S. companies under NYSE
listing standards:
|
Section of NYSE Listed Company Manual
|
NYSE Corporate Governance Rules for US Domestic Issuers
|
Credicorp Corporate Governance Practices
|
|
303A.01
|
A majority of the members of the Board of Directors must be “Independent Directors”, as defined by the NYSE.
|
Credicorp is not required under Bermuda law to maintain a Board of Directors with a majority being Independent Directors. As of December 31, 2022, five Directors out of nine are independent.
|
|
303A.02
|
A Director cannot be “independent” unless the Board of Directors affirmatively determines that the Director has no material relationship with the listed company. In affirmatively
determining the independence of any Director who will serve on the compensation committee of the listed company’s Board of Directors, the Board of Directors must all factors specifically relevant to determining whether a
Director has a relationship to the listed company that is material to that director’s ability to be independent from management in connection with the duties of a compensation committee member, including, but not limited to:
(i) the source of compensation of such Director, including any consulting, advisory or other compensatory fee paid by the
listed company to such Director
(ii) whether such Director is affiliated with the listed company, a subsidiary of the listed company or an affiliate of a subsidiary of the listed company
In addition, a Director is not independent if the Director:
(iii) is, or has been
within the last three years, an employee of the listed company, or an immediate family member is, or has been within the last three years, an executive officer of the listed company
|
Credicorp has adopted an “independence” standard that is different from the standard established by the NYSE. Credicorp’s independence standard incorporates the SEC’s minimum
independence requirements applicable to Directors serving on Audit Committees. The definition of independence is included in Credicorp’s Corporate Governance Policy. There is no similar requirement under Bermuda law.
Under our definition, a Director shall be deemed to be independent if he/she meets each of the following conditions:
(i) Not being or having been, in the last three years, a Related Director or employee of Credicorp and/or subsidiaries.
(ii) Not being or having been, in the last three years, a Director or employee of a company holding >=5% interest in Credicorp. This criterion shall not apply to Directors with an independent status in
Credicorp and/or subsidiaries.
(iii) Not being a shareholder with >1% interest in Credicorp, not being entitled to exercise voting rights in excess of such percentage nor have preferential voting rights nor have any agreement or
agreements allowing such shareholder to exercise the rights to purchase Credicorp shares in excess of such percentage.
|
|
Section of NYSE Listed Company Manual
|
NYSE Corporate Governance Rules for US Domestic Issuers
|
Credicorp Corporate Governance Practices
|
|
(iv) has received, or
has an immediate family member who has received, during any twelve-month period within the last three years, more than US$120,000 in direct compensation from the listed company, other than Director and committee fees and
pension or other forms of deferred compensation for prior service
(v) (a) is a current
partner or employee of a firm that is the listed company's internal or external auditor; (b) has an immediate family member who is a current partner of such a firm; (c) has an immediate family member who is a current employee
of such a firm and personally works on the listed company's audit; or (d) was, or an immediate family member was, within the last three years a partner or employee of such a firm and personally worked on the listed company's
audit within that time
(vi) is, or has been with the last three years, employed as an executive officer of another company where any of the listed company's
present executive officers at the same time serves or served on that company’s compensation committee
(vii) is a current employee, or an immediate family member is a current executive officer, of a company that has made
payments to, or received payments from, the listed company for property or services in an amount which, in any of the last three fiscal years, exceeds the greater of US$1 million, or 2% of such other company's consolidated
gross revenues.
|
(iv) Not being a Director or a member of the Senior Management of a company in which any Related Director or member of the Senior Management of Credicorp is a member of the Board of Directors. Such
restriction shall not apply when cross Directorship is with respect to Credicorp subsidiaries.
(v) Not being or having been a member of the Senior Management of a company in which any Related Director or member of the Senior Management of Credicorp is or has been a member of the Compensation
Committee (or equivalent) of the Board of Directors in the last three years.
(vi) Not being a shareholder with >5% interest, partner, Director, or member of the Senior Management of a third-party company which makes or has made business or contractual transactions for >1% of
the annual revenue of Credicorp or >5% of the third-party company, or >5% of the annual income of the proposed Director in the last three fiscal years.
(vii) Not having received from Credicorp and/or subsidiaries any compensation >$120,000 over a period of 12 months during the last three years, excluding Directors’ fees and revenue from investments in
financial instruments (bonds, shares, term deposits, among others) of Credicorp and/or subsidiaries. Applies also with respect to Relatives.
|
|
Section of NYSE Listed Company Manual
|
NYSE Corporate Governance Rules for US Domestic Issuers
|
Credicorp Corporate Governance Practices
|
|
(viii) Not being or having been an employee or partner of the auditing firm of Credicorp and/or subsidiaries in the last three years.
(ix) Not being a Relative of shareholders with >=5% interest in Credicorp, or of members of the Board of Directors or the Senior Management of Credicorp.
(x) Not acting as an Independent Director in >5 Boards of Directors of companies entered in the Securities Market Public Registry (RMPV). Excludes boards of Directors of Credicorp and/or subsidiaries.
(xi) Not being or having been an Independent Director for over 10 continuous or alternate years during the last 15 years in Credicorp and/or subsidiaries.
(xii) The Board of Directors shall be entitled to determine the Independence of a Director in situations calling for interpretation or which have not been contemplated in this document.
|
|
Section of NYSE Listed Company Manual
|
NYSE Corporate Governance Rules for US Domestic Issuers
|
Credicorp Corporate Governance Practices
|
|
Definitions
Senior Management: is made up of the following roles:
(i) Executive Chairman
(ii) Chief Executive Officer
(iii) Chief Operating Officer
(iv) Managers in charge of the four Business Units (Universal Banking, Microfinance, Insurance and Retirement, and Investment Banking and Asset Management)
(v) Managers with the following Corporate Roles:
• Chief Financial Officer
• Chief Risk Officer
• Chief Corporate Audit Officer
• Chief Compliance and Ethics Officer
• Head of Legal
• Head of Talent Management
• Head of Corporate Affairs
Related Director: the Credicorp Director who is not considered independent.
Relative: a person having an up to second-degree blood or affinity relation, including common law or
similar affective relationships.
Corporate Role: it is the function of corporate scope that implies direct or shared responsibility with the
management of the business units.
|
||
|
303A.03
|
Non-management Directors of a listed company must meet at regularly scheduled executive sessions without management.
|
Credicorp is not required by Bermuda law to hold regular meetings of the board of Directors at which only independent Directors are present.
|
|
303A.04
|
Listed companies must have a nominating/corporate governance committee composed entirely of Independent Directors, with a written charter that addresses specific minimum requirements.
|
Credicorp has established a Compensation and Nominations Committee and a Sustainability Committee (former Corporate Governance Committee). The minimum requirements and procedures
to be followed by each committee are set forth in Credicorp’s Corporate Governance Policy. Credicorp has adopted a charter for the Sustainability Committee and for the Compensation and Nominations Committee.
|
|
Section of NYSE Listed Company Manual
|
NYSE Corporate Governance Rules for US Domestic Issuers
|
Credicorp Corporate Governance Practices
|
|
Although these committees are not required by law to be composed entirely of independent Directors (as defined by the NYSE), under Credicorp’s current Corporate Governance Policy:
− the
Compensation and Nominations Committee shall consist of no less than three Directors, at least two of them must be independent (as determined by Credicorp) and one should be a woman. It will be chaired by one of the
independent Directors, and
− the
Sustainability Committee must be composed of at least three Directors of Credicorp, at least two of whom must be independent (as determined by Credicorp) and one should be a woman. Additionally, the Board of Directors may
incorporate as a member one or more Directors of subsidiaries of the Corporation. The chairman of the Board may not be part of the committee.
There is no similar requirement under Bermuda law.
|
||
|
303A.05
|
Listed companies must have a compensation committee composed entirely of independent Directors, who satisfy the additional independence requirements specific to compensation committee membership
set forth in Section 303A.02, with a written charter that addresses specific minimum requirements.
|
Under Bermuda law, compensation of executive officers does not need to be determined by an independent committee. However, Credicorp has established a Compensation and Nominations Committee that
reviews and approves the compensation and benefits for Credicorp’s executive officers and other key executives of Credicorp. Credicorp’s Board of Directors has adopted a Compensation and Nominations Committee charter.
|
|
Section of NYSE Listed Company Manual
|
NYSE Corporate Governance Rules for US Domestic Issuers
|
Credicorp Corporate Governance Practices
|
|
303A.06
|
Listed companies must have an audit committee that satisfies the requirements of Rule 10A-3 under the Exchange Act.
|
Credicorp has an Audit Committee that satisfies the requirements of Rule 10A-3 under the Exchange Act. There is no similar requirement under Bermuda law.
|
|
303A.07
|
Listed companies must have an audit committee with at least three members, and all members of the committee must satisfy the “independence” requirements set forth in Section 303A.02 of the NYSE
Listed Company Manual (described above). The audit committee must also have a written charter that addresses specific minimum requirements, and listed companies must have an internal audit function.
|
Credicorp has formed an Audit Committee responsible for advising the Board regarding the selection of independent auditors and evaluating Credicorp’s internal controls. Credicorp’s Audit Committee
has three members (although, extraordinarily, the Audit Committee has two independent directors during a transition period after the recent appointment of a new Board of Directors, which will appoint the new members of the Audit
Committee at their next meeting, which will be held on April 27, 2023), and the members satisfy the independence requirements of Rule 10A-3 under the Exchange Act as a foreign private issuer. The Committee shall have at least
one member who is considered a financial expert. Credicorp’s Board of Directors has adopted an Audit Committee charter. There is no similar requirement under Bermuda law.
|
|
303A.08
|
Shareholders must be given the opportunity to vote on equity-compensation plans and material revisions thereto, with limited exemptions set forth in the NYSE rules.
|
Under Bermuda law, Credicorp is not required to obtain shareholder consent prior to adopting share compensation plans.
|
|
303A.09
|
Listed companies must adopt and disclose corporate governance guidelines addressing specific minimum requirements.
|
Credicorp has adopted a set of corporate governance guidelines.
|
|
Section of NYSE Listed Company Manual
|
NYSE Corporate Governance Rules for US Domestic Issuers
|
Credicorp Corporate Governance Practices
|
|
303A.10
|
Listed companies must adopt and disclose a code of business conduct and ethics for Directors, officers and employees and promptly disclose any waivers of the code for Directors or executive
officers. Each code of business conduct and ethics must require that any waiver of the code may be made only by the Board of Directors or a Board committee and must contain compliance standard and procedures to facilitate the
effective operation of the code, including action against violations of the code. Each listed company may determine its own policies, but all listed companies should address the following topics: conflicts of interest, corporate
opportunities, confidentiality, fair dealing, protection and proper use of listed company assets, compliance with laws, rules and regulations (including insider trading laws), and encouraging the reporting of any illegal or
unethical behavior.
|
Credicorp has adopted and published on the Company’s website (https://credicorp.gcs-web.com/) a Code of Ethics for Directors, officers and employees and has adopted a Code of Ethics for
professionals with financial responsibility. In accordance with our corporate policies, all Directors, executives, employees and suppliers must comply with the laws, regulations and government requirements applicable to business
conducted both in Peru and in other jurisdictions where the Corporation operates, acting with honesty and integrity as described in Credicorp’s Corporate Compliance Manual, Credicorp’s Code of Ethics, Credicorp’s Corporate
Ethics and Conduct Policy, the Anti-Money Laundering and Financing of Terrorism Manual, and other internal documents related to compliance.
|
|
303A.12
|
Each listed company must submit an executed written affirmation annually to the NYSE. Each listed company CEO must (i) certify to the NYSE each year that he or she is not aware of any violation by
the listed company of NYSE corporate governance listing standards, qualifying the certification to the extent necessary and (ii) promptly notify the NYSE in writing after any executive officer of the listed company becomes aware
of any non-compliance with any applicable provisions of Section 303A.
|
As a NYSE-listed company, Credicorp must submit an executed written affirmation annually to the NYSE, and its CEO must promptly notify the NYSE in writing after any executive officer of Credicorp
becomes aware of any non-compliance with any applicable provisions of Section 303A. There is no similar requirement under Bermuda law.
|
We are a company incorporated under the laws of Bermuda and are subject to Bermuda laws related to corporate governance. Under Bermuda law, there are no statutory requirements with
respect to the independence of a Board of Directors, meetings of non-management Directors, the establishment and composition of certain committees or the adoption and disclosure of corporate governance guidelines or codes of business
conduct and ethics. Certain Bermuda common law and statutory provisions, however, relate to duties and obligations of a company and its Directors that are similar to some of the duties and obligations arising from the provisions of
Section 303A of the NYSE’s Listed Company Manual.
(1) Fiduciary Duties and
Duties of Skill and Care Under Bermuda law
Under section 97(1) of the Companies Act 1981 of Bermuda, as amended (also referred to as the Companies Act), every Director and officer of a company must act honestly and in good
faith with a view to the best interests of the company (often referred to as a “fiduciary duty”) and must exercise the care, diligence, and skill that a reasonably prudent person would exercise in comparable circumstances (often
referred to as a “duty of skill and care”).
Fiduciary Duty
Under the common law applicable to Bermuda companies, the fiduciary duty of Directors has four aspects which may be briefly summarized as follows:
| a) |
A duty to act honestly and in good faith. A Director has a duty to act honestly and in good faith in what he considers are the best interests of the company and not for any collateral purpose. The courts allow the Director
wide discretion in determining this, interfering only if no reasonable Director could have believed that a course of action was in the best interests of the company. However, a Director acting honestly, but not in the best
interests of the company, is in breach of such duty.
|
| b) |
A duty to exercise powers for a proper purpose. Directors must act within the powers set out in the company’s memorandum of association and bye-laws and exercise their powers in the company’s interests and for the purposes
for which those powers were conferred. Even if the Directors are acting in good faith in the interests of the company as a whole, they must still use their powers for the purposes for which they were intended. For example, in
general Directors are not allowed to exercise their powers in such a way as to prevent a majority of the members from exercising their rights.
|
| c) |
A duty to avoid conflicts of interest. A Director must not put himself in a position where there is an actual or potential conflict between a personal interest and his duty to the company. However, a Director may enter into a
contract where a conflict of interest might arise if the Bye-laws allow it or the company gives its approval in a general meeting. Our bye-laws do not prohibit a Director from entering into a contract where a conflict of
interest may arise, but they do prohibit a Director from voting with respect to any contract or proposed contract or arrangement in which such Director is interested or with which such Director has a conflict of interest. In
addition, section 97(4) of the Companies Act requires our Directors and officers to disclose at the first opportunity any interest in a material contract, proposed material contract or person that is a party to a material
contract or proposed material contract with us or any of our subsidiaries.
|
| d) |
A duty not to appropriate, divert or personally profit from corporate opportunities. Unless the bye-laws specifically provide otherwise, a Director’s fiduciary position precludes him from appropriating, diverting, or taking a
personal profit from any opportunities that result from the directorship. Our Bye-laws do provide an exception to this rule. They provide that any Director, any Director’s firm or partner, or any company with which any Director
is associated may act for us in a professional capacity. Such Director, firm, partner, or company will be entitled to compensation for professional services as if the Director were not a member of our Board of Directors.
However, such Director, firm, partner, or company may not act as our auditor.
|
Duty of Skill and Care
Under the common law, applicable to Bermuda companies, the duty of skill and care has three aspects which may be briefly summarized as follows:
| e) |
Degree of Skill. A Director need not exhibit in the performance of his duties a greater degree of skill than may reasonably be expected from a person of like knowledge and experience. A Director is not expected to exercise a
level of skill he does not have. The level of skill required of a Director is subjective, in that the Director is not expected, merely by virtue of the office, to possess any particular skills. Performance must be judged by the
way the Director applies any skills which he actually has. However, Directors ought to acquire and maintain a sufficient knowledge and understanding of the company’s business to enable them to properly discharge their duties as
Directors.
|
| f) |
Attention to the Business. A Director must diligently attend to the affairs of the company. In the performance of this duty, a Director must at a minimum display the reasonable care an ordinary person would be expected to
take in the same circumstances on his own behalf. Mere errors of judgment have been held not to breach the duty of skill and care. A Director, as such, is not bound to give continuous attention to the affairs of the company, as
his or her duties are of an intermittent nature.
|
| g) |
Reliance on Others. A Director is not liable for the acts of Co-Directors or other company officers solely by virtue of the position. A Director is entitled to rely on his Co-Directors or company officers as well as
subordinates who are expressly put in charge of attending to the detail of management, provided such reliance is honest and reasonable (although a Director cannot absolve himself entirely of responsibility by delegation to
others). As a general rule, before delegating responsibility to others, the Directors in question should satisfy themselves that the delegates have the requisite skills to discharge the functions delegated to them. In addition,
the Directors must ensure that there is set up an adequate system of monitoring such delegates (e.g., managers). The Directors must, on a regular basis, ensure that their delegates have fulfilled their obligations. The Directors
should require a regular flow of information from the delegates to ensure that they are carrying out their duties satisfactorily. In addition, section 97(5A) of the Companies Act provides that a Director shall not have breached
the fiduciary duty or duty of skill and care required by section 97(1) if he relies in good faith upon financial statements of the company represented to him by another Director or officer of the company or a report of an
attorney, accountant, engineer, appraiser, or other person whose profession lends credibility to a statement made by him.
|
(2) Other Statutory Duties
and Obligations
The Companies Act imposes certain specific duties and obligations on companies and Directors, both directly and indirectly, including duties and obligations with respect to (i) loans
to Directors and related persons, (ii) limits on indemnities for Directors and officers and (iii) the keeping of proper books of account.
Loans to Directors and Related Persons
It is not lawful for a company to make a loan or to enter into a guarantee or provide security in connection with a loan to a Director or certain persons related to a Director
without the consent of the members of the company holding in the aggregate not less than 90% of the total voting rights of all the members having the right to vote at any meeting of the members of the company, except in certain specific
circumstances.
Limits on Indemnity for Directors
Section 98 of the Companies Act provides generally that a Bermuda company may indemnify its Directors, officers, and auditors against any liability which, by virtue of any rule of
law, would otherwise be imposed on them with respect to any negligence, default, breach of duty or breach of trust. However, this rule does not apply in cases where such liability arises from fraud or dishonesty of which such Director;
officer or auditor may be guilty in relation to the company or any of its subsidiaries. Any provision, whether contained in the Bye-laws of a company or in any contract or arrangement between the company and one of its Directors which
would exempt such Director from, or indemnify him against, any liability that would otherwise attach to him with respect to his fraud or dishonesty in relation to the company will be void. Section 98 further provides that a Bermuda
company may indemnify its Directors, officers and auditors against any liability incurred by them in defending any proceedings, whether civil or criminal, in which judgment is awarded in their favor or in which they are acquitted or
granted relief by the Supreme Court of Bermuda pursuant to section 281 of the Companies Act. In the event that an allegation of fraud or dishonesty is proven, the Director is obligated to disgorge any money provided for his defense.
Books of Account
It is the duty of the Directors to cause to be kept proper books of account with respect to all sums of money received and expended by the company and the matters with respect to
which the receipts and expenditures take place, all sales and purchases by the company, and the assets and liabilities of the company.
Although we are a holding company whose principal subsidiaries (Grupo Crédito S.A., BCP Stand-alone, and Grupo Pacífico) are incorporated under and subject to the laws of Peru,
initially we were registered in Peru as a foreign issuer and were consequently only subject to Peruvian regulations applicable to foreign issuers. Due to a regulatory amendment enacted in December 2017, now our stock is considered as a
valor nacional (or national security), which has resulted in changes to our reporting requirements for the SMV. Currently, there are no corporate governance provisions under Peruvian law
applicable to us that are similar to the provisions of Section 303A of the NYSE’s Listed Company Manual.
Not applicable.
Not applicable.
See Item 18.
Credicorp Consolidated Financial Statements and the report of the independent public accounting firm in connection therewith are filed as part of this Annual Report on Form 20-F, as
noted below:
| Page | |
|
Report of Independent Registered Public Accounting Firm
|
F-3 – F-7
|
|
Consolidated financial statements
|
|
|
Consolidated statements of financial position
|
F-8
|
|
Consolidated statements of income
|
F-9 – F-10
|
|
Consolidated statements of comprehensive income
|
F-11
|
|
Consolidated statements of changes in equity
|
F-12 – F-13
|
|
Consolidated statements of cash flows
|
F-14 – F-17
|
|
Notes to consolidated financial statements
|
F-18 – F-187
|
| • |
Index to Exhibits
|
1.1 Bye-laws of Credicorp Ltd. incorporated herein by reference to Exhibit 1.1 to
Credicorp’s Annual Report on Form 20-F dated April 28, 2021
1.2 Memorandum of Association of Credicorp Ltd. incorporated herein by reference
to Exhibit 1.2 to Credicorp’s Annual Report on Form 20-F dated May 29, 2020
2.1 Description
of Securities incorporated herein by reference to Exhibit 2.1 to Credicorp’s Annual Report on Form 20-F dated April 28, 2021
2.2 Indenture among Credicorp Ltd., as issuer, The Bank of New York Mellon, as Trustee, Paying Agent and Registrar, (undertaking to furnish upon request)
8. List of Subsidiaries incorporated herein by reference to Exhibit 8 to
Credicorp’s Annual Report on Form 20-F dated April 28, 2021
12.1 Certification by the Chief Executive Officer
Pursuant to Section 302 of the U.S. Sarbanes-Oxley Act of 2002
12.2 Certification by the Chief Financial Officer
Pursuant to Section 302 of the U.S. Sarbanes-Oxley Act of 2002
13.1 Certification by the Chief Executive Officer
Pursuant to Section 906 of the U.S. Sarbanes-Oxley Act of 2002
13.2 Certification by the Chief Financial Officer
Pursuant to Section 906 of the U.S. Sarbanes-Oxley Act of 2002
SIGNATURE
The registrant hereby certifies that it meets all of the requirements for filing on Form 20-F and that it has duly caused and authorized the undersigned to sign this Annual Report on
its behalf
CREDICORP LTD.
|
By:
|
/S/ CESAR RIOS
|
|
Name:
|
Cesar Rios
|
|
Tittle:
|
Chief Financial Officer
|
|
Dated: April 25, 2023
|
|
383
(Free translation from the original in Spanish)
CREDICORP LTD. AND SUBSIDIARIES
CONSOLIDATED FINANCIAL STATEMENTS
AS OF DECEMBER 31, 2022 AND 2021
F-1
(Free translation from the original in Spanish)
CREDICORP LTD. AND SUBSIDIARIES
CONSOLIDATED FINANCIAL STATEMENTS
AS OF DECEMBER 31, 2022 AND 2021
|
CONTENTS
|
Pages
|
|
Independent auditor’s report (PCAOB ID: )
|
F-3 - F-7
|
| F-8 | |
|
F-9 - F-10
|
|
|
F-11
|
|
|
F-12 - F-13
|
|
|
F-14 - F-17
|
|
|
F-18 - F-187
|
|
US$, U.S. dollar
|
= United States dollar
|
|
S/
|
= Sol
|
|
Bs
|
= Boliviano
|
|
$
|
= Colombian peso
|
|
¥
|
= Yen
|
F-2
Report of Independent Registered Public Accounting Firm
To the Board of Directors and Shareholders of Credicorp Ltd.
Opinions on the Financial Statements and Internal Control over Financial Reporting
We have audited the accompanying consolidated statement of financial position of Credicorp Ltd. and its subsidiaries (the “Company”) as of December 31, 2022 and 2021, and the related consolidated statements of income, comprehensive income, changes in net
equity and cash flows for each of the three years in the period ended December 31, 2022, including the related notes (collectively referred to as the “consolidated financial statements”). We also have audited the Company's internal control over financial reporting as of December 31, 2022, based on criteria established in Internal Control - Integrated Framework (2013) issued by the Committee of Sponsoring Organizations of the Treadway Commission (COSO).
In our opinion, the consolidated financial statements referred to above present fairly, in all material respects, the financial position of the Company as of
December 31, 2022 and 2021, and the results of its operations
and its cash flows for each of the three years in the period ended December 31, 2022 in conformity with International Financial Reporting Standards as issued by the International Accounting Standards
Board. Also, in our opinion, the Company maintained, in all material respects, effective internal control over financial reporting as of December 31,
2022, based on criteria established in Internal Control - Integrated Framework (2013) issued by the COSO.
F-3
Basis for Opinions
The Company's management is responsible for these consolidated financial statements, for maintaining effective internal control over financial reporting, and for its assessment of the effectiveness of internal control over
financial reporting, included in the accompanying Management's Annual Report on Internal Control over Financial Reporting. Our responsibility is to
express opinions on the Company’s consolidated financial statements and on the Company's internal control over financial reporting based on our audits. We are a public accounting firm registered with the Public Company Accounting Oversight
Board (United States) (PCAOB) and are required to be independent with respect to the Company in accordance with the U.S. federal securities laws and the applicable rules and regulations of the Securities and Exchange Commission and the PCAOB.
We conducted our audits in accordance with the standards of the PCAOB. Those standards require that we plan and perform the audits to obtain reasonable assurance about whether the consolidated financial statements are free
of material misstatement, whether due to error or fraud, and whether effective internal control over financial reporting was maintained in all material respects.
Our audits of the consolidated financial statements included performing procedures to assess the risks of material misstatement of the
consolidated financial statements, whether due to error or fraud, and performing procedures that respond to those risks. Such procedures included examining, on a test basis, evidence regarding the amounts and disclosures in the consolidated
financial statements. Our audits also included evaluating the accounting principles used and significant estimates made by management, as well as evaluating the overall presentation of the consolidated financial statements. Our audit of internal
control over financial reporting included obtaining an understanding of internal control over financial reporting, assessing the risk that a material weakness exists, and testing and evaluating the design and operating effectiveness of internal
control based on the assessed risk. Our audits also included performing such other procedures as we considered necessary in the circumstances. We believe that our audits provide a reasonable basis for our opinions.
F-4
Definition and Limitations of Internal Control over Financial Reporting
A company’s internal control over financial reporting is a process designed to provide reasonable assurance regarding the reliability of financial reporting and
the preparation of financial statements for external purposes in accordance with generally accepted accounting principles. A company’s internal control over financial reporting includes those policies and procedures that (i) pertain to the
maintenance of records that, in reasonable detail, accurately and fairly reflect the transactions and dispositions of the assets of the company; (ii) provide reasonable assurance that transactions are recorded as necessary to permit preparation of
financial statements in accordance with generally accepted accounting principles, and that receipts and expenditures of the company are being made only in accordance with authorizations of management and directors of the company; and (iii) provide
reasonable assurance regarding prevention or timely detection of unauthorized acquisition, use, or disposition of the company’s assets that could have a material effect on the financial statements.
Because of its inherent limitations, internal control over financial reporting may not prevent or detect misstatements. Also, projections of any evaluation of
effectiveness to future periods are subject to the risk that controls may become inadequate because of changes in conditions, or that the degree of compliance with the policies or procedures may deteriorate.
Critical Audit Matters
The critical audit matters communicated below are matters arising from the current period audit of the consolidated financial statements that were communicated or
required to be communicated to the audit committee and that (i) relate to accounts or disclosures that are material to the consolidated financial
statements and (ii) involved our especially challenging, subjective, or complex judgments. The communication of critical audit matters does not alter in any way our opinion on the consolidated financial statements, taken as a whole, and we are not, by communicating the critical audit matters below, providing separate opinions on the critical audit matters or on the accounts or disclosures to
which they relate.
Allowance for loan losses
As described in Notes 3 f, 3 i, 7 and 34.1 to the consolidated financial statements, the amount recognized as allowance for loan losses is S/8,531
million as of December 31, 2022. As disclosed by management, the allowance is management’s estimate of expected credit losses that result from models with a series of underlying assumptions with regard to the choice of the variable inputs and their
interdependencies. The impairment model for expected credit loss reflects the present value of all the cash flows related to the events of default, at (i) twelve months or (ii) the lifetime of the financial instrument depending on the impairment of
the credit from inception in a three-stage model. The measurement of the expected credit loss is mainly based on the product of probability of default (PD), obtained mainly through rating and scoring tools; loss given default (LGD) and exposure at
default (EAD), discounted at the reporting date and considering the expected macroeconomic effects. The expected credit loss reflects a result weighted by probability that considers a range of multiple outcomes based on reasonable and supportable
forecasts. In addition, for commercial debtors with the highest debt that are in default, management performs an individual review to determine the expected loss in each case, in which it considers, among others, the financial information available
and the coverage of real guarantees.
F-5
The principal considerations for our determination that performing procedures relating to the allowance for loan losses is a critical audit matter are: (i) the
significant judgement by management when developing its estimate, which in turn led to a high degree of auditor judgment, subjectivity; and (ii) the effort in evaluating the significant judgment and assumptions used in the determination of PD, LGD
and EAD, related to rating and scoring tools, prospective information, the determination of stages based on the impairment of the credit since its initial recognition and the individual review for commercial debtors in default. Also, the audit
effort involved the use of professionals with specialized skill and knowledge.
Addressing the matter involved performing procedures and evaluating audit evidence in connection with forming our overall opinion on the consolidated financial
statements. These procedures included testing the effectiveness of controls relating to the Company’s allowance estimation process, which included controls over data inputs, models and assumptions adopted by management, and the calculation of the
allowance for loan losses. These procedures also included, among others, (i) testing the completeness and accuracy of the data used in the estimate and the mathematical accuracy of the impairment calculation for the credit portfolios and; (ii)
evaluating the appropriateness of the models utilized for the estimation of the expected credit loss and the reasonableness of the significant assumptions related to the determination of PD, LGD and EAD, as well as rating and scoring tools,
prospective information and the individual review performed on commercial debtors in default. The procedures included the involvement of professionals with specialized skill and knowledge to assist in testing management’s process for estimating
expected credit loss allowance.
Valuation of the mathematical reserves for annuities
As described in Notes 3 e, 16 and 34.6 to the consolidated financial statements, the amount recognized as mathematical reserves for annuities is S/6,254 million
as of December 31, 2022. As disclosed by management, the valuation of the Company’s mathematical reserves for annuities depends on significant judgment selecting actuarial methodologies and assumptions regarding future events. The main assumptions
used in the valuation of the mathematical reserves for annuities are: (i) the mortality tables; and (ii) the discount rates. Changes in each of these assumptions could result in significant impacts in the valuation of the mathematical reserves for
annuities and in the respective impacts reflected in the consolidated financial statements.
F-6
The principal considerations for our determination that performing procedures relating to mathematical reserves for annuities is a critical audit matter are: (i)
the significant judgement by management when developing its estimate, which in turn led to a high degree of auditor judgment, subjectivity; and (ii) the effort in evaluating the significant judgment and the main assumptions related to the mortality
tables and discount rates. Also, the audit effort involved the use of professionals with specialized skill and knowledge.
Addressing the matter involved performing procedures and evaluating audit evidence in connection with forming our overall opinion on the consolidated financial
statements. These procedures included testing the effectiveness of controls relating to the valuation of the mathematical reserves for annuities, which includes controls over data inputs, assumptions, and calculation of the mathematical reserves.
These procedures also included, among others, testing the completeness, accuracy and relevance of underlying data used in the model, the appropriateness of discount rates, and the involvement of professionals with specialized skill and knowledge to
assist in testing management’s process for the valuation of the mathematical reserves for annuities, including evaluating the appropriateness of the methodologies and models and evaluating the reasonableness of the main assumptions related to the
mortality tables and discount rates.
/S/Gaveglio, Aparicio y Asociados S.C.R.L.
April 25, 2023
We have served as the Company’s auditor since 2015.
Countersigned by
| (partner) | |
|
/s/Gustavo Villafana
|
|
|
Peruvian Certified Public Accountant Registration No. 46192
|
|
F-7
(Free translation from the original in Spanish)
CREDICORP LTD. AND SUBSIDIARIES
AS OF DECEMBER 31, 2022 AND 2021
|
Note
|
2022
|
2021
|
||||||||||
|
S/(000)
|
|
S/(000)
|
|
|||||||||
|
Assets
|
||||||||||||
|
Cash and due from banks:
|
||||||||||||
|
Non-interest-bearing
|
|
|
||||||||||
|
Interest-bearing
|
|
|
||||||||||
|
4
|
|
|
||||||||||
|
Cash collateral, reverse repurchase agreements and securities borrowing
|
5(a)
|
|
|
|
||||||||
|
Investments:
|
||||||||||||
|
At fair value through profit or loss
|
6(a)
|
|
|
|
||||||||
|
At fair value through other comprehensive income
|
|
|
||||||||||
|
At fair value through other comprehensive income pledged as collateral
|
|
|
||||||||||
|
6(b)
|
|
|
|
|||||||||
|
Amortized cost
|
|
|
||||||||||
|
Amortized cost pledged as collateral
|
|
|
||||||||||
|
6(c)
|
|
|
|
|||||||||
|
Loans, net:
|
7
|
|||||||||||
|
Loans, net of unearned income
|
|
|
||||||||||
|
Provision for credit losses
|
(
|
)
|
(
|
)
|
||||||||
|
|
|
|||||||||||
|
Financial assets designated at fair value through profit or loss
|
8
|
|
|
|||||||||
|
Premiums and other policies receivable
|
9(a)
|
|
|
|
||||||||
|
Accounts receivable from reinsurers and coinsurers
|
9(b)
|
|
|
|
||||||||
|
Property, furniture and equipment, net
|
10
|
|
|
|||||||||
|
Due from customers on banker’s acceptances
|
3(r) and 7(b) |
|
|
|||||||||
|
Intangible assets and goodwill, net
|
11
|
|
|
|||||||||
|
Right-of-use assets, net
|
12(a)
|
|
|
|
||||||||
|
Deferred tax assets, net
|
19(c) |
|
|
|||||||||
|
Other assets
|
13
|
|
|
|||||||||
|
Total assets
|
|
|
||||||||||
|
Liabilities
|
||||||||||||
|
Deposits and obligations:
|
|
|||||||||||
|
Non-interest-bearing
|
|
|
||||||||||
|
Interest-bearing
|
|
|
||||||||||
| 14(a) |
|
|
|
|||||||||
|
Payables from repurchase agreements and securities lending
|
5(b)
|
|
|
|
||||||||
|
Due to banks and correspondents
|
15(a)
|
|
|
|
||||||||
|
Due from customers on banker’s acceptances
|
3(r) and 7(b) |
|
|
|||||||||
|
Accounts payable to reinsurers
|
9(b)
|
|
|
|
||||||||
|
Lease liabilities
|
12(b)
|
|
|
|
||||||||
|
Financial liabilities at fair value through profit or loss
|
3(ad)
|
|
|
|
||||||||
|
Technical reserves for insurance claims and premiums
|
16
|
|
|
|||||||||
|
Bonds and notes issued
|
17
|
|
|
|||||||||
|
Deferred tax liabilities, net
|
19(c) |
|
|
|
||||||||
|
Other liabilities
|
13
|
|
|
|||||||||
|
Total liabilities
|
|
|
||||||||||
|
Equity, net
|
18
|
|||||||||||
|
Equity attributable to Credicorp’s equity holders:
|
||||||||||||
|
Capital stock
|
|
|
||||||||||
|
Treasury stock
|
(
|
)
|
(
|
)
|
||||||||
|
Capital surplus
|
|
|
||||||||||
|
Reserves
|
|
|
||||||||||
|
Other reserves
|
(
|
)
|
|
|||||||||
|
Retained earnings
|
|
|
||||||||||
|
|
|
|||||||||||
|
Non-controlling interest
|
|
|
||||||||||
|
Total equity, net
|
|
|
||||||||||
|
Total liabilities and net equity
|
|
|
||||||||||
The accompanying notes are an integral part of these consolidated financial statements.
F-8
(Free translation from the original in Spanish)
CREDICORP LTD. AND SUBSIDIARIES
FOR THE YEARS ENDED DECEMBER 31, 2022, 2021 AND 2020
|
Note
|
2022 | 2021 | 2020 | |||||||||||||
|
S/(000
|
)
|
S/(000
|
)
|
S/(000
|
)
|
|||||||||||
|
Interest and similar income
|
22
|
|
|
|
||||||||||||
|
Interest and similar expenses
|
22
|
(
|
)
|
(
|
)
|
(
|
)
|
|||||||||
|
Net interest, similar income and expenses
|
|
|
|
|||||||||||||
|
Provision for credit losses on loan portfolio
|
7(c)
|
|
(
|
)
|
(
|
)
|
(
|
)
|
||||||||
|
Recoveries of written-off loans
|
|
|
|
|||||||||||||
|
Provision for credit losses on loan portfolio, net of recoveries
|
(
|
)
|
(
|
)
|
(
|
)
|
||||||||||
|
Net interest, similar income and expenses, after provision for credit losses on loan portfolio
|
|
|
|
|||||||||||||
|
Other income
|
||||||||||||||||
|
Commissions and fees
|
23
|
|
|
|
||||||||||||
|
Net gain on foreign exchange transactions
|
|
|
|
|||||||||||||
|
Net gain on securities
|
24
|
|
|
|
||||||||||||
|
Net gain on derivatives held for trading
|
|
|
(
|
)
|
||||||||||||
|
Net loss from exchange differences
|
(
|
)
|
(
|
)
|
|
|||||||||||
|
Others
|
29
|
|
|
|
||||||||||||
|
Total other income
|
|
|
|
|||||||||||||
|
Insurance underwriting result
|
||||||||||||||||
|
Net premiums earned
|
25
|
|
|
|
||||||||||||
|
Net claims incurred for life, general and health insurance contracts
|
26
|
(
|
)
|
(
|
)
|
(
|
)
|
|||||||||
|
Acquisition cost
|
(
|
)
|
(
|
)
|
(
|
)
|
||||||||||
|
Total insurance underwriting result
|
|
(
|
)
|
|
||||||||||||
|
Other expenses
|
||||||||||||||||
|
Salaries and employee benefits
|
27
|
(
|
)
|
(
|
)
|
(
|
)
|
|||||||||
|
Administrative expenses
|
28
|
(
|
)
|
(
|
)
|
(
|
)
|
|||||||||
|
Depreciation and amortization
|
10 and 11(a) | ( |
) | ( |
) | ( |
) | |||||||||
|
Impairment loss on goodwill
|
11(b)
|
|
|
|
(
|
)
|
||||||||||
|
Depreciation for right-of-use assets
|
12(a)
|
|
(
|
)
|
(
|
)
|
(
|
)
|
||||||||
|
Others
|
29
|
(
|
)
|
(
|
)
|
(
|
)
|
|||||||||
|
Total other expenses
|
(
|
)
|
(
|
)
|
(
|
)
|
||||||||||
F-9
CONSOLIDATED STATEMENT OF INCOME (continued)
|
Note
|
2022
|
2021
|
2020
|
|||||||||||||
|
S/(000
|
)
|
S/(000
|
)
|
S/(000
|
)
|
|||||||||||
|
Net result before income tax
|
|
|
|
|||||||||||||
|
Income tax
|
19(b)
|
|
(
|
)
|
(
|
)
|
|
|||||||||
|
Net result after income tax
|
|
|
|
|||||||||||||
|
Attributable to:
|
||||||||||||||||
|
Credicorp’s equity holders
|
|
|
|
|||||||||||||
|
Non-controlling interest
|
|
|
(
|
)
|
||||||||||||
|
|
|
|
||||||||||||||
|
Net basic and dilutive earnings per share attributable to Credicorp’s equity holders (in soles):
|
||||||||||||||||
|
Basic
|
30
|
|
|
|
||||||||||||
|
Diluted
|
30
|
|
|
|
||||||||||||
The accompanying notes are an integral part of these consolidated financial statements.
F-10
(Free translation from the original in Spanish)
CREDICORP LTD. AND SUBSIDIARIES
FOR THE YEARS ENDED DECEMBER 31, 2022, 2021 AND 2020
|
2022
|
2021
|
2020
|
|||||||||||||
| S/(000) |
S/(000) | S/(000) | |||||||||||||
|
Net profit for the year
|
|
|
|||||||||||||
|
Other comprehensive income:
|
|||||||||||||||
|
To be reclassified to profit or loss in subsequent periods:
|
|||||||||||||||
|
Net (loss) gain on investments at fair value through other comprehensive income
|
18(d)
|
(
|
)
|
(
|
)
|
|
|||||||||
|
Income tax
|
18(d)
|
|
|
(
|
)
|
||||||||||
|
(
|
)
|
(
|
)
|
|
|||||||||||
|
Net movement of cash flow hedge reserves
|
18(d)
|
|
|
(
|
)
|
||||||||||
|
Income tax
|
18(d)
|
(
|
)
|
(
|
)
|
|
|||||||||
|
|
|
(
|
)
|
||||||||||||
|
Other reserves
|
18(d)
|
|
|
(
|
)
|
||||||||||
|
Income tax
|
18(d)
|
|
(
|
)
|
|
||||||||||
|
|
|
(
|
)
|
||||||||||||
|
Exchange differences on translation of foreign operations
|
18(d)
|
(
|
)
|
|
|
||||||||||
|
Net movement in hedges of net investments in foreign businesses
|
18(d)
|
|
(
|
)
|
(
|
)
|
|||||||||
|
(
|
)
|
|
|
||||||||||||
|
Total
|
(
|
)
|
(
|
)
|
|
||||||||||
|
Not to be reclassified to profit or loss in subsequent periods:
|
|||||||||||||||
|
Net loss on equity instruments designated at fair value through other comprehensive income
|
18(d)
|
(
|
)
|
(
|
)
|
(
|
)
|
||||||||
|
Income tax
|
18(d)
|
|
|
|
|||||||||||
| ( |
) | ( |
) | ( |
) | ||||||||||
| Total |
(
|
)
|
(
|
)
|
(
|
)
|
|||||||||
|
Total other comprehensive income
|
18(d)
|
(
|
)
|
(
|
)
|
|
|||||||||
|
Total comprehensive income for the year, net of income tax
|
|
|
|
||||||||||||
|
Attributable to:
|
|||||||||||||||
|
Credicorp’s equity holders
|
|
|
|
||||||||||||
|
Non-controlling interest
|
|
|
(
|
)
|
|||||||||||
|
|
|
|
|||||||||||||
The accompanying notes are an integral part of these consolidated financial statements.
F-11
(Free translation from the original in Spanish)
CREDICORP LTD. AND SUBSIDIARIES
FOR THE YEARS ENDED DECEMBER 31, 2022, 2021 AND 2020
|
Attributable to Credicorp’s equity holders.
|
||||||||||||||||||||||||||||||||||||||||||||||||||||||||
|
Other reserves
|
||||||||||||||||||||||||||||||||||||||||||||||||||||||||
|
Treasury stock
|
Instruments
that will not
be reclassified
to income
|
Instruments that will be reclassified to the
consolidated statement of income
|
||||||||||||||||||||||||||||||||||||||||||||||||||||||
|
Capital
stock
|
Shares of
the Group
|
Share-
based
payment
|
Capital
surplus
|
Reserves and others
|
Investments
in equity
instruments
|
Investments
in debt
instruments
|
Cash flow
hedge reserve
|
Insurance
reserves
|
Foreign
currency
translation
reserve
|
Retained
earnings
|
Total
|
Non-
controlling
interest
|
Total net
equity
|
|||||||||||||||||||||||||||||||||||||||||||
|
S/(000)
|
|
S/(000)
|
|
S/(000)
|
|
S/(000)
|
|
S/(000)
|
|
S/(000)
|
|
S/(000)
|
|
S/(000)
|
|
S/(000)
|
|
S/(000)
|
|
S/(000)
|
|
S/(000)
|
|
S/(000)
|
|
S/(000)
|
|
|||||||||||||||||||||||||||||
|
Balances as of January 1, 2020
|
|
(
|
)
|
(
|
)
|
|
|
|
|
(
|
)
|
(
|
)
|
(
|
)
|
|
|
|
|
|||||||||||||||||||||||||||||||||||||
|
Changes in equity in 2020 -
|
||||||||||||||||||||||||||||||||||||||||||||||||||||||||
|
Net profit for the year
|
|
|
|
|
|
|
|
|
|
|
|
|
(
|
)
|
|
|||||||||||||||||||||||||||||||||||||||||
|
Other comprehensive income, Note 18(d)
|
|
|
|
|
|
(
|
)
|
|
(
|
)
|
(
|
)
|
|
|
|
|
|
|||||||||||||||||||||||||||||||||||||||
|
Total comprehensive income
|
|
|
|
|
|
(
|
)
|
|
(
|
)
|
(
|
)
|
|
|
|
(
|
)
|
|
||||||||||||||||||||||||||||||||||||||
|
Transfer of retained earnings to reserves, Note 18(c)
|
|
|
|
|
|
|
|
|
|
|
(
|
)
|
|
|
|
|||||||||||||||||||||||||||||||||||||||||
|
Dividend distribution, Note 18(e)
|
|
|
|
|
|
|
|
|
|
|
(
|
)
|
(
|
)
|
|
(
|
)
|
|||||||||||||||||||||||||||||||||||||||
|
Dividends paid to interest non-controlling of subsidiaries
|
|
|
|
|
|
|
|
|
|
|
|
|
(
|
)
|
(
|
)
|
||||||||||||||||||||||||||||||||||||||||
| Additional dividends |
||||||||||||||||||||||||||||||||||||||||||||||||||||||||
|
Purchase of treasury stock, Note 18(b)
|
|
|
(
|
)
|
(
|
)
|
|
|
|
|
|
|
|
(
|
)
|
|
(
|
)
|
||||||||||||||||||||||||||||||||||||||
|
Sale of treasury stocks
|
||||||||||||||||||||||||||||||||||||||||||||||||||||||||
|
Share-based payment transactions
|
|
|
|
|
|
|
|
|
|
|
|
|
|
|
||||||||||||||||||||||||||||||||||||||||||
|
Others
|
|
|
|
|
|
|
|
|
|
|
(
|
)
|
(
|
)
|
|
|
||||||||||||||||||||||||||||||||||||||||
|
Balances as of December 31, 2020
|
|
(
|
)
|
(
|
)
|
|
|
|
|
(
|
)
|
(
|
)
|
|
|
|
|
|
||||||||||||||||||||||||||||||||||||||
|
Changes in equity in 2021 -
|
||||||||||||||||||||||||||||||||||||||||||||||||||||||||
|
Net profit for the year
|
|
|
|
|
|
|
|
|
|
|
|
|
|
|
||||||||||||||||||||||||||||||||||||||||||
|
Other comprehensive income, Note 18(d)
|
|
|
|
|
|
(
|
)
|
(
|
)
|
|
|
|
|
(
|
)
|
(
|
)
|
(
|
)
|
|||||||||||||||||||||||||||||||||||||
|
Total comprehensive income
|
|
|
|
|
|
(
|
)
|
(
|
)
|
|
|
|
|
|
|
|
||||||||||||||||||||||||||||||||||||||||
|
Transfer of retained earnings to reserves, Note 18(c)
|
|
|
|
|
|
|
|
|
|
|
(
|
)
|
|
|
|
|||||||||||||||||||||||||||||||||||||||||
|
Dividend distribution, Note 18(e)
|
|
|
|
|
(
|
)
|
|
|
|
|
|
|
(
|
)
|
|
(
|
)
|
|||||||||||||||||||||||||||||||||||||||
|
Dividends paid to interest non-controlling of subsidiaries
|
|
|
|
|
|
|
|
|
|
|
|
|
(
|
)
|
(
|
)
|
||||||||||||||||||||||||||||||||||||||||
|
Minority purchase
|
|
|
|
|
|
|
|
|
|
|
|
|
(
|
)
|
(
|
)
|
||||||||||||||||||||||||||||||||||||||||
|
Purchase of treasury stock, Note 18(b)
|
( |
) | ( |
) | ( |
) | ( |
) | ||||||||||||||||||||||||||||||||||||||||||||||||
|
Sale of treasury stocks
|
||||||||||||||||||||||||||||||||||||||||||||||||||||||||
|
Share-based payment transactions
|
|
|
|
|
(
|
)
|
|
|
|
|
|
|
|
|
|
|||||||||||||||||||||||||||||||||||||||||
|
Others
|
|
|
|
|
|
|
|
|
|
|
(
|
)
|
(
|
)
|
(
|
)
|
(
|
)
|
||||||||||||||||||||||||||||||||||||||
|
Balances as of December 31, 2021
|
|
(
|
)
|
(
|
)
|
|
|
|
(
|
)
|
(
|
)
|
(
|
)
|
|
|
|
|
|
|||||||||||||||||||||||||||||||||||||
F-12
CONSOLIDATED STATEMENT OF CHANGES IN NET EQUITY (continued)
|
Attributable to Credicorp’s equity holders.
|
||||||||||||||||||||||||||||||||||||||||||||||||||||||||
|
Other reserves
|
||||||||||||||||||||||||||||||||||||||||||||||||||||||||
|
Treasury stock
|
Instruments that will not be reclassified to income
|
|||||||||||||||||||||||||||||||||||||||||||||||||||||||
|
Capital
stock
|
Shares of
the Group
|
Share-
based
payment
|
Capital
surplus
|
Reserves and others
|
Investments
in equity
instruments
|
Investments
in debt
instruments
|
Cash flow
hedge reserve
|
Insurance
reserves |
Foreign
currency
translation
reserve
|
Retained
earnings
|
Total
|
Non-
controlling
interest
|
Total net
equity
|
|||||||||||||||||||||||||||||||||||||||||||
|
S/(000)
|
|
S/(000)
|
|
S/(000)
|
S/(000)
|
S/(000)
|
S/(000)
|
|
S/(000)
|
S/(000)
|
S/(000)
|
S/(000)
|
S/(000)
|
S/(000)
|
S/(000)
|
|
S/(000)
|
|||||||||||||||||||||||||||||||||||||||
|
Balances as of December 31, 2021
|
|
(
|
)
|
(
|
)
|
|
|
|
(
|
)
|
(
|
)
|
(
|
)
|
|
|
|
|
|
|||||||||||||||||||||||||||||||||||||
|
Changes in equity in 2022 -
|
||||||||||||||||||||||||||||||||||||||||||||||||||||||||
|
Net profit for the year
|
|
|
|
|
|
|
|
|
|
|
|
|
|
|
||||||||||||||||||||||||||||||||||||||||||
|
Other comprehensive income, Note 18(d)
|
|
|
|
|
|
(
|
)
|
(
|
)
|
|
|
(
|
)
|
|
(
|
)
|
(
|
)
|
(
|
)
|
||||||||||||||||||||||||||||||||||||
|
Total comprehensive income
|
|
|
|
|
|
(
|
)
|
(
|
)
|
|
|
(
|
)
|
|
|
|
|
|||||||||||||||||||||||||||||||||||||||
|
Transfer of retained earnings to reserves, Note 18(c)
|
|
|
|
|
|
|
|
|
|
|
(
|
)
|
|
|
|
|||||||||||||||||||||||||||||||||||||||||
|
Dividend distribution, Note 18(e)
|
|
|
|
|
|
|
|
|
|
|
(
|
)
|
(
|
)
|
|
(
|
)
|
|||||||||||||||||||||||||||||||||||||||
|
Dividends paid to interest non-controlling of subsidiaries
|
|
|
|
|
|
|
|
|
|
|
|
|
(
|
)
|
(
|
)
|
||||||||||||||||||||||||||||||||||||||||
|
Non-controlling interest stock put option, Note 3(n)
|
( |
) | ( |
) | ( |
) | ||||||||||||||||||||||||||||||||||||||||||||||||||
|
Minority purchase, Note 3(n)
|
( |
) | ( |
) | ||||||||||||||||||||||||||||||||||||||||||||||||||||
|
Purchase of treasury stock, Note 18(b)
|
|
|
(
|
)
|
(
|
)
|
|
|
|
|
|
|
|
(
|
)
|
|
(
|
)
|
||||||||||||||||||||||||||||||||||||||
|
Sale of treasury stocks
|
|
|
|
|
|
|
|
|
|
|
|
|
|
|
||||||||||||||||||||||||||||||||||||||||||
|
Share-based payment transactions
|
|
|
|
|
(
|
)
|
|
|
|
|
|
|
|
|
|
|||||||||||||||||||||||||||||||||||||||||
|
Others
|
|
|
|
|
|
|
|
|
|
|
(
|
)
|
(
|
)
|
(
|
)
|
(
|
)
|
||||||||||||||||||||||||||||||||||||||
|
Balances as of December 31, 2022
|
|
(
|
)
|
(
|
)
|
|
|
|
(
|
)
|
|
|
|
|
|
|
|
|||||||||||||||||||||||||||||||||||||||
The accompanying notes are an integral part of these consolidated financial statements.
F-13
(Free translation from the original in Spanish)
CREDICORP LTD. AND SUBSIDIARIES
FOR THE YEARS ENDED DECEMBER 31, 2022, 2021 AND 2020
|
Note
|
2022
|
2021
|
2020
|
|||||||||||||
| S/(000) |
S/(000) | S/(000) | ||||||||||||||
| |
||||||||||||||||
|
CASH AND CASH EQUIVALENTS FROM OPERATING ACTIVITIES
|
||||||||||||||||
|
Net profit for the year
|
|
|
|
|||||||||||||
|
Adjustment to reconcile net profit to net cash arising from operating activities:
|
||||||||||||||||
|
Provision for credit losses on loan portfolio
|
7(c)
|
|
|
|
|
|||||||||||
|
Impact of fair value of portfolio with change in effective rate
|
|
|
|
|||||||||||||
|
Depreciation and amortization
|
|
10 and 11(a) |
|
|
|
|||||||||||
|
Depreciation of right-of-use assets
|
12(a)
|
|
|
|
|
|||||||||||
|
Depreciation of investment properties
|
13(h)
|
|
|
|
|
|||||||||||
| Provision for sundry risks | 13(j) | |||||||||||||||
|
Deferred (income) tax expense
|
19(b)
|
|
|
|
(
|
)
|
||||||||||
|
Adjustment of technical reserves
|
25(a)
|
|
|
|
|
|||||||||||
|
Net gain on securities
|
24
|
(
|
)
|
(
|
)
|
(
|
)
|
|||||||||
|
Impairment loss on goodwill
|
11(b)
|
|
|
|
|
|||||||||||
|
Loss (Gain) on financial assets designated at fair value through profit and loss
|
25(a)
|
|
|
(
|
)
|
(
|
)
|
|||||||||
|
Net gain of trading derivatives
|
(
|
)
|
(
|
)
|
|
|||||||||||
|
Net Income from sale of property, furniture and equipment
|
29
|
(
|
)
|
(
|
)
|
(
|
)
|
|||||||||
|
Gain net from sale of seized and recovered assets
|
29
|
(
|
)
|
(
|
)
|
(
|
)
|
|||||||||
|
Expense for share-based payment transactions
|
27
|
|
|
|
||||||||||||
|
Net gain from sale of written-off portfolio
|
29 |
(
|
)
|
(
|
)
|
(
|
)
|
|||||||||
|
Intangible losses due to withdrawals and dismissed projects
|
29
|
|
|
|
||||||||||||
|
Others
|
|
(
|
)
|
|
||||||||||||
|
Net changes in assets and liabilities
|
||||||||||||||||
|
Net (increase) decrease in assets:
|
||||||||||||||||
|
Loans
|
(
|
)
|
(
|
)
|
(
|
)
|
||||||||||
|
Investments at fair value through profit or loss
|
|
|
(
|
)
|
||||||||||||
|
Investments at fair value through other comprehensive income
|
(
|
)
|
|
(
|
)
|
|||||||||||
|
Cash collateral, reverse repurchase agreements and securities borrowings
|
|
|
|
|||||||||||||
|
Sale of written off portfolio
|
|
|
|
|||||||||||||
|
Other assets
|
|
(
|
)
|
(
|
)
|
|||||||||||
F-14
CONSOLIDATED STATEMENT OF CASH FLOWS (continued)
|
Note
|
2022
|
2021
|
2020
|
|||||||||||||
| S/(000) |
S/(000) | S/(000) | ||||||||||||||
|
Net increase (decrease) in liabilities
|
||||||||||||||||
|
Deposits and obligations
|
(
|
)
|
|
|
||||||||||||
|
Due to Banks and correspondents
|
|
|
(
|
)
|
||||||||||||
|
Payables from repurchase agreements and securities lending
|
(
|
)
|
(
|
)
|
|
|||||||||||
|
Bonds and notes issued
|
(
|
)
|
(
|
)
|
(
|
)
|
||||||||||
|
Short-term and low-value lease payments
|
(
|
)
|
(
|
)
|
(
|
)
|
||||||||||
|
Other liabilities
|
|
|
|
|||||||||||||
|
Income tax paid
|
(
|
)
|
(
|
)
|
(
|
)
|
||||||||||
|
Net cash flow from operating activities
|
(
|
)
|
|
|
||||||||||||
|
NET CASH FLOWS FROM INVESTING ACTIVITIES
|
||||||||||||||||
|
Revenue from sale of property, furniture and equipment
|
|
|
|
|||||||||||||
|
(Loss) revenue from sale of investment property
|
29 |
(
|
)
|
|
|
|||||||||||
|
Revenue from sales and reimbursement of investment to amortized cost
|
|
|
|
|||||||||||||
|
Purchase of property, furniture and equipment
|
10
|
(
|
)
|
(
|
)
|
(
|
)
|
|||||||||
|
Purchase of investment property
|
13(h)
|
|
(
|
)
|
(
|
)
|
(
|
)
|
||||||||
|
Purchase of intangible assets
|
11(a)
|
|
(
|
)
|
(
|
)
|
(
|
)
|
||||||||
|
Purchase of investment at amortized cost
|
(
|
)
|
(
|
)
|
(
|
)
|
||||||||||
|
Net cash flows from investing activities
|
(
|
)
|
(
|
)
|
(
|
)
|
||||||||||
|
NET CASH FLOWS FROM FINANCING ACTIVITIES
|
||||||||||||||||
|
Dividends paid
|
18(e)
|
|
(
|
)
|
( |
) |
(
|
)
|
||||||||
|
Dividends paid to non-controlling interest of subsidiaries
|
(
|
)
|
( |
) |
(
|
)
|
||||||||||
|
Principal payments of leasing contracts
|
(
|
)
|
(
|
)
|
(
|
)
|
||||||||||
|
Interest payments of leasing contracts
|
(
|
)
|
(
|
)
|
(
|
)
|
||||||||||
|
Purchase of treasury stock
|
18(b)
|
|
(
|
)
|
(
|
)
|
(
|
)
|
||||||||
| Sale of treasury stock |
||||||||||||||||
|
Acquisition of non-controlling interest
|
(
|
)
|
(
|
)
|
|
|||||||||||
| Subordinated bonds | ( |
) | ||||||||||||||
|
Net cash flows from financing activities
|
(
|
)
|
(
|
)
|
(
|
)
|
||||||||||
F-15
CONSOLIDATED STATEMENT OF CASH FLOWS (continued)
|
|
Note |
2022
|
2021
|
2020
|
||||||||||||
| S/(000) |
S/(000) | S/(000) | ||||||||||||||
|
Net (decrease) increase of cash and cash equivalents before effect of changes in exchange rate
|
(
|
)
|
(
|
)
|
|
|||||||||||
|
Effect of changes in exchange rate of cash and cash equivalents
|
(
|
)
|
|
|
||||||||||||
|
Cash and cash equivalents at the beginning of the period
|
4(a) |
|
|
|
||||||||||||
|
Cash and cash equivalents at the end of the period
|
4(a) |
|
|
|
||||||||||||
|
Additional information from cash flows
|
||||||||||||||||
|
Interest received
|
|
|
|
|||||||||||||
|
Interest paid
|
(
|
)
|
(
|
)
|
(
|
)
|
||||||||||
|
Transactions that do not represent cash flow
|
||||||||||||||||
| Reclassification from fair value with changes in equity to investments at amortized cost | ||||||||||||||||
|
Recognition of lease operations
|
|
(
|
)
|
(
|
)
|
|||||||||||
|
Sale option of minor shares of MiBanco Colombia
|
(
|
)
|
|
|
||||||||||||
F-16
CONSOLIDATED STATEMENT OF CASH FLOWS (continued)
Reconciliation of liabilities arising from financing activities:
|
Changes that generate
cash flows
|
Changes that do not generate cash
flows
|
|||||||||||||||||||||||
|
2022
|
As of January
1, 2022
|
Received
|
Paid
|
Exchange
difference
|
Others
|
As of December
31, 2022
|
||||||||||||||||||
| S/(000) |
S/(000) |
S/(000) |
S/(000) |
S/(000) |
S/(000) |
|||||||||||||||||||
|
Subordinated bonds
|
|
|
(
|
)
|
(
|
)
|
|
|
||||||||||||||||
|
Lease liabilities
|
|
|
(
|
)
|
(
|
)
|
|
|
||||||||||||||||
|
|
|
(
|
)
|
(
|
)
|
|
|
|||||||||||||||||
|
Changes that generate
cash flows
|
Changes that do not generate cash
flows
|
|||||||||||||||||||||||
|
2021
|
As of January
1, 2021
|
Received
|
Paid
|
Exchange
difference
|
Others
|
As of December
31, 2021
|
||||||||||||||||||
| S/(000) |
S/(000) |
S/(000) |
S/(000) |
S/(000) |
S/(000) |
|||||||||||||||||||
|
Subordinated bonds
|
|
|
(
|
)
|
|
|
|
|||||||||||||||||
|
Lease liabilities
|
|
|
(
|
)
|
|
|
|
|||||||||||||||||
|
|
|
(
|
)
|
|
|
|
||||||||||||||||||
|
Changes that generate
cash flows
|
Changes that do not generate cash
flows
|
|||||||||||||||||||||||
|
2020
|
As of January
1, 2020
|
Received
|
Paid
|
Exchange
difference
|
Others
|
As of December
31, 2020
|
||||||||||||||||||
| S/(000) | S/(000) | S/(000) | S/(000) | S/(000) | S/(000) | |||||||||||||||||||
|
Subordinated bonds
|
|
|
(
|
)
|
|
(
|
)
|
|
||||||||||||||||
|
Lease liabilities
|
|
|
(
|
)
|
|
(
|
)
|
|
||||||||||||||||
|
|
|
(
|
)
|
|
(
|
)
|
|
|||||||||||||||||
The accompanying notes are an integral part of these consolidated financial statements.
F-17
(Free translation from the original in Spanish)
CREDICORP LTD. AND SUBSIDIARIES
AS OF DECEMBER 31, 2022 AND 2021
| 1 |
OPERATIONS
|
Credicorp Ltd. (hereinafter “Credicorp”) is a limited liability company incorporated in Bermuda in 1995 to act as a holding company and according to
Bermuda’s economic substance regulation, Credicorp Ltd. as an independent legal entity, is considered a “Pure Equity Holding Entity” (PEHE). Credicorp’s activity is to maintain equity interests and receive passive income such as dividends, capital
gains and other income from investments in securities.
In order to keep Credicorp’s structure and organization fully aligned with the new legislation on economic substance approved by the Government of
Bermuda on January 11, 2019, as of October 29, 2020, the decisions of the Credicorp Board of Directors will be limited to issues related to Credicorp’s strategy, objectives and goals, main action plans and policies, risk control and management,
annual budgets, business plans and control of their implementation, supervision of the main expenses, investments, acquisitions and disposals, among other “passive” decisions related to Credicorp. The authority to make decisions applicable to
Credicorp’s subsidiaries, such as the adoption of relevant strategic or management decisions, the assumption of expenses for the benefit of its affiliates, the coordination of group activities, and the granting of credit facilities in favor of its
affiliates, it has been transferred to Grupo Crédito SA, a subsidiary of Credicorp.
Credicorp, through its banking and non-banking subsidiaries and its associate Entidad Prestadora de Salud, offers a wide range of financial, insurance
and health services and products, mainly throughout Peru and in other countries (see Note 3 (b)). Its main subsidiary is Banco de Crédito del Perú (hereinafter “BCP” or the “Bank”), a
multiple bank incorporated in Peru.
Credicorp’s legal address is Clarendon House 2 Church Street Hamilton, Bermuda; likewise, the main offices from where Credicorp’s businesses are
managed are located at Calle Centenario N ° 156, La Molina, Lima, Peru.
The consolidated financial statements presented comprise the financial statement of Credicorp and subsidiaries (hereinafter “the Group”). The consolidated financial statements as of December 31, 2021, and for the year then
ended were approved by the Board of Directors on February 24, 2022 and presented to the General Shareholders’ Meeting on March 29, 2022. The consolidated financial statements as of December 31, 2022, and for the year ended on that date were
approved and authorized for issuance by the Board of Directors and Management on February 23, 2023 and will be presented for final approval in the General Shareholders' Meeting, which will be held within the deadlines established by law. Management
considers that these consolidated financial statements will be approved without amendments.
Credicorp is listed on the Lima and New York Stock Exchanges.
F-18
| 2 |
SIGNIFICANT TRANSACTIONS
|
| a) |
Main acquisitions, incorporations and mergers -
|
In 2022, the Group has not carried out significant transaction of acquisitions, incorporations, or mergers of companies. In 2021, the Group has carried out the following
transactions under common control:
|
i)
|
Merger by absorption between ASB Bank Corp. and Atlantic Security Bank -
|
At the General Shareholders’ Meeting - Extraordinary Meeting held on November 27, 2020, the shareholders of ASB Bank Corp. approved the merger by absorption of Atlantic
Security Bank. This operation was authorized by the Superintendency of Banks of Panama through Resolution SBP-033-2021 held on April 9, 2021. Also, on August 2, 2021, ASB Bank Corp. (absorbing entity) acquired all the assets, liabilities, rights and
obligations of Atlantic Security Bank (absorbed entity).
This transaction has not generated a significant impact on the Group’s consolidated financial statements.
| ii) |
Merger by absorption between Ultralat Capital Markets, LLC and Credicorp Capital Securities, Inc. -
|
On February 28, 2020, the Board of Directors of Ultralat Group Inc., parent company and sole shareholder of Ultralat Capital Markets,
LLC and of Credicorp Capital Securities, Inc. approved the merger by absorption process between Ultralat Capital Markets, LLC and Credicorp Capital Securities, Inc. It also agreed that, at the date of the merger, the legal name of the new merged
entity will be “Credicorp Capital LLC.” This operation was authorized by the Financial Industry Regulatory Authority (FINRA) of the United States on December 4, 2020. Likewise, on February 1, 2021 Ultralat Capital Markets, LLC (absorbing entity)
acquired the assets, liabilities, rights and obligations of Credicorp Capital Securities, Inc. (absorbed entity).
This transaction has not generated a significant impact on the Group’s consolidated financial statements.
| b) |
Current situation -
|
As of December 2022, social protests have been taking place in several regions in response to political events that occurred in Peru. These protests have produced a
decrease in commercial activity in these regions and, therefore, the temporary restriction of liquidity in certain people and companies. In this sense, the Group has carried out during the month of January 2023, rescheduling of loans to its customers
within the framework of the measures implemented by the SBS for an amount of S/650,179 thousand.
In Management's opinion, this current situation has not affected group´s operations or generated any significant impact on the financial statements presented as of
December 31, 2022.
F-19
| 3 |
SIGNIFICANT ACCOUNTING POLICIES
|
The significant accounting policies applied in the preparation of Credicorp’s consolidated financial statements are set out below:
| a) |
Basis of presentation, use of estimates and changes in accounting policies -
|
The accompanying consolidated financial statements have been prepared in accordance with International Financial Reporting Standards (IFRS) as issued
by the International Accounting Standards Board (IASB).
The consolidated financial statements as of December 31, 2022 and 2021 have been prepared following the historical cost criteria, except for investments at fair value through profit or loss, investments at fair value
through other comprehensive income, financial assets designated at fair value through profit or loss, derivative financial instruments, and financial liabilities at fair value through profit or loss; which have been measured at fair value.
The consolidated financial statements are presented in Soles (S/), which is the functional currency of the Group, see paragraph (c) below, and values
are rounded to thousands of soles, unless otherwise stated.
The preparation of the consolidated financial statements in accordance with IFRS requires Management to make estimates and assumptions that affect the
reported amounts of assets, liabilities, revenues and expenses and the disclosure of significant events in notes to the consolidated financial statements.
Estimates and judgments are continually evaluated and are based on historical experience and other factors, including expectations of future events
that are believed to be reasonable under the current circumstances. The final results could differ from said estimates; however, the Management expects that the variations, if any, will not have a material impact on the consolidated financial
statements.
The most significant estimates included in the accompanying consolidated financial statements are related to the calculation of the allowance of the
expected credit loss on loan portfolio, the valuation of investments, the technical reserves for insurance claims and premiums, the impairment of goodwill , the expected credit loss for investments at fair value through other comprehensive income and
investments at amortized cost, the valuation of share-based payment plans and the valuation of derivative financial instruments.
Furthermore, there are other estimates, such as the estimated useful life of intangible assets, property, furniture and equipment and the deferred
income tax assets and liabilities. The accounting criteria used for said estimates are described below.
The Group has adopted the following standards and amendments for the first time for its annual period beginning on or after January 1, 2022, as
described below:
| (i) |
Amendments to IAS16 - Property, Plant and Equipment: Proceeds before Intended Use
|
In May 2020, the Board of International Accounting Standards Board issued the Property, Plant and Equipment rule: Proceeds before
Intended Use, which prohibits companies from deducting from the cost of an article of Property, Plant and Equipment any product of the sale of articles produced while said asset is transported to the location and the conditions are adequate for it
to operate in the manner foreseen by the administration. Instead, an entity must recognize the product of the sale of said articles and the costs of production of the same in the profit and loss statement. These amendments take effect on January 1,
2022 and must be applied retrospectively to articles of property, plant and equipment that are made available for use on or after the beginning with the first period that the entity applied the amendment for the first time.
F-20
This amendment had no impact on the consolidated financial statements.
|
(ii)
|
Amendments to IFRS 3 - Reference to the Conceptual Framework -
|
Minor amendments were made to IFRS 3 Business combinations to update references to the Conceptual
Framework for Financial Information and add an exception to recognize liabilities and contingent liabilities within the scope of IAS37 Provisions, Contingent Liabilities and the Interpretation IFRIC 21 Levies.
The amendments also confirm that active contingent assets should not be recognized on the date of
acquisition. The amendment will be effective for annual reporting periods on or after January 1, 2022.
This amendment had no impact on the consolidated financial statements.
|
(iii)
|
Onerous Contracts - Cost of Fullfilling a Contract - Amendments to IAS37 -
|
In May 2020, the Board of International Accounting Standards Board issued amendments to IAS 37 to specify
which cost an entity must include when assessing if a contract is onerous or generates losses. The amendment to IAS37 clarifies that the direct costs of complying with a contract include both the incremental costs of complying with the contract and
the assignment of other costs directly required to comply with the contracts. Prior to recognizing a separate provision for the onerous contract, the entity will recognize any loss for impairment that occurred relative to the assets used to comply
with the contract.
The amendment is effective for annual reporting periods beginning on or after January 1,
2022.
This amendment had no impact on the consolidated financial statements.
|
(iv)
|
Annual improvements to the IFRS 2018 - 2020 Cycle -
|
As part of its annual improvements 2018-2020 to the standard process of IFRS, in May 2020, the Board for International Accounting
Standards Board issued the following amendments:
|
-
|
IFRS 9 Financial Instruments - clarifies that commissions must be included in the 10.0 percent test for derecognition of financial liabilities.
|
|
-
|
IFRS 16 Leases - amendment to the illustrative example 13 to eliminate the example of lessor payment related to improvements in the object of leasing to eliminate any
confusion regarding the treatment of leasing incentives.
|
|
-
|
IFRS 1 First-time Adoption of International Financial Reporting Standards - allows entities that have measured their assets and liabilities at carrying amount on their
headquarters’ books to also measure any accumulative translation using the amounts reported by the parent company. This amendment will also apply to associates and joint ventures that have taken the same expectation to IFRS 1.
|
|
-
|
IAS41 Agriculture - elimination of the requirement that entities exclude cash flows of taxes when it measures the reasonable value according to IAS41. The objective of this
amendment is to align with the standard’s requirement to discount after-tax cash flows.
|
These amendments will be effective for annual reporting periods beginning on or after January 1, 2022 with early adoption.
These amendments had no impact on the consolidated financial statements.
F-21
In 2021, the Group adopted the following amendments:
|
(i)
|
Interest Rate Benchmark Reform - Phase 2 - Amendments to IFRS 9, IAS 39, IFRS 7, IFRS 4, and IFRS 16 -
|
In August 2020, the IASB made amendments to IFRS 9, IAS 39, IFRS 7, IFRS 4, and IFRS 16, to
address issues that may arise from the Interest Rate Benchmark Reform including the replacement of an interest rate with an alternative.
These amendments provide the following practical applications:
| - |
By changing the basis for determining the contractual cash flows for financial assets and liabilities (including lease liabilities), the practical application has the effect that
the changes, which are necessary as a consequence of the LIBOR reform and which are considered economically equivalent, will not result in an immediate gain or loss in results.
|
| - |
The practical application regarding hedge accounting will allow most of the hedging relationships (whether they come from IAS 39 or IFRS 9) that are directly affected by the LIBOR
reform to be able to be maintained. However, there may be some additional ineffectiveness that needs to be recognized.
|
As of December 31, 2022 and 2021, it has not any significant effect on the consolidated financial statements
In 2020, the accounting standards adopted by the Group have not had any significant effect on its consolidated financial statements.
| b) |
Basis of consolidation -
|
Investment in subsidiaries -
The consolidated financial statements comprise the financial statements of Credicorp and its Subsidiaries for all the years presented.
Under IFRS 10 “Consolidated Financial Statements”, all entities over which the Group has control are subsidiaries. Control is achieved when the
Group is exposed, or has rights, to variable returns from its involvement with the investee and has the ability to affect those returns through its power over the investee. The Group controls an investee if and only if the Group has:
| - |
Power over the investee (i.e., existing rights that give it the current ability to direct the relevant activities of the investee).
|
| - |
Exposure, or rights, to variable returns from its involvement with the investee, and
|
| - |
The ability to use its power over the investee to affect its returns.
|
There is a presumption that a majority of voting rights results in control. To support this presumption and when the Group has less than a majority
of the voting or similar rights of an investee, the Group considers all relevant facts and circumstances in assessing whether it has power over an investee, including:
| - |
The contractual arrangement with the other vote holders of the investee.
|
| - |
Rights arising from other contractual arrangements.
|
| - |
The Group’s voting rights and potential voting rights.
|
F-22
The Group assesses whether or not it controls an investee if the facts and circumstances indicate that there are changes in any of the elements of
control. Consolidation of a subsidiary begins when the Group obtains control over the subsidiary and ceases when the Group loses control of the subsidiary. The consolidated financial statements include assets, liabilities, income and expenses of
Credicorp and its subsidiaries.
Profit or loss for the period and each component of the other comprehensive income (OCI) are attributed to the equity holders of the parent of the
Group and to the non-controlling interest, even if this results in the non-controlling interest with a negative balance. When necessary, adjustments are made to the financial statements of subsidiaries to bring their accounting policies into line
with the Group’s accounting policies.
All intra-group assets and liabilities, equity, income, expenses and cash flows relating to transactions between members of the Group are eliminated
in full on consolidation.
Assets in custody or managed by the Group, such as investment funds and private pension funds (AFP funds) and others, are not part of the Group’s
consolidated financial statements, Note 3(ab).
Transactions with non-controlling interest -
A change in the ownership interest of a subsidiary, without a loss of control, is accounted for as an equity transaction and any resulting
difference between the price paid and the price for which non-controlling interests are adjusted is recognized directly in the consolidated statement of changes in net equity.
The Group does not record any additional goodwill after the purchase of the non-controlling interest, nor does it recognize a gain or loss from the
sale of the non-controlling interest.
Loss of control -
If the Group loses control over a subsidiary, it derecognizes the carrying amount of the related assets (including goodwill) and liabilities,
non-controlling interest and other components of equity, while any resultant gain or loss is recognized in profit or loss. Any residual investment retained is recognized at fair value.
Investments in associates -
An associate is an entity over which the Group has significant influence. Significant influence is the power to participate in the financial and
operating policy decisions of the entity, but without exercising control over said policies.
The Group’s investments in its associates are recognized initially at cost and are subsequently accounted for using the equity method. They are
included in “Other assets” in the consolidated statement of financial position; the returns resulting from the use of the equity method of accounting are included in “Net gain on securities” in the consolidated statement of income.
F-23
As of December 31, 2022 and 2021, Credicorp maintains direct interest in the following entities comprise the Group (the individual
or consolidated figures of their financial statements are presented in accordance with IFRS and before eliminations for consolidation purposes, except for the elimination of Credicorp’s treasury shares and its related dividends):
|
Entity
|
Activity and
country of incorporation
|
Percentage of
interest (direct
and indirect)
|
Assets
|
Liabilities
|
Equity
|
Net income (loss)
|
|||||||||||||||||||||||||||||||||||
|
2022
|
2021
|
2022
|
2021
|
2022
|
2021
|
2022
|
2021
|
2022
|
2021
|
||||||||||||||||||||||||||||||||
| % | % | S/(000) |
S/(000) |
S/(000) |
S/(000) |
S/(000) |
S/(000) |
S/(000) |
S/(000) |
||||||||||||||||||||||||||||||||
|
Grupo Crédito S.A. and Subsidiaries (i)
|
|
|
|
|
|
|
|
|
|
|
|
||||||||||||||||||||||||||||||
|
Pacífico Compañía de Seguros y Reaseguros S.A and Subsidiaries (ii)
|
|
|
|
|
|
|
|
|
|
|
(
|
)
|
|||||||||||||||||||||||||||||
|
Atlantic Security Holding Corporation and Subsidiaries (iii)
|
|
|
|
|
|
|
|
|
|
|
|
||||||||||||||||||||||||||||||
|
Credicorp Capital Ltd. and Subsidiaries (iv)
|
|
|
|
|
|
|
|
|
|
|
|
||||||||||||||||||||||||||||||
|
CCR Inc.(v)
|
|
|
|
|
|
|
|
|
|
(
|
)
|
(
|
)
|
||||||||||||||||||||||||||||
| (i) |
|
|
Entity
|
Activity and
country of
incorporation
|
Percentage of
interest (direct
and indirect)
|
Assets
|
Liabilities
|
Equity
|
Net income (loss)
|
|||||||||||||||||||||||||||||||||||
|
2022
|
2021
|
2022
|
2021
|
2022 |
2021
|
2022 |
2021
|
2022 |
2021
|
||||||||||||||||||||||||||||||||
|
%
|
%
|
S/(000)
|
|
S/(000)
|
|
S/(000)
|
|
S/(000)
|
|
S/(000)
|
|
S/(000)
|
|
S/(000)
|
S/(000)
|
|
|||||||||||||||||||||||||
|
Banco de Crédito del Perú and Subsidiaries (a)
|
|
|
|
|
|
|
|
|
|
|
|
||||||||||||||||||||||||||||||
|
Inversiones Credicorp Bolivia S.A. and Subsidiaries (b)
|
|
|
|
|
|
|
|
|
|
|
|
||||||||||||||||||||||||||||||
|
Prima AFP (c)
|
|
|
|
|
|
|
|
|
|
|
|
||||||||||||||||||||||||||||||
|
Tenpo SpA and Subsidiaries (d)
|
|
|
|
|
|
|
|
|
|
(
|
)
|
(
|
)
|
||||||||||||||||||||||||||||
| a) |
|
Its main Subsidiary is Mibanco, Banco de la Microempresa S.A. (hereinafter “MiBanco”), a banking entity in Peru oriented towards the micro and small
business sector. As of December 31, 2022, the assets, liabilities, equity and net result of Mibanco amount to approximately S/17,225.4
million, S/14,444.8 million, S/2,780.6
million and S/424.9 million, respectively (S/16,162.6
million, S/13,799.6 million, S/2,363.0
million, and S/266.3 million, respectively December 31, 2021).
|
b)
|
|
Its main Subsidiary is Banco de Crédito de Bolivia (hereinafter “BCB”), a commercial bank which operates in Bolivia. As of December 31, 2022, the
assets, liabilities, equity and net result of BCB were approximately S/12,697.8 million, S/11,838.0 million, S/859.8 million and S/68.0 million, respectively (S/13,799.8
million, S/ 12,964.8 million, S/835.0
million and S/72.3 million, respectively as of December 31, 2021).
F-24
| c) |
|
| d) |
|
| (ii) |
|
| (iii) |
|
| (iv) |
|
|
Entity
|
Percentage of interest (direct and indirect)
|
Assets
|
Liabilities
|
Equity
|
Net income (loss)
|
|||||||||||||||||||||||||||||||||||
|
2022
|
2021
|
2022
|
2021
|
2022
|
2021
|
2022
|
2021
|
2022
|
2021
|
|||||||||||||||||||||||||||||||
|
%
|
%
|
S/(000)
|
|
S/(000)
|
|
S/(000)
|
|
S/(000)
|
|
S/(000)
|
|
S/(000)
|
|
S/(000)
|
|
S/(000)
|
|
|||||||||||||||||||||||
|
Credicorp Holding Colombia S.A.S. and Subsidiaries (a)
|
|
|
|
|
|
|
|
|
|
|
|
|||||||||||||||||||||||||||||
|
Credicorp Capital Holding Chile and Subsidiaries (b)
|
|
|
|
|
|
|
|
|
|
|
(
|
)
|
||||||||||||||||||||||||||||
|
Credicorp Capital Holding Perú S.A. and Subsidiaries (c)
|
|
|
|
|
|
|
|
|
|
|
||||||||||||||||||||||||||||||
| a) |
|
Its main subsidiaries are Credicorp Capital Colombia S.A, which was acquired in Colombia in 2012 and merged with Ultraserfinco S.A. In June
2020. This subsidiary is focused on the activities of commission agents and securities brokers. Likewise, Mibanco – Banco de la Microempresa de Colombia S.A (hereinafter Mibanco Colombia before Banco Compartir S.A.) was acquired in 2019 and merged with Edyficar S.A.S. in October 2020. This subsidiary is focused on granting
loans to the micro and small business sector. As of December 31, 2022, and 2021, the direct and indirect interest held by Credicorp and the assets, liabilities, equity and net income were:
|
Entity
|
Percentage of interest (direct and indirect)
|
Assets
|
Liabilities
|
Equity
|
Net income (loss)
|
|||||||||||||||||||||||||||||||||||
|
2022
|
2021
|
2022
|
2021
|
2022
|
2021
|
2022
|
2021
|
2022
|
2021
|
|||||||||||||||||||||||||||||||
|
%
|
%
|
S/(000)
|
S/(000)
|
S/(000)
|
S/(000)
|
S/(000)
|
S/(000)
|
S/(000)
|
S/(000)
|
|||||||||||||||||||||||||||||||
|
Credicorp Capital Colombia S.A.
|
|
|
|
|
|
|
|
|
|
|
||||||||||||||||||||||||||||||
|
MiBanco – Banco de la Microempresa de Colombia S.A.
|
|
|
|
|
|
|
|
|
|
|
|
|
||||||||||||||||||||||||||||
| b) |
|
| c) |
|
| (v) |
|
F-25
(i)
| c) |
Functional, presentation and foreign currency transactions -
|
| (i) |
Functional and presentation currency -
|
Credicorp and its Subsidiaries which operate in Peru consider the sol as their functional and presentation currency since it reflects the nature of
the economic events and relevant circumstances for most of the Group´s entities, given the fact their major transactions and/operations, such as: loans granted, financing obtained, sale of insurance premiums, interests and similar income, interest
and similar expenses, as well as a significant percentage of their purchases; they are agreed and settled in soles.
| (ii) |
Transactions and balances in foreign currency -
|
Foreign currency transactions are those carried out in currencies other than the functional currency. These transactions are initially recorded by
Group entities at the exchange rates of their functional currencies at the transaction dates. Monetary assets and liabilities denominated in foreign currency are adjusted at the exchange rate of the functional currency prevailing at the date of the
consolidated statement of financial position.
The differences arising from the exchange rate prevailing at the date of each consolidated statement of financial position presented and the
exchange rate initially used in recording transactions are recognized in the consolidated statement of income in the year in which they occur, in “Net gain from exchange differences”, except for those that comprise monetary items that are part of a
hedging strategy for a net investment abroad, said accumulated difference is recognized in the item “Exchange differences on translation of foreign operations” in the consolidated statement of comprehensive income. Non-monetary assets and
liabilities acquired in foreign currency are recorded at the exchange rate prevailing at the initial transaction date and are not subsequently adjusted.
| (iii) |
Group entities with functional currency other than the presentation currency -
|
Given that the Group’s entities in Colombia, Chile, Cayman Islands, Panama and Bolivia, Mexico, United States of America, Spain and Mexico have a
functional currency different from Sol, the balances were translated into Soles for consolidation purposes in accordance with IAS 21, “The Effects of Changes in Foreign Exchange Rates” as follows:
| - |
Assets and liabilities, at the closing exchange rate prevailing at the date of each consolidated statement of financial position.
|
| - |
Income and expense, at the average exchange rate for each month of the year.
|
All resulting exchange differences were recognized within “Exchange differences on translation of foreign operations”, including the differences in
financial instruments designated as accounting hedges of said investments, in the consolidated statement of comprehensive income.
| d) |
Recognition of income and expenses from banking activities -
|
Effective interest rate method:
Interest income is recorded using the effective interest rate (EIR) method for all financial instruments measured at amortized cost and at fair
value through other comprehensive income. Interest expenses corresponding to liabilities measured at amortized cost are also recorded using the EIR.
F-26
The EIR is the rate that exactly discounts future cash flows that are estimated to be paid or received during the life of the instrument or a
shorter period, if appropriate, to the gross carrying amount of the financial asset or financial liability. The EIR (and, therefore, the amortized cost of the financial asset or liability) is calculated considering any discount, premium and
transaction costs that are an integral part of the effective interest rate of the financial instrument, but the expected credit loss are not included.
Interest income and expenses:
The Group calculates interest income by applying the EIR to the gross carrying amount of those financial assets that are not impaired.
When a financial asset becomes impaired and, therefore, is considered in Stage 3 (as set out in Note 3(i) impairment of financial assets), the
Group calculates interest income by applying the interest rate effective at the carrying amount of the asset, net of its provision for credit loss. If the evidence that the criteria for the recognition of the financial asset in Stage 3 are no
longer met, the Group recalculates interest income in gross terms.
Interest income and expenses accrued from all financial instruments that generate interest, including those related to financial instruments
carried at fair value through profit or loss, are recorded under the heading “Interest and similar income” and “Interest and similar expenses” in the consolidated statement of income.
Dividends:
Dividends are recorded as income when they are declared.
Commissions and fees:
Commission income (which is not an integral part of the EIR) and fees are recorded as they accrue. Commissions and fees include, among others,
the commission charged for the banking service in general such as account maintenance, shipping, transfers, loan syndication fees and contingent credit fees.
Other income and expenses:
All other income and expenses are recorded in the period in which the performance obligation is satisfied.
| e) |
Insurance activities -
|
Product classification:
Insurance contracts are those contracts in which the Group (the insurer) has accepted a significant insurance risk from the counterparty (the
policyholder) by agreeing to compensate the policyholder if an uncertain future event (the insured event) occurs. This definition also includes reinsurance contracts that the Group holds.
Once a contract has been classified as an insurance contract, it remains an insurance contract for the remainder of its lifetime, even if the
insurance risk reduces significantly during this year, unless all rights and obligations expire.
Life insurance contracts offered by the Group include retirement, disability and survival insurance, annuities and individual life which includes
Investment Link insurance contracts. The non-life insurance contracts issued by the Group mainly include automobile, fire and allied lines, technical branches and healthcare.
F-27
Reinsurance:
The Group cedes insurance risk in the normal course of its operations for most of its businesses. Reinsurance assets represent balances due from
reinsurance companies. Reinsurance ceded is placed on both a proportional and non-proportional basis.
Amounts recoverable from reinsurers are estimated in a consistent manner with the outstanding claims reserve or settled claims and ceded
premiums, associated with the ceded policies and in accordance with the related reinsurance contracts.
Reinsurance assets are reviewed for impairment at each reporting date of the consolidated statement of financial position or more frequently when
an indication of impairment arises during the reporting year. Impairment occurs when there is objective evidence as a result of an event that occurred after initial recognition of the reinsurance asset that the Group may not receive all outstanding
amounts due under the terms of the contract and the event has a reliably measurable impact on the amounts that the Group will receive from the reinsurer. The impairment loss is recorded in the consolidated statement of income.
Ceded reinsurance arrangements do not relieve the Group from its obligations to policyholders.
The Group also assumes reinsurance risk in the normal course of business for non-life insurance contracts when applicable. Premiums and claims on
assumed reinsurance are recognized as revenue or expenses in the same manner as they would be if the reinsurance were considered direct business, taking into account the classification of the reinsured insurance contract.
Reinsurance liabilities represent balances due to reinsurance companies. Amounts payable are estimated in a manner consistent with the related
reinsurance contract.
Premiums and claims are presented as gross amounts for reinsurance ceded. Reinsurance assets or liabilities are written off when contractual
rights are terminated or expire or when the contract is transferred to a third party.
Reinsurance contracts that do not transfer significant insurance risk are not material to the insurance segment.
Insurance receivables:
Insurance receivables are recognized when they are enforceable and measured on initial recognition at the fair value of the consideration
received or receivable. Subsequent to initial recognition, insurance receivables are measured at amortized cost.
As of December 31, 2022 and 2021 the carrying amount of the insurance receivables is similar to their fair value due to their short term. The
carrying amount of insurance receivables is reviewed for impairment whenever events or circumstances indicate that the carrying amount may not be recoverable. The impairment loss is recorded in the consolidated statement of income. Insurance
receivables are derecognized when the de-recognition criteria for financial assets, as described in Note 3(g), have been met.
“Investment Link” assets:
“Investment Link” assets represent financial instruments held for purposes of funding a group of life insurance contracts and for which
investment gains and losses are allocated directly to the policyholders who bear the investment and reinvestment risk. Each account has specific characteristics, and the assets are carried at fair value. The balances of each account are legally
segregated and are not subject to claims that arise out of any other business of the Group. The liabilities linked to these contracts are equal in amount to the assets that support them, net of the commissions that the Group charges for the
management of these contracts.
F-28
Deferred acquisition costs (DAC):
It comprises the direct costs that originate with and are related to traditional life and Investment Link insurance contracts, which are
deferred; all other acquisition costs are recognized as an expense when incurred. The direct acquisition costs comprise primarily agent commissions corresponding to the underwriting and policy issuance costs.
Subsequent to initial recognition, these costs are amortized on a straight-line basis based on the average expiration period of the related
insurance contracts. Amortization is recorded in the consolidated statement of income.
DAC for general insurance and health products are amortized over the period in which the related revenues are earned.
DAC are derecognized when the related contracts are either settled or disposed of.
An impairment review is performed at the date of the consolidated statement of financial position or more frequently when an indication of
impairment arises. When the recoverable amounts are less than the carrying amount an impairment loss is recognized in the consolidated statement of income. DAC is also considered in the liability adequacy test for each reporting period.
Reinsurance commissions:
Commissions on reinsurance contracts for ceded premiums are amortized on a straight-line basis over the term of the coverage of the related
insurance contract.
Insurance contract liabilities:
| (i) |
Life insurance contract liabilities -
|
Life insurance liabilities are recognized when the term of the contract begins.
The technical reserves maintained by the Group include the reserves of all of the business lines, comprising both the mathematical reserves and
those of ongoing risk, as well as the reserves for outstanding claims, settled claims, claim settlement costs, claims incurred but not reported, as applicable to each line.
Due to the nature of the business, the mathematical reserves of the pension lines represent the main part of the Group’s reserves, with the line of
Life Annuities as the major source of reserves due to the important volume of premiums and as a result of having only single premiums. To determine the reserves of this business, the discounted present value of the expected future pensions,
calculated on the basis of mortality tables and interest rates. Those are based on the asset portfolio which supports the liabilities. Additionally, the constituted reserves include the amount required to cover the maintenance expenses related to
the administration of the payment of future pensions.
The mathematical reserves of the income lines are determined by the sum of the value discounted from future expected pensions to be paid during a
defined period or not defined, calculated on the basis of the current mortality and morbidity tables, and the market discount interest rates of the investment portfolio. During 2018, the Group adopted the new mortality tables approved and published
by the SBS through Resolution SBS No.886-2018. These tables reflect recent changes in the life expectancy.
The Group also uses discount rates in the measurement of income to reflect the market value in the measurement of insurance liabilities. As of December 31, 2022 and 2021, the Group uses the market rate for harvests of the portfolio of its financial assets for
pension flows shifted by currency (market rates).
F-29
As of December 31, 2022 and 2021, the adjustments to the liabilities at each reporting date of the consolidated statement of financial position are
recorded in the consolidated statement of income (due to the effects of the variations in the mortality tables) and in the consolidated statement of comprehensive income (due to the effect of the market rate), both effects are included in the
consolidated statement of comprehensive income as of December 31, 2022 and 2021. The liability is derecognized when the contract expires, is discharged or is cancelled.
On the other hand, in the Individual Life business, the Group offers some products which are only risk related and others of risk and savings, the
latter being those which comprise the highest percentage of reserves of the line. Risk and savings products can be differentiated between those with a guaranteed interest rate and others without guaranteed interest, the reserve for the first group
being equal to the balance of the policy accounts plus the unaccredited surplus interest, and for the second group it is equal to the balance of the policy accounts. These accounts are established with the premiums collected, tax deductions,
expenses and costs of insurance and the accreditation of interest based on the yield of the portfolio which supports said reserves.
Life insurance claims reserves include reserves for reported claims and estimates of incurred claims that havenot been reported (IBNR) to the Group.
As of December 31, 2022 reserves for claims occurred and not reported were determined on the basis of the Chain Ladder methodology (a generally accepted actuarial method), whereby the weighted average of past claim development is projected into the
future; this projection is based on the ratios of occurrence of accumulated past claims. Due to the COVID-19 pandemic, as of December 31, 2021 and 2020, IBNR reserves were calculated in two parts:
a) IBNR reserve for regular claims and
b) IBNR reserve for expected excess mortality (deaths above the average number of cases in the pre-pandemic months).
For part a) the IBNR reserves are determined based on the Chain Ladder methodology, maintaining the expected loss ratio of the periods prior to the
pandemic and for part b) the IBNR reserves are determined based on the estimate of deaths in addition to the average (excess mortality) of each portfolio and subtracting additional claims to the average already reported to the Group. The excess
mortality of each portfolio is calculated taking into account the excess mortality experienced in the country by geographic location and age ranges and the representation of the portfolio of policyholders in those same segments. It should be noted
that, due to periods of social confinement and stoppage of certain activities, the claim report during 2022 and 2021 has shown greater delays than in previous years, which translates into an increase in IBNR and an increase in claims, likewise, it
is reflected in the increase in the reserve for pending claims. In general, claim reserves have been estimated with prudential criteria due to the uncertainty in the loss ratio caused by the pandemic.
At each reporting date, an evaluation is carried out as to whether the life insurance liabilities are adequate, net of the related DAC, by means of
a liability adequacy test as established by IFRS 4. As of December 31, 2022 and 2021, the Group’s Management concluded that the liabilities are sufficient and, therefore, they have not recognized any additional liability for life insurance
contracts.
F-30
| (ii) |
Non-life insurance contract liabilities (which comprise general and healthcare insurance) -
|
Non-life insurance contract liabilities are recognized when contracts are entered into.
Claims reserves are based on the last estimated cost of all claims incurred but not settled at the date of the consolidated statement of financial
position, whether reported or not, together with related claim handling costs and the expected reduction in value of salvage and other recoveries. Delays can be experienced in the notification and settlement of certain types of claims, therefore
their ultimate cost cannot be known with certainty at the date of the consolidated statement of financial position.
Claims occurred but not reported are estimated and included in the provision (liabilities). The reserves for claims that have not been reported are
determined based on the Chain Ladder methodology (a generally accepted actuarial method) that considers the statistical analysis of the experience in reporting claims of the Group, the expected costs of the claims to be reported and when
appropriate, adjustments in the last estimated periods based on the frequency and/or severity of the cases to better reflect the current conditions.
During 2022 and 2021, the Group incorporated in the estimate of the reserve for incurred and unreported claims (IBNR) of the general insurance
businesses, adjustments in the expected frequency of claims during the months of confinement, stoppage of transport and activities in the country, as well as the decrease in the insured portfolio that was later recovering its usual level.
In the case of Medical Assistance (AMED), the IBNR estimate included the estimate of regular claims and also the IBNR estimate for COVID claims,
which had a different frequency and cost than regular claims.
No provision is recognized for stabilization or catastrophic reserves. The liability is written off when the contract expires, is eliminated or
canceled.
Technical reserves for non-life insurance contracts comprise the provision for unearned premiums which represents premiums received for risks that
have not yet expired. Generally, the reserve is liberated during the term of the contract and is recognized as premium income.
At each reporting date, the Group reviews the risk from outstanding claims and an existing liability adequacy test as laid out under IFRS 4, to
determine whether there is any overall excess of expected claims over unearned premiums. If these estimates show that the carrying amount of the unearned premiums is inadequate, the deficiency is recognized in the consolidated statement of income
by setting up a provision for liability adequacy. As of December 31, 2022 and 2021, Management determined that the liabilities were adequate; therefore, it has not recorded any additional liabilities for non-life insurance contracts.
Income recognition:
| (i) |
Gross premiums -
|
Life insurance contracts -
Gross premiums on life contracts are recognized as revenue when due from the policyholder. For single premium business, revenue is recognized on the
date on which the policy is effective.
F-31
Non-life insurance contracts -
Gross non-life insurance direct and assumed premiums comprise the total premiums written and are recognized on the date of issue of the policy as a
receivable. At the same time, a reserve is recorded for unearned premiums which represent premiums for risks that have not yet expired. Unearned premiums are recognized as income over the contract period which is also the coverage and risk period.
| (ii) |
Fees and commission income -
|
Investment Link insurance contract policyholders remunerate the Group for policy administration services, investment management services, surrenders
and other contract fees. These fees are recognized as revenue in the consolidated statement of income in the period in which the services are provided.
Recognition of benefits, claims and expenses:
| (i) |
Benefits and claims -
|
The benefits and claims for life insurance contracts include the cost of all claims arising during the year including internal and external claim
handling costs that are directly related to the processing and settlement of claims. Claims for death and disability claims are recorded based on notifications received. Pension payments are recognized when they accrue.
General and health insurance claims include all claims occurring during the year, whether reported or not, internal and external claim handling
costs that are directly related to the processing and settlement of claims, a reduction for the value of salvage and other recoveries, and any adjustment to claims outstanding from previous years.
| (ii) |
Ceded premiums -
|
Comprise the total premiums payable for the coverage of the insurance contracts and are recognized on the date the insurance contract enters in
policy commences. Unearned ceded premiums are deferred over the term of the underlying insurance contract.
| (iii) |
Reinsurance claims -
|
Reinsurance claims are recognized when the related gross insurance claim is recognized according to the terms of the relevant contract.
| f) |
Financial instruments: Initial recognition and subsequent measurement -
|
A financial instrument is any agreement that originates a financial asset of one entity and a financial liability or equity instrument of another
entity.
The Group determined the classification of its financial instruments at the date of initial recognition.
All financial instruments are initially recognized at fair value plus the incremental costs related to the transaction that are directly
attributable to the purchase or issue of the instrument, except in the case of financial assets or liabilities carried at fair value through profit or loss.
The purchases or sales of financial assets that require the delivery of the assets within a term established according to market regulations or
conventions (regular market terms) are recognized on the negotiation date, in other words, the date in which the Group commits to purchase or sell the asset.
F-32
As of December 31, 2022 and 2021, the Group classified the financial assets in one of the categories defined by IFRS 9: financial assets at fair
value through profit or loss, at fair value though other comprehensive income and at amortized cost, based on:
| - |
The business model for managing the financial assets and
|
| - |
The characteristics of the contractual cash flows of the financial asset.
|
Business model -
Represents how the financial assets are managed to generate
cash flows and it does not depend on the Management’s intention with regard to an individual instrument. Financial assets can be managed for the purpose of i) obtaining contractual cash flows; ii) obtaining contractual cash flows and sale; or
iii) others. In order to evaluate the business models, the Group considers:
|
|
-
|
The risks that affect the performance of the business model, and in particular, the way in which these risks are managed.
|
|
|
-
|
How the performance of the business model and the financial assets, held within this business model, are evaluated and informed to the key personnel of the
Administration of the Group.
|
If the cash flows after initial recognition are carried out in a manner other than what is expected by the Group, the classification of the
remaining financial assets maintained in this business model is not modified.
When the financial asset is maintained in the business models i) and ii), it requires the application of the “Solely Payments of Principal and
Interest” test - “SPPI”.
SPPI Test (Solely Payments of Principal and Interest) -
This test consists in the evaluation of the cash flows generated by a financial instrument in order to verify if the contractual terms of the
financial asset give rise on specified dates to cash flows that are solely payments of principal and interest. To adapt to this concept, the cash flows must solely include the consideration of the time value of money and the credit risk. If the
contractual terms introduce risk exposure or cash flow volatility, such as the exposure to changes in the prices of capital instruments or the prices of raw materials, the financial asset is classified at fair value through profit or loss. Hybrid
contracts must be evaluated as a whole, including all the integrated characteristics. The accounting of a hybrid contract that contains an embedded derivative is carried out jointly, in other words, the entire instrument is measured at fair value
through profit or loss.
| (i) |
Financial assets at amortized cost -
|
A financial asset is classified at amortized cost if the following conditions are met:
| - |
It is held within a business model whose objective of which is to maintain the financial asset to obtain the contractual cash flows, and
|
| - |
The contractual conditions give rise, on specified dates, to cash flows that are solely payments of the principal and interest.
|
After their initial recognition, the financial assets of this category are valued at amortized cost, using the effective interest rate method, minus
any credit loss provision. The amortized cost is calculated considering any discount or premium incurred in the acquisition and professional fees that constitute an integral part of the effective interest rate. Interests income is included in the
item “Interest and similar income” of the consolidated income statement.
Financial assets at amortized cost include direct loans that are recorded when the disbursement of the funds in favor of the customers is carried
out, and indirect (contingent) loans that are recorded when the documents that support said loan facilities are issued.
F-33
Furthermore, the Group considers as refinanced or restructured those credits that, due to difficulties in payment on the part of the debtor, change their payment schedule.
The impairment loss is calculated using the expected loss approach and recognized in the consolidated income statement in the item “Net gain on
securities” for investments and in the item “Provision for credit losses on loan portfolio” for loans.
The balance of the financial assets, measured at amortized cost, is presented net of the provision for credit losses in the consolidated statement
of financial position.
| (ii) |
Financial assets at fair value through other comprehensive income -
|
The financial assets that the Group maintains in this category are : a) investments in debt instruments, and b) investments in equity instruments,
not for trading, irrevocably designated at initial recognition.
Investments in debt instruments -
A financial asset is classified and measured at fair value through other comprehensive income when the following conditions are followed:
| - |
The financial asset is maintained within a business model whose objective is achieved by both collecting contractual cash flows and selling financial assets, and
|
| - |
The contractual conditions give rise, on specified dates, to cash flows that are solely payments of principal and interest.
|
After their initial recognition, investments in debt instruments are measured at fair value, recording the unrealized gains and losses in the
consolidated statement of comprehensive income, net of their corresponding income tax and non-controlling interest, until the investment is sold; upon which the accumulated profit or loss is recognized in the item “Net gain on securities” in the
consolidated statement of income.
Interest is recognized in the consolidated statement of income in the item “Interest and similar income” and it is reported as interest income using
the effective interest rate method.
When a debt instrument is designated in a fair value hedging
relationship, any change in the fair value due to changes in the hedged risk is recognized in the item “Interest and similar income” of the consolidated statement of income.
Gains or losses from exchange differences related to the amortized cost of the debt instrument are recognized in the consolidated statement of
income, and those related to the difference between the amortized cost and the fair value are recognized as part of the unrealized gain or loss in the consolidated statement of comprehensive income.
The estimated fair value of the investments in debt instruments is mainly determined based on quotations or, in their absence, based on the
discounted cash flows using market rates in accordance with the credit quality and the maturity term of the investment.
The impairment loss of investments in debt instruments is calculated using the expected loss approach and is recognized in the consolidated
statement of comprehensive income, charged to the item “Net gain on securities” in the consolidated statement of income, in this sense, it does not reduce the carrying amount of the financial asset in the consolidated statement of financial
position, which is maintained at fair value. The impairment loss recognized in the consolidated statement of comprehensive income is reclassified to the consolidated statement of income when the debt instrument is derecognized.
F-34
Investments in equity instruments, not for trading, designated upon initial recognition (equity instruments designated at the initial recognition) -
At initial recognition, the Group can make an irrevocable choice to present the equity instruments, which are not for trading, but for strategic
purposes, in the item “At fair value through other comprehensive income”.
After initial recognition, the equity investments are measured at fair value, recording the unrealized gains and losses in the consolidated
statement of comprehensive income, net of their corresponding income tax and non-controlling interest, until the investment is sold, whereupon the accumulated gain or loss is transferred to the item “Retained earnings” in the consolidated statement
of changes in equity; in other words, they are not subsequently reclassified to the consolidated statement of income.
As a result, the equity instruments classified in this category do not require a loss impairment evaluation.
Dividends are recognized when the collection right has been established and they are recorded in the item “Interest and similar income” in the
consolidated statement of income.
| (iii) |
Financial assets at fair value through profit or loss -
|
Financial assets must be classified and measured at fair value through profit or loss, unless they are classified and measured at “Amortized cost”
or “At fair value through other comprehensive income”.
The financial assets that the Group maintains in this category are: a) Investments in debt instruments, b) investments in equity instruments for
trading purposes, c) financial assets designated at fair value through profit or loss from their initial recognition, and d) derivative financial instruments for trading purposes.
Debt instruments -
Said instruments are classified in this category since: a) they are maintained for trading purposes, or b) their cash flows are not solely payments
of principal and interest.
After their initial recognition they are measured at fair value, recording the changes in “Net gain on securities” in the consolidated statement of
income. Interests accrued are calculated using the contractual interest rate and recorded in the “Interest and similar income” item in the consolidated statement of income.
Equity instruments -
Equity instruments are classified and measured at fair value through profit or loss, unless an irrevocable choice is made, at the time of initial
recognition, to designate them at fair value through other comprehensive income.
After their initial recognition, they are measured at fair value, recording the changes in the item “Net gains on securities” in the consolidated
statement of income. The profit from dividends is recorded in the item “Interest and similar income” in the consolidated statement of income when the right to payment has been recognized.
F-35
Financial assets designated at fair value through profit or loss from initial recognition -
Upon initial recognition, Management can irrevocably designate financial assets as measured at fair value through profit or loss, if doing so
eliminates or significantly reduces an incongruence of measurement or recognition that would otherwise arise from the measurement of the assets or liabilities or from the recognition of the profit and losses thereof on different bases.
After initial recognition they are measured at fair value, recording the changes in the consolidated statement of income.
As of December 31, 2022 and 2021 the Group classified the financial liabilities upon initial recognition as measured at amortized cost, except in
the case of the financial liabilities at fair value through profit or loss. These liabilities include the derivatives measured at fair value.
The interest incurred is accrued in the item “Interest and similar expense” in the consolidated statement of income.
Furthermore, upon initial recognition, Management can irrevocably designate financial liabilities as measured at fair value through profit or loss
when one of the following criteria is complied with:
| - |
An incongruence in the measurement is eliminated or significantly reduced, which would otherwise arise from using different criteria to measure assets or liabilities; or
|
| - |
They are part of a group of financial liabilities, which are managed and their yield is evaluated based on fair value, according to a documented investment strategy or risk
management; or
|
| - |
The financial liability contains one or more embedded derivatives that otherwise significantly modify the required cash flows.
|
| (iv) |
Reclassification of financial assets and liabilities -
|
The reclassification of financial assets will take place as long as the business model that manages the financial assets is changed. This change is
expected to be very rare. These changes are determined by approval of the Group's management as a result of external or internal changes, which must be significant for the Group's operations and demonstrable to third parties. Financial liabilities
are never reclassified.
When the Group changes its business model for the management of financial assets, it will reclassify all affected financial assets prospectively
from the reclassification date. The Group will not restate previously recognized gains, losses or interest (including gains or losses due to impairment of value).
If the Group reclassifies:
| - |
A financial asset from the amortized cost measurement category to fair value through profit or loss: its fair value will be measured on the reclassification date. Any gain or loss
that arises from differences between the previous amortized cost of the financial asset and its fair value will be recognized in the result of the period.
|
| - |
A financial asset from the measurement category of fair value through profit or loss to that of amortized cost: its fair value on the reclassification date becomes its new
carrying amount.
|
F-36
| - |
A financial asset from the amortized cost measurement category to fair value through other comprehensive income: its fair value will be measured on the reclassification date.
Any gain or loss arising from differences between the prior amortized cost of the financial asset and its fair value will be recognized in other comprehensive income. The effective interest rate and the measurement of expected credit
losses will not be adjusted as a result of the reclassification.
|
| - |
A financial asset from the measurement category of fair value through other comprehensive income to that of amortized cost, the financial asset will be reclassified at its fair
value on the reclassification date. However, accumulated gains or losses previously recognized in other comprehensive income will be eliminated from equity and adjusted against the fair value of the financial asset on the
reclassification date. As a result, the financial asset will be measured at the reclassification date as if it had always been measured at amortized cost. This adjustment affects other comprehensive income but not profit for the period.
|
| - |
A financial asset from the measurement category of fair value through profit or loss to fair value through other comprehensive income, the financial asset continues to be
measured at fair value.
|
| - |
A financial asset from the measurement category of fair value through other comprehensive income to that of fair value through profit or loss, the financial asset continues to be
measured at fair value.
|
The cumulative gain or loss previously recognized in other comprehensive income will be reclassified from equity to profit or loss for the period.
| g) |
De-recognition of financial assets and liabilities -
|
Financial assets:
A financial asset (or, where applicable, a part of a financial asset or a part of a group of similar financial assets) is derecognized when: (i) the
rights to receive cash flows from the asset have expired; or (ii) the Group has transferred its rights to receive cash flows from the asset or has assumed an obligation to pay the received cash flows in full without material delay to a third party
under a “pass-through” arrangement; and either the Group has transferred substantially all the risks and rewards of the asset, or the Group has neither transferred nor retained substantially all the risks and rewards of the asset, but has
transferred control of the asset.
When the Group has transferred its right to receive cash flows from an asset or has entered into a pass-through arrangement, it evaluates if and to
what extent it has retained the risks and rewards of ownership. When it has neither transferred nor retained substantially all of the risks and rewards of the asset, nor transferred control of the asset, the Group continues to recognize the
transferred asset to the extent of the Group’s continuing involvement.
In that case, the Group also recognizes the associated liability. The transferred asset and the associated liability are measured on a basis that
reflects the rights and obligations that the Group has retained.
Continuing involvement that takes the form of a guarantee over the transferred asset is measured at the lower of (i) the original carrying amount of
the asset, and (ii) the maximum amount of consideration that the Group could be required to repay.
F-37
Financial liabilities:
A financial liability is derecognized when the obligation under the liability is discharged, cancelled or expires. When an existing financial
liability is replaced by another from the same lender on substantially different terms (it does not pass the 10% test established in IFRS 9), or the terms of an existing liability are substantially modified, such exchange or modification is treated
as a withdrawal of the original liability and the recognition of a new liability; the difference between the carrying amount of the original financial liability and the consideration paid is recognized in the consolidated statement of income.
| h) |
Offsetting financial instruments -
|
Financial assets and liabilities are offset, and the net amount is reported in the consolidated statement of financial position when there is a
legally enforceable right to offset the recognized amounts and Management has the intention to settle on a net basis, or realize the asset and settle the liability simultaneously.
| i) |
Impairment of financial assets -
|
As of December 31, 2022 and 2021 the Group applies a three-stage approach to measure the provision for credit loss, using an impairment model based
on the expected credit losses as established in IFRS 9, for the following categories:
| - |
Financial assets at amortized cost.
|
| - |
Debt instruments classified as investments at fair value through other comprehensive income, and
|
| - |
Indirect loans that are presented in risk accounts and contingent commitments.
|
The financial assets classified or designated at fair value through profit of loss and the equity instruments designated at fair value through other
comprehensive income, are not subject to impairment evaluation.
Financial assets migrate through three stages according to the change in the credit risk from the initial recognition.
Impairment model of expected credit losses -
The calculations of credit losses are products of models with a series of underlying assumptions with regard to the choice of the variable inputs
and their interdependencies. The impairment model for expected credit loss reflects the present value of all the cash deficit events related to the events of default, whether (i) during the following twelve months or (ii) during the expected
useful life of a financial instrument depending on the impairment of the credit from the beginning. The expected credit loss reflects an unbiased result weighted by probability that considers a range of multiple outcomes based on reasonable and
supportable forecasts.
The provisions for credit losses will be measured on each reporting date following a three-stage model of expected credit losses based on the degree
of credit impairment from its origin:
| - |
Stage 1: Financial assets whose credit risk has not increased significantly since its initial recognition. A reserve will be recognized for losses equivalent to the credit losses
expected to occur from defaults in the following 12 months. For those instruments with a maturity less than 12 months, a probability of default corresponding to the remaining term until maturity is used.
|
| - |
Stage 2: Financial assets that have presented a significant increase in credit risk compared with initial recognition, but are not considered impaired, a reserve will be recognized
for losses equivalent to the credit losses expected to occur during the remaining life of the asset.
|
F-38
| - |
Stage 3: Financial assets with evidence of impairment on the reporting date, a reserve will be recognized for losses equivalent to the expected credit losses during the entire life
of the asset. The interest income will be recognized based on the carrying amount of the asset, net of the loss reserve.
|
Measurement of the expected loss -
The measurement of the expected credit loss is mainly based on the product of probability of default (PD), loss given default (LGD), and exposure at
default (EAD), discounted at the reporting date and considering the expected macroeconomic effects and all in accordance with the new regulation.
The details of these statistical parameters are the following:
|
-
|
PD: is an estimate of the probability of default in a determined time horizon. A default can only occur at a determined moment during the remaining estimated
life, if the provision has not been previously derecognized and it is still in the loan portfolio.
|
| - |
LGD: is an estimate of the loss produced in the case a predetermined value is produced at a given time. It is based on the difference between the contractual cash flows owed and
those that the lender would expect to receive, even after the liquidation of any guarantee. Generally, it is expressed as a percentage of the EAD.
|
| - |
EAD: is an estimate of the exposure on a future default date, which considers the changes expected in the exposure after the reporting date, including the reimbursements of
principal and interest, whether programmed by contract or otherwise, and the interest accrued due to default payments.
|
The fundamental difference between the credit loss considered as Stage 1 and Stage 2 is the PD horizon. The estimates of Stage 1 use a 12-month
horizon, while those situated in Stage 2 use an expected loss calculated with the remaining term of the asset and consider the effect of the significant increase in credit risk. Finally, Stage 3 will estimate the expected loss based on the best
estimate (“ELBE”), according to the situation of the collection process of each asset.
Changes from one stage to another –
The classification of an instrument as stage 1 or stage 2 depends on the concept of “significant increase in credit risk” on the reporting date
compared with the origination date; in this sense, the definition used considers the following criteria:
| - |
An account is classified in stage 2 if it has more than 30 days in arrears.
|
| - |
Thresholds for a significant increase in risk have been established based on absolute and relative thresholds that depend on the level of risk at which the instrument originated.
The thresholds differ for each of the portfolios considered.
|
| - |
The follow-up systems, alerts and monitoring of risk portfolios are integrated, as established by the current risk policy in Wholesale and Retail Banking.
|
Additionally, all the accounts that are classified as default on the reporting date are considered as stage 3. Assesments of significant increase in
risk since initial recognition and of credit impairment is performed independently at each reporting date. Assets can move in both directions, from one stage to another. See more detail in Note 34.1(c).
F-39
Prospective information -
The measurement of expected credit losses for each phase and the evaluation of significant increases in credit risk should consider information on
past events and current conditions, as well as projections of future events and economic conditions. For the estimation of the risk parameters (PD, LGD, EAD), used in the calculation of the provision in phases 1 and 2, the significance of the
macroeconomic variables (or their variations) that have the greatest influence on each portfolio was tested, which give a better prospective and systemic vision to the estimation, based on econometric techniques. These projections have a period of
3 years and, additionally, a long-term projection.
The estimate of the expected loss is a weighted estimate that considers three future macroeconomic scenarios. The base, optimistic and pessimistic
scenarios are based on macroeconomic projections provided by the internal economic studies team and approved by Senior Management; these projections are made for the main countries where Credicorp operates. This same team also provides the
probability of occurrence of each scenario. It should be noted that the design of the scenarios is reviewed quarterly and may be more frequent if the environmental conditions so require.
Macroeconomic factors -
In its models, the Group bases itself on a wide variety of prospective information such as economic inputs, including: the growth of the gross
domestic product (GDP), unemployment rates, the base rates of the central bank, among others. It is possible that the inputs and models used to calculate the expected credit losses do not always capture all the market characteristics on the date of
the financial statements. To reflect this, qualitative adjustments, or overlays such as temporary adjustments can be carried out using the opinion of experts.
Expected life -
For the instruments in Stage 2 or 3, the reserves for losses will cover the lifetime expected credit losses of the instrument. For the majority of
instruments, the expected life is limited to the remaining term of the product, adjusted by expected advance payments. In the case of revolving products, an analysis was carried out in order to determine the expected life period.
Presentation of provision for credit losses in the consolidated statement of financial position -
| - |
Financial assets measured at amortized cost: as a deduction from the gross carrying amount of the financial assets.
|
| - |
Debt instruments measured at fair value through other comprehensive income: it does not recognize any provision in the statement of financial position because the carrying amount
of these assets is their fair value; however, the expected credit loss is presented in other comprehensive income.
|
| - |
Indirect loans: the credit loss provision is presented in the item “Other liabilities” of the statement of financial position.
|
| j) |
Leases -
|
As of December 31, 2022 and 2021 the Group mainly maintains mainly leased premises, used as offices and agencies, and servers and technological
platforms, which were registered in accordance with the provisions of IFRS 16 “Leases”. This standard considers that a contract is, or contains, a lease if the contract transfers the right to control the use of an identified asset for a period of
time in exchange for a consideration.
F-40
Initial Recognition -
Leases are recorded in the consolidated statement of financial position as a right-of-use asset and a lease liability on the date the leased asset
is available for use.
The right-of-use assets are initially recognized at cost including the following:
| - |
The amount of the initial measurement of the lease liability.
|
| - |
Any lease payment paid to the lessor before the start date or on the same date.
|
| - |
Direct costs incurred and costs for dismantling or rehabilitation, if any.
|
Lease liabilities include the present value of fixed payments and variable lease payments that are based on an index or rate. Lease payments that
will be made under renewal options with reasonable certainty of being exercised are included in the measurement of the liability.
Lease payments are discounted using the interest rate implicit in the lease, if that rate could be determined easily, or the incremental interest
rate by loans of the lessee, which is the interest rate that the lessee would have to pay for borrowing for a term similar, the funds necessary to obtain an asset of similar value asset by the right-of-use in a similar economic environment with
similar terms, guarantees and conditions.
In determining the term of the lease, Management considers all the facts and circumstances that create an economic incentive to exercise the
extension option, or not to exercise a termination option. Likewise, the estimation of the extension or termination options will be revalued only if an event or changes in the circumstances occur within the control of the entity that affects said
estimate.
Subsequent recognition -
The right-of-use asset is generally depreciated in a straight-line basis during the shortest period of the asset’s useful life and the lease term.
If the Group is reasonably certain of exercising a purchase option, the right-of-use asset depreciates over the useful life of the underlying asset.
The Group has chosen to measure the asset at cost less depreciation and accumulated impairment loss and adjusting any new measurement of the lease
liability. Depreciation is calculated in a straight-line basis within the term of the lease.
The liability will be recorded at its amortized cost, that is, it will be increased to reflect the accrued interest, recognized in the item
“Interest, returns and similar expenses” in the consolidated statement of income, and the fees paid will be subtracted.
Likewise, the balance of the liability will be reviewed in the following cases:
| - |
When there is a change in the expected amount to be paid under a residual value guarantee.
|
| - |
When there is a change in future lease installments to reflect the variation in an index or interest rate.
|
| - |
When there is a change in the terms of the lease.
|
| - |
When there is a change in the evaluation of an option to purchase the underlying asset.
|
The changes will be recorded as an adjustment of the lease liability and the right of use, unless the book value of the right of use has been
reduced to zero, in which case it must be recorded against the consolidated statement of income.
Short-term leases with little significant value are recognized in a straight-line basis as an expense in the “Administrative expenses” in the
consolidated statement of income.
F-41
The accounting treatment of lessors continues with a similar model to that of IAS 17; In that sense, lessors continue to perform a classification
test to distinguish between financial and operating leases.
| k) |
Property, furniture and equipment -
|
Property, furniture and equipment are recorded at historical acquisition cost less accumulated depreciation and impairment losses, if applicable.
Historical acquisition costs include expenditures that are directly attributable to the acquired property, furniture or equipment. Maintenance and repair costs are charged to the consolidated statement of income; significant renewals and
improvements are capitalized when it is probable that future economic benefits, more than the originally assessed standard of performance, will flow from the use of the acquired property, furniture or equipment.
Land is not depreciated. Depreciation is calculated using the straight-line method over the estimated useful lives, which are as follows:
| Years | ||||
|
Buildings and other construction
|
|
|||
|
Facilities
|
|
|||
|
Furniture and fixtures
|
|
|||
|
Vehicles and equipment
|
|
|||
|
Computer hardware
|
|
|||
An item of property, furniture and equipment and any significant part initially recognized is derecognized upon disposal or when no future economic
benefits are expected from its use or disposal. Any gain or loss arising on de-recognition of the asset (calculated as the difference between the net disposal proceeds and the carrying amount of the asset) is included in the consolidated statement
of income.
Assets’ residual value and the selected useful life are periodically reviewed to ensure that they are consistent with current economic benefits and
life expectancy.
| l) |
Investment properties -
|
Investment properties are held for rentals, capital gains, or both rather than for: (a) use in the production or supply or goods or services or for
administrative purposes; or (b) sale in the ordinary course of business. Property that is being constructed or developed for future use as investment property is recognized at cost before completion.
Investment properties are initially measured at fair value, which is the purchase transaction price, unless otherwise indicated. Transaction costs
are included in the initial measurement, which includes the purchase price and any other cost directly attributable to the transaction.
For subsequent recognition, an entity shall choose as its accounting policy either the fair value model or the cost model and shall apply that
policy to all its investment property. At the date of the consolidated financial statements, the Group has opted for keeping the cost model. Accordingly, investment properties are accounted for at their acquisition cost less accumulated
depreciation and the accumulated impairment losses, if any.
An entity can opt for recognizing and depreciating separately the components of an investment property or as a single unit for recording and
depreciation purposes. The Group recognizes as a single unit each of its investment properties and has estimated a useful life of 33 years
for purposes of determining depreciation under the straight-line method.
Rental income is recognized as rents that are accrued under the related rental agreement; depreciation expenses as well as related expenses directly
with the maintenance of the leased assets, they are recorded net in the item of “Other Income” in the consolidated statement of income.
F-42
| m) |
Seized assets, net -
|
Seized assets are recorded at the lower of cost or estimated market value, which is obtained from valuations made by independent appraisers.
Reductions in book values are recorded in the consolidated statement of income.
| n) |
Business combination -
|
Business combinations made are accounted for using the acquisition method in accordance with IFRS 3 “Business Combination”, regardless of whether
they are equity instruments or other acquired assets.
The acquisition cost is the sum of the consideration paid for the acquisition measured at fair value at the acquisition date and the amount of the
share in the non-controlling interest acquired. For each business combination the Group decides whether to measure the non-controlling interest in the acquiree at fair value or at the proportional share in the identifiable net assets of the
acquired. Acquisition-related costs are recognized as expenses and are included within “Administrative expenses” in the consolidated statement of income.
When the Group acquires a business, it assesses the financial assets and liabilities assumed for its own classification and denomination according
to the contractual terms, economic circumstances and prevailing conditions at the date of acquisition. This includes the separation of embedded derivative contracts signed by the acquiree.
Any contingency transferred by the acquirer is recognized at fair value at the acquisition date. The contingency classified as an asset or liability
that is a financial instrument and is within the scope of IFRS 9 “Financial instruments”, is measured at fair value with changes recognized in the consolidated statement of income or consolidated statement of comprehensive income. If the
contingency is not within the scope of IFRS 9, it is measured in accordance with the applicable IFRS. A contingency that is classified as equity should not be measured again and its subsequent settlement is accounted for within equity.
The acquisition of a non-controlling interest is recorded directly in net equity, any difference between the amount paid and the acquired net assets
is recorded as an equity transaction. Accordingly, the Group recognizes no additional goodwill after the acquisition of the non-controlling interest, nor does it recognize any profit or loss from the disposal of the non-controlling interest.
If there is a contractual obligation to acquire the shares of the non-controlling interest through a put option, the Group will initially recognize
a liability at fair value through profit or loss equivalent to the market value of the interest of the non-controlling interest against the account "Reserves and others” in equity. After its initial recognition, the liability is measured at fair
value, recording the changes in the income statement until the option is exercised. If the option expires without being exercised, the liability is derecognized by adjusting the net equity.
Equity attributable to the non-controlling interest is shown separately in the consolidated statement of financial position. Profit attributable to
the non-controlling interest is shown separately in the consolidated statement of income and consolidated statement of comprehensive income.
If a business combination achieved in stages, the acquisition date and the value of the previous participation of the acquirer is measured again at
a fair value at the date of acquisition. The gains or losses arising from such remedy are recognized in profit or loss. Likewise, in accordance with IFRS 3, from the date of acquisition of a company that isn't under common control, the acquirer has
a subsequent 12-month period to be able to adjust the initial recognition of goodwill. During 2022 the Group has not carried out business combinations of acquired entities.
Combinations of entities under common control -
F-43
A business combination between entities or businesses under common control is outside the scope of IFRS 3, because it comprises a business
combination in which all the entities or businesses that are combined are controlled, ultimately, by the same part or parts, before and after the business combination. In these transactions, the Group recognizes the assets acquired under the
interest unification method, whereby the assets and liabilities of the combined companies are reflected at their book values and no goodwill is recognized as a result of the combination.
The consolidated financial statements of the Group have been presented considering the aforementioned. See Note 2(a).
| o) |
Intangible assets -
|
Comprise internally developed and acquired software licenses used by the Group. Acquired software licenses are measured upon initial recognition at
cost and are amortized using the straight-line method over their estimated useful life (between 3 and 5 years ).
Intangible assets identified as a consequence of the acquisition of subsidiaries are recognized in the consolidated statement of financial position
at their fair values determined on the acquisition date and are amortized using the straight-line method over their estimated useful life as follows:
|
Estimated useful
life in years
|
||||
|
Customer relationship - Prima AFP (AFP Unión Vida)
|
|
|||
|
Customer relationship - Credicorp Capital Holding Chile (Inversiones IMT)
|
|
|||
|
Customer relationship - Edyficar Peru
|
|
|||
|
Customer relationship - Mibanco
|
|
|||
|
Customer relationship - Ultraserfinco
|
|
|||
|
Brand - Mibanco
|
|
|||
|
Brand - Culqi
|
|
|||
|
Fund manager contract - Credicorp Capital Colombia
|
|
|||
|
Fund manager contract - Credicorp Capital Holding Chile (Inversiones IMT)
|
|
|||
|
Fund manager contract - Ultraserfinco
|
|
|||
|
Core deposits - Mibanco
|
|
|||
|
Others
|
Between
|
|||
The period and the amortization method, for intangible assets are reviewed at the end of each period. If the expected useful life differs from
previous estimates, the amortization period will be changed accordingly. If there has been a change in the expected pattern of conduct of the future economic benefits embodied in the asset, the amortization method shall be amended to reflect these
changes.
Gains or losses arising from de-recognition of an intangible asset are measured as the difference between the net disposal proceeds and the carrying
amount of the asset and are recognized in the consolidated statement of income when the asset is derecognized.
F-44
| p) |
Goodwill -
|
Goodwill
is the excess of the aggregate of the consideration transferred and the fair value recognized for the acquisition of the net value of the identifiable net assets acquired and liabilities assumed. If the fair value of the net assets acquired
exceeds the aggregate consideration transferred, then the gain is recognized in the consolidated statement of income.
After initial recognition, goodwill is measured at cost less any accumulated impairment losses. For the purpose of impairment testing, goodwill
acquired in a business combination is, from the acquisition date, allocated to each of the Group’s cash-generating units (CGU) that are expected to benefit from the combination, irrespective of whether other assets or liabilities of the acquiree
are assigned to these units.
If goodwill has been allocated to a CGU and part of the operation within that unit is disposed of, the goodwill and the disposed assets are included
in the carrying amount of the operation when determining the gain or loss on disposal. Goodwill disposed of in these circumstances is measured based on the relative values of the disposed operation and the portion of the cash-generating unit
retained.
Impairment is determined for goodwill by assessing the recoverable amount of each CGU (or group of CGUs) to which the goodwill relates. Where the
recoverable amount of the CGU is less than it’s carrying amount, an impairment loss is recognized. Impairment losses relating to goodwill cannot be reversed in future periods.
| q) |
Impairment of non-financial assets -
|
The Group assesses at each reporting date, whether there is an indicator that an asset may be impaired. If any indication exists, or when annual
impairment testing for an asset is required, the Group estimates the asset’s recoverable amount. An asset’s recoverable amount is the higher of the value of the asset or the CGU less costs to sell and its value in use and is determined for each
individual asset, unless the asset does not generate cash inflows that are largely independent of those from other assets or groups of assets.
When the carrying amount of an asset or CGU exceeds its recoverable amount, the asset is considered impaired and is written down to its recoverable
amount. In assessing value in use, the estimated future cash flows are discounted to their present value using a pre-tax discount rate that reflects current market assessments of the time value of money and the risks specific to the asset. In
determining fair value less costs to sell, recent market transactions are considered, if any. If this kind of transactions cannot be identified, an appropriate valuation model is used. These calculations are verified against valuation multiples,
quoted share prices for publicly traded subsidiaries or other available fair value indicators.
For non-financial assets, excluding goodwill, an assessment is made at each reporting date of whether there is an indication that previously
recognized impairment losses may no longer exist or may have decreased. If such indication exists, the Group estimates the recoverable amount. A previously recognized impairment loss is reversed only if there has been a change in the estimates used
to determine the asset’s recoverable amount since the last impairment loss was recognized.
The reversal is limited so that the carrying amount of the asset does not exceed its recoverable amount, nor exceed the carrying amount that would
have been determined, net of depreciation, had no impairment loss been recognized for the asset in prior years. Such reversal is recognized in the consolidated statement of income.
F-45
| r) |
Due from customers on banker’s acceptances -
|
Due from customers on banker’s comprises accounts payable from customers for import and export transactions, whose obligations have been accepted by
the Group. The obligations that must be assumed by the Group for such transactions are recorded as liabilities.
|
s)
|
Financial guarantees -
|
In the ordinary course of business, the Group issues financial guarantees, such as letters of credit, guarantees and banker’s acceptances. Financial
guarantees are initially recognized at fair value, which is equivalent to the commission initially received, also, letters of credit and guarantees are recorded in the item “Other liabilities” in the consolidated statement of financial position and
banker’s acceptances are presented in the consolidated statement of financial position. Subsequent to initial recognition, the Group’s liability under each guarantee is measured at the higher of the amount initially recognized less, when
appropriate, cumulative amortization recognized in the consolidated statement of income, and the best estimate of expenditure required to settle any financial obligation arising as a result of the financial guarantee.
Any increase in the liability relating to a financial guarantee is included in the consolidated statement of income. The commission received is
recognized in “Commissions and fees” in the consolidated statement of income on a straight-line basis over the life of the granted financial guarantee.
| t) |
Provisions -
|
Provisions are recognized when the Group has a present obligation (legal or implicit) as a result of a past event, and it is probable that resources
embodying economic benefits will be required to settle said obligation and the amount can be reliable determined.
The expense relating to any provision is presented in the consolidated statement of income net of any reimbursement. If the effect of the time value
of money is material, provisions are discounted using a current pre-tax rate that reflects, where appropriate, the specific risks of the liability. When discounting is used, the increase in the provision due to the passage of time is recognized as
a finance cost.
| u) |
Contingencies -
|
Contingent liabilities are not recognized in the consolidated financial statements. They are disclosed in the notes, unless the probability of an
outflow of resources is remote. Contingent assets are not recorded in the financial statements; they are disclosed if it is probable that an inflow of economic benefits will be realized.
| v) |
Income tax -
|
Income tax is computed based on the individual financial statements of each of the Group’s members.
Deferred income tax reflects the effects of temporary differences between the carrying amounts of assets and liabilities for accounting purposes and
the amounts determined for tax purposes. Deferred assets and liabilities are measured using the tax rates expected to be applied to taxable income in the years in which temporary differences are expected to be recovered or eliminated. The
measurement of deferred assets and deferred liabilities reflects the tax consequences that arise from the manner in which Credicorp and its Subsidiaries expect, at the date of the consolidated statement of financial position, to recover or settle
the carrying amount of its assets and liabilities.
F-46
The carrying amount of deferred tax assets and liabilities may change, even though there is no change in the amount of the related temporary
differences, due to a change in the income tax rate. In this case, the resulting change in deferred tax, corresponding to the change in rate, will be recognized in profit or loss, except to the extent that it relates to items previously recognized
outside of the consolidated income statement (either in other comprehensive income or directly in equity).
Deferred tax assets and liabilities are recognized regardless of when the timing differences are likely to reverse. Deferred tax assets are
recognized when it is likely to exist sufficient tax benefits for the application of temporary difference. At the date of the consolidated statement of financial position, Credicorp and its Subsidiaries assess unrecognized deferred assets and the
carrying amount of recognized deferred assets.
Credicorp and its Subsidiaries determine their deferred income tax based on the tax rate applicable to their undistributed earnings; any additional
tax on dividend distribution is recorded on the date a liability is recognized.
Deferred tax assets and liabilities are offset if there is a legal right of offset, and the deferred taxes are related to the same taxpaying entity
and the same tax authority.
| w) |
Earnings per share -
|
Basic earnings per share is calculated by dividing the net profit for the year attributable to Credicorp’s equity holders by the weighted average number of ordinary
shares outstanding during the year, excluding the average number of ordinary shares purchased and held as treasury stock.
Diluted earnings per share is calculated by dividing the net profit attributable to Credicorp’s equity holders by the weighted average number of
ordinary shares outstanding during the year, excluding the average number of ordinary shares purchased and held as treasury stock, plus the weighted average number of ordinary shares that would have been issued if all potential ordinary shares with
dilutive effect have been converted into ordinary shares.
| x) |
Share-based payment transactions -
|
The cost of the Group’s remuneration plan is recognized, together with a corresponding increase in equity, over the period in which the service
conditions are fulfilled, ending on the date on which the relevant employees become fully entitled to the award (‘the vesting date”).
The cumulative expense recognized for equity-settled liquidations at each reporting date until the vesting date reflects the extent to which the
vesting period has expired and the Group’s best estimate of the number of equity instruments that will ultimately vest. The expense is recorded in “Salaries and employee benefits” in the consolidated statement of income.
When the terms of a share-based liquidation are modified, the minimum expense recognized is maintained as if the terms had not been modified. An
additional expense is recognized for any modification which increases the total fair value of the share-based payment arrangement, or which is otherwise beneficial to the employee as measured at the date of modification.
The dilutive effect of the shares granted under this plan is reflected as a share dilution in the computation of diluted earnings per share, see
paragraph (w) above.
| y) |
Derivative financial instruments and hedge accounting -
|
Trading -
The Group negotiates derivative financial instruments in order to meet its customers needs. The Group may also take positions with the expectation
of profiting from favorable movements in prices, rates or indexes.
F-47
Part of the transactions with derivatives, which provide effective economic hedges under the Group’s risk management positions, do not qualify for
hedge accounting under the specific rules of IFRS 9 and are, therefore, treated as trading derivatives.
Derivative financial instruments are initially recognized at fair value in the consolidated statement of financial position and subsequently are
remeasured at fair value. Fair values are estimated based on the market exchange and interest rates. All derivatives are carried as assets when fair value is positive and as liabilities when fair value is negative. Gain and losses for changes in
their fair value are recorded in the consolidated statement of income.
Hedging -
The Group uses derivative instruments to manage exposures to interest rate and foreign currency. To manage particular risks, the Group applies hedge
accounting for transactions which meet the specified criteria.
In accordance with IFRS 9, to qualify as hedging operations, all the following conditions must be met:
| - |
The hedging relationship consists only of hedging instruments and eligible hedged items.
|
| - |
At the inception of the hedging relationship, there is a designation and formal documentation of the hedging relationship and the entity's risk management objective and strategy
for undertaking the hedging. That documentation will include identification of the hedging instrument, the hedged item, the nature of the risk being hedged, and how the entity will assess whether the hedging relationship meets the hedge
effectiveness requirements.
|
| - |
The hedge relationship meets all the following hedge effectiveness requirements:
|
| - |
There is an economic relationship between the hedged item and the hedging instrument.
|
| - |
The effect of credit risk does not predominate over the changes in value that come from that economic relationship.
|
| - |
The coverage ratio of the hedging relationship is the same as that derived from the amount of the hedged item that the entity actually hedges and the amount of the hedging
instrument that the entity actually uses to hedge that amount of the hedged item.
|
The accounting treatment is established based on the nature of the hedged item and compliance with hedging criteria.
| i) |
Cash flow hedges -
|
The effective portion of the accumulated gain or loss on the hedging instrument is recognized directly as part of other comprehensive income in
“Cash flow hedge reserve” in the consolidated statement of changes in equity, and it is reclassified to the consolidated statement of income in the same period or periods in which the covered operation affects results; that is, when income or
financial expenses related with coverage are registered, or when a forecasted transaction occurs.
The part of the gain or loss in derivatives that represents the ineffective portion is recognized immediately in the consolidated statement of
income.
Amounts originally recognized in other comprehensive income and subsequently reclassified to the consolidated statement of income are registered as
expenses or income in the cases in which the hedged item is reported.
F-48
If the forecasted transaction or firm commitment is no longer expected to occur, the accumulated gain or loss previously recognized in the cash flow
hedge reserve is transferred to the consolidated statement of income. If the hedging instrument expires or is sold, terminated or exercised without replacement or rollover, or if its designation as a hedge is revoked, any unrealized accumulated
gain or loss previously in the cash flow hedge reserve remains in said reserve until the planned transaction or firm commitment affects profit or loss. At the same time, the derivative is recorded as a trading derivative.
| ii) |
Fair value hedges -
|
The change in the fair value of a fair value hedge and the change in the fair value of the hedged item attributable to the risk hedged are recorded
as a part of the carrying amount of the hedged item and recognized in the consolidated statement of income.
For fair value hedges relating to items carried at amortized cost, any adjustment to the carrying amount of these items, as a result of
discontinuation of the hedge, will be amortized through the consolidated statement of income over the remaining life of the hedge. Amortization may begin as soon as an adjustment exists and no later than when the hedged item ceases to be adjusted
for changes in its fair value attributable to the risk being hedged.
If the hedged item is derecognized, the unamortized fair amount is recognized immediately in the consolidated statement of income.
The hedge relationship is terminated when the hedging instrument expires or is sold, terminated or exercised, or when the hedge no longer meets the
criteria for hedge accounting, the hedge relationship is terminated. For fair value hedges related to items recorded at amortized cost, the difference between the carrying value of the hedged item on termination and the face value is amortized over
the remaining term of the original hedge using the effective interest rate. If the hedged item is derecognized, the unamortized fair value adjustment is recognized immediately in the consolidated statement of income. At the same time, the
derivative is recorded as a trading derivative.
| iii) |
Hedges of net investments in foreign businesses -
|
Hedges of net investments in foreign operations are recognized for in a similar manner to cash flow hedges.
Any gain or loss on the hedging instrument related to the effective portion of the hedge is recognized in other comprehensive income and accumulated
in the item “Exchange differences on translation of foreign operations” in the consolidated statement of changes in net equity. The gain or loss related to the ineffective portion is recognized immediately in the consolidated statement of income
under “Other income” or “Other expenses”.
Accumulated gains and losses in the consolidated statement of changes in net equity are reclassified to the consolidated statement of income when
the net investment abroad is disposed or sold partially.
| iv) |
Embedded derivatives -
|
Derivatives embedded in host contracts are accounted for as separate derivatives and recorded at fair value if their economic characteristics and
risks are not closely related to those of the host contract and said host contract is not held for trading or designated at fair value through profit or loss.
F-49
| z) |
Fair value measurement -
|
Fair value is the price that would be received to sell an asset or paid to transfer a liability in an orderly transaction between market
participants at the measurement date. The fair value measurement is based on the presumption that the transaction to sell the asset or transfer the liability takes place either:
| - |
In the principal market for the asset or liability, or
|
| - |
In the absence of a principal market, in the most advantageous market for the asset or liability.
|
The principal or the most advantageous market must be accessible by the Group. Also, the fair value of a liability reflects its non-performance
risk.
When available, the Group measures the fair value of an instrument using the quoted price in an active market for that instrument. A market is
regarded as active if transactions for the asset or liability take place with sufficient frequency and volume to provide pricing information on an ongoing basis.
If there is no quoted price in an active market, then the Group uses valuation techniques that maximize the use of relevant observable inputs and
minimize the use of unobservable inputs.
The chosen valuation technique incorporates all of the factors that market participants would take into account in pricing a transaction.
All assets and liabilities for which fair value is measured or disclosed in the consolidated financial statements are categorized within the fair
value hierarchy, described as follows, based on the lowest level of input used that is significant to the fair value measurement as a whole:
|
- Level 1:
|
Quoted (unadjusted) market prices in active markets for identical assets or liabilities.
|
|
- Level 2:
|
Valuation techniques for which the lowest level input that is significant to the fair value measurement is directly or indirectly observable.
|
|
- Level 3:
|
Valuation techniques for which the lowest level input that is significant to the fair value measurement is unobservable. |
For assets and liabilities that are recognized at fair value
in the consolidated financial statements on a recurring basis, the Group determines whether transfers have occurred between levels in the hierarchy by re-assessing categorization at the end of each reporting period.
For the purpose of fair value disclosures, the Group has determined classes of assets and liabilities on the basis of the nature, characteristics
and risks of the asset or liability and the level of the fair value hierarchy as explained above.
Also, fair value of financial instruments measured at amortized cost is disclosed in Note 34.8(b).
| aa) |
Segment reporting -
|
The Group reports financial and descriptive information about its reportable segments. Reportable segments are operating segments or aggregations of
operating segments that meet specified criteria.
F-50
Operating segments are a component of an entity for which separate financial information is available that is evaluated regularly by the entity’s
Chief Operating Decision Maker (“CODM”) in making decisions about how to allocate resources and in assessing performance. The Group reported, financial information is required to be reported on the same basis as it is used internally for evaluating
operating segments’ performance and deciding how to allocate resources to segments, Note 31.
| ab) |
Fiduciary activities, fund management of funds and pension funds -
|
The Group provides custody, trustee, investment management and advisory services to third parties that result in the holding of assets on their
behalf. These assets and income arising thereon are excluded from these consolidated financial statements, as they are not assets of the Group, Note 34.9.
Commissions generated for these activities are included as “Commissions and fees” in the consolidated statement of income.
| ac) |
Cash and cash equivalents -
|
For the purpose of the consolidated statement of cash flows, cash and cash equivalents comprise balances of cash and non-restricted balances with
central banks, overnight deposits, interbank funds, time deposits with maturities of three months or less from the date of acquisition, excluding restricted cash, see Note 4(a).
Cash collateral pledged as a part of a repurchase agreement is presented in “Cash collateral, reverse repurchase agreement and securities
borrowings” in the consolidated statement of financial position, see Note 5(a).
Cash collateral pledged in the negotiation of derivative financial instrument and others are presented in “Other assets” in the consolidated
statement of financial position, See Note 13.
| ad) |
Repurchase and reverse repurchase agreements and securities lending and borrowing –
|
Securities sold under repurchase agreements at
a specified future date are not derecognized from the consolidated statement of financial position as the Group retains substantially all of the risks and rewards of ownership. The cash received is recorded as an asset in “Cash and due from
banks” and the corresponding obligation to return it is recognized too, including accrued interest, as a liability in “Payables from repurchase agreements and securities lending”, reflecting the transaction’s economic substance as a loan to the
Group. The difference between the sale and repurchase price was treated as interest expense and accrued over the life of the agreement using the effective interest rate and was recognized in “Interest and similar expenses” in the consolidated
statement of income.
As part of this transaction the Group grants assets as
collateral. When the counterparty receives securities and has the right to sell or re-pledge, the Group reclassifies those securities in “Investments at fair value through other comprehensive income pledged as collateral” or “Amortized cost
investments pledged as collateral”, as appropriate, in the consolidated statement of financial position. When the counterparty receives cash as collateral that will be restricted until the maturity of the contract, the Group reclassifies the cash
in “Cash collateral, reverse repurchase agreements and securities borrowings” in the consolidated statement of financial position, which includes accrued interest that is calculated according to the effective interest rate method. Likewise, when
the counterparty receives a loan portfolio, the Group maintains these loans in "Loan portfolio, net" in the statement of financial position, whose control is kept in off-balance sheet accounts.
F-51
On the other hand, securities purchased under reverse
repurchase agreements on a specified future date are not recognized in the consolidated statement of financial position. Cash granted is recorded as an outgoing asset in “Cash and due from banks” account and the corresponding right to charge it,
including accrued interest, is recorded in “Cash collateral, reverse repurchase agreements and securities borrowing”, reflecting the transaction’s economic substance as a loan granted by the Group. The difference between the purchase and resale
price is recorded in “Interest and similar income” in the consolidated statement of income and is accrued over the life of the agreement using the effective interest rate method.
If securities purchased under reverse repurchase agreement are
subsequently sold to third parties, the obligation to return the securities is recorded as a short sale in the consolidated statement of financial position as “Financial liabilities at fair value through profit or loss” and measured at fair value,
with any gains or losses included in the consolidated statement of income as “Net gain on securities”.
Loans and borrowing transactions are usually
collateralized by securities. The transfer of the securities to counterparties is only reflected in the consolidated statement of financial position if the risks and rewards of ownership are also transferred.
| ae) |
International Financial Reporting Standards issued but not yet effective -
|
The Group decided not to early adopt the following standards and interpretations that were issued but are not effective as of December 31, 2022:
| (i) |
IFRS 17 “Insurance Contracts” -
|
IFRS 17 was issued in May 2017 as a replacement for IFRS 4 "Insurance Contracts". This standard requires a current measurement model where
estimates are remeasured in each reporting period. Contracts are measured using the components of:
| - |
Discounted probability weighted cash flows.
|
| - |
An explicit risk adjustment, and.
|
| - |
A contractual service margin that represents the unearned technical utility of the contract which is recognized as revenue during the coverage period.
|
IFRS 17 applies to all types of insurance contracts (life insurance, non-life insurance and reinsurance), regardless of the type of entities
that issue them, as well as certain guarantees and financial instruments with certain characteristics of discretionary participation. The general objective of IFRS 17 is to provide an accounting model that is more useful and uniform for
insurance entities. Unlike IFRS 4, which relies heavily on the application of existing local accounting policies, IFRS 17 provides a comprehensive model for insurance contracts, covering all relevant accounting aspects.
IFRS 17 will imply fundamental changes in the recognition, measurement, presentation and disclosure of information in insurance and reinsurance
contracts, as well as in their related processes. Insurance contracts combine financial and service characteristics, and in many cases, generate long-term variable cash flows. To adequately reflect these characteristics, IFRS 17 combines the
measurement of future cash flows with the recording of the results of the insurance contract, during the period in which the service is provided, and requires the separate presentation of the financial results of the results of the provision of
the service, allowing the Companies, through the election of an accounting policy option, to recognize such financial results in the income statement or in other comprehensive income.
Under strict governance and participation of the units involved in the processes involved, the Group has made adjustments to its processes,
architecture, controls and corporate governance in order to implement the standard, as well as have the necessary financial and management reports.
F-52
In this process, the Group made the decision to use the computer platform of the provider specialized in insurance business worldwide, Fidelity
National Information Services - FIS, and has been supported by renowned international consultants. The implementation includes extensive tests carried out and related to the validation of insurance contracts under IFRS 17 in order to ensure the
accuracy and completeness of the information to be recorded in the Financial Statements.
The adoption of IFRS 17 will have the following impacts depending on the type of risk in which the Group operates:
Equity Risks:
The Group expects a reduction in insurance liabilities as a result of the projection of the claims reserve and its subsequent discount, and a
low impact is estimated given the current interest rate environment, as well as the nature of this risk insofar as to the duration of the reservation.
Life Risks:
Regarding the Life businesses, the Group considers that there will be an increase in insurance liabilities due to the effect of interest rates
and also, mainly, due to the establishment of an explicit future profit margin known as the contractual service margin.
The Group decided to recognize market changes in interest rates in equity. The choice reflects how the Group accounts for its financial assets
under IFRS 9.
IFRS 17 is effective from the financial statements beginning on January 1, 2023, and the effects of applying it for the first time will be
recognized in our consolidated statement of financial position on January 1, 2023, date of initial application, restating the financial information of the comparative period.
Based on current estimates, the adoption of IFRS 17 is not expected to have a significant impact on net equity on January 1, 2023.
|
(ii)
|
Disclosure of Accounting Policies – Amendments to IAS 1 and Practice
Statement No 2 -
|
IAS stipulated that “significant” accounting policies must be disclosed. With this amendment, there is a
specification that disclosure must be for “material” accounting policies. This amendment incorporates the definition of what is considered “information on material accounting policies” and explains how to identify this type of information.
Additionally, the amendment clarifies that it is not necessary to divulge information on immaterial accounting policies and if the same is divulged, it should not create confusion about what truly constitutes important accounting
information. Consistently, Practice Statement No 2 was also amended to express judgements on materiality to provide a guide to apply the concept of materiality in
accounting policy disclosures.
These amendments will be effective for the annual reporting periods beginning on or after January 1,
2023 with early adoption permitted.
The Group is currently assessing the impact on the disclosure of the accounting policies.
F-53
|
(iii)
|
Amendments to IAS 8 - Definition of Accounting Estimates –
|
This amendment clarifies how to distinguish changes in accounting policies from changes in accounting
estimates. The distinction is important when defining accounting treatment given that changes in accounting estimates recognize future transactions and events prospectively while changes in accounting policies generally apply to past
transactions and events retroactively, as is the case with the current period.
Amendments will be in effect for the annual periods reported beginning on or after January 1, 2023 and
anticipated adoption is permitted.
The Group is currently assessing the impact that this amendment will have on its consolidated financial
statements.
|
(iv)
|
Amendments to IAS 12, Deferred Tax related to Assets and Liabilities Arising from a Single Transaction –
|
These amendments specify that deferred taxes that arise from a single transaction should be recognized
if, in their initial recognition, temporary taxable differences and deductibles for the same value arise. This will generally apply to transactions such as leasing (for lessees) and obligation to dismantle or remediate in those situations
that will require
recognition of deferred tax assets and liabilities. These amendments must apply to transactions that
occur on or after the beginning of the comparative period presented. Additionally, it is necessary to recognize deferred tax assets (to the extent that it is probable that they will be utilized) and deferred tax liabilities at the beginning
of the first comparative period for all deductible or taxable temporary differences associated with:
|
-
|
Right of use assets and lease liabilities, and
|
|
-
|
Liabilities for dismantling, restoration and similar and the corresponding contributions are recognized as part of the cost of related assets.
|
The accumulated effect of these adjustments is recognized in retained earnings or through another
component of equity as applicable.
Previously, IAS 12 did not establish any particular accounting treatment for the tax effects of leases
that are recognized in the balance sheet and for similar transactions; as such, different approaches are considered acceptable. The entities that are already recognizing deferred taxes on these transactions will not see impacts on their
financial statements.
Amendments will be effective for the annual reported periods beginning or after January 1, 2023 and
anticipated adoption is permitted.
The Group is currently assessing the impact that this amendment may have on their consolidated financial
statements.
|
(v)
|
Amendment to IFRS 10 and IAS 28 - Sale or contribution of assets that takes place an investor and its associate
or joint venture -
|
The IASB has made modifications of limited scope to IFRS 10 “Consolidated Financial Statements” and IAS
28 “Investments in Associates and Joint Ventures”.
F-54
Amendments clarify the accounting treatment of asset sales or contributions between an investor and its
associates or joint ventures. They further confirm that the accounting treatment will depend on whether the non-monetary assets sold or contributed to an associate or joint venture constitute a "business" (as defined in IFRS 3 "Business
Combinations"). When non-monetary assets constitute a business, the investor will recognize the total gain or loss from the sale or contribution of the assets. If the assets do not meet the definition of a business, the gain or loss is
recognized by the investor only in proportion to the investment of the other investors in the joint venture associate. These modifications will be applied prospectively.
In December 2015, IASB decided to postpone the date of application of this amendment until its research
project on the equity method has been completed.
Amendments will be effective for annual reporting periods on or after January 1, 2023 and should be
applied retrospectively to property, plant and equipment that are made available for use on or after the beginning of the first period in which the entity first applies the amendment.
The Group is currently assessing the impact that this amendment may have on their consolidated financial
statements.
There are no other standards and
amendments to standardsthat have not yet become effective and are expected to have a significant impact on the Group, either in the current or future periods, as well as on foreseeable future transactions.
| 4 |
CASH AND DUE FROM BANKS
|
| a) |
This item comprises the following:
|
|
2022
|
2021
|
|||||||
|
S/(000)
|
|
S/(000)
|
|
|||||
|
Cash and clearing (b)
|
|
|
||||||
|
Deposits with Central Reserve Bank of Peru (BCRP) (b)
|
|
|
||||||
|
Deposits with Central Bank of Bolivia and Colombia (b)
|
|
|
||||||
|
Deposits with foreign banks (c)
|
|
|
||||||
|
Deposits with local banks (c)
|
|
|
||||||
|
Interbank funds
|
|
|
||||||
|
Accrued interest
|
|
|
||||||
|
Total cash and cash equivalents
|
|
|
||||||
|
Restricted funds
|
|
|
||||||
|
Total cash
|
|
|
||||||
Cash and cash equivalents presented in the consolidated statement of cash flows exclude restricted funds, see note 3(ac).
F-55
| b) |
|
These accounts mainly include the legal cash requirements that Credicorp Subsidiaries must maintain for their obligations to the public. This
item comprises the following:
|
2022
|
2021
|
|||||||
|
S/(000)
|
|
S/(000)
|
|
|||||
|
Legal cash requirements (i)
|
||||||||
|
Deposits with Central Reserve Bank of Perú
|
|
|
||||||
|
Deposits with Central Bank of Bolivia
|
|
|
||||||
|
Deposits with Republic Bank of Colombia
|
|
|
||||||
|
Cash in vaults of Bank
|
|
|
||||||
|
Total legal cash requirements
|
|
|
||||||
|
Additional funds
|
||||||||
|
Overnight deposits with Central Reserve Bank of Perú (ii)
|
|
|
||||||
|
Term deposits with Central Reserve Bank of Perú (iii)
|
|
|
||||||
|
Cash in vaults of Bank and others
|
|
|
||||||
|
Other Deposits BCRP
|
|
|
||||||
|
Total additional funds
|
|
|
||||||
|
Total
|
|
|
||||||
| (i) |
|
The reserve funds, which represent the minimum mandatory, do not earn interest; however, the excess of the mandatory reserve deposited in
BCRP, earns interests at a nominal rate established by BCRP.
Management considers that the Group has complied with the requirements established by current regulations related to the calculation of the
legal reserve.
| (ii) |
|
As of December 31, 2021, the Group maintained four
“overnight” deposits with the BCRP, which two were denominated in soles in amount of S/690.0 million and two in U.S. Dollar in amount of US$964.7 million, equivalent to S/3,846.4
million. At said date, deposits in soles and deposits in U.S. Dollar accrued interest at annual rates of 1.85 percent and 0.05 percent, respectively, and had maturities at 3 days .
F-56
| (iii) |
|
| c) |
|
Deposits with local and foreign banks mainly consist of balances in soles and U.S. Dollar; these are cash in hand and earn interest at
market rates. As of December 31, 2022 and 2021 Credicorp and its Subsidiaries do no
F-57
| 5 |
CASH COLLATERAL, REVERSE REPURCHASE AGREEMENTS AND SECURITIES BORROWING AND PAYABLES FROM REPURCHASE AGREEMENTS AND SECURITIES LENDING
|
| a) |
We present below the composition of cash collateral, reverse repurchase agreements and securities borrowing:
|
|
2022
|
2021
|
|||||||
|
S/(000)
|
|
S/(000)
|
|
|||||
|
Cash collateral on repurchase agreements and security lendings (i)
|
|
|
||||||
|
Reverse repurchase agreement and security borrowings (ii)
|
|
|
||||||
|
Receivables for short sales
|
|
|
||||||
|
Total
|
|
|
||||||
| (i) |
|
F-58
| (ii) |
Credicorp, through its
subsidiaries, provides financing to its customers through reverse repurchase agreements and securities borrowing, in which a financial instrument serves as collateral. Details of said transactions are as follows:
|
|
2022
|
2021
|
||||||||||||||||||||||||||||||||||||||||||||||||
|
|
Currency |
Average
interest
rate
|
Up to 3
days
|
From 3 to
30 days
|
More than
30 days
|
Carrying
amount
|
Fair value
of
underlying
assets
|
Average
interest
rate
|
Up to 3
days
|
From 3 to
30 days
|
More
than 30
days
|
Carrying
amount
|
Fair value
of
underlying
assets
|
||||||||||||||||||||||||||||||||||||
|
%
|
S/(000)
|
|
S/(000)
|
|
S/(000)
|
|
S/(000)
|
|
S/(000)
|
|
%
|
S/(000)
|
|
S/(000)
|
|
S/(000)
|
|
S/(000)
|
|
S/(000)
|
|
||||||||||||||||||||||||||||
|
Instruments issued by the Colombian Government
|
|
|
|
|
|
|
|
|
|
|
|
|
|
||||||||||||||||||||||||||||||||||||
|
Other instruments (*)
|
|
|
|
|
|
|
|
|
|
|
|
|
|||||||||||||||||||||||||||||||||||||
|
|
|
|
|
|
|
|
|
|
|
||||||||||||||||||||||||||||||||||||||||
| (*) Corporate and financial system instruments. | |||||||||||||||||||||||||||||||||||||||||||||||||
| b) |
Credicorp, through its subsidiaries, obtains financing through “Payables from repurchase agreements and securities lending” by selling financial instruments and committing to repurchase
them at future dates, including interest at a fixed rate. The details of said transactions are as follows:
|
|
2022
|
2021
|
||||||||||||||||||||||||||||||||||||||||||||||||
|
|
Currency |
Average interest
rate
|
Up to 3 days
|
From 3 to 30 days
|
More than 30 days
|
Carrying amount
|
Fair value of underlying assets
|
Average interest
rate
|
Up to 3
days
|
From 3 to 30 days
|
More
than 30 days
|
Carrying amount
|
Fair value of underlying assets
|
||||||||||||||||||||||||||||||||||||
|
%
|
S/(000)
|
S/(000)
|
S/(000)
|
S/(000)
|
S/(000)
|
%
|
S/(000)
|
S/(000)
|
S/(000)
|
S/(000)
|
S/(000)
|
||||||||||||||||||||||||||||||||||||||
|
Debt instruments, cash and loans (c)
|
|
|
|
|
|
|
|
|
|
|
|||||||||||||||||||||||||||||||||||||||
|
Instruments issued by the Colombian Government
|
|
|
|
|
|
|
|
|
|
|
|
|
|
||||||||||||||||||||||||||||||||||||
|
Instruments issued by the Chilean Government
|
|
|
|
|
|
|
|
|
|
|
|
|
|||||||||||||||||||||||||||||||||||||
|
Other instruments
|
|
|
|
|
|
|
|
|
|
|
|
|
|||||||||||||||||||||||||||||||||||||
|
|
|
|
|
|
|
|
|
|
|
||||||||||||||||||||||||||||||||||||||||
F-59
| c) |
|
|
2022
|
2021
|
|||||||||||||
|
Carrying
|
Carrying
|
|||||||||||||
|
Counterparties
|
Currency
|
Maturity
|
amount
|
Collateral
|
Maturity
|
amount
|
Collateral
|
|||||||
|
S/(000)
|
S/(000)
|
|||||||||||||
|
BCRP - Reactiva Perú (*)
|
|
|
|
Loans guaranteed by National Government
|
|
|
Loans guaranteed by National Government
|
|||||||
|
BCRP
|
|
|
|
Investments
|
|
|
Investments
|
|||||||
|
Banco Central de Bolivia
|
|
|
|
Cash
|
|
|
Cash
|
|||||||
|
BCRP - Reactiva Perú Especial (*)
|
Loans guaranteed by National Government |
Loans guaranteed by National Government
|
||||||||||||
|
Natixis S.A.
|
Investments | Investments | ||||||||||||
|
BCRP, Note 5(a)(i)
|
|
|
|
Cash with BCRP
|
|
|
Cash with BCRP
|
|||||||
|
Citigroup Global Markets Limited (i)
|
Investments | Investments | ||||||||||||
|
Natixis S.A. (ii)
|
|
|
|
Investments
|
|
|
Investments
|
|||||||
|
Banco de la República
|
|
|
|
Investments
|
|
|
Investments
|
|||||||
|
Other minors
|
|
|
|
Investments
|
|
|
Investments
|
|||||||
|
Accrued interest
|
|
|
||||||||||||
|
|
|
|||||||||||||
(*) Comprised Agreement Transactions where BCP and MiBanco sell representing credit securities guaranteed by the BCRP, they receive soles and are obliged to buy them back at a later date. The credit
representing securities with guarantee of the National Government may have the form of a portfolio of credit representing titles or of Certificates of Participation in trustee of the loan portfolio guaranteed by the National Government
(Reactiva Especial). The BCRP will charge a fixed interest annual rate in soles of 0.5 percent for the operation and will
include a grace period of twelve months without payment of interest or principal. As of December 2022, the total credits granted
through the Reactiva Perú program is S/8,877.2 million (S/18,404.6 million, at December 31, 2021), see Note 7(a).
As of December 31, 2022, said operations accrue interest at fixed and variable rates between 0.50 percent and 12.84 percent
and between Libor 6 M + 1.68
percent and Libor 6 M + 1.90
percent, respectively, (between 0.50 percent and 6.73 percent and between Libor 6 M + 1.68 percent and Libor 6 M + 1.90 percent , respectively, as of December 31, 2021).
Certain repurchase agreements were hedged using cross-currency swaps (CCS), as detailed below:
| (i) |
|
| (ii) |
|
F-60
| 6 |
INVESTMENTS
|
| a) |
Investment at fair value through profit or loss comprises the following:
|
|
|
2022
|
2021
|
||||||
|
|
S/(000)
|
|
S/(000)
|
|
||||
|
|
||||||||
|
Mutual funds (i)
|
|
|
||||||
|
Investment funds (ii)
|
|
|
||||||
|
Government Bonds (iii)
|
|
|
||||||
|
Restricted mutual funds (iv)
|
|
|
||||||
|
Central Bank of Chile bonds
|
|
|
||||||
|
Participation in RAL Funds (v)
|
|
|
||||||
|
Corporate bonds
|
|
|
||||||
|
Subordinated bonds
|
|
|
||||||
|
Shares
|
|
|
||||||
|
Multilateral organization bonds
|
|
|
||||||
|
ETF (Exchange - Traded Fund)
|
|
|
||||||
|
Certificates of deposit BCRP (vi)
|
|
|
||||||
|
Hedge funds
|
|
|
||||||
|
Others
|
|
|
||||||
|
Balance before accrued interest
|
|
|
||||||
|
Accrued interest
|
|
|
||||||
|
Total
|
|
|
||||||
| (i) |
|
| (ii) | |
| (iii) |
|
|
2022
|
2021
|
|||||||
|
|
S/(000)
|
|
S/(000)
|
|
||||
|
|
||||||||
|
Colombian Government Bonds
|
|
|||||||
|
Chilean Government Bonds
|
|
|
||||||
|
United States of America Government Bonds
|
|
|
||||||
|
Peru Government Bonds
|
|
|
||||||
|
Brazilian Government Bonds
|
|
|
||||||
|
Total
|
|
|
||||||
F-61
| (iv) |
|
| (v) |
|
|
|
(vi) |
|
F-62
| b) |
Investments at fair value through other comprehensive income comprises the following:
|
|
2022
|
2021
|
|||||||||||||||||||||||||||||||
|
Unrealized gross amount
|
Unrealized gross amount
|
|||||||||||||||||||||||||||||||
|
Cost
|
Profits
|
Losses
|
Estimated
fair value
|
Cost
|
Profits
|
Losses
|
Estimated
fair value
|
|||||||||||||||||||||||||
|
S/(000
|
)
|
S/(000
|
)
|
S/(000
|
)
|
S/(000
|
)
|
S/(000
|
)
|
S/(000
|
)
|
S/(000
|
)
|
S/(000
|
)
|
|||||||||||||||||
|
Debts instruments:
|
||||||||||||||||||||||||||||||||
|
Corporate bonds (i)
|
|
|
(
|
)
|
|
|
|
(
|
)
|
|
||||||||||||||||||||||
|
Government Bonds (ii)
|
|
|
(
|
)
|
|
|
|
(
|
)
|
|
||||||||||||||||||||||
|
Certificates of deposit BCRP (iii)
|
|
|
(
|
)
|
|
|
|
(
|
)
|
|
||||||||||||||||||||||
|
Securitization instruments (iv)
|
|
|
(
|
)
|
|
|
|
(
|
)
|
|
||||||||||||||||||||||
|
Negotiable certificates of deposit (v)
|
|
|
(
|
)
|
|
|
|
(
|
)
|
|
||||||||||||||||||||||
|
Subordinated bonds
|
|
|
(
|
)
|
|
|
|
(
|
)
|
|
||||||||||||||||||||||
|
Others
|
|
|
(
|
)
|
|
|
|
(
|
)
|
|
||||||||||||||||||||||
|
|
|
(
|
)
|
|
|
|
(
|
)
|
|
|||||||||||||||||||||||
|
Equity instruments designated at the initial recognition
|
||||||||||||||||||||||||||||||||
|
Shares issued by:
|
||||||||||||||||||||||||||||||||
|
Inversiones Centenario
|
|
|
|
|
|
|
|
|
||||||||||||||||||||||||
|
Alicorp S.A.A.
|
|
|
|
|
|
|
|
|
||||||||||||||||||||||||
|
Bolsa de Valores de Lima
|
|
|
|
|
|
|
|
|
||||||||||||||||||||||||
|
Bolsa de Comercio de Santiago
|
|
|
|
|
|
|
|
|
||||||||||||||||||||||||
|
Compañía Universal Textil S.A.
|
|
|
(
|
)
|
|
|
|
(
|
)
|
|
||||||||||||||||||||||
|
Pagos Digitales Peruanos S.A.
|
|
|
(
|
)
|
|
|
|
(
|
)
|
|
||||||||||||||||||||||
|
Bolsa de Valores de Colombia
|
|
|
(
|
)
|
|
|
|
(
|
)
|
|
||||||||||||||||||||||
|
Corporación Andina de Fomento
|
|
|
|
|
|
|
|
|
||||||||||||||||||||||||
|
Others
|
|
|
(
|
)
|
|
|
|
(
|
)
|
|
||||||||||||||||||||||
|
|
|
(
|
)
|
|
|
|
(
|
)
|
|
|||||||||||||||||||||||
|
Balance before accrued interest
|
|
|
(
|
)
|
|
|
|
(
|
)
|
|
||||||||||||||||||||||
|
Accrued interest
|
|
|
||||||||||||||||||||||||||||||
|
Total
|
|
|
||||||||||||||||||||||||||||||
The variation in the fair value of the investments is mainly due to the increase in interest rates in soles and in foreign currency, which
negatively affected the investment portfolios at fair value with changes in other comprehensive income as of December 31, 2022. Credicorp's Management has determined that the unrealized losses of investments at fair value through other
comprehensive income as of December 31, 2022 and December 31, 2021 are of a temporal nature; considering factors such as the planned strategy in relation to the security or portfolio identified, the related guarantee and the credit rating
of the issuers. During 2022, as a result of the evaluation of the impairment loss of investments at fair value with changes in other comprehensive income, the Group has recorded a provision for credit loss of S/58.3 million (provision for credit loss of S/6.8
million ended December 31, 2021), which is presented in the caption "Net gain in securities", see note 24 of the consolidated statement of income. Furthermore, Management has decided and has the ability to hold each of these investments for
a period of time to allow an early recovery in fair value, even before their sufficient recovery or maturity.
F-63
The maturities and annual market rates of investments at fair value through other comprehensive income during 2022 and 2021, are as
follows:
|
|
Maturities |
Annual effective interest rate
|
|||||||||||||||||||||||||||||||||||||||||||||||||
|
|
2022 |
2021
|
2022
|
2021
|
|||||||||||||||||||||||||||||||||||||||||||||||
|
S/
|
US$ | Other currencies |
S/
|
US$ | Other currencies
|
||||||||||||||||||||||||||||||||||||||||||||||
|
|
|
|
Min
|
Max
|
Min
|
Max
|
Min
|
Max
|
Min
|
Max
|
Min
|
Max
|
Min
|
Max
|
|||||||||||||||||||||||||||||||||||||
|
|
|
|
%
|
%
|
%
|
%
|
%
|
%
|
%
|
%
|
%
|
%
|
%
|
%
|
|||||||||||||||||||||||||||||||||||||
|
|
|
|
|||||||||||||||||||||||||||||||||||||||||||||||||
|
Corporate bonds
|
|
|
|
|
|
|
|
|
|
|
|
|
|
|
|||||||||||||||||||||||||||||||||||||
|
Government treasury bonds
|
|
|
|
|
|
|
|
|
|
|
|
|
|
|
|||||||||||||||||||||||||||||||||||||
|
Certificates of deposit BCRP
|
|
|
|
|
|
|
|
|
|
|
|
|
|
|
|||||||||||||||||||||||||||||||||||||
|
Negotiable certificates of deposits
|
|
|
|
|
|
|
|
|
|
|
|
|
|
|
|||||||||||||||||||||||||||||||||||||
|
Securitization instruments
|
|
|
|
|
|
|
|
|
|
|
|
|
|
|
|||||||||||||||||||||||||||||||||||||
|
Subordinated bonds
|
|
|
|
|
|
|
|
|
|
|
|
|
|
|
|||||||||||||||||||||||||||||||||||||
|
Others
|
|
|
|
|
|
|
|
|
|
|
|
|
|
|
|||||||||||||||||||||||||||||||||||||
Likewise, as of December 31, 2022, the Group entered into repurchase agreements for government bonds and BCRP certificates of deposit
classified as investments at fair value through other comprehensive income, for an estimated fair value of S/1,108.1 million (S/318.4 million as of December 31, 2021), whose related liability is presented in "Accounts payable for repurchase agreements and securities
lending" of the consolidated statement of financial position, see note 5(c).
As of December 31, 2022, the Group maintains IRS, which have been designated as hedges of the fair value of certain fixed-rate bonds in
U.S. dollar issued by corporate companies classified as investments at fair value through other comprehensive income, for a nominal amount of S/926.5
million (S/636.4 million as of December 31, 2021), see note 13(c); through said IRS these bonds were economically converted to a
variable rate.
F-64
| (i) |
|
Likewise, as of December 31, 2022, the Group maintains CCS, which were designated as cash flow hedges of certain corporate bonds for
nominal amounts of S/114.1 million. As of December 31, 2021, it had CCS for an amount of S/79.1 million, see note 13(c); Through said CCS, the bonds were economically converted into soles at a fixed rate.
As of December 31, 2022, the most significant individual unrealized loss amount ascends to approximately S/34.2 million of Inversiones Nacionales de Turismo - Intursa S.A, S/18.5 million as of December 31, 2021. The largest unrealized loss with respect to the balance sheet of 2021 is due to the behavior of the market.
| (ii) |
|
|
|
2022
|
2021
|
||||||
|
S/(000)
|
|
S/(000)
|
|
|||||
|
Peruvian Government Bonds
|
|
|
||||||
|
U.S. and federal agency Government Bonds
|
|
|
||||||
|
Colombian Government Bonds
|
|
|
||||||
|
Chilean Government Bonds
|
|
|
||||||
|
Bolivian Government Bonds
|
|
|
||||||
|
Others
|
|
|
||||||
|
Total
|
|
|
||||||
| (iii) |
|
F-65
| (iv) |
|
|
2022
|
2021
|
|||||||
|
S/(000)
|
|
S/(000)
|
|
|||||
|
Inmuebles Panamericana S.A.
|
|
|
||||||
|
ATN S.A.
|
|
|
||||||
|
Colegios Peruanos S.A.
|
|
|
||||||
|
Multimercados Zonales S.A.C.
|
||||||||
|
Costa de Sol S.A.
|
|
|
||||||
|
Nessus Hoteles Perú S.A.
|
|
|
||||||
|
Concesionaria La Chira S.A.
|
||||||||
|
Fábrica Nacional de Cemento S.A.
|
|
|
||||||
|
Homecenters Peruanos S.A.
|
|
|
||||||
|
Others (less than S/
|
|
|
||||||
|
Total
|
|
|
||||||
The instruments have semiannual payments until 2045.The pool of underlying assets consists mainly of accounts receivable from income, revenues for services and from maintenance and marketing contributions (Inmuebles
Panamericana S.A.), and accounts receivable for electrical transmission services from the Carhuamayo - Cajamarca line (ATN S.A.).
| (v) |
|
Due to the increase in market liquidity due to government programs such as Reactiva Perú and the successive withdrawals of Pension Fund Administrators
(hereinafter AFPs), approved by Congress since 2020, Banco de Crédito del Perú had to incorporate changes to the business model of investments at fair value with change in other comprehensive income to contribute to the matching of its
assets and liabilities. In October 2022, as a result of this change, the Bank has reclassified a portfolio of investments at fair value with changes in other comprehensive income to investments at amortized cost for S/2,232.7 million and has reversed the unrealized net loss of this portfolio recorded in other comprehensive income of equity net for S/549.2 million, in order to record it as if it had always been a portfolio classified at amortized cost from the beginning.
The change in the business model and the reclassification are in accordance with the provisions of IFRS 9 "Financial
Instruments", see note 3(f)(iv), and have been approved by the Risk Management Committee and the of Treasury Risks and ALM of the Bank.
F-66
| c) |
Amortized cost investments consist of the following:
|
|
|
2022
|
|||||||
|
|
Carrying
|
Fair
|
||||||
|
|
amount
|
value
|
||||||
|
|
S/(000)
|
|
S/(000)
|
|
||||
|
|
||||||||
| Peruvian Government Bonds (i) |
|
|
||||||
|
Corporate bonds (i)
|
|
|
||||||
|
Subordinated bonds (i)
|
|
|
||||||
|
Certificates of payment on work progress (CRPAO) (ii)
|
|
|
||||||
|
Other government bonds (i)
|
|
|
||||||
|
|
|
|
||||||
|
Accrued interest
|
|
|
||||||
| Total investments at amortized cost, net |
|
|
||||||
|
|
2021
|
|||||||
|
|
Carrying
|
Fair
|
||||||
|
|
amount
|
value
|
||||||
|
|
S/(000)
|
|
S/(000)
|
|
||||
|
|
||||||||
|
Peruvian Government Bonds (i)
|
|
|
||||||
| Corporate bonds (i) |
||||||||
| Subordinated bonds (i) |
||||||||
|
Certificates of payment on work progress (CRPAO) (ii)
|
|
|
||||||
|
Other government bonds (i)
|
|
|
||||||
|
|
|
|
||||||
|
Accrued interest
|
|
|
||||||
|
Total investments at amortized cost, net
|
|
|
||||||
The expected loss of
investments at amortized cost as of December 31, 2022
and 2021 is S/3.9 million and S/2.8 million, respectively.
| (i) |
|
| (ii) |
|
The increase in bonds at amortized cost is due to the fact that, in October 2022, Banco de Crédito del Perú reclassified its
portfolio of bonds at fair value through other comprehensive income at amortized cost due to a change in its business model, see note 6(b).
F-68
| d) |
The table below shows the balance of investments classified by maturity, without consider accrued interest or provision for credit loss:
|
|
2022
|
||||||||||||
|
At fair value
through profit
or loss
|
At fair value
through other
comprehensive
income
|
Amortized
cost
|
||||||||||
|
S/(000)
|
|
S/(000)
|
|
S/(000)
|
|
|||||||
|
Up to 3 months
|
|
|
|
|||||||||
|
From 3 months to 1 year
|
|
|
|
|||||||||
|
From 1 to 3 years
|
|
|
|
|||||||||
|
From 3 to 5 years
|
|
|
|
|||||||||
|
More than 5 years
|
|
|
|
|||||||||
|
Without maturity
|
|
|
|
|||||||||
|
Total
|
|
|
|
|||||||||
|
2021
|
||||||||||||
|
At fair value
through profit
or loss
|
At fair value
through other
comprehensive
income
|
Amortized
cost
|
||||||||||
|
S/(000)
|
|
S/(000)
|
|
S/(000)
|
|
|||||||
|
Up to 3 months
|
|
|
|
|||||||||
|
From 3 months to 1 year
|
|
|
|
|||||||||
|
From 1 to 3 years
|
|
|
|
|||||||||
|
From 3 to 5 years
|
|
|
|
|||||||||
|
More than 5 years
|
|
|
|
|||||||||
|
Without maturity
|
|
|
|
|||||||||
|
Total
|
|
|
|
|||||||||
F-69
| 7 |
LOANS, NET
|
| a) |
This item consists of the following:
|
|
2022
|
2021
|
|||||||
| S/(000) |
S/(000) | |||||||
|
Direct loans -
|
||||||||
|
Loans
|
|
|
||||||
|
Credit cards
|
|
|
||||||
|
Leasing receivables
|
|
|
||||||
|
Factoring receivables
|
|
|
||||||
|
Discounted notes
|
|
|
||||||
|
Advances and overdrafts in current account
|
|
|
||||||
|
Refinanced loans
|
|
|
||||||
|
Total direct loans
|
|
|
||||||
|
Internal overdue loans and under legal collection loans
|
|
|
||||||
|
|
|
|||||||
|
Add (less) -
|
||||||||
|
Accrued interest
|
|
|
||||||
|
Unearned interest
|
(
|
)
|
(
|
)
|
||||
|
Total direct loans
|
|
|
||||||
|
Allowance for loan losses (c)
|
(
|
)
|
(
|
)
|
||||
|
Total direct loans, net
|
|
|
||||||
The credits granted as part of the Reactiva Peru program are guaranteed by the Peruvian State. The total credits granted through this
program as of December 31, 2022, and 2021 amount to S/8,877.2 million and S/18,404.6 million, respectively. Likewise, as of December 31, 2022, and 2021, loans from the Reactiva Peru program were rescheduled for an amount of S/5,669.2 million and S/7,539.9
million, respectively. Overdue loans of the Reactiva Peru program as of December 31, 2022, and 2021 amount to S/1,047.8 million
and S/1,061.0 million, respectively. On the other hand, the Group maintains repurchase agreements with guarantees, which are
detailed in note 5(c).
The government, in order to serve small companies that the Reactiva Peru program does not reach, has established the MYPE Business Support
Fund (FAE-MYPE) which represents for Mibanco as of December 31, 2022, a total of S/3.9 million and S/83.6 million for FAE-MYPE 1 and FAE-MYPE 2, respectively. As of December 31, 2021, S/14.8 million and S/209.9 million for FAE-MYPE 1 and FAE-MYPE 2,
respectively. Likewise, as of December 31, 2022, and 2021, loans from the FAE-MYPE 2 program were rescheduled for an amount of S/36.7
million and S/55.9 million, respectively.
Due to the effects of the COVID-19 Pandemic, BCP and Mibanco, the main Credicorp Subsidiaries, have offered their customers the opportunity
to reschedule their loans for 30 or 90 days without incurring past due commissions and principal interest. As of December 31, 2022, and 2021, the rescheduled portfolio amounts to S/11,448.7 million and S/20,961.1
million, respectively
In the loan portfolio, the most vulnerable microfinance operations correspond to Mibanco and in individual BCP to SME products and consumer
loans, where debt rescheduling rates reached 3.69 percent, 22.18 percent, and 4.08 percent as of December 31.
December 2022. As of December 31, 2021, they reached a debt rescheduling of 5.25 percent, 34.00 percent, and 11.40
percent.
F-70
| b) |
As of December 31, 2022, and 2021, the composition of the gross credit balance is as follows:
|
|
2022
|
2021
|
|||||||
| S/(000) |
|
S/(000) |
|
|||||
|
Direct loans, Note7 (a)
|
|
|
||||||
|
Indirect loans, Note 21(a)
|
|
|
||||||
|
Banker’s acceptances Note 3(r)
|
|
|
||||||
|
Total
|
|
|
||||||
F-71
The movement of gross balance of loan portfolio by stages is as follows for the periods of 2022 and 2021 is as follows:
|
Stage 1
|
||||||||||||||||||||||||||||||||||||||||
|
Loans by class
|
Balance at
December 31,
2021
|
Transfer to
Stage 2
|
Transfer to
Stage 3
|
Transfer from
Stage 2
|
Transfer from
Stage 3
|
New loans,
liquidation and
write-offs, net
|
Transfers
between classes
of loans
|
Sale of loan
portfolio
|
Exchange
differences and
others
|
Balance at
December 31,
2022 |
||||||||||||||||||||||||||||||
| S/(000) |
S/(000) |
S/(000) |
S/(000) |
S/(000) |
S/(000) |
S/(000) |
S/(000) |
S/(000) |
S/(000) |
|||||||||||||||||||||||||||||||
|
Commercial loans
|
|
(
|
)
|
(
|
)
|
|
|
|
(
|
)
|
|
(
|
)
|
|
||||||||||||||||||||||||||
|
Residential mortgage loans
|
|
(
|
)
|
(
|
)
|
|
|
|
|
|
(
|
)
|
|
|||||||||||||||||||||||||||
|
Micro-business loans
|
|
(
|
)
|
(
|
)
|
|
|
|
(
|
)
|
|
(
|
)
|
|
||||||||||||||||||||||||||
|
Consumer loans
|
|
(
|
)
|
(
|
)
|
|
|
|
|
|
(
|
)
|
|
|||||||||||||||||||||||||||
|
Total
|
|
(
|
)
|
(
|
)
|
|
|
|
|
|
(
|
)
|
|
|||||||||||||||||||||||||||
|
Stage 2
|
||||||||||||||||||||||||||||||||||||||||
|
Loans by class
|
Balance at
December 31,
2021 |
Transfer to
Stage 1
|
Transfer to
Stage 3
|
Transfer from
Stage 1
|
Transfer from
Stage 3
|
New loans,
liquidation and
write-offs, net
|
Transfers
between classes
of loans
|
Sale of loan
portfolio
|
Exchange
differences and
others
|
Balance at
December 31,
2022
|
||||||||||||||||||||||||||||||
| S/(000) |
S/(000) |
S/(000) |
S/(000) |
S/(000) |
S/(000) |
S/(000) |
S/(000) |
S/(000) |
S/(000) |
|||||||||||||||||||||||||||||||
|
Commercial loans
|
|
(
|
)
|
(
|
)
|
|
|
(
|
)
|
|
|
(
|
)
|
|
||||||||||||||||||||||||||
|
Residential mortgage loans
|
|
(
|
)
|
(
|
)
|
|
|
(
|
)
|
|
|
(
|
)
|
|
||||||||||||||||||||||||||
|
Micro-business loans
|
|
(
|
)
|
(
|
)
|
|
|
(
|
)
|
(
|
)
|
|
(
|
)
|
|
|||||||||||||||||||||||||
|
Consumer loans
|
|
(
|
)
|
(
|
)
|
|
|
(
|
)
|
(
|
)
|
|
(
|
)
|
|
|||||||||||||||||||||||||
|
Total
|
|
(
|
)
|
(
|
)
|
|
|
(
|
)
|
|
|
(
|
)
|
|
||||||||||||||||||||||||||
|
Stage 3
|
||||||||||||||||||||||||||||||||||||||||
|
Loans by class
|
Balance at
December 31,
2021
|
Transfer to
Stage 1
|
Transfer to
Stage 2
|
Transfer from
Stage 1
|
Transfer from
Stage 2
|
New loans,
liquidation and
write-offs, net
|
Transfers
between classes
of loans
|
Sale of loan
portfolio
|
Exchange
differences and
others
|
Balance at
December 31,
2022
|
||||||||||||||||||||||||||||||
|
|
S/(000) |
S/(000) |
S/(000) |
S/(000) |
S/(000) |
S/(000) |
S/(000) |
S/(000) |
S/(000) |
S/(000) |
||||||||||||||||||||||||||||||
|
Commercial loans
|
|
(
|
)
|
(
|
)
|
|
|
(
|
)
|
(
|
)
|
(
|
)
|
(
|
)
|
|
||||||||||||||||||||||||
|
Residential mortgage loans
|
|
(
|
)
|
(
|
)
|
|
|
(
|
)
|
|
(
|
)
|
(
|
)
|
|
|||||||||||||||||||||||||
|
Micro-business loans
|
|
(
|
)
|
(
|
)
|
|
|
(
|
)
|
|
(
|
)
|
(
|
)
|
|
|||||||||||||||||||||||||
|
Consumer loans
|
|
(
|
)
|
(
|
)
|
|
|
(
|
)
|
|
(
|
)
|
(
|
)
|
|
|||||||||||||||||||||||||
|
Total
|
|
(
|
)
|
(
|
)
|
|
|
(
|
)
|
|
(
|
)
|
(
|
)
|
|
|||||||||||||||||||||||||
|
Consolidated 3 Stages
|
||||||||||||||||||||||||||||
|
Loans by class
|
Balance at
December 31,
2021
|
Loan
portfolio
written off
and forgiven
|
New loans and
liquidation, net
|
Transfers
between classes
of loans
|
Sale of loan
portfolio
|
Exchange
differences and
others
|
Balance at
December 31,
2022
|
|||||||||||||||||||||
|
|
S/(000) |
S/(000) |
S/(000) |
S/(000) |
S/(000) |
S/(000) |
S/(000) |
|||||||||||||||||||||
|
Commercial loans
|
|
(
|
)
|
(
|
)
|
|
(
|
)
|
(
|
)
|
|
|||||||||||||||||
|
Residential mortgage loans
|
|
(
|
)
|
|
|
(
|
)
|
(
|
)
|
|
||||||||||||||||||
|
Micro-business loans
|
|
(
|
)
|
|
(
|
)
|
(
|
)
|
(
|
)
|
|
|||||||||||||||||
|
Consumer loans
|
|
(
|
)
|
|
|
(
|
)
|
(
|
)
|
|
||||||||||||||||||
|
Total
|
|
(
|
)
|
|
|
(
|
)
|
(
|
)
|
|
||||||||||||||||||
F-72
|
Stage 1
|
||||||||||||||||||||||||||||||||||||||||
|
Loans by class
|
Balance at
December 31,
2020
|
Transfer to
Stage 2
|
Transfer to
Stage 3
|
Transfer from
Stage 2
|
Transfer from
Stage 3
|
New loans,
liquidation and
write-offs, net
|
Transfers
between classes
of loans
|
Sale of loan
portfolio
|
Exchange
differences and
others
|
Balance at
December 31,
2021
|
||||||||||||||||||||||||||||||
| S/(000) |
S/(000) |
S/(000) |
S/(000) |
S/(000) |
S/(000) |
S/(000) |
S/(000) |
S/(000) |
S/(000) |
|||||||||||||||||||||||||||||||
|
Commercial loans
|
|
(
|
)
|
(
|
)
|
|
|
|
|
|
|
|
||||||||||||||||||||||||||||
|
Residential mortgage loans
|
|
(
|
)
|
(
|
)
|
|
|
|
(
|
)
|
(
|
)
|
|
|
||||||||||||||||||||||||||
|
Micro-business loans
|
|
(
|
)
|
(
|
)
|
|
|
|
(
|
)
|
|
|
|
|||||||||||||||||||||||||||
|
Consumer loans
|
|
(
|
)
|
(
|
)
|
|
|
|
|
|
|
|
||||||||||||||||||||||||||||
|
Total
|
|
(
|
)
|
(
|
)
|
|
|
|
|
(
|
)
|
|
|
|||||||||||||||||||||||||||
|
Stage 2
|
||||||||||||||||||||||||||||||||||||||||
|
Loans by class
|
Balance at
December 31,
2020
|
Transfer to
Stage 1
|
Transfer to
Stage 3
|
Transfer from
Stage 1
|
Transfer from
Stage 3
|
New loans,
liquidation and
write-offs, net
|
Transfers
between classes
of loans
|
Sale of loan
portfolio
|
Exchange
differences and
others
|
Balance at
December 31,
2021 |
||||||||||||||||||||||||||||||
| S/(000) |
S/(000) |
S/(000) |
S/(000) |
S/(000) |
S/(000) |
S/(000) |
S/(000) |
S/(000) |
S/(000) |
|||||||||||||||||||||||||||||||
|
Commercial loans
|
|
(
|
)
|
(
|
)
|
|
|
(
|
)
|
|
|
|
|
|||||||||||||||||||||||||||
|
Residential mortgage loans
|
|
(
|
)
|
(
|
)
|
|
|
(
|
)
|
(
|
)
|
|
|
|
||||||||||||||||||||||||||
|
Micro-business loans
|
|
(
|
)
|
(
|
)
|
|
|
(
|
)
|
(
|
)
|
|
|
|
||||||||||||||||||||||||||
|
Consumer loans
|
|
(
|
)
|
(
|
)
|
|
|
(
|
)
|
(
|
)
|
|
|
|
||||||||||||||||||||||||||
|
Total
|
|
(
|
)
|
(
|
)
|
|
|
(
|
)
|
|
|
|
|
|||||||||||||||||||||||||||
|
Stage 3
|
||||||||||||||||||||||||||||||||||||||||
|
Loans by class
|
Balance at
December 31,
2020
|
Transfer to
Stage 1
|
Transfer to
Stage 2
|
Transfer from
Stage 1
|
Transfer from
Stage 2
|
New loans,
liquidation and
write-offs, net
|
Transfers
between classes
of loans
|
Sale of loan
portfolio
|
Exchange
differences and
others
|
Balance at
December 31,
2021
|
||||||||||||||||||||||||||||||
| S/(000) |
S/(000) |
S/(000) |
S/(000) |
S/(000) |
S/(000) |
S/(000) |
S/(000) |
S/(000) |
S/(000) |
|||||||||||||||||||||||||||||||
|
Commercial loans
|
|
(
|
)
|
(
|
)
|
|
|
(
|
)
|
|
(
|
)
|
|
|
||||||||||||||||||||||||||
|
Residential mortgage loans
|
|
(
|
)
|
(
|
)
|
|
|
(
|
)
|
(
|
)
|
(
|
)
|
|
|
|||||||||||||||||||||||||
|
Micro-business loans
|
|
(
|
)
|
(
|
)
|
|
|
(
|
)
|
(
|
)
|
(
|
)
|
|
|
|||||||||||||||||||||||||
|
Consumer loans
|
|
(
|
)
|
(
|
)
|
|
|
(
|
)
|
|
(
|
)
|
|
|
||||||||||||||||||||||||||
|
Total
|
|
(
|
)
|
(
|
)
|
|
|
(
|
)
|
|
(
|
)
|
|
|
||||||||||||||||||||||||||
|
Consolidated 3 Stages
|
||||||||||||||||||||||||||||
|
Loans by class
|
Balance at
December 31,
2020
|
Loan
portfolio
written off
and forgiven
|
New loans and
liquidation, net
|
Transfers
between classes
of loans
|
Sale of loan
portfolio
|
Exchange
differences and
others
|
Balance at
December 31,
2021
|
|||||||||||||||||||||
| S/(000) |
S/(000) |
S/(000) |
S/(000) |
S/(000) |
S/(000) |
S/(000) |
||||||||||||||||||||||
|
Commercial loans
|
|
(
|
)
|
|
|
(
|
)
|
|
|
|||||||||||||||||||
|
Residential mortgage loans
|
|
(
|
)
|
|
(
|
)
|
(
|
)
|
|
|
||||||||||||||||||
|
Micro-business loans
|
|
(
|
)
|
|
(
|
)
|
(
|
)
|
|
|
||||||||||||||||||
|
Consumer loans
|
|
(
|
)
|
|
|
(
|
)
|
|
|
|||||||||||||||||||
|
Total
|
|
(
|
)
|
|
|
(
|
)
|
|
|
|||||||||||||||||||
F-73
| c) |
As of December 31, 2022, and 2021, the allowance for loan losses for direct loans, indirect loans and due from customers on banker’s acceptances, was determined under the expected
credit loss model as established in IFRS 9. The movement in the allowance for loan losses is shown below for direct loans and indirect loans and due from customers on banker’s acceptances is shown below:
|
|
Stage 1
|
||||||||||||||||||||||||||||||||||||||||||||
|
Loans by class
|
Balance at
December 31,
2021
|
Transfer to
Stage 2
|
Transfer to
Stage 3
|
Transfer
from
Stage 2
|
Transfer
from
Stage 3
|
New loans liquidation, and write-
offs, net
|
Changes in
PDs, LGDs,
EADs(*)
|
Transfers
between
classes of
loans
|
Sale of loan
portfolio
|
Exchange
differences
and others
|
Balance at
December
31, 2022
|
|||||||||||||||||||||||||||||||||
| S/(000) | S/(000) | S/(000) | S/(000) | S/(000) | S/(000) | S/(000) | S/(000) | S/(000) | S/(000) | S/(000) | ||||||||||||||||||||||||||||||||||
|
Commercial loans
|
|
(
|
)
|
(
|
)
|
|
|
|
(
|
)
|
(
|
)
|
|
(
|
)
|
|
||||||||||||||||||||||||||||
|
Residential mortgage loans
|
|
(
|
)
|
(
|
)
|
|
|
|
(
|
)
|
|
|
(
|
)
|
|
|||||||||||||||||||||||||||||
|
Micro-business loans
|
|
(
|
)
|
(
|
)
|
|
|
|
(
|
)
|
(
|
)
|
|
(
|
)
|
|
||||||||||||||||||||||||||||
|
Consumer loans
|
|
(
|
)
|
(
|
)
|
|
|
|
(
|
)
|
|
|
(
|
)
|
|
|||||||||||||||||||||||||||||
|
Total
|
|
(
|
)
|
(
|
)
|
|
|
|
(
|
)
|
|
|
(
|
)
|
|
|||||||||||||||||||||||||||||
| Stage 2 | ||||||||||||||||||||||||||||||||||||||||||||
| Loans by class |
Balance at
December 31,
2021 |
Transfer to
Stage 1
|
Transfer to
Stage 3
|
Transfer
from Stage 1
|
Transfer
from
Stage 3
|
New loans liquidation, and write-
offs, net
|
Changes in
PDs, LGDs,
EADs(*)
|
Transfers
between
classes of
loans
|
Sale of loan
portfolio
|
Exchange
differences
and others
|
Balance at
December
31, 2022
|
|||||||||||||||||||||||||||||||||
| S/(000) | S/(000) | S/(000) | S/(000) | S/(000) | S/(000) | S/(000) | S/(000) | S/(000) | S/(000) | S/(000) | ||||||||||||||||||||||||||||||||||
|
Commercial loans
|
|
(
|
)
|
(
|
)
|
|
|
(
|
)
|
|
|
|
(
|
)
|
|
|||||||||||||||||||||||||||||
|
Residential mortgage loans
|
|
(
|
)
|
(
|
)
|
|
|
(
|
)
|
|
|
|
(
|
)
|
|
|||||||||||||||||||||||||||||
|
Micro-business loans
|
|
(
|
)
|
(
|
)
|
|
|
(
|
)
|
|
(
|
)
|
|
(
|
)
|
|
||||||||||||||||||||||||||||
|
Consumer loans
|
|
(
|
)
|
(
|
)
|
|
|
(
|
)
|
|
(
|
)
|
|
(
|
)
|
|
||||||||||||||||||||||||||||
|
Total
|
|
(
|
)
|
(
|
)
|
|
|
(
|
)
|
|
|
|
(
|
)
|
|
|||||||||||||||||||||||||||||
|
Stage 3
|
||||||||||||||||||||||||||||||||||||||||||||
|
Loans by class
|
Balance at
December 31,
2021
|
Transfer to
Stage 1
|
Transfer to
Stage 2
|
Transfer
from
Stage 1
|
Transfer
from
Stage 2
|
New loans liquidation, and write-
offs, net
|
Changes in
PDs, LGDs,
EADs(*)
|
Transfers
between
classes of
loans
|
Sale of loan
portfolio
|
Exchange
differences
and others
|
Balance at
December
31, 2022 |
|||||||||||||||||||||||||||||||||
| S/(000) | S/(000) | S/(000) | S/(000) | S/(000) | S/(000) | S/(000) | S/(000) | S/(000) | S/(000) | S/(000) | ||||||||||||||||||||||||||||||||||
|
Commercial loans
|
|
(
|
)
|
(
|
)
|
|
|
(
|
)
|
|
(
|
)
|
(
|
)
|
(
|
)
|
|
|||||||||||||||||||||||||||
|
Residential mortgage loans
|
|
(
|
)
|
(
|
)
|
|
|
(
|
)
|
|
|
(
|
)
|
(
|
)
|
|
||||||||||||||||||||||||||||
|
Micro-business loans
|
|
(
|
)
|
(
|
)
|
|
|
(
|
)
|
|
|
(
|
)
|
(
|
)
|
|
||||||||||||||||||||||||||||
|
Consumer loans
|
|
(
|
)
|
(
|
)
|
|
|
(
|
)
|
|
|
(
|
)
|
(
|
)
|
|
||||||||||||||||||||||||||||
|
Total
|
|
(
|
)
|
(
|
)
|
|
|
(
|
)
|
|
|
(
|
)
|
(
|
)
|
|
||||||||||||||||||||||||||||
|
Consolidated 3 Stages
|
Credit loss of the period
|
|||||||||||||||||||||||||||||||
|
Balance at
December
31, 2021
|
Loan
portfolio written off
and
forgiven
|
New loans
and
liquidation,
net
|
Changes in
PDs, LGDs,
EADs(*)
|
Transfers
between
classes of
loans
|
Sale of loan
portfolio
|
Exchange
differences
and others
|
Balance at
December
31, 2022 (**)
|
|||||||||||||||||||||||||
|
Loans by class
|
||||||||||||||||||||||||||||||||
| S/(000) | S/(000) | S/(000) | S/(000) | S/(000) | S/(000) | S/(000) | S/(000) | |||||||||||||||||||||||||
|
Commercial loans
|
|
(
|
)
|
(
|
)
|
|
(
|
)
|
(
|
)
|
(
|
)
|
|
|||||||||||||||||||
|
Residential mortgage loans
|
|
(
|
)
|
(
|
)
|
|
|
(
|
)
|
(
|
)
|
|
||||||||||||||||||||
|
Micro-business loans
|
|
(
|
)
|
(
|
)
|
|
(
|
)
|
(
|
)
|
(
|
)
|
|
|||||||||||||||||||
|
Consumer loans
|
|
(
|
)
|
|
|
|
(
|
)
|
(
|
)
|
|
|||||||||||||||||||||
|
Total
|
|
(
|
)
|
(
|
)
|
|
|
(
|
)
|
(
|
)
|
|
||||||||||||||||||||
F-74
|
Stage 1
|
||||||||||||||||||||||||||||||||||||||||||||
|
Loans by class
|
Balance at
December 31,
2020
|
Transfer to
Stage 2
|
Transfer to
Stage 3
|
Transfer
from
Stage 2
|
Transfer
from
Stage 3
|
New loans liquidation, and write-
offs, net
|
Changes in
PDs, LGDs,
EADs(*)
|
Transfers
between
classes of
loans
|
Sale of loan
portfolio
|
Exchange
differences
and others
|
Balance at
December
31, 2021
|
|||||||||||||||||||||||||||||||||
| S/(000) | S/(000) | S/(000) | S/(000) | S/(000) | S/(000) | S/(000) | S/(000) | S/(000) | S/(000) | S/(000) | ||||||||||||||||||||||||||||||||||
|
Commercial loans
|
|
(
|
)
|
(
|
)
|
|
|
(
|
)
|
(
|
)
|
|
|
|
|
|||||||||||||||||||||||||||||
|
Residential mortgage loans
|
|
(
|
)
|
(
|
)
|
|
|
|
(
|
)
|
|
|
|
|
||||||||||||||||||||||||||||||
|
Micro-business loans
|
|
(
|
)
|
(
|
)
|
|
|
|
(
|
)
|
(
|
)
|
|
|
|
|||||||||||||||||||||||||||||
|
Consumer loans
|
|
(
|
)
|
(
|
)
|
|
|
|
(
|
)
|
(
|
)
|
|
|
|
|||||||||||||||||||||||||||||
|
Total
|
|
(
|
)
|
(
|
)
|
|
|
|
(
|
)
|
|
|
|
|
||||||||||||||||||||||||||||||
| Stage 2 | ||||||||||||||||||||||||||||||||||||||||||||
|
Balance at
December 31,
2020
|
Transfer to
Stage 1
|
Transfer to
Stage 3
|
Transfer
from
Stage 1
|
Transfer
from
Stage 3
|
New loans liquidation, and write-
offs, net
|
Changes in
PDs, LGDs,
EADs(*)
|
Transfers
between
classes of
loans
|
Sale of loan
portfolio |
Exchange
differences
and others
|
Balance at
December
31, 2021
|
||||||||||||||||||||||||||||||||||
| Loans by class | ||||||||||||||||||||||||||||||||||||||||||||
| S/(000) | S/(000) | S/(000) | S/(000) | S/(000) | S/(000) | S/(000) | S/(000) | S/(000) | S/(000) | S/(000) | ||||||||||||||||||||||||||||||||||
|
Commercial loans
|
|
(
|
)
|
(
|
)
|
|
|
(
|
)
|
|
|
|
|
|
||||||||||||||||||||||||||||||
|
Residential mortgage loans
|
|
(
|
)
|
(
|
)
|
|
|
|
(
|
)
|
(
|
)
|
|
|
|
|||||||||||||||||||||||||||||
|
Micro-business loans
|
|
(
|
)
|
(
|
)
|
|
|
(
|
)
|
|
(
|
)
|
|
|
|
|||||||||||||||||||||||||||||
|
Consumer loans
|
|
(
|
)
|
(
|
)
|
|
|
(
|
)
|
|
(
|
)
|
|
|
|
|||||||||||||||||||||||||||||
|
Total
|
|
(
|
)
|
(
|
)
|
|
|
(
|
)
|
|
|
|
|
|
||||||||||||||||||||||||||||||
|
Stage 3
|
||||||||||||||||||||||||||||||||||||||||||||
|
|
Balance at
December 31,
2020
|
Transfer to
Stage 1
|
Transfer to
Stage 2
|
Transfer
from
Stage 1
|
Transfer
from
Stage 2
|
New loans liquidation, and write-
offs, net
|
Changes in
PDs, LGDs,
EADs(*)
|
Transfers
between
classes of
loans
|
Sale of loan
portfolio
|
Exchange
differences
and others
|
Balance at
December
31, 2021
|
|||||||||||||||||||||||||||||||||
| Loans by class | ||||||||||||||||||||||||||||||||||||||||||||
| S/(000) | S/(000) | S/(000) | S/(000) | S/(000) | S/(000) | S/(000) | S/(000) | S/(000) | S/(000) | S/(000) | ||||||||||||||||||||||||||||||||||
|
Commercial loans
|
|
(
|
)
|
(
|
)
|
|
|
(
|
)
|
|
(
|
)
|
(
|
)
|
|
|
||||||||||||||||||||||||||||
|
Residential mortgage loans
|
|
(
|
)
|
(
|
)
|
|
|
(
|
)
|
|
(
|
)
|
(
|
)
|
|
|
||||||||||||||||||||||||||||
|
Micro-business loans
|
|
(
|
)
|
(
|
)
|
|
|
(
|
)
|
|
|
(
|
)
|
|
|
|||||||||||||||||||||||||||||
|
Consumer loans
|
|
(
|
)
|
(
|
)
|
|
|
(
|
)
|
|
|
(
|
)
|
|
|
|||||||||||||||||||||||||||||
|
Total
|
|
(
|
)
|
(
|
)
|
|
|
(
|
)
|
|
|
(
|
)
|
|
|
|||||||||||||||||||||||||||||
|
Consolidated 3 Stages
|
Credit loss of the period
|
|||||||||||||||||||||||||||||||
|
Loans by class
|
Balance at
December
31, 2020
|
Loan
portfolio written off
and
forgiven
|
New loans
and
liquidation,
net
|
Changes in
PDs, LGDs,
EADs(*) |
Transfers
between
classes of
loans
|
Sale of loan
portfolio
|
Exchange
differences
and others
|
Balance at
December
31, 2021 (**)
|
||||||||||||||||||||||||
| S/(000) | S/(000) | S/(000) | S/(000) | S/(000) | S/(000) | S/(000) | S/(000) | |||||||||||||||||||||||||
|
Commercial loans
|
|
(
|
)
|
(
|
)
|
|
|
(
|
)
|
|
|
|||||||||||||||||||||
|
Residential mortgage loans
|
|
(
|
)
|
(
|
)
|
|
(
|
)
|
(
|
)
|
|
|
||||||||||||||||||||
|
Micro-business loans
|
|
(
|
)
|
|
|
(
|
)
|
(
|
)
|
|
|
|||||||||||||||||||||
|
Consumer loans
|
|
(
|
)
|
(
|
)
|
|
(
|
)
|
(
|
)
|
|
|
||||||||||||||||||||
|
Total
|
|
(
|
)
|
(
|
)
|
|
|
(
|
)
|
|
|
|||||||||||||||||||||
F-75
| (*) |
|
|
|
|
|
|
|
|
|
|
|
|
|
| (**) |
|
Gross balance of the direct and indirect credit portfolio and bank acceptances:
At the end of December
2022, the gross balance of the loan portfolio decreased in relation to the end of December 2021. The decrease was mainly due to (i) the amortization of the Reactiva Peru loans in Comerciales BCP, (ii) the write-offs in Consumption BCP
and Pequeña y Microempresa Mibanco Perú, and (iii) the drop in the exchange rate. The aforementioned effects were partially offset by the increase in disbursements in Pequeña y Microempresa Mibanco Perú, Consumo BCP and Hipotecario BCP.
Allowance for credit loss for direct and indirect loans and bank acceptances:
At the end of December 2022, the provision for credit loss of the loan portfolio decreased in relation to the end of December
2021. This decrease was mainly due to the flow of write-offs carried out during 2022, which mainly impacted the BCP consumer segment and to the small and microenterprise segment in both BCP and Mibanco Perú; In addition, it was due,
although to a lesser extent, to the decrease in the US$/Sol exchange rate. The above effects were partially offset by the deterioration of the macroeconomic component, which had a greater impact on the consumer and small and
microenterprise segments at BCP, and by entering segments of greater profitability and risk in small and microenterprises at BCP.
| d) |
Interest rates on loans are set considering the rates prevailing in the markets where the Group’s subsidiaries operate.
|
| e) |
A portion of the loan portfolio is collateralized with guarantees received from customers, which mainly consist of mortgages, bonds, securities and industrial and
mercantile pledges.
|
F-76
| f) |
The following table presents the gross direct loan portfolio as of December 31, 2022, and 2021 by maturity based on the remaining period to the payment due date:
|
|
2022
|
2021
|
|||||||
| S/(000) | S/(000) |
|
||||||
|
Outstanding loans -
|
||||||||
|
From 1 to 3 months
|
|
|
||||||
| From 3 months to 1 year |
||||||||
|
From 1 to 3 years
|
|
|
||||||
|
From 3 to 5 years
|
|
|
||||||
| From 5 to 15 years |
||||||||
|
More than 15 years
|
|
|
||||||
|
|
|
|||||||
|
Internal overdue loans -
|
||||||||
|
Overdue up to 90 days
|
|
|
||||||
|
Over 90 days
|
|
|
||||||
|
|
|
|||||||
|
Total
|
|
|
||||||
See credit risk analysis in Note 34.1.
| 8 |
FINANCIAL ASSETS DESIGNATED AT FAIR VALUE THROUGH PROFIT OR LOSS
|
The composition of the item is presented below:
|
|
2022
|
|
|
2021
|
|
|||
|
|
S/(000)
|
|
|
S/(000)
|
|
|||
|
|
|
|
|
|
|
|
|
|
| Investment Link (a) |
|
|
|
|
|
|
|
|
|
Other
|
|
|
|
|
|
|
|
|
|
Total
|
|
|
|
|
|
|
|
|
|
(a)
|
|
F-77
The profit
resulting from the Investment Link is shown in “Net premiums earned” in the consolidated statement of income. The composition of the generated returns is presented below:
|
|
2022
|
2021
|
2020
|
|||||||||
|
|
S/(000)
|
|
S/(000)
|
|
S/(000)
|
|
||||||
|
|
||||||||||||
|
Net profit on sale and fluctuations of financial investments (i)
|
(
|
)
|
|
|
||||||||
|
Dividends, interests and others
|
|
|
|
|||||||||
|
Total, Note 25 (a)
|
(
|
)
|
|
|
||||||||
| (i) |
|
The lower prices of food, energy, ocean freight, and rentals in the United States of America were reflected in the latest total inflation figures for October, November and December 2022, reaching records of 7.7 percent, 7.1 percent and
6.5 percent, respectively. The fall in investment prices is affected by the local and European economic environment and the
increase in the reference rate of the FED.
The offsetting of this effect is included in the technical reserve adjustment, which is part of the item “Net premiums earned” of the consolidated statement of income, see note 25 (a).
| 9 |
ACCOUNTS RECEIVABLE AND PAYABLE FROM INSURANCE CONTRACTS
|
| a) |
As of December 31, 2022 and 2021, “Premiums and other policies receivable” in the
consolidated statement of financial position includes balances for approximately S/
|
| b) |
The movements of the captions “Accounts receivable and payable to reinsurers and coinsurers” are as follows:
|
Accounts receivable:
|
2022
|
2021
|
2020
|
||||||||||
| S/(000 | ) | S/(000 | ) | S/(000 | ) | |||||||
|
Balances as of January 1
|
|
|
|
|||||||||
|
Reported claims of premiums ceded, Note 26
|
|
|
|
|||||||||
|
Reserve risk in progress of premiums ceded, Note 25(a)(**),(i)
|
(
|
)
|
|
|
||||||||
|
Premiums assumed
|
|
|
|
|||||||||
|
Settled claims of premiums ceded by reinsurance contracts
|
(
|
)
|
(
|
)
|
(
|
)
|
||||||
|
Collections and others, net (ii)
|
(
|
)
|
(
|
)
|
|
|||||||
|
Balances at the end of the period
|
|
|
|
|||||||||
As of December
31, 2022 and 2021 accounts receivable include S/76.1 million and S/299.0 million, respectively, which correspond to the technical reserves of the ceded portion of premiums to reinsurers.
F-78
| (i) |
|
| (ii) |
|
Accounts Payable:
| |
2022
|
2021
|
2020
|
|||||||||
| S/(000) | S/(000) | S/(000) | ||||||||||
|
Balances as of January 1
|
|
|
|
|||||||||
|
Premiums ceded for automatic contracts (mainly excess of loss), Note 25(a)(**)
|
|
|
|
|||||||||
|
Premiums ceded to reinsurers in facultative contracts, Note 25(a)(**)
|
|
|
|
|||||||||
|
Coinsurance granted
|
|
|
|
|||||||||
|
Payments and other, net (i)
|
(
|
)
|
(
|
)
|
(
|
)
|
||||||
|
Balances at the end of the period
|
|
|
|
|||||||||
Accounts payable to reinsurers are primarily related to proportional facultative contracts (on an individual basis) for
ceded premiums, automatic non-proportional contracts (excess loss) and reinstallation premiums. For facultative contracts the Group transfers to the reinsurers a percentage or an amount of an insurance contract or individual risk, based
on the premium and the coverage period.
| (i) | |
F-79
| 10 |
PROPERTY, FURNITURE AND EQUIPMENT, NET
|
| a) |
The movement of property, furniture and equipment and accumulated depreciation, for the
years ended December 31, 2022, 2021, and 2020 is as follows:
|
|
Land
|
Buildings and
other
constructions
|
Installations
|
Furniture
and fixtures
|
Computer
hardware
|
Vehicles
and
equipment
|
Work in
progress
|
2022
|
2021
|
2020
|
|||||||||||||||||||||||||||||||
| S/(000) | S/(000) | S/(000) | S/(000) | S/(000) | S/(000) | S/(000) | S/(000) | S/(000) | S/(000) | |||||||||||||||||||||||||||||||
|
Cost -
|
||||||||||||||||||||||||||||||||||||||||
|
Balance as of January 1
|
|
|
|
|
|
|
|
|
|
|
||||||||||||||||||||||||||||||
|
Additions
|
|
|
|
|
|
|
|
|
|
|
||||||||||||||||||||||||||||||
|
Acquisition of business
|
|
|
|
|
|
|
|
|
|
|
||||||||||||||||||||||||||||||
|
Transfers
|
|
|
|
|
|
|
(
|
)
|
|
|
|
|||||||||||||||||||||||||||||
|
Disposal, derecognition and others
|
(
|
)
|
(
|
)
|
(
|
)
|
(
|
)
|
(
|
)
|
(
|
)
|
(
|
)
|
(
|
)
|
(
|
)
|
(
|
)
|
||||||||||||||||||||
|
Balance as of December 31
|
|
|
|
|
|
|
|
|
|
|
||||||||||||||||||||||||||||||
|
Accumulated depreciation -
|
||||||||||||||||||||||||||||||||||||||||
|
Balance as of January 1
|
|
|
|
|
|
|
|
|
|
|
||||||||||||||||||||||||||||||
|
Depreciation of the period
|
|
|
|
|
|
|
|
|
|
|
||||||||||||||||||||||||||||||
|
Acquisition of business
|
|
|
|
|
|
|
|
|
|
|
||||||||||||||||||||||||||||||
|
Transfers
|
|
|
|
|
|
|
|
|
|
|
||||||||||||||||||||||||||||||
|
Disposals and others
|
|
(
|
)
|
(
|
)
|
(
|
)
|
(
|
)
|
(
|
)
|
|
(
|
)
|
(
|
)
|
(
|
)
|
||||||||||||||||||||||
|
Balance as of December 31
|
|
|
|
|
|
|
|
|
|
|
||||||||||||||||||||||||||||||
|
Net carrying amount
|
|
|
|
|
|
|
|
|
|
|
||||||||||||||||||||||||||||||
Banks, financial institutions, and insurance entities that operate in Peru cannot pledge their fixed assets.
During the year 2022, the administration, as part of the investment in fixed assets, has made disbursements related mainly to the
purchase of furniture and fixtures, for the conditioning and remodeling of its various agencies and administrative offices. Likewise, during 2021, as part of the investment in fixed assets that it makes annually, it has made
disbursements related mainly to the remodeling of its headquarters located in La Molina, San Pedro office, Lima office. During 2020, the Bank has made disbursements related mainly to the remodeling of its headquarters located in La
Molina and the comprehensive remodeling of the Café Dasso office.
During
the year 2022, Management decided to sell various properties, mainly land and buildings, whose approximate sale price was S/46.1
million, with a cost of S/33.8 million. During the year 2021, Management decided to sell various properties, mainly land and
buildings, whose approximate sale price was S/14.2 million, with a cost of S/7.9 million. During the year 2020, Management decided to carry out the sale of real estate, the main one being the property located on Av. Francisco Bolognesi,
district of Chimbote, department of Ancash and the second property located on Ayabaca street, district and province of Ica, whose sale price of both properties amounted to S/3.3 million.
The
subsidiaries of Credicorp Ltd. maintain insurance on their main assets in accordance with the policies established by Management.
Management
periodically reviews the residual value, the useful life and the depreciation method used of the Group's property, furniture and equipment; in order to ensure that these are consistent with their current economic benefit and life
expectancy. In Management's opinion, as of December 31, 2022 and December 31, 2021, and 2020, there is no evidence of impairment of the Group's property, furniture and equipment.
F-80
| 11 |
INTANGIBLE ASSETS AND GOODWILL, NET
|
| a) |
Intangible assets –
|
The movement of intangible assets with limited useful life for the years ended December 31, 2022, 2021 and 2020 was as follows:
|
Description
|
Client
relationships
(i)
|
Brand
name (ii)
|
Fund
manager
contract (iii)
|
Relationships
with holders
|
Software and
developments
|
Intangible
in
progress
|
Other
|
2022
|
2021
|
2020
|
||||||||||||||||||||||||||||||
| S/(000) | S/(000) | S/(000) | S/(000) | S/(000) | S/(000) | S/(000) | S/(000) | S/(000) | S/(000) | |||||||||||||||||||||||||||||||
|
Cost -
|
||||||||||||||||||||||||||||||||||||||||
|
Balances at January 1
|
|
|
|
|
|
|
|
|
|
|
||||||||||||||||||||||||||||||
|
Additions
|
|
|
|
|
|
|
|
|
|
|
||||||||||||||||||||||||||||||
|
Acquisition of business
|
|
|
|
|
|
|
|
|
|
|
||||||||||||||||||||||||||||||
|
Transfers
|
|
|
|
|
|
(
|
)
|
|
|
|
|
|||||||||||||||||||||||||||||
|
Disposals and others
|
(
|
)
|
|
(
|
)
|
|
(
|
)
|
(
|
)
|
(
|
)
|
(
|
)
|
(
|
)
|
(
|
)
|
||||||||||||||||||||||
|
Balance as of December 31
|
|
|
|
|
|
|
|
|
|
|
||||||||||||||||||||||||||||||
|
Accumulated amortization -
|
||||||||||||||||||||||||||||||||||||||||
|
Balance at January 1
|
|
|
|
|
|
|
|
|
|
|
||||||||||||||||||||||||||||||
|
Amortization of the period
|
|
|
|
|
|
|
|
|
|
|
||||||||||||||||||||||||||||||
|
Disposals and others
|
(
|
)
|
|
(
|
)
|
|
(
|
)
|
|
(
|
)
|
(
|
)
|
(
|
)
|
(
|
)
|
|||||||||||||||||||||||
|
Balance as of December 31
|
|
|
|
|
|
|
|
|
|
|
||||||||||||||||||||||||||||||
|
Net carrying amount
|
|
|
|
|
|
|
|
|
|
|
||||||||||||||||||||||||||||||
During 2022, the Group has made disbursements related mainly to the implementation and development of various IT projects such as Cubo -
Mis Financiero, Yape, DataLake - Data Vault, IFRS 9 Strategic Tool, Office Banking, Visio Plus, among others. During 2021, the Group has made disbursements related mainly to the implementation and development of various IT projects such
as Data Lake - Data Vault, Mobile Banking I14, Telephone Banking by voice call I15 and improvements in Yape, among others. During 2020, the Group has made disbursements related mainly to the implementation and development of various IT
projects such as Identify Access Management, Two-way Communication for Fraud alerts, HomeBanking 2.0, among others.
In Management's opinion, as of December 31, 2022, 2021
and 2020, the net book value of intangibles does not exceed their recoverable value.
F-81
| (i) |
Client relationships -
|
This item consists of the following:
|
2022
|
2021
|
|||||||
| S/(000) |
|
S/(000) |
|
|||||
|
Prima AFP - AFP Unión Vida
|
|
|
||||||
|
Credicorp Capital Holding Chile - Inversiones IMT
|
|
|
||||||
|
Ultraserfinco S.A
|
|
|
||||||
|
Tenpo
|
|
|
||||||
|
Culqi
|
|
|
||||||
|
Net carrying amount
|
|
|
||||||
| (ii) |
Brand name -
|
This item consists of the following:
|
2022
|
2021
|
|||||||
| S/(000) |
|
S/(000) |
|
|||||
|
MiBanco
|
|
|
||||||
|
Culqi
|
|
|
||||||
|
Net carrying amount
|
|
|
||||||
| (iii) |
Fund management contract -
|
This item consists of the following:
|
2022
|
2021
|
|||||||
| S/(000) |
|
S/(000) |
|
|||||
|
Credicorp Capital Colombia
|
|
|
||||||
|
Credicorp Capital Holding Chile - Inversiones IMT
|
|
|
||||||
|
Ultraserfinco S.A.
|
|
|
||||||
|
Net carrying amount
|
|
|
||||||
Management has assessed at each reporting date that there was no indication that customer relationships, brand name, fund management
contract and software and developments may be impaired.
F-82
| b) |
Goodwill -
|
Goodwill acquired through business combinations has been allocated to each subsidiary or groups of them, which are also identified as a
CGU for the purposes of impairment testing, as follows:
|
2022
|
2021
|
|||||||
| S/(000) |
|
S/(000) |
|
|||||
|
MiBanco - Edyficar Perú
|
|
|
||||||
| Prima AFP - AFP Unión Vida | ||||||||
|
MiBanco Colombia
|
|
|
||||||
|
Credicorp Capital Colombia
|
|
|
||||||
|
Banco de Crédito del Perú
|
|
|
||||||
|
Pacífico Seguros
|
|
|
||||||
|
Atlantic Security Holding Corporation
|
|
|
||||||
| Wally POS S.A |
||||||||
|
Tenpo SpA
|
|
|
||||||
|
Tenpo Prepago S.A.
|
|
|
||||||
|
Compañía Incubadora de Soluciones Móviles S.A-Culqi
|
|
|
||||||
|
Crediseguro Seguros Personales
|
|
|
||||||
|
Net carrying amount
|
|
|
||||||
The recoverable amount of all of the CGUs has been determined based in the present value of the discounted cash flows or dividends
determined principally with assumptions of revenue and expenses projection (based on efficiency ratios).
Goodwill balance of Mibanco Colombia, Credicorp Capital Colombia S.A, Tenpo SPA and Tenpo Technologies SpA. is affected by the volatility
effect of the local exchange rate currency of the country in which they operate against the exchange rate of functional currency of Credicorp Ltd. and subsidiaries.
As of December 31, 2022 the group has evaluated the impairment of goodwill by making an estimate based on the information available,
concluding that there is no evidence of impairment at said date; therefore, during the twelve - month period ended December 31, 2022, and December 31, 2021, the Group did no
F-83
The following table summarizes the key assumptions used for the calculation of fair value less selling costs in 2022 and 2021:
|
2022
|
||||||||
|
Description
|
Terminal
value growth
rate
|
Discount rate
|
||||||
|
%
|
%
|
|||||||
|
Mibanco - Edyficar Perú
|
|
|
||||||
|
Prima AFP - AFP Unión Vida
|
|
|
||||||
| Mibanco Colombia |
||||||||
|
Credicorp Capital Colombia
|
|
|
||||||
|
Banco de Crédito del Perú
|
|
|
||||||
|
Pacífico Seguros (*)
|
|
|
||||||
|
Atlantic Security Holding Corporation
|
|
|
||||||
|
Tenpo (**)
|
|
|
||||||
|
Compañía Incubadora de Soluciones Móviles S.A. - Culqi
|
|
|
||||||
|
2021
|
||||||||
|
Description
|
Terminal
value growth
rate
|
Discount rate
|
||||||
|
%
|
%
|
|||||||
|
Mibanco - Edyficar Perú
|
|
|
||||||
|
Prima AFP - AFP Unión Vida
|
|
|
||||||
| MiBanco - Colombia |
||||||||
|
Credicorp Capital Colombia
|
|
|
||||||
|
Banco de Crédito del Perú
|
|
|
||||||
|
Pacífico Seguros (*)
|
|
|
||||||
|
Atlantic Security Holding Corporation
|
|
|
||||||
| Tenpo (**) | ||||||||
| Compañía Incubadora de Soluciones Móviles S.A - Culqi | ||||||||
(*) As of
December 31, 2022, and 2021, it comprises to the discount rates used to determine the recoverable value of the cash flows that correspond to the general and life insurance business lines.
(**) As
of December 31,2022, and 2021, it comprises to the discount rates corresponds to the discount rates used to determine the recoverable value of the flows that correspond to the business lines of Tenpo SpA and Tenpo Technologie SpA.
Five or ten years of cash flows, depending on the business maturity, were included in the discounted cash flow model. The growth rate
estimates are based on historic performance and management’s expectations of market development. A long-term growth rate to perpetuity has been determined taking into account forecasts included in industry reports.
Growth rates used this year are considering mainly two points of prices adjustments compared to 2021: (1) the update of long-term
inflation expectations and (2) the update of businesses growth expectations (this one is the case of the microfinance companies).
F-84
Discount rates represent the current market assessment of the specific risks to each CGU. The discount rate is derived from the capital
asset pricing model (CAPM). The cost of equity is derived from the expected return on investment by the Group’s investors, specific risk incorporated by applying individual comparable beta factors. The discount rates used in 2022 are
higher than previous year level. This increase is explained by the update of the discount rates parameters. The biggest adjustments are mainly related to the increase of the free risk discount rate; the difference of inflation between the
economies where the analyzed vehicles operate, and United States, and the higher perceived risk in the region (incorporated in the rate as a bigger country risk)
The valuation includes assumptions about several key parameters of the entities. The parameter sensitivity exercises, growth and discount
rates mainly, show scenarios in which said value is higher, and some scenarios with a non-material impairment in assets value. We consider that the amounts presented in the financial statements are appropriate and do not require any
provision for impairment of our investments, given the accuracy of the assumptions with the information available at this time; considering that the valuation process occurs in an environment of high rates and with no signs of growth
contraction.
For entities with high risk of impairment, it is estimated that a change of up to 0.5 percent in the growth rate assumption and up to 0.5
percent in the discount rate assumption by 2022 (maintaining all other assumptions constant) would result in a decrease in the recoverable value of between S/13.0 million and S/45.8 million, which would generate non-material impairment.
The key assumptions described above may change if the conditions of the economy and market change. As of December 31, 2022 and 2021 the
Group estimates that reasonably possible changes in these assumptions would not cause the recoverable amount of all CGUs to decline below their carrying amount.
F-85
| 12 |
RIGHT-OF-USE ASSETS, NET AND LEASE OBLIGATIONS
|
| a) |
Right-of-use
|
The Group has leased agreements according to the following composition:
|
Property:
Agencies and
offices
|
Servers and
technology
platforms
|
Transport
units
|
Other leases
|
2022 |
2021
|
2020
|
||||||||||||||||||||||
|
S/(000)
|
|
S/(000)
|
|
S/(000)
|
|
S/(000)
|
|
S/(000) |
S/(000)
|
|
S/(000)
|
|
||||||||||||||||
|
Cost -
|
||||||||||||||||||||||||||||
|
Balance as of January 1,
|
|
|
|
|
|
|
||||||||||||||||||||||
|
Additions
|
|
|
|
|
|
|
||||||||||||||||||||||
|
Disposal and others
|
(
|
)
|
(
|
)
|
(
|
)
|
|
( |
) |
(
|
)
|
(
|
)
|
|||||||||||||||
|
Balance as of December 31
|
|
|
|
|
|
|
||||||||||||||||||||||
|
Accumulated depreciation -
|
||||||||||||||||||||||||||||
|
Balance as of January 1,
|
|
|
|
|
|
|
||||||||||||||||||||||
|
Depreciation of the period
|
|
|
|
|
|
|
||||||||||||||||||||||
|
Disposal and others
|
(
|
)
|
(
|
)
|
(
|
)
|
|
( |
) |
(
|
)
|
(
|
)
|
|||||||||||||||
|
Balance as of December 31
|
|
|
|
|
|
|
||||||||||||||||||||||
|
Net carrying amount
|
|
|
|
|
|
|
||||||||||||||||||||||
| b) |
Lease Liabilities
|
The Group maintains contracts, with certain renewal options and for which the Group has reasonable certainty that this option will be
exercised. In those cases, the period of lease used to measure the liability and assets corresponds to an estimation of future renovations.
F-86
| 13 |
OTHER ASSETS AND OTHER LIABILITIES
|
| a) |
This item consists of the following:
|
|
2022
|
2021
|
|||||||
|
S/(000)
|
|
S/(000)
|
|
|||||
|
Other assets -
|
||||||||
|
Financial instruments:
|
||||||||
|
Receivables (b)
|
|
|
||||||
|
Derivatives receivable (c)
|
|
|
||||||
| Operations in process (d) | ||||||||
|
Receivables from sale of investments (e)
|
|
|
||||||
|
|
|
|||||||
|
Non-financial instruments:
|
||||||||
|
Deferred fees (f)
|
|
|
||||||
|
Investment in associates (g)
|
|
|
||||||
|
Investment properties, net (h)
|
|
|
||||||
|
Income tax prepayments, net
|
|
|
||||||
|
Adjudicated assets, net
|
|
|
||||||
|
Improvements in leased premises
|
|
|
||||||
|
VAT (IGV) tax credit
|
|
|
||||||
|
Others
|
|
|
||||||
|
|
|
|||||||
|
Total
|
|
|
||||||
|
2022
|
2021
|
|||||||
|
S/(000)
|
|
S/(000)
|
|
|||||
|
Other liabilities -
|
||||||||
|
Financial instruments:
|
||||||||
|
Accounts payable (i)
|
|
|
||||||
| Derivatives payable (c) | ||||||||
|
Salaries and other personnel expenses
|
|
|
||||||
|
Allowance for indirect loan losses, Note 7(c)
|
|
|
||||||
| Accounts payable for acquisitions (e) | ||||||||
|
Operations in process (d)
|
|
|
||||||
| Dividends payable | ||||||||
|
|
|
|||||||
|
Non-financial instruments:
|
||||||||
|
Provision for sundry risks (j)
|
|
|
||||||
| Taxes | ||||||||
|
Others
|
|
|
||||||
|
|
|
|||||||
|
Total
|
|
|
||||||
F-87
|
|
b) |
|
F-88
| c) |
|
As of December 31, 2022, and 2021 the table below shows the fair value of derivative financial instruments, recorded as an asset or a
liability, together with their nominal amounts and maturities. The nominal amount, recorded gross, is the amount of a derivative’s underlying asset and is the basis upon which the fair value of derivatives is measured.
|
2022
|
2021
|
2022 and 2021
|
|||||||||||||||||||||||||||||||||
|
Assets
|
Liabilities
|
Nominal amount
|
Maturity
|
Assets
|
Liabilities
|
Nominal amount
|
Maturity
|
Related instruments
|
|||||||||||||||||||||||||||
|
S/(000)
|
|
S/(000)
|
|
S/(000)
|
|
S/(000)
|
|
S/(000)
|
|
S/(000)
|
|
||||||||||||||||||||||||
|
Derivatives held for trading (i) -
|
|||||||||||||||||||||||||||||||||||
|
Foreign currency forwards
|
|
|
|
|
|
|
|
|
–
|
||||||||||||||||||||||||||
|
Interest rate swaps
|
|
|
|
|
|
|
|
|
–
|
||||||||||||||||||||||||||
|
Currency swaps
|
|
|
|
|
|
|
|
|
–
|
||||||||||||||||||||||||||
|
Foreign exchange options
|
|
|
|
|
|
|
|
|
–
|
||||||||||||||||||||||||||
|
Futures
|
|
|
|
|
|
|
|
|
–
|
||||||||||||||||||||||||||
|
|
|
|
|
|
|
||||||||||||||||||||||||||||||
|
Derivatives held as hedges (ii)
|
|||||||||||||||||||||||||||||||||||
|
Cash flow hedges -
|
|||||||||||||||||||||||||||||||||||
|
Cross currency swaps (CCS)
|
17(a)(ii)
|
|
|
|
|
|
|
|
|
|
|||||||||||||||||||||||||
|
Cross currency swaps (CCS)
|
5(c)(i)
|
|
|
|
|
|
|
|
|
|
|||||||||||||||||||||||||
|
Cross currency swaps (CCS)
|
17(a)(vi)
|
|
|
|
|
|
|
|
|
|
|||||||||||||||||||||||||
|
Cross currency swaps (CCS)
|
6(b)(i)(v)
|
|
|
|
|
|
|
|
|
|
|||||||||||||||||||||||||
|
Cross currency swaps (CCS)
|
|
|
|
|
|
|
|
|
-
|
|
|||||||||||||||||||||||||
|
Cross currency swaps (CCS)
|
5(c)(ii) | ||||||||||||||||||||||||||||||||||
|
Interest rate swaps (IRS)
|
17(a)(v) |
|
|||||||||||||||||||||||||||||||||
|
Fair value hedges -
|
|||||||||||||||||||||||||||||||||||
|
Interest rate swaps (IRS)
|
6(b)
|
|
|
|
|
|
|
|
|
|
|||||||||||||||||||||||||
|
|
|
|
|
|
|
||||||||||||||||||||||||||||||
|
|
|
|
|
|
|
||||||||||||||||||||||||||||||
| (*) |
|
F-89
| (i) |
Held-for-trading derivatives are principally negotiated to satisfy customers’ needs. On the other hand, the Group may also take positions with the expectation of profiting from favorable
movements in prices or rates. Also, this caption includes any derivatives which do not comply with IFRS 9 hedge accounting requirements. Fair value of derivatives held for trading classified by contractual maturity is as follows:
|
|
2022
|
2021
|
|||||||||||||||||||||||||||||||||||||||||||||||
|
Up to 3
months
|
From 3 months
to 1 year
|
From 1 to 3
years
|
From 3 to 5
years
|
Over 5
years
|
Total
|
Up to 3
months
|
From 3 months
to 1 year
|
From 1 to 3
years
|
From 3 to 5
years
|
Over 5
years
|
Total
|
|||||||||||||||||||||||||||||||||||||
|
S/(000)
|
|
S/(000)
|
|
S/(000)
|
|
S/(000)
|
|
S/(000)
|
|
S/(000)
|
|
S/(000)
|
|
S/(000)
|
|
S/(000)
|
|
S/(000)
|
|
S/(000)
|
|
S/(000)
|
|
|||||||||||||||||||||||||
|
Foreign currency forwards
|
|
|
(
|
|
|
|
|
|
|
|
|
|
||||||||||||||||||||||||||||||||||||
|
Interest rate swaps
|
|
|
|
|
|
|
|
|
|
|
|
|
||||||||||||||||||||||||||||||||||||
|
Currency swaps
|
|
|
|
|
|
|
|
|
|
|
|
|
||||||||||||||||||||||||||||||||||||
|
Foreign exchange options
|
|
|
|
|
|
|
|
|
|
|
|
|
||||||||||||||||||||||||||||||||||||
|
Futures
|
|
|
|
|
|
|
|
|
|
|
|
|
||||||||||||||||||||||||||||||||||||
|
Total assets
|
|
|
|
|
|
|
|
|
|
|
|
|
||||||||||||||||||||||||||||||||||||
| 2022 | 2021 | |||||||||||||||||||||||||||||||||||||||||||||||
|
Up to 3
months
|
From 3 months
to 1 year
|
From 1 to 3
years
|
From 3 to 5
years
|
Over 5
years
|
Total
|
Up to 3
months
|
From 3 months
to 1 year
|
From 1 to 3
years
|
From 3 to 5
years
|
Over 5
years
|
Total
|
|||||||||||||||||||||||||||||||||||||
|
S/(000)
|
|
S/(000)
|
|
S/(000)
|
|
S/(000)
|
|
S/(000)
|
|
S/(000)
|
|
S/(000)
|
|
S/(000)
|
|
S/(000)
|
|
S/(000)
|
|
S/(000)
|
|
S/(000)
|
|
|||||||||||||||||||||||||
|
Foreign currency forwards
|
|
|
|
|
|
|
|
|
|
|
|
|
||||||||||||||||||||||||||||||||||||
|
Interest rate swaps
|
|
|
|
|
|
|
|
|
|
|
|
|
||||||||||||||||||||||||||||||||||||
|
Currency swaps
|
|
|
|
|
|
|
|
|
|
|
|
|
||||||||||||||||||||||||||||||||||||
|
Foreign exchange options
|
|
|
|
|
|
|
|
|
|
|
|
|
||||||||||||||||||||||||||||||||||||
|
Futures
|
|
|
|
|
|
|
|
|
|
|
|
|
||||||||||||||||||||||||||||||||||||
|
Total liabilities
|
|
|
|
|
|
|
|
|
|
|
|
|
||||||||||||||||||||||||||||||||||||
| (ii) |
The Group is exposed to
variability in future cash flows on assets and liabilities in foreign currency and/or those that bear interest at variable rates. The Group uses derivative financial instruments as cash flow hedges to cover these risks.
|
A schedule indicating the periods when the current cash flow hedges are expected to occur and affect the consolidated statement of income,
net of deferred income tax is presented below:
|
2022
|
2021
|
|||||||||||||||||||||||||||||||||||||||
|
Up to 1 year
|
From 1 to 3 years
|
From 3 to 5 years
|
Over 5 years
|
Total
|
Up to 1 year
|
From 1 to 3 years
|
From 3 to 5 years
|
Over 5 years
|
Total
|
|||||||||||||||||||||||||||||||
|
S/(000)
|
|
S/(000)
|
|
S/(000)
|
|
S/(000)
|
|
S/(000)
|
|
S/(000)
|
|
S/(000)
|
|
S/(000)
|
|
S/(000)
|
|
S/(000)
|
|
|||||||||||||||||||||
|
Cash inflows (assets)
|
|
|
|
|
|
|
|
|
|
|
||||||||||||||||||||||||||||||
|
Cash outflows (liabilities)
|
(
|
)
|
(
|
)
|
(
|
)
|
|
(
|
)
|
(
|
)
|
(
|
)
|
(
|
)
|
|
(
|
)
|
||||||||||||||||||||||
|
Consolidated statement of income
|
|
(
|
)
|
|
|
|
(
|
)
|
(
|
)
|
|
|
(
|
)
|
||||||||||||||||||||||||||
As of December 31, 2022 the accumulated balance of the net unrealized result from cash flow hedges, which is presented as other
comprehensive income in the caption " Cash flow hedge reserves ", results from current hedges that have an unrealized gain of approximately S/0.2
million (unrealized loss of approximately S/0.3 million for current hedges and an unrealized loss of 0.7 million for revoked hedges, as of December 31, 2021), which has been realized in the consolidated statements of income during the term of
the underlying financial instrument. Likewise, the transfer of the unrealized loss of cash flow hedges to the consolidated statement of income is presented in note 18(c).
F-90
| d) |
|
| e) |
|
| f) |
|
| g) |
|
| h) |
|
The movement of investment properties is as follows:
|
2022
|
2021
|
|||||||||||||||
|
Land
|
Buildings
|
Total
|
Total
|
|||||||||||||
|
S/(000)
|
|
S/(000)
|
|
S/(000)
|
|
S/(000)
|
|
|||||||||
|
Cost
|
||||||||||||||||
|
Balance at January 1
|
|
|
|
|
||||||||||||
|
Additions (i)
|
|
|
|
|
||||||||||||
|
Disposals and others
|
(
|
)
|
(
|
)
|
(
|
)
|
|
|||||||||
|
Balance at December 31
|
|
|
|
|
||||||||||||
|
Accumulated depreciation
|
||||||||||||||||
|
Balance at January 1
|
|
|
|
|
||||||||||||
|
Depreciation for the period
|
|
|
|
|
||||||||||||
|
Disposals and others
|
|
(
|
)
|
(
|
)
|
|
||||||||||
|
Balance at December 31
|
|
|
|
|
||||||||||||
|
Impairment losses (ii)
|
|
|
|
|
||||||||||||
|
Net carrying amount
|
|
|
|
|
||||||||||||
Land and buildings are mainly used for office rental, which are free of all encumbrances.
| (i) |
|
| (ii) |
|
F-91
As
of December 31, 2022 and 2021, the market value of the properties amounts to approximately S/1,206.5 million and S/1,244.1 million, respectively; which was determined through a valuation made by an independent appraiser.
| i) |
|
| j) |
|
|
2022
|
2021
|
2020
|
||||||||||
|
S/(000)
|
|
S/(000)
|
|
S/(000)
|
|
|||||||
|
Balance at the beginning of the year
|
|
|
|
|||||||||
|
Allowance, Note 29
|
|
|
|
|||||||||
|
(Decrease) increase, net
|
(
|
)
|
|
|
||||||||
|
Balances at the end of the year
|
|
|
|
|||||||||
Because of the nature of its business, the Group has various pending lawsuits, which allowances are recorded when, in Management’s and its
in-house legal advisors opinion, it is likely that these may result in an additional liability and such amount can be reliably estimated. Regarding lawsuits against the Group which have not been recorded as an allowance, in Management’s
and its in-house legal advisors opinion, they will not result in an additional liability other than those recorded previously and they will not have a material effect on the Group’s consolidated financial statements.
F-92
| 14 |
DEPOSITS AND OBLIGATIONS
|
| a) |
This item consists of the following:
|
|
2022
|
2021
|
|||||||
|
S/(000)
|
|
S/(000)
|
|
|||||
|
Saving deposits
|
|
|
||||||
|
Demand deposits
|
|
|
||||||
|
Time deposits (c)
|
|
|
||||||
|
Severance indemnity deposits
|
|
|
||||||
|
Bank’s negotiable certificates
|
|
|
||||||
|
Total
|
|
|
||||||
|
Interest payable
|
|
|
||||||
|
Total
|
|
|
||||||
The Group has established a policy to remunerate demand deposits and savings accounts according to a growing interest rate scale, based on
the average balance maintained in those accounts. On the other hand, according to its policy, balances that are lower than a specified amount for each type of account do not bear interest. Also, time deposits earn interest at market
rates.
Interest rates are determined by the Group considering the interest rates prevailing in the market in which each of the Group’s
subsidiaries operates.
| b) |
The amounts of non-interest-bearing and interest-bearing deposits and obligations are presented below:
|
|
2022
|
2021
|
|||||||
|
S/(000)
|
|
S/(000)
|
|
|||||
|
Non-interest-bearing -
|
||||||||
|
In Peru
|
|
|
||||||
|
In other countries
|
|
|
||||||
|
|
|
|||||||
|
Interest-bearing -
|
||||||||
|
In Peru
|
|
|
||||||
|
In other countries
|
|
|
||||||
|
|
|
|||||||
|
Total
|
|
|
||||||
F-93
| c) |
The balance of time deposits classified by maturity is as follows:
|
|
2022
|
2021
|
|||||||
|
S/(000)
|
|
S/(000)
|
|
|||||
|
Up to 3 months
|
|
|
||||||
|
From 3 months to 1 year
|
|
|
||||||
|
From 1 to 3 years
|
|
|
||||||
|
From 3 to 5 years
|
|
|
||||||
|
More than 5 years
|
|
|
||||||
|
Total
|
|
|
||||||
In Management’s opinion the Group’s deposits and obligations are diversified with no significant concentrations as of December 31, 2022
and 2021.
As of December 31, 2022 and 2021, the balance of deposits and obligations, guaranteed by the Peruvian “Fondo de Seguro de Depositos”
(Deposit Insurance Fund) amounts to approximately S/52,745.2 million and S/50,478.8 million, respectively. At said dates, maximum amount of coverage per depositor recognized by “Fondo de Seguro de Depositos” totaled S/125,603 and S/115,637 ,
respectively.
As of December 31, 2022 and 2021 the balance of deposits and obligations of Mibanco Colombia guaranteed by the “Financial Institutions
Guarantee Fund” (FOGAFÍN, for its Spanish acronym) of Colombia, amounts to 304,758.0 million Colombian pesos (equivalent to S/239.5 million) and 224,078.1
million Colombian pesos (equivalent to S/219.8 million), respectively. At said dates, maximum amount of coverage per depositor
recognized by “FOGAFÍN” totaled 50,000,000.0 39,300 and S/49,050 , respectively).
F-94
| 15 |
DUE TO BANKS AND CORRESPONDENTS
|
| a) |
This item consists of the following:
|
| |
2022 | |
2021 | |||||
|
S/(000)
|
|
S/(000)
|
|
|||||
|
International funds and others (b)
|
|
|
||||||
|
Promotional credit lines (c)
|
|
|
||||||
|
|
|
|||||||
|
Interest payable
|
|
|
||||||
|
Total
|
|
|
| b) |
This item consists of the following:
|
| |
2022 | |
2021 | |||||
|
S/(000)
|
|
S/(000)
|
|
|||||
|
Bank of New York Mellon
|
||||||||
|
Corporación Financiera de Desarrollo (COFIDE)
|
||||||||
|
Standard Chartered Bank (i)
|
||||||||
|
International Finance Corporation (IFC)
|
||||||||
|
Citibank N.A.
|
||||||||
|
Wells Fargo Bank, N.A. (i)
|
||||||||
|
The Toronto Dominion Bank
|
||||||||
|
Caixabank
|
||||||||
|
Bank of America N.A. (i)
|
||||||||
|
HSBC Bank USA (i)
|
||||||||
|
JP Morgan Chase Bank, N.A. (i)
|
||||||||
|
Banco Internacional del Perú S.A.A. (Interbank)
|
||||||||
| Bancoldex | ||||||||
|
Scotiabank Perú S.A.A.
|
||||||||
|
Banco BBVA Perú
|
||||||||
|
ICBC Perú Bank S.A.
|
||||||||
|
Banco de Occidente
|
||||||||
|
Bradesco Bac Florida Bank
|
||||||||
|
Bancolombia S.A.
|
||||||||
|
Zurcher Kantonalbank
|
||||||||
|
Banco de la Nación
|
||||||||
|
Others
|
||||||||
|
Total
|
F-95
As of December 31, 2022, the loans have maturities between January 2023 and December 2031
(between January 2022 and March 2032 , as of December 31, 2021) and accrue interest in soles currency at rates that fluctuate between 2.23
percent and 9.45 percent (between 1.15 percent and 7.53 percent, as of December 31, 2021) and accrue
interest in foreign currency as follows:
|
2022
|
2021
|
|||||||||||||||
|
Min
|
Max
|
Min
|
Max
|
|||||||||||||
|
%
|
%
|
%
|
%
|
|||||||||||||
|
Boliviano
|
|
|
|
|
||||||||||||
|
Chilean Peso
|
|
|
|
|
||||||||||||
|
Colombian Peso
|
|
|
|
|
||||||||||||
|
U.S. Dollar
|
|
|
|
|
||||||||||||
| (i) |
|
| c) |
Promotional credit lines represent loans granted by Corporación Financiera de Desarrollo and Fondo de Cooperación para el Desarrollo
Social (COFIDE and FONCODES by its acronyms in Spanish, respectively) to promote the development of Peru, they mature between
|
| d) |
As of December 31, 2022 and 2021 the following table presents the maturities of
due to banks and based on the period remaining to maturity:
|
|
2022
|
2021
|
|||||||
|
S/(000)
|
|
S/(000)
|
|
|||||
|
Up to 3 months
|
|
|
||||||
|
From 3 months to 1 year
|
|
|
||||||
|
From 1 to 3 years
|
|
|
||||||
|
From 3 to 5 years
|
|
|
||||||
|
More than 5 years
|
|
|
||||||
|
Total
|
|
|
||||||
| e) |
As of December 31, 2022 and 2021, lines of credit granted by various local and
foreign financial institutions, to be used for future operating activities total S/
|
F-96
| f) |
Certain debts to banks, correspondents and other entities include specific agreements on
how the funds received should be used, the financial conditions that the Bank must maintain, as well as other administrative matters. In Management’s opinion, these specific agreements have been fulfilled by the Bank as of
December 31, 2022 and 2021.
|
| 16 |
TECHNICAL RESERVES FOR INSURANCE CLAIMS AND PREMIUMS
|
| a) |
This item consists of the following:
|
|
2022
|
||||||||||||
|
Technical
reserves for claims
|
Technical
reserves for premiums (*)
|
Total
|
||||||||||
|
S/(000)
|
|
S/(000)
|
|
S/(000)
|
|
|||||||
|
Life insurance
|
|
|
|
|||||||||
|
General insurance
|
|
|
|
|||||||||
|
Health insurance
|
|
|
|
|||||||||
|
Total
|
|
|
|
|||||||||
|
2021
|
||||||||||||
|
Technical
reserves for claims
|
Technical
reserves for premiums (*)
|
Total
|
||||||||||
|
S/(000)
|
|
S/(000)
|
|
S/(000)
|
|
|||||||
|
Life insurance
|
|
|
|
|||||||||
|
General insurance
|
|
|
|
|||||||||
|
Health insurance
|
|
|
|
|||||||||
|
Total
|
|
|
|
|||||||||
(*) As of December 31, 2022, the life insurance technical reserves include the mathematical reserves of annuities amounting to S/6,254.0 million (S/ 6,759.7 million as of December 31,
2021).
Insurance claims reserves represent reported claims and an estimate for incurred but non reported claims (IBNR). Reported claims are
adjusted on the basis of technical reports received from independent adjusters.
As of December 31, 2022, the reserves for direct claims include reserves for IBNR for life, general and health insurance for an amount of
S/933.0 million, S/29.0
million and S/111.0 million, respectively (S/825.0 million, S/38.9 million and S/109.9 million, respectively, as of December 31, 2021).
Insurance claims to be paid by reinsurers and co-insurers represent ceded claims, which are presented in “Accounts receivable from
reinsurers and coinsurers” of the consolidated statement of financial position, See note 9(b).
Claims reserves have had a slight reduction, mainly due to lower reporting of COVID-19 cases. Likewise, the increase in technical
reserves for premiums is mainly due to the increase in new sales in the Income line.
F-97
As of December 31, 2022, the effect due to the COVID-19 pandemic continues, IBNR reserves were calculated in two parts: a) IBNR
reserve for regular claims and b) IBNR reserve for expected excess mortality (deaths above the average of cases of pre-pandemic months).
In general, the claims reserves have been estimated with prudential criteria due to the uncertainty in the claims rate caused by the
pandemic that began in 2020 and continues in effect in 2021 and to a lesser extent in 2022.
Technical reserves include reserves for future benefit obligations under current life and personal accident insurance; and from unearned
premium reserves in the proportion of written premiums that are allocable to the unexpired portion of the related hedging periods.
| b) |
Movement of insurance claims reserves (direct and assumed) occurred during the years 2022 and 2021:
|
|
2022
|
||||||||||||||||
|
Life
insurance
|
General
insurance
|
Health
insurance
|
Total
|
|||||||||||||
|
S/(000)
|
|
S/(000)
|
|
S/(000)
|
|
S/(000)
|
|
|||||||||
| Opening balance |
|
|
|
|
||||||||||||
|
Gross claims, Note 26
|
|
|
|
|
||||||||||||
|
Payments
|
(
|
)
|
(
|
)
|
(
|
)
|
(
|
)
|
||||||||
| Exchange difference |
(
|
)
|
(
|
)
|
(
|
)
|
(
|
)
|
||||||||
|
Ending balance
|
|
|
|
|
||||||||||||
|
2021
|
||||||||||||||||
|
Life
insurance
|
General
insurance
|
Health
insurance
|
Total
|
|||||||||||||
|
S/(000)
|
|
S/(000)
|
|
S/(000)
|
|
S/(000)
|
|
|||||||||
| Opening balance |
|
|
|
|
||||||||||||
|
Gross claims, Note 26
|
|
|
|
|
||||||||||||
|
Payments
|
(
|
)
|
(
|
)
|
(
|
)
|
(
|
)
|
||||||||
| Exchange difference |
|
|
|
|
||||||||||||
|
Ending balance
|
|
|
|
|
||||||||||||
F-98
The increase in technical reserves for claims corresponds mainly to excess mortality in the Life Insurance Businesses and the
provision of services for Health Insurance. The impact by business for COVID-19 cases is detailed below:
| 2022 |
||||||||||||
|
Business line
|
IBNR Balance
COVID - 19
|
Claims reported
COVID – 19
|
Total Impact COVID-19
|
|||||||||
| S/MM |
S/MM |
S/MM |
||||||||||
|
Vida Individual
|
|
|
|
|||||||||
|
Vida Grupo
|
|
|
|
|||||||||
|
Vida Ley
|
|
|
|
|||||||||
|
Vida Crédito
|
|
|
|
|||||||||
|
SISCO
|
|
|
|
|||||||||
|
Asistencia Médica
|
|
|
|
|||||||||
|
Total
|
|
|
|
|||||||||
| 2021 |
||||||||||||
|
Business line
|
IBNR Balance
COVID - 19
|
Claims reported
COVID – 19
|
Total Impact COVID-19
|
|||||||||
| S/MM |
S/MM |
S/MM |
||||||||||
|
Vida Individual
|
|
|
|
|||||||||
|
Vida Grupo
|
|
|
|
|||||||||
|
Vida Ley
|
|
|
|
|||||||||
|
Vida Crédito
|
|
|
|
|||||||||
|
SISCO
|
|
|
|
|||||||||
|
Asistencia Médica
|
|
|
|
|||||||||
|
Total
|
|
|
|
|||||||||
F-99
|
|
c) |
Movement of reserves for premiums (direct and assumed) that occurred during the years 2022 and 2021:
|
|
2022
|
||||||||||||||||
|
Life
insurance
|
General
insurance
|
Health
insurance
|
Total
|
|||||||||||||
|
S/(000)
|
|
S/(000)
|
|
S/(000)
|
|
S/(000)
|
|
|||||||||
| Opening balance |
|
|
|
|
||||||||||||
|
Time course expenses and others
|
(
|
)
|
|
|
(
|
)
|
||||||||||
|
Unearned premium and other technical reserves variation, net
|
(
|
)
|
(
|
)
|
|
(
|
)
|
|||||||||
|
Insurance subscriptions
|
|
|
|
|
||||||||||||
|
Adjustment by application of market rates (i)
|
(
|
)
|
|
|
(
|
)
|
||||||||||
| Exchange difference and others (ii) |
(
|
)
|
(
|
)
|
(
|
)
|
(
|
)
|
||||||||
|
Ending balance
|
|
|
|
|
||||||||||||
|
2021
|
||||||||||||||||
|
Life
insurance
|
General
insurance
|
Health
insurance
|
Total
|
|||||||||||||
|
S/(000)
|
|
S/(000)
|
|
S/(000)
|
|
S/(000)
|
|
|||||||||
|
Opening balance
|
|
|
|
|
||||||||||||
|
Time course expenses and others
|
(
|
)
|
|
|
(
|
)
|
||||||||||
|
Unearned premium and other technical reserves variation, net
|
(
|
)
|
(
|
)
|
|
(
|
)
|
|||||||||
|
Insurance subscriptions
|
|
|
|
|
||||||||||||
|
Adjustment by application of market rates (i)
|
(
|
)
|
|
|
(
|
)
|
||||||||||
| Exchange difference and others (ii) |
|
|
|
|
||||||||||||
|
Ending balance
|
|
|
|
|
||||||||||||
| (i) |
|
| (ii) |
|
F-100
The main assumptions used to estimate of retirement, disability and survival annuities and individual life reserves are as follows:
|
2022
|
2021
|
|||
|
Mortality
|
Mortality table
|
Technical rates
|
Mortality table
|
Technical rates
|
|
Annuities
|
Investment rates: between |
Investment rates: between |
||
|
|
Investment rates: between
|
|
Investment rates: between
|
|
|
Pension insurance - Definitive Regime (Claims with an accrual date up to May)
|
|
Soles VAC
|
|
Soles VAC
|
|
Pension Insurance - Definitive Regime (Claims with accrual date at June 2011)
|
|
Soles VAC
|
|
Soles VAC
|
|
Pension Insurance - Temporary Regime (IFRS reserve)
|
|
Soles VAC
|
|
Soles VAC
|
|
SCTR (IFRS reserve) Claims settled up to December 2019
|
|
Soles VAC
|
|
Soles VAC
|
| SCTR (IFRS reserve) Claims settled from January 2020 onwards |
Soles VAC |
Soles VAC |
||
|
Individual life
|
|
US Dollars |
|
US Dollars
|
The sensitivity of the estimates used by the Group to measure its insurance risks is represented primarily by the life insurance risks; the main variables
as of December 31, 2022 and 2021, are the interest rates and the mortality tables used. The Group has evaluated the changes in its most significant reserves related
to life insurance contracts included in retirement, disability and survival annuities reserves of +/- 100 bps of the interest rates and of +/- 5 bps of the mortality factors, with the following results:
|
2022
|
2021
|
|||||||||||||||||||||||
|
Variation of the reserve
|
Variation of the reserve
|
|||||||||||||||||||||||
|
Variables
|
Reserve
|
Amount
|
Percentage
|
Reserve
|
Amount
|
Percentage
|
||||||||||||||||||
|
%
|
%
|
|||||||||||||||||||||||
|
Portfolio in S/ - Base amount
|
|
–
|
–
|
|
–
|
–
|
||||||||||||||||||
|
Changes in interest rates: + 100 bps
|
|
(
|
)
|
(
|
)
|
|
(
|
)
|
(
|
)
|
||||||||||||||
|
Changes in interest rates: - 100 bps
|
|
|
|
|
|
|
||||||||||||||||||
|
Changes in Mortality tables to 105%
|
|
(
|
)
|
(
|
)
|
|
(
|
)
|
(
|
)
|
||||||||||||||
|
Changes in Mortality tables to 95%
|
|
|
|
|
|
|
||||||||||||||||||
|
Portfolio in US$ - Base amount
|
|
–
|
–
|
|
–
|
-
|
||||||||||||||||||
|
Changes in interest rates: + 100 bps
|
|
(
|
)
|
(
|
)
|
|
(
|
)
|
(
|
)
|
||||||||||||||
|
Changes in interest rates: - 100 bps
|
|
|
|
|
|
|
||||||||||||||||||
|
Changes in Mortality tables to 105%
|
|
(
|
)
|
(
|
)
|
|
(
|
)
|
(
|
)
|
||||||||||||||
|
Changes in Mortality tables to 95%
|
|
|
|
|
|
|
||||||||||||||||||
F-101
| 17 |
BONDS AND NOTES ISSUED
|
| a) |
This item consists of the following:
|
| Hedge Accounting |
2022 | 2021 | ||||||||||||||||||||||||||||||
|
Annual interest
|
Interest
|
Type |
Nominal |
Nominal Equivalent |
Issued
|
Carrying
|
Issued
|
Carrying
|
||||||||||||||||||||||||
|
rate
|
payment
|
Maturity
|
amount
|
amount
|
Maturity
|
amount
|
amount
|
|||||||||||||||||||||||||
|
%
|
(000) |
S/(000) |
(000)
|
|
S/(000)
|
|
(000)
|
S/(000)
|
|
|||||||||||||||||||||||
|
Senior notes - BCP (i)
|
|
|
– |
– | – |
|
US$
|
|
|
US$
|
|
|||||||||||||||||||||
|
Senior notes - BCP (ii)
|
|
CCS |
US$ |
|
US$
|
|
|
US$
|
|
|||||||||||||||||||||||
|
Senior notes - BCP (iii)
|
|
– | – | – |
|
S/
|
|
|
S/
|
|
||||||||||||||||||||||
|
Senior notes - Credicorp Ltd. (iv)
|
|
|
Net investment of a foreign operation | US$ |
|
US$
|
|
|
US$
|
|
||||||||||||||||||||||
|
Senior notes - BCP (v)
|
Libor
|
|
– | – | – |
|
|
|
|
US$
|
|
|||||||||||||||||||||
|
Senior notes - BCP (vi)
|
|
|
CCS |
¥ |
|
¥
|
|
|
¥
|
|
||||||||||||||||||||||
| Senior notes - BCP (vii) | – |
– | – | US$ |
||||||||||||||||||||||||||||
|
MMT 100 - Secured notes- CCR Inc. (viii)
|
||||||||||||||||||||||||||||||||
|
2012 Series C Floating rate certificates
|
|
|
– |
– | – |
|
|
|
|
US$
|
|
|||||||||||||||||||||
|
Corporate bonds -
|
||||||||||||||||||||||||||||||||
|
First program
|
||||||||||||||||||||||||||||||||
|
First issuance (Series A) - Mibanco Colombia
|
– | – | – | $ |
||||||||||||||||||||||||||||
|
Fourth program
|
||||||||||||||||||||||||||||||||
|
Tenth issuance (Series A, B and C) - BCP
|
From
|
|
– | – | – |
|
|
|
|
S/
|
|
|||||||||||||||||||||
|
Fifth program
|
||||||||||||||||||||||||||||||||
|
Third issuance (Series C) - BCP
|
|
|
– | – | – |
|
|
|
|
S/
|
|
|||||||||||||||||||||
|
Third issuance (Series D) - BCP
|
|
|
– | – | – |
|
|
|
|
S/
|
|
|||||||||||||||||||||
|
|
|
|||||||||||||||||||||||||||||||
F-102
| Hedge Accounting |
2022 | 2021 | ||||||||||||||||||||||||||||||
|
Annual interest
|
Interest
|
Type |
Nominal |
Nominal Equivalent |
Issued
|
Carrying
|
Issued
|
Carrying
|
||||||||||||||||||||||||
|
rate
|
payment
|
Maturity
|
amount
|
amount
|
Maturity
|
amount
|
amount
|
|||||||||||||||||||||||||
|
%
|
(000) |
S/(000) |
(000)
|
|
S/(000)
|
|
S/(000)
|
|
S/(000)
|
|
||||||||||||||||||||||
| Subordinated bonds - |
||||||||||||||||||||||||||||||||
|
Subordinated bonds - BCP (ix)
|
From
|
|
– | – | – |
US$
|
|
|
US$
|
|
||||||||||||||||||||||
|
First program
|
||||||||||||||||||||||||||||||||
|
First issuance (Series A) - Pacífico Seguros
|
|
|
– | – | – |
|
US$
|
|
|
US$
|
|
|||||||||||||||||||||
|
First issuance (Series A) - BCP
|
|
|
– | – | – |
|
|
|
|
S/
|
|
|||||||||||||||||||||
|
|
||||||||||||||||||||||||||||||||
|
Second program
|
||||||||||||||||||||||||||||||||
|
Second issuance (Series A) - Pacífico Seguros
|
|
|
– | – | – |
|
US$
|
|
|
US$
|
|
|||||||||||||||||||||
|
First issuance (Series B) - MiBanco
|
|
|
– | – | – |
|
S/
|
|
|
S/
|
|
|||||||||||||||||||||
|
|
||||||||||||||||||||||||||||||||
|
Third program
|
||||||||||||||||||||||||||||||||
|
Issuance II - Banco de Crédito de Bolivia
|
|
|
– | – | – |
|
|
|
|
Bs
|
|
|||||||||||||||||||||
|
Issuance III - Banco de Crédito de Bolivia
|
|
|
– | – | – |
|
Bs
|
|
|
Bs
|
|
|||||||||||||||||||||
|
Issuance I - Banco de Crédito de Bolivia
|
|
|
– | – | – |
|
Bs
|
|
|
Bs
|
|
|||||||||||||||||||||
|
Fourth program
|
||||||||||||||||||||||||||||||||
|
First issuance (Series A) - MiBanco (x)
|
– | – | – | S/ |
||||||||||||||||||||||||||||
|
|
|
|||||||||||||||||||||||||||||||
|
Negotiable certificate of deposit - MiBanco
|
From
|
|
– | – | – |
|
S/
|
|
|
S/
|
|
|||||||||||||||||||||
| Negotiable certificate of deposit - MiBanco Colombia |
From |
– | – | – | $ |
$ |
||||||||||||||||||||||||||
|
|
|
|||||||||||||||||||||||||||||||
|
Interest payable
|
|
|
||||||||||||||||||||||||||||||
|
Total
|
|
|
||||||||||||||||||||||||||||||
F-103
International issues maintain certain operating covenants, which, in Management’s opinion, the Group has complied with at the dates of
the statement of financial position.
| (i) |
|
| (ii) |
|
| (iii) |
|
| (iv) |
|
| (v) |
|
F-104
| (vi) |
|
| (vii) |
|
| (viii) |
|
| (ix) |
|
| (x) |
|
F-105
| b) |
The table below shows the bonds and notes issued, classified by maturity, without accrued interests:
|
|
2022
|
2021
|
|||||||
|
S/(000)
|
|
S/(000)
|
|
|||||
|
Up to 3 months
|
|
|
||||||
|
From 3 months to 1 year
|
|
|
||||||
|
From 1 to 3 years
|
|
|
||||||
|
From 3 to 5 years
|
|
|
||||||
|
More than 5 years
|
|
|
||||||
|
Total
|
|
|
||||||
F-106
| 18 |
EQUITY, NET
|
| a) |
Share Capital -
|
As of December 31, 2022, 2021 and 2020 a total of 94,382,317 5
| b) |
Treasury shares -
|
We present below the shares of Credicorp Ltd., that the entities of the Group maintain as of December 31, 2022, 2021 and 2020:
|
Number of shares
|
||||||||||||
|
As of December 31, 2022
|
Treasury
|
Shared-based payment (*)
|
Total
|
|||||||||
|
Atlantic Security Holding Corporation
|
|
|
|
|||||||||
|
BCP
|
|
|
|
|||||||||
|
Grupo Crédito
|
|
|
|
|||||||||
|
Pacífico Seguros
|
|
|
|
|||||||||
|
Credicorp Capital Servicios Financieros
|
|
|
|
|||||||||
|
MiBanco
|
|
|
|
|||||||||
|
ASB Bank Corp.
|
|
|
|
|||||||||
|
Prima AFP
|
|
|
|
|||||||||
|
Other minors
|
|
|
|
|||||||||
|
|
|
|
||||||||||
|
|
Number of shares
|
|||||||||||
|
As of December 31, 2021
|
Treasury
|
Shared-based payment (*)
|
Total
|
|||||||||
|
Atlantic Security Holding Corporation
|
|
|
|
|||||||||
|
BCP
|
|
|
|
|||||||||
|
Pacífico Seguros
|
|
|
|
|||||||||
|
Credicorp Capital Servicios Financieros
|
|
|
|
|||||||||
|
MiBanco
|
|
|
|
|||||||||
|
ASB Bank Corp. (Atlantic Security Bank)
|
|
|
|
|||||||||
|
Grupo Crédito
|
||||||||||||
|
Prima AFP
|
|
|
|
|||||||||
|
Other minors
|
|
|
|
|||||||||
|
|
|
|
||||||||||
F-107
|
Number of shares
|
||||||||||||
|
As of December 31, 2020
|
Treasury
|
Shared-based payment (*)
|
Total
|
|||||||||
|
Atlantic Security Holding Corporation
|
|
|
|
|||||||||
|
BCP
|
|
|
|
|||||||||
|
Grupo Crédito
|
||||||||||||
|
Pacífico Seguros
|
|
|
|
|||||||||
|
Credicorp Capital Servicios Financieros
|
|
|
|
|||||||||
|
MiBanco
|
|
|
|
|||||||||
|
ASB Bank Corp. (Atlantic Security Bank)
|
||||||||||||
|
Prima AFP
|
|
|
||||||||||
|
Other minors
|
|
|
|
|||||||||
|
|
|
|
||||||||||
(*) It comprises treasury shares that were granted to employees
and senior management, for which they have the right to vote. These shares are not vested at said dates, see note 20.
During 2022, 2021 and 2020, the Group purchased 137,604 , 97,951 and 240,151 shares of Credicorp Ltd., respectively, for a total of US$22.5
million (equivalent to S/83.6 million), US$16.1 million (equivalent to S/58.9 million) and US$44.4 million (equivalent to a S/151.9 million),
respectively.
F-108
| c) |
Reserves -
|
Certain Group’s subsidiaries are required to keep a reserve that equals a percentage of paid-in capital (20 , 30 or 50 percent, depending on its activities and the country in which production takes place); this reserve must be constituted with annual
transfers of not less than 10 percent of net profits. As of December 31, 2022, 2021 and 2020, the balance of this reserves
amounts approximately to S/7,783.3 million, S/7,088.6 million and S/6,990.1 million, respectively.
At the Board meetings held on April 28, 2022, February 25, 2021 and February 27, 2020, the decision was made to transfer from “Retained earnings” to “Reserves” S/2,354.9 million, S/347.0
million and S/1,977.1 million, respectively.
“Other reserves” include unrealized gains (losses) on fair value of investments through other comprehensive income and on cash flow hedges
derivative instruments, net of deferred income tax and non-controlling interest. Movement was as follows:
|
Other reserves:
|
||||||||||||||||||||||||
|
Instruments that will not be reclassifed to profit or loss
|
Instruments that will be reclassified to consolidated statement of income
|
|||||||||||||||||||||||
|
Equity
instruments at
fair value
|
Debt
instruments at
fair value
|
Reserve for
cash flow
hedges
|
Insurance
reserves
|
Foreign
currency
translation
reserve
|
Total
|
|||||||||||||||||||
|
S/(000)
|
|
S/(000)
|
|
S/(000)
|
|
S/(000)
|
|
S/(000)
|
|
S/(000)
|
|
|||||||||||||
|
Balance as of January 1, 2020
|
|
|
(
|
)
|
(
|
)
|
(
|
)
|
|
|||||||||||||||
|
Decrease (increase) in net unrealized gains on investments
|
(
|
)
|
|
|
|
|
|
|||||||||||||||||
|
Transfer to results of the net realized loss of investments
|
|
|
|
|
|
|
||||||||||||||||||
|
Transfer of recovery of credit loss of investments to profit or loss
|
|
|
|
|
|
|
||||||||||||||||||
|
Change in net unrealized loss on cash flow hedges derivatives
|
|
|
(
|
)
|
|
|
(
|
)
|
||||||||||||||||
|
Transfer of net realized losses on cash flow hedges derivatives to profit or loss
|
|
|
|
|
|
|
||||||||||||||||||
| Other reserves |
( |
) | ( |
) | ||||||||||||||||||||
|
Foreign exchange translation
|
|
|
|
|
|
|
||||||||||||||||||
|
Net movement in hedges of net investments in foreign businesses
|
( |
) | ( |
) | ||||||||||||||||||||
|
Balance as of December 31, 2020
|
|
|
(
|
)
|
(
|
)
|
|
|
||||||||||||||||
|
Decrease in net unrealized gains on investments
|
(
|
)
|
(
|
)
|
|
|
|
(
|
)
|
|||||||||||||||
|
Transfer to results of the net realized loss of investments
|
|
|
|
|
|
|
||||||||||||||||||
|
Transfer of recovery of credit loss of investments to profit or loss
|
|
|
|
|
|
|
||||||||||||||||||
|
Change in net unrealized gain on cash flow hedges derivatives
|
|
|
|
|
|
|
||||||||||||||||||
|
Transfer of net realized gain on cash flow hedges derivatives to profit or loss
|
|
|
(
|
)
|
|
|
(
|
)
|
||||||||||||||||
|
Other reserves
|
|
|
|
|
|
|
||||||||||||||||||
|
Foreign exchange translation
|
|
|
|
|
|
|
||||||||||||||||||
| Net movement in hedges of net investments in foreign businesses |
( |
) | ( |
) | ||||||||||||||||||||
|
Balance as of December 31, 2021
|
|
(
|
)
|
(
|
)
|
(
|
)
|
|
|
|||||||||||||||
|
Decrease in net unrealized gains on investments
|
(
|
)
|
(
|
)
|
|
|
|
(
|
)
|
|||||||||||||||
|
Transfer to results of the net realized loss of investments
|
|
|
|
|
|
|
||||||||||||||||||
|
Transfer of recovery of credit loss of investments to profit or loss
|
|
|
|
|
|
|
||||||||||||||||||
|
Change in net unrealized gain on cash flow hedges derivatives
|
|
|
|
|
|
|
||||||||||||||||||
|
Transfer of net realized gain on cash flow hedges derivatives to profit or loss
|
|
|
(
|
)
|
|
|
(
|
)
|
||||||||||||||||
|
Other reserves
|
|
|
|
|
|
|
||||||||||||||||||
|
Foreign exchange translation
|
|
|
|
|
(
|
)
|
(
|
)
|
||||||||||||||||
|
Net movement in hedges of net investments in foreign businesses
|
|
|
|
|
|
|
||||||||||||||||||
|
Balance as of December 31, 2022
|
|
(
|
)
|
|
|
|
(
|
)
|
||||||||||||||||
F-109
| d) |
Components of other comprehensive income -
|
The movement of the item is as follows:
|
2022
|
2021
|
2020
|
||||||||||
|
S/(000)
|
|
S/(000)
|
|
S/(000)
|
|
|||||||
|
To be reclassified to the consolidated statement of income in later periods
|
||||||||||||
| Debt instruments at fair value through other comprehensive income | ||||||||||||
|
Net unrealized (loss) gain
|
(
|
)
|
(
|
)
|
|
|||||||
|
Transfer to results of net realized loss
|
|
|
|
|||||||||
|
Transfer of recovery (provision) of credit loss to profit or loss
|
|
|
|
|||||||||
|
Sub total
|
(
|
)
|
(
|
)
|
|
|||||||
|
Non-controlling interest
|
(
|
)
|
(
|
)
|
|
|||||||
|
Income tax
|
(
|
)
|
(
|
)
|
|
|||||||
|
(
|
)
|
(
|
)
|
|
||||||||
|
Cash flow hedge reserves:
|
||||||||||||
|
Net gain (loss) on cash flow hedges
|
|
|
(
|
)
|
||||||||
|
Transfer of net realized (gains) losses on cash flow hedges derivatives to profit or loss
|
(
|
)
|
(
|
)
|
|
|||||||
|
Sub total
|
|
|
(
|
)
|
||||||||
|
Non-controlling interest
|
|
|
(
|
)
|
||||||||
|
Income tax
|
|
|
(
|
)
|
||||||||
|
|
|
(
|
)
|
|||||||||
|
Other reserves:
|
||||||||||||
|
Insurances reserves
|
|
|
(
|
)
|
||||||||
|
Non-controlling interest
|
|
|
(
|
)
|
||||||||
|
Income tax
|
|
|
(
|
)
|
||||||||
|
|
|
(
|
)
|
|||||||||
|
Foreign exchange traslation:
|
||||||||||||
|
Exchange difference on translation of foreign currency transactions
|
(
|
)
|
|
|
||||||||
|
Net movement in hedges of net investments in foreign businesses
|
|
(
|
)
|
(
|
)
|
|||||||
|
Sub total
|
(
|
)
|
|
|
||||||||
|
Non-controlling interest
|
(
|
)
|
|
(
|
)
|
|||||||
|
(
|
)
|
|
|
|||||||||
|
Not to be reclassified to the consolidated statement of income in later periods:
|
||||||||||||
|
Equity instruments at fair value through other comprehensive income
|
||||||||||||
|
Net unrealized loss
|
(
|
)
|
(
|
)
|
(
|
)
|
||||||
|
Non-controlling interest
|
|
|
(
|
)
|
||||||||
|
Income tax
|
(
|
)
|
(
|
)
|
(
|
)
|
||||||
|
(
|
)
|
(
|
)
|
(
|
)
|
|||||||
|
Attributable to:
|
||||||||||||
|
Credicorp's shareholders
|
(
|
)
|
(
|
)
|
|
|||||||
|
Non-controlling interest
|
(
|
)
|
(
|
)
|
|
|||||||
|
(
|
)
|
(
|
)
|
|
||||||||
F-110
| e) |
Dividend distribution –
|
The chart below shows the distribution of dividends agreed by the Board of Directors :
|
2022
|
2021
|
2020
|
||||||||||
|
Date of Meeting - Board of Directors
|
|
|
|
|||||||||
|
Dividends distribution, net of treasury shares effect (in thousands of soles)
|
|
|
|
|||||||||
|
Payment of dividends per share (in soles)
|
|
|
|
|||||||||
|
Date of dividends payout
|
|
|
|
|||||||||
|
Exchange rate published by the SBS
|
|
|
|
|||||||||
|
Dividends payout (equivalent in thousands of US$)
|
|
|
|
|||||||||
In accordance with current Peruvian legislation, there is no restriction for overseas remittance of dividends or the repatriation of
foreign investment. As of December 31, 2022, 2021 and 2020 dividends paid by the Peruvian subsidiaries to Credicorp are subject to a 5.0
| f) |
Regulatory capital -
|
As of December 31, 2022 and 2021, the regulatory capital requirement (“patrimonio efectivo” in Peru) applicable to Credicorp subsidiaries
engaged in financial services and insurance activities in Peru, determined under the provisions of the Peruvian banking and insurance regulator, SBS, totals approximately S/31,754.6 million and S/29,741.6 million, respectively.
At those dates, the Group’s regulatory requirement exceeds by approximately S/8,157.0 million and S/10,294.3 million, respectively, the minimum regulatory capital required by the SBS.
F-111
| 19 |
TAX SITUATION
|
| a) |
Credicorp is not subject to income tax or any taxes on capital gains, equity or
property in Bermuda. Credicorp Peruvian subsidiaries are subject to the Peruvian tax regime.
|
The income tax rate in Peru as of December 31, 2022, 2021 and 2020 was 29.5 5.0
The income tax rate in Bolivia is 25.0 6.0 percent; in that case, they must consider an additional 25.0 percent, with which the rate would be 50.0 percent. Situation
that as of the 2021 administration, was also established for brokerage firms, investment fund management companies and insurance entities.
With the change in Chile's tax legislation in 2020, two new regimes currently in force are established: the general regime and the Pro SME regime, for smaller companies. Credicorp Capital
Holding Chile, like all its subsidiaries, is taxed under the general tax regime, whose first category income tax rate for domiciled legal entities remains at 27.0 percent as of December 31, 2022.
On the other hand, natural or legal persons not domiciled in Chile will be
subject to a tax called “Additional income tax” whose rates range between 4.0 percent and 35.0 percent, depending on the nature of the rent. Additionally, Chile has signed agreements to avoid double taxation with different
countries, so that certain income could be released from withholding taxes or for the use of reduced rates.
In the case of Colombia, according to Law No.2155 of 2021 issued on
September 14, 2021, the income tax rate for the year 2022 is 35.0 percent of taxable income. Financial institutions must pay
an additional 3.0 38.0
Additionally, the additional rate will be applicable only to colombian
financial institutions that in the corresponding tax year have a taxable income equal to or greater than 120,000 Tax Value
Unit ("UVT"), which as of December 31, 2022 is equivalent to a total of S/3.6 million and S/4.7 million as of December 31, 2021. In this sense, Credicorp Capital Colombia, Credicorp Capital Fiduciaria and MiBanco Colombia must pay
income tax taking into consideration the above.
In the event that the company receives occasional profits, quoted and
established by the National Government in the Tax Statute and that are not subject to income tax, the company must apply a differential rate of 10.0
percent on net profit and expenses. associated respectively.
The Colombian Tax Reform Law No.2155 of 2021 repeals paragraph 1 of
article 115 of the Tax Statute, which would allow from the year 2022 to take 100.0 percent of the industry and commerce tax as
a discount for income tax, notices and boards. Therefore, only 50.0 percent of the industry and commerce tax, notices and
boards can be taken as a tax discount.
In addition to the Tax Reform Law No.2155 of 2021, the possibility of
reducing the time available for inspection of the income tax return and complementary for the taxable periods 2022 and 2023 is established as follows:
|
Increase in net income tax
compared to the previous year
|
Available time of
inspection
|
|
|
|
|
|
|
F-112
The reconciliation of the statutory income tax rate to the effective tax
rate for the Group is as follows:
|
2022
|
2021
|
2020
|
||||||||||||||||||||||
|
In millions
|
%
|
In millions
|
%
|
In millions
|
%
|
|||||||||||||||||||
|
Theoretical tax and income tax rate in Peru
|
(
|
)
|
(
|
)
|
(
|
)
|
(
|
)
|
(
|
)
|
(
|
)
|
||||||||||||
|
Decrease (Increase) in the
statutory tax rate due to:
|
||||||||||||||||||||||||
|
(i) Decrease (Increase) due to the profit of
subsidiaries not domiciled in Peru
|
(
|
)
|
(
|
)
|
(
|
)
|
(
|
)
|
|
|
||||||||||||||
|
(ii) Provision tax on dividends from
subsidiaries
|
(
|
)
|
(
|
)
|
(
|
)
|
(
|
)
|
(
|
)
|
(
|
)
|
||||||||||||
|
(iii) Non-taxable income, net
|
|
|
|
|
|
|
||||||||||||||||||
|
(iv) Change in estimate of deferred tax
rate, net (Banco de Crédito de Bolivia)
|
|
|
|
|
|
|
||||||||||||||||||
|
Income tax and effective
income tax rate
|
(
|
)
|
(
|
)
|
(
|
)
|
(
|
)
|
|
|
||||||||||||||
F-113
| b) |
Income tax expense for the years ended December 31, 2022, 2021 and 2020 comprises:
|
|
2022
|
2021
|
2020
|
||||||||||
|
S/(000)
|
|
S/(000)
|
|
S/(000)
|
|
|||||||
|
Current -
|
||||||||||||
|
In Peru
|
|
|
|
|
||||||||
|
In other countries
|
|
|
|
|||||||||
|
|
|
|
||||||||||
|
Deferred -
|
||||||||||||
|
In Peru
|
|
|
(
|
)
|
||||||||
|
In other countries
|
|
(
|
)
|
(
|
)
|
|||||||
|
|
|
(
|
)
|
|||||||||
|
Total
|
|
|
(
|
)
|
||||||||
The deferred income tax has been calculated on all temporary differences,
considering the income tax rates effective where Credicorp’s subsidiaries are located.
F-114
| c) |
The following table presents a summary of the Group’s deferred income tax:
|
|
2022
|
2021
|
|||||||
|
S/(000)
|
S/(000)
|
|||||||
|
Deferred income tax asset,
net
|
||||||||
|
Deferred asset
|
||||||||
|
Provision for loan losses for loan portfolio
|
|
|
||||||
|
Provision for profit sharing
|
|
|
||||||
|
Provision for sundry expenses and risks
|
|
|
||||||
|
Carry forward tax losses
|
|
|
||||||
|
Provision for pending vacations
|
|
|
||||||
|
Depreciation of improvements for leased premises
|
|
|
||||||
|
Unrealized losses due to valuation of
investments at fair value through other comprehensive income
|
|
|
||||||
|
Provision of Stock awards
|
|
|
||||||
|
Unrealized losses due to valuation of investments at fair value through other
comprehensive income
|
|
|
||||||
|
Others
|
|
|
||||||
|
Deferred liability
|
||||||||
|
Intangibles, net
|
(
|
)
|
(
|
)
|
||||
|
Adjustment for difference in exchange of Superintendencia Nacional de Aduanas y
de Administración Tributaria (SUNAT) and SBS
|
(
|
)
|
(
|
)
|
||||
|
Buildings depreciation
|
(
|
)
|
(
|
)
|
||||
|
Deferred acquisitions costs - DAC
|
(
|
)
|
(
|
)
|
||||
|
Unrealized gain due to valuation of investments at fair value through other
comprehensive income
|
(
|
)
|
(
|
)
|
||||
|
Unrealized gain / loss from valuation of
fair value hedging derivatives
|
|
(
|
)
|
|||||
|
Buildings revaluation
|
(
|
)
|
(
|
)
|
||||
|
Unrealized gain in valuation on cash flow hedge derivatives
|
(
|
)
|
(
|
)
|
||||
|
Others
|
(
|
)
|
(
|
)
|
||||
|
Total
|
|
|
||||||
F-115
|
2022
|
2021
|
|||||||
|
S/(000)
|
S/(000)
|
|||||||
|
Deferred income tax
liability, net
|
||||||||
|
Deferred asset
|
||||||||
|
Provision for sundry expenses and risks
|
|
|
||||||
|
Carry forward tax losses
|
|
|
||||||
|
Unrealized losses due to valuation of
investments at fair value through other comprehensive income
|
|
|
||||||
|
Provision for profit sharing
|
|
|
||||||
|
Deferred income from commissions on remuneration
|
|
|
||||||
|
Others
|
|
|
||||||
|
Deferred liability
|
||||||||
|
Intangibles, net
|
(
|
)
|
(
|
)
|
||||
|
Gain generated in the reorganization of
Pacífico EPS
|
(
|
)
|
(
|
)
|
||||
|
Deferred acquisitions costs - DAC
|
(
|
)
|
(
|
)
|
||||
|
Unrealized gain due to valuation of
investments at fair value through other comprehensive income
|
(
|
)
|
(
|
)
|
||||
|
Reserve for reinstatement premium costs and deductibles
|
(
|
)
|
(
|
)
|
||||
|
Leasing operations related to loans
|
(
|
)
|
(
|
)
|
||||
|
Buildings revaluation
|
(
|
)
|
(
|
)
|
||||
|
Others
|
(
|
)
|
(
|
)
|
||||
|
Total
|
(
|
)
|
(
|
)
|
||||
As of December 31, 2022, the Group has recorded a deferred liability of
deferred income tax of S/114 million for both periods corresponding to unrealized gains and losses generated by investments at
fair value through other comprehensive income and cash flow hedges derivatives.
As of December 31, 2021, the Group has recorded a deferred liability of
income tax of S/5.1 million for both periods corresponding to unrealized gains and losses generated by investments at fair
value through other comprehensive income and cash flow hedges derivatives.
| d) |
The Peruvian Tax Authority has the right to review and, if necessary, amend the
annual income tax returns filed by Peruvian subsidiaries up to
|
|
Banco de Crédito del Perú
|
|
|||
|
MiBanco, Banco de la Microempresa
|
|
|||
|
Pacífico Compañía de Seguros y Reaseguros
|
|
|||
|
Credicorp Capital Servicios Financieros
|
|
|||
|
Credicorp Capital Perú
|
|
|||
| Credicorp Capital Holding
Perú |
It is important to mention that the Peruvian
Tax Authority is auditing the Income Tax declaration of 2018 of Banco de Crédito del Perú. Additionally, Mibanco has a claim process to the Tax authority for 2014 period, it implies S/4.8 million, in the present, this process is starting.
F-116
The Bolivian, Chilean and Colombian Tax Authorities have
the power to review and, if applicable, make a new determination for the income tax the subsidiaries to Credicorp located in said countries, upon presentation of their Income Tax declarations. Additionally, in the case of Colombia, a
period of 6 years was established for the taxpayers obliged to apply Transfer Prices or taxpayers who report tax losses.
The annual income tax declarations pending examination by the overseas
tax authorities are the following:
|
Banco de Crédito de Bolivia
|
|
| MiBanco Colombia |
|
|
Credicorp Capital Colombia
|
|
|
Credicorp Capital Holding Chile
|
|
Since tax regulations are subject to interpretation by the different Tax
Authorities where Credicorp’s subsidiaries are located, it is not possible to determine at the present date whether any significant additional liabilities may arise from any eventual tax examinations of the Credicorp’s subsidiaries. Any
resulting unpaid taxes, tax penalties or interest that may arise will be recognized as expenses in the year in which they are determined. However, Management of Credicorp and its Subsidiaries and their legal counsel consider that any
additional tax assessments would not have a significant impact on the consolidated financial statements as of December 31, 2022 and 2021.
| 20 |
SHARE-BASED COMPENSATION PLANS
|
As indicated in Note 3(x), in March of each year, the Group grants its own shares to certain key employees. The awarded shares are
liberated in the following years for up to 33.3 percent of the shares granted in each of the
previous years. The Group assumes the payment of the related income tax on behalf of its employees, which is 30 percent of the profit.
As of December 31, 2022, 2021 and 2020, the Group has granted 116,626 , 88,507 and 175,930 Credicorp shares, of which 228,377 ,
229,523 and 293,606
shares not vested as of December 31, 2022, 2021 and 2020, respectively. During those years, the recorded expense amounted to approximately S/88.7
million, S/74.0 million and S/104.5
million, respectively, see Note 27.
| 21 |
CONTINGENT RISKS AND COMMITMENTS
|
| a) |
This item consists of the following:
|
|
2022
|
2021
|
|||||||
|
S/(000)
|
|
S/(000)
|
|
|||||
|
Contingent credits - indirect loans (b)
|
||||||||
|
Guarantees and performance bonds
|
|
|
||||||
|
Import and export letters of credit
|
|
|
||||||
|
Sub-total, Note 7(b)
|
|
|
||||||
|
Responsibilities under credit line agreements (c)
|
|
|
||||||
|
Total
|
|
|
||||||
Reference values of operations with derivatives are recorded in off-balance sheet accounts in the committed currency, as shown in note
13(c).
F-117
| b) |
|
Credit risk for contingent credits is defined as the possibility of sustaining a loss because one of the parties to a financial instrument
fails to comply with the terms of the contract. The risk of credit losses is represented by the contractual amounts specified in the related contracts. The Group applies the same credit policies in making contingent commitments and other
obligations as it does for on-balance sheet instruments (Note 7(a)), including the requirement to obtain collateral when it is deemed necessary.
Collateral held varies, but may include deposits in financial institutions, securities or other assets. Many of the contingent
transactions reach maturity without any performance being required; therefore, the total committed amounts do not necessarily represent future cash requirements.
| c) |
|
| 22 |
INTEREST, SIMILAR INCOME AND SIMILAR EXPENSES
|
This item consists of the following:
|
2022
|
2021
|
2020
|
||||||||||
|
S/(000)
|
S/(000)
|
S/(000)
|
||||||||||
|
Interest and similar income
|
||||||||||||
|
Interest on loans
|
|
|
|
|||||||||
|
Interest on investments at fair value through other comprehensive income
|
|
|
|
|||||||||
|
Interest on due from banks
|
|
|
|
|||||||||
| Interest on investments at amortized cost | ||||||||||||
|
Interest on investments at fair value through profit or loss
|
|
|
|
|||||||||
|
Dividends received
|
|
|
|
|||||||||
|
Other interest and similar income
|
|
|
|
|||||||||
|
Total
|
|
|
|
|||||||||
|
Interest and similar expense
|
||||||||||||
|
Interest on deposits and obligations
|
(
|
)
|
(
|
)
|
(
|
)
|
||||||
|
Interest on bonds and notes issued
|
(
|
)
|
(
|
)
|
(
|
)
|
||||||
|
Interest on due to banks and correspondents
|
(
|
)
|
(
|
)
|
(
|
)
|
||||||
|
Deposit Insurance Fund
|
(
|
)
|
(
|
)
|
(
|
)
|
||||||
|
Interest on lease liabilities
|
(
|
)
|
(
|
)
|
(
|
)
|
||||||
|
Other interest and similar expense
|
(
|
)
|
(
|
)
|
(
|
)
|
||||||
|
Total
|
(
|
)
|
(
|
)
|
(
|
)
|
||||||
The increase in the financial margin during 2022 is mainly due to the increase in financial income as a result of the
increase in interest rates that have been growing significantly during the year 2022, both in soles and in dollars, compared to the year 2021 with rates historically low.
Likewise, this growth is partially offset by the increase in financial expenses that is affected by the same increase in market
rates.
F-118
| 23 |
COMMISSIONS AND FEES
|
This item consists of the following:
|
2022
|
2021
|
2020
|
||||||||||
|
S/(000)
|
|
S/(000)
|
|
S/(000)
|
|
|||||||
|
Maintenance of accounts, transfers and credit and debit card services
|
|
|
|
|||||||||
|
Funds and equity management
|
|
|
|
|||||||||
|
Contingent loans and foreign trade fees
|
|
|
|
|||||||||
|
Commissions for banking services
|
|
|
|
|||||||||
| Collection services | ||||||||||||
|
Brokerage, securities, and custody services
|
|
|
|
|||||||||
|
Commissions for salary advance and payment of services
|
|
|
|
|||||||||
| Commissions for consulting and technical studies | ||||||||||||
|
Commissions for intermediation in virtual platforms
|
||||||||||||
|
Penalty commissions
|
|
|
|
|||||||||
|
Others
|
|
|
|
|||||||||
|
Total
|
|
|
|
|||||||||
F-119
| 24 |
NET GAIN ON SECURITIES
|
This item consists of the following:
|
2022
|
2021
|
2020
|
||||||||||
|
S/(000)
|
|
S/(000)
|
|
S/(000)
|
|
|||||||
| Net gain in associates (i) | ||||||||||||
|
Net gain on investments at fair value with changes in other comprehensive income (ii)
|
|
|
|
|||||||||
|
(Provision) recovery of credit loss for investments at fair value with changes in other comprehensive income (iii), note 6(b)
|
(
|
)
|
(
|
)
|
(
|
)
|
||||||
|
Net (loss) gain on investments at fair value through profit or loss (iv)
|
(
|
)
|
(
|
)
|
|
|||||||
|
Others
|
(
|
)
|
(
|
)
|
(
|
)
|
||||||
|
Total
|
|
|
|
|||||||||
| (i) |
|
| (ii) |
|
|
|
|
|
|
|
|
|
|
|
|
|
|
|
|
|
| (iii) |
|
| (iv) |
|
F-120
| 25 |
NET PREMIUMS EARNED
|
| a) |
This item consists of the following:
|
|
Gross written
premiums
|
Technical reserve
adjustment
|
Total gross
written premiums
(*)
|
Premiums ceded
to reinsurers and
co-insurers, net (**)
|
Results of
financial assets
designated at fair
value through
profit and loss,
Note 8
|
Total net
premiums
earned
|
|||||||||||||||||||
|
S/(000)
|
|
S/(000)
|
|
S/(000)
|
|
S/(000)
|
|
S/(000)
|
|
S/(000)
|
|
|||||||||||||
|
2022
|
||||||||||||||||||||||||
|
Life insurance
|
|
(
|
)
|
|
(
|
)
|
(
|
)
|
|
|||||||||||||||
|
Health insurance
|
|
(
|
)
|
|
(
|
)
|
|
|
||||||||||||||||
|
General insurance
|
|
(
|
)
|
|
(
|
)
|
|
|
||||||||||||||||
|
Total
|
|
(
|
)
|
|
(
|
)
|
(
|
)
|
|
|||||||||||||||
|
2021
|
||||||||||||||||||||||||
|
Life insurance
|
|
(
|
)
|
|
(
|
)
|
|
|
||||||||||||||||
|
Health insurance
|
|
(
|
)
|
|
(
|
)
|
|
|
||||||||||||||||
|
General insurance
|
|
(
|
)
|
|
(
|
)
|
|
|
||||||||||||||||
|
Total
|
|
(
|
)
|
|
(
|
)
|
|
|
||||||||||||||||
|
2020
|
||||||||||||||||||||||||
|
Life insurance
|
|
(
|
)
|
|
(
|
)
|
|
|
||||||||||||||||
|
Health insurance
|
|
(
|
)
|
|
(
|
)
|
|
|
||||||||||||||||
|
General insurance
|
|
(
|
)
|
|
(
|
)
|
|
|
||||||||||||||||
|
Total
|
|
(
|
)
|
|
(
|
)
|
|
|
||||||||||||||||
| (*) |
|
| (**) |
|
|
2022
|
2021
|
2020
|
||||||||||
|
S/(000)
|
|
S/(000)
|
|
S/(000)
|
|
|||||||
|
Premiums ceded for automatic contracts (mainly excess of loss), Note 9(b)
|
(
|
)
|
(
|
)
|
(
|
)
|
||||||
|
Premiums ceded for facultative contracts, Note 9(b)
|
(
|
)
|
(
|
)
|
(
|
)
|
||||||
|
Annual variation of reserve risk in progress of premiums ceded, Note 9(b)
|
(
|
)
|
|
|
||||||||
|
(
|
)
|
(
|
)
|
(
|
)
|
|||||||
F-121
| b) |
Gross written premiums by insurance type are described below:
|
|
2022
|
2021
|
2020
|
||||||||||||||||||||||
|
S/(000)
|
|
%
|
S/(000)
|
|
%
|
S/(000)
|
|
%
|
||||||||||||||||
|
Life insurance (i)
|
|
|
|
|
|
|
||||||||||||||||||
|
Health insurance (ii)
|
|
|
|
|
|
|
||||||||||||||||||
|
General insurance (iii)
|
|
|
|
|
|
|
||||||||||||||||||
|
Total
|
|
|
|
|
|
|
||||||||||||||||||
| (i) |
|
|
2022
|
2021
|
2020
|
||||||||||||||||||||||
|
S/(000)
|
|
%
|
S/(000)
|
|
%
|
S/(000)
|
|
%
|
||||||||||||||||
|
Disability and survival (*)
|
|
|
|
|
|
|
||||||||||||||||||
|
Credit life
|
|
|
|
|
|
|
||||||||||||||||||
|
Individual life (**)
|
|
|
|
|
|
|
||||||||||||||||||
|
Group life
|
|
|
|
|
|
|
||||||||||||||||||
|
Annuities
|
|
|
|
|
|
|
||||||||||||||||||
|
Total
|
|
|
|
|
|
|
||||||||||||||||||
| (*) |
|
| (**) |
|
| (ii) |
|
| (iii) |
|
|
2022
|
2021
|
2020
|
||||||||||||||||||||||
|
S/(000)
|
|
%
|
S/(000)
|
|
%
|
S/(000)
|
|
%
|
||||||||||||||||
|
Automobile
|
|
|
|
|
|
|
||||||||||||||||||
|
Fire and allied lines
|
|
|
|
|
|
|
||||||||||||||||||
|
Theft and robbery
|
|
|
|
|
|
|
||||||||||||||||||
|
Third party liability
|
|
|
|
|
|
|
||||||||||||||||||
|
Transport
|
|
|
|
|
|
|
||||||||||||||||||
|
Technical lines (*)
|
|
|
|
|
|
|
||||||||||||||||||
|
Marine Hull
|
|
|
|
|
|
|
||||||||||||||||||
|
SOAT (Mandatory automobile line)
|
|
|
|
|
|
|
||||||||||||||||||
|
Aviation
|
|
|
|
|
|
|
||||||||||||||||||
|
Others
|
|
|
|
|
|
|
||||||||||||||||||
|
Total
|
|
|
|
|
|
|
||||||||||||||||||
| (*) |
|
F-122
| 26 |
NET CLAIMS INCURRED FOR LIFE, GENERAL AND HEALTH INSURANCE CONTRACTS
|
This item consists of the following:
|
2022
|
||||||||||||||||
|
Life
insurance
|
General
insurance
|
Health
insurance
|
Total
|
|||||||||||||
|
S/(000)
|
|
S/(000)
|
|
S/(000)
|
|
S/(000)
|
|
|||||||||
|
Gross claims, Note 16(b)
|
|
|
|
|
||||||||||||
|
Ceded claims, Note 9(b)
|
(
|
)
|
(
|
)
|
(
|
)
|
(
|
)
|
||||||||
|
Net insurance claims
|
|
|
|
|
||||||||||||
|
2021
|
||||||||||||||||
|
Life
insurance
|
General
insurance
|
Health
insurance
|
Total
|
|||||||||||||
|
S/(000)
|
|
S/(000)
|
|
S/(000)
|
|
S/(000)
|
|
|||||||||
|
Gross claims, Note 16(b)
|
|
|
|
|
||||||||||||
|
Ceded claims, Note 9(b)
|
(
|
)
|
(
|
)
|
(
|
)
|
(
|
)
|
||||||||
|
Net insurance claims
|
|
|
|
|
||||||||||||
|
2020
|
||||||||||||||||
|
Life
insurance
|
General
insurance
|
Health
insurance
|
Total
|
|||||||||||||
|
S/(000)
|
|
S/(000)
|
|
S/(000)
|
|
S/(000)
|
|
|||||||||
|
Gross claims, Note 16(b)
|
|
|
|
|
||||||||||||
|
Ceded claims, Note 9(b)
|
(
|
)
|
(
|
)
|
(
|
)
|
(
|
)
|
||||||||
|
Net insurance claims
|
|
|
|
|
||||||||||||
As of December 31, 2022, the decrease in net life
insurance claims is mainly due to a lower claim rate of real cases due to COVID-19 for S/466.5 million, release of IBNR
for S/69.8 million and other minors for S/ 54.6 million. As of December 31, 2021, the increase in net claims for life insurance is mainly due to the increase in claims in real cases due to COVID-19 for
S/335.2 million, higher claims in credit life for S/49.7 million, annuities for S/30.9 million,
Complementary Risk Work Insurance (“SCTR”) for S/30.3 million as a result of the normalization of activities regarding
the limitation of activities due to the 2020 pandemic and other minors for S/87.0 million.
As of December 31, 2022, the increase in net claims for general insurance
corresponds to a higher claim rate of vehicles for S/38.2 million, transportation for S/16.6 million and other minor claims for S/8.3
million. As of December 31, 2021, the restrictions established by the government in relation to circulation and capacity in commercial activities began to be less rigid, which led to a gradual increase in claims in the general
insurance business, but without reaching pre-pandemic levels, mainly in the Auto lines and in the Mandatory Traffic Accident Insurance (“SOAT” by its acronym in Spanish).
F-123
| 27 |
SALARIES AND EMPLOYEES BENEFITS
|
This item consists of the following:
|
2022
|
2021
|
2020
|
||||||||||
|
S/(000)
|
|
S/(000)
|
|
S/(000)
|
|
|||||||
|
Salaries
|
|
|
|
|||||||||
|
Vacations, medical assistance and others
|
|
|
|
|||||||||
| Bonuses | ||||||||||||
| Workers profit sharing (a) |
||||||||||||
|
Additional participation
|
|
|
|
|||||||||
|
Social security
|
|
|
|
|||||||||
|
Severance indemnities
|
|
|
|
|||||||||
|
Share-based payment plans
|
|
|
|
|||||||||
|
Total
|
|
|
|
|||||||||
|
(a)
|
|
F-124
| 28 |
ADMINISTRATIVE EXPENSES
|
This item consists of the following:
|
2022
|
2021
|
2020
|
||||||||||
|
S/(000)
|
|
S/(000)
|
|
S/(000)
|
|
|||||||
| Systems expenses (a) | ||||||||||||
|
Publicity and loyalty programs (b)
|
|
|
|
|||||||||
|
Consulting and professional fees
|
|
|
|
|||||||||
|
Taxes and contributions
|
|
|
|
|||||||||
|
Transport and communications
|
||||||||||||
|
Repair and maintenance
|
|
|
|
|||||||||
| Outsourcing | ||||||||||||
|
Comissions by agents
|
|
|
|
|||||||||
|
Lease
|
|
|
|
|||||||||
|
Sundry supplies (c)
|
|
|
|
|||||||||
|
Security and protection
|
|
|
|
|||||||||
|
Insurance
|
|
|
|
|||||||||
|
Subscriptions and quotes
|
||||||||||||
|
Electricity and water
|
||||||||||||
|
Electronic processing
|
|
|
|
|||||||||
|
Cleaning
|
|
|
|
|||||||||
|
Others (d)
|
||||||||||||
|
Total
|
|
|
|
|||||||||
| (a) |
|
| (b) |
| (c) |
| (d) |
F-125
| 29 |
OTHER INCOME AND EXPENSES
|
This item consists of the following:
|
2022
|
2021
|
2020
|
||||||||||
|
S/(000)
|
S/(000)
|
S/(000)
|
||||||||||
|
Other income
|
||||||||||||
|
Rental income
|
|
|
|
|||||||||
|
Gain from sale of loan portfolio
|
|
|
|
|||||||||
|
Net income from sale of property, furniture and equipment
|
|
|
|
|||||||||
|
Net income from the sale of foreclosed assets
|
||||||||||||
|
Income from resolution of IFRS 16 contracts
|
|
|
|
|||||||||
| Recoveries of other accounts receivable and other assets | ||||||||||||
|
Others (a)
|
|
|
|
|||||||||
|
Total other income
|
|
|
|
|||||||||
|
2022
|
2021
|
2020
|
||||||||||
|
S/(000)
|
S/(000)
|
S/(000)
|
||||||||||
|
Other expenses
|
||||||||||||
|
Losses due to operational risk
|
||||||||||||
|
Provision for sundry risks, note 13(j)
|
|
|
|
|||||||||
|
Association in participation
|
|
|
|
|||||||||
|
Reduction of intangibles due to withdrawals and dismissed projects
|
||||||||||||
|
Expenses on improvements in building for rent
|
||||||||||||
|
Provision for other accounts receivable
|
|
|
|
|||||||||
|
Donations
|
|
|
|
|||||||||
|
Operating expenses due to COVID-19
|
||||||||||||
|
Administrative and tax penalties
|
|
|
|
|||||||||
|
Loss on sale of investment properties
|
|
|
|
|||||||||
|
Others (a)
|
|
|
|
|||||||||
|
Total other expenses
|
|
|
|
|||||||||
| (a) |
|
F-126
| 30 |
EARNING PER SHARE
|
Net earnings per common share were determined based on the net income attributable to equity holders of the Group as follows:
|
2022
|
2021
|
2020
|
||||||||||
|
Net income attributable to equity holders of Credicorp (in thousands of Soles)
|
|
|
|
|||||||||
|
Number of stock
|
||||||||||||
|
Ordinary stock, Note 18(a)
|
|
|
|
|||||||||
|
Less opening balance of treasury stock
|
(
|
)
|
(
|
)
|
(
|
)
|
||||||
|
Sale (acquisition) of treasury stock, net
|
(
|
)
|
|
(
|
)
|
|||||||
|
Weighted average number of ordinary shares for basic earnings
|
|
|
|
|||||||||
|
Plus - dilution effect - stock awards
|
|
|
|
|||||||||
|
Weighted average number of ordinary shares adjusted for the effect of dilution
|
|
|
|
|||||||||
|
Basic earnings per share (in Soles)
|
|
|
|
|||||||||
|
Diluted earnings per share (in Soles)
|
|
|
|
|||||||||
F-127
| 31 |
OPERATING SEGMENTS
|
The Board of Directors of Credicorp organized the Group’s subsidiaries according to the types of financial services provided and the sectors on which they
are focused; in order to optimize the management thereof. We present the Group´s business lines below:
| a) |
Universal Banking -
|
Comprising operations related to the granting of different credits and financial instruments to individuals and legal entities, from the segments of
wholesale and retail banking, such as the obtaining of funds from the public through deposits and checking accounts, obtaining of funding by means of initial public offerings and direct indebtedness with other financial institutions.
This business line incorporates the profit or loss and balances of the Banco de Crédito del Perú (BCP) and Banco de Crédito de Bolivia (BCB).
| b) |
Insurance and Pensions -
|
| - |
Insurance: it mainly includes the issuance of insurance policies to cover losses in commercial property, transport, marine vessels, automobiles, life, health and pensions, which are carried out through Pacífico Compañía de
Seguros y Reaseguros and its subsidiaries.
|
| - |
Pensions funds: It provides Management Service of private pension funds to the affiliates, which is carried out from Prima AFP.
|
| c) |
Microfinance -
|
Includes management of loans, deposits and checking accounts of the small and microenterprises which are carried out through Mibanco, Banco de la
Microempresa S.A. and Mibanco – Banco de la Microempresa de Colombia S.A.
| d) |
Investment Banking and Equity Management -
|
Comprising brokerage service and investment management services offered to a broad and diverse clientele, which includes corporations, institutional
investors, governments and foundations; also, comprising the structuring and placement of issues in the primary market, as well as the implementation and negotiation of transactions in the secondary market. Additionally, it structures
securitization processes for corporate customers and manages mutual funds.
All these services are provided through Credicorp Capital Ltd. and subsidiaries and ASB Bank Corp.
Management of these business lines is designed to:
| - |
Promote the joint action of our businesses in order to take advantage of the synergies which result from the diversification of our portfolio.
|
| - |
Strengthening our leadership in the financial sector through our growth in new businesses, through the implementation of an investment banking platform available not only to the corporate world, but also to the retail
segment, especially to the Small and Medium Enterprise (SME) and Consumer sectors.
|
| - |
Improve the ongoing search to adapt our business models, processes and procedures into line with best practices worldwide.
|
F-128
The operating results of the Group’s new business lines are monitored separately by the Board of Directors and Senior Management on a monthly basis, in order
to make decisions regarding the allocation of resources and the evaluation of the performance of each one of the segments. The Chief Operating Decision Maker (CODM) of Credicorp is the Chief Executive Officer (CEO). The performance of
the segments is evaluated based on the operating profits or losses and is measured consistently with the operating profits and losses presented in the consolidated statement of income.
Financial information by segment is prepared subject to the minimum controls necessary and on a uniform basis, with coherent grouping according to the type
of activity and customer. The transfer prices used for determining income and expenses generated among the operating segments are similar to the prices that would be applicable to transactions carried out at arm’s length.
None of the income derives from transactions carried out with a single customer or counterparty which is equal to or greater than 10 percent or more of the
total income of the Group as of December 31, 2022, 2021 and 2020.
F-129
| (i) |
The following table presents information recorded in the results and for certain items of the assets corresponding to the Group’s reportable segments (in millions of soles) as of December 31, 2022, 2021 and 2020:
|
|
Income (*)
|
||||||||||||||||||||||||||||||||||||||||||||
|
2022
|
External
|
From other
segments (**)
|
Net interest,
similar
income and
expenses
|
Other
income,
net (***)
|
Provision for
credit losses
on loan
portfolio
|
Depreciation
and
amortization
|
Income
tax
|
Net profit
|
Additions of
fixed asset,
intangibles
and goodwill
|
Total
assets
|
Total
liabilities
|
|||||||||||||||||||||||||||||||||
|
Universal Banking
|
||||||||||||||||||||||||||||||||||||||||||||
|
Banco de Crédito del Perú
|
|
|
|
|
(
|
)
|
(
|
)
|
(
|
)
|
|
|
|
|
||||||||||||||||||||||||||||||
|
Banco de Crédito de Bolivia
|
|
|
|
|
(
|
)
|
(
|
)
|
(
|
)
|
|
|
|
|
||||||||||||||||||||||||||||||
| ( |
) | ( |
) | ( |
) | |||||||||||||||||||||||||||||||||||||||
|
Insurance and Pension funds
|
||||||||||||||||||||||||||||||||||||||||||||
|
Pacífico Seguros y subsidiarias
|
|
|
|
|
|
(
|
)
|
(
|
)
|
|
|
|
|
|||||||||||||||||||||||||||||||
|
Prima AFP
|
|
|
|
|
|
(
|
)
|
(
|
)
|
|
|
|
|
|||||||||||||||||||||||||||||||
| ( |
) | ( |
) | |||||||||||||||||||||||||||||||||||||||||
|
Microfinance
|
||||||||||||||||||||||||||||||||||||||||||||
|
Mibanco
|
|
|
|
|
(
|
)
|
(
|
)
|
(
|
)
|
|
|
|
|
||||||||||||||||||||||||||||||
|
Mibanco Colombia (****)
|
|
|
|
|
(
|
)
|
(
|
)
|
(
|
)
|
|
|
|
|
||||||||||||||||||||||||||||||
| ( |
) | ( |
) | ( |
) | |||||||||||||||||||||||||||||||||||||||
|
Investment Banking and Wealth Management
|
|
|
|
|
|
(
|
)
|
(
|
)
|
|
|
|
|
|||||||||||||||||||||||||||||||
|
Other segments
|
|
|
|
|
|
(
|
)
|
(
|
)
|
(
|
)
|
|
|
|
||||||||||||||||||||||||||||||
|
Eliminations
|
|
|
|
|
|
|
|
|
|
(
|
)
|
(
|
)
|
|||||||||||||||||||||||||||||||
|
Total consolidated
|
|
|
|
|
(
|
)
|
(
|
)
|
(
|
)
|
|
|
|
|
||||||||||||||||||||||||||||||
|
Income (*)
|
||||||||||||||||||||||||||||||||||||||||||||
|
2021
|
External
|
From other
segments (**)
|
Net interest,
similar
income and
expenses
|
Other
income,
net (***)
|
Provision for
credit losses
on loan
portfolio
|
Depreciation
and
amortization
|
Income
tax
|
Net profit
|
Additions of
fixed asset,
intangibles
and goodwill
|
Total
assets
|
Total
liabilities
|
|||||||||||||||||||||||||||||||||
|
Universal Banking
|
||||||||||||||||||||||||||||||||||||||||||||
|
Banco de Crédito del Perú
|
|
|
|
|
(
|
)
|
(
|
)
|
(
|
)
|
|
|
|
|
||||||||||||||||||||||||||||||
|
Banco de Crédito de Bolivia
|
|
|
|
|
(
|
)
|
(
|
)
|
(
|
)
|
|
|
|
|
||||||||||||||||||||||||||||||
| ( |
) | ( |
) | ( |
) | |||||||||||||||||||||||||||||||||||||||
|
Insurance and Pesion funds
|
||||||||||||||||||||||||||||||||||||||||||||
|
Pacífico Seguros y subsidiarias
|
|
|
|
|
|
(
|
)
|
(
|
)
|
(
|
)
|
|
|
|
||||||||||||||||||||||||||||||
|
Prima AFP
|
|
|
(
|
)
|
|
|
(
|
)
|
(
|
)
|
|
|
|
|
||||||||||||||||||||||||||||||
| ( |
) | ( |
) | |||||||||||||||||||||||||||||||||||||||||
|
Microfinance
|
||||||||||||||||||||||||||||||||||||||||||||
|
Mibanco
|
|
|
|
(
|
)
|
(
|
)
|
(
|
)
|
(
|
)
|
|
|
|
|
|||||||||||||||||||||||||||||
|
Mibanco Colombia (****)
|
|
|
|
|
(
|
)
|
(
|
)
|
(
|
)
|
|
|
|
|
||||||||||||||||||||||||||||||
| ( |
) | ( |
) | ( |
) | |||||||||||||||||||||||||||||||||||||||
|
Investment banking and wealth management
|
|
|
|
|
|
(
|
)
|
(
|
)
|
|
|
|
|
|||||||||||||||||||||||||||||||
|
Other segments
|
|
|
|
|
(
|
)
|
(
|
)
|
(
|
)
|
(
|
)
|
|
|
|
|||||||||||||||||||||||||||||
|
Eliminations
|
|
|
|
|
|
|
|
|
|
(
|
)
|
(
|
)
|
|||||||||||||||||||||||||||||||
|
Total consolidated
|
|
|
|
|
(
|
)
|
(
|
)
|
(
|
)
|
|
|
|
|
||||||||||||||||||||||||||||||
| (*) |
Comprising total interest and similar income, other income (includes income and expenses on commissions) and net earned premiums from insurance activities.
|
| (**) |
Comprising income derived from transactions with other segments, which were eliminated in the consolidated statement of income.
|
| (***) |
Comprising other income (include income and expenses for commissions) and insurance underwriting result.
|
F-130
|
|
Income (*)
|
|||||||||||||||||||||||||||||||||||||||||||
|
2020
|
External
|
From other segments (**)
|
Net interest,
similar
income and
expenses
|
Otros
income,
net (***)
|
Provision for
credit losses
on loan
portfolio
|
Depreciation y
amortization
|
Income
tax
|
Net profit
|
Additions of
fixed asset,
intangibles
and goodwill
|
Total
assets
|
Total
liabilities
|
|||||||||||||||||||||||||||||||||
|
Universal Banking
|
||||||||||||||||||||||||||||||||||||||||||||
|
Banco de Crédito del Perú
|
|
|
|
|
(
|
)
|
(
|
)
|
(
|
)
|
|
|
|
|
||||||||||||||||||||||||||||||
|
Banco de Crédito de Bolivia
|
|
|
|
|
(
|
)
|
(
|
)
|
|
(
|
)
|
|
|
|
||||||||||||||||||||||||||||||
| ( |
) | ( |
) | |||||||||||||||||||||||||||||||||||||||||
|
Insurance and pension funds
|
||||||||||||||||||||||||||||||||||||||||||||
|
Pacífico Seguros y subsidiarias
|
|
|
|
|
|
(
|
)
|
(
|
)
|
|
|
|
|
|||||||||||||||||||||||||||||||
|
Prima AFP
|
|
|
(
|
)
|
|
|
(
|
)
|
(
|
)
|
|
|
|
|
||||||||||||||||||||||||||||||
| ( |
) | ( |
) | |||||||||||||||||||||||||||||||||||||||||
|
Microfinance
|
||||||||||||||||||||||||||||||||||||||||||||
|
Mibanco
|
|
|
|
|
(
|
)
|
(
|
)
|
|
(
|
)
|
|
|
|
||||||||||||||||||||||||||||||
|
Mibanco Colombia (****)
|
|
|
|
|
(
|
)
|
(
|
)
|
|
(
|
)
|
|
|
|
||||||||||||||||||||||||||||||
| ( |
) | ( |
) | ( |
) | |||||||||||||||||||||||||||||||||||||||
|
Investment Banking and Wealth Management
|
|
|
|
|
|
(
|
)
|
(
|
)
|
(
|
)
|
|
|
|
||||||||||||||||||||||||||||||
|
Other segments
|
(
|
)
|
|
(
|
)
|
(
|
)
|
|
(
|
)
|
(
|
)
|
(
|
)
|
|
|
|
|||||||||||||||||||||||||||
|
Eliminations
|
|
|
|
|
|
|
|
|
|
(
|
)
|
(
|
)
|
|||||||||||||||||||||||||||||||
|
Total consolidated
|
|
|
|
|
(
|
)
|
(
|
)
|
|
|
|
|
|
|||||||||||||||||||||||||||||||
| (*) |
|
| (**) |
|
| (***) |
|
| (****) |
|
| (ii) |
The following table shows (in millions of soles) the distribution of the total revenue, operating revenue and non-current assets of the Group; all assigned based on the location of the clients and assets, respectively, as of
December 31, 2022, 2021 and 2020:
|
|
2022
|
2021
|
2020
|
||||||||||||||||||||||||||||||||||||||||||||||
|
Total
income (*)
|
Operating
income (**)
|
Total non
current
assets (***)
|
Total
liabilities
|
Total
income (*)
|
Operating
income (**)
|
Total non
current
assets (***)
|
Total
liabilities
|
Total
income (*)
|
Operating
income (**)
|
Total non
current
assets (***)
|
Total
liabilities
|
|||||||||||||||||||||||||||||||||||||
|
Peru
|
|
|
|
|
|
|
|
|
|
|
|
|
||||||||||||||||||||||||||||||||||||
|
Bermuda
|
|
(
|
)
|
|
|
|
(
|
)
|
|
|
(
|
)
|
(
|
)
|
|
|
||||||||||||||||||||||||||||||||
|
Panama (****)
|
|
|
|
|
|
|
|
|
|
(
|
)
|
|
|
|||||||||||||||||||||||||||||||||||
| Cayman Islands |
|
|
|
|
|
|
|
|
|
|
|
|
||||||||||||||||||||||||||||||||||||
|
Bolivia
|
|
|
|
|
|
|
|
|
|
|
|
|
||||||||||||||||||||||||||||||||||||
|
Colombia
|
|
|
|
|
|
|
|
|
|
|
|
|
||||||||||||||||||||||||||||||||||||
|
United States of America
|
|
|
|
|
|
|
|
|
|
|
|
|
||||||||||||||||||||||||||||||||||||
| Chile |
|
|
|
|
|
|
|
|
|
(
|
)
|
|
|
|||||||||||||||||||||||||||||||||||
| Others |
||||||||||||||||||||||||||||||||||||||||||||||||
|
Total consolidated
|
|
|
|
|
|
|
|
|
|
|
|
|
||||||||||||||||||||||||||||||||||||
| (*) |
|
| (**) |
|
| (***) |
|
| (****) |
|
F-131
| 32 |
TRANSACTIONS AND BALANCES WITH RELATED PARTIES
|
| a) |
The Group’s consolidated financial statements as of December 31, 2022 and 2021 include transactions with related parties, the Board of Directors, the Group’s key executives (defined as the Management of Credicorp) and the
companies which are controlled by these individuals through their majority shareholding or their role as Chairman or CEO.
|
| b) |
The
following table shows the main transactions and balances with related parties and individuals as of December 31, 2022 and 2021:
|
|
2022
|
2021
|
|||||||
|
S/(000)
|
S/(000)
|
|||||||
|
Statement of financial position -
|
||||||||
|
Direct loans
|
|
|
||||||
|
Investments (i)
|
|
|
||||||
|
Deposits (ii)
|
(
|
)
|
(
|
)
|
||||
|
Derivatives at fair value
|
|
|
||||||
| (i) |
|
| (ii) |
|
|
2022
|
2021
|
|||||||
|
S/(000)
|
S/(000)
|
|||||||
|
Statement of income
|
||||||||
|
Interest income related to loans
|
|
|
||||||
|
Interest expenses related to deposits
|
(
|
)
|
(
|
)
|
||||
|
Other income
|
|
|
||||||
|
Contingent risks and commitments
|
||||||||
|
Indirect loans
|
|
|
||||||
As of December 31, 2022,
the increase in deposit expenses is mainly due to higher deposits held by related parties and individuals.
F-132
| c) |
All transactions with related parties are made in accordance with normal market conditions available to other customers. As of December 31, 2022 and 2021, direct loans to related parties are secured
by collateral, had maturities between January 2022 and June 2029, and accrue an annual average
interest rate of
|
| d) |
As of December 31, 2022 and 2021, directors, officers and employees of the Group have been involved, directly and indirectly, in financial transactions with certain subsidiaries of the Group, as permitted by Peruvian Banking
and Insurance Law Nº26702, which regulates and limits certain transactions with employees, directors and officers of a bank or an insurance company. As of December 31, 2022 and 2021, direct loans to employees, directors, key
management and family members amounted to S/
|
| e) |
The Group’s key personnel compensation (including the
related income taxes assumed by the Group) as of December 31, 2022 and 2021 was as follows:
|
|
2022
|
2021
|
|||||||
|
S/(000)
|
S/(000)
|
|||||||
|
Director’s compensation
|
|
|
||||||
|
Senior Management Compensation:
|
||||||||
|
Remuneration
|
|
|
||||||
|
Stock awards vested
|
|
|
||||||
|
Total
|
|
|
||||||
| f) |
As of December 31, 2022 and 2021 the Group holds interests in different funds managed by certain of the Group’s subsidiaries. The details of the funds are presented below:
|
|
2022
|
2021
|
|||||||
|
S/(000)
|
S/(000)
|
|||||||
|
At fair value through profit or loss:
|
||||||||
|
Mutual funds, investment funds and hedge funds
|
||||||||
|
U.S. dollar (i)
|
|
|
||||||
|
Bolivianos
|
|
|
||||||
|
Colombian pesos
|
|
|
||||||
|
Soles(ii)
|
|
|
||||||
|
Chilean pesos
|
|
|
||||||
|
Total
|
|
|
||||||
|
Restricted mutual funds, Note 6(a)(iv)
|
|
|
|
|||||
|
|
(i) |
|
|
|
(ii) |
|
F-133
| g) |
The following table presents the main transactions between subsidiaries of de Group, which have been eliminated in the financial statement consolidation process:
|
|
|
2022
|
2021
|
||||||
|
S/(000)
|
|
S/(000)
|
|
|||||
|
Statement of financial position -
|
||||||||
|
Direct loans
|
|
|
||||||
|
Investments
|
|
|
||||||
|
Deposits
|
(
|
)
|
(
|
)
|
||||
|
Derivatives at fair value (*)
|
|
|
||||||
|
2022
|
2021
|
|||||||
|
S/(000)
|
|
S/(000)
|
|
|||||
|
Statement of income
|
||||||||
|
Interest income related to loans
|
|
|
||||||
|
Interest expenses related to deposits
|
(
|
)
|
(
|
)
|
||||
|
Other income
|
|
|
||||||
|
Contingent risks and commitments
|
||||||||
|
Indirect loans
|
|
|
||||||
| |
(*) |
|
F-134
| 33 |
FINANCIAL INSTRUMENTS CLASSIFICATION
|
The table below shows the carrying amounts of the financial assets and liabilities captions in the consolidated statement of financial position, by
categories as defined under IFRS 9 as of December 31,2022 and 2021:
|
2022
|
2021
|
|||||||||||||||||||||||||||||||||||||||||||||||
|
Financial assets and
liabilities at fair
value through profit or loss
|
Financial assets at fair value
through other comprehensive
income
|
Financial assets and
liabilities at fair
value through profit or loss
|
Financial assets at fair value
through other comprehensive
income
|
|||||||||||||||||||||||||||||||||||||||||||||
|
Investments
and derivates
|
Investments
designated at
inception
|
Investments
|
Investments
designated at
inception
|
Financial
assets and
liabilities
measured at
amortized cost
|
Total
|
Investments
and derivates
|
Investments
designated at
inception
|
Investments
|
Investments
designated at
inception
|
Financial
assets and
liabilities
measured at
amortized cost
|
Total
|
|||||||||||||||||||||||||||||||||||||
|
S/(000)
|
S/(000)
|
S/(000)
|
S/(000)
|
S/(000)
|
S/(000)
|
S/(000)
|
S/(000)
|
S/(000)
|
S/(000)
|
S/(000)
|
S/(000)
|
|||||||||||||||||||||||||||||||||||||
|
Assets
|
||||||||||||||||||||||||||||||||||||||||||||||||
|
Cash and due from banks
|
|
|
|
|
|
|
|
|
|
|
|
|
||||||||||||||||||||||||||||||||||||
|
Cash collateral, reverse repurchase agreements and securities borrowings
|
|
|
|
|
|
|
|
|
|
|
|
|
||||||||||||||||||||||||||||||||||||
|
At fair value through profit or loss
|
|
|
|
|
|
|
|
|
|
|
|
|
||||||||||||||||||||||||||||||||||||
|
Investments at fair value through other comprehensive income, Note 6(b)
|
|
|
|
|
|
|
|
|
|
|
|
|
||||||||||||||||||||||||||||||||||||
|
Amortized cost investments
|
|
|
|
|
|
|
|
|
|
|
|
|
||||||||||||||||||||||||||||||||||||
|
Loans, net
|
|
|
|
|
|
|
|
|
|
|
|
|
||||||||||||||||||||||||||||||||||||
|
Financial assets designated at fair value through profit or loss
|
|
|
|
|
|
|
|
|
|
|
|
|
||||||||||||||||||||||||||||||||||||
|
Premiums and other policies receivable
|
|
|
|
|
|
|
|
|
|
|
|
|
||||||||||||||||||||||||||||||||||||
|
Accounts receivable from reinsurers and coinsurers
|
|
|
|
|
|
|
|
|
|
|
|
|
||||||||||||||||||||||||||||||||||||
|
Due from customers on banker’s acceptances
|
|
|
|
|
|
|
|
|
|
|
|
|
||||||||||||||||||||||||||||||||||||
|
Other assets, Note 13(a)
|
|
|
|
|
|
|
|
|
|
|
|
|
||||||||||||||||||||||||||||||||||||
|
|
|
|
|
|
|
|
|
|
|
|
|
|||||||||||||||||||||||||||||||||||||
|
Liabilities
|
||||||||||||||||||||||||||||||||||||||||||||||||
|
Deposits and obligations
|
|
|
–
|
–
|
|
|
|
|
–
|
–
|
|
|
||||||||||||||||||||||||||||||||||||
|
Payables from repurchase agreements and securities lending
|
|
|
–
|
–
|
|
|
|
|
–
|
–
|
|
|
||||||||||||||||||||||||||||||||||||
|
Due to banks and correspondents
|
|
|
–
|
–
|
|
|
|
|
–
|
–
|
|
|
||||||||||||||||||||||||||||||||||||
|
Due from customers on banker’s acceptances
|
|
|
–
|
–
|
|
|
|
|
–
|
–
|
|
|
||||||||||||||||||||||||||||||||||||
|
Accounts payable to reinsurers and coinsurers
|
|
|
–
|
–
|
|
|
|
|
–
|
–
|
|
|
||||||||||||||||||||||||||||||||||||
|
Lease liabilities
|
|
|
–
|
–
|
|
|
|
|
–
|
–
|
|
|
||||||||||||||||||||||||||||||||||||
|
Financial liabilities at fair value through profit or loss
|
|
|
–
|
–
|
|
|
|
|
–
|
–
|
|
|
||||||||||||||||||||||||||||||||||||
|
Bonds and notes issued
|
|
|
–
|
–
|
|
|
|
|
–
|
–
|
|
|
||||||||||||||||||||||||||||||||||||
|
Other liabilities, Note 13(a)
|
|
|
–
|
–
|
|
|
|
|
–
|
–
|
|
|
||||||||||||||||||||||||||||||||||||
|
|
|
–
|
–
|
|
|
|
|
–
|
–
|
|
|
|||||||||||||||||||||||||||||||||||||
F-135
| 34 |
FINANCIAL AND NON-FINANCIAL RISK MANAGEMENT
|
The Group’s activities mainly comprise the use of financial instruments, including derivatives. It also accepts deposits from customers at both fixed and
floating rates, for various periods, and invests these funds in high-quality assets. Additionally, it places these deposits at fixed and variable rates with legal entities and individuals, considering the finance costs and expected
profitability.
The Group also trades in financial instruments where it takes positions in traded and over-the-counter instruments, derivatives included, to take advantage
of short-term market movements on securities, bonds, currencies and interest rates.
Given the Group’s activities, it has a framework for risk appetite, a cornerstone of the management. The risk management processes involve continuous
identification, measurement, treatment and monitoring. The Group is mainly exposed to operating risk, credit risk, liquidity risk, market risk, strategic risk and insurance technical risk. Finally, it reports on a consolidated basis the
risks to which the Group is exposed.
| a) |
Risk management structure -
|
The Board of Directors of the Group and of each subsidiary are ultimately responsible for identifying and controlling risks; however, there are separate
independent instances in the major subsidiaries responsible for managing and monitoring risks, as further explained below:
| (i) |
Group’s Board of Directors -
|
Credicorp Board of Directors –
The Board of Directors of Credicorp is responsible for the overall approach to risk management of Credicorp Ltd., including the approval of its appetite for
risk.
It also takes knowledge of the level of compliance of the appetite and the level of risk exposure, as well as the relevant improvements in the integral risk
management of Grupo Crédito and Subsidiaries of Credicorp (Group).
Grupo Crédito’s Board of Directors –
Grupo Crédito’s Board of Directors is responsible for the general approach to risk management of the Group’s subsidiaries and the approval of the risk
appetite levels that it is willing to assume. Furthermore, it approves the guidelines and policies for Integral Risk Management, promotes an organizational culture that emphasizes the importance of risk management, oversees the internal
control system and ensures the adequate performance of the Group’s regulatory compliance function.
Group Company Boards -
The Board of each company of the Group is responsible for aligning the risk management established by the Board of Grupo Crédito with the context of each one
of them. For that, it establishes a framework for risk appetite, policies and guidelines.
| (ii) |
Credicorp Risk Committee -
|
Represents the Credicorp Board of Directors, proposes the levels of risk appetite for Credicorp Ltd. Also, it is aware of the level of
compliance of the risk appetite and the level of exposure assumed by Grupo Crédito and Credicorp subsidiaries and the relevant improvements in integral management of risks of said entities.
F-136
The Committee will be made up of no less than three directors of Credicorp, at least one of which must be independent. Additionally,
the Board of Directors may incorporate as a member one or more directors of Credicorp subsidiaries. Also, the coordinator of the Committee will be the Credicorp Risk Manager, with the Internal Audit Manager as an observer member
(without voice or vote). Finally, the following officials will attend the sessions as guests, according to the agenda of topics to be discussed and at the invitation of the Coordinator: General Manager, Finance Manager, Manager of the
Risk Management Division of BCP, and all those people who criteria assist with the development of the session.
| (iii) |
Risk commitee of Grupo Crédito -
|
Represents the Board of Directors of Grupo Crédito in risk management decision-making. Furthermore, proposes Board of directors of
Grupo Crédito the levels of risk appetite. This Committee defines the strategies used for the adequate management of the different types of risks and the supervision of risk appetite, as well as the establishing of principles, policies
and general limits.
The Risk Committee is presided by no less than three Board members of Grupo Crédito, at least one of which must be independent.
Additionally, the Board of Directors may incorporate as a member one or more directors of the Group. Also, the coordinator of the Committee will be the Risk Manager of Grupo Crédito, with the Internal Audit Manager as an observer member
(without voice or vote). Finally, the following officials will attend the sessions as guests, according to the agenda of topics to be discussed and at the invitation of the Coordinator: General Manager, Finance Manager, Manager of the
Risk Management Division of BCP, and all those people who can assist with the development of the session.
In addition to effectively managing all the risks, the Risk Committee of Grupo Crédito Risk Committee is supported by the following committees which report
periodically on all relevant changes or issues relating to the risks being managed:
Corporate Credit Risk Committees (retail and non-retail)-
The Corporate Credit Risk Committees (retail and non-retail) are responsible for reviewing the tolerance level of the credit risk appetite, the limits of
exposure and the actions for the implementation of corrective measures, in case there are deviations. In addition, they propose credit risk management norms and policies within the framework of governance and the organization for the
integral management of credit risk. Furthermore, they propose the approval of any changes to the functions described above and important findings to the Grupo Crédito Risk Committee.
Corporate Committee for Market, Structural, Trading and Liquidity Risks
The Corporate Committee for Market, Structural, Trading and Liquidity Risks is in charge of analyzing and proposing corporate objectives, guidelines and policies for the Management of Market and
Liquidity Risks of the Group and the Group’s companies. In addition, it monitors the indicators and limits of the market risk appetite and liquidity of the Group and of each one of the companies of the Group. Likewise, it is
responsible for escalating managerial decisions above its authority to the Risk Committee of Grupo Crédito.
Corporate Model Risk Committee –
The Corporate Model Risk Committee is responsible for analyzing and proposing the corrective actions in case there are deviations with respect to the degrees
of exposure assumed in the Appetite for Model Risk. Likewise, it proposes the creation and/or modification of the government for model risk management, monitoring its compliance with the same. The Model Risk Committee monitors the
Group’s data and analytical strategy and the health status of the model portfolio. They are also responsible to inform the Risk Committee of Grupo Crédito on exposures, related to model risk, which involve variations in the risk
profile.
F-137
Corporate Operational Risk Methodology Committee -
The Corporate Methodological Committee of Operational Risk has as main responsibilities to review the main indicators of Operational Risk of the companies of
the Credicorp Group, as well as the progress of the methodologies deployed for Operational Risk and Business Continuity. Likewise, share best practices regarding the main challenges faced by the companies of the Group.
| (iv) |
Central Risk Management of Credicorp -
|
The Central Risk Management of Credicorp informs the Credicorp Risk Committee of the level of compliance of the risk appetite and the level of exposure
assumed by Grupo Crédito and Credicorp subsidiaries. Likewise, it reports the relevant improvements in the integral risk management of Grupo Crédito and Credicorp subsidiaries. In addition, it proposes to the Credicorp Risk Committee
the risk appetite levels for Credicorp Ltd.
| (v) |
Central Risk Management of Grupo Crédito -
|
The Central Risk Management is responsible for the implementation of policies, procedures, methodologies and the actions to be taken to identify, measure,
monitor, mitigate, report and control the different types of risks to which the Group is exposed. In addition, it is responsible for participating in the design and definition of the strategic plans of the business units to ensure that
they are aligned within the risk parameters approved by the Board of Directors of Grupo Crédito. Likewise, it disseminates the importance of adequate risk management, specifying in each of the units, the role that corresponds to them in
the timely identification and definition of the corresponding actions.
The units of the Central Risk Management that manage risk at the corporate level are the following:
Credit Division -
The Credit Division proposes credit policies and evaluation criteria and credit risk management that the Group assumes with customers in the wholesale segment.
It evaluates and authorizes loan proposals until their autonomy and proposes their approval to the higher instances for those that exceed it. These guidelines are established on the basis of the policies set by the Board of Directors
of Grupo Crédito, respecting the laws and regulations in force. In addition, it assesses the evolution of the risk of wholesale clients and identifies problematic situations, taking actions to mitigate or resolve them.
Risk Management Division -
The Risk Management Division is responsible for ensuring that risk management directives and policies comply with the established by the Board of Directors.
In addition, it is responsible for supervising the process of risk management and for coordinating with the companies of Credicorp involved in the whole process, promoting homogeneous risk management and aligned with the best practices.
It also has the task of informing Board of Directors regarding global exposure and by type of risk, as well as the specific exposure of each company of the group.
F-138
Retail Banking Risk Division -
The Retail Banking Risk Division is responsible for managing the risk profile of the retail portfolio and developing credit policies that are in accordance
with the guidelines and risk levels established by Grupo Crédito’s Board of Directors. Likewise, it participates in the definition of products and campaigns aligned to these policies, as well as in the design, optimization and
integration of credit evaluation tools and income estimation for credit management.
Likewise, there is an active and recurring participation of the BCP Retail Banking Risk Division in MiBanco’s Credit Risk and Collections Committee and in the BCB Retail Banking Risk Committee to
ensure alignment of best practices in terms of policies and guidelines credit, risk segmentation and credit risk models.
Non-financial Risks Division -
The Non-financial Risks Division is responsible for defining a non-financial risks strategy aligned with the objectives and risk appetite set by the Board of
Directors of Grupo Crédito. This strategy seeks to strengthen the management process, generate synergies, optimize resources and achieve better results among the units responsible for managing non-financial risks in the Group.
Additionally, in order to achieve the objectives defined in the non-financial risks strategy, the Division is responsible for promoting risk culture, developing talent, defining indicators and generating and following-up strategic
projects and initiatives.
| (vi) |
Internal Audit Division and Corporate Ethics and Compliance Division -
|
The Audit Division is in charge of monitoring on an ongoing basis the effectiveness and efficiency of the risk management function in the Group, verifying compliance with regulations,
policies, objectives and guidelines set by the Board of Directors, providing agile and timely assurance, advice and analysis based on risk and data. On the other hand, it evaluates sufficiency and integration level of Group’s
information and database systems. Finally, it ensures that independence is maintained between the functions of the risk management and business units, for each of the companies of the Group.
The Corporate Compliance and Ethics Division reports to the Board of Directors and is responsible for providing corporate policies to ensure that Group
companies specifically comply with regulations that specified them, and the guidelines established in the Code of Ethics.
| b) |
Risk measurement and reporting systems -
|
The risk is measured according to models and methodologies developed for the management of each type of risk. Risk reports that allow to monitor at the level
added and detailed the different types of risks of each company which is exposed. The system provides the facility to meet the appetite review needs by risk requested by the committees and areas described above; as well as comply with
regulatory requirements.
| c) |
Risk mitigation -
|
Depending on the type of risk, mitigating instruments are used to reduce its exposure, such as guarantees, derivatives, controls and insurance, among others.
Furthermore, it has policies linked to risk appetite and established procedures for each type of risk.
The Group actively uses guarantees to reduce its credit risks.
F-139
| d) |
Risk appetite -
|
Based on corporate risk management, The Board of Directors of Grupo Crédito approves the risk appetite framework to define the maximum level of risk that the
organization is willing to take as it seeks its strategic and financial objectives, maintaining a corporate vision in individual decisions of each entity. This Risk Appetite framework is based on “core” and specific metrics:
“Core” metrics are intended to preserve the organization’s strategic pillars, defined as solvency, liquidity, profit and growth, income stability and balance
sheet structure, no financial and cybersecurity risks.
Specific metrics objectives are intended to monitor on a qualitative and quantitative basis the different risks, to which the Group is exposed, as well as
define a tolerance threshold of each of those risks, so the risk profile set by the Board is preserved and any risk focus is anticipated on a more granular basis.
Risk appetite is instrumented through the following elements:
| - |
Risk appetite statement: It establishes explicit general principles and the qualitative statements which complement the risk strategy.
|
| - |
Metrics scorecards: These are used to define the levels of risk exposure in the different strategic pillars.
|
| - |
Limits: They allow control over the risk-taking process within the tolerance threshold established by the Board of Directors. They also provide accountability for the risk-taking process and define guidelines regarding the
target risk profile.
|
| - |
Government scheme: It seeks to guarantee compliance of the framework through different roles and responsibilities assigned to the units involved.
|
The appetite is integrated into the processes of strategic and capital guidelines, as well as in the definition of the annual budget, facilitating the
strategic decision making of the organization.
| e) |
Risk concentration -
|
Concentrations arise when a reduced and representative number of all of the counterparties of the Group are engaged in similar business
activities, or activities in the same geographic region, or have similar economic and political conditions among others.
In order to avoid excessive concentrations of risk, the policies and procedures include specific guidelines and limits to guarantee a diversified portfolio.
F-140
| 34.1 |
Credit risk -
|
| a) |
The Group takes on exposure to credit risk, which is the probability of suffering losses caused by debtors or counterparties failing to comply with payment obligations in on or off the balance sheet exposures.
|
Credit risk is the most important risk for the Group’s business; therefore, Management carefully manages its exposure to credit risk. Credit exposures mainly
arise from lending activities that lead to direct loans; they also result from investment activities. There is also credit risk in off-balance sheet financial instruments, such as contingent credits (indirect loans and due from
customers on acceptances), which expose Credicorp to risks similar to direct loans. Likewise, credit risk arises from derivative financial instruments that present positive fair values. Finally, all exposure to credit risk (direct or
indirect) is mitigated by the control processes and policies.
As part of managing this type of risk, provisions for impairment of its portfolio are assigned as of the date of the statement of financial position.
Credit risk levels are defined based on risk exposure limits, which are frequently monitored. Said limits are established in relation to one debtor or group
of debtors, geographical and industry segments. Furthermore, the risk limits by product, industry sector and by geographical segment are approved by the Risk Committee of Credicorp.
Exposure to credit risk is managed through regular analysis of the ability of debtors and potential debtors to meet payments of principal and interest on its
obligations and by changing the credit limits when it is appropriate. Other specific control measures are outlined below:
| (i) |
Collateral -
|
The Group employs a range of policies and practices to mitigate credit risk. The most traditional of these is collateralization which is common practice. The
Group implements guidelines on the acceptability of specific classes of collateral or credit risk mitigation. The main types of collateral obtained are as follows:
| - |
For loans and advances, collateral includes, among others, mortgages on residential properties; liens on business assets such as plants, inventory and receivables; and liens on financial instruments such as debt securities
and equity securities.
|
| - |
Long-term loans and financing to corporate entities are generally guaranteed. Loans to micro business generally have no collateral. In order to minimize credit loss, the Group will seek additional collateral from the
counterparty as soon as impairment indicators arise.
|
| - |
For repurchase agreements and securities lending, collateral consists of fixed income instruments, cash and loans.
|
Collateral held as security for financial assets other than loans is determined by the nature of the instrument. Debt securities, treasury and other eligible
bills are generally unsecured, with the exception of assets backed securities and similar instruments, which are secured by portfolios of financial instruments.
Management monitors the market value of collateral, requests additional collateral in accordance with the underlying agreement, and monitors the market value
of collateral obtained during its review of the adequacy of the allowance for impairment losses. As part of the Group’s policies, the recovered goods are sold in seniority order. The proceeds of the sale are used to reduce or amortize
the outstanding credit. In general, the Group does not use recovered assets for its operational purposes.
F-141
| (ii) |
Derivatives -
|
The amount subject to credit risk is limited to the current and potential fair value of instruments that are favorable to the Group (fair value is positive).
In the case of derivatives this is only a small fraction of the contract, or notional values used to express the volume of instruments outstanding. This credit risk exposure is managed as a portion of the total credit limits with
customers, together with potential exposures from market movements. Collateral or other security is not usually obtained for this type of risk exposure.
| (iii) |
Credit-related commitments -
|
The primary purpose of these instruments is to ensure that funds are available to a customer as required. Guarantees and letters of credit have the same
credit risk as direct loans. Documentary and commercial letters of credit - which are written undertakings by the Group on behalf of a customer authorizing a third party to draw drafts on the Group up to a stipulated amount under
specific terms and conditions - are collateralized by the underlying shipments of goods to which they relate and therefore have less risk than a direct loan. The Group has no mandatory commitments to extend credit.
| b) |
The maximum exposure to credit risk as of December 31, 2021 and 2020 before the effect of mitigation through any collateral, is the carrying amount of each class of financial assets indicated in Notes 34.8(a), 34.8(b) and the
contingent credits detailed in Note 21(a).
|
| c) |
Credit risk management for loans -
|
Credit risk management is mainly based on the rating and scoring internal models of each company of the Group. In Credicorp, quantitative and qualitative
analysis are made for each client, regarding their financial position, credit behavior in the financial system and the market in which they operate or are located. This analysis is carried out continuously to characterize the risk
profile of each operation and client with a credit position in the Group.
In the Group, a loan is internally classified as past due according to three criteria: the number of days past due based on the contractually agreed due
date, the subsidiary and the type of credit. The detail is shown below:
| - |
Banco de Crédito del Perú, Mibanco y Solución Empresa Administradora Hipotecaria internally classify a loan as past due
|
| - |
For corporate, large and medium companies, when it has more than 15 days in arrears.
|
| - |
For small and microbusiness when it has more than 30 days in arrears.
|
| - |
For overdrafts when it has more than 30 days in arrears.
|
| - |
For consumer, mortgage and leasing operations, installments are internally classified as past due when they are between 30 and 90 days in arrears; after 90 days, the pending loan balance is considered past due.
|
| - |
Mibanco Colombia internally classifies a loan as past due:
|
| - |
For commercial loans when it has more than 90 days in arrears.
|
| - |
For microbusiness loans when it has more than 60 days in arrears.
|
| - |
For consumer loans when it has more than 60 days in arrears.
|
| - |
For mortgage loans when it has more than 30 days in arrears.
|
F-142
| - |
ASB Bank Corp. internally classifies a loan as past due when it has 1 or more days in arrears.
|
| - |
Banco de Crédito de Bolivia internally classifies a loan as past due when it has 30 or more days in arrears.
|
Estimate for
the expected credit loss -
The
measurement of the expected credit loss is based on the product of the following risk parameters: (i) probability of default (PD), (ii) loss given default (LGD), and (iii) exposure at default (EAD); discounted at the reporting date
using the effective interest rate. The definition of the parameters is presented below:
| - |
Probabilidad de incumplimiento (PD): It is a credit rating measure that is given internally to a client with the objective of estimating its
probability of default within a specific time horizon. The process of obtaining the PD is carried out considering three main components: (i) the risk observed at the portfolio level, (ii) the macroeconomic perspectives of
the main countries where Credicorp operates and (iii) the individual risk of each credit, which It is measured through rating and scoring tools.
|
The Group considers that a financial instrument is in default if it meets the following conditions, according to the type of asset:
| - |
Consumer products, credit card and SME: if the client, at some certain point, presents arrears equal to or greater than 60 days and/or has operations that
are refinanced, restructured, in pre-judicial, judicial proceedings or written off.
|
| - |
Mortgage products: if the client, at some certain point, presents arrears equal to or greater than 120 days and/or has operations that are refinanced,
restructured, in pre-judicial, judicial proceedings or written off.
|
| - |
Commercial products: if the client, at some certain point, is in the Collections portfolio, or has a risk classification of Deficient,
Doubtful or Loss, or has operations that are refinanced, in pre-judicial, judicial proceedings or written off. Also, a client can be considered as default if it shows signs of significant qualitative impairment.It should
be noted that, for commercial debtors with the highest debt that are classified in default, Risk Management performs an individual review to determine the expected loss in each case, in which it considers: (i) knowledge of
the specific situation of the client, (ii) the coverage of real guarantees, (iii) the financial information available, (iv) the conditions of the sector in which the company operates, (v) among others.
|
| - |
Investments: if the instrument has a default rating according to external rating agencies such as Fitch, Standard & Poor’s or Moody’s, or if it has an
indicator of arrears equal to or greater than 90 days. In addition, an issuer can be considered as default if it shows signs of significant qualitative impairment or if it is in default according to the definition for
Commercial products. When an issuer is classified as default, all its instruments are also classified as Default, that is, in stage 3.
|
| - |
Loss given default (LGD): this is a measurement which estimates the severity of the loss that would be incurred at the time of the default. It has two
approaches in the estimate of the severity of the loss, according to the stage of the client:
|
| - |
LGD workout: this is the real loss of the clients that arrived at the stage of default. The recoveries and costs of each one of the operations are used to
calculate this parameter (includes open and closed recovery processes).
|
F-143
| - |
LGD ELBE (expected loss best estimate): this is the loss of the contracts in a default situation based on the time in arrears of the operation (the longer the operation is in default, the greater
will be the loss).
|
| - |
Exposure at default (EAD): this is a measurement which estimates the exposure at the time of the client’s default, considering changes in future exposure, for example, in the case of prepayments
and/or greater utilization of unused credit lines.
|
The estimate of the risk parameters considers information regarding the actual conditions, as well as the projections of future
macroeconomic events and conditions in three scenarios (base, optimistic and pessimistic), which are weighted to obtain the expected credit loss.
The fundamental difference between the expected credit loss of a loan allocated in stage 1 and stage 2 is the PD’s time horizon. The
estimates in stage 1 use a PD with a maximum time horizon of 12 months, while those in stage 2 use a PD measured for the remaining lifetime of the instrument. The estimates in stage 3 are carried out based on an LGD “best estimate”.
For those portfolios that are not material and/or do not have specific credit scoring models, the option was to extrapolate the expected credit loss ratio of portfolios with comparable characteristics.
The main methodological calibrations made in the internal credit risk models during 2022 were:
| - |
PD models: in accordance with our internal governance scheme, throughout 2022 we still monitor the performance of the PD models and implement the necessary calibrations to maintain
a proper measurement of the credit risk of our loan portfolio.
|
| - |
LGD models: throughout 2022, we calibrated in a comprehensive manner the LGD models of the Retail and SME portfolios in order to maintain an adequate level of precision in estimating
the loss at the time of default. This calibration included the use of data comprising the observed behavior during the pandemic, the updating of the methodological assumptions and certain revisions to improve the
consideration of the guarantees of impaired mortgage loans in the measurement of the recovery rate.
|
Prospective information -
The measurement of the expected credit loss for each stage and the evaluation of significant increase in credit risk consider information on previous events
and current conditions, as well as reasonable projections based on future events and economic conditions.
For the estimation of the risk parameters (PD, LGD, EAD), used in the calculation of the expected credit loss in Phase 1 and Phase 2, the significance of the macroeconomic variables (or their
variations) that have greater influence in each portfolio. which give a better prospective and systemic vision to the estimation, based on econometric techniques. Each macroeconomic scenario used in the calculation of the expected
credit loss considers projections of relevant macroeconomic variables, such as the gross domestic product (GDP), terms of trade, inflation, among others, for a period of 3 years and a long-term projection.
The expected credit loss is a weighted estimate that considers three future macroeconomic scenarios (base, optimistic, pessimistic). These scenarios, as well as the probability of occurrence
of each one, are projections provided by the internal team of Economic Studies and approved by Senior Management; these projections are made for the main countries where Credicorp operates. The design of the scenarios is reviewed
quarterly. All considered scenarios are applied to portfolios subject to expected credit loss with the same probabilities.
F-144
Changes from one stage to another:
The classification of an instrument as stage 1 or stage 2 depends on the concept of “significant increase in credit risk” at the reporting date compared to
the origin date. This classification is updated monthly. As the IFRS 9 states, this classification depends on the following criteria:
| - |
An account is classified in stage 2 if it has more than 30 days in arrears.
|
| - |
Additionally, significant risk increase thresholds were established based on absolute and relative thresholds that depend on the level of risk in which the instrument originated. The thresholds differ for each of the
portfolios considered.
|
| - |
Additional qualitative reviews are carried out based on the risk segmentation used in the management of Retail Banking and an individual review is carried out in Wholesale Banking.
|
Additionally, all those accounts classified as default at the reporting date, according to the definition used by the Group, are considered as stage 3.
Evaluations of significant increase in credit risk from initial recognition and credit impairment are carried out independently on each reporting date.
Wholesale banking assets can be moved in both directions from one stage to another; in this regard, a financial asset that migrated to stage 2 will return to stage 1 if its credit risk did not
increase significantly from its initial recognition until a subsequent reporting period. Likewise, an asset that is in stage 3 will return to stage 2 if the asset is no longer considered to be impaired (according to our definition of default) during a certain number of subsequent reporting periods.
On the other hand, Retail Banking assets that migrated to Phase 2 will return to Phase 1 if their credit risk has not increased significantly since initial recognition during a certain number of subsequent reporting periods (cure period). In the case of assets housed in Phase 3, these will not return to Phase 2 except for refinanced loans, which will return to Phase 2 if good payment behavior is demonstrated during a certain number of subsequent reporting periods.
Expected life -
For the instruments in stage 2 or 3, the allowance for loan losses will cover the expected credit loss during the expected time of the remaining lifetime of the instrument. For most
instruments, the expected life is limited to the remaining contractual life, adjusted by expected anticipated payments. In the case of revolving products, a statistical analysis was carried out to determine what would be the expected
life period.
F-145
The following is a summary of the direct credits classified into three important groups and their respective allowance for loan losses for each type of loan; it is important to note that impaired loans are
loans in default that are in stage 3. Additionally, it should be noted that, in accordance with IFRS 7, the total balance of the loan is considered overdue when the debtor has failed to make a payment at its contractual maturity.
| (i) |
Loans neither past due nor impaired, which comprise those direct loans which currently do not have characteristics of delay in payments and which are not in default.
|
| (ii) |
Past due but not impaired loans, which comprise all of the direct loans of customers who are not in default but have failed to make a payment at its
contractual maturity, according to IFRS 7.
|
| (iii) |
Impaired loans, those direct loans considered to be in stage 3 or default, as detailed in Note 34.1(c).
|
|
2022
|
2021
|
|||||||||||||||||||||||||||||||
|
Commercial loans
|
Stage 1
|
Stage 2
|
Stage 3
|
Total
|
Stage 1
|
Stage 2
|
Stage 3
|
Total
|
||||||||||||||||||||||||
|
S/(000)
|
S/(000)
|
S/(000)
|
S/(000)
|
S/(000)
|
S/(000)
|
S/(000)
|
S/(000)
|
|||||||||||||||||||||||||
|
Neither past due nor impaired
|
|
|
|
|
|
|
|
|
||||||||||||||||||||||||
|
Past due but not impaired
|
|
|
|
|
|
|
|
|
||||||||||||||||||||||||
|
Impaired
|
|
|
|
|
|
|
|
|
||||||||||||||||||||||||
|
Gross
|
|
|
|
|
|
|
|
|
||||||||||||||||||||||||
|
Less: Provision for loan losses
|
|
|
|
|
|
|
|
|
||||||||||||||||||||||||
|
Total, net
|
|
|
|
|
|
|
|
|
||||||||||||||||||||||||
|
Residential mortgage loans
|
Stage 1
|
Stage 2
|
Stage 3
|
Total
|
Stage 1
|
Stage 2
|
Stage 3
|
Total
|
||||||||||||||||||||||||
|
S/(000)
|
S/(000)
|
S/(000)
|
S/(000)
|
S/(000)
|
S/(000)
|
S/(000)
|
S/(000)
|
|||||||||||||||||||||||||
|
Neither past due nor impaired
|
|
|
|
|
|
|
|
|
||||||||||||||||||||||||
|
Past due but not impaired
|
|
|
|
|
|
|
|
|
||||||||||||||||||||||||
|
Impaired
|
|
|
|
|
|
|
|
|
||||||||||||||||||||||||
|
Gross
|
|
|
|
|
|
|
|
|
||||||||||||||||||||||||
|
Less: Provision for loan losses
|
|
|
|
|
|
|
|
|
||||||||||||||||||||||||
|
Total, net
|
|
|
|
|
|
|
|
|
||||||||||||||||||||||||
|
Microbusiness loans
|
Stage 1
|
Stage 2
|
Stage 3
|
Total
|
Stage 1
|
Stage 2
|
Stage 3
|
Total
|
||||||||||||||||||||||||
|
S/(000)
|
S/(000)
|
S/(000)
|
S/(000)
|
S/(000)
|
S/(000)
|
S/(000)
|
S/(000)
|
|||||||||||||||||||||||||
|
Neither past due nor impaired
|
|
|
|
|
|
|
|
|
||||||||||||||||||||||||
|
Past due but not impaired
|
|
|
|
|
|
|
|
|
||||||||||||||||||||||||
|
Impaired
|
|
|
|
|
|
|
|
|
||||||||||||||||||||||||
|
Gross
|
|
|
|
|
|
|
|
|
||||||||||||||||||||||||
|
Less: Provision for loan losses
|
|
|
|
|
|
|
|
|
||||||||||||||||||||||||
|
Total, net
|
|
|
|
|
|
|
|
|
||||||||||||||||||||||||
|
Consumer loans
|
Stage 1
|
Stage 2
|
Stage 3
|
Total
|
Stage 1
|
Stage 2
|
Stage 3
|
Total
|
||||||||||||||||||||||||
|
S/(000)
|
S/(000)
|
S/(000)
|
S/(000)
|
S/(000)
|
S/(000)
|
S/(000)
|
S/(000)
|
|||||||||||||||||||||||||
|
Neither past due nor impaired
|
|
|
|
|
|
|
|
|
||||||||||||||||||||||||
|
Past due but not impaired
|
|
|
|
|
|
|
|
|
||||||||||||||||||||||||
|
Impaired
|
|
|
|
|
|
|
|
|
||||||||||||||||||||||||
|
Gross
|
|
|
|
|
|
|
|
|
||||||||||||||||||||||||
|
Less: Provision for loan losses
|
|
|
|
|
|
|
|
|
||||||||||||||||||||||||
|
Total, net
|
|
|
|
|
|
|
|
|
||||||||||||||||||||||||
|
Consolidated of loans
|
Stage 1
|
Stage 2
|
Stage 3
|
Total
|
Stage 1
|
Stage 2
|
Stage 3
|
Total
|
||||||||||||||||||||||||
|
S/(000)
|
S/(000)
|
S/(000)
|
S/(000)
|
S/(000)
|
S/(000)
|
S/(000)
|
S/(000)
|
|||||||||||||||||||||||||
|
Total gross direct loans, Note 7(a)
|
|
|
|
|
|
|
|
|
||||||||||||||||||||||||
|
Total credit losses, Note 7(a)
|
|
|
|
|
|
|
|
|
||||||||||||||||||||||||
|
Total net direct loans
|
|
|
|
|
|
|
|
|
||||||||||||||||||||||||
F-146
The general explanation of the variations in the allowance for loan losses is found in Note 7(c).
At Credicorp, we separate renegotiated loans into two groups, focusing on operations that have suffered a significant increase in credit risk since their disbursement, which has
generated modifications to the original loan agreement. Both groups are defined below:
| - |
Refinanced loans: these are loans that have undergone modifications in the initial loan agreement (term and interest rate), according to the accounting definition.
|
| - |
Renegotiated loans due to the COVID-19 pandemic: these are loans for which, due to the pandemic, the SBS and other local regulators have established that
certain benefits
be granted, and that Credicorp has also voluntarily granted to its clients (grace periods, debt consolidation, etc.), which were not in the initial credit agreements. It should be noted that these loans were granted mainly
during 2020 and 2021.
|
The amount of the gross balance of the portfolio and provision of the renegotiated credits of Credicorp is shown below. The
presentation is made for each of the two groups defined above and by opening the balances by stage. It should be noted that for the construction of the tables, the information of the three subsidiaries that concentrate more than
95.0 percent of the balance of renegotiated loans (BCP, Mibanco and BCB) has been considered.
As of December 31, 2022, and 2021, renegotiated loans and their expected credit loss are composed as follows:
|
|
|
2022
|
|
|
2021
|
|
||||||||||
|
|
|
Refinanced loans
|
|
|
Allowance for loan losses
|
|
|
Refinanced loans
|
|
|
Allowance for loan losses
|
|
||||
|
S/(000)
|
S/(000)
|
S/(000)
|
S/(000)
|
|||||||||||||
|
|
|
|
|
|
|
|
|
|
|
|
|
|
|
|
|
|
|
Stage 1
|
|
|
|
|
|
|
|
|
|
|
|
|
|
|
|
|
|
Stage 2
|
|
|
|
|
|
|
|
|
|
|
|
|
|
|
|
|
|
Stage 3
|
|
|
|
|
|
|
|
|
|
|
|
|
|
|
|
|
|
Total
|
|
|
|
|
|
|
|
|
|
|
|
|
|
|
|
|
|
|
|
2022
|
|
|
2021
|
|
||||||||||
|
|
|
Renegotiated loans COVID
|
|
|
Allowance for loan losses
|
|
|
Renegotiated loans COVID
|
|
|
Allowance for loan losses
|
|
||||
|
S/(000)
|
S/(000)
|
S/(000)
|
S/(000)
|
|||||||||||||
|
|
|
|
|
|
|
|
|
|
|
|
|
|
|
|
|
|
|
Stage 1
|
|
|
|
|
|
|
|
|
|
|
|
|
|
|
|
|
|
Stage 2
|
|
|
|
|
|
|
|
|
|
|
|
|
|
|
|
|
|
Stage 3
|
|
|
|
|
|
|
|
|
|
|
|
|
|
|
|
|
|
Total
|
|
|
|
|
|
|
|
|
|
|
|
|
|
|
|
|
The detail of the gross amount of impaired direct loans by type of loan, together with the fair value of the related
collateral and the amounts of its allowance for loan losses, are as follows:
|
2022
|
2021
|
|||||||||||||||||||||||||||||||||||||||
|
Commercial loans
|
Residential mortgage loans
|
Microbusiness loans
|
Consumer loans
|
Total
|
Commercial loans
|
Residential mortgage loans
|
Microbusiness loans
|
Consumer loans
|
Total
|
|||||||||||||||||||||||||||||||
|
S/(000)
|
S/(000)
|
S/(000)
|
S/(000)
|
S/(000)
|
S/(000)
|
S/(000)
|
S/(000)
|
S/(000)
|
S/(000)
|
|||||||||||||||||||||||||||||||
|
|
||||||||||||||||||||||||||||||||||||||||
|
Impaired loans
|
|
|
|
|
|
|
|
|
|
|
||||||||||||||||||||||||||||||
|
Fair value of collateral
|
|
|
|
|
|
|
|
|
|
|
||||||||||||||||||||||||||||||
|
Provision for credit losses
|
|
|
|
|
|
|
|
|
|
|
||||||||||||||||||||||||||||||
F-147
On the other hand, the breakdown of direct loans classified by maturity is shown below, according to the following criteria:
| (i) |
Current loans, which comprise those direct loans which do not currently have characteristics of delay in payment, nor are they in default or stage 3, according to the rules of IFRS 9.
|
| (ii) |
Current but impaired loans, which comprise those direct loans which do not currently have characteristics of delay in payment, but are in default or stage 3, according to IFRS 9.
|
| (iii) |
Loans with payment delay of one day or more but that are not past due according to our internal guidelines, which comprise those direct loans of customers who have failed to make a payment at its contractual maturity, that
is, with at least one day past due. However, the days of delay in payment are insufficient to be considered as past due under the Group’s internal criteria.
|
| (iv) | Past due loans under internal criteria. |
The total of the concepts: loans with a delay of payment from the first day and the amounts of the internal overdue loans reflect the totality of “past due”
loans consistent with IFRS 7.
|
2022
|
2021
|
|||||||||||||||||||||||||||||||||||||||||||||||
|
Current loans
|
Current but impaired loans
|
Loans with delays in
payments of one day or more but not considered internal overdue loans
|
Internal
overdue loans
|
Total
|
Total past
due under
IFRS 7
|
Current loans
|
Current but impaired loans
|
Loans with delays in payments of one day or more but not considered internal overdue loans
|
Internal
overdue loans
|
Total
|
Total past
due under
IFRS 7
|
|||||||||||||||||||||||||||||||||||||
|
S/(000)
|
S/(000)
|
S/(000)
|
S/(000)
|
S/(000)
|
S/(000)
|
S/(000)
|
S/(000)
|
S/(000)
|
S/(000)
|
S/(000)
|
S/(000) | |||||||||||||||||||||||||||||||||||||
|
Neither past due nor impaired
|
|
|
|
|
|
|
|
|
|
|
|
|
||||||||||||||||||||||||||||||||||||
|
Past due but not impaired
|
|
|
|
|
|
|
|
|
|
|
|
|
||||||||||||||||||||||||||||||||||||
|
Impaired debt
|
|
|
|
|
|
|
|
|
|
|
|
|
||||||||||||||||||||||||||||||||||||
|
Total
|
|
|
|
|
|
|
|
|
|
|
|
|
||||||||||||||||||||||||||||||||||||
F-148
The classification of loans by type of loan and maturity is as follows:
|
2022
|
2021
|
|||||||||||||||||||||||||||||||||||||||
|
Current loans
|
Current but impaired loans
|
Loans with delays in payments of one day or more but not considered internal overdue loans
|
Internal overdue loans
|
Total
|
Current loans
|
Current but impaired loans
|
Loans with delays in payments of one day or more but not considered internal overdue loans
|
Internal overdue loans
|
Total
|
|||||||||||||||||||||||||||||||
|
S/(000)
|
S/(000)
|
S/(000)
|
S/(000)
|
S/(000)
|
S/(000)
|
S/(000)
|
S/(000)
|
S/(000)
|
S/(000)
|
|||||||||||||||||||||||||||||||
|
Commercial loans
|
|
|
|
|
|
|
|
|
|
|
||||||||||||||||||||||||||||||
|
Residential mortgage loans
|
|
|
|
|
|
|
|
|
|
|
||||||||||||||||||||||||||||||
|
Microbusiness loans
|
|
|
|
|
|
|
|
|
|
|
||||||||||||||||||||||||||||||
|
Consumer loans
|
|
|
|
|
|
|
|
|
|
|
||||||||||||||||||||||||||||||
|
Total
|
|
|
|
|
|
|
|
|
|
|
||||||||||||||||||||||||||||||
Macroeconomic scenario -
The expected credit loss is a weighted estimate of three macroeconomic scenarios: base, optimistic and pessimistic, that are calculated with macroeconomic
projections provided by the internal team of Economic Studies and approved by the Senior Management. The local and international information flows available during the analysis period are used to feed projections, which reflect the fact
that Peru is a small and open economy, and in this context approximately 60.0 percent of the volatility in economic growth
is driven by external factors, including terms of trade, the growth of Peru’s trading partners; and the external interest rates. Information on each of these factors is gathered to construct each scenario for the next three years.
The variables mentioned above, together with local variables (fiscal and monetary variables), are incorporated in the economic models. In this regard two
types of models are used:
| (i) |
Structural projection model.
|
| (ii) |
Financial programming model.
|
The first one is a dynamic stochastic general equilibrium model, which is constructed with expectations. The second is built with the main identities of
national accounts in accordance with the financial programming methodology designed by the IMF (International Monetary Fund) and the methodologies used by a battery of econometric models.
Through this process, projections of GDP growth, inflation, exchange rate and other macroeconomic variables are obtained for the years 2022, 2023 and
2024. We expect GDP to grow around 2.3 percent in 2023 (2.8 percent by 2022) due to:
| i) |
Lower global growth.
|
|
ii)
|
Lagged effect on activity as a result of monetary tightening (increase this year in interest rates in dollars and soles by the Central Banks).
|
|
iii)
|
Accumulated inflation 2021-2023 close to
|
|
iv)
|
Drop in public investment due to the change of subnational authorities.
|
|
v)
|
Deterioration of private investment in the absence of large new projects and weak business
expectations.
|
|
vi)
|
Post-Covid-19 rebound effect is exhausted and is limited almost only to international inbound
tourism.
|
F-149
For the period 2022 -2024, probabilities of 50.0 percent, 25.0 percent, and 25.0
percent were considered for the baseline, optimistic, and pessimistic scenarios, respectively (60.0 percent, 30.0 percent, and 10.0
percent, respectively, at the end of December 2021). The probabilities assigned to each scenario and the projections are validated through a fanchart analysis, which uses the probability function to identify and analyze:
| i) |
The central tendency of the projections.
|
| ii) |
The dispersion
that is expected around this value, and values higher or lower than the central value more or less probable.
|
The following table provides a comparison between the carrying amount of allowance for loan losses for direct loans, indirect loans and due from customers on
banker’s acceptances, and its estimation under three scenarios: base, optimistic and pessimistic.
|
2022
|
2021
|
|||||||
|
S/(000)
|
S/(000)
|
|||||||
|
|
||||||||
|
Carrying amount
|
|
|
||||||
|
Scenarios:
|
||||||||
|
Optimistic
|
|
|
||||||
|
Base Case
|
|
|
||||||
|
Pessimistic
|
|
|
||||||
F-150
| d) |
Credit risk management on reverse repurchase agreements and securities borrowing -
|
Most of these operations are performed by Credicorp Capital. The Group has implemented credit limits for each counterparty and most of transactions are
collateralized with investment grade financial instruments and financial instruments issued by Governments.
| e) |
Credit risk management on investments -
|
The Group evaluates the credit risk identified of each of the investments, disclosing the risk rating granted to them by a risk rating agency. For
investments traded in Peru, risk ratings used are those provided by the three most prestigious Peruvian rating agencies (authorized by Peruvian regulator) and for investments traded abroad, the risk-ratings used are those provided by
the three most prestigious international rating agencies.
In the event that any subsidiary uses a risk-rating prepared by any other risk rating agency, said risk-ratings are standardized with those provided by the
above-mentioned institutions for consolidation purposes.
The following table shows the analysis of the risk-rating of the investments at fair value through profit or loss, at fair value through other comprehensive
income and amortized cost provided by the institutions referred to above:
|
2022
|
2021
|
|||||||||||||||
|
S/(000)
|
|
%
|
S/(000)
|
|
%
|
|||||||||||
|
Instruments rated in Peru:
|
||||||||||||||||
|
AAA
|
|
|
|
|
||||||||||||
|
AA- a AA+
|
|
|
|
|
||||||||||||
|
A- to A+ (i)
|
|
|
|
|
||||||||||||
|
BBB- to BBB+
|
|
|
|
|
||||||||||||
|
BB- to BB+
|
|
|
|
|
||||||||||||
|
Lower and equal to +B
|
|
|
|
|
||||||||||||
|
Unrated:
|
||||||||||||||||
|
BCRP certificates of deposit (ii)
|
|
|
|
|
||||||||||||
|
Listed and unlisted securities
|
|
|
|
|
||||||||||||
|
Restricted mutual funds
|
|
|
|
|
||||||||||||
|
Investment funds
|
|
|
|
|
||||||||||||
|
Mutual funds
|
|
|
|
|
||||||||||||
|
Hedge funds
|
||||||||||||||||
|
Other instruments
|
|
|
|
|
||||||||||||
|
Subtotal
|
|
|
|
|
||||||||||||
F-151
|
2022
|
2021
|
|||||||||||||||
|
S/(000)
|
|
%
|
S/(000)
|
|
%
|
|||||||||||
|
Instruments rated abroad:
|
||||||||||||||||
|
AAA
|
|
|
|
|
||||||||||||
|
AA- a AA+
|
|
|
|
|
||||||||||||
|
A- to A+
|
|
|
|
|
||||||||||||
|
BBB- to BBB+
|
|
|
|
|
||||||||||||
|
BB- to BB+
|
|
|
|
|
||||||||||||
|
Lower and equal to +B
|
|
|
|
|
||||||||||||
|
Unrated:
|
||||||||||||||||
|
Listed and unlisted securities
|
|
|
|
|
||||||||||||
|
Mutual funds
|
|
|
|
|
||||||||||||
|
Participations of RAL funds
|
|
|
|
|
||||||||||||
|
Investment funds
|
|
|
|
|
||||||||||||
|
Hedge funds
|
|
|
|
|
||||||||||||
|
Other instruments
|
|
|
|
|
||||||||||||
|
Subtotal
|
|
|
|
|
||||||||||||
|
Total
|
|
|
|
|
||||||||||||
| (i) |
|
| (ii) |
|
It is worth mentioning that the change in the risk-rating of the investments has had an impact on the measurement of the expected loss.
F-152
| f) |
Concentration of financial instruments exposed to credit risk -
|
As of December 31, 2022 and 2021, financial instruments with exposure to credit risk were distributed considering the following economic sectors:
|
2022
|
2021
|
|||||||||||||||||||||||||||||||||||||||
|
At fair value
through profit for loss
|
At fair value
through profit for loss
|
|||||||||||||||||||||||||||||||||||||||
|
Held for
trading,
hedging and
others (*)
|
Designated
at inception
|
Financial
assets at
amortized
cost
|
At fair value
through other
comprehensive
income
investments
|
Total
|
Held for
trading,
hedging and
others (*)
|
Designated
at inception
|
Financial
assets at
amortized
cost
|
At fair value
through other
comprehensive
income
investments
|
Total
|
|||||||||||||||||||||||||||||||
|
S/(000)
|
S/(000)
|
S/(000)
|
S/(000)
|
S/(000)
|
S/(000)
|
S/(000)
|
S/(000)
|
S/(000)
|
S/(000)
|
|||||||||||||||||||||||||||||||
|
|
||||||||||||||||||||||||||||||||||||||||
|
Central Reserve Bank of Peru
|
|
|
|
|
|
|
|
|
|
|
||||||||||||||||||||||||||||||
|
Financial services
|
|
|
|
|
|
|
|
|
|
|
||||||||||||||||||||||||||||||
|
Commerce
|
|
|
|
|
|
|
|
|
|
|
||||||||||||||||||||||||||||||
|
Manufacturing
|
|
|
|
|
|
|
|
|
|
|
||||||||||||||||||||||||||||||
|
Government and public administration
|
|
|
|
|
|
|
|
|
|
|
||||||||||||||||||||||||||||||
|
Mortgage loans
|
|
|
|
|
|
|
|
|
|
|
||||||||||||||||||||||||||||||
|
Consumer loans
|
|
|
|
|
|
|
|
|
|
|
||||||||||||||||||||||||||||||
|
Real estate and leasing
|
|
|
|
|
|
|
|
|
|
|
||||||||||||||||||||||||||||||
|
Communications, storage and transportation
|
|
|
|
|
|
|
|
|
|
|
||||||||||||||||||||||||||||||
|
Electricity, gas and water
|
|
|
|
|
|
|
|
|
|
|
||||||||||||||||||||||||||||||
|
Community services
|
|
|
|
|
|
|
|
|
|
|
||||||||||||||||||||||||||||||
|
Construction
|
|
|
|
|
|
|
|
|
|
|
||||||||||||||||||||||||||||||
|
Mining
|
|
|
|
|
|
|
|
|
|
|
||||||||||||||||||||||||||||||
|
Agriculture
|
|
|
|
|
|
|
|
|
|
|
||||||||||||||||||||||||||||||
|
Hotels and restaurants
|
|
|
|
|
|
|
|
|
|
|
||||||||||||||||||||||||||||||
|
Education, health and others
|
|
|
|
|
|
|
|
|||||||||||||||||||||||||||||||||
|
Insurance
|
|
|
|
|
|
|
|
|
|
|
||||||||||||||||||||||||||||||
|
Fishing
|
|
|
|
|
|
|
|
|
|
|
||||||||||||||||||||||||||||||
|
Others
|
|
|
|
|
|
|
|
|
|
|
||||||||||||||||||||||||||||||
|
Total
|
|
|
|
|
|
|
|
|
|
|
||||||||||||||||||||||||||||||
| (*) |
|
F-153
As of December 31, 2022 and 2021 financial instruments with exposure to credit risk were distributed by the following geographical areas:
|
2022
|
2021
|
|||||||||||||||||||||||||||||||||||||||
|
At fair value
through profit for loss
|
At fair value
through profit for loss
|
|||||||||||||||||||||||||||||||||||||||
|
Held for
trading,
hedging and
others (*)
|
Designated
at inception
|
Financial
assets at
amortized
cost
|
At fair value
through other
comprehensive
income
investments
|
Total
|
Held for
trading,
hedging and
others (*)
|
Designated
at inception
|
Financial
assets at
amortized
cost
|
At fair value
through other
comprehensive
income
investments
|
Total
|
|||||||||||||||||||||||||||||||
|
S/(000)
|
S/(000)
|
S/(000)
|
S/(000)
|
S/(000)
|
S/(000)
|
S/(000)
|
S/(000)
|
S/(000)
|
S/(000)
|
|||||||||||||||||||||||||||||||
|
|
||||||||||||||||||||||||||||||||||||||||
|
Peru
|
|
|
|
|
|
|
|
|
|
|
||||||||||||||||||||||||||||||
|
Bolivia
|
|
|
|
|
|
|
|
|
|
|
||||||||||||||||||||||||||||||
|
United States of America
|
|
|
|
|
|
|
|
|
|
|
||||||||||||||||||||||||||||||
|
Colombia
|
|
|
|
|
|
|
|
|
|
|
||||||||||||||||||||||||||||||
|
Chile
|
|
|
|
|
|
|
|
|
|
|
||||||||||||||||||||||||||||||
|
Brazil
|
|
|
|
|
|
|
|
|
|
|
||||||||||||||||||||||||||||||
|
Mexico
|
|
|
|
|
|
|
|
|
|
|
||||||||||||||||||||||||||||||
|
Panama
|
|
|
|
|
|
|
|
|
|
|
||||||||||||||||||||||||||||||
| Canada |
||||||||||||||||||||||||||||||||||||||||
|
Europe:
|
||||||||||||||||||||||||||||||||||||||||
|
Luxembourg
|
||||||||||||||||||||||||||||||||||||||||
|
France
|
|
|
|
|
|
|
|
|
|
|
||||||||||||||||||||||||||||||
|
United Kingdom
|
|
|
|
|
|
|
|
|
|
|
||||||||||||||||||||||||||||||
|
Others in Europe
|
|
|
|
|
|
|
|
|
|
|
||||||||||||||||||||||||||||||
|
Spain
|
|
|
|
|
|
|
|
|
|
|
||||||||||||||||||||||||||||||
|
Switzerland
|
|
|
|
|
|
|
|
|
|
|
||||||||||||||||||||||||||||||
|
Netherlands
|
|
|
|
|
|
|
|
|
|
|
||||||||||||||||||||||||||||||
|
Multilateral Organizations (**)
|
|
|
|
|
|
|
|
|
|
|
||||||||||||||||||||||||||||||
|
Others
|
|
|
|
|
|
|
|
|
|
|
||||||||||||||||||||||||||||||
|
Total
|
|
|
|
|
|
|
|
|
|
|
||||||||||||||||||||||||||||||
| (*) |
|
| (**) |
|
F-154
| g) |
Offsetting financial assets and liabilities -
|
The disclosures set out in the tables below include financial assets and liabilities that:
| - |
Are offset in the Group’s consolidated statement of financial position; or
|
| - |
Are subject to an enforceable master netting arrangement or similar agreement that covers similar financial instruments, irrespective of whether they are offset in the consolidated statement of financial position.
|
Similar agreements include derivative netting agreements, master repurchase agreements, and master securities lending agreements. Similar financial
instruments include derivatives, accounts receivable from reverse repurchase agreements and securities borrowing, payables from repurchase agreements and securities lending and other financial assets and liabilities. Financial
instruments such as loans and deposits are not disclosed in the tables below because they are not offset in the consolidated statement of financial position.
The offsetting framework contract issued by the International Swaps and Derivatives Association Inc. (“ISDA”) and similar master netting arrangements do not
meet the criteria for offsetting in the consolidated statement of financial position, because said agreements were created in order for both parties to have an enforceable offsetting right in cases of default, insolvency or bankruptcy
of the Group or the counterparties or following other predetermined events. In addition, the Group and its counterparties do not intend to settle said instruments on a net basis or to realize the assets and settle the liabilities
simultaneously.
The Group receives and gives collateral in the form of cash and trading securities in respect of the following transactions:
| - |
Derivatives,
|
| - |
Accounts receivable from reverse repurchase agreements and securities borrowing,
|
| - |
Payables from repurchase agreements and securities lending, and
|
| - |
Other financial assets and liabilities
|
Such collateral adheres to standard industry terms including, when appropriate, an ISDA Credit Support Annex (CSA). This means that securities received/given
as collateral can be pledged or sold during the term of the transaction but have to be returned on maturity of the transaction. The terms also give each party the right to terminate the related transactions upon the counterparty’s
failure to return the respective collateral.
F-155
Financial assets subject to offsetting, enforceable master netting agreements and similar agreements:
|
2022
|
||||||||||||||||||||
|
Net of financial
assets presented
in the consolidated
statements of
financial position
|
Related amounts not offset in the
consolidated statement of
financial position
|
|||||||||||||||||||
|
Details
|
Gross amounts
recognized
financial assets
|
Financial
instruments
|
Cash
collateral
received
|
Net amount
|
||||||||||||||||
|
S/(000)
|
S/(000)
|
S/(000)
|
S/(000)
|
S/(000)
|
||||||||||||||||
|
Receivables from derivatives
|
|
|
(
|
)
|
(
|
)
|
|
|||||||||||||
|
Cash collateral, reverse repurchase agreements and securities borrowing
|
|
|
|
(
|
)
|
|
||||||||||||||
|
Investments at fair value through other comprehensive income and amortized cost pledged as collateral
|
|
|
(
|
)
|
|
|
||||||||||||||
|
Total
|
|
|
(
|
)
|
(
|
)
|
|
|||||||||||||
|
2021
|
||||||||||||||||||||
|
Net of financial
assets presented
in the consolidated
statements of
financial position
|
Related amounts not offset in the
consolidated statement of
financial position
|
|||||||||||||||||||
|
Details
|
Gross amounts
recognized
financial assets
|
Financial
instruments
|
Cash
collateral
received
|
Net amount
|
||||||||||||||||
|
S/(000)
|
S/(000)
|
S/(000)
|
S/(000)
|
S/(000)
|
||||||||||||||||
|
Receivables from derivatives
|
|
|
(
|
)
|
(
|
)
|
|
|||||||||||||
|
Cash collateral, reverse repurchase agreements and securities borrowing
|
|
|
|
(
|
)
|
|
||||||||||||||
|
Available-for-sale and held-to-maturity investments pledged as collateral
|
|
|
(
|
)
|
|
|
||||||||||||||
|
Total
|
|
|
(
|
)
|
(
|
)
|
|
|||||||||||||
F-156
Financial liabilities subject to offsetting, enforceable netting master agreements and similar agreements:
|
2022
|
||||||||||||||||||||
|
Net amounts of
financial liabilities
presented in the
consolidated
statement of financial
position
|
Related amounts not offset in
the consolidated statement of
financial position
|
|||||||||||||||||||
|
Details
|
Gross amounts of
recognized financial
liabilities
|
Financial
instruments
|
Cash
collateral
pledged
|
Net amount
|
||||||||||||||||
|
S/(000)
|
S/(000)
|
S/(000)
|
S/(000)
|
S/(000)
|
||||||||||||||||
|
Payables on derivatives
|
|
|
(
|
)
|
(
|
)
|
|
|||||||||||||
|
Payables on repurchase agreements and securites lending
|
|
|
(
|
)
|
(
|
)
|
|
|||||||||||||
|
Total
|
|
|
(
|
)
|
(
|
)
|
|
|||||||||||||
|
2021
|
||||||||||||||||||||
|
Net amounts of
financial liabilities
presented in the
consolidated
statement of financial
position
|
Related amounts not offset in
the consolidated statement of
financial position
|
|||||||||||||||||||
|
Details
|
Gross amounts of
recognized financial
liabilities
|
Financial
instruments
|
Cash
collateral
pledged
|
Net amount
|
||||||||||||||||
|
S/(000)
|
S/(000)
|
S/(000)
|
S/(000)
|
S/(000)
|
||||||||||||||||
|
Payables on derivatives
|
|
|
(
|
)
|
(
|
)
|
|
|||||||||||||
|
Payables on repurchase agreements and securites lending
|
|
|
(
|
)
|
(
|
)
|
|
|||||||||||||
|
Total
|
|
|
(
|
)
|
(
|
)
|
|
|||||||||||||
The gross amounts of financial assets and liabilities disclosed in the above tables have been measured in the consolidated statement of
financial position on the following basis:
| - |
Derivative assets and liabilities are measured at fair value.
|
| - |
Receivables from reverse repurchase agreements and securities lending are measured at amortized cost.
|
| - |
Financial liabilities are measured at fair value.
|
The difference between the carrying amount in the consolidated statement of financial position and the amounts presented in the tables above for derivatives
(presented in other assets Note 13(c)), receivables from reverse repurchase agreement and securities borrowing and payables from repurchase agreements and securities lending and financial liabilities measured at fair value through
profit or loss are financial instruments outside of the scope of offsetting disclosure.
F-157
| 34.2 |
Market risk -
|
The Group has exposure to market risk, which is the risk that the fair value or future cash flows of a financial instrument will
fluctuate because of changes in market prices. Market risks arise from open positions in interest rates, currency, commodities and equity products; all of which are exposed to general and specific market movements and changes in the
level of volatility of prices such as interest rates, credit spreads, foreign exchange rates and equity prices. Due to the order of the Group’s current activities, commodity price risk has not been approved, so this type of instrument
is not agreed.
The Group separates exposures to market risk in two groups: (i) those that arise from value fluctuation of trading portfolios
recognized at fair value through profit or loss due to movements of market rates or prices (Trading Book) and (ii) those that arise from changes in the structural positions of non-trading portfolios due to movements of the interest
rates, prices and foreign exchange ratios (Banking Book) and that are recorded at amortized cost and at fair value through other comprehensive income, this is due to movements in interest rates, prices and currency exchange rates.
The risks that trading portfolios face are managed through Value at Risk (VaR) historical simulation techniques; while non-trading
portfolios (Banking Book) are monitored using rate sensitivity metrics, which are a part of Asset and Liability Management (ALM).
| a) |
Trading Book -
|
The trading book is characterized for having liquid positions in stocks, bonds, foreign currencies and derivatives, arising from
market-making transactions where the Group acts as principal with the customers or with the market. This portfolio includes investments and derivatives classified by Management as held for trading.
| (i) |
Value at Risk (VaR) -
|
The Group applies the VaR approach to its trading portfolio to estimate the market risk of the main positions held and the maximum
losses that are expected, based upon a number of assumptions for various changes in market conditions and considering the risk appetite of the subsidiary.
Daily calculation of VaR is a statistically based estimate of the maximum potential loss on the current portfolio from adverse market
movements.
VaR expresses the “maximum” amount the Group might lose, but only to a certain level of confidence (99 percent). There is therefore a specified statistical probability (1 percent) that actual loss could be greater than the VaR estimate. The VaR model assumes a certain “holding period” until positions can be closed (1 - 10 days).
The time horizon used to calculate VaR is one day ; however, the one-day VAR is amplified to a 10 -day time frame and calculated by multiplying the one-day VaR by the square root of 10 . This adjustment will be accurate only if the
changes in the portfolio in the following days have a normal distribution independent and identically distributed; because of that, the result is multiplied by a non-normality adjustment factor. The limits and consumptions of the VaR
are established based on the risk appetite and the trading strategies of each subsidiary.
The evaluation of the movements of the trading portfolio has been based on annual historical information and 133 market risk factors, which are detailed below: 36 market curves, 71 stock prices, 22 mutual fund values and 4 series of volatility.
The Group directly applies these historical changes in rates to each position in its current portfolio (method known as historical simulation).
F-158
The Group Management considers that the market risk factors, incorporated in their VaR model, are adequate to measure the market
risk to which its trading portfolio is exposed.
The use of this approach does not prevent losses outside of these limits in the event of more significant market movements. Losses
exceeding the VaR figure may occur, on average under normal market conditions, not more than once every hundred days.
VaR limits have been established to control and keep track of all the risks taken. These risks arise from the size of the positions
and/or the volatility of the risk factors embedded in each financial instrument. Regular reports are prepared for the Treasury Risk Committee and ALM, the Risk Management Committee and Senior Management.
VaR results are used to generate economic capital estimates by market risk, which are periodically monitored and are part of the
overall risk appetite of each subsidiary. Furthermore, at Group level, there is also a limit to the risk appetite of the trading portfolio, which is monitored and informed to the Treasury Risks and ALM Credicorp Committee.
In VaR calculation, the effects of the exchange rate are not included because said effects are measured in the net monetary position,
see note 34.2 (b)(ii).
The Group’s VaR showed an increase as of December 31, 2022, mainly explained by higher rate risk due to the increase in exposure to
fixed income instruments in the Colombian market. The VaR remained contained within the risk appetite limits established by the Risk Management of each Subsidiary.
As of December 31, 2022, and 2021, the Group’s VaR by risk type is as follows:
|
2022
|
2021 | |||||||
|
S/(000)
|
S/(000)
|
|||||||
|
|
||||||||
|
Interest rate risk
|
|
|
||||||
|
Price risk
|
|
|
||||||
|
Volatility risk
|
|
|
||||||
|
Diversification effect
|
(
|
)
|
(
|
)
|
||||
|
Consolidated VaR by type of risk
|
|
|
||||||
On the other hand, the instruments recorded as fair values through profit or loss are not part of the selling business model and are
considered as part of the sensitivity analysis of rates in the next section. See the table of sensitivity of earnings at risk, net economic value and price sensitivity.
|
b)
|
Banking Book –
|
Non-trading portfolios which comprise the Banking Book are exposed to different risks, given that they are sensitive to market rate
movements, which could bring about a deterioration in the value of assets compared to liabilities and hence to a reduction of their net worth.
|
(i)
|
Interest rate risk –
|
The Banking Book-related interest rate risk arises from eventual changes in interest rates that may adversely affect the expected
gains (risk gains) or market value of financial assets and liabilities reported on the balance sheet (net economic value). The Group assumes the exposure to the interest rate risk that may affect their fair value as well as the cash
flow risk of future assets and liabilities.
The Risk Committee sets the guidelines regarding the level of unmatched repricing of interest rates that can be tolerated, which is
periodically monitored through ALCO.
F-159
Corporate policies include guidelines for the management of the Group’s exposure to the interest rate risk. These guidelines are
implemented considering the features of each segment of business in which the Group entities operate.
In this regard, Group companies that are exposed to the interest rate risk are those that have yields based on interest, such as
credits, investments and technical reserves. Interest rate risk management in BCP, BCB, MiBanco – Banco de la Microempresa, , Mibanco – Banco de la Microempresa de Colombia, ASB Bank Corp. and Pacífico Seguros is carried out by
performing a repricing gap analysis, sensitivity analysis of the financial margin and sensitivity analysis of the net economic value (NEV). These calculations consider different rate shocks in stress scenarios.
Analysis of repricing gap -
The repricing gap analysis is intended to measure the risk exposure of interest rate for repricing periods, in which both balance and
out of balance assets and liabilities are grouped. This allows identifying those sections in which the rate variations would have a potential impact.
F-160
The table below summarizes the Group’s exposure to interest rate risks. It includes the Group’s financial instruments at carrying
amounts, categorized by the earlier of contractual re-pricing or maturity dates, what occurs first:
|
2022
|
||||||||||||||||||||||||||||
|
Up to 1
month
|
1 to 3
months
|
3 to 12
months
|
1 to 5
years
|
More than
5 years
|
Non-interest
bearing
|
Total
|
||||||||||||||||||||||
|
S/(000)
|
S/(000)
|
S/(000)
|
S/(000)
|
S/(000)
|
S/(000)
|
S/(000)
|
||||||||||||||||||||||
|
Assets
|
||||||||||||||||||||||||||||
|
Cash and cash collateral, reverse repurchase agreements and securities borrowing
|
|
|
|
|
|
|
|
|||||||||||||||||||||
|
Investments
|
|
|
|
|
|
|
|
|||||||||||||||||||||
|
Loans, net
|
|
|
|
|
|
|
|
|||||||||||||||||||||
|
Financial assets designated at fair value through profit or loss
|
|
|
|
|
|
|
|
|||||||||||||||||||||
|
Premiums and other policies receivable
|
|
|
|
|
|
|
|
|||||||||||||||||||||
|
Accounts receivable from reinsurers and coinsurers
|
|
|
|
|
|
|
|
|||||||||||||||||||||
|
Other assets (*)
|
|
|
|
|
|
|
|
|||||||||||||||||||||
|
Total assets
|
|
|
|
|
|
|
|
|||||||||||||||||||||
|
Liabilities
|
||||||||||||||||||||||||||||
|
Deposits and obligations
|
|
|
|
|
|
|
|
|||||||||||||||||||||
|
Payables from repurchase agreements and securities lending
|
|
|
|
|
|
|
|
|||||||||||||||||||||
|
Accounts payable to reinsurers and coinsurers
|
|
|
|
|
|
|
|
|||||||||||||||||||||
|
Technical reserves for claims and insurance premiums
|
|
|
|
|
|
|
|
|||||||||||||||||||||
|
Financial liabilities at fair value through profit or loss
|
|
|
|
|
|
|
|
|||||||||||||||||||||
|
Bonds and Notes issued
|
|
|
|
|
|
|
|
|||||||||||||||||||||
|
Other liabilities (*)
|
|
|
|
|
|
|
|
|||||||||||||||||||||
|
Equity
|
|
|
|
|
|
|
|
|||||||||||||||||||||
|
Total liabilities and equity
|
|
|
|
|
|
|
|
|||||||||||||||||||||
|
Risks and contingent commitments
|
||||||||||||||||||||||||||||
|
Derivative financial assets
|
|
|
|
|
|
|
|
|||||||||||||||||||||
|
Derivative financial liabilities
|
|
|
|
|
|
|
|
|||||||||||||||||||||
|
|
|
|
(
|
)
|
(
|
)
|
|
|
||||||||||||||||||||
|
Marginal gap
|
|
|
|
(
|
)
|
|
(
|
)
|
(
|
)
|
||||||||||||||||||
|
Accumulated gap
|
|
|
|
|
|
(
|
)
|
|
||||||||||||||||||||
(*) Other
assets and other liabilities only include financial accounts.
Investments
for trading purposes are not considered (investments at fair value through profit or loss and trading derivatives), because these instruments are part of the trading book and the Value at Risk methodology is used to measure market
risks.
F-161
|
2021
|
||||||||||||||||||||||||||||
|
Up to 1
month
|
1 to 3
months
|
3 to 12
months
|
1 to 5
years
|
More than
5 years
|
Non-interest
bearing
|
Total
|
||||||||||||||||||||||
|
S/(000)
|
S/(000)
|
S/(000)
|
S/(000)
|
S/(000
|
S/(000)
|
S/(000)
|
||||||||||||||||||||||
|
Assets
|
||||||||||||||||||||||||||||
|
Cash and cash collateral, reverse repurchase agreements and securities borrowing
|
|
|
|
|
|
|
|
|||||||||||||||||||||
|
Investment
|
|
|
|
|
|
|
|
|||||||||||||||||||||
|
Loans, net
|
|
|
|
|
|
(
|
)
|
|
||||||||||||||||||||
|
Financial assets designated at fair value through profit or loss
|
|
|
|
|
|
|
|
|||||||||||||||||||||
|
Premiums and other policies receivable
|
|
|
|
|
|
|
|
|||||||||||||||||||||
|
Accounts receivable from reinsurers and coinsurers
|
|
|
|
|
|
|
|
|||||||||||||||||||||
|
Other assets (*)
|
|
|
|
|
|
|
|
|||||||||||||||||||||
|
Total assets
|
|
|
|
|
|
|
|
|||||||||||||||||||||
|
Liabilities
|
||||||||||||||||||||||||||||
|
Deposits and obligations
|
|
|
|
|
|
|
|
|||||||||||||||||||||
|
Payables from repurchase agreements and securities lending
|
|
|
|
|
|
|
|
|||||||||||||||||||||
|
Accounts payable to reinsurers and coinsurers
|
||||||||||||||||||||||||||||
|
Technical reserves for claims and insurance premiums
|
|
|
|
|
|
|
|
|||||||||||||||||||||
|
Financial liabilities at fair value through profit or loss
|
|
|
|
|
|
|
|
|||||||||||||||||||||
|
Bonds and Notes issued
|
|
|
|
|
|
|
|
|||||||||||||||||||||
|
Other liabilities (*)
|
|
|
|
|
|
|
|
|||||||||||||||||||||
|
Equity
|
|
|
|
|
|
|
|
|||||||||||||||||||||
|
Total liabilities and equity
|
|
|
|
|
|
|
|
|||||||||||||||||||||
|
Risks and contingent commitments
|
||||||||||||||||||||||||||||
|
Derivative financial assets
|
|
|
|
|
|
|
|
|||||||||||||||||||||
|
Derivative financial liabilities
|
|
|
|
|
|
|
|
|||||||||||||||||||||
|
|
|
(
|
)
|
(
|
)
|
|
|
|
||||||||||||||||||||
|
Marginal gap
|
|
|
|
(
|
)
|
|
(
|
)
|
(
|
)
|
||||||||||||||||||
|
Accumulated gap
|
|
|
|
(
|
)
|
|
(
|
)
|
|
|||||||||||||||||||
(*) Other
assets and other liabilities only include financial accounts.
Investments
for trading purposes are not considered (investments at fair value through profit or loss and trading derivatives), because these instruments are part of the trading book and the Value at Risk methodology is used to measure market
risks.
F-162
Sensitivity to changes in interest rates -
The sensitivity analysis of a reasonable possible change in interest rates on the banking book comprises an assessment of the
sensitivity of the financial margins that seeks to measure the potential changes in the interest accruals over a period of time and the expected movement of the interest rate curves, as well as the sensibility of the net economic
value, which is a long-term metric measured as the difference arising between the net economic value of assets and liabilities before and after a variation in interest rates.
The sensitivity of the financial margin is the effect of the assumed changes in interest rates on the net financial interest income
before income tax and non-controlling interest for one year, based on non-trading financial assets and financial liabilities held as of December 31, 2022, and 2021, including the effect of derivative instruments.
The sensitivity of the net economic value is calculated by reassessing the financial assets and liabilities sensitive to rates,
except for the trading instruments, including the effect of any associated hedge, and derivative instruments designated as a cash flow hedge. Regarding rate risk management, no distinction is made by accounting category for the
investments that are considered in these calculations.
The results of the sensitivity analysis regarding changes in interest rates as of December 31, 2022 and 2021 are presented below:
|
2022
|
|||||||||
|
Currency
|
Changes in
basis points
|
Sensitivity of net
profit
|
Sensitivity of Net
Economic Value
|
||||||
|
S/(000)
|
S/(000)
|
||||||||
|
Soles
|
+/-
|
|
+/-
|
|
-/+
|
|
|||
|
Soles
|
+/-
|
|
+/-
|
|
-/+
|
|
|||
|
Soles
|
+/-
|
|
+/-
|
|
-/+
|
|
|||
|
Soles
|
+/-
|
|
+/-
|
|
-/+
|
|
|||
|
U.S. Dollar
|
+/-
|
|
+/-
|
|
+/-
|
|
|||
|
U.S. Dollar
|
+/-
|
|
+/-
|
|
+/-
|
|
|||
|
U.S. Dollar
|
+/-
|
|
+/-
|
|
+/-
|
|
|||
|
U.S. Dollar
|
+/-
|
|
+/-
|
|
+/-
|
|
|||
|
2021
|
|||||||||
|
Currency
|
Changes in
basis points
|
Sensitivity of net
profit
|
Sensitivity of Net
Economic Value
|
||||||
|
S/(000)
|
S/(000)
|
||||||||
|
Soles
|
+/-
|
|
-/+
|
|
-/+
|
|
|||
|
Soles
|
+/-
|
|
-/+
|
|
-/+
|
|
|||
|
Soles
|
+/-
|
|
-/+
|
|
-/+
|
|
|||
|
Soles
|
+/-
|
|
-/+
|
|
-/+
|
|
|||
|
U.S. Dollar
|
+/-
|
|
+/-
|
|
+/-
|
|
|||
|
U.S. Dollar
|
+/-
|
|
+/-
|
|
+/-
|
|
|||
|
U.S. Dollar
|
+/-
|
|
+/-
|
|
+/-
|
|
|||
|
U.S. Dollar
|
+/-
|
|
+/-
|
|
+/-
|
|
|||
F-163
The interest rate sensitivities set out in the table above are only illustrative and are based on simplified scenarios. The figures
represent the effect of the pro-forma movements in the net interest income based on the projected yield curve scenarios and the Group’s current interest rate risk profile. This effect, however, does not incorporate actions that would
be taken by Management to mitigate the impact of this interest rate risk.
The Group seeks proactively to change the interest rate risk profile to minimize losses and optimize net revenues. The projections
above also assume that the interest rate of all maturities moves by the same amount and, therefore, do not reflect the potential impact on net interest income of some rates changing while others remain unchanged.
As of December 31, 2022 and 2021, investments in equity securities and funds that are non-trading, recorded at fair value through
other comprehensive income and at fair value through profit or loss, respectively, are not considered as comprising investment securities for interest rate sensitivity calculation purposes; however, sensitivity tests have been
conducted for variations of 10 , 25 and 30 percent in the market prices of these securities.
The market price sensitivity tests as of December 31, 2021 and 2020 are presented below:
|
Equity securities
|
||||||||||||
|
Measured at fair value through other comprehensive income
|
Change in
market prices
|
2022
|
2021
|
|||||||||
| % |
S/(000)
|
S/(000)
|
||||||||||
|
|
||||||||||||
|
Equity securities
|
+/-
|
|
|
|||||||||
|
Equity securities
|
+/-
|
|
|
|||||||||
|
Equity securities
|
+/-
|
|
|
|||||||||
|
Funds
|
||||||||||||
|
Measured at fair value through profit or loss
|
Change in
market prices
|
2022
|
2021
|
|||||||||
| % |
S/(000)
|
S/(000)
|
||||||||||
|
|
||||||||||||
|
Participation in mutual funds
|
+/-
|
|
|
|||||||||
|
Participation in mutual funds
|
+/-
|
|
|
|||||||||
|
Participation in mutual funds
|
+/-
|
|
|
|||||||||
|
Restricted mutual funds
|
+/-
|
|
|
|||||||||
|
Restricted mutual funds
|
+/-
|
|
|
|||||||||
|
Restricted mutual funds
|
+/-
|
|
|
|||||||||
|
Participation in RAL funds
|
+/-
|
|
|
|||||||||
|
Participation in RAL funds
|
+/-
|
|
|
|||||||||
|
Participation in RAL funds
|
+/-
|
|
|
|||||||||
|
Investment funds
|
+/-
|
|
|
|||||||||
|
Investment funds
|
+/-
|
|
|
|||||||||
|
Investment funds
|
+/-
|
|
|
|||||||||
|
Hedge funds
|
+/-
|
|
|
|||||||||
|
Hedge funds
|
+/-
|
|
|
|||||||||
|
Hedge funds
|
+/-
|
|
|
|||||||||
|
Exchange Trade Funds
|
+/-
|
|
|
|||||||||
|
Exchange Trade Funds
|
+/-
|
|
|
|||||||||
|
Exchange Trade Funds
|
+/-
|
|
|
|||||||||
F-164
(ii) Foreign currency exchange risk -
The Group is exposed to fluctuations in foreign currency exchange rates, which
impact net open monetary positions and equity positions in a different currency than the Group’s functional currency.
The Group’s monetary position is made up of the net open position of
monetary assets, monetary liabilities and off-balance sheet items expressed in foreign currency for which the entity itself assumes the risk; as well as the equity position generated by the investment in the Group’s subsidiaries
whose functional currency is different from soles. In the first case, any appreciation/depreciation of the foreign currency would affect the
consolidated income statement, on the contrary, in the case of the equity position, any appreciation/depreciation of the foreign currency will be recognized in other comprehensive income.
The Group manages foreign currency exchange risk, which affects the income statement, by monitoring and controlling currency
positions exposed to movements in exchange rates. The market risk units of each subsidiary establish limits for said positions, which are approved by their own committees, and monitor and follow up the limits considering their foreign
exchange trading positions, their most structural foreign exchange positions, as well as their sensitivities. Additionally, there is a monetary position limit at the Credicorp level, which is monitored and reported to the Group’s Risk
Committee.
On the other hand, the Group manages foreign currency exchange risk whose fluctuation is recognized in other comprehensive income, monitoring and
controlling equity positions and their sensitivities, which are reported to the Group’s Risk Committee.
Net foreign exchange gains/losses recognized in the consolidated statement of income are disclosed in the following items:
• Net gain on foreign exchange transactions.
• Net gain on Derivatives held for trading.
• Net Result from exchange difference.
As of December 31, 2022, the foreign currency in which the Group has the greatest exposure is the U.S.
Dollar. The free market exchange rate for purchase and sale transactions of each U.S. dollar as of December 31, 2022 was S/3.814
( S/3.987 as of December 31, 2021).
F-165
Transactions in foreign currency are made at free market exchange rates of the countries where Credicorp’s Subsidiaries are
established. As of December 31,2022 and 2021, the net open monetary position with effect on results and the equity position of the Group was as follows:
|
|
2022
|
2021
|
||||||||||||||||||||||
|
|
U.S. Dollar
|
Other
currencies
|
Total |
U.S. Dollar
|
Other
currencies
|
Total | ||||||||||||||||||
|
S/(000)
|
|
S/(000)
|
|
S/(000) |
S/(000)
|
|
S/(000)
|
|
S/(000) | |||||||||||||||
|
|
||||||||||||||||||||||||
|
Total monetary assets
|
|
|
|
|
||||||||||||||||||||
|
Total monetary liabilities
|
(
|
)
|
(
|
)
|
( |
) |
(
|
)
|
(
|
)
|
( |
) | ||||||||||||
|
|
(
|
)
|
|
( |
) |
(
|
)
|
|
( |
) | ||||||||||||||
|
|
||||||||||||||||||||||||
|
Currency derivatives
|
( |
) | ( |
) | ||||||||||||||||||||
|
Accounting hedge (investment abroad) (*)
|
|
|
|
|
||||||||||||||||||||
|
Net monetary position with effect on consolidated statement of income
|
||||||||||||||||||||||||
|
Net monetary position with effect on equity
|
||||||||||||||||||||||||
|
|
||||||||||||||||||||||||
|
Net monetary position
|
|
|
|
|
||||||||||||||||||||
As of December 31, 2022, the monetary position with effect on equity in other currencies is mainly made up of the equity of subsidiaries in Bolivian pesos for S/954.7 million, in Colombian pesos for S/566.7 million and, in
Chilean pesos for S/348.0 million, among other minors. As of December 31,2021,the monetary position with effect on equity in other
currencies was mainly made up of the equity of subsidiaries in Bolivian pesos for S/928.6 million, in Colombian pesos
for S/638.6 million and, in Chilean pesos for S/304.4 million, among other minors.
(*) An accounting
hedge of net investment abroad was carried out where part of our liability position in dollars related to the balance of the caption “bonds and notes issued”, see Note 17(iv), was designated as cover our permanent investment in
Atlantic Security Holding.
F-166
The following tables show the sensitivity analysis of the main currencies to which the Group is exposed, and which affect the consolidated income
statement and other comprehensive income as of December 31, 2022 and 2021.
The analysis determines the effect of a reasonably possible variation of the exchange rate against the sun for each of the currencies independently, considering all other variables constant. A negative amount shows a potential net reduction in the consolidated income statement and other comprehensive income, while a positive amount reflects a potential increase.
Sensitivity analysis of the foreign exchange position with effect in the consolidated income statement is shown below:
|
Currency rate sensibility
|
Change in
currency
rates
|
2022
|
2021
|
|||||||||
|
%
|
S/(000)
|
S/(000)
|
||||||||||
|
Depreciation -
|
||||||||||||
|
Soles in relation to U.S. Dollar
|
|
|
|
|||||||||
|
Soles in relation to U.S. Dollar
|
|
|
|
|||||||||
|
Appreciation -
|
||||||||||||
|
Soles in relation to U.S. Dollar
|
|
(
|
)
|
(
|
)
|
|||||||
|
Soles in relation to U.S. Dollar
|
|
(
|
)
|
(
|
)
|
|||||||
The following is the
sensitivity analysis of the foreign exchange position with effect in other comprehensive income, being the main currencies of exposure: U.S. Dollar, Boliviano,Colombian Peso and Chilean Peso. This analysis is shown as of
December 31, 2022 and 2021:
|
Currency rate sensibility
|
Change in
currency
rates
|
2022
|
2021 |
|||||||||
|
%
|
S/(000)
|
S/(000)
|
||||||||||
|
Depreciation -
|
||||||||||||
|
Soles in relation
to U.S. Dollar
|
|
|
|
|||||||||
|
Soles in relation
to U.S. Dollar
|
|
|
|
|||||||||
|
Appreciation -
|
||||||||||||
|
Soles in relation
to U.S. Dollar
|
|
(
|
)
|
(
|
)
|
|||||||
|
Soles in relation
to U.S. Dollar
|
|
(
|
)
|
(
|
)
|
|||||||
|
Currency rate sensibility
|
Change in
currency
rates
|
2022
|
2021
|
|||||||||
|
%
|
S/(000)
|
S/(000)
|
||||||||||
|
Depreciation -
|
||||||||||||
|
Soles in relation to Boliviano
|
|
|
|
|||||||||
|
Soles in relation to Boliviano
|
|
|
|
|||||||||
|
Appreciation -
|
||||||||||||
|
Soles in relation to Boliviano
|
|
(
|
)
|
(
|
)
|
|||||||
|
Soles in relation to Boliviano
|
|
(
|
)
|
(
|
)
|
|||||||
F-167
|
Currency rate sensibility
|
Change in
currency
rates
|
2022
|
2021
|
|||||||||
|
%
|
S/(000)
|
S/(000)
|
||||||||||
|
Depreciation -
|
||||||||||||
|
Soles in relation to Colombian Peso
|
|
|
|
|||||||||
|
Soles in relation to Colombian Peso
|
|
|
|
|||||||||
|
Appreciation -
|
||||||||||||
|
Soles in relation to Colombian Peso
|
|
(
|
)
|
(
|
)
|
|||||||
|
Soles in relation to Colombian Peso
|
|
(
|
)
|
(
|
)
|
|||||||
|
Currency rate sensibility
|
Change in
currency
rates
|
2022 |
2021
|
|||||||||
|
%
|
S/(000)
|
S/(000)
|
||||||||||
|
Depreciation -
|
||||||||||||
|
Soles in relation to Chilean Peso
|
|
|
|
|||||||||
|
Soles in relation to Chilean Peso
|
|
|
|
|||||||||
|
Appreciation -
|
||||||||||||
|
Soles in relation to Chilean Peso
|
|
(
|
)
|
(
|
)
|
|||||||
|
Soles in relation to Chilean Peso
|
|
(
|
)
|
(
|
)
|
|||||||
F-168
|
34.3
|
Liquidity risk
|
Liquidity risk is the risk that the Group is unable to meet its short-term payment obligations associated with its financial
liabilities when they fall due and to replace funds when they are withdrawn. In this sense, the company that is facing a liquidity crisis would be failing to comply with the obligations to pay depositors and with commitments to lend
or satisfy other operational cash needs.
The Group is exposed to daily cash requirements, interbank deposits, current accounts, time deposits, use of loans, guarantees
and other requirements. The Management of the Group’s subsidiaries establishes limits for the minimum funds amount available to cover such cash withdrawals and on the minimum level of inter-bank and other borrowing facilities that
should be in place to cover withdrawals at unexpected levels of demand. Sources of liquidity are regularly reviewed by the corresponding risk teams to maintain a wide diversification by currency, geography, type of funding,
provider, producer and term.
The procedure to control the mismatching of the maturities and interest rates of assets and liabilities is fundamental to the
management of the Group. It is unusual for banks to be completely matched, as transacted business is often based on uncertain terms and of different types. An unmatched position potentially enhances profitability, but also increases
liquidity risk, which generates exposure to potential losses.
Maturities of assets and liabilities and the ability to replace them, at an acceptable cost are important factors in assessing
the liquidity of the Group.
A mismatch, in maturity of long-term illiquid assets against short-term liabilities, exposes the consolidated statement of
financial position to risks related both to rollover and to interest rates. If liquid assets do not cover maturing debts, a consolidated statement of financial position is vulnerable to a rollover risk. Furthermore, a sharp increase
in interest rates can dramatically increase the cost of rolling over short-term liabilities, leading to a rapid increase in debt cost. The contractual-maturity gap report is useful in showing liquidity characteristics.
Corporate policies have been implemented for liquidity risk management by the Group. These policies are consistent with the
particular characteristics of each operating segment in which each of the Group companies operate. Risk Management heads set up limits and autonomy models to determine the adequate liquidity indicators to be managed.
Commercial banking and Microfinance:
Liquidity risk exposure in BCP, BCB,Mibanco and Mibanco Colombia is based on indicators such as the Internal Liquidity Coverage
Ratio (RCLI, the Spanish acronym) which measures the amount of liquid assets available to meet cash outflows needs within a given stress scenario for a period of 30 days and the Internal Ratio of Stable Net Funding (RFNEI, the Spanish acronym), which is intended to guarantee that long-term assets are financed at least
with a minimum number of stable liabilities within a prolonged liquidity crisis scenario and works as a minimum compliance mechanism that supplements the RCLI. The core limits of these indicators are 100 percent and any excess is presented in the Credicorp Treasury Risk Committee, Credicorp Risk Committee and the Assets Liabilities
Committee (ALCO) of the respective subsidiary.
Insurances and Pensions:
Insurances: Liquidity risk management in Pacífico Grupo Asegurador follows a
particular approach given the nature of the business. For annually renewable businesses, mainly general insurance, the emphasis of liquidity is focused on the quick availability of resources in the event of a systemic event (for
example, earthquake); for this purpose, there are minimum investment indicators in place relating to local cash/time deposits and foreign fixed-income instruments of high quality and liquidity abroad.
F-169
For long-term businesses such as Pacífico Seguros, given the nature of the products offered and the contractual relationship with
customers (the liquidity risk is not material); the emphasis is on maintaining sufficient flow of assets and matching their maturities with maturities of obligations (mathematical technical reserves); for this purpose there are
indicators that measure the asset/liability sufficiency and adequacy as well as calculations or economic capital subject to interest rate risk, this last under the methodology of Credicorp.
Pensions: Liquidity risk management in AFP Prima is carried out in a
differentiated manner between the fund administrator and the funds being managed. Liquidity management regarding the fund administrator is focused on hedge meeting periodic operating expense needs, which are supported with the
collection of commissions. The fund administering entity does not record unexpected outflows of liquidity.
Investment banking:
Liquidity risk in the Grupo Credicorp Capital principally affects the security brokerage. In managing this risk, limits of use of
liquidity have been established as well as mismatching by dealing desk; follow-up on liquidity is performed on daily basis for a short-term horizon covering the coming settlements. If short-term unmatched maturities are identified,
repos are used. On the other hand, structural liquidity risk of Credicorp Capital is not significant given the low levels of debt, which is monitored regularly using financial planning tools.
In the case of ASB Bank Corp. the risk liquidity management performs through indicators such as Internal Liquidity Coverage Ratio
(RCLI, the Spanish acronym) and the Internal Ratio of Stable Net Funding (RFNEI, the Spanish acronym) with the core limits of 100
percent and any excess is presented in the Credicorp Treasury Risk Committee, Credicorp Risk Committee and the Assets Liabilities Committee (ALCO) of the respective subsidiary.
Companies perform a liquidity risk management using the liquidity Gap or contractual maturity Gap.
F-170
The table below presents the cash flows payable by the Group by remaining contractual maturities (including future interest
payments) at the date of the consolidated statement of financial position. The amounts disclosed in the table are the contractual undiscounted cash flows:
|
2022
|
2021
|
|||||||||||||||||||||||||||||||||||||||||||||||
|
Up to a
month
|
From 1 to
3 months
|
From 3 to
12 months
|
From 1 to
5 years
|
Over 5
Year
|
Total
|
Up to a
month
|
From 1 to
3 months
|
From 3 to
12 months
|
From 1 to
5 years
|
Over 5
Year
|
Total
|
|||||||||||||||||||||||||||||||||||||
|
S/(000)
|
|
S/(000)
|
|
S/(000)
|
|
S/(000)
|
|
S/(000)
|
|
S/(000)
|
|
S/(000)
|
|
S/(000)
|
|
S/(000)
|
|
S/(000)
|
|
S/(000)
|
|
S/(000)
|
|
|||||||||||||||||||||||||
|
Financial assets
|
|
|
|
|
|
|
|
|
|
|
|
|
||||||||||||||||||||||||||||||||||||
|
Financial liabilities by type -
|
||||||||||||||||||||||||||||||||||||||||||||||||
|
Deposits and obligations
|
|
|
|
|
|
|
|
|
|
|
|
|
||||||||||||||||||||||||||||||||||||
|
Payables from reverse purchase agreements and security lendings and due to banks and correspondents
|
|
|
|
|
|
|
|
|
|
|
|
|
||||||||||||||||||||||||||||||||||||
|
Accounts payable to reinsurers
|
|
|
|
|
|
|
|
|
|
|
|
|
||||||||||||||||||||||||||||||||||||
|
Financial liabilities designated at fair value through profit or loss
|
|
|
|
|
|
|
|
|
|
|
|
|
||||||||||||||||||||||||||||||||||||
|
Bonds and notes issued
|
|
|
|
|
|
|
|
|
|
|
|
|
||||||||||||||||||||||||||||||||||||
|
Lease liabilities
|
|
|
|
|
|
|
|
|
|
|
|
|
||||||||||||||||||||||||||||||||||||
|
Other liabilities
|
|
|
|
|
|
|
|
|
|
|
|
|
||||||||||||||||||||||||||||||||||||
|
Total liabilities
|
|
|
|
|
|
|
|
|
|
|
|
|
||||||||||||||||||||||||||||||||||||
|
Derivative financial liabilities -
|
||||||||||||||||||||||||||||||||||||||||||||||||
|
Contractual amounts receivable (Inflows)
|
|
|
|
|
|
|
|
|
|
|
|
|
||||||||||||||||||||||||||||||||||||
|
Contractual amounts payable (outflows)
|
|
|
|
|
|
|
|
|
|
|
|
|
||||||||||||||||||||||||||||||||||||
|
Total liabilities
|
(
|
)
|
(
|
)
|
(
|
)
|
|
|
|
|
(
|
)
|
|
|
|
|
||||||||||||||||||||||||||||||||
F-171
|
34.4
|
No financial risk -
|
A non-financial risk (NFR) is a broad term that is generally defined by exclusion; that is, any risk other than the traditional financial risks of the market, credit and liquidity. RNFs can have
substantial negative strategic, business, economic and/or reputational implications. RNF includes the operational risks defined in the seven Basel operational risk event types, but also other major risks such as technology,
cyber, behavioral, model, compliance, strategic, and third-party risk.
Non-Financial Risk management has become more challenging due to the added complexity of rapid changes in technology, extensive process automation, increased reliance on systems rather than people, as well as
transformational processes such as business agility. These changes in the way financial institutions do business have led to new risk exposures, whether in the form of attacks affecting the Bank’s service, data theft or online
fraud.
Operational risk
Operational risk is the possibility of the occurrence of losses arising from inadequate processes, human error, failure of
information technology, relations with third parties or external events. Operational risks can, lead to financial losses and have legal or regulatory compliance consequences but exclude strategic or reputational risk (except for
companies under Colombian regulations, where reputational risk is included in operational risk).
Operational risks are grouped into internal fraud, external fraud, labor relations and job security, relations with customers,
business products and practices, damages to material assets, business and systems interruption, and failures in process execution, delivery and management of processes.
One of the Group’s pillars is to develop an efficient risk culture, and to achieve this, it records operational risks and their
respective process controls. The risk map permits their monitoring, prioritization and proposed treatment according to established governance. Likewise carries out an active cybersecurity and fraud prevention management, aligned
with the best international practices.
The business continuity management system enables the establishing, implementing, operating, monitoring, reviewing, maintaining
and improving of business continuity based on best practices and regulatory requirements. The Group implements recovery strategies for the resources that support important products and services of the organization, which will be
periodically tested to measure the effectiveness of the strategy.
In the management of operational risk, cybersecurity, fraud prevention and business continuity, corporate guidelines are used,
and methodologies and best practices are shared among the Group’s companies.
Finally, it is incorporated as a mechanism of recovery in front of the materialization of operational risks, the management of
the Transfer of Non-Financial Risks, mainly through Insurance Policies contracted individually or corporately in the local and international market, which cover losses due to fraud, civil and professional liability, cyber risks,
damage to physical assets, among others. The insurance design is in accordance with the Group’s main operating risks, the coverage needs of key areas and the organization’s risk appetite, constantly seeking efficiencies in the cost
of policies, working together with the insurers that make up the Group and the most important insurance/reinsurance brokers in the international market.
F-172
Cybersecurity
Credicorp focuses its efforts on the most cost-efficient strategies to reduce exposure to cybersecurity risk;
thereby complying with the Group’s risk appetite. To achieve this, different levels of controls are applied adapted to the different areas and companies potentially exposed. For this reason, it maintains an important investment
program, which allows it to have the technologies and processes necessary to keep the Group’s operations and assets safe.
As part of cybersecurity management, the Group has lines of action that allow this risk to be mitigated and that, at the corporate level, implementation and improvement priorities
have been established according to the different realities of the companies. These lines of work include the Cybersecurity Strategy, which is constantly reviewed considering the global scenario, standards, frameworks and
regulations, in order to guarantee business continuity, resilience and data privacy, as well as the adoption of security and cybersecurity frameworks that allow cybersecurity controls to be adapted for each of the Group
companies, adequate management and remediation of vulnerabilities on time.
There is an awareness program focused in constant training for employees to generate a culture of cybersecurity awareness in all Group companies and cybersecurity indicators, which ensure alignment between
operations and the business strategy of group companies.
The Government of Third Parties, which includes suppliers, consumers, strategic allies and clients, allows us to ensure adherence and compliance with Group policies, as well as the implementation of security
technologies, to comprehensively ensure all business processes.
Finally,
information security management of information assets is carried out through a systemic process, documented and known by the entire organization under the best practices and regulatory requirements. Guidelines are designed and
developed based on the policies and procedures to have availability, privacy and integrity strategies.
Corporate Security and Cybercrime
As part of the management of Non-Financial Risks, the Corporate Security & Cybercrime Operations Center’s function is to detect and respond to incidents of fraud, cyber crime and
physical security.
These tasks are carried out by teams specialized in transactional monitoring, investigations, “cybercrime”, electronic security, disaster risk management
and strategic intelligence activities, including social conflicts, which allow safeguarding the safety of workers, clients, suppliers and company assets.
To this end, the designed strategy includes the use of state-of-the-art technological tools in the monitoring platform, digital video surveillance and advanced risk profile analysis
models, among other fronts. Likewise, there is highly specialized and trained talent on these fronts that allows the proper use of artificial intelligence, electronics, advanced analytics and “cyber forensic” achieving high
efficiency standards.
Finally, The Group contributes to the security of the Financial System through union activities that it develops at the local level in the Association of Banks of Peru (ASBANC) and at the
Latin American level in the Committee of Security Experts of the Latin American Federation of Banks (FELABAN).
F-173
|
34.5
|
Model Risk -
|
The Group uses models for different purposes such as credit admission, capital calculation, behavior, provisions, market risk,
liquidity, among others.
Model risk is defined as the probability of loss resulting from decisions (credit, market, among others) based on the use of
poorly designed and/or poorly implemented models. The sources that generate this risk are mainly: deficiencies in data, errors in the model (from design to implementation), use of the model.
The management of model risk is proportional to the importance of each model. In this sense, a concept of “tiering” (measurement
system that orders the models depending to the importance according to the impact on the business) is defined as the main attribute to synthesize the level of importance or relevance of a model, from which is determined the
intensity of the model risk management processes to be followed.
Model risk management is structured around a set of processes known as the life cycle of the model. The definition of phases of
the life cycle of the model in the Group is detailed below: Identification, Planning, Development, Internal Validation, Approval, Implementation and use, and Monitoring and control
|
34.6
|
Risk of the insurance activity -
|
The main risk the Group faces under insurance contracts is that the actual claims and benefit payments or the timing
thereof, differ from expectations. This is influenced by the frequency of claims, severity of claims, actual benefits paid and subsequent development of long-term claims. Therefore, the objective of the Group is to ensure that
enough reserves are available to cover these liabilities.
The risk exposure is mitigated by diversification across a large portfolio of insurance contracts and by having different lines
of business. The risks are also mitigated by careful selection and implementation of underwriting strategy guidelines, as well as the use of reinsurance arrangements. The Group’s placement of reinsurance is diversified so that it is
neither dependent on a single reinsurer nor are the operations of the Group substantially dependent upon any single reinsurance contract.
Life insurance contracts -
The main risks that the Group is exposed to are mortality, morbidity, longevity, investment yield and flow, losses arising from
policies due to the expense incurred being different than expected, and the policyholder decision; all of which, do not vary significantly in relation to the location of the risk insured by the Group, type of risk insured or
industry.
The Group’s underwriting strategy is designed to ensure that risks are well diversified in terms of type of risk and level of
insured benefits. This is achieved through diversification across insurable risks, the use of medical screening in order to ensure that pricing takes account of current health conditions and family medical history, regular review of
actual claims experience and product pricing, as well as detailed claims handling procedures. Underwriting limits are in place to enforce appropriate risk selection criteria. For example, the Group has the right not to renew
individual policies, it can impose deductibles and it has the right to reject the payment of fraudulent claims.
For contracts when death or disability is the insured risk, the significant factors that could increase the overall frequency of
claims are epidemics, widespread changes in lifestyle and natural disasters, resulting in more claims than expected.
For retirement, survival and disability annuities contracts, the most significant factor is continuing improvement in medical
science and social conditions that increase longevity.
Management has performed a sensitivity analysis of the technical reserve estimates, Note 16(c).
F-174
Since the start of the Covid-19 pandemic in March 2020, the mortality
of the portfolio of life business policyholders has increased significantly. The main businesses affected have been the current Social Security Insurance and Credit Life Insurance, due to the number of policyholders in each
business (more than 2.5 million people in each case). The other businesses affected are Individual Life, Group Life
and Law Life, but with a reduced impact.However, during 2022 the mortality due to Covid-19 has been reduced compared to 2021.
In these businesses, the reserve for pending claims has increased, as
well as the reserve for Claims Occurred and Not Reported (IBNR) due to the increase in deaths and the delay experienced in reporting claims. Since March 2020, the month in which the national emergency began, the size of the
portfolios, the reported claims and the reserves necessary to cover the expected excess mortality (expected deaths above the average number of premature deaths) have been continuously monitored. pandemic). Likewise, conservative
criteria have been applied in estimating loss reserves, considering the uncertainty involved.
On the other hand, in the pension businesses, more deceased annuitants have also been registered since the start of the pandemic, which has led to a
greater release of mathematical reserves for this concept compared to previous years, however during 2022, the level of death of rentiers has decreased compared to 2021, this is a product of the vaccination advancement.
Finally, although the risk of increased mortality remains given the declaration of the fitht wave of COVID-19 by the Ministry of Health, the risk is largely mitigated because the population fully vaccinated exceeds
Non-life insurance contracts (general insurance and healthcare) -
The Group mainly issues the following types of non-life general insurance contracts: automobile, technical branches, business and
healthcare insurances. Healthcare contracts provide medical expense cover to policyholders. Risks under non-life insurance policies usually cover 12 months.
For general insurance contracts the most significant risks arise from climate changes, natural disasters and other types of
damages. For healthcare contracts the most significant risks arise from lifestyle changes, epidemics and medical science and technology improvements.
Most of these risks do not vary significantly in relation to the location of the risk insured by the Group, type of risk insured
or industry.
The above risk exposures are mitigated by diversification across a large portfolio of insurance contracts and by having different business lines. The variability of
risk is improved by careful selection and implementation of underwriting strategies, which are designed to ensure that risks are diversified in terms of type of risks and level of insured benefits. This is achieved, in various
cases, through diversification across industry sectors and geography.
Furthermore, strict claim review policies to assess all new and ongoing claims and in process of settlement, regular detailed
review of claims handling procedures and frequent investigation of possible fraudulent claims are all policies and procedures put in place to reduce the Group’s risk exposure. Insurance contracts also entitle the Group to pursue
third parties for payment of some or all costs. Also, the Group actively manages and promptly pursues claims, in order to reduce its exposure to unpredictable future developments that can negatively impact the Group. In this sense, constant
monitoring is being carried out on claims that may arise as a result of the social political crisis, which began at the end of 2022.
The Group has also limited its exposure by imposing maximum claim amounts on certain contracts as well as the use of reinsurance
arrangements in order to limit its exposure to catastrophic events.
F-175
In the Medical Assistance branch, the pandemic had two simultaneous effects on the accident rate: an increase in outpatient care and hospitalizations
(normal and in the ICU) for COVID-19 cases and a decrease in care and hospitalizations for other ailments. For this business, reserves for claims pending, as well as reserves for claims that have occurred and not reported (IBNR)
are being continuously monitored and have been estimated with prudent criteria due to the variability and uncertainty of the frequency and cost of cases and the Greater delay in reporting claims by health centers, whose care
during the pandemic is focused on patient care. During 2022, care for Covid-19 has decreased compared to 2021, allowing an increase in outpatient and hospital care for other illnesses.
|
34.7
|
Capital management -
|
The Group maintains an actively managed capital base to cover risks inherent in its business. The adequacy of the Group’s capital
is monitored using, among other measures, the rules and ratios established by the SBS, the supervising authority of its major subsidiaries and for consolidation purposes. Furthermore, capital management responds to market
expectations in relation to the solvency of the Group and to support the growth of the businesses considered in the strategic planning. In this way, the capital maintained by the Group enables it to assume unexpected losses in
normal conditions and conditions of severe stress.
The Group’s objectives when managing capital are: (i) to comply with the capital requirements set by the regulators of the
markets where the entities within the Group operate; (ii) to safeguard the Group’s ability to continue as a going concern so that it can continue to provide returns for shareholders and benefits for other stakeholders; and (iii) to
maintain a strong capital base to support the development of its business, in line with the limits and tolerances established in the declaration of Risk Appetite.
As of December 31, 2022, and 2021, the regulatory capital for the subsidiaries engaged in financial and insurance activities
amounted to approximately S/31,754.6 million and S/29,741.6 million, respectively. The regulatory capital has been determined in accordance with SBS regulations in force as of said dates. Under the SBS
regulations, the Group’s regulatory capital exceeds by approximately S/8,157.0 million the minimum regulatory capital
required as of December 31, 2021 (approximately S/10,294.3 million as of December 31, 2021).
F-176
|
34.8
|
Fair values –
|
|
a)
|
Financial instruments recorded at fair value and fair value hierarchy –
|
The following table analyses financial instruments measured at fair value at the reporting date, by the level in the fair value
hierarchy into which the fair value measurement is categorized. The amounts are based on the values recognized in the consolidated statement of financial position:
|
2022
|
2021
|
|||||||||||||||||||||||||||||||||||
|
Note
|
Level 1
|
Level 2
|
Level 3
|
Total
|
Level 1
|
Level 2
|
Level 3
|
Total
|
||||||||||||||||||||||||||||
|
S/(000)
|
S/(000)
|
S/(000)
|
S/(000)
|
S/(000)
|
S/(000)
|
S/(000)
|
S/(000)
|
|||||||||||||||||||||||||||||
|
Financial assets
|
||||||||||||||||||||||||||||||||||||
|
Derivative financial instruments:
|
||||||||||||||||||||||||||||||||||||
|
Currency swaps
|
|
|
|
|
|
|
|
|
||||||||||||||||||||||||||||
|
Interest rate swaps
|
|
|
|
|
|
|
|
|
||||||||||||||||||||||||||||
|
Foreign currency forwards
|
|
|
|
|
|
|
|
|
||||||||||||||||||||||||||||
|
Cross currency swaps
|
|
|
|
|
|
|
|
|
||||||||||||||||||||||||||||
|
Foreign exchange options
|
|
|
|
|
|
|
|
|
||||||||||||||||||||||||||||
|
Futures
|
|
|
|
|
|
|
|
|
||||||||||||||||||||||||||||
|
13(c)
|
|
|
|
|
|
|
|
|
|
|||||||||||||||||||||||||||
|
Investments at fair value through profit of loss
|
6(a)
|
|
|
|
|
|
|
|
|
|
||||||||||||||||||||||||||
|
Financial assets at fair value through profit of loss
|
8
|
|
|
|
|
|
|
|
|
|||||||||||||||||||||||||||
|
Investments at fair value through other comprehensive income:
|
||||||||||||||||||||||||||||||||||||
|
Debt Instruments
|
||||||||||||||||||||||||||||||||||||
|
Corporate bonds
|
|
|
|
|
|
|
|
|
||||||||||||||||||||||||||||
|
Government Bonds
|
|
|
|
|
|
|
|
|
||||||||||||||||||||||||||||
|
Certificates of deposit BCRP
|
|
|
|
|
|
|
|
|
||||||||||||||||||||||||||||
|
Negotiable certificates of deposit
|
|
|
|
|
|
|
|
|
||||||||||||||||||||||||||||
|
Securitization instruments
|
|
|
|
|
|
|
|
|
||||||||||||||||||||||||||||
|
Subordinated bonds
|
|
|
|
|
|
|
|
|
||||||||||||||||||||||||||||
|
Other instruments
|
|
|
|
|
|
|
|
|
||||||||||||||||||||||||||||
|
Equity instruments
|
|
|
|
|
|
|
|
|
||||||||||||||||||||||||||||
|
6(b)
|
|
|
|
|
|
|
|
|
|
|||||||||||||||||||||||||||
|
Total financial assets
|
|
|
|
|
|
|
|
|
||||||||||||||||||||||||||||
|
Financial liabilities
|
||||||||||||||||||||||||||||||||||||
|
Derivatives financial instruments:
|
||||||||||||||||||||||||||||||||||||
|
Currency swaps
|
|
|
|
|
|
|
|
|
||||||||||||||||||||||||||||
|
Foreign currency forwards
|
|
|
|
|
|
|
|
|
||||||||||||||||||||||||||||
|
Interest rate swaps
|
|
|
|
|
|
|
|
|
||||||||||||||||||||||||||||
|
Cross currency swaps
|
|
|
|
|
|
|
|
|
||||||||||||||||||||||||||||
|
Foreign exchange options
|
|
|
|
|
|
|
|
|
||||||||||||||||||||||||||||
|
Futures
|
|
|
|
|
|
|
|
|
||||||||||||||||||||||||||||
|
13(c)
|
|
|
|
|
|
|
|
|
|
|||||||||||||||||||||||||||
|
Financial liabilities at fair value through profit or loss
|
|
|
|
|
|
|
|
|
||||||||||||||||||||||||||||
|
Total financial liabilities
|
|
|
|
|
|
|
|
|
||||||||||||||||||||||||||||
F-177
Financial instruments included in the Level 1 category are those that are measured based on quotations obtained in an active market.
A financial instrument is regarded as quoted in an active market if quoted prices are readily and regularly available from an exchange, dealer, broker, industry group, pricing service or regulatory agency and those prices represent
actual and regularly occurring market transactions on an arm’s length basis.
Financial instruments included in the Level 2 category are those that are measured based on observable market factors. This category
includes instruments valued using quoted prices for similar instruments, either in active or less active markets and other valuation techniques (models) where all significant inputs are directly or indirectly observable based on
market data.
Following
is a description of how fair value is determined for the main Group’s financial instruments where valuation techniques were used with inputs based on market data which
incorporate Credicorp’s estimates on the assumptions that market participants would use for measuring these financial instruments:
| - |
Valuation of derivative financial instruments -
|
Interest rate swaps, currency swaps and forward exchange contracts are measured by using valuation techniques where inputs are based
on market data. The most frequently applied valuation techniques include forward pricing and swap models, using present value calculations. The models incorporate various inputs, including the credit quality of counterparties, spot
exchange rates, forward rates and interest rate curves. Options are valued using well-known, widely accepted valuation models.
A credit valuation adjustment (CVA) is applied to the “Over-The-Counter” derivative exposures to take into account the
counterparty’s risk of default when measuring the fair value of the derivative. CVA is the mark-to market cost of protection required to hedge credit risk from counterparties in this type of derivatives portfolio. CVA is calculated
by multiplying the probability of default (PD), the loss given default (LGD) and the expected exposure (EE) at the time of default.
A debit valuation adjustment (DVA) is applied to include the Group’s own credit risk in the fair value of derivatives (that is the
risk that the Group might default on its contractual obligations), using the same methodology as for CVA.
F-178
As of December 31, 2022, the balance of receivables and payables corresponding to derivatives amounted to S/1,478.7 million and S/1,345.7
million respectively, See Note 13(c), generating DVA and CVA adjustments for approximately S/7.5 million and S/11.2 million respectively. The net impact of both items in the consolidated statement of income amounted to S/6.0 million of loss. As of December 31, 2021, the balance of receivables and payables corresponding to derivatives amounted to S/1,661.6 million and S/1,524.8
million, respectively, See Note 13(c), generating DVA and CVA adjustments for approximately S/7.8 million and S/17.3 million, respectively. Also, the net impact of both items in the consolidated statement of income amounted to S/0.3 million of loss.
| - |
Valuation of debt securities classified in the category “at fair value through other comprehensive income” and included in level 2 -
|
Valuation of certificates of deposit BCRP, corporate, leasing, subordinated bonds and Government treasury bonds are measured by
calculating their Net Present Values (NPV) through discounted cash flows, using appropriate and relevant zero coupon rate curves to discount cash flows in the respective currency and considering observable current market
transactions.
Certificates of deposit BCRP (CD BCRP) are securities issued at a discount in order to regulate the liquidity of the financial
system. They are placed mainly through public auction or direct placement, are freely negotiable by their holders in the Peruvian secondary market and may be used as collateral in Repurchase Agreement Transactions of Securities with
the BCRP.
Other debt instruments are measured using valuation techniques based on assumptions supported by prices from observable current
market transactions, obtained via pricing services. Nevertheless, when prices have not been determined in an active market, fair values are based on broker quotes and assets that are valued using models whereby the majority of
assumptions are market observable.
|
-
|
Valuation of financial instruments included in level 3 -
|
These are measured using valuation techniques (internal models), based on assumptions that are not supported by transaction prices
observable in the market for the same instrument, nor based on available market data.
In this regard, no significant differences were noted between the estimated fair values and the respective carrying amounts.
As of December 31, 2022 and 2021, the net unrealized loss of Level 3 financial instruments amounted to S/0.1 million and S/0.7
million, respectively. During 2022 and 2021, changes in the carrying amount of Level 3 financial instruments have not been significant since there were no purchases, issuances, settlements or any other significant movements or
transfers from level 3 to Level 1 or Level 2 or vice versa.
F-179
| b) |
Financial instruments not measured at fair value -
|
We present below the disclosure of the comparison between the carrying amounts and fair values of the financial instruments,
which are not measured at fair value, presented in the consolidated statement of financial position by level of the fair value hierarchy:
|
2022
|
2021
|
|||||||||||||||||||||||||||||||||||||||
|
Level 1
|
Level 2
|
Level 3
|
Fair value
|
Book value
|
Level 1
|
Level 2
|
Level 3
|
Fair value
|
Book value
|
|||||||||||||||||||||||||||||||
|
S/(000)
|
S/(000)
|
S/(000)
|
S/(000)
|
S/(000)
|
S/(000)
|
S/(000)
|
S/(000)
|
S/(000)
|
S/(000)
|
|||||||||||||||||||||||||||||||
|
Assets
|
||||||||||||||||||||||||||||||||||||||||
|
Cash and due from banks
|
|
|
|
|
|
|
|
|
|
|
||||||||||||||||||||||||||||||
|
Cash collateral, reverse repurchase agreements and securities borrowing
|
|
|
|
|
|
|
|
|
|
|
||||||||||||||||||||||||||||||
|
Investments at amortized cost
|
|
|
|
|
|
|
|
|
|
|
||||||||||||||||||||||||||||||
|
Loans, net
|
|
|
|
|
|
|
|
|
|
|
||||||||||||||||||||||||||||||
|
Premiums and other policies receivable
|
|
|
|
|
|
|
|
|
|
|
||||||||||||||||||||||||||||||
|
Accounts receivable from reinsurers and coinsurers
|
|
|
|
|
|
|
|
|
|
|
||||||||||||||||||||||||||||||
|
Due from customers on banker’s acceptances
|
|
|
|
|
|
|
|
|
|
|
||||||||||||||||||||||||||||||
|
Other assets
|
|
|
|
|
|
|
|
|
|
|
||||||||||||||||||||||||||||||
|
Total
|
|
|
|
|
|
|
|
|
|
|
||||||||||||||||||||||||||||||
|
Liabilities
|
||||||||||||||||||||||||||||||||||||||||
|
Deposits and obligations
|
|
|
|
|
|
|
|
|
|
|
||||||||||||||||||||||||||||||
|
Payables on repurchase agreements and securities lending
|
|
|
|
|
|
|
|
|
|
|
||||||||||||||||||||||||||||||
|
Due to Banks and correspondents and other entities
|
|
|
|
|
|
|
|
|
|
|
||||||||||||||||||||||||||||||
|
Due from customers on banker’s acceptances
|
|
|
|
|
|
|
|
|
|
|
||||||||||||||||||||||||||||||
|
Payable to reinsurers and coinsurers
|
|
|
|
|
|
|
|
|
|
|
||||||||||||||||||||||||||||||
|
Lease liabilities
|
|
|
|
|
|
|
|
|
|
|
||||||||||||||||||||||||||||||
|
Bond and notes issued
|
|
|
|
|
|
|
|
|
|
|
||||||||||||||||||||||||||||||
|
Other liabilities
|
|
|
|
|
|
|
|
|
|
|
||||||||||||||||||||||||||||||
|
Total
|
|
|
|
|
|
|
|
|
|
|
||||||||||||||||||||||||||||||
F-180
The methodologies and assumptions used by the Group to determine fair values depend on the terms and risk characteristics of the
various financial instruments and include the following:
| (i) |
Long-term fixed-rate and variable-rate loans are evaluated by the Group based on parameters such as interest rates, specific country risk factors, and individual creditworthiness of
the customer and the risk characteristics of the financed project. Based on this evaluation, allowances are taken into account for the incurred losses of these loans. As of December 31, 2022 and 2021, the carrying amounts of
loans, net of allowances, were not materially different from their calculated fair values.
|
| (ii) |
Assets for which fair values approximate their carrying value - For financial assets and financial liabilities that are liquid or have a short term maturity (less than three months)
it is assumed that the carrying amounts approximate to their fair values. This assumption is also applied to demand deposits, savings accounts without a specific maturity and variable rate financial instruments.
|
|
(iii)
|
Fixed rate financial instruments - The fair value of fixed rate financial assets and liabilities carried at amortized cost are estimated by
comparing market interest rates when they were first recognized with current market rates offered for similar financial instruments. The estimated fair value of fixed interest-bearing deposits is based on discounted cash
flows using prevailing market interest rates for financial instruments with similar credit risk and maturity. For quoted debt issued the fair values are calculated based on quoted market prices. When quoted market prices
are not available, a discounted cash flow model is used based on a current interest rate yield curve appropriate for the remaining term to maturity.
|
F-181
|
34.9
|
Fiduciary activities, management of funds and pension funds -
|
The Group provides custody, trustee, investment management and advisory services to third parties; therefore, the Group makes
allocations and purchase and sale decisions in relation to a wide range of financial instruments. Assets that are held in a fiduciary capacity are not included in these consolidated financial statements. These services give rise to
the risk that the Group will be accused of mismanagement or under-performance.
As of December 31, 2022 and 2021, the value of the net assets under administration off the balance sheet (in millions of soles) is
as follows:
|
2022
|
2021
|
|||||||
|
Investment funds and mutual funds
|
|
|
||||||
|
Equity managed
|
|
|
||||||
| Pension funds | ||||||||
|
Bank trusts
|
|
|
||||||
|
Total
|
|
|
||||||
F-182
|
35
|
COMMITMENTS AND CONTINGENCIES
|
Legal claim contingencies
|
i)
|
Madoff Trustee Litigation -
|
In September 2011, the Trustee for the liquidation of Bernard L. Madoff Investment Securities LLC (BLMIS) and the substantively
consolidated estate of Bernard L. Madoff (the Madoff Trustee) filed a complaint (the Madoff Complaint) against Credicorp’s subsidiary ASB (now ASB Bank Corp.) in the U.S. Bankruptcy Court for the Southern District of New York (the
Bankruptcy Court). The Madoff Complaint seeks recovery of approximately US$120.0 million in principal amount, which is
alleged to be equal to the amount of redemptions between the end of 2004 and the beginning of 2005 of ASB-managed Atlantic U.S. Blue Chip Fund assets invested in Fairfield Sentry Limited (Fairfield Sentry), together with fees, costs,
interest and expenses. The Madoff Complaint seeks the recovery of these redemptions from ASB Bank Corp. as “subsequent transfers” or “avoided transfers” from BLMIS to Fairfield Sentry, which Fairfield Sentry in turn subsequently
transferred to ASB Bank Corp. The Madoff Trustee has filed similar “claw back” actions against numerous other alleged “subsequent transferees” that invested in Fairfield Sentry and its sister entities, which, in turn, invested in and
redeemed funds from BLMIS.
There has been significant briefing on issues related to these Madoff Trustee actions, and these cases have been pending for many
years. In November 2016, the Bankruptcy Court issued a Memorandum Decision Regarding Claims to Recover Foreign Subsequent Transfers (the Memorandum Decision) holding that the recovery of certain subsequent foreign transfers is barred
under the doctrine of comity and/or extraterritoriality, and dismissed the claims brought by the Madoff Trustee against a number of parties, including ASB Bank Corp. In March 2017, the Madoff Trustee filed an appeal (the Appeal) of
the Memorandum Decision to the United States Court of Appeals for the Second Circuit, which reversed the Dismissal Order and remanded the matter to the Bankruptcy Court (the Second Circuit Opinion). In April 2019, the
defendant-appellees, including ASB Bank Corp., filed, and the Second Circuit granted, a motion to stay the issuance of the mandate pending the filing of a petition for a writ of certiorari in the United States Supreme Court. The
petition for a writ of certiorari was filed in the United States Supreme Court in August 2019. On or about June 1, 2020, the United States Supreme Court denied the petition for a writ of certiorari. Following the denial of the
petition for writ of certiorari, the judgment for dismissal by the Bankruptcy Court was vacated and the matter was remanded back to the Bankruptcy Court. The case now remains pending in the Bankruptcy Court. On March 25, 2022, ASB
Bank Corp. filed a Motion to Dismiss the Complaint. On May 24, 2022, the Madoff Trustee filed its opposition to the Motion to Dismiss. On July 14, 2022, ASB Bank Corp. filed its reply memorandum of law in further support of its Motion
to Dismiss. On November 18, 2022, the Bankruptcy Court denied the Motion to Dismiss presented by ASB Bank Corp. and give to ASB Bank Corp. until February 1, 2023 to file an answer to the Complaint. While management believes that ASB
has defenses against the Madoff Trustee’s claims and intends to defend against any action by the Madoff Trustee, in view of recent judicial decisions in cases not involving ASB, certain defenses are no longer available. In this
context, Credicorp has constituted a provision that management considers reasonable with the information available today.
| ii) |
Fairfield Litigation -
|
In April 2012, Fairfield Sentry (In Liquidation) and its representative, Kenneth Krys (the Fairfield Liquidator), filed a complaint
(the Fairfield Complaint) against ASB (now ASB Bank Corp.) in the Bankruptcy Court (the Fairfield v. ASB Adversary Proceeding). The Fairfield Complaint seeks to recover US$115.2 million in principal amount from ASB Bank Corp., representing the amount of ASB’s Bank Corp. redemptions of certain investments in Fairfield Sentry,
together with fees, costs, interest and expenses. These are essentially the same funds that the Madoff Trustee seeks to recover in the Madoff Trustee litigation as described above. After the Fairfield Complaint was filed, the
Bankruptcy Court procedurally consolidated the Fairfield V. ASB Adversary Proceeding with other adversary actions brought by the Fairfield Liquidator against former investors in Fairfield Sentry.
F-183
Similar to the Madoff Trustee litigation described above, the Fairfield v. ASB Adversary Proceeding and related adversary actions have
been pending for many years. In October 2016, the Fairfield Liquidator filed a Motion for Leave to Amend (the Motion for Leave) various complaints, including the Fairfield Complaint. Certain defendants, including ASB Bank Corp., filed
a motion to dismiss (the Motion to Dismiss) and a consolidated memorandum of law (i) in opposition to the Motion for Leave and (ii) in support of the Motion to Dismiss. In December 2018, the Bankruptcy Court entered a memorandum
decision granting in part and denying in part the Motion to Dismiss and the Motion for Leave (the Memorandum Decision). In March 2019, the Fairfield Liquidator submitted a form of a stipulated order dismissing the adversary proceeding
against ASB Bank Corp. (the Dismissal Order), as directed by the Bankruptcy Court, but filed notices of appeal, including of the dismissal of the claims asserted against ASB Bank Corp. and other defendants, in May 2019. The appeal
remains pending.
Management believes that ASB Bank Corp. has defenses against the Fairfield Liquidator’s claims alleged in the Amended Complaint and
the Fairfield Liquidator’s appeal.
| iii) |
Government Investigations -
|
The former Chairman and the current Vice Chairman of the Board of Directors of Credicorp, in their respective capacities as Chairman
of the Board and as a Director of BCP Stand-alone, were summoned as witnesses by Peruvian prosecutors, along with 26 other Peruvian business leaders, to testify in connection with a judicial investigation that is being carried out
regarding contributions made to the electoral campaign of a political party in the 2011 Peruvian presidential elections. Our former Chairman testified on November 18, 2019, and our Vice Chairman testified on December 9, 2019. The
former Chairman informed prosecutors that in 2010 and 2011 Credicorp made donations totaling US$3.65 million to Fuerza
Popular 2011 campaign (in total amounts of US$1.7 million in 2010 and US$1.95 million in 2011). These contributions were made in coordination with the General Manager of Credicorp at that time. While the amount of these contributions
exceeded the limits then permitted under Peruvian electoral law, the law in place at that time provided no sanction for contributors, and instead only for the recipient of the campaign contribution.
The former Chairman also informed prosecutors that in 2016, three subsidiaries of Credicorp (BCP Stand-alone, Mibanco and Grupo Pacifico) made donations totaling S/711,000 (approximately US$200,000 ) to the Peruanos
Por el Kambio campaign. These contributions were made in compliance both with Peruvian electoral law and with Credicorp’s own political contributions guidelines, adopted in 2015. These guidelines provided details on the procedures for
obtaining approval for contributions and outlined the specific required conditions for transparent contributions.
The Peruvian Superintendencia del Mercado de Valores (‘SMV’ for its Spanish acronym) has initiated a sanctioning process against
Credicorp, for failing to disclose to the market, in due course, the political campaign contributions in the years 2011 and 2016. The SMV also has initiated a sanctioning process against three subsidiaries of Credicorp (BCP Stand-alone, Mibanco and Grupo Pacifico), for failing to disclose to the market, in due course, the political campaign
contributions made in connection with the 2016 presidential elections. The SMV notified Credicorp, BCP, Mibanco and Grupo Pacifico with first instance Resolutions on these proceedings. The mentioned Resolutions imposed pecuniary
sanctions (fines) on Credicorp and the three subsidiaries as a consequence of these sanctioning processes. Credicorp, BCP,
Mibanco and Grupo Pacifico appealed the Resolutions.
On December 8, 2021, Credicorp informed that the Peruvian SMV was notified of the resolution issued by the Provisional Superior Chamber
Specialized in Administrative Litigation of the Superior Court of Justice of Lima (the “Court”), pursuant to which the Court has admitted for consideration Credicorp’s contentious-administrative claim challenging the SMV’s resolution
(by negative administrative silence), with reference to the appeal filed by Credicorp mentioned in the prior paragraph.
Under the Resolution, the SMV resolved to sanction
Credicorp (i) with a fine of 300 Tax Units (Unidades Impositivas Tributarias or UITs by its acronym in Spanish)
approximately US$270,000 for, allegedly, having infringed (categorized as “very serious”, “muy grave” in Spanish) subsection 1.6, numeral 1 of Annex 1 of
the Sanctions Regulation, approved by CONASEV Resolution N°055-2001-EF / 94.10, effective as from 2011; and (ii) with a fine of 210 UITs approximately US$207,375 for, allegedly, having violated (categorized as “very serious”, “muy grave” in Spanish) subsection 1.5, numeral 1 of
Annex 1 of the Sanctions Regulation, approved by CONASEV Resolution N°
055-2001-EF / 94.10 and modified by Resolution N° 006-2012-SMV / 01, effective as from 2016. The charges made by the SMV against Credicorp were that the company had affected the transparency of the stock market by not having disclosed relevant information to the market regarding
Credicorp’s cash contributions to the political party Fuerza Popular during the 2011 Peruvian presidential campaign (first charge) and that
the company had affected the transparency of the stock market by not having disclosed relevant information to the market regarding Credicorp’s agreement to make contributions to the political party Peruanos por el Kambio during the
2016 Peruvian presidential campaign (second charge).
F-184
Because Credicorp was neither in
agreement with the categorization of the facts nor with the sanctions imposed, Credicorp filed an appeal challenging the Resolution. Subsequently, after the expiration of the term to resolve in the appeal (second administrative instance), Credicorp asserted its right to negative
administrative silence and to resort to the Judiciary. Notwithstanding, Credicorp proceeded to pay the fines imposed by the SMV, in compliance with Peruvian law.
Thus, since Credicorp’s contentious-administrative claim filed was admitted for consideration by the Court, the
administrative procedure has terminated with respect to Credicorp and the matter is now subject to the decision of the Judiciary.
On March 4, 2022, Grupo Pacifico informed that the Peruvian SMV was notified of the resolution issued by the
Superior Chamber Specialized in Administrative Litigation of the Superior Court of Justice of Lima (the “Court”), pursuant to which the Court has admitted for consideration Grupo Pacifico´s contentious-administrative claim challenging
the SMV´s resolution (by negative administrative silence), with reference to the appeal filed by Grupo Pacifico mentioned above. Thus, since Grupo Pacifico´s mentioned claim was admitted for consideration by the Court, the
administrative procedure has terminated with respect to Grupo Pacifico, and the matter is now subject to the decision of the Judiciary.
On July 4, 2022, BCP informed that the Peruvian SMV was notified of the resolution issued by the Superior Chamber
Specialized in Administrative Litigation of the Superior Court of Justice of Lima (the “Court”), pursuant to which the Court has admitted for consideration BCP´s contentious-administrative claim challenging the SMV´s resolution (by
negative administrative silence), with reference to the appeal filed by BCP mentioned above. Thus, since BCP´s mentioned claim was admitted for consideration by the Court, the administrative procedure has terminated with respect to
BCP, and the matter is now subject to the decision of the Judiciary.
On July 5, 2022, Mibanco informed that the Peruvian SMV was notified of the resolution issued by the Superior
Chamber Specialized in Administrative Litigation of the Superior Court of Justice of Lima (the “Court”), pursuant to which the Court has admitted for consideration Mibanco´s contentious-administrative claim challenging the SMV´s
resolution (by negative administrative silence), with reference to the appeal filed by Mibanco mentioned above. Thus, since Mibanco´s mentioned claim was admitted for consideration by the Court, the administrative procedure has
terminated with respect to Mibanco, and the matter is now subject to the decision of the Judiciary.
Credicorp believes that neither the contributions disclosed by our former Chairman and the current Vice
Chairman in 2019 nor the related SMV sanctioning processes pose a significant risk of material liability to the Company. Furthermore, Credicorp does not believe that either of the contributions will have material effect on the Company’s business,
financial position or profitability.
F-185
On November 11, 2021, Credicorp disclosed that its incoming CEO, Mr. Gianfranco Ferrari de las Casas, informed the company that he
was notified of a Prosecutor’s Decision issued by the Corporate Supraprovincial Prosecutor’s Office Specialized in Officer Corruption Offenses Special Team - Fourth Court Division (“Fiscalía Supraprovincial Corporativa Especializada
en Delitos de Corrupción de Funcionarios Equipo Especial – Cuarto Despacho”, for its name in Spanish). Through such notice, Mr. Ferrari was informed that he has been included in the preparatory investigation carried out against Mr.
Yehude Simon M. and an additional sixty-five (65 ) individuals on the grounds of, in his particular case, alleged primary complicity in the alleged crime against the public administration, aggravated collusion, incompatible
negotiation or improper use of position and criminal organization detrimental to the Peruvian State, in connection with the financial advisory services provided by BCP Stand - alone to the Olmos Project.
Credicorp has reviewed the performance of the officers of Banco de Crédito del Perú in relation to the financial advisory services
provided by the Bank in connection with the Olmos Project and has concluded that the facts under investigation do not give rise to any liability of Banco de Crédito del Perú or its officers. Credicorp bases this view on the qualified
opinion of external consultants specialized in the matter. Therefore, Credicorp considers that the opening of the aforementioned preparatory investigation will not have any impact on the normal operation of the company, nor will it
affect the dedication and performance of its officers in undertaking their regular duties.
F-186
| 36 |
SUBSEQUENT EVENTS
|
| a) |
On January 13, 2023, Law No. 31670 was published, that allows access to a minimum retirement pension and expands the voluntary contribution alternatives for members of Private Pension Fund
Administration System (PPS). The law seeks to improve the pension culture through the determination of retirement targets establishing that:
|
Affiliates may set a target of provisional saving in their individual funded account.
The minimum pension will be decided by the affiliates, being an amount not less than the basket of basic goods
determined by the National Institute of Statistics and Informatics.
Members may use the surplus of the individually funded account (i) by transferring it to their voluntary
contributions account for non-pension purposes and freely dispose or (ii) by issuing negotiable guarantees for an amount equivalent to the excess of the individually funded accounts. These guarantees have a maturity of two years
from their issuance.
Regulations under this new law are expected to be published in the coming months.
|
b)
|
On March 30, 2023, Credicorp acquired Joinnus, which is ticket sales for sports and entertainment events platform. This operation diversifies the portfolio of
digital products Credicorp.
|
F-187