UNITED STATES
SECURITIES AND EXCHANGE COMMISSION
Washington, D.C. 20549
FORM
(Mark One)
|
|
Annual Report Pursuant To Section 13 or 15(d) Of The Securities Exchange Act of 1934 |
For the fiscal year ended
Or
|
|
Transition Report Pursuant To Section 13 or 15(d) Of The Securities Exchange Act of 1934 |
For the transition period from ______________ to ______________.
Commission file number:
(Exact name of registrant as specified in its charter)
|
|
|
| ||
(State or other jurisdiction of incorporation or organization) |
| (I.R.S. Employer Identification No.) |
|
|
|
| ||
(Address of principal executive offices) |
| (Zip Code) |
Registrant's telephone number, including area code: 1-(
Securities registered pursuant to Section 12(b) of the Act:
|
|
|
Title of each class |
| Name of each exchange on which registered |
|
Trading Symbol
Securities registered pursuant to Section 12(g) of the Act: None
Indicate by check mark if the registrant is a well-known seasoned issuer, as defined in Rule 405 of the Securities Act.
YES o NO
Indicate by check mark if the registrant is not required to file reports pursuant to Section 13 or Section 15(d) of the Act.
YES o NO
Indicate by check mark whether the Registrant (1) has filed all reports required to be filed by Section 13 or 15(d) of the Securities Exchange Act of 1934 during the preceding 12 months (or for such shorter period that the registrant was required to file such reports), and (2) has been subject to such filing requirements for the past 90 days.
YES NO o
Indicate by check mark whether the Registrant has submitted electronically every Interactive Data File required to be submitted pursuant to Rule 405 of Regulation S-T during the preceding 12 months (or such shorter period that the Registrant was required to submit such files).
YES NO o
Indicate by check mark whether the registrant is a large accelerated filer, an accelerated filer, a non-accelerated filer, a smaller reporting company, or an emerging growth company. See definitions of “large accelerated filer,” “accelerated filer,” “smaller reporting company,” and “emerging growth company” in Rule 12b-2 of the Exchange Act.:
|
|
|
|
Large accelerated filer o | Non-accelerated filer o | Smaller reporting company |
If any emerging growth company, indicate by check mark if the registrant has elected not to use the extended transition period for complying with any new or revised financial accounting standards provided pursuant to Section 13(a) of the Exchange Act o
Indicate by check mark whether the registrant has filed a report on and attestation to its management’s assessment of the effectiveness of its internal control over financial reporting under Section 404(b) of the Sarbanes-Oxley Act (15 U.S.C. 7262(b)) by the registered public accounting firm that prepared or issued its audit report.
If securities are registered pursuant to Section 12(b) of the Act, indicate by check mark whether the financial statements of the registrant included in the filing reflect the correction of an error to previously issued financial statements.
Indicate by check mark whether any of those error corrections are restatements that required a recovery analysis of incentive-based compensation received by any of registrant’s executive officers during the relevant recovery period pursuant to §240.10D-1(b). o
Indicate by check mark whether the registrant is a shell company (as defined in Rule 12b-2 of the Act). YES ¨ NO
The aggregate market value of the voting and non-voting common equity held by non-affiliates of the Registrant, computed by reference to the last sale price on June 30, 2023, as reported by the Nasdaq Global Market, was approximately $
As of March 1, 2024, there were
DOCUMENTS INCORPORATED BY REFERENCE:
TABLE OF CONTENTS
PART I
ITEM 1. BUSINESS
Forward-Looking Statements
This report on Form 10-K contains forward-looking statements that are based on assumptions and may describe future plans, strategies and expectations of BCB Bancorp, Inc. and subsidiaries. This document may include forward-looking statements within the meaning of Section 27A of the Securities Act of 1933 and Section 21E of the Securities Exchange Act of 1934. The Company intends such forward-looking statements to be covered by the safe harbor provisions for forward-looking statements contained in the Private Securities Litigation Reform Act of 1995, and is including this statement for purposes of said safe harbor provisions. Forward-looking information is inherently subject to risks and uncertainties, and actual results could differ materially from those currently anticipated due to a number of factors, which include, but are not limited to, factors discussed in this Annual Report on Form 10-K and in other documents filed with the Securities and Exchange Commission. These forward-looking statements, which are based on certain assumptions and describe future plans, strategies, and expectations of the Company, are generally identified by use of the words “anticipate,” “believe,” “estimate,” “expect,” “intend,” “plan,” “project,” “seek,” “strive,” “try,” or future or conditional verbs such as “will,” “would,” “should,” “could,” “may,” or similar expressions. Although we believe that our plans, intentions and expectations, as reflected in these forward-looking statements are reasonable, we can give no assurance that these plans, intentions or expectations will be achieved or realized. By identifying these statements for you in this manner, we are alerting you to the possibility that our actual results and financial condition may differ, possibly materially, from the anticipated results and financial condition indicated in these forward-looking statements. Important factors that could cause our actual results and financial condition to differ from those indicated in the forward-looking statements include, among others, changes in market interest rates, general economic conditions, legislation, and regulation; changes in monetary and fiscal policies of the United States Government, including policies of the United States Treasury and Federal Reserve Board; changes in the quality or composition of the loan or investment portfolios; changes in deposit flows, competition, and demand for financial services, loans, deposits and investment products in our local markets; changes in accounting principles and guidelines; war or terrorist activities; and other economic, competitive, governmental, regulatory, geopolitical and technological factors affecting the our operations, pricing and services, and those discussed under “Risk Factors” in Part I, Item 1A of this Annual Report on Form 10-K. Although we believe that the expectations reflected in the forward-looking statements are reasonable, we cannot guarantee future results, levels of activity, performance or achievements. You should not place undue reliance on these forward-looking statements, which reflect our expectations only as of the date of this report. We do not assume any obligation to revise forward-looking statements to reflect events or circumstances that occur after the date on which such statements were made, except as may be required by law.
BCB Bancorp, Inc.
BCB Bancorp, Inc. (individually referred to herein as the “Parent Company” and together with its subsidiaries, collectively referred to herein as the “Company”) is a New Jersey corporation established in 2003, and is the holding company parent of BCB Community Bank (the “Bank”). The Company has not engaged in any significant business activity other than owning all of the outstanding common stock of BCB Community Bank. Our executive office is located at 104-110 Avenue C, Bayonne, New Jersey 07002. Our telephone number is 1-(800)-680-6872 and our website is www.bcb.bank. Information on our website is not incorporated into this Annual Report on Form 10-K. At December 31, 2023 we had $3.832 billion in consolidated assets, $2.979 billion in deposits and $314.1 million in consolidated stockholders’ equity. The Parent Company is subject to extensive regulation by the Board of Governors of the Federal Reserve System.
BCB Community Bank
The Bank opened for business on November 1, 2000 as Bayonne Community Bank, a New Jersey chartered commercial bank. The Bank changed its name from Bayonne Community Bank to BCB Community Bank in April 2007. At December 31, 2023, the Bank operated at twenty-four branches in Bayonne, Edison, Hoboken, Fairfield, Holmdel, Jersey City, Lyndhurst, Maplewood, Monroe Township, Newark, Parsippany, Plainsboro, River Edge, Rutherford, South Orange, Union, and Woodbridge, New Jersey, as well as four branches in Staten Island and Hicksville, New York, through executive offices located at 104-110 Avenue C, and an administrative office located at 591-595 Avenue C, Bayonne, New Jersey 07002. The Bank’s deposit accounts are insured by the Federal Deposit Insurance Corporation (the “FDIC”) and the Bank is a member of the Federal Home Loan Bank (“FHLB”) System.
We are a community-oriented financial institution. Our business is to offer FDIC-insured deposit products and to invest funds held in deposit accounts at the Bank, together with funds generated from operations, in loans and investment securities. We offer our customers:
loans, including commercial and multi-family real estate loans, one-to-four family mortgage loans, commercial business loans, construction loans, home equity loans, and consumer loans. In recent years the primary growth in our loan portfolio has been in loans secured by commercial real estate and multi-family properties;
FDIC-insured deposit products, including savings and club accounts, interest and non-interest-bearing demand accounts, money market accounts, certificates of deposit, and individual retirement accounts; and,
retail and commercial banking services including wire transfers, money orders, safe deposit boxes, night depository, debit cards, online banking, mobile banking, fraud detection (positive pay), and automated teller services.
Recent Events
On December 14, 2023, the Company completed a private placement of 1,527 shares of Series J Noncumulative Perpetual Stock, par value $0.01 per share (the “Series J Preferred Stock”), resulting in gross proceeds of $15,270,000. Also during the fourth quarter of 2023, the Company redeemed the remaining 1,101 outstanding shares of its Series H 3.5% Noncumulative Perpetual Preferred Stock, at their face value of $10,000 per share, for a total redemption amount of $11.0 million.
On September 14, 2023, the Company redeemed 22 outstanding shares of its Series H 3.5% Noncumulative Perpetual Preferred Stock, at their face value of $10,000 per share, for a total redemption amount of $220,000.
Business Strategy
Our business strategy is to operate as a well-capitalized, profitable, and independent community-oriented financial institution dedicated to providing the highest quality customer service. Management’s and the Board of Directors’ extensive knowledge of the markets we serve helps to differentiate us from our competitors. Our business strategy incorporates the following elements: maintaining a community focus, focusing on profitability, strengthening our balance sheet, emphasizing real estate- based lending, capitalizing on market dynamics, providing attentive and personalized service, and attracting highly qualified and experienced personnel. These attributes coupled with our desire to seek out under-served markets for banking products and services, facilitate the growth of our franchise footprint organically and synergistically.
Maintaining a community focus. Our management and Board of Directors have strong ties to the communities we serve. Many members of the management team are New Jersey natives and are active in the communities we serve through non-profit board membership, local business development organizations, and industry associations. In addition, our board members are well-established professionals and business leaders in the communities we serve. Management and the Board are interested in making a lasting contribution to these communities, and they have succeeded in attracting deposits and loans through attentive and personalized service.
Focusing on profitability. Management is focused on optimizing profitability while also meeting the needs of businesses and individuals in its community. The persistently high interest rate environment and competition for liquidity have negatively impacted margins for our industry. Management continues to prudently manage its balance sheet to protect its spread income in a challenging operating environment. Additionally, Management continues to be committed to managing and controlling our non-interest expenses to improve our efficiency ratio.
Strengthening our balance sheet. Management has slowed its balance sheet growth to strengthen its liquidity and capital position. Management is focused on reducing reliance on wholesale borrowing that is expensive and not core to the Bank’s operating philosophy. Additionally, slower balance sheet growth combined with profitability are expected to continue to enhance the Company’s capital position. Management remains committed to strengthening the Company’s statements of financial condition and maintaining profitability by diversifying the products, pricing and services we offer. Additionally, the Company is very focused on maintaining robust asset quality as the industry continues to face challenges from an uncertain macroeconomic environment.
Emphasizing real estate-based lending. A primary focus of our business strategy is to originate loans secured by commercial and multi-family properties. Such loans generally provide higher returns than loans secured by one-to-four family properties. As a result of our underwriting practices, including debt service requirements for commercial real estate and multi-family loans, management believes that such loans offer us an opportunity to obtain higher returns without a significant increased level of risk.
Capitalizing on market dynamics. The consolidation of the banking industry in northeast New Jersey has provided a unique opportunity for a customer-focused banking institution, such as our Bank. We believe our local roots and community focus provide the Bank with an opportunity to capitalize on the consolidation in our market area. This consolidation has moved decision making away from local, community-based banks to much larger banks headquartered outside of New Jersey. We believe our local roots and community focus provide the Bank with an opportunity to capitalize on the consolidation in our market area.
Providing attentive and personalized service. Management believes that providing attentive and personalized service is the key to gaining deposit and loan relationships in the markets we serve and their surrounding communities.
Attracting highly experienced and qualified personnel. An important part of our strategy is to hire bankers who have prior experience in the markets we serve, as well as pre-existing business relationships. Our management team averages over decades of banking experience, while our lenders and branch personnel have significant experience at community banks and regional banks throughout the region. Management believes that its knowledge of these markets has been a critical element in the success of the Bank. Management’s extensive knowledge of the local communities has allowed us to develop and implement a highly focused and disciplined approach to lending, and has enabled the Bank to attract a high percentage of low-cost deposits.
Our Market Area
We are located in Bayonne, Jersey City and Hoboken in Hudson County, Edison, Monroe Township, Plainsboro and Woodbridge in Middlesex County, Lyndhurst, River Edge, and Rutherford in Bergen County; Fairfield, Maplewood, Newark, and South Orange in Essex County, Holmdel in Monmouth County, Parsippany in Morris County, and Union in Union County, New Jersey. The Bank also operates three branches in Staten Island, New York and one in Hicksville, New York. The Bank’s locations are easily accessible and provide convenient services to businesses and individuals throughout our market area. These areas are all considered “bedroom” or “commuter” communities to Manhattan. Our market area is well-served by a network of arterial roadways, including Route 440 and the New Jersey Turnpike.
Our market area has a high level of commercial business activity. Businesses are concentrated in the service sector and retail trade areas. Major employers in our market area include certain medical centers, municipalities, and school districts.
Competition
The banking industry in northeast New Jersey and New York City is extremely competitive. We compete for deposits and loans with existing New Jersey and out-of-state financial institutions that have longer operating histories, larger capital reserves, and more established customer bases. Our competition includes large financial services companies and other entities, in addition to traditional banking institutions, such as savings and loan associations, savings banks, commercial banks and credit unions. Our larger competitors have a greater ability to finance wide-ranging advertising campaigns through greater capital resources. Our marketing efforts depend heavily upon referrals from officers, directors, stockholders, advertising in local media, and through a social media presence. We compete for business principally on the basis of personal service to customers, customer access to our business development officers, loan officers, executive officers and directors, and competitive interest rates and fees.
In the financial services industry in recent years, intense market demands, technological and regulatory changes, and economic pressures have eroded industry classifications that were once clearly defined. Banks have diversified their services, competitively priced their deposit products and become more cost-effective as a result of competition with each other and with new types of financial service companies, including non-banking competitors. Some of these market dynamics have resulted in a number of new bank and non-bank competitors, increased merger activity, and increased customer awareness of product and service differences among competitors
Lending Activities
Loan Maturities. The following table sets forth the contractual maturity of our loan portfolio at December 31, 2023. The amount shown represents outstanding principal balances. Demand loans, loans having no stated schedule of repayments and no stated maturity and overdrafts are reported as being due in one year or less. The table does not include prepayments or scheduled principal repayments.
|
|
|
|
|
|
|
|
|
|
|
|
|
|
|
|
|
|
| Due within 1 Year |
|
| Due after 1 through 5 Years |
|
| After 5 Years through 15 Years |
|
| After 15 Years |
|
| Total |
|
| (In Thousands) | |||||||||||||
Residential One-to-four family |
| $ | 9 |
| $ | 9,215 |
| $ | 25,285 |
| $ | 213,786 |
| $ | 248,295 |
Construction |
|
| 178,515 |
|
| 9,378 |
|
| - |
|
| 4,923 |
|
| 192,816 |
Commercial business(1) |
|
| 151,025 |
|
| 133,523 |
|
| 75,997 |
|
| 11,657 |
|
| 372,202 |
Commercial and multi-family |
|
| 151,674 |
|
| 555,795 |
|
| 440,250 |
|
| 1,286,396 |
|
| 2,434,115 |
Home equity(2) |
|
| 565 |
|
| 2,070 |
|
| 12,930 |
|
| 50,766 |
|
| 66,331 |
Consumer |
|
| 1,853 |
|
| 1,491 |
|
| 299 |
|
| - |
|
| 3,643 |
Total amount due |
| $ | 483,641 |
| $ | 711,472 |
| $ | 554,761 |
| $ | 1,567,528 |
| $ | 3,317,402 |
__________
(1) Includes business lines of credit.
(2) Includes home equity lines of credit.
Loans with Fixed or Floating or Adjustable Rates of Interest. The following table sets forth the dollar amount of all loans at December 31, 2023 that are due after December 31, 2024, and have fixed interest rates or that have floating or adjustable interest rates.
|
|
|
|
|
|
|
|
|
|
|
|
|
|
|
|
|
|
|
|
|
|
|
|
|
|
|
|
|
|
|
|
|
|
|
|
|
|
|
|
|
|
| Fixed Rates |
|
| Floating or Adjustable Rates |
|
| Total |
|
|
| (In Thousands) | ||||||
Residential One-to-four family |
| $ | 157,792 |
| $ | 90,494 |
| $ | 248,286 |
Construction |
|
| - |
|
| 14,301 |
|
| 14,301 |
Commercial business(1) |
|
| 74,263 |
|
| 146,914 |
|
| 221,177 |
Commercial and multi-family |
|
| 387,039 |
|
| 1,895,402 |
|
| 2,282,441 |
Home equity(2) |
|
| 15,552 |
|
| 50,214 |
|
| 65,766 |
Consumer |
|
| 1,200 |
|
| 590 |
|
| 1,790 |
Total amount due |
| $ | 635,846 |
| $ | 2,197,915 |
| $ | 2,833,761 |
(1) Includes business lines of credit.
(2) Includes home equity lines of credit.
Commercial and Multi-family Real Estate Loans. Commercial real estate loans are secured by improved property such as office buildings, mixed use buildings, retail stores, shopping centers, warehouses, and other non-residential buildings. Loans secured by multi-family properties contain five or more residential units. Generally, the Bank offers fully amortizing loans on both property types at loan amounts up to 75 percent of the appraised value of the property. Both commercial and multi-family real estate loans are generally made at rates that adjust above the Federal Home Loan Bank of New York interest rate, with terms of up to 30 years. In addition, the Bank offers balloon loans with fixed interest rates which generally mature in three to five years with amortization periods up to 30 years. The Bank’s owner-occupied loans represented 21% of total Commercial and multi-family loans as of December 31, 2023 and the Bank’s multi-family portfolio represented 23% of the total Commercial and multi-family real estate loans. The rent controlled portion comprised 5% of total multi-family loans. The Bank’s multi-family loan portfolio had average LTVs of 55%. As of December 31, 2023, the Bank’s largest commercial real estate loan had an outstanding principal balance of $42.5 million. The borrower is a well-known private university, and the loan is secured by various properties which are associated with University functions. This loan is performing in accordance with its terms at December 31, 2023.
Loans secured by commercial and multi-family real estate are generally larger and involve a greater degree of risk than one-to-four family residential mortgage loans. The borrower’s creditworthiness, as well as the property’s continued viability and cash flow potential are of primary concern in commercial and multi-family real estate lending. Commercial loans secured by owner occupied properties involve different risks when measured against one-to-four family residential and non-owner-occupied commercial mortgage loans. Cash flow on owner occupied properties is often dependent on the success of the business operation contained within the subject property. The Bank intends to continue the origination of loans secured by commercial real estate and multi-family properties.
Construction Loans. The Bank offers loans to finance the construction of various types of commercial and residential properties. Generally, construction loans are offered with terms of up to thirty months, with adjustable interest rates tied to a margin above Prime Rate. Customarily, the Bank originates loans on projects which have all necessary permits in place to the Bank’s satisfaction. Construction loan funds are disbursed as the project progresses. The Bank also offers construction loans that convert to a permanent mortgage on the property upon completion of the project, provided compliance with conditions set forth at loan approval. Terms of such permanent mortgage loans are similar to other mortgage loans secured by similar properties, with the interest rate established at the time of conversion. As of December 31, 2023, the Bank’s largest construction loan has a borrowing capacity of $24.8 million, of which $200,000 has not been disbursed. The loan is recourse to a well-capitalized borrower, with proceeds used to construct a transit-oriented multifamily development in northern New Jersey. This loan is performing in accordance with its terms at December 31, 2023.
Construction financing is generally considered a higher risk lending product. To mitigate risks, the Bank will, among other things, obtain a plan and cost review from a third-party vendor, which reviews the borrowers proposed construction budget for appropriateness. The Bank will also obtain an appraisal report which provides values based on various possible project results. These reports generally include value scenarios such as “As Is,” “As Completed,” “As a Rental,” “As Sellout,” and “As a Bulk Sale.”
Commercial Business Loans. The Bank offers a variety of commercial business loans in the form of either lines of credit or fully amortizing term loans. Lines of credit (LOCs) are typically utilized for working capital purposes. LOCs are either revolving or non-revolving and provide loan terms between one and three years. LOC repayment is generally interest only with adjustable interest rates tied to a margin above Prime Rate. Term loans are typically utilized for the purchase of a business or
equipment for a business, and carry fully amortizing terms up to seven years. Term loan interest rates may be fixed or adjustable and tied to a margin above the Federal Home Loan Bank of New York rate. Commercial business loans are underwritten based upon the borrower’s ability to service such debt from income. These loans are generally made to small and mid-sized companies located within the Bank’s primary and secondary lending areas. Depending on the circumstances, a commercial business loan may be secured by equipment, accounts receivable, inventory, chattel or other assets. As of December 31, 2023, the Bank’s largest commercial business loan has an outstanding balance of $24.3 million and is collateralized by 2nd mortgages on various franchises. This loan is performing in accordance with its terms at December 31, 2023.
Commercial business loans generally have higher rates and shorter terms than one-to-four family residential loans, but may also involve higher average balances and a higher risk of default, as their repayment generally depends on the success of the borrower’s business.
SBA Lending. The Bank offers qualifying business loans guaranteed by the U.S. Small Business Administration (“SBA”). Amongst other characteristics, SBA borrowers are often sound businesses, but may have a smaller amount of equity funds to invest in their businesses, may be at an emergent stage of business development, or have other characteristics that may make them ineligible for conventional bank loans. There is a well-developed market for the sale of the guaranteed portion of SBA 7(a) loans. As of December 31, 2023, the Bank’s largest SBA loan has an outstanding balance of $4.9 million and is secured by a gym located in Marlboro, NJ. This loan is performing in accordance with its terms at December 31, 2023.
Residential Lending. Residential loans are secured by one-to-four family dwellings, condominiums and cooperative units. Residential mortgage loans are secured by properties located in our primary lending areas of Bergen, Essex, Middlesex, Hudson, Monmouth and Richmond Counties; adjoining counties are considered as our secondary lending areas. Generally, we originate residential mortgage loans up to 80 percent loan-to-value at a maximum loan amount of $2.5 million and 75 percent loan-to-value at a maximum loan amount of $5.0 million for primary residences. The loan-to-value ratio is based on the lesser of the appraised value or the purchase price without the requirement of private mortgage insurance. We will originate loans with loan-to-value ratios up to 90 percent, provided the borrower obtains private mortgage insurance approval. We originate both fixed and adjustable rate residential loans with a term of up to 30 years. We offer 15, 20, and 30 year fixed, 15/30-year balloon and 3/1, 5/1, 7/1 and 10/1 adjustable rate loans with payments being calculated to include principal, interest, taxes and insurance. The 3/1 and 5/1 adjustable rate loans are qualified at 2.0 percent above the start rate; all other loans are qualified at the start rate. We have a number of correspondent relationships with third party lenders in which we deliver closed first mortgage loans. Our correspondent banking relationships allow us to offer customers competitive long-term fixed and adjustable rate loans we could not otherwise originate, while providing the Bank a source of fee income. During 2023, loans totaling approximately $2.3 million were sold in the secondary market and gains of approximately $36,000 were recognized from the sale of such loans.
Home Equity Loans and Home Equity Lines of Credit. The Bank offers home equity loans and lines of credit that are secured by either the borrower’s primary residence, a secondary residence or an investment property. Our home equity loans can be structured as loans that are disbursed in full at closing or as lines of credit. Home equity lines of credit are offered with terms up to 20 years. Virtually all of our home equity loans are originated with fixed rates of interest and home equity lines of credit are originated with adjustable interest rates tied to the prime rate. Home equity loans and lines of credit are underwritten utilizing the same criteria used to underwrite one-to-four family residential loans. Home equity lines of credit may be underwritten with a loan-to-value ratio of up to 80 percent in a first lien position. At December 31, 2023, the outstanding and committed balances of home equity loans and lines of credit totaled $56.9 million and $57.0 million, respectively.
Consumer Loans. The Bank makes secured passbook, automobile and, on occasion, unsecured consumer loans. Consumer loans generally have terms between one and five years. They generally are made on a fixed rate basis, fully-amortizing.
Loan Approval Authority and Underwriting. The Bank’s Lending Policy has established lending limits for executive management. Two senior officers have the authority to approve loan requests up to $3.0 million (Level 1). Two officers with authority, one designated senior officer and one executive officer (CEO, CLO, and/or COO), have authority to approve loan requests greater than $3.0 million (Level 2). For loan requests greater than $20.0 million, with certain policy exceptions, Level 3 authorization is required. Level 3 requires Level 2 signatures plus a majority of the Bank’s Loan Committee Members. Deviation of 5 basis points or less from Policy DSCR and/or LTV calculations (regardless of single credit or exposure amount), may be approved at the discretion of management. Loans approved by the Loan Committee shall be presented to the Board of Directors for ratification in a timely manner.
The Bank will customarily begin its underwriting analysis of a loan request upon receipt of a completed loan application, and all appropriate financial information from a prospective borrower. Property valuations or appraisals are required for all real estate collateralized loans. Appraisals are prepared by a state certified independent appraiser approved by the Bank Board of Directors.
Loan Commitments. Written commitments are given to prospective borrowers on all approved loans. Generally, we honor commitments for up to 60 days from the date of issuance. At December 31, 2023, our outstanding loan origination commitments totaled $975,000, standby letters of credit totaled $13.4 million, undisbursed construction funds totaled $63.4 million, and undisbursed lines of credit funds totaled $235.3 million.
Loan Delinquencies. Notices of nonpayment are generated to borrowers once the loan account(s) becomes either 10 or 15 days past due, as specified in the applicable promissory note. A nonresponsive borrower will receive collection calls and a site visit from a bank representative in addition to follow-up delinquency notices. If such payment is not received after 60 days, a notice of right to cure default is sent to the borrower providing 30 additional days to bring the loan current before foreclosure or other remedies are commenced. The Bank utilizes various reporting tools to closely monitor the performance and asset quality of the loan portfolio. The Bank complies with all federal, state and local laws regarding collection of its delinquent accounts.
Nonaccrual Status. Loans are placed on a nonaccrual status when the loan becomes more than 90 days delinquent or when, in our opinion, the collection of payment is doubtful. Once placed on nonaccrual status, the accrual of interest income is discontinued until the loan has been returned to accrual status. At December 31, 2023, the Bank had $18.8 million in non-accruing loans. The largest exposure of non-performing loans was a commercial real estate loan with an outstanding principal balance of approximately $3.6 million fully collateralized by a 21 unit condominium in New York.
As of December 31, 2023, nonaccrual loans differed from the amount of total loans past due greater than 90 days due to loans that were previously 90 days past due which are maintained on nonaccrual status for a minimum of six months until the borrower has demonstrated their ability to satisfy the terms of the loan.
Troubled Debt Restructuring. The Company adopted Accounting Standards Update (“ASU”) 2022-02, Financial Instruments - Credit Losses (Topic 326) Troubled Debt Restructurings and Vintage Disclosures (“ASU 2022-02”) effective January 1, 2023. The amendments in ASU 2022-02 eliminated the recognition and measurement of troubled debt restructurings and enhanced disclosures for loan modifications to borrowers experiencing financial difficulty. The Company did not have any loans that were both experiencing financial difficulty and modified during the twelve months ending December 31, 2023.
Criticized and Classified Loans. The Bank’s Lending Policy contains an internal rating system which evaluates the overall risk of a problem loan. When a loan is classified and determined to be impaired, the Bank may establish specific allowances for credit losses. General allowances represent loss allowances which have been established to recognize the inherent risk associated with lending activities, but which, unlike specific allowances, have not been allocated to particular problem assets. A portion of general loss allowances established to cover possible losses related to assets classified as substandard or doubtful may be included in determining our regulatory capital. Specific valuation allowances for credit losses generally do not qualify as regulatory capital. At December 31, 2023, the Bank reported $85.7 million in classified assets.
The Company’s internal credit risk grades are based on the definitions currently utilized by the banking regulatory agencies. The grades assigned and definitions are as follows, and loans graded excellent, above average, good and watch list (risk ratings 1-5) are treated as “pass” for grading purposes. The “criticized” risk rating (6) and the “classified” risk ratings (7-9) are detailed below:
6 – Special Mention- Loans currently performing but with potential weaknesses including adverse trends in borrower’s operations, credit quality, financial strength, or possible collateral deficiency.
7 – Substandard- Loans that are inadequately protected by current sound worth, paying capacity, and collateral support. Loans on “nonaccrual” status. The loan needs special and corrective attention.
8 – Doubtful- Weaknesses in credit quality and collateral support make full collection improbable, but pending reasonable factors remain sufficient to defer the loss status.
9 – Loss- Continuance as a bankable asset is not warranted. However, this does not preclude future attempts of recovery.
The grades are determined through the use of qualitative and quantitative matrices that consider various characteristics of the loan such as payment performance, quality of management, principals’/guarantors’ character, balance sheet strength, collateral quality, cash flow coverage, position within the industry, loan structure and documentation.
Allowance for Credit Losses. The allowance for credit losses represents the estimated amount considered necessary to cover lifetime expected credit losses inherent in financial assets at the balance sheet date. The measurement of expected credit losses is applicable to loans receivable and securities measured at amortized cost. It also applies to off-balance sheet credit exposures such as loan commitments and unused lines of credit. The allowance is established through a provision for credit losses that is charged against income. The methodology for determining the allowance for credit losses is considered a critical accounting policy by management because of the high degree of judgment involved, the subjectivity of the assumptions used, and the potential for changes in the forecasted economic environment that could result in changes to the amount of the recorded allowance for credit losses. The allowance for credit losses is reported separately as a contra-asset on the consolidated statement of financial condition. The expected credit loss for unfunded lending commitments and unfunded loan commitments is reported on the consolidated statement of financial condition in other liabilities while the provision for credit losses related to unfunded commitments is reported in other non-interest expense.
Allowance for Credit Losses on Loans Receivable. The allowance for credit losses on loans is deducted from the amortized cost basis of the loan to present the net amount expected to be collected. Expected losses are evaluated and calculated on a collective, or pooled, basis for those loans which share similar risk characteristics. If the loan does not share risk characteristics with other loans, the Company will evaluate the loan on an individual basis. Individually evaluated loans are primarily nonaccrual and collateral dependent loans. Furthermore, the Company evaluates the pooling methodology at least annually to ensure that loans with similar risk characteristics are pooled appropriately. Loans are charged off against the allowance for credit losses when the Company believes the balances to be uncollectible. Expected recoveries do not exceed the aggregate of amounts previously charged off or expected to be charged off.
The Company has chosen to segment its portfolio consistent with the manner in which it manages credit risk. The Company calculates estimated credit losses for these loan segments using quantitative models and qualitative factors. Further information on loan segmentation and the credit loss estimation is included in Note 7 – Loan Receivables and Allowance for Credit Losses.
Individually Evaluated Loans. On a case-by-case basis, the Company may conclude that a loan should be evaluated on an individual basis based on its disparate risk characteristics. When the Company determines that a loan no longer shares similar risk characteristics with other loans in the portfolio, the allowance will be determined on an individual basis using the present value of expected cash flows or, for collateral-dependent loans, the fair value of the collateral as of the reporting date, less estimated selling costs, as applicable. If the fair value of the collateral is less than the amortized cost basis of the loan, the Company will charge off the difference between the fair value of the collateral, less costs to sell at the reporting date and the amortized cost basis of the loan.
Allowance for Credit Losses on Off-Balance Sheet Commitments. The Company is required to include unfunded commitments that are expected to be funded in the future within the allowance calculation, other than those that are unconditionally cancelable. To arrive at that reserve, the Company relies on a third-party econometric model that calculates current utilization rates and projected utilization rates for different loan segments. The model then develops projections for future draws on the lines and forecasts losses to estimate reserves for each loan segment. The allowance for credit losses on unfunded loan commitments is included in other liabilities on the consolidated statement of financial condition and the related credit expense is recorded in other non-interest expense in the consolidated statements of income.
Allowance for Credit Losses on Available for Sale Securities. For available for sale securities in an unrealized loss position, the Company first assesses whether it intends to sell, or it is more than likely than not that it will be required to sell the security before recovery of its amortized cost basis. If either of the criteria regarding intent or requirement to sell is met, the security’s amortized cost basis is written down to fair value through income. For securities available for sale that do not meet the above criteria, the Company evaluates whether the decline in fair value has resulted from credit losses or other factors. In making this assessment, the Company considers the extent to which fair value is less than amortized cost and adverse conditions related to the security, among other factors. If this assessment indicates that a credit loss exists, the present value of cash flows expected to be collected from the security are compared to the amortized cost basis of the security. If the present value of the cash flows expected to be collected is less than the amortized cost basis, a credit loss exists and an allowance for credit losses is recorded for the credit loss, limited by the amount that the fair value is less than the amortized cost. Any impairment that has not been recorded through an allowance for credit losses is recognized in other comprehensive income, net of tax. The Company elected the practical expedient of zero loss estimates for securities issued by U.S. government entities and agencies. These securities are either explicitly or implicitly guaranteed by the U.S. government, are highly rate by major agencies and have a long history of no credit losses.
Changes in the allowance for credit losses are recorded as provision for, or reversal of, credit loss expense. Losses are charged against the allowance when management believes the uncollectibility of an available for sale security is confirmed or when either of the criteria regarding intent or requirement to sell is met.
Accrued Interest Receivable. The Company made an accounting policy election to exclude accrued interest receivable from the amortized cost basis of loans and available for sale securities. Accrued interest receivable on loans and securities is reported as a component of accrued interest receivable on the consolidated statement of financial condition.
Allocation of the Allowance for Credit losses. The following table illustrates the allocation of the allowance for credit losses for each category of loan. The allocation of the allowance to each category is not necessarily indicative of future loss in any particular category and does not restrict our use of the allowance to absorb losses in other loan categories.
|
|
|
|
|
|
|
|
|
|
|
|
|
|
|
|
|
|
| December 31, | ||||||||||||||||
|
| 2023 |
|
|
| 2022 |
|
|
| 2021 |
| ||||||
|
| Amount |
| Percent of Loans in each Category to Total Loans |
|
|
| Amount |
| Percent of Loans in each Category to Total Loans |
|
|
| Amount |
| Percent of Loans in each Category to Total Loans |
|
| (Dollars in Thousands) | ||||||||||||||||
Residential one-to-four family | $ | 2,344 |
| 7.48 | % |
| $ | 2,474 |
| 8.11 | % |
| $ | 4,094 |
| 9.58 | % |
Commercial and Multi-family |
| 16,301 |
| 73.38 |
|
|
| 21,749 |
| 76.08 |
|
|
| 22,065 |
| 73.39 |
|
Construction |
| 3,841 |
| 5.81 |
|
|
| 2,094 |
| 4.70 |
|
|
| 2,231 |
| 6.57 |
|
Commercial business(1) |
| 10,353 |
| 11.22 |
|
|
| 5,367 |
| 9.15 |
|
|
| 8,000 |
| 8.15 |
|
Home equity(2) |
| 691 |
| 2.0 |
|
|
| 485 |
| 1.85 |
|
|
| 533 |
| 2.15 |
|
Consumer |
| 78 |
| 0.11 |
|
|
| 24 |
| 0.11 |
|
|
| 14 |
| 0.16 |
|
Unallocated |
| - |
| - |
|
|
| 180 |
| - |
|
|
| 182 |
| - |
|
Total | $ | 33,608 |
| 100.00 | % |
| $ | 32,373 |
| 100.00 | % |
| $ | 37,119 |
| 100.00 | % |
(1) Includes business lines of credit.
(2) Includes home equity lines of credit.
The following table presents, for the years indicated, an analysis of the allowance for credit losses and other related data.
|
|
|
|
|
|
|
|
|
|
|
|
|
|
|
|
|
|
|
|
|
|
|
|
|
|
|
| Years Ended December 31, | ||||||||||
|
|
| 2023 |
|
|
| 2022 |
|
|
| 2021 |
|
|
|
|
|
|
|
|
|
|
|
|
|
|
Allowance for credit losses to total loans outstanding |
|
| 1.01 | % |
|
| 1.05 | % |
|
| 1.58 | % |
Allowance for credit losses |
| $ | 33,608 |
|
| $ | 32,373 |
|
| $ | 37,119 |
|
Total loans outstanding |
| $ | 3,313,316 |
|
| $ | 3,077,704 |
|
| $ | 2,342,061 |
|
|
|
|
|
|
|
|
|
|
|
|
|
|
Nonaccrual loans to total loans outstanding |
|
| 0.57 | % |
|
| 0.17 | % |
|
| 0.64 | % |
Nonaccrual loans |
| $ | 18,783 |
|
| $ | 5,109 |
|
| $ | 14,889 |
|
Total loans outstanding |
| $ | 3,313,316 |
|
| $ | 3,077,704 |
|
| $ | 2,342,061 |
|
|
|
|
|
|
|
|
|
|
|
|
|
|
Allowance for credit losses to nonaccrual loans |
|
| 178.90 | % |
|
| 633.65 | % |
|
| 249.30 | % |
Allowance for credit losses |
| $ | 33,608 |
|
| $ | 32,373 |
|
| $ | 37,119 |
|
Nonaccrual loans |
| $ | 18,783 |
|
| $ | 5,109 |
|
| $ | 14,889 |
|
|
|
|
|
|
|
|
|
|
|
|
|
|
Net charge-offs (recovery) during the period to daily average loans outstanding |
|
|
|
|
|
|
|
|
|
|
|
|
|
|
|
|
|
|
|
|
|
|
|
|
|
Residential one-to-four family |
|
| (0.02) | % |
|
| 0.01 | % |
|
| 0.02 | % |
Net charge-off (recovery) during the period |
|
| (45) |
|
|
| (23) |
|
|
| 42 |
|
Average amount outstanding |
| $ | 248,847 |
|
| $ | 232,916 |
|
| $ | 228,478 |
|
|
|
|
|
|
|
|
|
|
|
|
|
|
Commercial and multi-family |
|
| - | % |
|
| - | % |
|
| - | % |
Net charge-off (recovery) during the period |
|
| - |
|
|
| - |
|
|
| - |
|
Average amount outstanding |
| $ | 2,445,876 |
|
| $ | 1,981,862 |
|
| $ | 1,725,947 |
|
|
|
|
|
|
|
|
|
|
|
|
|
|
Construction |
|
| - | % |
|
| - | % |
|
| - | % |
Net charge-off (recovery) during the period |
|
| - |
|
|
| - |
|
|
| - |
|
Average amount outstanding |
| $ | 162,984 |
|
| $ | 147,411 |
|
| $ | 145,649 |
|
|
|
|
|
|
|
|
|
|
|
|
|
|
Commercial business |
|
| 0.21 | % |
|
| (0.91) | % |
|
| 0.12 | % |
Net charge-off (recovery) during the period |
|
| 765 |
|
|
| 1,904 |
|
|
| 202 |
|
Average amount outstanding |
| $ | 358,048 |
|
| $ | 208,996 |
|
| $ | 172,816 |
|
|
|
|
|
|
|
|
|
|
|
|
|
|
Home equity |
|
| (0.03) | % |
|
| 0.02 | % |
|
| (0.13) | % |
Net charge-off (recovery) during the period |
|
| (16) |
|
|
| (12) |
|
|
| (67) |
|
Average amount outstanding |
| $ | 62,311 |
|
| $ | 53,038 |
|
| $ | 53,495 |
|
|
|
|
|
|
|
|
|
|
|
|
|
|
Consumer |
|
| - | % |
|
| 7.96 | % |
|
| 14.18 | % |
Net charge-off (recovery) during the period |
|
| - |
|
|
| (198) |
|
|
| 198 |
|
Average amount outstanding |
| $ | 3,268 |
|
| $ | 2,487 |
|
| $ | 1,396 |
|
|
|
|
|
|
|
|
|
|
|
|
|
|
Total Loans |
|
| 0.02 | % |
|
| (0.06) | % |
|
| 0.02 | % |
Net charge-off (recovery) during the period |
|
| 704 |
|
|
| 1,671 |
|
|
| 375 |
|
Average amount outstanding |
| $ | 3,281,334 |
|
| $ | 2,626,710 |
|
| $ | 2,327,781 |
|
Investment Activities
Investment Securities. We are required, under federal regulations, to maintain a minimum amount of liquid assets that may be invested in specified short-term securities and certain other investments. The level of liquid assets varies depending upon several factors, including: (i) the yields on investment alternatives, (ii) our judgment as to the attractiveness of the yields then-available in relation to other opportunities, (iii) expectation of future yield levels, and (iv) our projections as to the short-term demand for funds to be used in loan origination and other activities. Debt securities, including mortgage-backed securities, are classified at the time of purchase, based upon management’s intentions and abilities, as securities held-to-maturity or securities available-for-sale. Debt securities acquired with the intent and ability to hold to maturity may be classified as held-to-maturity and stated at cost and adjusted for amortization of premium and accretion of discount, which are computed using the level yield method and recognized as adjustments of interest income. All other debt securities are classified as available-for-sale to serve principally as a source of liquidity.
As of December 31, 2023, there were no securities classified as held-to-maturity. We had $87.8 million in securities classified as available for sale, $9.1 million in equity investments, and no securities classified as trading. Securities classified as available for sale were reported for financial reporting purposes at the fair value with net changes in the fair value from period to period included as a separate component of stockholders’ equity, net of income taxes. Changes in the fair value of debt securities classified as held-to-maturity or available-for-sale do not affect our income, unless we determine there to be an other-than-temporary impairment for those securities in an unrealized loss position. As of December 31, 2023, management concluded that all unrealized losses were temporary in nature since they were related to interest rate fluctuations rather than any underlying credit quality of the issuers.
As of December 31, 2023, our investment policy allowed investments in instruments such as: (i) U.S. Treasury obligations; (ii) U.S. federal agency or federally sponsored enterprise obligations; (iii) mortgage-backed securities; (iv) municipal obligations; (v) equity securities (including preferred stock); (vi) certificates of deposit; and (vii) corporate debt (including subordinated debt). The Board of Directors may authorize additional investments.
To supplement our lending activities, we have invested in residential mortgage-backed securities. Mortgage-backed securities generally yield less than the loans that underlie such securities because of payment guarantees or credit enhancements that reduce credit risk. Mortgage-backed securities can serve as collateral for borrowings, to insure New Jersey municipal deposits through the Governmental Unit Deposit Protection Act (“GUDPA”) and, through repayments, as a source of liquidity. Mortgage-backed securities represent a participation interest in a pool of single-family or other types of mortgages. Principal and interest payments are passed from the mortgage originators, through intermediaries (generally government-sponsored enterprises) that pool and repackage the participation interests in the form of securities, to investors. The government-sponsored enterprises guarantee the payment of principal and interest to investors and include Freddie Mac, Ginnie Mae, and Fannie Mae.
Mortgage-backed securities typically are issued with stated principal amounts. The securities are backed by pools of mortgage loans that have interest rates that are within a set range and have varying maturities. The underlying pool of mortgages can be composed of either fixed rate or adjustable rate mortgage loans. Mortgage-backed securities are generally referred to as mortgage participation certificates or pass-through certificates. The interest rate risk characteristics of the underlying pool of mortgages (i.e., fixed rate or adjustable rate) and the prepayment risk, are passed on to the certificate holder. The life of a mortgage-backed pass-through security is equal to the life of the underlying mortgages. Expected maturities will differ from contractual maturities due to scheduled repayments and because borrowers may have the right to call or prepay obligations with or without prepayment penalties.
Maturities and yields of Securities Portfolio. The following table sets forth information regarding the scheduled maturities, amortized cost, estimated fair values, and weighted average yields for the Bank’s debt securities portfolio at December 31, 2023 by final contractual maturity. Average yield calculation equals the investments estimated annual income divided by the amortized cost. The following table does not take into consideration the effects of scheduled repayments, the effects of possible prepayments, or equity investments. Certain securities have interest rates that are adjustable and will reprice annually within the various maturity ranges. The effect of these repricings are not reflected in the table below.
|
|
|
|
|
|
|
|
|
|
|
|
|
|
|
|
|
|
|
|
|
|
|
|
|
|
|
|
|
|
|
|
|
|
|
|
|
|
|
|
|
|
|
|
|
|
|
|
|
|
|
|
|
|
|
|
|
|
|
|
|
|
|
| More than One to five years |
|
|
| More than five to ten years |
|
|
| More than ten years |
|
|
| Total investment securities |
| |||||||||||||||
|
| Amortized Cost |
|
| Average Yield |
|
|
| Amortized Cost |
|
| Average Yield |
|
|
| Amortized Cost |
|
| Average Yield |
|
|
| Fair Value |
|
| Amortized Cost |
|
| Average Yield |
|
|
|
|
|
|
|
|
|
|
|
|
|
|
|
|
|
|
|
|
|
|
|
|
|
|
|
|
|
|
|
|
Mortgage-backed securities | $ | 605 |
|
| 1.68 | % |
| $ | 4,147 |
|
| 2.81 | % |
| $ | 32,833 |
|
| 3.34 | % |
| $ | 34,613 |
| $ | 37,585 |
|
| 3.26 | % |
Corporate debt securities |
| 8,981 |
|
| 8.99 |
|
|
| 50,583 |
|
| 5.05 |
|
|
| - |
|
| - |
|
|
| 53,156 |
|
| 59,564 |
|
| 5.64 |
|
Total Debt Securities | $ | 9,586 |
|
| 8.53 | % |
| $ | 54,730 |
|
| 4.88 | % |
| $ | 32,833 |
|
| 3.34 | % |
| $ | 87,769 |
| $ | 97,149 |
|
| 4.72 | % |
Sources of Funds
Our major external source of funds for lending and other investment purposes is deposits. Funds are also derived from the receipt of payments on loans, prepayment of loans, maturities of investment securities and mortgage-backed securities and borrowings. Scheduled loan principal repayments are a relatively stable source of funds, while deposit inflows and outflows and loan prepayments are significantly influenced by general interest rates and market conditions.
Deposits. Consumer and commercial deposits are attracted principally from within our primary market area through the offering of a selection of deposit instruments including demand, NOW, savings and club accounts, money market accounts, and term certificate accounts. Deposit account terms vary according to the minimum balance required, the time period the funds must remain on deposit, and the interest rate.
The interest rates paid by us on deposits are set at the direction of our senior management. Interest rates are determined based on our liquidity requirements, interest rates paid by our competitors, our growth goals, and applicable regulatory restrictions and requirements. As of December 31, 2023, we had $505.4 million in brokered certificate deposits. Reciprocal deposits are not considered brokered deposits under applicable regulations.
Deposit Accounts. The following table sets forth the dollar amount of deposits in the various types of deposit programs we offered as of the dates indicated.
|
|
|
|
|
|
|
|
|
|
|
|
|
|
|
|
|
|
|
|
|
|
|
|
|
|
|
|
|
|
|
|
|
|
|
|
| December 31, | ||||||||||||||||
| 2023 |
| 2022 |
| 2021 | ||||||||||||
| Weighted Average Rate(1) |
|
|
| Amount |
| Weighted Average Rate(1) |
|
|
| Amount |
| Weighted Average Rate(1) |
|
|
| Amount |
| (Dollars in Thousands) | ||||||||||||||||
Non-interest bearing accounts | - | % |
| $ | 536,264 |
| - | % |
| $ | 613,910 |
| - | % |
| $ | 588,207 |
Interest bearing checking | 1.28 |
|
|
| 564,912 |
| 0.40 |
|
|
| 757,615 |
| 0.42 |
|
|
| 668,262 |
Savings and club accounts | 0.20 |
|
|
| 284,273 |
| 0.13 |
|
|
| 329,752 |
| 0.16 |
|
|
| 329,724 |
Money market | 2.54 |
|
|
| 370,934 |
| 0.66 |
|
|
| 305,556 |
| 0.50 |
|
|
| 337,126 |
Certificates of deposit | 3.99 |
|
|
| 1,222,697 |
| 1.12 |
|
|
| 804,774 |
| 0.92 |
|
|
| 638,083 |
Total | 2.49 | % |
| $ | 2,979,080 |
| 0.61 | % |
| $ | 2,811,607 |
| 0.56 | % |
| $ | 2,561,402 |
__________
(1) Represents annual interest expense divided by daily average balance.
The following table sets forth our deposit flows during the years indicated.
|
|
|
|
|
|
|
|
|
|
|
|
|
|
|
|
|
|
|
|
|
|
|
|
| Years Ended December 31, | ||||||||||
|
| 2023 |
|
|
| 2022 |
|
|
| 2021 |
|
| (Dollars in Thousands) | ||||||||||
Beginning of year | $ | 2,811,607 |
|
| $ | 2,561,402 |
|
| $ | 2,318,050 |
|
Net deposits |
| 113,286 |
|
|
| 238,502 |
|
|
| 232,124 |
|
Interest credited on deposit accounts |
| 54,187 |
|
|
| 11,703 |
|
|
| 11,228 |
|
Total increase in deposit accounts |
| 167,473 |
|
|
| 250,205 |
|
|
| 243,352 |
|
Ending balance | $ | 2,979,080 |
|
| $ | 2,811,607 |
|
| $ | 2,561,402 |
|
Percent increase |
| 5.96 | % |
|
| 9.77 | % |
|
| 10.50 | % |
|
|
|
|
|
|
|
|
|
|
|
|
|
|
|
|
|
|
|
|
|
|
|
|
Uninsured Deposits. The following table indicates the amount of uninsured deposits and the portion of uninsured time deposits in excess of FDIC insurance limits by time remaining until maturity.
|
|
|
|
|
|
|
|
|
| For the Year Ended December 31, | |||||||
|
| 2023 |
|
| 2022 |
|
| 2021 |
| (Dollars in thousands) | |||||||
Uninsured deposits | $ | 1,111,756 |
| $ | 1,087,703 |
| $ | 1,055,945 |
|
|
|
|
|
|
|
|
|
Uninsured U.S. time deposits with |
|
|
|
| ||||
a maturity of: |
|
|
|
| ||||
3 months or less | $ | 97,312 |
| $ | 35,089 |
| $ | 38,355 |
Over 3 months through 6 months |
| 35,657 |
|
| 26,826 |
|
| 27,639 |
Over 6 months through 12 months |
| 99,638 |
|
| 67,584 |
|
| 101,221 |
Over 12 months |
| 5,611 |
|
| 8,705 |
|
| 18,530 |
Total | $ | 238,218 |
| $ | 138,204 |
| $ | 185,745 |
The following table presents, by rate category, our certificate of deposit accounts as of the dates indicated.
|
|
|
|
|
|
|
|
|
|
|
|
|
|
|
|
|
|
|
|
|
|
|
|
|
|
|
|
|
|
|
|
|
|
|
|
| At December 31, | ||||||||||||||||
|
| 2023 |
|
|
| 2022 |
|
|
| 2021 |
| ||||||
|
| Amount |
| Percent |
|
|
| Amount |
| Percent |
|
|
| Amount |
| Percent |
|
| (Dollars in Thousands) | ||||||||||||||||
Certificate of deposit rates: |
|
|
|
|
|
|
|
|
|
|
|
|
|
|
|
|
|
0.00% - 0.99% | $ | 89,455 |
| 7.32 | % |
| $ | 219,120 |
| 27.23 | % |
| $ | 580,002 |
| 90.90 | % |
1.00% - 1.99% |
| 5,471 |
| 0.45 |
|
|
| 45,228 |
| 5.62 |
|
|
| 23,305 |
| 3.65 |
|
2.00% - 2.99% |
| 17,686 |
| 1.45 |
|
|
| 89,872 |
| 11.17 |
|
|
| 31,783 |
| 4.98 |
|
3.00% - 3.99% |
| 68,877 |
| 5.63 |
|
|
| 206,496 |
| 25.66 |
|
|
| 2,993 |
| 0.47 |
|
4.00% - 4.99% |
| 177,750 |
| 14.54 |
|
|
| 226,734 |
| 28.17 |
|
|
| - |
| - |
|
5.00% - 5.99% |
| 863,458 |
| 70.61 |
|
|
| 17,324 |
| 2.15 |
|
|
| - |
| - |
|
Total | $ | 1,222,697 |
| 100.00 | % |
| $ | 804,774 |
| 100.00 | % |
| $ | 638,083 |
| 100.00 | % |
The following table presents, by rate category, the remaining period to maturity of certificate of deposit accounts outstanding as of December 31, 2023.
|
|
|
|
|
|
|
|
|
|
|
|
|
|
|
|
|
|
|
|
|
|
|
|
|
|
|
|
|
|
|
| Maturity Date | ||||||||||||
|
| 1 Year |
|
| Over 1 |
|
| Over 2 |
|
| Over |
|
|
|
|
| or Less |
|
| to 2 Years |
|
| to 3 Years |
|
| 3 Years |
|
| Total |
|
| (In Thousands) | ||||||||||||
Interest rate: |
|
|
|
|
|
|
|
|
|
|
|
|
|
|
0.00% - 0.99% | $ | 73,105 |
| $ | 11,752 |
| $ | 3,004 |
| $ | 1,594 |
| $ | 89,455 |
1.00% - 1.99% |
| 4,316 |
|
| 1,150 |
|
| - |
|
| 5 |
|
| 5,471 |
2.00% - 2.99% |
| 16,116 |
|
| 58 |
|
| 565 |
|
| 947 |
|
| 17,686 |
3.00% - 3.99% |
| 67,826 |
|
| 723 |
|
| - |
|
| 328 |
|
| 68,877 |
4.00% - 4.99% |
| 175,772 |
|
| 1,978 |
|
| - |
|
| - |
|
| 177,750 |
5.00% - 5.99% |
| 861,985 |
|
| 1,473 |
|
| - |
|
| - |
|
| 863,458 |
Total | $ | 1,199,120 |
| $ | 17,134 |
| $ | 3,569 |
| $ | 2,874 |
| $ | 1,222,697 |
Borrowings. The Overnight Advance Program permits the Bank to borrow overnight up to its maximum borrowing capacity at the FHLB. At December 31, 2023, the Bank’s total credit exposure cannot exceed 50 percent of its total assets, or $1.916 billion, based on the borrowing limitations outlined in the FHLB member products guide. The total credit exposure limit to 50 percent of total assets is recalculated each quarter. Additionally, at December 31, 2023 we had floating rate junior subordinated debentures of $4.1 million which have been callable at the Bank’s option since June 17, 2009, and quarterly thereafter, and fixed-to-floating rate 10-year subordinated debentures of $33.5 million.
The following table sets forth information concerning balances and interest rates on our over-night borrowings at the dates and for the years indicated.
|
|
|
|
|
|
|
|
|
|
|
|
|
|
|
|
|
|
|
|
|
|
|
|
| At or For the Years Ended December 31, | ||||||||||
|
| 2023 |
|
|
| 2022 |
|
|
| 2021 |
|
| (Dollars in Thousands) | ||||||||||
Balance at end of year | $ | - |
|
| $ | 60,000 |
|
| $ | - |
|
Average balance during year | $ | 804 |
|
| $ | 1,313 |
|
| $ | 48 |
|
Maximum outstanding at any month end | $ | 65,000 |
|
| $ | 87,000 |
|
| $ | - |
|
Weighted average interest rate at end of year |
| - | % |
|
| 4.61 | % |
|
| - | % |
Average interest rate during year |
| 4.77 | % |
|
| 3.13 | % |
|
| 0.50 | % |
|
|
|
|
|
|
|
|
|
|
|
|
Subsidiaries
We have three non-bank subsidiaries. BCB Holding Company Investment Corp. was established in 2004 for the purpose of holding and investing in securities. Only securities authorized to be purchased by BCB Community Bank are held by BCB Holding Company Investment Corp. At December 31, 2023, this company held $96.9 million in securities. As a part of the merger with IAB in April, 2018, the Company acquired Special Asset REO 1, LLC and Special Asset REO 2, LLC. Special Asset REO 2, LLC was inactive at December 31, 2023. The Bank changed the name of Special Asset REO 1, LLC to BCB Capital Finance Group, LLC in November 2023. It has not conducted any business as of December 31, 2023.
Human Capital
The Company’s long-term growth and success depends on its ability to attract, develop and retain a high-performing and diverse workforce. The Company strives to provide a work environment that promotes collaboration, productivity, and employee engagement, which in turn drives both employee and customer success, as well as benefits the communities in which the Company does business.
The Company’s Board of Directors and executive team oversee the strategic management of the Company’s human capital resources, and the Company’s Human Resources Department manages the day-to- day of those resources.
Employee profile
As of December 31, 2023, the Company had 266 full-time employees, 46 part-time employees, and no commissioned employees, for a total of 312 employees. In addition, approximately 67% of the Company’s employees are female and 33% are male, and the average tenure was 7 years as of December 31, 2023.
Total Rewards
As part of the Company’s compensation philosophy, market competitive programs are maintained for employees to attract and retain superior talent. In addition to competitive base wages, additional programs include annual bonus compensation opportunities, a Company-matched 401(k) Plan, health and welfare benefits, flexible spending accounts, paid time off, family leave, and employee assistance programs. Some employees also receive grants of equity awards in the Company’s stock. In addition, the Company promotes health and wellness by encouraging work-life balance, and offering flexible work schedules.
Talent and Promoting Diversity
A core tenet of the Company’s talent philosophy is to both develop talent from within and supplement with external hires. Whenever possible, the Company seeks to fill positions by promotion and transfer from within the organization. The Company’s talent acquisition team uses internal and external resources to recruit highly skilled and talented candidates; employee referrals are also encouraged.
The Company is dedicated to recruitment and career development practices that support its employees and promotes diversity in its workforce at all levels of the Company. The Company is committed to having a workforce that reflects the communities in which it serves. Partnerships are in place with several sources to assist in attracting diverse talent from a broad population, including the African American, Asian American, and Latino chamber of commerce affiliations. In addition, career opportunities are shared with colleges and universities with diverse student bodies. The Company’s internship program also serves as a pipeline of diverse talent for full time employment. Other available tools are also utilized to connect with prospective new hires. As of December 31, 2023, 48% of the Company’s employees were persons of color.
Following a multi-pronged recruiting strategy, which includes sourcing diverse candidate pools, new hires participate in an onboarding program which includes an introduction to the Company’s culture, policies, and procedures. Retention strategies include espousing a culture that inspires loyalty and trust through ongoing communication of strategic initiatives, in addition to the benefits mentioned above in Total Rewards. The Company’s leadership development programs and opportunities offered through the Company’s continuing education program help ensure that motivated individuals have the opportunity for continuous improvement. Employees each maintain a professional development action plan and participate in regular evaluation and growth opportunities.
This approach has yielded loyalty and commitment from employees which in turn grows the business, products, and customers. This approach has also added new employees and ideas, which support a continuous improvement mindset and the goals of a diverse and inclusive workforce.
The Company strives to promote inclusion through defined Company values and behaviors. With the support from the Board of Directors, the Company continues to explore additional diversity, equity, inclusion, and belonging efforts through multiple approaches to inclusion: candidates, employees, and the marketplace. The Company is focused on sourcing and hiring with fair and equitable approaches, creating an environment where all employees can develop and thrive.
Supervision and Regulation
Bank holding companies and banks are extensively regulated under both federal and state law. These laws and regulations are primarily intended to protect depositors and the deposit insurance funds, rather than to protect shareholders and creditors. The description below is limited to certain material aspects of the statutes and regulations addressed, and is not intended to be a complete description of such statutes and regulations and their effects on the Parent Company or the Bank.
Set forth below is a summary of certain material regulatory requirements applicable to the Parent Company and the Bank. These and any other changes in applicable laws or regulations, whether by Congress or regulatory agencies, may have a material effect on the business and prospects of the Parent Company and the Bank.
The Dodd-Frank Act
The Dodd-Frank Wall Street Reform and Consumer Protection Act (the “Dodd-Frank Act”) significantly changed bank regulation and has affected the lending, investment, trading, and operating activities of depository institutions and their holding companies. The Dodd-Frank Act also created the Consumer Financial Protection Bureau (the “CFPB”) with extensive powers to supervise and enforce consumer protection laws. The CFPB has broad rule-making authority for a wide range of consumer protection laws that apply to all banks and savings institutions, including the authority to prohibit “unfair, deceptive, or abusive” acts and practices. The Dodd-Frank Act required the CFPB to issue regulations requiring lenders to make a reasonable good faith determination as to a prospective borrower’s ability to repay a residential mortgage loan. The final “Ability to Repay” rules, which were effective beginning January 2014, established a “qualified mortgage” safe harbor for loans whose terms and features are deemed to make the loan less risky.
The Dodd-Frank Act broadened the base for FDIC assessments for deposit insurance and permanently increased the maximum amount of deposit insurance to $250,000 per depositor. The legislation also, among other things, requires originators of certain securitized loans to retain a portion of the credit risk, stipulates regulatory rate-setting for certain debit card interchange fees, repealed restrictions on the payment of interest on commercial demand deposits, and contains a number of reforms related to mortgage originations. The legislation also directed the Board of Governors of the Federal Reserve System (the "Federal Reserve Board") to promulgate rules prohibiting excessive compensation paid to company executives, regardless of whether the company is publicly traded or not.
Bank Holding Company Regulation
As a bank holding company registered under the Bank Holding Company Act of 1956, as amended, the Company is subject to the regulation and supervision applicable to bank holding companies by the Federal Reserve Board. The Company is also subject to the provisions of the New Jersey Banking Act of 1948 (the “New Jersey Banking Act”) and the regulations of the Commissioner of the New Jersey Department of Banking and Insurance (“Commissioner”). The Company is required to file reports with the Federal Reserve Board and the Commissioner regarding its business operations and those of its subsidiaries.
Federal Regulation. The Company is required to obtain the prior approval of the Federal Reserve Board to acquire all, or substantially all, of the assets of any bank or bank holding company. Prior Federal Reserve Board approval would be required for the Company to acquire direct or indirect ownership or control of any voting securities of any bank or bank holding company if it would, directly or indirectly, own or control more than 5.0 percent of any class of voting shares of the bank or bank holding company.
A bank holding company is generally prohibited from engaging in, or acquiring, direct or indirect control of more than 5.0 percent of the voting securities of any company engaged in non-banking activities. One of the principal exceptions to this prohibition is for activities found by the Federal Reserve Board to be so closely related to banking or managing or controlling banks as to be a proper incident thereto. Some of the principal activities that the Federal Reserve Board has determined by regulation to be closely related to banking are: (i) making or servicing loans; (ii) performing certain data processing services; (iii) providing securities brokerage services; (iv) acting
as fiduciary, investment or financial advisor; (v) leasing personal or real property under certain conditions; (vi) making investments in corporations or projects designed primarily to promote community welfare; and (vii) acquiring a savings association.
A bank holding company that meets specified conditions, including depository institutions subsidiaries that are “well capitalized” and “well managed,” may opt to become a “financial holding company.” A “financial holding company” may engage in a broader array of financial activities than permitted a typical bank holding company. Such activities can include insurance underwriting and investment banking. The Company has not elected “financial holding company” status.
A bank holding company is generally required to give the Federal Reserve Board prior written notice of any purchase or redemption of then-outstanding equity securities if the gross consideration for the purchase or redemption, when combined with the net consideration paid for all such purchases or redemptions during the preceding 12 months, is equal to 10.0 percent or more of the company’s consolidated net worth. The Federal Reserve Board may disapprove such a purchase or redemption if it determines that the proposal would constitute an unsafe and unsound practice, or would violate any law, regulation, Federal Reserve Board order or directive, or any condition imposed by, or written agreement with, the Federal Reserve Board. The Federal Reserve Board has adopted an exception to that approval requirement for well-capitalized bank holding companies that meet certain other conditions.
The Federal Reserve Board has issued a policy statement regarding the payment of dividends by bank holding companies. In general, the Federal Reserve Board’s policies provide that dividends should be paid only out of current earnings and only if the prospective rate of earnings retention by the bank holding company appears consistent with the organization’s capital needs, asset quality and overall financial condition. The Federal Reserve Board’s policies also require that a bank holding company serve as a source of financial strength to its subsidiary banks by using available resources to provide capital funds during periods of financial stress or adversity and by maintaining the financial flexibility and capital-raising capacity to obtain additional resources for assisting its subsidiary banks where necessary. The Dodd-Frank Act codified the source of strength policy. Under the prompt corrective action laws, the ability of a bank holding company to pay dividends may be restricted if a subsidiary bank becomes undercapitalized. These regulatory policies could affect the ability of the Company to pay dividends or otherwise engage in capital distributions.
The Company's status as a registered bank holding company under the Bank Holding Company Act will not exempt it from certain federal and state laws and regulations applicable to corporations generally, including, without limitation, certain provisions of the federal securities laws.
New Jersey Regulation. Under the New Jersey Banking Act, a company owning or controlling a bank is regulated as a bank holding company and must file certain reports with the Commissioner and is subject to examination by the Commissioner. Under the New Jersey Banking Act, as well as Federal law, no person may acquire control of the Company or the Bank without first obtaining approval of such acquisition of control from the Federal Reserve Board and the Commissioner.
Bank Regulation
As a New Jersey-chartered commercial bank, the Bank is subject to the regulation, supervision, and examination of the Commissioner. As a state-chartered bank, the Bank is subject to the regulation, supervision, and examination of the FDIC as its primary federal regulator. The regulations of the FDIC and the Commissioner impact virtually all of our activities, including the minimum level of capital we must maintain, our ability to pay dividends, our ability to expand through new branches or acquisitions, and various other matters.
Capital Requirements. Federal regulations require FDIC-insured depository institutions to meet several minimum capital standards: a common equity Tier 1 capital to risk-based assets ratio of 4.5 percent, a Tier 1 capital to risk-based assets ratio of 6.0 percent, a total capital to risk-based assets of 8.0 percent, and a 4.0 percent Tier l capital to total assets leverage ratio.
In addition to establishing the minimum regulatory capital requirements, the regulations limit capital distributions and certain discretionary bonus payments to management if the institution does not hold a “capital conservation buffer” consisting of 2.5 percent of common equity Tier 1 capital to risk-weighted asset above the amount necessary to meet its minimum risk-based capital requirements.
In lieu of complying with the capital requirements set forth above, qualifying community banking organizations may opt-in to the community bank leverage ratio (“CBLR”) framework (tier 1 capital to average consolidated assets). Such institutions that maintain a CBLR of at least 9.0 percent, are under $10.0 billion in assets and meet certain other qualifying criteria will automatically be deemed to be well-capitalized.
Standards for Safety and Soundness. As required by statute, the federal banking agencies adopted final regulations and Interagency Guidelines Establishing Standards for Safety and Soundness to implement safety and soundness standards. The guidelines set forth the safety and soundness standards that the federal banking agencies use to identify and address problems at insured depository institutions before capital becomes impaired. The guidelines address internal controls and information systems, internal audit system, credit underwriting, loan documentation, interest rate exposure, asset growth, asset quality, earnings, compensation, fees and benefits and, more recently, safeguarding customer information. If the appropriate federal banking agency determines that an institution fails to meet any standard prescribed by the guidelines, the agency may require the institution to submit to the agency an acceptable plan to achieve compliance with the standard.
Business and Investment Activities. Under federal law, all state-chartered FDIC-insured banks have been limited in their activities as principal and in their equity investments to the type and the amount authorized for national banks, notwithstanding state law. Federal law permits exceptions to these limitations. For example, certain state-chartered banks may, with FDIC approval, continue to exercise state authority to invest in common or preferred stocks listed on a national securities exchange and in the shares of an investment company registered under the Investment Company Act of 1940, as amended. The maximum permissible investment is the lesser of 100.0 percent of Tier 1 capital or the maximum amount permitted by New Jersey law.
The FDIC is also authorized to permit state banks to engage in state-authorized activities or investments not permissible for national banks (other than non-subsidiary equity investments) if they meet all applicable capital requirements and it is determined that such activities or investments do not pose a significant risk to the FDIC insurance fund. The FDIC has adopted regulations governing the procedures for institutions seeking approval to engage in such activities or investments. The Gramm-Leach-Bliley Act of 1999 specified that a state bank may control a subsidiary that engages in activities as principal that would only be permitted for a national bank to conduct in a “financial subsidiary,” if a bank meets specified conditions and deducts its investment in the subsidiary for regulatory capital purposes.
Prompt Corrective Regulatory Action. Federal law requires, among other things, that federal bank regulatory authorities take “prompt corrective action” with respect to banks that do not meet minimum capital requirements. For these purposes, the law establishes five capital categories: well-capitalized, adequately-capitalized, undercapitalized, significantly undercapitalized, and critically undercapitalized.
Under FDIC regulations, an institution is deemed to be “well-capitalized” if it has a total risk-based capital ratio of 10.0 percent or greater, a Tier 1 risk-based capital ratio of 8.0 percent or greater, a leverage ratio of 5.0 percent or greater, and a common equity Tier 1 ratio of 6.5 percent or greater. An institution is “adequately-capitalized” if it has a total risk-based capital ratio of 8.0 percent or greater, a Tier 1 risk-based capital ratio of 6.0 percent or greater, a leverage ratio of 4.0 percent or
greater and a common equity Tier 1 ratio of 4.5 percent or greater. An institution is “undercapitalized” if it has a total risk-based capital ratio of less than 8.0 percent, a Tier 1 risk-based capital ratio of less than 6.0 percent, a leverage ratio of less than 4.0 percent or a common equity Tier 1 ratio of less than 4.5 percent. An institution is deemed to be “significantly undercapitalized” if it has a total risk-based capital ratio of less than 6.0 percent, a Tier 1 risk-based capital ratio of less than 4.0 percent, a leverage ratio of less than 3.0 percent or a common equity Tier 1 ratio of less than 3.0 percent. An institution is considered to be “critically undercapitalized” if it has a ratio of tangible equity (as defined in the regulations) to total assets that is equal to or less than 2.0 percent.
As noted above, these requirements do not apply to banks with less than $10.0 billion in assets who elect to follow the CBLR. The FDIC’s rule provides that the bank will be well-capitalized, with a community bank leverage ratio of 9.0 percent or greater. A banking organization that has a leverage ratio that is greater than 8.0 percent and equal to or less than 9.0 percent is allowed a two-quarter grace period after which it must either (i) again meet all qualifying criteria or (ii) apply and report the generally applicable rule. During this two-quarter period, a banking organization that is an insured depository institution and that has a leverage ratio that is greater than 8.0 percent would be considered to have met the well-capitalized capital ratio requirements for prompt corrective action purposes. An electing banking organization with a leverage ratio of 8.0 percent or less is not eligible for the grace period and must comply with the generally applicable rule, i.e. for the quarter in which the banking organization reports a leverage ratio of 8.0 percent or less. An electing banking organization experiencing or anticipating such an event would be expected to notify its primary federal supervisory agency, which would respond as appropriate to the circumstances of the banking organization.
“Undercapitalized” banks must adhere to growth, capital distribution (including dividend) and other limitations and are required to submit a capital restoration plan. A bank’s compliance with such a plan must be guaranteed by any company that controls the undercapitalized institution in an amount equal to the lesser of 5.0 percent of the institution’s total assets when deemed undercapitalized or the amount necessary to achieve the status of adequately capitalized. If an “undercapitalized” bank fails to submit an acceptable plan, it is treated as if it is “significantly undercapitalized.” “Significantly undercapitalized” banks must comply with one or more of a number of additional measures, including, but not limited to, a required sale of sufficient voting stock to become adequately capitalized, a requirement to reduce total assets, cessation of taking deposits from correspondent banks, the dismissal of directors or officers, restrictions on interest rates paid on deposits, compensation of executive officers, and capital distributions by the parent holding company. “Critically undercapitalized” institutions are subject to additional measures including, subject to a narrow exception, the appointment of a receiver or conservator within 270 days after it obtains such status.
Enforcement. The FDIC has extensive enforcement authority over insured state banks, including the Bank. That enforcement authority includes, among other things, the ability to assess civil money penalties, issue cease and desist orders, and remove directors and officers. In general, enforcement actions may be initiated in response to violations of laws and regulations and unsafe or unsound practices. The FDIC also has authority under federal law to appoint a conservator or receiver for an insured bank under certain circumstances. The FDIC is required, with certain exceptions, to appoint a receiver or conservator for an insured state non-member bank if that bank was “critically undercapitalized” on average during the calendar quarter beginning 270 days after the date on which the institution became “critically undercapitalized.”
Federal Insurance of Deposit Accounts. Our deposits are insured by the FDIC in the maximum amount permitted of $250,000 per depositor.
The Bank pays assessments to the FDIC to support its Deposit Insurance Fund (“DIF”). The FDIC has adopted a risk-based assessment system whereby FDIC-insured institutions pay insurance premiums at rates based on their risk classification. For institutions like the Bank that are not considered large and highly complex banking organizations, assessments are now based on examination ratings and financial ratios. The total base assessment rates currently range from 1.5 basis points to 30 basis points. At least semi-annually, the FDIC updates its loss and income projections for the DIF and, if needed, increases or decreases the assessment rates, following notice and comment on proposed rulemaking. The assessment base against which an FDIC-insured institution’s deposit insurance premiums paid to the DIF has been calculated since effectiveness of the Dodd-Frank Act based on its average consolidated total assets less its average tangible equity.
The FDIC has authority to increase insurance assessments. Any significant increases would have an adverse effect on the operating expenses and results of operations of the Bank. Management cannot predict what assessment rates will be in the future.
Insurance of deposits may be terminated by the FDIC upon a finding that an institution has engaged in unsafe or unsound practices, is in an unsafe or unsound condition to continue operations, or has violated any applicable law, regulation, rule, order, or condition imposed by the FDIC. We do not currently know of any practice, condition or violation that may lead to termination of our deposit insurance.
Community Reinvestment Act. All FDIC-insured institutions have a responsibility under the Community Reinvestment Act (“CRA”) and related regulations to help meet the credit needs of their communities, including low- and moderate-income neighborhoods. In connection with its examination of a state-chartered bank, the FDIC is required to assess the institution’s record of compliance with the CRA. On October 24, 2023, the FDIC, the Federal Reserve Board, and the Office of the Comptroller of the Currency issued a final rule to strengthen and modernize the CRA regulations. Under the final rule, banks with assets of at least $2 billion as of December 31 in both of the prior two calendar years will be a “large bank.” The agencies will evaluate large banks under four performance tests: the Retail Lending Test, the Retail Services and Products Test, the Community Development Financing Test, and the Community Development Services Test. The applicability date for the majority of the provisions in the CRA regulations is January 1, 2026, and additional requirements will be applicable on January 1, 2027. BCB Community Bank’s latest FDIC CRA rating, dated September 20, 2021 was “satisfactory.”
Cyber-security. Federal regulators have issued two related statements regarding cyber-security. One statement indicates that financial institutions should design multiple layers of security controls to establish lines of defense and ensure their risk management processes also address the risk posed by compromised client credentials, including security measures to reliably authenticate clients accessing internet-based services of the financial institution. The other statement indicates that a financial institution’s management is expected to maintain sufficient business continuity planning processes to ensure the rapid recovery, resumption, and maintenance of the institution’s operations after a cyber-attack involving destructive malware. A financial institution is also expected to develop appropriate processes to enable recovery of data and business operations and address rebuilding network capabilities and restoring data if the institution or its critical service providers fall victim to this type of cyber-attack. If we fail to observe the regulatory guidance, we could be subject to various regulatory sanctions, including financial penalties.
In the ordinary course of business, we rely on electronic communications and information systems to conduct our operations and to store sensitive data. We employ a variety of preventative and detective controls and tools to monitor, block, and provide alerts regarding suspicious activity and to report on any suspected advanced persistent threats. We also offset cyber risk through internal training, testing of our employees, and we procure insurance to provide assistance on significant incidents and to offset potential liability.
We have not experienced a significant compromise, significant data loss, or any material financial losses related to cyber-security attacks. Risks and exposures related to cyber-security attacks are expected to remain high for the foreseeable future due to the rapidly evolving nature and sophistication of these threats, as well as due to the expanding use of third-party service providers, internet banking, mobile banking, and other technology-based products and services by us and our clients.
Transactions with Affiliates
Transactions between banks and their related parties or affiliates are limited by Sections 23A and 23B of the Federal Reserve Act. An affiliate of a bank is any company or entity that controls, is controlled by, or is under common control with the bank. In a holding company context, the parent bank holding company and any companies which are controlled by such parent holding company are affiliates of the bank. Generally, Sections 23A and 23B of the Federal Reserve Act and Regulation W (i) limit the extent to which the bank or its subsidiaries may engage in “covered transactions” with any one affiliate to an amount equal to 10.0 percent of such institution’s capital stock and surplus, and contain an aggregate limit on all such transactions with all affiliates to an amount equal to 20.0 percent of such institution’s capital stock and surplus and (ii) require that all such transactions be on terms substantially the same, or at least as favorable, to the institution or subsidiary as those provided to non-affiliates. The term “covered transaction” includes the making of loans, purchasing of assets, issuance of a guarantee, and other similar transactions. In addition, loans or other extensions of credit by the financial institution to the affiliate are required to be collateralized in accordance with the requirements set forth in Section 23A of the Federal Reserve Act. The Sarbanes-Oxley Act of 2002 generally prohibits loans by a company to its executive officers and directors. However, the law contains a specific exception for loans by a depository institution to its executive officers and directors in compliance with federal banking laws assuming such loans are also permitted under the law of the institution’s chartering state. Under such laws, the Bank’s authority to extend credit to executive officers, directors and 10.0 percent shareholders (“insiders”), as well as entities such person’s control, is limited. The law limits both the individual and aggregate amount of loans the Bank may make to insiders based, in part, on the Bank’s capital position and requires certain board approval procedures to be followed. Such loans are required to be made on terms substantially the same as those offered to unaffiliated individuals and not involve more than the normal risk of repayment. There is an exception for loans made pursuant to a benefit or compensation program that is widely available to all employees of the institution and does not give preference to insiders over other employees. Loans to executive officers are further limited by specific categories.
Dividends
The primary source of cash to pay dividends to the Company’s shareholders and to meet the Company’s obligations is dividends paid to the Company by the Bank. The Bank may pay dividends to the Company as declared from time to time by the Board of Directors out of funds legally available, subject to certain restrictions. Under the New Jersey Banking Act of 1948, as amended, the Bank may not pay a cash dividend unless, following the payment, the Bank’s capital stock will be unimpaired and the Bank will have a surplus of no less than 50.0 percent of the Bank capital stock or, if not, the payment of the dividend will not reduce the surplus. In addition, the Bank cannot pay dividends in amounts that would reduce the Bank’s capital below regulatory imposed minimums.
See the discussion above under “Bank Holding Company Regulation” for a description of the Federal Reserve Board’s policy on bank holding companies paying cash dividends. Under New Jersey law, corporations like the Parent Company may not pay dividends when insolvent.
Federal Securities Laws
The Company’s common stock is registered with the SEC under the Securities Exchange Act of 1934, as amended (“Exchange Act”). The Company is subject to the information, proxy solicitation, insider trading restrictions, and other requirements under the Securities Exchange Act of 1934. We prepare this Annual Report on Form 10-K, our proxy materials and our other periodic and current reports as a “smaller reporting company” consistent with the rules of the Securities and Exchange Commission.
Under the Exchange Act, the Company is required to conduct a comprehensive review and assessment of the adequacy of our existing financial systems and controls. For the year ended December 31, 2023, the Company’s auditors are required to audit our internal control over financial reporting.
AVAILABILITY OF ANNUAL REPORT
Our Annual Report is available on our website, www.bcb.bank. We will also provide our Annual Report on Form 10-K free of charge to shareholders who request a copy in writing from the Corporate Secretary at 104-110 Avenue C, Bayonne, New Jersey 07002.
ITEM 1A. RISK FACTORS
Our business and results of operations are subject to numerous risks and uncertainties, many of which are beyond our control. The material risks and uncertainties that management believes affect the Company are described below. Additional risks and uncertainties that management is not aware of or that management currently deems immaterial may also impair the Company’s business operations. This report is qualified in its entirety by these risk factors. If any of the following risks actually occur, our business, financial condition, and results of operations could be materially and adversely affected.
Our risk factors can be broadly summarized by the following categories:
Credit and Interest Rate Risks;
Risks Related to the Company’s Common Stock;
Economic Risks;
Operational Risks;
Risks Related to the Regulation of our Industry; and,
Strategic Risks.
CREDIT AND INTEREST RATE RISKS
Our loan portfolio consists of a high percentage of loans secured by commercial real estate and multi-family real estate. These loans are riskier than loans secured by one-to-four family properties.
At December 31, 2023, $2.434 billion, or 73.37 percent, of our loan portfolio consisted of commercial and multi-family real estate loans. We intend to continue to emphasize the origination of these types of loans. These loans generally expose a lender to greater risk of nonpayment and loss than one-to-four family residential mortgage loans because repayment of the loans often depends on the successful operation and income stream of the collateral that is pledged. Such loans typically involve larger loan balances to single borrowers or groups of related borrowers compared to one-to-four family residential mortgage loans. Consequently, an adverse development with respect to one loan or one credit relationship can expose us to a significantly greater risk of loss compared to an adverse development with respect to a one-to-four family residential mortgage loan.
Commercial loans and commercial real estate loans generally carry larger balances and can involve a greater degree of financial and credit risk than other loans. As a result, banking regulators continue to give greater scrutiny to lenders with a high concentration of commercial real estate loans in their portfolios, such as us, and such lenders are expected to implement stricter underwriting standards, internal controls, risk management policies, and portfolio stress testing, as well as higher capital levels and loss allowances. The increased financial and credit risk associated with these types of loans are a result of several factors, including the concentration of principal in a limited number of loans and borrowers, the size of loan balances, the effects of general economic conditions on income-producing properties, and the increased difficulty of evaluating and monitoring these types of loans. If we cannot effectively manage the risk associated with our high concentration of commercial real estate loans, our financial condition and results of operations may be adversely affected.
If our allowance for credit losses is not sufficient to cover actual credit losses, our earnings could decrease.
Our loan customers may not repay their loans according to the terms of their loans, and the collateral securing the payment of their loans may be insufficient to assure repayment. We may experience significant credit losses, which could have a material adverse effect on our operating results. We maintain allowance for credit losses on loans and off-balance sheet exposures. The calculation of allowance for credit losses utilizes the use of econometric models that rely on various assumptions including but not limited to historical credit loss experience, economic forecasts, and expected future credit risks and trends. Additionally, Management relies on qualitative adjustments, as deemed necessary, to supplement the quantitative results generated by the models. Several factors including possibility of a recession, inflation, global pandemics, natural disasters, changes in regulations, identification of additional loan downgrades and other factors that are within and outside of our control may require a material increase in the allowance for credit losses for both on balance sheet loans and off-balance sheet credit exposures. Any increase in the allowance for credit losses will negatively impact our net income, possibly capital, and may have an adverse impact on our business and results of operations.
While we have only been operating for 23 years, we have experienced significant growth in our loan portfolio, particularly in loans secured by commercial real estate. Although we believe we have underwriting standards to manage normal lending risks, it is difficult to assess the future performance of our loan portfolio due to the relatively recent origination of many of these loans. We can give you no assurance that our non-performing loans will not increase or that our non-performing or delinquent loans will not adversely affect our future performance.
In addition, federal and state regulators periodically review our allowance for credit losses and may require us to increase our allowance for credit losses or recognize further loan charge-offs. Any increase in our allowance for credit losses or loan charge-offs as required by these regulatory agencies could have a material adverse effect on our results of operations and financial condition.
The asset quality of our loan portfolio may deteriorate if the economy falters, resulting in a portion of our loans failing to perform in accordance with their terms. Under such circumstances our profitability will be adversely affected.
At December 31, 2023, we had $85.7 million in classified loans of which none were classified as doubtful or loss. We also had $56.1 million of loans that were classified as special mention. In addition, at that date we had $18.8 million in non-accruing loans, or 0.57 percent of total loans. We have adhered to stringent underwriting standards in the origination of our loans, but there can be no assurance that loans that we originated will not experience asset quality deterioration as a result of a downturn in the local or broader economy. Should our local or regional economy weaken, our asset quality may deteriorate resulting in losses to the Company.
Changes in interest rates could hurt our profits.
Our profitability, like most financial institutions, depends to a large extent upon our net interest income, which is the difference between interest income on interest-earning assets, such as loans and securities, and interest expense on interest-bearing liabilities, such as deposits and borrowed funds. Accordingly, our results of operations depend largely on movements in market interest rates and our ability to manage our interest-rate-sensitive assets and liabilities in response to these movements. Factors such as inflation, recession, and instability in financial markets, among other factors beyond our control, may affect interest rates.
If interest rates rise, and if rates on our deposits and variable rate borrowings reprice upwards faster than the rates on our long-term loans and investments, we could experience compression of our interest rate spread, which would have a negative effect on our profitability. Conversely, decreases in interest rates can result in increased prepayments of loans and mortgage-related securities, as borrowers refinance to reduce their borrowing costs. Under these circumstances, we are subject to reinvestment risk, as we may have to redeploy such loan or securities proceeds into lower-yielding assets, which might also negatively impact our income.
Any substantial, unexpected, prolonged change in market interest rates could have a material adverse effect on our financial condition, liquidity and results of operations. Also, our interest rate risk-modeling techniques and assumptions likely may not fully predict or capture the impact of actual interest rate changes on our balance sheet or projected operating results.
While we pursue an asset/liability strategy designed to mitigate our risk from changes in interest rates, changes in interest rates can still have a material adverse effect on our financial condition and results of operations. Changes in the level of interest rates also may negatively affect our ability to originate real estate loans, the value of our assets and our ability to realize gains from the sale of our assets, all of which ultimately affect our earnings. For further discussion of how changes in interest rates could impact us, see “Item 7A. – Quantitative and Qualitative Disclosure About Market Risk.”
Rising interest rates have decreased the value of a portion of the Company’s securities portfolio, and the Company would realize losses if it were required to sell such securities to meet liquidity needs.
As a result of inflationary pressures and the resulting rapid increases in interest rates over the last year, the fair value of our securities classified as available for sale has declined. At December 31, 2023, the fair value of our total debt securities portfolio was $87.8 million, down from $91.7 million at December 31, 2022. The Company’s unrealized net loss on debt securities totaled $9.4 million on a pre-tax basis at December 31, 2023. If the Company were required to sell such securities to meet liquidity needs, including in the event of deposit outflows or slower deposit growth, it may incur losses, which could negatively impact the Company’s capital, financial condition, and results of operations. While the Company has taken actions to maximize its funding sources, there is no guarantee that such actions will be successful or sufficient in the event of sudden liquidity needs.
RISKS RELATED TO THE COMPANY’S COMMON STOCK
Our dividend policy may change without notice, and our future ability to pay dividends is also subject to regulatory restrictions.
Holders of our common stock are entitled to receive only such cash dividends as our board of directors may declare out of funds legally available for the payment of dividends. We are a holding company that conducts substantially all of our operations through the Bank. As a result, our ability to make dividend payments on our common stock will depend primarily upon the receipt of dividends and other distributions from the Bank. Under New Jersey banking law, the Bank may pay a dividend to the Company provided that following the payment of the dividend the capital stock of the Bank will be unimpaired and the Bank will have a surplus of not less than 50 percent of its capital stock, or if not, the payment of such dividend will not reduce the surplus of the Bank.
Under New Jersey law, the Company may not make a distribution, if, after giving effect to the distribution, it would be unable to pay its debts as they become due in the usual course of business or if its total assets would be less than its liabilities. Our current intention is to continue to pay a quarterly cash dividend of $0.16 per share. However, any declaration and payment of dividends on common stock will substantially depend upon our earnings and financial condition, liquidity and capital requirements, regulatory and state law restrictions, general economic conditions and regulatory climate and other factors deemed relevant by our board of directors. Furthermore, consistent with our strategic plans, growth initiatives, capital availability, projected liquidity needs, and other factors, we have made, and will continue to make, capital management decisions and policies that could adversely impact the amount of dividends, if any, paid to our stockholders.
Our common stock is not heavily traded, and the stock price may fluctuate significantly.
Our common stock is traded on the NASDAQ under the symbol “BCBP.” Certain brokers currently make a market in the common stock, but such transactions are infrequent and the volume of shares traded is relatively small. Management cannot predict whether these or other brokers will continue to make a market in our common stock. Prices on stock that is not heavily traded, such as our common stock, can be more volatile than heavily traded stock. Factors such as our financial results, the introduction of new products and services by us or our competitors, publicity regarding the banking industry, inflation, changing interest rates, and various other factors affecting the banking industry may have a significant impact on the market price of the shares of the common stock. Management cannot predict the extent to which an active public market for our common stock will develop or be sustained in the future. Accordingly, stockholders may not be able to sell their shares of our common stock at the volumes, prices, or times that they desire.
ECONOMIC RISKS
Inflation can have an adverse impact on the Company’s business and its customers.
Inflation risk is the risk that the value of assets or income from investments will be worth less in the future as inflation decreases the value of money. Over the past year, in response to a pronounced rise in inflation, the Federal Reserve has raised certain benchmark interest rates to combat inflation. As discussed above under CREDIT AND INTEREST RATE RISKS— Changes in interest rates could hurt our profits, as inflation increases and market interest rates rise, the value of the Company’s investment securities, particularly those with longer maturities, decreases, although this effect can be less pronounced for floating rate instruments. In addition, inflation generally increases the cost of goods and services the Company uses in its business operations, such as electricity and other utilities, and also generally increases employee wages, any of which can increase the Company’s non-interest expenses. Furthermore, the Company’s customers are also affected by inflation and the rising costs of goods and services used in their households and businesses, which could have a negative impact on their ability to repay their loans with the Company. Sustained higher interest rates by the Federal Reserve Board to tame persistent inflationary price pressures could also push down asset prices and weaken economic activity. A deterioration in economic conditions in the United States and the Company’s markets could result in an increase in loan delinquencies and non-performing assets, decreases in loan collateral values and a decrease in demand for the Company’s products and services, all of which, in turn, would adversely affect the Company’s business, financial condition and results of operations.
Events similar to the COVID-19 pandemic could adversely affect our business activities, financial condition, and results of operations.
The occurrence of events which adversely affect the global, national and regional economies, like the COVID-19 pandemic, may have a negative impact on our business. Like other financial institutions, our business relies upon the ability and willingness of our customers to transact business with us, including banking, borrowing and other financial transactions. A strong and stable economy at each of the local, federal and global levels is often a critical component of consumer confidence and typically correlates positively with our customers’ ability and willingness to transact certain types of business with us. Local and global events outside of our control which disrupt the New Jersey, New York, United States and/or global economy may therefore negatively impact our business and financial condition. A public health crisis such as the COVID-19 pandemic is no exception, and its adverse health and economic effects may adversely impact our business and financial condition.
OPERATIONAL RISKS
Our deposit services for businesses in the state licensed cannabis industry could expose us to liabilities and regulatory compliance costs.
In 2014 we implemented specialized deposit services intended for a limited number of state-licensed medical-use cannabis business customers. Medical use cannabis, as well as recreational use businesses are legal in numerous states and the District of Columbia, including our primary markets of New Jersey and New York. However, such businesses are not legal at the federal level and marijuana remains a Schedule I drug under the Controlled Substances Act of 1970. In 2014, the U.S. Department of the Treasury’s Financial Crimes Enforcement Network (FinCEN) published guidelines for financial institutions servicing state legal cannabis businesses. We have implemented a comprehensive control framework that includes written policies and procedures related to the on-boarding of such businesses and the monitoring and maintenance of such business accounts that comports with the FinCEN guidance. Additionally, our policies call for due diligence review of the cannabis business before the business is on-boarded, including confirmation that the business is properly licensed and maintains the license in good standing in the applicable state. Throughout the relationship, our policies call for continued monitoring of the business, including site visits, to determine if the business continues to meet our requirements, including maintenance of required licenses and calls for undertaking periodic financial reviews of the business. The Bank’s program originally was limited to offering depository products to medical cannabis businesses. Deposit transactions are monitored for compliance with the applicable state medical program rules and other regulations. In 2022, the Bank expanded its cannabis-related business offerings to some limited lending on real estate and deposit services to licensed recreational dispensaries. The Bank may offer additional banking products and services to such customers in the future.
While we believe our policies and procedures allow us to operate in compliance with the FinCEN guidelines, there can be no assurance that compliance with the FinCEN guidelines will protect us from federal prosecution or other regulatory sanctions. Federal prosecutors have significant discretion and there can be no assurance that the federal prosecutors will not choose to strictly enforce the federal laws governing cannabis. Any change in the federal government’s enforcement position could potentially subject us to criminal prosecution and other regulatory sanctions. As a general matter, the medical and recreational cannabis business is considered high-risk,
thus increasing the risk of a regulatory action against our BSA/AML program that has adverse consequences, including but not limited to, preventing us from undertaking mergers, acquisitions and other expansion activities.
Adverse events in New Jersey and the New York metropolitan area, where our business is generally concentrated, could adversely affect our results and future growth.
Our business, the location of our branches, and the real estate collateralizing our real estate loans are generally concentrated in New Jersey and the New York metropolitan area. As a result, we are exposed to geographic risks. The occurrence of an economic downturn in New Jersey or the New York metropolitan area, or adverse changes in laws or regulations in New Jersey or the New York metropolitan area, could impact the credit quality of our assets, the business of our customers and our ability to expand our business.
Our success significantly depends upon the growth in population, income levels, deposits, and housing in our market area. If the communities in which we operate do not grow or if prevailing economic conditions locally, regionally, or nationally are unfavorable, our business may be negatively affected. In addition, the economies of the communities in which we operate are substantially dependent on the growth of the economy in the State of New Jersey and the New York metropolitan area. To the extent that economic conditions in New Jersey are unfavorable or do not continue to grow as projected, the economy in our market area would be adversely affected. Moreover, we cannot give any assurance that we will benefit from any market growth or favorable economic conditions in our market area if they do occur.
In addition, the market value of the real estate securing loans as collateral could be adversely affected by unfavorable changes in market and economic conditions. As of December 31, 2023, approximately 89.5 percent of our total loans were secured by real estate. Adverse developments affecting commerce or real estate values in the local economies in our primary market areas could increase the credit risk associated with our loan portfolio. In addition, a significant percentage of our loans are to individuals and businesses in New Jersey. Our business customers may not have customer bases that are as diverse as businesses serving regional or national markets. Consequently, any decline in the economy of our market area could have an adverse impact on our revenues and financial condition. In particular, we may experience increased loan delinquencies, which could result in a higher provision for credit losses and increased charge-offs. Any sustained period of increased non-payment, delinquencies, foreclosures, or losses caused by adverse market or economic conditions in our market area could adversely affect the value of our assets, revenues, results of operations and financial condition.
We depend primarily on net interest income for our earnings rather than fee income.
Net interest income is the most significant component of our operating income. We have less reliance on traditional sources of fee income utilized by some community banks, such as fees from sales of insurance, securities, or investment advisory products or services. For the years ended December 31, 2023 and 2022, our net interest income was $104.1 million and $113.9 million, respectively. The amount of our net interest income is influenced by the overall interest rate environment, competition, and the amount of our interest-earning assets relative to the amount of our interest-bearing liabilities. In the event that one or more of these factors were to result in a decrease in our net interest income, we do not have significant sources of fee income to make up for decreases in net interest income.
Risks associated with system failures, interruptions, or breaches of security could negatively affect our earnings.
Information technology systems are critical to our business. We use various technology systems to manage our customer relationships, general ledger, securities investments, deposits, and loans. We have established policies and procedures to prevent or limit the impact of system failures, interruptions, and security breaches (including privacy breaches and cyber-attacks), but such events may still occur or may not be adequately addressed if they do occur. In addition, any compromise of our systems could deter customers from using our products and services. Although we take protective measures, the security of our computer systems, software, and networks may be vulnerable to breaches, unauthorized access, misuse, computer viruses, or other malicious code and cyber-attacks that could have an impact on information security.
In addition, we outsource a majority of our data processing to certain third-party providers. If these third-party providers encounter difficulties, or if we have difficulty communicating with them, our ability to adequately process and account for transactions could be affected, and our business operations could be adversely affected. Threats to information security also exist in the processing of customer information through various other vendors and their personnel.
There have been increasing efforts on the part of third parties, including through cyber-attacks, to breach data security at financial institutions or with respect to financial transactions. Cybercrime risks have increased as electronic and mobile banking activities increased as a result of the COVID-19 pandemic. There have been several recent instances involving financial services and consumer-based companies reporting the unauthorized disclosure of client or customer information or the destruction or theft of corporate data. In addition, because the techniques used to cause such security breaches change frequently and often are not recognized until launched against a target and may originate from less-regulated and remote areas of the world, we may be unable to proactively address these techniques or to implement adequate preventative measures. The ability of our customers to bank remotely, including through online and mobile devices, requires secure transmission of confidential information and increases the risk of data security breaches.
The occurrence of any system failures, interruption, or breach of security could damage our reputation and result in a loss of customers and business, thereby subjecting us to additional regulatory scrutiny, or could expose us to litigation and possible financial liability. Any of these events could have a material adverse effect on our financial condition and results of operations.
The Bank’s reliance on brokered and reciprocal deposits could adversely affect its liquidity and operating results.
Among other sources of funds, the Company, from time to time, relies on brokered deposits to provide funds with which to make loans and provide for other liquidity needs. At December 31, 2023, the Bank had $505.4 million in brokered certificate deposits. One of the Bank’s sources for brokered deposits is the Certificate of Deposit Account Registry Service (“CDARS”). At December 31, 2023, the Bank has $38.6 million in CDARS reciprocal deposits and $48.1 million in Insured Cash Sweep or ICS network deposits. These amounts, are reciprocal and are not considered brokered deposits under recent regulatory reform.
Generally, brokered and reciprocal deposits may not be as stable as other types of deposits. In the future, those depositors may not replace their brokered or reciprocal deposits with us as they mature, or we may have to pay a higher rate of interest to keep those deposits, or to replace them with other deposits or other sources of funds. Not being able to maintain or replace those deposits as they mature would adversely affect our liquidity. Paying higher deposit rates to maintain or replace such deposits would adversely affect our net interest margin and operating results.
If deposit levels are not sufficient, it may be more expensive to fund loan originations.
Our deposits have been our primary funding source. In current market conditions, depositors may choose to redeploy their funds into the stock market or other investment alternatives, regardless of our effort to retain such depositors. If this occurs, it would hamper our ability to grow deposits and could result in a net outflow of deposits. We will continue to focus on deposit growth, which we use to fund loan originations. However, if we are unable to sufficiently increase our deposit balances, we may be required to increase our use of alternative sources of funding, including Federal Home Loan Bank advances, or to increase our deposit rates in order to attract additional deposits, each of which would increase our cost of funds.
We could be adversely affected by failure in our internal controls.
A failure in our internal controls could have a significant negative impact not only on our earnings, but also on the perception that customers, regulators and investors may have of us. We continue to devote a significant amount of effort, time and resources to continually strengthening our internal controls and ensuring compliance with complex accounting standards and banking regulations.
If we cannot favorably assess the effectiveness of our internal controls over financial reporting or if our independent registered public accounting firm is unable to provide an unqualified attestation report on our internal controls, we may be subject to additional regulatory scrutiny.
Under the rules of the FDIC and the SEC, Company management is required to prepare a report that contains an assessment by management of the effectiveness of our internal control structure and procedures for financial reporting (including the Call Report that is submitted to the FDIC) as of the end of each fiscal year. Our independent registered public accounting firm is also required to examine, attest to and report on the assessment of our management concerning the effectiveness of our internal control structure and procedures for financial reporting. The rules that must be met for management to assess our internal controls over financial reporting are complex and require significant documentation and testing and possible remediation of internal control weaknesses. The effort to comply with regulatory requirements relating to internal controls will likely cause us to incur increased expenses and will cause a diversion of management’s time and other internal resources. We also may encounter problems or delays in completing the implementation of any changes necessary to make a favorable assessment of our internal control over financial reporting. In addition, in connection with the attestation process, we may encounter problems or delays in completing the implementation of any requested improvements or receiving a favorable attestation from our independent registered public accounting firm. If we cannot favorably assess the effectiveness of our internal control over financial reporting, or if our independent registered public accounting firm is unable to provide an unqualified attestation report on our internal controls, investor confidence and the price of our common stock could be adversely affected and we may be subject to additional regulatory scrutiny.
The increasing use of social media platforms presents new risks and challenges and the inability or failure to recognize, respond to, and effectively manage the accelerated impact of social media could materially adversely impact the Bank’s business.
There has been a marked increase in the use of social media platforms, including weblogs (blogs), podcasts, social media websites, and other forms of Internet-based communications which allow individuals’ access to a broad audience of consumers and other interested persons. Social media practices in the banking industry are evolving, which creates uncertainty and risk of noncompliance with regulations applicable to the Bank’s business. Consumers value readily available information concerning businesses and their goods and services and often act on such information without further investigation and without regard to its accuracy. Many social media platforms immediately publish the content their subscribers and participants’ post, often without filters or checks on accuracy of the content posted. Information posted on such platforms at any time may be adverse to the Bank’s interests and/or may be inaccurate. The dissemination of information online could harm the Bank’s business, prospects, financial condition, and results of operations, regardless of the information’s accuracy. The harm may be immediate without affording the Bank an opportunity for redress or correction.
Other risks associated with the use of social media include improper disclosure of proprietary information, negative comments about the Bank’s business, exposure of personally identifiable information, fraud, out-of-date information, and improper use by employees, directors and customers. The inappropriate use of social media by the Bank’s customers, directors or employees could result in negative consequences such as remediation costs including training for employees, additional regulatory scrutiny and possible regulatory penalties, litigation, or negative publicity that could damage the Bank’s reputation adversely affecting customer or investor confidence.
Market conditions and economic cyclicality may adversely affect our industry.
Market developments, including unemployment, price levels, stock and bond volatility, and other changes due to world events, affect consumer confidence levels, economic activity and inflation. Changes in payment behaviors and payment rates may increase in delinquencies and default rates, which could affect our earnings and credit quality.
Negative developments in the banking industry could adversely affect our business operations and our financial condition and results of operations.
Actual events involving bank failures, limited liquidity, defaults, non-performance or other adverse developments that affect financial institutions, transactional counterparties or other companies in the financial services industry or the financial services industry generally, or concerns or rumors about any events of these kinds or other similar risks, have in the past and may in the future lead to negative media attention and market-wide liquidity problems. The closures by the regulators of First Republic Bank, Silicon Valley Bank, and Signature Bank in the first half of 2023 are examples of these events. These developments negatively impact customer confidence in regional and community banks, which could prompt customers to maintain their deposits with larger financial institutions. Further, competition for deposits has increased in recent periods, and the cost of funding has similarly increased, putting pressure on our net interest margin. If we were required to sell a portion of our securities portfolio to address liquidity needs, we may incur losses, including as a result of the negative impact of rising interest rates on the value of our securities portfolio, which could negatively affect our earnings and our capital. If we were required to raise additional capital in the current environment, any such capital raise may be on unfavorable terms, thereby negatively impacting book value and profitability. While we have taken actions to improve our funding, there is no guarantee that such actions will be successful or sufficient in the event of sudden liquidity needs.
There has also been increased regulatory scrutiny – in the course of routine examinations and otherwise – and new regulations directed towards banks of similar size to the Bank, designed to address the 2023 negative developments in the banking industry, all of which may increase our costs of doing business and reduce our profitability. Among other things, there may be an increased focus by both regulators and investors on deposit composition, the level of uninsured deposits, losses embedded in our securities portfolio, contingent liquidity, CRE composition and concentration, capital position and our general oversight and internal control structures regarding the foregoing. As a result, the Bank could face increased scrutiny or be viewed as higher risk by regulators and the investor community.
RISKS RELATED TO THE REGULATION OF OUR INDUSTRY
We are subject to stringent capital requirements, which may adversely impact our return on equity or constrain us from paying dividends or repurchasing shares.
Federal regulations require FDIC-insured depository institutions to meet several minimum capital standards: a common equity Tier 1 capital to risk-based assets ratio of 4.5 percent, a Tier 1 capital to risk-based assets ratio of 6.0 percent, a total capital to risk-based assets of 8.0 percent, and a 4.0 percent Tier l capital to total assets leverage ratio. In addition to establishing the minimum regulatory capital requirements, the regulations limit capital distributions and certain discretionary bonus payments to management if the institution does not hold a “capital conservation buffer” consisting of 2.5 percent of common equity Tier 1 capital to risk-weighted asset above the amount necessary to meet its minimum risk-based capital requirements.
In 2019, the FDIC passed a final rule providing qualifying community banking organizations the ability to opt-in to a new community bank leverage ratio (“CBLR”) framework, (tier 1 capital to average consolidated assets) at 9.0 percent for institutions under $10.0 billion in assets that such institutions may elect to utilize in lieu of the general applicable risk-based capital requirements under Basel III. Such institutions that meet the CBLR and certain other qualifying criteria will automatically be deemed to be well-capitalized. The Bank decided to opt-in to the new CBLR, effective for the quarter ended March 31, 2020. Pursuant to the “Regulatory Relief Act”, the Federal Reserve Board raised the asset threshold under its Small Bank Holding Company Policy Statement from $1.0 billion to $3.0 billion for bank or savings and loan holding companies are permitted to have debt levels higher than would be permitted for larger holding companies, provided that such companies meet certain other conditions such as not engaging in significant nonbanking activities. The Company no longer meets the definition of a Small Bank Holding Company and the qualifications set forth in the “Regulatory Relief Act” at December 31, 2022 and was subject to the larger company capital requirements at March 31, 2023.
The application of more stringent capital requirements likely will result in lower returns on equity and could require raising additional capital in the future or result in regulatory actions if we are unable to comply with such requirements.
We operate in a highly regulated environment, and we may be adversely affected by changes in federal, state and local laws and regulations.
We are subject to extensive regulation, supervision, and examination by federal and state banking authorities. Any change in applicable regulations or federal, state or local legislation could have a substantial impact on us and our operations. Additional legislation and regulations that could significantly affect our powers, authority, and operations may be enacted or adopted in the future, which could have a material adverse effect on our financial condition and results of operations. Further, regulators have significant discretion and authority to prevent or remedy unsafe or unsound practices or violations of laws by banks and bank holding companies in the performance of their supervisory and enforcement duties. The exercise of regulatory authority may have a negative impact on our results of operations and financial condition.
The USA PATRIOT and Bank Secrecy Acts require financial institutions to develop programs to prevent financial institutions from being used for money laundering and terrorist activities. If such activities are detected, financial institutions are obligated to file suspicious activity reports with the U.S. Treasury’s Office of Financial Crimes Enforcement Network. These rules require financial institutions to establish procedures for identifying and verifying the identity of customers seeking to open new financial accounts. Failure to comply with these regulations could result in fines or sanctions, including restrictions on conducting acquisitions or establishing new branches. During the last few years, several banking institutions have received large fines for non-compliance with these laws and regulations. While we have developed policies and procedures designed to assist in compliance with these laws and regulations, these policies and procedures may not be effective in preventing violations of these laws and regulations. Because we operate our business in the highly urbanized greater Newark/New York City metropolitan area, we may be at greater risk of scrutiny by government regulators for compliance with these laws.
The level of our commercial real estate loan portfolio subjects us to additional regulatory scrutiny.
The FDIC and the other federal bank regulatory agencies have promulgated joint guidance on sound risk management practices for financial institutions with concentrations in commercial real estate lending. Under the guidance, a financial institution that, like us, is actively involved in commercial real estate lending should perform a risk assessment to identify concentrations. A financial institution may have a concentration in commercial real estate lending if, among other factors, (i) total reported loans for construction, land acquisition and development, and other land represent 100 percent or more of total capital, or (ii) total reported loans secured by multi-family and non-owner occupied, non-farm, non-residential properties, loans for construction, land acquisition and development and other land, and loans otherwise sensitive to the general commercial real estate market, including loans to commercial real estate related entities, represent 300 percent or more of total capital. Based on these factors, we have a concentration in loans of the type described in (ii) above of 480.6 percent of our risk-based capital at December 31, 2023. The purpose of the guidance is to assist banks in developing risk management practices and capital levels commensurate with the level and nature of real estate concentrations. The guidance states that management should employ heightened risk management practices including board and management oversight and strategic planning, development of underwriting standards, risk assessment and monitoring through market analysis and stress testing. Our bank regulators could require us to implement additional policies and procedures consistent with their interpretation of the guidance that may result in additional costs to us or that may result in a curtailment of our commercial real estate and multi-family lending and/or the requirement that we maintain higher levels of regulatory capital, either of which would adversely affect our loan originations and profitability.
We are subject to the Community Reinvestment Act and fair lending laws, and failure to comply with these laws could lead to material penalties.
The CRA, the Equal Credit Opportunity Act, the Fair Housing Act and other fair lending laws and regulations impose nondiscriminatory lending requirements on financial institutions. A successful regulatory challenge to an institution’s performance under the CRA or fair lending laws and regulations could result in a wide variety of sanctions, including the required payment of damages and civil money penalties, injunctive relief, imposition of restrictions on mergers and acquisitions activity and restrictions on expansion. Private parties may also have the ability to challenge an institution’s performance under fair lending laws in private class action litigation. Such actions could have a material adverse effect on our business, financial condition and results of operations.
Future legislative or regulatory actions responding to perceived financial and market problems could impair our ability to foreclose on collateral.
There have been proposals made by members of Congress and others that would reduce the amount distressed borrowers are otherwise contractually obligated to pay under their mortgage loans and limit an institution’s ability to foreclose on mortgage collateral. Were proposals such as these, or other proposals limiting our rights as a creditor, to be implemented, we could experience increased credit losses or increased expense in pursuing our remedies as a creditor.
STRATEGIC RISKS
Strong competition within our market area may limit our growth and profitability.
Competition is intense within the banking and financial services industry in New Jersey and the New York metropolitan area. In our market area, we compete with commercial banks, savings institutions, mortgage brokerage firms, credit unions, finance companies, mutual funds, insurance companies, and brokerage and investment banking firms operating locally and elsewhere. Many of these competitors have substantially greater resources, higher lending limits and offer services that we do not or cannot provide. This competition makes it more difficult for us to originate new loans and retain and attract new deposits. Price competition for loans may result in originating fewer loans or earning less on our loans. Price competition for deposits may result in a reduction of our deposit base or paying more on our deposits.
The small to mid-sized businesses that we lend to may have fewer resources to weather a downturn in the economy, which may impair a borrower’s ability to repay a loan to us that could materially harm our operating results.
We target our business development and marketing strategy primarily to serve the banking and financial services needs of small to mid-sized businesses. These small to mid-sized businesses frequently have smaller market share than their competition, may be more vulnerable to economic downturns, often need substantial additional capital to expand or compete and may experience significant volatility in operating results. In addition, the success of a small to midsized business often depends on the management talents and efforts of one or two persons or a small group of persons, and the death, disability or resignation of one or more of these persons could have a material adverse impact on the business and its ability to repay a loan. Economic downturns and other events that negatively impact our market areas could cause us to incur substantial credit losses that could negatively affect our results of operations and financial condition.
ITEM 1B. UNRESOLVED STAFF COMMENTS
None.
ITEM 1C. CYBERSECURITY
Cybersecurity Risk Management and Strategy
Cybersecurity risks are continually evolving, becoming increasingly complex and pervasive across all industries. To mitigate these cybersecurity risks and protect nonpublic, personally identifiable customer data, financial transactions and our classified information systems, the Bank has implemented a comprehensive information security program, which is a component of its overarching enterprise risk management program. Key components of the information security program include:
• A risk assessment process that identifies and prioritizes material cybersecurity risks; defines and evaluates the effectiveness of controls to mitigate the risks; and reports results to executive management and the Board of Directors.
• Annual security assessments that proactively identify potential vulnerabilities that are both externally facing and internal within the bank’s infrastructure; reports the results for all assessments to executive management and the Board of Directors with tracking and resolution to potential areas of risk.
• Vulnerability management program that patches known vulnerabilities across operating systems and software platforms.
• Strong controls around user access including creation, changes and termination of access, ongoing user access reviews, multifactor authentication and password policies.
• A technology team covering all critical cyber defense functions such as engineering, data protection, identity and access management, insider risk management, security operations, threat emulation and threat intelligence.
• A training program that educates employees about cybersecurity risks and how to protect themselves from cyberattacks.
• An awareness program that keeps employees informed about cybersecurity threats and how to stay safe online.
• An incident response plan that outlines the steps the Bank will take to respond to a cybersecurity incident, which is tested on a periodic basis.
• Adoption and implementation of a layered defense / defense in depth model n which security systems are linked or stacked so that the strengths of one security system compensate the weaknesses of the other system.
• Additional controls that include but not limited to data encryption; change management; end of life management; asset management; malware and antivirus detection, response and mitigation; physical security; business continuity and disaster recovery management.
The Bank engages reputable third-party assessors to conduct various independent audits on a regular basis, including but not limited to maturity assessments and various testing. Following a defense-in-depth strategy, the Bank leverages both in-house resources and third-party service providers to implement and maintain processes and controls to manage the identified risks.
The Bank’s Third-Party / Vendor Risk Management program is designed to ensure that our vendors meet our cybersecurity requirements. This includes conducting periodic risk assessments of vendors, requiring vendors to implement appropriate cybersecurity controls and monitoring vendor compliance with our cybersecurity requirements.
The Bank’s information security program and strategy are designed to ensure the Bank's information and information systems are resilient and appropriately protected from a variety of threats, both natural and man-made. Periodic audits and risk assessments are performed to validate control requirements and ensure that the Bank’s information is protected at a level commensurate with its sensitivity, value, and criticality. Preventative and detective security controls and policies are employed on all media where information is stored, the systems that process it, and infrastructure components that facilitate its transmission to ensure the confidentiality, integrity, and availability of Bank information. These controls and policies include, but are not limited to access control, data encryption, data loss prevention, incident response, security monitoring, third party risk management, and vulnerability management.
The Bank's information security program and strategy are regularly reviewed and updated to ensure that they are aligned with the Bank's business objectives and are designed to address evolving cybersecurity threats and satisfy regulatory requirements and industry standards.
Material Effects of Cybersecurity Threats
While cybersecurity risks have the potential to materially affect the Bank's business, financial condition, and results of operations, the Bank does not believe that risks from cybersecurity threats or attacks, including as a result of any previous cybersecurity incidents, have materially affected the Bank, including its business strategy, results of operations or financial condition. Accordingly, no matter how well designed or implemented the Bank’s controls are, there is a risk that it may not be able to anticipate all zero-day cyber security exploits and vulnerabilities, and it may not be able to implement effective preventive measures against such exploits / vulnerabilities and potentially associated security breaches in a timely manner.
Governance
Board of Directors Oversight
The Bank’s Board of Directors is charged with overseeing the establishment and execution of the Bank’s security management framework and monitoring adherence to related policies required by applicable statutes, regulations and principles of safety and soundness. Consistent with this responsibility the Board has delegated primary oversight responsibility over the Bank’s security management framework, including oversight of cybersecurity risk and cybersecurity risk management, to the Information Technology /Information Security Committee of the Board of Directors. The Information Technology /Information Security Committee receives regular updates on cybersecurity risks and incidents and the cybersecurity program through direct interaction with the Chief Information Technology Officer and provides periodic updates regarding cybersecurity risks and the cybersecurity program to the full Board of Directors. Additionally, awareness and training on cybersecurity topics is provided to the Board on an annual basis.
Management's Role
The Information Technology department is responsible for implementing and maintaining the Bank’s cybersecurity risk management program. The Information Technology department consists of cybersecurity and information risk professionals who assess, identify, and manage cybersecurity risks. Information Security is led by Chief Information Technology Officer, who reports directly to the Chief Operating Officer and dotted lined to the Board of Directors. The Bank’s CITO has over 23 years of experience in technology and cybersecurity across the financial services industry. Prior to joining the Bank, the Bank’s CITO served as Chief Information Officer and Information Security Officer at First Choice Bank and the Director of Technology and IT Governance at OceanFirst Bank. The Information Technology department is responsible for ensuring the protection of electronic and physical information through the identification and management of risk activities. Information security risk is reported by the Information Technology Department through quarterly management reporting to achieve an appropriate flow of information risk reporting to the Board. The committees and working groups that monitor information security risks include the Cybersecurity Incident Response Team, and the Information Technology / Information Security Committee of the Board of Directors. These committees and working groups establish and oversee policies, programs, and other guidance to provide specific expectations for managing the cybersecurity risk.
ITEM 2. PROPERTIES
At December 31, 2023, the Bank conducted its business through an executive office, two administrative offices, and 28 branch offices. 13 offices have drive-up facilities. The Bank has 37 automatic teller machines at its branch facilities and three other off-site locations. The following table sets forth information relating to each of the Bank’s offices at December 31, 2023. The total net book value of the Bank’s premises and equipment at December 31, 2023 was $13.1 million.
|
|
|
|
|
|
|
|
|
|
|
|
|
|
Location |
| Year Office Opened |
|
| Net Book Value |
|
|
|
|
|
|
|
|
|
|
|
|
| (In Thousands) |
|
Executive Office |
|
|
|
|
|
|
104-110 Avenue C, Bayonne, New Jersey |
| 2003 |
| $ | 2,179 |
|
Administrative and Other Offices |
|
|
|
|
|
|
591-597 Avenue C, Bayonne, New Jersey |
| 2010 |
|
| 50 | (1) |
27 West 18th Street, Bayonne, New Jersey |
| 2014 |
|
| 191 | (1) |
Branch Offices |
|
|
|
|
|
|
860 Broadway, Bayonne, New Jersey |
| 2000 |
|
| 478 | (1) |
510 Broadway, Bayonne, New Jersey |
| 2003 |
|
| 19 | (1) |
401 Washington Street, Hoboken, New Jersey |
| 2010 |
|
| 135 | (1) |
987 Broadway, Bayonne, New Jersey |
| 2010 |
|
| - | (1) |
473 Spotswood Englishtown Rd., Monroe Township, New Jersey |
| 2010 |
|
| 97 | (1) |
611 Avenue C, Bayonne, New Jersey |
| 2010 |
|
| 29 | (1) |
181 Avenue A, Bayonne, New Jersey |
| 2010 |
|
| 1,984 |
|
211 Washington St., Jersey City, New Jersey |
| 2010 |
|
| - | (1) |
200 Valley Street, South Orange, New Jersey |
| 2011 |
|
| 927 |
|
378 Amboy Road, Woodbridge, New Jersey |
| 2019 |
|
| 6 | (1) |
165 Passaic Avenue, Fairfield, New Jersey |
| 2014 |
|
| - | (1) |
354 New Dorp Lane, Staten Island, New York |
| 2015 |
|
| - | (1) |
190 Park Avenue, Rutherford, New Jersey |
| 2015 |
|
| 23 | (1) |
1500 Forest Avenue, Staten Island, New York |
| 2016 |
|
| 625 | (1) |
626 Laurel Avenue, Holmdel, New Jersey |
| 2016 |
|
| 15 | (1) |
734 Ridge Road, Lyndhurst, New Jersey |
| 2016 |
|
| 63 | (1) |
2000 Morris Avenue, Union, New Jersey |
| 2016 |
|
| 13 | (1) |
156 Maplewood Avenue, Maplewood, New Jersey |
| 2018 |
|
| 354 | (1) |
1630 Oak Tree Road, Edison, New Jersey |
| 2018 |
|
| 190 | (1) |
1452 Route 46 West, Parsippany, New Jersey |
| 2018 |
|
| 89 | (1) |
781 Newark Avenue, Jersey City, New Jersey |
| 2018 |
|
| 3,185 |
|
70 Broadway, Hicksville, New York |
| 2018 |
|
| - | (1) |
10 Schalks Crossing Road, Plainsboro, New Jersey |
| 2018 |
|
| 64 | (1) |
876 Kinderkamack Road, River Edge, New Jersey |
| 2019 |
|
| 93 | (1) |
1100 Washington Street, Hoboken, New Jersey |
| 2019 |
|
| 192 | (1) |
269 Ferry Street, Newark, New Jersey |
| 2020 |
|
| 322 | (1) |
240 Page Avenue, Staten Island, New York |
| 2023 |
|
| 306 | (1) |
|
|
|
|
|
|
|
Net book value of properties |
|
|
|
| 11,629 |
|
Net book value of furnishings and equipment |
|
|
|
| 1,428 | (2) |
Total premises and equipment |
|
|
| $ | 13,057 |
|
(1)Leased property
(2)Includes off-site ATMs
ITEM 3. LEGAL PROCEEDINGS
We are involved, from time to time, as plaintiff or defendant in various legal actions arising in the normal course of business. As of December 31, 2023, we were not involved in any material legal proceedings the outcome of which, if determined in a manner adverse to the Company, would have a material adverse effect on our financial condition or results of operations.
ITEM 4. MINE SAFETY DISCLOSURES
Not applicable.
PART II
ITEM 5. MARKET FOR REGISTRANT’S COMMON EQUITY, RELATED STOCKHOLDER MATTERS AND ISSUER PURCHASES OF EQUITY SECURITIES
Market Information
The Company’s common stock trades on the Nasdaq Global Market under the symbol “BCBP.”
Stockholders.
At March 1, 2024, the Company had approximately 5,500 stockholders of record.
Recent Sales of Unregistered Securities
None.
Dividends
The Company declared and paid cash dividends of $0.16 per share in each quarter for the year ended December 31, 2023. The payment of dividends to shareholders of the Company is dependent on the Bank paying dividends to the Company. The Bank may pay dividends as declared from time to time by the Board of Directors out of funds legally available, subject to certain restrictions. Under the New Jersey Banking Act of 1948, as amended, the Bank may not pay a cash dividend unless, following the payment, the Bank’s capital stock will be unimpaired and the Bank will have a surplus of no less than 50.0 percent of the Bank’s capital stock or, if not, the payment of the dividend will not reduce the surplus. In addition, the Bank cannot pay dividends in amounts that would reduce the Bank’s capital below regulatory imposed minimums.
Issuer Purchases of Equity Securities
On December 11, 2020, the Company issued a press release announcing the adoption of a new stock repurchase program, effective December 16, 2020. Under the stock repurchase program, management is authorized to repurchase up to 500,000 shares of the Company’s common stock. On October 17, 2022, the Company issued a press release announcing an amendment to its stock repurchase program. The amendment to the stock repurchase program increased the number of shares yet to be repurchased from 82,350 shares to a total number of 500,000 shares. The Company repurchased 266,753 shares during the year ended December 31, 2023, and has 150,897 remaining to be repurchased under the program. No shares were repurchased during the three months ended December 31, 2023.
Compensation Plans
Set forth below is information as of December 31, 2023 regarding equity compensation plans that have been approved by shareholders. The Company has no equity-based benefit plans that were not approved by shareholders.
|
|
|
|
Plan | Number of securities to be issued upon exercise of outstanding options and rights | Weighted average Exercise price(1) | Number of securities remaining available for issuance under plans |
2011 Stock Option Plan | 639,600 | $12.06 | - |
2018 Equity Incentive Plan | 423,127 | $12.27 | - |
2023 Equity Incentive Plan | - | - | 1,000,000 |
Equity compensation plans not approved by shareholders | - | - | - |
Total | 1,062,727 | $12.14 | 1,000,000 |
_____________________________
(1)The weighted average exercise price reflects the exercise prices ranging from $10.55-$13.68 per share for options granted under the 2011 Stock Option Plan and the 2018 Equity Incentive Plan. As of December 31, 2023, the 2011 Stock Option Plan and the 2018 Equity Incentive Plan have expired.
Common Stock Performance Graph
Set forth hereunder is a stock performance graph comparing (a) the cumulative total return on the common stock for the period beginning with the closing sales price on December 31, 2018 through December 31, 2023, (b) the cumulative total return on all publicly traded commercial bank stocks over such period, as repriced on the SNL Banks Index, and (c) the cumulative total return of the Nasdaq Market Index over such period. Cumulative return assumes the reinvestment of dividends, and is expressed in dollars based on an assumed investment of $100.
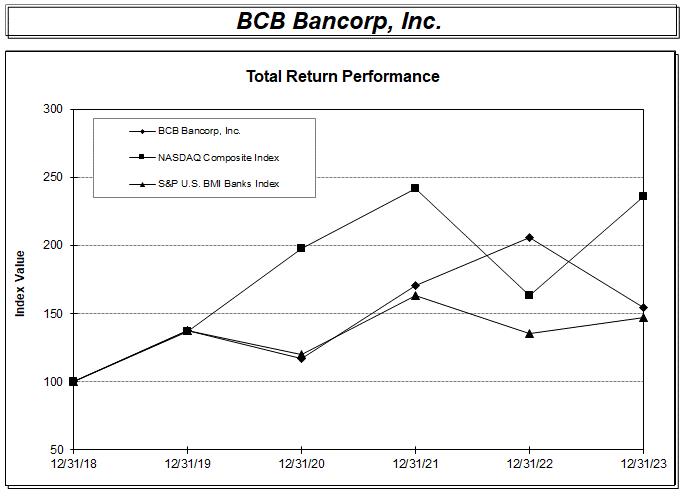
|
|
|
|
|
|
|
|
| Period Ending |
| |||
Index | 12/31/18 | 12/31/19 | 12/31/20 | 12/31/21 | 12/31/22 | 12/31/23 |
BCB Bancorp, Inc. | 100.00 | 137.75 | 117.09 | 170.37 | 205.59 | 154.65 |
NASDAQ Composite Index | 100.00 | 136.69 | 198.10 | 242.03 | 163.28 | 236.17 |
S&P U.S. BMI Banks Index | 100.00 | 137.36 | 119.83 | 162.92 | 135.13 | 147.41 |
ITEM 6. [RESERVED]
ITEM 7. MANAGEMENT’S DISCUSSION AND ANALYSIS OF FINANCIAL CONDITION AND RESULTS OF OPERATIONS
Critical Accounting Estimates
Critical accounting estimates are those accounting policies that can have a significant impact on the Company’s financial position and results of operations that require the use of complex and subjective estimates based upon past experiences and management’s judgment. Because of the uncertainty inherent in such estimates, actual results may differ from these estimates. Below are those policies applied in preparing the Company’s consolidated financial statements that management believes are the most dependent on the application of estimates and assumptions. For additional accounting policies, see Note 2 of “Notes to Consolidated Financial Statements.”
Allowance for Credit losses
On January 1, 2023, the Company adopted ASU 2016-13 (Topic 326), which replaced the incurred loss methodology with CECL for financial instruments measured at amortized cost and other commitments to extend credit. Loans receivable are presented net of an allowance for credit losses and net deferred loan fees. In determining the appropriate level of the allowance, management considers a combination of factors, such as economic and industry trends, real estate market conditions, size and type of loans in portfolio, nature and value of collateral held, borrowers’ financial strength and credit ratings, and prepayment and default history. The calculation of the appropriate allowance for credit losses relies on econometric models to estimate the quantitative reserves and also the use of qualitative factors to supplement the quantitative calculation. The process of establishing allowance for credit losses is complex and requires a substantial amount of judgment regarding the impact of the aforementioned factors, as well as other factors, on the ultimate realization of loans receivable. In addition, our determination of the amount of the allowance for credit losses is subject to review by the New Jersey Department of Banking and Insurance and the FDIC, as part of their examination process. After a review of the information available, our regulators might require the establishment of an additional allowance. Any increase in the allowance for loan loss required by regulators would have a negative impact on our earnings. Refer to Note 5 of the accompanying consolidated financial statements for additional information on the Company’s allowance for credit loss process.
Goodwill
The Company accounts for goodwill and other intangible assets in accordance with FASB ASC Topic 350, “Intangibles – Goodwill and Other,” which allows an entity to first assess qualitative factors to determine whether it is necessary to perform the quantitative goodwill impairment test. Based on a qualitative assessment, management determined that the Company’s recorded goodwill totaling $5.2 million, is not impaired as of December 31, 2023.
Financial Condition at December 31, 2023 and 2022
Total assets increased by $286.2 million, or 8.1 percent, to $3.832 billion at December 31, 2023, from $3.546 billion at December 31, 2022. The increase in total assets was mainly related to increases in total loans and in cash and cash equivalents.
Total cash and cash equivalents increased by $50.2 million, or 21.9 percent, to $279.5 million at December 31, 2023, from $229.4 million at December 31, 2022. The increase was primarily due to an increase in Federal Home Loan Bank (“FHLB”) borrowings and in deposits.
Loans receivable, net, increased by $234.4 million, or 7.7 percent, to $3.280 billion at December 31, 2023, from $3.045 billion at December 31, 2022. Total loan increases during 2023 included increases of $90.2 million in commercial business loans, $88.9 million in commercial real estate and multi-family loans, $47.9 million in construction loans and $9.8 million in home equity and consumer loans. 1-4 family residential loans decreased $1.8 million. The allowance for credit losses increased $1.2 million to $33.6 million, or 178.9 percent of non-accruing loans and 1.01 percent of gross loans, at December 31, 2023, as compared to an allowance for credit losses of $32.4 million, or 633.6 percent of non-accruing loans and 1.05 percent of gross loans, at December 31, 2022.
Total investment securities decreased by $12.5 million, or 11.5 percent, to $96.9 million at December 31, 2023, from $109.4 million at December 31, 2022, representing unrealized losses, calls and maturities, and repayments.
Deposit liabilities increased by $167.5 million, or 6.0 percent, to $2.979 billion at December 31, 2023, from $2.812 billion at December 31, 2022. Certificates of deposits and money market accounts increased $417.9 million and $65.4 million, respectively, offset by interest bearing demand, non-interest bearing and savings and club accounts which declined $315.8 million during the twelve months of 2023.
Debt obligations increased by $90.7 million to $510.4 million at December 31, 2023 from $419.7 million at December 31, 2022. The weighted average interest rate of FHLB advances was 4.21 percent at December 31, 2023 and 4.07 percent at December 31, 2022. The weighted average maturity of FHLB advances as of December 31, 2023 was 1.93 years. The interest rate of our subordinated debt balances was 8.36 percent at December 31, 2023 and 5.62 percent at December 31, 2022 due to the fixed-rate period on such debt ending as of July 31, 2023.
Stockholders’ equity increased by $22.8 million, or 7.8 percent, to $314.1 million at December 31, 2023, from $291.3 million at December 31, 2022. The increase was primarily attributable to the increase in retained earnings of $20.8 million, or 18.1 percent, to $135.9 million at December 31, 2023 from $115.1 million at December 31, 2023.
Analysis of Net Interest Income
Net interest income is the difference between interest income on interest-earning assets and interest expense on interest-bearing liabilities. Net interest income depends on the relative amounts of interest-earning assets and interest-bearing liabilities and the interest rates earned or paid on them, respectively.
The following table sets forth average balance sheets, yields and costs, and certain other information for the years indicated. All average balances are daily average balances. The yields set forth below include the effect of deferred fees, discounts and premiums, which are included in interest income.
|
|
|
|
|
|
|
|
|
|
|
|
|
|
|
|
|
|
|
|
|
|
|
|
|
|
|
|
| Year ended December 31, 2023 |
|
|
| Year ended December 31, 2022 |
|
|
| Year ended December 31, 2021 |
| |||||||||||||||
| Average Daily Balance |
| Interest Earned/Paid |
| Average Yield/Rate |
| Average Daily Balance |
| Interest Earned/Paid |
| Average Yield/Rate |
| Average Daily Balance |
| Interest Earned/Paid |
| Average Yield/Rate | |||||||||
| (Dollars in Thousands) | |||||||||||||||||||||||||
Interest-earning assets: |
|
|
|
|
|
|
|
|
|
|
|
|
|
|
|
|
|
|
|
|
|
|
|
|
|
|
Loans receivable (1) (2) | $ | 3,281,334 |
| $ | 169,559 |
| 5.17 | % |
| $ | 2,626,710 |
| $ | 123,577 |
| 4.70 | % |
| $ | 2,327,781 |
| $ | 107,660 |
| 4.63 | % |
Investment securities (3) |
| 100,000 |
|
| 5,106 |
| 5.11 |
|
|
| 109,604 |
|
| 4,731 |
| 4.32 |
|
|
| 108,545 |
|
| 3,954 |
| 3.64 |
|
Interest-earning deposits |
| 270,659 |
|
| 13,695 |
| 5.06 |
|
|
| 274,649 |
|
| 3,133 |
| 1.14 |
|
|
| 377,209 |
|
| 959 |
| 0.25 |
|
Total interest-earning assets |
| 3,651,993 |
|
| 188,360 |
| 5.16 | % |
|
| 3,010,963 |
|
| 131,441 |
| 4.37 | % |
|
| 2,813,535 |
|
| 112,573 |
| 4.00 | % |
Non-interest-earning assets |
| 123,651 |
|
|
|
|
|
|
|
| 106,712 |
|
|
|
|
|
|
|
| 106,039 |
|
|
|
|
|
|
Total assets | $ | 3,775,644 |
|
|
|
|
|
|
| $ | 3,117,675 |
|
|
|
|
|
|
| $ | 2,919,574 |
|
|
|
|
|
|
Interest-bearing liabilities: |
|
|
|
|
|
|
|
|
|
|
|
|
|
|
|
|
|
|
|
|
|
|
|
|
|
|
Interest-bearing demand accounts | $ | 658,023 |
| $ | 8,426 |
| 1.28 | % |
| $ | 751,708 |
| $ | 2,970 |
| 0.40 | % |
| $ | 637,671 |
| $ | 2,657 |
| 0.42 | % |
Money market accounts |
| 334,353 |
|
| 8,489 |
| 2.54 |
|
|
| 350,207 |
|
| 2,313 |
| 0.66 |
|
|
| 335,824 |
|
| 1,678 |
| 0.50 |
|
Savings accounts |
| 305,778 |
|
| 620 |
| 0.20 |
|
|
| 340,232 |
|
| 449 |
| 0.13 |
|
|
| 317,301 |
|
| 505 |
| 0.16 |
|
Certificates of deposit |
| 980,617 |
|
| 39,157 |
| 3.99 |
|
|
| 614,346 |
|
| 6,889 |
| 1.12 |
|
|
| 673,233 |
|
| 6,160 |
| 0.92 |
|
Total interest-bearing deposits |
| 2,278,771 |
|
| 56,692 |
| 2.49 |
|
|
| 2,056,493 |
|
| 12,621 |
| 0.61 |
|
|
| 1,964,029 |
|
| 11,000 |
| 0.56 |
|
Borrowed funds |
| 594,564 |
|
| 27,606 |
| 4.64 |
|
|
| 149,354 |
|
| 4,875 |
| 3.26 |
|
|
| 173,341 |
|
| 4,180 |
| 2.41 |
|
Total interest-bearing liabilities |
| 2,873,335 |
|
| 84,298 |
| 2.93 | % |
|
| 2,205,847 |
|
| 17,496 |
| 0.79 | % |
|
| 2,137,370 |
|
| 15,180 |
| 0.71 | % |
Non-interest-bearing liabilities |
| 602,691 |
|
|
|
|
|
|
|
| 636,217 |
|
|
|
|
|
|
|
| 524,668 |
|
|
|
|
|
|
Total liabilities |
| 3,476,026 |
|
|
|
|
|
|
|
| 2,842,064 |
|
|
|
|
|
|
|
| 2,662,038 |
|
|
|
|
|
|
Stockholders' equity |
| 299,618 |
|
|
|
|
|
|
|
| 275,611 |
|
|
|
|
|
|
|
| 257,536 |
|
|
|
|
|
|
Total liabilities and stockholders' equity |
| 3,775,644 |
|
|
|
|
|
|
|
| 3,117,675 |
|
|
|
|
|
|
|
| 2,919,574 |
|
|
|
|
|
|
Net interest income |
|
|
| $ | 104,062 |
|
|
|
|
|
|
| $ | 113,945 |
|
|
|
|
|
|
| $ | 97,393 |
|
|
|
Net interest rate spread (4) |
|
|
|
|
|
| 2.22 | % |
|
|
|
|
|
|
| 3.57 | % |
|
|
|
|
|
|
| 3.29 | % |
Net interest margin (5) |
|
|
|
|
|
| 2.85 | % |
|
|
|
|
|
|
| 3.78 | % |
|
|
|
|
|
|
| 3.46 | % |
_______________
(1) Excludes allowance for credit losses.
(2) Includes nonaccrual loans which are immaterial to the yield.
(3) Includes Federal Home Loan Bank of New York stock.
(4) Interest rate spread represents the difference between the average yield on interest-earning assets and the average cost of interest-bearing liabilities.
(5) Net interest margin represents net interest income as a percentage of average interest-earning assets.
Rate/Volume Analysis
The table below sets forth certain information regarding changes in our interest income and interest expense for the years indicated. For each category of interest-earning assets and interest-bearing liabilities, information is provided on changes attributable to (i) changes in average volume (changes in average volume multiplied by old rate); (ii) changes in rate (change in rate multiplied by old average volume); (iii) changes due to combined changes in rate and volume; and (iv) the net change.
|
|
|
|
|
|
|
|
|
|
|
|
|
|
|
|
|
|
|
|
|
|
|
|
|
|
|
|
|
|
|
|
|
|
|
|
|
|
|
|
|
|
|
|
|
|
|
|
|
|
|
|
|
|
| Years Ended December 31, | |||||||||||||||||||||||||
|
| 2023 vs. 2022 |
|
| 2022 vs. 2021 |
|
| 2021 vs. 2020 | ||||||||||||||||||
|
| Increase (Decrease) Due to |
|
| Increase (Decrease) Due to |
| Increase (Decrease) Due to | |||||||||||||||||||
| Volume | Rate | Rate/ Volume | Total Increase (Decrease) |
| Volume | Rate | Rate/ Volume | Total Increase (Decrease) |
| Volume | Rate | Rate/ Volume | Total Increase (Decrease) | ||||||||||||
| (In thousands) | |||||||||||||||||||||||||
Interest income: |
|
|
|
|
|
|
|
|
|
|
|
|
|
|
|
|
|
|
|
|
|
|
|
|
|
|
Loans receivable | $ | 30,798 | $ | 12,155 | $ | 3,029 | $ | 45,982 |
| $ | 13,825 | $ | 1,854 | $ | 238 | $ | 15,917 |
| $ | 371 | $ | 136 | $ | - | $ | 507 |
Investment securities |
| (415) |
| 865 |
| (76) |
| 374 |
|
| 39 |
| 731 |
| 7 |
| 777 |
|
| (277) |
| 862 |
| (69) |
| 516 |
Interest-earning deposits |
| (45) |
| 10,764 |
| (156) |
| 10,563 |
|
| (261) |
| 3,344 |
| (909) |
| 2,174 |
|
| (175) |
| (1,813) |
| 112 |
| (1,876) |
Total interest-earning assets |
| 30,338 |
| 23,784 |
| 2,797 |
| 56,919 |
|
| 13,603 |
| 5,929 |
| (664) |
| 18,868 |
|
| (81) |
| (815) |
| 43 |
| (853) |
Interest expense: |
|
|
|
|
|
|
|
|
|
|
|
|
|
|
|
|
|
|
|
|
|
|
|
|
|
|
Interest-bearing demand accounts |
| (370) |
| 6,656 |
| (830) |
| 5,456 |
|
| 475 |
| (138) |
| (24) |
| 313 |
|
| 950 |
| (1,024) |
| (319) |
| (393) |
Money market deposits |
| (105) |
| 6,579 |
| (298) |
| 6,176 |
|
| 72 |
| 540 |
| 23 |
| 635 |
|
| 144 |
| (1,494) |
| (69) |
| (1,419) |
Savings deposits |
| (46) |
| 241 |
| (24) |
| 171 |
|
| 36 |
| (86) |
| (6) |
| (56) |
|
| 64 |
| - |
| - |
| 64 |
Certificates of Deposits |
| 4,107 |
| 17,643 |
| 10,519 |
| 32,269 |
|
| (538) |
| 1,389 |
| (122) |
| 729 |
|
| (5,369) |
| (10,835) |
| 3,005 |
| (13,199) |
Borrowings |
| 14,532 |
| 2,060 |
| 6,139 |
| 22,731 |
|
| (578) |
| 1,478 |
| (205) |
| 695 |
|
| (2,636) |
| (404) |
| 151 |
| (2,889) |
Total interest-bearing liabilities |
| 18,118 |
| 33,179 |
| 15,506 |
| 66,803 |
|
| (533) |
| 3,183 |
| (334) |
| 2,316 |
|
| (6,847) |
| (13,757) |
| 2,768 |
| (17,836) |
Change in net interest income | $ | 12,220 | $ | (9,395) | $ | (12,709) | $ | (9,884) |
| $ | 14,136 | $ | 2,746 | $ | (330) | $ | 16,552 |
| $ | 6,766 | $ | 12,942 | $ | (2,725) | $ | 16,983 |
Results of Operations for the Years Ended December 31, 2023 and 2022
Net income decreased by $16.1 million, or 35.3 percent, to $29.5 million for the year ended December 31, 2023 from $45.6 million for the year ended December 31, 2022. The decrease in net income was primarily driven by less net interest income and an increased provision for credit losses on loans being recorded.
Net interest income decreased by $9.9 million, or 8.7 percent, to $104.1 million for the year ended December 31, 2023 from $113.9 million for the year ended December 31, 2022. The decrease in net interest income resulted from a $66.8 million increase in interest expense, offset by an increase of $56.9 million in interest income.
The $56.9 million increase in interest income to $188.4 million for the twelve months of 2023, was a 43.3 percent increase from $131.4 million for the twelve months of 2022. The average balance of interest-earning assets increased $641.0 million, or 21.3 percent, to $3.652 billion for the twelve months of 2023, from $3.011 billion for the twelve months of 2022, while the average yield increased 79 basis points to 5.16 percent from 4.37 percent for the same comparable period. The increase in the average balance of interest-earning assets and in interest income mainly related to an increase in the average balance of loans receivable of $654.6 million to $3.281 billion for the twelve months of 2023, from $2.627 billion for the twelve months of 2022.
The $66.8 million increase in interest expense to $84.3 million for the twelve months of 2023, was a 381.8 percent increase from $17.5 million for the 2022 comparable period. This increase resulted primarily from an increase in the average rate on interest-bearing liabilities of 214 basis points to 2.93 percent for the twelve months of 2023, from 0.79 percent for the twelve months of 2022, and an increase in the average balance of interest-bearing liabilities of $667.5 million, or 30.3 percent, to $2.873 billion from $2.206 billion over the same comparable periods. The increase in the average cost of funds primarily resulted from the high interest rate environment and an increase in the level of borrowed funds in the twelve months of 2023 compared to the same period in 2022.
Net interest margin was 2.85 percent for the twelve months of 2023, compared to 3.78 percent for the twelve months of 2022. The decrease in the net interest margin compared to the prior period was primarily the result of an increase in the average volume of interest-bearing liabilities as well as an increase in the cost of interest-bearing liabilities.
During the twelve months of 2023, the Company recognized $704,000 in net-charge offs compared to $1.7 million in net-charge offs for the same period in 2022.
Non-interest income increased by $2.5 million to $4.1 million for the twelve months of 2023 from $1.6 million for the twelve months of 2022. The improvement in total non-interest income was mainly related to a $2.9 million decrease in the realized and unrealized losses on equity securities. The realized and unrealized losses on equity securities are based on market conditions.
Non-interest expense increased by $5.1 million, or 9.2 percent, to $60.6 million for the twelve months of 2023 from $55.5 million for the same period in 2022. The increase in operating expenses for 2023 was driven primarily by an increase in salaries and employee benefits, an increase in regulatory assessments, and higher data processing expenses. The 2023 salaries and benefits expense includes a one-time payment of $1.17 million to the Company’s former President and Chief Executive Officer.
The income tax provision decreased by $5.5 million or 31.7 percent, to $12.0 million for the twelve months of 2023 from $17.5 million for the same period in 2022. The decrease in the income tax provision was a result of the lower taxable income for the twelve months ended December 31, 2023 compared to the same period in 2022. The consolidated effective tax rate was 28.9 percent for the twelve months of 2023 compared to 27.8 percent for the twelve months of 2022.
Results of Operations for the Years Ended December 31, 2022 and 2021
The results of operations comparison of 2022 compared to 2021 can be found in the Company’s previously filed Annual Report on Form 10-K for the year-ended December 31, 2022 under Item 7 “Management’s Discussion and Analysis of Financial Condition and Results of Operations”- Results of Operations for the Years Ended December 31, 2022 and 2021 on pages 28 and 29.
Liquidity and Capital Resources
The overall objective of our liquidity management practices is to ensure the availability of sufficient funds to meet financial commitments and to take advantage of lending and investment opportunities. The Company manages liquidity in order to meet deposit withdrawals on demand or at contractual maturity, to repay borrowings and other obligations as they mature, and to fund loan and investment portfolio opportunities as they arise.
The Company’s primary sources of funds to satisfy its objectives are net growth in deposits (primarily retail), principal and interest payments on loans and investment securities, proceeds from the sale of originated loans and FHLB and other borrowings. The scheduled amortization of loans is a predictable source of funds. Deposit flows and mortgage prepayments are greatly influenced by general interest rates, economic conditions and competition. The Company has other sources of liquidity if a need for additional funds arises, including unsecured overnight lines of credit and other collateralized borrowings from the Federal Reserve Bank Discount Window, the FHLB and other correspondent banks. Our Asset / Liability Management Committee is responsible for establishing and monitoring our liquidity targets and strategies in order to ensure that sufficient liquidity exists for meeting the borrowing needs of our customers as well as unanticipated contingencies.
At December 31, 2023 and 2022, the Company had $0 and $60 million in overnight borrowings outstanding with the FHLB, respectively. The Company utilizes overnight borrowings from time to time to fund short-term liquidity needs. The Company had total outstanding borrowings of $510.4 million at December 31, 2023 as compared to $419.8 million at December 31, 2022.
At December 31, 2023, the Company had the ability to obtain additional funding from the FHLB of $408.3 million and $309.2 million from the Federal Reserve Bank Discount Window, utilizing unencumbered loan collateral. The Company expects to have sufficient funds available to meet current loan commitments in the normal course of business through typical sources of liquidity. Time deposits scheduled to mature in one year or less totaled $1.199 billion at December 31, 2023. Based upon historical experience data, management estimates that a significant portion of such deposits will remain with the Company.
The Company was well-positioned with adequate levels of cash and liquid assets as of December 31, 2023 and a significant amount of available borrowing capacity with FHLB and Federal Reserve Bank Discount Window.
At December 31, 2023 and 2022, the capital ratios of the Bank exceeded the quantitative capital ratios required for an institution to be considered “well-capitalized” under prompt corrective action provisions.
ITEM 7A. QUANTITATIVE AND QUALITATIVE DISCLOSURES ABOUT MARKET RISK
Management of Market Risk
Qualitative Analysis. The majority of our assets and liabilities are monetary in nature. Consequently, one of our most significant forms of market risk is interest rate risk. Our assets, consisting primarily of mortgage loans, have longer maturities than our liabilities, consisting primarily of deposits. As a result, a principal part of our business strategy is to manage interest rate risk and reduce the exposure of our net interest income to changes in market interest rates. Accordingly, our Board of Directors has established an Asset/Liability Committee which is responsible for evaluating the interest rate risk inherent in our assets and liabilities, for determining the level of risk that is appropriate given our business strategy, operating environment, capital, liquidity and performance objectives, and for managing this risk consistent with the guidelines approved by the Board of Directors. Senior management monitors the level of interest rate risk on a regular basis and the Asset/Liability Committee, which consists of senior management and outside directors operating under a policy adopted by the Board of Directors, meets as needed to review our asset/liability policies and interest rate risk position.
Quantitative Analysis. The following table presents the Company’s net portfolio value (“NPV”). These calculations were based upon assumptions believed to be fundamentally sound, although they may vary from assumptions utilized by other financial institutions. The information set forth below is based on data that included all financial instruments as of December 31, 2023. Assumptions have been made by the Company relating to interest rates, loan prepayment rates, core deposit duration, and the market values of certain assets and liabilities under the various interest rate scenarios. Actual maturity dates were used for fixed rate loans and certificate accounts. Investment securities were scheduled at either the maturity date or the next scheduled call date based upon management’s judgment of whether the particular security would be called in the current interest rate environment and under assumed interest rate scenarios. Variable rate loans were scheduled as of their next scheduled interest rate repricing date. Additional assumptions made in the preparation of the NPV table include prepayment rates on loans and mortgage-backed securities, core deposits without stated maturity dates were scheduled with an assumed term of 48 months, and money market and noninterest bearing accounts were scheduled with an assumed term of 24 months. The NPV at “PAR” represents the difference between the Company’s estimated value of assets and estimated value of liabilities assuming no change in interest rates. The NPV for a decrease of 200 to 300 basis points has been excluded since it would not be meaningful in the interest rate environment as of December 31, 2023. The following sets forth the Company’s NPV as of December 31, 2023.
|
|
|
|
|
|
|
|
|
|
|
|
|
|
|
|
|
|
|
|
|
|
|
|
|
|
|
|
|
|
|
|
|
|
|
|
|
|
|
|
|
|
|
|
|
| NPV as a % of Assets |
| |||
Change in calculation |
|
| Net Portfolio Value |
|
| $ Change from PAR |
|
| % Change from PAR |
|
| NPV Ratio |
|
| Change |
|
(Dollars in Thousands) |
|
|
|
|
|
|
|
|
|
|
|
|
|
|
|
|
+100bp |
| $ | 305,247 |
| $ | (34,563) |
|
| (10.17) | % |
| 8.51 | % |
| (0.77) | bps |
PAR |
|
| 339,810 |
|
| - |
|
| 0.00 |
|
| 9.28 |
|
| 0.00 | bps |
-100bp |
|
| 371,622 |
|
| 31,812 |
|
| 9.36 |
|
| 9.94 |
|
| 0.66 | bps |
-200bp |
|
| 400,009 |
|
| 60,199 |
|
| 17.72 |
|
| 10.47 |
|
| 1.19 | bps |
-300bp |
|
| 420,099 |
|
| 80,289 |
|
| 23.63 |
|
| 10.76 |
|
| 1.48 | bps |
_________
bps-basis point
The table above indicates that at December 31, 2023, in the event of a 100-basis point decrease in interest rates, we would experience a 0.66 basis point increase in NPV, as compared to a 0.02 percent decrease at December 31, 2022.
Certain shortcomings are inherent in the methodology used in the above interest rate risk measurement. Modeling changes in NPV require making certain assumptions that may or may not reflect the manner in which actual yields and costs respond to changes in market interest rates. In this regard, the NPV table presented assumes that the composition of our interest-sensitive assets and liabilities existing at the beginning of a period remains constant over the period being measured and assumes that a particular change in interest rates is reflected uniformly across the yield curve regardless of the duration or repricing of specific assets and liabilities. Accordingly, although the NPV table provides an indication of our interest rate risk exposure at a particular point in time, such measurements are not intended to and do not provide a precise forecast of the effect of changes in market interest rates on our net interest income, and will differ from actual results.
ITEM 8. FINANCIAL STATEMENTS AND SUPPLEMENTARY DATA
Report of Independent Registered Public Accounting Firm
To the Stockholders and Board of Directors of BCB Bancorp, Inc.
Opinion on the Financial Statements
We have audited the accompanying consolidated statements of financial condition of BCB Bancorp, Inc. (the “Company”) as of December 31, 2023 and 2022, the related consolidated statements of operations, comprehensive income, changes in stockholders' equity and cash flows for each of the years in the three-year period ended December 31, 2023, and the related notes to the consolidated financial statements (collectively, the “financial statements”). In our opinion, the financial statements present fairly, in all material respects, the financial position of the Company as of December 31, 2023 and 2022, and the results of its operations and its cash flows for each of the years in the three-year period ended December 31, 2023, in conformity with accounting principles generally accepted in the United States of America.
We have also audited, in accordance with the standards of the Public Company Accounting Oversight Board (United States) (“PCAOB”), the Company’s internal control over financial reporting as of December 31, 2023, based on criteria established in Internal Control — Integrated Framework issued by the Committee of Sponsoring Organizations of the Treadway Commission in 2013 and our report dated March 8, 2024 expressed an unqualified opinion on the effectiveness of the Company’s internal control over financial reporting.
Change in Accounting Principle
As discussed in Note 2 to the financial statements, the Company changed its method of accounting for the recognition and measurement of credit losses as of January 1, 2023 upon the adoption of Accounting Standards Codification Topic 326, Financial Instruments – Credit Losses (“ASC 326”).
Basis for Opinion
These financial statements are the responsibility of the Company’s management. Our responsibility is to express an opinion on the Company’s financial statements based on our audits. We are a public accounting firm registered with the PCAOB and are required to be independent with respect to the Company in accordance with U.S. federal securities laws and the applicable rules and regulations of the Securities and Exchange Commission and the PCAOB.
We conducted our audits in accordance with the standards of the PCAOB. Those standards require that we plan and perform the audits to obtain reasonable assurance about whether the financial statements are free of material misstatement, whether due to error or fraud. Our audits included performing procedures to assess the risks of material misstatement of the financial statements, whether due to error or fraud, and performing procedures that respond to those risks. Such procedures included examining, on a test basis, evidence regarding the amounts and disclosures in the financial statements. Our audits also included evaluating the accounting principles used and significant estimates made by management, as well as evaluating the overall presentation of the financial statements. We believe that our audits provide a reasonable basis for our opinion.
Critical Audit Matter
The critical audit matter communicated below is a matter arising from the current period audit of the financial statements that was communicated or required to be communicated to the audit committee and that: (1) relates to accounts or disclosures that are material to the financial statements and (2) involved our especially challenging, subjective, or complex judgments. The communication of a critical audit matter does not alter in any way our opinion on the financial statements, taken as a whole, and we are not, by communicating the critical audit matter below, providing a separate opinion on the critical audit matter or on the accounts or disclosures to which it relates.
Allowance for Credit Losses – Loans Evaluated on a Collective Basis
As described in Notes 2 and 5 to the financial statements, the Company has recorded an allowance for credit losses (“ACL”) in the amount of $33.6 million as of December 31, 2023, representing management’s estimate of credit losses over the remaining expected life of the Bank’s loan portfolio as of that date. Upon adoption of ASC 326 on January 1, 2023, the Company recorded a cumulative effect adjustment to increase opening retained earnings and decrease the ACL by $4.2 million, net of related deferred income tax effects. Management determined these amounts, and corresponding provision for credit loss expense during the year ended December 31, 2023, pursuant to the application of ASC 326.
The Company’s methodology to determine its ACL incorporates the use of third-party software to arrive at an expected life-of-loan loss amount that incorporates a probability of default approach for commercial and commercial real estate loans and a discounted cash flow approach for residential real estate and consumer loans. Both of these approaches use industry-based loss history and Company specific prepayment rates that are adjusted based on various current and forecasted economic factors including, as relevant, home price indices, treasury yields, national and local unemployment rates and national real disposable income growth rates which incorporate reasonable and supportable forecasts. The results of these calculations are then qualitatively adjusted by management based on portfolio specific attributes including recent growth trends, credit concentrations, personnel changes and other portfolio relevant information. We determined that performing procedures relating to these components of the Company’s methodology is a critical audit matter.
The principal considerations for our determination are (i) the application of significant judgment and estimation on the part of management, which in turn led to a high degree of auditor judgment and subjectivity in performing procedures and evaluating audit evidence obtained, and (ii) significant audit effort was necessary in evaluating management’s methodology, significant assumptions and calculations.
How the Critical Audit Matter was addressed in the Audit
Following are some of the primary procedures we performed to address this critical audit matter. We evaluated the design and tested the operating effectiveness of certain internal controls related to the Company’s measurement of the collective ACL, including controls over the:
Methodologies used to calculate the estimate
External model validation of the third-party model for appropriateness of model usage along with recalculation of model results
Completeness and accuracy of loan data
Evaluation of model assumptions including economic forecasts and loss-given default rates
Development of qualitative adjustments to model results
Addressing the above matters involved performing procedures and evaluating audit evidence in connection with forming our overall opinion on the consolidated financial statements. These procedures also included, among others, reviewing the Bank’s model validation ensuring appropriate recalculation of the models used along with management’s review of model validation results, testing various assumptions used in the calculation, testing management’s process for determining the qualitative reserve component, evaluating the appropriateness of management’s methodology relating to the qualitative reserve component and testing the completeness and accuracy of data utilized by management.
/s/ Wolf & Company, P.C.
Auditor ID: 392
Boston, Massachusetts
March 8, 2024
Report of Independent Registered Public Accounting Firm
To the Stockholders and Board of Directors of BCB Bancorp, Inc.
Opinion on Internal Control Over Financial Reporting
We have audited BCB Bancorp Inc. and subsidiaries’ (the “Company”) internal control over financial reporting as of December 31, 2023, based on criteria established in Internal Control — Integrated Framework issued by the Committee of Sponsoring Organizations of the Treadway Commission (“COSO”) in 2013. In our opinion, the Company maintained, in all material respects, effective internal control over financial reporting as of December 31, 2023, based on criteria established in Internal Control — Integrated Framework (2013) issued by COSO in 2013.
We have also audited, in accordance with the standards of the Public Company Accounting Oversight Board (United States) (“PCAOB”), the December 31, 2023 consolidated financial statements of the Company and our report dated March 8, 2024 expressed an unqualified opinion.
Basis for Opinion
The Company’s management is responsible for maintaining effective internal control over financial reporting and for its assessment of the effectiveness of internal control over financial reporting in the accompanying Management Report. Our responsibility is to express an opinion on the Company’s internal control over financial reporting based on our audit. We are a public accounting firm registered with the PCAOB and are required to be independent with respect to the Company in accordance with U.S. federal securities laws and the applicable rules and regulations of the Securities and Exchange Commission and the PCAOB.
We conducted our audit in accordance with the standards of the PCAOB. Those standards require that we plan and perform the audit to obtain reasonable assurance about whether effective internal control over financial reporting was maintained in all material respects. Our audit included obtaining an understanding of internal control over financial reporting, assessing the risk that a material weakness exists, and testing and evaluating the design and operating effectiveness of internal control based on the assessed risk. Our audit also included performing such other procedures as we considered necessary in the circumstances. We believe that our audit provides a reasonable basis for our opinion.
Definition and Limitations of Internal Control Over Financial Reporting
An entity’s internal control over financial reporting is a process affected by those charged with governance, management, and other personnel, designed to provide reasonable assurance regarding the preparation of reliable financial statements in accordance with accounting principles generally accepted in the United States of America. Because management’s assessment and our audit were conducted to meet the reporting requirements of Section 112 of the Federal Deposit Insurance Corporation Improvement Act (FDICIA), our audit of the Company’s internal control over financial reporting included controls over the preparation of financial statements in accordance with accounting principles generally accepted in the United States of America and with the instructions to the Consolidated Financial Statements for Bank Holding Companies (Form FR Y-9C) and the Federal Financial Institutions Examination Council Instructions for Consolidated Reports of Condition and Income. An entity's internal control over financial reporting includes those policies and procedures that (1) pertain to the maintenance of records that, in reasonable detail, accurately and fairly reflect the transactions and dispositions of the assets of the entity; (2) provide reasonable assurance that transactions are recorded as necessary to permit preparation of financial statements in accordance with accounting principles generally accepted in the United States of America, and that the receipts and expenditures of the entity are being made only in accordance with authorizations of management and those charged with governance; and (3) provide reasonable assurance regarding prevention, or timely detection and correction, of unauthorized acquisition, use, or disposition of the entity's assets that could have a material effect on the financial statements.
Because of its inherent limitations, internal control over financial reporting may not prevent or detect misstatements. Also, projections of any evaluation of effectiveness to future periods are subject to the risk that controls may become inadequate because of changes in conditions, or that the degree of compliance with the policies or procedures may deteriorate.
Other Matter
We were not engaged to, and we have not performed any procedures with respect to management’s assertion regarding compliance with laws and regulations included in the accompanying Management Report. Accordingly, we do not express any opinion, or any other form of assurance, on management’s assertion regarding compliance with laws and regulations.
Restriction on Use
This report is intended solely for the information and use of the Board of Directors and management of the Company and regulatory authorities and is not intended to be, and should not be, used by anyone other than these specified parties.
/s/
Auditor ID:
March 8, 2024
|
|
|
|
|
|
|
|
|
|
|
|
| December 31, | ||||
| 2023 |
| 2022 | ||
| (In Thousands, Except Share and Per Share Data) | ||||
ASSETS |
|
|
|
|
|
Cash and amounts due from depository institutions | $ | |
| $ | |
Interest-earning deposits |
| |
|
| |
Total cash and cash equivalents |
| |
|
| |
|
|
|
|
|
|
Interest-earning time deposits |
| |
|
| |
Debt securities available for sale, at fair value |
| |
|
| |
Equity investments |
| |
|
| |
Loans held for sale |
| |
|
| |
Loans receivable, net of allowance for credit losses of $ |
|
|
|
|
|
$ |
| |
|
| |
Federal Home Loan Bank of New York stock, at cost |
| |
|
| |
Premises and equipment, net |
| |
|
| |
Accrued interest receivable |
| |
|
| |
Other real estate owned |
| - |
|
| |
Deferred income taxes |
| |
|
| |
Goodwill and other intangibles |
| |
|
| |
Operating lease right-of-use assets |
| |
|
| |
Bank-owned life insurance ("BOLI") |
| |
|
| |
Other assets |
| |
|
| |
Total Assets | $ | |
| $ | |
|
|
|
|
|
|
LIABILITIES AND STOCKHOLDERS' EQUITY |
|
|
|
|
|
|
|
|
|
|
|
LIABILITIES |
|
|
|
|
|
Non-interest-bearing deposits | $ | |
| $ | |
Interest bearing deposits |
| |
|
| |
Total deposits |
| |
|
| |
FHLB Advances |
| |
|
| |
Subordinated debentures |
| |
|
| |
Operating lease liability |
| |
|
| |
Other liabilities |
| |
|
| |
Total Liabilities |
| |
|
| |
|
|
|
|
|
|
STOCKHOLDERS' EQUITY |
|
|
|
|
|
Preferred stock: $ |
|
|
|
|
|
Additional paid-in capital preferred stock |
| |
|
| |
Common stock: |
|
|
|
|
|
Additional paid-in capital common stock |
| |
|
| |
Retained earnings |
| |
|
| |
Accumulated other comprehensive loss |
| ( |
|
| ( |
Treasury stock, at cost, |
| ( |
|
| ( |
Total Stockholders' Equity |
| |
|
| |
|
|
|
|
|
|
Total Liabilities and Stockholders' Equity | $ | |
| $ | |
See accompanying notes to consolidated financial statements.
|
|
|
|
|
|
|
|
|
|
|
|
|
|
|
|
|
|
|
|
|
|
| Years Ended December 31, | |||||||||
|
| 2023 |
|
|
| 2022 |
|
|
| 2021 |
| (In Thousands, Except for Per Share Data) | |||||||||
Interest and dividend income: |
|
|
|
|
|
|
|
|
|
|
Loans, including fees | $ | |
|
| $ | |
|
| $ | |
Mortgage-backed securities |
| |
|
|
| |
|
|
| |
Other investment securities |
| |
|
|
| |
|
|
| |
FHLB stock dividends and other interest-earning assets |
| |
|
|
| |
|
|
| |
Total interest and dividend income |
| |
|
|
| |
|
|
| |
Interest expense: |
|
|
|
|
|
|
|
|
|
|
Deposits: |
|
|
|
|
|
|
|
|
|
|
Demand |
| |
|
|
| |
|
|
| |
Savings and club |
| |
|
|
| |
|
|
| |
Certificates of deposit |
| |
|
|
| |
|
|
| |
|
| |
|
|
| |
|
|
| |
Borrowings |
| |
|
|
| |
|
|
| |
Total interest expense |
| |
|
|
| |
|
|
| |
Net interest income |
| |
|
|
| |
|
|
| |
Provision (benefit) for credit losses |
| |
|
|
| ( |
|
|
| |
Net interest income after provision (benefit) for credit losses |
| |
|
|
| |
|
|
| |
Non-interest income: |
|
|
|
|
|
|
|
|
|
|
Fees and service charges |
| |
|
|
| |
|
|
| |
BOLI income |
| |
|
|
| |
|
|
| |
Gain on sales of loans |
| |
|
|
| |
|
|
| |
(Loss) gain on sale of impaired loans held in portfolio |
| - |
|
|
| - |
|
|
| ( |
Gain on sales of other real estate owned |
| |
|
|
| - |
|
|
| |
Gain on sale of premises |
| - |
|
|
| - |
|
|
| |
Realized and unrealized (loss) gain on equity investments |
| ( |
|
|
| ( |
|
|
| |
Other |
| |
|
|
| |
|
|
| |
Total non-interest income |
| |
|
|
| |
|
|
| |
Non-interest expense: |
|
|
|
|
|
|
|
|
|
|
Salaries and employee benefits |
| |
|
|
| |
|
|
| |
Occupancy and equipment |
| |
|
|
| |
|
|
| |
Data processing service fees |
| |
|
|
| |
|
|
| |
Professional fees |
| |
|
|
| |
|
|
| |
Director fees |
| |
|
|
| |
|
|
| |
Regulatory assessments |
| |
|
|
| |
|
|
| |
Advertising and promotional |
| |
|
|
| |
|
|
| |
Other real estate owned, net |
| |
|
|
| |
|
|
| |
Loss from extinguishment of debt |
| - |
|
|
| - |
|
|
| |
Other |
| |
|
|
| |
|
|
| |
Total non-interest expense |
| |
|
|
| |
|
|
| |
Income before income tax provision |
| |
|
|
| |
|
|
| |
Income tax provision |
| |
|
|
| |
|
|
| |
Net Income | $ | |
|
| $ | |
|
| $ | |
Preferred stock dividends |
| |
|
|
| |
|
|
| |
Net Income available to common stockholders | $ | |
|
| $ | |
|
| $ | |
Net Income per common share-basic and diluted |
|
|
|
|
|
|
|
|
|
|
Basic | $ | |
|
| $ | |
|
| $ | |
Diluted | $ | |
|
| $ | |
|
| $ | |
Weighted average number of common shares outstanding |
|
|
|
|
|
|
|
|
|
|
Basic |
| |
|
|
| |
|
|
| |
Diluted |
| |
|
|
| |
|
|
| |
See accompanying notes to consolidated financial statements.
|
|
|
|
|
|
|
|
|
|
|
|
|
|
|
|
|
|
| Years Ended December 31, | |||||||
| 2023 |
| 2022 |
| 2021 | |||
| (In Thousands) | |||||||
Net Income | $ | |
| $ | |
| $ | |
Other comprehensive income (loss), net of tax: |
|
|
|
|
|
|
|
|
Unrealized losses on available-for-sale securities: |
|
|
|
|
|
|
|
|
Unrealized holding losses arising during the period |
| ( |
|
| ( |
|
| ( |
Reclassification adjustment for gains realized in income |
|
|
|
|
|
|
|
|
Net unrealized losses |
| ( |
|
| ( |
|
| ( |
Tax effects |
| |
|
| |
|
| |
Net-of-tax amount |
| ( |
|
| ( |
|
| ( |
Benefit Plans: |
|
|
|
|
|
|
|
|
Actuarial gain |
| |
|
| |
|
| |
Income tax benefit (expense) |
| |
|
| ( |
|
| ( |
Net-of-tax amount |
| |
|
| |
|
| |
Total other comprehensive (loss) income |
| ( |
|
| ( |
|
| |
Comprehensive income | $ | |
| $ | |
| $ | |
See accompanying notes to consolidated financial statements.
BCB Bancorp, Inc. and Subsidiaries
Consolidated Statements of Changes in Stockholders’ Equity
|
|
|
|
|
|
|
|
|
|
|
|
|
|
|
|
|
|
|
|
|
| Preferred |
| Common |
|
| Additional |
| Retained |
|
| Treasury |
| Accumulated Other |
| Total | |||||
| (In Thousands, Except Per Share Data) | |||||||||||||||||||
Balance at December 31, 2020 | $ | - |
| $ | - |
| $ | |
| $ | |
| $ | ( |
| $ | ( |
| $ | |
|
|
|
|
|
|
|
|
|
|
|
|
|
|
|
|
|
|
|
|
|
Net income |
| - |
|
| - |
|
| - |
|
| |
|
| - |
|
| - |
|
| |
Other comprehensive income |
| - |
|
| - |
|
| - |
|
| - |
|
| - |
|
| |
|
| |
Redemption of Series C and F Preferred Stock |
| - |
|
| - |
|
| - |
|
| - |
|
| - |
|
| - |
|
| - |
Issuance of Series I Preferred Stock |
| - |
|
| - |
|
| |
|
| - |
|
| - |
|
| - |
|
| |
Exercise of Stock Options ( |
| - |
|
| - |
|
| |
|
| - |
|
| - |
|
| - |
|
| |
Stock-based compensation expense |
| - |
|
| - |
|
| |
|
| - |
|
| - |
|
| - |
|
| |
Dividends payable on Series D |
| - |
|
| - |
|
| - |
|
| ( |
|
| - |
|
| - |
|
| ( |
Cash dividends on common stock ($ |
| - |
|
| - |
|
| - |
|
| ( |
|
| - |
|
| - |
|
| ( |
Dividend Reinvestment Plan |
| - |
|
| - |
|
| |
|
| ( |
|
| - |
|
| - |
|
| - |
Stock Purchase Plan |
| - |
|
| - |
|
| |
|
| - |
|
| - |
|
| - |
|
| |
Treasury Stock Purchases ( |
| - |
|
| - |
|
| - |
|
| - |
|
| ( |
|
| - |
|
| ( |
Balance at December 31, 2021 | $ | - |
| $ | - |
| $ | |
| $ | |
| $ | ( |
| $ | |
| $ | |
|
|
|
|
|
|
|
|
|
|
|
|
|
|
|
|
|
|
|
|
|
Net income |
| - |
|
| - |
|
| - |
|
| |
|
| - |
|
| - |
|
| |
Other comprehensive income |
| - |
|
| - |
|
| - |
|
| - |
|
| - |
|
| ( |
|
| ( |
Redemption of Series D and G Preferred Stock |
| - |
|
| - |
|
| ( |
|
| - |
|
| - |
|
| - |
|
| ( |
Issuance of Series I Preferred Stock |
| - |
|
| - |
|
| |
|
| - |
|
| - |
|
| - |
|
| |
Exercise of Stock Options ( |
| - |
|
| - |
|
| |
|
| - |
|
| - |
|
| - |
|
| |
Stock-based compensation expense |
| - |
|
| - |
|
| |
|
| - |
|
| - |
|
| - |
|
| |
Dividends payable on Series D |
| - |
|
| - |
|
| - |
|
| ( |
|
| - |
|
| - |
|
| ( |
Cash dividends on common stock ($ |
| - |
|
| - |
|
| - |
|
| ( |
|
| - |
|
| - |
|
| ( |
Dividend Reinvestment Plan |
| - |
|
| - |
|
| |
|
| ( |
|
| - |
|
| - |
|
| - |
Stock Purchase Plan |
| - |
|
| - |
|
| |
|
| - |
|
| - |
|
| - |
|
| |
Treasury Stock Purchases ( |
| - |
|
| - |
|
| - |
|
| - |
|
| ( |
|
| - |
|
| ( |
Balance at December 31, 2022 | $ | - |
| $ | - |
| $ | |
| $ |
| $ | ( |
| $ | ( |
| $ | | |
|
|
|
|
|
|
|
|
|
|
|
|
|
|
|
|
|
|
|
|
|
Effect of adopting ASU No. 2016-13 ("CECL") |
| - |
|
| - |
|
| - |
|
| |
|
| - |
|
| - |
|
| |
Beginning Balance at January 1, 2023 |
| - |
|
| - |
|
| |
|
|
|
| ( |
|
| ( |
|
| | |
Net income |
| - |
|
| - |
|
| - |
|
| |
|
| - |
|
| - |
|
| |
Other comprehensive income |
| - |
|
| - |
|
| - |
|
| - |
|
| - |
|
| ( |
|
| ( |
Redemption of Series H Preferred Stock |
| - |
|
| - |
|
| ( |
|
| - |
|
| - |
|
| - |
|
| ( |
Issuance of Series J Preferred Stock |
| - |
|
| - |
|
| |
|
|
|
|
| - |
|
| - |
|
| |
Exercise of Stock Options ( |
| - |
|
| - |
|
| |
|
| - |
|
| - |
|
| - |
|
| |
Stock-based compensation expense |
| - |
|
| - |
|
| |
|
| - |
|
| - |
|
| - |
|
| |
Dividends payable on Series H |
| - |
|
| - |
|
| - |
|
| ( |
|
| - |
|
| - |
|
| ( |
Cash dividends on common stock ($ |
| - |
|
| - |
|
| - |
|
| ( |
|
| - |
|
| - |
|
| ( |
Dividend Reinvestment Plan |
| - |
|
| - |
|
| |
|
| ( |
|
| - |
|
| - |
|
| - |
Stock Purchase Plan |
| - |
|
| - |
|
| |
|
| - |
|
| - |
|
| - |
|
| |
Treasury Stock Purchases ( |
| - |
|
| - |
|
| - |
|
| - |
|
| ( |
|
| - |
|
| ( |
Ending balance at December 31, 2023 | $ | - |
| $ | - |
| $ | |
| $ |
| $ | ( |
| $ | ( |
| $ | | |
See accompanying notes to consolidated financial statements.
|
|
|
|
|
|
|
|
|
|
|
|
|
|
|
|
|
|
|
|
|
| Years Ended December 31, | |||||||
|
| 2023 |
| 2022 |
| 2021 | |||
Cash flows from Operating Activities: |
| (In Thousands) | |||||||
Net income |
| $ | |
| $ | |
| $ | |
Adjustments to reconcile net income to net cash provided by operating activities: |
|
|
|
|
|
|
|
|
|
Depreciation of premises and equipment |
|
| |
|
| |
|
| |
Amortization and accretion, net |
|
| ( |
|
| ( |
|
| ( |
Provision (benefit) for credit losses |
|
| |
|
| ( |
|
| |
Deferred income tax benefit |
|
| ( |
|
| ( |
|
| ( |
Loans originated for sale |
|
| ( |
|
| ( |
|
| ( |
Proceeds from sale of loans |
|
| |
|
| |
|
| |
Gains on sales of loans |
|
| ( |
|
| ( |
|
| ( |
Fair value adjustment of OREO |
|
| - |
|
| - |
|
| |
Gain on sales of premises |
|
| - |
|
| - |
|
| ( |
Realized and unrealized loss (gain) on equity investments |
|
| |
|
| |
|
| ( |
(Gain) loss from sales of other real estate owned |
|
| ( |
|
| - |
|
| ( |
Loss (gain) on sale of impaired loans |
|
| - |
|
| - |
|
| |
Increase in cash surrender value of BOLI |
|
| ( |
|
| ( |
|
| ( |
Stock-based compensation expense |
|
| |
|
| |
|
| |
Net change in accrued interest receivable |
|
| ( |
|
| ( |
|
| |
Net change in other assets |
|
| ( |
|
| ( |
|
| |
Net change in accrued interest payable |
|
| |
|
| |
|
| ( |
Net change in other liabilities |
|
| |
|
| ( |
|
| |
Net Cash Provided by Operating Activities |
|
| |
|
| |
|
| |
Cash flows from Investing Activities: |
|
|
|
|
|
|
|
|
|
Proceeds from repayments, calls, and maturities on securities |
|
| |
|
| |
|
| |
Purchases of securities |
|
| ( |
|
| ( |
|
| ( |
Proceeds from sales of securities |
|
| |
|
| |
|
| - |
Proceeds from sales of premises |
|
| - |
|
| - |
|
| |
Purchase of BOLI |
|
| - |
|
| - |
|
| ( |
Proceeds from BOLI |
|
| - |
|
| |
|
| - |
Proceeds from sales of other real estate owned |
|
| |
|
| - |
|
| |
Proceeds from bulk sale of impaired loans held in portfolio |
|
| - |
|
| - |
|
| |
Net increase in loans receivable |
|
| ( |
|
| ( |
|
| ( |
Additions to premises and equipment |
|
| ( |
|
| ( |
|
| ( |
(Purchase) sale of Federal Home Loan Bank of New York stock |
|
| ( |
|
| ( |
|
| |
Net Cash Used In Investing Activities |
|
| ( |
|
| ( |
|
| ( |
Cash flows from Financing Activities: |
|
|
|
|
|
|
|
|
|
Net increase in deposits |
|
| |
|
| |
|
| |
Proceeds from Federal Home Loan Bank of New York Long Term Advances |
|
| |
|
| |
|
| |
Repayments Federal Home Loan Bank of New York Long Term Advances |
|
| ( |
|
| - |
|
| ( |
Net change in Federal Home Loan Bank of New York Short Term Advances |
|
| ( |
|
| |
|
| - |
Purchase of treasury stock |
|
| ( |
|
| ( |
|
| ( |
Cash dividends paid on common stock |
|
| ( |
|
| ( |
|
| ( |
Cash dividends paid on preferred stock |
|
| ( |
|
| ( |
|
| ( |
Net proceeds from issuance of common stock |
|
| |
|
| |
|
| |
Net proceeds from issuance of preferred stock |
|
| |
|
| |
|
| |
Payments for redemption of preferred stock |
|
| ( |
|
| ( |
|
| - |
Exercise of stock options |
|
| |
|
| |
|
| |
Net Cash Provided by (Used In) Financing Activities |
|
| |
|
| |
|
| |
Net Increase (Decrease) in Cash and Cash Equivalents |
|
| |
|
| ( |
|
| |
Cash and Cash Equivalents-Beginning |
|
| |
|
| |
|
| |
Cash and Cash Equivalents-Ending |
| $ | |
| $ | |
| $ | |
|
|
|
|
|
|
|
|
|
|
|
|
|
|
|
|
|
|
| Years Ended December 31, | |||||||
| 2023 |
| 2022 |
| 2021 | |||
| (In Thousands) | |||||||
Supplementary Cash Flow Information |
|
|
|
|
|
|
|
|
Cash paid during the year for: |
|
|
|
|
|
|
|
|
Income taxes | $ | |
| $ | |
| $ | |
Interest | $ | |
| $ | |
| $ | |
Non-cash items: |
|
|
|
|
|
|
|
|
Transfer of loans to other real estate owned | $ | - |
| $ | - |
| $ | |
|
|
|
|
|
|
|
|
|
See accompanying notes to consolidated financial statements.
BCB Bancorp, Inc. (the “Company”) is incorporated in the State of New Jersey and is a bank holding company. The common stock of the Company is listed on the NASDAQ Global Market and trades under the symbol “BCBP”.
The Company’s primary business is the ownership and operation of BCB Community Bank (the “Bank”). The Bank is a New Jersey based commercial bank which, as of December 31, 2023, operated at
The consolidated financial statements which include the accounts of the Company and its wholly-owned subsidiaries, the Bank, the New Jersey Investment Company, BCB Capital Finance Group LLC, and Special Asset REO 2, LLC have been prepared in conformity with U.S. generally accepted accounting principles (“GAAP”). All significant intercompany accounts and transactions have been eliminated in consolidation.
In preparing the consolidated financial statements, management is required to make estimates and assumptions that affect the reported amounts of assets and liabilities, disclosure of contingent assets and liabilities at the date of the consolidated financial statements and the reported amounts of revenues and expenses for the years then ended. Material estimates that are particularly susceptible to significant change relate to the determination of the allowance for credit losses and a determination as to possible impairment of goodwill. Management believes that the allowance for credit losses is adequate. While management uses available information to recognize losses on loans, future additions to the allowance for credit losses may be necessary based on changes in economic conditions in the market area. Management’s assessment regarding impairment of securities is based on future projections of cash flow which are subject to change. Management performed a quantitative assessment of goodwill and determined there was
In addition, various regulatory agencies, as an integral part of their examination process, periodically review the Bank’s allowance for credit losses. Such agencies may require the Bank to recognize additions to the allowance based on their judgments about information available to them at the time of their examination.
In preparing these consolidated financial statements, the Company evaluated the events that occurred between December 31, 2023 and the date these consolidated financial statements were issued.
Note 2 - Summary of Significant Accounting Policies (continued)
Investments in debt securities that the Bank has the positive intent and ability to hold to maturity are classified as held-to-maturity securities and reported at amortized cost. Debt securities that are bought and held principally for the purpose of selling them in the near-term are classified as trading securities and reported at fair value, with unrealized holding gains and losses included in earnings. Debt securities not classified as trading securities or as held-to-maturity securities are classified as available-for-sale securities (“AFS”) and reported at fair value, with unrealized holding gains or losses, net of applicable deferred income taxes, reported in the accumulated other comprehensive income (loss) component of stockholders’ equity. Gains and losses on the sale of securities are recorded on the trade date and are determined using the specific identification method. There were
For debt securities in an unrealized loss position, the Company first assesses whether it intends to sell, or it is more than likely than not that it will be required to sell the security before recovery of its amortized cost basis. If either of the criteria regarding intent or requirement to sell is met, the security’s amortized cost basis is written down to fair value through income. For securities available-for-sale that do not meet the above criteria, the Company evaluates whether the decline in fair value has resulted from credit losses or other factors. In making this assessment, the Company considers the extent to which fair value is less than amortized cost and adverse conditions related to the security, among other factors. If this assessment indicates that a credit loss exists, the present value of cash flows expected to be collected from the security are compared to the amortized cost basis of the security. If the present value of the cash flows expected to be collected is less than the amortized cost basis, a credit loss exists and an allowance for credit losses is recorded for the credit loss, limited by the amount that the fair value is less than the amortized cost. Any impairment that has not been recorded through an allowance for credit losses is recognized in other comprehensive income, net of tax. The Company elected the practical expedient of zero loss estimates for securities issued by U.S. government entities and agencies. These securities are either explicitly or implicitly guaranteed by the U.S. government, are highly rate by major agencies and have a long history of no credit losses.
Discounts on securities are amortized/accreted to maturity using the interest method. Premiums on securities are amortized to maturity or the earliest call date for callable securities using the interest method. Interest and dividend income on securities, which includes amortization of premiums and accretion of discounts, are recognized in the consolidated financial statements when earned.
Loans held for sale consist primarily of residential mortgage loans intended for sale and are carried at the lower of cost or estimated fair market value using the aggregate method. These loans are generally sold with servicing rights released. Gains and losses recognized on loan sales are based upon the cash proceeds received and the cost of the related loans sold.
Loans receivable are stated at unpaid principal balances, less net deferred loan origination fees and the allowance for credit losses. Loan origination fees and certain direct loan origination costs are deferred and amortized/accreted, as an adjustment of yield, over the contractual lives of the related loans.
Generally, the accrual of interest on loans that are contractually delinquent more than ninety days is discontinued and the related loans are placed on nonaccrual status. All payments received while in nonaccrual status, are applied to principal until the loan has performed as expected for a minimum of six (6) months or until the loan is determined to qualify for return to normal accruing status. Loans may be returned to accrual status when all the principal and interest contractually due are brought current and future payments are reasonably assured.
Financial instruments which potentially subject the Company and its subsidiaries to concentrations of credit risk consist of cash and cash equivalents, investment and mortgage-backed securities and loans.
Note 2 - Summary of Significant Accounting Policies (continued)
The allowance for credit losses represents the estimated amount considered necessary to cover lifetime expected credit losses inherent in financial assets at the balance sheet date. The measurement of expected credit losses is applicable to loans receivable and securities measured at amortized cost. It also applies to off-balance sheet credit exposures such as loan commitments and unused lines of credit. The allowance is established through a provision for credit losses that is charged against income. The methodology for determining the allowance for credit losses is considered a critical accounting policy by management because of the high degree of judgment involved, the subjectivity of the assumptions used, and the potential for changes in the forecasted economic environment that could result in changes to the amount of the recorded allowance for credit losses. The allowance for credit losses is reported separately as a contra-asset on the consolidated statement of financial condition. The expected credit loss for unfunded lending commitments and unfunded loan commitments is reported on the consolidated statement of financial condition in other liabilities while the provision for credit losses related to unfunded commitments is reported in other non-interest expense.
Allowance for Credit Losses on Loans Receivable
The allowance for credit losses on loans is deducted from the amortized cost basis of the loan to present the net amount expected to be collected. Expected losses are evaluated and calculated on a collective, or pooled, basis for those loans which share similar risk characteristics. If the loan does not share risk characteristics with other loans, the Company will evaluate the loan on an individual basis. Individually evaluated loans are primarily non-accrual and collateral dependent loans. Furthermore, the Company evaluates the pooling methodology at least annually to ensure that loans with similar risk characteristics are pooled appropriately. Loans are charged off against the allowance for credit losses when the Company believes the balances to be uncollectible. Expected recoveries do not exceed the aggregate of amounts previously charged off or expected to be charged off.
The Company has chosen to segment its portfolio consistent with the manner in which it manages credit risk. The Company calculates estimated credit losses for these loan segments using quantitative models and qualitative factors. Further information on loan segmentation and the credit loss estimation is included in Note 5 – Loan Receivables and Allowance for Credit Losses.
Individually Evaluated Loans
On a case-by-case basis, the Company may conclude that a loan should be evaluated on an individual basis based on its disparate risk characteristics. When the Company determines that a loan no longer shares similar risk characteristics with other loans in the portfolio, the allowance will be determined on an individual basis using the present value of expected cash flows or, for collateral-dependent loans, the fair value of the collateral as of the reporting date, less estimated selling costs, as applicable. If the fair value of the collateral is less than the amortized cost basis of the loan, the Company will charge off the difference between the fair value of the collateral, less costs to sell at the reporting date and the amortized cost basis of the loan.
Allowance for Credit Losses on Off-Balance Sheet Commitments
The Company is required to include unfunded commitments that are expected to be funded in the future within the allowance calculation, other than those that are unconditionally cancelable. To arrive at that reserve, the reserve percentage for each applicable segment is applied to the unused portion of the expected commitment balance and is multiplied by the expected funding rate. As noted above, the allowance for credit losses on unfunded loan commitments is included in other liabilities on the consolidated statement of financial condition and the related credit expense is recorded in other non-interest expense in the consolidated statements of operations.
Allowance for Credit Losses on Available-for-Sale Securities
For available-for-sale securities in an unrealized loss position, the Company first assesses whether it intends to sell, or it is more than likely than not that it will be required to sell the security before recovery of its amortized cost basis. If either of the criteria regarding intent or requirement to sell is met, the security’s amortized cost basis is written down to fair value through income. For securities available-for-sale that do not meet the above criteria, the Company evaluates whether the decline in fair value has resulted from credit losses or other factors. In making this assessment, the Company considers the extent to which fair value is less than amortized cost and adverse conditions related to the security, among other factors. If this assessment indicates that a credit loss exists, the present value of cash flows expected to be collected from the security are compared to the amortized cost basis of the security. If the present value of the cash flows expected to be collected is less than the amortized cost basis, a credit loss exists and an allowance for credit losses is recorded for the credit loss, limited by the amount that the fair value is less than the amortized cost. Any impairment that has not been recorded through an allowance for credit losses is recognized in other comprehensive income, net of tax. The Company elected the practical expedient of zero loss estimates for securities issued by U.S. government entities and agencies. These securities are either explicitly or implicitly guaranteed by the U.S. government, are highly rate by major agencies and have a long history of no credit losses.
Accrued Interest Receivable
The Company made an accounting policy election to exclude accrued interest receivable from the amortized cost basis of loans and available-for-sale securities. Accrued interest receivable on loans and securities is reported as a component of accrued interest receivable on the consolidated statement of financial condition.
Changes in the allowance for credit losses are recorded as provision for, or reversal of, credit loss expense. Losses are charged against the allowance when management believes the uncollectibility of an available-for-sale security is confirmed or when either of the criteria regarding intent or requirement to sell is met.
Premises and Equipment
Land is carried at cost. Buildings, building improvements, leasehold improvements and furniture, fixtures and equipment are carried at cost less accumulated depreciation and amortization. Significant renovations and additions are charged to the property and equipment account. Maintenance and repairs are charged to expense in the period incurred. Depreciation charges are computed on the straight-line method over the following estimated useful lives of each type of asset.
|
|
|
|
|
|
| Years |
| Buildings |
| |
| Building improvements |
| |
| Furniture, fixtures and equipment |
| |
| Leasehold improvements |
|
Note 2 - Summary of Significant Accounting Policies (continued)
Federal law requires a member institution of the FHLB system to purchase and hold restricted stock of its district FHLB according to a predetermined formula. Such stock is carried at cost. The Company reviews for impairment based on the ultimate recoverability of the cost basis of the stock.
Assets acquired through, or in lieu of, loan foreclosures are held for sale and are initially recorded at fair value less cost to sell at the date of foreclosure, establishing a new cost basis. Subsequent to foreclosure, valuations are periodically performed by management and the assets are carried at the lower of carrying amount or fair value less cost to sell. Costs relating to development and improvement of property are capitalized, whereas costs relating to the holding of property are expensed. At December 31, 2023 the Bank owned
The Bank is principally engaged in the business of attracting deposits from the general public and using these deposits, together with other funds, to make loans primarily secured by real estate and to purchase securities. The potential for interest-rate risk exists as a result of the difference in duration of the Bank’s interest-sensitive liabilities compared to its interest-sensitive assets. For this reason, management regularly monitors the maturity structure of the Bank’s interest-earning assets and interest-bearing liabilities in order to measure its level of interest-rate risk and to plan for future volatility.
ASC Topic 820, Fair Value Measurements and Disclosures, establishes a fair value hierarchy that prioritizes the inputs to valuation methods used to measure fair value. The hierarchy gives the highest priority to unadjusted quoted prices in active markets for identical assets or liabilities (Level 1 measurements) and the lowest priority to unobservable inputs (Level 3 measurements). The three levels of the fair value hierarchy are as follows:
Level 1: Unadjusted quoted prices in active markets that are accessible at the measurement date for identical, unrestricted assets or liabilities.
Level 2: Quoted prices in markets that are not active, or inputs that are observable either directly or indirectly, for substantially the full term of the asset or liability.
Level 3: Prices or valuation techniques that require inputs that are both significant to the fair value measurement and unobservable (i.e., supported with little or no market activity).
An asset’s or liability’s level within the fair value hierarchy is based on the lowest level of input that is significant to the fair value measurement.
The Company recognizes as separate assets the rights to service mortgage loans. The right to service loans for others is generally obtained through the sale of loans with servicing retained. The initial asset recognized for originated mortgage servicing rights (“MSR”) is measured at fair value. The estimated fair value of MSR is obtained through independent third-party valuations through an analysis of future cash flows, incorporating assumptions market participants would use in determining fair value including market discount rates, prepayment speeds, servicing income, servicing costs, default rates and other market driven data, including the market’s perception of future interest rate movements. MSR are amortized in proportion to and over the period of estimated net servicing income. We apply the amortization method for measurements of our MSR. MSR are assessed for impairment based on fair value at each reporting date. MSR impairment, if any, is recognized in a valuation allowance through charges to earnings as a component of fees and service charges. Subsequent increases in the fair value of impaired MSR are recognized only up to the amount of the previously recognized valuation allowance. Fees earned for servicing loans are reported as income when the related mortgage loan payments are collected.
Transfers of financial assets are accounted for as sales, when control over the assets has been surrendered. Control over transferred assets is deemed to be surrendered when (1) the assets have been isolated from the Company, (2) the transferee obtains the right (free of conditions that constrain it from taking advantage of that right) to pledge or exchange the transferred assets, and (3) the Company does not maintain effective control over the transferred assets through an agreement to repurchase them before their maturity.
Bank-Owned Life Insurance policies are reflected on the consolidated statements of financial condition at cash surrender value. Changes in the net cash surrender value of the policies, as well as insurance proceeds received in excess of carrying value, are reflected in non-interest income on the consolidated statements of operations and are not subject to income taxes.
Goodwill resulting from a business combination is generally determined as the excess of the fair value of the consideration transferred over the fair value of the net assets acquired as of the acquisition date. Goodwill acquired in a business combination and determined to have an indefinite useful life is not amortized, but tested for impairment at least annually. The Company has selected October 31 as the date to perform the annual goodwill impairment test.
The Company and its subsidiaries file a consolidated federal income tax return. Income taxes are allocated to the Company and its subsidiaries based upon their respective income or loss included in the consolidated income tax return. Separate state income tax returns are filed by the Company and its subsidiaries.
Note 2 – Summary of Significant Accounting Policies (continued)
Federal and state income tax expense has been provided on the basis of reported income. The amounts reflected on the tax returns differ from these provisions due principally to temporary differences in the reporting of certain items for financial reporting and income tax reporting purposes. The tax effect of these temporary differences is accounted for as deferred taxes applicable to future periods. Deferred income tax expense or (benefit) is determined by recognizing deferred tax assets and liabilities for the estimated future tax consequences attributable to differences between the financial statement carrying amounts of existing assets and liabilities and their respective tax bases. Deferred tax assets and liabilities are measured using enacted tax rates expected to apply to taxable income in the years in which those temporary differences are expected to be recovered or settled. The effect on deferred tax assets and liabilities of a change in tax rates is recognized in earnings in the period that includes the enactment date. The realization of deferred tax assets is assessed and a valuation allowance provided, when necessary, for that portion of the asset which is not more likely than not to be realized.
The Company accounts for uncertainty in income taxes recognized in the consolidated financial statements in accordance with ASC Topic 740, Income Taxes, which prescribes a recognition threshold and measurement attribute for the financial statement recognition and measurement of a tax position taken or expected to be taken in a tax return, and also provides guidance on derecognition, classification, interest and penalties, accounting in interim periods, disclosure and transition. A tax position is recognized as a benefit only if it is “more likely than not” that the tax position would be sustained in a tax examination, with a tax examination being presumed to occur. The amount recognized is the largest amount of tax benefit that has a likelihood of being realized on examination of more than 50 percent. For tax positions not meeting the “more likely than not” test, no tax benefit is recorded. Under the “more likely than not” threshold guidelines, the Company believes no significant uncertain tax positions exist, either individually or in the aggregate, that would give rise to the non-recognition of an existing tax benefit. The Company recognizes interest and penalties on unrecognized tax benefits in income taxes expense in the consolidated statement of operations. The Company did not recognize any interest and penalties for the years ended December 31, 2023, 2022, or 2021. The tax years subject to examination by the Federal taxing authority are the years ended December 31, 2022, 2021, and 2020. The tax years subject to examination by the State taxing authorities are the years ended December 31, 2022, 2021, and 2020. In 2022, the Company received notice that it had been selected for audit by the State of New Jersey for the years ending December 31, 2020, 2019, and 2018. The audit was completed in 2022 and resulted in a nominal audit adjustment. In 2022, the Company received notice that it had been selected for an audit by the City of New York for the years ending December 31, 2020, 2019, 2018, and 2017. The audit was completed in 2022 and resulted in a nominal audit adjustment.
Basic net income per common share is computed by dividing net income less dividends on preferred stock by the weighted average number of shares of common stock outstanding. The diluted net income per common share is computed by adjusting the weighted average number of shares of common stock outstanding to include the effects of outstanding stock options, if dilutive, using the treasury stock method. Dilution is not applicable in periods of net loss. For the years ended December 31, 2023 and 2022, the difference in the weighted average number of basic and diluted common shares was due solely to the effects of outstanding stock options. No adjustments to net income were necessary in calculating basic and diluted net income per share. For the year ended December 31, 2023, the Company had
|
|
|
|
|
|
|
|
|
|
|
|
|
|
|
|
|
|
|
|
|
|
|
|
|
|
|
|
|
|
|
|
|
|
|
|
|
|
|
|
|
|
| For the Year Ended December 31, | |||||||||||||||||||
| 2023 |
| 2022 |
| 2021 | |||||||||||||||
|
| Net Income |
| Shares |
| Per Share |
|
| Net Income |
| Shares |
| Per Share |
|
| Net Income |
| Shares |
| Per Share |
|
| (Numerator) |
| (Denominator) |
| Amount |
|
| (Numerator) |
| (Denominator) |
| Amount |
|
| (Numerator) |
| (Denominator) |
| Amount |
| (In Thousands, Except per share data) | |||||||||||||||||||
Net income | $ |
|
|
|
|
| $ |
|
|
|
|
| $ |
|
|
|
| |||
Basic earnings per share- |
|
|
|
|
|
|
|
|
|
|
|
|
|
|
|
|
|
|
|
|
Income available to |
|
|
|
|
|
|
|
|
|
|
|
|
|
|
|
|
|
|
|
|
Common stockholders | $ |
| $ |
| $ |
| $ |
| $ |
| $ | |||||||||
Effect of dilutive securities: |
|
|
|
|
|
|
|
|
|
|
|
|
|
|
|
|
|
|
|
|
Stock options |
|
|
|
|
|
|
|
|
|
|
|
|
|
|
|
|
| |||
Diluted earnings per share- |
|
|
|
|
|
|
|
|
|
|
|
|
|
|
|
|
|
|
|
|
Income available to |
|
|
|
|
|
|
|
|
|
|
|
|
|
|
|
|
|
|
|
|
Common stockholders | $ |
| $ |
| $ |
| $ |
| $ |
| $ | |||||||||
The Company, under plans approved by its stockholders in 2018 and 2011, has granted stock options to employees and outside directors. See Note 12 for additional information as to option grants. Compensation expense recognized for option grants is net of estimated forfeitures and is recognized over the awards’ respective requisite service periods. The fair values relating to options granted are estimated using a Black-Scholes option pricing model. Expected volatilities are based on historical volatility of the Company’s stock and other factors, such as implied market volatility using the respective options’ expected term. The Company used the mid-point of the original vesting period and original option life to estimate the options’ expected term, which represents the period of time that the options granted are expected to be outstanding. The risk-free rate for periods within the contractual life of the option is based on the U.S. Treasury yield curve in effect at the time of grant. The Company recognizes compensation expense for the fair values of option awards, which have graded vesting, on a straight-line basis.
The Company acquired, through the merger with Pamrapo Bancorp, Inc., a non-contributory defined benefit pension plan covering all eligible employees of Pamrapo Savings Bank. Effective January 1, 2010, the defined benefit pension plan (the “Pension Plan”), was frozen by Pamrapo Savings Bank. All benefits for eligible participants accrued in the Pension Plan to January 1, 2010 have been retained. The benefits are based on years of service and employee’s compensation. The Pension Plan is funded in conformity with funding requirements of applicable government regulations. Prior service costs for the Pension Plan generally are amortized over the estimated remaining service periods of employees.
Note 2 – Summary of Significant Accounting Policies (continued)
The Bank entered into a Supplemental Executive Retirement Agreement (the “SERP Agreement”) with its Chief Executive Officer (“the CEO”) in December 2021. Upon the CEO’s retirement, the Bank will provide for a monthly retirement payment for his lifetime. The SERP Agreement provides that a retirement benefit is payable upon his attaining age sixty-five (
The Company records unrealized gains and losses, net of deferred income taxes, on securities available-for-sale in accumulated other comprehensive income (loss). Realized gains and losses, if any, are reclassified to non-interest income upon sale of the related securities or upon the recognition of an impairment loss. Accumulated other comprehensive income (loss) also includes benefit plan amounts recognized in accordance with ASC 715, Compensation-Retirement Benefits, which reflect, net of tax, the unrecognized actuarial gains (losses) on the benefit plans.
In March 2022, the Financial Accounting Standards Board (“FASB”) issued Accounting Standards Update (“ASU”) 2022-02, Financial Instruments—Credit Losses (Topic 326): Troubled Debt Restructurings and Vintage Disclosures. The amendments in this update eliminate the existing accounting guidance for troubled debt restructures ("TDRs") by creditors in Subtopic 310-40, Receivables - Troubled Debt Restructurings by Creditors and instead requires that an entity evaluate whether a modification represents a new loan or a continuation of an existing loan. The amendments also enhance disclosure requirements for certain loan refinancing and restructuring by creditors when a borrower is experiencing financial difficulty. All amendments in this update are effective for fiscal years beginning after December 15, 2022, including interim periods within those fiscal years. The Company adopted ASU 2016-13 on January 1, 2023. The adoption of this standard did not have a material effect on the Company's financial statements
The Bank leases a property from New Bay, LLC. (“New Bay”), a limited liability company
On March 6, 2014, the Bank entered into a -year lease of property in Rutherford, New Jersey with 190 Park Avenue, LLC, which is owned by Directors of the Bank and the Company. The rent is $
On August 3, 2018, the Bank entered in to a -year lease of property in River Edge, New Jersey with 876 Kinderkamack, LLC, which is owned by a majority of the Directors of the Bank and the Company. The rent is $
On April 2, 2021, the Bank renewed a -year lease of property in Lyndhurst, New Jersey with 734 Ridge Realty, LLC, which is owned by Directors of the Bank and the Company. The rent is $
During the year ended December 31, 2022, legal fees were paid to a law firm owned by a Director of the Bank and the Company totaling $
Equity Securities
Equity securities are reported at fair value on the Company’s consolidated statements of financial condition. The Company’s portfolio of equity securities had an estimated fair value of $
Equity securities are generally required to be measured at fair value with market value adjustments being reflected in net income.
Note 4- Securities (continued)
The following table presents the disaggregated net gains and losses on equity securities reported in the consolidated statements of operations (In Thousands):
|
|
|
|
|
|
|
|
|
|
| For the Twelve Months Ended December 31, 2023 |
|
| For the Twelve Months Ended December 31, 2022 |
|
| For the Twelve Months Ended December 31, 2021 |
Net gains (losses) recognized during the period on equity securities | $ | ( |
| $ | ( |
| $ | |
Less: Net gains (losses) recognized during the period on equity securities sold during the period |
| ( |
|
| ( |
|
| |
Unrealized gains (losses) recognized during the reporting period on equity securities still held at the reporting date | $ | ( |
| $ | ( |
| $ |
Debt Securities Available-for-Sale
The following table sets forth information regarding the amortized cost, estimated fair values, and unrealized gains and losses for the Bank’s debt securities portfolio at December 31 by final contractual maturity. The following table does not take into consideration the effects of scheduled repayments or the effects of possible prepayments. Certain securities have interest rates that are adjustable and will reprice annually within the various maturity ranges. The effect of these repricings are not reflected in the table below.
|
|
|
|
|
|
|
|
|
|
|
|
| December 31, 2023 | ||||||||||
|
|
|
| Gross |
| Gross |
|
| |||
| Amortized |
| Unrealized |
| Unrealized |
|
|
| |||
| Cost |
| Gains |
| Losses |
| Fair Value | ||||
| (In Thousands) | ||||||||||
Residential Mortgage-backed securities: |
|
|
|
|
|
|
|
|
|
|
|
More than one to five years | $ |
| $ | - |
| $ |
| $ | | ||
More than five to ten years |
| |
|
| - |
|
| |
|
| |
More than ten years |
| |
|
| |
|
| |
|
| |
Sub-total: |
| |
|
| |
|
| |
|
| |
|
|
|
|
|
|
|
|
|
|
|
|
Corporate Debt Securities: |
|
|
|
|
|
|
|
|
|
|
|
More than one to five years |
| |
|
| - |
|
| |
|
| |
More than five to ten years |
| |
|
| - |
|
| |
|
| |
Sub-total: |
| |
|
| - |
|
| |
|
| |
|
|
|
|
|
|
|
|
|
|
|
|
Total Debt Securities Available-for-Sale | $ | |
| $ | |
| $ | |
| $ | |
|
|
|
|
|
|
|
|
|
|
|
|
| December 31, 2022 | ||||||||||
|
|
|
| Gross |
| Gross |
|
| |||
| Amortized |
| Unrealized |
| Unrealized |
|
|
| |||
| Cost |
| Gains |
| Losses |
| Fair Value | ||||
| (In Thousands) | ||||||||||
Residential Mortgage-backed securities |
|
|
|
|
|
|
|
|
|
|
|
More than five to ten years | $ | |
| $ | - |
| $ | |
| $ | |
More than ten years |
| |
|
| - |
|
| |
|
| |
Sub-total: |
| |
|
| - |
|
| |
|
| |
|
|
|
|
|
|
|
|
|
|
|
|
Corporate Debt Securities: |
|
|
|
|
|
|
|
|
|
|
|
Due within one year |
| |
|
| - |
|
| |
|
| |
More than five to ten years |
| |
|
| - |
|
| |
|
| |
Sub-total: |
| |
|
| - |
|
| |
|
| |
|
|
|
|
|
|
|
|
|
|
|
|
Municipal obligations: |
|
|
|
|
|
|
|
|
|
|
|
Due after ten years |
| |
|
| - |
|
| |
|
| |
Sub-total: |
| |
|
| - |
|
| |
|
| |
|
|
|
|
|
|
|
|
|
|
|
|
Total Debt Securities Available-for-Sale | $ | |
| $ | - |
| $ | |
| $ | |
Note 4- Securities (continued)
The unrealized losses, categorized by the length of time of continuous loss position, and fair value of related securities available-for-sale were as follows:
|
|
|
|
|
|
|
|
|
|
|
|
|
|
|
|
|
|
| Less than 12 Months |
| More than 12 Months |
| Total | ||||||||||||
| Fair |
| Unrealized |
| Fair |
| Unrealized |
| Fair |
| Unrealized | ||||||
| Value |
| Losses |
| Value |
| Losses |
| Value |
| Losses | ||||||
| (In Thousands) | ||||||||||||||||
December 31, 2023 |
|
|
|
|
|
|
|
|
|
|
|
|
|
|
|
|
|
Residential mortgage-backed securities | $ | |
| $ | |
| $ | |
| $ | |
| $ | |
| $ | |
Corporate Debt Securities |
| - |
|
| - |
|
| |
|
| |
|
| |
|
| |
| $ | |
| $ | |
| $ | |
| $ | |
| $ | |
| $ | |
|
|
|
|
|
|
|
|
|
|
|
|
|
|
|
|
|
|
December 31, 2022 |
|
|
|
|
|
|
|
|
|
|
|
|
|
|
|
|
|
Residential mortgage-backed securities | $ | |
| $ | |
| $ | |
| $ | |
| $ | |
| $ | |
Corporate Debt Securities |
| |
|
| |
|
| |
|
| |
|
| |
|
| |
Municipal obligations |
| |
|
| |
|
|
|
|
|
|
|
| |
|
| |
| $ | |
| $ | |
| $ | |
| $ | |
| $ | |
| $ | |
|
|
|
|
|
|
|
|
|
|
|
|
| December 31, 2023 |
| December 31, 2022 | ||
| (In Thousands) | ||||
Loans: |
|
|
|
|
|
Residential one-to-four family | $ | |
| $ | |
Commercial and multi-family |
| |
|
| |
Construction |
| |
|
| |
Commercial business(1) |
| |
|
| |
Home equity(2) |
| |
|
| |
Consumer |
| |
|
| |
Total Loans |
| |
|
| |
Less: |
|
|
|
|
|
Deferred loan fees, net |
| ( |
|
| ( |
Allowance for credit losses |
| ( |
|
| ( |
|
| ( |
|
| ( |
Total Loans, net | $ | |
| $ | |
__________
(1) Includes business lines of credit.
(2) Includes home equity lines of credit.
The Company occasionally transfers a portion of its originated commercial loans to participating lending partners. The amounts transferred have been accounted for as sales and are therefore not included in the Company’s accompanying consolidated statements of financial condition. The Company and its lending partners share proportionally in any gains or losses that may result from a borrower’s lack of compliance with contractual terms of the loan. The Company continues to service the loans, collects cash payments from the borrowers, remits payments (net of servicing fees), and disburses required escrow funds to relevant parties.
Note 5 - Loans Receivable and Allowance for Credit losses (continued)
At December 31, 2023 and 2022, loans serviced by the Bank for the benefit of others totaled $
|
|
|
|
|
|
|
|
|
|
|
|
|
|
|
|
|
|
Related-Party Loans
The Bank grants loans to its officers and directors and to their associates. The activity with respect to loans to directors, officers and associates of such persons, is as follows:
|
|
|
|
|
|
|
|
|
|
|
|
| Years Ended December 31, | ||||
|
| 2023 |
|
| 2022 |
| (In Thousands) | ||||
Balance – beginning | $ | |
| $ | |
Loans originated |
| |
|
| - |
Collections of principal |
| ( |
|
| ( |
Balance - ending | $ | |
| $ | |
Allowance for Credit losses
The Company engages a third-party vendor to assist in the CECL calculation and has established a robust internal governance framework to oversee the quarterly estimation process for the allowance for credit losses (“ACL”). The ACL calculation methodology relies on regression-based discounted cash flow (“DCF”) models that correlate relationships between certain financial metrics and external market and macroeconomic variables. Following are some of the key factors and assumptions that are used in the Company’s CECL calculations:
methods based on probability of default and loss given default which are modeled based on macroeconomic scenarios;
a reasonable and supportable forecast period determined based on management’s current review of macroeconomic environment;
a reversion period after the reasonable and supportable forecast period;
estimated prepayment rates based on the Company’s historical experience and future macroeconomic environment;
estimated credit utilization rates based on the Company’s historical experience and future macroeconomic environment; and
incorporation of qualitative factors not captured within the modeled results. The qualitative factors include but are not limited to changes in lending policies, business conditions, changes in the nature and size of the portfolio, portfolio concentrations, and external factors such as competition.
Allowance for credit losses are aggregated for the major loan segments, with similar risk characteristics, summarized below. However, for the purposes of calculating the reserves, these segments may be further broken down into loan classes by risk characteristics that include but are not limited to regulatory call codes, industry type, geographic location, and collateral type.
Residential one-to-four family real estate loans involve certain risks such as interest rate risk and risk of non-repayment. Adjustable-rate residential real estate loans decrease the interest rate risk to the Bank that is associated with changes in interest rates but involve other risks, primarily because as interest rates rise, the payment by the borrower rises to the extent permitted by the terms of the loan, thereby increasing the potential for default. At the same time, the marketability of the underlying properties may be adversely affected by higher interest rates. Repayment risk may be affected by a number of factors including, but not necessarily limited to, job loss, divorce, illness and personal bankruptcy of the borrower.
Commercial and multi-family real estate lending entails additional risks as compared with residential family property lending. Such loans typically involve large loan balances to single borrowers or groups of related borrowers. The payment experience on such loans is typically dependent on the successful operation of the real estate project. The success of such projects is sensitive to changes in supply and demand conditions in the market for commercial real estate as well as general economic conditions.
Construction lending is generally considered to involve a high risk due to the concentration of principal in a limited number of loans and borrowers and the effects of the general economic conditions on developers and builders. Moreover, a construction loan can involve additional risks because of the inherent difficulty in estimating both a property’s value at completion of the project and the estimated cost (including interest) of the project. The nature of these loans is such that they are generally difficult to evaluate and monitor. In addition, speculative construction loans to a builder are not necessarily pre-sold and thus pose a greater potential risk to the Bank than construction loans to individuals on their personal residence.
Commercial business lending, including lines of credit, is generally considered higher risk due to the concentration of principal in a limited number of loans and borrowers and the effects of general economic conditions on the business. Commercial business loans are primarily secured by inventories and other business assets. In many cases, any repossessed collateral for a defaulted commercial business loans will not provide an adequate source of repayment of the outstanding loan balance.
Home equity lending entails certain risks such as interest rate risk and risk of non-repayment. The marketability of the underlying property may be adversely affected by higher interest rates, decreasing the collateral value securing the loan. Repayment risk can be affected by job loss, divorce, illness and personal bankruptcy of the borrower. Home equity line of credit lending entails securing an equity interest in the borrower’s home. In many cases, the Bank’s position in these loans is as a junior lien holder to another institution’s superior lien. This type of lending is often priced on an adjustable rate basis with the rate set at or above a predefined index. Adjustable-rate loans decrease the interest rate risk to the Bank that is associated with changes in interest rates but involve other risks, primarily because as interest rates rise, the payment by the borrower rises to the extent permitted by the terms of the loan, thereby increasing the potential for default.
Other consumer loans generally have more credit risk because of the type and nature of the collateral and, in certain cases, the absence of collateral. Consumer loans generally have shorter terms and higher interest rates than other lending. In addition, consumer lending collections are dependent on the borrower’s continuing financial stability, and thus are more likely to be adversely affected by job loss, divorce, illness and personal bankruptcy. In many cases, any repossessed collateral for a defaulted consumer loan will not provide an adequate source of repayment of the outstanding loan.
Note 5- Loans Receivable and Allowance for Credit losses (continued)
|
|
|
|
|
|
|
|
|
|
|
|
|
|
|
|
|
|
|
|
|
|
|
|
| Residential |
|
| Commercial & Multi-family |
| Construction |
| Commercial Business (1) |
| Home Equity (2) |
| Consumer |
| Unallocated |
| Total | |||||||
Allowance for credit losses: |
|
|
|
|
|
|
|
|
|
|
|
|
|
|
|
|
|
|
|
|
|
|
|
Ending Balance, December 31, 2022 |
| |
|
| |
|
| |
|
| |
|
| |
|
| |
|
| |
|
| |
Effect of adopting ASU No. 2016-13 ("CECL") |
| |
|
| ( |
|
| |
|
| |
|
| |
|
| |
|
| ( |
|
| ( |
Beginning Balance, January 1, 2023 | $ | |
| $ | |
| $ | |
| $ | |
| $ | |
| $ | |
| $ | - |
| $ | |
|
|
|
|
|
|
|
|
|
|
|
|
|
|
|
|
|
|
|
|
|
|
|
|
Charge-offs: |
| - |
|
| - |
|
| - |
|
| ( |
|
| - |
|
| - |
|
| - |
|
| ( |
Recoveries: |
| |
|
| - |
|
| - |
|
| |
|
| |
|
| - |
|
| - |
|
| |
Provision (benefit): |
| ( |
|
| |
|
| |
|
| |
|
| |
|
| |
|
| - |
|
| |
Ending Balance, December 31, 2023 | $ | |
| $ | |
| $ | |
| $ | |
| $ | |
| $ | |
| $ | - |
| $ | |
|
|
|
|
|
|
|
|
|
|
|
|
|
|
|
|
|
|
|
|
|
|
|
|
Ending Balance attributable to loans: |
|
|
|
|
|
|
|
|
|
|
|
|
|
|
|
|
|
|
|
|
|
|
|
Individually evaluated | $ | - |
| $ | |
| $ | |
| $ | |
| $ | - |
| $ | - |
| $ | - |
| $ | |
Collectively evaluated |
| |
|
| |
|
| |
|
| |
|
| |
|
| |
|
| - |
|
| |
Ending Balance, December 31, 2023 | $ | |
| $ | |
| $ | |
| $ | |
| $ | |
| $ | |
| $ | - |
| $ | |
|
|
|
|
|
|
|
|
|
|
|
|
|
|
|
|
|
|
|
|
|
|
|
|
Loans Receivables: |
|
|
|
|
|
|
|
|
|
|
|
|
|
|
|
|
|
|
|
|
|
|
|
Individually evaluated | $ | |
| $ | |
| $ | |
| $ | |
| $ | |
| $ | - |
| $ | - |
| $ | |
Collectively evaluated |
| |
|
| |
|
| |
|
| |
|
| |
|
| |
|
| - |
|
| |
Total Gross Loans | $ | |
| $ | |
| $ | |
| $ | |
| $ | |
| $ | |
| $ | - |
| $ | |
(1) Includes business lines of credit.
(2) Includes home equity lines of credit.
|
|
|
|
|
|
|
|
|
|
|
|
|
|
|
|
|
|
|
|
|
|
|
|
| Residential |
|
| Commercial & Multi-family |
| Construction |
| Commercial Business (1) |
| Home Equity (2) |
| Consumer |
| Unallocated |
| Total | |||||||
Allowance for credit losses: |
|
|
|
|
|
|
|
|
|
|
|
|
|
|
|
|
|
|
|
|
|
|
|
Beginning Balance, December 31, 2021 | $ | |
| $ | |
| $ | |
| $ | |
| $ | |
| $ | |
| $ | |
| $ | |
|
|
|
|
|
|
|
|
|
|
|
|
|
|
|
|
|
|
|
|
|
|
|
|
Charge-offs: |
| - |
|
| - |
|
| - |
|
| ( |
|
| - |
|
| - |
|
| - |
|
| ( |
Recoveries: |
| |
|
| - |
|
| - |
|
| |
|
| |
|
| |
|
| - |
|
| |
Provision (benefit): |
| ( |
|
| ( |
|
| ( |
|
| ( |
|
| ( |
|
| ( |
|
| ( |
|
| ( |
Ending Balance, December 31, 2022 | $ | |
| $ | |
| $ | |
| $ | |
| $ | |
| $ | |
| $ | |
| $ | |
|
|
|
|
|
|
|
|
|
|
|
|
|
|
|
|
|
|
|
|
|
|
|
|
Ending Balance attributable to loans: |
|
|
|
|
|
|
|
|
|
|
|
|
|
|
|
|
|
|
|
|
|
|
|
Individually evaluated for impairment | $ | |
| $ | - |
| $ | |
| $ | |
| $ | |
| $ | - |
| $ | - |
| $ | |
Collectively evaluated for impairment |
| |
|
| |
|
| |
|
| |
|
| |
|
| |
|
| |
|
| |
Ending Balance, December 31, 2022 | $ | |
| $ | |
| $ | |
| $ | |
| $ | |
| $ | |
| $ | |
| $ | |
|
|
|
|
|
|
|
|
|
|
|
|
|
|
|
|
|
|
|
|
|
|
|
|
Loans Receivables: |
|
|
|
|
|
|
|
|
|
|
|
|
|
|
|
|
|
|
|
|
|
|
|
Individually evaluated for impairment | $ | |
| $ | |
| $ | |
| $ | |
| $ | |
| $ | - |
| $ | - |
| $ | |
Collectively evaluated for impairment |
| |
|
| |
|
| |
|
| |
|
| |
|
| |
|
| - |
|
| |
Total Gross Loans | $ | |
| $ | |
| $ | |
| $ | |
| $ | |
| $ | |
| $ | - |
| $ | |
(1) Includes business lines of credit.
(2) Includes home equity lines of credit.
Note 5- Loans Receivable and Allowance for Credit losses (continued)
The tables below set forth the amounts and types of nonaccrual loans in the Bank’s loan portfolio at December 31 2023 and 2022, respectively. Loans are generally placed on nonaccrual status when they become more than 90 days delinquent, or when the collection of principal and/or interest become doubtful.
As of December 31, 2023, nonaccrual loans differed from the amount of total loans past due greater than 90 days due to loans 90 days past due but still accruing interest or loans that were previously 90 days past due both of which are maintained on nonaccrual status for a minimum of six months until the borrower has demonstrated their ability to satisfy the terms of the loan.
|
|
|
|
|
|
|
|
|
|
|
|
| |
|
| As of December 31, 2023 | |||||||||||
|
| (in Thousands) | |||||||||||
|
| Nonaccrual loans with Allowance for Credit Losses |
|
|
| Nonaccrual loans without Allowance for Credit Losses |
|
| Total Nonaccrual loans |
|
| Amortized Cost of Loans Past due 90 and Still Accruing | |
Residential one-to-four family | $ | - |
| $ |
| |
| $ | |
| $ | - | |
Commercial and multi-family |
| |
|
|
| |
|
| |
|
| - | |
Construction |
| |
|
|
| |
|
| |
|
| - | |
Commercial business (1) |
| |
|
|
| |
|
| |
|
| - | |
Home equity (2) |
| - |
|
|
| |
|
| |
|
| - | |
Total | $ | |
| $ |
| |
| $ | |
| $ | - | |
(1) Includes business lines of credit.
(2) Includes home equity lines of credit.
|
|
|
|
|
|
| As of | |
| (In Thousands) | |
Non-Accruing Loans: |
|
|
|
|
|
Residential one-to-four family | $ | |
Commercial and multi-family |
| |
Construction |
| |
Commercial business(1) |
| |
Total | $ | |
(1) Includes business lines of credit.
Had nonaccrual loans been performing in accordance with their original terms, the interest income recognized for the years ended December 31, 2023 and 2022 would have been approximately $
(In Thousands):
|
|
|
|
|
|
|
|
|
|
| As of December 31, 2022 | ||||||
|
| Recorded |
|
| Unpaid Principal |
|
| Related |
|
| Investment |
|
| Balance |
|
| Allowance |
Loans with no related allowance: |
|
|
|
|
|
|
|
|
Residential one-to-four family | $ | |
| $ | |
| $ | - |
Commercial and multi-family |
| |
|
| |
|
| - |
Commercial business(1) |
| |
|
| |
|
| - |
Home equity(2) |
| |
|
| |
|
| - |
Total Individually Evaluated Loans with no related allowance recorded: | $ | |
| $ | |
| $ | - |
|
|
|
|
|
|
|
|
|
Loans with an allowance recorded: |
|
|
|
|
|
|
|
|
Residential one-to-four family | $ | |
| $ | |
| $ | |
Commercial and Multi-family |
| - |
|
| - |
|
| - |
Construction |
| |
|
| |
|
| |
Commercial business(1) |
| |
|
| |
|
| |
Home equity(2) |
| |
|
| |
|
| |
Total Individually Evaluated Loans with an allowance recorded: | $ | |
| $ | |
| $ | |
|
|
|
|
|
|
|
|
|
Total Individually Evaluated Loans: | $ | |
| $ | |
| $ | |
(1) Includes business lines of credit.
(2) Includes home equity lines of credit.
Note 5- Loans Receivable and Allowance for Credit losses (continued)
The following table summarizes the average recorded investment and actual interest income recognized on individually evaluated loans for the year ended December 31, 2022.
(In Thousands)
|
|
|
|
|
|
|
|
|
|
|
|
|
|
|
|
| 2022 |
|
| 2022 |
|
|
| Average |
|
| Interest |
|
|
| Recorded |
|
| Income |
|
|
| Investment |
|
| Recognized |
Loans with no related allowance recorded: |
|
|
|
|
|
|
Residential one-to-four family |
| $ | |
| $ | |
Commercial and multi-family |
|
| |
|
| |
Construction |
|
| - |
|
| - |
Commercial business(1) |
|
| |
|
| |
Home equity(2) |
|
| |
|
| |
Total Individually Evaluated Loans with no allowance recorded: |
| $ | |
| $ | |
|
|
|
|
|
|
|
Loans with an allowance recorded: |
|
|
|
|
|
|
Residential one-to-four family |
| $ | |
| $ | |
Commercial and Multi-family |
|
| |
|
| |
Construction |
|
| |
|
| |
Commercial business(1) |
|
| |
|
| |
Home equity(2) |
|
| |
|
| |
Total Individually Evaluated Loans with an allowance recorded: |
| $ | |
| $ | |
|
|
|
|
|
|
|
Total Individually Evaluated Loans: |
| $ | |
| $ | |
(1) Includes business lines of credit.
(2) Includes home equity lines of credit.
The Company adopted ASU 2022-02, Financial Instruments - Credit Losses (Topic 326) Troubled Debt Restructurings and Vintage Disclosures (“ASU 2022-02”) effective January 1, 2023. The amendments in ASU 2022-02 eliminated the recognition and measurement of troubled debt restructurings and enhanced disclosures for loan modifications to borrowers experiencing financial difficulty. The Company did not have any loans that were both experiencing financial difficulty and modified during the twelve months ending December 31, 2023.
|
|
|
|
|
|
|
|
|
|
|
|
|
|
|
|
|
|
|
|
|
|
|
|
|
|
|
|
|
|
|
|
|
|
|
|
|
|
|
| Loans Receivable | |
| 30-59 Days |
| 60-90 Days |
| Greater Than |
| Total Past |
|
|
|
| Total Loans |
| >90 Days | ||||||
| Past Due |
| Past Due |
| 90 Days |
| Due |
| Current |
| Receivable |
| and Accruing | |||||||
|
| (In Thousands) | ||||||||||||||||||
Residential one-to-four family | $ | |
| $ | - |
| $ | |
| $ | |
| $ | |
| $ | |
| $ | - |
Commercial and multi-family |
| |
|
| |
|
| |
|
| |
|
| |
|
| |
|
| - |
Construction |
| |
|
| - |
|
| |
|
| |
|
| |
|
| |
|
| - |
Commercial business(1) |
| |
|
| |
|
| |
|
| |
|
| |
|
| |
|
| - |
Home equity(2) |
| |
|
| - |
|
| - |
|
| |
|
| |
|
| |
|
| - |
Consumer |
| - |
|
| - |
|
| - |
|
| - |
|
| |
|
| |
|
| - |
Total | $ | |
| $ | |
| $ | |
| $ | |
| $ | |
| $ | |
| $ | - |
(1) Includes business lines of credit.
(2) Includes home equity lines of credit.
The following table sets forth the delinquency status of total loans receivable at December 31, 2022:
|
|
|
|
|
|
|
|
|
|
|
|
|
|
|
|
|
|
|
|
|
|
|
|
|
|
|
|
|
|
|
|
|
|
|
|
|
|
|
| Loans Receivable | |
| 30-59 Days |
| 60-90 Days |
| Greater Than |
| Total Past |
|
|
|
| Total Loans |
| >90 Days | ||||||
| Past Due |
| Past Due |
| 90 Days |
| Due |
| Current |
| Receivable |
| and Accruing | |||||||
|
| (In Thousands) | ||||||||||||||||||
Residential one-to-four family | $ | |
| $ | |
| $ | - |
| $ | |
| $ | |
| $ | |
| $ | - |
Commercial and multi-family |
| |
|
| |
|
| - |
|
| |
|
| |
|
| |
|
| - |
Construction |
| - |
|
| - |
|
| |
|
| |
|
| |
|
| |
|
| - |
Commercial business(1) |
| |
|
| |
|
| |
|
| |
|
| |
|
| |
|
| - |
Home equity(2) |
| |
|
| - |
|
| - |
|
| |
|
| |
|
| |
|
| - |
Consumer |
| - |
|
| - |
|
| - |
|
| - |
|
| |
|
| |
|
| - |
Total | $ | |
| $ | |
| $ | |
| $ | |
| $ | |
| $ | |
| $ | - |
(1) Includes business lines of credit.
(2) Includes home equity lines of credit.
Note 5 - Loans Receivable and Allowance for Credit losses (continued)
Criticized and Classified Assets
The Company’s policies provide for a classification system for problem assets. Under this classification system, problem assets are classified as “substandard,” “doubtful,” or “loss.”
When the Company classifies problem assets, the Company may establish general allowances for credit losses in an amount deemed prudent by management. General allowances represent loss allowances which have been established to recognize the inherent risk associated with lending activities, but which, unlike specific allowances, have not been allocated to particular problem assets. A portion of general loss allowances established to cover possible losses related to assets classified as substandard or doubtful may be included in determining our regulatory capital. Specific valuation allowances for credit losses generally do not qualify as regulatory capital. As of December 31, 2023, the Company had $
The Company’s internal credit risk grades are based on the definitions currently utilized by the banking regulatory agencies. The grades assigned and definitions are as follows, and loans graded excellent, above average, good and watch list (risk ratings 1-5) are treated as “pass” for grading purposes. The “criticized” risk rating (6) and the “classified” risk ratings (7-9) are detailed below:
6 – Special Mention- Loans currently performing but with potential weaknesses including adverse trends in borrower’s operations, credit quality, financial strength, or possible collateral deficiency.
7 – Substandard- Loans that are inadequately protected by current sound worth, paying capacity, and collateral support. Loans on “nonaccrual” status. The loan needs special and corrective attention.
8 – Doubtful- Weaknesses in credit quality and collateral support make full collection improbable, but pending reasonable factors remain sufficient to defer the loss status.
9 – Loss- Continuance as a bankable asset is not warranted. However, this does not preclude future attempts at partial recovery.
Residential, home equity, and consumer loans are rated pass at origination with subsequent adjustments based on delinquency status.
Note 5 - Loans Receivable and Allowance for Credit losses (continued)
|
|
|
|
|
|
|
|
|
|
|
|
|
|
|
|
|
|
|
|
|
|
|
|
|
|
|
Loans by Year of Origination at December 31, 2023 | ||||||||||||||||||||||||||
|
| 2023 |
|
| 2022 |
|
| 2021 |
|
| 2020 |
|
| 2019 |
|
| Prior |
|
| Revolving Loans |
|
| Revolving Loans to Term Loans |
|
| Total |
Residential one-to-four family |
|
|
|
|
|
|
|
|
|
|
|
|
|
|
|
|
|
|
|
|
|
|
|
|
|
|
Pass | $ | |
| $ | |
| $ | |
| $ | |
| $ | |
| $ | |
| $ | - |
| $ | - |
| $ | |
Special Mention |
| - |
|
| |
|
| |
|
| - |
|
| - |
|
| - |
|
| - |
|
| - |
|
| |
Substandard |
| - |
|
| - |
|
| |
|
| - |
|
| - |
|
| |
|
| - |
|
| - |
|
| |
Total one-to-four family | $ | |
| $ | |
| $ | |
| $ | |
| $ | |
| $ | |
| $ | - |
| $ | - |
| $ | |
|
|
|
|
|
|
|
|
|
|
|
|
|
|
|
|
|
|
|
|
|
|
|
|
|
|
|
Commercial and multi-family |
|
|
|
|
|
|
|
|
|
|
|
|
|
|
|
|
|
|
|
|
|
|
|
|
|
|
Pass | $ | |
| $ | |
| $ | |
| $ | |
| $ | |
| $ | |
| $ | |
| $ | - |
| $ | |
Special Mention |
| |
|
| |
|
| - |
|
| - |
|
| |
|
| |
|
| |
|
| - |
|
| |
Substandard |
| - |
|
| |
|
| |
|
| |
|
| - |
|
| |
|
| - |
|
| - |
|
| |
Total Commercial and multi-family | $ | |
| $ | |
| $ | |
| $ | |
| $ | |
| $ | |
| $ | |
| $ | - |
| $ | |
|
|
|
|
|
|
|
|
|
|
|
|
|
|
|
|
|
|
|
|
|
|
|
|
|
|
|
Construction |
|
|
|
|
|
|
|
|
|
|
|
|
|
|
|
|
|
|
|
|
|
|
|
|
|
|
Pass | $ | |
| $ | |
| $ | |
| $ | |
| $ | - |
| $ | |
| $ | |
| $ | - |
| $ | |
Special Mention |
| - |
|
| - |
|
| - |
|
| - |
|
| - |
|
| - |
|
| - |
|
| - |
|
| - |
Substandard |
| - |
|
| |
|
| - |
|
| |
|
| - |
|
| |
|
| - |
|
| - |
|
| |
Total Construction | $ | |
| $ | |
| $ | |
| $ | |
| $ | - |
| $ | |
| $ | |
| $ | - |
| $ | |
|
|
|
|
|
|
|
|
|
|
|
|
|
|
|
|
|
|
|
|
|
|
|
|
|
|
|
Commercial business |
|
|
|
|
|
|
|
|
|
|
|
|
|
|
|
|
|
|
|
|
|
|
|
|
|
|
Pass | $ | |
| $ | |
| $ | |
| $ | |
| $ | |
| $ | |
| $ | |
| $ | - |
| $ | |
Special Mention |
| - |
|
| - |
|
| - |
|
| - |
|
| |
|
| |
|
| |
|
| - |
|
| |
Substandard |
| - |
|
| - |
|
| - |
|
| - |
|
| - |
|
| |
|
| |
|
| - |
|
| |
Total Commercial business | $ | |
| $ | |
| $ | |
| $ | |
| $ | |
| $ | |
| $ | |
| $ | - |
| $ | |
|
|
|
|
|
|
|
|
|
|
|
|
|
|
|
|
|
|
|
|
|
|
|
|
|
|
|
Home equity |
|
|
|
|
|
|
|
|
|
|
|
|
|
|
|
|
|
|
|
|
|
|
|
|
|
|
Pass | $ | |
| $ | |
| $ | |
| $ | |
| $ | |
| $ | |
| $ | |
| $ | |
| $ | |
Special Mention |
| - |
|
| - |
|
| - |
|
| - |
|
| - |
|
| - |
|
| - |
|
| - |
|
| - |
Substandard |
| - |
|
| |
|
| - |
|
| - |
|
| - |
|
| - |
|
| |
|
| |
|
| |
Total Home equity | $ | |
| $ | |
| $ | |
| $ | |
| $ | |
| $ | |
| $ | |
| $ | |
| $ | |
|
|
|
|
|
|
|
|
|
|
|
|
|
|
|
|
|
|
|
|
|
|
|
|
|
|
|
Consumer |
|
|
|
|
|
|
|
|
|
|
|
|
|
|
|
|
|
|
|
|
|
|
|
|
|
|
Pass | $ | |
| $ | |
| $ | |
| $ | |
| $ | |
| $ | - |
| $ | |
| $ | - |
| $ | |
Special Mention |
| - |
|
| - |
|
| - |
|
| - |
|
| - |
|
| - |
|
| - |
|
| - |
|
| - |
Substandard |
| - |
|
| - |
|
| - |
|
| - |
|
| - |
|
| - |
|
| - |
|
| - |
|
| - |
Total Consumer | $ | |
| $ | |
| $ | |
| $ | |
| $ | |
| $ | - |
| $ | |
| $ | - |
| $ | |
|
|
|
|
|
|
|
|
|
|
|
|
|
|
|
|
|
|
|
|
|
|
|
|
|
|
|
Total Loans | $ | |
| $ | |
| $ | |
| $ | |
| $ | |
| $ | |
| $ | |
| $ | |
| $ | |
|
|
|
|
|
|
|
|
|
|
|
|
|
|
|
|
|
|
|
|
|
|
|
|
|
|
|
Gross charge-offs | $ | |
| $ | |
| $ | - |
| $ | - |
| $ | - |
| $ | - |
| $ | - |
| $ | - |
| $ | |
|
|
|
|
|
|
|
|
|
|
|
|
|
|
|
|
|
|
| Pass |
| Special Mention |
| Substandard |
| Doubtful |
| Loss |
| Total | ||||||
December 31, 2022 |
|
|
|
|
|
|
|
|
|
|
|
|
|
|
|
|
|
Residential one-to-four family | $ | |
| $ | |
| $ | |
| $ | - |
| $ | - |
| $ | |
Commercial and multi-family |
| |
|
| |
|
| |
|
| - |
|
| - |
|
| |
Construction |
| |
|
| - |
|
| |
|
| - |
|
| - |
|
| |
Commercial business(1) |
| |
|
| |
|
| |
|
| - |
|
| - |
|
| |
Home equity(2) |
| |
|
| - |
|
| |
|
| - |
|
| - |
|
| |
Consumer |
| |
|
| - |
|
| - |
|
| - |
|
| - |
|
| |
Total Gross Loans | $ | |
| $ | |
| $ | |
| $ | - |
| $ | - |
| $ | |
(1) Includes business lines of credit.
(2) Includes home equity lines of credit.
Premises and equipment as of December 31, 2023 and 2022 consists of the following:
|
|
|
|
|
|
|
|
|
|
|
|
|
|
|
|
| December 31, | |||
|
|
| 2023 |
|
| 2022 |
|
| (In Thousands) | ||||
Land |
| $ | |
| $ | |
Buildings and improvements |
|
| |
|
| |
Leasehold improvements |
|
| |
|
| |
Furniture, fixtures and equipment |
|
| |
|
| |
|
|
| |
|
| |
Accumulated depreciation and amortization |
|
| ( |
|
| ( |
|
| $ | |
| $ | |
Depreciation and amortization expense for the years ended December 31, 2023 and 2022 was $
Buildings and improvements include a building constructed on property leased from a related party (see Note 3).
The distribution of interest receivable at December 31, 2023 and 2022 was as follows:
|
|
|
|
|
|
|
|
|
|
|
|
|
|
|
| December 31, | ||||
|
|
| 2023 |
|
| 2022 |
|
| (In Thousands) | ||||
Loans |
| $ | |
| $ | |
Securities |
|
| |
|
| |
|
| $ | |
| $ | |
The distribution of deposits at December 31, 2023 and 2022 were as follows:
|
|
|
|
|
|
|
|
|
|
|
|
|
|
|
| December 31, | ||||
|
|
| 2023 |
|
| 2022 |
|
| (In Thousands) | ||||
Demand: |
|
|
|
|
|
|
Non-interest bearing |
| $ | |
| $ | |
Interest bearing |
|
| |
|
| |
Money market |
|
| |
|
| |
|
|
| |
|
| |
Savings and club |
|
| |
|
| |
Certificates of deposit |
|
| |
|
| |
|
| $ | |
| $ | |
Deposits of certain municipalities and local government agencies are collateralized by $
At December 31, 2023 and 2022, certificates of deposit of $250,000 or more totaled approximately $
At December 31, 2023, deposits from officers, directors and their associates totaled approximately $
The scheduled maturities of certificates of deposit at December 31, 2023, were as follows (In thousands):
|
|
|
|
| Amount |
2024 | $ | |
2025 |
| |
2026 |
| |
2027 |
| |
Thereafter |
| |
| $ |
As of December 31, 2023, the Company had $
Information regarding short-term borrowings is as follows:
|
|
|
|
|
|
|
|
|
|
|
|
|
|
|
|
|
|
| December 31, | |||||||
|
|
| 2023 |
|
|
| 2022 | |
|
|
|
|
|
|
|
|
|
|
|
| Amount |
| Amount | |||
|
| ( In Thousands) | ||||||
Balance at end of period |
| $ | - |
|
| $ | |
|
Average balance outstanding during the year |
| $ | |
|
| $ | |
|
Highest month-end balance during the year |
| $ | |
|
| $ | |
|
Average interest rate during the year |
|
| | % |
|
| | % |
Weighted average interest rate at year-end |
|
| - | % |
|
| | % |
|
|
|
|
|
|
|
|
|
Long-term debt consists of the following:
|
|
|
|
|
|
|
|
|
|
|
|
|
|
|
|
|
|
|
|
|
|
|
|
|
|
|
| December 31, | ||||||||||
|
| 2023 |
| 2022 | ||||||||
|
| Weighted Average Rate |
|
|
| Amount ($000s) |
| Weighted Average Rate |
|
|
| Amount ($000s) |
Federal Home Loan Bank Advances: |
|
|
|
|
|
|
|
|
|
|
|
|
| Maturing by December 31, | |||||||||||
| 2023 | - | % |
| $ | - |
| % |
| $ | ||
| 2024 | |
|
|
| |
|
|
|
| ||
| 2025 | |
|
|
| |
|
|
|
| ||
| 2026 | |
|
|
| |
|
|
|
| ||
|
| | % |
| $ | |
| % |
| $ | ||
FHLB advances are presented net of unamortized prepayment penalties totaling $
At December 31, 2023 and 2022, loans with carrying values of approximately $
On July 30, 2018, the Company issued $
The Company also has $
In accordance with the Adjustable Interest Rate (LIBOR) Act (the “LIBOR Act”) and the regulation issued by the Board of Governors of the Federal Reserve System implementing the LIBOR Act, the Company has selected the three-month CME Term SOFR as the applicable successor rate for both the Notes and the trust preferred securities. The calculation of the amount of interest payable, based on the three-month CME Term SOFR, will also include the applicable tenor spread adjustment of
The Bank is subject to various regulatory capital requirements administered by the federal banking agencies. Failure to meet the minimum capital requirements can initiate certain mandatory and possibly additional discretionary actions by regulators that, if undertaken, could have a direct material effect on the Company’s consolidated financial statements. Under capital adequacy guidelines and the regulatory framework for prompt corrective action, the Bank must meet specific capital guidelines that involve quantitative measures of the Bank’s assets, liabilities and certain off-balance sheet items as calculated under regulatory accounting practices. The Bank’s capital amounts and classification are also subject to qualitative judgments by the regulators about components, risk-weightings and other factors.
In July 2013, the FDIC and the other federal bank regulatory agencies issued a final rule that revised their leverage and risk-based capital requirements and the method for calculating risk-weighted assets to make them consistent with agreements that were reached by the Basel Committee on Banking Supervision and certain provisions of the Dodd-Frank Act. Among other things, the new rule established a new common equity Tier 1 minimum capital requirement (4.5 percent of risk-weighted assets), increased the minimum Tier 1 capital to risk-based assets requirement (from 4.0 percent to 6.0 percent of risk-weighted assets) and assigned a higher risk weight (150 percent) to exposures that are more than 90 days past due or are on nonaccrual status and to certain commercial real estate facilities that finance the acquisition, development or construction of real property. The final rule also requires unrealized gains and losses on certain available-for-sale securities holdings and defined benefit plan obligations to be included for purposes of calculating regulatory capital requirements unless a one-time opt-in or opt-out is exercised. The Bank exercised the opt-out election.
On September 17, 2019, the FDIC passed a final rule providing qualifying community banking organizations the ability to opt-in to a new community bank leverage ratio (“CBLR”) framework, (tier 1 capital to average consolidated assets) at 9.0 percent for institutions under $10.0 billion in assets that such institutions may elect to utilize in lieu of the general applicable risk-based capital requirements under Basel III. Such institutions that meet the community bank leverage ratio and certain other qualifying criteria will automatically be deemed to be well-capitalized.
The Bank opted in to the community bank leverage ratio (tier 1 capital to average consolidated assets) (“CBLR”) framework, with a minimum requirement of 9% for institutions under $10 billion in assets. Such institutions meeting that requirement may elect to utilize the CBLR in lieu of the general applicable risk-based capital requirements under Basel III. Such institutions that meet the CBLR and certain other qualifying criteria will automatically be deemed to be well-capitalized.
At December 31, 2023 and December 31, 2022, the Bank exceeded all of its regulatory capital requirements. The following table sets forth the regulatory capital ratios for the Bank as well as regulatory capital requirements for the periods presented.
|
|
|
|
|
|
|
|
|
|
|
|
|
|
|
|
|
|
|
|
|
|
|
|
|
|
|
|
| For Capital Adequacy |
|
| To be Well Capitalized under Prompt Corrective |
| ||||||||
| Actual |
|
|
| Purposes |
|
| Action Provisions |
| |||||||||||
|
|
|
|
|
|
|
|
|
|
|
|
|
|
|
|
|
|
|
|
|
|
| Amount |
|
| Ratio |
|
|
| Amount |
|
| Ratio |
|
|
| Amount |
|
| Ratio |
|
|
| (Dollars in Thousands) | ||||||||||||||||||
As of December 31, 2023 |
|
|
|
|
|
|
|
|
|
|
|
|
|
|
|
|
|
|
|
|
Bank |
|
|
|
|
|
|
|
|
|
|
|
|
|
|
|
|
|
|
|
|
Community Bank Leverage Ratio | $ | |
|
| | % |
| $ | |
|
| | % |
| $ | |
|
| | % |
|
|
|
|
|
|
|
|
|
|
|
|
|
|
|
|
|
|
|
|
|
As of December 31, 2022 |
|
|
|
|
|
|
|
|
|
|
|
|
|
|
|
|
|
|
|
|
Bank |
|
|
|
|
|
|
|
|
|
|
|
|
|
|
|
|
|
|
|
|
Community Bank Leverage Ratio | $ |
|
| % |
| $ |
|
| % |
| $ |
|
| % | ||||||
The following table sets forth the regulatory capital ratios for the Company as well as the regulatory requirements for the year ended December 31, 2023.
|
|
|
|
|
|
|
|
|
|
|
|
|
|
|
|
|
|
|
|
|
|
|
|
|
|
|
|
| For Capital Adequacy |
|
| To be Well Capitalized under Prompt Corrective |
| ||||||||
| Actual |
|
|
| Purposes |
|
| Action Provisions |
| |||||||||||
|
|
|
|
|
|
|
|
|
|
|
|
|
|
|
|
|
|
|
|
|
|
| Amount |
|
| Ratio |
|
|
| Amount |
|
| Ratio |
|
|
| Amount |
|
| Ratio |
|
|
| (Dollars in Thousands) | ||||||||||||||||||
As of December 31, 2023 |
|
|
|
|
|
|
|
|
|
|
|
|
|
|
|
|
|
|
|
|
Bancorp |
|
|
|
|
|
|
|
|
|
|
|
|
|
|
|
|
|
|
|
|
Total Capital (to Risk-Weighted Assets) | $ | |
|
| | % |
| $ | |
|
| | % |
| $ | |
|
| | % |
Tier 1 Capital (to Risk-Weighted Assets) |
| |
|
| |
|
|
| |
|
| |
|
|
| |
|
| |
|
C/E Tier 1 Capital (to Risk-Weighted Assets) |
| |
|
| |
|
|
| |
|
| |
|
|
| |
|
| |
|
Tier 1 Capital (to adjusted total assets) |
| |
|
| |
|
|
| |
|
| |
|
|
| |
|
| |
|
At December 31, 2022, the Company was not subject to the larger capital requirements set forth in the “Regulatory Relief Act”.
As of December 31, 2023 and 2022, the most recent notification from the Company and the Bank’s regulators categorized the Bank as “well-capitalized” under the regulatory framework for prompt corrective action. There are no conditions or events occurring since that notification that management believes have changed the Bank’s category.
Pension Plan
The Company acquired, through the merger with Pamrapo Bancorp, Inc. a non-contributory defined benefit pension plan (“Pension Plan”) covering all eligible employees of Pamrapo Savings Bank. Effective January 1, 2010, the Pension Plan was frozen by Pamrapo Savings Bank. All benefits for eligible participants accrued in the Pension Plan to the freeze date have been retained. The benefits are based on years of service and employee’s compensation. The Pension Plan is funded in conformity with funding requirements of applicable government regulations. Prior service costs for the Pension Plan generally are amortized over the estimated remaining service periods of employees.
The following tables set forth the Pension Plan's funded status at December 31, 2023, 2022 and 2021 and components of net periodic pension cost for the years ended December 31, 2023, 2022 and 2021:
|
|
|
|
|
|
|
|
|
Change in Benefit Obligation: | December 31, | |||||||
|
| 2023 |
|
| 2022 |
|
| 2021 |
| (In Thousands) | |||||||
Benefit obligation, beginning of year | $ | |
| $ |
| $ | ||
Interest cost |
| |
|
|
|
| ||
Actuarial gain |
| ( |
|
| ( |
|
| ( |
Benefits paid |
| ( |
|
| ( |
|
| ( |
Lump sum distributions |
| - |
|
| ( |
|
| ( |
Benefit obligation, ending | $ | |
| $ |
| $ | ||
Change in Plan Assets: |
|
|
|
|
|
|
|
|
Fair value of assets, beginning of year | $ | |
| $ |
| $ | ||
Actual return on plan assets |
| |
|
| ( |
|
| |
Benefits paid |
| ( |
|
| ( |
|
| ( |
Lump sum distributions |
| - |
|
| ( |
|
| ( |
Fair value of assets, ending | $ | |
| $ |
| $ | ||
Fair value of assets | $ | |
| $ |
| $ | ||
Projected benefit obligation |
| |
|
|
|
| ||
Funded status, included in other liabilities, net | $ | |
| $ |
| $ | ||
Valuation assumptions used to determine benefit obligation at period end: |
|
|
|
|
|
|
|
|
Discount rate |
|
|
|
|
| |||
Salary increase rate |
| N/A |
|
| N/A |
|
| N/A |
|
|
|
|
|
|
|
|
|
Net Periodic Pension Expense: | December 31, | |||||||
|
| 2023 |
|
| 2022 |
|
| 2021 |
| (In Thousands) | |||||||
Interest cost | $ | |
| $ |
| $ | ||
Expected return on assets |
| ( |
|
| ( |
|
| ( |
Amortization of net loss |
| |
|
|
|
| ||
Net periodic pension cost (benefit) | $ | ( |
| $ | ( |
| $ | |
Valuation assumptions used to determine net periodic cost (benefit) cost for the year: |
|
|
|
|
|
|
|
|
Discount rate |
|
|
|
|
| |||
Long term rate of return on plan assets |
|
|
|
|
| |||
Salary increase rate |
|
|
|
|
| |||
At December 31, 2023, 2022 and December 31, 2021, unrecognized net losses of $
Note 12 - Benefits Plan (continued)
Plan Assets
Investment Policies and Strategies
The primary long-term objective for the Pension Plan is to maintain assets at a level that will sufficiently cover future beneficiary obligations. The Pension Plan is structured to include a volatility reducing component (the fixed income commitment) and a growth component (the equity commitment).
To achieve the Bank’s long-term investment objectives, the trustee invests the assets of the Pension Plan in a diversified combination of asset classes, investment strategies, and pooled vehicles. The asset allocation guidelines in the table below reflect the Bank’s risk tolerance and long-term objectives for the Pension Plan. These parameters will be reviewed on a regular basis and subject to change following discussions between the Bank and the trustee.
The following asset allocation targets and ranges guides the trustee in structuring the overall allocation in the Pension Plan’s investment portfolio. The Bank or the trustee may amend these allocations to reflect the most appropriate standards consistent with changing circumstances. Any such fundamental amendments in strategy will be discussed between the Bank and the trustee prior to implementation.
Based on the above considerations, the following asset allocation ranges will be implemented:
|
|
|
|
|
|
|
|
Asset Allocation Parameters by Asset Class | |||
| Minimum | Target | Maximum |
Equity |
|
|
|
Large-Cap U.S. |
|
| |
Mid/Small-Cap U.S. |
|
| |
Non-U.S. |
|
| |
Total-Equity | |||
|
|
|
|
Fixed Income |
|
|
|
Long/Short Duration |
|
| |
Money Market/Certificates of Deposit |
|
| |
Total-Fixed Income | |||
|
|
|
|
|
|
|
|
The parameters for each asset class provide the trustee with the latitude for managing the Pension Plan within a minimum and maximum range. The trustee has full discretion to buy, sell, invest and reinvest in these asset segments based on these guidelines which includes allowing the underlying investments to fluctuate within the stated policy ranges. The Pension Plan maintains a cash equivalents component (not to exceed
The trustee monitors the actual asset segment exposures of the Pension Plan on a regular basis and, periodically, may adjust the asset allocation within the ranges set forth above as it deems appropriate. Periodic reallocations of assets are based on the trustee’s perception of the changing risk/return opportunities of the respective asset classes.
Determination of Long-Term Rate of Return
The long-term rate of return on assets assumption was set based on historical returns earned by equities and fixed income securities, adjusted to reflect expectations of future returns as applied to the Pension Plan’s target allocation of asset classes. Equities and fixed income securities were assumed to earn real rates of return in the ranges of
Note 12 - Benefits Plan (continued)
|
|
|
|
|
|
|
|
|
|
|
|
|
|
|
|
|
|
|
|
|
|
|
|
Asset Category |
| Total |
|
| (Level 1) |
|
| (Level 2) |
|
| (Level 3) |
Mutual funds-Equity |
|
|
|
|
|
|
|
|
|
|
|
Large-Cap Value (a) | $ | |
| $ | |
| $ | - |
| $ | - |
Large-Cap Growth (b) |
| |
|
| |
|
| - |
|
| - |
Diversified Emerging Markets (f) |
| |
|
| |
|
| - |
|
| - |
Large Blend (d) |
| |
|
| |
|
| - |
|
| - |
Technology (g) |
| |
|
| |
|
| - |
|
| - |
Mutual Funds-Fixed Income |
|
|
|
|
|
|
|
|
|
|
|
Long Government (h) |
| |
|
| |
|
| - |
|
| - |
Multi-Sector Bond (c) |
| |
|
| |
|
| - |
|
| - |
High Yield Bond (e) |
| |
|
| |
|
| - |
|
| - |
Intermediate Core Bond (i) |
| |
|
| |
|
|
|
|
|
|
BCB Common Stock |
| |
|
| |
|
| - |
|
| - |
Cash Equivalents |
|
|
|
|
|
|
|
|
|
|
|
Money Market |
| |
|
| |
|
| - |
|
| - |
Total | $ | |
| $ | |
| $ | - |
| $ | - |
The fair values of the Company’s pension plan assets at December 31, 2022, by asset category (see Note 2 for the definitions of levels), are as follows (In Thousands):
|
|
|
|
|
|
|
|
|
|
|
|
|
|
|
|
|
|
|
|
|
|
|
|
|
|
|
|
|
|
|
|
|
|
|
|
|
|
|
|
|
|
|
|
|
|
|
|
Asset Category |
| Total |
|
| (Level 1) |
|
| (Level 2) |
|
| (Level 3) |
Mutual funds-Equity |
|
|
|
|
|
|
|
|
|
|
|
Large-Cap Value (a) | $ |
| $ |
| $ | - |
| $ | - | ||
Large-Cap Growth (b) |
|
|
|
|
| - |
|
| - | ||
Diversified Emerging Markets (f) |
|
|
|
|
| - |
|
| - | ||
Large Blend (d) |
|
|
|
|
| - |
|
| - | ||
Technology (g) |
|
|
|
|
| - |
|
| - | ||
Mutual Funds-Fixed Income |
|
|
|
|
|
|
|
|
|
|
|
Long Government (h) |
|
|
|
|
| - |
|
| - | ||
Multi-Sector Bond (c) |
|
|
|
|
| - |
|
| - | ||
High Yield Bond (e) |
|
|
|
|
| - |
|
| - | ||
Intermediate Core Bond (i) |
|
|
|
|
| - |
|
| - | ||
BCB Common Stock |
|
|
|
|
| - |
|
| - | ||
Cash Equivalents |
|
|
|
|
|
|
|
|
|
|
|
Money Market |
|
|
|
|
| - |
|
| - | ||
Total | $ | |
| $ | |
| $ | - |
| $ | - |
|
|
|
|
|
|
|
|
|
|
|
|
a)Large-value portfolios invest primarily in big U.S. companies that are less expensive or growing more slowly than other large-cap stocks. Stocks in the top 70 percent of the capitalization of the U.S. equity market are defined as large cap. Value is defined based on low valuations (low price ratios and high dividend yields) and slow growth (low growth rates for earnings, sales, book value, and cash flow).
b)Large Cap Growth Stocks of large cap companies that are projected to grow faster than other large cap stocks. Stocks in the top 70% of the capitalization of the U.S. equity market defined as large cap. Growth is defined based on fast growth (high growth rates for earnings, sales, book value, and cash flow) and high valuations (high price ratios and low dividend yields).
c)Multi Sector portfolios seek income by diversifying their assets among several fixed-income sectors, usually U.S. government obligations, foreign bonds, and high-yield domestic debt securities.
d)This fund invests in 500 of the largest U.S. companies, which span many different industries and account for about three-fourths of the U.S. Stock Markets value.
e)High Yield Bond funds invest at least 65 percent of assets in bonds rated below BBB. This fund seeks to provide shareholders with a high level of current income with capital growth as a secondary objective.
f)The fund invests at least 80% of the value of its assets in equity securities and equity related instruments that are tied economically to emerging markets.
g)The fund normally invests at least 80% of the fund’s net assets in securities of issuers principally engaged in offering, using or developing products, processes or services that will provide or benefit significantly from technological advances and improvements.
h)The fund normally invests at least 80% of assets in securities included in the Bloomberg Barclays U.S. Long Treasury Bond Index.
i)Intermediate term core bond portfolios invest primarily in investment grade U.S. fixed-income issues including government, corporate, and securitized debt, and hold less than 5% in below-investment grade exposures.
Note 12 - Benefits Plan (continued)
The Company does not expect to contribute, based upon actuarial estimates, to the Pension Plan in 2024.
Benefit payments are expected to be paid for the years ended December 31 as follows (In thousands):
|
|
|
|
|
|
2024 | $ | |
2025 |
| |
2026 |
| |
2027 |
| |
2028 |
| |
2029-2033 |
| |
|
|
|
Equity Incentive Plans
The Company, under the plan approved by its shareholders on April 27, 2023 (“2023 Equity Incentive Plan”), authorized the issuance of up to
The Company, under the plan approved by its shareholders on April 26, 2018 (“2018 Equity Incentive Plan”), authorized the issuance of up to
The Company, under the plan approved by its shareholders on April 28, 2011 (“2011 Stock Plan”), authorized the issuance of up to
On January 31, 2023, awards of
On June 30, 2023, an award of
On September 30, 2022, awards of
The following table presents the share-based compensation expense for the years ended December 31, 2023, 2022 and 2021 (In Thousands).
|
|
|
|
|
|
|
|
|
|
|
|
|
|
|
|
|
|
| Years Ended December 31, | |||||||
|
| 2023 |
|
| 2022 |
|
| 2021 |
Stock Option Expense | $ | |
| $ | |
| $ | |
Restricted Stock Expense |
| |
|
| |
|
| |
Total share-based compensation expense | $ | |
| $ | |
| $ | |
|
|
|
|
|
|
|
|
|
The following is a summary of the status of the Company’s restricted shares as of December 31, 2023.
|
|
|
|
|
|
|
|
|
|
| Number of Shares Awarded |
|
| Weighted Average Grant Date Fair Value |
Non-vested at December 31, 2022 | |
|
| $ |
Granted | |
|
| |
Vested | ( |
|
| |
Forfeited |
|
|
|
|
Non-vested at December 31, 2023 | |
|
| $ |
|
|
|
|
|
The remaining non-vested restricted shares outstanding as of December 31, 2023 will be charged to expense in 2024-2025, totaling $
Note 12 - Benefits Plan (continued)
A summary of stock option activity, follows:
|
|
|
|
|
|
|
|
|
|
|
|
|
|
|
| Number of Options |
|
| Range of Exercise Price |
|
| Weighted Average Exercise Price |
| Weighted Average Remaining Contractual Term |
|
| Aggregate Intrinsic Value (000's) |
Outstanding at January 1, 2022 |
|
| $ |
| $ |
|
| $ | | ||||
Options forfeited |
| - |
|
| - |
|
| - |
| - |
|
| - |
Options exercised (1) |
| ( |
|
|
|
|
| - |
|
| - | ||
Options granted |
| - |
|
| - |
|
| - |
| - |
|
| - |
Options expired |
| - |
|
| - |
|
| - |
| - |
|
| - |
Outstanding at December 31, 2022 |
|
| $ |
| $ |
|
| $ | | ||||
Options forfeited |
| - |
|
| - |
|
| - |
| - |
|
| - |
Options exercised |
| ( |
|
| |
|
| |
| - |
|
| - |
Options granted |
| - |
|
| - |
|
| - |
| - |
|
| - |
Options expired |
| - |
|
| - |
|
| - |
| - |
|
| - |
Outstanding at December 31, 2023 |
|
| $ |
| $ | |
|
| $ | | |||
Exercisable at December 31, 2023 |
|
|
|
|
|
|
|
|
|
|
|
| |
|
|
|
|
|
|
|
|
|
|
|
|
|
|
__________
(1) Includes
It is Company policy to issue new shares upon share option exercise. Expected future compensation expense relating to the
There were
|
|
|
|
|
|
Supplemental Executive Retirement Plan
The Bank entered into a Supplemental Executive Retirement Agreement (the “SERP Agreement”) with its Chief Executive Officer (“the CEO”) in December 2021, payable in the form of a life annuity.
On December 14, 2023, the Company closed a private placement of Series J Noncumulative Perpetual Stock, par value $
On September 14, 2023, the Company redeemed
Note 14 – Goodwill and Other Intangible Assets
The Company’s intangible assets consist of goodwill and core deposit intangibles in connection with acquisitions. The initial recording of goodwill and other intangible assets requires subjective judgments concerning estimates of the fair value of the acquired assets and assumed liabilities. Goodwill is not amortized but is subject to annual tests for impairment or more often if events or circumstances indicate it may be impaired.
Amortization expense of the core deposit intangibles was $
The Company’s core deposit intangibles are amortized on an accelerated basis using an estimated life of
The Company conducts impairment analysis on goodwill at least annually or more often as conditions require. Pursuant to ASC 350-20-35, the Company conducted a qualitative assessment of goodwill as of October 31, 2023, and determined that it was more likely than not that goodwill was not impaired. Accordingly, there was
Payment of cash dividends on common stock is conditional on earnings, financial condition, cash needs, capital considerations, the discretion of the Board of Directors of the Company, and compliance with regulatory requirements. State and federal law and regulations impose limitations on the Bank’s ability to pay dividends to the Company. Under New Jersey law, the Company is permitted to declare dividends on its common stock only if, after payment of the dividend, the capital stock of the Bank will be unimpaired and the Bank will have a surplus of no less than
The components of income tax expense are summarized as follows:
|
|
|
|
|
|
|
|
|
|
|
|
|
|
|
|
|
|
| Years Ended December 31, | |||||||
|
| 2023 |
|
| 2022 |
|
| 2021 |
| (In Thousands) | |||||||
Current income tax expense: |
|
|
|
|
|
|
|
|
Federal | $ | |
| $ | |
| $ | |
State |
| |
|
| |
|
| |
|
| |
|
| |
|
| |
Deferred income tax benefit: |
|
|
|
|
|
|
|
|
Federal |
| ( |
|
| ( |
|
| ( |
State |
| ( |
|
| ( |
|
| ( |
|
| ( |
|
| ( |
|
| ( |
Total Income Tax Expense | $ | |
| $ | |
| $ | |
The tax effects of existing temporary differences that give rise to significant portions of the deferred income tax assets and deferred income tax liabilities are as follows:
|
|
|
|
|
|
|
|
|
|
|
|
| December 31, | ||||
|
| 2023 |
|
| 2022 |
Deferred income tax assets: | (In Thousands) | ||||
Allowance for credit losses | $ | |
| $ | |
Other real estate owned expenses |
| - |
|
| |
Non-accrual interest |
| |
|
| |
Benefit plan-accumulated other comprehensive loss |
| |
|
| |
Purchase accounting adjustment on loans receivable acquired |
| - |
|
| |
Net operating loss carry forwards |
| |
|
| |
Lease liability |
| |
|
| |
Unrealized loss on securities |
| |
|
| |
Capital loss carryover |
| |
|
| |
Deferred fees and costs |
| |
|
| |
Other |
| |
|
| |
|
| |
|
| |
Deferred income tax liabilities: |
|
|
|
|
|
Purchase accounting adjustment on premises and equipment acquired |
| |
|
| |
Right-of-use assets |
| |
|
| |
SBA servicing asset |
| |
|
| |
Borrowing modification |
| |
|
| |
Benefit plans |
| |
|
| |
|
| |
|
| |
Net Deferred Tax Asset | $ | |
| $ | |
Note 16 - Income Taxes (continued)
A summary of the change in the net deferred tax asset is as follows:
|
|
|
|
|
|
|
|
|
|
|
|
| Years Ended December 31, | ||||
|
| 2023 |
|
| 2022 |
| (In Thousands) | ||||
Balance at beginning of year: | $ | |
| $ | |
Effect of adopting ASU No. 2016-13 ("CECL") |
| ( |
|
| - |
Deferred tax benefit |
| |
|
| |
Other comprehensive income |
|
|
|
|
|
Available-for-sale securities |
| |
|
| |
Benefit plan |
| |
|
| ( |
Balance at end of year | $ | |
| $ | |
In assessing the realizability of deferred tax assets, management considers whether it is more likely than not that some portion or all of the deferred tax assets will not be realized. In making this assessment, management has considered the profitability of current core operations, future market growth, forecasted earnings, future taxable income, and ongoing, feasible and permissible tax planning strategies. If the Company was to determine that it would not be able to realize a portion of its net deferred tax asset in the future for which there is currently no valuation allowance, an adjustment to the net deferred tax asset would be charged to earnings in the period such determination was made. The ultimate realization of deferred tax assets is dependent upon the generation of future taxable income and capital gains during the periods in which temporary differences are deductible and carry forwards are available. The Company believes it will generate sufficient future taxable income and taxable gains to realize the tax benefits related to the remaining net deferred tax assets in our consolidated balance sheet.
In conjunction with the Company’s acquisition of IA Bancorp in 2018, the Company acquired a federal net operating loss carry forward of $
The following table presents a reconciliation between the reported income tax expense and the income tax expense which would be computed by applying the normal federal income tax rate of
|
|
|
|
|
|
|
|
|
|
|
|
|
|
|
|
|
|
|
|
|
|
|
|
| Years Ended December 31, | ||||||||||
|
| 2023 |
|
|
| 2022 |
|
|
| 2021 |
|
| (In Thousands) | ||||||||||
Federal income tax expense at statutory rate | $ | |
|
| $ |
|
| $ |
| ||
Increases in income taxes resulting from: |
|
|
|
|
|
|
|
|
|
|
|
State income tax , net of federal income tax effect |
| |
|
|
|
|
|
|
| ||
Tax-exempt income |
| ( |
|
|
| ( |
|
|
| ( |
|
Bank-owned life insurance earnings |
| ( |
|
|
| ( |
|
|
| ( |
|
Other items, net |
| ( |
|
|
|
|
|
| ( |
| |
Effective Income Tax Expense | $ | |
|
| $ |
|
| $ |
| ||
Effective Income Tax Rate |
| | % |
|
| % |
|
| % | ||
The Bank is a party to financial instruments with off-balance-sheet risk in the normal course of business to meet the financing needs of its customers. These financial instruments primarily include commitments to extend credit. The Bank’s exposure to credit loss, in the event of nonperformance by the other party to the financial instrument for commitments to extend credit, is represented by the contractual amount of those instruments. The Bank uses the same credit policies in making commitments and conditional obligations as it does for on-balance-sheet instruments.
Outstanding loan related commitments were as follows:
|
|
|
|
|
|
|
|
|
|
|
|
|
|
|
|
|
|
| December 31, | |||||||
|
| 2023 |
|
| 2022 |
|
| 2021 |
| (In Thousands) | |||||||
Loan origination commitments | $ | |
| $ | |
| $ | |
Standby letters of credit |
| |
|
| |
|
| |
Construction loans in process |
| |
|
| |
|
| |
Unused lines of credit |
| |
|
| |
|
| |
| $ | |
| $ | |
| $ | |
Commitments to extend credit are agreements to lend to a customer as long as there is no violation of any condition established in the contract. Commitments generally have fixed expiration dates or other termination clauses and may require payment of a fee. Since many of the commitments are expected to expire without being drawn upon, total commitment amounts do not necessarily represent future cash requirements. The Bank evaluates each customer’s creditworthiness on a case-by-case basis. The amount of collateral obtained, if deemed necessary by the Bank upon extension of credit, is based on management’s credit evaluation of the counterparty. Collateral held varies but primarily includes residential real estate properties.
Note 17- Commitments and Contingencies (continued)
Leases
At December 31, 2023, the Company leased
The Company evaluates its contracts and service agreements in order to determine if there is an asset imbedded in such contracts and agreements. Such determination is based upon whether there is a specific asset covered by the agreement, whether the Company is entitled to all of the economic benefits to the asset over the term of the agreement, and whether the Company has full control and use of the asset over the term of the agreement without substitution rights or direction of use of the asset by the lessor.
The Company includes in its determination of its lease liability and concurrent right of use asset those renewal or purchase options for which it is reasonably certain it will exercise. Currently, the Company does not expect to exercise such purchase options and, accordingly, those are excluded in the determination of the lease liabilities and the concurrent right of use assets.
The Company has elected not to recognize a lease liability and a right of use asset for leases with a lease term of 12 or fewer months.
To calculate its lease liabilities, the Company used a discount rate based upon the applicable borrowing rates of the Federal Home Loan Bank at the inception of the lease agreement, which corresponds to the length of the lease term.
Note 17- Commitments and Contingencies (continued)
The following tables present certain information related to the Company’s lease obligations (in thousands):
|
|
|
|
|
|
|
| Twelve Months Ended December 31, 2023 |
|
| Twelve Months Ended December 31, 2022 |
Operating lease cost | $ | |
| $ | |
Variable lease cost-operating leases |
| |
|
| |
| $ | |
| $ | |
|
|
|
|
|
|
|
| At December 31, 2023 |
|
| At December 31, 2022 |
Supplemental balance sheet information related to leases: |
|
|
|
|
|
Operating Leases |
|
|
|
|
|
Operating lease right-of-use assets | $ | |
| $ | |
|
|
|
|
|
|
Operating Lease Liabilities: |
|
|
|
|
|
Current liabilities | $ | |
| $ | |
Operating lease liabilities (noncurrent portion) |
| |
|
| |
Imputed interest |
| ( |
|
| ( |
Total operating lease liabilities | $ | |
| $ | |
The following tables summarize the Company’s weighted average remaining lease terms and weighted average discount rates:
|
|
|
|
|
|
|
|
|
|
Weighted Average Remaining Lease Term |
|
|
|
|
|
|
|
|
|
Operating leases |
| | years |
| | years |
| | years |
|
|
|
|
|
|
|
|
|
|
Weighted Average Discount Rate |
|
|
|
|
|
|
|
|
|
Operating leases |
| | % |
| | % |
| | % |
The following table summarizes the Company’s maturity of lease obligations for operating leases at December 31, 2023 (in thousands):
|
|
|
Maturities of lease liabilities (discounted): | ||
|
| At December 31, 2023 |
|
| Operating Leases |
One year or less | $ | |
Over one year through three years |
| |
Over three years through five years |
| |
Over five years |
| |
Gross Operating Lease Liabilities | $ | |
Imputed Interest |
| ( |
Total Operating Lease Liabilities | $ | |
|
|
|
Legal Contingencies
Management uses its best judgment in estimating the fair value of the Company’s financial instruments; however, there are inherent weaknesses in any estimation technique. Therefore, for substantially all financial instruments, the fair value estimates herein are not necessarily indicative of the amounts the Company could have realized in a sales transaction on the dates indicated. The estimated fair value amounts have been measured as of their respective year-ends and have not been re-evaluated or updated for purposes of these consolidated financial statements subsequent to those respective dates. As such, the estimated fair values of these financial instruments subsequent to the respective reporting dates may be different than the amounts reported at each year-end.
ASC Topic 820, Fair Value Measurements and Disclosures, establishes a fair value hierarchy that prioritizes the inputs to valuation methods used to measure fair value. The hierarchy gives the highest priority to unadjusted quoted prices in active markets for identical assets or liabilities (Level 1 measurements) and the lowest priority to unobservable inputs (Level 3 measurements).
An asset’s or liability’s level within the fair value hierarchy is based on the lowest level of input that is significant to the fair value measurement. There were
For assets measured at fair value on a recurring basis, the fair value measurements, by level, within the fair value hierarchy are as follows:
|
|
|
|
|
|
|
|
|
|
|
|
|
|
|
|
|
|
|
|
|
|
|
|
|
|
|
|
|
|
| (Level 1) |
| (Level 2) |
|
|
| ||
|
|
|
|
| Quoted Prices in |
| Significant |
| (Level 3) | |||
|
|
|
|
| Active Markets |
| Other |
| Significant | |||
|
|
|
|
| for Identical |
| Observable |
| Unobservable | |||
Description |
| Total |
| Assets |
| Inputs |
| Inputs | ||||
|
| (In Thousands) | ||||||||||
As of December 31, 2023: |
|
|
|
|
|
|
|
|
|
|
|
|
Securities Available-for-Sale |
|
|
|
|
|
|
|
|
|
|
|
|
Debt Securities Available-for-Sale |
| $ | |
| $ | - |
| $ | |
| $ | - |
Marketable Equities |
|
| |
|
| |
|
| - |
|
| - |
Total Securities Available-for-Sale |
| $ | |
| $ | |
| $ | |
| $ | - |
|
|
|
|
|
|
|
|
|
|
|
|
|
As of December 31, 2022: |
|
|
|
|
|
|
|
|
|
|
|
|
Securities Available for Sale |
|
|
|
|
|
|
|
|
|
|
|
|
Debt Securities Available-for-Sale |
| $ | |
| $ | - |
| $ | |
| $ | - |
Marketable Equities |
|
| |
|
| |
|
| - |
|
| - |
Total Securities Available-for-Sale |
| $ | |
| $ | |
| $ | |
| $ | - |
|
|
|
|
|
|
|
|
|
|
|
|
|
As of December 31, 2021: |
|
|
|
|
|
|
|
|
|
|
|
|
Securities Available for Sale |
|
|
|
|
|
|
|
|
|
|
|
|
Debt Securities Available-for-Sale |
| $ | |
| $ | - |
| $ | |
| $ | - |
Marketable Equities |
|
| |
|
| |
|
| - |
|
| - |
Total Securities Available-for-Sale |
| $ | |
| $ | |
| $ | |
| $ | - |
For assets measured at fair value on a nonrecurring basis, the fair value measurements by level within the fair value hierarchy are as follows:
|
|
|
|
|
|
|
|
|
|
|
|
|
|
|
|
|
|
|
|
|
|
|
|
|
|
|
|
|
|
| (Level 1) |
| (Level 2) |
|
|
| ||
|
|
|
|
| Quoted Prices in |
| Significant |
| (Level 3) | |||
|
|
|
|
| Active Markets |
| Other |
| Significant | |||
|
|
|
|
| for Identical |
| Observable |
| Unobservable | |||
Description |
| Total |
| Assets |
| Inputs |
| Inputs | ||||
|
| (In Thousands) | ||||||||||
As of December 31, 2023: |
|
|
|
|
|
|
|
|
|
|
|
|
Individually Evaluated Loans |
| $ | |
| $ | - |
| $ | - |
| $ | |
|
|
|
|
|
|
|
|
|
|
|
|
|
As of December 31, 2022: |
|
|
|
|
|
|
|
|
|
|
|
|
Individually Evaluated Loans |
| $ | |
| $ | - |
| $ | - |
| $ | |
Other real estate owned |
| $ | |
| $ | - |
| $ | - |
| $ | |
Certain individually evaluated loans were adjusted to the fair value, less costs to sell, of the underlying collateral securing these loans resulting in losses. The loss is not recorded directly as an adjustment to current earnings, but rather as a component in determining the allowance for credit losses. Fair value was measured using appraised values of collateral and adjusted as necessary by management based on unobservable inputs for specific properties. Losses (recoveries) on individually evaluated loans for the years ended December 31, 2023, 2022 and 2021 were $
Note 18 - Fair Value Measurements and Fair Values of Financial Instruments (continued)
|
|
|
|
|
|
|
|
|
|
|
|
Quantitative Information about Level 3 Fair Value Measurements | |||||
|
| Fair Value | Valuation | Unobservable | Range |
|
| Estimate | Techniques | Input |
|
December 31, 2023: |
|
|
|
|
|
Individually Evaluated Loans | $ | | Appraisal of collateral (1) | Appraisal adjustments (2) | |
|
|
|
|
|
|
|
|
|
|
|
|
|
|
|
|
|
|
Quantitative Information about Level 3 Fair Value Measurements | |||||
|
| Fair Value | Valuation | Unobservable | Range |
|
| Estimate | Techniques | Input |
|
December 31, 2022: |
|
|
|
|
|
Individually Evaluated Loans | $ | Appraisal of collateral (1) | Appraisal adjustments (2) | ||
|
|
|
|
|
|
Other Real Estate Owned | $ | Appraisal of collateral (1) | Appraisal adjustments (2) | ||
|
|
|
|
|
|
(1)Fair value is generally determined through independent appraisals of the underlying collateral, which generally include various level 3 inputs which are not identifiable.
(2)Appraisals may be adjusted by management for qualitative factors such as age of appraisal, expected condition of property, economic conditions, and estimated liquidation expenses. The range of liquidation expenses and other appraisal adjustments are presented as a percent of the appraisal.
The following information should not be interpreted as an estimate of the fair value of the entire Company since a fair value calculation is only provided for a limited portion of the Company’s assets and liabilities. Due to a wide range of valuation techniques and the degree of subjectivity used in making the estimates, comparisons between the Company’s disclosures and those of other companies may not be meaningful. The following methods and assumptions were used to estimate the fair values of the Company’s financial instruments at December 31, 2023 and 2022.
Cash and Cash Equivalents (Carried at Cost)
The carrying amounts reported in the consolidated statements of financial condition for cash and interest-earning deposits approximate those assets’ fair values.
Securities (Carried at Fair Value)
The fair value of securities is determined by obtaining quoted market prices on nationally recognized securities exchanges (Level 1), or matrix pricing (Level 2), which is a mathematical technique used widely in the industry to value debt securities without relying exclusively on quoted market prices for the specific securities but rather by relying on the securities’ relationship to other benchmark quoted prices.
Loans Held for Sale (Carried at Lower of Cost or Fair Value)
The fair value of loans held for sale is determined, when possible, using quoted secondary-market prices. If no such quoted prices exist, the fair value of a loan is determined using quoted prices for a similar loan or loans, adjusted for specific attributes of that loan. Loans held for sale are carried at the lower of cost or fair value.
Loans Receivable (Carried at Amortized Cost)
The fair values of loans, except for certain individually evaluated loans, are estimated using discounted cash flow analyses, using market rates at the date of the Statement of Financial Condition that reflect the credit and interest rate-risk inherent in the loans. Projected future cash flows are calculated based upon contractual maturity or call dates, projected repayments and prepayments of principal. Generally, for variable rate loans that reprice frequently and with no significant change in credit risk, fair values are based on carrying values.
Individually Evaluated Loans (Generally Carried at Fair Value)
Individually evaluated loans are those for which the Company has measured and recorded an ACL generally based on the fair value of the loan’s collateral, less estimated costs to sell. Fair value is generally determined based upon independent third-party appraisals of the properties, or discounted cash flows based upon the expected proceeds. These assets are included as Level 3 fair values, based upon the lowest level of input that is significant to the fair value measurements. The fair value at December 31, 2023 and 2022 consists of the loan balances of $
FHLB of New York Stock (Carried at Cost)
The carrying amount of restricted investment in bank stock approximates fair value, and considers the limited marketability of such securities.
Accrued Interest Receivable and Payable (Carried at Cost)
The carrying amount of accrued interest receivable and accrued interest payable approximates its fair value.
Note 18 - Fair Value Measurements and Fair Values of Financial Instruments (continued)
Deposits (Carried at Cost)
The fair values disclosed for demand deposits (e.g., interest and non-interest checking, passbook savings and money market accounts) are, by definition, equal to the amount payable on demand at the reporting date (i.e., their carrying amounts). Fair values for fixed-rate certificates of deposit are estimated using a discounted cash flow calculation that applies interest rates currently being offered in the market on certificates to a schedule of aggregated expected monthly maturities on time deposits.
Debt Including Subordinated Debentures (Carried at Cost)
Fair values of debt are estimated using discounted cash flow analysis, based on quoted prices for new long-term debt with similar credit risk characteristics, terms and remaining maturity. These prices obtained from this active market represent a market value that is deemed to represent the transfer price if the liability were assumed by a third party.
Off-Balance Sheet Financial Instruments
Fair values for the Bank’s off-balance sheet financial instruments (lending commitments and unused lines of credit) are based on fees currently charged in the market to enter into similar agreements, taking into account, the remaining terms of the agreements and the counterparties’ credit standing. The fair value of these commitments was deemed immaterial and is not presented in the accompanying table.
The carrying values and estimated fair values of financial instruments were as follows at December 31, 2023 and 2022:
|
|
|
|
|
|
|
|
|
|
|
|
|
|
|
|
|
|
| As of December 31, 2023 | ||||||||||||
|
|
|
|
|
|
|
| Quoted Prices in Active |
| Significant |
| Significant | |||
|
| Carrying |
|
|
|
| Markets for Identical Assets |
| Other Observable Inputs |
| Unobservable Inputs | ||||
|
| Value |
| Fair Value |
| (Level 1) |
| (Level 2) |
| (Level 3) | |||||
|
| (In Thousands) | |||||||||||||
Financial assets: |
|
|
|
|
|
|
|
|
|
|
|
|
|
|
|
Cash and cash equivalents |
| $ | |
| $ | |
| $ | |
| $ | - |
| $ | - |
Interest-earning time deposits |
|
| |
|
| |
|
| - |
|
| |
|
| - |
Debt securities available-for-sale |
|
| |
|
| |
|
| - |
|
| |
|
| - |
Equity investments |
|
| |
|
| |
|
| |
|
| - |
|
| - |
Loans held for sale |
|
| |
|
| |
|
| - |
|
| |
|
| - |
Loans receivable, net |
|
| |
|
| |
|
| - |
|
| - |
|
| |
FHLB of New York stock, at cost |
|
| |
|
| |
|
| - |
|
| |
|
| - |
Accrued interest receivable |
|
| |
|
| |
|
| - |
|
| |
|
| - |
|
|
|
|
|
|
|
|
|
|
|
|
|
|
|
|
Financial liabilities: |
|
|
|
|
|
|
|
|
|
|
|
|
|
|
|
Deposits |
|
| |
|
| |
|
| |
|
| |
|
| - |
Debt |
|
| |
|
| |
|
| - |
|
| |
|
| - |
Subordinated debentures |
|
| |
|
| |
|
| - |
|
| |
|
| - |
Accrued interest payable |
|
| |
|
| |
|
| - |
|
| |
|
| - |
|
|
|
|
|
|
|
|
|
|
|
|
|
|
|
|
|
|
| As of December 31, 2022 | ||||||||||||
|
|
|
|
|
|
|
| Quoted Prices in Active |
| Significant |
| Significant | |||
|
| Carrying |
|
|
|
| Markets for Identical Assets |
| Other Observable Inputs |
| Unobservable Inputs | ||||
|
| Value |
| Fair Value |
| (Level 1) |
| (Level 2) |
| (Level 3) | |||||
|
| (In Thousands) | |||||||||||||
Financial assets: |
|
|
|
|
|
|
|
|
|
|
|
|
|
|
|
Cash and cash equivalents |
| $ | |
| $ | |
| $ | |
| $ | - |
| $ | - |
Interest-earning time deposits |
|
| |
|
| |
|
| - |
|
| |
|
| - |
Debt securities available-for-sale |
|
| |
|
| |
|
| - |
|
| |
|
| - |
Equity investments |
|
| |
|
| |
|
| |
|
| - |
|
| - |
Loans held for sale |
|
| |
|
| |
|
| - |
|
| |
|
| - |
Loans receivable, net |
|
| |
|
| |
|
| - |
|
| - |
|
| |
FHLB of New York stock, at cost |
|
| |
|
| |
|
| - |
|
| |
|
| - |
Accrued interest receivable |
|
| |
|
| |
|
| - |
|
| |
|
| - |
|
|
|
|
|
|
|
|
|
|
|
|
|
|
|
|
Financial liabilities: |
|
|
|
|
|
|
|
|
|
|
|
|
|
|
|
Deposits |
|
| |
|
| |
|
| |
|
| |
|
| - |
Debt |
|
| |
|
| |
|
| - |
|
| |
|
| - |
Subordinated debentures |
|
| |
|
| |
|
| - |
|
| |
|
| - |
Accrued interest payable |
|
| |
|
| |
|
| - |
|
| |
|
| - |
Note 19 - Accumulated Other Comprehensive Loss
The components of accumulated other comprehensive loss included in stockholders' equity are as follows:
|
|
|
|
|
|
|
|
|
| At December 31, | |||||||
|
| 2023 |
|
| 2022 |
|
| 2021 |
| (In Thousands) | |||||||
|
|
|
|
|
|
|
|
|
Net unrealized loss on securities available-for-sale | $ | ( |
| $ | ( |
| $ | |
Tax effect |
| |
|
| |
|
| ( |
Net of tax amount |
| ( |
|
| ( |
|
| |
|
|
|
|
|
|
|
|
|
Benefit plan adjustments |
| ( |
|
| ( |
|
| ( |
Tax effect |
| |
|
| |
|
| |
Net of tax amount |
| ( |
|
| ( |
|
| ( |
|
|
|
|
|
|
|
|
|
Accumulated other comprehensive loss | $ | ( |
| $ | ( |
| $ | |
|
|
|
|
|
|
|
|
|
|
|
|
STATEMENTS OF FINANCIAL CONDITION |
|
|
|
|
|
| Years Ended December 31, | ||||
|
| 2023 |
|
| 2022 |
| (In Thousands) | ||||
Assets |
|
|
|
|
|
Cash and due from banks | $ | |
| $ | |
Investment in subsidiaries |
| |
|
| |
Restricted common stock |
| |
|
| |
Other assets |
| |
|
| |
Total assets |
| |
|
| |
Liabilities and Stockholders' Equity |
|
|
|
|
|
Liabilities |
|
|
|
|
|
Subordinated debentures | $ | |
| $ | |
Other liabilities |
| |
|
| |
Total liabilities |
| |
|
| |
Stockholders' Equity |
| |
|
| |
Total Liabilities and Stockholders' Equity | $ | |
| $ | |
|
|
|
|
|
|
|
|
|
|
|
|
|
|
|
|
|
|
STATEMENTS OF OPERATIONS |
|
|
|
|
|
|
|
|
| Years Ended December 31, | |||||||
|
| 2023 |
|
| 2022 |
|
| 2021 |
| (In Thousands) | |||||||
Dividends from Bank | $ | |
| $ | |
| $ | |
Interest and dividends from investments |
| |
|
| - |
|
| - |
Total Income |
| |
|
| |
|
| |
Interest expense, borrowed money |
| |
|
| |
|
| |
Other |
| |
|
| |
|
| |
Total Expense |
| |
|
| |
|
| |
Income before Income Tax Benefit and Equity in Undistributed Earnings of Subsidiaries |
| |
|
| |
|
| |
Income tax benefit |
| ( |
|
| ( |
|
| ( |
Income before Equity in Undistributed Earnings of Subsidiaries |
| |
|
| |
|
| |
Equity in undistributed earnings of subsidiaries |
| |
|
| |
|
| |
Net Income | $ | |
| $ | |
| $ | |
Note 20 - Parent Only Condensed Financial Information
|
|
|
|
|
|
|
|
|
|
|
|
|
|
|
|
|
|
STATEMENTS OF CASH FLOWS |
|
|
|
|
|
|
|
|
| Years Ended December 31, | |||||||
|
| 2023 |
|
| 2022 |
|
| 2021 |
| (In Thousands) | |||||||
Cash Flows from Operating Activities |
|
|
|
|
|
|
|
|
Net Income | $ | |
| $ | |
| $ | |
Adjustments to reconcile net income to net cash provided by operating activities: |
|
|
|
|
|
|
|
|
Amortization |
| |
|
| |
|
| |
Equity in undistributed earnings of subsidiaries |
| ( |
|
| ( |
|
| ( |
Decrease (increase) in other assets |
| ( |
|
| |
|
| ( |
(Decrease) increase in other liabilities |
| ( |
|
| ( |
|
| |
Net Cash Provided By Operating Activities |
| |
|
| |
|
| |
Cash Flows from Investing Activities |
|
|
|
|
|
|
|
|
Additional investment in subsidiary |
| ( |
|
| ( |
|
| ( |
Net Cash Used In Investing Activities | $ | ( |
| $ | ( |
| $ | ( |
Cash Flows from Financing Activities |
|
|
|
|
|
|
|
|
Proceeds from issuance of preferred stock |
| |
|
| |
|
| |
Redemption of preferred stock |
| ( |
|
| ( |
|
| - |
Proceeds from issuance of common stock |
| |
|
| |
|
| |
Cash dividends paid |
| ( |
|
| ( |
|
| ( |
Purchase of treasury stock |
| ( |
|
| ( |
|
| ( |
Net Cash Used in Financing Activities |
| ( |
|
| ( |
|
| ( |
Net Increase (Decrease) in Cash and Cash Equivalents |
| ( |
|
| ( |
|
| |
Cash and Cash Equivalents - Beginning | $ | |
| $ | |
| $ | |
Cash and Cash Equivalents - Ending | $ | |
| $ | |
| $ | |
|
|
|
|
|
|
|
|
|
Subsequent Events are events or transactions that occur after the balance sheet date but before financial statements are issued or available to be issued. Financial statements are considered issued when they are widely distributed to stockholders and other financial statement users for general use and reliance in a form and format that complies with GAAP.
On
ITEM 9. CHANGES IN AND DISAGREEMENTS WITH ACCOUNTANTS ON ACCOUNTING AND FINANCIAL DISCLOSURE
Not applicable.
ITEM 9A. CONTROLS AND PROCEDURES
(a)Evaluation of disclosure controls and procedures.
Under the supervision and with the participation of our management, including our Chief Executive Officer and Chief Financial Officer, we evaluated the effectiveness of the design and operation of our disclosure controls and procedures (as defined in Rule 13a-15(e) and 15d-15(e) under the Exchange Act) as of December 31, 2023 (the “Evaluation Date”). Based upon that evaluation, the Chief Executive Officer and Chief Financial Officer concluded that, as of the Evaluation Date, our disclosure controls and procedures were effective in timely alerting them to the material information relating to us (or our consolidated subsidiaries) required to be included in our periodic SEC filings.
(b)Management’s Annual Report on Internal Control over Financial Reporting.
Management of BCB Bancorp, Inc., and subsidiaries (the “Company”) is responsible for establishing and maintaining adequate internal control over financial reporting. The Company’s system of internal control is designed under the supervision of management, including our Chief Executive Officer and Chief Financial Officer, to provide reasonable assurance regarding the reliability of our financial reporting and the preparation of the Company’s consolidated financial statements for external reporting purposes in accordance with accounting principles generally accepted in the United States of America (“GAAP”).
Our internal control over financial reporting includes policies and procedures that pertain to the maintenance of records that, in reasonable detail, accurately and fairly reflect transactions and dispositions of assets; provide reasonable assurances that transactions are recorded as necessary to permit preparation of consolidated financial statements in accordance with GAAP, and that receipts and expenditures are made only in accordance with the authorization of management and the Board of Directors; and provide reasonable assurance regarding prevention or timely detection of unauthorized acquisition, use, or disposition of the Company’s assets that could have a material effect on our consolidated financial statements. Because of its inherent limitations, internal control over financial reporting may not prevent or detect misstatements. Projections on any evaluation of effectiveness to future periods are subject to the risk that the controls may become inadequate because of changes in conditions or that the degree of compliance with policies and procedures may deteriorate.
As of December 31, 2023, management assessed the effectiveness of the Company’s internal control over financial reporting based upon the framework established in Internal Control – Integrated Framework (2013) issued by the Committee of Sponsoring Organizations of the Treadway Commission (COSO). Based upon its assessment, management believes that the Company’s internal control over financial reporting as of December 31, 2023 is effective and meets the criteria of the Internal Control – Integrated Framework (2013).
There were no changes in the Company’s internal control over financial reporting (as defined in Rule 13a-15(f) and 15d-15(f) under the Exchange Act) that occurred during the fourth fiscal quarter of 2023 that have materially affected, or are reasonably likely to materially affect, the Company’s internal control over financial reporting.
Wolf and Company, P.C., the independent registered public accounting firm that audited the Company’s consolidated financial statements, has issued an audit report on the Company’s internal control over financial reporting as of December 31, 2023 that appears in Item 8 of this Form 10-K.
ITEM 9B. OTHER INFORMATION
(a)Kenneth G. Emerson, the Chief Risk Officer of the Bank, resigned from his employment with the Bank on March 5, 2024.
(b)During the three months ended December 31, 2023, no directors or executive officers of the Company
ITEM 9C. DISCLOSURE REGARDING FOREIGN JURISDICTIONS THAT PREVENT INSPECTIONS
Not applicable.
PART III
ITEM 10. DIRECTORS, EXECUTIVE OFFICERS AND CORPORATE GOVERNANCE
The Company has adopted a Code of Ethics that applies to the Company’s Chief Executive Officer, Chief Financial Officer, Controller, and/or any persons performing similar functions. The Code of Ethics is available for free by writing to: President and Chief Executive Officer, BCB Bancorp, Inc., 104-110 Avenue C, Bayonne, New Jersey 07002. The Code of Ethics was filed as an exhibit to the Form 10-K for the year ended December 31, 2004 and is incorporated by reference as an exhibit to this report.
The section entitled “PROPOSAL NO. 1 ELECTION OF THE DIRECTOR NOMINEES OF THE BOARD OF DIRECTORS” section of the Company’s definitive Proxy Statement for the Company’s 2024 Annual Meeting of Stockholders (the “2024 Proxy Statement”).
In addition, the information under the captions “DELINQUENT SECTION 16(A) REPORTS”, “Code of Business Conduct and Ethics” and “CORPORATE GOVERNANCE - Committees of our Board of Directors – Audit Committee”” of the 2024 Proxy Statement is incorporated herein by reference.
There have been no changes during the last year in the procedures by which security holders may recommend nominees to the Company’s board of directors.
ITEM 11. EXECUTIVE COMPENSATION
The sections of the 2024 Proxy Statement entitled “EXECUTIVE COMPENSATION”, “DIRECTOR COMPENSATION” and “CORPORATE GOVERNANCE - Committees of our Board of Directors – Compensation Committee Interlocks and Insider Participation” are incorporated herein by reference.
ITEM 12. SECURITY OWNERSHIP OF CERTAIN BENEFICIAL OWNERS AND MANAGEMENT AND RELATED STOCKHOLDER MATTERS
The section of the 2024 Proxy Statement entitled “SECURITY OWNERSHIP OF CERTAIN BENEFICIAL OWNERS AND MANAGEMENT” is incorporated herein by reference.
The disclosure in this Form 10-K under the caption “ITEM 5. MARKET FOR REGISTRANT’S COMMON EQUITY, RELATED STOCKHOLDER MATTERS AND ISSUER PURCHASES OF EQUITY SECURITIES - Compensation Plans” is incorporated herein by reference.
ITEM 13. CERTAIN RELATIONSHIPS AND RELATED TRANSACTIONS, AND DIRECTOR INDEPENDENCE
The sections of the 2024 Proxy Statement entitled “CERTAIN RELATIONSHIPS AND RELATED TRANSACTIONS” and “CORPORATE GOVERNANCE - Independence of Directors” are incorporated herein by reference.
ITEM 14. PRINCIPAL ACCOUNTANT FEES AND SERVICES
Information required by Item 14 is incorporated by reference to the sections of the 2024 Proxy Statement entitled “AUDIT COMMITTEE REPORT - Fees of Independent Auditors’ and ‘-- Audit Committee Pre-Approval of Audit and Permissible Non-Audit Services by Independent Auditors.” .”
PART IV
ITEM 15. EXHIBITS AND FINANCIAL STATEMENT SCHEDULES
(a)(1) Financial Statements
The exhibits and financial statement schedules filed as a part of this Form 10-K are as follows:
(A) Report of Independent Registered Public Accounting Firm
(B) Consolidated Statements of Financial Condition as of December 31, 2023 and 2022
(C) Consolidated Statements of Operations for the years ended December 31, 2023, 2022 and 2021
(D) Consolidated Statements of Comprehensive Income for the years ended December 31, 2023, 2022 and 2021
(E) Consolidated Statements of Changes in Stockholders’ Equity for the years ended December 31, 2023, 2022 and 2021
(F) Consolidated Statements of Cash Flows for the years ended December 31, 2023, 2022 and 2021
(G) Notes to Consolidated Financial Statements
(a)(2) Financial Statement Schedules
All schedules are omitted because they are not required or applicable, or the required information is shown in the consolidated statements or the notes thereto.
(b) Exhibits
(1)Incorporated by reference to Exhibit 3.1 to the Form 8-K filed with the Securities and Exchange Commission on February 22, 2023.
(2)Incorporated by reference to Exhibit 4 to the Form 8-K-12g3 filed with the Securities and Exchange Commission on May 1, 2003.
(3)Incorporated by reference to Exhibit 4.3 to the Annual Report on Form 10-K filed with the Securities and Exchange Commission on March 11, 2020.
(4)Incorporated by reference to Exhibit 10.1 to the Form 8-K filed with the Securities and Exchange Commission on July 31, 2018.
(5)Incorporated by reference to Exhibit 4.1 to the Form 8-K filed with the Securities and Exchange Commission on July 31, 2018.
(6)Incorporated by reference to Exhibit 10.1 to the Company’s Form 8-K filed with the Securities and Exchange Commission on March 21, 2023.
(7)Incorporated by reference to Appendix A to the proxy statement for the Company’s Annual Meeting of Shareholders (File No. 000-50275), filed by the Company with the Securities and Exchange Commission on Schedule 14A on March 28, 2011.
(8)Incorporated by reference to Appendix A to the proxy statement for the Company’s Annual Meeting of Stockholders by the Company with the Securities and Exchange Commission on March 26, 2018.
(9)Incorporated by reference to Exhibit 10.1 to the Form 8-K filed with the Securities and Exchange Commission on January 3, 2022.
(10)Incorporated by reference to Exhibit 10.11 to the Annual Report on Form 10-K filed with the Securities and Exchange Commission on March 9, 2022.
(11)Incorporated by reference to Exhibit 10.12 to the Annual Report on Form 10-K filed with the Securities and Exchange Commission on March 9, 2022.
(12)Incorporated by reference to Appendix A to the proxy statement for the Company’s 2023 Annual Meeting of Stockholders filed by the Company with the Securities and Exchange Commission on March 21, 2023.
(13)Incorporated by reference to Exhibit 10.2 to the Form 8-K filed with the Securities and Exchange Commission on September 29, 2022.
(14)Incorporated by reference to Exhibit 10.2 to the Form 8-K filed with the Securities and Exchange Commission on March 21, 2023.
ITEM 16. FORM 10-K SUMMARY
None.
Signatures
Pursuant to the requirements of Section 13 of the Securities Exchange Act of 1934, the Registrant has duly caused this report to be signed on its behalf by the undersigned, thereunto duly authorized.
|
|
|
|
|
|
|
|
|
| BCB BANCORP, INC. |
|
|
|
|
|
|
|
Date: | March 8, 2024 |
| By: | /s/ Michael A. Shriner |
|
|
|
|
| Michael A. Shriner |
|
|
|
|
| President and Chief Executive Officer |
|
|
|
|
| (Principal Executive Officer) |
|
|
|
|
| (Duly Authorized Representative) |
|
Pursuant to the requirements of the Securities Exchange of 1934, this report has been signed below by the following persons on behalf of the Registrant and in the capacities and on the dates indicated.
|
|
|
|
|
|
|
|
|
|
|
|
|
|
|
Signatures |
| Title |
| Date |
|
|
|
|
|
/s/ Michael A. Shriner |
|
|
|
|
Michael A. Shriner |
| President, Chief Executive Officer and Director |
| March 8, 2024 |
|
| (Principal Executive Officer) |
|
|
|
|
|
|
|
/s/ Jawad Chaudhry |
|
|
|
|
Jawad Chaudhry |
| Chief Financial Officer |
| March 8, 2024 |
|
| (Principal Financial and Accounting Officer) |
|
|
|
|
|
|
|
/s/ Mark D. Hogan |
|
|
|
|
Mark D. Hogan |
| Chairman of the Board |
| March 8, 2024 |
|
|
|
|
|
/s/ Robert Ballance |
|
|
|
|
Robert Ballance |
| Director |
| March 8, 2024 |
|
|
|
|
|
/s/ Judith Q. Bielan |
|
|
|
|
Judith Q. Bielan |
| Director |
| March 8, 2024 |
|
|
|
|
|
/s/ Ryan Blake |
|
|
|
|
Ryan Blake |
| Director |
| March 8, 2024 |
|
|
|
|
|
/s/ James E. Collins |
|
|
|
|
James E. Collins |
| Director |
| March 8, 2024 |
|
|
|
|
|
/s/ Thomas Coughlin |
|
|
|
|
Thomas Coughlin |
| Director |
| March 8, 2024 |
|
|
|
|
|
/s/ Vincent DiDomenico, Jr. |
|
|
|
|
Vincent DiDomenico, Jr. |
| Director |
| March 8, 2024 |
|
|
|
|
|
/s/ Joseph Lyga |
|
|
|
|
Joseph Lyga |
| Director |
| March 8, 2024 |
|
|
|
|
|
/s/ John Pulomena |
|
|
|
|
John Pulomena |
| Director |
| March 8, 2024 |
|
|
|
|
|
/s/ James Rizzo |
|
|
|
|
James Rizzo |
| Director |
| March 8, 2024 |
|
|
|
|
|
/s/ Spencer B. Robbins |
|
|
|
|
Spencer B. Robbins |
| Director |
| March 8, 2024 |
|
|
|
|
|
|
|
|
|
|