bcs-20231231false2023FY0000312069P1YP1Y00003120692023-01-012023-12-310000312069dei:BusinessContactMember2023-01-012023-12-310000312069bcs:AmericanDepositorySharesMember2023-01-012023-12-310000312069bcs:A4375FixedRateSubordinatedNotesDue2024Member2023-01-012023-12-310000312069bcs:A365FixedRateSeniorNotesDue2025Member2023-01-012023-12-310000312069bcs:A525FixedRateSeniorNotesDue2045Member2023-01-012023-12-310000312069bcs:A4375FixedRateSeniorNotesDue2026Member2023-01-012023-12-310000312069bcs:A520FixedRateSubordinatedNotesDue2026Member2023-01-012023-12-310000312069bcs:A4337FixedRateSeniorNotesDue2028Member2023-01-012023-12-310000312069bcs:A4950FixedRateSeniorNotesDue2047Member2023-01-012023-12-310000312069bcs:A4836FixedRateSubordinatedCallableNotesDue2028Member2023-01-012023-12-310000312069bcs:A3250FixedRateSeniorNotesDue2033Member2023-01-012023-12-310000312069bcs:A4972FixedToFloatingRateSeniorNotesDue2029Member2023-01-012023-12-310000312069bcs:A3932FixedToFloatingRateSeniorNotesDue2025Member2023-01-012023-12-310000312069bcs:A5088FixedToFloatingRateSubordinatedNotesDue2030Member2023-01-012023-12-310000312069bcs:A2852FixedToFloatingRateSeniorNotesDue2026Member2023-01-012023-12-310000312069bcs:A2645FixedRateResettingSeniorCallableNotesDue2031Member2023-01-012023-12-310000312069bcs:A3564FixedRateResettingSubordinatedCallableNotesDue2035Member2023-01-012023-12-310000312069bcs:A2667FixedRateResettingSeniorCallableNotesDue2032Member2023-01-012023-12-310000312069bcs:A3811FixedRateResettingSubordinatedCallableNotesDue2042Member2023-01-012023-12-310000312069bcs:A2279FixedRateResettingSeniorCallableNotesDue2027Member2023-01-012023-12-310000312069bcs:A2894FixedRateResettingSeniorCallableNotesDue2032Member2023-01-012023-12-310000312069bcs:A3330FixedRateResettingSeniorCallableNotesDue2042Member2023-01-012023-12-310000312069bcs:A5304FixedRateResettingSeniorCallableNotesDue2026Member2023-01-012023-12-310000312069bcs:A5501FixedRateResettingSeniorCallableNotesDue2028Member2023-01-012023-12-310000312069bcs:A5746FixedRateResettingSeniorCallableNotesDue2033Member2023-01-012023-12-310000312069bcs:A7325FixedRateResettingSeniorCallableNotesDue2026Member2023-01-012023-12-310000312069bcs:A7385FixedRateResettingSeniorCallableNotesDue2028Member2023-01-012023-12-310000312069bcs:A7437FixedRateResettingSeniorCallableNotesDue2033Member2023-01-012023-12-310000312069bcs:A5829FixedToFloatingRateResettingSeniorCallableNotesDue2027Member2023-01-012023-12-310000312069bcs:A6224FixedToFloatingRateResettingSeniorCallableNotesDue2034Member2023-01-012023-12-310000312069bcs:A7119FixedToFloatingRateSubordinatedCallableNotesDue2034Member2023-01-012023-12-310000312069bcs:A6496FixedToFloatingRateSeniorCallableNotesDue2027Member2023-01-012023-12-310000312069bcs:A6490FixedToFloatingRateSeniorCallableNotesDue2029Member2023-01-012023-12-310000312069bcs:A6692FixedToFloatingRateSeniorCallableNotesDue2034Member2023-01-012023-12-310000312069bcs:FloatingRateSeniorCallableNotesDue2027Member2023-01-012023-12-3100003120692023-12-31xbrli:shares0000312069bcs:OnBalanceSheetAssetsMemberbcs:CashAndBankBalancesAtCentralBanksMemberifrs-full:CreditRiskMember2023-12-31iso4217:GBP0000312069bcs:OnBalanceSheetAssetsMemberbcs:BankAcceptanceAssetsMemberifrs-full:CreditRiskMember2023-12-310000312069ifrs-full:MortgagesMemberbcs:OnBalanceSheetAssetsMemberifrs-full:CreditRiskMember2023-12-310000312069bcs:CreditCardsRetailMemberbcs:OnBalanceSheetAssetsMemberifrs-full:CreditRiskMember2023-12-310000312069bcs:OtherRetailMemberbcs:OnBalanceSheetAssetsMemberifrs-full:CreditRiskMember2023-12-310000312069ifrs-full:CorporateLoansMemberbcs:OnBalanceSheetAssetsMemberifrs-full:CreditRiskMember2023-12-310000312069bcs:OnBalanceSheetAssetsMemberifrs-full:CreditRiskMemberifrs-full:LoansAndReceivablesCategoryMember2023-12-310000312069ifrs-full:MortgagesMemberbcs:OnBalanceSheetAssetsMemberifrs-full:FinancialInstrumentsCreditimpairedMemberifrs-full:CreditRiskMember2023-12-310000312069bcs:CreditCardsRetailMemberbcs:OnBalanceSheetAssetsMemberifrs-full:FinancialInstrumentsCreditimpairedMemberifrs-full:CreditRiskMember2023-12-310000312069bcs:OtherRetailMemberbcs:OnBalanceSheetAssetsMemberifrs-full:FinancialInstrumentsCreditimpairedMemberifrs-full:CreditRiskMember2023-12-310000312069ifrs-full:CorporateLoansMemberbcs:OnBalanceSheetAssetsMemberifrs-full:FinancialInstrumentsCreditimpairedMemberifrs-full:CreditRiskMember2023-12-310000312069bcs:OnBalanceSheetAssetsMemberifrs-full:FinancialInstrumentsCreditimpairedMemberifrs-full:CreditRiskMemberifrs-full:LoansAndReceivablesCategoryMember2023-12-310000312069ifrs-full:DebtSecuritiesMemberifrs-full:FinancialAssetsAtAmortisedCostCategoryMemberbcs:OnBalanceSheetAssetsMemberifrs-full:CreditRiskMember2023-12-310000312069bcs:OnBalanceSheetAssetsMemberbcs:ReverseRepurchaseAgreementsAndOtherSimilarSecuredLendingMemberifrs-full:CreditRiskMember2023-12-310000312069ifrs-full:DebtSecuritiesMemberbcs:OnBalanceSheetAssetsMemberifrs-full:FinancialAssetsAtFairValueThroughProfitOrLossClassifiedAsHeldForTradingCategoryMemberifrs-full:CreditRiskMember2023-12-310000312069bcs:OnBalanceSheetAssetsMemberifrs-full:FinancialAssetsAtFairValueThroughProfitOrLossClassifiedAsHeldForTradingCategoryMemberifrs-full:CreditRiskMemberbcs:TradedLoansMember2023-12-310000312069bcs:OnBalanceSheetAssetsMemberifrs-full:FinancialAssetsAtFairValueThroughProfitOrLossClassifiedAsHeldForTradingCategoryMemberifrs-full:CreditRiskMember2023-12-310000312069bcs:LoansAndAdvancesMemberbcs:OnBalanceSheetAssetsMemberifrs-full:CreditRiskMemberifrs-full:FinancialAssetsAtFairValueThroughProfitOrLossCategoryMember2023-12-310000312069ifrs-full:DebtSecuritiesMemberbcs:OnBalanceSheetAssetsMemberifrs-full:CreditRiskMemberifrs-full:FinancialAssetsAtFairValueThroughProfitOrLossCategoryMember2023-12-310000312069bcs:OnBalanceSheetAssetsMemberbcs:ReverseRepurchaseAgreementsMemberifrs-full:CreditRiskMemberifrs-full:FinancialAssetsAtFairValueThroughProfitOrLossCategoryMember2023-12-310000312069bcs:OtherFinancialAssetsMemberbcs:OnBalanceSheetAssetsMemberifrs-full:CreditRiskMemberifrs-full:FinancialAssetsAtFairValueThroughProfitOrLossCategoryMember2023-12-310000312069bcs:OnBalanceSheetAssetsMemberifrs-full:CreditRiskMemberifrs-full:FinancialAssetsAtFairValueThroughProfitOrLossCategoryMember2023-12-310000312069bcs:OnBalanceSheetAssetsMemberifrs-full:CreditRiskMemberifrs-full:DerivativesMember2023-12-310000312069bcs:OnBalanceSheetAssetsMemberifrs-full:FinancialAssetsAtFairValueThroughOtherComprehensiveIncomeCategoryMemberifrs-full:CreditRiskMember2023-12-310000312069ifrs-full:OtherAssetsMemberbcs:OnBalanceSheetAssetsMemberifrs-full:CreditRiskMember2023-12-310000312069ifrs-full:NoncurrentAssetsOrDisposalGroupsClassifiedAsHeldForSaleMemberbcs:OnBalanceSheetAssetsMemberifrs-full:CreditRiskMember2023-12-310000312069bcs:OnBalanceSheetAssetsMemberifrs-full:CreditRiskMember2023-12-310000312069bcs:OffBalanceSheetLoanCommitmentsAndFinancialGuaranteeContractsMemberifrs-full:CreditRiskMemberifrs-full:ItemsOfContingentLiabilitiesMember2023-12-310000312069ifrs-full:LoanCommitmentsMemberbcs:OffBalanceSheetLoanCommitmentsAndFinancialGuaranteeContractsMemberifrs-full:CreditRiskMember2023-12-310000312069bcs:OffBalanceSheetLoanCommitmentsAndFinancialGuaranteeContractsMemberifrs-full:CreditRiskMember2023-12-310000312069ifrs-full:CreditRiskMember2023-12-310000312069ifrs-full:AccumulatedImpairmentMemberifrs-full:FinancialAssetsAtAmortisedCostMemberbcs:OffBalanceSheetLoanCommitmentsAndFinancialGuaranteeContractsMember2023-12-310000312069ifrs-full:AccumulatedImpairmentMemberifrs-full:FinancialAssetsAtAmortisedCostMemberbcs:OffBalanceSheetLoanCommitmentsAndFinancialGuaranteeContractsMember2022-12-310000312069bcs:OffBalanceSheetLoanCommitmentsAndFinancialGuaranteeContractsMemberifrs-full:CreditRiskMember2022-12-310000312069ifrs-full:LoansToGovernmentMemberifrs-full:FinancialAssetsAtAmortisedCostCategoryMemberbcs:OnBalanceSheetAssetsMemberifrs-full:CreditRiskMember2023-12-310000312069ifrs-full:LoansToGovernmentMemberifrs-full:FinancialAssetsAtAmortisedCostCategoryMemberbcs:OnBalanceSheetAssetsMemberifrs-full:CreditRiskMember2022-12-310000312069bcs:OnBalanceSheetAssetsMemberbcs:CashAndBankBalancesAtCentralBanksMemberifrs-full:CreditRiskMember2022-12-310000312069bcs:OnBalanceSheetAssetsMemberbcs:BankAcceptanceAssetsMemberifrs-full:CreditRiskMember2022-12-310000312069ifrs-full:MortgagesMemberbcs:OnBalanceSheetAssetsMemberifrs-full:CreditRiskMember2022-12-310000312069bcs:CreditCardsRetailMemberbcs:OnBalanceSheetAssetsMemberifrs-full:CreditRiskMember2022-12-310000312069bcs:OtherRetailMemberbcs:OnBalanceSheetAssetsMemberifrs-full:CreditRiskMember2022-12-310000312069ifrs-full:CorporateLoansMemberbcs:OnBalanceSheetAssetsMemberifrs-full:CreditRiskMember2022-12-310000312069bcs:OnBalanceSheetAssetsMemberifrs-full:CreditRiskMemberifrs-full:LoansAndReceivablesCategoryMember2022-12-310000312069ifrs-full:MortgagesMemberbcs:OnBalanceSheetAssetsMemberifrs-full:FinancialInstrumentsCreditimpairedMemberifrs-full:CreditRiskMember2022-12-310000312069bcs:CreditCardsRetailMemberbcs:OnBalanceSheetAssetsMemberifrs-full:FinancialInstrumentsCreditimpairedMemberifrs-full:CreditRiskMember2022-12-310000312069bcs:OtherRetailMemberbcs:OnBalanceSheetAssetsMemberifrs-full:FinancialInstrumentsCreditimpairedMemberifrs-full:CreditRiskMember2022-12-310000312069ifrs-full:CorporateLoansMemberbcs:OnBalanceSheetAssetsMemberifrs-full:FinancialInstrumentsCreditimpairedMemberifrs-full:CreditRiskMember2022-12-310000312069bcs:OnBalanceSheetAssetsMemberifrs-full:FinancialInstrumentsCreditimpairedMemberifrs-full:CreditRiskMemberifrs-full:LoansAndReceivablesCategoryMember2022-12-310000312069ifrs-full:DebtSecuritiesMemberifrs-full:FinancialAssetsAtAmortisedCostCategoryMemberbcs:OnBalanceSheetAssetsMemberifrs-full:CreditRiskMember2022-12-310000312069bcs:OnBalanceSheetAssetsMemberbcs:ReverseRepurchaseAgreementsAndOtherSimilarSecuredLendingMemberifrs-full:CreditRiskMember2022-12-310000312069ifrs-full:DebtSecuritiesMemberbcs:OnBalanceSheetAssetsMemberifrs-full:FinancialAssetsAtFairValueThroughProfitOrLossClassifiedAsHeldForTradingCategoryMemberifrs-full:CreditRiskMember2022-12-310000312069bcs:OnBalanceSheetAssetsMemberifrs-full:FinancialAssetsAtFairValueThroughProfitOrLossClassifiedAsHeldForTradingCategoryMemberifrs-full:CreditRiskMemberbcs:TradedLoansMember2022-12-310000312069bcs:OnBalanceSheetAssetsMemberifrs-full:FinancialAssetsAtFairValueThroughProfitOrLossClassifiedAsHeldForTradingCategoryMemberifrs-full:CreditRiskMember2022-12-310000312069bcs:LoansAndAdvancesMemberbcs:OnBalanceSheetAssetsMemberifrs-full:CreditRiskMemberifrs-full:FinancialAssetsAtFairValueThroughProfitOrLossCategoryMember2022-12-310000312069ifrs-full:DebtSecuritiesMemberbcs:OnBalanceSheetAssetsMemberifrs-full:CreditRiskMemberifrs-full:FinancialAssetsAtFairValueThroughProfitOrLossCategoryMember2022-12-310000312069bcs:OnBalanceSheetAssetsMemberbcs:ReverseRepurchaseAgreementsMemberifrs-full:CreditRiskMemberifrs-full:FinancialAssetsAtFairValueThroughProfitOrLossCategoryMember2022-12-310000312069bcs:OtherFinancialAssetsMemberbcs:OnBalanceSheetAssetsMemberifrs-full:CreditRiskMemberifrs-full:FinancialAssetsAtFairValueThroughProfitOrLossCategoryMember2022-12-310000312069bcs:OnBalanceSheetAssetsMemberifrs-full:CreditRiskMemberifrs-full:FinancialAssetsAtFairValueThroughProfitOrLossCategoryMember2022-12-310000312069bcs:OnBalanceSheetAssetsMemberifrs-full:CreditRiskMemberifrs-full:DerivativesMember2022-12-310000312069bcs:OnBalanceSheetAssetsMemberifrs-full:FinancialAssetsAtFairValueThroughOtherComprehensiveIncomeCategoryMemberifrs-full:CreditRiskMember2022-12-310000312069ifrs-full:OtherAssetsMemberbcs:OnBalanceSheetAssetsMemberifrs-full:CreditRiskMember2022-12-310000312069ifrs-full:NoncurrentAssetsOrDisposalGroupsClassifiedAsHeldForSaleMemberbcs:OnBalanceSheetAssetsMemberifrs-full:CreditRiskMember2022-12-310000312069bcs:OnBalanceSheetAssetsMemberifrs-full:CreditRiskMember2022-12-310000312069bcs:OffBalanceSheetLoanCommitmentsAndFinancialGuaranteeContractsMemberifrs-full:CreditRiskMemberifrs-full:ItemsOfContingentLiabilitiesMember2022-12-310000312069ifrs-full:LoanCommitmentsMemberbcs:OffBalanceSheetLoanCommitmentsAndFinancialGuaranteeContractsMemberifrs-full:CreditRiskMember2022-12-310000312069ifrs-full:CreditRiskMember2022-12-310000312069ifrs-full:MortgagesMemberifrs-full:FinancialAssetsAtAmortisedCostMembercountry:GBifrs-full:GrossCarryingAmountMemberifrs-full:TwelvemonthExpectedCreditLossesMember2023-12-310000312069ifrs-full:LifetimeExpectedCreditLossesMemberifrs-full:MortgagesMemberifrs-full:FinancialAssetsAtAmortisedCostMembercountry:GBifrs-full:GrossCarryingAmountMemberifrs-full:FinancialInstrumentsNotCreditimpairedMember2023-12-310000312069ifrs-full:LifetimeExpectedCreditLossesMemberifrs-full:MortgagesMemberifrs-full:FinancialInstrumentsCreditimpairedMemberifrs-full:FinancialAssetsAtAmortisedCostMembercountry:GBifrs-full:GrossCarryingAmountMember2023-12-310000312069ifrs-full:MortgagesMemberifrs-full:FinancialAssetsAtAmortisedCostMembercountry:GBifrs-full:GrossCarryingAmountMember2023-12-310000312069ifrs-full:AccumulatedImpairmentMemberifrs-full:MortgagesMemberifrs-full:FinancialAssetsAtAmortisedCostMembercountry:GBifrs-full:TwelvemonthExpectedCreditLossesMember2023-12-310000312069ifrs-full:AccumulatedImpairmentMemberifrs-full:LifetimeExpectedCreditLossesMemberifrs-full:MortgagesMemberifrs-full:FinancialAssetsAtAmortisedCostMembercountry:GBifrs-full:FinancialInstrumentsNotCreditimpairedMember2023-12-310000312069ifrs-full:AccumulatedImpairmentMemberifrs-full:LifetimeExpectedCreditLossesMemberifrs-full:MortgagesMemberifrs-full:FinancialInstrumentsCreditimpairedMemberifrs-full:FinancialAssetsAtAmortisedCostMembercountry:GB2023-12-310000312069ifrs-full:AccumulatedImpairmentMemberifrs-full:MortgagesMemberifrs-full:FinancialAssetsAtAmortisedCostMembercountry:GB2023-12-310000312069bcs:CreditCardsRetailMemberifrs-full:FinancialAssetsAtAmortisedCostMembercountry:GBifrs-full:GrossCarryingAmountMemberifrs-full:TwelvemonthExpectedCreditLossesMember2023-12-310000312069bcs:CreditCardsRetailMemberifrs-full:LifetimeExpectedCreditLossesMemberifrs-full:FinancialAssetsAtAmortisedCostMembercountry:GBifrs-full:GrossCarryingAmountMemberifrs-full:FinancialInstrumentsNotCreditimpairedMember2023-12-310000312069bcs:CreditCardsRetailMemberifrs-full:LifetimeExpectedCreditLossesMemberifrs-full:FinancialInstrumentsCreditimpairedMemberifrs-full:FinancialAssetsAtAmortisedCostMembercountry:GBifrs-full:GrossCarryingAmountMember2023-12-310000312069bcs:CreditCardsRetailMemberifrs-full:FinancialAssetsAtAmortisedCostMembercountry:GBifrs-full:GrossCarryingAmountMember2023-12-310000312069bcs:CreditCardsRetailMemberifrs-full:AccumulatedImpairmentMemberifrs-full:FinancialAssetsAtAmortisedCostMembercountry:GBifrs-full:TwelvemonthExpectedCreditLossesMember2023-12-310000312069bcs:CreditCardsRetailMemberifrs-full:AccumulatedImpairmentMemberifrs-full:LifetimeExpectedCreditLossesMemberifrs-full:FinancialAssetsAtAmortisedCostMembercountry:GBifrs-full:FinancialInstrumentsNotCreditimpairedMember2023-12-310000312069bcs:CreditCardsRetailMemberifrs-full:AccumulatedImpairmentMemberifrs-full:LifetimeExpectedCreditLossesMemberifrs-full:FinancialInstrumentsCreditimpairedMemberifrs-full:FinancialAssetsAtAmortisedCostMembercountry:GB2023-12-310000312069bcs:CreditCardsRetailMemberifrs-full:AccumulatedImpairmentMemberifrs-full:FinancialAssetsAtAmortisedCostMembercountry:GB2023-12-310000312069bcs:OtherRetailMemberifrs-full:FinancialAssetsAtAmortisedCostMembercountry:GBifrs-full:GrossCarryingAmountMemberifrs-full:TwelvemonthExpectedCreditLossesMember2023-12-310000312069ifrs-full:LifetimeExpectedCreditLossesMemberbcs:OtherRetailMemberifrs-full:FinancialAssetsAtAmortisedCostMembercountry:GBifrs-full:GrossCarryingAmountMemberifrs-full:FinancialInstrumentsNotCreditimpairedMember2023-12-310000312069ifrs-full:LifetimeExpectedCreditLossesMemberbcs:OtherRetailMemberifrs-full:FinancialInstrumentsCreditimpairedMemberifrs-full:FinancialAssetsAtAmortisedCostMembercountry:GBifrs-full:GrossCarryingAmountMember2023-12-310000312069bcs:OtherRetailMemberifrs-full:FinancialAssetsAtAmortisedCostMembercountry:GBifrs-full:GrossCarryingAmountMember2023-12-310000312069ifrs-full:AccumulatedImpairmentMemberbcs:OtherRetailMemberifrs-full:FinancialAssetsAtAmortisedCostMembercountry:GBifrs-full:TwelvemonthExpectedCreditLossesMember2023-12-310000312069ifrs-full:AccumulatedImpairmentMemberifrs-full:LifetimeExpectedCreditLossesMemberbcs:OtherRetailMemberifrs-full:FinancialAssetsAtAmortisedCostMembercountry:GBifrs-full:FinancialInstrumentsNotCreditimpairedMember2023-12-310000312069ifrs-full:AccumulatedImpairmentMemberifrs-full:LifetimeExpectedCreditLossesMemberbcs:OtherRetailMemberifrs-full:FinancialInstrumentsCreditimpairedMemberifrs-full:FinancialAssetsAtAmortisedCostMembercountry:GB2023-12-310000312069ifrs-full:AccumulatedImpairmentMemberbcs:OtherRetailMemberifrs-full:FinancialAssetsAtAmortisedCostMembercountry:GB2023-12-310000312069ifrs-full:CorporateLoansMemberifrs-full:FinancialAssetsAtAmortisedCostMembercountry:GBifrs-full:GrossCarryingAmountMemberifrs-full:TwelvemonthExpectedCreditLossesMember2023-12-310000312069ifrs-full:LifetimeExpectedCreditLossesMemberifrs-full:CorporateLoansMemberifrs-full:FinancialAssetsAtAmortisedCostMembercountry:GBifrs-full:GrossCarryingAmountMemberifrs-full:FinancialInstrumentsNotCreditimpairedMember2023-12-310000312069ifrs-full:LifetimeExpectedCreditLossesMemberifrs-full:CorporateLoansMemberifrs-full:FinancialInstrumentsCreditimpairedMemberifrs-full:FinancialAssetsAtAmortisedCostMembercountry:GBifrs-full:GrossCarryingAmountMember2023-12-310000312069ifrs-full:CorporateLoansMemberifrs-full:FinancialAssetsAtAmortisedCostMembercountry:GBifrs-full:GrossCarryingAmountMember2023-12-310000312069ifrs-full:AccumulatedImpairmentMemberifrs-full:CorporateLoansMemberifrs-full:FinancialAssetsAtAmortisedCostMembercountry:GBifrs-full:TwelvemonthExpectedCreditLossesMember2023-12-310000312069ifrs-full:AccumulatedImpairmentMemberifrs-full:LifetimeExpectedCreditLossesMemberifrs-full:CorporateLoansMemberifrs-full:FinancialAssetsAtAmortisedCostMembercountry:GBifrs-full:FinancialInstrumentsNotCreditimpairedMember2023-12-310000312069ifrs-full:AccumulatedImpairmentMemberifrs-full:LifetimeExpectedCreditLossesMemberifrs-full:CorporateLoansMemberifrs-full:FinancialInstrumentsCreditimpairedMemberifrs-full:FinancialAssetsAtAmortisedCostMembercountry:GB2023-12-310000312069ifrs-full:AccumulatedImpairmentMemberifrs-full:CorporateLoansMemberifrs-full:FinancialAssetsAtAmortisedCostMembercountry:GB2023-12-310000312069ifrs-full:FinancialAssetsAtAmortisedCostMembercountry:GBifrs-full:GrossCarryingAmountMemberifrs-full:LoansAndReceivablesCategoryMemberifrs-full:TwelvemonthExpectedCreditLossesMember2023-12-310000312069ifrs-full:LifetimeExpectedCreditLossesMemberifrs-full:FinancialAssetsAtAmortisedCostMembercountry:GBifrs-full:GrossCarryingAmountMemberifrs-full:LoansAndReceivablesCategoryMemberifrs-full:FinancialInstrumentsNotCreditimpairedMember2023-12-310000312069ifrs-full:LifetimeExpectedCreditLossesMemberifrs-full:FinancialInstrumentsCreditimpairedMemberifrs-full:FinancialAssetsAtAmortisedCostMembercountry:GBifrs-full:GrossCarryingAmountMemberifrs-full:LoansAndReceivablesCategoryMember2023-12-310000312069ifrs-full:FinancialAssetsAtAmortisedCostMembercountry:GBifrs-full:GrossCarryingAmountMemberifrs-full:LoansAndReceivablesCategoryMember2023-12-310000312069ifrs-full:AccumulatedImpairmentMemberifrs-full:FinancialAssetsAtAmortisedCostMembercountry:GBifrs-full:LoansAndReceivablesCategoryMemberifrs-full:TwelvemonthExpectedCreditLossesMember2023-12-310000312069ifrs-full:AccumulatedImpairmentMemberifrs-full:LifetimeExpectedCreditLossesMemberifrs-full:FinancialAssetsAtAmortisedCostMembercountry:GBifrs-full:LoansAndReceivablesCategoryMemberifrs-full:FinancialInstrumentsNotCreditimpairedMember2023-12-310000312069ifrs-full:AccumulatedImpairmentMemberifrs-full:LifetimeExpectedCreditLossesMemberifrs-full:FinancialInstrumentsCreditimpairedMemberifrs-full:FinancialAssetsAtAmortisedCostMembercountry:GBifrs-full:LoansAndReceivablesCategoryMember2023-12-310000312069ifrs-full:AccumulatedImpairmentMemberifrs-full:FinancialAssetsAtAmortisedCostMembercountry:GBifrs-full:LoansAndReceivablesCategoryMember2023-12-310000312069ifrs-full:MortgagesMemberbcs:RestOfTheWorldMemberifrs-full:FinancialAssetsAtAmortisedCostMemberifrs-full:GrossCarryingAmountMemberifrs-full:TwelvemonthExpectedCreditLossesMember2023-12-310000312069ifrs-full:LifetimeExpectedCreditLossesMemberifrs-full:MortgagesMemberbcs:RestOfTheWorldMemberifrs-full:FinancialAssetsAtAmortisedCostMemberifrs-full:GrossCarryingAmountMemberifrs-full:FinancialInstrumentsNotCreditimpairedMember2023-12-310000312069ifrs-full:LifetimeExpectedCreditLossesMemberifrs-full:MortgagesMemberifrs-full:FinancialInstrumentsCreditimpairedMemberbcs:RestOfTheWorldMemberifrs-full:FinancialAssetsAtAmortisedCostMemberifrs-full:GrossCarryingAmountMember2023-12-310000312069ifrs-full:MortgagesMemberbcs:RestOfTheWorldMemberifrs-full:FinancialAssetsAtAmortisedCostMemberifrs-full:GrossCarryingAmountMember2023-12-310000312069ifrs-full:AccumulatedImpairmentMemberifrs-full:MortgagesMemberbcs:RestOfTheWorldMemberifrs-full:FinancialAssetsAtAmortisedCostMemberifrs-full:TwelvemonthExpectedCreditLossesMember2023-12-310000312069ifrs-full:AccumulatedImpairmentMemberifrs-full:LifetimeExpectedCreditLossesMemberifrs-full:MortgagesMemberbcs:RestOfTheWorldMemberifrs-full:FinancialAssetsAtAmortisedCostMemberifrs-full:FinancialInstrumentsNotCreditimpairedMember2023-12-310000312069ifrs-full:AccumulatedImpairmentMemberifrs-full:LifetimeExpectedCreditLossesMemberifrs-full:MortgagesMemberifrs-full:FinancialInstrumentsCreditimpairedMemberbcs:RestOfTheWorldMemberifrs-full:FinancialAssetsAtAmortisedCostMember2023-12-310000312069ifrs-full:AccumulatedImpairmentMemberifrs-full:MortgagesMemberbcs:RestOfTheWorldMemberifrs-full:FinancialAssetsAtAmortisedCostMember2023-12-310000312069bcs:CreditCardsRetailMemberbcs:RestOfTheWorldMemberifrs-full:FinancialAssetsAtAmortisedCostMemberifrs-full:GrossCarryingAmountMemberifrs-full:TwelvemonthExpectedCreditLossesMember2023-12-310000312069bcs:CreditCardsRetailMemberifrs-full:LifetimeExpectedCreditLossesMemberbcs:RestOfTheWorldMemberifrs-full:FinancialAssetsAtAmortisedCostMemberifrs-full:GrossCarryingAmountMemberifrs-full:FinancialInstrumentsNotCreditimpairedMember2023-12-310000312069bcs:CreditCardsRetailMemberifrs-full:LifetimeExpectedCreditLossesMemberifrs-full:FinancialInstrumentsCreditimpairedMemberbcs:RestOfTheWorldMemberifrs-full:FinancialAssetsAtAmortisedCostMemberifrs-full:GrossCarryingAmountMember2023-12-310000312069bcs:CreditCardsRetailMemberbcs:RestOfTheWorldMemberifrs-full:FinancialAssetsAtAmortisedCostMemberifrs-full:GrossCarryingAmountMember2023-12-310000312069bcs:CreditCardsRetailMemberifrs-full:AccumulatedImpairmentMemberbcs:RestOfTheWorldMemberifrs-full:FinancialAssetsAtAmortisedCostMemberifrs-full:TwelvemonthExpectedCreditLossesMember2023-12-310000312069bcs:CreditCardsRetailMemberifrs-full:AccumulatedImpairmentMemberifrs-full:LifetimeExpectedCreditLossesMemberbcs:RestOfTheWorldMemberifrs-full:FinancialAssetsAtAmortisedCostMemberifrs-full:FinancialInstrumentsNotCreditimpairedMember2023-12-310000312069bcs:CreditCardsRetailMemberifrs-full:AccumulatedImpairmentMemberifrs-full:LifetimeExpectedCreditLossesMemberifrs-full:FinancialInstrumentsCreditimpairedMemberbcs:RestOfTheWorldMemberifrs-full:FinancialAssetsAtAmortisedCostMember2023-12-310000312069bcs:CreditCardsRetailMemberifrs-full:AccumulatedImpairmentMemberbcs:RestOfTheWorldMemberifrs-full:FinancialAssetsAtAmortisedCostMember2023-12-310000312069bcs:OtherRetailMemberbcs:RestOfTheWorldMemberifrs-full:FinancialAssetsAtAmortisedCostMemberifrs-full:GrossCarryingAmountMemberifrs-full:TwelvemonthExpectedCreditLossesMember2023-12-310000312069ifrs-full:LifetimeExpectedCreditLossesMemberbcs:OtherRetailMemberbcs:RestOfTheWorldMemberifrs-full:FinancialAssetsAtAmortisedCostMemberifrs-full:GrossCarryingAmountMemberifrs-full:FinancialInstrumentsNotCreditimpairedMember2023-12-310000312069ifrs-full:LifetimeExpectedCreditLossesMemberbcs:OtherRetailMemberifrs-full:FinancialInstrumentsCreditimpairedMemberbcs:RestOfTheWorldMemberifrs-full:FinancialAssetsAtAmortisedCostMemberifrs-full:GrossCarryingAmountMember2023-12-310000312069bcs:OtherRetailMemberbcs:RestOfTheWorldMemberifrs-full:FinancialAssetsAtAmortisedCostMemberifrs-full:GrossCarryingAmountMember2023-12-310000312069ifrs-full:AccumulatedImpairmentMemberbcs:OtherRetailMemberbcs:RestOfTheWorldMemberifrs-full:FinancialAssetsAtAmortisedCostMemberifrs-full:TwelvemonthExpectedCreditLossesMember2023-12-310000312069ifrs-full:AccumulatedImpairmentMemberifrs-full:LifetimeExpectedCreditLossesMemberbcs:OtherRetailMemberbcs:RestOfTheWorldMemberifrs-full:FinancialAssetsAtAmortisedCostMemberifrs-full:FinancialInstrumentsNotCreditimpairedMember2023-12-310000312069ifrs-full:AccumulatedImpairmentMemberifrs-full:LifetimeExpectedCreditLossesMemberbcs:OtherRetailMemberifrs-full:FinancialInstrumentsCreditimpairedMemberbcs:RestOfTheWorldMemberifrs-full:FinancialAssetsAtAmortisedCostMember2023-12-310000312069ifrs-full:AccumulatedImpairmentMemberbcs:OtherRetailMemberbcs:RestOfTheWorldMemberifrs-full:FinancialAssetsAtAmortisedCostMember2023-12-310000312069ifrs-full:CorporateLoansMemberbcs:RestOfTheWorldMemberifrs-full:FinancialAssetsAtAmortisedCostMemberifrs-full:GrossCarryingAmountMemberifrs-full:TwelvemonthExpectedCreditLossesMember2023-12-310000312069ifrs-full:LifetimeExpectedCreditLossesMemberifrs-full:CorporateLoansMemberbcs:RestOfTheWorldMemberifrs-full:FinancialAssetsAtAmortisedCostMemberifrs-full:GrossCarryingAmountMemberifrs-full:FinancialInstrumentsNotCreditimpairedMember2023-12-310000312069ifrs-full:LifetimeExpectedCreditLossesMemberifrs-full:CorporateLoansMemberifrs-full:FinancialInstrumentsCreditimpairedMemberbcs:RestOfTheWorldMemberifrs-full:FinancialAssetsAtAmortisedCostMemberifrs-full:GrossCarryingAmountMember2023-12-310000312069ifrs-full:CorporateLoansMemberbcs:RestOfTheWorldMemberifrs-full:FinancialAssetsAtAmortisedCostMemberifrs-full:GrossCarryingAmountMember2023-12-310000312069ifrs-full:AccumulatedImpairmentMemberifrs-full:CorporateLoansMemberbcs:RestOfTheWorldMemberifrs-full:FinancialAssetsAtAmortisedCostMemberifrs-full:TwelvemonthExpectedCreditLossesMember2023-12-310000312069ifrs-full:AccumulatedImpairmentMemberifrs-full:LifetimeExpectedCreditLossesMemberifrs-full:CorporateLoansMemberbcs:RestOfTheWorldMemberifrs-full:FinancialAssetsAtAmortisedCostMemberifrs-full:FinancialInstrumentsNotCreditimpairedMember2023-12-310000312069ifrs-full:AccumulatedImpairmentMemberifrs-full:LifetimeExpectedCreditLossesMemberifrs-full:CorporateLoansMemberifrs-full:FinancialInstrumentsCreditimpairedMemberbcs:RestOfTheWorldMemberifrs-full:FinancialAssetsAtAmortisedCostMember2023-12-310000312069ifrs-full:AccumulatedImpairmentMemberifrs-full:CorporateLoansMemberbcs:RestOfTheWorldMemberifrs-full:FinancialAssetsAtAmortisedCostMember2023-12-310000312069bcs:RestOfTheWorldMemberifrs-full:FinancialAssetsAtAmortisedCostMemberifrs-full:GrossCarryingAmountMemberifrs-full:LoansAndReceivablesCategoryMemberifrs-full:TwelvemonthExpectedCreditLossesMember2023-12-310000312069ifrs-full:LifetimeExpectedCreditLossesMemberbcs:RestOfTheWorldMemberifrs-full:FinancialAssetsAtAmortisedCostMemberifrs-full:GrossCarryingAmountMemberifrs-full:LoansAndReceivablesCategoryMemberifrs-full:FinancialInstrumentsNotCreditimpairedMember2023-12-310000312069ifrs-full:LifetimeExpectedCreditLossesMemberifrs-full:FinancialInstrumentsCreditimpairedMemberbcs:RestOfTheWorldMemberifrs-full:FinancialAssetsAtAmortisedCostMemberifrs-full:GrossCarryingAmountMemberifrs-full:LoansAndReceivablesCategoryMember2023-12-310000312069bcs:RestOfTheWorldMemberifrs-full:FinancialAssetsAtAmortisedCostMemberifrs-full:GrossCarryingAmountMemberifrs-full:LoansAndReceivablesCategoryMember2023-12-310000312069ifrs-full:AccumulatedImpairmentMemberbcs:RestOfTheWorldMemberifrs-full:FinancialAssetsAtAmortisedCostMemberifrs-full:LoansAndReceivablesCategoryMemberifrs-full:TwelvemonthExpectedCreditLossesMember2023-12-310000312069ifrs-full:AccumulatedImpairmentMemberifrs-full:LifetimeExpectedCreditLossesMemberbcs:RestOfTheWorldMemberifrs-full:FinancialAssetsAtAmortisedCostMemberifrs-full:LoansAndReceivablesCategoryMemberifrs-full:FinancialInstrumentsNotCreditimpairedMember2023-12-310000312069ifrs-full:AccumulatedImpairmentMemberifrs-full:LifetimeExpectedCreditLossesMemberifrs-full:FinancialInstrumentsCreditimpairedMemberbcs:RestOfTheWorldMemberifrs-full:FinancialAssetsAtAmortisedCostMemberifrs-full:LoansAndReceivablesCategoryMember2023-12-310000312069ifrs-full:AccumulatedImpairmentMemberbcs:RestOfTheWorldMemberifrs-full:FinancialAssetsAtAmortisedCostMemberifrs-full:LoansAndReceivablesCategoryMember2023-12-310000312069ifrs-full:FinancialAssetsAtAmortisedCostMemberifrs-full:GrossCarryingAmountMemberifrs-full:LoansAndReceivablesCategoryMemberifrs-full:TwelvemonthExpectedCreditLossesMember2023-12-310000312069ifrs-full:LifetimeExpectedCreditLossesMemberifrs-full:FinancialAssetsAtAmortisedCostMemberifrs-full:GrossCarryingAmountMemberifrs-full:LoansAndReceivablesCategoryMemberifrs-full:FinancialInstrumentsNotCreditimpairedMember2023-12-310000312069ifrs-full:LifetimeExpectedCreditLossesMemberifrs-full:FinancialInstrumentsCreditimpairedMemberifrs-full:FinancialAssetsAtAmortisedCostMemberifrs-full:GrossCarryingAmountMemberifrs-full:LoansAndReceivablesCategoryMember2023-12-310000312069ifrs-full:FinancialAssetsAtAmortisedCostMemberifrs-full:GrossCarryingAmountMemberifrs-full:LoansAndReceivablesCategoryMember2023-12-310000312069ifrs-full:AccumulatedImpairmentMemberifrs-full:FinancialAssetsAtAmortisedCostMemberifrs-full:LoansAndReceivablesCategoryMemberifrs-full:TwelvemonthExpectedCreditLossesMember2023-12-310000312069ifrs-full:AccumulatedImpairmentMemberifrs-full:LifetimeExpectedCreditLossesMemberifrs-full:FinancialAssetsAtAmortisedCostMemberifrs-full:LoansAndReceivablesCategoryMemberifrs-full:FinancialInstrumentsNotCreditimpairedMember2023-12-310000312069ifrs-full:AccumulatedImpairmentMemberifrs-full:LifetimeExpectedCreditLossesMemberifrs-full:FinancialInstrumentsCreditimpairedMemberifrs-full:FinancialAssetsAtAmortisedCostMemberifrs-full:LoansAndReceivablesCategoryMember2023-12-310000312069ifrs-full:AccumulatedImpairmentMemberifrs-full:FinancialAssetsAtAmortisedCostMemberifrs-full:LoansAndReceivablesCategoryMember2023-12-310000312069ifrs-full:DebtSecuritiesMemberifrs-full:FinancialAssetsAtAmortisedCostMemberifrs-full:GrossCarryingAmountMemberifrs-full:TwelvemonthExpectedCreditLossesMember2023-12-310000312069ifrs-full:LifetimeExpectedCreditLossesMemberifrs-full:DebtSecuritiesMemberifrs-full:FinancialAssetsAtAmortisedCostMemberifrs-full:GrossCarryingAmountMemberifrs-full:FinancialInstrumentsNotCreditimpairedMember2023-12-310000312069ifrs-full:LifetimeExpectedCreditLossesMemberifrs-full:DebtSecuritiesMemberifrs-full:FinancialInstrumentsCreditimpairedMemberifrs-full:FinancialAssetsAtAmortisedCostMemberifrs-full:GrossCarryingAmountMember2023-12-310000312069ifrs-full:DebtSecuritiesMemberifrs-full:FinancialAssetsAtAmortisedCostMemberifrs-full:GrossCarryingAmountMember2023-12-310000312069ifrs-full:AccumulatedImpairmentMemberifrs-full:DebtSecuritiesMemberifrs-full:FinancialAssetsAtAmortisedCostMemberifrs-full:TwelvemonthExpectedCreditLossesMember2023-12-310000312069ifrs-full:AccumulatedImpairmentMemberifrs-full:LifetimeExpectedCreditLossesMemberifrs-full:DebtSecuritiesMemberifrs-full:FinancialAssetsAtAmortisedCostMemberifrs-full:FinancialInstrumentsNotCreditimpairedMember2023-12-310000312069ifrs-full:AccumulatedImpairmentMemberifrs-full:LifetimeExpectedCreditLossesMemberifrs-full:DebtSecuritiesMemberifrs-full:FinancialInstrumentsCreditimpairedMemberifrs-full:FinancialAssetsAtAmortisedCostMember2023-12-310000312069ifrs-full:AccumulatedImpairmentMemberifrs-full:DebtSecuritiesMemberifrs-full:FinancialAssetsAtAmortisedCostMember2023-12-310000312069bcs:LoansAndAdvancesAtAmortisedCostIncludingDebtSecuritiesMemberifrs-full:GrossCarryingAmountMemberifrs-full:TwelvemonthExpectedCreditLossesMember2023-12-310000312069ifrs-full:LifetimeExpectedCreditLossesMemberbcs:LoansAndAdvancesAtAmortisedCostIncludingDebtSecuritiesMemberifrs-full:GrossCarryingAmountMemberifrs-full:FinancialInstrumentsNotCreditimpairedMember2023-12-310000312069ifrs-full:LifetimeExpectedCreditLossesMemberifrs-full:FinancialInstrumentsCreditimpairedMemberbcs:LoansAndAdvancesAtAmortisedCostIncludingDebtSecuritiesMemberifrs-full:GrossCarryingAmountMember2023-12-310000312069bcs:LoansAndAdvancesAtAmortisedCostIncludingDebtSecuritiesMemberifrs-full:GrossCarryingAmountMember2023-12-310000312069ifrs-full:AccumulatedImpairmentMemberbcs:LoansAndAdvancesAtAmortisedCostIncludingDebtSecuritiesMemberifrs-full:TwelvemonthExpectedCreditLossesMember2023-12-310000312069ifrs-full:AccumulatedImpairmentMemberifrs-full:LifetimeExpectedCreditLossesMemberbcs:LoansAndAdvancesAtAmortisedCostIncludingDebtSecuritiesMemberifrs-full:FinancialInstrumentsNotCreditimpairedMember2023-12-310000312069ifrs-full:AccumulatedImpairmentMemberifrs-full:LifetimeExpectedCreditLossesMemberifrs-full:FinancialInstrumentsCreditimpairedMemberbcs:LoansAndAdvancesAtAmortisedCostIncludingDebtSecuritiesMember2023-12-310000312069ifrs-full:AccumulatedImpairmentMemberbcs:LoansAndAdvancesAtAmortisedCostIncludingDebtSecuritiesMember2023-12-310000312069ifrs-full:GrossCarryingAmountMemberifrs-full:TwelvemonthExpectedCreditLossesMemberbcs:OffBalanceSheetLoanCommitmentsAndFinancialGuaranteeContractsMember2023-12-310000312069ifrs-full:LifetimeExpectedCreditLossesMemberifrs-full:GrossCarryingAmountMemberifrs-full:FinancialInstrumentsNotCreditimpairedMemberbcs:OffBalanceSheetLoanCommitmentsAndFinancialGuaranteeContractsMember2023-12-310000312069ifrs-full:LifetimeExpectedCreditLossesMemberifrs-full:FinancialInstrumentsCreditimpairedMemberifrs-full:GrossCarryingAmountMemberbcs:OffBalanceSheetLoanCommitmentsAndFinancialGuaranteeContractsMember2023-12-310000312069ifrs-full:GrossCarryingAmountMemberbcs:OffBalanceSheetLoanCommitmentsAndFinancialGuaranteeContractsMember2023-12-310000312069ifrs-full:AccumulatedImpairmentMemberifrs-full:TwelvemonthExpectedCreditLossesMemberbcs:OffBalanceSheetLoanCommitmentsAndFinancialGuaranteeContractsMember2023-12-310000312069ifrs-full:AccumulatedImpairmentMemberifrs-full:LifetimeExpectedCreditLossesMemberifrs-full:FinancialInstrumentsNotCreditimpairedMemberbcs:OffBalanceSheetLoanCommitmentsAndFinancialGuaranteeContractsMember2023-12-310000312069ifrs-full:AccumulatedImpairmentMemberifrs-full:LifetimeExpectedCreditLossesMemberifrs-full:FinancialInstrumentsCreditimpairedMemberbcs:OffBalanceSheetLoanCommitmentsAndFinancialGuaranteeContractsMember2023-12-310000312069ifrs-full:AccumulatedImpairmentMemberbcs:OffBalanceSheetLoanCommitmentsAndFinancialGuaranteeContractsMember2023-12-310000312069bcs:LoansAndAdvancesAtAmortisedCostIncludingOffBalanceSheetLoanCommitmentsAndFinancialGuaranteeContractsMemberifrs-full:GrossCarryingAmountMemberifrs-full:TwelvemonthExpectedCreditLossesMember2023-12-310000312069ifrs-full:LifetimeExpectedCreditLossesMemberbcs:LoansAndAdvancesAtAmortisedCostIncludingOffBalanceSheetLoanCommitmentsAndFinancialGuaranteeContractsMemberifrs-full:GrossCarryingAmountMemberifrs-full:FinancialInstrumentsNotCreditimpairedMember2023-12-310000312069ifrs-full:LifetimeExpectedCreditLossesMemberbcs:LoansAndAdvancesAtAmortisedCostIncludingOffBalanceSheetLoanCommitmentsAndFinancialGuaranteeContractsMemberifrs-full:FinancialInstrumentsCreditimpairedMemberifrs-full:GrossCarryingAmountMember2023-12-310000312069bcs:LoansAndAdvancesAtAmortisedCostIncludingOffBalanceSheetLoanCommitmentsAndFinancialGuaranteeContractsMemberifrs-full:GrossCarryingAmountMember2023-12-310000312069ifrs-full:AccumulatedImpairmentMemberbcs:LoansAndAdvancesAtAmortisedCostIncludingOffBalanceSheetLoanCommitmentsAndFinancialGuaranteeContractsMemberifrs-full:TwelvemonthExpectedCreditLossesMember2023-12-310000312069ifrs-full:AccumulatedImpairmentMemberifrs-full:LifetimeExpectedCreditLossesMemberbcs:LoansAndAdvancesAtAmortisedCostIncludingOffBalanceSheetLoanCommitmentsAndFinancialGuaranteeContractsMemberifrs-full:FinancialInstrumentsNotCreditimpairedMember2023-12-310000312069ifrs-full:AccumulatedImpairmentMemberifrs-full:LifetimeExpectedCreditLossesMemberbcs:LoansAndAdvancesAtAmortisedCostIncludingOffBalanceSheetLoanCommitmentsAndFinancialGuaranteeContractsMemberifrs-full:FinancialInstrumentsCreditimpairedMember2023-12-310000312069ifrs-full:AccumulatedImpairmentMemberbcs:LoansAndAdvancesAtAmortisedCostIncludingOffBalanceSheetLoanCommitmentsAndFinancialGuaranteeContractsMember2023-12-310000312069ifrs-full:MortgagesMemberifrs-full:FinancialAssetsAtAmortisedCostMembercountry:GBifrs-full:TwelvemonthExpectedCreditLossesMember2023-12-310000312069ifrs-full:LifetimeExpectedCreditLossesMemberifrs-full:MortgagesMemberifrs-full:FinancialAssetsAtAmortisedCostMembercountry:GBifrs-full:FinancialInstrumentsNotCreditimpairedMember2023-12-310000312069ifrs-full:LifetimeExpectedCreditLossesMemberifrs-full:MortgagesMemberifrs-full:FinancialInstrumentsCreditimpairedMemberifrs-full:FinancialAssetsAtAmortisedCostMembercountry:GB2023-12-310000312069ifrs-full:MortgagesMemberifrs-full:FinancialAssetsAtAmortisedCostMembercountry:GB2023-12-31xbrli:pure0000312069bcs:CreditCardsRetailMemberifrs-full:FinancialAssetsAtAmortisedCostMembercountry:GBifrs-full:TwelvemonthExpectedCreditLossesMember2023-12-310000312069bcs:CreditCardsRetailMemberifrs-full:LifetimeExpectedCreditLossesMemberifrs-full:FinancialAssetsAtAmortisedCostMembercountry:GBifrs-full:FinancialInstrumentsNotCreditimpairedMember2023-12-310000312069bcs:CreditCardsRetailMemberifrs-full:LifetimeExpectedCreditLossesMemberifrs-full:FinancialInstrumentsCreditimpairedMemberifrs-full:FinancialAssetsAtAmortisedCostMembercountry:GB2023-12-310000312069bcs:CreditCardsRetailMemberifrs-full:FinancialAssetsAtAmortisedCostMembercountry:GB2023-12-310000312069bcs:OtherRetailMemberifrs-full:FinancialAssetsAtAmortisedCostMembercountry:GBifrs-full:TwelvemonthExpectedCreditLossesMember2023-12-310000312069ifrs-full:LifetimeExpectedCreditLossesMemberbcs:OtherRetailMemberifrs-full:FinancialAssetsAtAmortisedCostMembercountry:GBifrs-full:FinancialInstrumentsNotCreditimpairedMember2023-12-310000312069ifrs-full:LifetimeExpectedCreditLossesMemberbcs:OtherRetailMemberifrs-full:FinancialInstrumentsCreditimpairedMemberifrs-full:FinancialAssetsAtAmortisedCostMembercountry:GB2023-12-310000312069bcs:OtherRetailMemberifrs-full:FinancialAssetsAtAmortisedCostMembercountry:GB2023-12-310000312069ifrs-full:CorporateLoansMemberifrs-full:FinancialAssetsAtAmortisedCostMembercountry:GBifrs-full:TwelvemonthExpectedCreditLossesMember2023-12-310000312069ifrs-full:LifetimeExpectedCreditLossesMemberifrs-full:CorporateLoansMemberifrs-full:FinancialAssetsAtAmortisedCostMembercountry:GBifrs-full:FinancialInstrumentsNotCreditimpairedMember2023-12-310000312069ifrs-full:LifetimeExpectedCreditLossesMemberifrs-full:CorporateLoansMemberifrs-full:FinancialInstrumentsCreditimpairedMemberifrs-full:FinancialAssetsAtAmortisedCostMembercountry:GB2023-12-310000312069ifrs-full:CorporateLoansMemberifrs-full:FinancialAssetsAtAmortisedCostMembercountry:GB2023-12-310000312069ifrs-full:FinancialAssetsAtAmortisedCostMembercountry:GBifrs-full:LoansAndReceivablesCategoryMemberifrs-full:TwelvemonthExpectedCreditLossesMember2023-12-310000312069ifrs-full:LifetimeExpectedCreditLossesMemberifrs-full:FinancialAssetsAtAmortisedCostMembercountry:GBifrs-full:LoansAndReceivablesCategoryMemberifrs-full:FinancialInstrumentsNotCreditimpairedMember2023-12-310000312069ifrs-full:LifetimeExpectedCreditLossesMemberifrs-full:FinancialInstrumentsCreditimpairedMemberifrs-full:FinancialAssetsAtAmortisedCostMembercountry:GBifrs-full:LoansAndReceivablesCategoryMember2023-12-310000312069ifrs-full:FinancialAssetsAtAmortisedCostMembercountry:GBifrs-full:LoansAndReceivablesCategoryMember2023-12-310000312069ifrs-full:MortgagesMemberbcs:RestOfTheWorldMemberifrs-full:FinancialAssetsAtAmortisedCostMemberifrs-full:TwelvemonthExpectedCreditLossesMember2023-12-310000312069ifrs-full:LifetimeExpectedCreditLossesMemberifrs-full:MortgagesMemberbcs:RestOfTheWorldMemberifrs-full:FinancialAssetsAtAmortisedCostMemberifrs-full:FinancialInstrumentsNotCreditimpairedMember2023-12-310000312069ifrs-full:LifetimeExpectedCreditLossesMemberifrs-full:MortgagesMemberifrs-full:FinancialInstrumentsCreditimpairedMemberbcs:RestOfTheWorldMemberifrs-full:FinancialAssetsAtAmortisedCostMember2023-12-310000312069ifrs-full:MortgagesMemberbcs:RestOfTheWorldMemberifrs-full:FinancialAssetsAtAmortisedCostMember2023-12-310000312069bcs:CreditCardsRetailMemberbcs:RestOfTheWorldMemberifrs-full:FinancialAssetsAtAmortisedCostMemberifrs-full:TwelvemonthExpectedCreditLossesMember2023-12-310000312069bcs:CreditCardsRetailMemberifrs-full:LifetimeExpectedCreditLossesMemberbcs:RestOfTheWorldMemberifrs-full:FinancialAssetsAtAmortisedCostMemberifrs-full:FinancialInstrumentsNotCreditimpairedMember2023-12-310000312069bcs:CreditCardsRetailMemberifrs-full:LifetimeExpectedCreditLossesMemberifrs-full:FinancialInstrumentsCreditimpairedMemberbcs:RestOfTheWorldMemberifrs-full:FinancialAssetsAtAmortisedCostMember2023-12-310000312069bcs:CreditCardsRetailMemberbcs:RestOfTheWorldMemberifrs-full:FinancialAssetsAtAmortisedCostMember2023-12-310000312069bcs:OtherRetailMemberbcs:RestOfTheWorldMemberifrs-full:FinancialAssetsAtAmortisedCostMemberifrs-full:TwelvemonthExpectedCreditLossesMember2023-12-310000312069ifrs-full:LifetimeExpectedCreditLossesMemberbcs:OtherRetailMemberbcs:RestOfTheWorldMemberifrs-full:FinancialAssetsAtAmortisedCostMemberifrs-full:FinancialInstrumentsNotCreditimpairedMember2023-12-310000312069ifrs-full:LifetimeExpectedCreditLossesMemberbcs:OtherRetailMemberifrs-full:FinancialInstrumentsCreditimpairedMemberbcs:RestOfTheWorldMemberifrs-full:FinancialAssetsAtAmortisedCostMember2023-12-310000312069bcs:OtherRetailMemberbcs:RestOfTheWorldMemberifrs-full:FinancialAssetsAtAmortisedCostMember2023-12-310000312069ifrs-full:CorporateLoansMemberbcs:RestOfTheWorldMemberifrs-full:FinancialAssetsAtAmortisedCostMemberifrs-full:TwelvemonthExpectedCreditLossesMember2023-12-310000312069ifrs-full:LifetimeExpectedCreditLossesMemberifrs-full:CorporateLoansMemberbcs:RestOfTheWorldMemberifrs-full:FinancialAssetsAtAmortisedCostMemberifrs-full:FinancialInstrumentsNotCreditimpairedMember2023-12-310000312069ifrs-full:LifetimeExpectedCreditLossesMemberifrs-full:CorporateLoansMemberifrs-full:FinancialInstrumentsCreditimpairedMemberbcs:RestOfTheWorldMemberifrs-full:FinancialAssetsAtAmortisedCostMember2023-12-310000312069ifrs-full:CorporateLoansMemberbcs:RestOfTheWorldMemberifrs-full:FinancialAssetsAtAmortisedCostMember2023-12-310000312069bcs:RestOfTheWorldMemberifrs-full:FinancialAssetsAtAmortisedCostMemberifrs-full:LoansAndReceivablesCategoryMemberifrs-full:TwelvemonthExpectedCreditLossesMember2023-12-310000312069ifrs-full:LifetimeExpectedCreditLossesMemberbcs:RestOfTheWorldMemberifrs-full:FinancialAssetsAtAmortisedCostMemberifrs-full:LoansAndReceivablesCategoryMemberifrs-full:FinancialInstrumentsNotCreditimpairedMember2023-12-310000312069ifrs-full:LifetimeExpectedCreditLossesMemberifrs-full:FinancialInstrumentsCreditimpairedMemberbcs:RestOfTheWorldMemberifrs-full:FinancialAssetsAtAmortisedCostMemberifrs-full:LoansAndReceivablesCategoryMember2023-12-310000312069bcs:RestOfTheWorldMemberifrs-full:FinancialAssetsAtAmortisedCostMemberifrs-full:LoansAndReceivablesCategoryMember2023-12-310000312069ifrs-full:FinancialAssetsAtAmortisedCostMemberifrs-full:LoansAndReceivablesCategoryMemberifrs-full:TwelvemonthExpectedCreditLossesMember2023-12-310000312069ifrs-full:LifetimeExpectedCreditLossesMemberifrs-full:FinancialAssetsAtAmortisedCostMemberifrs-full:LoansAndReceivablesCategoryMemberifrs-full:FinancialInstrumentsNotCreditimpairedMember2023-12-310000312069ifrs-full:LifetimeExpectedCreditLossesMemberifrs-full:FinancialInstrumentsCreditimpairedMemberifrs-full:FinancialAssetsAtAmortisedCostMemberifrs-full:LoansAndReceivablesCategoryMember2023-12-310000312069ifrs-full:FinancialAssetsAtAmortisedCostMemberifrs-full:LoansAndReceivablesCategoryMember2023-12-310000312069ifrs-full:DebtSecuritiesMemberifrs-full:FinancialAssetsAtAmortisedCostMemberifrs-full:TwelvemonthExpectedCreditLossesMember2023-12-310000312069ifrs-full:LifetimeExpectedCreditLossesMemberifrs-full:DebtSecuritiesMemberifrs-full:FinancialAssetsAtAmortisedCostMemberifrs-full:FinancialInstrumentsNotCreditimpairedMember2023-12-310000312069ifrs-full:LifetimeExpectedCreditLossesMemberifrs-full:DebtSecuritiesMemberifrs-full:FinancialInstrumentsCreditimpairedMemberifrs-full:FinancialAssetsAtAmortisedCostMember2023-12-310000312069ifrs-full:DebtSecuritiesMemberifrs-full:FinancialAssetsAtAmortisedCostMember2023-12-310000312069bcs:LoansAndAdvancesAtAmortisedCostIncludingDebtSecuritiesMemberifrs-full:TwelvemonthExpectedCreditLossesMember2023-12-310000312069ifrs-full:LifetimeExpectedCreditLossesMemberbcs:LoansAndAdvancesAtAmortisedCostIncludingDebtSecuritiesMemberifrs-full:FinancialInstrumentsNotCreditimpairedMember2023-12-310000312069ifrs-full:LifetimeExpectedCreditLossesMemberifrs-full:FinancialInstrumentsCreditimpairedMemberbcs:LoansAndAdvancesAtAmortisedCostIncludingDebtSecuritiesMember2023-12-310000312069bcs:LoansAndAdvancesAtAmortisedCostIncludingDebtSecuritiesMember2023-12-310000312069ifrs-full:TwelvemonthExpectedCreditLossesMemberbcs:OffBalanceSheetLoanCommitmentsAndFinancialGuaranteeContractsMember2023-12-310000312069ifrs-full:LifetimeExpectedCreditLossesMemberifrs-full:FinancialInstrumentsNotCreditimpairedMemberbcs:OffBalanceSheetLoanCommitmentsAndFinancialGuaranteeContractsMember2023-12-310000312069ifrs-full:LifetimeExpectedCreditLossesMemberifrs-full:FinancialInstrumentsCreditimpairedMemberbcs:OffBalanceSheetLoanCommitmentsAndFinancialGuaranteeContractsMember2023-12-310000312069bcs:OffBalanceSheetLoanCommitmentsAndFinancialGuaranteeContractsMember2023-12-310000312069bcs:LoansAndAdvancesAtAmortisedCostIncludingOffBalanceSheetLoanCommitmentsAndFinancialGuaranteeContractsMemberifrs-full:TwelvemonthExpectedCreditLossesMember2023-12-310000312069ifrs-full:LifetimeExpectedCreditLossesMemberbcs:LoansAndAdvancesAtAmortisedCostIncludingOffBalanceSheetLoanCommitmentsAndFinancialGuaranteeContractsMemberifrs-full:FinancialInstrumentsNotCreditimpairedMember2023-12-310000312069ifrs-full:LifetimeExpectedCreditLossesMemberbcs:LoansAndAdvancesAtAmortisedCostIncludingOffBalanceSheetLoanCommitmentsAndFinancialGuaranteeContractsMemberifrs-full:FinancialInstrumentsCreditimpairedMember2023-12-310000312069bcs:LoansAndAdvancesAtAmortisedCostIncludingOffBalanceSheetLoanCommitmentsAndFinancialGuaranteeContractsMember2023-12-310000312069ifrs-full:CorporateLoansMemberifrs-full:FinancialAssetsAtAmortisedCostMembercountry:GBbcs:BusinessBankingMemberifrs-full:GrossCarryingAmountMember2023-12-310000312069ifrs-full:AccumulatedImpairmentMemberifrs-full:CorporateLoansMemberifrs-full:FinancialAssetsAtAmortisedCostMembercountry:GBbcs:BusinessBankingMember2023-12-310000312069ifrs-full:AccumulatedImpairmentMemberifrs-full:CorporateLoansMemberifrs-full:FinancialAssetsAtAmortisedCostMembercountry:GBbcs:BusinessBankingMemberifrs-full:TwelvemonthExpectedCreditLossesMember2023-12-310000312069ifrs-full:CorporateLoansMemberifrs-full:FinancialAssetsAtAmortisedCostMembercountry:GBbcs:BusinessBankingMemberifrs-full:GrossCarryingAmountMemberifrs-full:TwelvemonthExpectedCreditLossesMember2023-12-310000312069ifrs-full:AccumulatedImpairmentMemberifrs-full:LifetimeExpectedCreditLossesMemberifrs-full:CorporateLoansMemberifrs-full:FinancialAssetsAtAmortisedCostMembercountry:GBbcs:BusinessBankingMemberifrs-full:FinancialInstrumentsNotCreditimpairedMember2023-12-310000312069ifrs-full:LifetimeExpectedCreditLossesMemberifrs-full:CorporateLoansMemberifrs-full:FinancialAssetsAtAmortisedCostMembercountry:GBbcs:BusinessBankingMemberifrs-full:GrossCarryingAmountMemberifrs-full:FinancialInstrumentsNotCreditimpairedMember2023-12-310000312069ifrs-full:AccumulatedImpairmentMemberifrs-full:LifetimeExpectedCreditLossesMemberifrs-full:CorporateLoansMemberifrs-full:FinancialInstrumentsCreditimpairedMemberifrs-full:FinancialAssetsAtAmortisedCostMembercountry:GBbcs:BusinessBankingMember2023-12-310000312069ifrs-full:LifetimeExpectedCreditLossesMemberifrs-full:CorporateLoansMemberifrs-full:FinancialInstrumentsCreditimpairedMemberifrs-full:FinancialAssetsAtAmortisedCostMembercountry:GBbcs:BusinessBankingMemberifrs-full:GrossCarryingAmountMember2023-12-310000312069ifrs-full:GrossCarryingAmountMemberifrs-full:FinancialAssetsAtFairValueThroughProfitOrLossDesignatedUponInitialRecognitionCategoryMember2023-12-310000312069bcs:OtherFinancialAssetsSubjectToImpairmentMemberifrs-full:GrossCarryingAmountMember2023-12-310000312069ifrs-full:AccumulatedImpairmentMemberbcs:OtherFinancialAssetsSubjectToImpairmentMember2023-12-310000312069ifrs-full:AccumulatedImpairmentMemberbcs:OtherFinancialAssetsSubjectToImpairmentMemberifrs-full:TwelvemonthExpectedCreditLossesMember2023-12-310000312069bcs:OtherFinancialAssetsSubjectToImpairmentMemberifrs-full:GrossCarryingAmountMemberifrs-full:TwelvemonthExpectedCreditLossesMember2023-12-310000312069ifrs-full:AccumulatedImpairmentMemberifrs-full:LifetimeExpectedCreditLossesMemberbcs:OtherFinancialAssetsSubjectToImpairmentMemberifrs-full:FinancialInstrumentsNotCreditimpairedMember2023-12-310000312069ifrs-full:LifetimeExpectedCreditLossesMemberbcs:OtherFinancialAssetsSubjectToImpairmentMemberifrs-full:GrossCarryingAmountMemberifrs-full:FinancialInstrumentsNotCreditimpairedMember2023-12-310000312069ifrs-full:AccumulatedImpairmentMemberifrs-full:LifetimeExpectedCreditLossesMemberifrs-full:FinancialInstrumentsCreditimpairedMemberbcs:OtherFinancialAssetsSubjectToImpairmentMember2023-12-310000312069ifrs-full:LifetimeExpectedCreditLossesMemberifrs-full:FinancialInstrumentsCreditimpairedMemberbcs:OtherFinancialAssetsSubjectToImpairmentMemberifrs-full:GrossCarryingAmountMember2023-12-310000312069ifrs-full:MortgagesMemberifrs-full:FinancialAssetsAtAmortisedCostMembercountry:GBifrs-full:GrossCarryingAmountMemberifrs-full:TwelvemonthExpectedCreditLossesMember2022-12-310000312069ifrs-full:LifetimeExpectedCreditLossesMemberifrs-full:MortgagesMemberifrs-full:FinancialAssetsAtAmortisedCostMembercountry:GBifrs-full:GrossCarryingAmountMemberifrs-full:FinancialInstrumentsNotCreditimpairedMember2022-12-310000312069ifrs-full:LifetimeExpectedCreditLossesMemberifrs-full:MortgagesMemberifrs-full:FinancialInstrumentsCreditimpairedMemberifrs-full:FinancialAssetsAtAmortisedCostMembercountry:GBifrs-full:GrossCarryingAmountMember2022-12-310000312069ifrs-full:MortgagesMemberifrs-full:FinancialAssetsAtAmortisedCostMembercountry:GBifrs-full:GrossCarryingAmountMember2022-12-310000312069ifrs-full:AccumulatedImpairmentMemberifrs-full:MortgagesMemberifrs-full:FinancialAssetsAtAmortisedCostMembercountry:GBifrs-full:TwelvemonthExpectedCreditLossesMember2022-12-310000312069ifrs-full:AccumulatedImpairmentMemberifrs-full:LifetimeExpectedCreditLossesMemberifrs-full:MortgagesMemberifrs-full:FinancialAssetsAtAmortisedCostMembercountry:GBifrs-full:FinancialInstrumentsNotCreditimpairedMember2022-12-310000312069ifrs-full:AccumulatedImpairmentMemberifrs-full:LifetimeExpectedCreditLossesMemberifrs-full:MortgagesMemberifrs-full:FinancialInstrumentsCreditimpairedMemberifrs-full:FinancialAssetsAtAmortisedCostMembercountry:GB2022-12-310000312069ifrs-full:AccumulatedImpairmentMemberifrs-full:MortgagesMemberifrs-full:FinancialAssetsAtAmortisedCostMembercountry:GB2022-12-310000312069bcs:CreditCardsRetailMemberifrs-full:FinancialAssetsAtAmortisedCostMembercountry:GBifrs-full:GrossCarryingAmountMemberifrs-full:TwelvemonthExpectedCreditLossesMember2022-12-310000312069bcs:CreditCardsRetailMemberifrs-full:LifetimeExpectedCreditLossesMemberifrs-full:FinancialAssetsAtAmortisedCostMembercountry:GBifrs-full:GrossCarryingAmountMemberifrs-full:FinancialInstrumentsNotCreditimpairedMember2022-12-310000312069bcs:CreditCardsRetailMemberifrs-full:LifetimeExpectedCreditLossesMemberifrs-full:FinancialInstrumentsCreditimpairedMemberifrs-full:FinancialAssetsAtAmortisedCostMembercountry:GBifrs-full:GrossCarryingAmountMember2022-12-310000312069bcs:CreditCardsRetailMemberifrs-full:FinancialAssetsAtAmortisedCostMembercountry:GBifrs-full:GrossCarryingAmountMember2022-12-310000312069bcs:CreditCardsRetailMemberifrs-full:AccumulatedImpairmentMemberifrs-full:FinancialAssetsAtAmortisedCostMembercountry:GBifrs-full:TwelvemonthExpectedCreditLossesMember2022-12-310000312069bcs:CreditCardsRetailMemberifrs-full:AccumulatedImpairmentMemberifrs-full:LifetimeExpectedCreditLossesMemberifrs-full:FinancialAssetsAtAmortisedCostMembercountry:GBifrs-full:FinancialInstrumentsNotCreditimpairedMember2022-12-310000312069bcs:CreditCardsRetailMemberifrs-full:AccumulatedImpairmentMemberifrs-full:LifetimeExpectedCreditLossesMemberifrs-full:FinancialInstrumentsCreditimpairedMemberifrs-full:FinancialAssetsAtAmortisedCostMembercountry:GB2022-12-310000312069bcs:CreditCardsRetailMemberifrs-full:AccumulatedImpairmentMemberifrs-full:FinancialAssetsAtAmortisedCostMembercountry:GB2022-12-310000312069bcs:OtherRetailMemberifrs-full:FinancialAssetsAtAmortisedCostMembercountry:GBifrs-full:GrossCarryingAmountMemberifrs-full:TwelvemonthExpectedCreditLossesMember2022-12-310000312069ifrs-full:LifetimeExpectedCreditLossesMemberbcs:OtherRetailMemberifrs-full:FinancialAssetsAtAmortisedCostMembercountry:GBifrs-full:GrossCarryingAmountMemberifrs-full:FinancialInstrumentsNotCreditimpairedMember2022-12-310000312069ifrs-full:LifetimeExpectedCreditLossesMemberbcs:OtherRetailMemberifrs-full:FinancialInstrumentsCreditimpairedMemberifrs-full:FinancialAssetsAtAmortisedCostMembercountry:GBifrs-full:GrossCarryingAmountMember2022-12-310000312069bcs:OtherRetailMemberifrs-full:FinancialAssetsAtAmortisedCostMembercountry:GBifrs-full:GrossCarryingAmountMember2022-12-310000312069ifrs-full:AccumulatedImpairmentMemberbcs:OtherRetailMemberifrs-full:FinancialAssetsAtAmortisedCostMembercountry:GBifrs-full:TwelvemonthExpectedCreditLossesMember2022-12-310000312069ifrs-full:AccumulatedImpairmentMemberifrs-full:LifetimeExpectedCreditLossesMemberbcs:OtherRetailMemberifrs-full:FinancialAssetsAtAmortisedCostMembercountry:GBifrs-full:FinancialInstrumentsNotCreditimpairedMember2022-12-310000312069ifrs-full:AccumulatedImpairmentMemberifrs-full:LifetimeExpectedCreditLossesMemberbcs:OtherRetailMemberifrs-full:FinancialInstrumentsCreditimpairedMemberifrs-full:FinancialAssetsAtAmortisedCostMembercountry:GB2022-12-310000312069ifrs-full:AccumulatedImpairmentMemberbcs:OtherRetailMemberifrs-full:FinancialAssetsAtAmortisedCostMembercountry:GB2022-12-310000312069ifrs-full:CorporateLoansMemberifrs-full:FinancialAssetsAtAmortisedCostMembercountry:GBifrs-full:GrossCarryingAmountMemberifrs-full:TwelvemonthExpectedCreditLossesMember2022-12-310000312069ifrs-full:LifetimeExpectedCreditLossesMemberifrs-full:CorporateLoansMemberifrs-full:FinancialAssetsAtAmortisedCostMembercountry:GBifrs-full:GrossCarryingAmountMemberifrs-full:FinancialInstrumentsNotCreditimpairedMember2022-12-310000312069ifrs-full:LifetimeExpectedCreditLossesMemberifrs-full:CorporateLoansMemberifrs-full:FinancialInstrumentsCreditimpairedMemberifrs-full:FinancialAssetsAtAmortisedCostMembercountry:GBifrs-full:GrossCarryingAmountMember2022-12-310000312069ifrs-full:CorporateLoansMemberifrs-full:FinancialAssetsAtAmortisedCostMembercountry:GBifrs-full:GrossCarryingAmountMember2022-12-310000312069ifrs-full:AccumulatedImpairmentMemberifrs-full:CorporateLoansMemberifrs-full:FinancialAssetsAtAmortisedCostMembercountry:GBifrs-full:TwelvemonthExpectedCreditLossesMember2022-12-310000312069ifrs-full:AccumulatedImpairmentMemberifrs-full:LifetimeExpectedCreditLossesMemberifrs-full:CorporateLoansMemberifrs-full:FinancialAssetsAtAmortisedCostMembercountry:GBifrs-full:FinancialInstrumentsNotCreditimpairedMember2022-12-310000312069ifrs-full:AccumulatedImpairmentMemberifrs-full:LifetimeExpectedCreditLossesMemberifrs-full:CorporateLoansMemberifrs-full:FinancialInstrumentsCreditimpairedMemberifrs-full:FinancialAssetsAtAmortisedCostMembercountry:GB2022-12-310000312069ifrs-full:AccumulatedImpairmentMemberifrs-full:CorporateLoansMemberifrs-full:FinancialAssetsAtAmortisedCostMembercountry:GB2022-12-310000312069ifrs-full:FinancialAssetsAtAmortisedCostMembercountry:GBifrs-full:GrossCarryingAmountMemberifrs-full:LoansAndReceivablesCategoryMemberifrs-full:TwelvemonthExpectedCreditLossesMember2022-12-310000312069ifrs-full:LifetimeExpectedCreditLossesMemberifrs-full:FinancialAssetsAtAmortisedCostMembercountry:GBifrs-full:GrossCarryingAmountMemberifrs-full:LoansAndReceivablesCategoryMemberifrs-full:FinancialInstrumentsNotCreditimpairedMember2022-12-310000312069ifrs-full:LifetimeExpectedCreditLossesMemberifrs-full:FinancialInstrumentsCreditimpairedMemberifrs-full:FinancialAssetsAtAmortisedCostMembercountry:GBifrs-full:GrossCarryingAmountMemberifrs-full:LoansAndReceivablesCategoryMember2022-12-310000312069ifrs-full:FinancialAssetsAtAmortisedCostMembercountry:GBifrs-full:GrossCarryingAmountMemberifrs-full:LoansAndReceivablesCategoryMember2022-12-310000312069ifrs-full:AccumulatedImpairmentMemberifrs-full:FinancialAssetsAtAmortisedCostMembercountry:GBifrs-full:LoansAndReceivablesCategoryMemberifrs-full:TwelvemonthExpectedCreditLossesMember2022-12-310000312069ifrs-full:AccumulatedImpairmentMemberifrs-full:LifetimeExpectedCreditLossesMemberifrs-full:FinancialAssetsAtAmortisedCostMembercountry:GBifrs-full:LoansAndReceivablesCategoryMemberifrs-full:FinancialInstrumentsNotCreditimpairedMember2022-12-310000312069ifrs-full:AccumulatedImpairmentMemberifrs-full:LifetimeExpectedCreditLossesMemberifrs-full:FinancialInstrumentsCreditimpairedMemberifrs-full:FinancialAssetsAtAmortisedCostMembercountry:GBifrs-full:LoansAndReceivablesCategoryMember2022-12-310000312069ifrs-full:AccumulatedImpairmentMemberifrs-full:FinancialAssetsAtAmortisedCostMembercountry:GBifrs-full:LoansAndReceivablesCategoryMember2022-12-310000312069ifrs-full:MortgagesMemberbcs:RestOfTheWorldMemberifrs-full:FinancialAssetsAtAmortisedCostMemberifrs-full:GrossCarryingAmountMemberifrs-full:TwelvemonthExpectedCreditLossesMember2022-12-310000312069ifrs-full:LifetimeExpectedCreditLossesMemberifrs-full:MortgagesMemberbcs:RestOfTheWorldMemberifrs-full:FinancialAssetsAtAmortisedCostMemberifrs-full:GrossCarryingAmountMemberifrs-full:FinancialInstrumentsNotCreditimpairedMember2022-12-310000312069ifrs-full:LifetimeExpectedCreditLossesMemberifrs-full:MortgagesMemberifrs-full:FinancialInstrumentsCreditimpairedMemberbcs:RestOfTheWorldMemberifrs-full:FinancialAssetsAtAmortisedCostMemberifrs-full:GrossCarryingAmountMember2022-12-310000312069ifrs-full:MortgagesMemberbcs:RestOfTheWorldMemberifrs-full:FinancialAssetsAtAmortisedCostMemberifrs-full:GrossCarryingAmountMember2022-12-310000312069ifrs-full:AccumulatedImpairmentMemberifrs-full:MortgagesMemberbcs:RestOfTheWorldMemberifrs-full:FinancialAssetsAtAmortisedCostMemberifrs-full:TwelvemonthExpectedCreditLossesMember2022-12-310000312069ifrs-full:AccumulatedImpairmentMemberifrs-full:LifetimeExpectedCreditLossesMemberifrs-full:MortgagesMemberbcs:RestOfTheWorldMemberifrs-full:FinancialAssetsAtAmortisedCostMemberifrs-full:FinancialInstrumentsNotCreditimpairedMember2022-12-310000312069ifrs-full:AccumulatedImpairmentMemberifrs-full:LifetimeExpectedCreditLossesMemberifrs-full:MortgagesMemberifrs-full:FinancialInstrumentsCreditimpairedMemberbcs:RestOfTheWorldMemberifrs-full:FinancialAssetsAtAmortisedCostMember2022-12-310000312069ifrs-full:AccumulatedImpairmentMemberifrs-full:MortgagesMemberbcs:RestOfTheWorldMemberifrs-full:FinancialAssetsAtAmortisedCostMember2022-12-310000312069bcs:CreditCardsRetailMemberbcs:RestOfTheWorldMemberifrs-full:FinancialAssetsAtAmortisedCostMemberifrs-full:GrossCarryingAmountMemberifrs-full:TwelvemonthExpectedCreditLossesMember2022-12-310000312069bcs:CreditCardsRetailMemberifrs-full:LifetimeExpectedCreditLossesMemberbcs:RestOfTheWorldMemberifrs-full:FinancialAssetsAtAmortisedCostMemberifrs-full:GrossCarryingAmountMemberifrs-full:FinancialInstrumentsNotCreditimpairedMember2022-12-310000312069bcs:CreditCardsRetailMemberifrs-full:LifetimeExpectedCreditLossesMemberifrs-full:FinancialInstrumentsCreditimpairedMemberbcs:RestOfTheWorldMemberifrs-full:FinancialAssetsAtAmortisedCostMemberifrs-full:GrossCarryingAmountMember2022-12-310000312069bcs:CreditCardsRetailMemberbcs:RestOfTheWorldMemberifrs-full:FinancialAssetsAtAmortisedCostMemberifrs-full:GrossCarryingAmountMember2022-12-310000312069bcs:CreditCardsRetailMemberifrs-full:AccumulatedImpairmentMemberbcs:RestOfTheWorldMemberifrs-full:FinancialAssetsAtAmortisedCostMemberifrs-full:TwelvemonthExpectedCreditLossesMember2022-12-310000312069bcs:CreditCardsRetailMemberifrs-full:AccumulatedImpairmentMemberifrs-full:LifetimeExpectedCreditLossesMemberbcs:RestOfTheWorldMemberifrs-full:FinancialAssetsAtAmortisedCostMemberifrs-full:FinancialInstrumentsNotCreditimpairedMember2022-12-310000312069bcs:CreditCardsRetailMemberifrs-full:AccumulatedImpairmentMemberifrs-full:LifetimeExpectedCreditLossesMemberifrs-full:FinancialInstrumentsCreditimpairedMemberbcs:RestOfTheWorldMemberifrs-full:FinancialAssetsAtAmortisedCostMember2022-12-310000312069bcs:CreditCardsRetailMemberifrs-full:AccumulatedImpairmentMemberbcs:RestOfTheWorldMemberifrs-full:FinancialAssetsAtAmortisedCostMember2022-12-310000312069bcs:OtherRetailMemberbcs:RestOfTheWorldMemberifrs-full:FinancialAssetsAtAmortisedCostMemberifrs-full:GrossCarryingAmountMemberifrs-full:TwelvemonthExpectedCreditLossesMember2022-12-310000312069ifrs-full:LifetimeExpectedCreditLossesMemberbcs:OtherRetailMemberbcs:RestOfTheWorldMemberifrs-full:FinancialAssetsAtAmortisedCostMemberifrs-full:GrossCarryingAmountMemberifrs-full:FinancialInstrumentsNotCreditimpairedMember2022-12-310000312069ifrs-full:LifetimeExpectedCreditLossesMemberbcs:OtherRetailMemberifrs-full:FinancialInstrumentsCreditimpairedMemberbcs:RestOfTheWorldMemberifrs-full:FinancialAssetsAtAmortisedCostMemberifrs-full:GrossCarryingAmountMember2022-12-310000312069bcs:OtherRetailMemberbcs:RestOfTheWorldMemberifrs-full:FinancialAssetsAtAmortisedCostMemberifrs-full:GrossCarryingAmountMember2022-12-310000312069ifrs-full:AccumulatedImpairmentMemberbcs:OtherRetailMemberbcs:RestOfTheWorldMemberifrs-full:FinancialAssetsAtAmortisedCostMemberifrs-full:TwelvemonthExpectedCreditLossesMember2022-12-310000312069ifrs-full:AccumulatedImpairmentMemberifrs-full:LifetimeExpectedCreditLossesMemberbcs:OtherRetailMemberbcs:RestOfTheWorldMemberifrs-full:FinancialAssetsAtAmortisedCostMemberifrs-full:FinancialInstrumentsNotCreditimpairedMember2022-12-310000312069ifrs-full:AccumulatedImpairmentMemberifrs-full:LifetimeExpectedCreditLossesMemberbcs:OtherRetailMemberifrs-full:FinancialInstrumentsCreditimpairedMemberbcs:RestOfTheWorldMemberifrs-full:FinancialAssetsAtAmortisedCostMember2022-12-310000312069ifrs-full:AccumulatedImpairmentMemberbcs:OtherRetailMemberbcs:RestOfTheWorldMemberifrs-full:FinancialAssetsAtAmortisedCostMember2022-12-310000312069ifrs-full:CorporateLoansMemberbcs:RestOfTheWorldMemberifrs-full:FinancialAssetsAtAmortisedCostMemberifrs-full:GrossCarryingAmountMemberifrs-full:TwelvemonthExpectedCreditLossesMember2022-12-310000312069ifrs-full:LifetimeExpectedCreditLossesMemberifrs-full:CorporateLoansMemberbcs:RestOfTheWorldMemberifrs-full:FinancialAssetsAtAmortisedCostMemberifrs-full:GrossCarryingAmountMemberifrs-full:FinancialInstrumentsNotCreditimpairedMember2022-12-310000312069ifrs-full:LifetimeExpectedCreditLossesMemberifrs-full:CorporateLoansMemberifrs-full:FinancialInstrumentsCreditimpairedMemberbcs:RestOfTheWorldMemberifrs-full:FinancialAssetsAtAmortisedCostMemberifrs-full:GrossCarryingAmountMember2022-12-310000312069ifrs-full:CorporateLoansMemberbcs:RestOfTheWorldMemberifrs-full:FinancialAssetsAtAmortisedCostMemberifrs-full:GrossCarryingAmountMember2022-12-310000312069ifrs-full:AccumulatedImpairmentMemberifrs-full:CorporateLoansMemberbcs:RestOfTheWorldMemberifrs-full:FinancialAssetsAtAmortisedCostMemberifrs-full:TwelvemonthExpectedCreditLossesMember2022-12-310000312069ifrs-full:AccumulatedImpairmentMemberifrs-full:LifetimeExpectedCreditLossesMemberifrs-full:CorporateLoansMemberbcs:RestOfTheWorldMemberifrs-full:FinancialAssetsAtAmortisedCostMemberifrs-full:FinancialInstrumentsNotCreditimpairedMember2022-12-310000312069ifrs-full:AccumulatedImpairmentMemberifrs-full:LifetimeExpectedCreditLossesMemberifrs-full:CorporateLoansMemberifrs-full:FinancialInstrumentsCreditimpairedMemberbcs:RestOfTheWorldMemberifrs-full:FinancialAssetsAtAmortisedCostMember2022-12-310000312069ifrs-full:AccumulatedImpairmentMemberifrs-full:CorporateLoansMemberbcs:RestOfTheWorldMemberifrs-full:FinancialAssetsAtAmortisedCostMember2022-12-310000312069bcs:RestOfTheWorldMemberifrs-full:FinancialAssetsAtAmortisedCostMemberifrs-full:GrossCarryingAmountMemberifrs-full:LoansAndReceivablesCategoryMemberifrs-full:TwelvemonthExpectedCreditLossesMember2022-12-310000312069ifrs-full:LifetimeExpectedCreditLossesMemberbcs:RestOfTheWorldMemberifrs-full:FinancialAssetsAtAmortisedCostMemberifrs-full:GrossCarryingAmountMemberifrs-full:LoansAndReceivablesCategoryMemberifrs-full:FinancialInstrumentsNotCreditimpairedMember2022-12-310000312069ifrs-full:LifetimeExpectedCreditLossesMemberifrs-full:FinancialInstrumentsCreditimpairedMemberbcs:RestOfTheWorldMemberifrs-full:FinancialAssetsAtAmortisedCostMemberifrs-full:GrossCarryingAmountMemberifrs-full:LoansAndReceivablesCategoryMember2022-12-310000312069bcs:RestOfTheWorldMemberifrs-full:FinancialAssetsAtAmortisedCostMemberifrs-full:GrossCarryingAmountMemberifrs-full:LoansAndReceivablesCategoryMember2022-12-310000312069ifrs-full:AccumulatedImpairmentMemberbcs:RestOfTheWorldMemberifrs-full:FinancialAssetsAtAmortisedCostMemberifrs-full:LoansAndReceivablesCategoryMemberifrs-full:TwelvemonthExpectedCreditLossesMember2022-12-310000312069ifrs-full:AccumulatedImpairmentMemberifrs-full:LifetimeExpectedCreditLossesMemberbcs:RestOfTheWorldMemberifrs-full:FinancialAssetsAtAmortisedCostMemberifrs-full:LoansAndReceivablesCategoryMemberifrs-full:FinancialInstrumentsNotCreditimpairedMember2022-12-310000312069ifrs-full:AccumulatedImpairmentMemberifrs-full:LifetimeExpectedCreditLossesMemberifrs-full:FinancialInstrumentsCreditimpairedMemberbcs:RestOfTheWorldMemberifrs-full:FinancialAssetsAtAmortisedCostMemberifrs-full:LoansAndReceivablesCategoryMember2022-12-310000312069ifrs-full:AccumulatedImpairmentMemberbcs:RestOfTheWorldMemberifrs-full:FinancialAssetsAtAmortisedCostMemberifrs-full:LoansAndReceivablesCategoryMember2022-12-310000312069ifrs-full:FinancialAssetsAtAmortisedCostMemberifrs-full:GrossCarryingAmountMemberifrs-full:LoansAndReceivablesCategoryMemberifrs-full:TwelvemonthExpectedCreditLossesMember2022-12-310000312069ifrs-full:LifetimeExpectedCreditLossesMemberifrs-full:FinancialAssetsAtAmortisedCostMemberifrs-full:GrossCarryingAmountMemberifrs-full:LoansAndReceivablesCategoryMemberifrs-full:FinancialInstrumentsNotCreditimpairedMember2022-12-310000312069ifrs-full:LifetimeExpectedCreditLossesMemberifrs-full:FinancialInstrumentsCreditimpairedMemberifrs-full:FinancialAssetsAtAmortisedCostMemberifrs-full:GrossCarryingAmountMemberifrs-full:LoansAndReceivablesCategoryMember2022-12-310000312069ifrs-full:FinancialAssetsAtAmortisedCostMemberifrs-full:GrossCarryingAmountMemberifrs-full:LoansAndReceivablesCategoryMember2022-12-310000312069ifrs-full:AccumulatedImpairmentMemberifrs-full:FinancialAssetsAtAmortisedCostMemberifrs-full:LoansAndReceivablesCategoryMemberifrs-full:TwelvemonthExpectedCreditLossesMember2022-12-310000312069ifrs-full:AccumulatedImpairmentMemberifrs-full:LifetimeExpectedCreditLossesMemberifrs-full:FinancialAssetsAtAmortisedCostMemberifrs-full:LoansAndReceivablesCategoryMemberifrs-full:FinancialInstrumentsNotCreditimpairedMember2022-12-310000312069ifrs-full:AccumulatedImpairmentMemberifrs-full:LifetimeExpectedCreditLossesMemberifrs-full:FinancialInstrumentsCreditimpairedMemberifrs-full:FinancialAssetsAtAmortisedCostMemberifrs-full:LoansAndReceivablesCategoryMember2022-12-310000312069ifrs-full:AccumulatedImpairmentMemberifrs-full:FinancialAssetsAtAmortisedCostMemberifrs-full:LoansAndReceivablesCategoryMember2022-12-310000312069ifrs-full:DebtSecuritiesMemberifrs-full:FinancialAssetsAtAmortisedCostMemberifrs-full:GrossCarryingAmountMemberifrs-full:TwelvemonthExpectedCreditLossesMember2022-12-310000312069ifrs-full:LifetimeExpectedCreditLossesMemberifrs-full:DebtSecuritiesMemberifrs-full:FinancialAssetsAtAmortisedCostMemberifrs-full:GrossCarryingAmountMemberifrs-full:FinancialInstrumentsNotCreditimpairedMember2022-12-310000312069ifrs-full:LifetimeExpectedCreditLossesMemberifrs-full:DebtSecuritiesMemberifrs-full:FinancialInstrumentsCreditimpairedMemberifrs-full:FinancialAssetsAtAmortisedCostMemberifrs-full:GrossCarryingAmountMember2022-12-310000312069ifrs-full:DebtSecuritiesMemberifrs-full:FinancialAssetsAtAmortisedCostMemberifrs-full:GrossCarryingAmountMember2022-12-310000312069ifrs-full:AccumulatedImpairmentMemberifrs-full:DebtSecuritiesMemberifrs-full:FinancialAssetsAtAmortisedCostMemberifrs-full:TwelvemonthExpectedCreditLossesMember2022-12-310000312069ifrs-full:AccumulatedImpairmentMemberifrs-full:LifetimeExpectedCreditLossesMemberifrs-full:DebtSecuritiesMemberifrs-full:FinancialAssetsAtAmortisedCostMemberifrs-full:FinancialInstrumentsNotCreditimpairedMember2022-12-310000312069ifrs-full:AccumulatedImpairmentMemberifrs-full:LifetimeExpectedCreditLossesMemberifrs-full:DebtSecuritiesMemberifrs-full:FinancialInstrumentsCreditimpairedMemberifrs-full:FinancialAssetsAtAmortisedCostMember2022-12-310000312069ifrs-full:AccumulatedImpairmentMemberifrs-full:DebtSecuritiesMemberifrs-full:FinancialAssetsAtAmortisedCostMember2022-12-310000312069bcs:LoansAndAdvancesAtAmortisedCostIncludingDebtSecuritiesMemberifrs-full:GrossCarryingAmountMemberifrs-full:TwelvemonthExpectedCreditLossesMember2022-12-310000312069ifrs-full:LifetimeExpectedCreditLossesMemberbcs:LoansAndAdvancesAtAmortisedCostIncludingDebtSecuritiesMemberifrs-full:GrossCarryingAmountMemberifrs-full:FinancialInstrumentsNotCreditimpairedMember2022-12-310000312069ifrs-full:LifetimeExpectedCreditLossesMemberifrs-full:FinancialInstrumentsCreditimpairedMemberbcs:LoansAndAdvancesAtAmortisedCostIncludingDebtSecuritiesMemberifrs-full:GrossCarryingAmountMember2022-12-310000312069bcs:LoansAndAdvancesAtAmortisedCostIncludingDebtSecuritiesMemberifrs-full:GrossCarryingAmountMember2022-12-310000312069ifrs-full:AccumulatedImpairmentMemberbcs:LoansAndAdvancesAtAmortisedCostIncludingDebtSecuritiesMemberifrs-full:TwelvemonthExpectedCreditLossesMember2022-12-310000312069ifrs-full:AccumulatedImpairmentMemberifrs-full:LifetimeExpectedCreditLossesMemberbcs:LoansAndAdvancesAtAmortisedCostIncludingDebtSecuritiesMemberifrs-full:FinancialInstrumentsNotCreditimpairedMember2022-12-310000312069ifrs-full:AccumulatedImpairmentMemberifrs-full:LifetimeExpectedCreditLossesMemberifrs-full:FinancialInstrumentsCreditimpairedMemberbcs:LoansAndAdvancesAtAmortisedCostIncludingDebtSecuritiesMember2022-12-310000312069ifrs-full:AccumulatedImpairmentMemberbcs:LoansAndAdvancesAtAmortisedCostIncludingDebtSecuritiesMember2022-12-310000312069ifrs-full:GrossCarryingAmountMemberifrs-full:TwelvemonthExpectedCreditLossesMemberbcs:OffBalanceSheetLoanCommitmentsAndFinancialGuaranteeContractsMember2022-12-310000312069ifrs-full:LifetimeExpectedCreditLossesMemberifrs-full:GrossCarryingAmountMemberifrs-full:FinancialInstrumentsNotCreditimpairedMemberbcs:OffBalanceSheetLoanCommitmentsAndFinancialGuaranteeContractsMember2022-12-310000312069ifrs-full:LifetimeExpectedCreditLossesMemberifrs-full:FinancialInstrumentsCreditimpairedMemberifrs-full:GrossCarryingAmountMemberbcs:OffBalanceSheetLoanCommitmentsAndFinancialGuaranteeContractsMember2022-12-310000312069ifrs-full:GrossCarryingAmountMemberbcs:OffBalanceSheetLoanCommitmentsAndFinancialGuaranteeContractsMember2022-12-310000312069ifrs-full:AccumulatedImpairmentMemberifrs-full:TwelvemonthExpectedCreditLossesMemberbcs:OffBalanceSheetLoanCommitmentsAndFinancialGuaranteeContractsMember2022-12-310000312069ifrs-full:AccumulatedImpairmentMemberifrs-full:LifetimeExpectedCreditLossesMemberifrs-full:FinancialInstrumentsNotCreditimpairedMemberbcs:OffBalanceSheetLoanCommitmentsAndFinancialGuaranteeContractsMember2022-12-310000312069ifrs-full:AccumulatedImpairmentMemberifrs-full:LifetimeExpectedCreditLossesMemberifrs-full:FinancialInstrumentsCreditimpairedMemberbcs:OffBalanceSheetLoanCommitmentsAndFinancialGuaranteeContractsMember2022-12-310000312069ifrs-full:AccumulatedImpairmentMemberbcs:OffBalanceSheetLoanCommitmentsAndFinancialGuaranteeContractsMember2022-12-310000312069bcs:LoansAndAdvancesAtAmortisedCostIncludingOffBalanceSheetLoanCommitmentsAndFinancialGuaranteeContractsMemberifrs-full:GrossCarryingAmountMemberifrs-full:TwelvemonthExpectedCreditLossesMember2022-12-310000312069ifrs-full:LifetimeExpectedCreditLossesMemberbcs:LoansAndAdvancesAtAmortisedCostIncludingOffBalanceSheetLoanCommitmentsAndFinancialGuaranteeContractsMemberifrs-full:GrossCarryingAmountMemberifrs-full:FinancialInstrumentsNotCreditimpairedMember2022-12-310000312069ifrs-full:LifetimeExpectedCreditLossesMemberbcs:LoansAndAdvancesAtAmortisedCostIncludingOffBalanceSheetLoanCommitmentsAndFinancialGuaranteeContractsMemberifrs-full:FinancialInstrumentsCreditimpairedMemberifrs-full:GrossCarryingAmountMember2022-12-310000312069bcs:LoansAndAdvancesAtAmortisedCostIncludingOffBalanceSheetLoanCommitmentsAndFinancialGuaranteeContractsMemberifrs-full:GrossCarryingAmountMember2022-12-310000312069ifrs-full:AccumulatedImpairmentMemberbcs:LoansAndAdvancesAtAmortisedCostIncludingOffBalanceSheetLoanCommitmentsAndFinancialGuaranteeContractsMemberifrs-full:TwelvemonthExpectedCreditLossesMember2022-12-310000312069ifrs-full:AccumulatedImpairmentMemberifrs-full:LifetimeExpectedCreditLossesMemberbcs:LoansAndAdvancesAtAmortisedCostIncludingOffBalanceSheetLoanCommitmentsAndFinancialGuaranteeContractsMemberifrs-full:FinancialInstrumentsNotCreditimpairedMember2022-12-310000312069ifrs-full:AccumulatedImpairmentMemberifrs-full:LifetimeExpectedCreditLossesMemberbcs:LoansAndAdvancesAtAmortisedCostIncludingOffBalanceSheetLoanCommitmentsAndFinancialGuaranteeContractsMemberifrs-full:FinancialInstrumentsCreditimpairedMember2022-12-310000312069ifrs-full:AccumulatedImpairmentMemberbcs:LoansAndAdvancesAtAmortisedCostIncludingOffBalanceSheetLoanCommitmentsAndFinancialGuaranteeContractsMember2022-12-310000312069ifrs-full:MortgagesMemberifrs-full:FinancialAssetsAtAmortisedCostMembercountry:GBifrs-full:TwelvemonthExpectedCreditLossesMember2022-12-310000312069ifrs-full:LifetimeExpectedCreditLossesMemberifrs-full:MortgagesMemberifrs-full:FinancialAssetsAtAmortisedCostMembercountry:GBifrs-full:FinancialInstrumentsNotCreditimpairedMember2022-12-310000312069ifrs-full:LifetimeExpectedCreditLossesMemberifrs-full:MortgagesMemberifrs-full:FinancialInstrumentsCreditimpairedMemberifrs-full:FinancialAssetsAtAmortisedCostMembercountry:GB2022-12-310000312069ifrs-full:MortgagesMemberifrs-full:FinancialAssetsAtAmortisedCostMembercountry:GB2022-12-310000312069bcs:CreditCardsRetailMemberifrs-full:FinancialAssetsAtAmortisedCostMembercountry:GBifrs-full:TwelvemonthExpectedCreditLossesMember2022-12-310000312069bcs:CreditCardsRetailMemberifrs-full:LifetimeExpectedCreditLossesMemberifrs-full:FinancialAssetsAtAmortisedCostMembercountry:GBifrs-full:FinancialInstrumentsNotCreditimpairedMember2022-12-310000312069bcs:CreditCardsRetailMemberifrs-full:LifetimeExpectedCreditLossesMemberifrs-full:FinancialInstrumentsCreditimpairedMemberifrs-full:FinancialAssetsAtAmortisedCostMembercountry:GB2022-12-310000312069bcs:CreditCardsRetailMemberifrs-full:FinancialAssetsAtAmortisedCostMembercountry:GB2022-12-310000312069bcs:OtherRetailMemberifrs-full:FinancialAssetsAtAmortisedCostMembercountry:GBifrs-full:TwelvemonthExpectedCreditLossesMember2022-12-310000312069ifrs-full:LifetimeExpectedCreditLossesMemberbcs:OtherRetailMemberifrs-full:FinancialAssetsAtAmortisedCostMembercountry:GBifrs-full:FinancialInstrumentsNotCreditimpairedMember2022-12-310000312069ifrs-full:LifetimeExpectedCreditLossesMemberbcs:OtherRetailMemberifrs-full:FinancialInstrumentsCreditimpairedMemberifrs-full:FinancialAssetsAtAmortisedCostMembercountry:GB2022-12-310000312069bcs:OtherRetailMemberifrs-full:FinancialAssetsAtAmortisedCostMembercountry:GB2022-12-310000312069ifrs-full:CorporateLoansMemberifrs-full:FinancialAssetsAtAmortisedCostMembercountry:GBifrs-full:TwelvemonthExpectedCreditLossesMember2022-12-310000312069ifrs-full:LifetimeExpectedCreditLossesMemberifrs-full:CorporateLoansMemberifrs-full:FinancialAssetsAtAmortisedCostMembercountry:GBifrs-full:FinancialInstrumentsNotCreditimpairedMember2022-12-310000312069ifrs-full:LifetimeExpectedCreditLossesMemberifrs-full:CorporateLoansMemberifrs-full:FinancialInstrumentsCreditimpairedMemberifrs-full:FinancialAssetsAtAmortisedCostMembercountry:GB2022-12-310000312069ifrs-full:CorporateLoansMemberifrs-full:FinancialAssetsAtAmortisedCostMembercountry:GB2022-12-310000312069ifrs-full:FinancialAssetsAtAmortisedCostMembercountry:GBifrs-full:LoansAndReceivablesCategoryMemberifrs-full:TwelvemonthExpectedCreditLossesMember2022-12-310000312069ifrs-full:LifetimeExpectedCreditLossesMemberifrs-full:FinancialAssetsAtAmortisedCostMembercountry:GBifrs-full:LoansAndReceivablesCategoryMemberifrs-full:FinancialInstrumentsNotCreditimpairedMember2022-12-310000312069ifrs-full:LifetimeExpectedCreditLossesMemberifrs-full:FinancialInstrumentsCreditimpairedMemberifrs-full:FinancialAssetsAtAmortisedCostMembercountry:GBifrs-full:LoansAndReceivablesCategoryMember2022-12-310000312069ifrs-full:FinancialAssetsAtAmortisedCostMembercountry:GBifrs-full:LoansAndReceivablesCategoryMember2022-12-310000312069ifrs-full:MortgagesMemberbcs:RestOfTheWorldMemberifrs-full:FinancialAssetsAtAmortisedCostMemberifrs-full:TwelvemonthExpectedCreditLossesMember2022-12-310000312069ifrs-full:LifetimeExpectedCreditLossesMemberifrs-full:MortgagesMemberbcs:RestOfTheWorldMemberifrs-full:FinancialAssetsAtAmortisedCostMemberifrs-full:FinancialInstrumentsNotCreditimpairedMember2022-12-310000312069ifrs-full:LifetimeExpectedCreditLossesMemberifrs-full:MortgagesMemberifrs-full:FinancialInstrumentsCreditimpairedMemberbcs:RestOfTheWorldMemberifrs-full:FinancialAssetsAtAmortisedCostMember2022-12-310000312069ifrs-full:MortgagesMemberbcs:RestOfTheWorldMemberifrs-full:FinancialAssetsAtAmortisedCostMember2022-12-310000312069bcs:CreditCardsRetailMemberbcs:RestOfTheWorldMemberifrs-full:FinancialAssetsAtAmortisedCostMemberifrs-full:TwelvemonthExpectedCreditLossesMember2022-12-310000312069bcs:CreditCardsRetailMemberifrs-full:LifetimeExpectedCreditLossesMemberbcs:RestOfTheWorldMemberifrs-full:FinancialAssetsAtAmortisedCostMemberifrs-full:FinancialInstrumentsNotCreditimpairedMember2022-12-310000312069bcs:CreditCardsRetailMemberifrs-full:LifetimeExpectedCreditLossesMemberifrs-full:FinancialInstrumentsCreditimpairedMemberbcs:RestOfTheWorldMemberifrs-full:FinancialAssetsAtAmortisedCostMember2022-12-310000312069bcs:CreditCardsRetailMemberbcs:RestOfTheWorldMemberifrs-full:FinancialAssetsAtAmortisedCostMember2022-12-310000312069bcs:OtherRetailMemberbcs:RestOfTheWorldMemberifrs-full:FinancialAssetsAtAmortisedCostMemberifrs-full:TwelvemonthExpectedCreditLossesMember2022-12-310000312069ifrs-full:LifetimeExpectedCreditLossesMemberbcs:OtherRetailMemberbcs:RestOfTheWorldMemberifrs-full:FinancialAssetsAtAmortisedCostMemberifrs-full:FinancialInstrumentsNotCreditimpairedMember2022-12-310000312069ifrs-full:LifetimeExpectedCreditLossesMemberbcs:OtherRetailMemberifrs-full:FinancialInstrumentsCreditimpairedMemberbcs:RestOfTheWorldMemberifrs-full:FinancialAssetsAtAmortisedCostMember2022-12-310000312069bcs:OtherRetailMemberbcs:RestOfTheWorldMemberifrs-full:FinancialAssetsAtAmortisedCostMember2022-12-310000312069ifrs-full:CorporateLoansMemberbcs:RestOfTheWorldMemberifrs-full:FinancialAssetsAtAmortisedCostMemberifrs-full:TwelvemonthExpectedCreditLossesMember2022-12-310000312069ifrs-full:LifetimeExpectedCreditLossesMemberifrs-full:CorporateLoansMemberbcs:RestOfTheWorldMemberifrs-full:FinancialAssetsAtAmortisedCostMemberifrs-full:FinancialInstrumentsNotCreditimpairedMember2022-12-310000312069ifrs-full:LifetimeExpectedCreditLossesMemberifrs-full:CorporateLoansMemberifrs-full:FinancialInstrumentsCreditimpairedMemberbcs:RestOfTheWorldMemberifrs-full:FinancialAssetsAtAmortisedCostMember2022-12-310000312069ifrs-full:CorporateLoansMemberbcs:RestOfTheWorldMemberifrs-full:FinancialAssetsAtAmortisedCostMember2022-12-310000312069bcs:RestOfTheWorldMemberifrs-full:FinancialAssetsAtAmortisedCostMemberifrs-full:LoansAndReceivablesCategoryMemberifrs-full:TwelvemonthExpectedCreditLossesMember2022-12-310000312069ifrs-full:LifetimeExpectedCreditLossesMemberbcs:RestOfTheWorldMemberifrs-full:FinancialAssetsAtAmortisedCostMemberifrs-full:LoansAndReceivablesCategoryMemberifrs-full:FinancialInstrumentsNotCreditimpairedMember2022-12-310000312069ifrs-full:LifetimeExpectedCreditLossesMemberifrs-full:FinancialInstrumentsCreditimpairedMemberbcs:RestOfTheWorldMemberifrs-full:FinancialAssetsAtAmortisedCostMemberifrs-full:LoansAndReceivablesCategoryMember2022-12-310000312069bcs:RestOfTheWorldMemberifrs-full:FinancialAssetsAtAmortisedCostMemberifrs-full:LoansAndReceivablesCategoryMember2022-12-310000312069ifrs-full:FinancialAssetsAtAmortisedCostMemberifrs-full:LoansAndReceivablesCategoryMemberifrs-full:TwelvemonthExpectedCreditLossesMember2022-12-310000312069ifrs-full:LifetimeExpectedCreditLossesMemberifrs-full:FinancialAssetsAtAmortisedCostMemberifrs-full:LoansAndReceivablesCategoryMemberifrs-full:FinancialInstrumentsNotCreditimpairedMember2022-12-310000312069ifrs-full:LifetimeExpectedCreditLossesMemberifrs-full:FinancialInstrumentsCreditimpairedMemberifrs-full:FinancialAssetsAtAmortisedCostMemberifrs-full:LoansAndReceivablesCategoryMember2022-12-310000312069ifrs-full:FinancialAssetsAtAmortisedCostMemberifrs-full:LoansAndReceivablesCategoryMember2022-12-310000312069ifrs-full:DebtSecuritiesMemberifrs-full:FinancialAssetsAtAmortisedCostMemberifrs-full:TwelvemonthExpectedCreditLossesMember2022-12-310000312069ifrs-full:LifetimeExpectedCreditLossesMemberifrs-full:DebtSecuritiesMemberifrs-full:FinancialAssetsAtAmortisedCostMemberifrs-full:FinancialInstrumentsNotCreditimpairedMember2022-12-310000312069ifrs-full:LifetimeExpectedCreditLossesMemberifrs-full:DebtSecuritiesMemberifrs-full:FinancialInstrumentsCreditimpairedMemberifrs-full:FinancialAssetsAtAmortisedCostMember2022-12-310000312069ifrs-full:DebtSecuritiesMemberifrs-full:FinancialAssetsAtAmortisedCostMember2022-12-310000312069bcs:LoansAndAdvancesAtAmortisedCostIncludingDebtSecuritiesMemberifrs-full:TwelvemonthExpectedCreditLossesMember2022-12-310000312069ifrs-full:LifetimeExpectedCreditLossesMemberbcs:LoansAndAdvancesAtAmortisedCostIncludingDebtSecuritiesMemberifrs-full:FinancialInstrumentsNotCreditimpairedMember2022-12-310000312069ifrs-full:LifetimeExpectedCreditLossesMemberifrs-full:FinancialInstrumentsCreditimpairedMemberbcs:LoansAndAdvancesAtAmortisedCostIncludingDebtSecuritiesMember2022-12-310000312069bcs:LoansAndAdvancesAtAmortisedCostIncludingDebtSecuritiesMember2022-12-310000312069ifrs-full:TwelvemonthExpectedCreditLossesMemberbcs:OffBalanceSheetLoanCommitmentsAndFinancialGuaranteeContractsMember2022-12-310000312069ifrs-full:LifetimeExpectedCreditLossesMemberifrs-full:FinancialInstrumentsNotCreditimpairedMemberbcs:OffBalanceSheetLoanCommitmentsAndFinancialGuaranteeContractsMember2022-12-310000312069ifrs-full:LifetimeExpectedCreditLossesMemberifrs-full:FinancialInstrumentsCreditimpairedMemberbcs:OffBalanceSheetLoanCommitmentsAndFinancialGuaranteeContractsMember2022-12-310000312069bcs:OffBalanceSheetLoanCommitmentsAndFinancialGuaranteeContractsMember2022-12-310000312069bcs:LoansAndAdvancesAtAmortisedCostIncludingOffBalanceSheetLoanCommitmentsAndFinancialGuaranteeContractsMemberifrs-full:TwelvemonthExpectedCreditLossesMember2022-12-310000312069ifrs-full:LifetimeExpectedCreditLossesMemberbcs:LoansAndAdvancesAtAmortisedCostIncludingOffBalanceSheetLoanCommitmentsAndFinancialGuaranteeContractsMemberifrs-full:FinancialInstrumentsNotCreditimpairedMember2022-12-310000312069ifrs-full:LifetimeExpectedCreditLossesMemberbcs:LoansAndAdvancesAtAmortisedCostIncludingOffBalanceSheetLoanCommitmentsAndFinancialGuaranteeContractsMemberifrs-full:FinancialInstrumentsCreditimpairedMember2022-12-310000312069bcs:LoansAndAdvancesAtAmortisedCostIncludingOffBalanceSheetLoanCommitmentsAndFinancialGuaranteeContractsMember2022-12-310000312069ifrs-full:CorporateLoansMemberifrs-full:FinancialAssetsAtAmortisedCostMembercountry:GBbcs:BusinessBankingMemberifrs-full:GrossCarryingAmountMember2022-12-310000312069ifrs-full:AccumulatedImpairmentMemberifrs-full:CorporateLoansMemberifrs-full:FinancialAssetsAtAmortisedCostMembercountry:GBbcs:BusinessBankingMember2022-12-310000312069ifrs-full:AccumulatedImpairmentMemberifrs-full:CorporateLoansMemberifrs-full:FinancialAssetsAtAmortisedCostMembercountry:GBbcs:BusinessBankingMemberifrs-full:TwelvemonthExpectedCreditLossesMember2022-12-310000312069ifrs-full:CorporateLoansMemberifrs-full:FinancialAssetsAtAmortisedCostMembercountry:GBbcs:BusinessBankingMemberifrs-full:GrossCarryingAmountMemberifrs-full:TwelvemonthExpectedCreditLossesMember2022-12-310000312069ifrs-full:AccumulatedImpairmentMemberifrs-full:LifetimeExpectedCreditLossesMemberifrs-full:CorporateLoansMemberifrs-full:FinancialAssetsAtAmortisedCostMembercountry:GBbcs:BusinessBankingMemberifrs-full:FinancialInstrumentsNotCreditimpairedMember2022-12-310000312069ifrs-full:LifetimeExpectedCreditLossesMemberifrs-full:CorporateLoansMemberifrs-full:FinancialAssetsAtAmortisedCostMembercountry:GBbcs:BusinessBankingMemberifrs-full:GrossCarryingAmountMemberifrs-full:FinancialInstrumentsNotCreditimpairedMember2022-12-310000312069ifrs-full:AccumulatedImpairmentMemberifrs-full:LifetimeExpectedCreditLossesMemberifrs-full:CorporateLoansMemberifrs-full:FinancialInstrumentsCreditimpairedMemberifrs-full:FinancialAssetsAtAmortisedCostMembercountry:GBbcs:BusinessBankingMember2022-12-310000312069ifrs-full:LifetimeExpectedCreditLossesMemberifrs-full:CorporateLoansMemberifrs-full:FinancialInstrumentsCreditimpairedMemberifrs-full:FinancialAssetsAtAmortisedCostMembercountry:GBbcs:BusinessBankingMemberifrs-full:GrossCarryingAmountMember2022-12-310000312069ifrs-full:GrossCarryingAmountMemberifrs-full:FinancialAssetsAtFairValueThroughProfitOrLossDesignatedUponInitialRecognitionCategoryMember2022-12-310000312069bcs:OtherFinancialAssetsSubjectToImpairmentMemberifrs-full:GrossCarryingAmountMember2022-12-310000312069ifrs-full:AccumulatedImpairmentMemberbcs:OtherFinancialAssetsSubjectToImpairmentMember2022-12-310000312069ifrs-full:AccumulatedImpairmentMemberbcs:OtherFinancialAssetsSubjectToImpairmentMemberifrs-full:TwelvemonthExpectedCreditLossesMember2022-12-310000312069bcs:OtherFinancialAssetsSubjectToImpairmentMemberifrs-full:GrossCarryingAmountMemberifrs-full:TwelvemonthExpectedCreditLossesMember2022-12-310000312069ifrs-full:AccumulatedImpairmentMemberifrs-full:LifetimeExpectedCreditLossesMemberbcs:OtherFinancialAssetsSubjectToImpairmentMemberifrs-full:FinancialInstrumentsNotCreditimpairedMember2022-12-310000312069ifrs-full:LifetimeExpectedCreditLossesMemberbcs:OtherFinancialAssetsSubjectToImpairmentMemberifrs-full:GrossCarryingAmountMemberifrs-full:FinancialInstrumentsNotCreditimpairedMember2022-12-310000312069ifrs-full:AccumulatedImpairmentMemberifrs-full:LifetimeExpectedCreditLossesMemberifrs-full:FinancialInstrumentsCreditimpairedMemberbcs:OtherFinancialAssetsSubjectToImpairmentMember2022-12-310000312069ifrs-full:LifetimeExpectedCreditLossesMemberifrs-full:FinancialInstrumentsCreditimpairedMemberbcs:OtherFinancialAssetsSubjectToImpairmentMemberifrs-full:GrossCarryingAmountMember2022-12-3100003120692022-01-012022-12-310000312069ifrs-full:MortgagesMemberifrs-full:FinancialAssetsAtAmortisedCostMemberifrs-full:GrossCarryingAmountMemberifrs-full:TwelvemonthExpectedCreditLossesMember2023-12-310000312069ifrs-full:LifetimeExpectedCreditLossesMemberifrs-full:MortgagesMemberifrs-full:CurrentMemberifrs-full:FinancialAssetsAtAmortisedCostMemberifrs-full:GrossCarryingAmountMemberifrs-full:FinancialInstrumentsNotCreditimpairedMember2023-12-310000312069ifrs-full:LifetimeExpectedCreditLossesMemberifrs-full:MortgagesMemberifrs-full:NotLaterThanOneMonthMemberifrs-full:FinancialAssetsAtAmortisedCostMemberifrs-full:GrossCarryingAmountMemberifrs-full:FinancialInstrumentsNotCreditimpairedMember2023-12-310000312069ifrs-full:LifetimeExpectedCreditLossesMemberifrs-full:MortgagesMemberbcs:GreaterThan30DaysPastDueMemberifrs-full:FinancialAssetsAtAmortisedCostMemberifrs-full:GrossCarryingAmountMemberifrs-full:FinancialInstrumentsNotCreditimpairedMember2023-12-310000312069ifrs-full:LifetimeExpectedCreditLossesMemberifrs-full:MortgagesMemberifrs-full:FinancialAssetsAtAmortisedCostMemberifrs-full:GrossCarryingAmountMemberifrs-full:FinancialInstrumentsNotCreditimpairedMember2023-12-310000312069ifrs-full:LifetimeExpectedCreditLossesMemberifrs-full:MortgagesMemberifrs-full:FinancialInstrumentsCreditimpairedMemberifrs-full:FinancialAssetsAtAmortisedCostMemberifrs-full:GrossCarryingAmountMember2023-12-310000312069ifrs-full:MortgagesMemberifrs-full:FinancialAssetsAtAmortisedCostMemberifrs-full:GrossCarryingAmountMember2023-12-310000312069bcs:CreditCardsRetailMemberifrs-full:FinancialAssetsAtAmortisedCostMemberifrs-full:GrossCarryingAmountMemberifrs-full:TwelvemonthExpectedCreditLossesMember2023-12-310000312069bcs:CreditCardsRetailMemberifrs-full:LifetimeExpectedCreditLossesMemberifrs-full:CurrentMemberifrs-full:FinancialAssetsAtAmortisedCostMemberifrs-full:GrossCarryingAmountMemberifrs-full:FinancialInstrumentsNotCreditimpairedMember2023-12-310000312069bcs:CreditCardsRetailMemberifrs-full:LifetimeExpectedCreditLossesMemberifrs-full:NotLaterThanOneMonthMemberifrs-full:FinancialAssetsAtAmortisedCostMemberifrs-full:GrossCarryingAmountMemberifrs-full:FinancialInstrumentsNotCreditimpairedMember2023-12-310000312069bcs:CreditCardsRetailMemberifrs-full:LifetimeExpectedCreditLossesMemberbcs:GreaterThan30DaysPastDueMemberifrs-full:FinancialAssetsAtAmortisedCostMemberifrs-full:GrossCarryingAmountMemberifrs-full:FinancialInstrumentsNotCreditimpairedMember2023-12-310000312069bcs:CreditCardsRetailMemberifrs-full:LifetimeExpectedCreditLossesMemberifrs-full:FinancialAssetsAtAmortisedCostMemberifrs-full:GrossCarryingAmountMemberifrs-full:FinancialInstrumentsNotCreditimpairedMember2023-12-310000312069bcs:CreditCardsRetailMemberifrs-full:LifetimeExpectedCreditLossesMemberifrs-full:FinancialInstrumentsCreditimpairedMemberifrs-full:FinancialAssetsAtAmortisedCostMemberifrs-full:GrossCarryingAmountMember2023-12-310000312069bcs:CreditCardsRetailMemberifrs-full:FinancialAssetsAtAmortisedCostMemberifrs-full:GrossCarryingAmountMember2023-12-310000312069bcs:OtherRetailMemberifrs-full:FinancialAssetsAtAmortisedCostMemberifrs-full:GrossCarryingAmountMemberifrs-full:TwelvemonthExpectedCreditLossesMember2023-12-310000312069ifrs-full:LifetimeExpectedCreditLossesMemberbcs:OtherRetailMemberifrs-full:CurrentMemberifrs-full:FinancialAssetsAtAmortisedCostMemberifrs-full:GrossCarryingAmountMemberifrs-full:FinancialInstrumentsNotCreditimpairedMember2023-12-310000312069ifrs-full:LifetimeExpectedCreditLossesMemberbcs:OtherRetailMemberifrs-full:NotLaterThanOneMonthMemberifrs-full:FinancialAssetsAtAmortisedCostMemberifrs-full:GrossCarryingAmountMemberifrs-full:FinancialInstrumentsNotCreditimpairedMember2023-12-310000312069ifrs-full:LifetimeExpectedCreditLossesMemberbcs:OtherRetailMemberbcs:GreaterThan30DaysPastDueMemberifrs-full:FinancialAssetsAtAmortisedCostMemberifrs-full:GrossCarryingAmountMemberifrs-full:FinancialInstrumentsNotCreditimpairedMember2023-12-310000312069ifrs-full:LifetimeExpectedCreditLossesMemberbcs:OtherRetailMemberifrs-full:FinancialAssetsAtAmortisedCostMemberifrs-full:GrossCarryingAmountMemberifrs-full:FinancialInstrumentsNotCreditimpairedMember2023-12-310000312069ifrs-full:LifetimeExpectedCreditLossesMemberbcs:OtherRetailMemberifrs-full:FinancialInstrumentsCreditimpairedMemberifrs-full:FinancialAssetsAtAmortisedCostMemberifrs-full:GrossCarryingAmountMember2023-12-310000312069bcs:OtherRetailMemberifrs-full:FinancialAssetsAtAmortisedCostMemberifrs-full:GrossCarryingAmountMember2023-12-310000312069ifrs-full:CorporateLoansMemberifrs-full:FinancialAssetsAtAmortisedCostMemberifrs-full:GrossCarryingAmountMemberifrs-full:TwelvemonthExpectedCreditLossesMember2023-12-310000312069ifrs-full:LifetimeExpectedCreditLossesMemberifrs-full:CorporateLoansMemberifrs-full:CurrentMemberifrs-full:FinancialAssetsAtAmortisedCostMemberifrs-full:GrossCarryingAmountMemberifrs-full:FinancialInstrumentsNotCreditimpairedMember2023-12-310000312069ifrs-full:LifetimeExpectedCreditLossesMemberifrs-full:CorporateLoansMemberifrs-full:NotLaterThanOneMonthMemberifrs-full:FinancialAssetsAtAmortisedCostMemberifrs-full:GrossCarryingAmountMemberifrs-full:FinancialInstrumentsNotCreditimpairedMember2023-12-310000312069ifrs-full:LifetimeExpectedCreditLossesMemberifrs-full:CorporateLoansMemberbcs:GreaterThan30DaysPastDueMemberifrs-full:FinancialAssetsAtAmortisedCostMemberifrs-full:GrossCarryingAmountMemberifrs-full:FinancialInstrumentsNotCreditimpairedMember2023-12-310000312069ifrs-full:LifetimeExpectedCreditLossesMemberifrs-full:CorporateLoansMemberifrs-full:FinancialAssetsAtAmortisedCostMemberifrs-full:GrossCarryingAmountMemberifrs-full:FinancialInstrumentsNotCreditimpairedMember2023-12-310000312069ifrs-full:LifetimeExpectedCreditLossesMemberifrs-full:CorporateLoansMemberifrs-full:FinancialInstrumentsCreditimpairedMemberifrs-full:FinancialAssetsAtAmortisedCostMemberifrs-full:GrossCarryingAmountMember2023-12-310000312069ifrs-full:CorporateLoansMemberifrs-full:FinancialAssetsAtAmortisedCostMemberifrs-full:GrossCarryingAmountMember2023-12-310000312069ifrs-full:LifetimeExpectedCreditLossesMemberifrs-full:CurrentMemberifrs-full:FinancialAssetsAtAmortisedCostMemberifrs-full:GrossCarryingAmountMemberifrs-full:LoansAndReceivablesCategoryMemberifrs-full:FinancialInstrumentsNotCreditimpairedMember2023-12-310000312069ifrs-full:LifetimeExpectedCreditLossesMemberifrs-full:NotLaterThanOneMonthMemberifrs-full:FinancialAssetsAtAmortisedCostMemberifrs-full:GrossCarryingAmountMemberifrs-full:LoansAndReceivablesCategoryMemberifrs-full:FinancialInstrumentsNotCreditimpairedMember2023-12-310000312069ifrs-full:LifetimeExpectedCreditLossesMemberbcs:GreaterThan30DaysPastDueMemberifrs-full:FinancialAssetsAtAmortisedCostMemberifrs-full:GrossCarryingAmountMemberifrs-full:LoansAndReceivablesCategoryMemberifrs-full:FinancialInstrumentsNotCreditimpairedMember2023-12-310000312069ifrs-full:AccumulatedImpairmentMemberifrs-full:MortgagesMemberifrs-full:FinancialAssetsAtAmortisedCostMemberifrs-full:TwelvemonthExpectedCreditLossesMember2023-12-310000312069ifrs-full:AccumulatedImpairmentMemberifrs-full:LifetimeExpectedCreditLossesMemberifrs-full:MortgagesMemberifrs-full:CurrentMemberifrs-full:FinancialAssetsAtAmortisedCostMemberifrs-full:FinancialInstrumentsNotCreditimpairedMember2023-12-310000312069ifrs-full:AccumulatedImpairmentMemberifrs-full:LifetimeExpectedCreditLossesMemberifrs-full:MortgagesMemberifrs-full:NotLaterThanOneMonthMemberifrs-full:FinancialAssetsAtAmortisedCostMemberifrs-full:FinancialInstrumentsNotCreditimpairedMember2023-12-310000312069ifrs-full:AccumulatedImpairmentMemberifrs-full:LifetimeExpectedCreditLossesMemberifrs-full:MortgagesMemberbcs:GreaterThan30DaysPastDueMemberifrs-full:FinancialAssetsAtAmortisedCostMemberifrs-full:FinancialInstrumentsNotCreditimpairedMember2023-12-310000312069ifrs-full:AccumulatedImpairmentMemberifrs-full:LifetimeExpectedCreditLossesMemberifrs-full:MortgagesMemberifrs-full:FinancialAssetsAtAmortisedCostMemberifrs-full:FinancialInstrumentsNotCreditimpairedMember2023-12-310000312069ifrs-full:AccumulatedImpairmentMemberifrs-full:LifetimeExpectedCreditLossesMemberifrs-full:MortgagesMemberifrs-full:FinancialInstrumentsCreditimpairedMemberifrs-full:FinancialAssetsAtAmortisedCostMember2023-12-310000312069ifrs-full:AccumulatedImpairmentMemberifrs-full:MortgagesMemberifrs-full:FinancialAssetsAtAmortisedCostMember2023-12-310000312069bcs:CreditCardsRetailMemberifrs-full:AccumulatedImpairmentMemberifrs-full:FinancialAssetsAtAmortisedCostMemberifrs-full:TwelvemonthExpectedCreditLossesMember2023-12-310000312069bcs:CreditCardsRetailMemberifrs-full:AccumulatedImpairmentMemberifrs-full:LifetimeExpectedCreditLossesMemberifrs-full:CurrentMemberifrs-full:FinancialAssetsAtAmortisedCostMemberifrs-full:FinancialInstrumentsNotCreditimpairedMember2023-12-310000312069bcs:CreditCardsRetailMemberifrs-full:AccumulatedImpairmentMemberifrs-full:LifetimeExpectedCreditLossesMemberifrs-full:NotLaterThanOneMonthMemberifrs-full:FinancialAssetsAtAmortisedCostMemberifrs-full:FinancialInstrumentsNotCreditimpairedMember2023-12-310000312069bcs:CreditCardsRetailMemberifrs-full:AccumulatedImpairmentMemberifrs-full:LifetimeExpectedCreditLossesMemberbcs:GreaterThan30DaysPastDueMemberifrs-full:FinancialAssetsAtAmortisedCostMemberifrs-full:FinancialInstrumentsNotCreditimpairedMember2023-12-310000312069bcs:CreditCardsRetailMemberifrs-full:AccumulatedImpairmentMemberifrs-full:LifetimeExpectedCreditLossesMemberifrs-full:FinancialAssetsAtAmortisedCostMemberifrs-full:FinancialInstrumentsNotCreditimpairedMember2023-12-310000312069bcs:CreditCardsRetailMemberifrs-full:AccumulatedImpairmentMemberifrs-full:LifetimeExpectedCreditLossesMemberifrs-full:FinancialInstrumentsCreditimpairedMemberifrs-full:FinancialAssetsAtAmortisedCostMember2023-12-310000312069bcs:CreditCardsRetailMemberifrs-full:AccumulatedImpairmentMemberifrs-full:FinancialAssetsAtAmortisedCostMember2023-12-310000312069ifrs-full:AccumulatedImpairmentMemberbcs:OtherRetailMemberifrs-full:FinancialAssetsAtAmortisedCostMemberifrs-full:TwelvemonthExpectedCreditLossesMember2023-12-310000312069ifrs-full:AccumulatedImpairmentMemberifrs-full:LifetimeExpectedCreditLossesMemberbcs:OtherRetailMemberifrs-full:CurrentMemberifrs-full:FinancialAssetsAtAmortisedCostMemberifrs-full:FinancialInstrumentsNotCreditimpairedMember2023-12-310000312069ifrs-full:AccumulatedImpairmentMemberifrs-full:LifetimeExpectedCreditLossesMemberbcs:OtherRetailMemberifrs-full:NotLaterThanOneMonthMemberifrs-full:FinancialAssetsAtAmortisedCostMemberifrs-full:FinancialInstrumentsNotCreditimpairedMember2023-12-310000312069ifrs-full:AccumulatedImpairmentMemberifrs-full:LifetimeExpectedCreditLossesMemberbcs:OtherRetailMemberbcs:GreaterThan30DaysPastDueMemberifrs-full:FinancialAssetsAtAmortisedCostMemberifrs-full:FinancialInstrumentsNotCreditimpairedMember2023-12-310000312069ifrs-full:AccumulatedImpairmentMemberifrs-full:LifetimeExpectedCreditLossesMemberbcs:OtherRetailMemberifrs-full:FinancialAssetsAtAmortisedCostMemberifrs-full:FinancialInstrumentsNotCreditimpairedMember2023-12-310000312069ifrs-full:AccumulatedImpairmentMemberifrs-full:LifetimeExpectedCreditLossesMemberbcs:OtherRetailMemberifrs-full:FinancialInstrumentsCreditimpairedMemberifrs-full:FinancialAssetsAtAmortisedCostMember2023-12-310000312069ifrs-full:AccumulatedImpairmentMemberbcs:OtherRetailMemberifrs-full:FinancialAssetsAtAmortisedCostMember2023-12-310000312069ifrs-full:AccumulatedImpairmentMemberifrs-full:CorporateLoansMemberifrs-full:FinancialAssetsAtAmortisedCostMemberifrs-full:TwelvemonthExpectedCreditLossesMember2023-12-310000312069ifrs-full:AccumulatedImpairmentMemberifrs-full:LifetimeExpectedCreditLossesMemberifrs-full:CorporateLoansMemberifrs-full:CurrentMemberifrs-full:FinancialAssetsAtAmortisedCostMemberifrs-full:FinancialInstrumentsNotCreditimpairedMember2023-12-310000312069ifrs-full:AccumulatedImpairmentMemberifrs-full:LifetimeExpectedCreditLossesMemberifrs-full:CorporateLoansMemberifrs-full:NotLaterThanOneMonthMemberifrs-full:FinancialAssetsAtAmortisedCostMemberifrs-full:FinancialInstrumentsNotCreditimpairedMember2023-12-310000312069ifrs-full:AccumulatedImpairmentMemberifrs-full:LifetimeExpectedCreditLossesMemberifrs-full:CorporateLoansMemberbcs:GreaterThan30DaysPastDueMemberifrs-full:FinancialAssetsAtAmortisedCostMemberifrs-full:FinancialInstrumentsNotCreditimpairedMember2023-12-310000312069ifrs-full:AccumulatedImpairmentMemberifrs-full:LifetimeExpectedCreditLossesMemberifrs-full:CorporateLoansMemberifrs-full:FinancialAssetsAtAmortisedCostMemberifrs-full:FinancialInstrumentsNotCreditimpairedMember2023-12-310000312069ifrs-full:AccumulatedImpairmentMemberifrs-full:LifetimeExpectedCreditLossesMemberifrs-full:CorporateLoansMemberifrs-full:FinancialInstrumentsCreditimpairedMemberifrs-full:FinancialAssetsAtAmortisedCostMember2023-12-310000312069ifrs-full:AccumulatedImpairmentMemberifrs-full:CorporateLoansMemberifrs-full:FinancialAssetsAtAmortisedCostMember2023-12-310000312069ifrs-full:AccumulatedImpairmentMemberifrs-full:LifetimeExpectedCreditLossesMemberifrs-full:CurrentMemberifrs-full:FinancialAssetsAtAmortisedCostMemberifrs-full:LoansAndReceivablesCategoryMemberifrs-full:FinancialInstrumentsNotCreditimpairedMember2023-12-310000312069ifrs-full:AccumulatedImpairmentMemberifrs-full:LifetimeExpectedCreditLossesMemberifrs-full:NotLaterThanOneMonthMemberifrs-full:FinancialAssetsAtAmortisedCostMemberifrs-full:LoansAndReceivablesCategoryMemberifrs-full:FinancialInstrumentsNotCreditimpairedMember2023-12-310000312069ifrs-full:AccumulatedImpairmentMemberifrs-full:LifetimeExpectedCreditLossesMemberbcs:GreaterThan30DaysPastDueMemberifrs-full:FinancialAssetsAtAmortisedCostMemberifrs-full:LoansAndReceivablesCategoryMemberifrs-full:FinancialInstrumentsNotCreditimpairedMember2023-12-310000312069ifrs-full:MortgagesMemberifrs-full:FinancialAssetsAtAmortisedCostMemberifrs-full:TwelvemonthExpectedCreditLossesMember2023-12-310000312069ifrs-full:LifetimeExpectedCreditLossesMemberifrs-full:MortgagesMemberifrs-full:CurrentMemberifrs-full:FinancialAssetsAtAmortisedCostMemberifrs-full:FinancialInstrumentsNotCreditimpairedMember2023-12-310000312069ifrs-full:LifetimeExpectedCreditLossesMemberifrs-full:MortgagesMemberifrs-full:NotLaterThanOneMonthMemberifrs-full:FinancialAssetsAtAmortisedCostMemberifrs-full:FinancialInstrumentsNotCreditimpairedMember2023-12-310000312069ifrs-full:LifetimeExpectedCreditLossesMemberifrs-full:MortgagesMemberbcs:GreaterThan30DaysPastDueMemberifrs-full:FinancialAssetsAtAmortisedCostMemberifrs-full:FinancialInstrumentsNotCreditimpairedMember2023-12-310000312069ifrs-full:LifetimeExpectedCreditLossesMemberifrs-full:MortgagesMemberifrs-full:FinancialAssetsAtAmortisedCostMemberifrs-full:FinancialInstrumentsNotCreditimpairedMember2023-12-310000312069ifrs-full:LifetimeExpectedCreditLossesMemberifrs-full:MortgagesMemberifrs-full:FinancialInstrumentsCreditimpairedMemberifrs-full:FinancialAssetsAtAmortisedCostMember2023-12-310000312069ifrs-full:MortgagesMemberifrs-full:FinancialAssetsAtAmortisedCostMember2023-12-310000312069bcs:CreditCardsRetailMemberifrs-full:FinancialAssetsAtAmortisedCostMemberifrs-full:TwelvemonthExpectedCreditLossesMember2023-12-310000312069bcs:CreditCardsRetailMemberifrs-full:LifetimeExpectedCreditLossesMemberifrs-full:CurrentMemberifrs-full:FinancialAssetsAtAmortisedCostMemberifrs-full:FinancialInstrumentsNotCreditimpairedMember2023-12-310000312069bcs:CreditCardsRetailMemberifrs-full:LifetimeExpectedCreditLossesMemberifrs-full:NotLaterThanOneMonthMemberifrs-full:FinancialAssetsAtAmortisedCostMemberifrs-full:FinancialInstrumentsNotCreditimpairedMember2023-12-310000312069bcs:CreditCardsRetailMemberifrs-full:LifetimeExpectedCreditLossesMemberbcs:GreaterThan30DaysPastDueMemberifrs-full:FinancialAssetsAtAmortisedCostMemberifrs-full:FinancialInstrumentsNotCreditimpairedMember2023-12-310000312069bcs:CreditCardsRetailMemberifrs-full:LifetimeExpectedCreditLossesMemberifrs-full:FinancialAssetsAtAmortisedCostMemberifrs-full:FinancialInstrumentsNotCreditimpairedMember2023-12-310000312069bcs:CreditCardsRetailMemberifrs-full:LifetimeExpectedCreditLossesMemberifrs-full:FinancialInstrumentsCreditimpairedMemberifrs-full:FinancialAssetsAtAmortisedCostMember2023-12-310000312069bcs:CreditCardsRetailMemberifrs-full:FinancialAssetsAtAmortisedCostMember2023-12-310000312069bcs:OtherRetailMemberifrs-full:FinancialAssetsAtAmortisedCostMemberifrs-full:TwelvemonthExpectedCreditLossesMember2023-12-310000312069ifrs-full:LifetimeExpectedCreditLossesMemberbcs:OtherRetailMemberifrs-full:CurrentMemberifrs-full:FinancialAssetsAtAmortisedCostMemberifrs-full:FinancialInstrumentsNotCreditimpairedMember2023-12-310000312069ifrs-full:LifetimeExpectedCreditLossesMemberbcs:OtherRetailMemberifrs-full:NotLaterThanOneMonthMemberifrs-full:FinancialAssetsAtAmortisedCostMemberifrs-full:FinancialInstrumentsNotCreditimpairedMember2023-12-310000312069ifrs-full:LifetimeExpectedCreditLossesMemberbcs:OtherRetailMemberbcs:GreaterThan30DaysPastDueMemberifrs-full:FinancialAssetsAtAmortisedCostMemberifrs-full:FinancialInstrumentsNotCreditimpairedMember2023-12-310000312069ifrs-full:LifetimeExpectedCreditLossesMemberbcs:OtherRetailMemberifrs-full:FinancialAssetsAtAmortisedCostMemberifrs-full:FinancialInstrumentsNotCreditimpairedMember2023-12-310000312069ifrs-full:LifetimeExpectedCreditLossesMemberbcs:OtherRetailMemberifrs-full:FinancialInstrumentsCreditimpairedMemberifrs-full:FinancialAssetsAtAmortisedCostMember2023-12-310000312069bcs:OtherRetailMemberifrs-full:FinancialAssetsAtAmortisedCostMember2023-12-310000312069ifrs-full:CorporateLoansMemberifrs-full:FinancialAssetsAtAmortisedCostMemberifrs-full:TwelvemonthExpectedCreditLossesMember2023-12-310000312069ifrs-full:LifetimeExpectedCreditLossesMemberifrs-full:CorporateLoansMemberifrs-full:CurrentMemberifrs-full:FinancialAssetsAtAmortisedCostMemberifrs-full:FinancialInstrumentsNotCreditimpairedMember2023-12-310000312069ifrs-full:LifetimeExpectedCreditLossesMemberifrs-full:CorporateLoansMemberifrs-full:NotLaterThanOneMonthMemberifrs-full:FinancialAssetsAtAmortisedCostMemberifrs-full:FinancialInstrumentsNotCreditimpairedMember2023-12-310000312069ifrs-full:LifetimeExpectedCreditLossesMemberifrs-full:CorporateLoansMemberbcs:GreaterThan30DaysPastDueMemberifrs-full:FinancialAssetsAtAmortisedCostMemberifrs-full:FinancialInstrumentsNotCreditimpairedMember2023-12-310000312069ifrs-full:LifetimeExpectedCreditLossesMemberifrs-full:CorporateLoansMemberifrs-full:FinancialAssetsAtAmortisedCostMemberifrs-full:FinancialInstrumentsNotCreditimpairedMember2023-12-310000312069ifrs-full:LifetimeExpectedCreditLossesMemberifrs-full:CorporateLoansMemberifrs-full:FinancialInstrumentsCreditimpairedMemberifrs-full:FinancialAssetsAtAmortisedCostMember2023-12-310000312069ifrs-full:CorporateLoansMemberifrs-full:FinancialAssetsAtAmortisedCostMember2023-12-310000312069ifrs-full:LifetimeExpectedCreditLossesMemberifrs-full:CurrentMemberifrs-full:FinancialAssetsAtAmortisedCostMemberifrs-full:LoansAndReceivablesCategoryMemberifrs-full:FinancialInstrumentsNotCreditimpairedMember2023-12-310000312069ifrs-full:LifetimeExpectedCreditLossesMemberifrs-full:NotLaterThanOneMonthMemberifrs-full:FinancialAssetsAtAmortisedCostMemberifrs-full:LoansAndReceivablesCategoryMemberifrs-full:FinancialInstrumentsNotCreditimpairedMember2023-12-310000312069ifrs-full:LifetimeExpectedCreditLossesMemberbcs:GreaterThan30DaysPastDueMemberifrs-full:FinancialAssetsAtAmortisedCostMemberifrs-full:LoansAndReceivablesCategoryMemberifrs-full:FinancialInstrumentsNotCreditimpairedMember2023-12-310000312069ifrs-full:MortgagesMemberifrs-full:FinancialAssetsAtAmortisedCostMemberifrs-full:GrossCarryingAmountMemberifrs-full:TwelvemonthExpectedCreditLossesMember2022-12-310000312069ifrs-full:LifetimeExpectedCreditLossesMemberifrs-full:MortgagesMemberifrs-full:CurrentMemberifrs-full:FinancialAssetsAtAmortisedCostMemberifrs-full:GrossCarryingAmountMemberifrs-full:FinancialInstrumentsNotCreditimpairedMember2022-12-310000312069ifrs-full:LifetimeExpectedCreditLossesMemberifrs-full:MortgagesMemberifrs-full:NotLaterThanOneMonthMemberifrs-full:FinancialAssetsAtAmortisedCostMemberifrs-full:GrossCarryingAmountMemberifrs-full:FinancialInstrumentsNotCreditimpairedMember2022-12-310000312069ifrs-full:LifetimeExpectedCreditLossesMemberifrs-full:MortgagesMemberbcs:GreaterThan30DaysPastDueMemberifrs-full:FinancialAssetsAtAmortisedCostMemberifrs-full:GrossCarryingAmountMemberifrs-full:FinancialInstrumentsNotCreditimpairedMember2022-12-310000312069ifrs-full:LifetimeExpectedCreditLossesMemberifrs-full:MortgagesMemberifrs-full:FinancialAssetsAtAmortisedCostMemberifrs-full:GrossCarryingAmountMemberifrs-full:FinancialInstrumentsNotCreditimpairedMember2022-12-310000312069ifrs-full:LifetimeExpectedCreditLossesMemberifrs-full:MortgagesMemberifrs-full:FinancialInstrumentsCreditimpairedMemberifrs-full:FinancialAssetsAtAmortisedCostMemberifrs-full:GrossCarryingAmountMember2022-12-310000312069ifrs-full:MortgagesMemberifrs-full:FinancialAssetsAtAmortisedCostMemberifrs-full:GrossCarryingAmountMember2022-12-310000312069bcs:CreditCardsRetailMemberifrs-full:FinancialAssetsAtAmortisedCostMemberifrs-full:GrossCarryingAmountMemberifrs-full:TwelvemonthExpectedCreditLossesMember2022-12-310000312069bcs:CreditCardsRetailMemberifrs-full:LifetimeExpectedCreditLossesMemberifrs-full:CurrentMemberifrs-full:FinancialAssetsAtAmortisedCostMemberifrs-full:GrossCarryingAmountMemberifrs-full:FinancialInstrumentsNotCreditimpairedMember2022-12-310000312069bcs:CreditCardsRetailMemberifrs-full:LifetimeExpectedCreditLossesMemberifrs-full:NotLaterThanOneMonthMemberifrs-full:FinancialAssetsAtAmortisedCostMemberifrs-full:GrossCarryingAmountMemberifrs-full:FinancialInstrumentsNotCreditimpairedMember2022-12-310000312069bcs:CreditCardsRetailMemberifrs-full:LifetimeExpectedCreditLossesMemberbcs:GreaterThan30DaysPastDueMemberifrs-full:FinancialAssetsAtAmortisedCostMemberifrs-full:GrossCarryingAmountMemberifrs-full:FinancialInstrumentsNotCreditimpairedMember2022-12-310000312069bcs:CreditCardsRetailMemberifrs-full:LifetimeExpectedCreditLossesMemberifrs-full:FinancialAssetsAtAmortisedCostMemberifrs-full:GrossCarryingAmountMemberifrs-full:FinancialInstrumentsNotCreditimpairedMember2022-12-310000312069bcs:CreditCardsRetailMemberifrs-full:LifetimeExpectedCreditLossesMemberifrs-full:FinancialInstrumentsCreditimpairedMemberifrs-full:FinancialAssetsAtAmortisedCostMemberifrs-full:GrossCarryingAmountMember2022-12-310000312069bcs:CreditCardsRetailMemberifrs-full:FinancialAssetsAtAmortisedCostMemberifrs-full:GrossCarryingAmountMember2022-12-310000312069bcs:OtherRetailMemberifrs-full:FinancialAssetsAtAmortisedCostMemberifrs-full:GrossCarryingAmountMemberifrs-full:TwelvemonthExpectedCreditLossesMember2022-12-310000312069ifrs-full:LifetimeExpectedCreditLossesMemberbcs:OtherRetailMemberifrs-full:CurrentMemberifrs-full:FinancialAssetsAtAmortisedCostMemberifrs-full:GrossCarryingAmountMemberifrs-full:FinancialInstrumentsNotCreditimpairedMember2022-12-310000312069ifrs-full:LifetimeExpectedCreditLossesMemberbcs:OtherRetailMemberifrs-full:NotLaterThanOneMonthMemberifrs-full:FinancialAssetsAtAmortisedCostMemberifrs-full:GrossCarryingAmountMemberifrs-full:FinancialInstrumentsNotCreditimpairedMember2022-12-310000312069ifrs-full:LifetimeExpectedCreditLossesMemberbcs:OtherRetailMemberbcs:GreaterThan30DaysPastDueMemberifrs-full:FinancialAssetsAtAmortisedCostMemberifrs-full:GrossCarryingAmountMemberifrs-full:FinancialInstrumentsNotCreditimpairedMember2022-12-310000312069ifrs-full:LifetimeExpectedCreditLossesMemberbcs:OtherRetailMemberifrs-full:FinancialAssetsAtAmortisedCostMemberifrs-full:GrossCarryingAmountMemberifrs-full:FinancialInstrumentsNotCreditimpairedMember2022-12-310000312069ifrs-full:LifetimeExpectedCreditLossesMemberbcs:OtherRetailMemberifrs-full:FinancialInstrumentsCreditimpairedMemberifrs-full:FinancialAssetsAtAmortisedCostMemberifrs-full:GrossCarryingAmountMember2022-12-310000312069bcs:OtherRetailMemberifrs-full:FinancialAssetsAtAmortisedCostMemberifrs-full:GrossCarryingAmountMember2022-12-310000312069ifrs-full:CorporateLoansMemberifrs-full:FinancialAssetsAtAmortisedCostMemberifrs-full:GrossCarryingAmountMemberifrs-full:TwelvemonthExpectedCreditLossesMember2022-12-310000312069ifrs-full:LifetimeExpectedCreditLossesMemberifrs-full:CorporateLoansMemberifrs-full:CurrentMemberifrs-full:FinancialAssetsAtAmortisedCostMemberifrs-full:GrossCarryingAmountMemberifrs-full:FinancialInstrumentsNotCreditimpairedMember2022-12-310000312069ifrs-full:LifetimeExpectedCreditLossesMemberifrs-full:CorporateLoansMemberifrs-full:NotLaterThanOneMonthMemberifrs-full:FinancialAssetsAtAmortisedCostMemberifrs-full:GrossCarryingAmountMemberifrs-full:FinancialInstrumentsNotCreditimpairedMember2022-12-310000312069ifrs-full:LifetimeExpectedCreditLossesMemberifrs-full:CorporateLoansMemberbcs:GreaterThan30DaysPastDueMemberifrs-full:FinancialAssetsAtAmortisedCostMemberifrs-full:GrossCarryingAmountMemberifrs-full:FinancialInstrumentsNotCreditimpairedMember2022-12-310000312069ifrs-full:LifetimeExpectedCreditLossesMemberifrs-full:CorporateLoansMemberifrs-full:FinancialAssetsAtAmortisedCostMemberifrs-full:GrossCarryingAmountMemberifrs-full:FinancialInstrumentsNotCreditimpairedMember2022-12-310000312069ifrs-full:LifetimeExpectedCreditLossesMemberifrs-full:CorporateLoansMemberifrs-full:FinancialInstrumentsCreditimpairedMemberifrs-full:FinancialAssetsAtAmortisedCostMemberifrs-full:GrossCarryingAmountMember2022-12-310000312069ifrs-full:CorporateLoansMemberifrs-full:FinancialAssetsAtAmortisedCostMemberifrs-full:GrossCarryingAmountMember2022-12-310000312069ifrs-full:LifetimeExpectedCreditLossesMemberifrs-full:CurrentMemberifrs-full:FinancialAssetsAtAmortisedCostMemberifrs-full:GrossCarryingAmountMemberifrs-full:LoansAndReceivablesCategoryMemberifrs-full:FinancialInstrumentsNotCreditimpairedMember2022-12-310000312069ifrs-full:LifetimeExpectedCreditLossesMemberifrs-full:NotLaterThanOneMonthMemberifrs-full:FinancialAssetsAtAmortisedCostMemberifrs-full:GrossCarryingAmountMemberifrs-full:LoansAndReceivablesCategoryMemberifrs-full:FinancialInstrumentsNotCreditimpairedMember2022-12-310000312069ifrs-full:LifetimeExpectedCreditLossesMemberbcs:GreaterThan30DaysPastDueMemberifrs-full:FinancialAssetsAtAmortisedCostMemberifrs-full:GrossCarryingAmountMemberifrs-full:LoansAndReceivablesCategoryMemberifrs-full:FinancialInstrumentsNotCreditimpairedMember2022-12-310000312069ifrs-full:AccumulatedImpairmentMemberifrs-full:MortgagesMemberifrs-full:FinancialAssetsAtAmortisedCostMemberifrs-full:TwelvemonthExpectedCreditLossesMember2022-12-310000312069ifrs-full:AccumulatedImpairmentMemberifrs-full:LifetimeExpectedCreditLossesMemberifrs-full:MortgagesMemberifrs-full:CurrentMemberifrs-full:FinancialAssetsAtAmortisedCostMemberifrs-full:FinancialInstrumentsNotCreditimpairedMember2022-12-310000312069ifrs-full:AccumulatedImpairmentMemberifrs-full:LifetimeExpectedCreditLossesMemberifrs-full:MortgagesMemberifrs-full:NotLaterThanOneMonthMemberifrs-full:FinancialAssetsAtAmortisedCostMemberifrs-full:FinancialInstrumentsNotCreditimpairedMember2022-12-310000312069ifrs-full:AccumulatedImpairmentMemberifrs-full:LifetimeExpectedCreditLossesMemberifrs-full:MortgagesMemberbcs:GreaterThan30DaysPastDueMemberifrs-full:FinancialAssetsAtAmortisedCostMemberifrs-full:FinancialInstrumentsNotCreditimpairedMember2022-12-310000312069ifrs-full:AccumulatedImpairmentMemberifrs-full:LifetimeExpectedCreditLossesMemberifrs-full:MortgagesMemberifrs-full:FinancialAssetsAtAmortisedCostMemberifrs-full:FinancialInstrumentsNotCreditimpairedMember2022-12-310000312069ifrs-full:AccumulatedImpairmentMemberifrs-full:LifetimeExpectedCreditLossesMemberifrs-full:MortgagesMemberifrs-full:FinancialInstrumentsCreditimpairedMemberifrs-full:FinancialAssetsAtAmortisedCostMember2022-12-310000312069ifrs-full:AccumulatedImpairmentMemberifrs-full:MortgagesMemberifrs-full:FinancialAssetsAtAmortisedCostMember2022-12-310000312069bcs:CreditCardsRetailMemberifrs-full:AccumulatedImpairmentMemberifrs-full:FinancialAssetsAtAmortisedCostMemberifrs-full:TwelvemonthExpectedCreditLossesMember2022-12-310000312069bcs:CreditCardsRetailMemberifrs-full:AccumulatedImpairmentMemberifrs-full:LifetimeExpectedCreditLossesMemberifrs-full:CurrentMemberifrs-full:FinancialAssetsAtAmortisedCostMemberifrs-full:FinancialInstrumentsNotCreditimpairedMember2022-12-310000312069bcs:CreditCardsRetailMemberifrs-full:AccumulatedImpairmentMemberifrs-full:LifetimeExpectedCreditLossesMemberifrs-full:NotLaterThanOneMonthMemberifrs-full:FinancialAssetsAtAmortisedCostMemberifrs-full:FinancialInstrumentsNotCreditimpairedMember2022-12-310000312069bcs:CreditCardsRetailMemberifrs-full:AccumulatedImpairmentMemberifrs-full:LifetimeExpectedCreditLossesMemberbcs:GreaterThan30DaysPastDueMemberifrs-full:FinancialAssetsAtAmortisedCostMemberifrs-full:FinancialInstrumentsNotCreditimpairedMember2022-12-310000312069bcs:CreditCardsRetailMemberifrs-full:AccumulatedImpairmentMemberifrs-full:LifetimeExpectedCreditLossesMemberifrs-full:FinancialAssetsAtAmortisedCostMemberifrs-full:FinancialInstrumentsNotCreditimpairedMember2022-12-310000312069bcs:CreditCardsRetailMemberifrs-full:AccumulatedImpairmentMemberifrs-full:LifetimeExpectedCreditLossesMemberifrs-full:FinancialInstrumentsCreditimpairedMemberifrs-full:FinancialAssetsAtAmortisedCostMember2022-12-310000312069bcs:CreditCardsRetailMemberifrs-full:AccumulatedImpairmentMemberifrs-full:FinancialAssetsAtAmortisedCostMember2022-12-310000312069ifrs-full:AccumulatedImpairmentMemberbcs:OtherRetailMemberifrs-full:FinancialAssetsAtAmortisedCostMemberifrs-full:TwelvemonthExpectedCreditLossesMember2022-12-310000312069ifrs-full:AccumulatedImpairmentMemberifrs-full:LifetimeExpectedCreditLossesMemberbcs:OtherRetailMemberifrs-full:CurrentMemberifrs-full:FinancialAssetsAtAmortisedCostMemberifrs-full:FinancialInstrumentsNotCreditimpairedMember2022-12-310000312069ifrs-full:AccumulatedImpairmentMemberifrs-full:LifetimeExpectedCreditLossesMemberbcs:OtherRetailMemberifrs-full:NotLaterThanOneMonthMemberifrs-full:FinancialAssetsAtAmortisedCostMemberifrs-full:FinancialInstrumentsNotCreditimpairedMember2022-12-310000312069ifrs-full:AccumulatedImpairmentMemberifrs-full:LifetimeExpectedCreditLossesMemberbcs:OtherRetailMemberbcs:GreaterThan30DaysPastDueMemberifrs-full:FinancialAssetsAtAmortisedCostMemberifrs-full:FinancialInstrumentsNotCreditimpairedMember2022-12-310000312069ifrs-full:AccumulatedImpairmentMemberifrs-full:LifetimeExpectedCreditLossesMemberbcs:OtherRetailMemberifrs-full:FinancialAssetsAtAmortisedCostMemberifrs-full:FinancialInstrumentsNotCreditimpairedMember2022-12-310000312069ifrs-full:AccumulatedImpairmentMemberifrs-full:LifetimeExpectedCreditLossesMemberbcs:OtherRetailMemberifrs-full:FinancialInstrumentsCreditimpairedMemberifrs-full:FinancialAssetsAtAmortisedCostMember2022-12-310000312069ifrs-full:AccumulatedImpairmentMemberbcs:OtherRetailMemberifrs-full:FinancialAssetsAtAmortisedCostMember2022-12-310000312069ifrs-full:AccumulatedImpairmentMemberifrs-full:CorporateLoansMemberifrs-full:FinancialAssetsAtAmortisedCostMemberifrs-full:TwelvemonthExpectedCreditLossesMember2022-12-310000312069ifrs-full:AccumulatedImpairmentMemberifrs-full:LifetimeExpectedCreditLossesMemberifrs-full:CorporateLoansMemberifrs-full:CurrentMemberifrs-full:FinancialAssetsAtAmortisedCostMemberifrs-full:FinancialInstrumentsNotCreditimpairedMember2022-12-310000312069ifrs-full:AccumulatedImpairmentMemberifrs-full:LifetimeExpectedCreditLossesMemberifrs-full:CorporateLoansMemberifrs-full:NotLaterThanOneMonthMemberifrs-full:FinancialAssetsAtAmortisedCostMemberifrs-full:FinancialInstrumentsNotCreditimpairedMember2022-12-310000312069ifrs-full:AccumulatedImpairmentMemberifrs-full:LifetimeExpectedCreditLossesMemberifrs-full:CorporateLoansMemberbcs:GreaterThan30DaysPastDueMemberifrs-full:FinancialAssetsAtAmortisedCostMemberifrs-full:FinancialInstrumentsNotCreditimpairedMember2022-12-310000312069ifrs-full:AccumulatedImpairmentMemberifrs-full:LifetimeExpectedCreditLossesMemberifrs-full:CorporateLoansMemberifrs-full:FinancialAssetsAtAmortisedCostMemberifrs-full:FinancialInstrumentsNotCreditimpairedMember2022-12-310000312069ifrs-full:AccumulatedImpairmentMemberifrs-full:LifetimeExpectedCreditLossesMemberifrs-full:CorporateLoansMemberifrs-full:FinancialInstrumentsCreditimpairedMemberifrs-full:FinancialAssetsAtAmortisedCostMember2022-12-310000312069ifrs-full:AccumulatedImpairmentMemberifrs-full:CorporateLoansMemberifrs-full:FinancialAssetsAtAmortisedCostMember2022-12-310000312069ifrs-full:AccumulatedImpairmentMemberifrs-full:LifetimeExpectedCreditLossesMemberifrs-full:CurrentMemberifrs-full:FinancialAssetsAtAmortisedCostMemberifrs-full:LoansAndReceivablesCategoryMemberifrs-full:FinancialInstrumentsNotCreditimpairedMember2022-12-310000312069ifrs-full:AccumulatedImpairmentMemberifrs-full:LifetimeExpectedCreditLossesMemberifrs-full:NotLaterThanOneMonthMemberifrs-full:FinancialAssetsAtAmortisedCostMemberifrs-full:LoansAndReceivablesCategoryMemberifrs-full:FinancialInstrumentsNotCreditimpairedMember2022-12-310000312069ifrs-full:AccumulatedImpairmentMemberifrs-full:LifetimeExpectedCreditLossesMemberbcs:GreaterThan30DaysPastDueMemberifrs-full:FinancialAssetsAtAmortisedCostMemberifrs-full:LoansAndReceivablesCategoryMemberifrs-full:FinancialInstrumentsNotCreditimpairedMember2022-12-310000312069ifrs-full:MortgagesMemberifrs-full:FinancialAssetsAtAmortisedCostMemberifrs-full:TwelvemonthExpectedCreditLossesMember2022-12-310000312069ifrs-full:LifetimeExpectedCreditLossesMemberifrs-full:MortgagesMemberifrs-full:CurrentMemberifrs-full:FinancialAssetsAtAmortisedCostMemberifrs-full:FinancialInstrumentsNotCreditimpairedMember2022-12-310000312069ifrs-full:LifetimeExpectedCreditLossesMemberifrs-full:MortgagesMemberifrs-full:NotLaterThanOneMonthMemberifrs-full:FinancialAssetsAtAmortisedCostMemberifrs-full:FinancialInstrumentsNotCreditimpairedMember2022-12-310000312069ifrs-full:LifetimeExpectedCreditLossesMemberifrs-full:MortgagesMemberbcs:GreaterThan30DaysPastDueMemberifrs-full:FinancialAssetsAtAmortisedCostMemberifrs-full:FinancialInstrumentsNotCreditimpairedMember2022-12-310000312069ifrs-full:LifetimeExpectedCreditLossesMemberifrs-full:MortgagesMemberifrs-full:FinancialAssetsAtAmortisedCostMemberifrs-full:FinancialInstrumentsNotCreditimpairedMember2022-12-310000312069ifrs-full:LifetimeExpectedCreditLossesMemberifrs-full:MortgagesMemberifrs-full:FinancialInstrumentsCreditimpairedMemberifrs-full:FinancialAssetsAtAmortisedCostMember2022-12-310000312069ifrs-full:MortgagesMemberifrs-full:FinancialAssetsAtAmortisedCostMember2022-12-310000312069bcs:CreditCardsRetailMemberifrs-full:FinancialAssetsAtAmortisedCostMemberifrs-full:TwelvemonthExpectedCreditLossesMember2022-12-310000312069bcs:CreditCardsRetailMemberifrs-full:LifetimeExpectedCreditLossesMemberifrs-full:CurrentMemberifrs-full:FinancialAssetsAtAmortisedCostMemberifrs-full:FinancialInstrumentsNotCreditimpairedMember2022-12-310000312069bcs:CreditCardsRetailMemberifrs-full:LifetimeExpectedCreditLossesMemberifrs-full:NotLaterThanOneMonthMemberifrs-full:FinancialAssetsAtAmortisedCostMemberifrs-full:FinancialInstrumentsNotCreditimpairedMember2022-12-310000312069bcs:CreditCardsRetailMemberifrs-full:LifetimeExpectedCreditLossesMemberbcs:GreaterThan30DaysPastDueMemberifrs-full:FinancialAssetsAtAmortisedCostMemberifrs-full:FinancialInstrumentsNotCreditimpairedMember2022-12-310000312069bcs:CreditCardsRetailMemberifrs-full:LifetimeExpectedCreditLossesMemberifrs-full:FinancialAssetsAtAmortisedCostMemberifrs-full:FinancialInstrumentsNotCreditimpairedMember2022-12-310000312069bcs:CreditCardsRetailMemberifrs-full:LifetimeExpectedCreditLossesMemberifrs-full:FinancialInstrumentsCreditimpairedMemberifrs-full:FinancialAssetsAtAmortisedCostMember2022-12-310000312069bcs:CreditCardsRetailMemberifrs-full:FinancialAssetsAtAmortisedCostMember2022-12-310000312069bcs:OtherRetailMemberifrs-full:FinancialAssetsAtAmortisedCostMemberifrs-full:TwelvemonthExpectedCreditLossesMember2022-12-310000312069ifrs-full:LifetimeExpectedCreditLossesMemberbcs:OtherRetailMemberifrs-full:CurrentMemberifrs-full:FinancialAssetsAtAmortisedCostMemberifrs-full:FinancialInstrumentsNotCreditimpairedMember2022-12-310000312069ifrs-full:LifetimeExpectedCreditLossesMemberbcs:OtherRetailMemberifrs-full:NotLaterThanOneMonthMemberifrs-full:FinancialAssetsAtAmortisedCostMemberifrs-full:FinancialInstrumentsNotCreditimpairedMember2022-12-310000312069ifrs-full:LifetimeExpectedCreditLossesMemberbcs:OtherRetailMemberbcs:GreaterThan30DaysPastDueMemberifrs-full:FinancialAssetsAtAmortisedCostMemberifrs-full:FinancialInstrumentsNotCreditimpairedMember2022-12-310000312069ifrs-full:LifetimeExpectedCreditLossesMemberbcs:OtherRetailMemberifrs-full:FinancialAssetsAtAmortisedCostMemberifrs-full:FinancialInstrumentsNotCreditimpairedMember2022-12-310000312069ifrs-full:LifetimeExpectedCreditLossesMemberbcs:OtherRetailMemberifrs-full:FinancialInstrumentsCreditimpairedMemberifrs-full:FinancialAssetsAtAmortisedCostMember2022-12-310000312069bcs:OtherRetailMemberifrs-full:FinancialAssetsAtAmortisedCostMember2022-12-310000312069ifrs-full:CorporateLoansMemberifrs-full:FinancialAssetsAtAmortisedCostMemberifrs-full:TwelvemonthExpectedCreditLossesMember2022-12-310000312069ifrs-full:LifetimeExpectedCreditLossesMemberifrs-full:CorporateLoansMemberifrs-full:CurrentMemberifrs-full:FinancialAssetsAtAmortisedCostMemberifrs-full:FinancialInstrumentsNotCreditimpairedMember2022-12-310000312069ifrs-full:LifetimeExpectedCreditLossesMemberifrs-full:CorporateLoansMemberifrs-full:NotLaterThanOneMonthMemberifrs-full:FinancialAssetsAtAmortisedCostMemberifrs-full:FinancialInstrumentsNotCreditimpairedMember2022-12-310000312069ifrs-full:LifetimeExpectedCreditLossesMemberifrs-full:CorporateLoansMemberbcs:GreaterThan30DaysPastDueMemberifrs-full:FinancialAssetsAtAmortisedCostMemberifrs-full:FinancialInstrumentsNotCreditimpairedMember2022-12-310000312069ifrs-full:LifetimeExpectedCreditLossesMemberifrs-full:CorporateLoansMemberifrs-full:FinancialAssetsAtAmortisedCostMemberifrs-full:FinancialInstrumentsNotCreditimpairedMember2022-12-310000312069ifrs-full:LifetimeExpectedCreditLossesMemberifrs-full:CorporateLoansMemberifrs-full:FinancialInstrumentsCreditimpairedMemberifrs-full:FinancialAssetsAtAmortisedCostMember2022-12-310000312069ifrs-full:CorporateLoansMemberifrs-full:FinancialAssetsAtAmortisedCostMember2022-12-310000312069ifrs-full:LifetimeExpectedCreditLossesMemberifrs-full:CurrentMemberifrs-full:FinancialAssetsAtAmortisedCostMemberifrs-full:LoansAndReceivablesCategoryMemberifrs-full:FinancialInstrumentsNotCreditimpairedMember2022-12-310000312069ifrs-full:LifetimeExpectedCreditLossesMemberifrs-full:NotLaterThanOneMonthMemberifrs-full:FinancialAssetsAtAmortisedCostMemberifrs-full:LoansAndReceivablesCategoryMemberifrs-full:FinancialInstrumentsNotCreditimpairedMember2022-12-310000312069ifrs-full:LifetimeExpectedCreditLossesMemberbcs:GreaterThan30DaysPastDueMemberifrs-full:FinancialAssetsAtAmortisedCostMemberifrs-full:LoansAndReceivablesCategoryMemberifrs-full:FinancialInstrumentsNotCreditimpairedMember2022-12-310000312069ifrs-full:MortgagesMemberifrs-full:GrossCarryingAmountMemberifrs-full:TwelvemonthExpectedCreditLossesMember2022-12-310000312069ifrs-full:AccumulatedImpairmentMemberifrs-full:MortgagesMemberifrs-full:TwelvemonthExpectedCreditLossesMember2022-12-310000312069ifrs-full:LifetimeExpectedCreditLossesMemberifrs-full:MortgagesMemberifrs-full:GrossCarryingAmountMemberifrs-full:FinancialInstrumentsNotCreditimpairedMember2022-12-310000312069ifrs-full:AccumulatedImpairmentMemberifrs-full:LifetimeExpectedCreditLossesMemberifrs-full:MortgagesMemberifrs-full:FinancialInstrumentsNotCreditimpairedMember2022-12-310000312069ifrs-full:LifetimeExpectedCreditLossesMemberifrs-full:MortgagesMemberifrs-full:FinancialInstrumentsCreditimpairedMemberifrs-full:GrossCarryingAmountMember2022-12-310000312069ifrs-full:AccumulatedImpairmentMemberifrs-full:LifetimeExpectedCreditLossesMemberifrs-full:MortgagesMemberifrs-full:FinancialInstrumentsCreditimpairedMember2022-12-310000312069ifrs-full:MortgagesMemberifrs-full:GrossCarryingAmountMember2022-12-310000312069ifrs-full:AccumulatedImpairmentMemberifrs-full:MortgagesMember2022-12-310000312069bcs:TransfersFromStage1ToStage2Memberifrs-full:MortgagesMemberifrs-full:GrossCarryingAmountMemberifrs-full:TwelvemonthExpectedCreditLossesMember2023-01-012023-12-310000312069ifrs-full:AccumulatedImpairmentMemberbcs:TransfersFromStage1ToStage2Memberifrs-full:MortgagesMemberifrs-full:TwelvemonthExpectedCreditLossesMember2023-01-012023-12-310000312069ifrs-full:LifetimeExpectedCreditLossesMemberbcs:TransfersFromStage1ToStage2Memberifrs-full:MortgagesMemberifrs-full:GrossCarryingAmountMemberifrs-full:FinancialInstrumentsNotCreditimpairedMember2023-01-012023-12-310000312069ifrs-full:AccumulatedImpairmentMemberifrs-full:LifetimeExpectedCreditLossesMemberbcs:TransfersFromStage1ToStage2Memberifrs-full:MortgagesMemberifrs-full:FinancialInstrumentsNotCreditimpairedMember2023-01-012023-12-310000312069ifrs-full:LifetimeExpectedCreditLossesMemberbcs:TransfersFromStage1ToStage2Memberifrs-full:MortgagesMemberifrs-full:FinancialInstrumentsCreditimpairedMemberifrs-full:GrossCarryingAmountMember2023-01-012023-12-310000312069ifrs-full:AccumulatedImpairmentMemberifrs-full:LifetimeExpectedCreditLossesMemberbcs:TransfersFromStage1ToStage2Memberifrs-full:MortgagesMemberifrs-full:FinancialInstrumentsCreditimpairedMember2023-01-012023-12-310000312069bcs:TransfersFromStage1ToStage2Memberifrs-full:MortgagesMemberifrs-full:GrossCarryingAmountMember2023-01-012023-12-310000312069ifrs-full:AccumulatedImpairmentMemberbcs:TransfersFromStage1ToStage2Memberifrs-full:MortgagesMember2023-01-012023-12-310000312069bcs:TransfersFromStage2ToStage1Memberifrs-full:MortgagesMemberifrs-full:GrossCarryingAmountMemberifrs-full:TwelvemonthExpectedCreditLossesMember2023-01-012023-12-310000312069ifrs-full:AccumulatedImpairmentMemberbcs:TransfersFromStage2ToStage1Memberifrs-full:MortgagesMemberifrs-full:TwelvemonthExpectedCreditLossesMember2023-01-012023-12-310000312069ifrs-full:LifetimeExpectedCreditLossesMemberbcs:TransfersFromStage2ToStage1Memberifrs-full:MortgagesMemberifrs-full:GrossCarryingAmountMemberifrs-full:FinancialInstrumentsNotCreditimpairedMember2023-01-012023-12-310000312069ifrs-full:AccumulatedImpairmentMemberifrs-full:LifetimeExpectedCreditLossesMemberbcs:TransfersFromStage2ToStage1Memberifrs-full:MortgagesMemberifrs-full:FinancialInstrumentsNotCreditimpairedMember2023-01-012023-12-310000312069ifrs-full:LifetimeExpectedCreditLossesMemberbcs:TransfersFromStage2ToStage1Memberifrs-full:MortgagesMemberifrs-full:FinancialInstrumentsCreditimpairedMemberifrs-full:GrossCarryingAmountMember2023-01-012023-12-310000312069ifrs-full:AccumulatedImpairmentMemberifrs-full:LifetimeExpectedCreditLossesMemberbcs:TransfersFromStage2ToStage1Memberifrs-full:MortgagesMemberifrs-full:FinancialInstrumentsCreditimpairedMember2023-01-012023-12-310000312069bcs:TransfersFromStage2ToStage1Memberifrs-full:MortgagesMemberifrs-full:GrossCarryingAmountMember2023-01-012023-12-310000312069ifrs-full:AccumulatedImpairmentMemberbcs:TransfersFromStage2ToStage1Memberifrs-full:MortgagesMember2023-01-012023-12-310000312069ifrs-full:MortgagesMemberifrs-full:GrossCarryingAmountMemberbcs:TransfersToStage3Memberifrs-full:TwelvemonthExpectedCreditLossesMember2023-01-012023-12-310000312069ifrs-full:AccumulatedImpairmentMemberifrs-full:MortgagesMemberbcs:TransfersToStage3Memberifrs-full:TwelvemonthExpectedCreditLossesMember2023-01-012023-12-310000312069ifrs-full:LifetimeExpectedCreditLossesMemberifrs-full:MortgagesMemberifrs-full:GrossCarryingAmountMemberifrs-full:FinancialInstrumentsNotCreditimpairedMemberbcs:TransfersToStage3Member2023-01-012023-12-310000312069ifrs-full:AccumulatedImpairmentMemberifrs-full:LifetimeExpectedCreditLossesMemberifrs-full:MortgagesMemberifrs-full:FinancialInstrumentsNotCreditimpairedMemberbcs:TransfersToStage3Member2023-01-012023-12-310000312069ifrs-full:LifetimeExpectedCreditLossesMemberifrs-full:MortgagesMemberifrs-full:FinancialInstrumentsCreditimpairedMemberifrs-full:GrossCarryingAmountMemberbcs:TransfersToStage3Member2023-01-012023-12-310000312069ifrs-full:AccumulatedImpairmentMemberifrs-full:LifetimeExpectedCreditLossesMemberifrs-full:MortgagesMemberifrs-full:FinancialInstrumentsCreditimpairedMemberbcs:TransfersToStage3Member2023-01-012023-12-310000312069ifrs-full:MortgagesMemberifrs-full:GrossCarryingAmountMemberbcs:TransfersToStage3Member2023-01-012023-12-310000312069ifrs-full:AccumulatedImpairmentMemberifrs-full:MortgagesMemberbcs:TransfersToStage3Member2023-01-012023-12-310000312069ifrs-full:MortgagesMemberifrs-full:GrossCarryingAmountMemberbcs:TransfersFromStage3Memberifrs-full:TwelvemonthExpectedCreditLossesMember2023-01-012023-12-310000312069ifrs-full:AccumulatedImpairmentMemberifrs-full:MortgagesMemberbcs:TransfersFromStage3Memberifrs-full:TwelvemonthExpectedCreditLossesMember2023-01-012023-12-310000312069ifrs-full:LifetimeExpectedCreditLossesMemberifrs-full:MortgagesMemberifrs-full:GrossCarryingAmountMemberbcs:TransfersFromStage3Memberifrs-full:FinancialInstrumentsNotCreditimpairedMember2023-01-012023-12-310000312069ifrs-full:AccumulatedImpairmentMemberifrs-full:LifetimeExpectedCreditLossesMemberifrs-full:MortgagesMemberbcs:TransfersFromStage3Memberifrs-full:FinancialInstrumentsNotCreditimpairedMember2023-01-012023-12-310000312069ifrs-full:LifetimeExpectedCreditLossesMemberifrs-full:MortgagesMemberifrs-full:FinancialInstrumentsCreditimpairedMemberifrs-full:GrossCarryingAmountMemberbcs:TransfersFromStage3Member2023-01-012023-12-310000312069ifrs-full:AccumulatedImpairmentMemberifrs-full:LifetimeExpectedCreditLossesMemberifrs-full:MortgagesMemberifrs-full:FinancialInstrumentsCreditimpairedMemberbcs:TransfersFromStage3Member2023-01-012023-12-310000312069ifrs-full:MortgagesMemberifrs-full:GrossCarryingAmountMemberbcs:TransfersFromStage3Member2023-01-012023-12-310000312069ifrs-full:AccumulatedImpairmentMemberifrs-full:MortgagesMemberbcs:TransfersFromStage3Member2023-01-012023-12-310000312069ifrs-full:MortgagesMemberifrs-full:GrossCarryingAmountMemberifrs-full:TwelvemonthExpectedCreditLossesMember2023-01-012023-12-310000312069ifrs-full:AccumulatedImpairmentMemberifrs-full:MortgagesMemberifrs-full:TwelvemonthExpectedCreditLossesMember2023-01-012023-12-310000312069ifrs-full:LifetimeExpectedCreditLossesMemberifrs-full:MortgagesMemberifrs-full:GrossCarryingAmountMemberifrs-full:FinancialInstrumentsNotCreditimpairedMember2023-01-012023-12-310000312069ifrs-full:AccumulatedImpairmentMemberifrs-full:LifetimeExpectedCreditLossesMemberifrs-full:MortgagesMemberifrs-full:FinancialInstrumentsNotCreditimpairedMember2023-01-012023-12-310000312069ifrs-full:LifetimeExpectedCreditLossesMemberifrs-full:MortgagesMemberifrs-full:FinancialInstrumentsCreditimpairedMemberifrs-full:GrossCarryingAmountMember2023-01-012023-12-310000312069ifrs-full:AccumulatedImpairmentMemberifrs-full:LifetimeExpectedCreditLossesMemberifrs-full:MortgagesMemberifrs-full:FinancialInstrumentsCreditimpairedMember2023-01-012023-12-310000312069ifrs-full:MortgagesMemberifrs-full:GrossCarryingAmountMember2023-01-012023-12-310000312069ifrs-full:AccumulatedImpairmentMemberifrs-full:MortgagesMember2023-01-012023-12-310000312069ifrs-full:MortgagesMemberifrs-full:GrossCarryingAmountMemberifrs-full:TwelvemonthExpectedCreditLossesMember2023-12-310000312069ifrs-full:AccumulatedImpairmentMemberifrs-full:MortgagesMemberifrs-full:TwelvemonthExpectedCreditLossesMember2023-12-310000312069ifrs-full:LifetimeExpectedCreditLossesMemberifrs-full:MortgagesMemberifrs-full:GrossCarryingAmountMemberifrs-full:FinancialInstrumentsNotCreditimpairedMember2023-12-310000312069ifrs-full:AccumulatedImpairmentMemberifrs-full:LifetimeExpectedCreditLossesMemberifrs-full:MortgagesMemberifrs-full:FinancialInstrumentsNotCreditimpairedMember2023-12-310000312069ifrs-full:LifetimeExpectedCreditLossesMemberifrs-full:MortgagesMemberifrs-full:FinancialInstrumentsCreditimpairedMemberifrs-full:GrossCarryingAmountMember2023-12-310000312069ifrs-full:AccumulatedImpairmentMemberifrs-full:LifetimeExpectedCreditLossesMemberifrs-full:MortgagesMemberifrs-full:FinancialInstrumentsCreditimpairedMember2023-12-310000312069ifrs-full:MortgagesMemberifrs-full:GrossCarryingAmountMember2023-12-310000312069ifrs-full:AccumulatedImpairmentMemberifrs-full:MortgagesMember2023-12-310000312069bcs:CreditCardsRetailMemberifrs-full:GrossCarryingAmountMemberifrs-full:TwelvemonthExpectedCreditLossesMember2022-12-310000312069bcs:CreditCardsRetailMemberifrs-full:AccumulatedImpairmentMemberifrs-full:TwelvemonthExpectedCreditLossesMember2022-12-310000312069bcs:CreditCardsRetailMemberifrs-full:LifetimeExpectedCreditLossesMemberifrs-full:GrossCarryingAmountMemberifrs-full:FinancialInstrumentsNotCreditimpairedMember2022-12-310000312069bcs:CreditCardsRetailMemberifrs-full:AccumulatedImpairmentMemberifrs-full:LifetimeExpectedCreditLossesMemberifrs-full:FinancialInstrumentsNotCreditimpairedMember2022-12-310000312069bcs:CreditCardsRetailMemberifrs-full:LifetimeExpectedCreditLossesMemberifrs-full:FinancialInstrumentsCreditimpairedMemberifrs-full:GrossCarryingAmountMember2022-12-310000312069bcs:CreditCardsRetailMemberifrs-full:AccumulatedImpairmentMemberifrs-full:LifetimeExpectedCreditLossesMemberifrs-full:FinancialInstrumentsCreditimpairedMember2022-12-310000312069bcs:CreditCardsRetailMemberifrs-full:GrossCarryingAmountMember2022-12-310000312069bcs:CreditCardsRetailMemberifrs-full:AccumulatedImpairmentMember2022-12-310000312069bcs:CreditCardsRetailMemberbcs:TransfersFromStage1ToStage2Memberifrs-full:GrossCarryingAmountMemberifrs-full:TwelvemonthExpectedCreditLossesMember2023-01-012023-12-310000312069bcs:CreditCardsRetailMemberifrs-full:AccumulatedImpairmentMemberbcs:TransfersFromStage1ToStage2Memberifrs-full:TwelvemonthExpectedCreditLossesMember2023-01-012023-12-310000312069bcs:CreditCardsRetailMemberifrs-full:LifetimeExpectedCreditLossesMemberbcs:TransfersFromStage1ToStage2Memberifrs-full:GrossCarryingAmountMemberifrs-full:FinancialInstrumentsNotCreditimpairedMember2023-01-012023-12-310000312069bcs:CreditCardsRetailMemberifrs-full:AccumulatedImpairmentMemberifrs-full:LifetimeExpectedCreditLossesMemberbcs:TransfersFromStage1ToStage2Memberifrs-full:FinancialInstrumentsNotCreditimpairedMember2023-01-012023-12-310000312069bcs:CreditCardsRetailMemberifrs-full:LifetimeExpectedCreditLossesMemberbcs:TransfersFromStage1ToStage2Memberifrs-full:FinancialInstrumentsCreditimpairedMemberifrs-full:GrossCarryingAmountMember2023-01-012023-12-310000312069bcs:CreditCardsRetailMemberifrs-full:AccumulatedImpairmentMemberifrs-full:LifetimeExpectedCreditLossesMemberbcs:TransfersFromStage1ToStage2Memberifrs-full:FinancialInstrumentsCreditimpairedMember2023-01-012023-12-310000312069bcs:CreditCardsRetailMemberbcs:TransfersFromStage1ToStage2Memberifrs-full:GrossCarryingAmountMember2023-01-012023-12-310000312069bcs:CreditCardsRetailMemberifrs-full:AccumulatedImpairmentMemberbcs:TransfersFromStage1ToStage2Member2023-01-012023-12-310000312069bcs:CreditCardsRetailMemberbcs:TransfersFromStage2ToStage1Memberifrs-full:GrossCarryingAmountMemberifrs-full:TwelvemonthExpectedCreditLossesMember2023-01-012023-12-310000312069bcs:CreditCardsRetailMemberifrs-full:AccumulatedImpairmentMemberbcs:TransfersFromStage2ToStage1Memberifrs-full:TwelvemonthExpectedCreditLossesMember2023-01-012023-12-310000312069bcs:CreditCardsRetailMemberifrs-full:LifetimeExpectedCreditLossesMemberbcs:TransfersFromStage2ToStage1Memberifrs-full:GrossCarryingAmountMemberifrs-full:FinancialInstrumentsNotCreditimpairedMember2023-01-012023-12-310000312069bcs:CreditCardsRetailMemberifrs-full:AccumulatedImpairmentMemberifrs-full:LifetimeExpectedCreditLossesMemberbcs:TransfersFromStage2ToStage1Memberifrs-full:FinancialInstrumentsNotCreditimpairedMember2023-01-012023-12-310000312069bcs:CreditCardsRetailMemberifrs-full:LifetimeExpectedCreditLossesMemberbcs:TransfersFromStage2ToStage1Memberifrs-full:FinancialInstrumentsCreditimpairedMemberifrs-full:GrossCarryingAmountMember2023-01-012023-12-310000312069bcs:CreditCardsRetailMemberifrs-full:AccumulatedImpairmentMemberifrs-full:LifetimeExpectedCreditLossesMemberbcs:TransfersFromStage2ToStage1Memberifrs-full:FinancialInstrumentsCreditimpairedMember2023-01-012023-12-310000312069bcs:CreditCardsRetailMemberbcs:TransfersFromStage2ToStage1Memberifrs-full:GrossCarryingAmountMember2023-01-012023-12-310000312069bcs:CreditCardsRetailMemberifrs-full:AccumulatedImpairmentMemberbcs:TransfersFromStage2ToStage1Member2023-01-012023-12-310000312069bcs:CreditCardsRetailMemberifrs-full:GrossCarryingAmountMemberbcs:TransfersToStage3Memberifrs-full:TwelvemonthExpectedCreditLossesMember2023-01-012023-12-310000312069bcs:CreditCardsRetailMemberifrs-full:AccumulatedImpairmentMemberbcs:TransfersToStage3Memberifrs-full:TwelvemonthExpectedCreditLossesMember2023-01-012023-12-310000312069bcs:CreditCardsRetailMemberifrs-full:LifetimeExpectedCreditLossesMemberifrs-full:GrossCarryingAmountMemberifrs-full:FinancialInstrumentsNotCreditimpairedMemberbcs:TransfersToStage3Member2023-01-012023-12-310000312069bcs:CreditCardsRetailMemberifrs-full:AccumulatedImpairmentMemberifrs-full:LifetimeExpectedCreditLossesMemberifrs-full:FinancialInstrumentsNotCreditimpairedMemberbcs:TransfersToStage3Member2023-01-012023-12-310000312069bcs:CreditCardsRetailMemberifrs-full:LifetimeExpectedCreditLossesMemberifrs-full:FinancialInstrumentsCreditimpairedMemberifrs-full:GrossCarryingAmountMemberbcs:TransfersToStage3Member2023-01-012023-12-310000312069bcs:CreditCardsRetailMemberifrs-full:AccumulatedImpairmentMemberifrs-full:LifetimeExpectedCreditLossesMemberifrs-full:FinancialInstrumentsCreditimpairedMemberbcs:TransfersToStage3Member2023-01-012023-12-310000312069bcs:CreditCardsRetailMemberifrs-full:GrossCarryingAmountMemberbcs:TransfersToStage3Member2023-01-012023-12-310000312069bcs:CreditCardsRetailMemberifrs-full:AccumulatedImpairmentMemberbcs:TransfersToStage3Member2023-01-012023-12-310000312069bcs:CreditCardsRetailMemberifrs-full:GrossCarryingAmountMemberbcs:TransfersFromStage3Memberifrs-full:TwelvemonthExpectedCreditLossesMember2023-01-012023-12-310000312069bcs:CreditCardsRetailMemberifrs-full:AccumulatedImpairmentMemberbcs:TransfersFromStage3Memberifrs-full:TwelvemonthExpectedCreditLossesMember2023-01-012023-12-310000312069bcs:CreditCardsRetailMemberifrs-full:LifetimeExpectedCreditLossesMemberifrs-full:GrossCarryingAmountMemberbcs:TransfersFromStage3Memberifrs-full:FinancialInstrumentsNotCreditimpairedMember2023-01-012023-12-310000312069bcs:CreditCardsRetailMemberifrs-full:AccumulatedImpairmentMemberifrs-full:LifetimeExpectedCreditLossesMemberbcs:TransfersFromStage3Memberifrs-full:FinancialInstrumentsNotCreditimpairedMember2023-01-012023-12-310000312069bcs:CreditCardsRetailMemberifrs-full:LifetimeExpectedCreditLossesMemberifrs-full:FinancialInstrumentsCreditimpairedMemberifrs-full:GrossCarryingAmountMemberbcs:TransfersFromStage3Member2023-01-012023-12-310000312069bcs:CreditCardsRetailMemberifrs-full:AccumulatedImpairmentMemberifrs-full:LifetimeExpectedCreditLossesMemberifrs-full:FinancialInstrumentsCreditimpairedMemberbcs:TransfersFromStage3Member2023-01-012023-12-310000312069bcs:CreditCardsRetailMemberifrs-full:GrossCarryingAmountMemberbcs:TransfersFromStage3Member2023-01-012023-12-310000312069bcs:CreditCardsRetailMemberifrs-full:AccumulatedImpairmentMemberbcs:TransfersFromStage3Member2023-01-012023-12-310000312069bcs:CreditCardsRetailMemberifrs-full:GrossCarryingAmountMemberifrs-full:TwelvemonthExpectedCreditLossesMember2023-01-012023-12-310000312069bcs:CreditCardsRetailMemberifrs-full:AccumulatedImpairmentMemberifrs-full:TwelvemonthExpectedCreditLossesMember2023-01-012023-12-310000312069bcs:CreditCardsRetailMemberifrs-full:LifetimeExpectedCreditLossesMemberifrs-full:GrossCarryingAmountMemberifrs-full:FinancialInstrumentsNotCreditimpairedMember2023-01-012023-12-310000312069bcs:CreditCardsRetailMemberifrs-full:AccumulatedImpairmentMemberifrs-full:LifetimeExpectedCreditLossesMemberifrs-full:FinancialInstrumentsNotCreditimpairedMember2023-01-012023-12-310000312069bcs:CreditCardsRetailMemberifrs-full:LifetimeExpectedCreditLossesMemberifrs-full:FinancialInstrumentsCreditimpairedMemberifrs-full:GrossCarryingAmountMember2023-01-012023-12-310000312069bcs:CreditCardsRetailMemberifrs-full:AccumulatedImpairmentMemberifrs-full:LifetimeExpectedCreditLossesMemberifrs-full:FinancialInstrumentsCreditimpairedMember2023-01-012023-12-310000312069bcs:CreditCardsRetailMemberifrs-full:GrossCarryingAmountMember2023-01-012023-12-310000312069bcs:CreditCardsRetailMemberifrs-full:AccumulatedImpairmentMember2023-01-012023-12-310000312069bcs:CreditCardsRetailMemberifrs-full:GrossCarryingAmountMemberifrs-full:TwelvemonthExpectedCreditLossesMember2023-12-310000312069bcs:CreditCardsRetailMemberifrs-full:AccumulatedImpairmentMemberifrs-full:TwelvemonthExpectedCreditLossesMember2023-12-310000312069bcs:CreditCardsRetailMemberifrs-full:LifetimeExpectedCreditLossesMemberifrs-full:GrossCarryingAmountMemberifrs-full:FinancialInstrumentsNotCreditimpairedMember2023-12-310000312069bcs:CreditCardsRetailMemberifrs-full:AccumulatedImpairmentMemberifrs-full:LifetimeExpectedCreditLossesMemberifrs-full:FinancialInstrumentsNotCreditimpairedMember2023-12-310000312069bcs:CreditCardsRetailMemberifrs-full:LifetimeExpectedCreditLossesMemberifrs-full:FinancialInstrumentsCreditimpairedMemberifrs-full:GrossCarryingAmountMember2023-12-310000312069bcs:CreditCardsRetailMemberifrs-full:AccumulatedImpairmentMemberifrs-full:LifetimeExpectedCreditLossesMemberifrs-full:FinancialInstrumentsCreditimpairedMember2023-12-310000312069bcs:CreditCardsRetailMemberifrs-full:GrossCarryingAmountMember2023-12-310000312069bcs:CreditCardsRetailMemberifrs-full:AccumulatedImpairmentMember2023-12-310000312069bcs:OtherRetailMemberifrs-full:GrossCarryingAmountMemberifrs-full:TwelvemonthExpectedCreditLossesMember2022-12-310000312069ifrs-full:AccumulatedImpairmentMemberbcs:OtherRetailMemberifrs-full:TwelvemonthExpectedCreditLossesMember2022-12-310000312069ifrs-full:LifetimeExpectedCreditLossesMemberbcs:OtherRetailMemberifrs-full:GrossCarryingAmountMemberifrs-full:FinancialInstrumentsNotCreditimpairedMember2022-12-310000312069ifrs-full:AccumulatedImpairmentMemberifrs-full:LifetimeExpectedCreditLossesMemberbcs:OtherRetailMemberifrs-full:FinancialInstrumentsNotCreditimpairedMember2022-12-310000312069ifrs-full:LifetimeExpectedCreditLossesMemberbcs:OtherRetailMemberifrs-full:FinancialInstrumentsCreditimpairedMemberifrs-full:GrossCarryingAmountMember2022-12-310000312069ifrs-full:AccumulatedImpairmentMemberifrs-full:LifetimeExpectedCreditLossesMemberbcs:OtherRetailMemberifrs-full:FinancialInstrumentsCreditimpairedMember2022-12-310000312069bcs:OtherRetailMemberifrs-full:GrossCarryingAmountMember2022-12-310000312069ifrs-full:AccumulatedImpairmentMemberbcs:OtherRetailMember2022-12-310000312069bcs:TransfersFromStage1ToStage2Memberbcs:OtherRetailMemberifrs-full:GrossCarryingAmountMemberifrs-full:TwelvemonthExpectedCreditLossesMember2023-01-012023-12-310000312069ifrs-full:AccumulatedImpairmentMemberbcs:TransfersFromStage1ToStage2Memberbcs:OtherRetailMemberifrs-full:TwelvemonthExpectedCreditLossesMember2023-01-012023-12-310000312069ifrs-full:LifetimeExpectedCreditLossesMemberbcs:TransfersFromStage1ToStage2Memberbcs:OtherRetailMemberifrs-full:GrossCarryingAmountMemberifrs-full:FinancialInstrumentsNotCreditimpairedMember2023-01-012023-12-310000312069ifrs-full:AccumulatedImpairmentMemberifrs-full:LifetimeExpectedCreditLossesMemberbcs:TransfersFromStage1ToStage2Memberbcs:OtherRetailMemberifrs-full:FinancialInstrumentsNotCreditimpairedMember2023-01-012023-12-310000312069ifrs-full:LifetimeExpectedCreditLossesMemberbcs:TransfersFromStage1ToStage2Memberbcs:OtherRetailMemberifrs-full:FinancialInstrumentsCreditimpairedMemberifrs-full:GrossCarryingAmountMember2023-01-012023-12-310000312069ifrs-full:AccumulatedImpairmentMemberifrs-full:LifetimeExpectedCreditLossesMemberbcs:TransfersFromStage1ToStage2Memberbcs:OtherRetailMemberifrs-full:FinancialInstrumentsCreditimpairedMember2023-01-012023-12-310000312069bcs:TransfersFromStage1ToStage2Memberbcs:OtherRetailMemberifrs-full:GrossCarryingAmountMember2023-01-012023-12-310000312069ifrs-full:AccumulatedImpairmentMemberbcs:TransfersFromStage1ToStage2Memberbcs:OtherRetailMember2023-01-012023-12-310000312069bcs:TransfersFromStage2ToStage1Memberbcs:OtherRetailMemberifrs-full:GrossCarryingAmountMemberifrs-full:TwelvemonthExpectedCreditLossesMember2023-01-012023-12-310000312069ifrs-full:AccumulatedImpairmentMemberbcs:TransfersFromStage2ToStage1Memberbcs:OtherRetailMemberifrs-full:TwelvemonthExpectedCreditLossesMember2023-01-012023-12-310000312069ifrs-full:LifetimeExpectedCreditLossesMemberbcs:TransfersFromStage2ToStage1Memberbcs:OtherRetailMemberifrs-full:GrossCarryingAmountMemberifrs-full:FinancialInstrumentsNotCreditimpairedMember2023-01-012023-12-310000312069ifrs-full:AccumulatedImpairmentMemberifrs-full:LifetimeExpectedCreditLossesMemberbcs:TransfersFromStage2ToStage1Memberbcs:OtherRetailMemberifrs-full:FinancialInstrumentsNotCreditimpairedMember2023-01-012023-12-310000312069ifrs-full:LifetimeExpectedCreditLossesMemberbcs:TransfersFromStage2ToStage1Memberbcs:OtherRetailMemberifrs-full:FinancialInstrumentsCreditimpairedMemberifrs-full:GrossCarryingAmountMember2023-01-012023-12-310000312069ifrs-full:AccumulatedImpairmentMemberifrs-full:LifetimeExpectedCreditLossesMemberbcs:TransfersFromStage2ToStage1Memberbcs:OtherRetailMemberifrs-full:FinancialInstrumentsCreditimpairedMember2023-01-012023-12-310000312069bcs:TransfersFromStage2ToStage1Memberbcs:OtherRetailMemberifrs-full:GrossCarryingAmountMember2023-01-012023-12-310000312069ifrs-full:AccumulatedImpairmentMemberbcs:TransfersFromStage2ToStage1Memberbcs:OtherRetailMember2023-01-012023-12-310000312069bcs:OtherRetailMemberifrs-full:GrossCarryingAmountMemberbcs:TransfersToStage3Memberifrs-full:TwelvemonthExpectedCreditLossesMember2023-01-012023-12-310000312069ifrs-full:AccumulatedImpairmentMemberbcs:OtherRetailMemberbcs:TransfersToStage3Memberifrs-full:TwelvemonthExpectedCreditLossesMember2023-01-012023-12-310000312069ifrs-full:LifetimeExpectedCreditLossesMemberbcs:OtherRetailMemberifrs-full:GrossCarryingAmountMemberifrs-full:FinancialInstrumentsNotCreditimpairedMemberbcs:TransfersToStage3Member2023-01-012023-12-310000312069ifrs-full:AccumulatedImpairmentMemberifrs-full:LifetimeExpectedCreditLossesMemberbcs:OtherRetailMemberifrs-full:FinancialInstrumentsNotCreditimpairedMemberbcs:TransfersToStage3Member2023-01-012023-12-310000312069ifrs-full:LifetimeExpectedCreditLossesMemberbcs:OtherRetailMemberifrs-full:FinancialInstrumentsCreditimpairedMemberifrs-full:GrossCarryingAmountMemberbcs:TransfersToStage3Member2023-01-012023-12-310000312069ifrs-full:AccumulatedImpairmentMemberifrs-full:LifetimeExpectedCreditLossesMemberbcs:OtherRetailMemberifrs-full:FinancialInstrumentsCreditimpairedMemberbcs:TransfersToStage3Member2023-01-012023-12-310000312069bcs:OtherRetailMemberifrs-full:GrossCarryingAmountMemberbcs:TransfersToStage3Member2023-01-012023-12-310000312069ifrs-full:AccumulatedImpairmentMemberbcs:OtherRetailMemberbcs:TransfersToStage3Member2023-01-012023-12-310000312069bcs:OtherRetailMemberifrs-full:GrossCarryingAmountMemberbcs:TransfersFromStage3Memberifrs-full:TwelvemonthExpectedCreditLossesMember2023-01-012023-12-310000312069ifrs-full:AccumulatedImpairmentMemberbcs:OtherRetailMemberbcs:TransfersFromStage3Memberifrs-full:TwelvemonthExpectedCreditLossesMember2023-01-012023-12-310000312069ifrs-full:LifetimeExpectedCreditLossesMemberbcs:OtherRetailMemberifrs-full:GrossCarryingAmountMemberbcs:TransfersFromStage3Memberifrs-full:FinancialInstrumentsNotCreditimpairedMember2023-01-012023-12-310000312069ifrs-full:AccumulatedImpairmentMemberifrs-full:LifetimeExpectedCreditLossesMemberbcs:OtherRetailMemberbcs:TransfersFromStage3Memberifrs-full:FinancialInstrumentsNotCreditimpairedMember2023-01-012023-12-310000312069ifrs-full:LifetimeExpectedCreditLossesMemberbcs:OtherRetailMemberifrs-full:FinancialInstrumentsCreditimpairedMemberifrs-full:GrossCarryingAmountMemberbcs:TransfersFromStage3Member2023-01-012023-12-310000312069ifrs-full:AccumulatedImpairmentMemberifrs-full:LifetimeExpectedCreditLossesMemberbcs:OtherRetailMemberifrs-full:FinancialInstrumentsCreditimpairedMemberbcs:TransfersFromStage3Member2023-01-012023-12-310000312069bcs:OtherRetailMemberifrs-full:GrossCarryingAmountMemberbcs:TransfersFromStage3Member2023-01-012023-12-310000312069ifrs-full:AccumulatedImpairmentMemberbcs:OtherRetailMemberbcs:TransfersFromStage3Member2023-01-012023-12-310000312069bcs:OtherRetailMemberifrs-full:GrossCarryingAmountMemberifrs-full:TwelvemonthExpectedCreditLossesMember2023-01-012023-12-310000312069ifrs-full:AccumulatedImpairmentMemberbcs:OtherRetailMemberifrs-full:TwelvemonthExpectedCreditLossesMember2023-01-012023-12-310000312069ifrs-full:LifetimeExpectedCreditLossesMemberbcs:OtherRetailMemberifrs-full:GrossCarryingAmountMemberifrs-full:FinancialInstrumentsNotCreditimpairedMember2023-01-012023-12-310000312069ifrs-full:AccumulatedImpairmentMemberifrs-full:LifetimeExpectedCreditLossesMemberbcs:OtherRetailMemberifrs-full:FinancialInstrumentsNotCreditimpairedMember2023-01-012023-12-310000312069ifrs-full:LifetimeExpectedCreditLossesMemberbcs:OtherRetailMemberifrs-full:FinancialInstrumentsCreditimpairedMemberifrs-full:GrossCarryingAmountMember2023-01-012023-12-310000312069ifrs-full:AccumulatedImpairmentMemberifrs-full:LifetimeExpectedCreditLossesMemberbcs:OtherRetailMemberifrs-full:FinancialInstrumentsCreditimpairedMember2023-01-012023-12-310000312069bcs:OtherRetailMemberifrs-full:GrossCarryingAmountMember2023-01-012023-12-310000312069ifrs-full:AccumulatedImpairmentMemberbcs:OtherRetailMember2023-01-012023-12-310000312069bcs:OtherRetailMemberifrs-full:GrossCarryingAmountMemberifrs-full:TwelvemonthExpectedCreditLossesMember2023-12-310000312069ifrs-full:AccumulatedImpairmentMemberbcs:OtherRetailMemberifrs-full:TwelvemonthExpectedCreditLossesMember2023-12-310000312069ifrs-full:LifetimeExpectedCreditLossesMemberbcs:OtherRetailMemberifrs-full:GrossCarryingAmountMemberifrs-full:FinancialInstrumentsNotCreditimpairedMember2023-12-310000312069ifrs-full:AccumulatedImpairmentMemberifrs-full:LifetimeExpectedCreditLossesMemberbcs:OtherRetailMemberifrs-full:FinancialInstrumentsNotCreditimpairedMember2023-12-310000312069ifrs-full:LifetimeExpectedCreditLossesMemberbcs:OtherRetailMemberifrs-full:FinancialInstrumentsCreditimpairedMemberifrs-full:GrossCarryingAmountMember2023-12-310000312069ifrs-full:AccumulatedImpairmentMemberifrs-full:LifetimeExpectedCreditLossesMemberbcs:OtherRetailMemberifrs-full:FinancialInstrumentsCreditimpairedMember2023-12-310000312069bcs:OtherRetailMemberifrs-full:GrossCarryingAmountMember2023-12-310000312069ifrs-full:AccumulatedImpairmentMemberbcs:OtherRetailMember2023-12-310000312069ifrs-full:MortgagesMemberbcs:KensingtonMortgageCompanyMember2023-01-012023-12-310000312069country:ITbcs:OtherRetailMemberifrs-full:GrossCarryingAmountMemberbcs:WealthPortfolioMember2023-01-012023-12-310000312069ifrs-full:DebtSecuritiesMemberbcs:OtherRetailMemberifrs-full:GrossCarryingAmountMember2023-01-012023-12-310000312069bcs:CreditCardsRetailMemberifrs-full:AccumulatedImpairmentMemberifrs-full:FinancialAssetsAtAmortisedCostMembercountry:GB2023-01-012023-12-310000312069bcs:CreditCardsRetailMemberifrs-full:AccumulatedImpairmentMembercountry:USifrs-full:FinancialAssetsAtAmortisedCostMember2023-01-012023-12-310000312069bcs:CreditCardsRetailMembercountry:DEifrs-full:AccumulatedImpairmentMemberifrs-full:FinancialAssetsAtAmortisedCostMember2023-01-012023-12-310000312069ifrs-full:CorporateLoansMemberifrs-full:GrossCarryingAmountMemberifrs-full:TwelvemonthExpectedCreditLossesMember2022-12-310000312069ifrs-full:AccumulatedImpairmentMemberifrs-full:CorporateLoansMemberifrs-full:TwelvemonthExpectedCreditLossesMember2022-12-310000312069ifrs-full:LifetimeExpectedCreditLossesMemberifrs-full:CorporateLoansMemberifrs-full:GrossCarryingAmountMemberifrs-full:FinancialInstrumentsNotCreditimpairedMember2022-12-310000312069ifrs-full:AccumulatedImpairmentMemberifrs-full:LifetimeExpectedCreditLossesMemberifrs-full:CorporateLoansMemberifrs-full:FinancialInstrumentsNotCreditimpairedMember2022-12-310000312069ifrs-full:LifetimeExpectedCreditLossesMemberifrs-full:CorporateLoansMemberifrs-full:FinancialInstrumentsCreditimpairedMemberifrs-full:GrossCarryingAmountMember2022-12-310000312069ifrs-full:AccumulatedImpairmentMemberifrs-full:LifetimeExpectedCreditLossesMemberifrs-full:CorporateLoansMemberifrs-full:FinancialInstrumentsCreditimpairedMember2022-12-310000312069ifrs-full:CorporateLoansMemberifrs-full:GrossCarryingAmountMember2022-12-310000312069ifrs-full:AccumulatedImpairmentMemberifrs-full:CorporateLoansMember2022-12-310000312069ifrs-full:CorporateLoansMemberbcs:TransfersFromStage1ToStage2Memberifrs-full:GrossCarryingAmountMemberifrs-full:TwelvemonthExpectedCreditLossesMember2023-01-012023-12-310000312069ifrs-full:AccumulatedImpairmentMemberifrs-full:CorporateLoansMemberbcs:TransfersFromStage1ToStage2Memberifrs-full:TwelvemonthExpectedCreditLossesMember2023-01-012023-12-310000312069ifrs-full:LifetimeExpectedCreditLossesMemberifrs-full:CorporateLoansMemberbcs:TransfersFromStage1ToStage2Memberifrs-full:GrossCarryingAmountMemberifrs-full:FinancialInstrumentsNotCreditimpairedMember2023-01-012023-12-310000312069ifrs-full:AccumulatedImpairmentMemberifrs-full:LifetimeExpectedCreditLossesMemberifrs-full:CorporateLoansMemberbcs:TransfersFromStage1ToStage2Memberifrs-full:FinancialInstrumentsNotCreditimpairedMember2023-01-012023-12-310000312069ifrs-full:LifetimeExpectedCreditLossesMemberifrs-full:CorporateLoansMemberbcs:TransfersFromStage1ToStage2Memberifrs-full:FinancialInstrumentsCreditimpairedMemberifrs-full:GrossCarryingAmountMember2023-01-012023-12-310000312069ifrs-full:AccumulatedImpairmentMemberifrs-full:LifetimeExpectedCreditLossesMemberifrs-full:CorporateLoansMemberbcs:TransfersFromStage1ToStage2Memberifrs-full:FinancialInstrumentsCreditimpairedMember2023-01-012023-12-310000312069ifrs-full:CorporateLoansMemberbcs:TransfersFromStage1ToStage2Memberifrs-full:GrossCarryingAmountMember2023-01-012023-12-310000312069ifrs-full:AccumulatedImpairmentMemberifrs-full:CorporateLoansMemberbcs:TransfersFromStage1ToStage2Member2023-01-012023-12-310000312069ifrs-full:CorporateLoansMemberbcs:TransfersFromStage2ToStage1Memberifrs-full:GrossCarryingAmountMemberifrs-full:TwelvemonthExpectedCreditLossesMember2023-01-012023-12-310000312069ifrs-full:AccumulatedImpairmentMemberifrs-full:CorporateLoansMemberbcs:TransfersFromStage2ToStage1Memberifrs-full:TwelvemonthExpectedCreditLossesMember2023-01-012023-12-310000312069ifrs-full:LifetimeExpectedCreditLossesMemberifrs-full:CorporateLoansMemberbcs:TransfersFromStage2ToStage1Memberifrs-full:GrossCarryingAmountMemberifrs-full:FinancialInstrumentsNotCreditimpairedMember2023-01-012023-12-310000312069ifrs-full:AccumulatedImpairmentMemberifrs-full:LifetimeExpectedCreditLossesMemberifrs-full:CorporateLoansMemberbcs:TransfersFromStage2ToStage1Memberifrs-full:FinancialInstrumentsNotCreditimpairedMember2023-01-012023-12-310000312069ifrs-full:LifetimeExpectedCreditLossesMemberifrs-full:CorporateLoansMemberbcs:TransfersFromStage2ToStage1Memberifrs-full:FinancialInstrumentsCreditimpairedMemberifrs-full:GrossCarryingAmountMember2023-01-012023-12-310000312069ifrs-full:AccumulatedImpairmentMemberifrs-full:LifetimeExpectedCreditLossesMemberifrs-full:CorporateLoansMemberbcs:TransfersFromStage2ToStage1Memberifrs-full:FinancialInstrumentsCreditimpairedMember2023-01-012023-12-310000312069ifrs-full:CorporateLoansMemberbcs:TransfersFromStage2ToStage1Memberifrs-full:GrossCarryingAmountMember2023-01-012023-12-310000312069ifrs-full:AccumulatedImpairmentMemberifrs-full:CorporateLoansMemberbcs:TransfersFromStage2ToStage1Member2023-01-012023-12-310000312069ifrs-full:CorporateLoansMemberifrs-full:GrossCarryingAmountMemberbcs:TransfersToStage3Memberifrs-full:TwelvemonthExpectedCreditLossesMember2023-01-012023-12-310000312069ifrs-full:AccumulatedImpairmentMemberifrs-full:CorporateLoansMemberbcs:TransfersToStage3Memberifrs-full:TwelvemonthExpectedCreditLossesMember2023-01-012023-12-310000312069ifrs-full:LifetimeExpectedCreditLossesMemberifrs-full:CorporateLoansMemberifrs-full:GrossCarryingAmountMemberifrs-full:FinancialInstrumentsNotCreditimpairedMemberbcs:TransfersToStage3Member2023-01-012023-12-310000312069ifrs-full:AccumulatedImpairmentMemberifrs-full:LifetimeExpectedCreditLossesMemberifrs-full:CorporateLoansMemberifrs-full:FinancialInstrumentsNotCreditimpairedMemberbcs:TransfersToStage3Member2023-01-012023-12-310000312069ifrs-full:LifetimeExpectedCreditLossesMemberifrs-full:CorporateLoansMemberifrs-full:FinancialInstrumentsCreditimpairedMemberifrs-full:GrossCarryingAmountMemberbcs:TransfersToStage3Member2023-01-012023-12-310000312069ifrs-full:AccumulatedImpairmentMemberifrs-full:LifetimeExpectedCreditLossesMemberifrs-full:CorporateLoansMemberifrs-full:FinancialInstrumentsCreditimpairedMemberbcs:TransfersToStage3Member2023-01-012023-12-310000312069ifrs-full:CorporateLoansMemberifrs-full:GrossCarryingAmountMemberbcs:TransfersToStage3Member2023-01-012023-12-310000312069ifrs-full:AccumulatedImpairmentMemberifrs-full:CorporateLoansMemberbcs:TransfersToStage3Member2023-01-012023-12-310000312069ifrs-full:CorporateLoansMemberifrs-full:GrossCarryingAmountMemberbcs:TransfersFromStage3Memberifrs-full:TwelvemonthExpectedCreditLossesMember2023-01-012023-12-310000312069ifrs-full:AccumulatedImpairmentMemberifrs-full:CorporateLoansMemberbcs:TransfersFromStage3Memberifrs-full:TwelvemonthExpectedCreditLossesMember2023-01-012023-12-310000312069ifrs-full:LifetimeExpectedCreditLossesMemberifrs-full:CorporateLoansMemberifrs-full:GrossCarryingAmountMemberbcs:TransfersFromStage3Memberifrs-full:FinancialInstrumentsNotCreditimpairedMember2023-01-012023-12-310000312069ifrs-full:AccumulatedImpairmentMemberifrs-full:LifetimeExpectedCreditLossesMemberifrs-full:CorporateLoansMemberbcs:TransfersFromStage3Memberifrs-full:FinancialInstrumentsNotCreditimpairedMember2023-01-012023-12-310000312069ifrs-full:LifetimeExpectedCreditLossesMemberifrs-full:CorporateLoansMemberifrs-full:FinancialInstrumentsCreditimpairedMemberifrs-full:GrossCarryingAmountMemberbcs:TransfersFromStage3Member2023-01-012023-12-310000312069ifrs-full:AccumulatedImpairmentMemberifrs-full:LifetimeExpectedCreditLossesMemberifrs-full:CorporateLoansMemberifrs-full:FinancialInstrumentsCreditimpairedMemberbcs:TransfersFromStage3Member2023-01-012023-12-310000312069ifrs-full:CorporateLoansMemberifrs-full:GrossCarryingAmountMemberbcs:TransfersFromStage3Member2023-01-012023-12-310000312069ifrs-full:AccumulatedImpairmentMemberifrs-full:CorporateLoansMemberbcs:TransfersFromStage3Member2023-01-012023-12-310000312069ifrs-full:CorporateLoansMemberifrs-full:GrossCarryingAmountMemberifrs-full:TwelvemonthExpectedCreditLossesMember2023-01-012023-12-310000312069ifrs-full:AccumulatedImpairmentMemberifrs-full:CorporateLoansMemberifrs-full:TwelvemonthExpectedCreditLossesMember2023-01-012023-12-310000312069ifrs-full:LifetimeExpectedCreditLossesMemberifrs-full:CorporateLoansMemberifrs-full:GrossCarryingAmountMemberifrs-full:FinancialInstrumentsNotCreditimpairedMember2023-01-012023-12-310000312069ifrs-full:AccumulatedImpairmentMemberifrs-full:LifetimeExpectedCreditLossesMemberifrs-full:CorporateLoansMemberifrs-full:FinancialInstrumentsNotCreditimpairedMember2023-01-012023-12-310000312069ifrs-full:LifetimeExpectedCreditLossesMemberifrs-full:CorporateLoansMemberifrs-full:FinancialInstrumentsCreditimpairedMemberifrs-full:GrossCarryingAmountMember2023-01-012023-12-310000312069ifrs-full:AccumulatedImpairmentMemberifrs-full:LifetimeExpectedCreditLossesMemberifrs-full:CorporateLoansMemberifrs-full:FinancialInstrumentsCreditimpairedMember2023-01-012023-12-310000312069ifrs-full:CorporateLoansMemberifrs-full:GrossCarryingAmountMember2023-01-012023-12-310000312069ifrs-full:AccumulatedImpairmentMemberifrs-full:CorporateLoansMember2023-01-012023-12-310000312069ifrs-full:CorporateLoansMemberifrs-full:GrossCarryingAmountMemberifrs-full:TwelvemonthExpectedCreditLossesMember2023-12-310000312069ifrs-full:AccumulatedImpairmentMemberifrs-full:CorporateLoansMemberifrs-full:TwelvemonthExpectedCreditLossesMember2023-12-310000312069ifrs-full:LifetimeExpectedCreditLossesMemberifrs-full:CorporateLoansMemberifrs-full:GrossCarryingAmountMemberifrs-full:FinancialInstrumentsNotCreditimpairedMember2023-12-310000312069ifrs-full:AccumulatedImpairmentMemberifrs-full:LifetimeExpectedCreditLossesMemberifrs-full:CorporateLoansMemberifrs-full:FinancialInstrumentsNotCreditimpairedMember2023-12-310000312069ifrs-full:LifetimeExpectedCreditLossesMemberifrs-full:CorporateLoansMemberifrs-full:FinancialInstrumentsCreditimpairedMemberifrs-full:GrossCarryingAmountMember2023-12-310000312069ifrs-full:AccumulatedImpairmentMemberifrs-full:LifetimeExpectedCreditLossesMemberifrs-full:CorporateLoansMemberifrs-full:FinancialInstrumentsCreditimpairedMember2023-12-310000312069ifrs-full:CorporateLoansMemberifrs-full:GrossCarryingAmountMember2023-12-310000312069ifrs-full:AccumulatedImpairmentMemberifrs-full:CorporateLoansMember2023-12-310000312069ifrs-full:MortgagesMemberifrs-full:TwelvemonthExpectedCreditLossesMember2023-01-012023-12-310000312069ifrs-full:LifetimeExpectedCreditLossesMemberifrs-full:MortgagesMemberifrs-full:FinancialInstrumentsNotCreditimpairedMember2023-01-012023-12-310000312069ifrs-full:LifetimeExpectedCreditLossesMemberifrs-full:MortgagesMemberifrs-full:FinancialInstrumentsCreditimpairedMember2023-01-012023-12-310000312069ifrs-full:MortgagesMember2023-01-012023-12-310000312069bcs:CreditCardsRetailMemberifrs-full:TwelvemonthExpectedCreditLossesMember2023-01-012023-12-310000312069bcs:CreditCardsRetailMemberifrs-full:LifetimeExpectedCreditLossesMemberifrs-full:FinancialInstrumentsNotCreditimpairedMember2023-01-012023-12-310000312069bcs:CreditCardsRetailMemberifrs-full:LifetimeExpectedCreditLossesMemberifrs-full:FinancialInstrumentsCreditimpairedMember2023-01-012023-12-310000312069bcs:CreditCardsRetailMember2023-01-012023-12-310000312069bcs:OtherRetailMemberifrs-full:TwelvemonthExpectedCreditLossesMember2023-01-012023-12-310000312069ifrs-full:LifetimeExpectedCreditLossesMemberbcs:OtherRetailMemberifrs-full:FinancialInstrumentsNotCreditimpairedMember2023-01-012023-12-310000312069ifrs-full:LifetimeExpectedCreditLossesMemberbcs:OtherRetailMemberifrs-full:FinancialInstrumentsCreditimpairedMember2023-01-012023-12-310000312069bcs:OtherRetailMember2023-01-012023-12-310000312069ifrs-full:CorporateLoansMemberifrs-full:TwelvemonthExpectedCreditLossesMember2023-01-012023-12-310000312069ifrs-full:LifetimeExpectedCreditLossesMemberifrs-full:CorporateLoansMemberifrs-full:FinancialInstrumentsNotCreditimpairedMember2023-01-012023-12-310000312069ifrs-full:LifetimeExpectedCreditLossesMemberifrs-full:CorporateLoansMemberifrs-full:FinancialInstrumentsCreditimpairedMember2023-01-012023-12-310000312069ifrs-full:CorporateLoansMember2023-01-012023-12-310000312069ifrs-full:LoansAndReceivablesCategoryMemberifrs-full:TwelvemonthExpectedCreditLossesMember2023-01-012023-12-310000312069ifrs-full:LifetimeExpectedCreditLossesMemberifrs-full:LoansAndReceivablesCategoryMemberifrs-full:FinancialInstrumentsNotCreditimpairedMember2023-01-012023-12-310000312069ifrs-full:LifetimeExpectedCreditLossesMemberifrs-full:FinancialInstrumentsCreditimpairedMemberifrs-full:LoansAndReceivablesCategoryMember2023-01-012023-12-310000312069ifrs-full:LoansAndReceivablesCategoryMember2023-01-012023-12-310000312069ifrs-full:TwelvemonthExpectedCreditLossesMemberbcs:OffBalanceSheetLoanCommitmentsAndFinancialGuaranteeContractsMember2023-01-012023-12-310000312069ifrs-full:LifetimeExpectedCreditLossesMemberifrs-full:FinancialInstrumentsNotCreditimpairedMemberbcs:OffBalanceSheetLoanCommitmentsAndFinancialGuaranteeContractsMember2023-01-012023-12-310000312069ifrs-full:LifetimeExpectedCreditLossesMemberifrs-full:FinancialInstrumentsCreditimpairedMemberbcs:OffBalanceSheetLoanCommitmentsAndFinancialGuaranteeContractsMember2023-01-012023-12-310000312069bcs:OffBalanceSheetLoanCommitmentsAndFinancialGuaranteeContractsMember2023-01-012023-12-310000312069bcs:OtherFinancialAssetsSubjectToImpairmentMemberifrs-full:TwelvemonthExpectedCreditLossesMember2023-01-012023-12-310000312069ifrs-full:LifetimeExpectedCreditLossesMemberbcs:OtherFinancialAssetsSubjectToImpairmentMemberifrs-full:FinancialInstrumentsNotCreditimpairedMember2023-01-012023-12-310000312069ifrs-full:LifetimeExpectedCreditLossesMemberifrs-full:FinancialInstrumentsCreditimpairedMemberbcs:OtherFinancialAssetsSubjectToImpairmentMember2023-01-012023-12-310000312069bcs:OtherFinancialAssetsSubjectToImpairmentMember2023-01-012023-12-310000312069ifrs-full:DebtSecuritiesMemberifrs-full:TwelvemonthExpectedCreditLossesMember2023-01-012023-12-310000312069ifrs-full:LifetimeExpectedCreditLossesMemberifrs-full:DebtSecuritiesMemberifrs-full:FinancialInstrumentsNotCreditimpairedMember2023-01-012023-12-310000312069ifrs-full:LifetimeExpectedCreditLossesMemberifrs-full:DebtSecuritiesMemberifrs-full:FinancialInstrumentsCreditimpairedMember2023-01-012023-12-310000312069ifrs-full:DebtSecuritiesMember2023-01-012023-12-310000312069ifrs-full:TwelvemonthExpectedCreditLossesMember2023-01-012023-12-310000312069ifrs-full:LifetimeExpectedCreditLossesMemberifrs-full:FinancialInstrumentsNotCreditimpairedMember2023-01-012023-12-310000312069ifrs-full:LifetimeExpectedCreditLossesMemberifrs-full:FinancialInstrumentsCreditimpairedMember2023-01-012023-12-310000312069ifrs-full:AccumulatedImpairmentMemberifrs-full:CorporateLoansMemberifrs-full:FinancialAssetsAtAmortisedCostMemberbcs:CorporateAndInvestmentBankMember2023-01-012023-12-310000312069ifrs-full:AccumulatedImpairmentMemberifrs-full:CorporateLoansMemberifrs-full:FinancialAssetsAtAmortisedCostMemberbcs:BarclaycardPaymentsMember2023-01-012023-12-310000312069ifrs-full:AccumulatedImpairmentMemberifrs-full:CorporateLoansMemberifrs-full:LoansToGovernmentMember2023-01-012023-12-310000312069ifrs-full:DebtSecuritiesMemberifrs-full:CorporateLoansMemberifrs-full:GrossCarryingAmountMember2023-01-012023-12-310000312069ifrs-full:FinancialAssetsAtAmortisedCostMemberifrs-full:LoansAndReceivablesCategoryMember2023-01-012023-12-310000312069ifrs-full:FinancialAssetsAtAmortisedCostMemberifrs-full:LoansAndReceivablesCategoryMember2022-01-012022-12-310000312069ifrs-full:FinancialGuaranteeContractsMember2023-01-012023-12-310000312069bcs:OffBalanceSheetLoanCommitmentsAndFinancialGuaranteeContractsMemberifrs-full:MortgagesMemberifrs-full:GrossCarryingAmountMemberifrs-full:TwelvemonthExpectedCreditLossesMember2022-12-310000312069ifrs-full:AccumulatedImpairmentMemberbcs:OffBalanceSheetLoanCommitmentsAndFinancialGuaranteeContractsMemberifrs-full:MortgagesMemberifrs-full:TwelvemonthExpectedCreditLossesMember2022-12-310000312069bcs:OffBalanceSheetLoanCommitmentsAndFinancialGuaranteeContractsMemberifrs-full:LifetimeExpectedCreditLossesMemberifrs-full:MortgagesMemberifrs-full:GrossCarryingAmountMemberifrs-full:FinancialInstrumentsNotCreditimpairedMember2022-12-310000312069bcs:OffBalanceSheetLoanCommitmentsAndFinancialGuaranteeContractsMemberifrs-full:AccumulatedImpairmentMemberifrs-full:LifetimeExpectedCreditLossesMemberifrs-full:MortgagesMemberifrs-full:FinancialInstrumentsNotCreditimpairedMember2022-12-310000312069bcs:OffBalanceSheetLoanCommitmentsAndFinancialGuaranteeContractsMemberifrs-full:LifetimeExpectedCreditLossesMemberifrs-full:MortgagesMemberifrs-full:FinancialInstrumentsCreditimpairedMemberifrs-full:GrossCarryingAmountMember2022-12-310000312069bcs:OffBalanceSheetLoanCommitmentsAndFinancialGuaranteeContractsMemberifrs-full:AccumulatedImpairmentMemberifrs-full:LifetimeExpectedCreditLossesMemberifrs-full:MortgagesMemberifrs-full:FinancialInstrumentsCreditimpairedMember2022-12-310000312069bcs:OffBalanceSheetLoanCommitmentsAndFinancialGuaranteeContractsMemberifrs-full:MortgagesMemberifrs-full:GrossCarryingAmountMember2022-12-310000312069ifrs-full:AccumulatedImpairmentMemberbcs:OffBalanceSheetLoanCommitmentsAndFinancialGuaranteeContractsMemberifrs-full:MortgagesMember2022-12-310000312069bcs:OffBalanceSheetLoanCommitmentsAndFinancialGuaranteeContractsMemberifrs-full:MortgagesMemberifrs-full:GrossCarryingAmountMemberifrs-full:TwelvemonthExpectedCreditLossesMember2023-01-012023-12-310000312069ifrs-full:AccumulatedImpairmentMemberbcs:OffBalanceSheetLoanCommitmentsAndFinancialGuaranteeContractsMemberifrs-full:MortgagesMemberifrs-full:TwelvemonthExpectedCreditLossesMember2023-01-012023-12-310000312069bcs:OffBalanceSheetLoanCommitmentsAndFinancialGuaranteeContractsMemberifrs-full:LifetimeExpectedCreditLossesMemberifrs-full:MortgagesMemberifrs-full:GrossCarryingAmountMemberifrs-full:FinancialInstrumentsNotCreditimpairedMember2023-01-012023-12-310000312069bcs:OffBalanceSheetLoanCommitmentsAndFinancialGuaranteeContractsMemberifrs-full:AccumulatedImpairmentMemberifrs-full:LifetimeExpectedCreditLossesMemberifrs-full:MortgagesMemberifrs-full:FinancialInstrumentsNotCreditimpairedMember2023-01-012023-12-310000312069bcs:OffBalanceSheetLoanCommitmentsAndFinancialGuaranteeContractsMemberifrs-full:LifetimeExpectedCreditLossesMemberifrs-full:MortgagesMemberifrs-full:FinancialInstrumentsCreditimpairedMemberifrs-full:GrossCarryingAmountMember2023-01-012023-12-310000312069bcs:OffBalanceSheetLoanCommitmentsAndFinancialGuaranteeContractsMemberifrs-full:AccumulatedImpairmentMemberifrs-full:LifetimeExpectedCreditLossesMemberifrs-full:MortgagesMemberifrs-full:FinancialInstrumentsCreditimpairedMember2023-01-012023-12-310000312069bcs:OffBalanceSheetLoanCommitmentsAndFinancialGuaranteeContractsMemberifrs-full:MortgagesMemberifrs-full:GrossCarryingAmountMember2023-01-012023-12-310000312069ifrs-full:AccumulatedImpairmentMemberbcs:OffBalanceSheetLoanCommitmentsAndFinancialGuaranteeContractsMemberifrs-full:MortgagesMember2023-01-012023-12-310000312069bcs:OffBalanceSheetLoanCommitmentsAndFinancialGuaranteeContractsMemberifrs-full:MortgagesMemberifrs-full:GrossCarryingAmountMemberifrs-full:TwelvemonthExpectedCreditLossesMember2023-12-310000312069ifrs-full:AccumulatedImpairmentMemberbcs:OffBalanceSheetLoanCommitmentsAndFinancialGuaranteeContractsMemberifrs-full:MortgagesMemberifrs-full:TwelvemonthExpectedCreditLossesMember2023-12-310000312069bcs:OffBalanceSheetLoanCommitmentsAndFinancialGuaranteeContractsMemberifrs-full:LifetimeExpectedCreditLossesMemberifrs-full:MortgagesMemberifrs-full:GrossCarryingAmountMemberifrs-full:FinancialInstrumentsNotCreditimpairedMember2023-12-310000312069bcs:OffBalanceSheetLoanCommitmentsAndFinancialGuaranteeContractsMemberifrs-full:AccumulatedImpairmentMemberifrs-full:LifetimeExpectedCreditLossesMemberifrs-full:MortgagesMemberifrs-full:FinancialInstrumentsNotCreditimpairedMember2023-12-310000312069bcs:OffBalanceSheetLoanCommitmentsAndFinancialGuaranteeContractsMemberifrs-full:LifetimeExpectedCreditLossesMemberifrs-full:MortgagesMemberifrs-full:FinancialInstrumentsCreditimpairedMemberifrs-full:GrossCarryingAmountMember2023-12-310000312069bcs:OffBalanceSheetLoanCommitmentsAndFinancialGuaranteeContractsMemberifrs-full:AccumulatedImpairmentMemberifrs-full:LifetimeExpectedCreditLossesMemberifrs-full:MortgagesMemberifrs-full:FinancialInstrumentsCreditimpairedMember2023-12-310000312069bcs:OffBalanceSheetLoanCommitmentsAndFinancialGuaranteeContractsMemberifrs-full:MortgagesMemberifrs-full:GrossCarryingAmountMember2023-12-310000312069ifrs-full:AccumulatedImpairmentMemberbcs:OffBalanceSheetLoanCommitmentsAndFinancialGuaranteeContractsMemberifrs-full:MortgagesMember2023-12-310000312069bcs:CreditCardsRetailMemberbcs:OffBalanceSheetLoanCommitmentsAndFinancialGuaranteeContractsMemberifrs-full:GrossCarryingAmountMemberifrs-full:TwelvemonthExpectedCreditLossesMember2022-12-310000312069bcs:CreditCardsRetailMemberifrs-full:AccumulatedImpairmentMemberbcs:OffBalanceSheetLoanCommitmentsAndFinancialGuaranteeContractsMemberifrs-full:TwelvemonthExpectedCreditLossesMember2022-12-310000312069bcs:CreditCardsRetailMemberbcs:OffBalanceSheetLoanCommitmentsAndFinancialGuaranteeContractsMemberifrs-full:LifetimeExpectedCreditLossesMemberifrs-full:GrossCarryingAmountMemberifrs-full:FinancialInstrumentsNotCreditimpairedMember2022-12-310000312069bcs:CreditCardsRetailMemberbcs:OffBalanceSheetLoanCommitmentsAndFinancialGuaranteeContractsMemberifrs-full:AccumulatedImpairmentMemberifrs-full:LifetimeExpectedCreditLossesMemberifrs-full:FinancialInstrumentsNotCreditimpairedMember2022-12-310000312069bcs:CreditCardsRetailMemberbcs:OffBalanceSheetLoanCommitmentsAndFinancialGuaranteeContractsMemberifrs-full:LifetimeExpectedCreditLossesMemberifrs-full:FinancialInstrumentsCreditimpairedMemberifrs-full:GrossCarryingAmountMember2022-12-310000312069bcs:CreditCardsRetailMemberbcs:OffBalanceSheetLoanCommitmentsAndFinancialGuaranteeContractsMemberifrs-full:AccumulatedImpairmentMemberifrs-full:LifetimeExpectedCreditLossesMemberifrs-full:FinancialInstrumentsCreditimpairedMember2022-12-310000312069bcs:CreditCardsRetailMemberbcs:OffBalanceSheetLoanCommitmentsAndFinancialGuaranteeContractsMemberifrs-full:GrossCarryingAmountMember2022-12-310000312069bcs:CreditCardsRetailMemberifrs-full:AccumulatedImpairmentMemberbcs:OffBalanceSheetLoanCommitmentsAndFinancialGuaranteeContractsMember2022-12-310000312069bcs:CreditCardsRetailMemberbcs:OffBalanceSheetLoanCommitmentsAndFinancialGuaranteeContractsMemberifrs-full:GrossCarryingAmountMemberifrs-full:TwelvemonthExpectedCreditLossesMember2023-01-012023-12-310000312069bcs:CreditCardsRetailMemberifrs-full:AccumulatedImpairmentMemberbcs:OffBalanceSheetLoanCommitmentsAndFinancialGuaranteeContractsMemberifrs-full:TwelvemonthExpectedCreditLossesMember2023-01-012023-12-310000312069bcs:CreditCardsRetailMemberbcs:OffBalanceSheetLoanCommitmentsAndFinancialGuaranteeContractsMemberifrs-full:LifetimeExpectedCreditLossesMemberifrs-full:GrossCarryingAmountMemberifrs-full:FinancialInstrumentsNotCreditimpairedMember2023-01-012023-12-310000312069bcs:CreditCardsRetailMemberbcs:OffBalanceSheetLoanCommitmentsAndFinancialGuaranteeContractsMemberifrs-full:AccumulatedImpairmentMemberifrs-full:LifetimeExpectedCreditLossesMemberifrs-full:FinancialInstrumentsNotCreditimpairedMember2023-01-012023-12-310000312069bcs:CreditCardsRetailMemberbcs:OffBalanceSheetLoanCommitmentsAndFinancialGuaranteeContractsMemberifrs-full:LifetimeExpectedCreditLossesMemberifrs-full:FinancialInstrumentsCreditimpairedMemberifrs-full:GrossCarryingAmountMember2023-01-012023-12-310000312069bcs:CreditCardsRetailMemberbcs:OffBalanceSheetLoanCommitmentsAndFinancialGuaranteeContractsMemberifrs-full:AccumulatedImpairmentMemberifrs-full:LifetimeExpectedCreditLossesMemberifrs-full:FinancialInstrumentsCreditimpairedMember2023-01-012023-12-310000312069bcs:CreditCardsRetailMemberbcs:OffBalanceSheetLoanCommitmentsAndFinancialGuaranteeContractsMemberifrs-full:GrossCarryingAmountMember2023-01-012023-12-310000312069bcs:CreditCardsRetailMemberifrs-full:AccumulatedImpairmentMemberbcs:OffBalanceSheetLoanCommitmentsAndFinancialGuaranteeContractsMember2023-01-012023-12-310000312069bcs:CreditCardsRetailMemberbcs:OffBalanceSheetLoanCommitmentsAndFinancialGuaranteeContractsMemberifrs-full:GrossCarryingAmountMemberifrs-full:TwelvemonthExpectedCreditLossesMember2023-12-310000312069bcs:CreditCardsRetailMemberifrs-full:AccumulatedImpairmentMemberbcs:OffBalanceSheetLoanCommitmentsAndFinancialGuaranteeContractsMemberifrs-full:TwelvemonthExpectedCreditLossesMember2023-12-310000312069bcs:CreditCardsRetailMemberbcs:OffBalanceSheetLoanCommitmentsAndFinancialGuaranteeContractsMemberifrs-full:LifetimeExpectedCreditLossesMemberifrs-full:GrossCarryingAmountMemberifrs-full:FinancialInstrumentsNotCreditimpairedMember2023-12-310000312069bcs:CreditCardsRetailMemberbcs:OffBalanceSheetLoanCommitmentsAndFinancialGuaranteeContractsMemberifrs-full:AccumulatedImpairmentMemberifrs-full:LifetimeExpectedCreditLossesMemberifrs-full:FinancialInstrumentsNotCreditimpairedMember2023-12-310000312069bcs:CreditCardsRetailMemberbcs:OffBalanceSheetLoanCommitmentsAndFinancialGuaranteeContractsMemberifrs-full:LifetimeExpectedCreditLossesMemberifrs-full:FinancialInstrumentsCreditimpairedMemberifrs-full:GrossCarryingAmountMember2023-12-310000312069bcs:CreditCardsRetailMemberbcs:OffBalanceSheetLoanCommitmentsAndFinancialGuaranteeContractsMemberifrs-full:AccumulatedImpairmentMemberifrs-full:LifetimeExpectedCreditLossesMemberifrs-full:FinancialInstrumentsCreditimpairedMember2023-12-310000312069bcs:CreditCardsRetailMemberbcs:OffBalanceSheetLoanCommitmentsAndFinancialGuaranteeContractsMemberifrs-full:GrossCarryingAmountMember2023-12-310000312069bcs:CreditCardsRetailMemberifrs-full:AccumulatedImpairmentMemberbcs:OffBalanceSheetLoanCommitmentsAndFinancialGuaranteeContractsMember2023-12-310000312069bcs:OffBalanceSheetLoanCommitmentsAndFinancialGuaranteeContractsMemberbcs:OtherRetailMemberifrs-full:GrossCarryingAmountMemberifrs-full:TwelvemonthExpectedCreditLossesMember2022-12-310000312069ifrs-full:AccumulatedImpairmentMemberbcs:OffBalanceSheetLoanCommitmentsAndFinancialGuaranteeContractsMemberbcs:OtherRetailMemberifrs-full:TwelvemonthExpectedCreditLossesMember2022-12-310000312069bcs:OffBalanceSheetLoanCommitmentsAndFinancialGuaranteeContractsMemberifrs-full:LifetimeExpectedCreditLossesMemberbcs:OtherRetailMemberifrs-full:GrossCarryingAmountMemberifrs-full:FinancialInstrumentsNotCreditimpairedMember2022-12-310000312069bcs:OffBalanceSheetLoanCommitmentsAndFinancialGuaranteeContractsMemberifrs-full:AccumulatedImpairmentMemberifrs-full:LifetimeExpectedCreditLossesMemberbcs:OtherRetailMemberifrs-full:FinancialInstrumentsNotCreditimpairedMember2022-12-310000312069bcs:OffBalanceSheetLoanCommitmentsAndFinancialGuaranteeContractsMemberifrs-full:LifetimeExpectedCreditLossesMemberbcs:OtherRetailMemberifrs-full:FinancialInstrumentsCreditimpairedMemberifrs-full:GrossCarryingAmountMember2022-12-310000312069bcs:OffBalanceSheetLoanCommitmentsAndFinancialGuaranteeContractsMemberifrs-full:AccumulatedImpairmentMemberifrs-full:LifetimeExpectedCreditLossesMemberbcs:OtherRetailMemberifrs-full:FinancialInstrumentsCreditimpairedMember2022-12-310000312069bcs:OffBalanceSheetLoanCommitmentsAndFinancialGuaranteeContractsMemberbcs:OtherRetailMemberifrs-full:GrossCarryingAmountMember2022-12-310000312069ifrs-full:AccumulatedImpairmentMemberbcs:OffBalanceSheetLoanCommitmentsAndFinancialGuaranteeContractsMemberbcs:OtherRetailMember2022-12-310000312069bcs:OffBalanceSheetLoanCommitmentsAndFinancialGuaranteeContractsMemberbcs:OtherRetailMemberifrs-full:GrossCarryingAmountMemberifrs-full:TwelvemonthExpectedCreditLossesMember2023-01-012023-12-310000312069ifrs-full:AccumulatedImpairmentMemberbcs:OffBalanceSheetLoanCommitmentsAndFinancialGuaranteeContractsMemberbcs:OtherRetailMemberifrs-full:TwelvemonthExpectedCreditLossesMember2023-01-012023-12-310000312069bcs:OffBalanceSheetLoanCommitmentsAndFinancialGuaranteeContractsMemberifrs-full:LifetimeExpectedCreditLossesMemberbcs:OtherRetailMemberifrs-full:GrossCarryingAmountMemberifrs-full:FinancialInstrumentsNotCreditimpairedMember2023-01-012023-12-310000312069bcs:OffBalanceSheetLoanCommitmentsAndFinancialGuaranteeContractsMemberifrs-full:AccumulatedImpairmentMemberifrs-full:LifetimeExpectedCreditLossesMemberbcs:OtherRetailMemberifrs-full:FinancialInstrumentsNotCreditimpairedMember2023-01-012023-12-310000312069bcs:OffBalanceSheetLoanCommitmentsAndFinancialGuaranteeContractsMemberifrs-full:LifetimeExpectedCreditLossesMemberbcs:OtherRetailMemberifrs-full:FinancialInstrumentsCreditimpairedMemberifrs-full:GrossCarryingAmountMember2023-01-012023-12-310000312069bcs:OffBalanceSheetLoanCommitmentsAndFinancialGuaranteeContractsMemberifrs-full:AccumulatedImpairmentMemberifrs-full:LifetimeExpectedCreditLossesMemberbcs:OtherRetailMemberifrs-full:FinancialInstrumentsCreditimpairedMember2023-01-012023-12-310000312069bcs:OffBalanceSheetLoanCommitmentsAndFinancialGuaranteeContractsMemberifrs-full:GrossCarryingAmountMember2023-01-012023-12-310000312069ifrs-full:AccumulatedImpairmentMemberbcs:OffBalanceSheetLoanCommitmentsAndFinancialGuaranteeContractsMember2023-01-012023-12-310000312069bcs:OffBalanceSheetLoanCommitmentsAndFinancialGuaranteeContractsMemberbcs:OtherRetailMemberifrs-full:GrossCarryingAmountMember2023-01-012023-12-310000312069ifrs-full:AccumulatedImpairmentMemberbcs:OffBalanceSheetLoanCommitmentsAndFinancialGuaranteeContractsMemberbcs:OtherRetailMember2023-01-012023-12-310000312069bcs:OffBalanceSheetLoanCommitmentsAndFinancialGuaranteeContractsMemberbcs:OtherRetailMemberifrs-full:GrossCarryingAmountMemberifrs-full:TwelvemonthExpectedCreditLossesMember2023-12-310000312069ifrs-full:AccumulatedImpairmentMemberbcs:OffBalanceSheetLoanCommitmentsAndFinancialGuaranteeContractsMemberbcs:OtherRetailMemberifrs-full:TwelvemonthExpectedCreditLossesMember2023-12-310000312069bcs:OffBalanceSheetLoanCommitmentsAndFinancialGuaranteeContractsMemberifrs-full:LifetimeExpectedCreditLossesMemberbcs:OtherRetailMemberifrs-full:GrossCarryingAmountMemberifrs-full:FinancialInstrumentsNotCreditimpairedMember2023-12-310000312069bcs:OffBalanceSheetLoanCommitmentsAndFinancialGuaranteeContractsMemberifrs-full:AccumulatedImpairmentMemberifrs-full:LifetimeExpectedCreditLossesMemberbcs:OtherRetailMemberifrs-full:FinancialInstrumentsNotCreditimpairedMember2023-12-310000312069bcs:OffBalanceSheetLoanCommitmentsAndFinancialGuaranteeContractsMemberifrs-full:LifetimeExpectedCreditLossesMemberbcs:OtherRetailMemberifrs-full:FinancialInstrumentsCreditimpairedMemberifrs-full:GrossCarryingAmountMember2023-12-310000312069bcs:OffBalanceSheetLoanCommitmentsAndFinancialGuaranteeContractsMemberifrs-full:AccumulatedImpairmentMemberifrs-full:LifetimeExpectedCreditLossesMemberbcs:OtherRetailMemberifrs-full:FinancialInstrumentsCreditimpairedMember2023-12-310000312069bcs:OffBalanceSheetLoanCommitmentsAndFinancialGuaranteeContractsMemberbcs:OtherRetailMemberifrs-full:GrossCarryingAmountMember2023-12-310000312069ifrs-full:AccumulatedImpairmentMemberbcs:OffBalanceSheetLoanCommitmentsAndFinancialGuaranteeContractsMemberbcs:OtherRetailMember2023-12-310000312069bcs:OffBalanceSheetLoanCommitmentsAndFinancialGuaranteeContractsMemberifrs-full:CorporateLoansMemberifrs-full:GrossCarryingAmountMemberifrs-full:TwelvemonthExpectedCreditLossesMember2022-12-310000312069ifrs-full:AccumulatedImpairmentMemberbcs:OffBalanceSheetLoanCommitmentsAndFinancialGuaranteeContractsMemberifrs-full:CorporateLoansMemberifrs-full:TwelvemonthExpectedCreditLossesMember2022-12-310000312069bcs:OffBalanceSheetLoanCommitmentsAndFinancialGuaranteeContractsMemberifrs-full:LifetimeExpectedCreditLossesMemberifrs-full:CorporateLoansMemberifrs-full:GrossCarryingAmountMemberifrs-full:FinancialInstrumentsNotCreditimpairedMember2022-12-310000312069bcs:OffBalanceSheetLoanCommitmentsAndFinancialGuaranteeContractsMemberifrs-full:AccumulatedImpairmentMemberifrs-full:LifetimeExpectedCreditLossesMemberifrs-full:CorporateLoansMemberifrs-full:FinancialInstrumentsNotCreditimpairedMember2022-12-310000312069bcs:OffBalanceSheetLoanCommitmentsAndFinancialGuaranteeContractsMemberifrs-full:LifetimeExpectedCreditLossesMemberifrs-full:CorporateLoansMemberifrs-full:FinancialInstrumentsCreditimpairedMemberifrs-full:GrossCarryingAmountMember2022-12-310000312069bcs:OffBalanceSheetLoanCommitmentsAndFinancialGuaranteeContractsMemberifrs-full:AccumulatedImpairmentMemberifrs-full:LifetimeExpectedCreditLossesMemberifrs-full:CorporateLoansMemberifrs-full:FinancialInstrumentsCreditimpairedMember2022-12-310000312069bcs:OffBalanceSheetLoanCommitmentsAndFinancialGuaranteeContractsMemberifrs-full:CorporateLoansMemberifrs-full:GrossCarryingAmountMember2022-12-310000312069ifrs-full:AccumulatedImpairmentMemberbcs:OffBalanceSheetLoanCommitmentsAndFinancialGuaranteeContractsMemberifrs-full:CorporateLoansMember2022-12-310000312069bcs:OffBalanceSheetLoanCommitmentsAndFinancialGuaranteeContractsMemberifrs-full:CorporateLoansMemberifrs-full:GrossCarryingAmountMemberifrs-full:TwelvemonthExpectedCreditLossesMember2023-01-012023-12-310000312069ifrs-full:AccumulatedImpairmentMemberbcs:OffBalanceSheetLoanCommitmentsAndFinancialGuaranteeContractsMemberifrs-full:CorporateLoansMemberifrs-full:TwelvemonthExpectedCreditLossesMember2023-01-012023-12-310000312069bcs:OffBalanceSheetLoanCommitmentsAndFinancialGuaranteeContractsMemberifrs-full:LifetimeExpectedCreditLossesMemberifrs-full:CorporateLoansMemberifrs-full:GrossCarryingAmountMemberifrs-full:FinancialInstrumentsNotCreditimpairedMember2023-01-012023-12-310000312069bcs:OffBalanceSheetLoanCommitmentsAndFinancialGuaranteeContractsMemberifrs-full:AccumulatedImpairmentMemberifrs-full:LifetimeExpectedCreditLossesMemberifrs-full:CorporateLoansMemberifrs-full:FinancialInstrumentsNotCreditimpairedMember2023-01-012023-12-310000312069bcs:OffBalanceSheetLoanCommitmentsAndFinancialGuaranteeContractsMemberifrs-full:LifetimeExpectedCreditLossesMemberifrs-full:CorporateLoansMemberifrs-full:FinancialInstrumentsCreditimpairedMemberifrs-full:GrossCarryingAmountMember2023-01-012023-12-310000312069bcs:OffBalanceSheetLoanCommitmentsAndFinancialGuaranteeContractsMemberifrs-full:AccumulatedImpairmentMemberifrs-full:LifetimeExpectedCreditLossesMemberifrs-full:CorporateLoansMemberifrs-full:FinancialInstrumentsCreditimpairedMember2023-01-012023-12-310000312069bcs:OffBalanceSheetLoanCommitmentsAndFinancialGuaranteeContractsMemberifrs-full:CorporateLoansMemberifrs-full:GrossCarryingAmountMember2023-01-012023-12-310000312069ifrs-full:AccumulatedImpairmentMemberbcs:OffBalanceSheetLoanCommitmentsAndFinancialGuaranteeContractsMemberifrs-full:CorporateLoansMember2023-01-012023-12-310000312069bcs:OffBalanceSheetLoanCommitmentsAndFinancialGuaranteeContractsMemberifrs-full:CorporateLoansMemberifrs-full:GrossCarryingAmountMemberifrs-full:TwelvemonthExpectedCreditLossesMember2023-12-310000312069ifrs-full:AccumulatedImpairmentMemberbcs:OffBalanceSheetLoanCommitmentsAndFinancialGuaranteeContractsMemberifrs-full:CorporateLoansMemberifrs-full:TwelvemonthExpectedCreditLossesMember2023-12-310000312069bcs:OffBalanceSheetLoanCommitmentsAndFinancialGuaranteeContractsMemberifrs-full:LifetimeExpectedCreditLossesMemberifrs-full:CorporateLoansMemberifrs-full:GrossCarryingAmountMemberifrs-full:FinancialInstrumentsNotCreditimpairedMember2023-12-310000312069bcs:OffBalanceSheetLoanCommitmentsAndFinancialGuaranteeContractsMemberifrs-full:AccumulatedImpairmentMemberifrs-full:LifetimeExpectedCreditLossesMemberifrs-full:CorporateLoansMemberifrs-full:FinancialInstrumentsNotCreditimpairedMember2023-12-310000312069bcs:OffBalanceSheetLoanCommitmentsAndFinancialGuaranteeContractsMemberifrs-full:LifetimeExpectedCreditLossesMemberifrs-full:CorporateLoansMemberifrs-full:FinancialInstrumentsCreditimpairedMemberifrs-full:GrossCarryingAmountMember2023-12-310000312069bcs:OffBalanceSheetLoanCommitmentsAndFinancialGuaranteeContractsMemberifrs-full:AccumulatedImpairmentMemberifrs-full:LifetimeExpectedCreditLossesMemberifrs-full:CorporateLoansMemberifrs-full:FinancialInstrumentsCreditimpairedMember2023-12-310000312069bcs:OffBalanceSheetLoanCommitmentsAndFinancialGuaranteeContractsMemberifrs-full:CorporateLoansMemberifrs-full:GrossCarryingAmountMember2023-12-310000312069ifrs-full:AccumulatedImpairmentMemberbcs:OffBalanceSheetLoanCommitmentsAndFinancialGuaranteeContractsMemberifrs-full:CorporateLoansMember2023-12-310000312069ifrs-full:MortgagesMemberifrs-full:GrossCarryingAmountMemberifrs-full:TwelvemonthExpectedCreditLossesMember2021-12-310000312069ifrs-full:AccumulatedImpairmentMemberifrs-full:MortgagesMemberifrs-full:TwelvemonthExpectedCreditLossesMember2021-12-310000312069ifrs-full:LifetimeExpectedCreditLossesMemberifrs-full:MortgagesMemberifrs-full:GrossCarryingAmountMemberifrs-full:FinancialInstrumentsNotCreditimpairedMember2021-12-310000312069ifrs-full:AccumulatedImpairmentMemberifrs-full:LifetimeExpectedCreditLossesMemberifrs-full:MortgagesMemberifrs-full:FinancialInstrumentsNotCreditimpairedMember2021-12-310000312069ifrs-full:LifetimeExpectedCreditLossesMemberifrs-full:MortgagesMemberifrs-full:FinancialInstrumentsCreditimpairedMemberifrs-full:GrossCarryingAmountMember2021-12-310000312069ifrs-full:AccumulatedImpairmentMemberifrs-full:LifetimeExpectedCreditLossesMemberifrs-full:MortgagesMemberifrs-full:FinancialInstrumentsCreditimpairedMember2021-12-310000312069ifrs-full:MortgagesMemberifrs-full:GrossCarryingAmountMember2021-12-310000312069ifrs-full:AccumulatedImpairmentMemberifrs-full:MortgagesMember2021-12-310000312069bcs:TransfersFromStage1ToStage2Memberifrs-full:MortgagesMemberifrs-full:GrossCarryingAmountMemberifrs-full:TwelvemonthExpectedCreditLossesMember2022-01-012022-12-310000312069ifrs-full:AccumulatedImpairmentMemberbcs:TransfersFromStage1ToStage2Memberifrs-full:MortgagesMemberifrs-full:TwelvemonthExpectedCreditLossesMember2022-01-012022-12-310000312069ifrs-full:LifetimeExpectedCreditLossesMemberbcs:TransfersFromStage1ToStage2Memberifrs-full:MortgagesMemberifrs-full:GrossCarryingAmountMemberifrs-full:FinancialInstrumentsNotCreditimpairedMember2022-01-012022-12-310000312069ifrs-full:AccumulatedImpairmentMemberifrs-full:LifetimeExpectedCreditLossesMemberbcs:TransfersFromStage1ToStage2Memberifrs-full:MortgagesMemberifrs-full:FinancialInstrumentsNotCreditimpairedMember2022-01-012022-12-310000312069ifrs-full:LifetimeExpectedCreditLossesMemberbcs:TransfersFromStage1ToStage2Memberifrs-full:MortgagesMemberifrs-full:FinancialInstrumentsCreditimpairedMemberifrs-full:GrossCarryingAmountMember2022-01-012022-12-310000312069ifrs-full:AccumulatedImpairmentMemberifrs-full:LifetimeExpectedCreditLossesMemberbcs:TransfersFromStage1ToStage2Memberifrs-full:MortgagesMemberifrs-full:FinancialInstrumentsCreditimpairedMember2022-01-012022-12-310000312069bcs:TransfersFromStage1ToStage2Memberifrs-full:MortgagesMemberifrs-full:GrossCarryingAmountMember2022-01-012022-12-310000312069ifrs-full:AccumulatedImpairmentMemberbcs:TransfersFromStage1ToStage2Memberifrs-full:MortgagesMember2022-01-012022-12-310000312069bcs:TransfersFromStage2ToStage1Memberifrs-full:MortgagesMemberifrs-full:GrossCarryingAmountMemberifrs-full:TwelvemonthExpectedCreditLossesMember2022-01-012022-12-310000312069ifrs-full:AccumulatedImpairmentMemberbcs:TransfersFromStage2ToStage1Memberifrs-full:MortgagesMemberifrs-full:TwelvemonthExpectedCreditLossesMember2022-01-012022-12-310000312069ifrs-full:LifetimeExpectedCreditLossesMemberbcs:TransfersFromStage2ToStage1Memberifrs-full:MortgagesMemberifrs-full:GrossCarryingAmountMemberifrs-full:FinancialInstrumentsNotCreditimpairedMember2022-01-012022-12-310000312069ifrs-full:AccumulatedImpairmentMemberifrs-full:LifetimeExpectedCreditLossesMemberbcs:TransfersFromStage2ToStage1Memberifrs-full:MortgagesMemberifrs-full:FinancialInstrumentsNotCreditimpairedMember2022-01-012022-12-310000312069ifrs-full:LifetimeExpectedCreditLossesMemberbcs:TransfersFromStage2ToStage1Memberifrs-full:MortgagesMemberifrs-full:FinancialInstrumentsCreditimpairedMemberifrs-full:GrossCarryingAmountMember2022-01-012022-12-310000312069ifrs-full:AccumulatedImpairmentMemberifrs-full:LifetimeExpectedCreditLossesMemberbcs:TransfersFromStage2ToStage1Memberifrs-full:MortgagesMemberifrs-full:FinancialInstrumentsCreditimpairedMember2022-01-012022-12-310000312069bcs:TransfersFromStage2ToStage1Memberifrs-full:MortgagesMemberifrs-full:GrossCarryingAmountMember2022-01-012022-12-310000312069ifrs-full:AccumulatedImpairmentMemberbcs:TransfersFromStage2ToStage1Memberifrs-full:MortgagesMember2022-01-012022-12-310000312069ifrs-full:MortgagesMemberifrs-full:GrossCarryingAmountMemberbcs:TransfersToStage3Memberifrs-full:TwelvemonthExpectedCreditLossesMember2022-01-012022-12-310000312069ifrs-full:AccumulatedImpairmentMemberifrs-full:MortgagesMemberbcs:TransfersToStage3Memberifrs-full:TwelvemonthExpectedCreditLossesMember2022-01-012022-12-310000312069ifrs-full:LifetimeExpectedCreditLossesMemberifrs-full:MortgagesMemberifrs-full:GrossCarryingAmountMemberifrs-full:FinancialInstrumentsNotCreditimpairedMemberbcs:TransfersToStage3Member2022-01-012022-12-310000312069ifrs-full:AccumulatedImpairmentMemberifrs-full:LifetimeExpectedCreditLossesMemberifrs-full:MortgagesMemberifrs-full:FinancialInstrumentsNotCreditimpairedMemberbcs:TransfersToStage3Member2022-01-012022-12-310000312069ifrs-full:LifetimeExpectedCreditLossesMemberifrs-full:MortgagesMemberifrs-full:FinancialInstrumentsCreditimpairedMemberifrs-full:GrossCarryingAmountMemberbcs:TransfersToStage3Member2022-01-012022-12-310000312069ifrs-full:AccumulatedImpairmentMemberifrs-full:LifetimeExpectedCreditLossesMemberifrs-full:MortgagesMemberifrs-full:FinancialInstrumentsCreditimpairedMemberbcs:TransfersToStage3Member2022-01-012022-12-310000312069ifrs-full:MortgagesMemberifrs-full:GrossCarryingAmountMemberbcs:TransfersToStage3Member2022-01-012022-12-310000312069ifrs-full:AccumulatedImpairmentMemberifrs-full:MortgagesMemberbcs:TransfersToStage3Member2022-01-012022-12-310000312069ifrs-full:MortgagesMemberifrs-full:GrossCarryingAmountMemberbcs:TransfersFromStage3Memberifrs-full:TwelvemonthExpectedCreditLossesMember2022-01-012022-12-310000312069ifrs-full:AccumulatedImpairmentMemberifrs-full:MortgagesMemberbcs:TransfersFromStage3Memberifrs-full:TwelvemonthExpectedCreditLossesMember2022-01-012022-12-310000312069ifrs-full:LifetimeExpectedCreditLossesMemberifrs-full:MortgagesMemberifrs-full:GrossCarryingAmountMemberbcs:TransfersFromStage3Memberifrs-full:FinancialInstrumentsNotCreditimpairedMember2022-01-012022-12-310000312069ifrs-full:AccumulatedImpairmentMemberifrs-full:LifetimeExpectedCreditLossesMemberifrs-full:MortgagesMemberbcs:TransfersFromStage3Memberifrs-full:FinancialInstrumentsNotCreditimpairedMember2022-01-012022-12-310000312069ifrs-full:LifetimeExpectedCreditLossesMemberifrs-full:MortgagesMemberifrs-full:FinancialInstrumentsCreditimpairedMemberifrs-full:GrossCarryingAmountMemberbcs:TransfersFromStage3Member2022-01-012022-12-310000312069ifrs-full:AccumulatedImpairmentMemberifrs-full:LifetimeExpectedCreditLossesMemberifrs-full:MortgagesMemberifrs-full:FinancialInstrumentsCreditimpairedMemberbcs:TransfersFromStage3Member2022-01-012022-12-310000312069ifrs-full:MortgagesMemberifrs-full:GrossCarryingAmountMemberbcs:TransfersFromStage3Member2022-01-012022-12-310000312069ifrs-full:AccumulatedImpairmentMemberifrs-full:MortgagesMemberbcs:TransfersFromStage3Member2022-01-012022-12-310000312069ifrs-full:MortgagesMemberifrs-full:GrossCarryingAmountMemberifrs-full:TwelvemonthExpectedCreditLossesMember2022-01-012022-12-310000312069ifrs-full:AccumulatedImpairmentMemberifrs-full:MortgagesMemberifrs-full:TwelvemonthExpectedCreditLossesMember2022-01-012022-12-310000312069ifrs-full:LifetimeExpectedCreditLossesMemberifrs-full:MortgagesMemberifrs-full:GrossCarryingAmountMemberifrs-full:FinancialInstrumentsNotCreditimpairedMember2022-01-012022-12-310000312069ifrs-full:AccumulatedImpairmentMemberifrs-full:LifetimeExpectedCreditLossesMemberifrs-full:MortgagesMemberifrs-full:FinancialInstrumentsNotCreditimpairedMember2022-01-012022-12-310000312069ifrs-full:LifetimeExpectedCreditLossesMemberifrs-full:MortgagesMemberifrs-full:FinancialInstrumentsCreditimpairedMemberifrs-full:GrossCarryingAmountMember2022-01-012022-12-310000312069ifrs-full:AccumulatedImpairmentMemberifrs-full:LifetimeExpectedCreditLossesMemberifrs-full:MortgagesMemberifrs-full:FinancialInstrumentsCreditimpairedMember2022-01-012022-12-310000312069ifrs-full:MortgagesMemberifrs-full:GrossCarryingAmountMember2022-01-012022-12-310000312069ifrs-full:AccumulatedImpairmentMemberifrs-full:MortgagesMember2022-01-012022-12-310000312069bcs:CreditCardsRetailMemberifrs-full:GrossCarryingAmountMemberifrs-full:TwelvemonthExpectedCreditLossesMember2021-12-310000312069bcs:CreditCardsRetailMemberifrs-full:AccumulatedImpairmentMemberifrs-full:TwelvemonthExpectedCreditLossesMember2021-12-310000312069bcs:CreditCardsRetailMemberifrs-full:LifetimeExpectedCreditLossesMemberifrs-full:GrossCarryingAmountMemberifrs-full:FinancialInstrumentsNotCreditimpairedMember2021-12-310000312069bcs:CreditCardsRetailMemberifrs-full:AccumulatedImpairmentMemberifrs-full:LifetimeExpectedCreditLossesMemberifrs-full:FinancialInstrumentsNotCreditimpairedMember2021-12-310000312069bcs:CreditCardsRetailMemberifrs-full:LifetimeExpectedCreditLossesMemberifrs-full:FinancialInstrumentsCreditimpairedMemberifrs-full:GrossCarryingAmountMember2021-12-310000312069bcs:CreditCardsRetailMemberifrs-full:AccumulatedImpairmentMemberifrs-full:LifetimeExpectedCreditLossesMemberifrs-full:FinancialInstrumentsCreditimpairedMember2021-12-310000312069bcs:CreditCardsRetailMemberifrs-full:GrossCarryingAmountMember2021-12-310000312069bcs:CreditCardsRetailMemberifrs-full:AccumulatedImpairmentMember2021-12-310000312069bcs:CreditCardsRetailMemberbcs:TransfersFromStage1ToStage2Memberifrs-full:GrossCarryingAmountMemberifrs-full:TwelvemonthExpectedCreditLossesMember2022-01-012022-12-310000312069bcs:CreditCardsRetailMemberifrs-full:AccumulatedImpairmentMemberbcs:TransfersFromStage1ToStage2Memberifrs-full:TwelvemonthExpectedCreditLossesMember2022-01-012022-12-310000312069bcs:CreditCardsRetailMemberifrs-full:LifetimeExpectedCreditLossesMemberbcs:TransfersFromStage1ToStage2Memberifrs-full:GrossCarryingAmountMemberifrs-full:FinancialInstrumentsNotCreditimpairedMember2022-01-012022-12-310000312069bcs:CreditCardsRetailMemberifrs-full:AccumulatedImpairmentMemberifrs-full:LifetimeExpectedCreditLossesMemberbcs:TransfersFromStage1ToStage2Memberifrs-full:FinancialInstrumentsNotCreditimpairedMember2022-01-012022-12-310000312069bcs:CreditCardsRetailMemberifrs-full:LifetimeExpectedCreditLossesMemberbcs:TransfersFromStage1ToStage2Memberifrs-full:FinancialInstrumentsCreditimpairedMemberifrs-full:GrossCarryingAmountMember2022-01-012022-12-310000312069bcs:CreditCardsRetailMemberifrs-full:AccumulatedImpairmentMemberifrs-full:LifetimeExpectedCreditLossesMemberbcs:TransfersFromStage1ToStage2Memberifrs-full:FinancialInstrumentsCreditimpairedMember2022-01-012022-12-310000312069bcs:CreditCardsRetailMemberbcs:TransfersFromStage1ToStage2Memberifrs-full:GrossCarryingAmountMember2022-01-012022-12-310000312069bcs:CreditCardsRetailMemberifrs-full:AccumulatedImpairmentMemberbcs:TransfersFromStage1ToStage2Member2022-01-012022-12-310000312069bcs:CreditCardsRetailMemberbcs:TransfersFromStage2ToStage1Memberifrs-full:GrossCarryingAmountMemberifrs-full:TwelvemonthExpectedCreditLossesMember2022-01-012022-12-310000312069bcs:CreditCardsRetailMemberifrs-full:AccumulatedImpairmentMemberbcs:TransfersFromStage2ToStage1Memberifrs-full:TwelvemonthExpectedCreditLossesMember2022-01-012022-12-310000312069bcs:CreditCardsRetailMemberifrs-full:LifetimeExpectedCreditLossesMemberbcs:TransfersFromStage2ToStage1Memberifrs-full:GrossCarryingAmountMemberifrs-full:FinancialInstrumentsNotCreditimpairedMember2022-01-012022-12-310000312069bcs:CreditCardsRetailMemberifrs-full:AccumulatedImpairmentMemberifrs-full:LifetimeExpectedCreditLossesMemberbcs:TransfersFromStage2ToStage1Memberifrs-full:FinancialInstrumentsNotCreditimpairedMember2022-01-012022-12-310000312069bcs:CreditCardsRetailMemberifrs-full:LifetimeExpectedCreditLossesMemberbcs:TransfersFromStage2ToStage1Memberifrs-full:FinancialInstrumentsCreditimpairedMemberifrs-full:GrossCarryingAmountMember2022-01-012022-12-310000312069bcs:CreditCardsRetailMemberifrs-full:AccumulatedImpairmentMemberifrs-full:LifetimeExpectedCreditLossesMemberbcs:TransfersFromStage2ToStage1Memberifrs-full:FinancialInstrumentsCreditimpairedMember2022-01-012022-12-310000312069bcs:CreditCardsRetailMemberbcs:TransfersFromStage2ToStage1Memberifrs-full:GrossCarryingAmountMember2022-01-012022-12-310000312069bcs:CreditCardsRetailMemberifrs-full:AccumulatedImpairmentMemberbcs:TransfersFromStage2ToStage1Member2022-01-012022-12-310000312069bcs:CreditCardsRetailMemberifrs-full:GrossCarryingAmountMemberbcs:TransfersToStage3Memberifrs-full:TwelvemonthExpectedCreditLossesMember2022-01-012022-12-310000312069bcs:CreditCardsRetailMemberifrs-full:AccumulatedImpairmentMemberbcs:TransfersToStage3Memberifrs-full:TwelvemonthExpectedCreditLossesMember2022-01-012022-12-310000312069bcs:CreditCardsRetailMemberifrs-full:LifetimeExpectedCreditLossesMemberifrs-full:GrossCarryingAmountMemberifrs-full:FinancialInstrumentsNotCreditimpairedMemberbcs:TransfersToStage3Member2022-01-012022-12-310000312069bcs:CreditCardsRetailMemberifrs-full:AccumulatedImpairmentMemberifrs-full:LifetimeExpectedCreditLossesMemberifrs-full:FinancialInstrumentsNotCreditimpairedMemberbcs:TransfersToStage3Member2022-01-012022-12-310000312069bcs:CreditCardsRetailMemberifrs-full:LifetimeExpectedCreditLossesMemberifrs-full:FinancialInstrumentsCreditimpairedMemberifrs-full:GrossCarryingAmountMemberbcs:TransfersToStage3Member2022-01-012022-12-310000312069bcs:CreditCardsRetailMemberifrs-full:AccumulatedImpairmentMemberifrs-full:LifetimeExpectedCreditLossesMemberifrs-full:FinancialInstrumentsCreditimpairedMemberbcs:TransfersToStage3Member2022-01-012022-12-310000312069bcs:CreditCardsRetailMemberifrs-full:GrossCarryingAmountMemberbcs:TransfersToStage3Member2022-01-012022-12-310000312069bcs:CreditCardsRetailMemberifrs-full:AccumulatedImpairmentMemberbcs:TransfersToStage3Member2022-01-012022-12-310000312069bcs:CreditCardsRetailMemberifrs-full:GrossCarryingAmountMemberbcs:TransfersFromStage3Memberifrs-full:TwelvemonthExpectedCreditLossesMember2022-01-012022-12-310000312069bcs:CreditCardsRetailMemberifrs-full:AccumulatedImpairmentMemberbcs:TransfersFromStage3Memberifrs-full:TwelvemonthExpectedCreditLossesMember2022-01-012022-12-310000312069bcs:CreditCardsRetailMemberifrs-full:LifetimeExpectedCreditLossesMemberifrs-full:GrossCarryingAmountMemberbcs:TransfersFromStage3Memberifrs-full:FinancialInstrumentsNotCreditimpairedMember2022-01-012022-12-310000312069bcs:CreditCardsRetailMemberifrs-full:AccumulatedImpairmentMemberifrs-full:LifetimeExpectedCreditLossesMemberbcs:TransfersFromStage3Memberifrs-full:FinancialInstrumentsNotCreditimpairedMember2022-01-012022-12-310000312069bcs:CreditCardsRetailMemberifrs-full:LifetimeExpectedCreditLossesMemberifrs-full:FinancialInstrumentsCreditimpairedMemberifrs-full:GrossCarryingAmountMemberbcs:TransfersFromStage3Member2022-01-012022-12-310000312069bcs:CreditCardsRetailMemberifrs-full:AccumulatedImpairmentMemberifrs-full:LifetimeExpectedCreditLossesMemberifrs-full:FinancialInstrumentsCreditimpairedMemberbcs:TransfersFromStage3Member2022-01-012022-12-310000312069bcs:CreditCardsRetailMemberifrs-full:GrossCarryingAmountMemberbcs:TransfersFromStage3Member2022-01-012022-12-310000312069bcs:CreditCardsRetailMemberifrs-full:AccumulatedImpairmentMemberbcs:TransfersFromStage3Member2022-01-012022-12-310000312069bcs:CreditCardsRetailMemberifrs-full:GrossCarryingAmountMemberifrs-full:TwelvemonthExpectedCreditLossesMember2022-01-012022-12-310000312069bcs:CreditCardsRetailMemberifrs-full:AccumulatedImpairmentMemberifrs-full:TwelvemonthExpectedCreditLossesMember2022-01-012022-12-310000312069bcs:CreditCardsRetailMemberifrs-full:LifetimeExpectedCreditLossesMemberifrs-full:GrossCarryingAmountMemberifrs-full:FinancialInstrumentsNotCreditimpairedMember2022-01-012022-12-310000312069bcs:CreditCardsRetailMemberifrs-full:AccumulatedImpairmentMemberifrs-full:LifetimeExpectedCreditLossesMemberifrs-full:FinancialInstrumentsNotCreditimpairedMember2022-01-012022-12-310000312069bcs:CreditCardsRetailMemberifrs-full:LifetimeExpectedCreditLossesMemberifrs-full:FinancialInstrumentsCreditimpairedMemberifrs-full:GrossCarryingAmountMember2022-01-012022-12-310000312069bcs:CreditCardsRetailMemberifrs-full:AccumulatedImpairmentMemberifrs-full:LifetimeExpectedCreditLossesMemberifrs-full:FinancialInstrumentsCreditimpairedMember2022-01-012022-12-310000312069bcs:CreditCardsRetailMemberifrs-full:GrossCarryingAmountMember2022-01-012022-12-310000312069bcs:CreditCardsRetailMemberifrs-full:AccumulatedImpairmentMember2022-01-012022-12-310000312069bcs:OtherRetailMemberifrs-full:GrossCarryingAmountMemberifrs-full:TwelvemonthExpectedCreditLossesMember2021-12-310000312069ifrs-full:AccumulatedImpairmentMemberbcs:OtherRetailMemberifrs-full:TwelvemonthExpectedCreditLossesMember2021-12-310000312069ifrs-full:LifetimeExpectedCreditLossesMemberbcs:OtherRetailMemberifrs-full:GrossCarryingAmountMemberifrs-full:FinancialInstrumentsNotCreditimpairedMember2021-12-310000312069ifrs-full:AccumulatedImpairmentMemberifrs-full:LifetimeExpectedCreditLossesMemberbcs:OtherRetailMemberifrs-full:FinancialInstrumentsNotCreditimpairedMember2021-12-310000312069ifrs-full:LifetimeExpectedCreditLossesMemberbcs:OtherRetailMemberifrs-full:FinancialInstrumentsCreditimpairedMemberifrs-full:GrossCarryingAmountMember2021-12-310000312069ifrs-full:AccumulatedImpairmentMemberifrs-full:LifetimeExpectedCreditLossesMemberbcs:OtherRetailMemberifrs-full:FinancialInstrumentsCreditimpairedMember2021-12-310000312069bcs:OtherRetailMemberifrs-full:GrossCarryingAmountMember2021-12-310000312069ifrs-full:AccumulatedImpairmentMemberbcs:OtherRetailMember2021-12-310000312069bcs:TransfersFromStage1ToStage2Memberbcs:OtherRetailMemberifrs-full:GrossCarryingAmountMemberifrs-full:TwelvemonthExpectedCreditLossesMember2022-01-012022-12-310000312069ifrs-full:AccumulatedImpairmentMemberbcs:TransfersFromStage1ToStage2Memberbcs:OtherRetailMemberifrs-full:TwelvemonthExpectedCreditLossesMember2022-01-012022-12-310000312069ifrs-full:LifetimeExpectedCreditLossesMemberbcs:TransfersFromStage1ToStage2Memberbcs:OtherRetailMemberifrs-full:GrossCarryingAmountMemberifrs-full:FinancialInstrumentsNotCreditimpairedMember2022-01-012022-12-310000312069ifrs-full:AccumulatedImpairmentMemberifrs-full:LifetimeExpectedCreditLossesMemberbcs:TransfersFromStage1ToStage2Memberbcs:OtherRetailMemberifrs-full:FinancialInstrumentsNotCreditimpairedMember2022-01-012022-12-310000312069ifrs-full:LifetimeExpectedCreditLossesMemberbcs:TransfersFromStage1ToStage2Memberbcs:OtherRetailMemberifrs-full:FinancialInstrumentsCreditimpairedMemberifrs-full:GrossCarryingAmountMember2022-01-012022-12-310000312069ifrs-full:AccumulatedImpairmentMemberifrs-full:LifetimeExpectedCreditLossesMemberbcs:TransfersFromStage1ToStage2Memberbcs:OtherRetailMemberifrs-full:FinancialInstrumentsCreditimpairedMember2022-01-012022-12-310000312069bcs:TransfersFromStage1ToStage2Memberbcs:OtherRetailMemberifrs-full:GrossCarryingAmountMember2022-01-012022-12-310000312069ifrs-full:AccumulatedImpairmentMemberbcs:TransfersFromStage1ToStage2Memberbcs:OtherRetailMember2022-01-012022-12-310000312069bcs:TransfersFromStage2ToStage1Memberbcs:OtherRetailMemberifrs-full:GrossCarryingAmountMemberifrs-full:TwelvemonthExpectedCreditLossesMember2022-01-012022-12-310000312069ifrs-full:AccumulatedImpairmentMemberbcs:TransfersFromStage2ToStage1Memberbcs:OtherRetailMemberifrs-full:TwelvemonthExpectedCreditLossesMember2022-01-012022-12-310000312069ifrs-full:LifetimeExpectedCreditLossesMemberbcs:TransfersFromStage2ToStage1Memberbcs:OtherRetailMemberifrs-full:GrossCarryingAmountMemberifrs-full:FinancialInstrumentsNotCreditimpairedMember2022-01-012022-12-310000312069ifrs-full:AccumulatedImpairmentMemberifrs-full:LifetimeExpectedCreditLossesMemberbcs:TransfersFromStage2ToStage1Memberbcs:OtherRetailMemberifrs-full:FinancialInstrumentsNotCreditimpairedMember2022-01-012022-12-310000312069ifrs-full:LifetimeExpectedCreditLossesMemberbcs:TransfersFromStage2ToStage1Memberbcs:OtherRetailMemberifrs-full:FinancialInstrumentsCreditimpairedMemberifrs-full:GrossCarryingAmountMember2022-01-012022-12-310000312069ifrs-full:AccumulatedImpairmentMemberifrs-full:LifetimeExpectedCreditLossesMemberbcs:TransfersFromStage2ToStage1Memberbcs:OtherRetailMemberifrs-full:FinancialInstrumentsCreditimpairedMember2022-01-012022-12-310000312069bcs:TransfersFromStage2ToStage1Memberbcs:OtherRetailMemberifrs-full:GrossCarryingAmountMember2022-01-012022-12-310000312069ifrs-full:AccumulatedImpairmentMemberbcs:TransfersFromStage2ToStage1Memberbcs:OtherRetailMember2022-01-012022-12-310000312069bcs:OtherRetailMemberifrs-full:GrossCarryingAmountMemberbcs:TransfersToStage3Memberifrs-full:TwelvemonthExpectedCreditLossesMember2022-01-012022-12-310000312069ifrs-full:AccumulatedImpairmentMemberbcs:OtherRetailMemberbcs:TransfersToStage3Memberifrs-full:TwelvemonthExpectedCreditLossesMember2022-01-012022-12-310000312069ifrs-full:LifetimeExpectedCreditLossesMemberbcs:OtherRetailMemberifrs-full:GrossCarryingAmountMemberifrs-full:FinancialInstrumentsNotCreditimpairedMemberbcs:TransfersToStage3Member2022-01-012022-12-310000312069ifrs-full:AccumulatedImpairmentMemberifrs-full:LifetimeExpectedCreditLossesMemberbcs:OtherRetailMemberifrs-full:FinancialInstrumentsNotCreditimpairedMemberbcs:TransfersToStage3Member2022-01-012022-12-310000312069ifrs-full:LifetimeExpectedCreditLossesMemberbcs:OtherRetailMemberifrs-full:FinancialInstrumentsCreditimpairedMemberifrs-full:GrossCarryingAmountMemberbcs:TransfersToStage3Member2022-01-012022-12-310000312069ifrs-full:AccumulatedImpairmentMemberifrs-full:LifetimeExpectedCreditLossesMemberbcs:OtherRetailMemberifrs-full:FinancialInstrumentsCreditimpairedMemberbcs:TransfersToStage3Member2022-01-012022-12-310000312069bcs:OtherRetailMemberifrs-full:GrossCarryingAmountMemberbcs:TransfersToStage3Member2022-01-012022-12-310000312069ifrs-full:AccumulatedImpairmentMemberbcs:OtherRetailMemberbcs:TransfersToStage3Member2022-01-012022-12-310000312069bcs:OtherRetailMemberifrs-full:GrossCarryingAmountMemberbcs:TransfersFromStage3Memberifrs-full:TwelvemonthExpectedCreditLossesMember2022-01-012022-12-310000312069ifrs-full:AccumulatedImpairmentMemberbcs:OtherRetailMemberbcs:TransfersFromStage3Memberifrs-full:TwelvemonthExpectedCreditLossesMember2022-01-012022-12-310000312069ifrs-full:LifetimeExpectedCreditLossesMemberbcs:OtherRetailMemberifrs-full:GrossCarryingAmountMemberbcs:TransfersFromStage3Memberifrs-full:FinancialInstrumentsNotCreditimpairedMember2022-01-012022-12-310000312069ifrs-full:AccumulatedImpairmentMemberifrs-full:LifetimeExpectedCreditLossesMemberbcs:OtherRetailMemberbcs:TransfersFromStage3Memberifrs-full:FinancialInstrumentsNotCreditimpairedMember2022-01-012022-12-310000312069ifrs-full:LifetimeExpectedCreditLossesMemberbcs:OtherRetailMemberifrs-full:FinancialInstrumentsCreditimpairedMemberifrs-full:GrossCarryingAmountMemberbcs:TransfersFromStage3Member2022-01-012022-12-310000312069ifrs-full:AccumulatedImpairmentMemberifrs-full:LifetimeExpectedCreditLossesMemberbcs:OtherRetailMemberifrs-full:FinancialInstrumentsCreditimpairedMemberbcs:TransfersFromStage3Member2022-01-012022-12-310000312069bcs:OtherRetailMemberifrs-full:GrossCarryingAmountMemberbcs:TransfersFromStage3Member2022-01-012022-12-310000312069ifrs-full:AccumulatedImpairmentMemberbcs:OtherRetailMemberbcs:TransfersFromStage3Member2022-01-012022-12-310000312069bcs:OtherRetailMemberifrs-full:GrossCarryingAmountMemberifrs-full:TwelvemonthExpectedCreditLossesMember2022-01-012022-12-310000312069ifrs-full:AccumulatedImpairmentMemberbcs:OtherRetailMemberifrs-full:TwelvemonthExpectedCreditLossesMember2022-01-012022-12-310000312069ifrs-full:LifetimeExpectedCreditLossesMemberbcs:OtherRetailMemberifrs-full:GrossCarryingAmountMemberifrs-full:FinancialInstrumentsNotCreditimpairedMember2022-01-012022-12-310000312069ifrs-full:AccumulatedImpairmentMemberifrs-full:LifetimeExpectedCreditLossesMemberbcs:OtherRetailMemberifrs-full:FinancialInstrumentsNotCreditimpairedMember2022-01-012022-12-310000312069ifrs-full:LifetimeExpectedCreditLossesMemberbcs:OtherRetailMemberifrs-full:FinancialInstrumentsCreditimpairedMemberifrs-full:GrossCarryingAmountMember2022-01-012022-12-310000312069ifrs-full:AccumulatedImpairmentMemberifrs-full:LifetimeExpectedCreditLossesMemberbcs:OtherRetailMemberifrs-full:FinancialInstrumentsCreditimpairedMember2022-01-012022-12-310000312069bcs:OtherRetailMemberifrs-full:GrossCarryingAmountMember2022-01-012022-12-310000312069ifrs-full:AccumulatedImpairmentMemberbcs:OtherRetailMember2022-01-012022-12-310000312069bcs:CreditCardsRetailMemberifrs-full:AccumulatedImpairmentMembercountry:USifrs-full:FinancialAssetsAtAmortisedCostMember2022-01-012022-12-310000312069bcs:CreditCardsRetailMemberifrs-full:AccumulatedImpairmentMemberifrs-full:FinancialAssetsAtAmortisedCostMembercountry:GB2022-01-012022-12-310000312069bcs:CreditCardsRetailMemberbcs:USCardsMemberifrs-full:GrossCarryingAmountMember2022-01-012022-12-310000312069bcs:CreditCardsRetailMemberifrs-full:DebtSecuritiesMemberifrs-full:GrossCarryingAmountMember2022-01-012022-12-310000312069ifrs-full:CorporateLoansMemberifrs-full:GrossCarryingAmountMemberifrs-full:TwelvemonthExpectedCreditLossesMember2021-12-310000312069ifrs-full:AccumulatedImpairmentMemberifrs-full:CorporateLoansMemberifrs-full:TwelvemonthExpectedCreditLossesMember2021-12-310000312069ifrs-full:LifetimeExpectedCreditLossesMemberifrs-full:CorporateLoansMemberifrs-full:GrossCarryingAmountMemberifrs-full:FinancialInstrumentsNotCreditimpairedMember2021-12-310000312069ifrs-full:AccumulatedImpairmentMemberifrs-full:LifetimeExpectedCreditLossesMemberifrs-full:CorporateLoansMemberifrs-full:FinancialInstrumentsNotCreditimpairedMember2021-12-310000312069ifrs-full:LifetimeExpectedCreditLossesMemberifrs-full:CorporateLoansMemberifrs-full:FinancialInstrumentsCreditimpairedMemberifrs-full:GrossCarryingAmountMember2021-12-310000312069ifrs-full:AccumulatedImpairmentMemberifrs-full:LifetimeExpectedCreditLossesMemberifrs-full:CorporateLoansMemberifrs-full:FinancialInstrumentsCreditimpairedMember2021-12-310000312069ifrs-full:CorporateLoansMemberifrs-full:GrossCarryingAmountMember2021-12-310000312069ifrs-full:AccumulatedImpairmentMemberifrs-full:CorporateLoansMember2021-12-310000312069ifrs-full:CorporateLoansMemberbcs:TransfersFromStage1ToStage2Memberifrs-full:GrossCarryingAmountMemberifrs-full:TwelvemonthExpectedCreditLossesMember2022-01-012022-12-310000312069ifrs-full:AccumulatedImpairmentMemberifrs-full:CorporateLoansMemberbcs:TransfersFromStage1ToStage2Memberifrs-full:TwelvemonthExpectedCreditLossesMember2022-01-012022-12-310000312069ifrs-full:LifetimeExpectedCreditLossesMemberifrs-full:CorporateLoansMemberbcs:TransfersFromStage1ToStage2Memberifrs-full:GrossCarryingAmountMemberifrs-full:FinancialInstrumentsNotCreditimpairedMember2022-01-012022-12-310000312069ifrs-full:AccumulatedImpairmentMemberifrs-full:LifetimeExpectedCreditLossesMemberifrs-full:CorporateLoansMemberbcs:TransfersFromStage1ToStage2Memberifrs-full:FinancialInstrumentsNotCreditimpairedMember2022-01-012022-12-310000312069ifrs-full:LifetimeExpectedCreditLossesMemberifrs-full:CorporateLoansMemberbcs:TransfersFromStage1ToStage2Memberifrs-full:FinancialInstrumentsCreditimpairedMemberifrs-full:GrossCarryingAmountMember2022-01-012022-12-310000312069ifrs-full:AccumulatedImpairmentMemberifrs-full:LifetimeExpectedCreditLossesMemberifrs-full:CorporateLoansMemberbcs:TransfersFromStage1ToStage2Memberifrs-full:FinancialInstrumentsCreditimpairedMember2022-01-012022-12-310000312069ifrs-full:CorporateLoansMemberbcs:TransfersFromStage1ToStage2Memberifrs-full:GrossCarryingAmountMember2022-01-012022-12-310000312069ifrs-full:AccumulatedImpairmentMemberifrs-full:CorporateLoansMemberbcs:TransfersFromStage1ToStage2Member2022-01-012022-12-310000312069ifrs-full:CorporateLoansMemberbcs:TransfersFromStage2ToStage1Memberifrs-full:GrossCarryingAmountMemberifrs-full:TwelvemonthExpectedCreditLossesMember2022-01-012022-12-310000312069ifrs-full:AccumulatedImpairmentMemberifrs-full:CorporateLoansMemberbcs:TransfersFromStage2ToStage1Memberifrs-full:TwelvemonthExpectedCreditLossesMember2022-01-012022-12-310000312069ifrs-full:LifetimeExpectedCreditLossesMemberifrs-full:CorporateLoansMemberbcs:TransfersFromStage2ToStage1Memberifrs-full:GrossCarryingAmountMemberifrs-full:FinancialInstrumentsNotCreditimpairedMember2022-01-012022-12-310000312069ifrs-full:AccumulatedImpairmentMemberifrs-full:LifetimeExpectedCreditLossesMemberifrs-full:CorporateLoansMemberbcs:TransfersFromStage2ToStage1Memberifrs-full:FinancialInstrumentsNotCreditimpairedMember2022-01-012022-12-310000312069ifrs-full:LifetimeExpectedCreditLossesMemberifrs-full:CorporateLoansMemberbcs:TransfersFromStage2ToStage1Memberifrs-full:FinancialInstrumentsCreditimpairedMemberifrs-full:GrossCarryingAmountMember2022-01-012022-12-310000312069ifrs-full:AccumulatedImpairmentMemberifrs-full:LifetimeExpectedCreditLossesMemberifrs-full:CorporateLoansMemberbcs:TransfersFromStage2ToStage1Memberifrs-full:FinancialInstrumentsCreditimpairedMember2022-01-012022-12-310000312069ifrs-full:CorporateLoansMemberbcs:TransfersFromStage2ToStage1Memberifrs-full:GrossCarryingAmountMember2022-01-012022-12-310000312069ifrs-full:AccumulatedImpairmentMemberifrs-full:CorporateLoansMemberbcs:TransfersFromStage2ToStage1Member2022-01-012022-12-310000312069ifrs-full:CorporateLoansMemberifrs-full:GrossCarryingAmountMemberbcs:TransfersToStage3Memberifrs-full:TwelvemonthExpectedCreditLossesMember2022-01-012022-12-310000312069ifrs-full:AccumulatedImpairmentMemberifrs-full:CorporateLoansMemberbcs:TransfersToStage3Memberifrs-full:TwelvemonthExpectedCreditLossesMember2022-01-012022-12-310000312069ifrs-full:LifetimeExpectedCreditLossesMemberifrs-full:CorporateLoansMemberifrs-full:GrossCarryingAmountMemberifrs-full:FinancialInstrumentsNotCreditimpairedMemberbcs:TransfersToStage3Member2022-01-012022-12-310000312069ifrs-full:AccumulatedImpairmentMemberifrs-full:LifetimeExpectedCreditLossesMemberifrs-full:CorporateLoansMemberifrs-full:FinancialInstrumentsNotCreditimpairedMemberbcs:TransfersToStage3Member2022-01-012022-12-310000312069ifrs-full:LifetimeExpectedCreditLossesMemberifrs-full:CorporateLoansMemberifrs-full:FinancialInstrumentsCreditimpairedMemberifrs-full:GrossCarryingAmountMemberbcs:TransfersToStage3Member2022-01-012022-12-310000312069ifrs-full:AccumulatedImpairmentMemberifrs-full:LifetimeExpectedCreditLossesMemberifrs-full:CorporateLoansMemberifrs-full:FinancialInstrumentsCreditimpairedMemberbcs:TransfersToStage3Member2022-01-012022-12-310000312069ifrs-full:CorporateLoansMemberifrs-full:GrossCarryingAmountMemberbcs:TransfersToStage3Member2022-01-012022-12-310000312069ifrs-full:AccumulatedImpairmentMemberifrs-full:CorporateLoansMemberbcs:TransfersToStage3Member2022-01-012022-12-310000312069ifrs-full:CorporateLoansMemberifrs-full:GrossCarryingAmountMemberbcs:TransfersFromStage3Memberifrs-full:TwelvemonthExpectedCreditLossesMember2022-01-012022-12-310000312069ifrs-full:AccumulatedImpairmentMemberifrs-full:CorporateLoansMemberbcs:TransfersFromStage3Memberifrs-full:TwelvemonthExpectedCreditLossesMember2022-01-012022-12-310000312069ifrs-full:LifetimeExpectedCreditLossesMemberifrs-full:CorporateLoansMemberifrs-full:GrossCarryingAmountMemberbcs:TransfersFromStage3Memberifrs-full:FinancialInstrumentsNotCreditimpairedMember2022-01-012022-12-310000312069ifrs-full:AccumulatedImpairmentMemberifrs-full:LifetimeExpectedCreditLossesMemberifrs-full:CorporateLoansMemberbcs:TransfersFromStage3Memberifrs-full:FinancialInstrumentsNotCreditimpairedMember2022-01-012022-12-310000312069ifrs-full:LifetimeExpectedCreditLossesMemberifrs-full:CorporateLoansMemberifrs-full:FinancialInstrumentsCreditimpairedMemberifrs-full:GrossCarryingAmountMemberbcs:TransfersFromStage3Member2022-01-012022-12-310000312069ifrs-full:AccumulatedImpairmentMemberifrs-full:LifetimeExpectedCreditLossesMemberifrs-full:CorporateLoansMemberifrs-full:FinancialInstrumentsCreditimpairedMemberbcs:TransfersFromStage3Member2022-01-012022-12-310000312069ifrs-full:CorporateLoansMemberifrs-full:GrossCarryingAmountMemberbcs:TransfersFromStage3Member2022-01-012022-12-310000312069ifrs-full:AccumulatedImpairmentMemberifrs-full:CorporateLoansMemberbcs:TransfersFromStage3Member2022-01-012022-12-310000312069ifrs-full:CorporateLoansMemberifrs-full:GrossCarryingAmountMemberifrs-full:TwelvemonthExpectedCreditLossesMember2022-01-012022-12-310000312069ifrs-full:AccumulatedImpairmentMemberifrs-full:CorporateLoansMemberifrs-full:TwelvemonthExpectedCreditLossesMember2022-01-012022-12-310000312069ifrs-full:LifetimeExpectedCreditLossesMemberifrs-full:CorporateLoansMemberifrs-full:GrossCarryingAmountMemberifrs-full:FinancialInstrumentsNotCreditimpairedMember2022-01-012022-12-310000312069ifrs-full:AccumulatedImpairmentMemberifrs-full:LifetimeExpectedCreditLossesMemberifrs-full:CorporateLoansMemberifrs-full:FinancialInstrumentsNotCreditimpairedMember2022-01-012022-12-310000312069ifrs-full:LifetimeExpectedCreditLossesMemberifrs-full:CorporateLoansMemberifrs-full:FinancialInstrumentsCreditimpairedMemberifrs-full:GrossCarryingAmountMember2022-01-012022-12-310000312069ifrs-full:AccumulatedImpairmentMemberifrs-full:LifetimeExpectedCreditLossesMemberifrs-full:CorporateLoansMemberifrs-full:FinancialInstrumentsCreditimpairedMember2022-01-012022-12-310000312069ifrs-full:CorporateLoansMemberifrs-full:GrossCarryingAmountMember2022-01-012022-12-310000312069ifrs-full:AccumulatedImpairmentMemberifrs-full:CorporateLoansMember2022-01-012022-12-310000312069ifrs-full:MortgagesMemberifrs-full:TwelvemonthExpectedCreditLossesMember2022-01-012022-12-310000312069ifrs-full:LifetimeExpectedCreditLossesMemberifrs-full:MortgagesMemberifrs-full:FinancialInstrumentsNotCreditimpairedMember2022-01-012022-12-310000312069ifrs-full:LifetimeExpectedCreditLossesMemberifrs-full:MortgagesMemberifrs-full:FinancialInstrumentsCreditimpairedMember2022-01-012022-12-310000312069ifrs-full:MortgagesMember2022-01-012022-12-310000312069bcs:CreditCardsRetailMemberifrs-full:TwelvemonthExpectedCreditLossesMember2022-01-012022-12-310000312069bcs:CreditCardsRetailMemberifrs-full:LifetimeExpectedCreditLossesMemberifrs-full:FinancialInstrumentsNotCreditimpairedMember2022-01-012022-12-310000312069bcs:CreditCardsRetailMemberifrs-full:LifetimeExpectedCreditLossesMemberifrs-full:FinancialInstrumentsCreditimpairedMember2022-01-012022-12-310000312069bcs:CreditCardsRetailMember2022-01-012022-12-310000312069bcs:OtherRetailMemberifrs-full:TwelvemonthExpectedCreditLossesMember2022-01-012022-12-310000312069ifrs-full:LifetimeExpectedCreditLossesMemberbcs:OtherRetailMemberifrs-full:FinancialInstrumentsNotCreditimpairedMember2022-01-012022-12-310000312069ifrs-full:LifetimeExpectedCreditLossesMemberbcs:OtherRetailMemberifrs-full:FinancialInstrumentsCreditimpairedMember2022-01-012022-12-310000312069bcs:OtherRetailMember2022-01-012022-12-310000312069ifrs-full:CorporateLoansMemberifrs-full:TwelvemonthExpectedCreditLossesMember2022-01-012022-12-310000312069ifrs-full:LifetimeExpectedCreditLossesMemberifrs-full:CorporateLoansMemberifrs-full:FinancialInstrumentsNotCreditimpairedMember2022-01-012022-12-310000312069ifrs-full:LifetimeExpectedCreditLossesMemberifrs-full:CorporateLoansMemberifrs-full:FinancialInstrumentsCreditimpairedMember2022-01-012022-12-310000312069ifrs-full:CorporateLoansMember2022-01-012022-12-310000312069ifrs-full:LoansAndReceivablesCategoryMemberifrs-full:TwelvemonthExpectedCreditLossesMember2022-01-012022-12-310000312069ifrs-full:LifetimeExpectedCreditLossesMemberifrs-full:LoansAndReceivablesCategoryMemberifrs-full:FinancialInstrumentsNotCreditimpairedMember2022-01-012022-12-310000312069ifrs-full:LifetimeExpectedCreditLossesMemberifrs-full:FinancialInstrumentsCreditimpairedMemberifrs-full:LoansAndReceivablesCategoryMember2022-01-012022-12-310000312069ifrs-full:LoansAndReceivablesCategoryMember2022-01-012022-12-310000312069ifrs-full:TwelvemonthExpectedCreditLossesMemberbcs:OffBalanceSheetLoanCommitmentsAndFinancialGuaranteeContractsMember2022-01-012022-12-310000312069ifrs-full:LifetimeExpectedCreditLossesMemberifrs-full:FinancialInstrumentsNotCreditimpairedMemberbcs:OffBalanceSheetLoanCommitmentsAndFinancialGuaranteeContractsMember2022-01-012022-12-310000312069ifrs-full:LifetimeExpectedCreditLossesMemberifrs-full:FinancialInstrumentsCreditimpairedMemberbcs:OffBalanceSheetLoanCommitmentsAndFinancialGuaranteeContractsMember2022-01-012022-12-310000312069bcs:OffBalanceSheetLoanCommitmentsAndFinancialGuaranteeContractsMember2022-01-012022-12-310000312069bcs:OtherFinancialAssetsSubjectToImpairmentMemberifrs-full:TwelvemonthExpectedCreditLossesMember2022-01-012022-12-310000312069ifrs-full:LifetimeExpectedCreditLossesMemberbcs:OtherFinancialAssetsSubjectToImpairmentMemberifrs-full:FinancialInstrumentsNotCreditimpairedMember2022-01-012022-12-310000312069ifrs-full:LifetimeExpectedCreditLossesMemberifrs-full:FinancialInstrumentsCreditimpairedMemberbcs:OtherFinancialAssetsSubjectToImpairmentMember2022-01-012022-12-310000312069bcs:OtherFinancialAssetsSubjectToImpairmentMember2022-01-012022-12-310000312069ifrs-full:DebtSecuritiesMemberifrs-full:TwelvemonthExpectedCreditLossesMember2022-01-012022-12-310000312069ifrs-full:LifetimeExpectedCreditLossesMemberifrs-full:DebtSecuritiesMemberifrs-full:FinancialInstrumentsNotCreditimpairedMember2022-01-012022-12-310000312069ifrs-full:LifetimeExpectedCreditLossesMemberifrs-full:DebtSecuritiesMemberifrs-full:FinancialInstrumentsCreditimpairedMember2022-01-012022-12-310000312069ifrs-full:DebtSecuritiesMember2022-01-012022-12-310000312069ifrs-full:TwelvemonthExpectedCreditLossesMember2022-01-012022-12-310000312069ifrs-full:LifetimeExpectedCreditLossesMemberifrs-full:FinancialInstrumentsNotCreditimpairedMember2022-01-012022-12-310000312069ifrs-full:LifetimeExpectedCreditLossesMemberifrs-full:FinancialInstrumentsCreditimpairedMember2022-01-012022-12-310000312069ifrs-full:AccumulatedImpairmentMemberifrs-full:CorporateLoansMemberifrs-full:FinancialAssetsAtAmortisedCostMemberbcs:CorporateAndInvestmentBankMember2022-01-012022-12-310000312069ifrs-full:AccumulatedImpairmentMemberifrs-full:CorporateLoansMemberifrs-full:LoansToGovernmentMember2022-01-012022-12-310000312069ifrs-full:DebtSecuritiesMemberifrs-full:CorporateLoansMemberifrs-full:GrossCarryingAmountMember2022-01-012022-12-310000312069bcs:CardsUnsecuredLoansAndOtherPersonalLendingMemberifrs-full:FinancialAssetsAtAmortisedCostMembercountry:GBifrs-full:LoansAndReceivablesCategoryMember2022-10-012022-12-310000312069ifrs-full:FinancialGuaranteeContractsMember2022-01-012022-12-310000312069bcs:OffBalanceSheetLoanCommitmentsAndFinancialGuaranteeContractsMemberifrs-full:MortgagesMemberifrs-full:GrossCarryingAmountMemberifrs-full:TwelvemonthExpectedCreditLossesMember2021-12-310000312069ifrs-full:AccumulatedImpairmentMemberbcs:OffBalanceSheetLoanCommitmentsAndFinancialGuaranteeContractsMemberifrs-full:MortgagesMemberifrs-full:TwelvemonthExpectedCreditLossesMember2021-12-310000312069bcs:OffBalanceSheetLoanCommitmentsAndFinancialGuaranteeContractsMemberifrs-full:LifetimeExpectedCreditLossesMemberifrs-full:MortgagesMemberifrs-full:GrossCarryingAmountMemberifrs-full:FinancialInstrumentsNotCreditimpairedMember2021-12-310000312069bcs:OffBalanceSheetLoanCommitmentsAndFinancialGuaranteeContractsMemberifrs-full:AccumulatedImpairmentMemberifrs-full:LifetimeExpectedCreditLossesMemberifrs-full:MortgagesMemberifrs-full:FinancialInstrumentsNotCreditimpairedMember2021-12-310000312069bcs:OffBalanceSheetLoanCommitmentsAndFinancialGuaranteeContractsMemberifrs-full:LifetimeExpectedCreditLossesMemberifrs-full:MortgagesMemberifrs-full:FinancialInstrumentsCreditimpairedMemberifrs-full:GrossCarryingAmountMember2021-12-310000312069bcs:OffBalanceSheetLoanCommitmentsAndFinancialGuaranteeContractsMemberifrs-full:AccumulatedImpairmentMemberifrs-full:LifetimeExpectedCreditLossesMemberifrs-full:MortgagesMemberifrs-full:FinancialInstrumentsCreditimpairedMember2021-12-310000312069bcs:OffBalanceSheetLoanCommitmentsAndFinancialGuaranteeContractsMemberifrs-full:MortgagesMemberifrs-full:GrossCarryingAmountMember2021-12-310000312069ifrs-full:AccumulatedImpairmentMemberbcs:OffBalanceSheetLoanCommitmentsAndFinancialGuaranteeContractsMemberifrs-full:MortgagesMember2021-12-310000312069bcs:OffBalanceSheetLoanCommitmentsAndFinancialGuaranteeContractsMemberifrs-full:MortgagesMemberifrs-full:GrossCarryingAmountMemberifrs-full:TwelvemonthExpectedCreditLossesMember2022-01-012022-12-310000312069ifrs-full:AccumulatedImpairmentMemberbcs:OffBalanceSheetLoanCommitmentsAndFinancialGuaranteeContractsMemberifrs-full:MortgagesMemberifrs-full:TwelvemonthExpectedCreditLossesMember2022-01-012022-12-310000312069bcs:OffBalanceSheetLoanCommitmentsAndFinancialGuaranteeContractsMemberifrs-full:LifetimeExpectedCreditLossesMemberifrs-full:MortgagesMemberifrs-full:GrossCarryingAmountMemberifrs-full:FinancialInstrumentsNotCreditimpairedMember2022-01-012022-12-310000312069bcs:OffBalanceSheetLoanCommitmentsAndFinancialGuaranteeContractsMemberifrs-full:AccumulatedImpairmentMemberifrs-full:LifetimeExpectedCreditLossesMemberifrs-full:MortgagesMemberifrs-full:FinancialInstrumentsNotCreditimpairedMember2022-01-012022-12-310000312069bcs:OffBalanceSheetLoanCommitmentsAndFinancialGuaranteeContractsMemberifrs-full:LifetimeExpectedCreditLossesMemberifrs-full:MortgagesMemberifrs-full:FinancialInstrumentsCreditimpairedMemberifrs-full:GrossCarryingAmountMember2022-01-012022-12-310000312069bcs:OffBalanceSheetLoanCommitmentsAndFinancialGuaranteeContractsMemberifrs-full:AccumulatedImpairmentMemberifrs-full:LifetimeExpectedCreditLossesMemberifrs-full:MortgagesMemberifrs-full:FinancialInstrumentsCreditimpairedMember2022-01-012022-12-310000312069bcs:OffBalanceSheetLoanCommitmentsAndFinancialGuaranteeContractsMemberifrs-full:MortgagesMemberifrs-full:GrossCarryingAmountMember2022-01-012022-12-310000312069ifrs-full:AccumulatedImpairmentMemberbcs:OffBalanceSheetLoanCommitmentsAndFinancialGuaranteeContractsMemberifrs-full:MortgagesMember2022-01-012022-12-310000312069bcs:CreditCardsRetailMemberbcs:OffBalanceSheetLoanCommitmentsAndFinancialGuaranteeContractsMemberifrs-full:GrossCarryingAmountMemberifrs-full:TwelvemonthExpectedCreditLossesMember2021-12-310000312069bcs:CreditCardsRetailMemberifrs-full:AccumulatedImpairmentMemberbcs:OffBalanceSheetLoanCommitmentsAndFinancialGuaranteeContractsMemberifrs-full:TwelvemonthExpectedCreditLossesMember2021-12-310000312069bcs:CreditCardsRetailMemberbcs:OffBalanceSheetLoanCommitmentsAndFinancialGuaranteeContractsMemberifrs-full:LifetimeExpectedCreditLossesMemberifrs-full:GrossCarryingAmountMemberifrs-full:FinancialInstrumentsNotCreditimpairedMember2021-12-310000312069bcs:CreditCardsRetailMemberbcs:OffBalanceSheetLoanCommitmentsAndFinancialGuaranteeContractsMemberifrs-full:AccumulatedImpairmentMemberifrs-full:LifetimeExpectedCreditLossesMemberifrs-full:FinancialInstrumentsNotCreditimpairedMember2021-12-310000312069bcs:CreditCardsRetailMemberbcs:OffBalanceSheetLoanCommitmentsAndFinancialGuaranteeContractsMemberifrs-full:LifetimeExpectedCreditLossesMemberifrs-full:FinancialInstrumentsCreditimpairedMemberifrs-full:GrossCarryingAmountMember2021-12-310000312069bcs:CreditCardsRetailMemberbcs:OffBalanceSheetLoanCommitmentsAndFinancialGuaranteeContractsMemberifrs-full:AccumulatedImpairmentMemberifrs-full:LifetimeExpectedCreditLossesMemberifrs-full:FinancialInstrumentsCreditimpairedMember2021-12-310000312069bcs:CreditCardsRetailMemberbcs:OffBalanceSheetLoanCommitmentsAndFinancialGuaranteeContractsMemberifrs-full:GrossCarryingAmountMember2021-12-310000312069bcs:CreditCardsRetailMemberifrs-full:AccumulatedImpairmentMemberbcs:OffBalanceSheetLoanCommitmentsAndFinancialGuaranteeContractsMember2021-12-310000312069bcs:CreditCardsRetailMemberbcs:OffBalanceSheetLoanCommitmentsAndFinancialGuaranteeContractsMemberifrs-full:GrossCarryingAmountMemberifrs-full:TwelvemonthExpectedCreditLossesMember2022-01-012022-12-310000312069bcs:CreditCardsRetailMemberifrs-full:AccumulatedImpairmentMemberbcs:OffBalanceSheetLoanCommitmentsAndFinancialGuaranteeContractsMemberifrs-full:TwelvemonthExpectedCreditLossesMember2022-01-012022-12-310000312069bcs:CreditCardsRetailMemberbcs:OffBalanceSheetLoanCommitmentsAndFinancialGuaranteeContractsMemberifrs-full:LifetimeExpectedCreditLossesMemberifrs-full:GrossCarryingAmountMemberifrs-full:FinancialInstrumentsNotCreditimpairedMember2022-01-012022-12-310000312069bcs:CreditCardsRetailMemberbcs:OffBalanceSheetLoanCommitmentsAndFinancialGuaranteeContractsMemberifrs-full:AccumulatedImpairmentMemberifrs-full:LifetimeExpectedCreditLossesMemberifrs-full:FinancialInstrumentsNotCreditimpairedMember2022-01-012022-12-310000312069bcs:CreditCardsRetailMemberbcs:OffBalanceSheetLoanCommitmentsAndFinancialGuaranteeContractsMemberifrs-full:LifetimeExpectedCreditLossesMemberifrs-full:FinancialInstrumentsCreditimpairedMemberifrs-full:GrossCarryingAmountMember2022-01-012022-12-310000312069bcs:CreditCardsRetailMemberbcs:OffBalanceSheetLoanCommitmentsAndFinancialGuaranteeContractsMemberifrs-full:AccumulatedImpairmentMemberifrs-full:LifetimeExpectedCreditLossesMemberifrs-full:FinancialInstrumentsCreditimpairedMember2022-01-012022-12-310000312069bcs:CreditCardsRetailMemberbcs:OffBalanceSheetLoanCommitmentsAndFinancialGuaranteeContractsMemberifrs-full:GrossCarryingAmountMember2022-01-012022-12-310000312069bcs:CreditCardsRetailMemberifrs-full:AccumulatedImpairmentMemberbcs:OffBalanceSheetLoanCommitmentsAndFinancialGuaranteeContractsMember2022-01-012022-12-310000312069bcs:OffBalanceSheetLoanCommitmentsAndFinancialGuaranteeContractsMemberbcs:OtherRetailMemberifrs-full:GrossCarryingAmountMemberifrs-full:TwelvemonthExpectedCreditLossesMember2021-12-310000312069ifrs-full:AccumulatedImpairmentMemberbcs:OffBalanceSheetLoanCommitmentsAndFinancialGuaranteeContractsMemberbcs:OtherRetailMemberifrs-full:TwelvemonthExpectedCreditLossesMember2021-12-310000312069bcs:OffBalanceSheetLoanCommitmentsAndFinancialGuaranteeContractsMemberifrs-full:LifetimeExpectedCreditLossesMemberbcs:OtherRetailMemberifrs-full:GrossCarryingAmountMemberifrs-full:FinancialInstrumentsNotCreditimpairedMember2021-12-310000312069bcs:OffBalanceSheetLoanCommitmentsAndFinancialGuaranteeContractsMemberifrs-full:AccumulatedImpairmentMemberifrs-full:LifetimeExpectedCreditLossesMemberbcs:OtherRetailMemberifrs-full:FinancialInstrumentsNotCreditimpairedMember2021-12-310000312069bcs:OffBalanceSheetLoanCommitmentsAndFinancialGuaranteeContractsMemberifrs-full:LifetimeExpectedCreditLossesMemberbcs:OtherRetailMemberifrs-full:FinancialInstrumentsCreditimpairedMemberifrs-full:GrossCarryingAmountMember2021-12-310000312069bcs:OffBalanceSheetLoanCommitmentsAndFinancialGuaranteeContractsMemberifrs-full:AccumulatedImpairmentMemberifrs-full:LifetimeExpectedCreditLossesMemberbcs:OtherRetailMemberifrs-full:FinancialInstrumentsCreditimpairedMember2021-12-310000312069bcs:OffBalanceSheetLoanCommitmentsAndFinancialGuaranteeContractsMemberbcs:OtherRetailMemberifrs-full:GrossCarryingAmountMember2021-12-310000312069ifrs-full:AccumulatedImpairmentMemberbcs:OffBalanceSheetLoanCommitmentsAndFinancialGuaranteeContractsMemberbcs:OtherRetailMember2021-12-310000312069bcs:OffBalanceSheetLoanCommitmentsAndFinancialGuaranteeContractsMemberbcs:OtherRetailMemberifrs-full:GrossCarryingAmountMemberifrs-full:TwelvemonthExpectedCreditLossesMember2022-01-012022-12-310000312069ifrs-full:AccumulatedImpairmentMemberbcs:OffBalanceSheetLoanCommitmentsAndFinancialGuaranteeContractsMemberbcs:OtherRetailMemberifrs-full:TwelvemonthExpectedCreditLossesMember2022-01-012022-12-310000312069bcs:OffBalanceSheetLoanCommitmentsAndFinancialGuaranteeContractsMemberifrs-full:LifetimeExpectedCreditLossesMemberbcs:OtherRetailMemberifrs-full:GrossCarryingAmountMemberifrs-full:FinancialInstrumentsNotCreditimpairedMember2022-01-012022-12-310000312069bcs:OffBalanceSheetLoanCommitmentsAndFinancialGuaranteeContractsMemberifrs-full:AccumulatedImpairmentMemberifrs-full:LifetimeExpectedCreditLossesMemberbcs:OtherRetailMemberifrs-full:FinancialInstrumentsNotCreditimpairedMember2022-01-012022-12-310000312069bcs:OffBalanceSheetLoanCommitmentsAndFinancialGuaranteeContractsMemberifrs-full:LifetimeExpectedCreditLossesMemberbcs:OtherRetailMemberifrs-full:FinancialInstrumentsCreditimpairedMemberifrs-full:GrossCarryingAmountMember2022-01-012022-12-310000312069bcs:OffBalanceSheetLoanCommitmentsAndFinancialGuaranteeContractsMemberifrs-full:AccumulatedImpairmentMemberifrs-full:LifetimeExpectedCreditLossesMemberbcs:OtherRetailMemberifrs-full:FinancialInstrumentsCreditimpairedMember2022-01-012022-12-310000312069bcs:OffBalanceSheetLoanCommitmentsAndFinancialGuaranteeContractsMemberifrs-full:GrossCarryingAmountMember2022-01-012022-12-310000312069ifrs-full:AccumulatedImpairmentMemberbcs:OffBalanceSheetLoanCommitmentsAndFinancialGuaranteeContractsMember2022-01-012022-12-310000312069bcs:OffBalanceSheetLoanCommitmentsAndFinancialGuaranteeContractsMemberbcs:OtherRetailMemberifrs-full:GrossCarryingAmountMember2022-01-012022-12-310000312069ifrs-full:AccumulatedImpairmentMemberbcs:OffBalanceSheetLoanCommitmentsAndFinancialGuaranteeContractsMemberbcs:OtherRetailMember2022-01-012022-12-310000312069bcs:OffBalanceSheetLoanCommitmentsAndFinancialGuaranteeContractsMemberifrs-full:CorporateLoansMemberifrs-full:GrossCarryingAmountMemberifrs-full:TwelvemonthExpectedCreditLossesMember2021-12-310000312069ifrs-full:AccumulatedImpairmentMemberbcs:OffBalanceSheetLoanCommitmentsAndFinancialGuaranteeContractsMemberifrs-full:CorporateLoansMemberifrs-full:TwelvemonthExpectedCreditLossesMember2021-12-310000312069bcs:OffBalanceSheetLoanCommitmentsAndFinancialGuaranteeContractsMemberifrs-full:LifetimeExpectedCreditLossesMemberifrs-full:CorporateLoansMemberifrs-full:GrossCarryingAmountMemberifrs-full:FinancialInstrumentsNotCreditimpairedMember2021-12-310000312069bcs:OffBalanceSheetLoanCommitmentsAndFinancialGuaranteeContractsMemberifrs-full:AccumulatedImpairmentMemberifrs-full:LifetimeExpectedCreditLossesMemberifrs-full:CorporateLoansMemberifrs-full:FinancialInstrumentsNotCreditimpairedMember2021-12-310000312069bcs:OffBalanceSheetLoanCommitmentsAndFinancialGuaranteeContractsMemberifrs-full:LifetimeExpectedCreditLossesMemberifrs-full:CorporateLoansMemberifrs-full:FinancialInstrumentsCreditimpairedMemberifrs-full:GrossCarryingAmountMember2021-12-310000312069bcs:OffBalanceSheetLoanCommitmentsAndFinancialGuaranteeContractsMemberifrs-full:AccumulatedImpairmentMemberifrs-full:LifetimeExpectedCreditLossesMemberifrs-full:CorporateLoansMemberifrs-full:FinancialInstrumentsCreditimpairedMember2021-12-310000312069bcs:OffBalanceSheetLoanCommitmentsAndFinancialGuaranteeContractsMemberifrs-full:CorporateLoansMemberifrs-full:GrossCarryingAmountMember2021-12-310000312069ifrs-full:AccumulatedImpairmentMemberbcs:OffBalanceSheetLoanCommitmentsAndFinancialGuaranteeContractsMemberifrs-full:CorporateLoansMember2021-12-310000312069bcs:OffBalanceSheetLoanCommitmentsAndFinancialGuaranteeContractsMemberifrs-full:CorporateLoansMemberifrs-full:GrossCarryingAmountMemberifrs-full:TwelvemonthExpectedCreditLossesMember2022-01-012022-12-310000312069ifrs-full:AccumulatedImpairmentMemberbcs:OffBalanceSheetLoanCommitmentsAndFinancialGuaranteeContractsMemberifrs-full:CorporateLoansMemberifrs-full:TwelvemonthExpectedCreditLossesMember2022-01-012022-12-310000312069bcs:OffBalanceSheetLoanCommitmentsAndFinancialGuaranteeContractsMemberifrs-full:LifetimeExpectedCreditLossesMemberifrs-full:CorporateLoansMemberifrs-full:GrossCarryingAmountMemberifrs-full:FinancialInstrumentsNotCreditimpairedMember2022-01-012022-12-310000312069bcs:OffBalanceSheetLoanCommitmentsAndFinancialGuaranteeContractsMemberifrs-full:AccumulatedImpairmentMemberifrs-full:LifetimeExpectedCreditLossesMemberifrs-full:CorporateLoansMemberifrs-full:FinancialInstrumentsNotCreditimpairedMember2022-01-012022-12-310000312069bcs:OffBalanceSheetLoanCommitmentsAndFinancialGuaranteeContractsMemberifrs-full:LifetimeExpectedCreditLossesMemberifrs-full:CorporateLoansMemberifrs-full:FinancialInstrumentsCreditimpairedMemberifrs-full:GrossCarryingAmountMember2022-01-012022-12-310000312069bcs:OffBalanceSheetLoanCommitmentsAndFinancialGuaranteeContractsMemberifrs-full:AccumulatedImpairmentMemberifrs-full:LifetimeExpectedCreditLossesMemberifrs-full:CorporateLoansMemberifrs-full:FinancialInstrumentsCreditimpairedMember2022-01-012022-12-310000312069bcs:OffBalanceSheetLoanCommitmentsAndFinancialGuaranteeContractsMemberifrs-full:CorporateLoansMemberifrs-full:GrossCarryingAmountMember2022-01-012022-12-310000312069ifrs-full:AccumulatedImpairmentMemberbcs:OffBalanceSheetLoanCommitmentsAndFinancialGuaranteeContractsMemberifrs-full:CorporateLoansMember2022-01-012022-12-310000312069ifrs-full:MortgagesMemberbcs:PreManagementAdjustmentsMembercountry:GB2023-12-310000312069ifrs-full:MortgagesMembercountry:GBbcs:EconomicUncertaintyAdjustmentsMember2023-12-310000312069ifrs-full:MortgagesMembercountry:GBbcs:OtherAdjustmentsMember2023-12-310000312069ifrs-full:MortgagesMembercountry:GBbcs:ManagementAdjustmentsMember2023-12-310000312069ifrs-full:MortgagesMembercountry:GB2023-12-310000312069bcs:CreditCardsRetailMemberbcs:PreManagementAdjustmentsMembercountry:GB2023-12-310000312069bcs:CreditCardsRetailMembercountry:GBbcs:EconomicUncertaintyAdjustmentsMember2023-12-310000312069bcs:CreditCardsRetailMembercountry:GBbcs:OtherAdjustmentsMember2023-12-310000312069bcs:CreditCardsRetailMembercountry:GBbcs:ManagementAdjustmentsMember2023-12-310000312069bcs:CreditCardsRetailMembercountry:GB2023-12-310000312069bcs:OtherRetailMemberbcs:PreManagementAdjustmentsMembercountry:GB2023-12-310000312069bcs:OtherRetailMembercountry:GBbcs:EconomicUncertaintyAdjustmentsMember2023-12-310000312069bcs:OtherRetailMembercountry:GBbcs:OtherAdjustmentsMember2023-12-310000312069bcs:OtherRetailMembercountry:GBbcs:ManagementAdjustmentsMember2023-12-310000312069bcs:OtherRetailMembercountry:GB2023-12-310000312069ifrs-full:CorporateLoansMemberbcs:PreManagementAdjustmentsMembercountry:GB2023-12-310000312069ifrs-full:CorporateLoansMembercountry:GBbcs:EconomicUncertaintyAdjustmentsMember2023-12-310000312069ifrs-full:CorporateLoansMembercountry:GBbcs:OtherAdjustmentsMember2023-12-310000312069ifrs-full:CorporateLoansMembercountry:GBbcs:ManagementAdjustmentsMember2023-12-310000312069ifrs-full:CorporateLoansMembercountry:GB2023-12-310000312069bcs:PreManagementAdjustmentsMembercountry:GBifrs-full:LoansAndReceivablesCategoryMember2023-12-310000312069country:GBbcs:EconomicUncertaintyAdjustmentsMemberifrs-full:LoansAndReceivablesCategoryMember2023-12-310000312069country:GBifrs-full:LoansAndReceivablesCategoryMemberbcs:OtherAdjustmentsMember2023-12-310000312069country:GBifrs-full:LoansAndReceivablesCategoryMemberbcs:ManagementAdjustmentsMember2023-12-310000312069country:GBifrs-full:LoansAndReceivablesCategoryMember2023-12-310000312069ifrs-full:MortgagesMemberbcs:RestOfTheWorldMemberbcs:PreManagementAdjustmentsMember2023-12-310000312069ifrs-full:MortgagesMemberbcs:RestOfTheWorldMemberbcs:EconomicUncertaintyAdjustmentsMember2023-12-310000312069ifrs-full:MortgagesMemberbcs:RestOfTheWorldMemberbcs:OtherAdjustmentsMember2023-12-310000312069ifrs-full:MortgagesMemberbcs:RestOfTheWorldMemberbcs:ManagementAdjustmentsMember2023-12-310000312069ifrs-full:MortgagesMemberbcs:RestOfTheWorldMember2023-12-310000312069bcs:CreditCardsRetailMemberbcs:RestOfTheWorldMemberbcs:PreManagementAdjustmentsMember2023-12-310000312069bcs:CreditCardsRetailMemberbcs:RestOfTheWorldMemberbcs:EconomicUncertaintyAdjustmentsMember2023-12-310000312069bcs:CreditCardsRetailMemberbcs:RestOfTheWorldMemberbcs:OtherAdjustmentsMember2023-12-310000312069bcs:CreditCardsRetailMemberbcs:RestOfTheWorldMemberbcs:ManagementAdjustmentsMember2023-12-310000312069bcs:CreditCardsRetailMemberbcs:RestOfTheWorldMember2023-12-310000312069bcs:OtherRetailMemberbcs:RestOfTheWorldMemberbcs:PreManagementAdjustmentsMember2023-12-310000312069bcs:OtherRetailMemberbcs:RestOfTheWorldMemberbcs:EconomicUncertaintyAdjustmentsMember2023-12-310000312069bcs:OtherRetailMemberbcs:RestOfTheWorldMemberbcs:OtherAdjustmentsMember2023-12-310000312069bcs:OtherRetailMemberbcs:RestOfTheWorldMemberbcs:ManagementAdjustmentsMember2023-12-310000312069bcs:OtherRetailMemberbcs:RestOfTheWorldMember2023-12-310000312069ifrs-full:CorporateLoansMemberbcs:RestOfTheWorldMemberbcs:PreManagementAdjustmentsMember2023-12-310000312069ifrs-full:CorporateLoansMemberbcs:RestOfTheWorldMemberbcs:EconomicUncertaintyAdjustmentsMember2023-12-310000312069ifrs-full:CorporateLoansMemberbcs:RestOfTheWorldMemberbcs:OtherAdjustmentsMember2023-12-310000312069ifrs-full:CorporateLoansMemberbcs:RestOfTheWorldMemberbcs:ManagementAdjustmentsMember2023-12-310000312069ifrs-full:CorporateLoansMemberbcs:RestOfTheWorldMember2023-12-310000312069bcs:RestOfTheWorldMemberbcs:PreManagementAdjustmentsMemberifrs-full:LoansAndReceivablesCategoryMember2023-12-310000312069bcs:RestOfTheWorldMemberbcs:EconomicUncertaintyAdjustmentsMemberifrs-full:LoansAndReceivablesCategoryMember2023-12-310000312069bcs:RestOfTheWorldMemberifrs-full:LoansAndReceivablesCategoryMemberbcs:OtherAdjustmentsMember2023-12-310000312069bcs:RestOfTheWorldMemberifrs-full:LoansAndReceivablesCategoryMemberbcs:ManagementAdjustmentsMember2023-12-310000312069bcs:RestOfTheWorldMemberifrs-full:LoansAndReceivablesCategoryMember2023-12-310000312069bcs:PreManagementAdjustmentsMemberifrs-full:LoansAndReceivablesCategoryMember2023-12-310000312069bcs:EconomicUncertaintyAdjustmentsMemberifrs-full:LoansAndReceivablesCategoryMember2023-12-310000312069bcs:OtherAdjustmentsMemberifrs-full:LoansAndReceivablesCategoryMember2023-12-310000312069bcs:ManagementAdjustmentsMemberifrs-full:LoansAndReceivablesCategoryMember2023-12-310000312069ifrs-full:LoansAndReceivablesCategoryMember2023-12-310000312069ifrs-full:DebtSecuritiesMemberbcs:PreManagementAdjustmentsMember2023-12-310000312069ifrs-full:DebtSecuritiesMemberbcs:EconomicUncertaintyAdjustmentsMember2023-12-310000312069ifrs-full:DebtSecuritiesMemberbcs:OtherAdjustmentsMember2023-12-310000312069ifrs-full:DebtSecuritiesMemberbcs:ManagementAdjustmentsMember2023-12-310000312069ifrs-full:DebtSecuritiesMember2023-12-310000312069bcs:PreManagementAdjustmentsMember2023-12-310000312069bcs:EconomicUncertaintyAdjustmentsMember2023-12-310000312069bcs:OtherAdjustmentsMember2023-12-310000312069bcs:ManagementAdjustmentsMember2023-12-310000312069ifrs-full:MortgagesMemberbcs:PreManagementAdjustmentsMembercountry:GB2022-12-310000312069ifrs-full:MortgagesMembercountry:GBbcs:EconomicUncertaintyAdjustmentsMember2022-12-310000312069ifrs-full:MortgagesMembercountry:GBbcs:OtherAdjustmentsMember2022-12-310000312069ifrs-full:MortgagesMembercountry:GBbcs:ManagementAdjustmentsMember2022-12-310000312069ifrs-full:MortgagesMembercountry:GB2022-12-310000312069bcs:CreditCardsRetailMemberbcs:PreManagementAdjustmentsMembercountry:GB2022-12-310000312069bcs:CreditCardsRetailMembercountry:GBbcs:EconomicUncertaintyAdjustmentsMember2022-12-310000312069bcs:CreditCardsRetailMembercountry:GBbcs:OtherAdjustmentsMember2022-12-310000312069bcs:CreditCardsRetailMembercountry:GBbcs:ManagementAdjustmentsMember2022-12-310000312069bcs:CreditCardsRetailMembercountry:GB2022-12-310000312069bcs:OtherRetailMemberbcs:PreManagementAdjustmentsMembercountry:GB2022-12-310000312069bcs:OtherRetailMembercountry:GBbcs:EconomicUncertaintyAdjustmentsMember2022-12-310000312069bcs:OtherRetailMembercountry:GBbcs:OtherAdjustmentsMember2022-12-310000312069bcs:OtherRetailMembercountry:GBbcs:ManagementAdjustmentsMember2022-12-310000312069bcs:OtherRetailMembercountry:GB2022-12-310000312069ifrs-full:CorporateLoansMemberbcs:PreManagementAdjustmentsMembercountry:GB2022-12-310000312069ifrs-full:CorporateLoansMembercountry:GBbcs:EconomicUncertaintyAdjustmentsMember2022-12-310000312069ifrs-full:CorporateLoansMembercountry:GBbcs:OtherAdjustmentsMember2022-12-310000312069ifrs-full:CorporateLoansMembercountry:GBbcs:ManagementAdjustmentsMember2022-12-310000312069ifrs-full:CorporateLoansMembercountry:GB2022-12-310000312069bcs:PreManagementAdjustmentsMembercountry:GBifrs-full:LoansAndReceivablesCategoryMember2022-12-310000312069country:GBbcs:EconomicUncertaintyAdjustmentsMemberifrs-full:LoansAndReceivablesCategoryMember2022-12-310000312069country:GBifrs-full:LoansAndReceivablesCategoryMemberbcs:OtherAdjustmentsMember2022-12-310000312069country:GBifrs-full:LoansAndReceivablesCategoryMemberbcs:ManagementAdjustmentsMember2022-12-310000312069country:GBifrs-full:LoansAndReceivablesCategoryMember2022-12-310000312069ifrs-full:MortgagesMemberbcs:RestOfTheWorldMemberbcs:PreManagementAdjustmentsMember2022-12-310000312069ifrs-full:MortgagesMemberbcs:RestOfTheWorldMemberbcs:EconomicUncertaintyAdjustmentsMember2022-12-310000312069ifrs-full:MortgagesMemberbcs:RestOfTheWorldMemberbcs:OtherAdjustmentsMember2022-12-310000312069ifrs-full:MortgagesMemberbcs:RestOfTheWorldMemberbcs:ManagementAdjustmentsMember2022-12-310000312069ifrs-full:MortgagesMemberbcs:RestOfTheWorldMember2022-12-310000312069bcs:CreditCardsRetailMemberbcs:RestOfTheWorldMemberbcs:PreManagementAdjustmentsMember2022-12-310000312069bcs:CreditCardsRetailMemberbcs:RestOfTheWorldMemberbcs:EconomicUncertaintyAdjustmentsMember2022-12-310000312069bcs:CreditCardsRetailMemberbcs:RestOfTheWorldMemberbcs:OtherAdjustmentsMember2022-12-310000312069bcs:CreditCardsRetailMemberbcs:RestOfTheWorldMemberbcs:ManagementAdjustmentsMember2022-12-310000312069bcs:CreditCardsRetailMemberbcs:RestOfTheWorldMember2022-12-310000312069bcs:OtherRetailMemberbcs:RestOfTheWorldMemberbcs:PreManagementAdjustmentsMember2022-12-310000312069bcs:OtherRetailMemberbcs:RestOfTheWorldMemberbcs:EconomicUncertaintyAdjustmentsMember2022-12-310000312069bcs:OtherRetailMemberbcs:RestOfTheWorldMemberbcs:OtherAdjustmentsMember2022-12-310000312069bcs:OtherRetailMemberbcs:RestOfTheWorldMemberbcs:ManagementAdjustmentsMember2022-12-310000312069bcs:OtherRetailMemberbcs:RestOfTheWorldMember2022-12-310000312069ifrs-full:CorporateLoansMemberbcs:RestOfTheWorldMemberbcs:PreManagementAdjustmentsMember2022-12-310000312069ifrs-full:CorporateLoansMemberbcs:RestOfTheWorldMemberbcs:EconomicUncertaintyAdjustmentsMember2022-12-310000312069ifrs-full:CorporateLoansMemberbcs:RestOfTheWorldMemberbcs:OtherAdjustmentsMember2022-12-310000312069ifrs-full:CorporateLoansMemberbcs:RestOfTheWorldMemberbcs:ManagementAdjustmentsMember2022-12-310000312069ifrs-full:CorporateLoansMemberbcs:RestOfTheWorldMember2022-12-310000312069bcs:RestOfTheWorldMemberbcs:PreManagementAdjustmentsMemberifrs-full:LoansAndReceivablesCategoryMember2022-12-310000312069bcs:RestOfTheWorldMemberbcs:EconomicUncertaintyAdjustmentsMemberifrs-full:LoansAndReceivablesCategoryMember2022-12-310000312069bcs:RestOfTheWorldMemberifrs-full:LoansAndReceivablesCategoryMemberbcs:OtherAdjustmentsMember2022-12-310000312069bcs:RestOfTheWorldMemberifrs-full:LoansAndReceivablesCategoryMemberbcs:ManagementAdjustmentsMember2022-12-310000312069bcs:RestOfTheWorldMemberifrs-full:LoansAndReceivablesCategoryMember2022-12-310000312069bcs:PreManagementAdjustmentsMemberifrs-full:LoansAndReceivablesCategoryMember2022-12-310000312069bcs:EconomicUncertaintyAdjustmentsMemberifrs-full:LoansAndReceivablesCategoryMember2022-12-310000312069bcs:OtherAdjustmentsMemberifrs-full:LoansAndReceivablesCategoryMember2022-12-310000312069bcs:ManagementAdjustmentsMemberifrs-full:LoansAndReceivablesCategoryMember2022-12-310000312069ifrs-full:LoansAndReceivablesCategoryMember2022-12-310000312069ifrs-full:DebtSecuritiesMemberbcs:PreManagementAdjustmentsMember2022-12-310000312069ifrs-full:DebtSecuritiesMemberbcs:EconomicUncertaintyAdjustmentsMember2022-12-310000312069ifrs-full:DebtSecuritiesMemberbcs:OtherAdjustmentsMember2022-12-310000312069ifrs-full:DebtSecuritiesMemberbcs:ManagementAdjustmentsMember2022-12-310000312069ifrs-full:DebtSecuritiesMember2022-12-310000312069bcs:PreManagementAdjustmentsMember2022-12-310000312069bcs:EconomicUncertaintyAdjustmentsMember2022-12-310000312069bcs:OtherAdjustmentsMember2022-12-310000312069bcs:ManagementAdjustmentsMember2022-12-3100003120692022-12-310000312069ifrs-full:MortgagesMembercountry:GBbcs:EconomicUncertaintyAdjustmentsMemberifrs-full:TwelvemonthExpectedCreditLossesMember2023-12-310000312069ifrs-full:LifetimeExpectedCreditLossesMemberifrs-full:MortgagesMembercountry:GBbcs:EconomicUncertaintyAdjustmentsMemberifrs-full:FinancialInstrumentsNotCreditimpairedMember2023-12-310000312069ifrs-full:LifetimeExpectedCreditLossesMemberifrs-full:MortgagesMemberifrs-full:FinancialInstrumentsCreditimpairedMembercountry:GBbcs:EconomicUncertaintyAdjustmentsMember2023-12-310000312069bcs:CreditCardsRetailMembercountry:GBbcs:EconomicUncertaintyAdjustmentsMemberifrs-full:TwelvemonthExpectedCreditLossesMember2023-12-310000312069bcs:CreditCardsRetailMemberifrs-full:LifetimeExpectedCreditLossesMembercountry:GBbcs:EconomicUncertaintyAdjustmentsMemberifrs-full:FinancialInstrumentsNotCreditimpairedMember2023-12-310000312069bcs:CreditCardsRetailMemberifrs-full:LifetimeExpectedCreditLossesMemberifrs-full:FinancialInstrumentsCreditimpairedMembercountry:GBbcs:EconomicUncertaintyAdjustmentsMember2023-12-310000312069bcs:OtherRetailMembercountry:GBbcs:EconomicUncertaintyAdjustmentsMemberifrs-full:TwelvemonthExpectedCreditLossesMember2023-12-310000312069ifrs-full:LifetimeExpectedCreditLossesMemberbcs:OtherRetailMembercountry:GBbcs:EconomicUncertaintyAdjustmentsMemberifrs-full:FinancialInstrumentsNotCreditimpairedMember2023-12-310000312069ifrs-full:LifetimeExpectedCreditLossesMemberbcs:OtherRetailMemberifrs-full:FinancialInstrumentsCreditimpairedMembercountry:GBbcs:EconomicUncertaintyAdjustmentsMember2023-12-310000312069ifrs-full:CorporateLoansMembercountry:GBbcs:EconomicUncertaintyAdjustmentsMemberifrs-full:TwelvemonthExpectedCreditLossesMember2023-12-310000312069ifrs-full:LifetimeExpectedCreditLossesMemberifrs-full:CorporateLoansMembercountry:GBbcs:EconomicUncertaintyAdjustmentsMemberifrs-full:FinancialInstrumentsNotCreditimpairedMember2023-12-310000312069ifrs-full:LifetimeExpectedCreditLossesMemberifrs-full:CorporateLoansMemberifrs-full:FinancialInstrumentsCreditimpairedMembercountry:GBbcs:EconomicUncertaintyAdjustmentsMember2023-12-310000312069country:GBbcs:EconomicUncertaintyAdjustmentsMemberifrs-full:LoansAndReceivablesCategoryMemberifrs-full:TwelvemonthExpectedCreditLossesMember2023-12-310000312069ifrs-full:LifetimeExpectedCreditLossesMembercountry:GBbcs:EconomicUncertaintyAdjustmentsMemberifrs-full:LoansAndReceivablesCategoryMemberifrs-full:FinancialInstrumentsNotCreditimpairedMember2023-12-310000312069ifrs-full:LifetimeExpectedCreditLossesMemberifrs-full:FinancialInstrumentsCreditimpairedMembercountry:GBbcs:EconomicUncertaintyAdjustmentsMemberifrs-full:LoansAndReceivablesCategoryMember2023-12-310000312069ifrs-full:MortgagesMemberbcs:RestOfTheWorldMemberbcs:EconomicUncertaintyAdjustmentsMemberifrs-full:TwelvemonthExpectedCreditLossesMember2023-12-310000312069ifrs-full:LifetimeExpectedCreditLossesMemberifrs-full:MortgagesMemberbcs:RestOfTheWorldMemberbcs:EconomicUncertaintyAdjustmentsMemberifrs-full:FinancialInstrumentsNotCreditimpairedMember2023-12-310000312069ifrs-full:LifetimeExpectedCreditLossesMemberifrs-full:MortgagesMemberifrs-full:FinancialInstrumentsCreditimpairedMemberbcs:RestOfTheWorldMemberbcs:EconomicUncertaintyAdjustmentsMember2023-12-310000312069bcs:CreditCardsRetailMemberbcs:RestOfTheWorldMemberbcs:EconomicUncertaintyAdjustmentsMemberifrs-full:TwelvemonthExpectedCreditLossesMember2023-12-310000312069bcs:CreditCardsRetailMemberifrs-full:LifetimeExpectedCreditLossesMemberbcs:RestOfTheWorldMemberbcs:EconomicUncertaintyAdjustmentsMemberifrs-full:FinancialInstrumentsNotCreditimpairedMember2023-12-310000312069bcs:CreditCardsRetailMemberifrs-full:LifetimeExpectedCreditLossesMemberifrs-full:FinancialInstrumentsCreditimpairedMemberbcs:RestOfTheWorldMemberbcs:EconomicUncertaintyAdjustmentsMember2023-12-310000312069bcs:OtherRetailMemberbcs:RestOfTheWorldMemberbcs:EconomicUncertaintyAdjustmentsMemberifrs-full:TwelvemonthExpectedCreditLossesMember2023-12-310000312069ifrs-full:LifetimeExpectedCreditLossesMemberbcs:OtherRetailMemberbcs:RestOfTheWorldMemberbcs:EconomicUncertaintyAdjustmentsMemberifrs-full:FinancialInstrumentsNotCreditimpairedMember2023-12-310000312069ifrs-full:LifetimeExpectedCreditLossesMemberbcs:OtherRetailMemberifrs-full:FinancialInstrumentsCreditimpairedMemberbcs:RestOfTheWorldMemberbcs:EconomicUncertaintyAdjustmentsMember2023-12-310000312069ifrs-full:CorporateLoansMemberbcs:RestOfTheWorldMemberbcs:EconomicUncertaintyAdjustmentsMemberifrs-full:TwelvemonthExpectedCreditLossesMember2023-12-310000312069ifrs-full:LifetimeExpectedCreditLossesMemberifrs-full:CorporateLoansMemberbcs:RestOfTheWorldMemberbcs:EconomicUncertaintyAdjustmentsMemberifrs-full:FinancialInstrumentsNotCreditimpairedMember2023-12-310000312069ifrs-full:LifetimeExpectedCreditLossesMemberifrs-full:CorporateLoansMemberifrs-full:FinancialInstrumentsCreditimpairedMemberbcs:RestOfTheWorldMemberbcs:EconomicUncertaintyAdjustmentsMember2023-12-310000312069bcs:RestOfTheWorldMemberbcs:EconomicUncertaintyAdjustmentsMemberifrs-full:LoansAndReceivablesCategoryMemberifrs-full:TwelvemonthExpectedCreditLossesMember2023-12-310000312069ifrs-full:LifetimeExpectedCreditLossesMemberbcs:RestOfTheWorldMemberbcs:EconomicUncertaintyAdjustmentsMemberifrs-full:LoansAndReceivablesCategoryMemberifrs-full:FinancialInstrumentsNotCreditimpairedMember2023-12-310000312069ifrs-full:LifetimeExpectedCreditLossesMemberifrs-full:FinancialInstrumentsCreditimpairedMemberbcs:RestOfTheWorldMemberbcs:EconomicUncertaintyAdjustmentsMemberifrs-full:LoansAndReceivablesCategoryMember2023-12-310000312069bcs:EconomicUncertaintyAdjustmentsMemberifrs-full:LoansAndReceivablesCategoryMemberifrs-full:TwelvemonthExpectedCreditLossesMember2023-12-310000312069ifrs-full:LifetimeExpectedCreditLossesMemberbcs:EconomicUncertaintyAdjustmentsMemberifrs-full:LoansAndReceivablesCategoryMemberifrs-full:FinancialInstrumentsNotCreditimpairedMember2023-12-310000312069ifrs-full:LifetimeExpectedCreditLossesMemberifrs-full:FinancialInstrumentsCreditimpairedMemberbcs:EconomicUncertaintyAdjustmentsMemberifrs-full:LoansAndReceivablesCategoryMember2023-12-310000312069ifrs-full:MortgagesMembercountry:GBbcs:EconomicUncertaintyAdjustmentsMemberifrs-full:TwelvemonthExpectedCreditLossesMember2022-12-310000312069ifrs-full:LifetimeExpectedCreditLossesMemberifrs-full:MortgagesMembercountry:GBbcs:EconomicUncertaintyAdjustmentsMemberifrs-full:FinancialInstrumentsNotCreditimpairedMember2022-12-310000312069ifrs-full:LifetimeExpectedCreditLossesMemberifrs-full:MortgagesMemberifrs-full:FinancialInstrumentsCreditimpairedMembercountry:GBbcs:EconomicUncertaintyAdjustmentsMember2022-12-310000312069bcs:CreditCardsRetailMembercountry:GBbcs:EconomicUncertaintyAdjustmentsMemberifrs-full:TwelvemonthExpectedCreditLossesMember2022-12-310000312069bcs:CreditCardsRetailMemberifrs-full:LifetimeExpectedCreditLossesMembercountry:GBbcs:EconomicUncertaintyAdjustmentsMemberifrs-full:FinancialInstrumentsNotCreditimpairedMember2022-12-310000312069bcs:CreditCardsRetailMemberifrs-full:LifetimeExpectedCreditLossesMemberifrs-full:FinancialInstrumentsCreditimpairedMembercountry:GBbcs:EconomicUncertaintyAdjustmentsMember2022-12-310000312069bcs:OtherRetailMembercountry:GBbcs:EconomicUncertaintyAdjustmentsMemberifrs-full:TwelvemonthExpectedCreditLossesMember2022-12-310000312069ifrs-full:LifetimeExpectedCreditLossesMemberbcs:OtherRetailMembercountry:GBbcs:EconomicUncertaintyAdjustmentsMemberifrs-full:FinancialInstrumentsNotCreditimpairedMember2022-12-310000312069ifrs-full:LifetimeExpectedCreditLossesMemberbcs:OtherRetailMemberifrs-full:FinancialInstrumentsCreditimpairedMembercountry:GBbcs:EconomicUncertaintyAdjustmentsMember2022-12-310000312069ifrs-full:CorporateLoansMembercountry:GBbcs:EconomicUncertaintyAdjustmentsMemberifrs-full:TwelvemonthExpectedCreditLossesMember2022-12-310000312069ifrs-full:LifetimeExpectedCreditLossesMemberifrs-full:CorporateLoansMembercountry:GBbcs:EconomicUncertaintyAdjustmentsMemberifrs-full:FinancialInstrumentsNotCreditimpairedMember2022-12-310000312069ifrs-full:LifetimeExpectedCreditLossesMemberifrs-full:CorporateLoansMemberifrs-full:FinancialInstrumentsCreditimpairedMembercountry:GBbcs:EconomicUncertaintyAdjustmentsMember2022-12-310000312069country:GBbcs:EconomicUncertaintyAdjustmentsMemberifrs-full:LoansAndReceivablesCategoryMemberifrs-full:TwelvemonthExpectedCreditLossesMember2022-12-310000312069ifrs-full:LifetimeExpectedCreditLossesMembercountry:GBbcs:EconomicUncertaintyAdjustmentsMemberifrs-full:LoansAndReceivablesCategoryMemberifrs-full:FinancialInstrumentsNotCreditimpairedMember2022-12-310000312069ifrs-full:LifetimeExpectedCreditLossesMemberifrs-full:FinancialInstrumentsCreditimpairedMembercountry:GBbcs:EconomicUncertaintyAdjustmentsMemberifrs-full:LoansAndReceivablesCategoryMember2022-12-310000312069ifrs-full:MortgagesMemberbcs:RestOfTheWorldMemberbcs:EconomicUncertaintyAdjustmentsMemberifrs-full:TwelvemonthExpectedCreditLossesMember2022-12-310000312069ifrs-full:LifetimeExpectedCreditLossesMemberifrs-full:MortgagesMemberbcs:RestOfTheWorldMemberbcs:EconomicUncertaintyAdjustmentsMemberifrs-full:FinancialInstrumentsNotCreditimpairedMember2022-12-310000312069ifrs-full:LifetimeExpectedCreditLossesMemberifrs-full:MortgagesMemberifrs-full:FinancialInstrumentsCreditimpairedMemberbcs:RestOfTheWorldMemberbcs:EconomicUncertaintyAdjustmentsMember2022-12-310000312069bcs:CreditCardsRetailMemberbcs:RestOfTheWorldMemberbcs:EconomicUncertaintyAdjustmentsMemberifrs-full:TwelvemonthExpectedCreditLossesMember2022-12-310000312069bcs:CreditCardsRetailMemberifrs-full:LifetimeExpectedCreditLossesMemberbcs:RestOfTheWorldMemberbcs:EconomicUncertaintyAdjustmentsMemberifrs-full:FinancialInstrumentsNotCreditimpairedMember2022-12-310000312069bcs:CreditCardsRetailMemberifrs-full:LifetimeExpectedCreditLossesMemberifrs-full:FinancialInstrumentsCreditimpairedMemberbcs:RestOfTheWorldMemberbcs:EconomicUncertaintyAdjustmentsMember2022-12-310000312069bcs:OtherRetailMemberbcs:RestOfTheWorldMemberbcs:EconomicUncertaintyAdjustmentsMemberifrs-full:TwelvemonthExpectedCreditLossesMember2022-12-310000312069ifrs-full:LifetimeExpectedCreditLossesMemberbcs:OtherRetailMemberbcs:RestOfTheWorldMemberbcs:EconomicUncertaintyAdjustmentsMemberifrs-full:FinancialInstrumentsNotCreditimpairedMember2022-12-310000312069ifrs-full:LifetimeExpectedCreditLossesMemberbcs:OtherRetailMemberifrs-full:FinancialInstrumentsCreditimpairedMemberbcs:RestOfTheWorldMemberbcs:EconomicUncertaintyAdjustmentsMember2022-12-310000312069ifrs-full:CorporateLoansMemberbcs:RestOfTheWorldMemberbcs:EconomicUncertaintyAdjustmentsMemberifrs-full:TwelvemonthExpectedCreditLossesMember2022-12-310000312069ifrs-full:LifetimeExpectedCreditLossesMemberifrs-full:CorporateLoansMemberbcs:RestOfTheWorldMemberbcs:EconomicUncertaintyAdjustmentsMemberifrs-full:FinancialInstrumentsNotCreditimpairedMember2022-12-310000312069ifrs-full:LifetimeExpectedCreditLossesMemberifrs-full:CorporateLoansMemberifrs-full:FinancialInstrumentsCreditimpairedMemberbcs:RestOfTheWorldMemberbcs:EconomicUncertaintyAdjustmentsMember2022-12-310000312069bcs:RestOfTheWorldMemberbcs:EconomicUncertaintyAdjustmentsMemberifrs-full:LoansAndReceivablesCategoryMemberifrs-full:TwelvemonthExpectedCreditLossesMember2022-12-310000312069ifrs-full:LifetimeExpectedCreditLossesMemberbcs:RestOfTheWorldMemberbcs:EconomicUncertaintyAdjustmentsMemberifrs-full:LoansAndReceivablesCategoryMemberifrs-full:FinancialInstrumentsNotCreditimpairedMember2022-12-310000312069ifrs-full:LifetimeExpectedCreditLossesMemberifrs-full:FinancialInstrumentsCreditimpairedMemberbcs:RestOfTheWorldMemberbcs:EconomicUncertaintyAdjustmentsMemberifrs-full:LoansAndReceivablesCategoryMember2022-12-310000312069bcs:EconomicUncertaintyAdjustmentsMemberifrs-full:LoansAndReceivablesCategoryMemberifrs-full:TwelvemonthExpectedCreditLossesMember2022-12-310000312069ifrs-full:LifetimeExpectedCreditLossesMemberbcs:EconomicUncertaintyAdjustmentsMemberifrs-full:LoansAndReceivablesCategoryMemberifrs-full:FinancialInstrumentsNotCreditimpairedMember2022-12-310000312069ifrs-full:LifetimeExpectedCreditLossesMemberifrs-full:FinancialInstrumentsCreditimpairedMemberbcs:EconomicUncertaintyAdjustmentsMemberifrs-full:LoansAndReceivablesCategoryMember2022-12-310000312069ifrs-full:ExpectedCreditLossesCollectivelyAssessedMemberifrs-full:LoansAndReceivablesCategoryMember2023-12-310000312069ifrs-full:ExpectedCreditLossesCollectivelyAssessedMemberifrs-full:LoansAndReceivablesCategoryMember2022-12-310000312069ifrs-full:ExpectedCreditLossesIndividuallyAssessedMemberifrs-full:LoansAndReceivablesCategoryMember2023-12-310000312069ifrs-full:ExpectedCreditLossesIndividuallyAssessedMemberifrs-full:LoansAndReceivablesCategoryMember2022-12-310000312069bcs:ECLFromNonModelledExposuresMemberifrs-full:LoansAndReceivablesCategoryMember2023-12-310000312069bcs:ECLFromNonModelledExposuresMemberifrs-full:LoansAndReceivablesCategoryMember2022-12-310000312069ifrs-full:MajorCustomersMemberbcs:EconomicUncertaintyAdjustmentsMemberifrs-full:LoansAndReceivablesCategoryMember2023-12-310000312069ifrs-full:MajorCustomersMemberbcs:EconomicUncertaintyAdjustmentsMemberifrs-full:LoansAndReceivablesCategoryMember2022-12-310000312069bcs:CustomerAndClientUncertaintyProvisionMemberifrs-full:MortgagesMembercountry:GBbcs:EconomicUncertaintyAdjustmentsMember2023-12-310000312069ifrs-full:CorporateLoansMemberbcs:EconomicUncertaintyAdjustmentsMember2023-12-310000312069ifrs-full:CorporateLoansMemberbcs:EconomicUncertaintyAdjustmentsMember2022-12-310000312069ifrs-full:CorporateLoansMemberbcs:EconomicUncertaintyAdjustmentsMember2023-01-012023-12-310000312069bcs:ModelUncertaintyRiskMemberbcs:EconomicUncertaintyAdjustmentsMemberifrs-full:LoansAndReceivablesCategoryMember2023-12-310000312069bcs:ModelUncertaintyRiskMemberbcs:EconomicUncertaintyAdjustmentsMemberifrs-full:LoansAndReceivablesCategoryMember2022-12-310000312069bcs:ModelUncertaintyRiskMemberifrs-full:MortgagesMemberbcs:EconomicUncertaintyAdjustmentsMember2023-12-310000312069bcs:ModelUncertaintyRiskMemberifrs-full:MortgagesMemberbcs:EconomicUncertaintyAdjustmentsMember2022-12-310000312069bcs:ModelUncertaintyRiskMemberifrs-full:CorporateLoansMemberbcs:EconomicUncertaintyAdjustmentsMember2023-12-310000312069bcs:ModelUncertaintyRiskMemberifrs-full:CorporateLoansMemberbcs:EconomicUncertaintyAdjustmentsMember2022-12-310000312069ifrs-full:CreditRiskMember2023-01-012023-12-31bcs:economic_scenario0000312069bcs:DownsideScenarioMemberifrs-full:CreditRiskMember2023-01-012023-12-310000312069bcs:UpsideScenarioMemberifrs-full:CreditRiskMember2023-01-012023-12-310000312069ifrs-full:MajorCustomersMemberbcs:EconomicUncertaintyAdjustmentsMember2023-12-310000312069ifrs-full:MajorCustomersMemberbcs:EconomicUncertaintyAdjustmentsMember2022-12-310000312069bcs:ModelUncertaintyRiskMemberbcs:EconomicUncertaintyAdjustmentsMember2023-12-310000312069bcs:ModelUncertaintyRiskMemberbcs:EconomicUncertaintyAdjustmentsMember2022-12-310000312069bcs:GrossDomesticProductEconomicVariableMemberbcs:BaselineMembercountry:GBifrs-full:NotLaterThanOneYearMember2023-12-310000312069ifrs-full:LaterThanOneYearAndNotLaterThanTwoYearsMemberbcs:GrossDomesticProductEconomicVariableMemberbcs:BaselineMembercountry:GB2023-12-310000312069ifrs-full:LaterThanTwoYearsAndNotLaterThanThreeYearsMemberbcs:GrossDomesticProductEconomicVariableMemberbcs:BaselineMembercountry:GB2023-12-310000312069bcs:GrossDomesticProductEconomicVariableMemberifrs-full:LaterThanThreeYearsAndNotLaterThanFourYearsMemberbcs:BaselineMembercountry:GB2023-12-310000312069bcs:GrossDomesticProductEconomicVariableMemberbcs:BaselineMembercountry:GBifrs-full:LaterThanFourYearsAndNotLaterThanFiveYearsMember2023-12-310000312069bcs:UnemploymentEconomicCoreVariableMemberbcs:BaselineMembercountry:GBifrs-full:NotLaterThanOneYearMember2023-12-310000312069ifrs-full:LaterThanOneYearAndNotLaterThanTwoYearsMemberbcs:UnemploymentEconomicCoreVariableMemberbcs:BaselineMembercountry:GB2023-12-310000312069ifrs-full:LaterThanTwoYearsAndNotLaterThanThreeYearsMemberbcs:UnemploymentEconomicCoreVariableMemberbcs:BaselineMembercountry:GB2023-12-310000312069bcs:UnemploymentEconomicCoreVariableMemberifrs-full:LaterThanThreeYearsAndNotLaterThanFourYearsMemberbcs:BaselineMembercountry:GB2023-12-310000312069bcs:UnemploymentEconomicCoreVariableMemberbcs:BaselineMembercountry:GBifrs-full:LaterThanFourYearsAndNotLaterThanFiveYearsMember2023-12-310000312069bcs:HousePriceIndexEconomicCoreVariableMemberbcs:BaselineMembercountry:GBifrs-full:NotLaterThanOneYearMember2023-12-310000312069ifrs-full:LaterThanOneYearAndNotLaterThanTwoYearsMemberbcs:HousePriceIndexEconomicCoreVariableMemberbcs:BaselineMembercountry:GB2023-12-310000312069bcs:HousePriceIndexEconomicCoreVariableMemberifrs-full:LaterThanTwoYearsAndNotLaterThanThreeYearsMemberbcs:BaselineMembercountry:GB2023-12-310000312069bcs:HousePriceIndexEconomicCoreVariableMemberifrs-full:LaterThanThreeYearsAndNotLaterThanFourYearsMemberbcs:BaselineMembercountry:GB2023-12-310000312069bcs:HousePriceIndexEconomicCoreVariableMemberbcs:BaselineMembercountry:GBifrs-full:LaterThanFourYearsAndNotLaterThanFiveYearsMember2023-12-310000312069bcs:BankRateMemberbcs:BaselineMembercountry:GBifrs-full:NotLaterThanOneYearMember2023-12-310000312069ifrs-full:LaterThanOneYearAndNotLaterThanTwoYearsMemberbcs:BankRateMemberbcs:BaselineMembercountry:GB2023-12-310000312069bcs:BankRateMemberifrs-full:LaterThanTwoYearsAndNotLaterThanThreeYearsMemberbcs:BaselineMembercountry:GB2023-12-310000312069bcs:BankRateMemberifrs-full:LaterThanThreeYearsAndNotLaterThanFourYearsMemberbcs:BaselineMembercountry:GB2023-12-310000312069bcs:BankRateMemberbcs:BaselineMembercountry:GBifrs-full:LaterThanFourYearsAndNotLaterThanFiveYearsMember2023-12-310000312069country:USbcs:GrossDomesticProductEconomicVariableMemberbcs:BaselineMemberifrs-full:NotLaterThanOneYearMember2023-12-310000312069country:USifrs-full:LaterThanOneYearAndNotLaterThanTwoYearsMemberbcs:GrossDomesticProductEconomicVariableMemberbcs:BaselineMember2023-12-310000312069country:USifrs-full:LaterThanTwoYearsAndNotLaterThanThreeYearsMemberbcs:GrossDomesticProductEconomicVariableMemberbcs:BaselineMember2023-12-310000312069country:USbcs:GrossDomesticProductEconomicVariableMemberifrs-full:LaterThanThreeYearsAndNotLaterThanFourYearsMemberbcs:BaselineMember2023-12-310000312069country:USbcs:GrossDomesticProductEconomicVariableMemberbcs:BaselineMemberifrs-full:LaterThanFourYearsAndNotLaterThanFiveYearsMember2023-12-310000312069country:USbcs:UnemploymentEconomicCoreVariableMemberbcs:BaselineMemberifrs-full:NotLaterThanOneYearMember2023-12-310000312069country:USifrs-full:LaterThanOneYearAndNotLaterThanTwoYearsMemberbcs:UnemploymentEconomicCoreVariableMemberbcs:BaselineMember2023-12-310000312069country:USifrs-full:LaterThanTwoYearsAndNotLaterThanThreeYearsMemberbcs:UnemploymentEconomicCoreVariableMemberbcs:BaselineMember2023-12-310000312069country:USbcs:UnemploymentEconomicCoreVariableMemberifrs-full:LaterThanThreeYearsAndNotLaterThanFourYearsMemberbcs:BaselineMember2023-12-310000312069country:USbcs:UnemploymentEconomicCoreVariableMemberbcs:BaselineMemberifrs-full:LaterThanFourYearsAndNotLaterThanFiveYearsMember2023-12-310000312069country:USbcs:HousePriceIndexEconomicCoreVariableMemberbcs:BaselineMemberifrs-full:NotLaterThanOneYearMember2023-12-310000312069country:USifrs-full:LaterThanOneYearAndNotLaterThanTwoYearsMemberbcs:HousePriceIndexEconomicCoreVariableMemberbcs:BaselineMember2023-12-310000312069country:USbcs:HousePriceIndexEconomicCoreVariableMemberifrs-full:LaterThanTwoYearsAndNotLaterThanThreeYearsMemberbcs:BaselineMember2023-12-310000312069country:USbcs:HousePriceIndexEconomicCoreVariableMemberifrs-full:LaterThanThreeYearsAndNotLaterThanFourYearsMemberbcs:BaselineMember2023-12-310000312069country:USbcs:HousePriceIndexEconomicCoreVariableMemberbcs:BaselineMemberifrs-full:LaterThanFourYearsAndNotLaterThanFiveYearsMember2023-12-310000312069country:USbcs:FederalFundsRateMemberbcs:BaselineMemberifrs-full:NotLaterThanOneYearMember2023-12-310000312069country:USifrs-full:LaterThanOneYearAndNotLaterThanTwoYearsMemberbcs:FederalFundsRateMemberbcs:BaselineMember2023-12-310000312069country:USifrs-full:LaterThanTwoYearsAndNotLaterThanThreeYearsMemberbcs:FederalFundsRateMemberbcs:BaselineMember2023-12-310000312069country:USbcs:FederalFundsRateMemberifrs-full:LaterThanThreeYearsAndNotLaterThanFourYearsMemberbcs:BaselineMember2023-12-310000312069country:USbcs:FederalFundsRateMemberbcs:BaselineMemberifrs-full:LaterThanFourYearsAndNotLaterThanFiveYearsMember2023-12-310000312069bcs:GrossDomesticProductEconomicVariableMemberbcs:DownsideTwoMembercountry:GBifrs-full:NotLaterThanOneYearMember2023-12-310000312069ifrs-full:LaterThanOneYearAndNotLaterThanTwoYearsMemberbcs:GrossDomesticProductEconomicVariableMemberbcs:DownsideTwoMembercountry:GB2023-12-310000312069ifrs-full:LaterThanTwoYearsAndNotLaterThanThreeYearsMemberbcs:GrossDomesticProductEconomicVariableMemberbcs:DownsideTwoMembercountry:GB2023-12-310000312069bcs:GrossDomesticProductEconomicVariableMemberbcs:DownsideTwoMemberifrs-full:LaterThanThreeYearsAndNotLaterThanFourYearsMembercountry:GB2023-12-310000312069bcs:GrossDomesticProductEconomicVariableMemberbcs:DownsideTwoMembercountry:GBifrs-full:LaterThanFourYearsAndNotLaterThanFiveYearsMember2023-12-310000312069bcs:UnemploymentEconomicCoreVariableMemberbcs:DownsideTwoMembercountry:GBifrs-full:NotLaterThanOneYearMember2023-12-310000312069ifrs-full:LaterThanOneYearAndNotLaterThanTwoYearsMemberbcs:UnemploymentEconomicCoreVariableMemberbcs:DownsideTwoMembercountry:GB2023-12-310000312069ifrs-full:LaterThanTwoYearsAndNotLaterThanThreeYearsMemberbcs:UnemploymentEconomicCoreVariableMemberbcs:DownsideTwoMembercountry:GB2023-12-310000312069bcs:UnemploymentEconomicCoreVariableMemberbcs:DownsideTwoMemberifrs-full:LaterThanThreeYearsAndNotLaterThanFourYearsMembercountry:GB2023-12-310000312069bcs:UnemploymentEconomicCoreVariableMemberbcs:DownsideTwoMembercountry:GBifrs-full:LaterThanFourYearsAndNotLaterThanFiveYearsMember2023-12-310000312069bcs:HousePriceIndexEconomicCoreVariableMemberbcs:DownsideTwoMembercountry:GBifrs-full:NotLaterThanOneYearMember2023-12-310000312069ifrs-full:LaterThanOneYearAndNotLaterThanTwoYearsMemberbcs:HousePriceIndexEconomicCoreVariableMemberbcs:DownsideTwoMembercountry:GB2023-12-310000312069bcs:HousePriceIndexEconomicCoreVariableMemberifrs-full:LaterThanTwoYearsAndNotLaterThanThreeYearsMemberbcs:DownsideTwoMembercountry:GB2023-12-310000312069bcs:HousePriceIndexEconomicCoreVariableMemberbcs:DownsideTwoMemberifrs-full:LaterThanThreeYearsAndNotLaterThanFourYearsMembercountry:GB2023-12-310000312069bcs:HousePriceIndexEconomicCoreVariableMemberbcs:DownsideTwoMembercountry:GBifrs-full:LaterThanFourYearsAndNotLaterThanFiveYearsMember2023-12-310000312069bcs:BankRateMemberbcs:DownsideTwoMembercountry:GBifrs-full:NotLaterThanOneYearMember2023-12-310000312069ifrs-full:LaterThanOneYearAndNotLaterThanTwoYearsMemberbcs:BankRateMemberbcs:DownsideTwoMembercountry:GB2023-12-310000312069bcs:BankRateMemberifrs-full:LaterThanTwoYearsAndNotLaterThanThreeYearsMemberbcs:DownsideTwoMembercountry:GB2023-12-310000312069bcs:BankRateMemberbcs:DownsideTwoMemberifrs-full:LaterThanThreeYearsAndNotLaterThanFourYearsMembercountry:GB2023-12-310000312069bcs:BankRateMemberbcs:DownsideTwoMembercountry:GBifrs-full:LaterThanFourYearsAndNotLaterThanFiveYearsMember2023-12-310000312069country:USbcs:GrossDomesticProductEconomicVariableMemberbcs:DownsideTwoMemberifrs-full:NotLaterThanOneYearMember2023-12-310000312069country:USifrs-full:LaterThanOneYearAndNotLaterThanTwoYearsMemberbcs:GrossDomesticProductEconomicVariableMemberbcs:DownsideTwoMember2023-12-310000312069country:USifrs-full:LaterThanTwoYearsAndNotLaterThanThreeYearsMemberbcs:GrossDomesticProductEconomicVariableMemberbcs:DownsideTwoMember2023-12-310000312069country:USbcs:GrossDomesticProductEconomicVariableMemberbcs:DownsideTwoMemberifrs-full:LaterThanThreeYearsAndNotLaterThanFourYearsMember2023-12-310000312069country:USbcs:GrossDomesticProductEconomicVariableMemberbcs:DownsideTwoMemberifrs-full:LaterThanFourYearsAndNotLaterThanFiveYearsMember2023-12-310000312069country:USbcs:UnemploymentEconomicCoreVariableMemberbcs:DownsideTwoMemberifrs-full:NotLaterThanOneYearMember2023-12-310000312069country:USifrs-full:LaterThanOneYearAndNotLaterThanTwoYearsMemberbcs:UnemploymentEconomicCoreVariableMemberbcs:DownsideTwoMember2023-12-310000312069country:USifrs-full:LaterThanTwoYearsAndNotLaterThanThreeYearsMemberbcs:UnemploymentEconomicCoreVariableMemberbcs:DownsideTwoMember2023-12-310000312069country:USbcs:UnemploymentEconomicCoreVariableMemberbcs:DownsideTwoMemberifrs-full:LaterThanThreeYearsAndNotLaterThanFourYearsMember2023-12-310000312069country:USbcs:UnemploymentEconomicCoreVariableMemberbcs:DownsideTwoMemberifrs-full:LaterThanFourYearsAndNotLaterThanFiveYearsMember2023-12-310000312069country:USbcs:HousePriceIndexEconomicCoreVariableMemberbcs:DownsideTwoMemberifrs-full:NotLaterThanOneYearMember2023-12-310000312069country:USifrs-full:LaterThanOneYearAndNotLaterThanTwoYearsMemberbcs:HousePriceIndexEconomicCoreVariableMemberbcs:DownsideTwoMember2023-12-310000312069country:USbcs:HousePriceIndexEconomicCoreVariableMemberifrs-full:LaterThanTwoYearsAndNotLaterThanThreeYearsMemberbcs:DownsideTwoMember2023-12-310000312069country:USbcs:HousePriceIndexEconomicCoreVariableMemberbcs:DownsideTwoMemberifrs-full:LaterThanThreeYearsAndNotLaterThanFourYearsMember2023-12-310000312069country:USbcs:HousePriceIndexEconomicCoreVariableMemberbcs:DownsideTwoMemberifrs-full:LaterThanFourYearsAndNotLaterThanFiveYearsMember2023-12-310000312069country:USbcs:FederalFundsRateMemberbcs:DownsideTwoMemberifrs-full:NotLaterThanOneYearMember2023-12-310000312069country:USifrs-full:LaterThanOneYearAndNotLaterThanTwoYearsMemberbcs:FederalFundsRateMemberbcs:DownsideTwoMember2023-12-310000312069country:USifrs-full:LaterThanTwoYearsAndNotLaterThanThreeYearsMemberbcs:FederalFundsRateMemberbcs:DownsideTwoMember2023-12-310000312069country:USbcs:FederalFundsRateMemberbcs:DownsideTwoMemberifrs-full:LaterThanThreeYearsAndNotLaterThanFourYearsMember2023-12-310000312069country:USbcs:FederalFundsRateMemberbcs:DownsideTwoMemberifrs-full:LaterThanFourYearsAndNotLaterThanFiveYearsMember2023-12-310000312069bcs:GrossDomesticProductEconomicVariableMembercountry:GBbcs:DownsideOneMemberifrs-full:NotLaterThanOneYearMember2023-12-310000312069ifrs-full:LaterThanOneYearAndNotLaterThanTwoYearsMemberbcs:GrossDomesticProductEconomicVariableMembercountry:GBbcs:DownsideOneMember2023-12-310000312069ifrs-full:LaterThanTwoYearsAndNotLaterThanThreeYearsMemberbcs:GrossDomesticProductEconomicVariableMembercountry:GBbcs:DownsideOneMember2023-12-310000312069bcs:GrossDomesticProductEconomicVariableMemberifrs-full:LaterThanThreeYearsAndNotLaterThanFourYearsMembercountry:GBbcs:DownsideOneMember2023-12-310000312069bcs:GrossDomesticProductEconomicVariableMembercountry:GBifrs-full:LaterThanFourYearsAndNotLaterThanFiveYearsMemberbcs:DownsideOneMember2023-12-310000312069bcs:UnemploymentEconomicCoreVariableMembercountry:GBbcs:DownsideOneMemberifrs-full:NotLaterThanOneYearMember2023-12-310000312069ifrs-full:LaterThanOneYearAndNotLaterThanTwoYearsMemberbcs:UnemploymentEconomicCoreVariableMembercountry:GBbcs:DownsideOneMember2023-12-310000312069ifrs-full:LaterThanTwoYearsAndNotLaterThanThreeYearsMemberbcs:UnemploymentEconomicCoreVariableMembercountry:GBbcs:DownsideOneMember2023-12-310000312069bcs:UnemploymentEconomicCoreVariableMemberifrs-full:LaterThanThreeYearsAndNotLaterThanFourYearsMembercountry:GBbcs:DownsideOneMember2023-12-310000312069bcs:UnemploymentEconomicCoreVariableMembercountry:GBifrs-full:LaterThanFourYearsAndNotLaterThanFiveYearsMemberbcs:DownsideOneMember2023-12-310000312069bcs:HousePriceIndexEconomicCoreVariableMembercountry:GBbcs:DownsideOneMemberifrs-full:NotLaterThanOneYearMember2023-12-310000312069ifrs-full:LaterThanOneYearAndNotLaterThanTwoYearsMemberbcs:HousePriceIndexEconomicCoreVariableMembercountry:GBbcs:DownsideOneMember2023-12-310000312069bcs:HousePriceIndexEconomicCoreVariableMemberifrs-full:LaterThanTwoYearsAndNotLaterThanThreeYearsMembercountry:GBbcs:DownsideOneMember2023-12-310000312069bcs:HousePriceIndexEconomicCoreVariableMemberifrs-full:LaterThanThreeYearsAndNotLaterThanFourYearsMembercountry:GBbcs:DownsideOneMember2023-12-310000312069bcs:HousePriceIndexEconomicCoreVariableMembercountry:GBifrs-full:LaterThanFourYearsAndNotLaterThanFiveYearsMemberbcs:DownsideOneMember2023-12-310000312069bcs:BankRateMembercountry:GBbcs:DownsideOneMemberifrs-full:NotLaterThanOneYearMember2023-12-310000312069ifrs-full:LaterThanOneYearAndNotLaterThanTwoYearsMemberbcs:BankRateMembercountry:GBbcs:DownsideOneMember2023-12-310000312069bcs:BankRateMemberifrs-full:LaterThanTwoYearsAndNotLaterThanThreeYearsMembercountry:GBbcs:DownsideOneMember2023-12-310000312069bcs:BankRateMemberifrs-full:LaterThanThreeYearsAndNotLaterThanFourYearsMembercountry:GBbcs:DownsideOneMember2023-12-310000312069bcs:BankRateMembercountry:GBifrs-full:LaterThanFourYearsAndNotLaterThanFiveYearsMemberbcs:DownsideOneMember2023-12-310000312069country:USbcs:GrossDomesticProductEconomicVariableMemberbcs:DownsideOneMemberifrs-full:NotLaterThanOneYearMember2023-12-310000312069country:USifrs-full:LaterThanOneYearAndNotLaterThanTwoYearsMemberbcs:GrossDomesticProductEconomicVariableMemberbcs:DownsideOneMember2023-12-310000312069country:USifrs-full:LaterThanTwoYearsAndNotLaterThanThreeYearsMemberbcs:GrossDomesticProductEconomicVariableMemberbcs:DownsideOneMember2023-12-310000312069country:USbcs:GrossDomesticProductEconomicVariableMemberifrs-full:LaterThanThreeYearsAndNotLaterThanFourYearsMemberbcs:DownsideOneMember2023-12-310000312069country:USbcs:GrossDomesticProductEconomicVariableMemberifrs-full:LaterThanFourYearsAndNotLaterThanFiveYearsMemberbcs:DownsideOneMember2023-12-310000312069country:USbcs:UnemploymentEconomicCoreVariableMemberbcs:DownsideOneMemberifrs-full:NotLaterThanOneYearMember2023-12-310000312069country:USifrs-full:LaterThanOneYearAndNotLaterThanTwoYearsMemberbcs:UnemploymentEconomicCoreVariableMemberbcs:DownsideOneMember2023-12-310000312069country:USifrs-full:LaterThanTwoYearsAndNotLaterThanThreeYearsMemberbcs:UnemploymentEconomicCoreVariableMemberbcs:DownsideOneMember2023-12-310000312069country:USbcs:UnemploymentEconomicCoreVariableMemberifrs-full:LaterThanThreeYearsAndNotLaterThanFourYearsMemberbcs:DownsideOneMember2023-12-310000312069country:USbcs:UnemploymentEconomicCoreVariableMemberifrs-full:LaterThanFourYearsAndNotLaterThanFiveYearsMemberbcs:DownsideOneMember2023-12-310000312069country:USbcs:HousePriceIndexEconomicCoreVariableMemberbcs:DownsideOneMemberifrs-full:NotLaterThanOneYearMember2023-12-310000312069country:USifrs-full:LaterThanOneYearAndNotLaterThanTwoYearsMemberbcs:HousePriceIndexEconomicCoreVariableMemberbcs:DownsideOneMember2023-12-310000312069country:USbcs:HousePriceIndexEconomicCoreVariableMemberifrs-full:LaterThanTwoYearsAndNotLaterThanThreeYearsMemberbcs:DownsideOneMember2023-12-310000312069country:USbcs:HousePriceIndexEconomicCoreVariableMemberifrs-full:LaterThanThreeYearsAndNotLaterThanFourYearsMemberbcs:DownsideOneMember2023-12-310000312069country:USbcs:HousePriceIndexEconomicCoreVariableMemberifrs-full:LaterThanFourYearsAndNotLaterThanFiveYearsMemberbcs:DownsideOneMember2023-12-310000312069country:USbcs:FederalFundsRateMemberbcs:DownsideOneMemberifrs-full:NotLaterThanOneYearMember2023-12-310000312069country:USifrs-full:LaterThanOneYearAndNotLaterThanTwoYearsMemberbcs:FederalFundsRateMemberbcs:DownsideOneMember2023-12-310000312069country:USifrs-full:LaterThanTwoYearsAndNotLaterThanThreeYearsMemberbcs:FederalFundsRateMemberbcs:DownsideOneMember2023-12-310000312069country:USbcs:FederalFundsRateMemberifrs-full:LaterThanThreeYearsAndNotLaterThanFourYearsMemberbcs:DownsideOneMember2023-12-310000312069country:USbcs:FederalFundsRateMemberifrs-full:LaterThanFourYearsAndNotLaterThanFiveYearsMemberbcs:DownsideOneMember2023-12-310000312069bcs:UpsideTwoMemberbcs:GrossDomesticProductEconomicVariableMembercountry:GBifrs-full:NotLaterThanOneYearMember2023-12-310000312069ifrs-full:LaterThanOneYearAndNotLaterThanTwoYearsMemberbcs:UpsideTwoMemberbcs:GrossDomesticProductEconomicVariableMembercountry:GB2023-12-310000312069ifrs-full:LaterThanTwoYearsAndNotLaterThanThreeYearsMemberbcs:UpsideTwoMemberbcs:GrossDomesticProductEconomicVariableMembercountry:GB2023-12-310000312069bcs:UpsideTwoMemberbcs:GrossDomesticProductEconomicVariableMemberifrs-full:LaterThanThreeYearsAndNotLaterThanFourYearsMembercountry:GB2023-12-310000312069bcs:UpsideTwoMemberbcs:GrossDomesticProductEconomicVariableMembercountry:GBifrs-full:LaterThanFourYearsAndNotLaterThanFiveYearsMember2023-12-310000312069bcs:UnemploymentEconomicCoreVariableMemberbcs:UpsideTwoMembercountry:GBifrs-full:NotLaterThanOneYearMember2023-12-310000312069ifrs-full:LaterThanOneYearAndNotLaterThanTwoYearsMemberbcs:UnemploymentEconomicCoreVariableMemberbcs:UpsideTwoMembercountry:GB2023-12-310000312069ifrs-full:LaterThanTwoYearsAndNotLaterThanThreeYearsMemberbcs:UnemploymentEconomicCoreVariableMemberbcs:UpsideTwoMembercountry:GB2023-12-310000312069bcs:UnemploymentEconomicCoreVariableMemberbcs:UpsideTwoMemberifrs-full:LaterThanThreeYearsAndNotLaterThanFourYearsMembercountry:GB2023-12-310000312069bcs:UnemploymentEconomicCoreVariableMemberbcs:UpsideTwoMembercountry:GBifrs-full:LaterThanFourYearsAndNotLaterThanFiveYearsMember2023-12-310000312069bcs:HousePriceIndexEconomicCoreVariableMemberbcs:UpsideTwoMembercountry:GBifrs-full:NotLaterThanOneYearMember2023-12-310000312069ifrs-full:LaterThanOneYearAndNotLaterThanTwoYearsMemberbcs:HousePriceIndexEconomicCoreVariableMemberbcs:UpsideTwoMembercountry:GB2023-12-310000312069bcs:HousePriceIndexEconomicCoreVariableMemberifrs-full:LaterThanTwoYearsAndNotLaterThanThreeYearsMemberbcs:UpsideTwoMembercountry:GB2023-12-310000312069bcs:HousePriceIndexEconomicCoreVariableMemberbcs:UpsideTwoMemberifrs-full:LaterThanThreeYearsAndNotLaterThanFourYearsMembercountry:GB2023-12-310000312069bcs:HousePriceIndexEconomicCoreVariableMemberbcs:UpsideTwoMembercountry:GBifrs-full:LaterThanFourYearsAndNotLaterThanFiveYearsMember2023-12-310000312069bcs:BankRateMemberbcs:UpsideTwoMembercountry:GBifrs-full:NotLaterThanOneYearMember2023-12-310000312069ifrs-full:LaterThanOneYearAndNotLaterThanTwoYearsMemberbcs:BankRateMemberbcs:UpsideTwoMembercountry:GB2023-12-310000312069bcs:BankRateMemberifrs-full:LaterThanTwoYearsAndNotLaterThanThreeYearsMemberbcs:UpsideTwoMembercountry:GB2023-12-310000312069bcs:BankRateMemberbcs:UpsideTwoMemberifrs-full:LaterThanThreeYearsAndNotLaterThanFourYearsMembercountry:GB2023-12-310000312069bcs:BankRateMemberbcs:UpsideTwoMembercountry:GBifrs-full:LaterThanFourYearsAndNotLaterThanFiveYearsMember2023-12-310000312069country:USbcs:UpsideTwoMemberbcs:GrossDomesticProductEconomicVariableMemberifrs-full:NotLaterThanOneYearMember2023-12-310000312069country:USifrs-full:LaterThanOneYearAndNotLaterThanTwoYearsMemberbcs:UpsideTwoMemberbcs:GrossDomesticProductEconomicVariableMember2023-12-310000312069country:USifrs-full:LaterThanTwoYearsAndNotLaterThanThreeYearsMemberbcs:UpsideTwoMemberbcs:GrossDomesticProductEconomicVariableMember2023-12-310000312069country:USbcs:UpsideTwoMemberbcs:GrossDomesticProductEconomicVariableMemberifrs-full:LaterThanThreeYearsAndNotLaterThanFourYearsMember2023-12-310000312069country:USbcs:UpsideTwoMemberbcs:GrossDomesticProductEconomicVariableMemberifrs-full:LaterThanFourYearsAndNotLaterThanFiveYearsMember2023-12-310000312069country:USbcs:UnemploymentEconomicCoreVariableMemberbcs:UpsideTwoMemberifrs-full:NotLaterThanOneYearMember2023-12-310000312069country:USifrs-full:LaterThanOneYearAndNotLaterThanTwoYearsMemberbcs:UnemploymentEconomicCoreVariableMemberbcs:UpsideTwoMember2023-12-310000312069country:USifrs-full:LaterThanTwoYearsAndNotLaterThanThreeYearsMemberbcs:UnemploymentEconomicCoreVariableMemberbcs:UpsideTwoMember2023-12-310000312069country:USbcs:UnemploymentEconomicCoreVariableMemberbcs:UpsideTwoMemberifrs-full:LaterThanThreeYearsAndNotLaterThanFourYearsMember2023-12-310000312069country:USbcs:UnemploymentEconomicCoreVariableMemberbcs:UpsideTwoMemberifrs-full:LaterThanFourYearsAndNotLaterThanFiveYearsMember2023-12-310000312069country:USbcs:HousePriceIndexEconomicCoreVariableMemberbcs:UpsideTwoMemberifrs-full:NotLaterThanOneYearMember2023-12-310000312069country:USifrs-full:LaterThanOneYearAndNotLaterThanTwoYearsMemberbcs:HousePriceIndexEconomicCoreVariableMemberbcs:UpsideTwoMember2023-12-310000312069country:USbcs:HousePriceIndexEconomicCoreVariableMemberifrs-full:LaterThanTwoYearsAndNotLaterThanThreeYearsMemberbcs:UpsideTwoMember2023-12-310000312069country:USbcs:HousePriceIndexEconomicCoreVariableMemberbcs:UpsideTwoMemberifrs-full:LaterThanThreeYearsAndNotLaterThanFourYearsMember2023-12-310000312069country:USbcs:HousePriceIndexEconomicCoreVariableMemberbcs:UpsideTwoMemberifrs-full:LaterThanFourYearsAndNotLaterThanFiveYearsMember2023-12-310000312069country:USbcs:FederalFundsRateMemberbcs:UpsideTwoMemberifrs-full:NotLaterThanOneYearMember2023-12-310000312069country:USifrs-full:LaterThanOneYearAndNotLaterThanTwoYearsMemberbcs:FederalFundsRateMemberbcs:UpsideTwoMember2023-12-310000312069country:USifrs-full:LaterThanTwoYearsAndNotLaterThanThreeYearsMemberbcs:FederalFundsRateMemberbcs:UpsideTwoMember2023-12-310000312069country:USbcs:FederalFundsRateMemberbcs:UpsideTwoMemberifrs-full:LaterThanThreeYearsAndNotLaterThanFourYearsMember2023-12-310000312069country:USbcs:FederalFundsRateMemberbcs:UpsideTwoMemberifrs-full:LaterThanFourYearsAndNotLaterThanFiveYearsMember2023-12-310000312069bcs:GrossDomesticProductEconomicVariableMemberbcs:UpsideOneMembercountry:GBifrs-full:NotLaterThanOneYearMember2023-12-310000312069ifrs-full:LaterThanOneYearAndNotLaterThanTwoYearsMemberbcs:GrossDomesticProductEconomicVariableMemberbcs:UpsideOneMembercountry:GB2023-12-310000312069ifrs-full:LaterThanTwoYearsAndNotLaterThanThreeYearsMemberbcs:GrossDomesticProductEconomicVariableMemberbcs:UpsideOneMembercountry:GB2023-12-310000312069bcs:GrossDomesticProductEconomicVariableMemberifrs-full:LaterThanThreeYearsAndNotLaterThanFourYearsMemberbcs:UpsideOneMembercountry:GB2023-12-310000312069bcs:GrossDomesticProductEconomicVariableMemberbcs:UpsideOneMembercountry:GBifrs-full:LaterThanFourYearsAndNotLaterThanFiveYearsMember2023-12-310000312069bcs:UnemploymentEconomicCoreVariableMemberbcs:UpsideOneMembercountry:GBifrs-full:NotLaterThanOneYearMember2023-12-310000312069ifrs-full:LaterThanOneYearAndNotLaterThanTwoYearsMemberbcs:UnemploymentEconomicCoreVariableMemberbcs:UpsideOneMembercountry:GB2023-12-310000312069ifrs-full:LaterThanTwoYearsAndNotLaterThanThreeYearsMemberbcs:UnemploymentEconomicCoreVariableMemberbcs:UpsideOneMembercountry:GB2023-12-310000312069bcs:UnemploymentEconomicCoreVariableMemberifrs-full:LaterThanThreeYearsAndNotLaterThanFourYearsMemberbcs:UpsideOneMembercountry:GB2023-12-310000312069bcs:UnemploymentEconomicCoreVariableMemberbcs:UpsideOneMembercountry:GBifrs-full:LaterThanFourYearsAndNotLaterThanFiveYearsMember2023-12-310000312069bcs:HousePriceIndexEconomicCoreVariableMemberbcs:UpsideOneMembercountry:GBifrs-full:NotLaterThanOneYearMember2023-12-310000312069ifrs-full:LaterThanOneYearAndNotLaterThanTwoYearsMemberbcs:HousePriceIndexEconomicCoreVariableMemberbcs:UpsideOneMembercountry:GB2023-12-310000312069bcs:HousePriceIndexEconomicCoreVariableMemberifrs-full:LaterThanTwoYearsAndNotLaterThanThreeYearsMemberbcs:UpsideOneMembercountry:GB2023-12-310000312069bcs:HousePriceIndexEconomicCoreVariableMemberifrs-full:LaterThanThreeYearsAndNotLaterThanFourYearsMemberbcs:UpsideOneMembercountry:GB2023-12-310000312069bcs:HousePriceIndexEconomicCoreVariableMemberbcs:UpsideOneMembercountry:GBifrs-full:LaterThanFourYearsAndNotLaterThanFiveYearsMember2023-12-310000312069bcs:BankRateMemberbcs:UpsideOneMembercountry:GBifrs-full:NotLaterThanOneYearMember2023-12-310000312069ifrs-full:LaterThanOneYearAndNotLaterThanTwoYearsMemberbcs:BankRateMemberbcs:UpsideOneMembercountry:GB2023-12-310000312069bcs:BankRateMemberifrs-full:LaterThanTwoYearsAndNotLaterThanThreeYearsMemberbcs:UpsideOneMembercountry:GB2023-12-310000312069bcs:BankRateMemberifrs-full:LaterThanThreeYearsAndNotLaterThanFourYearsMemberbcs:UpsideOneMembercountry:GB2023-12-310000312069bcs:BankRateMemberbcs:UpsideOneMembercountry:GBifrs-full:LaterThanFourYearsAndNotLaterThanFiveYearsMember2023-12-310000312069country:USbcs:GrossDomesticProductEconomicVariableMemberbcs:UpsideOneMemberifrs-full:NotLaterThanOneYearMember2023-12-310000312069country:USifrs-full:LaterThanOneYearAndNotLaterThanTwoYearsMemberbcs:GrossDomesticProductEconomicVariableMemberbcs:UpsideOneMember2023-12-310000312069country:USifrs-full:LaterThanTwoYearsAndNotLaterThanThreeYearsMemberbcs:GrossDomesticProductEconomicVariableMemberbcs:UpsideOneMember2023-12-310000312069country:USbcs:GrossDomesticProductEconomicVariableMemberifrs-full:LaterThanThreeYearsAndNotLaterThanFourYearsMemberbcs:UpsideOneMember2023-12-310000312069country:USbcs:GrossDomesticProductEconomicVariableMemberbcs:UpsideOneMemberifrs-full:LaterThanFourYearsAndNotLaterThanFiveYearsMember2023-12-310000312069country:USbcs:UnemploymentEconomicCoreVariableMemberbcs:UpsideOneMemberifrs-full:NotLaterThanOneYearMember2023-12-310000312069country:USifrs-full:LaterThanOneYearAndNotLaterThanTwoYearsMemberbcs:UnemploymentEconomicCoreVariableMemberbcs:UpsideOneMember2023-12-310000312069country:USifrs-full:LaterThanTwoYearsAndNotLaterThanThreeYearsMemberbcs:UnemploymentEconomicCoreVariableMemberbcs:UpsideOneMember2023-12-310000312069country:USbcs:UnemploymentEconomicCoreVariableMemberifrs-full:LaterThanThreeYearsAndNotLaterThanFourYearsMemberbcs:UpsideOneMember2023-12-310000312069country:USbcs:UnemploymentEconomicCoreVariableMemberbcs:UpsideOneMemberifrs-full:LaterThanFourYearsAndNotLaterThanFiveYearsMember2023-12-310000312069country:USbcs:HousePriceIndexEconomicCoreVariableMemberbcs:UpsideOneMemberifrs-full:NotLaterThanOneYearMember2023-12-310000312069country:USifrs-full:LaterThanOneYearAndNotLaterThanTwoYearsMemberbcs:HousePriceIndexEconomicCoreVariableMemberbcs:UpsideOneMember2023-12-310000312069country:USbcs:HousePriceIndexEconomicCoreVariableMemberifrs-full:LaterThanTwoYearsAndNotLaterThanThreeYearsMemberbcs:UpsideOneMember2023-12-310000312069country:USbcs:HousePriceIndexEconomicCoreVariableMemberifrs-full:LaterThanThreeYearsAndNotLaterThanFourYearsMemberbcs:UpsideOneMember2023-12-310000312069country:USbcs:HousePriceIndexEconomicCoreVariableMemberbcs:UpsideOneMemberifrs-full:LaterThanFourYearsAndNotLaterThanFiveYearsMember2023-12-310000312069country:USbcs:FederalFundsRateMemberbcs:UpsideOneMemberifrs-full:NotLaterThanOneYearMember2023-12-310000312069country:USifrs-full:LaterThanOneYearAndNotLaterThanTwoYearsMemberbcs:FederalFundsRateMemberbcs:UpsideOneMember2023-12-310000312069country:USifrs-full:LaterThanTwoYearsAndNotLaterThanThreeYearsMemberbcs:FederalFundsRateMemberbcs:UpsideOneMember2023-12-310000312069country:USbcs:FederalFundsRateMemberifrs-full:LaterThanThreeYearsAndNotLaterThanFourYearsMemberbcs:UpsideOneMember2023-12-310000312069country:USbcs:FederalFundsRateMemberbcs:UpsideOneMemberifrs-full:LaterThanFourYearsAndNotLaterThanFiveYearsMember2023-12-310000312069bcs:GrossDomesticProductEconomicVariableMemberbcs:BaselineMembercountry:GBifrs-full:NotLaterThanOneYearMember2022-12-310000312069ifrs-full:LaterThanOneYearAndNotLaterThanTwoYearsMemberbcs:GrossDomesticProductEconomicVariableMemberbcs:BaselineMembercountry:GB2022-12-310000312069ifrs-full:LaterThanTwoYearsAndNotLaterThanThreeYearsMemberbcs:GrossDomesticProductEconomicVariableMemberbcs:BaselineMembercountry:GB2022-12-310000312069bcs:GrossDomesticProductEconomicVariableMemberifrs-full:LaterThanThreeYearsAndNotLaterThanFourYearsMemberbcs:BaselineMembercountry:GB2022-12-310000312069bcs:GrossDomesticProductEconomicVariableMemberbcs:BaselineMembercountry:GBifrs-full:LaterThanFourYearsAndNotLaterThanFiveYearsMember2022-12-310000312069bcs:UnemploymentEconomicCoreVariableMemberbcs:BaselineMembercountry:GBifrs-full:NotLaterThanOneYearMember2022-12-310000312069ifrs-full:LaterThanOneYearAndNotLaterThanTwoYearsMemberbcs:UnemploymentEconomicCoreVariableMemberbcs:BaselineMembercountry:GB2022-12-310000312069ifrs-full:LaterThanTwoYearsAndNotLaterThanThreeYearsMemberbcs:UnemploymentEconomicCoreVariableMemberbcs:BaselineMembercountry:GB2022-12-310000312069bcs:UnemploymentEconomicCoreVariableMemberifrs-full:LaterThanThreeYearsAndNotLaterThanFourYearsMemberbcs:BaselineMembercountry:GB2022-12-310000312069bcs:UnemploymentEconomicCoreVariableMemberbcs:BaselineMembercountry:GBifrs-full:LaterThanFourYearsAndNotLaterThanFiveYearsMember2022-12-310000312069bcs:HousePriceIndexEconomicCoreVariableMemberbcs:BaselineMembercountry:GBifrs-full:NotLaterThanOneYearMember2022-12-310000312069ifrs-full:LaterThanOneYearAndNotLaterThanTwoYearsMemberbcs:HousePriceIndexEconomicCoreVariableMemberbcs:BaselineMembercountry:GB2022-12-310000312069bcs:HousePriceIndexEconomicCoreVariableMemberifrs-full:LaterThanTwoYearsAndNotLaterThanThreeYearsMemberbcs:BaselineMembercountry:GB2022-12-310000312069bcs:HousePriceIndexEconomicCoreVariableMemberifrs-full:LaterThanThreeYearsAndNotLaterThanFourYearsMemberbcs:BaselineMembercountry:GB2022-12-310000312069bcs:HousePriceIndexEconomicCoreVariableMemberbcs:BaselineMembercountry:GBifrs-full:LaterThanFourYearsAndNotLaterThanFiveYearsMember2022-12-310000312069bcs:BankRateMemberbcs:BaselineMembercountry:GBifrs-full:NotLaterThanOneYearMember2022-12-310000312069ifrs-full:LaterThanOneYearAndNotLaterThanTwoYearsMemberbcs:BankRateMemberbcs:BaselineMembercountry:GB2022-12-310000312069bcs:BankRateMemberifrs-full:LaterThanTwoYearsAndNotLaterThanThreeYearsMemberbcs:BaselineMembercountry:GB2022-12-310000312069bcs:BankRateMemberifrs-full:LaterThanThreeYearsAndNotLaterThanFourYearsMemberbcs:BaselineMembercountry:GB2022-12-310000312069bcs:BankRateMemberbcs:BaselineMembercountry:GBifrs-full:LaterThanFourYearsAndNotLaterThanFiveYearsMember2022-12-310000312069country:USbcs:GrossDomesticProductEconomicVariableMemberbcs:BaselineMemberifrs-full:NotLaterThanOneYearMember2022-12-310000312069country:USifrs-full:LaterThanOneYearAndNotLaterThanTwoYearsMemberbcs:GrossDomesticProductEconomicVariableMemberbcs:BaselineMember2022-12-310000312069country:USifrs-full:LaterThanTwoYearsAndNotLaterThanThreeYearsMemberbcs:GrossDomesticProductEconomicVariableMemberbcs:BaselineMember2022-12-310000312069country:USbcs:GrossDomesticProductEconomicVariableMemberifrs-full:LaterThanThreeYearsAndNotLaterThanFourYearsMemberbcs:BaselineMember2022-12-310000312069country:USbcs:GrossDomesticProductEconomicVariableMemberbcs:BaselineMemberifrs-full:LaterThanFourYearsAndNotLaterThanFiveYearsMember2022-12-310000312069country:USbcs:UnemploymentEconomicCoreVariableMemberbcs:BaselineMemberifrs-full:NotLaterThanOneYearMember2022-12-310000312069country:USifrs-full:LaterThanOneYearAndNotLaterThanTwoYearsMemberbcs:UnemploymentEconomicCoreVariableMemberbcs:BaselineMember2022-12-310000312069country:USifrs-full:LaterThanTwoYearsAndNotLaterThanThreeYearsMemberbcs:UnemploymentEconomicCoreVariableMemberbcs:BaselineMember2022-12-310000312069country:USbcs:UnemploymentEconomicCoreVariableMemberifrs-full:LaterThanThreeYearsAndNotLaterThanFourYearsMemberbcs:BaselineMember2022-12-310000312069country:USbcs:UnemploymentEconomicCoreVariableMemberbcs:BaselineMemberifrs-full:LaterThanFourYearsAndNotLaterThanFiveYearsMember2022-12-310000312069country:USbcs:HousePriceIndexEconomicCoreVariableMemberbcs:BaselineMemberifrs-full:NotLaterThanOneYearMember2022-12-310000312069country:USifrs-full:LaterThanOneYearAndNotLaterThanTwoYearsMemberbcs:HousePriceIndexEconomicCoreVariableMemberbcs:BaselineMember2022-12-310000312069country:USbcs:HousePriceIndexEconomicCoreVariableMemberifrs-full:LaterThanTwoYearsAndNotLaterThanThreeYearsMemberbcs:BaselineMember2022-12-310000312069country:USbcs:HousePriceIndexEconomicCoreVariableMemberifrs-full:LaterThanThreeYearsAndNotLaterThanFourYearsMemberbcs:BaselineMember2022-12-310000312069country:USbcs:HousePriceIndexEconomicCoreVariableMemberbcs:BaselineMemberifrs-full:LaterThanFourYearsAndNotLaterThanFiveYearsMember2022-12-310000312069country:USbcs:FederalFundsRateMemberbcs:BaselineMemberifrs-full:NotLaterThanOneYearMember2022-12-310000312069country:USifrs-full:LaterThanOneYearAndNotLaterThanTwoYearsMemberbcs:FederalFundsRateMemberbcs:BaselineMember2022-12-310000312069country:USifrs-full:LaterThanTwoYearsAndNotLaterThanThreeYearsMemberbcs:FederalFundsRateMemberbcs:BaselineMember2022-12-310000312069country:USbcs:FederalFundsRateMemberifrs-full:LaterThanThreeYearsAndNotLaterThanFourYearsMemberbcs:BaselineMember2022-12-310000312069country:USbcs:FederalFundsRateMemberbcs:BaselineMemberifrs-full:LaterThanFourYearsAndNotLaterThanFiveYearsMember2022-12-310000312069bcs:GrossDomesticProductEconomicVariableMemberbcs:DownsideTwoMembercountry:GBifrs-full:NotLaterThanOneYearMember2022-12-310000312069ifrs-full:LaterThanOneYearAndNotLaterThanTwoYearsMemberbcs:GrossDomesticProductEconomicVariableMemberbcs:DownsideTwoMembercountry:GB2022-12-310000312069ifrs-full:LaterThanTwoYearsAndNotLaterThanThreeYearsMemberbcs:GrossDomesticProductEconomicVariableMemberbcs:DownsideTwoMembercountry:GB2022-12-310000312069bcs:GrossDomesticProductEconomicVariableMemberbcs:DownsideTwoMemberifrs-full:LaterThanThreeYearsAndNotLaterThanFourYearsMembercountry:GB2022-12-310000312069bcs:GrossDomesticProductEconomicVariableMemberbcs:DownsideTwoMembercountry:GBifrs-full:LaterThanFourYearsAndNotLaterThanFiveYearsMember2022-12-310000312069bcs:UnemploymentEconomicCoreVariableMemberbcs:DownsideTwoMembercountry:GBifrs-full:NotLaterThanOneYearMember2022-12-310000312069ifrs-full:LaterThanOneYearAndNotLaterThanTwoYearsMemberbcs:UnemploymentEconomicCoreVariableMemberbcs:DownsideTwoMembercountry:GB2022-12-310000312069ifrs-full:LaterThanTwoYearsAndNotLaterThanThreeYearsMemberbcs:UnemploymentEconomicCoreVariableMemberbcs:DownsideTwoMembercountry:GB2022-12-310000312069bcs:UnemploymentEconomicCoreVariableMemberbcs:DownsideTwoMemberifrs-full:LaterThanThreeYearsAndNotLaterThanFourYearsMembercountry:GB2022-12-310000312069bcs:UnemploymentEconomicCoreVariableMemberbcs:DownsideTwoMembercountry:GBifrs-full:LaterThanFourYearsAndNotLaterThanFiveYearsMember2022-12-310000312069bcs:HousePriceIndexEconomicCoreVariableMemberbcs:DownsideTwoMembercountry:GBifrs-full:NotLaterThanOneYearMember2022-12-310000312069ifrs-full:LaterThanOneYearAndNotLaterThanTwoYearsMemberbcs:HousePriceIndexEconomicCoreVariableMemberbcs:DownsideTwoMembercountry:GB2022-12-310000312069bcs:HousePriceIndexEconomicCoreVariableMemberifrs-full:LaterThanTwoYearsAndNotLaterThanThreeYearsMemberbcs:DownsideTwoMembercountry:GB2022-12-310000312069bcs:HousePriceIndexEconomicCoreVariableMemberbcs:DownsideTwoMemberifrs-full:LaterThanThreeYearsAndNotLaterThanFourYearsMembercountry:GB2022-12-310000312069bcs:HousePriceIndexEconomicCoreVariableMemberbcs:DownsideTwoMembercountry:GBifrs-full:LaterThanFourYearsAndNotLaterThanFiveYearsMember2022-12-310000312069bcs:BankRateMemberbcs:DownsideTwoMembercountry:GBifrs-full:NotLaterThanOneYearMember2022-12-310000312069ifrs-full:LaterThanOneYearAndNotLaterThanTwoYearsMemberbcs:BankRateMemberbcs:DownsideTwoMembercountry:GB2022-12-310000312069bcs:BankRateMemberifrs-full:LaterThanTwoYearsAndNotLaterThanThreeYearsMemberbcs:DownsideTwoMembercountry:GB2022-12-310000312069bcs:BankRateMemberbcs:DownsideTwoMemberifrs-full:LaterThanThreeYearsAndNotLaterThanFourYearsMembercountry:GB2022-12-310000312069bcs:BankRateMemberbcs:DownsideTwoMembercountry:GBifrs-full:LaterThanFourYearsAndNotLaterThanFiveYearsMember2022-12-310000312069country:USbcs:GrossDomesticProductEconomicVariableMemberbcs:DownsideTwoMemberifrs-full:NotLaterThanOneYearMember2022-12-310000312069country:USifrs-full:LaterThanOneYearAndNotLaterThanTwoYearsMemberbcs:GrossDomesticProductEconomicVariableMemberbcs:DownsideTwoMember2022-12-310000312069country:USifrs-full:LaterThanTwoYearsAndNotLaterThanThreeYearsMemberbcs:GrossDomesticProductEconomicVariableMemberbcs:DownsideTwoMember2022-12-310000312069country:USbcs:GrossDomesticProductEconomicVariableMemberbcs:DownsideTwoMemberifrs-full:LaterThanThreeYearsAndNotLaterThanFourYearsMember2022-12-310000312069country:USbcs:GrossDomesticProductEconomicVariableMemberbcs:DownsideTwoMemberifrs-full:LaterThanFourYearsAndNotLaterThanFiveYearsMember2022-12-310000312069country:USbcs:UnemploymentEconomicCoreVariableMemberbcs:DownsideTwoMemberifrs-full:NotLaterThanOneYearMember2022-12-310000312069country:USifrs-full:LaterThanOneYearAndNotLaterThanTwoYearsMemberbcs:UnemploymentEconomicCoreVariableMemberbcs:DownsideTwoMember2022-12-310000312069country:USifrs-full:LaterThanTwoYearsAndNotLaterThanThreeYearsMemberbcs:UnemploymentEconomicCoreVariableMemberbcs:DownsideTwoMember2022-12-310000312069country:USbcs:UnemploymentEconomicCoreVariableMemberbcs:DownsideTwoMemberifrs-full:LaterThanThreeYearsAndNotLaterThanFourYearsMember2022-12-310000312069country:USbcs:UnemploymentEconomicCoreVariableMemberbcs:DownsideTwoMemberifrs-full:LaterThanFourYearsAndNotLaterThanFiveYearsMember2022-12-310000312069country:USbcs:HousePriceIndexEconomicCoreVariableMemberbcs:DownsideTwoMemberifrs-full:NotLaterThanOneYearMember2022-12-310000312069country:USifrs-full:LaterThanOneYearAndNotLaterThanTwoYearsMemberbcs:HousePriceIndexEconomicCoreVariableMemberbcs:DownsideTwoMember2022-12-310000312069country:USbcs:HousePriceIndexEconomicCoreVariableMemberifrs-full:LaterThanTwoYearsAndNotLaterThanThreeYearsMemberbcs:DownsideTwoMember2022-12-310000312069country:USbcs:HousePriceIndexEconomicCoreVariableMemberbcs:DownsideTwoMemberifrs-full:LaterThanThreeYearsAndNotLaterThanFourYearsMember2022-12-310000312069country:USbcs:HousePriceIndexEconomicCoreVariableMemberbcs:DownsideTwoMemberifrs-full:LaterThanFourYearsAndNotLaterThanFiveYearsMember2022-12-310000312069country:USbcs:FederalFundsRateMemberbcs:DownsideTwoMemberifrs-full:NotLaterThanOneYearMember2022-12-310000312069country:USifrs-full:LaterThanOneYearAndNotLaterThanTwoYearsMemberbcs:FederalFundsRateMemberbcs:DownsideTwoMember2022-12-310000312069country:USifrs-full:LaterThanTwoYearsAndNotLaterThanThreeYearsMemberbcs:FederalFundsRateMemberbcs:DownsideTwoMember2022-12-310000312069country:USbcs:FederalFundsRateMemberbcs:DownsideTwoMemberifrs-full:LaterThanThreeYearsAndNotLaterThanFourYearsMember2022-12-310000312069country:USbcs:FederalFundsRateMemberbcs:DownsideTwoMemberifrs-full:LaterThanFourYearsAndNotLaterThanFiveYearsMember2022-12-310000312069bcs:GrossDomesticProductEconomicVariableMembercountry:GBbcs:DownsideOneMemberifrs-full:NotLaterThanOneYearMember2022-12-310000312069ifrs-full:LaterThanOneYearAndNotLaterThanTwoYearsMemberbcs:GrossDomesticProductEconomicVariableMembercountry:GBbcs:DownsideOneMember2022-12-310000312069ifrs-full:LaterThanTwoYearsAndNotLaterThanThreeYearsMemberbcs:GrossDomesticProductEconomicVariableMembercountry:GBbcs:DownsideOneMember2022-12-310000312069bcs:GrossDomesticProductEconomicVariableMemberifrs-full:LaterThanThreeYearsAndNotLaterThanFourYearsMembercountry:GBbcs:DownsideOneMember2022-12-310000312069bcs:GrossDomesticProductEconomicVariableMembercountry:GBifrs-full:LaterThanFourYearsAndNotLaterThanFiveYearsMemberbcs:DownsideOneMember2022-12-310000312069bcs:UnemploymentEconomicCoreVariableMembercountry:GBbcs:DownsideOneMemberifrs-full:NotLaterThanOneYearMember2022-12-310000312069ifrs-full:LaterThanOneYearAndNotLaterThanTwoYearsMemberbcs:UnemploymentEconomicCoreVariableMembercountry:GBbcs:DownsideOneMember2022-12-310000312069ifrs-full:LaterThanTwoYearsAndNotLaterThanThreeYearsMemberbcs:UnemploymentEconomicCoreVariableMembercountry:GBbcs:DownsideOneMember2022-12-310000312069bcs:UnemploymentEconomicCoreVariableMemberifrs-full:LaterThanThreeYearsAndNotLaterThanFourYearsMembercountry:GBbcs:DownsideOneMember2022-12-310000312069bcs:UnemploymentEconomicCoreVariableMembercountry:GBifrs-full:LaterThanFourYearsAndNotLaterThanFiveYearsMemberbcs:DownsideOneMember2022-12-310000312069bcs:HousePriceIndexEconomicCoreVariableMembercountry:GBbcs:DownsideOneMemberifrs-full:NotLaterThanOneYearMember2022-12-310000312069ifrs-full:LaterThanOneYearAndNotLaterThanTwoYearsMemberbcs:HousePriceIndexEconomicCoreVariableMembercountry:GBbcs:DownsideOneMember2022-12-310000312069bcs:HousePriceIndexEconomicCoreVariableMemberifrs-full:LaterThanTwoYearsAndNotLaterThanThreeYearsMembercountry:GBbcs:DownsideOneMember2022-12-310000312069bcs:HousePriceIndexEconomicCoreVariableMemberifrs-full:LaterThanThreeYearsAndNotLaterThanFourYearsMembercountry:GBbcs:DownsideOneMember2022-12-310000312069bcs:HousePriceIndexEconomicCoreVariableMembercountry:GBifrs-full:LaterThanFourYearsAndNotLaterThanFiveYearsMemberbcs:DownsideOneMember2022-12-310000312069bcs:BankRateMembercountry:GBbcs:DownsideOneMemberifrs-full:NotLaterThanOneYearMember2022-12-310000312069ifrs-full:LaterThanOneYearAndNotLaterThanTwoYearsMemberbcs:BankRateMembercountry:GBbcs:DownsideOneMember2022-12-310000312069bcs:BankRateMemberifrs-full:LaterThanTwoYearsAndNotLaterThanThreeYearsMembercountry:GBbcs:DownsideOneMember2022-12-310000312069bcs:BankRateMemberifrs-full:LaterThanThreeYearsAndNotLaterThanFourYearsMembercountry:GBbcs:DownsideOneMember2022-12-310000312069bcs:BankRateMembercountry:GBifrs-full:LaterThanFourYearsAndNotLaterThanFiveYearsMemberbcs:DownsideOneMember2022-12-310000312069country:USbcs:GrossDomesticProductEconomicVariableMemberbcs:DownsideOneMemberifrs-full:NotLaterThanOneYearMember2022-12-310000312069country:USifrs-full:LaterThanOneYearAndNotLaterThanTwoYearsMemberbcs:GrossDomesticProductEconomicVariableMemberbcs:DownsideOneMember2022-12-310000312069country:USifrs-full:LaterThanTwoYearsAndNotLaterThanThreeYearsMemberbcs:GrossDomesticProductEconomicVariableMemberbcs:DownsideOneMember2022-12-310000312069country:USbcs:GrossDomesticProductEconomicVariableMemberifrs-full:LaterThanThreeYearsAndNotLaterThanFourYearsMemberbcs:DownsideOneMember2022-12-310000312069country:USbcs:GrossDomesticProductEconomicVariableMemberifrs-full:LaterThanFourYearsAndNotLaterThanFiveYearsMemberbcs:DownsideOneMember2022-12-310000312069country:USbcs:UnemploymentEconomicCoreVariableMemberbcs:DownsideOneMemberifrs-full:NotLaterThanOneYearMember2022-12-310000312069country:USifrs-full:LaterThanOneYearAndNotLaterThanTwoYearsMemberbcs:UnemploymentEconomicCoreVariableMemberbcs:DownsideOneMember2022-12-310000312069country:USifrs-full:LaterThanTwoYearsAndNotLaterThanThreeYearsMemberbcs:UnemploymentEconomicCoreVariableMemberbcs:DownsideOneMember2022-12-310000312069country:USbcs:UnemploymentEconomicCoreVariableMemberifrs-full:LaterThanThreeYearsAndNotLaterThanFourYearsMemberbcs:DownsideOneMember2022-12-310000312069country:USbcs:UnemploymentEconomicCoreVariableMemberifrs-full:LaterThanFourYearsAndNotLaterThanFiveYearsMemberbcs:DownsideOneMember2022-12-310000312069country:USbcs:HousePriceIndexEconomicCoreVariableMemberbcs:DownsideOneMemberifrs-full:NotLaterThanOneYearMember2022-12-310000312069country:USifrs-full:LaterThanOneYearAndNotLaterThanTwoYearsMemberbcs:HousePriceIndexEconomicCoreVariableMemberbcs:DownsideOneMember2022-12-310000312069country:USbcs:HousePriceIndexEconomicCoreVariableMemberifrs-full:LaterThanTwoYearsAndNotLaterThanThreeYearsMemberbcs:DownsideOneMember2022-12-310000312069country:USbcs:HousePriceIndexEconomicCoreVariableMemberifrs-full:LaterThanThreeYearsAndNotLaterThanFourYearsMemberbcs:DownsideOneMember2022-12-310000312069country:USbcs:HousePriceIndexEconomicCoreVariableMemberifrs-full:LaterThanFourYearsAndNotLaterThanFiveYearsMemberbcs:DownsideOneMember2022-12-310000312069country:USbcs:FederalFundsRateMemberbcs:DownsideOneMemberifrs-full:NotLaterThanOneYearMember2022-12-310000312069country:USifrs-full:LaterThanOneYearAndNotLaterThanTwoYearsMemberbcs:FederalFundsRateMemberbcs:DownsideOneMember2022-12-310000312069country:USifrs-full:LaterThanTwoYearsAndNotLaterThanThreeYearsMemberbcs:FederalFundsRateMemberbcs:DownsideOneMember2022-12-310000312069country:USbcs:FederalFundsRateMemberifrs-full:LaterThanThreeYearsAndNotLaterThanFourYearsMemberbcs:DownsideOneMember2022-12-310000312069country:USbcs:FederalFundsRateMemberifrs-full:LaterThanFourYearsAndNotLaterThanFiveYearsMemberbcs:DownsideOneMember2022-12-310000312069bcs:UpsideTwoMemberbcs:GrossDomesticProductEconomicVariableMembercountry:GBifrs-full:NotLaterThanOneYearMember2022-12-310000312069ifrs-full:LaterThanOneYearAndNotLaterThanTwoYearsMemberbcs:UpsideTwoMemberbcs:GrossDomesticProductEconomicVariableMembercountry:GB2022-12-310000312069ifrs-full:LaterThanTwoYearsAndNotLaterThanThreeYearsMemberbcs:UpsideTwoMemberbcs:GrossDomesticProductEconomicVariableMembercountry:GB2022-12-310000312069bcs:UpsideTwoMemberbcs:GrossDomesticProductEconomicVariableMemberifrs-full:LaterThanThreeYearsAndNotLaterThanFourYearsMembercountry:GB2022-12-310000312069bcs:UpsideTwoMemberbcs:GrossDomesticProductEconomicVariableMembercountry:GBifrs-full:LaterThanFourYearsAndNotLaterThanFiveYearsMember2022-12-310000312069bcs:UnemploymentEconomicCoreVariableMemberbcs:UpsideTwoMembercountry:GBifrs-full:NotLaterThanOneYearMember2022-12-310000312069ifrs-full:LaterThanOneYearAndNotLaterThanTwoYearsMemberbcs:UnemploymentEconomicCoreVariableMemberbcs:UpsideTwoMembercountry:GB2022-12-310000312069ifrs-full:LaterThanTwoYearsAndNotLaterThanThreeYearsMemberbcs:UnemploymentEconomicCoreVariableMemberbcs:UpsideTwoMembercountry:GB2022-12-310000312069bcs:UnemploymentEconomicCoreVariableMemberbcs:UpsideTwoMemberifrs-full:LaterThanThreeYearsAndNotLaterThanFourYearsMembercountry:GB2022-12-310000312069bcs:UnemploymentEconomicCoreVariableMemberbcs:UpsideTwoMembercountry:GBifrs-full:LaterThanFourYearsAndNotLaterThanFiveYearsMember2022-12-310000312069bcs:HousePriceIndexEconomicCoreVariableMemberbcs:UpsideTwoMembercountry:GBifrs-full:NotLaterThanOneYearMember2022-12-310000312069ifrs-full:LaterThanOneYearAndNotLaterThanTwoYearsMemberbcs:HousePriceIndexEconomicCoreVariableMemberbcs:UpsideTwoMembercountry:GB2022-12-310000312069bcs:HousePriceIndexEconomicCoreVariableMemberifrs-full:LaterThanTwoYearsAndNotLaterThanThreeYearsMemberbcs:UpsideTwoMembercountry:GB2022-12-310000312069bcs:HousePriceIndexEconomicCoreVariableMemberbcs:UpsideTwoMemberifrs-full:LaterThanThreeYearsAndNotLaterThanFourYearsMembercountry:GB2022-12-310000312069bcs:HousePriceIndexEconomicCoreVariableMemberbcs:UpsideTwoMembercountry:GBifrs-full:LaterThanFourYearsAndNotLaterThanFiveYearsMember2022-12-310000312069bcs:BankRateMemberbcs:UpsideTwoMembercountry:GBifrs-full:NotLaterThanOneYearMember2022-12-310000312069ifrs-full:LaterThanOneYearAndNotLaterThanTwoYearsMemberbcs:BankRateMemberbcs:UpsideTwoMembercountry:GB2022-12-310000312069bcs:BankRateMemberifrs-full:LaterThanTwoYearsAndNotLaterThanThreeYearsMemberbcs:UpsideTwoMembercountry:GB2022-12-310000312069bcs:BankRateMemberbcs:UpsideTwoMemberifrs-full:LaterThanThreeYearsAndNotLaterThanFourYearsMembercountry:GB2022-12-310000312069bcs:BankRateMemberbcs:UpsideTwoMembercountry:GBifrs-full:LaterThanFourYearsAndNotLaterThanFiveYearsMember2022-12-310000312069country:USbcs:UpsideTwoMemberbcs:GrossDomesticProductEconomicVariableMemberifrs-full:NotLaterThanOneYearMember2022-12-310000312069country:USifrs-full:LaterThanOneYearAndNotLaterThanTwoYearsMemberbcs:UpsideTwoMemberbcs:GrossDomesticProductEconomicVariableMember2022-12-310000312069country:USifrs-full:LaterThanTwoYearsAndNotLaterThanThreeYearsMemberbcs:UpsideTwoMemberbcs:GrossDomesticProductEconomicVariableMember2022-12-310000312069country:USbcs:UpsideTwoMemberbcs:GrossDomesticProductEconomicVariableMemberifrs-full:LaterThanThreeYearsAndNotLaterThanFourYearsMember2022-12-310000312069country:USbcs:UpsideTwoMemberbcs:GrossDomesticProductEconomicVariableMemberifrs-full:LaterThanFourYearsAndNotLaterThanFiveYearsMember2022-12-310000312069country:USbcs:UnemploymentEconomicCoreVariableMemberbcs:UpsideTwoMemberifrs-full:NotLaterThanOneYearMember2022-12-310000312069country:USifrs-full:LaterThanOneYearAndNotLaterThanTwoYearsMemberbcs:UnemploymentEconomicCoreVariableMemberbcs:UpsideTwoMember2022-12-310000312069country:USifrs-full:LaterThanTwoYearsAndNotLaterThanThreeYearsMemberbcs:UnemploymentEconomicCoreVariableMemberbcs:UpsideTwoMember2022-12-310000312069country:USbcs:UnemploymentEconomicCoreVariableMemberbcs:UpsideTwoMemberifrs-full:LaterThanThreeYearsAndNotLaterThanFourYearsMember2022-12-310000312069country:USbcs:UnemploymentEconomicCoreVariableMemberbcs:UpsideTwoMemberifrs-full:LaterThanFourYearsAndNotLaterThanFiveYearsMember2022-12-310000312069country:USbcs:HousePriceIndexEconomicCoreVariableMemberbcs:UpsideTwoMemberifrs-full:NotLaterThanOneYearMember2022-12-310000312069country:USifrs-full:LaterThanOneYearAndNotLaterThanTwoYearsMemberbcs:HousePriceIndexEconomicCoreVariableMemberbcs:UpsideTwoMember2022-12-310000312069country:USbcs:HousePriceIndexEconomicCoreVariableMemberifrs-full:LaterThanTwoYearsAndNotLaterThanThreeYearsMemberbcs:UpsideTwoMember2022-12-310000312069country:USbcs:HousePriceIndexEconomicCoreVariableMemberbcs:UpsideTwoMemberifrs-full:LaterThanThreeYearsAndNotLaterThanFourYearsMember2022-12-310000312069country:USbcs:HousePriceIndexEconomicCoreVariableMemberbcs:UpsideTwoMemberifrs-full:LaterThanFourYearsAndNotLaterThanFiveYearsMember2022-12-310000312069country:USbcs:FederalFundsRateMemberbcs:UpsideTwoMemberifrs-full:NotLaterThanOneYearMember2022-12-310000312069country:USifrs-full:LaterThanOneYearAndNotLaterThanTwoYearsMemberbcs:FederalFundsRateMemberbcs:UpsideTwoMember2022-12-310000312069country:USifrs-full:LaterThanTwoYearsAndNotLaterThanThreeYearsMemberbcs:FederalFundsRateMemberbcs:UpsideTwoMember2022-12-310000312069country:USbcs:FederalFundsRateMemberbcs:UpsideTwoMemberifrs-full:LaterThanThreeYearsAndNotLaterThanFourYearsMember2022-12-310000312069country:USbcs:FederalFundsRateMemberbcs:UpsideTwoMemberifrs-full:LaterThanFourYearsAndNotLaterThanFiveYearsMember2022-12-310000312069bcs:GrossDomesticProductEconomicVariableMemberbcs:UpsideOneMembercountry:GBifrs-full:NotLaterThanOneYearMember2022-12-310000312069ifrs-full:LaterThanOneYearAndNotLaterThanTwoYearsMemberbcs:GrossDomesticProductEconomicVariableMemberbcs:UpsideOneMembercountry:GB2022-12-310000312069ifrs-full:LaterThanTwoYearsAndNotLaterThanThreeYearsMemberbcs:GrossDomesticProductEconomicVariableMemberbcs:UpsideOneMembercountry:GB2022-12-310000312069bcs:GrossDomesticProductEconomicVariableMemberifrs-full:LaterThanThreeYearsAndNotLaterThanFourYearsMemberbcs:UpsideOneMembercountry:GB2022-12-310000312069bcs:GrossDomesticProductEconomicVariableMemberbcs:UpsideOneMembercountry:GBifrs-full:LaterThanFourYearsAndNotLaterThanFiveYearsMember2022-12-310000312069bcs:UnemploymentEconomicCoreVariableMemberbcs:UpsideOneMembercountry:GBifrs-full:NotLaterThanOneYearMember2022-12-310000312069ifrs-full:LaterThanOneYearAndNotLaterThanTwoYearsMemberbcs:UnemploymentEconomicCoreVariableMemberbcs:UpsideOneMembercountry:GB2022-12-310000312069ifrs-full:LaterThanTwoYearsAndNotLaterThanThreeYearsMemberbcs:UnemploymentEconomicCoreVariableMemberbcs:UpsideOneMembercountry:GB2022-12-310000312069bcs:UnemploymentEconomicCoreVariableMemberifrs-full:LaterThanThreeYearsAndNotLaterThanFourYearsMemberbcs:UpsideOneMembercountry:GB2022-12-310000312069bcs:UnemploymentEconomicCoreVariableMemberbcs:UpsideOneMembercountry:GBifrs-full:LaterThanFourYearsAndNotLaterThanFiveYearsMember2022-12-310000312069bcs:HousePriceIndexEconomicCoreVariableMemberbcs:UpsideOneMembercountry:GBifrs-full:NotLaterThanOneYearMember2022-12-310000312069ifrs-full:LaterThanOneYearAndNotLaterThanTwoYearsMemberbcs:HousePriceIndexEconomicCoreVariableMemberbcs:UpsideOneMembercountry:GB2022-12-310000312069bcs:HousePriceIndexEconomicCoreVariableMemberifrs-full:LaterThanTwoYearsAndNotLaterThanThreeYearsMemberbcs:UpsideOneMembercountry:GB2022-12-310000312069bcs:HousePriceIndexEconomicCoreVariableMemberifrs-full:LaterThanThreeYearsAndNotLaterThanFourYearsMemberbcs:UpsideOneMembercountry:GB2022-12-310000312069bcs:HousePriceIndexEconomicCoreVariableMemberbcs:UpsideOneMembercountry:GBifrs-full:LaterThanFourYearsAndNotLaterThanFiveYearsMember2022-12-310000312069bcs:BankRateMemberbcs:UpsideOneMembercountry:GBifrs-full:NotLaterThanOneYearMember2022-12-310000312069ifrs-full:LaterThanOneYearAndNotLaterThanTwoYearsMemberbcs:BankRateMemberbcs:UpsideOneMembercountry:GB2022-12-310000312069bcs:BankRateMemberifrs-full:LaterThanTwoYearsAndNotLaterThanThreeYearsMemberbcs:UpsideOneMembercountry:GB2022-12-310000312069bcs:BankRateMemberifrs-full:LaterThanThreeYearsAndNotLaterThanFourYearsMemberbcs:UpsideOneMembercountry:GB2022-12-310000312069bcs:BankRateMemberbcs:UpsideOneMembercountry:GBifrs-full:LaterThanFourYearsAndNotLaterThanFiveYearsMember2022-12-310000312069country:USbcs:GrossDomesticProductEconomicVariableMemberbcs:UpsideOneMemberifrs-full:NotLaterThanOneYearMember2022-12-310000312069country:USifrs-full:LaterThanOneYearAndNotLaterThanTwoYearsMemberbcs:GrossDomesticProductEconomicVariableMemberbcs:UpsideOneMember2022-12-310000312069country:USifrs-full:LaterThanTwoYearsAndNotLaterThanThreeYearsMemberbcs:GrossDomesticProductEconomicVariableMemberbcs:UpsideOneMember2022-12-310000312069country:USbcs:GrossDomesticProductEconomicVariableMemberifrs-full:LaterThanThreeYearsAndNotLaterThanFourYearsMemberbcs:UpsideOneMember2022-12-310000312069country:USbcs:GrossDomesticProductEconomicVariableMemberbcs:UpsideOneMemberifrs-full:LaterThanFourYearsAndNotLaterThanFiveYearsMember2022-12-310000312069country:USbcs:UnemploymentEconomicCoreVariableMemberbcs:UpsideOneMemberifrs-full:NotLaterThanOneYearMember2022-12-310000312069country:USifrs-full:LaterThanOneYearAndNotLaterThanTwoYearsMemberbcs:UnemploymentEconomicCoreVariableMemberbcs:UpsideOneMember2022-12-310000312069country:USifrs-full:LaterThanTwoYearsAndNotLaterThanThreeYearsMemberbcs:UnemploymentEconomicCoreVariableMemberbcs:UpsideOneMember2022-12-310000312069country:USbcs:UnemploymentEconomicCoreVariableMemberifrs-full:LaterThanThreeYearsAndNotLaterThanFourYearsMemberbcs:UpsideOneMember2022-12-310000312069country:USbcs:UnemploymentEconomicCoreVariableMemberbcs:UpsideOneMemberifrs-full:LaterThanFourYearsAndNotLaterThanFiveYearsMember2022-12-310000312069country:USbcs:HousePriceIndexEconomicCoreVariableMemberbcs:UpsideOneMemberifrs-full:NotLaterThanOneYearMember2022-12-310000312069country:USifrs-full:LaterThanOneYearAndNotLaterThanTwoYearsMemberbcs:HousePriceIndexEconomicCoreVariableMemberbcs:UpsideOneMember2022-12-310000312069country:USbcs:HousePriceIndexEconomicCoreVariableMemberifrs-full:LaterThanTwoYearsAndNotLaterThanThreeYearsMemberbcs:UpsideOneMember2022-12-310000312069country:USbcs:HousePriceIndexEconomicCoreVariableMemberifrs-full:LaterThanThreeYearsAndNotLaterThanFourYearsMemberbcs:UpsideOneMember2022-12-310000312069country:USbcs:HousePriceIndexEconomicCoreVariableMemberbcs:UpsideOneMemberifrs-full:LaterThanFourYearsAndNotLaterThanFiveYearsMember2022-12-310000312069country:USbcs:FederalFundsRateMemberbcs:UpsideOneMemberifrs-full:NotLaterThanOneYearMember2022-12-310000312069country:USifrs-full:LaterThanOneYearAndNotLaterThanTwoYearsMemberbcs:FederalFundsRateMemberbcs:UpsideOneMember2022-12-310000312069country:USifrs-full:LaterThanTwoYearsAndNotLaterThanThreeYearsMemberbcs:FederalFundsRateMemberbcs:UpsideOneMember2022-12-310000312069country:USbcs:FederalFundsRateMemberifrs-full:LaterThanThreeYearsAndNotLaterThanFourYearsMemberbcs:UpsideOneMember2022-12-310000312069country:USbcs:FederalFundsRateMemberbcs:UpsideOneMemberifrs-full:LaterThanFourYearsAndNotLaterThanFiveYearsMember2022-12-310000312069bcs:UpsideTwoMember2023-12-310000312069bcs:UpsideOneMember2023-12-310000312069bcs:BaselineMember2023-12-310000312069bcs:DownsideOneMember2023-12-310000312069bcs:DownsideTwoMember2023-12-310000312069bcs:UpsideTwoMember2022-12-310000312069bcs:UpsideOneMember2022-12-310000312069bcs:BaselineMember2022-12-310000312069bcs:DownsideOneMember2022-12-310000312069bcs:DownsideTwoMember2022-12-310000312069bcs:UpsideTwoMemberbcs:GrossDomesticProductEconomicVariableMemberbcs:SpecificBasesMembercountry:GB2023-12-310000312069bcs:GrossDomesticProductEconomicVariableMemberbcs:SpecificBasesMemberbcs:UpsideOneMembercountry:GB2023-12-310000312069bcs:GrossDomesticProductEconomicVariableMemberbcs:SpecificBasesMemberbcs:BaselineMembercountry:GB2023-12-310000312069bcs:GrossDomesticProductEconomicVariableMemberbcs:SpecificBasesMembercountry:GBbcs:DownsideOneMember2023-12-310000312069bcs:GrossDomesticProductEconomicVariableMemberbcs:DownsideTwoMemberbcs:SpecificBasesMembercountry:GB2023-12-310000312069bcs:UnemploymentEconomicCoreVariableMemberbcs:UpsideTwoMemberbcs:SpecificBasesMembercountry:GB2023-12-310000312069bcs:UnemploymentEconomicCoreVariableMemberbcs:SpecificBasesMemberbcs:UpsideOneMembercountry:GB2023-12-310000312069bcs:UnemploymentEconomicCoreVariableMemberbcs:SpecificBasesMemberbcs:BaselineMembercountry:GB2023-12-310000312069bcs:UnemploymentEconomicCoreVariableMemberbcs:SpecificBasesMembercountry:GBbcs:DownsideOneMember2023-12-310000312069bcs:UnemploymentEconomicCoreVariableMemberbcs:DownsideTwoMemberbcs:SpecificBasesMembercountry:GB2023-12-310000312069bcs:HousePriceIndexEconomicCoreVariableMemberbcs:UpsideTwoMemberbcs:SpecificBasesMembercountry:GB2023-12-310000312069bcs:HousePriceIndexEconomicCoreVariableMemberbcs:SpecificBasesMemberbcs:UpsideOneMembercountry:GB2023-12-310000312069bcs:HousePriceIndexEconomicCoreVariableMemberbcs:SpecificBasesMemberbcs:BaselineMembercountry:GB2023-12-310000312069bcs:HousePriceIndexEconomicCoreVariableMemberbcs:SpecificBasesMembercountry:GBbcs:DownsideOneMember2023-12-310000312069bcs:HousePriceIndexEconomicCoreVariableMemberbcs:DownsideTwoMemberbcs:SpecificBasesMembercountry:GB2023-12-310000312069bcs:BankRateMemberbcs:UpsideTwoMemberbcs:SpecificBasesMembercountry:GB2023-12-310000312069bcs:BankRateMemberbcs:SpecificBasesMemberbcs:UpsideOneMembercountry:GB2023-12-310000312069bcs:BankRateMemberbcs:SpecificBasesMemberbcs:BaselineMembercountry:GB2023-12-310000312069bcs:BankRateMemberbcs:SpecificBasesMembercountry:GBbcs:DownsideOneMember2023-12-310000312069bcs:BankRateMemberbcs:DownsideTwoMemberbcs:SpecificBasesMembercountry:GB2023-12-310000312069country:USbcs:UpsideTwoMemberbcs:GrossDomesticProductEconomicVariableMemberbcs:SpecificBasesMember2023-12-310000312069country:USbcs:GrossDomesticProductEconomicVariableMemberbcs:SpecificBasesMemberbcs:UpsideOneMember2023-12-310000312069country:USbcs:GrossDomesticProductEconomicVariableMemberbcs:SpecificBasesMemberbcs:BaselineMember2023-12-310000312069country:USbcs:GrossDomesticProductEconomicVariableMemberbcs:SpecificBasesMemberbcs:DownsideOneMember2023-12-310000312069country:USbcs:GrossDomesticProductEconomicVariableMemberbcs:DownsideTwoMemberbcs:SpecificBasesMember2023-12-310000312069country:USbcs:UnemploymentEconomicCoreVariableMemberbcs:UpsideTwoMemberbcs:SpecificBasesMember2023-12-310000312069country:USbcs:UnemploymentEconomicCoreVariableMemberbcs:SpecificBasesMemberbcs:UpsideOneMember2023-12-310000312069country:USbcs:UnemploymentEconomicCoreVariableMemberbcs:SpecificBasesMemberbcs:BaselineMember2023-12-310000312069country:USbcs:UnemploymentEconomicCoreVariableMemberbcs:SpecificBasesMemberbcs:DownsideOneMember2023-12-310000312069country:USbcs:UnemploymentEconomicCoreVariableMemberbcs:DownsideTwoMemberbcs:SpecificBasesMember2023-12-310000312069country:USbcs:HousePriceIndexEconomicCoreVariableMemberbcs:UpsideTwoMemberbcs:SpecificBasesMember2023-12-310000312069country:USbcs:HousePriceIndexEconomicCoreVariableMemberbcs:SpecificBasesMemberbcs:UpsideOneMember2023-12-310000312069country:USbcs:HousePriceIndexEconomicCoreVariableMemberbcs:SpecificBasesMemberbcs:BaselineMember2023-12-310000312069country:USbcs:HousePriceIndexEconomicCoreVariableMemberbcs:SpecificBasesMemberbcs:DownsideOneMember2023-12-310000312069country:USbcs:HousePriceIndexEconomicCoreVariableMemberbcs:DownsideTwoMemberbcs:SpecificBasesMember2023-12-310000312069country:USbcs:FederalFundsRateMemberbcs:UpsideTwoMemberbcs:SpecificBasesMember2023-12-310000312069country:USbcs:FederalFundsRateMemberbcs:SpecificBasesMemberbcs:UpsideOneMember2023-12-310000312069country:USbcs:FederalFundsRateMemberbcs:SpecificBasesMemberbcs:BaselineMember2023-12-310000312069country:USbcs:FederalFundsRateMemberbcs:SpecificBasesMemberbcs:DownsideOneMember2023-12-310000312069country:USbcs:FederalFundsRateMemberbcs:DownsideTwoMemberbcs:SpecificBasesMember2023-12-310000312069bcs:UpsideTwoMemberbcs:GrossDomesticProductEconomicVariableMemberbcs:SpecificBasesMembercountry:GB2022-12-310000312069bcs:GrossDomesticProductEconomicVariableMemberbcs:SpecificBasesMemberbcs:UpsideOneMembercountry:GB2022-12-310000312069bcs:GrossDomesticProductEconomicVariableMemberbcs:SpecificBasesMemberbcs:BaselineMembercountry:GB2022-12-310000312069bcs:GrossDomesticProductEconomicVariableMemberbcs:SpecificBasesMembercountry:GBbcs:DownsideOneMember2022-12-310000312069bcs:GrossDomesticProductEconomicVariableMemberbcs:DownsideTwoMemberbcs:SpecificBasesMembercountry:GB2022-12-310000312069bcs:UnemploymentEconomicCoreVariableMemberbcs:UpsideTwoMemberbcs:SpecificBasesMembercountry:GB2022-12-310000312069bcs:UnemploymentEconomicCoreVariableMemberbcs:SpecificBasesMemberbcs:UpsideOneMembercountry:GB2022-12-310000312069bcs:UnemploymentEconomicCoreVariableMemberbcs:SpecificBasesMemberbcs:BaselineMembercountry:GB2022-12-310000312069bcs:UnemploymentEconomicCoreVariableMemberbcs:SpecificBasesMembercountry:GBbcs:DownsideOneMember2022-12-310000312069bcs:UnemploymentEconomicCoreVariableMemberbcs:DownsideTwoMemberbcs:SpecificBasesMembercountry:GB2022-12-310000312069bcs:HousePriceIndexEconomicCoreVariableMemberbcs:UpsideTwoMemberbcs:SpecificBasesMembercountry:GB2022-12-310000312069bcs:HousePriceIndexEconomicCoreVariableMemberbcs:SpecificBasesMemberbcs:UpsideOneMembercountry:GB2022-12-310000312069bcs:HousePriceIndexEconomicCoreVariableMemberbcs:SpecificBasesMemberbcs:BaselineMembercountry:GB2022-12-310000312069bcs:HousePriceIndexEconomicCoreVariableMemberbcs:SpecificBasesMembercountry:GBbcs:DownsideOneMember2022-12-310000312069bcs:HousePriceIndexEconomicCoreVariableMemberbcs:DownsideTwoMemberbcs:SpecificBasesMembercountry:GB2022-12-310000312069bcs:BankRateMemberbcs:UpsideTwoMemberbcs:SpecificBasesMembercountry:GB2022-12-310000312069bcs:BankRateMemberbcs:SpecificBasesMemberbcs:UpsideOneMembercountry:GB2022-12-310000312069bcs:BankRateMemberbcs:SpecificBasesMemberbcs:BaselineMembercountry:GB2022-12-310000312069bcs:BankRateMemberbcs:SpecificBasesMembercountry:GBbcs:DownsideOneMember2022-12-310000312069bcs:BankRateMemberbcs:DownsideTwoMemberbcs:SpecificBasesMembercountry:GB2022-12-310000312069country:USbcs:UpsideTwoMemberbcs:GrossDomesticProductEconomicVariableMemberbcs:SpecificBasesMember2022-12-310000312069country:USbcs:GrossDomesticProductEconomicVariableMemberbcs:SpecificBasesMemberbcs:UpsideOneMember2022-12-310000312069country:USbcs:GrossDomesticProductEconomicVariableMemberbcs:SpecificBasesMemberbcs:BaselineMember2022-12-310000312069country:USbcs:GrossDomesticProductEconomicVariableMemberbcs:SpecificBasesMemberbcs:DownsideOneMember2022-12-310000312069country:USbcs:GrossDomesticProductEconomicVariableMemberbcs:DownsideTwoMemberbcs:SpecificBasesMember2022-12-310000312069country:USbcs:UnemploymentEconomicCoreVariableMemberbcs:UpsideTwoMemberbcs:SpecificBasesMember2022-12-310000312069country:USbcs:UnemploymentEconomicCoreVariableMemberbcs:SpecificBasesMemberbcs:UpsideOneMember2022-12-310000312069country:USbcs:UnemploymentEconomicCoreVariableMemberbcs:SpecificBasesMemberbcs:BaselineMember2022-12-310000312069country:USbcs:UnemploymentEconomicCoreVariableMemberbcs:SpecificBasesMemberbcs:DownsideOneMember2022-12-310000312069country:USbcs:UnemploymentEconomicCoreVariableMemberbcs:DownsideTwoMemberbcs:SpecificBasesMember2022-12-310000312069country:USbcs:HousePriceIndexEconomicCoreVariableMemberbcs:UpsideTwoMemberbcs:SpecificBasesMember2022-12-310000312069country:USbcs:HousePriceIndexEconomicCoreVariableMemberbcs:SpecificBasesMemberbcs:UpsideOneMember2022-12-310000312069country:USbcs:HousePriceIndexEconomicCoreVariableMemberbcs:SpecificBasesMemberbcs:BaselineMember2022-12-310000312069country:USbcs:HousePriceIndexEconomicCoreVariableMemberbcs:SpecificBasesMemberbcs:DownsideOneMember2022-12-310000312069country:USbcs:HousePriceIndexEconomicCoreVariableMemberbcs:DownsideTwoMemberbcs:SpecificBasesMember2022-12-310000312069country:USbcs:FederalFundsRateMemberbcs:UpsideTwoMemberbcs:SpecificBasesMember2022-12-310000312069country:USbcs:FederalFundsRateMemberbcs:SpecificBasesMemberbcs:UpsideOneMember2022-12-310000312069country:USbcs:FederalFundsRateMemberbcs:SpecificBasesMemberbcs:BaselineMember2022-12-310000312069country:USbcs:FederalFundsRateMemberbcs:SpecificBasesMemberbcs:DownsideOneMember2022-12-310000312069country:USbcs:FederalFundsRateMemberbcs:DownsideTwoMemberbcs:SpecificBasesMember2022-12-310000312069bcs:UpsideTwoMemberbcs:GrossDomesticProductEconomicVariableMembercountry:GBbcs:FiveYearAveragesMember2023-12-310000312069bcs:GrossDomesticProductEconomicVariableMemberbcs:UpsideOneMembercountry:GBbcs:FiveYearAveragesMember2023-12-310000312069bcs:GrossDomesticProductEconomicVariableMemberbcs:BaselineMembercountry:GBbcs:FiveYearAveragesMember2023-12-310000312069bcs:GrossDomesticProductEconomicVariableMembercountry:GBbcs:DownsideOneMemberbcs:FiveYearAveragesMember2023-12-310000312069bcs:GrossDomesticProductEconomicVariableMemberbcs:DownsideTwoMembercountry:GBbcs:FiveYearAveragesMember2023-12-310000312069bcs:UnemploymentEconomicCoreVariableMemberbcs:UpsideTwoMembercountry:GBbcs:FiveYearAveragesMember2023-12-310000312069bcs:UnemploymentEconomicCoreVariableMemberbcs:UpsideOneMembercountry:GBbcs:FiveYearAveragesMember2023-12-310000312069bcs:UnemploymentEconomicCoreVariableMemberbcs:BaselineMembercountry:GBbcs:FiveYearAveragesMember2023-12-310000312069bcs:UnemploymentEconomicCoreVariableMembercountry:GBbcs:DownsideOneMemberbcs:FiveYearAveragesMember2023-12-310000312069bcs:UnemploymentEconomicCoreVariableMemberbcs:DownsideTwoMembercountry:GBbcs:FiveYearAveragesMember2023-12-310000312069bcs:HousePriceIndexEconomicCoreVariableMemberbcs:UpsideTwoMembercountry:GBbcs:FiveYearAveragesMember2023-12-310000312069bcs:HousePriceIndexEconomicCoreVariableMemberbcs:UpsideOneMembercountry:GBbcs:FiveYearAveragesMember2023-12-310000312069bcs:HousePriceIndexEconomicCoreVariableMemberbcs:BaselineMembercountry:GBbcs:FiveYearAveragesMember2023-12-310000312069bcs:HousePriceIndexEconomicCoreVariableMembercountry:GBbcs:DownsideOneMemberbcs:FiveYearAveragesMember2023-12-310000312069bcs:HousePriceIndexEconomicCoreVariableMemberbcs:DownsideTwoMembercountry:GBbcs:FiveYearAveragesMember2023-12-310000312069bcs:BankRateMemberbcs:UpsideTwoMembercountry:GBbcs:FiveYearAveragesMember2023-12-310000312069bcs:BankRateMemberbcs:UpsideOneMembercountry:GBbcs:FiveYearAveragesMember2023-12-310000312069bcs:BankRateMemberbcs:BaselineMembercountry:GBbcs:FiveYearAveragesMember2023-12-310000312069bcs:BankRateMembercountry:GBbcs:DownsideOneMemberbcs:FiveYearAveragesMember2023-12-310000312069bcs:BankRateMemberbcs:DownsideTwoMembercountry:GBbcs:FiveYearAveragesMember2023-12-310000312069country:USbcs:UpsideTwoMemberbcs:GrossDomesticProductEconomicVariableMemberbcs:FiveYearAveragesMember2023-12-310000312069country:USbcs:GrossDomesticProductEconomicVariableMemberbcs:UpsideOneMemberbcs:FiveYearAveragesMember2023-12-310000312069country:USbcs:GrossDomesticProductEconomicVariableMemberbcs:BaselineMemberbcs:FiveYearAveragesMember2023-12-310000312069country:USbcs:GrossDomesticProductEconomicVariableMemberbcs:DownsideOneMemberbcs:FiveYearAveragesMember2023-12-310000312069country:USbcs:GrossDomesticProductEconomicVariableMemberbcs:DownsideTwoMemberbcs:FiveYearAveragesMember2023-12-310000312069country:USbcs:UnemploymentEconomicCoreVariableMemberbcs:UpsideTwoMemberbcs:FiveYearAveragesMember2023-12-310000312069country:USbcs:UnemploymentEconomicCoreVariableMemberbcs:UpsideOneMemberbcs:FiveYearAveragesMember2023-12-310000312069country:USbcs:UnemploymentEconomicCoreVariableMemberbcs:BaselineMemberbcs:FiveYearAveragesMember2023-12-310000312069country:USbcs:UnemploymentEconomicCoreVariableMemberbcs:DownsideOneMemberbcs:FiveYearAveragesMember2023-12-310000312069country:USbcs:UnemploymentEconomicCoreVariableMemberbcs:DownsideTwoMemberbcs:FiveYearAveragesMember2023-12-310000312069country:USbcs:HousePriceIndexEconomicCoreVariableMemberbcs:UpsideTwoMemberbcs:FiveYearAveragesMember2023-12-310000312069country:USbcs:HousePriceIndexEconomicCoreVariableMemberbcs:UpsideOneMemberbcs:FiveYearAveragesMember2023-12-310000312069country:USbcs:HousePriceIndexEconomicCoreVariableMemberbcs:BaselineMemberbcs:FiveYearAveragesMember2023-12-310000312069country:USbcs:HousePriceIndexEconomicCoreVariableMemberbcs:DownsideOneMemberbcs:FiveYearAveragesMember2023-12-310000312069country:USbcs:HousePriceIndexEconomicCoreVariableMemberbcs:DownsideTwoMemberbcs:FiveYearAveragesMember2023-12-310000312069country:USbcs:FederalFundsRateMemberbcs:UpsideTwoMemberbcs:FiveYearAveragesMember2023-12-310000312069country:USbcs:FederalFundsRateMemberbcs:UpsideOneMemberbcs:FiveYearAveragesMember2023-12-310000312069country:USbcs:FederalFundsRateMemberbcs:BaselineMemberbcs:FiveYearAveragesMember2023-12-310000312069country:USbcs:FederalFundsRateMemberbcs:DownsideOneMemberbcs:FiveYearAveragesMember2023-12-310000312069country:USbcs:FederalFundsRateMemberbcs:DownsideTwoMemberbcs:FiveYearAveragesMember2023-12-310000312069bcs:UpsideTwoMemberbcs:GrossDomesticProductEconomicVariableMembercountry:GBbcs:FiveYearAveragesMember2022-12-310000312069bcs:GrossDomesticProductEconomicVariableMemberbcs:UpsideOneMembercountry:GBbcs:FiveYearAveragesMember2022-12-310000312069bcs:GrossDomesticProductEconomicVariableMemberbcs:BaselineMembercountry:GBbcs:FiveYearAveragesMember2022-12-310000312069bcs:GrossDomesticProductEconomicVariableMembercountry:GBbcs:DownsideOneMemberbcs:FiveYearAveragesMember2022-12-310000312069bcs:GrossDomesticProductEconomicVariableMemberbcs:DownsideTwoMembercountry:GBbcs:FiveYearAveragesMember2022-12-310000312069bcs:UnemploymentEconomicCoreVariableMemberbcs:UpsideTwoMembercountry:GBbcs:FiveYearAveragesMember2022-12-310000312069bcs:UnemploymentEconomicCoreVariableMemberbcs:UpsideOneMembercountry:GBbcs:FiveYearAveragesMember2022-12-310000312069bcs:UnemploymentEconomicCoreVariableMemberbcs:BaselineMembercountry:GBbcs:FiveYearAveragesMember2022-12-310000312069bcs:UnemploymentEconomicCoreVariableMembercountry:GBbcs:DownsideOneMemberbcs:FiveYearAveragesMember2022-12-310000312069bcs:UnemploymentEconomicCoreVariableMemberbcs:DownsideTwoMembercountry:GBbcs:FiveYearAveragesMember2022-12-310000312069bcs:HousePriceIndexEconomicCoreVariableMemberbcs:UpsideTwoMembercountry:GBbcs:FiveYearAveragesMember2022-12-310000312069bcs:HousePriceIndexEconomicCoreVariableMemberbcs:UpsideOneMembercountry:GBbcs:FiveYearAveragesMember2022-12-310000312069bcs:HousePriceIndexEconomicCoreVariableMemberbcs:BaselineMembercountry:GBbcs:FiveYearAveragesMember2022-12-310000312069bcs:HousePriceIndexEconomicCoreVariableMembercountry:GBbcs:DownsideOneMemberbcs:FiveYearAveragesMember2022-12-310000312069bcs:HousePriceIndexEconomicCoreVariableMemberbcs:DownsideTwoMembercountry:GBbcs:FiveYearAveragesMember2022-12-310000312069bcs:BankRateMemberbcs:UpsideTwoMembercountry:GBbcs:FiveYearAveragesMember2022-12-310000312069bcs:BankRateMemberbcs:UpsideOneMembercountry:GBbcs:FiveYearAveragesMember2022-12-310000312069bcs:BankRateMemberbcs:BaselineMembercountry:GBbcs:FiveYearAveragesMember2022-12-310000312069bcs:BankRateMembercountry:GBbcs:DownsideOneMemberbcs:FiveYearAveragesMember2022-12-310000312069bcs:BankRateMemberbcs:DownsideTwoMembercountry:GBbcs:FiveYearAveragesMember2022-12-310000312069country:USbcs:UpsideTwoMemberbcs:GrossDomesticProductEconomicVariableMemberbcs:FiveYearAveragesMember2022-12-310000312069country:USbcs:GrossDomesticProductEconomicVariableMemberbcs:UpsideOneMemberbcs:FiveYearAveragesMember2022-12-310000312069country:USbcs:GrossDomesticProductEconomicVariableMemberbcs:BaselineMemberbcs:FiveYearAveragesMember2022-12-310000312069country:USbcs:GrossDomesticProductEconomicVariableMemberbcs:DownsideOneMemberbcs:FiveYearAveragesMember2022-12-310000312069country:USbcs:GrossDomesticProductEconomicVariableMemberbcs:DownsideTwoMemberbcs:FiveYearAveragesMember2022-12-310000312069country:USbcs:UnemploymentEconomicCoreVariableMemberbcs:UpsideTwoMemberbcs:FiveYearAveragesMember2022-12-310000312069country:USbcs:UnemploymentEconomicCoreVariableMemberbcs:UpsideOneMemberbcs:FiveYearAveragesMember2022-12-310000312069country:USbcs:UnemploymentEconomicCoreVariableMemberbcs:BaselineMemberbcs:FiveYearAveragesMember2022-12-310000312069country:USbcs:UnemploymentEconomicCoreVariableMemberbcs:DownsideOneMemberbcs:FiveYearAveragesMember2022-12-310000312069country:USbcs:UnemploymentEconomicCoreVariableMemberbcs:DownsideTwoMemberbcs:FiveYearAveragesMember2022-12-310000312069country:USbcs:HousePriceIndexEconomicCoreVariableMemberbcs:UpsideTwoMemberbcs:FiveYearAveragesMember2022-12-310000312069country:USbcs:HousePriceIndexEconomicCoreVariableMemberbcs:UpsideOneMemberbcs:FiveYearAveragesMember2022-12-310000312069country:USbcs:HousePriceIndexEconomicCoreVariableMemberbcs:BaselineMemberbcs:FiveYearAveragesMember2022-12-310000312069country:USbcs:HousePriceIndexEconomicCoreVariableMemberbcs:DownsideOneMemberbcs:FiveYearAveragesMember2022-12-310000312069country:USbcs:HousePriceIndexEconomicCoreVariableMemberbcs:DownsideTwoMemberbcs:FiveYearAveragesMember2022-12-310000312069country:USbcs:FederalFundsRateMemberbcs:UpsideTwoMemberbcs:FiveYearAveragesMember2022-12-310000312069country:USbcs:FederalFundsRateMemberbcs:UpsideOneMemberbcs:FiveYearAveragesMember2022-12-310000312069country:USbcs:FederalFundsRateMemberbcs:BaselineMemberbcs:FiveYearAveragesMember2022-12-310000312069country:USbcs:FederalFundsRateMemberbcs:DownsideOneMemberbcs:FiveYearAveragesMember2022-12-310000312069country:USbcs:FederalFundsRateMemberbcs:DownsideTwoMemberbcs:FiveYearAveragesMember2022-12-310000312069ifrs-full:MortgagesMemberifrs-full:FinancialAssetsAtAmortisedCostMemberifrs-full:CreditRiskMemberifrs-full:ExpectedCreditLossesCollectivelyAssessedMemberifrs-full:GrossCarryingAmountMemberifrs-full:TwelvemonthExpectedCreditLossesMember2023-12-310000312069bcs:UpsideTwoMemberifrs-full:MortgagesMemberifrs-full:FinancialAssetsAtAmortisedCostMemberifrs-full:ExpectedCreditLossesCollectivelyAssessedMemberifrs-full:GrossCarryingAmountMemberifrs-full:TwelvemonthExpectedCreditLossesMember2023-12-310000312069ifrs-full:MortgagesMemberbcs:UpsideOneMemberifrs-full:FinancialAssetsAtAmortisedCostMemberifrs-full:ExpectedCreditLossesCollectivelyAssessedMemberifrs-full:GrossCarryingAmountMemberifrs-full:TwelvemonthExpectedCreditLossesMember2023-12-310000312069ifrs-full:MortgagesMemberbcs:BaselineMemberifrs-full:FinancialAssetsAtAmortisedCostMemberifrs-full:ExpectedCreditLossesCollectivelyAssessedMemberifrs-full:GrossCarryingAmountMemberifrs-full:TwelvemonthExpectedCreditLossesMember2023-12-310000312069ifrs-full:MortgagesMemberifrs-full:FinancialAssetsAtAmortisedCostMemberbcs:DownsideOneMemberifrs-full:ExpectedCreditLossesCollectivelyAssessedMemberifrs-full:GrossCarryingAmountMemberifrs-full:TwelvemonthExpectedCreditLossesMember2023-12-310000312069ifrs-full:MortgagesMemberbcs:DownsideTwoMemberifrs-full:FinancialAssetsAtAmortisedCostMemberifrs-full:ExpectedCreditLossesCollectivelyAssessedMemberifrs-full:GrossCarryingAmountMemberifrs-full:TwelvemonthExpectedCreditLossesMember2023-12-310000312069bcs:CreditCardsRetailMemberifrs-full:FinancialAssetsAtAmortisedCostMemberifrs-full:CreditRiskMemberifrs-full:ExpectedCreditLossesCollectivelyAssessedMemberifrs-full:GrossCarryingAmountMemberifrs-full:TwelvemonthExpectedCreditLossesMember2023-12-310000312069bcs:CreditCardsRetailMemberbcs:UpsideTwoMemberifrs-full:FinancialAssetsAtAmortisedCostMemberifrs-full:ExpectedCreditLossesCollectivelyAssessedMemberifrs-full:GrossCarryingAmountMemberifrs-full:TwelvemonthExpectedCreditLossesMember2023-12-310000312069bcs:CreditCardsRetailMemberbcs:UpsideOneMemberifrs-full:FinancialAssetsAtAmortisedCostMemberifrs-full:ExpectedCreditLossesCollectivelyAssessedMemberifrs-full:GrossCarryingAmountMemberifrs-full:TwelvemonthExpectedCreditLossesMember2023-12-310000312069bcs:CreditCardsRetailMemberbcs:BaselineMemberifrs-full:FinancialAssetsAtAmortisedCostMemberifrs-full:ExpectedCreditLossesCollectivelyAssessedMemberifrs-full:GrossCarryingAmountMemberifrs-full:TwelvemonthExpectedCreditLossesMember2023-12-310000312069bcs:CreditCardsRetailMemberifrs-full:FinancialAssetsAtAmortisedCostMemberbcs:DownsideOneMemberifrs-full:ExpectedCreditLossesCollectivelyAssessedMemberifrs-full:GrossCarryingAmountMemberifrs-full:TwelvemonthExpectedCreditLossesMember2023-12-310000312069bcs:CreditCardsRetailMemberbcs:DownsideTwoMemberifrs-full:FinancialAssetsAtAmortisedCostMemberifrs-full:ExpectedCreditLossesCollectivelyAssessedMemberifrs-full:GrossCarryingAmountMemberifrs-full:TwelvemonthExpectedCreditLossesMember2023-12-310000312069bcs:OtherRetailMemberifrs-full:FinancialAssetsAtAmortisedCostMemberifrs-full:CreditRiskMemberifrs-full:ExpectedCreditLossesCollectivelyAssessedMemberifrs-full:GrossCarryingAmountMemberifrs-full:TwelvemonthExpectedCreditLossesMember2023-12-310000312069bcs:UpsideTwoMemberbcs:OtherRetailMemberifrs-full:FinancialAssetsAtAmortisedCostMemberifrs-full:ExpectedCreditLossesCollectivelyAssessedMemberifrs-full:GrossCarryingAmountMemberifrs-full:TwelvemonthExpectedCreditLossesMember2023-12-310000312069bcs:OtherRetailMemberbcs:UpsideOneMemberifrs-full:FinancialAssetsAtAmortisedCostMemberifrs-full:ExpectedCreditLossesCollectivelyAssessedMemberifrs-full:GrossCarryingAmountMemberifrs-full:TwelvemonthExpectedCreditLossesMember2023-12-310000312069bcs:OtherRetailMemberbcs:BaselineMemberifrs-full:FinancialAssetsAtAmortisedCostMemberifrs-full:ExpectedCreditLossesCollectivelyAssessedMemberifrs-full:GrossCarryingAmountMemberifrs-full:TwelvemonthExpectedCreditLossesMember2023-12-310000312069bcs:OtherRetailMemberifrs-full:FinancialAssetsAtAmortisedCostMemberbcs:DownsideOneMemberifrs-full:ExpectedCreditLossesCollectivelyAssessedMemberifrs-full:GrossCarryingAmountMemberifrs-full:TwelvemonthExpectedCreditLossesMember2023-12-310000312069bcs:OtherRetailMemberbcs:DownsideTwoMemberifrs-full:FinancialAssetsAtAmortisedCostMemberifrs-full:ExpectedCreditLossesCollectivelyAssessedMemberifrs-full:GrossCarryingAmountMemberifrs-full:TwelvemonthExpectedCreditLossesMember2023-12-310000312069ifrs-full:CorporateLoansMemberifrs-full:FinancialAssetsAtAmortisedCostMemberifrs-full:CreditRiskMemberifrs-full:ExpectedCreditLossesCollectivelyAssessedMemberifrs-full:GrossCarryingAmountMemberifrs-full:TwelvemonthExpectedCreditLossesMember2023-12-310000312069ifrs-full:CorporateLoansMemberbcs:UpsideTwoMemberifrs-full:FinancialAssetsAtAmortisedCostMemberifrs-full:ExpectedCreditLossesCollectivelyAssessedMemberifrs-full:GrossCarryingAmountMemberifrs-full:TwelvemonthExpectedCreditLossesMember2023-12-310000312069ifrs-full:CorporateLoansMemberbcs:UpsideOneMemberifrs-full:FinancialAssetsAtAmortisedCostMemberifrs-full:ExpectedCreditLossesCollectivelyAssessedMemberifrs-full:GrossCarryingAmountMemberifrs-full:TwelvemonthExpectedCreditLossesMember2023-12-310000312069ifrs-full:CorporateLoansMemberbcs:BaselineMemberifrs-full:FinancialAssetsAtAmortisedCostMemberifrs-full:ExpectedCreditLossesCollectivelyAssessedMemberifrs-full:GrossCarryingAmountMemberifrs-full:TwelvemonthExpectedCreditLossesMember2023-12-310000312069ifrs-full:CorporateLoansMemberifrs-full:FinancialAssetsAtAmortisedCostMemberbcs:DownsideOneMemberifrs-full:ExpectedCreditLossesCollectivelyAssessedMemberifrs-full:GrossCarryingAmountMemberifrs-full:TwelvemonthExpectedCreditLossesMember2023-12-310000312069ifrs-full:CorporateLoansMemberbcs:DownsideTwoMemberifrs-full:FinancialAssetsAtAmortisedCostMemberifrs-full:ExpectedCreditLossesCollectivelyAssessedMemberifrs-full:GrossCarryingAmountMemberifrs-full:TwelvemonthExpectedCreditLossesMember2023-12-310000312069ifrs-full:AccumulatedImpairmentMemberifrs-full:MortgagesMemberifrs-full:FinancialAssetsAtAmortisedCostMemberifrs-full:CreditRiskMemberifrs-full:ExpectedCreditLossesCollectivelyAssessedMemberifrs-full:TwelvemonthExpectedCreditLossesMember2023-12-310000312069ifrs-full:AccumulatedImpairmentMemberbcs:UpsideTwoMemberifrs-full:MortgagesMemberifrs-full:FinancialAssetsAtAmortisedCostMemberifrs-full:ExpectedCreditLossesCollectivelyAssessedMemberifrs-full:TwelvemonthExpectedCreditLossesMember2023-12-310000312069ifrs-full:AccumulatedImpairmentMemberifrs-full:MortgagesMemberbcs:UpsideOneMemberifrs-full:FinancialAssetsAtAmortisedCostMemberifrs-full:ExpectedCreditLossesCollectivelyAssessedMemberifrs-full:TwelvemonthExpectedCreditLossesMember2023-12-310000312069ifrs-full:AccumulatedImpairmentMemberifrs-full:MortgagesMemberbcs:BaselineMemberifrs-full:FinancialAssetsAtAmortisedCostMemberifrs-full:ExpectedCreditLossesCollectivelyAssessedMemberifrs-full:TwelvemonthExpectedCreditLossesMember2023-12-310000312069ifrs-full:AccumulatedImpairmentMemberifrs-full:MortgagesMemberifrs-full:FinancialAssetsAtAmortisedCostMemberbcs:DownsideOneMemberifrs-full:ExpectedCreditLossesCollectivelyAssessedMemberifrs-full:TwelvemonthExpectedCreditLossesMember2023-12-310000312069ifrs-full:AccumulatedImpairmentMemberifrs-full:MortgagesMemberbcs:DownsideTwoMemberifrs-full:FinancialAssetsAtAmortisedCostMemberifrs-full:ExpectedCreditLossesCollectivelyAssessedMemberifrs-full:TwelvemonthExpectedCreditLossesMember2023-12-310000312069bcs:CreditCardsRetailMemberifrs-full:AccumulatedImpairmentMemberifrs-full:FinancialAssetsAtAmortisedCostMemberifrs-full:CreditRiskMemberifrs-full:ExpectedCreditLossesCollectivelyAssessedMemberifrs-full:TwelvemonthExpectedCreditLossesMember2023-12-310000312069bcs:CreditCardsRetailMemberifrs-full:AccumulatedImpairmentMemberbcs:UpsideTwoMemberifrs-full:FinancialAssetsAtAmortisedCostMemberifrs-full:ExpectedCreditLossesCollectivelyAssessedMemberifrs-full:TwelvemonthExpectedCreditLossesMember2023-12-310000312069bcs:CreditCardsRetailMemberifrs-full:AccumulatedImpairmentMemberbcs:UpsideOneMemberifrs-full:FinancialAssetsAtAmortisedCostMemberifrs-full:ExpectedCreditLossesCollectivelyAssessedMemberifrs-full:TwelvemonthExpectedCreditLossesMember2023-12-310000312069bcs:CreditCardsRetailMemberifrs-full:AccumulatedImpairmentMemberbcs:BaselineMemberifrs-full:FinancialAssetsAtAmortisedCostMemberifrs-full:ExpectedCreditLossesCollectivelyAssessedMemberifrs-full:TwelvemonthExpectedCreditLossesMember2023-12-310000312069bcs:CreditCardsRetailMemberifrs-full:AccumulatedImpairmentMemberifrs-full:FinancialAssetsAtAmortisedCostMemberbcs:DownsideOneMemberifrs-full:ExpectedCreditLossesCollectivelyAssessedMemberifrs-full:TwelvemonthExpectedCreditLossesMember2023-12-310000312069bcs:CreditCardsRetailMemberifrs-full:AccumulatedImpairmentMemberbcs:DownsideTwoMemberifrs-full:FinancialAssetsAtAmortisedCostMemberifrs-full:ExpectedCreditLossesCollectivelyAssessedMemberifrs-full:TwelvemonthExpectedCreditLossesMember2023-12-310000312069ifrs-full:AccumulatedImpairmentMemberbcs:OtherRetailMemberifrs-full:FinancialAssetsAtAmortisedCostMemberifrs-full:CreditRiskMemberifrs-full:ExpectedCreditLossesCollectivelyAssessedMemberifrs-full:TwelvemonthExpectedCreditLossesMember2023-12-310000312069ifrs-full:AccumulatedImpairmentMemberbcs:UpsideTwoMemberbcs:OtherRetailMemberifrs-full:FinancialAssetsAtAmortisedCostMemberifrs-full:ExpectedCreditLossesCollectivelyAssessedMemberifrs-full:TwelvemonthExpectedCreditLossesMember2023-12-310000312069ifrs-full:AccumulatedImpairmentMemberbcs:OtherRetailMemberbcs:UpsideOneMemberifrs-full:FinancialAssetsAtAmortisedCostMemberifrs-full:ExpectedCreditLossesCollectivelyAssessedMemberifrs-full:TwelvemonthExpectedCreditLossesMember2023-12-310000312069ifrs-full:AccumulatedImpairmentMemberbcs:OtherRetailMemberbcs:BaselineMemberifrs-full:FinancialAssetsAtAmortisedCostMemberifrs-full:ExpectedCreditLossesCollectivelyAssessedMemberifrs-full:TwelvemonthExpectedCreditLossesMember2023-12-310000312069ifrs-full:AccumulatedImpairmentMemberbcs:OtherRetailMemberifrs-full:FinancialAssetsAtAmortisedCostMemberbcs:DownsideOneMemberifrs-full:ExpectedCreditLossesCollectivelyAssessedMemberifrs-full:TwelvemonthExpectedCreditLossesMember2023-12-310000312069ifrs-full:AccumulatedImpairmentMemberbcs:OtherRetailMemberbcs:DownsideTwoMemberifrs-full:FinancialAssetsAtAmortisedCostMemberifrs-full:ExpectedCreditLossesCollectivelyAssessedMemberifrs-full:TwelvemonthExpectedCreditLossesMember2023-12-310000312069ifrs-full:AccumulatedImpairmentMemberifrs-full:CorporateLoansMemberifrs-full:FinancialAssetsAtAmortisedCostMemberifrs-full:CreditRiskMemberifrs-full:ExpectedCreditLossesCollectivelyAssessedMemberifrs-full:TwelvemonthExpectedCreditLossesMember2023-12-310000312069ifrs-full:AccumulatedImpairmentMemberifrs-full:CorporateLoansMemberbcs:UpsideTwoMemberifrs-full:FinancialAssetsAtAmortisedCostMemberifrs-full:ExpectedCreditLossesCollectivelyAssessedMemberifrs-full:TwelvemonthExpectedCreditLossesMember2023-12-310000312069ifrs-full:AccumulatedImpairmentMemberifrs-full:CorporateLoansMemberbcs:UpsideOneMemberifrs-full:FinancialAssetsAtAmortisedCostMemberifrs-full:ExpectedCreditLossesCollectivelyAssessedMemberifrs-full:TwelvemonthExpectedCreditLossesMember2023-12-310000312069ifrs-full:AccumulatedImpairmentMemberifrs-full:CorporateLoansMemberbcs:BaselineMemberifrs-full:FinancialAssetsAtAmortisedCostMemberifrs-full:ExpectedCreditLossesCollectivelyAssessedMemberifrs-full:TwelvemonthExpectedCreditLossesMember2023-12-310000312069ifrs-full:AccumulatedImpairmentMemberifrs-full:CorporateLoansMemberifrs-full:FinancialAssetsAtAmortisedCostMemberbcs:DownsideOneMemberifrs-full:ExpectedCreditLossesCollectivelyAssessedMemberifrs-full:TwelvemonthExpectedCreditLossesMember2023-12-310000312069ifrs-full:AccumulatedImpairmentMemberifrs-full:CorporateLoansMemberbcs:DownsideTwoMemberifrs-full:FinancialAssetsAtAmortisedCostMemberifrs-full:ExpectedCreditLossesCollectivelyAssessedMemberifrs-full:TwelvemonthExpectedCreditLossesMember2023-12-310000312069ifrs-full:MortgagesMemberifrs-full:FinancialAssetsAtAmortisedCostMemberifrs-full:CreditRiskMemberifrs-full:ExpectedCreditLossesCollectivelyAssessedMemberifrs-full:TwelvemonthExpectedCreditLossesMember2023-12-310000312069bcs:UpsideTwoMemberifrs-full:MortgagesMemberifrs-full:FinancialAssetsAtAmortisedCostMemberifrs-full:ExpectedCreditLossesCollectivelyAssessedMemberifrs-full:TwelvemonthExpectedCreditLossesMember2023-12-310000312069ifrs-full:MortgagesMemberbcs:UpsideOneMemberifrs-full:FinancialAssetsAtAmortisedCostMemberifrs-full:ExpectedCreditLossesCollectivelyAssessedMemberifrs-full:TwelvemonthExpectedCreditLossesMember2023-12-310000312069ifrs-full:MortgagesMemberbcs:BaselineMemberifrs-full:FinancialAssetsAtAmortisedCostMemberifrs-full:ExpectedCreditLossesCollectivelyAssessedMemberifrs-full:TwelvemonthExpectedCreditLossesMember2023-12-310000312069ifrs-full:MortgagesMemberifrs-full:FinancialAssetsAtAmortisedCostMemberbcs:DownsideOneMemberifrs-full:ExpectedCreditLossesCollectivelyAssessedMemberifrs-full:TwelvemonthExpectedCreditLossesMember2023-12-310000312069ifrs-full:MortgagesMemberbcs:DownsideTwoMemberifrs-full:FinancialAssetsAtAmortisedCostMemberifrs-full:ExpectedCreditLossesCollectivelyAssessedMemberifrs-full:TwelvemonthExpectedCreditLossesMember2023-12-310000312069bcs:CreditCardsRetailMemberifrs-full:FinancialAssetsAtAmortisedCostMemberifrs-full:CreditRiskMemberifrs-full:ExpectedCreditLossesCollectivelyAssessedMemberifrs-full:TwelvemonthExpectedCreditLossesMember2023-12-310000312069bcs:CreditCardsRetailMemberbcs:UpsideTwoMemberifrs-full:FinancialAssetsAtAmortisedCostMemberifrs-full:ExpectedCreditLossesCollectivelyAssessedMemberifrs-full:TwelvemonthExpectedCreditLossesMember2023-12-310000312069bcs:CreditCardsRetailMemberbcs:UpsideOneMemberifrs-full:FinancialAssetsAtAmortisedCostMemberifrs-full:ExpectedCreditLossesCollectivelyAssessedMemberifrs-full:TwelvemonthExpectedCreditLossesMember2023-12-310000312069bcs:CreditCardsRetailMemberbcs:BaselineMemberifrs-full:FinancialAssetsAtAmortisedCostMemberifrs-full:ExpectedCreditLossesCollectivelyAssessedMemberifrs-full:TwelvemonthExpectedCreditLossesMember2023-12-310000312069bcs:CreditCardsRetailMemberifrs-full:FinancialAssetsAtAmortisedCostMemberbcs:DownsideOneMemberifrs-full:ExpectedCreditLossesCollectivelyAssessedMemberifrs-full:TwelvemonthExpectedCreditLossesMember2023-12-310000312069bcs:CreditCardsRetailMemberbcs:DownsideTwoMemberifrs-full:FinancialAssetsAtAmortisedCostMemberifrs-full:ExpectedCreditLossesCollectivelyAssessedMemberifrs-full:TwelvemonthExpectedCreditLossesMember2023-12-310000312069bcs:OtherRetailMemberifrs-full:FinancialAssetsAtAmortisedCostMemberifrs-full:CreditRiskMemberifrs-full:ExpectedCreditLossesCollectivelyAssessedMemberifrs-full:TwelvemonthExpectedCreditLossesMember2023-12-310000312069bcs:UpsideTwoMemberbcs:OtherRetailMemberifrs-full:FinancialAssetsAtAmortisedCostMemberifrs-full:ExpectedCreditLossesCollectivelyAssessedMemberifrs-full:TwelvemonthExpectedCreditLossesMember2023-12-310000312069bcs:OtherRetailMemberbcs:UpsideOneMemberifrs-full:FinancialAssetsAtAmortisedCostMemberifrs-full:ExpectedCreditLossesCollectivelyAssessedMemberifrs-full:TwelvemonthExpectedCreditLossesMember2023-12-310000312069bcs:OtherRetailMemberbcs:BaselineMemberifrs-full:FinancialAssetsAtAmortisedCostMemberifrs-full:ExpectedCreditLossesCollectivelyAssessedMemberifrs-full:TwelvemonthExpectedCreditLossesMember2023-12-310000312069bcs:OtherRetailMemberifrs-full:FinancialAssetsAtAmortisedCostMemberbcs:DownsideOneMemberifrs-full:ExpectedCreditLossesCollectivelyAssessedMemberifrs-full:TwelvemonthExpectedCreditLossesMember2023-12-310000312069bcs:OtherRetailMemberbcs:DownsideTwoMemberifrs-full:FinancialAssetsAtAmortisedCostMemberifrs-full:ExpectedCreditLossesCollectivelyAssessedMemberifrs-full:TwelvemonthExpectedCreditLossesMember2023-12-310000312069ifrs-full:CorporateLoansMemberifrs-full:FinancialAssetsAtAmortisedCostMemberifrs-full:CreditRiskMemberifrs-full:ExpectedCreditLossesCollectivelyAssessedMemberifrs-full:TwelvemonthExpectedCreditLossesMember2023-12-310000312069ifrs-full:CorporateLoansMemberbcs:UpsideTwoMemberifrs-full:FinancialAssetsAtAmortisedCostMemberifrs-full:ExpectedCreditLossesCollectivelyAssessedMemberifrs-full:TwelvemonthExpectedCreditLossesMember2023-12-310000312069ifrs-full:CorporateLoansMemberbcs:UpsideOneMemberifrs-full:FinancialAssetsAtAmortisedCostMemberifrs-full:ExpectedCreditLossesCollectivelyAssessedMemberifrs-full:TwelvemonthExpectedCreditLossesMember2023-12-310000312069ifrs-full:CorporateLoansMemberbcs:BaselineMemberifrs-full:FinancialAssetsAtAmortisedCostMemberifrs-full:ExpectedCreditLossesCollectivelyAssessedMemberifrs-full:TwelvemonthExpectedCreditLossesMember2023-12-310000312069ifrs-full:CorporateLoansMemberifrs-full:FinancialAssetsAtAmortisedCostMemberbcs:DownsideOneMemberifrs-full:ExpectedCreditLossesCollectivelyAssessedMemberifrs-full:TwelvemonthExpectedCreditLossesMember2023-12-310000312069ifrs-full:CorporateLoansMemberbcs:DownsideTwoMemberifrs-full:FinancialAssetsAtAmortisedCostMemberifrs-full:ExpectedCreditLossesCollectivelyAssessedMemberifrs-full:TwelvemonthExpectedCreditLossesMember2023-12-310000312069ifrs-full:LifetimeExpectedCreditLossesMemberifrs-full:MortgagesMemberifrs-full:FinancialAssetsAtAmortisedCostMemberifrs-full:CreditRiskMemberifrs-full:ExpectedCreditLossesCollectivelyAssessedMemberifrs-full:GrossCarryingAmountMemberifrs-full:FinancialInstrumentsNotCreditimpairedMember2023-12-310000312069ifrs-full:LifetimeExpectedCreditLossesMemberbcs:UpsideTwoMemberifrs-full:MortgagesMemberifrs-full:FinancialAssetsAtAmortisedCostMemberifrs-full:ExpectedCreditLossesCollectivelyAssessedMemberifrs-full:GrossCarryingAmountMemberifrs-full:FinancialInstrumentsNotCreditimpairedMember2023-12-310000312069ifrs-full:LifetimeExpectedCreditLossesMemberifrs-full:MortgagesMemberbcs:UpsideOneMemberifrs-full:FinancialAssetsAtAmortisedCostMemberifrs-full:ExpectedCreditLossesCollectivelyAssessedMemberifrs-full:GrossCarryingAmountMemberifrs-full:FinancialInstrumentsNotCreditimpairedMember2023-12-310000312069ifrs-full:LifetimeExpectedCreditLossesMemberifrs-full:MortgagesMemberbcs:BaselineMemberifrs-full:FinancialAssetsAtAmortisedCostMemberifrs-full:ExpectedCreditLossesCollectivelyAssessedMemberifrs-full:GrossCarryingAmountMemberifrs-full:FinancialInstrumentsNotCreditimpairedMember2023-12-310000312069ifrs-full:LifetimeExpectedCreditLossesMemberifrs-full:MortgagesMemberifrs-full:FinancialAssetsAtAmortisedCostMemberbcs:DownsideOneMemberifrs-full:ExpectedCreditLossesCollectivelyAssessedMemberifrs-full:GrossCarryingAmountMemberifrs-full:FinancialInstrumentsNotCreditimpairedMember2023-12-310000312069ifrs-full:LifetimeExpectedCreditLossesMemberifrs-full:MortgagesMemberbcs:DownsideTwoMemberifrs-full:FinancialAssetsAtAmortisedCostMemberifrs-full:ExpectedCreditLossesCollectivelyAssessedMemberifrs-full:GrossCarryingAmountMemberifrs-full:FinancialInstrumentsNotCreditimpairedMember2023-12-310000312069bcs:CreditCardsRetailMemberifrs-full:LifetimeExpectedCreditLossesMemberifrs-full:FinancialAssetsAtAmortisedCostMemberifrs-full:CreditRiskMemberifrs-full:ExpectedCreditLossesCollectivelyAssessedMemberifrs-full:GrossCarryingAmountMemberifrs-full:FinancialInstrumentsNotCreditimpairedMember2023-12-310000312069bcs:CreditCardsRetailMemberifrs-full:LifetimeExpectedCreditLossesMemberbcs:UpsideTwoMemberifrs-full:FinancialAssetsAtAmortisedCostMemberifrs-full:ExpectedCreditLossesCollectivelyAssessedMemberifrs-full:GrossCarryingAmountMemberifrs-full:FinancialInstrumentsNotCreditimpairedMember2023-12-310000312069bcs:CreditCardsRetailMemberifrs-full:LifetimeExpectedCreditLossesMemberbcs:UpsideOneMemberifrs-full:FinancialAssetsAtAmortisedCostMemberifrs-full:ExpectedCreditLossesCollectivelyAssessedMemberifrs-full:GrossCarryingAmountMemberifrs-full:FinancialInstrumentsNotCreditimpairedMember2023-12-310000312069bcs:CreditCardsRetailMemberifrs-full:LifetimeExpectedCreditLossesMemberbcs:BaselineMemberifrs-full:FinancialAssetsAtAmortisedCostMemberifrs-full:ExpectedCreditLossesCollectivelyAssessedMemberifrs-full:GrossCarryingAmountMemberifrs-full:FinancialInstrumentsNotCreditimpairedMember2023-12-310000312069bcs:CreditCardsRetailMemberifrs-full:LifetimeExpectedCreditLossesMemberifrs-full:FinancialAssetsAtAmortisedCostMemberbcs:DownsideOneMemberifrs-full:ExpectedCreditLossesCollectivelyAssessedMemberifrs-full:GrossCarryingAmountMemberifrs-full:FinancialInstrumentsNotCreditimpairedMember2023-12-310000312069bcs:CreditCardsRetailMemberifrs-full:LifetimeExpectedCreditLossesMemberbcs:DownsideTwoMemberifrs-full:FinancialAssetsAtAmortisedCostMemberifrs-full:ExpectedCreditLossesCollectivelyAssessedMemberifrs-full:GrossCarryingAmountMemberifrs-full:FinancialInstrumentsNotCreditimpairedMember2023-12-310000312069ifrs-full:LifetimeExpectedCreditLossesMemberbcs:OtherRetailMemberifrs-full:FinancialAssetsAtAmortisedCostMemberifrs-full:CreditRiskMemberifrs-full:ExpectedCreditLossesCollectivelyAssessedMemberifrs-full:GrossCarryingAmountMemberifrs-full:FinancialInstrumentsNotCreditimpairedMember2023-12-310000312069ifrs-full:LifetimeExpectedCreditLossesMemberbcs:UpsideTwoMemberbcs:OtherRetailMemberifrs-full:FinancialAssetsAtAmortisedCostMemberifrs-full:ExpectedCreditLossesCollectivelyAssessedMemberifrs-full:GrossCarryingAmountMemberifrs-full:FinancialInstrumentsNotCreditimpairedMember2023-12-310000312069ifrs-full:LifetimeExpectedCreditLossesMemberbcs:OtherRetailMemberbcs:UpsideOneMemberifrs-full:FinancialAssetsAtAmortisedCostMemberifrs-full:ExpectedCreditLossesCollectivelyAssessedMemberifrs-full:GrossCarryingAmountMemberifrs-full:FinancialInstrumentsNotCreditimpairedMember2023-12-310000312069ifrs-full:LifetimeExpectedCreditLossesMemberbcs:OtherRetailMemberbcs:BaselineMemberifrs-full:FinancialAssetsAtAmortisedCostMemberifrs-full:ExpectedCreditLossesCollectivelyAssessedMemberifrs-full:GrossCarryingAmountMemberifrs-full:FinancialInstrumentsNotCreditimpairedMember2023-12-310000312069ifrs-full:LifetimeExpectedCreditLossesMemberbcs:OtherRetailMemberifrs-full:FinancialAssetsAtAmortisedCostMemberbcs:DownsideOneMemberifrs-full:ExpectedCreditLossesCollectivelyAssessedMemberifrs-full:GrossCarryingAmountMemberifrs-full:FinancialInstrumentsNotCreditimpairedMember2023-12-310000312069ifrs-full:LifetimeExpectedCreditLossesMemberbcs:OtherRetailMemberbcs:DownsideTwoMemberifrs-full:FinancialAssetsAtAmortisedCostMemberifrs-full:ExpectedCreditLossesCollectivelyAssessedMemberifrs-full:GrossCarryingAmountMemberifrs-full:FinancialInstrumentsNotCreditimpairedMember2023-12-310000312069ifrs-full:LifetimeExpectedCreditLossesMemberifrs-full:CorporateLoansMemberifrs-full:FinancialAssetsAtAmortisedCostMemberifrs-full:CreditRiskMemberifrs-full:ExpectedCreditLossesCollectivelyAssessedMemberifrs-full:GrossCarryingAmountMemberifrs-full:FinancialInstrumentsNotCreditimpairedMember2023-12-310000312069ifrs-full:LifetimeExpectedCreditLossesMemberifrs-full:CorporateLoansMemberbcs:UpsideTwoMemberifrs-full:FinancialAssetsAtAmortisedCostMemberifrs-full:ExpectedCreditLossesCollectivelyAssessedMemberifrs-full:GrossCarryingAmountMemberifrs-full:FinancialInstrumentsNotCreditimpairedMember2023-12-310000312069ifrs-full:LifetimeExpectedCreditLossesMemberifrs-full:CorporateLoansMemberbcs:UpsideOneMemberifrs-full:FinancialAssetsAtAmortisedCostMemberifrs-full:ExpectedCreditLossesCollectivelyAssessedMemberifrs-full:GrossCarryingAmountMemberifrs-full:FinancialInstrumentsNotCreditimpairedMember2023-12-310000312069ifrs-full:LifetimeExpectedCreditLossesMemberifrs-full:CorporateLoansMemberbcs:BaselineMemberifrs-full:FinancialAssetsAtAmortisedCostMemberifrs-full:ExpectedCreditLossesCollectivelyAssessedMemberifrs-full:GrossCarryingAmountMemberifrs-full:FinancialInstrumentsNotCreditimpairedMember2023-12-310000312069ifrs-full:LifetimeExpectedCreditLossesMemberifrs-full:CorporateLoansMemberifrs-full:FinancialAssetsAtAmortisedCostMemberbcs:DownsideOneMemberifrs-full:ExpectedCreditLossesCollectivelyAssessedMemberifrs-full:GrossCarryingAmountMemberifrs-full:FinancialInstrumentsNotCreditimpairedMember2023-12-310000312069ifrs-full:LifetimeExpectedCreditLossesMemberifrs-full:CorporateLoansMemberbcs:DownsideTwoMemberifrs-full:FinancialAssetsAtAmortisedCostMemberifrs-full:ExpectedCreditLossesCollectivelyAssessedMemberifrs-full:GrossCarryingAmountMemberifrs-full:FinancialInstrumentsNotCreditimpairedMember2023-12-310000312069ifrs-full:AccumulatedImpairmentMemberifrs-full:LifetimeExpectedCreditLossesMemberifrs-full:MortgagesMemberifrs-full:FinancialAssetsAtAmortisedCostMemberifrs-full:CreditRiskMemberifrs-full:ExpectedCreditLossesCollectivelyAssessedMemberifrs-full:FinancialInstrumentsNotCreditimpairedMember2023-12-310000312069ifrs-full:AccumulatedImpairmentMemberifrs-full:LifetimeExpectedCreditLossesMemberbcs:UpsideTwoMemberifrs-full:MortgagesMemberifrs-full:FinancialAssetsAtAmortisedCostMemberifrs-full:ExpectedCreditLossesCollectivelyAssessedMemberifrs-full:FinancialInstrumentsNotCreditimpairedMember2023-12-310000312069ifrs-full:AccumulatedImpairmentMemberifrs-full:LifetimeExpectedCreditLossesMemberifrs-full:MortgagesMemberbcs:UpsideOneMemberifrs-full:FinancialAssetsAtAmortisedCostMemberifrs-full:ExpectedCreditLossesCollectivelyAssessedMemberifrs-full:FinancialInstrumentsNotCreditimpairedMember2023-12-310000312069ifrs-full:AccumulatedImpairmentMemberifrs-full:LifetimeExpectedCreditLossesMemberifrs-full:MortgagesMemberbcs:BaselineMemberifrs-full:FinancialAssetsAtAmortisedCostMemberifrs-full:ExpectedCreditLossesCollectivelyAssessedMemberifrs-full:FinancialInstrumentsNotCreditimpairedMember2023-12-310000312069ifrs-full:AccumulatedImpairmentMemberifrs-full:LifetimeExpectedCreditLossesMemberifrs-full:MortgagesMemberifrs-full:FinancialAssetsAtAmortisedCostMemberbcs:DownsideOneMemberifrs-full:ExpectedCreditLossesCollectivelyAssessedMemberifrs-full:FinancialInstrumentsNotCreditimpairedMember2023-12-310000312069ifrs-full:AccumulatedImpairmentMemberifrs-full:LifetimeExpectedCreditLossesMemberifrs-full:MortgagesMemberbcs:DownsideTwoMemberifrs-full:FinancialAssetsAtAmortisedCostMemberifrs-full:ExpectedCreditLossesCollectivelyAssessedMemberifrs-full:FinancialInstrumentsNotCreditimpairedMember2023-12-310000312069bcs:CreditCardsRetailMemberifrs-full:AccumulatedImpairmentMemberifrs-full:LifetimeExpectedCreditLossesMemberifrs-full:FinancialAssetsAtAmortisedCostMemberifrs-full:CreditRiskMemberifrs-full:ExpectedCreditLossesCollectivelyAssessedMemberifrs-full:FinancialInstrumentsNotCreditimpairedMember2023-12-310000312069bcs:CreditCardsRetailMemberifrs-full:AccumulatedImpairmentMemberifrs-full:LifetimeExpectedCreditLossesMemberbcs:UpsideTwoMemberifrs-full:FinancialAssetsAtAmortisedCostMemberifrs-full:ExpectedCreditLossesCollectivelyAssessedMemberifrs-full:FinancialInstrumentsNotCreditimpairedMember2023-12-310000312069bcs:CreditCardsRetailMemberifrs-full:AccumulatedImpairmentMemberifrs-full:LifetimeExpectedCreditLossesMemberbcs:UpsideOneMemberifrs-full:FinancialAssetsAtAmortisedCostMemberifrs-full:ExpectedCreditLossesCollectivelyAssessedMemberifrs-full:FinancialInstrumentsNotCreditimpairedMember2023-12-310000312069bcs:CreditCardsRetailMemberifrs-full:AccumulatedImpairmentMemberifrs-full:LifetimeExpectedCreditLossesMemberbcs:BaselineMemberifrs-full:FinancialAssetsAtAmortisedCostMemberifrs-full:ExpectedCreditLossesCollectivelyAssessedMemberifrs-full:FinancialInstrumentsNotCreditimpairedMember2023-12-310000312069bcs:CreditCardsRetailMemberifrs-full:AccumulatedImpairmentMemberifrs-full:LifetimeExpectedCreditLossesMemberifrs-full:FinancialAssetsAtAmortisedCostMemberbcs:DownsideOneMemberifrs-full:ExpectedCreditLossesCollectivelyAssessedMemberifrs-full:FinancialInstrumentsNotCreditimpairedMember2023-12-310000312069bcs:CreditCardsRetailMemberifrs-full:AccumulatedImpairmentMemberifrs-full:LifetimeExpectedCreditLossesMemberbcs:DownsideTwoMemberifrs-full:FinancialAssetsAtAmortisedCostMemberifrs-full:ExpectedCreditLossesCollectivelyAssessedMemberifrs-full:FinancialInstrumentsNotCreditimpairedMember2023-12-310000312069ifrs-full:AccumulatedImpairmentMemberifrs-full:LifetimeExpectedCreditLossesMemberbcs:OtherRetailMemberifrs-full:FinancialAssetsAtAmortisedCostMemberifrs-full:CreditRiskMemberifrs-full:ExpectedCreditLossesCollectivelyAssessedMemberifrs-full:FinancialInstrumentsNotCreditimpairedMember2023-12-310000312069ifrs-full:AccumulatedImpairmentMemberifrs-full:LifetimeExpectedCreditLossesMemberbcs:UpsideTwoMemberbcs:OtherRetailMemberifrs-full:FinancialAssetsAtAmortisedCostMemberifrs-full:ExpectedCreditLossesCollectivelyAssessedMemberifrs-full:FinancialInstrumentsNotCreditimpairedMember2023-12-310000312069ifrs-full:AccumulatedImpairmentMemberifrs-full:LifetimeExpectedCreditLossesMemberbcs:OtherRetailMemberbcs:UpsideOneMemberifrs-full:FinancialAssetsAtAmortisedCostMemberifrs-full:ExpectedCreditLossesCollectivelyAssessedMemberifrs-full:FinancialInstrumentsNotCreditimpairedMember2023-12-310000312069ifrs-full:AccumulatedImpairmentMemberifrs-full:LifetimeExpectedCreditLossesMemberbcs:OtherRetailMemberbcs:BaselineMemberifrs-full:FinancialAssetsAtAmortisedCostMemberifrs-full:ExpectedCreditLossesCollectivelyAssessedMemberifrs-full:FinancialInstrumentsNotCreditimpairedMember2023-12-310000312069ifrs-full:AccumulatedImpairmentMemberifrs-full:LifetimeExpectedCreditLossesMemberbcs:OtherRetailMemberifrs-full:FinancialAssetsAtAmortisedCostMemberbcs:DownsideOneMemberifrs-full:ExpectedCreditLossesCollectivelyAssessedMemberifrs-full:FinancialInstrumentsNotCreditimpairedMember2023-12-310000312069ifrs-full:AccumulatedImpairmentMemberifrs-full:LifetimeExpectedCreditLossesMemberbcs:OtherRetailMemberbcs:DownsideTwoMemberifrs-full:FinancialAssetsAtAmortisedCostMemberifrs-full:ExpectedCreditLossesCollectivelyAssessedMemberifrs-full:FinancialInstrumentsNotCreditimpairedMember2023-12-310000312069ifrs-full:AccumulatedImpairmentMemberifrs-full:LifetimeExpectedCreditLossesMemberifrs-full:CorporateLoansMemberifrs-full:FinancialAssetsAtAmortisedCostMemberifrs-full:CreditRiskMemberifrs-full:ExpectedCreditLossesCollectivelyAssessedMemberifrs-full:FinancialInstrumentsNotCreditimpairedMember2023-12-310000312069ifrs-full:AccumulatedImpairmentMemberifrs-full:LifetimeExpectedCreditLossesMemberifrs-full:CorporateLoansMemberbcs:UpsideTwoMemberifrs-full:FinancialAssetsAtAmortisedCostMemberifrs-full:ExpectedCreditLossesCollectivelyAssessedMemberifrs-full:FinancialInstrumentsNotCreditimpairedMember2023-12-310000312069ifrs-full:AccumulatedImpairmentMemberifrs-full:LifetimeExpectedCreditLossesMemberifrs-full:CorporateLoansMemberbcs:UpsideOneMemberifrs-full:FinancialAssetsAtAmortisedCostMemberifrs-full:ExpectedCreditLossesCollectivelyAssessedMemberifrs-full:FinancialInstrumentsNotCreditimpairedMember2023-12-310000312069ifrs-full:AccumulatedImpairmentMemberifrs-full:LifetimeExpectedCreditLossesMemberifrs-full:CorporateLoansMemberbcs:BaselineMemberifrs-full:FinancialAssetsAtAmortisedCostMemberifrs-full:ExpectedCreditLossesCollectivelyAssessedMemberifrs-full:FinancialInstrumentsNotCreditimpairedMember2023-12-310000312069ifrs-full:AccumulatedImpairmentMemberifrs-full:LifetimeExpectedCreditLossesMemberifrs-full:CorporateLoansMemberifrs-full:FinancialAssetsAtAmortisedCostMemberbcs:DownsideOneMemberifrs-full:ExpectedCreditLossesCollectivelyAssessedMemberifrs-full:FinancialInstrumentsNotCreditimpairedMember2023-12-310000312069ifrs-full:AccumulatedImpairmentMemberifrs-full:LifetimeExpectedCreditLossesMemberifrs-full:CorporateLoansMemberbcs:DownsideTwoMemberifrs-full:FinancialAssetsAtAmortisedCostMemberifrs-full:ExpectedCreditLossesCollectivelyAssessedMemberifrs-full:FinancialInstrumentsNotCreditimpairedMember2023-12-310000312069ifrs-full:LifetimeExpectedCreditLossesMemberifrs-full:MortgagesMemberifrs-full:FinancialAssetsAtAmortisedCostMemberifrs-full:CreditRiskMemberifrs-full:ExpectedCreditLossesCollectivelyAssessedMemberifrs-full:FinancialInstrumentsNotCreditimpairedMember2023-12-310000312069ifrs-full:LifetimeExpectedCreditLossesMemberbcs:UpsideTwoMemberifrs-full:MortgagesMemberifrs-full:FinancialAssetsAtAmortisedCostMemberifrs-full:ExpectedCreditLossesCollectivelyAssessedMemberifrs-full:FinancialInstrumentsNotCreditimpairedMember2023-12-310000312069ifrs-full:LifetimeExpectedCreditLossesMemberifrs-full:MortgagesMemberbcs:UpsideOneMemberifrs-full:FinancialAssetsAtAmortisedCostMemberifrs-full:ExpectedCreditLossesCollectivelyAssessedMemberifrs-full:FinancialInstrumentsNotCreditimpairedMember2023-12-310000312069ifrs-full:LifetimeExpectedCreditLossesMemberifrs-full:MortgagesMemberbcs:BaselineMemberifrs-full:FinancialAssetsAtAmortisedCostMemberifrs-full:ExpectedCreditLossesCollectivelyAssessedMemberifrs-full:FinancialInstrumentsNotCreditimpairedMember2023-12-310000312069ifrs-full:LifetimeExpectedCreditLossesMemberifrs-full:MortgagesMemberifrs-full:FinancialAssetsAtAmortisedCostMemberbcs:DownsideOneMemberifrs-full:ExpectedCreditLossesCollectivelyAssessedMemberifrs-full:FinancialInstrumentsNotCreditimpairedMember2023-12-310000312069ifrs-full:LifetimeExpectedCreditLossesMemberifrs-full:MortgagesMemberbcs:DownsideTwoMemberifrs-full:FinancialAssetsAtAmortisedCostMemberifrs-full:ExpectedCreditLossesCollectivelyAssessedMemberifrs-full:FinancialInstrumentsNotCreditimpairedMember2023-12-310000312069bcs:CreditCardsRetailMemberifrs-full:LifetimeExpectedCreditLossesMemberifrs-full:FinancialAssetsAtAmortisedCostMemberifrs-full:CreditRiskMemberifrs-full:ExpectedCreditLossesCollectivelyAssessedMemberifrs-full:FinancialInstrumentsNotCreditimpairedMember2023-12-310000312069bcs:CreditCardsRetailMemberifrs-full:LifetimeExpectedCreditLossesMemberbcs:UpsideTwoMemberifrs-full:FinancialAssetsAtAmortisedCostMemberifrs-full:ExpectedCreditLossesCollectivelyAssessedMemberifrs-full:FinancialInstrumentsNotCreditimpairedMember2023-12-310000312069bcs:CreditCardsRetailMemberifrs-full:LifetimeExpectedCreditLossesMemberbcs:UpsideOneMemberifrs-full:FinancialAssetsAtAmortisedCostMemberifrs-full:ExpectedCreditLossesCollectivelyAssessedMemberifrs-full:FinancialInstrumentsNotCreditimpairedMember2023-12-310000312069bcs:CreditCardsRetailMemberifrs-full:LifetimeExpectedCreditLossesMemberbcs:BaselineMemberifrs-full:FinancialAssetsAtAmortisedCostMemberifrs-full:ExpectedCreditLossesCollectivelyAssessedMemberifrs-full:FinancialInstrumentsNotCreditimpairedMember2023-12-310000312069bcs:CreditCardsRetailMemberifrs-full:LifetimeExpectedCreditLossesMemberifrs-full:FinancialAssetsAtAmortisedCostMemberbcs:DownsideOneMemberifrs-full:ExpectedCreditLossesCollectivelyAssessedMemberifrs-full:FinancialInstrumentsNotCreditimpairedMember2023-12-310000312069bcs:CreditCardsRetailMemberifrs-full:LifetimeExpectedCreditLossesMemberbcs:DownsideTwoMemberifrs-full:FinancialAssetsAtAmortisedCostMemberifrs-full:ExpectedCreditLossesCollectivelyAssessedMemberifrs-full:FinancialInstrumentsNotCreditimpairedMember2023-12-310000312069ifrs-full:LifetimeExpectedCreditLossesMemberbcs:OtherRetailMemberifrs-full:FinancialAssetsAtAmortisedCostMemberifrs-full:CreditRiskMemberifrs-full:ExpectedCreditLossesCollectivelyAssessedMemberifrs-full:FinancialInstrumentsNotCreditimpairedMember2023-12-310000312069ifrs-full:LifetimeExpectedCreditLossesMemberbcs:UpsideTwoMemberbcs:OtherRetailMemberifrs-full:FinancialAssetsAtAmortisedCostMemberifrs-full:ExpectedCreditLossesCollectivelyAssessedMemberifrs-full:FinancialInstrumentsNotCreditimpairedMember2023-12-310000312069ifrs-full:LifetimeExpectedCreditLossesMemberbcs:OtherRetailMemberbcs:UpsideOneMemberifrs-full:FinancialAssetsAtAmortisedCostMemberifrs-full:ExpectedCreditLossesCollectivelyAssessedMemberifrs-full:FinancialInstrumentsNotCreditimpairedMember2023-12-310000312069ifrs-full:LifetimeExpectedCreditLossesMemberbcs:OtherRetailMemberbcs:BaselineMemberifrs-full:FinancialAssetsAtAmortisedCostMemberifrs-full:ExpectedCreditLossesCollectivelyAssessedMemberifrs-full:FinancialInstrumentsNotCreditimpairedMember2023-12-310000312069ifrs-full:LifetimeExpectedCreditLossesMemberbcs:OtherRetailMemberifrs-full:FinancialAssetsAtAmortisedCostMemberbcs:DownsideOneMemberifrs-full:ExpectedCreditLossesCollectivelyAssessedMemberifrs-full:FinancialInstrumentsNotCreditimpairedMember2023-12-310000312069ifrs-full:LifetimeExpectedCreditLossesMemberbcs:OtherRetailMemberbcs:DownsideTwoMemberifrs-full:FinancialAssetsAtAmortisedCostMemberifrs-full:ExpectedCreditLossesCollectivelyAssessedMemberifrs-full:FinancialInstrumentsNotCreditimpairedMember2023-12-310000312069ifrs-full:LifetimeExpectedCreditLossesMemberifrs-full:CorporateLoansMemberifrs-full:FinancialAssetsAtAmortisedCostMemberifrs-full:CreditRiskMemberifrs-full:ExpectedCreditLossesCollectivelyAssessedMemberifrs-full:FinancialInstrumentsNotCreditimpairedMember2023-12-310000312069ifrs-full:LifetimeExpectedCreditLossesMemberifrs-full:CorporateLoansMemberbcs:UpsideTwoMemberifrs-full:FinancialAssetsAtAmortisedCostMemberifrs-full:ExpectedCreditLossesCollectivelyAssessedMemberifrs-full:FinancialInstrumentsNotCreditimpairedMember2023-12-310000312069ifrs-full:LifetimeExpectedCreditLossesMemberifrs-full:CorporateLoansMemberbcs:UpsideOneMemberifrs-full:FinancialAssetsAtAmortisedCostMemberifrs-full:ExpectedCreditLossesCollectivelyAssessedMemberifrs-full:FinancialInstrumentsNotCreditimpairedMember2023-12-310000312069ifrs-full:LifetimeExpectedCreditLossesMemberifrs-full:CorporateLoansMemberbcs:BaselineMemberifrs-full:FinancialAssetsAtAmortisedCostMemberifrs-full:ExpectedCreditLossesCollectivelyAssessedMemberifrs-full:FinancialInstrumentsNotCreditimpairedMember2023-12-310000312069ifrs-full:LifetimeExpectedCreditLossesMemberifrs-full:CorporateLoansMemberifrs-full:FinancialAssetsAtAmortisedCostMemberbcs:DownsideOneMemberifrs-full:ExpectedCreditLossesCollectivelyAssessedMemberifrs-full:FinancialInstrumentsNotCreditimpairedMember2023-12-310000312069ifrs-full:LifetimeExpectedCreditLossesMemberifrs-full:CorporateLoansMemberbcs:DownsideTwoMemberifrs-full:FinancialAssetsAtAmortisedCostMemberifrs-full:ExpectedCreditLossesCollectivelyAssessedMemberifrs-full:FinancialInstrumentsNotCreditimpairedMember2023-12-310000312069ifrs-full:LifetimeExpectedCreditLossesMemberifrs-full:MortgagesMemberifrs-full:FinancialInstrumentsCreditimpairedMemberifrs-full:FinancialAssetsAtAmortisedCostMemberifrs-full:CreditRiskMemberifrs-full:ExpectedCreditLossesCollectivelyAssessedMemberifrs-full:GrossCarryingAmountMember2023-12-310000312069ifrs-full:LifetimeExpectedCreditLossesMemberbcs:UpsideTwoMemberifrs-full:MortgagesMemberifrs-full:FinancialInstrumentsCreditimpairedMemberifrs-full:FinancialAssetsAtAmortisedCostMemberifrs-full:ExpectedCreditLossesCollectivelyAssessedMemberifrs-full:GrossCarryingAmountMember2023-12-310000312069ifrs-full:LifetimeExpectedCreditLossesMemberifrs-full:MortgagesMemberifrs-full:FinancialInstrumentsCreditimpairedMemberbcs:UpsideOneMemberifrs-full:FinancialAssetsAtAmortisedCostMemberifrs-full:ExpectedCreditLossesCollectivelyAssessedMemberifrs-full:GrossCarryingAmountMember2023-12-310000312069ifrs-full:LifetimeExpectedCreditLossesMemberifrs-full:MortgagesMemberifrs-full:FinancialInstrumentsCreditimpairedMemberbcs:BaselineMemberifrs-full:FinancialAssetsAtAmortisedCostMemberifrs-full:ExpectedCreditLossesCollectivelyAssessedMemberifrs-full:GrossCarryingAmountMember2023-12-310000312069ifrs-full:LifetimeExpectedCreditLossesMemberifrs-full:MortgagesMemberifrs-full:FinancialInstrumentsCreditimpairedMemberifrs-full:FinancialAssetsAtAmortisedCostMemberbcs:DownsideOneMemberifrs-full:ExpectedCreditLossesCollectivelyAssessedMemberifrs-full:GrossCarryingAmountMember2023-12-310000312069ifrs-full:LifetimeExpectedCreditLossesMemberifrs-full:MortgagesMemberbcs:DownsideTwoMemberifrs-full:FinancialInstrumentsCreditimpairedMemberifrs-full:FinancialAssetsAtAmortisedCostMemberifrs-full:ExpectedCreditLossesCollectivelyAssessedMemberifrs-full:GrossCarryingAmountMember2023-12-310000312069bcs:CreditCardsRetailMemberifrs-full:LifetimeExpectedCreditLossesMemberifrs-full:FinancialInstrumentsCreditimpairedMemberifrs-full:FinancialAssetsAtAmortisedCostMemberifrs-full:CreditRiskMemberifrs-full:ExpectedCreditLossesCollectivelyAssessedMemberifrs-full:GrossCarryingAmountMember2023-12-310000312069bcs:CreditCardsRetailMemberifrs-full:LifetimeExpectedCreditLossesMemberbcs:UpsideTwoMemberifrs-full:FinancialInstrumentsCreditimpairedMemberifrs-full:FinancialAssetsAtAmortisedCostMemberifrs-full:ExpectedCreditLossesCollectivelyAssessedMemberifrs-full:GrossCarryingAmountMember2023-12-310000312069bcs:CreditCardsRetailMemberifrs-full:LifetimeExpectedCreditLossesMemberifrs-full:FinancialInstrumentsCreditimpairedMemberbcs:UpsideOneMemberifrs-full:FinancialAssetsAtAmortisedCostMemberifrs-full:ExpectedCreditLossesCollectivelyAssessedMemberifrs-full:GrossCarryingAmountMember2023-12-310000312069bcs:CreditCardsRetailMemberifrs-full:LifetimeExpectedCreditLossesMemberifrs-full:FinancialInstrumentsCreditimpairedMemberbcs:BaselineMemberifrs-full:FinancialAssetsAtAmortisedCostMemberifrs-full:ExpectedCreditLossesCollectivelyAssessedMemberifrs-full:GrossCarryingAmountMember2023-12-310000312069bcs:CreditCardsRetailMemberifrs-full:LifetimeExpectedCreditLossesMemberifrs-full:FinancialInstrumentsCreditimpairedMemberifrs-full:FinancialAssetsAtAmortisedCostMemberbcs:DownsideOneMemberifrs-full:ExpectedCreditLossesCollectivelyAssessedMemberifrs-full:GrossCarryingAmountMember2023-12-310000312069bcs:CreditCardsRetailMemberifrs-full:LifetimeExpectedCreditLossesMemberbcs:DownsideTwoMemberifrs-full:FinancialInstrumentsCreditimpairedMemberifrs-full:FinancialAssetsAtAmortisedCostMemberifrs-full:ExpectedCreditLossesCollectivelyAssessedMemberifrs-full:GrossCarryingAmountMember2023-12-310000312069ifrs-full:LifetimeExpectedCreditLossesMemberbcs:OtherRetailMemberifrs-full:FinancialInstrumentsCreditimpairedMemberifrs-full:FinancialAssetsAtAmortisedCostMemberifrs-full:CreditRiskMemberifrs-full:ExpectedCreditLossesCollectivelyAssessedMemberifrs-full:GrossCarryingAmountMember2023-12-310000312069ifrs-full:LifetimeExpectedCreditLossesMemberbcs:UpsideTwoMemberbcs:OtherRetailMemberifrs-full:FinancialInstrumentsCreditimpairedMemberifrs-full:FinancialAssetsAtAmortisedCostMemberifrs-full:ExpectedCreditLossesCollectivelyAssessedMemberifrs-full:GrossCarryingAmountMember2023-12-310000312069ifrs-full:LifetimeExpectedCreditLossesMemberbcs:OtherRetailMemberifrs-full:FinancialInstrumentsCreditimpairedMemberbcs:UpsideOneMemberifrs-full:FinancialAssetsAtAmortisedCostMemberifrs-full:ExpectedCreditLossesCollectivelyAssessedMemberifrs-full:GrossCarryingAmountMember2023-12-310000312069ifrs-full:LifetimeExpectedCreditLossesMemberbcs:OtherRetailMemberifrs-full:FinancialInstrumentsCreditimpairedMemberbcs:BaselineMemberifrs-full:FinancialAssetsAtAmortisedCostMemberifrs-full:ExpectedCreditLossesCollectivelyAssessedMemberifrs-full:GrossCarryingAmountMember2023-12-310000312069ifrs-full:LifetimeExpectedCreditLossesMemberbcs:OtherRetailMemberifrs-full:FinancialInstrumentsCreditimpairedMemberifrs-full:FinancialAssetsAtAmortisedCostMemberbcs:DownsideOneMemberifrs-full:ExpectedCreditLossesCollectivelyAssessedMemberifrs-full:GrossCarryingAmountMember2023-12-310000312069ifrs-full:LifetimeExpectedCreditLossesMemberbcs:OtherRetailMemberbcs:DownsideTwoMemberifrs-full:FinancialInstrumentsCreditimpairedMemberifrs-full:FinancialAssetsAtAmortisedCostMemberifrs-full:ExpectedCreditLossesCollectivelyAssessedMemberifrs-full:GrossCarryingAmountMember2023-12-310000312069ifrs-full:LifetimeExpectedCreditLossesMemberifrs-full:CorporateLoansMemberifrs-full:FinancialInstrumentsCreditimpairedMemberifrs-full:FinancialAssetsAtAmortisedCostMemberifrs-full:CreditRiskMemberifrs-full:ExpectedCreditLossesCollectivelyAssessedMemberifrs-full:GrossCarryingAmountMember2023-12-310000312069ifrs-full:LifetimeExpectedCreditLossesMemberifrs-full:CorporateLoansMemberbcs:UpsideTwoMemberifrs-full:FinancialInstrumentsCreditimpairedMemberifrs-full:FinancialAssetsAtAmortisedCostMemberifrs-full:ExpectedCreditLossesCollectivelyAssessedMemberifrs-full:GrossCarryingAmountMember2023-12-310000312069ifrs-full:LifetimeExpectedCreditLossesMemberifrs-full:CorporateLoansMemberifrs-full:FinancialInstrumentsCreditimpairedMemberbcs:UpsideOneMemberifrs-full:FinancialAssetsAtAmortisedCostMemberifrs-full:ExpectedCreditLossesCollectivelyAssessedMemberifrs-full:GrossCarryingAmountMember2023-12-310000312069ifrs-full:LifetimeExpectedCreditLossesMemberifrs-full:CorporateLoansMemberifrs-full:FinancialInstrumentsCreditimpairedMemberbcs:BaselineMemberifrs-full:FinancialAssetsAtAmortisedCostMemberifrs-full:ExpectedCreditLossesCollectivelyAssessedMemberifrs-full:GrossCarryingAmountMember2023-12-310000312069ifrs-full:LifetimeExpectedCreditLossesMemberifrs-full:CorporateLoansMemberifrs-full:FinancialInstrumentsCreditimpairedMemberifrs-full:FinancialAssetsAtAmortisedCostMemberbcs:DownsideOneMemberifrs-full:ExpectedCreditLossesCollectivelyAssessedMemberifrs-full:GrossCarryingAmountMember2023-12-310000312069ifrs-full:LifetimeExpectedCreditLossesMemberifrs-full:CorporateLoansMemberbcs:DownsideTwoMemberifrs-full:FinancialInstrumentsCreditimpairedMemberifrs-full:FinancialAssetsAtAmortisedCostMemberifrs-full:ExpectedCreditLossesCollectivelyAssessedMemberifrs-full:GrossCarryingAmountMember2023-12-310000312069ifrs-full:AccumulatedImpairmentMemberifrs-full:LifetimeExpectedCreditLossesMemberifrs-full:MortgagesMemberifrs-full:FinancialInstrumentsCreditimpairedMemberifrs-full:FinancialAssetsAtAmortisedCostMemberifrs-full:CreditRiskMemberifrs-full:ExpectedCreditLossesCollectivelyAssessedMember2023-12-310000312069ifrs-full:AccumulatedImpairmentMemberifrs-full:LifetimeExpectedCreditLossesMemberbcs:UpsideTwoMemberifrs-full:MortgagesMemberifrs-full:FinancialInstrumentsCreditimpairedMemberifrs-full:FinancialAssetsAtAmortisedCostMemberifrs-full:ExpectedCreditLossesCollectivelyAssessedMember2023-12-310000312069ifrs-full:AccumulatedImpairmentMemberifrs-full:LifetimeExpectedCreditLossesMemberifrs-full:MortgagesMemberifrs-full:FinancialInstrumentsCreditimpairedMemberbcs:UpsideOneMemberifrs-full:FinancialAssetsAtAmortisedCostMemberifrs-full:ExpectedCreditLossesCollectivelyAssessedMember2023-12-310000312069ifrs-full:AccumulatedImpairmentMemberifrs-full:LifetimeExpectedCreditLossesMemberifrs-full:MortgagesMemberifrs-full:FinancialInstrumentsCreditimpairedMemberbcs:BaselineMemberifrs-full:FinancialAssetsAtAmortisedCostMemberifrs-full:ExpectedCreditLossesCollectivelyAssessedMember2023-12-310000312069ifrs-full:AccumulatedImpairmentMemberifrs-full:LifetimeExpectedCreditLossesMemberifrs-full:MortgagesMemberifrs-full:FinancialInstrumentsCreditimpairedMemberifrs-full:FinancialAssetsAtAmortisedCostMemberbcs:DownsideOneMemberifrs-full:ExpectedCreditLossesCollectivelyAssessedMember2023-12-310000312069ifrs-full:AccumulatedImpairmentMemberifrs-full:LifetimeExpectedCreditLossesMemberifrs-full:MortgagesMemberbcs:DownsideTwoMemberifrs-full:FinancialInstrumentsCreditimpairedMemberifrs-full:FinancialAssetsAtAmortisedCostMemberifrs-full:ExpectedCreditLossesCollectivelyAssessedMember2023-12-310000312069bcs:CreditCardsRetailMemberifrs-full:AccumulatedImpairmentMemberifrs-full:LifetimeExpectedCreditLossesMemberifrs-full:FinancialInstrumentsCreditimpairedMemberifrs-full:FinancialAssetsAtAmortisedCostMemberifrs-full:CreditRiskMemberifrs-full:ExpectedCreditLossesCollectivelyAssessedMember2023-12-310000312069bcs:CreditCardsRetailMemberifrs-full:AccumulatedImpairmentMemberifrs-full:LifetimeExpectedCreditLossesMemberbcs:UpsideTwoMemberifrs-full:FinancialInstrumentsCreditimpairedMemberifrs-full:FinancialAssetsAtAmortisedCostMemberifrs-full:ExpectedCreditLossesCollectivelyAssessedMember2023-12-310000312069bcs:CreditCardsRetailMemberifrs-full:AccumulatedImpairmentMemberifrs-full:LifetimeExpectedCreditLossesMemberifrs-full:FinancialInstrumentsCreditimpairedMemberbcs:UpsideOneMemberifrs-full:FinancialAssetsAtAmortisedCostMemberifrs-full:ExpectedCreditLossesCollectivelyAssessedMember2023-12-310000312069bcs:CreditCardsRetailMemberifrs-full:AccumulatedImpairmentMemberifrs-full:LifetimeExpectedCreditLossesMemberifrs-full:FinancialInstrumentsCreditimpairedMemberbcs:BaselineMemberifrs-full:FinancialAssetsAtAmortisedCostMemberifrs-full:ExpectedCreditLossesCollectivelyAssessedMember2023-12-310000312069bcs:CreditCardsRetailMemberifrs-full:AccumulatedImpairmentMemberifrs-full:LifetimeExpectedCreditLossesMemberifrs-full:FinancialInstrumentsCreditimpairedMemberifrs-full:FinancialAssetsAtAmortisedCostMemberbcs:DownsideOneMemberifrs-full:ExpectedCreditLossesCollectivelyAssessedMember2023-12-310000312069bcs:CreditCardsRetailMemberifrs-full:AccumulatedImpairmentMemberifrs-full:LifetimeExpectedCreditLossesMemberbcs:DownsideTwoMemberifrs-full:FinancialInstrumentsCreditimpairedMemberifrs-full:FinancialAssetsAtAmortisedCostMemberifrs-full:ExpectedCreditLossesCollectivelyAssessedMember2023-12-310000312069ifrs-full:AccumulatedImpairmentMemberifrs-full:LifetimeExpectedCreditLossesMemberbcs:OtherRetailMemberifrs-full:FinancialInstrumentsCreditimpairedMemberifrs-full:FinancialAssetsAtAmortisedCostMemberifrs-full:CreditRiskMemberifrs-full:ExpectedCreditLossesCollectivelyAssessedMember2023-12-310000312069ifrs-full:AccumulatedImpairmentMemberifrs-full:LifetimeExpectedCreditLossesMemberbcs:UpsideTwoMemberbcs:OtherRetailMemberifrs-full:FinancialInstrumentsCreditimpairedMemberifrs-full:FinancialAssetsAtAmortisedCostMemberifrs-full:ExpectedCreditLossesCollectivelyAssessedMember2023-12-310000312069ifrs-full:AccumulatedImpairmentMemberifrs-full:LifetimeExpectedCreditLossesMemberbcs:OtherRetailMemberifrs-full:FinancialInstrumentsCreditimpairedMemberbcs:UpsideOneMemberifrs-full:FinancialAssetsAtAmortisedCostMemberifrs-full:ExpectedCreditLossesCollectivelyAssessedMember2023-12-310000312069ifrs-full:AccumulatedImpairmentMemberifrs-full:LifetimeExpectedCreditLossesMemberbcs:OtherRetailMemberifrs-full:FinancialInstrumentsCreditimpairedMemberbcs:BaselineMemberifrs-full:FinancialAssetsAtAmortisedCostMemberifrs-full:ExpectedCreditLossesCollectivelyAssessedMember2023-12-310000312069ifrs-full:AccumulatedImpairmentMemberifrs-full:LifetimeExpectedCreditLossesMemberbcs:OtherRetailMemberifrs-full:FinancialInstrumentsCreditimpairedMemberifrs-full:FinancialAssetsAtAmortisedCostMemberbcs:DownsideOneMemberifrs-full:ExpectedCreditLossesCollectivelyAssessedMember2023-12-310000312069ifrs-full:AccumulatedImpairmentMemberifrs-full:LifetimeExpectedCreditLossesMemberbcs:OtherRetailMemberbcs:DownsideTwoMemberifrs-full:FinancialInstrumentsCreditimpairedMemberifrs-full:FinancialAssetsAtAmortisedCostMemberifrs-full:ExpectedCreditLossesCollectivelyAssessedMember2023-12-310000312069ifrs-full:AccumulatedImpairmentMemberifrs-full:LifetimeExpectedCreditLossesMemberifrs-full:CorporateLoansMemberifrs-full:FinancialInstrumentsCreditimpairedMemberifrs-full:FinancialAssetsAtAmortisedCostMemberifrs-full:CreditRiskMemberifrs-full:ExpectedCreditLossesCollectivelyAssessedMember2023-12-310000312069ifrs-full:AccumulatedImpairmentMemberifrs-full:LifetimeExpectedCreditLossesMemberifrs-full:CorporateLoansMemberbcs:UpsideTwoMemberifrs-full:FinancialInstrumentsCreditimpairedMemberifrs-full:FinancialAssetsAtAmortisedCostMemberifrs-full:ExpectedCreditLossesCollectivelyAssessedMember2023-12-310000312069ifrs-full:AccumulatedImpairmentMemberifrs-full:LifetimeExpectedCreditLossesMemberifrs-full:CorporateLoansMemberifrs-full:FinancialInstrumentsCreditimpairedMemberbcs:UpsideOneMemberifrs-full:FinancialAssetsAtAmortisedCostMemberifrs-full:ExpectedCreditLossesCollectivelyAssessedMember2023-12-310000312069ifrs-full:AccumulatedImpairmentMemberifrs-full:LifetimeExpectedCreditLossesMemberifrs-full:CorporateLoansMemberifrs-full:FinancialInstrumentsCreditimpairedMemberbcs:BaselineMemberifrs-full:FinancialAssetsAtAmortisedCostMemberifrs-full:ExpectedCreditLossesCollectivelyAssessedMember2023-12-310000312069ifrs-full:AccumulatedImpairmentMemberifrs-full:LifetimeExpectedCreditLossesMemberifrs-full:CorporateLoansMemberifrs-full:FinancialInstrumentsCreditimpairedMemberifrs-full:FinancialAssetsAtAmortisedCostMemberbcs:DownsideOneMemberifrs-full:ExpectedCreditLossesCollectivelyAssessedMember2023-12-310000312069ifrs-full:AccumulatedImpairmentMemberifrs-full:LifetimeExpectedCreditLossesMemberifrs-full:CorporateLoansMemberbcs:DownsideTwoMemberifrs-full:FinancialInstrumentsCreditimpairedMemberifrs-full:FinancialAssetsAtAmortisedCostMemberifrs-full:ExpectedCreditLossesCollectivelyAssessedMember2023-12-310000312069ifrs-full:LifetimeExpectedCreditLossesMemberifrs-full:MortgagesMemberifrs-full:FinancialInstrumentsCreditimpairedMemberifrs-full:FinancialAssetsAtAmortisedCostMemberifrs-full:CreditRiskMemberifrs-full:ExpectedCreditLossesCollectivelyAssessedMember2023-12-310000312069ifrs-full:LifetimeExpectedCreditLossesMemberbcs:UpsideTwoMemberifrs-full:MortgagesMemberifrs-full:FinancialInstrumentsCreditimpairedMemberifrs-full:FinancialAssetsAtAmortisedCostMemberifrs-full:ExpectedCreditLossesCollectivelyAssessedMember2023-12-310000312069ifrs-full:LifetimeExpectedCreditLossesMemberifrs-full:MortgagesMemberifrs-full:FinancialInstrumentsCreditimpairedMemberbcs:UpsideOneMemberifrs-full:FinancialAssetsAtAmortisedCostMemberifrs-full:ExpectedCreditLossesCollectivelyAssessedMember2023-12-310000312069ifrs-full:LifetimeExpectedCreditLossesMemberifrs-full:MortgagesMemberifrs-full:FinancialInstrumentsCreditimpairedMemberbcs:BaselineMemberifrs-full:FinancialAssetsAtAmortisedCostMemberifrs-full:ExpectedCreditLossesCollectivelyAssessedMember2023-12-310000312069ifrs-full:LifetimeExpectedCreditLossesMemberifrs-full:MortgagesMemberifrs-full:FinancialInstrumentsCreditimpairedMemberifrs-full:FinancialAssetsAtAmortisedCostMemberbcs:DownsideOneMemberifrs-full:ExpectedCreditLossesCollectivelyAssessedMember2023-12-310000312069ifrs-full:LifetimeExpectedCreditLossesMemberifrs-full:MortgagesMemberbcs:DownsideTwoMemberifrs-full:FinancialInstrumentsCreditimpairedMemberifrs-full:FinancialAssetsAtAmortisedCostMemberifrs-full:ExpectedCreditLossesCollectivelyAssessedMember2023-12-310000312069bcs:CreditCardsRetailMemberifrs-full:LifetimeExpectedCreditLossesMemberifrs-full:FinancialInstrumentsCreditimpairedMemberifrs-full:FinancialAssetsAtAmortisedCostMemberifrs-full:CreditRiskMemberifrs-full:ExpectedCreditLossesCollectivelyAssessedMember2023-12-310000312069bcs:CreditCardsRetailMemberifrs-full:LifetimeExpectedCreditLossesMemberbcs:UpsideTwoMemberifrs-full:FinancialInstrumentsCreditimpairedMemberifrs-full:FinancialAssetsAtAmortisedCostMemberifrs-full:ExpectedCreditLossesCollectivelyAssessedMember2023-12-310000312069bcs:CreditCardsRetailMemberifrs-full:LifetimeExpectedCreditLossesMemberifrs-full:FinancialInstrumentsCreditimpairedMemberbcs:UpsideOneMemberifrs-full:FinancialAssetsAtAmortisedCostMemberifrs-full:ExpectedCreditLossesCollectivelyAssessedMember2023-12-310000312069bcs:CreditCardsRetailMemberifrs-full:LifetimeExpectedCreditLossesMemberifrs-full:FinancialInstrumentsCreditimpairedMemberbcs:BaselineMemberifrs-full:FinancialAssetsAtAmortisedCostMemberifrs-full:ExpectedCreditLossesCollectivelyAssessedMember2023-12-310000312069bcs:CreditCardsRetailMemberifrs-full:LifetimeExpectedCreditLossesMemberifrs-full:FinancialInstrumentsCreditimpairedMemberifrs-full:FinancialAssetsAtAmortisedCostMemberbcs:DownsideOneMemberifrs-full:ExpectedCreditLossesCollectivelyAssessedMember2023-12-310000312069bcs:CreditCardsRetailMemberifrs-full:LifetimeExpectedCreditLossesMemberbcs:DownsideTwoMemberifrs-full:FinancialInstrumentsCreditimpairedMemberifrs-full:FinancialAssetsAtAmortisedCostMemberifrs-full:ExpectedCreditLossesCollectivelyAssessedMember2023-12-310000312069ifrs-full:LifetimeExpectedCreditLossesMemberbcs:OtherRetailMemberifrs-full:FinancialInstrumentsCreditimpairedMemberifrs-full:FinancialAssetsAtAmortisedCostMemberifrs-full:CreditRiskMemberifrs-full:ExpectedCreditLossesCollectivelyAssessedMember2023-12-310000312069ifrs-full:LifetimeExpectedCreditLossesMemberbcs:UpsideTwoMemberbcs:OtherRetailMemberifrs-full:FinancialInstrumentsCreditimpairedMemberifrs-full:FinancialAssetsAtAmortisedCostMemberifrs-full:ExpectedCreditLossesCollectivelyAssessedMember2023-12-310000312069ifrs-full:LifetimeExpectedCreditLossesMemberbcs:OtherRetailMemberifrs-full:FinancialInstrumentsCreditimpairedMemberbcs:UpsideOneMemberifrs-full:FinancialAssetsAtAmortisedCostMemberifrs-full:ExpectedCreditLossesCollectivelyAssessedMember2023-12-310000312069ifrs-full:LifetimeExpectedCreditLossesMemberbcs:OtherRetailMemberifrs-full:FinancialInstrumentsCreditimpairedMemberbcs:BaselineMemberifrs-full:FinancialAssetsAtAmortisedCostMemberifrs-full:ExpectedCreditLossesCollectivelyAssessedMember2023-12-310000312069ifrs-full:LifetimeExpectedCreditLossesMemberbcs:OtherRetailMemberifrs-full:FinancialInstrumentsCreditimpairedMemberifrs-full:FinancialAssetsAtAmortisedCostMemberbcs:DownsideOneMemberifrs-full:ExpectedCreditLossesCollectivelyAssessedMember2023-12-310000312069ifrs-full:LifetimeExpectedCreditLossesMemberbcs:OtherRetailMemberbcs:DownsideTwoMemberifrs-full:FinancialInstrumentsCreditimpairedMemberifrs-full:FinancialAssetsAtAmortisedCostMemberifrs-full:ExpectedCreditLossesCollectivelyAssessedMember2023-12-310000312069ifrs-full:LifetimeExpectedCreditLossesMemberifrs-full:CorporateLoansMemberifrs-full:FinancialInstrumentsCreditimpairedMemberifrs-full:FinancialAssetsAtAmortisedCostMemberifrs-full:CreditRiskMemberifrs-full:ExpectedCreditLossesCollectivelyAssessedMember2023-12-310000312069ifrs-full:LifetimeExpectedCreditLossesMemberifrs-full:CorporateLoansMemberbcs:UpsideTwoMemberifrs-full:FinancialInstrumentsCreditimpairedMemberifrs-full:FinancialAssetsAtAmortisedCostMemberifrs-full:ExpectedCreditLossesCollectivelyAssessedMember2023-12-310000312069ifrs-full:LifetimeExpectedCreditLossesMemberifrs-full:CorporateLoansMemberifrs-full:FinancialInstrumentsCreditimpairedMemberbcs:UpsideOneMemberifrs-full:FinancialAssetsAtAmortisedCostMemberifrs-full:ExpectedCreditLossesCollectivelyAssessedMember2023-12-310000312069ifrs-full:LifetimeExpectedCreditLossesMemberifrs-full:CorporateLoansMemberifrs-full:FinancialInstrumentsCreditimpairedMemberbcs:BaselineMemberifrs-full:FinancialAssetsAtAmortisedCostMemberifrs-full:ExpectedCreditLossesCollectivelyAssessedMember2023-12-310000312069ifrs-full:LifetimeExpectedCreditLossesMemberifrs-full:CorporateLoansMemberifrs-full:FinancialInstrumentsCreditimpairedMemberifrs-full:FinancialAssetsAtAmortisedCostMemberbcs:DownsideOneMemberifrs-full:ExpectedCreditLossesCollectivelyAssessedMember2023-12-310000312069ifrs-full:LifetimeExpectedCreditLossesMemberifrs-full:CorporateLoansMemberbcs:DownsideTwoMemberifrs-full:FinancialInstrumentsCreditimpairedMemberifrs-full:FinancialAssetsAtAmortisedCostMemberifrs-full:ExpectedCreditLossesCollectivelyAssessedMember2023-12-310000312069ifrs-full:AccumulatedImpairmentMemberifrs-full:MortgagesMemberifrs-full:FinancialAssetsAtAmortisedCostMemberifrs-full:CreditRiskMemberifrs-full:ExpectedCreditLossesCollectivelyAssessedMember2023-12-310000312069ifrs-full:AccumulatedImpairmentMemberbcs:UpsideTwoMemberifrs-full:MortgagesMemberifrs-full:FinancialAssetsAtAmortisedCostMemberifrs-full:ExpectedCreditLossesCollectivelyAssessedMember2023-12-310000312069ifrs-full:AccumulatedImpairmentMemberifrs-full:MortgagesMemberbcs:UpsideOneMemberifrs-full:FinancialAssetsAtAmortisedCostMemberifrs-full:ExpectedCreditLossesCollectivelyAssessedMember2023-12-310000312069ifrs-full:AccumulatedImpairmentMemberifrs-full:MortgagesMemberbcs:BaselineMemberifrs-full:FinancialAssetsAtAmortisedCostMemberifrs-full:ExpectedCreditLossesCollectivelyAssessedMember2023-12-310000312069ifrs-full:AccumulatedImpairmentMemberifrs-full:MortgagesMemberifrs-full:FinancialAssetsAtAmortisedCostMemberbcs:DownsideOneMemberifrs-full:ExpectedCreditLossesCollectivelyAssessedMember2023-12-310000312069ifrs-full:AccumulatedImpairmentMemberifrs-full:MortgagesMemberbcs:DownsideTwoMemberifrs-full:FinancialAssetsAtAmortisedCostMemberifrs-full:ExpectedCreditLossesCollectivelyAssessedMember2023-12-310000312069bcs:CreditCardsRetailMemberifrs-full:AccumulatedImpairmentMemberifrs-full:FinancialAssetsAtAmortisedCostMemberifrs-full:CreditRiskMemberifrs-full:ExpectedCreditLossesCollectivelyAssessedMember2023-12-310000312069bcs:CreditCardsRetailMemberifrs-full:AccumulatedImpairmentMemberbcs:UpsideTwoMemberifrs-full:FinancialAssetsAtAmortisedCostMemberifrs-full:ExpectedCreditLossesCollectivelyAssessedMember2023-12-310000312069bcs:CreditCardsRetailMemberifrs-full:AccumulatedImpairmentMemberbcs:UpsideOneMemberifrs-full:FinancialAssetsAtAmortisedCostMemberifrs-full:ExpectedCreditLossesCollectivelyAssessedMember2023-12-310000312069bcs:CreditCardsRetailMemberifrs-full:AccumulatedImpairmentMemberbcs:BaselineMemberifrs-full:FinancialAssetsAtAmortisedCostMemberifrs-full:ExpectedCreditLossesCollectivelyAssessedMember2023-12-310000312069bcs:CreditCardsRetailMemberifrs-full:AccumulatedImpairmentMemberifrs-full:FinancialAssetsAtAmortisedCostMemberbcs:DownsideOneMemberifrs-full:ExpectedCreditLossesCollectivelyAssessedMember2023-12-310000312069bcs:CreditCardsRetailMemberifrs-full:AccumulatedImpairmentMemberbcs:DownsideTwoMemberifrs-full:FinancialAssetsAtAmortisedCostMemberifrs-full:ExpectedCreditLossesCollectivelyAssessedMember2023-12-310000312069ifrs-full:AccumulatedImpairmentMemberbcs:OtherRetailMemberifrs-full:FinancialAssetsAtAmortisedCostMemberifrs-full:CreditRiskMemberifrs-full:ExpectedCreditLossesCollectivelyAssessedMember2023-12-310000312069ifrs-full:AccumulatedImpairmentMemberbcs:UpsideTwoMemberbcs:OtherRetailMemberifrs-full:FinancialAssetsAtAmortisedCostMemberifrs-full:ExpectedCreditLossesCollectivelyAssessedMember2023-12-310000312069ifrs-full:AccumulatedImpairmentMemberbcs:OtherRetailMemberbcs:UpsideOneMemberifrs-full:FinancialAssetsAtAmortisedCostMemberifrs-full:ExpectedCreditLossesCollectivelyAssessedMember2023-12-310000312069ifrs-full:AccumulatedImpairmentMemberbcs:OtherRetailMemberbcs:BaselineMemberifrs-full:FinancialAssetsAtAmortisedCostMemberifrs-full:ExpectedCreditLossesCollectivelyAssessedMember2023-12-310000312069ifrs-full:AccumulatedImpairmentMemberbcs:OtherRetailMemberifrs-full:FinancialAssetsAtAmortisedCostMemberbcs:DownsideOneMemberifrs-full:ExpectedCreditLossesCollectivelyAssessedMember2023-12-310000312069ifrs-full:AccumulatedImpairmentMemberbcs:OtherRetailMemberbcs:DownsideTwoMemberifrs-full:FinancialAssetsAtAmortisedCostMemberifrs-full:ExpectedCreditLossesCollectivelyAssessedMember2023-12-310000312069ifrs-full:AccumulatedImpairmentMemberifrs-full:CorporateLoansMemberifrs-full:FinancialAssetsAtAmortisedCostMemberifrs-full:CreditRiskMemberifrs-full:ExpectedCreditLossesCollectivelyAssessedMember2023-12-310000312069ifrs-full:AccumulatedImpairmentMemberifrs-full:CorporateLoansMemberbcs:UpsideTwoMemberifrs-full:FinancialAssetsAtAmortisedCostMemberifrs-full:ExpectedCreditLossesCollectivelyAssessedMember2023-12-310000312069ifrs-full:AccumulatedImpairmentMemberifrs-full:CorporateLoansMemberbcs:UpsideOneMemberifrs-full:FinancialAssetsAtAmortisedCostMemberifrs-full:ExpectedCreditLossesCollectivelyAssessedMember2023-12-310000312069ifrs-full:AccumulatedImpairmentMemberifrs-full:CorporateLoansMemberbcs:BaselineMemberifrs-full:FinancialAssetsAtAmortisedCostMemberifrs-full:ExpectedCreditLossesCollectivelyAssessedMember2023-12-310000312069ifrs-full:AccumulatedImpairmentMemberifrs-full:CorporateLoansMemberifrs-full:FinancialAssetsAtAmortisedCostMemberbcs:DownsideOneMemberifrs-full:ExpectedCreditLossesCollectivelyAssessedMember2023-12-310000312069ifrs-full:AccumulatedImpairmentMemberifrs-full:CorporateLoansMemberbcs:DownsideTwoMemberifrs-full:FinancialAssetsAtAmortisedCostMemberifrs-full:ExpectedCreditLossesCollectivelyAssessedMember2023-12-310000312069ifrs-full:AccumulatedImpairmentMemberifrs-full:FinancialAssetsAtAmortisedCostMemberifrs-full:CreditRiskMemberifrs-full:ExpectedCreditLossesCollectivelyAssessedMemberifrs-full:LoansAndReceivablesCategoryMember2023-12-310000312069ifrs-full:AccumulatedImpairmentMemberbcs:UpsideTwoMemberifrs-full:FinancialAssetsAtAmortisedCostMemberifrs-full:ExpectedCreditLossesCollectivelyAssessedMemberifrs-full:LoansAndReceivablesCategoryMember2023-12-310000312069ifrs-full:AccumulatedImpairmentMemberbcs:UpsideOneMemberifrs-full:FinancialAssetsAtAmortisedCostMemberifrs-full:ExpectedCreditLossesCollectivelyAssessedMemberifrs-full:LoansAndReceivablesCategoryMember2023-12-310000312069ifrs-full:AccumulatedImpairmentMemberbcs:BaselineMemberifrs-full:FinancialAssetsAtAmortisedCostMemberifrs-full:ExpectedCreditLossesCollectivelyAssessedMemberifrs-full:LoansAndReceivablesCategoryMember2023-12-310000312069ifrs-full:AccumulatedImpairmentMemberifrs-full:FinancialAssetsAtAmortisedCostMemberbcs:DownsideOneMemberifrs-full:ExpectedCreditLossesCollectivelyAssessedMemberifrs-full:LoansAndReceivablesCategoryMember2023-12-310000312069ifrs-full:AccumulatedImpairmentMemberbcs:DownsideTwoMemberifrs-full:FinancialAssetsAtAmortisedCostMemberifrs-full:ExpectedCreditLossesCollectivelyAssessedMemberifrs-full:LoansAndReceivablesCategoryMember2023-12-310000312069ifrs-full:AccumulatedImpairmentMemberifrs-full:ExpectedCreditLossesCollectivelyAssessedMember2023-12-310000312069ifrs-full:AccumulatedImpairmentMemberifrs-full:ExpectedCreditLossesIndividuallyAssessedMember2023-12-310000312069ifrs-full:AccumulatedImpairmentMemberbcs:ECLFromNonModelledExposuresAndOthersMember2023-12-310000312069ifrs-full:AccumulatedImpairmentMemberbcs:ECLFromDebtSecuritiesAtAmortisedCostMember2023-12-310000312069ifrs-full:AccumulatedImpairmentMemberbcs:ECLFromPostModelManagementAdjustmentsMember2023-12-310000312069ifrs-full:AccumulatedImpairmentMemberbcs:ECLFromPostModelManagementAdjustmentsEconomicUncertaintyAdjustmentsMember2023-12-310000312069ifrs-full:AccumulatedImpairmentMember2023-12-310000312069ifrs-full:AccumulatedImpairmentMemberbcs:BaselineMember2023-01-012023-12-310000312069ifrs-full:MortgagesMemberbcs:BaselineMember2023-01-012023-12-310000312069ifrs-full:CorporateLoansMemberbcs:BaselineMember2023-01-012023-12-310000312069ifrs-full:MortgagesMemberifrs-full:FinancialAssetsAtAmortisedCostMemberifrs-full:CreditRiskMemberifrs-full:ExpectedCreditLossesCollectivelyAssessedMemberifrs-full:GrossCarryingAmountMemberifrs-full:TwelvemonthExpectedCreditLossesMember2022-12-310000312069bcs:UpsideTwoMemberifrs-full:MortgagesMemberifrs-full:FinancialAssetsAtAmortisedCostMemberifrs-full:ExpectedCreditLossesCollectivelyAssessedMemberifrs-full:GrossCarryingAmountMemberifrs-full:TwelvemonthExpectedCreditLossesMember2022-12-310000312069ifrs-full:MortgagesMemberbcs:UpsideOneMemberifrs-full:FinancialAssetsAtAmortisedCostMemberifrs-full:ExpectedCreditLossesCollectivelyAssessedMemberifrs-full:GrossCarryingAmountMemberifrs-full:TwelvemonthExpectedCreditLossesMember2022-12-310000312069ifrs-full:MortgagesMemberbcs:BaselineMemberifrs-full:FinancialAssetsAtAmortisedCostMemberifrs-full:ExpectedCreditLossesCollectivelyAssessedMemberifrs-full:GrossCarryingAmountMemberifrs-full:TwelvemonthExpectedCreditLossesMember2022-12-310000312069ifrs-full:MortgagesMemberifrs-full:FinancialAssetsAtAmortisedCostMemberbcs:DownsideOneMemberifrs-full:ExpectedCreditLossesCollectivelyAssessedMemberifrs-full:GrossCarryingAmountMemberifrs-full:TwelvemonthExpectedCreditLossesMember2022-12-310000312069ifrs-full:MortgagesMemberbcs:DownsideTwoMemberifrs-full:FinancialAssetsAtAmortisedCostMemberifrs-full:ExpectedCreditLossesCollectivelyAssessedMemberifrs-full:GrossCarryingAmountMemberifrs-full:TwelvemonthExpectedCreditLossesMember2022-12-310000312069bcs:CreditCardsRetailMemberifrs-full:FinancialAssetsAtAmortisedCostMemberifrs-full:CreditRiskMemberifrs-full:ExpectedCreditLossesCollectivelyAssessedMemberifrs-full:GrossCarryingAmountMemberifrs-full:TwelvemonthExpectedCreditLossesMember2022-12-310000312069bcs:CreditCardsRetailMemberbcs:UpsideTwoMemberifrs-full:FinancialAssetsAtAmortisedCostMemberifrs-full:ExpectedCreditLossesCollectivelyAssessedMemberifrs-full:GrossCarryingAmountMemberifrs-full:TwelvemonthExpectedCreditLossesMember2022-12-310000312069bcs:CreditCardsRetailMemberbcs:UpsideOneMemberifrs-full:FinancialAssetsAtAmortisedCostMemberifrs-full:ExpectedCreditLossesCollectivelyAssessedMemberifrs-full:GrossCarryingAmountMemberifrs-full:TwelvemonthExpectedCreditLossesMember2022-12-310000312069bcs:CreditCardsRetailMemberbcs:BaselineMemberifrs-full:FinancialAssetsAtAmortisedCostMemberifrs-full:ExpectedCreditLossesCollectivelyAssessedMemberifrs-full:GrossCarryingAmountMemberifrs-full:TwelvemonthExpectedCreditLossesMember2022-12-310000312069bcs:CreditCardsRetailMemberifrs-full:FinancialAssetsAtAmortisedCostMemberbcs:DownsideOneMemberifrs-full:ExpectedCreditLossesCollectivelyAssessedMemberifrs-full:GrossCarryingAmountMemberifrs-full:TwelvemonthExpectedCreditLossesMember2022-12-310000312069bcs:CreditCardsRetailMemberbcs:DownsideTwoMemberifrs-full:FinancialAssetsAtAmortisedCostMemberifrs-full:ExpectedCreditLossesCollectivelyAssessedMemberifrs-full:GrossCarryingAmountMemberifrs-full:TwelvemonthExpectedCreditLossesMember2022-12-310000312069bcs:OtherRetailMemberifrs-full:FinancialAssetsAtAmortisedCostMemberifrs-full:CreditRiskMemberifrs-full:ExpectedCreditLossesCollectivelyAssessedMemberifrs-full:GrossCarryingAmountMemberifrs-full:TwelvemonthExpectedCreditLossesMember2022-12-310000312069bcs:UpsideTwoMemberbcs:OtherRetailMemberifrs-full:FinancialAssetsAtAmortisedCostMemberifrs-full:ExpectedCreditLossesCollectivelyAssessedMemberifrs-full:GrossCarryingAmountMemberifrs-full:TwelvemonthExpectedCreditLossesMember2022-12-310000312069bcs:OtherRetailMemberbcs:UpsideOneMemberifrs-full:FinancialAssetsAtAmortisedCostMemberifrs-full:ExpectedCreditLossesCollectivelyAssessedMemberifrs-full:GrossCarryingAmountMemberifrs-full:TwelvemonthExpectedCreditLossesMember2022-12-310000312069bcs:OtherRetailMemberbcs:BaselineMemberifrs-full:FinancialAssetsAtAmortisedCostMemberifrs-full:ExpectedCreditLossesCollectivelyAssessedMemberifrs-full:GrossCarryingAmountMemberifrs-full:TwelvemonthExpectedCreditLossesMember2022-12-310000312069bcs:OtherRetailMemberifrs-full:FinancialAssetsAtAmortisedCostMemberbcs:DownsideOneMemberifrs-full:ExpectedCreditLossesCollectivelyAssessedMemberifrs-full:GrossCarryingAmountMemberifrs-full:TwelvemonthExpectedCreditLossesMember2022-12-310000312069bcs:OtherRetailMemberbcs:DownsideTwoMemberifrs-full:FinancialAssetsAtAmortisedCostMemberifrs-full:ExpectedCreditLossesCollectivelyAssessedMemberifrs-full:GrossCarryingAmountMemberifrs-full:TwelvemonthExpectedCreditLossesMember2022-12-310000312069ifrs-full:CorporateLoansMemberifrs-full:FinancialAssetsAtAmortisedCostMemberifrs-full:CreditRiskMemberifrs-full:ExpectedCreditLossesCollectivelyAssessedMemberifrs-full:GrossCarryingAmountMemberifrs-full:TwelvemonthExpectedCreditLossesMember2022-12-310000312069ifrs-full:CorporateLoansMemberbcs:UpsideTwoMemberifrs-full:FinancialAssetsAtAmortisedCostMemberifrs-full:ExpectedCreditLossesCollectivelyAssessedMemberifrs-full:GrossCarryingAmountMemberifrs-full:TwelvemonthExpectedCreditLossesMember2022-12-310000312069ifrs-full:CorporateLoansMemberbcs:UpsideOneMemberifrs-full:FinancialAssetsAtAmortisedCostMemberifrs-full:ExpectedCreditLossesCollectivelyAssessedMemberifrs-full:GrossCarryingAmountMemberifrs-full:TwelvemonthExpectedCreditLossesMember2022-12-310000312069ifrs-full:CorporateLoansMemberbcs:BaselineMemberifrs-full:FinancialAssetsAtAmortisedCostMemberifrs-full:ExpectedCreditLossesCollectivelyAssessedMemberifrs-full:GrossCarryingAmountMemberifrs-full:TwelvemonthExpectedCreditLossesMember2022-12-310000312069ifrs-full:CorporateLoansMemberifrs-full:FinancialAssetsAtAmortisedCostMemberbcs:DownsideOneMemberifrs-full:ExpectedCreditLossesCollectivelyAssessedMemberifrs-full:GrossCarryingAmountMemberifrs-full:TwelvemonthExpectedCreditLossesMember2022-12-310000312069ifrs-full:CorporateLoansMemberbcs:DownsideTwoMemberifrs-full:FinancialAssetsAtAmortisedCostMemberifrs-full:ExpectedCreditLossesCollectivelyAssessedMemberifrs-full:GrossCarryingAmountMemberifrs-full:TwelvemonthExpectedCreditLossesMember2022-12-310000312069ifrs-full:AccumulatedImpairmentMemberifrs-full:MortgagesMemberifrs-full:FinancialAssetsAtAmortisedCostMemberifrs-full:CreditRiskMemberifrs-full:ExpectedCreditLossesCollectivelyAssessedMemberifrs-full:TwelvemonthExpectedCreditLossesMember2022-12-310000312069ifrs-full:AccumulatedImpairmentMemberbcs:UpsideTwoMemberifrs-full:MortgagesMemberifrs-full:FinancialAssetsAtAmortisedCostMemberifrs-full:ExpectedCreditLossesCollectivelyAssessedMemberifrs-full:TwelvemonthExpectedCreditLossesMember2022-12-310000312069ifrs-full:AccumulatedImpairmentMemberifrs-full:MortgagesMemberbcs:UpsideOneMemberifrs-full:FinancialAssetsAtAmortisedCostMemberifrs-full:ExpectedCreditLossesCollectivelyAssessedMemberifrs-full:TwelvemonthExpectedCreditLossesMember2022-12-310000312069ifrs-full:AccumulatedImpairmentMemberifrs-full:MortgagesMemberbcs:BaselineMemberifrs-full:FinancialAssetsAtAmortisedCostMemberifrs-full:ExpectedCreditLossesCollectivelyAssessedMemberifrs-full:TwelvemonthExpectedCreditLossesMember2022-12-310000312069ifrs-full:AccumulatedImpairmentMemberifrs-full:MortgagesMemberifrs-full:FinancialAssetsAtAmortisedCostMemberbcs:DownsideOneMemberifrs-full:ExpectedCreditLossesCollectivelyAssessedMemberifrs-full:TwelvemonthExpectedCreditLossesMember2022-12-310000312069ifrs-full:AccumulatedImpairmentMemberifrs-full:MortgagesMemberbcs:DownsideTwoMemberifrs-full:FinancialAssetsAtAmortisedCostMemberifrs-full:ExpectedCreditLossesCollectivelyAssessedMemberifrs-full:TwelvemonthExpectedCreditLossesMember2022-12-310000312069bcs:CreditCardsRetailMemberifrs-full:AccumulatedImpairmentMemberifrs-full:FinancialAssetsAtAmortisedCostMemberifrs-full:CreditRiskMemberifrs-full:ExpectedCreditLossesCollectivelyAssessedMemberifrs-full:TwelvemonthExpectedCreditLossesMember2022-12-310000312069bcs:CreditCardsRetailMemberifrs-full:AccumulatedImpairmentMemberbcs:UpsideTwoMemberifrs-full:FinancialAssetsAtAmortisedCostMemberifrs-full:ExpectedCreditLossesCollectivelyAssessedMemberifrs-full:TwelvemonthExpectedCreditLossesMember2022-12-310000312069bcs:CreditCardsRetailMemberifrs-full:AccumulatedImpairmentMemberbcs:UpsideOneMemberifrs-full:FinancialAssetsAtAmortisedCostMemberifrs-full:ExpectedCreditLossesCollectivelyAssessedMemberifrs-full:TwelvemonthExpectedCreditLossesMember2022-12-310000312069bcs:CreditCardsRetailMemberifrs-full:AccumulatedImpairmentMemberbcs:BaselineMemberifrs-full:FinancialAssetsAtAmortisedCostMemberifrs-full:ExpectedCreditLossesCollectivelyAssessedMemberifrs-full:TwelvemonthExpectedCreditLossesMember2022-12-310000312069bcs:CreditCardsRetailMemberifrs-full:AccumulatedImpairmentMemberifrs-full:FinancialAssetsAtAmortisedCostMemberbcs:DownsideOneMemberifrs-full:ExpectedCreditLossesCollectivelyAssessedMemberifrs-full:TwelvemonthExpectedCreditLossesMember2022-12-310000312069bcs:CreditCardsRetailMemberifrs-full:AccumulatedImpairmentMemberbcs:DownsideTwoMemberifrs-full:FinancialAssetsAtAmortisedCostMemberifrs-full:ExpectedCreditLossesCollectivelyAssessedMemberifrs-full:TwelvemonthExpectedCreditLossesMember2022-12-310000312069ifrs-full:AccumulatedImpairmentMemberbcs:OtherRetailMemberifrs-full:FinancialAssetsAtAmortisedCostMemberifrs-full:CreditRiskMemberifrs-full:ExpectedCreditLossesCollectivelyAssessedMemberifrs-full:TwelvemonthExpectedCreditLossesMember2022-12-310000312069ifrs-full:AccumulatedImpairmentMemberbcs:UpsideTwoMemberbcs:OtherRetailMemberifrs-full:FinancialAssetsAtAmortisedCostMemberifrs-full:ExpectedCreditLossesCollectivelyAssessedMemberifrs-full:TwelvemonthExpectedCreditLossesMember2022-12-310000312069ifrs-full:AccumulatedImpairmentMemberbcs:OtherRetailMemberbcs:UpsideOneMemberifrs-full:FinancialAssetsAtAmortisedCostMemberifrs-full:ExpectedCreditLossesCollectivelyAssessedMemberifrs-full:TwelvemonthExpectedCreditLossesMember2022-12-310000312069ifrs-full:AccumulatedImpairmentMemberbcs:OtherRetailMemberbcs:BaselineMemberifrs-full:FinancialAssetsAtAmortisedCostMemberifrs-full:ExpectedCreditLossesCollectivelyAssessedMemberifrs-full:TwelvemonthExpectedCreditLossesMember2022-12-310000312069ifrs-full:AccumulatedImpairmentMemberbcs:OtherRetailMemberifrs-full:FinancialAssetsAtAmortisedCostMemberbcs:DownsideOneMemberifrs-full:ExpectedCreditLossesCollectivelyAssessedMemberifrs-full:TwelvemonthExpectedCreditLossesMember2022-12-310000312069ifrs-full:AccumulatedImpairmentMemberbcs:OtherRetailMemberbcs:DownsideTwoMemberifrs-full:FinancialAssetsAtAmortisedCostMemberifrs-full:ExpectedCreditLossesCollectivelyAssessedMemberifrs-full:TwelvemonthExpectedCreditLossesMember2022-12-310000312069ifrs-full:AccumulatedImpairmentMemberifrs-full:CorporateLoansMemberifrs-full:FinancialAssetsAtAmortisedCostMemberifrs-full:CreditRiskMemberifrs-full:ExpectedCreditLossesCollectivelyAssessedMemberifrs-full:TwelvemonthExpectedCreditLossesMember2022-12-310000312069ifrs-full:AccumulatedImpairmentMemberifrs-full:CorporateLoansMemberbcs:UpsideTwoMemberifrs-full:FinancialAssetsAtAmortisedCostMemberifrs-full:ExpectedCreditLossesCollectivelyAssessedMemberifrs-full:TwelvemonthExpectedCreditLossesMember2022-12-310000312069ifrs-full:AccumulatedImpairmentMemberifrs-full:CorporateLoansMemberbcs:UpsideOneMemberifrs-full:FinancialAssetsAtAmortisedCostMemberifrs-full:ExpectedCreditLossesCollectivelyAssessedMemberifrs-full:TwelvemonthExpectedCreditLossesMember2022-12-310000312069ifrs-full:AccumulatedImpairmentMemberifrs-full:CorporateLoansMemberbcs:BaselineMemberifrs-full:FinancialAssetsAtAmortisedCostMemberifrs-full:ExpectedCreditLossesCollectivelyAssessedMemberifrs-full:TwelvemonthExpectedCreditLossesMember2022-12-310000312069ifrs-full:AccumulatedImpairmentMemberifrs-full:CorporateLoansMemberifrs-full:FinancialAssetsAtAmortisedCostMemberbcs:DownsideOneMemberifrs-full:ExpectedCreditLossesCollectivelyAssessedMemberifrs-full:TwelvemonthExpectedCreditLossesMember2022-12-310000312069ifrs-full:AccumulatedImpairmentMemberifrs-full:CorporateLoansMemberbcs:DownsideTwoMemberifrs-full:FinancialAssetsAtAmortisedCostMemberifrs-full:ExpectedCreditLossesCollectivelyAssessedMemberifrs-full:TwelvemonthExpectedCreditLossesMember2022-12-310000312069ifrs-full:MortgagesMemberifrs-full:FinancialAssetsAtAmortisedCostMemberifrs-full:CreditRiskMemberifrs-full:ExpectedCreditLossesCollectivelyAssessedMemberifrs-full:TwelvemonthExpectedCreditLossesMember2022-12-310000312069bcs:UpsideTwoMemberifrs-full:MortgagesMemberifrs-full:FinancialAssetsAtAmortisedCostMemberifrs-full:ExpectedCreditLossesCollectivelyAssessedMemberifrs-full:TwelvemonthExpectedCreditLossesMember2022-12-310000312069ifrs-full:MortgagesMemberbcs:UpsideOneMemberifrs-full:FinancialAssetsAtAmortisedCostMemberifrs-full:ExpectedCreditLossesCollectivelyAssessedMemberifrs-full:TwelvemonthExpectedCreditLossesMember2022-12-310000312069ifrs-full:MortgagesMemberbcs:BaselineMemberifrs-full:FinancialAssetsAtAmortisedCostMemberifrs-full:ExpectedCreditLossesCollectivelyAssessedMemberifrs-full:TwelvemonthExpectedCreditLossesMember2022-12-310000312069ifrs-full:MortgagesMemberifrs-full:FinancialAssetsAtAmortisedCostMemberbcs:DownsideOneMemberifrs-full:ExpectedCreditLossesCollectivelyAssessedMemberifrs-full:TwelvemonthExpectedCreditLossesMember2022-12-310000312069ifrs-full:MortgagesMemberbcs:DownsideTwoMemberifrs-full:FinancialAssetsAtAmortisedCostMemberifrs-full:ExpectedCreditLossesCollectivelyAssessedMemberifrs-full:TwelvemonthExpectedCreditLossesMember2022-12-310000312069bcs:CreditCardsRetailMemberifrs-full:FinancialAssetsAtAmortisedCostMemberifrs-full:CreditRiskMemberifrs-full:ExpectedCreditLossesCollectivelyAssessedMemberifrs-full:TwelvemonthExpectedCreditLossesMember2022-12-310000312069bcs:CreditCardsRetailMemberbcs:UpsideTwoMemberifrs-full:FinancialAssetsAtAmortisedCostMemberifrs-full:ExpectedCreditLossesCollectivelyAssessedMemberifrs-full:TwelvemonthExpectedCreditLossesMember2022-12-310000312069bcs:CreditCardsRetailMemberbcs:UpsideOneMemberifrs-full:FinancialAssetsAtAmortisedCostMemberifrs-full:ExpectedCreditLossesCollectivelyAssessedMemberifrs-full:TwelvemonthExpectedCreditLossesMember2022-12-310000312069bcs:CreditCardsRetailMemberbcs:BaselineMemberifrs-full:FinancialAssetsAtAmortisedCostMemberifrs-full:ExpectedCreditLossesCollectivelyAssessedMemberifrs-full:TwelvemonthExpectedCreditLossesMember2022-12-310000312069bcs:CreditCardsRetailMemberifrs-full:FinancialAssetsAtAmortisedCostMemberbcs:DownsideOneMemberifrs-full:ExpectedCreditLossesCollectivelyAssessedMemberifrs-full:TwelvemonthExpectedCreditLossesMember2022-12-310000312069bcs:CreditCardsRetailMemberbcs:DownsideTwoMemberifrs-full:FinancialAssetsAtAmortisedCostMemberifrs-full:ExpectedCreditLossesCollectivelyAssessedMemberifrs-full:TwelvemonthExpectedCreditLossesMember2022-12-310000312069bcs:OtherRetailMemberifrs-full:FinancialAssetsAtAmortisedCostMemberifrs-full:CreditRiskMemberifrs-full:ExpectedCreditLossesCollectivelyAssessedMemberifrs-full:TwelvemonthExpectedCreditLossesMember2022-12-310000312069bcs:UpsideTwoMemberbcs:OtherRetailMemberifrs-full:FinancialAssetsAtAmortisedCostMemberifrs-full:ExpectedCreditLossesCollectivelyAssessedMemberifrs-full:TwelvemonthExpectedCreditLossesMember2022-12-310000312069bcs:OtherRetailMemberbcs:UpsideOneMemberifrs-full:FinancialAssetsAtAmortisedCostMemberifrs-full:ExpectedCreditLossesCollectivelyAssessedMemberifrs-full:TwelvemonthExpectedCreditLossesMember2022-12-310000312069bcs:OtherRetailMemberbcs:BaselineMemberifrs-full:FinancialAssetsAtAmortisedCostMemberifrs-full:ExpectedCreditLossesCollectivelyAssessedMemberifrs-full:TwelvemonthExpectedCreditLossesMember2022-12-310000312069bcs:OtherRetailMemberifrs-full:FinancialAssetsAtAmortisedCostMemberbcs:DownsideOneMemberifrs-full:ExpectedCreditLossesCollectivelyAssessedMemberifrs-full:TwelvemonthExpectedCreditLossesMember2022-12-310000312069bcs:OtherRetailMemberbcs:DownsideTwoMemberifrs-full:FinancialAssetsAtAmortisedCostMemberifrs-full:ExpectedCreditLossesCollectivelyAssessedMemberifrs-full:TwelvemonthExpectedCreditLossesMember2022-12-310000312069ifrs-full:CorporateLoansMemberifrs-full:FinancialAssetsAtAmortisedCostMemberifrs-full:CreditRiskMemberifrs-full:ExpectedCreditLossesCollectivelyAssessedMemberifrs-full:TwelvemonthExpectedCreditLossesMember2022-12-310000312069ifrs-full:CorporateLoansMemberbcs:UpsideTwoMemberifrs-full:FinancialAssetsAtAmortisedCostMemberifrs-full:ExpectedCreditLossesCollectivelyAssessedMemberifrs-full:TwelvemonthExpectedCreditLossesMember2022-12-310000312069ifrs-full:CorporateLoansMemberbcs:UpsideOneMemberifrs-full:FinancialAssetsAtAmortisedCostMemberifrs-full:ExpectedCreditLossesCollectivelyAssessedMemberifrs-full:TwelvemonthExpectedCreditLossesMember2022-12-310000312069ifrs-full:CorporateLoansMemberbcs:BaselineMemberifrs-full:FinancialAssetsAtAmortisedCostMemberifrs-full:ExpectedCreditLossesCollectivelyAssessedMemberifrs-full:TwelvemonthExpectedCreditLossesMember2022-12-310000312069ifrs-full:CorporateLoansMemberifrs-full:FinancialAssetsAtAmortisedCostMemberbcs:DownsideOneMemberifrs-full:ExpectedCreditLossesCollectivelyAssessedMemberifrs-full:TwelvemonthExpectedCreditLossesMember2022-12-310000312069ifrs-full:CorporateLoansMemberbcs:DownsideTwoMemberifrs-full:FinancialAssetsAtAmortisedCostMemberifrs-full:ExpectedCreditLossesCollectivelyAssessedMemberifrs-full:TwelvemonthExpectedCreditLossesMember2022-12-310000312069ifrs-full:LifetimeExpectedCreditLossesMemberifrs-full:MortgagesMemberifrs-full:FinancialAssetsAtAmortisedCostMemberifrs-full:CreditRiskMemberifrs-full:ExpectedCreditLossesCollectivelyAssessedMemberifrs-full:GrossCarryingAmountMemberifrs-full:FinancialInstrumentsNotCreditimpairedMember2022-12-310000312069ifrs-full:LifetimeExpectedCreditLossesMemberbcs:UpsideTwoMemberifrs-full:MortgagesMemberifrs-full:FinancialAssetsAtAmortisedCostMemberifrs-full:ExpectedCreditLossesCollectivelyAssessedMemberifrs-full:GrossCarryingAmountMemberifrs-full:FinancialInstrumentsNotCreditimpairedMember2022-12-310000312069ifrs-full:LifetimeExpectedCreditLossesMemberifrs-full:MortgagesMemberbcs:UpsideOneMemberifrs-full:FinancialAssetsAtAmortisedCostMemberifrs-full:ExpectedCreditLossesCollectivelyAssessedMemberifrs-full:GrossCarryingAmountMemberifrs-full:FinancialInstrumentsNotCreditimpairedMember2022-12-310000312069ifrs-full:LifetimeExpectedCreditLossesMemberifrs-full:MortgagesMemberbcs:BaselineMemberifrs-full:FinancialAssetsAtAmortisedCostMemberifrs-full:ExpectedCreditLossesCollectivelyAssessedMemberifrs-full:GrossCarryingAmountMemberifrs-full:FinancialInstrumentsNotCreditimpairedMember2022-12-310000312069ifrs-full:LifetimeExpectedCreditLossesMemberifrs-full:MortgagesMemberifrs-full:FinancialAssetsAtAmortisedCostMemberbcs:DownsideOneMemberifrs-full:ExpectedCreditLossesCollectivelyAssessedMemberifrs-full:GrossCarryingAmountMemberifrs-full:FinancialInstrumentsNotCreditimpairedMember2022-12-310000312069ifrs-full:LifetimeExpectedCreditLossesMemberifrs-full:MortgagesMemberbcs:DownsideTwoMemberifrs-full:FinancialAssetsAtAmortisedCostMemberifrs-full:ExpectedCreditLossesCollectivelyAssessedMemberifrs-full:GrossCarryingAmountMemberifrs-full:FinancialInstrumentsNotCreditimpairedMember2022-12-310000312069bcs:CreditCardsRetailMemberifrs-full:LifetimeExpectedCreditLossesMemberifrs-full:FinancialAssetsAtAmortisedCostMemberifrs-full:CreditRiskMemberifrs-full:ExpectedCreditLossesCollectivelyAssessedMemberifrs-full:GrossCarryingAmountMemberifrs-full:FinancialInstrumentsNotCreditimpairedMember2022-12-310000312069bcs:CreditCardsRetailMemberifrs-full:LifetimeExpectedCreditLossesMemberbcs:UpsideTwoMemberifrs-full:FinancialAssetsAtAmortisedCostMemberifrs-full:ExpectedCreditLossesCollectivelyAssessedMemberifrs-full:GrossCarryingAmountMemberifrs-full:FinancialInstrumentsNotCreditimpairedMember2022-12-310000312069bcs:CreditCardsRetailMemberifrs-full:LifetimeExpectedCreditLossesMemberbcs:UpsideOneMemberifrs-full:FinancialAssetsAtAmortisedCostMemberifrs-full:ExpectedCreditLossesCollectivelyAssessedMemberifrs-full:GrossCarryingAmountMemberifrs-full:FinancialInstrumentsNotCreditimpairedMember2022-12-310000312069bcs:CreditCardsRetailMemberifrs-full:LifetimeExpectedCreditLossesMemberbcs:BaselineMemberifrs-full:FinancialAssetsAtAmortisedCostMemberifrs-full:ExpectedCreditLossesCollectivelyAssessedMemberifrs-full:GrossCarryingAmountMemberifrs-full:FinancialInstrumentsNotCreditimpairedMember2022-12-310000312069bcs:CreditCardsRetailMemberifrs-full:LifetimeExpectedCreditLossesMemberifrs-full:FinancialAssetsAtAmortisedCostMemberbcs:DownsideOneMemberifrs-full:ExpectedCreditLossesCollectivelyAssessedMemberifrs-full:GrossCarryingAmountMemberifrs-full:FinancialInstrumentsNotCreditimpairedMember2022-12-310000312069bcs:CreditCardsRetailMemberifrs-full:LifetimeExpectedCreditLossesMemberbcs:DownsideTwoMemberifrs-full:FinancialAssetsAtAmortisedCostMemberifrs-full:ExpectedCreditLossesCollectivelyAssessedMemberifrs-full:GrossCarryingAmountMemberifrs-full:FinancialInstrumentsNotCreditimpairedMember2022-12-310000312069ifrs-full:LifetimeExpectedCreditLossesMemberbcs:OtherRetailMemberifrs-full:FinancialAssetsAtAmortisedCostMemberifrs-full:CreditRiskMemberifrs-full:ExpectedCreditLossesCollectivelyAssessedMemberifrs-full:GrossCarryingAmountMemberifrs-full:FinancialInstrumentsNotCreditimpairedMember2022-12-310000312069ifrs-full:LifetimeExpectedCreditLossesMemberbcs:UpsideTwoMemberbcs:OtherRetailMemberifrs-full:FinancialAssetsAtAmortisedCostMemberifrs-full:ExpectedCreditLossesCollectivelyAssessedMemberifrs-full:GrossCarryingAmountMemberifrs-full:FinancialInstrumentsNotCreditimpairedMember2022-12-310000312069ifrs-full:LifetimeExpectedCreditLossesMemberbcs:OtherRetailMemberbcs:UpsideOneMemberifrs-full:FinancialAssetsAtAmortisedCostMemberifrs-full:ExpectedCreditLossesCollectivelyAssessedMemberifrs-full:GrossCarryingAmountMemberifrs-full:FinancialInstrumentsNotCreditimpairedMember2022-12-310000312069ifrs-full:LifetimeExpectedCreditLossesMemberbcs:OtherRetailMemberbcs:BaselineMemberifrs-full:FinancialAssetsAtAmortisedCostMemberifrs-full:ExpectedCreditLossesCollectivelyAssessedMemberifrs-full:GrossCarryingAmountMemberifrs-full:FinancialInstrumentsNotCreditimpairedMember2022-12-310000312069ifrs-full:LifetimeExpectedCreditLossesMemberbcs:OtherRetailMemberifrs-full:FinancialAssetsAtAmortisedCostMemberbcs:DownsideOneMemberifrs-full:ExpectedCreditLossesCollectivelyAssessedMemberifrs-full:GrossCarryingAmountMemberifrs-full:FinancialInstrumentsNotCreditimpairedMember2022-12-310000312069ifrs-full:LifetimeExpectedCreditLossesMemberbcs:OtherRetailMemberbcs:DownsideTwoMemberifrs-full:FinancialAssetsAtAmortisedCostMemberifrs-full:ExpectedCreditLossesCollectivelyAssessedMemberifrs-full:GrossCarryingAmountMemberifrs-full:FinancialInstrumentsNotCreditimpairedMember2022-12-310000312069ifrs-full:LifetimeExpectedCreditLossesMemberifrs-full:CorporateLoansMemberifrs-full:FinancialAssetsAtAmortisedCostMemberifrs-full:CreditRiskMemberifrs-full:ExpectedCreditLossesCollectivelyAssessedMemberifrs-full:GrossCarryingAmountMemberifrs-full:FinancialInstrumentsNotCreditimpairedMember2022-12-310000312069ifrs-full:LifetimeExpectedCreditLossesMemberifrs-full:CorporateLoansMemberbcs:UpsideTwoMemberifrs-full:FinancialAssetsAtAmortisedCostMemberifrs-full:ExpectedCreditLossesCollectivelyAssessedMemberifrs-full:GrossCarryingAmountMemberifrs-full:FinancialInstrumentsNotCreditimpairedMember2022-12-310000312069ifrs-full:LifetimeExpectedCreditLossesMemberifrs-full:CorporateLoansMemberbcs:UpsideOneMemberifrs-full:FinancialAssetsAtAmortisedCostMemberifrs-full:ExpectedCreditLossesCollectivelyAssessedMemberifrs-full:GrossCarryingAmountMemberifrs-full:FinancialInstrumentsNotCreditimpairedMember2022-12-310000312069ifrs-full:LifetimeExpectedCreditLossesMemberifrs-full:CorporateLoansMemberbcs:BaselineMemberifrs-full:FinancialAssetsAtAmortisedCostMemberifrs-full:ExpectedCreditLossesCollectivelyAssessedMemberifrs-full:GrossCarryingAmountMemberifrs-full:FinancialInstrumentsNotCreditimpairedMember2022-12-310000312069ifrs-full:LifetimeExpectedCreditLossesMemberifrs-full:CorporateLoansMemberifrs-full:FinancialAssetsAtAmortisedCostMemberbcs:DownsideOneMemberifrs-full:ExpectedCreditLossesCollectivelyAssessedMemberifrs-full:GrossCarryingAmountMemberifrs-full:FinancialInstrumentsNotCreditimpairedMember2022-12-310000312069ifrs-full:LifetimeExpectedCreditLossesMemberifrs-full:CorporateLoansMemberbcs:DownsideTwoMemberifrs-full:FinancialAssetsAtAmortisedCostMemberifrs-full:ExpectedCreditLossesCollectivelyAssessedMemberifrs-full:GrossCarryingAmountMemberifrs-full:FinancialInstrumentsNotCreditimpairedMember2022-12-310000312069ifrs-full:AccumulatedImpairmentMemberifrs-full:LifetimeExpectedCreditLossesMemberifrs-full:MortgagesMemberifrs-full:FinancialAssetsAtAmortisedCostMemberifrs-full:CreditRiskMemberifrs-full:ExpectedCreditLossesCollectivelyAssessedMemberifrs-full:FinancialInstrumentsNotCreditimpairedMember2022-12-310000312069ifrs-full:AccumulatedImpairmentMemberifrs-full:LifetimeExpectedCreditLossesMemberbcs:UpsideTwoMemberifrs-full:MortgagesMemberifrs-full:FinancialAssetsAtAmortisedCostMemberifrs-full:ExpectedCreditLossesCollectivelyAssessedMemberifrs-full:FinancialInstrumentsNotCreditimpairedMember2022-12-310000312069ifrs-full:AccumulatedImpairmentMemberifrs-full:LifetimeExpectedCreditLossesMemberifrs-full:MortgagesMemberbcs:UpsideOneMemberifrs-full:FinancialAssetsAtAmortisedCostMemberifrs-full:ExpectedCreditLossesCollectivelyAssessedMemberifrs-full:FinancialInstrumentsNotCreditimpairedMember2022-12-310000312069ifrs-full:AccumulatedImpairmentMemberifrs-full:LifetimeExpectedCreditLossesMemberifrs-full:MortgagesMemberbcs:BaselineMemberifrs-full:FinancialAssetsAtAmortisedCostMemberifrs-full:ExpectedCreditLossesCollectivelyAssessedMemberifrs-full:FinancialInstrumentsNotCreditimpairedMember2022-12-310000312069ifrs-full:AccumulatedImpairmentMemberifrs-full:LifetimeExpectedCreditLossesMemberifrs-full:MortgagesMemberifrs-full:FinancialAssetsAtAmortisedCostMemberbcs:DownsideOneMemberifrs-full:ExpectedCreditLossesCollectivelyAssessedMemberifrs-full:FinancialInstrumentsNotCreditimpairedMember2022-12-310000312069ifrs-full:AccumulatedImpairmentMemberifrs-full:LifetimeExpectedCreditLossesMemberifrs-full:MortgagesMemberbcs:DownsideTwoMemberifrs-full:FinancialAssetsAtAmortisedCostMemberifrs-full:ExpectedCreditLossesCollectivelyAssessedMemberifrs-full:FinancialInstrumentsNotCreditimpairedMember2022-12-310000312069bcs:CreditCardsRetailMemberifrs-full:AccumulatedImpairmentMemberifrs-full:LifetimeExpectedCreditLossesMemberifrs-full:FinancialAssetsAtAmortisedCostMemberifrs-full:CreditRiskMemberifrs-full:ExpectedCreditLossesCollectivelyAssessedMemberifrs-full:FinancialInstrumentsNotCreditimpairedMember2022-12-310000312069bcs:CreditCardsRetailMemberifrs-full:AccumulatedImpairmentMemberifrs-full:LifetimeExpectedCreditLossesMemberbcs:UpsideTwoMemberifrs-full:FinancialAssetsAtAmortisedCostMemberifrs-full:ExpectedCreditLossesCollectivelyAssessedMemberifrs-full:FinancialInstrumentsNotCreditimpairedMember2022-12-310000312069bcs:CreditCardsRetailMemberifrs-full:AccumulatedImpairmentMemberifrs-full:LifetimeExpectedCreditLossesMemberbcs:UpsideOneMemberifrs-full:FinancialAssetsAtAmortisedCostMemberifrs-full:ExpectedCreditLossesCollectivelyAssessedMemberifrs-full:FinancialInstrumentsNotCreditimpairedMember2022-12-310000312069bcs:CreditCardsRetailMemberifrs-full:AccumulatedImpairmentMemberifrs-full:LifetimeExpectedCreditLossesMemberbcs:BaselineMemberifrs-full:FinancialAssetsAtAmortisedCostMemberifrs-full:ExpectedCreditLossesCollectivelyAssessedMemberifrs-full:FinancialInstrumentsNotCreditimpairedMember2022-12-310000312069bcs:CreditCardsRetailMemberifrs-full:AccumulatedImpairmentMemberifrs-full:LifetimeExpectedCreditLossesMemberifrs-full:FinancialAssetsAtAmortisedCostMemberbcs:DownsideOneMemberifrs-full:ExpectedCreditLossesCollectivelyAssessedMemberifrs-full:FinancialInstrumentsNotCreditimpairedMember2022-12-310000312069bcs:CreditCardsRetailMemberifrs-full:AccumulatedImpairmentMemberifrs-full:LifetimeExpectedCreditLossesMemberbcs:DownsideTwoMemberifrs-full:FinancialAssetsAtAmortisedCostMemberifrs-full:ExpectedCreditLossesCollectivelyAssessedMemberifrs-full:FinancialInstrumentsNotCreditimpairedMember2022-12-310000312069ifrs-full:AccumulatedImpairmentMemberifrs-full:LifetimeExpectedCreditLossesMemberbcs:OtherRetailMemberifrs-full:FinancialAssetsAtAmortisedCostMemberifrs-full:CreditRiskMemberifrs-full:ExpectedCreditLossesCollectivelyAssessedMemberifrs-full:FinancialInstrumentsNotCreditimpairedMember2022-12-310000312069ifrs-full:AccumulatedImpairmentMemberifrs-full:LifetimeExpectedCreditLossesMemberbcs:UpsideTwoMemberbcs:OtherRetailMemberifrs-full:FinancialAssetsAtAmortisedCostMemberifrs-full:ExpectedCreditLossesCollectivelyAssessedMemberifrs-full:FinancialInstrumentsNotCreditimpairedMember2022-12-310000312069ifrs-full:AccumulatedImpairmentMemberifrs-full:LifetimeExpectedCreditLossesMemberbcs:OtherRetailMemberbcs:UpsideOneMemberifrs-full:FinancialAssetsAtAmortisedCostMemberifrs-full:ExpectedCreditLossesCollectivelyAssessedMemberifrs-full:FinancialInstrumentsNotCreditimpairedMember2022-12-310000312069ifrs-full:AccumulatedImpairmentMemberifrs-full:LifetimeExpectedCreditLossesMemberbcs:OtherRetailMemberbcs:BaselineMemberifrs-full:FinancialAssetsAtAmortisedCostMemberifrs-full:ExpectedCreditLossesCollectivelyAssessedMemberifrs-full:FinancialInstrumentsNotCreditimpairedMember2022-12-310000312069ifrs-full:AccumulatedImpairmentMemberifrs-full:LifetimeExpectedCreditLossesMemberbcs:OtherRetailMemberifrs-full:FinancialAssetsAtAmortisedCostMemberbcs:DownsideOneMemberifrs-full:ExpectedCreditLossesCollectivelyAssessedMemberifrs-full:FinancialInstrumentsNotCreditimpairedMember2022-12-310000312069ifrs-full:AccumulatedImpairmentMemberifrs-full:LifetimeExpectedCreditLossesMemberbcs:OtherRetailMemberbcs:DownsideTwoMemberifrs-full:FinancialAssetsAtAmortisedCostMemberifrs-full:ExpectedCreditLossesCollectivelyAssessedMemberifrs-full:FinancialInstrumentsNotCreditimpairedMember2022-12-310000312069ifrs-full:AccumulatedImpairmentMemberifrs-full:LifetimeExpectedCreditLossesMemberifrs-full:CorporateLoansMemberifrs-full:FinancialAssetsAtAmortisedCostMemberifrs-full:CreditRiskMemberifrs-full:ExpectedCreditLossesCollectivelyAssessedMemberifrs-full:FinancialInstrumentsNotCreditimpairedMember2022-12-310000312069ifrs-full:AccumulatedImpairmentMemberifrs-full:LifetimeExpectedCreditLossesMemberifrs-full:CorporateLoansMemberbcs:UpsideTwoMemberifrs-full:FinancialAssetsAtAmortisedCostMemberifrs-full:ExpectedCreditLossesCollectivelyAssessedMemberifrs-full:FinancialInstrumentsNotCreditimpairedMember2022-12-310000312069ifrs-full:AccumulatedImpairmentMemberifrs-full:LifetimeExpectedCreditLossesMemberifrs-full:CorporateLoansMemberbcs:UpsideOneMemberifrs-full:FinancialAssetsAtAmortisedCostMemberifrs-full:ExpectedCreditLossesCollectivelyAssessedMemberifrs-full:FinancialInstrumentsNotCreditimpairedMember2022-12-310000312069ifrs-full:AccumulatedImpairmentMemberifrs-full:LifetimeExpectedCreditLossesMemberifrs-full:CorporateLoansMemberbcs:BaselineMemberifrs-full:FinancialAssetsAtAmortisedCostMemberifrs-full:ExpectedCreditLossesCollectivelyAssessedMemberifrs-full:FinancialInstrumentsNotCreditimpairedMember2022-12-310000312069ifrs-full:AccumulatedImpairmentMemberifrs-full:LifetimeExpectedCreditLossesMemberifrs-full:CorporateLoansMemberifrs-full:FinancialAssetsAtAmortisedCostMemberbcs:DownsideOneMemberifrs-full:ExpectedCreditLossesCollectivelyAssessedMemberifrs-full:FinancialInstrumentsNotCreditimpairedMember2022-12-310000312069ifrs-full:AccumulatedImpairmentMemberifrs-full:LifetimeExpectedCreditLossesMemberifrs-full:CorporateLoansMemberbcs:DownsideTwoMemberifrs-full:FinancialAssetsAtAmortisedCostMemberifrs-full:ExpectedCreditLossesCollectivelyAssessedMemberifrs-full:FinancialInstrumentsNotCreditimpairedMember2022-12-310000312069ifrs-full:LifetimeExpectedCreditLossesMemberifrs-full:MortgagesMemberifrs-full:FinancialAssetsAtAmortisedCostMemberifrs-full:CreditRiskMemberifrs-full:ExpectedCreditLossesCollectivelyAssessedMemberifrs-full:FinancialInstrumentsNotCreditimpairedMember2022-12-310000312069ifrs-full:LifetimeExpectedCreditLossesMemberbcs:UpsideTwoMemberifrs-full:MortgagesMemberifrs-full:FinancialAssetsAtAmortisedCostMemberifrs-full:ExpectedCreditLossesCollectivelyAssessedMemberifrs-full:FinancialInstrumentsNotCreditimpairedMember2022-12-310000312069ifrs-full:LifetimeExpectedCreditLossesMemberifrs-full:MortgagesMemberbcs:UpsideOneMemberifrs-full:FinancialAssetsAtAmortisedCostMemberifrs-full:ExpectedCreditLossesCollectivelyAssessedMemberifrs-full:FinancialInstrumentsNotCreditimpairedMember2022-12-310000312069ifrs-full:LifetimeExpectedCreditLossesMemberifrs-full:MortgagesMemberbcs:BaselineMemberifrs-full:FinancialAssetsAtAmortisedCostMemberifrs-full:ExpectedCreditLossesCollectivelyAssessedMemberifrs-full:FinancialInstrumentsNotCreditimpairedMember2022-12-310000312069ifrs-full:LifetimeExpectedCreditLossesMemberifrs-full:MortgagesMemberifrs-full:FinancialAssetsAtAmortisedCostMemberbcs:DownsideOneMemberifrs-full:ExpectedCreditLossesCollectivelyAssessedMemberifrs-full:FinancialInstrumentsNotCreditimpairedMember2022-12-310000312069ifrs-full:LifetimeExpectedCreditLossesMemberifrs-full:MortgagesMemberbcs:DownsideTwoMemberifrs-full:FinancialAssetsAtAmortisedCostMemberifrs-full:ExpectedCreditLossesCollectivelyAssessedMemberifrs-full:FinancialInstrumentsNotCreditimpairedMember2022-12-310000312069bcs:CreditCardsRetailMemberifrs-full:LifetimeExpectedCreditLossesMemberifrs-full:FinancialAssetsAtAmortisedCostMemberifrs-full:CreditRiskMemberifrs-full:ExpectedCreditLossesCollectivelyAssessedMemberifrs-full:FinancialInstrumentsNotCreditimpairedMember2022-12-310000312069bcs:CreditCardsRetailMemberifrs-full:LifetimeExpectedCreditLossesMemberbcs:UpsideTwoMemberifrs-full:FinancialAssetsAtAmortisedCostMemberifrs-full:ExpectedCreditLossesCollectivelyAssessedMemberifrs-full:FinancialInstrumentsNotCreditimpairedMember2022-12-310000312069bcs:CreditCardsRetailMemberifrs-full:LifetimeExpectedCreditLossesMemberbcs:UpsideOneMemberifrs-full:FinancialAssetsAtAmortisedCostMemberifrs-full:ExpectedCreditLossesCollectivelyAssessedMemberifrs-full:FinancialInstrumentsNotCreditimpairedMember2022-12-310000312069bcs:CreditCardsRetailMemberifrs-full:LifetimeExpectedCreditLossesMemberbcs:BaselineMemberifrs-full:FinancialAssetsAtAmortisedCostMemberifrs-full:ExpectedCreditLossesCollectivelyAssessedMemberifrs-full:FinancialInstrumentsNotCreditimpairedMember2022-12-310000312069bcs:CreditCardsRetailMemberifrs-full:LifetimeExpectedCreditLossesMemberifrs-full:FinancialAssetsAtAmortisedCostMemberbcs:DownsideOneMemberifrs-full:ExpectedCreditLossesCollectivelyAssessedMemberifrs-full:FinancialInstrumentsNotCreditimpairedMember2022-12-310000312069bcs:CreditCardsRetailMemberifrs-full:LifetimeExpectedCreditLossesMemberbcs:DownsideTwoMemberifrs-full:FinancialAssetsAtAmortisedCostMemberifrs-full:ExpectedCreditLossesCollectivelyAssessedMemberifrs-full:FinancialInstrumentsNotCreditimpairedMember2022-12-310000312069ifrs-full:LifetimeExpectedCreditLossesMemberbcs:OtherRetailMemberifrs-full:FinancialAssetsAtAmortisedCostMemberifrs-full:CreditRiskMemberifrs-full:ExpectedCreditLossesCollectivelyAssessedMemberifrs-full:FinancialInstrumentsNotCreditimpairedMember2022-12-310000312069ifrs-full:LifetimeExpectedCreditLossesMemberbcs:UpsideTwoMemberbcs:OtherRetailMemberifrs-full:FinancialAssetsAtAmortisedCostMemberifrs-full:ExpectedCreditLossesCollectivelyAssessedMemberifrs-full:FinancialInstrumentsNotCreditimpairedMember2022-12-310000312069ifrs-full:LifetimeExpectedCreditLossesMemberbcs:OtherRetailMemberbcs:UpsideOneMemberifrs-full:FinancialAssetsAtAmortisedCostMemberifrs-full:ExpectedCreditLossesCollectivelyAssessedMemberifrs-full:FinancialInstrumentsNotCreditimpairedMember2022-12-310000312069ifrs-full:LifetimeExpectedCreditLossesMemberbcs:OtherRetailMemberbcs:BaselineMemberifrs-full:FinancialAssetsAtAmortisedCostMemberifrs-full:ExpectedCreditLossesCollectivelyAssessedMemberifrs-full:FinancialInstrumentsNotCreditimpairedMember2022-12-310000312069ifrs-full:LifetimeExpectedCreditLossesMemberbcs:OtherRetailMemberifrs-full:FinancialAssetsAtAmortisedCostMemberbcs:DownsideOneMemberifrs-full:ExpectedCreditLossesCollectivelyAssessedMemberifrs-full:FinancialInstrumentsNotCreditimpairedMember2022-12-310000312069ifrs-full:LifetimeExpectedCreditLossesMemberbcs:OtherRetailMemberbcs:DownsideTwoMemberifrs-full:FinancialAssetsAtAmortisedCostMemberifrs-full:ExpectedCreditLossesCollectivelyAssessedMemberifrs-full:FinancialInstrumentsNotCreditimpairedMember2022-12-310000312069ifrs-full:LifetimeExpectedCreditLossesMemberifrs-full:CorporateLoansMemberifrs-full:FinancialAssetsAtAmortisedCostMemberifrs-full:CreditRiskMemberifrs-full:ExpectedCreditLossesCollectivelyAssessedMemberifrs-full:FinancialInstrumentsNotCreditimpairedMember2022-12-310000312069ifrs-full:LifetimeExpectedCreditLossesMemberifrs-full:CorporateLoansMemberbcs:UpsideTwoMemberifrs-full:FinancialAssetsAtAmortisedCostMemberifrs-full:ExpectedCreditLossesCollectivelyAssessedMemberifrs-full:FinancialInstrumentsNotCreditimpairedMember2022-12-310000312069ifrs-full:LifetimeExpectedCreditLossesMemberifrs-full:CorporateLoansMemberbcs:UpsideOneMemberifrs-full:FinancialAssetsAtAmortisedCostMemberifrs-full:ExpectedCreditLossesCollectivelyAssessedMemberifrs-full:FinancialInstrumentsNotCreditimpairedMember2022-12-310000312069ifrs-full:LifetimeExpectedCreditLossesMemberifrs-full:CorporateLoansMemberbcs:BaselineMemberifrs-full:FinancialAssetsAtAmortisedCostMemberifrs-full:ExpectedCreditLossesCollectivelyAssessedMemberifrs-full:FinancialInstrumentsNotCreditimpairedMember2022-12-310000312069ifrs-full:LifetimeExpectedCreditLossesMemberifrs-full:CorporateLoansMemberifrs-full:FinancialAssetsAtAmortisedCostMemberbcs:DownsideOneMemberifrs-full:ExpectedCreditLossesCollectivelyAssessedMemberifrs-full:FinancialInstrumentsNotCreditimpairedMember2022-12-310000312069ifrs-full:LifetimeExpectedCreditLossesMemberifrs-full:CorporateLoansMemberbcs:DownsideTwoMemberifrs-full:FinancialAssetsAtAmortisedCostMemberifrs-full:ExpectedCreditLossesCollectivelyAssessedMemberifrs-full:FinancialInstrumentsNotCreditimpairedMember2022-12-310000312069ifrs-full:LifetimeExpectedCreditLossesMemberifrs-full:MortgagesMemberifrs-full:FinancialInstrumentsCreditimpairedMemberifrs-full:FinancialAssetsAtAmortisedCostMemberifrs-full:CreditRiskMemberifrs-full:ExpectedCreditLossesCollectivelyAssessedMemberifrs-full:GrossCarryingAmountMember2022-12-310000312069ifrs-full:LifetimeExpectedCreditLossesMemberbcs:UpsideTwoMemberifrs-full:MortgagesMemberifrs-full:FinancialInstrumentsCreditimpairedMemberifrs-full:FinancialAssetsAtAmortisedCostMemberifrs-full:ExpectedCreditLossesCollectivelyAssessedMemberifrs-full:GrossCarryingAmountMember2022-12-310000312069ifrs-full:LifetimeExpectedCreditLossesMemberifrs-full:MortgagesMemberifrs-full:FinancialInstrumentsCreditimpairedMemberbcs:UpsideOneMemberifrs-full:FinancialAssetsAtAmortisedCostMemberifrs-full:ExpectedCreditLossesCollectivelyAssessedMemberifrs-full:GrossCarryingAmountMember2022-12-310000312069ifrs-full:LifetimeExpectedCreditLossesMemberifrs-full:MortgagesMemberifrs-full:FinancialInstrumentsCreditimpairedMemberbcs:BaselineMemberifrs-full:FinancialAssetsAtAmortisedCostMemberifrs-full:ExpectedCreditLossesCollectivelyAssessedMemberifrs-full:GrossCarryingAmountMember2022-12-310000312069ifrs-full:LifetimeExpectedCreditLossesMemberifrs-full:MortgagesMemberifrs-full:FinancialInstrumentsCreditimpairedMemberifrs-full:FinancialAssetsAtAmortisedCostMemberbcs:DownsideOneMemberifrs-full:ExpectedCreditLossesCollectivelyAssessedMemberifrs-full:GrossCarryingAmountMember2022-12-310000312069ifrs-full:LifetimeExpectedCreditLossesMemberifrs-full:MortgagesMemberbcs:DownsideTwoMemberifrs-full:FinancialInstrumentsCreditimpairedMemberifrs-full:FinancialAssetsAtAmortisedCostMemberifrs-full:ExpectedCreditLossesCollectivelyAssessedMemberifrs-full:GrossCarryingAmountMember2022-12-310000312069bcs:CreditCardsRetailMemberifrs-full:LifetimeExpectedCreditLossesMemberifrs-full:FinancialInstrumentsCreditimpairedMemberifrs-full:FinancialAssetsAtAmortisedCostMemberifrs-full:CreditRiskMemberifrs-full:ExpectedCreditLossesCollectivelyAssessedMemberifrs-full:GrossCarryingAmountMember2022-12-310000312069bcs:CreditCardsRetailMemberifrs-full:LifetimeExpectedCreditLossesMemberbcs:UpsideTwoMemberifrs-full:FinancialInstrumentsCreditimpairedMemberifrs-full:FinancialAssetsAtAmortisedCostMemberifrs-full:ExpectedCreditLossesCollectivelyAssessedMemberifrs-full:GrossCarryingAmountMember2022-12-310000312069bcs:CreditCardsRetailMemberifrs-full:LifetimeExpectedCreditLossesMemberifrs-full:FinancialInstrumentsCreditimpairedMemberbcs:UpsideOneMemberifrs-full:FinancialAssetsAtAmortisedCostMemberifrs-full:ExpectedCreditLossesCollectivelyAssessedMemberifrs-full:GrossCarryingAmountMember2022-12-310000312069bcs:CreditCardsRetailMemberifrs-full:LifetimeExpectedCreditLossesMemberifrs-full:FinancialInstrumentsCreditimpairedMemberbcs:BaselineMemberifrs-full:FinancialAssetsAtAmortisedCostMemberifrs-full:ExpectedCreditLossesCollectivelyAssessedMemberifrs-full:GrossCarryingAmountMember2022-12-310000312069bcs:CreditCardsRetailMemberifrs-full:LifetimeExpectedCreditLossesMemberifrs-full:FinancialInstrumentsCreditimpairedMemberifrs-full:FinancialAssetsAtAmortisedCostMemberbcs:DownsideOneMemberifrs-full:ExpectedCreditLossesCollectivelyAssessedMemberifrs-full:GrossCarryingAmountMember2022-12-310000312069bcs:CreditCardsRetailMemberifrs-full:LifetimeExpectedCreditLossesMemberbcs:DownsideTwoMemberifrs-full:FinancialInstrumentsCreditimpairedMemberifrs-full:FinancialAssetsAtAmortisedCostMemberifrs-full:ExpectedCreditLossesCollectivelyAssessedMemberifrs-full:GrossCarryingAmountMember2022-12-310000312069ifrs-full:LifetimeExpectedCreditLossesMemberbcs:OtherRetailMemberifrs-full:FinancialInstrumentsCreditimpairedMemberifrs-full:FinancialAssetsAtAmortisedCostMemberifrs-full:CreditRiskMemberifrs-full:ExpectedCreditLossesCollectivelyAssessedMemberifrs-full:GrossCarryingAmountMember2022-12-310000312069ifrs-full:LifetimeExpectedCreditLossesMemberbcs:UpsideTwoMemberbcs:OtherRetailMemberifrs-full:FinancialInstrumentsCreditimpairedMemberifrs-full:FinancialAssetsAtAmortisedCostMemberifrs-full:ExpectedCreditLossesCollectivelyAssessedMemberifrs-full:GrossCarryingAmountMember2022-12-310000312069ifrs-full:LifetimeExpectedCreditLossesMemberbcs:OtherRetailMemberifrs-full:FinancialInstrumentsCreditimpairedMemberbcs:UpsideOneMemberifrs-full:FinancialAssetsAtAmortisedCostMemberifrs-full:ExpectedCreditLossesCollectivelyAssessedMemberifrs-full:GrossCarryingAmountMember2022-12-310000312069ifrs-full:LifetimeExpectedCreditLossesMemberbcs:OtherRetailMemberifrs-full:FinancialInstrumentsCreditimpairedMemberbcs:BaselineMemberifrs-full:FinancialAssetsAtAmortisedCostMemberifrs-full:ExpectedCreditLossesCollectivelyAssessedMemberifrs-full:GrossCarryingAmountMember2022-12-310000312069ifrs-full:LifetimeExpectedCreditLossesMemberbcs:OtherRetailMemberifrs-full:FinancialInstrumentsCreditimpairedMemberifrs-full:FinancialAssetsAtAmortisedCostMemberbcs:DownsideOneMemberifrs-full:ExpectedCreditLossesCollectivelyAssessedMemberifrs-full:GrossCarryingAmountMember2022-12-310000312069ifrs-full:LifetimeExpectedCreditLossesMemberbcs:OtherRetailMemberbcs:DownsideTwoMemberifrs-full:FinancialInstrumentsCreditimpairedMemberifrs-full:FinancialAssetsAtAmortisedCostMemberifrs-full:ExpectedCreditLossesCollectivelyAssessedMemberifrs-full:GrossCarryingAmountMember2022-12-310000312069ifrs-full:LifetimeExpectedCreditLossesMemberifrs-full:CorporateLoansMemberifrs-full:FinancialInstrumentsCreditimpairedMemberifrs-full:FinancialAssetsAtAmortisedCostMemberifrs-full:CreditRiskMemberifrs-full:ExpectedCreditLossesCollectivelyAssessedMemberifrs-full:GrossCarryingAmountMember2022-12-310000312069ifrs-full:LifetimeExpectedCreditLossesMemberifrs-full:CorporateLoansMemberbcs:UpsideTwoMemberifrs-full:FinancialInstrumentsCreditimpairedMemberifrs-full:FinancialAssetsAtAmortisedCostMemberifrs-full:ExpectedCreditLossesCollectivelyAssessedMemberifrs-full:GrossCarryingAmountMember2022-12-310000312069ifrs-full:LifetimeExpectedCreditLossesMemberifrs-full:CorporateLoansMemberifrs-full:FinancialInstrumentsCreditimpairedMemberbcs:UpsideOneMemberifrs-full:FinancialAssetsAtAmortisedCostMemberifrs-full:ExpectedCreditLossesCollectivelyAssessedMemberifrs-full:GrossCarryingAmountMember2022-12-310000312069ifrs-full:LifetimeExpectedCreditLossesMemberifrs-full:CorporateLoansMemberifrs-full:FinancialInstrumentsCreditimpairedMemberbcs:BaselineMemberifrs-full:FinancialAssetsAtAmortisedCostMemberifrs-full:ExpectedCreditLossesCollectivelyAssessedMemberifrs-full:GrossCarryingAmountMember2022-12-310000312069ifrs-full:LifetimeExpectedCreditLossesMemberifrs-full:CorporateLoansMemberifrs-full:FinancialInstrumentsCreditimpairedMemberifrs-full:FinancialAssetsAtAmortisedCostMemberbcs:DownsideOneMemberifrs-full:ExpectedCreditLossesCollectivelyAssessedMemberifrs-full:GrossCarryingAmountMember2022-12-310000312069ifrs-full:LifetimeExpectedCreditLossesMemberifrs-full:CorporateLoansMemberbcs:DownsideTwoMemberifrs-full:FinancialInstrumentsCreditimpairedMemberifrs-full:FinancialAssetsAtAmortisedCostMemberifrs-full:ExpectedCreditLossesCollectivelyAssessedMemberifrs-full:GrossCarryingAmountMember2022-12-310000312069ifrs-full:AccumulatedImpairmentMemberifrs-full:LifetimeExpectedCreditLossesMemberifrs-full:MortgagesMemberifrs-full:FinancialInstrumentsCreditimpairedMemberifrs-full:FinancialAssetsAtAmortisedCostMemberifrs-full:CreditRiskMemberifrs-full:ExpectedCreditLossesCollectivelyAssessedMember2022-12-310000312069ifrs-full:AccumulatedImpairmentMemberifrs-full:LifetimeExpectedCreditLossesMemberbcs:UpsideTwoMemberifrs-full:MortgagesMemberifrs-full:FinancialInstrumentsCreditimpairedMemberifrs-full:FinancialAssetsAtAmortisedCostMemberifrs-full:ExpectedCreditLossesCollectivelyAssessedMember2022-12-310000312069ifrs-full:AccumulatedImpairmentMemberifrs-full:LifetimeExpectedCreditLossesMemberifrs-full:MortgagesMemberifrs-full:FinancialInstrumentsCreditimpairedMemberbcs:UpsideOneMemberifrs-full:FinancialAssetsAtAmortisedCostMemberifrs-full:ExpectedCreditLossesCollectivelyAssessedMember2022-12-310000312069ifrs-full:AccumulatedImpairmentMemberifrs-full:LifetimeExpectedCreditLossesMemberifrs-full:MortgagesMemberifrs-full:FinancialInstrumentsCreditimpairedMemberbcs:BaselineMemberifrs-full:FinancialAssetsAtAmortisedCostMemberifrs-full:ExpectedCreditLossesCollectivelyAssessedMember2022-12-310000312069ifrs-full:AccumulatedImpairmentMemberifrs-full:LifetimeExpectedCreditLossesMemberifrs-full:MortgagesMemberifrs-full:FinancialInstrumentsCreditimpairedMemberifrs-full:FinancialAssetsAtAmortisedCostMemberbcs:DownsideOneMemberifrs-full:ExpectedCreditLossesCollectivelyAssessedMember2022-12-310000312069ifrs-full:AccumulatedImpairmentMemberifrs-full:LifetimeExpectedCreditLossesMemberifrs-full:MortgagesMemberbcs:DownsideTwoMemberifrs-full:FinancialInstrumentsCreditimpairedMemberifrs-full:FinancialAssetsAtAmortisedCostMemberifrs-full:ExpectedCreditLossesCollectivelyAssessedMember2022-12-310000312069bcs:CreditCardsRetailMemberifrs-full:AccumulatedImpairmentMemberifrs-full:LifetimeExpectedCreditLossesMemberifrs-full:FinancialInstrumentsCreditimpairedMemberifrs-full:FinancialAssetsAtAmortisedCostMemberifrs-full:CreditRiskMemberifrs-full:ExpectedCreditLossesCollectivelyAssessedMember2022-12-310000312069bcs:CreditCardsRetailMemberifrs-full:AccumulatedImpairmentMemberifrs-full:LifetimeExpectedCreditLossesMemberbcs:UpsideTwoMemberifrs-full:FinancialInstrumentsCreditimpairedMemberifrs-full:FinancialAssetsAtAmortisedCostMemberifrs-full:ExpectedCreditLossesCollectivelyAssessedMember2022-12-310000312069bcs:CreditCardsRetailMemberifrs-full:AccumulatedImpairmentMemberifrs-full:LifetimeExpectedCreditLossesMemberifrs-full:FinancialInstrumentsCreditimpairedMemberbcs:UpsideOneMemberifrs-full:FinancialAssetsAtAmortisedCostMemberifrs-full:ExpectedCreditLossesCollectivelyAssessedMember2022-12-310000312069bcs:CreditCardsRetailMemberifrs-full:AccumulatedImpairmentMemberifrs-full:LifetimeExpectedCreditLossesMemberifrs-full:FinancialInstrumentsCreditimpairedMemberbcs:BaselineMemberifrs-full:FinancialAssetsAtAmortisedCostMemberifrs-full:ExpectedCreditLossesCollectivelyAssessedMember2022-12-310000312069bcs:CreditCardsRetailMemberifrs-full:AccumulatedImpairmentMemberifrs-full:LifetimeExpectedCreditLossesMemberifrs-full:FinancialInstrumentsCreditimpairedMemberifrs-full:FinancialAssetsAtAmortisedCostMemberbcs:DownsideOneMemberifrs-full:ExpectedCreditLossesCollectivelyAssessedMember2022-12-310000312069bcs:CreditCardsRetailMemberifrs-full:AccumulatedImpairmentMemberifrs-full:LifetimeExpectedCreditLossesMemberbcs:DownsideTwoMemberifrs-full:FinancialInstrumentsCreditimpairedMemberifrs-full:FinancialAssetsAtAmortisedCostMemberifrs-full:ExpectedCreditLossesCollectivelyAssessedMember2022-12-310000312069ifrs-full:AccumulatedImpairmentMemberifrs-full:LifetimeExpectedCreditLossesMemberbcs:OtherRetailMemberifrs-full:FinancialInstrumentsCreditimpairedMemberifrs-full:FinancialAssetsAtAmortisedCostMemberifrs-full:CreditRiskMemberifrs-full:ExpectedCreditLossesCollectivelyAssessedMember2022-12-310000312069ifrs-full:AccumulatedImpairmentMemberifrs-full:LifetimeExpectedCreditLossesMemberbcs:UpsideTwoMemberbcs:OtherRetailMemberifrs-full:FinancialInstrumentsCreditimpairedMemberifrs-full:FinancialAssetsAtAmortisedCostMemberifrs-full:ExpectedCreditLossesCollectivelyAssessedMember2022-12-310000312069ifrs-full:AccumulatedImpairmentMemberifrs-full:LifetimeExpectedCreditLossesMemberbcs:OtherRetailMemberifrs-full:FinancialInstrumentsCreditimpairedMemberbcs:UpsideOneMemberifrs-full:FinancialAssetsAtAmortisedCostMemberifrs-full:ExpectedCreditLossesCollectivelyAssessedMember2022-12-310000312069ifrs-full:AccumulatedImpairmentMemberifrs-full:LifetimeExpectedCreditLossesMemberbcs:OtherRetailMemberifrs-full:FinancialInstrumentsCreditimpairedMemberbcs:BaselineMemberifrs-full:FinancialAssetsAtAmortisedCostMemberifrs-full:ExpectedCreditLossesCollectivelyAssessedMember2022-12-310000312069ifrs-full:AccumulatedImpairmentMemberifrs-full:LifetimeExpectedCreditLossesMemberbcs:OtherRetailMemberifrs-full:FinancialInstrumentsCreditimpairedMemberifrs-full:FinancialAssetsAtAmortisedCostMemberbcs:DownsideOneMemberifrs-full:ExpectedCreditLossesCollectivelyAssessedMember2022-12-310000312069ifrs-full:AccumulatedImpairmentMemberifrs-full:LifetimeExpectedCreditLossesMemberbcs:OtherRetailMemberbcs:DownsideTwoMemberifrs-full:FinancialInstrumentsCreditimpairedMemberifrs-full:FinancialAssetsAtAmortisedCostMemberifrs-full:ExpectedCreditLossesCollectivelyAssessedMember2022-12-310000312069ifrs-full:AccumulatedImpairmentMemberifrs-full:LifetimeExpectedCreditLossesMemberifrs-full:CorporateLoansMemberifrs-full:FinancialInstrumentsCreditimpairedMemberifrs-full:FinancialAssetsAtAmortisedCostMemberifrs-full:CreditRiskMemberifrs-full:ExpectedCreditLossesCollectivelyAssessedMember2022-12-310000312069ifrs-full:AccumulatedImpairmentMemberifrs-full:LifetimeExpectedCreditLossesMemberifrs-full:CorporateLoansMemberbcs:UpsideTwoMemberifrs-full:FinancialInstrumentsCreditimpairedMemberifrs-full:FinancialAssetsAtAmortisedCostMemberifrs-full:ExpectedCreditLossesCollectivelyAssessedMember2022-12-310000312069ifrs-full:AccumulatedImpairmentMemberifrs-full:LifetimeExpectedCreditLossesMemberifrs-full:CorporateLoansMemberifrs-full:FinancialInstrumentsCreditimpairedMemberbcs:UpsideOneMemberifrs-full:FinancialAssetsAtAmortisedCostMemberifrs-full:ExpectedCreditLossesCollectivelyAssessedMember2022-12-310000312069ifrs-full:AccumulatedImpairmentMemberifrs-full:LifetimeExpectedCreditLossesMemberifrs-full:CorporateLoansMemberifrs-full:FinancialInstrumentsCreditimpairedMemberbcs:BaselineMemberifrs-full:FinancialAssetsAtAmortisedCostMemberifrs-full:ExpectedCreditLossesCollectivelyAssessedMember2022-12-310000312069ifrs-full:AccumulatedImpairmentMemberifrs-full:LifetimeExpectedCreditLossesMemberifrs-full:CorporateLoansMemberifrs-full:FinancialInstrumentsCreditimpairedMemberifrs-full:FinancialAssetsAtAmortisedCostMemberbcs:DownsideOneMemberifrs-full:ExpectedCreditLossesCollectivelyAssessedMember2022-12-310000312069ifrs-full:AccumulatedImpairmentMemberifrs-full:LifetimeExpectedCreditLossesMemberifrs-full:CorporateLoansMemberbcs:DownsideTwoMemberifrs-full:FinancialInstrumentsCreditimpairedMemberifrs-full:FinancialAssetsAtAmortisedCostMemberifrs-full:ExpectedCreditLossesCollectivelyAssessedMember2022-12-310000312069ifrs-full:LifetimeExpectedCreditLossesMemberifrs-full:MortgagesMemberifrs-full:FinancialInstrumentsCreditimpairedMemberifrs-full:FinancialAssetsAtAmortisedCostMemberifrs-full:CreditRiskMemberifrs-full:ExpectedCreditLossesCollectivelyAssessedMember2022-12-310000312069ifrs-full:LifetimeExpectedCreditLossesMemberbcs:UpsideTwoMemberifrs-full:MortgagesMemberifrs-full:FinancialInstrumentsCreditimpairedMemberifrs-full:FinancialAssetsAtAmortisedCostMemberifrs-full:ExpectedCreditLossesCollectivelyAssessedMember2022-12-310000312069ifrs-full:LifetimeExpectedCreditLossesMemberifrs-full:MortgagesMemberifrs-full:FinancialInstrumentsCreditimpairedMemberbcs:UpsideOneMemberifrs-full:FinancialAssetsAtAmortisedCostMemberifrs-full:ExpectedCreditLossesCollectivelyAssessedMember2022-12-310000312069ifrs-full:LifetimeExpectedCreditLossesMemberifrs-full:MortgagesMemberifrs-full:FinancialInstrumentsCreditimpairedMemberbcs:BaselineMemberifrs-full:FinancialAssetsAtAmortisedCostMemberifrs-full:ExpectedCreditLossesCollectivelyAssessedMember2022-12-310000312069ifrs-full:LifetimeExpectedCreditLossesMemberifrs-full:MortgagesMemberifrs-full:FinancialInstrumentsCreditimpairedMemberifrs-full:FinancialAssetsAtAmortisedCostMemberbcs:DownsideOneMemberifrs-full:ExpectedCreditLossesCollectivelyAssessedMember2022-12-310000312069ifrs-full:LifetimeExpectedCreditLossesMemberifrs-full:MortgagesMemberbcs:DownsideTwoMemberifrs-full:FinancialInstrumentsCreditimpairedMemberifrs-full:FinancialAssetsAtAmortisedCostMemberifrs-full:ExpectedCreditLossesCollectivelyAssessedMember2022-12-310000312069bcs:CreditCardsRetailMemberifrs-full:LifetimeExpectedCreditLossesMemberifrs-full:FinancialInstrumentsCreditimpairedMemberifrs-full:FinancialAssetsAtAmortisedCostMemberifrs-full:CreditRiskMemberifrs-full:ExpectedCreditLossesCollectivelyAssessedMember2022-12-310000312069bcs:CreditCardsRetailMemberifrs-full:LifetimeExpectedCreditLossesMemberbcs:UpsideTwoMemberifrs-full:FinancialInstrumentsCreditimpairedMemberifrs-full:FinancialAssetsAtAmortisedCostMemberifrs-full:ExpectedCreditLossesCollectivelyAssessedMember2022-12-310000312069bcs:CreditCardsRetailMemberifrs-full:LifetimeExpectedCreditLossesMemberifrs-full:FinancialInstrumentsCreditimpairedMemberbcs:UpsideOneMemberifrs-full:FinancialAssetsAtAmortisedCostMemberifrs-full:ExpectedCreditLossesCollectivelyAssessedMember2022-12-310000312069bcs:CreditCardsRetailMemberifrs-full:LifetimeExpectedCreditLossesMemberifrs-full:FinancialInstrumentsCreditimpairedMemberbcs:BaselineMemberifrs-full:FinancialAssetsAtAmortisedCostMemberifrs-full:ExpectedCreditLossesCollectivelyAssessedMember2022-12-310000312069bcs:CreditCardsRetailMemberifrs-full:LifetimeExpectedCreditLossesMemberifrs-full:FinancialInstrumentsCreditimpairedMemberifrs-full:FinancialAssetsAtAmortisedCostMemberbcs:DownsideOneMemberifrs-full:ExpectedCreditLossesCollectivelyAssessedMember2022-12-310000312069bcs:CreditCardsRetailMemberifrs-full:LifetimeExpectedCreditLossesMemberbcs:DownsideTwoMemberifrs-full:FinancialInstrumentsCreditimpairedMemberifrs-full:FinancialAssetsAtAmortisedCostMemberifrs-full:ExpectedCreditLossesCollectivelyAssessedMember2022-12-310000312069ifrs-full:LifetimeExpectedCreditLossesMemberbcs:OtherRetailMemberifrs-full:FinancialInstrumentsCreditimpairedMemberifrs-full:FinancialAssetsAtAmortisedCostMemberifrs-full:CreditRiskMemberifrs-full:ExpectedCreditLossesCollectivelyAssessedMember2022-12-310000312069ifrs-full:LifetimeExpectedCreditLossesMemberbcs:UpsideTwoMemberbcs:OtherRetailMemberifrs-full:FinancialInstrumentsCreditimpairedMemberifrs-full:FinancialAssetsAtAmortisedCostMemberifrs-full:ExpectedCreditLossesCollectivelyAssessedMember2022-12-310000312069ifrs-full:LifetimeExpectedCreditLossesMemberbcs:OtherRetailMemberifrs-full:FinancialInstrumentsCreditimpairedMemberbcs:UpsideOneMemberifrs-full:FinancialAssetsAtAmortisedCostMemberifrs-full:ExpectedCreditLossesCollectivelyAssessedMember2022-12-310000312069ifrs-full:LifetimeExpectedCreditLossesMemberbcs:OtherRetailMemberifrs-full:FinancialInstrumentsCreditimpairedMemberbcs:BaselineMemberifrs-full:FinancialAssetsAtAmortisedCostMemberifrs-full:ExpectedCreditLossesCollectivelyAssessedMember2022-12-310000312069ifrs-full:LifetimeExpectedCreditLossesMemberbcs:OtherRetailMemberifrs-full:FinancialInstrumentsCreditimpairedMemberifrs-full:FinancialAssetsAtAmortisedCostMemberbcs:DownsideOneMemberifrs-full:ExpectedCreditLossesCollectivelyAssessedMember2022-12-310000312069ifrs-full:LifetimeExpectedCreditLossesMemberbcs:OtherRetailMemberbcs:DownsideTwoMemberifrs-full:FinancialInstrumentsCreditimpairedMemberifrs-full:FinancialAssetsAtAmortisedCostMemberifrs-full:ExpectedCreditLossesCollectivelyAssessedMember2022-12-310000312069ifrs-full:LifetimeExpectedCreditLossesMemberifrs-full:CorporateLoansMemberifrs-full:FinancialInstrumentsCreditimpairedMemberifrs-full:FinancialAssetsAtAmortisedCostMemberifrs-full:CreditRiskMemberifrs-full:ExpectedCreditLossesCollectivelyAssessedMember2022-12-310000312069ifrs-full:LifetimeExpectedCreditLossesMemberifrs-full:CorporateLoansMemberbcs:UpsideTwoMemberifrs-full:FinancialInstrumentsCreditimpairedMemberifrs-full:FinancialAssetsAtAmortisedCostMemberifrs-full:ExpectedCreditLossesCollectivelyAssessedMember2022-12-310000312069ifrs-full:LifetimeExpectedCreditLossesMemberifrs-full:CorporateLoansMemberifrs-full:FinancialInstrumentsCreditimpairedMemberbcs:UpsideOneMemberifrs-full:FinancialAssetsAtAmortisedCostMemberifrs-full:ExpectedCreditLossesCollectivelyAssessedMember2022-12-310000312069ifrs-full:LifetimeExpectedCreditLossesMemberifrs-full:CorporateLoansMemberifrs-full:FinancialInstrumentsCreditimpairedMemberbcs:BaselineMemberifrs-full:FinancialAssetsAtAmortisedCostMemberifrs-full:ExpectedCreditLossesCollectivelyAssessedMember2022-12-310000312069ifrs-full:LifetimeExpectedCreditLossesMemberifrs-full:CorporateLoansMemberifrs-full:FinancialInstrumentsCreditimpairedMemberifrs-full:FinancialAssetsAtAmortisedCostMemberbcs:DownsideOneMemberifrs-full:ExpectedCreditLossesCollectivelyAssessedMember2022-12-310000312069ifrs-full:LifetimeExpectedCreditLossesMemberifrs-full:CorporateLoansMemberbcs:DownsideTwoMemberifrs-full:FinancialInstrumentsCreditimpairedMemberifrs-full:FinancialAssetsAtAmortisedCostMemberifrs-full:ExpectedCreditLossesCollectivelyAssessedMember2022-12-310000312069ifrs-full:AccumulatedImpairmentMemberifrs-full:MortgagesMemberifrs-full:FinancialAssetsAtAmortisedCostMemberifrs-full:CreditRiskMemberifrs-full:ExpectedCreditLossesCollectivelyAssessedMember2022-12-310000312069ifrs-full:AccumulatedImpairmentMemberbcs:UpsideTwoMemberifrs-full:MortgagesMemberifrs-full:FinancialAssetsAtAmortisedCostMemberifrs-full:ExpectedCreditLossesCollectivelyAssessedMember2022-12-310000312069ifrs-full:AccumulatedImpairmentMemberifrs-full:MortgagesMemberbcs:UpsideOneMemberifrs-full:FinancialAssetsAtAmortisedCostMemberifrs-full:ExpectedCreditLossesCollectivelyAssessedMember2022-12-310000312069ifrs-full:AccumulatedImpairmentMemberifrs-full:MortgagesMemberbcs:BaselineMemberifrs-full:FinancialAssetsAtAmortisedCostMemberifrs-full:ExpectedCreditLossesCollectivelyAssessedMember2022-12-310000312069ifrs-full:AccumulatedImpairmentMemberifrs-full:MortgagesMemberifrs-full:FinancialAssetsAtAmortisedCostMemberbcs:DownsideOneMemberifrs-full:ExpectedCreditLossesCollectivelyAssessedMember2022-12-310000312069ifrs-full:AccumulatedImpairmentMemberifrs-full:MortgagesMemberbcs:DownsideTwoMemberifrs-full:FinancialAssetsAtAmortisedCostMemberifrs-full:ExpectedCreditLossesCollectivelyAssessedMember2022-12-310000312069bcs:CreditCardsRetailMemberifrs-full:AccumulatedImpairmentMemberifrs-full:FinancialAssetsAtAmortisedCostMemberifrs-full:CreditRiskMemberifrs-full:ExpectedCreditLossesCollectivelyAssessedMember2022-12-310000312069bcs:CreditCardsRetailMemberifrs-full:AccumulatedImpairmentMemberbcs:UpsideTwoMemberifrs-full:FinancialAssetsAtAmortisedCostMemberifrs-full:ExpectedCreditLossesCollectivelyAssessedMember2022-12-310000312069bcs:CreditCardsRetailMemberifrs-full:AccumulatedImpairmentMemberbcs:UpsideOneMemberifrs-full:FinancialAssetsAtAmortisedCostMemberifrs-full:ExpectedCreditLossesCollectivelyAssessedMember2022-12-310000312069bcs:CreditCardsRetailMemberifrs-full:AccumulatedImpairmentMemberbcs:BaselineMemberifrs-full:FinancialAssetsAtAmortisedCostMemberifrs-full:ExpectedCreditLossesCollectivelyAssessedMember2022-12-310000312069bcs:CreditCardsRetailMemberifrs-full:AccumulatedImpairmentMemberifrs-full:FinancialAssetsAtAmortisedCostMemberbcs:DownsideOneMemberifrs-full:ExpectedCreditLossesCollectivelyAssessedMember2022-12-310000312069bcs:CreditCardsRetailMemberifrs-full:AccumulatedImpairmentMemberbcs:DownsideTwoMemberifrs-full:FinancialAssetsAtAmortisedCostMemberifrs-full:ExpectedCreditLossesCollectivelyAssessedMember2022-12-310000312069ifrs-full:AccumulatedImpairmentMemberbcs:OtherRetailMemberifrs-full:FinancialAssetsAtAmortisedCostMemberifrs-full:CreditRiskMemberifrs-full:ExpectedCreditLossesCollectivelyAssessedMember2022-12-310000312069ifrs-full:AccumulatedImpairmentMemberbcs:UpsideTwoMemberbcs:OtherRetailMemberifrs-full:FinancialAssetsAtAmortisedCostMemberifrs-full:ExpectedCreditLossesCollectivelyAssessedMember2022-12-310000312069ifrs-full:AccumulatedImpairmentMemberbcs:OtherRetailMemberbcs:UpsideOneMemberifrs-full:FinancialAssetsAtAmortisedCostMemberifrs-full:ExpectedCreditLossesCollectivelyAssessedMember2022-12-310000312069ifrs-full:AccumulatedImpairmentMemberbcs:OtherRetailMemberbcs:BaselineMemberifrs-full:FinancialAssetsAtAmortisedCostMemberifrs-full:ExpectedCreditLossesCollectivelyAssessedMember2022-12-310000312069ifrs-full:AccumulatedImpairmentMemberbcs:OtherRetailMemberifrs-full:FinancialAssetsAtAmortisedCostMemberbcs:DownsideOneMemberifrs-full:ExpectedCreditLossesCollectivelyAssessedMember2022-12-310000312069ifrs-full:AccumulatedImpairmentMemberbcs:OtherRetailMemberbcs:DownsideTwoMemberifrs-full:FinancialAssetsAtAmortisedCostMemberifrs-full:ExpectedCreditLossesCollectivelyAssessedMember2022-12-310000312069ifrs-full:AccumulatedImpairmentMemberifrs-full:CorporateLoansMemberifrs-full:FinancialAssetsAtAmortisedCostMemberifrs-full:CreditRiskMemberifrs-full:ExpectedCreditLossesCollectivelyAssessedMember2022-12-310000312069ifrs-full:AccumulatedImpairmentMemberifrs-full:CorporateLoansMemberbcs:UpsideTwoMemberifrs-full:FinancialAssetsAtAmortisedCostMemberifrs-full:ExpectedCreditLossesCollectivelyAssessedMember2022-12-310000312069ifrs-full:AccumulatedImpairmentMemberifrs-full:CorporateLoansMemberbcs:UpsideOneMemberifrs-full:FinancialAssetsAtAmortisedCostMemberifrs-full:ExpectedCreditLossesCollectivelyAssessedMember2022-12-310000312069ifrs-full:AccumulatedImpairmentMemberifrs-full:CorporateLoansMemberbcs:BaselineMemberifrs-full:FinancialAssetsAtAmortisedCostMemberifrs-full:ExpectedCreditLossesCollectivelyAssessedMember2022-12-310000312069ifrs-full:AccumulatedImpairmentMemberifrs-full:CorporateLoansMemberifrs-full:FinancialAssetsAtAmortisedCostMemberbcs:DownsideOneMemberifrs-full:ExpectedCreditLossesCollectivelyAssessedMember2022-12-310000312069ifrs-full:AccumulatedImpairmentMemberifrs-full:CorporateLoansMemberbcs:DownsideTwoMemberifrs-full:FinancialAssetsAtAmortisedCostMemberifrs-full:ExpectedCreditLossesCollectivelyAssessedMember2022-12-310000312069ifrs-full:AccumulatedImpairmentMemberifrs-full:FinancialAssetsAtAmortisedCostMemberifrs-full:CreditRiskMemberifrs-full:ExpectedCreditLossesCollectivelyAssessedMemberifrs-full:LoansAndReceivablesCategoryMember2022-12-310000312069ifrs-full:AccumulatedImpairmentMemberbcs:UpsideTwoMemberifrs-full:FinancialAssetsAtAmortisedCostMemberifrs-full:ExpectedCreditLossesCollectivelyAssessedMemberifrs-full:LoansAndReceivablesCategoryMember2022-12-310000312069ifrs-full:AccumulatedImpairmentMemberbcs:UpsideOneMemberifrs-full:FinancialAssetsAtAmortisedCostMemberifrs-full:ExpectedCreditLossesCollectivelyAssessedMemberifrs-full:LoansAndReceivablesCategoryMember2022-12-310000312069ifrs-full:AccumulatedImpairmentMemberbcs:BaselineMemberifrs-full:FinancialAssetsAtAmortisedCostMemberifrs-full:ExpectedCreditLossesCollectivelyAssessedMemberifrs-full:LoansAndReceivablesCategoryMember2022-12-310000312069ifrs-full:AccumulatedImpairmentMemberifrs-full:FinancialAssetsAtAmortisedCostMemberbcs:DownsideOneMemberifrs-full:ExpectedCreditLossesCollectivelyAssessedMemberifrs-full:LoansAndReceivablesCategoryMember2022-12-310000312069ifrs-full:AccumulatedImpairmentMemberbcs:DownsideTwoMemberifrs-full:FinancialAssetsAtAmortisedCostMemberifrs-full:ExpectedCreditLossesCollectivelyAssessedMemberifrs-full:LoansAndReceivablesCategoryMember2022-12-310000312069ifrs-full:AccumulatedImpairmentMemberifrs-full:ExpectedCreditLossesCollectivelyAssessedMember2022-12-310000312069ifrs-full:AccumulatedImpairmentMemberifrs-full:ExpectedCreditLossesIndividuallyAssessedMember2022-12-310000312069ifrs-full:AccumulatedImpairmentMemberbcs:ECLFromNonModelledExposuresAndOthersMember2022-12-310000312069ifrs-full:AccumulatedImpairmentMemberbcs:ECLFromDebtSecuritiesAtAmortisedCostMember2022-12-310000312069ifrs-full:AccumulatedImpairmentMemberbcs:ECLFromPostModelManagementAdjustmentsMember2022-12-310000312069ifrs-full:AccumulatedImpairmentMemberbcs:ECLFromPostModelManagementAdjustmentsEconomicUncertaintyAdjustmentsMember2022-12-310000312069ifrs-full:AccumulatedImpairmentMember2022-12-310000312069ifrs-full:CountryOfDomicileMemberifrs-full:FinancialAssetsAtAmortisedCostMemberifrs-full:LoansAndReceivablesCategoryMemberbcs:AgricultureFoodAndForestProductsMember2023-12-310000312069ifrs-full:FinancialAssetsAtAmortisedCostMembersrt:AmericasMemberifrs-full:LoansAndReceivablesCategoryMemberbcs:AgricultureFoodAndForestProductsMember2023-12-310000312069srt:EuropeMemberifrs-full:FinancialAssetsAtAmortisedCostMemberifrs-full:LoansAndReceivablesCategoryMemberbcs:AgricultureFoodAndForestProductsMember2023-12-310000312069bcs:OtherRegionsMemberifrs-full:FinancialAssetsAtAmortisedCostMemberifrs-full:LoansAndReceivablesCategoryMemberbcs:AgricultureFoodAndForestProductsMember2023-12-310000312069ifrs-full:FinancialAssetsAtAmortisedCostMemberifrs-full:LoansAndReceivablesCategoryMemberbcs:AgricultureFoodAndForestProductsMember2023-12-310000312069ifrs-full:FinancialAssetsAtAmortisedCostMemberifrs-full:LoansAndReceivablesCategoryMemberifrs-full:TwelvemonthExpectedCreditLossesMemberbcs:AgricultureFoodAndForestProductsMember2023-12-310000312069ifrs-full:LifetimeExpectedCreditLossesMemberifrs-full:FinancialAssetsAtAmortisedCostMemberifrs-full:LoansAndReceivablesCategoryMemberifrs-full:FinancialInstrumentsNotCreditimpairedMemberbcs:AgricultureFoodAndForestProductsMember2023-12-310000312069ifrs-full:LifetimeExpectedCreditLossesMemberifrs-full:FinancialInstrumentsCreditimpairedMemberifrs-full:FinancialAssetsAtAmortisedCostMemberifrs-full:LoansAndReceivablesCategoryMemberbcs:AgricultureFoodAndForestProductsMember2023-12-310000312069ifrs-full:CountryOfDomicileMemberbcs:MiningAndQuarryingMemberifrs-full:FinancialAssetsAtAmortisedCostMemberifrs-full:LoansAndReceivablesCategoryMember2023-12-310000312069bcs:MiningAndQuarryingMemberifrs-full:FinancialAssetsAtAmortisedCostMembersrt:AmericasMemberifrs-full:LoansAndReceivablesCategoryMember2023-12-310000312069bcs:MiningAndQuarryingMembersrt:EuropeMemberifrs-full:FinancialAssetsAtAmortisedCostMemberifrs-full:LoansAndReceivablesCategoryMember2023-12-310000312069bcs:MiningAndQuarryingMemberbcs:OtherRegionsMemberifrs-full:FinancialAssetsAtAmortisedCostMemberifrs-full:LoansAndReceivablesCategoryMember2023-12-310000312069bcs:MiningAndQuarryingMemberifrs-full:FinancialAssetsAtAmortisedCostMemberifrs-full:LoansAndReceivablesCategoryMember2023-12-310000312069bcs:MiningAndQuarryingMemberifrs-full:FinancialAssetsAtAmortisedCostMemberifrs-full:LoansAndReceivablesCategoryMemberifrs-full:TwelvemonthExpectedCreditLossesMember2023-12-310000312069ifrs-full:LifetimeExpectedCreditLossesMemberbcs:MiningAndQuarryingMemberifrs-full:FinancialAssetsAtAmortisedCostMemberifrs-full:LoansAndReceivablesCategoryMemberifrs-full:FinancialInstrumentsNotCreditimpairedMember2023-12-310000312069ifrs-full:LifetimeExpectedCreditLossesMemberbcs:MiningAndQuarryingMemberifrs-full:FinancialInstrumentsCreditimpairedMemberifrs-full:FinancialAssetsAtAmortisedCostMemberifrs-full:LoansAndReceivablesCategoryMember2023-12-310000312069ifrs-full:CountryOfDomicileMemberifrs-full:FinancialAssetsAtAmortisedCostMemberifrs-full:LoansAndReceivablesCategoryMemberbcs:ManufacturingMember2023-12-310000312069ifrs-full:FinancialAssetsAtAmortisedCostMembersrt:AmericasMemberifrs-full:LoansAndReceivablesCategoryMemberbcs:ManufacturingMember2023-12-310000312069srt:EuropeMemberifrs-full:FinancialAssetsAtAmortisedCostMemberifrs-full:LoansAndReceivablesCategoryMemberbcs:ManufacturingMember2023-12-310000312069bcs:OtherRegionsMemberifrs-full:FinancialAssetsAtAmortisedCostMemberifrs-full:LoansAndReceivablesCategoryMemberbcs:ManufacturingMember2023-12-310000312069ifrs-full:FinancialAssetsAtAmortisedCostMemberifrs-full:LoansAndReceivablesCategoryMemberbcs:ManufacturingMember2023-12-310000312069ifrs-full:FinancialAssetsAtAmortisedCostMemberifrs-full:LoansAndReceivablesCategoryMemberbcs:ManufacturingMemberifrs-full:TwelvemonthExpectedCreditLossesMember2023-12-310000312069ifrs-full:LifetimeExpectedCreditLossesMemberifrs-full:FinancialAssetsAtAmortisedCostMemberbcs:ManufacturingMemberifrs-full:LoansAndReceivablesCategoryMemberifrs-full:FinancialInstrumentsNotCreditimpairedMember2023-12-310000312069ifrs-full:LifetimeExpectedCreditLossesMemberifrs-full:FinancialInstrumentsCreditimpairedMemberifrs-full:FinancialAssetsAtAmortisedCostMemberbcs:ManufacturingMemberifrs-full:LoansAndReceivablesCategoryMember2023-12-310000312069ifrs-full:CountryOfDomicileMemberifrs-full:FinancialAssetsAtAmortisedCostMemberbcs:GovernmentAndCentralBankMemberifrs-full:LoansAndReceivablesCategoryMember2023-12-310000312069ifrs-full:FinancialAssetsAtAmortisedCostMembersrt:AmericasMemberbcs:GovernmentAndCentralBankMemberifrs-full:LoansAndReceivablesCategoryMember2023-12-310000312069srt:EuropeMemberifrs-full:FinancialAssetsAtAmortisedCostMemberbcs:GovernmentAndCentralBankMemberifrs-full:LoansAndReceivablesCategoryMember2023-12-310000312069bcs:OtherRegionsMemberifrs-full:FinancialAssetsAtAmortisedCostMemberbcs:GovernmentAndCentralBankMemberifrs-full:LoansAndReceivablesCategoryMember2023-12-310000312069ifrs-full:FinancialAssetsAtAmortisedCostMemberbcs:GovernmentAndCentralBankMemberifrs-full:LoansAndReceivablesCategoryMember2023-12-310000312069ifrs-full:FinancialAssetsAtAmortisedCostMemberbcs:GovernmentAndCentralBankMemberifrs-full:LoansAndReceivablesCategoryMemberifrs-full:TwelvemonthExpectedCreditLossesMember2023-12-310000312069ifrs-full:LifetimeExpectedCreditLossesMemberifrs-full:FinancialAssetsAtAmortisedCostMemberbcs:GovernmentAndCentralBankMemberifrs-full:LoansAndReceivablesCategoryMemberifrs-full:FinancialInstrumentsNotCreditimpairedMember2023-12-310000312069ifrs-full:LifetimeExpectedCreditLossesMemberifrs-full:FinancialInstrumentsCreditimpairedMemberifrs-full:FinancialAssetsAtAmortisedCostMemberbcs:GovernmentAndCentralBankMemberifrs-full:LoansAndReceivablesCategoryMember2023-12-310000312069ifrs-full:CountryOfDomicileMemberifrs-full:FinancialAssetsAtAmortisedCostMemberbcs:BanksMemberifrs-full:LoansAndReceivablesCategoryMember2023-12-310000312069ifrs-full:FinancialAssetsAtAmortisedCostMemberbcs:BanksMembersrt:AmericasMemberifrs-full:LoansAndReceivablesCategoryMember2023-12-310000312069srt:EuropeMemberifrs-full:FinancialAssetsAtAmortisedCostMemberbcs:BanksMemberifrs-full:LoansAndReceivablesCategoryMember2023-12-310000312069bcs:OtherRegionsMemberifrs-full:FinancialAssetsAtAmortisedCostMemberbcs:BanksMemberifrs-full:LoansAndReceivablesCategoryMember2023-12-310000312069ifrs-full:FinancialAssetsAtAmortisedCostMemberbcs:BanksMemberifrs-full:LoansAndReceivablesCategoryMember2023-12-310000312069ifrs-full:FinancialAssetsAtAmortisedCostMemberbcs:BanksMemberifrs-full:LoansAndReceivablesCategoryMemberifrs-full:TwelvemonthExpectedCreditLossesMember2023-12-310000312069ifrs-full:LifetimeExpectedCreditLossesMemberbcs:BanksMemberifrs-full:FinancialAssetsAtAmortisedCostMemberifrs-full:LoansAndReceivablesCategoryMemberifrs-full:FinancialInstrumentsNotCreditimpairedMember2023-12-310000312069ifrs-full:LifetimeExpectedCreditLossesMemberifrs-full:FinancialInstrumentsCreditimpairedMemberbcs:BanksMemberifrs-full:FinancialAssetsAtAmortisedCostMemberifrs-full:LoansAndReceivablesCategoryMember2023-12-310000312069ifrs-full:CountryOfDomicileMemberifrs-full:FinancialAssetsAtAmortisedCostMemberbcs:EnergyAndWaterMemberifrs-full:LoansAndReceivablesCategoryMember2023-12-310000312069ifrs-full:FinancialAssetsAtAmortisedCostMemberbcs:EnergyAndWaterMembersrt:AmericasMemberifrs-full:LoansAndReceivablesCategoryMember2023-12-310000312069srt:EuropeMemberifrs-full:FinancialAssetsAtAmortisedCostMemberbcs:EnergyAndWaterMemberifrs-full:LoansAndReceivablesCategoryMember2023-12-310000312069bcs:OtherRegionsMemberifrs-full:FinancialAssetsAtAmortisedCostMemberbcs:EnergyAndWaterMemberifrs-full:LoansAndReceivablesCategoryMember2023-12-310000312069ifrs-full:FinancialAssetsAtAmortisedCostMemberbcs:EnergyAndWaterMemberifrs-full:LoansAndReceivablesCategoryMember2023-12-310000312069ifrs-full:FinancialAssetsAtAmortisedCostMemberbcs:EnergyAndWaterMemberifrs-full:LoansAndReceivablesCategoryMemberifrs-full:TwelvemonthExpectedCreditLossesMember2023-12-310000312069ifrs-full:LifetimeExpectedCreditLossesMemberbcs:EnergyAndWaterMemberifrs-full:FinancialAssetsAtAmortisedCostMemberifrs-full:LoansAndReceivablesCategoryMemberifrs-full:FinancialInstrumentsNotCreditimpairedMember2023-12-310000312069ifrs-full:LifetimeExpectedCreditLossesMemberifrs-full:FinancialInstrumentsCreditimpairedMemberbcs:EnergyAndWaterMemberifrs-full:FinancialAssetsAtAmortisedCostMemberifrs-full:LoansAndReceivablesCategoryMember2023-12-310000312069ifrs-full:CountryOfDomicileMemberifrs-full:FinancialAssetsAtAmortisedCostMemberifrs-full:LoansAndReceivablesCategoryMemberbcs:MaterialsAndBuildingMember2023-12-310000312069ifrs-full:FinancialAssetsAtAmortisedCostMembersrt:AmericasMemberifrs-full:LoansAndReceivablesCategoryMemberbcs:MaterialsAndBuildingMember2023-12-310000312069srt:EuropeMemberifrs-full:FinancialAssetsAtAmortisedCostMemberifrs-full:LoansAndReceivablesCategoryMemberbcs:MaterialsAndBuildingMember2023-12-310000312069bcs:OtherRegionsMemberifrs-full:FinancialAssetsAtAmortisedCostMemberifrs-full:LoansAndReceivablesCategoryMemberbcs:MaterialsAndBuildingMember2023-12-310000312069ifrs-full:FinancialAssetsAtAmortisedCostMemberifrs-full:LoansAndReceivablesCategoryMemberbcs:MaterialsAndBuildingMember2023-12-310000312069ifrs-full:FinancialAssetsAtAmortisedCostMemberifrs-full:LoansAndReceivablesCategoryMemberbcs:MaterialsAndBuildingMemberifrs-full:TwelvemonthExpectedCreditLossesMember2023-12-310000312069ifrs-full:LifetimeExpectedCreditLossesMemberifrs-full:FinancialAssetsAtAmortisedCostMemberifrs-full:LoansAndReceivablesCategoryMemberbcs:MaterialsAndBuildingMemberifrs-full:FinancialInstrumentsNotCreditimpairedMember2023-12-310000312069ifrs-full:LifetimeExpectedCreditLossesMemberifrs-full:FinancialInstrumentsCreditimpairedMemberifrs-full:FinancialAssetsAtAmortisedCostMemberifrs-full:LoansAndReceivablesCategoryMemberbcs:MaterialsAndBuildingMember2023-12-310000312069ifrs-full:CountryOfDomicileMemberifrs-full:FinancialAssetsAtAmortisedCostMemberbcs:WholesaleAndRetailDistributionAndLeisureMemberifrs-full:LoansAndReceivablesCategoryMember2023-12-310000312069ifrs-full:FinancialAssetsAtAmortisedCostMemberbcs:WholesaleAndRetailDistributionAndLeisureMembersrt:AmericasMemberifrs-full:LoansAndReceivablesCategoryMember2023-12-310000312069srt:EuropeMemberifrs-full:FinancialAssetsAtAmortisedCostMemberbcs:WholesaleAndRetailDistributionAndLeisureMemberifrs-full:LoansAndReceivablesCategoryMember2023-12-310000312069bcs:OtherRegionsMemberifrs-full:FinancialAssetsAtAmortisedCostMemberbcs:WholesaleAndRetailDistributionAndLeisureMemberifrs-full:LoansAndReceivablesCategoryMember2023-12-310000312069ifrs-full:FinancialAssetsAtAmortisedCostMemberbcs:WholesaleAndRetailDistributionAndLeisureMemberifrs-full:LoansAndReceivablesCategoryMember2023-12-310000312069ifrs-full:FinancialAssetsAtAmortisedCostMemberbcs:WholesaleAndRetailDistributionAndLeisureMemberifrs-full:LoansAndReceivablesCategoryMemberifrs-full:TwelvemonthExpectedCreditLossesMember2023-12-310000312069ifrs-full:LifetimeExpectedCreditLossesMemberbcs:WholesaleAndRetailDistributionAndLeisureMemberifrs-full:FinancialAssetsAtAmortisedCostMemberifrs-full:LoansAndReceivablesCategoryMemberifrs-full:FinancialInstrumentsNotCreditimpairedMember2023-12-310000312069ifrs-full:LifetimeExpectedCreditLossesMemberifrs-full:FinancialInstrumentsCreditimpairedMemberbcs:WholesaleAndRetailDistributionAndLeisureMemberifrs-full:FinancialAssetsAtAmortisedCostMemberifrs-full:LoansAndReceivablesCategoryMember2023-12-310000312069ifrs-full:CountryOfDomicileMemberifrs-full:FinancialAssetsAtAmortisedCostMemberifrs-full:LoansAndReceivablesCategoryMemberbcs:TransportAndStorageMember2023-12-310000312069ifrs-full:FinancialAssetsAtAmortisedCostMembersrt:AmericasMemberifrs-full:LoansAndReceivablesCategoryMemberbcs:TransportAndStorageMember2023-12-310000312069srt:EuropeMemberifrs-full:FinancialAssetsAtAmortisedCostMemberifrs-full:LoansAndReceivablesCategoryMemberbcs:TransportAndStorageMember2023-12-310000312069bcs:OtherRegionsMemberifrs-full:FinancialAssetsAtAmortisedCostMemberifrs-full:LoansAndReceivablesCategoryMemberbcs:TransportAndStorageMember2023-12-310000312069ifrs-full:FinancialAssetsAtAmortisedCostMemberifrs-full:LoansAndReceivablesCategoryMemberbcs:TransportAndStorageMember2023-12-310000312069ifrs-full:FinancialAssetsAtAmortisedCostMemberifrs-full:LoansAndReceivablesCategoryMemberbcs:TransportAndStorageMemberifrs-full:TwelvemonthExpectedCreditLossesMember2023-12-310000312069ifrs-full:LifetimeExpectedCreditLossesMemberifrs-full:FinancialAssetsAtAmortisedCostMemberbcs:TransportAndStorageMemberifrs-full:LoansAndReceivablesCategoryMemberifrs-full:FinancialInstrumentsNotCreditimpairedMember2023-12-310000312069ifrs-full:LifetimeExpectedCreditLossesMemberifrs-full:FinancialInstrumentsCreditimpairedMemberifrs-full:FinancialAssetsAtAmortisedCostMemberbcs:TransportAndStorageMemberifrs-full:LoansAndReceivablesCategoryMember2023-12-310000312069ifrs-full:CountryOfDomicileMemberbcs:HomeLoansMemberifrs-full:FinancialAssetsAtAmortisedCostMemberifrs-full:LoansAndReceivablesCategoryMember2023-12-310000312069bcs:HomeLoansMemberifrs-full:FinancialAssetsAtAmortisedCostMembersrt:AmericasMemberifrs-full:LoansAndReceivablesCategoryMember2023-12-310000312069srt:EuropeMemberbcs:HomeLoansMemberifrs-full:FinancialAssetsAtAmortisedCostMemberifrs-full:LoansAndReceivablesCategoryMember2023-12-310000312069bcs:HomeLoansMemberbcs:OtherRegionsMemberifrs-full:FinancialAssetsAtAmortisedCostMemberifrs-full:LoansAndReceivablesCategoryMember2023-12-310000312069bcs:HomeLoansMemberifrs-full:FinancialAssetsAtAmortisedCostMemberifrs-full:LoansAndReceivablesCategoryMember2023-12-310000312069bcs:HomeLoansMemberifrs-full:FinancialAssetsAtAmortisedCostMemberifrs-full:LoansAndReceivablesCategoryMemberifrs-full:TwelvemonthExpectedCreditLossesMember2023-12-310000312069ifrs-full:LifetimeExpectedCreditLossesMemberbcs:HomeLoansMemberifrs-full:FinancialAssetsAtAmortisedCostMemberifrs-full:LoansAndReceivablesCategoryMemberifrs-full:FinancialInstrumentsNotCreditimpairedMember2023-12-310000312069ifrs-full:LifetimeExpectedCreditLossesMemberbcs:HomeLoansMemberifrs-full:FinancialInstrumentsCreditimpairedMemberifrs-full:FinancialAssetsAtAmortisedCostMemberifrs-full:LoansAndReceivablesCategoryMember2023-12-310000312069bcs:BusinessAndOtherServicesMemberifrs-full:CountryOfDomicileMemberifrs-full:FinancialAssetsAtAmortisedCostMemberifrs-full:LoansAndReceivablesCategoryMember2023-12-310000312069bcs:BusinessAndOtherServicesMemberifrs-full:FinancialAssetsAtAmortisedCostMembersrt:AmericasMemberifrs-full:LoansAndReceivablesCategoryMember2023-12-310000312069bcs:BusinessAndOtherServicesMembersrt:EuropeMemberifrs-full:FinancialAssetsAtAmortisedCostMemberifrs-full:LoansAndReceivablesCategoryMember2023-12-310000312069bcs:BusinessAndOtherServicesMemberbcs:OtherRegionsMemberifrs-full:FinancialAssetsAtAmortisedCostMemberifrs-full:LoansAndReceivablesCategoryMember2023-12-310000312069bcs:BusinessAndOtherServicesMemberifrs-full:FinancialAssetsAtAmortisedCostMemberifrs-full:LoansAndReceivablesCategoryMember2023-12-310000312069bcs:BusinessAndOtherServicesMemberifrs-full:FinancialAssetsAtAmortisedCostMemberifrs-full:LoansAndReceivablesCategoryMemberifrs-full:TwelvemonthExpectedCreditLossesMember2023-12-310000312069bcs:BusinessAndOtherServicesMemberifrs-full:LifetimeExpectedCreditLossesMemberifrs-full:FinancialAssetsAtAmortisedCostMemberifrs-full:LoansAndReceivablesCategoryMemberifrs-full:FinancialInstrumentsNotCreditimpairedMember2023-12-310000312069bcs:BusinessAndOtherServicesMemberifrs-full:LifetimeExpectedCreditLossesMemberifrs-full:FinancialInstrumentsCreditimpairedMemberifrs-full:FinancialAssetsAtAmortisedCostMemberifrs-full:LoansAndReceivablesCategoryMember2023-12-310000312069ifrs-full:CountryOfDomicileMemberifrs-full:FinancialAssetsAtAmortisedCostMemberifrs-full:LoansAndReceivablesCategoryMemberbcs:OtherFinancialInstitutionsMember2023-12-310000312069ifrs-full:FinancialAssetsAtAmortisedCostMembersrt:AmericasMemberifrs-full:LoansAndReceivablesCategoryMemberbcs:OtherFinancialInstitutionsMember2023-12-310000312069srt:EuropeMemberifrs-full:FinancialAssetsAtAmortisedCostMemberifrs-full:LoansAndReceivablesCategoryMemberbcs:OtherFinancialInstitutionsMember2023-12-310000312069bcs:OtherRegionsMemberifrs-full:FinancialAssetsAtAmortisedCostMemberifrs-full:LoansAndReceivablesCategoryMemberbcs:OtherFinancialInstitutionsMember2023-12-310000312069ifrs-full:FinancialAssetsAtAmortisedCostMemberifrs-full:LoansAndReceivablesCategoryMemberbcs:OtherFinancialInstitutionsMember2023-12-310000312069ifrs-full:FinancialAssetsAtAmortisedCostMemberifrs-full:LoansAndReceivablesCategoryMemberbcs:OtherFinancialInstitutionsMemberifrs-full:TwelvemonthExpectedCreditLossesMember2023-12-310000312069ifrs-full:LifetimeExpectedCreditLossesMemberifrs-full:FinancialAssetsAtAmortisedCostMemberifrs-full:LoansAndReceivablesCategoryMemberbcs:OtherFinancialInstitutionsMemberifrs-full:FinancialInstrumentsNotCreditimpairedMember2023-12-310000312069ifrs-full:LifetimeExpectedCreditLossesMemberifrs-full:FinancialInstrumentsCreditimpairedMemberifrs-full:FinancialAssetsAtAmortisedCostMemberifrs-full:LoansAndReceivablesCategoryMemberbcs:OtherFinancialInstitutionsMember2023-12-310000312069bcs:CardsUnsecuredLoansAndOtherPersonalLendingMemberifrs-full:CountryOfDomicileMemberifrs-full:FinancialAssetsAtAmortisedCostMemberifrs-full:LoansAndReceivablesCategoryMember2023-12-310000312069bcs:CardsUnsecuredLoansAndOtherPersonalLendingMemberifrs-full:FinancialAssetsAtAmortisedCostMembersrt:AmericasMemberifrs-full:LoansAndReceivablesCategoryMember2023-12-310000312069bcs:CardsUnsecuredLoansAndOtherPersonalLendingMembersrt:EuropeMemberifrs-full:FinancialAssetsAtAmortisedCostMemberifrs-full:LoansAndReceivablesCategoryMember2023-12-310000312069bcs:CardsUnsecuredLoansAndOtherPersonalLendingMemberbcs:OtherRegionsMemberifrs-full:FinancialAssetsAtAmortisedCostMemberifrs-full:LoansAndReceivablesCategoryMember2023-12-310000312069bcs:CardsUnsecuredLoansAndOtherPersonalLendingMemberifrs-full:FinancialAssetsAtAmortisedCostMemberifrs-full:LoansAndReceivablesCategoryMember2023-12-310000312069bcs:CardsUnsecuredLoansAndOtherPersonalLendingMemberifrs-full:FinancialAssetsAtAmortisedCostMemberifrs-full:LoansAndReceivablesCategoryMemberifrs-full:TwelvemonthExpectedCreditLossesMember2023-12-310000312069bcs:CardsUnsecuredLoansAndOtherPersonalLendingMemberifrs-full:LifetimeExpectedCreditLossesMemberifrs-full:FinancialAssetsAtAmortisedCostMemberifrs-full:LoansAndReceivablesCategoryMemberifrs-full:FinancialInstrumentsNotCreditimpairedMember2023-12-310000312069bcs:CardsUnsecuredLoansAndOtherPersonalLendingMemberifrs-full:LifetimeExpectedCreditLossesMemberifrs-full:FinancialInstrumentsCreditimpairedMemberifrs-full:FinancialAssetsAtAmortisedCostMemberifrs-full:LoansAndReceivablesCategoryMember2023-12-310000312069ifrs-full:CountryOfDomicileMemberifrs-full:FinancialAssetsAtAmortisedCostMemberifrs-full:LoansAndReceivablesCategoryMember2023-12-310000312069ifrs-full:FinancialAssetsAtAmortisedCostMembersrt:AmericasMemberifrs-full:LoansAndReceivablesCategoryMember2023-12-310000312069srt:EuropeMemberifrs-full:FinancialAssetsAtAmortisedCostMemberifrs-full:LoansAndReceivablesCategoryMember2023-12-310000312069bcs:OtherRegionsMemberifrs-full:FinancialAssetsAtAmortisedCostMemberifrs-full:LoansAndReceivablesCategoryMember2023-12-310000312069ifrs-full:CountryOfDomicileMemberifrs-full:DebtSecuritiesMemberifrs-full:FinancialAssetsAtAmortisedCostMember2023-12-310000312069ifrs-full:DebtSecuritiesMemberifrs-full:FinancialAssetsAtAmortisedCostMembersrt:AmericasMember2023-12-310000312069ifrs-full:DebtSecuritiesMembersrt:EuropeMemberifrs-full:FinancialAssetsAtAmortisedCostMember2023-12-310000312069ifrs-full:DebtSecuritiesMemberbcs:OtherRegionsMemberifrs-full:FinancialAssetsAtAmortisedCostMember2023-12-310000312069ifrs-full:CountryOfDomicileMemberbcs:LoansAndAdvancesAtAmortisedCostIncludingDebtSecuritiesMember2023-12-310000312069bcs:LoansAndAdvancesAtAmortisedCostIncludingDebtSecuritiesMembersrt:AmericasMember2023-12-310000312069srt:EuropeMemberbcs:LoansAndAdvancesAtAmortisedCostIncludingDebtSecuritiesMember2023-12-310000312069bcs:OtherRegionsMemberbcs:LoansAndAdvancesAtAmortisedCostIncludingDebtSecuritiesMember2023-12-310000312069ifrs-full:CountryOfDomicileMemberifrs-full:GrossCarryingAmountMemberifrs-full:ItemsOfContingentLiabilitiesMemberbcs:OffBalanceSheetLoanCommitmentsAndFinancialGuaranteeContractsMember2023-12-310000312069srt:AmericasMemberifrs-full:GrossCarryingAmountMemberifrs-full:ItemsOfContingentLiabilitiesMemberbcs:OffBalanceSheetLoanCommitmentsAndFinancialGuaranteeContractsMember2023-12-310000312069srt:EuropeMemberifrs-full:GrossCarryingAmountMemberifrs-full:ItemsOfContingentLiabilitiesMemberbcs:OffBalanceSheetLoanCommitmentsAndFinancialGuaranteeContractsMember2023-12-310000312069bcs:OtherRegionsMemberifrs-full:GrossCarryingAmountMemberifrs-full:ItemsOfContingentLiabilitiesMemberbcs:OffBalanceSheetLoanCommitmentsAndFinancialGuaranteeContractsMember2023-12-310000312069ifrs-full:GrossCarryingAmountMemberifrs-full:ItemsOfContingentLiabilitiesMemberbcs:OffBalanceSheetLoanCommitmentsAndFinancialGuaranteeContractsMember2023-12-310000312069ifrs-full:GrossCarryingAmountMemberifrs-full:ItemsOfContingentLiabilitiesMemberifrs-full:TwelvemonthExpectedCreditLossesMemberbcs:OffBalanceSheetLoanCommitmentsAndFinancialGuaranteeContractsMember2023-12-310000312069ifrs-full:LifetimeExpectedCreditLossesMemberifrs-full:GrossCarryingAmountMemberifrs-full:FinancialInstrumentsNotCreditimpairedMemberifrs-full:ItemsOfContingentLiabilitiesMemberbcs:OffBalanceSheetLoanCommitmentsAndFinancialGuaranteeContractsMember2023-12-310000312069ifrs-full:LifetimeExpectedCreditLossesMemberifrs-full:FinancialInstrumentsCreditimpairedMemberifrs-full:GrossCarryingAmountMemberifrs-full:ItemsOfContingentLiabilitiesMemberbcs:OffBalanceSheetLoanCommitmentsAndFinancialGuaranteeContractsMember2023-12-310000312069ifrs-full:CountryOfDomicileMemberifrs-full:LoanCommitmentsMemberifrs-full:GrossCarryingAmountMemberbcs:OffBalanceSheetLoanCommitmentsAndFinancialGuaranteeContractsMember2023-12-310000312069ifrs-full:LoanCommitmentsMembersrt:AmericasMemberifrs-full:GrossCarryingAmountMemberbcs:OffBalanceSheetLoanCommitmentsAndFinancialGuaranteeContractsMember2023-12-310000312069srt:EuropeMemberifrs-full:LoanCommitmentsMemberifrs-full:GrossCarryingAmountMemberbcs:OffBalanceSheetLoanCommitmentsAndFinancialGuaranteeContractsMember2023-12-310000312069bcs:OtherRegionsMemberifrs-full:LoanCommitmentsMemberifrs-full:GrossCarryingAmountMemberbcs:OffBalanceSheetLoanCommitmentsAndFinancialGuaranteeContractsMember2023-12-310000312069ifrs-full:LoanCommitmentsMemberifrs-full:GrossCarryingAmountMemberbcs:OffBalanceSheetLoanCommitmentsAndFinancialGuaranteeContractsMember2023-12-310000312069ifrs-full:LoanCommitmentsMemberifrs-full:GrossCarryingAmountMemberifrs-full:TwelvemonthExpectedCreditLossesMemberbcs:OffBalanceSheetLoanCommitmentsAndFinancialGuaranteeContractsMember2023-12-310000312069ifrs-full:LifetimeExpectedCreditLossesMemberifrs-full:LoanCommitmentsMemberifrs-full:GrossCarryingAmountMemberifrs-full:FinancialInstrumentsNotCreditimpairedMemberbcs:OffBalanceSheetLoanCommitmentsAndFinancialGuaranteeContractsMember2023-12-310000312069ifrs-full:LifetimeExpectedCreditLossesMemberifrs-full:FinancialInstrumentsCreditimpairedMemberifrs-full:LoanCommitmentsMemberifrs-full:GrossCarryingAmountMemberbcs:OffBalanceSheetLoanCommitmentsAndFinancialGuaranteeContractsMember2023-12-310000312069ifrs-full:CountryOfDomicileMemberifrs-full:GrossCarryingAmountMemberbcs:OffBalanceSheetLoanCommitmentsAndFinancialGuaranteeContractsMember2023-12-310000312069srt:AmericasMemberifrs-full:GrossCarryingAmountMemberbcs:OffBalanceSheetLoanCommitmentsAndFinancialGuaranteeContractsMember2023-12-310000312069srt:EuropeMemberifrs-full:GrossCarryingAmountMemberbcs:OffBalanceSheetLoanCommitmentsAndFinancialGuaranteeContractsMember2023-12-310000312069bcs:OtherRegionsMemberifrs-full:GrossCarryingAmountMemberbcs:OffBalanceSheetLoanCommitmentsAndFinancialGuaranteeContractsMember2023-12-310000312069ifrs-full:CountryOfDomicileMemberifrs-full:FinancialAssetsAtAmortisedCostMemberifrs-full:LoansAndReceivablesCategoryMemberbcs:AgricultureFoodAndForestProductsMember2022-12-310000312069ifrs-full:FinancialAssetsAtAmortisedCostMembersrt:AmericasMemberifrs-full:LoansAndReceivablesCategoryMemberbcs:AgricultureFoodAndForestProductsMember2022-12-310000312069srt:EuropeMemberifrs-full:FinancialAssetsAtAmortisedCostMemberifrs-full:LoansAndReceivablesCategoryMemberbcs:AgricultureFoodAndForestProductsMember2022-12-310000312069bcs:OtherRegionsMemberifrs-full:FinancialAssetsAtAmortisedCostMemberifrs-full:LoansAndReceivablesCategoryMemberbcs:AgricultureFoodAndForestProductsMember2022-12-310000312069ifrs-full:FinancialAssetsAtAmortisedCostMemberifrs-full:LoansAndReceivablesCategoryMemberbcs:AgricultureFoodAndForestProductsMember2022-12-310000312069ifrs-full:FinancialAssetsAtAmortisedCostMemberifrs-full:LoansAndReceivablesCategoryMemberifrs-full:TwelvemonthExpectedCreditLossesMemberbcs:AgricultureFoodAndForestProductsMember2022-12-310000312069ifrs-full:LifetimeExpectedCreditLossesMemberifrs-full:FinancialAssetsAtAmortisedCostMemberifrs-full:LoansAndReceivablesCategoryMemberifrs-full:FinancialInstrumentsNotCreditimpairedMemberbcs:AgricultureFoodAndForestProductsMember2022-12-310000312069ifrs-full:LifetimeExpectedCreditLossesMemberifrs-full:FinancialInstrumentsCreditimpairedMemberifrs-full:FinancialAssetsAtAmortisedCostMemberifrs-full:LoansAndReceivablesCategoryMemberbcs:AgricultureFoodAndForestProductsMember2022-12-310000312069ifrs-full:CountryOfDomicileMemberbcs:MiningAndQuarryingMemberifrs-full:FinancialAssetsAtAmortisedCostMemberifrs-full:LoansAndReceivablesCategoryMember2022-12-310000312069bcs:MiningAndQuarryingMemberifrs-full:FinancialAssetsAtAmortisedCostMembersrt:AmericasMemberifrs-full:LoansAndReceivablesCategoryMember2022-12-310000312069bcs:MiningAndQuarryingMembersrt:EuropeMemberifrs-full:FinancialAssetsAtAmortisedCostMemberifrs-full:LoansAndReceivablesCategoryMember2022-12-310000312069bcs:MiningAndQuarryingMemberbcs:OtherRegionsMemberifrs-full:FinancialAssetsAtAmortisedCostMemberifrs-full:LoansAndReceivablesCategoryMember2022-12-310000312069bcs:MiningAndQuarryingMemberifrs-full:FinancialAssetsAtAmortisedCostMemberifrs-full:LoansAndReceivablesCategoryMember2022-12-310000312069bcs:MiningAndQuarryingMemberifrs-full:FinancialAssetsAtAmortisedCostMemberifrs-full:LoansAndReceivablesCategoryMemberifrs-full:TwelvemonthExpectedCreditLossesMember2022-12-310000312069ifrs-full:LifetimeExpectedCreditLossesMemberbcs:MiningAndQuarryingMemberifrs-full:FinancialAssetsAtAmortisedCostMemberifrs-full:LoansAndReceivablesCategoryMemberifrs-full:FinancialInstrumentsNotCreditimpairedMember2022-12-310000312069ifrs-full:LifetimeExpectedCreditLossesMemberbcs:MiningAndQuarryingMemberifrs-full:FinancialInstrumentsCreditimpairedMemberifrs-full:FinancialAssetsAtAmortisedCostMemberifrs-full:LoansAndReceivablesCategoryMember2022-12-310000312069ifrs-full:CountryOfDomicileMemberifrs-full:FinancialAssetsAtAmortisedCostMemberifrs-full:LoansAndReceivablesCategoryMemberbcs:ManufacturingMember2022-12-310000312069ifrs-full:FinancialAssetsAtAmortisedCostMembersrt:AmericasMemberifrs-full:LoansAndReceivablesCategoryMemberbcs:ManufacturingMember2022-12-310000312069srt:EuropeMemberifrs-full:FinancialAssetsAtAmortisedCostMemberifrs-full:LoansAndReceivablesCategoryMemberbcs:ManufacturingMember2022-12-310000312069bcs:OtherRegionsMemberifrs-full:FinancialAssetsAtAmortisedCostMemberifrs-full:LoansAndReceivablesCategoryMemberbcs:ManufacturingMember2022-12-310000312069ifrs-full:FinancialAssetsAtAmortisedCostMemberifrs-full:LoansAndReceivablesCategoryMemberbcs:ManufacturingMember2022-12-310000312069ifrs-full:FinancialAssetsAtAmortisedCostMemberifrs-full:LoansAndReceivablesCategoryMemberbcs:ManufacturingMemberifrs-full:TwelvemonthExpectedCreditLossesMember2022-12-310000312069ifrs-full:LifetimeExpectedCreditLossesMemberifrs-full:FinancialAssetsAtAmortisedCostMemberbcs:ManufacturingMemberifrs-full:LoansAndReceivablesCategoryMemberifrs-full:FinancialInstrumentsNotCreditimpairedMember2022-12-310000312069ifrs-full:LifetimeExpectedCreditLossesMemberifrs-full:FinancialInstrumentsCreditimpairedMemberifrs-full:FinancialAssetsAtAmortisedCostMemberbcs:ManufacturingMemberifrs-full:LoansAndReceivablesCategoryMember2022-12-310000312069ifrs-full:CountryOfDomicileMemberifrs-full:FinancialAssetsAtAmortisedCostMemberbcs:GovernmentAndCentralBankMemberifrs-full:LoansAndReceivablesCategoryMember2022-12-310000312069ifrs-full:FinancialAssetsAtAmortisedCostMembersrt:AmericasMemberbcs:GovernmentAndCentralBankMemberifrs-full:LoansAndReceivablesCategoryMember2022-12-310000312069srt:EuropeMemberifrs-full:FinancialAssetsAtAmortisedCostMemberbcs:GovernmentAndCentralBankMemberifrs-full:LoansAndReceivablesCategoryMember2022-12-310000312069bcs:OtherRegionsMemberifrs-full:FinancialAssetsAtAmortisedCostMemberbcs:GovernmentAndCentralBankMemberifrs-full:LoansAndReceivablesCategoryMember2022-12-310000312069ifrs-full:FinancialAssetsAtAmortisedCostMemberbcs:GovernmentAndCentralBankMemberifrs-full:LoansAndReceivablesCategoryMember2022-12-310000312069ifrs-full:FinancialAssetsAtAmortisedCostMemberbcs:GovernmentAndCentralBankMemberifrs-full:LoansAndReceivablesCategoryMemberifrs-full:TwelvemonthExpectedCreditLossesMember2022-12-310000312069ifrs-full:LifetimeExpectedCreditLossesMemberifrs-full:FinancialAssetsAtAmortisedCostMemberbcs:GovernmentAndCentralBankMemberifrs-full:LoansAndReceivablesCategoryMemberifrs-full:FinancialInstrumentsNotCreditimpairedMember2022-12-310000312069ifrs-full:LifetimeExpectedCreditLossesMemberifrs-full:FinancialInstrumentsCreditimpairedMemberifrs-full:FinancialAssetsAtAmortisedCostMemberbcs:GovernmentAndCentralBankMemberifrs-full:LoansAndReceivablesCategoryMember2022-12-310000312069ifrs-full:CountryOfDomicileMemberifrs-full:FinancialAssetsAtAmortisedCostMemberbcs:BanksMemberifrs-full:LoansAndReceivablesCategoryMember2022-12-310000312069ifrs-full:FinancialAssetsAtAmortisedCostMemberbcs:BanksMembersrt:AmericasMemberifrs-full:LoansAndReceivablesCategoryMember2022-12-310000312069srt:EuropeMemberifrs-full:FinancialAssetsAtAmortisedCostMemberbcs:BanksMemberifrs-full:LoansAndReceivablesCategoryMember2022-12-310000312069bcs:OtherRegionsMemberifrs-full:FinancialAssetsAtAmortisedCostMemberbcs:BanksMemberifrs-full:LoansAndReceivablesCategoryMember2022-12-310000312069ifrs-full:FinancialAssetsAtAmortisedCostMemberbcs:BanksMemberifrs-full:LoansAndReceivablesCategoryMember2022-12-310000312069ifrs-full:FinancialAssetsAtAmortisedCostMemberbcs:BanksMemberifrs-full:LoansAndReceivablesCategoryMemberifrs-full:TwelvemonthExpectedCreditLossesMember2022-12-310000312069ifrs-full:LifetimeExpectedCreditLossesMemberbcs:BanksMemberifrs-full:FinancialAssetsAtAmortisedCostMemberifrs-full:LoansAndReceivablesCategoryMemberifrs-full:FinancialInstrumentsNotCreditimpairedMember2022-12-310000312069ifrs-full:LifetimeExpectedCreditLossesMemberifrs-full:FinancialInstrumentsCreditimpairedMemberbcs:BanksMemberifrs-full:FinancialAssetsAtAmortisedCostMemberifrs-full:LoansAndReceivablesCategoryMember2022-12-310000312069ifrs-full:CountryOfDomicileMemberifrs-full:FinancialAssetsAtAmortisedCostMemberbcs:EnergyAndWaterMemberifrs-full:LoansAndReceivablesCategoryMember2022-12-310000312069ifrs-full:FinancialAssetsAtAmortisedCostMemberbcs:EnergyAndWaterMembersrt:AmericasMemberifrs-full:LoansAndReceivablesCategoryMember2022-12-310000312069srt:EuropeMemberifrs-full:FinancialAssetsAtAmortisedCostMemberbcs:EnergyAndWaterMemberifrs-full:LoansAndReceivablesCategoryMember2022-12-310000312069bcs:OtherRegionsMemberifrs-full:FinancialAssetsAtAmortisedCostMemberbcs:EnergyAndWaterMemberifrs-full:LoansAndReceivablesCategoryMember2022-12-310000312069ifrs-full:FinancialAssetsAtAmortisedCostMemberbcs:EnergyAndWaterMemberifrs-full:LoansAndReceivablesCategoryMember2022-12-310000312069ifrs-full:FinancialAssetsAtAmortisedCostMemberbcs:EnergyAndWaterMemberifrs-full:LoansAndReceivablesCategoryMemberifrs-full:TwelvemonthExpectedCreditLossesMember2022-12-310000312069ifrs-full:LifetimeExpectedCreditLossesMemberbcs:EnergyAndWaterMemberifrs-full:FinancialAssetsAtAmortisedCostMemberifrs-full:LoansAndReceivablesCategoryMemberifrs-full:FinancialInstrumentsNotCreditimpairedMember2022-12-310000312069ifrs-full:LifetimeExpectedCreditLossesMemberifrs-full:FinancialInstrumentsCreditimpairedMemberbcs:EnergyAndWaterMemberifrs-full:FinancialAssetsAtAmortisedCostMemberifrs-full:LoansAndReceivablesCategoryMember2022-12-310000312069ifrs-full:CountryOfDomicileMemberifrs-full:FinancialAssetsAtAmortisedCostMemberifrs-full:LoansAndReceivablesCategoryMemberbcs:MaterialsAndBuildingMember2022-12-310000312069ifrs-full:FinancialAssetsAtAmortisedCostMembersrt:AmericasMemberifrs-full:LoansAndReceivablesCategoryMemberbcs:MaterialsAndBuildingMember2022-12-310000312069srt:EuropeMemberifrs-full:FinancialAssetsAtAmortisedCostMemberifrs-full:LoansAndReceivablesCategoryMemberbcs:MaterialsAndBuildingMember2022-12-310000312069bcs:OtherRegionsMemberifrs-full:FinancialAssetsAtAmortisedCostMemberifrs-full:LoansAndReceivablesCategoryMemberbcs:MaterialsAndBuildingMember2022-12-310000312069ifrs-full:FinancialAssetsAtAmortisedCostMemberifrs-full:LoansAndReceivablesCategoryMemberbcs:MaterialsAndBuildingMember2022-12-310000312069ifrs-full:FinancialAssetsAtAmortisedCostMemberifrs-full:LoansAndReceivablesCategoryMemberbcs:MaterialsAndBuildingMemberifrs-full:TwelvemonthExpectedCreditLossesMember2022-12-310000312069ifrs-full:LifetimeExpectedCreditLossesMemberifrs-full:FinancialAssetsAtAmortisedCostMemberifrs-full:LoansAndReceivablesCategoryMemberbcs:MaterialsAndBuildingMemberifrs-full:FinancialInstrumentsNotCreditimpairedMember2022-12-310000312069ifrs-full:LifetimeExpectedCreditLossesMemberifrs-full:FinancialInstrumentsCreditimpairedMemberifrs-full:FinancialAssetsAtAmortisedCostMemberifrs-full:LoansAndReceivablesCategoryMemberbcs:MaterialsAndBuildingMember2022-12-310000312069ifrs-full:CountryOfDomicileMemberifrs-full:FinancialAssetsAtAmortisedCostMemberbcs:WholesaleAndRetailDistributionAndLeisureMemberifrs-full:LoansAndReceivablesCategoryMember2022-12-310000312069ifrs-full:FinancialAssetsAtAmortisedCostMemberbcs:WholesaleAndRetailDistributionAndLeisureMembersrt:AmericasMemberifrs-full:LoansAndReceivablesCategoryMember2022-12-310000312069srt:EuropeMemberifrs-full:FinancialAssetsAtAmortisedCostMemberbcs:WholesaleAndRetailDistributionAndLeisureMemberifrs-full:LoansAndReceivablesCategoryMember2022-12-310000312069bcs:OtherRegionsMemberifrs-full:FinancialAssetsAtAmortisedCostMemberbcs:WholesaleAndRetailDistributionAndLeisureMemberifrs-full:LoansAndReceivablesCategoryMember2022-12-310000312069ifrs-full:FinancialAssetsAtAmortisedCostMemberbcs:WholesaleAndRetailDistributionAndLeisureMemberifrs-full:LoansAndReceivablesCategoryMember2022-12-310000312069ifrs-full:FinancialAssetsAtAmortisedCostMemberbcs:WholesaleAndRetailDistributionAndLeisureMemberifrs-full:LoansAndReceivablesCategoryMemberifrs-full:TwelvemonthExpectedCreditLossesMember2022-12-310000312069ifrs-full:LifetimeExpectedCreditLossesMemberbcs:WholesaleAndRetailDistributionAndLeisureMemberifrs-full:FinancialAssetsAtAmortisedCostMemberifrs-full:LoansAndReceivablesCategoryMemberifrs-full:FinancialInstrumentsNotCreditimpairedMember2022-12-310000312069ifrs-full:LifetimeExpectedCreditLossesMemberifrs-full:FinancialInstrumentsCreditimpairedMemberbcs:WholesaleAndRetailDistributionAndLeisureMemberifrs-full:FinancialAssetsAtAmortisedCostMemberifrs-full:LoansAndReceivablesCategoryMember2022-12-310000312069ifrs-full:CountryOfDomicileMemberifrs-full:FinancialAssetsAtAmortisedCostMemberifrs-full:LoansAndReceivablesCategoryMemberbcs:TransportAndStorageMember2022-12-310000312069ifrs-full:FinancialAssetsAtAmortisedCostMembersrt:AmericasMemberifrs-full:LoansAndReceivablesCategoryMemberbcs:TransportAndStorageMember2022-12-310000312069srt:EuropeMemberifrs-full:FinancialAssetsAtAmortisedCostMemberifrs-full:LoansAndReceivablesCategoryMemberbcs:TransportAndStorageMember2022-12-310000312069bcs:OtherRegionsMemberifrs-full:FinancialAssetsAtAmortisedCostMemberifrs-full:LoansAndReceivablesCategoryMemberbcs:TransportAndStorageMember2022-12-310000312069ifrs-full:FinancialAssetsAtAmortisedCostMemberifrs-full:LoansAndReceivablesCategoryMemberbcs:TransportAndStorageMember2022-12-310000312069ifrs-full:FinancialAssetsAtAmortisedCostMemberifrs-full:LoansAndReceivablesCategoryMemberbcs:TransportAndStorageMemberifrs-full:TwelvemonthExpectedCreditLossesMember2022-12-310000312069ifrs-full:LifetimeExpectedCreditLossesMemberifrs-full:FinancialAssetsAtAmortisedCostMemberbcs:TransportAndStorageMemberifrs-full:LoansAndReceivablesCategoryMemberifrs-full:FinancialInstrumentsNotCreditimpairedMember2022-12-310000312069ifrs-full:LifetimeExpectedCreditLossesMemberifrs-full:FinancialInstrumentsCreditimpairedMemberifrs-full:FinancialAssetsAtAmortisedCostMemberbcs:TransportAndStorageMemberifrs-full:LoansAndReceivablesCategoryMember2022-12-310000312069ifrs-full:CountryOfDomicileMemberbcs:HomeLoansMemberifrs-full:FinancialAssetsAtAmortisedCostMemberifrs-full:LoansAndReceivablesCategoryMember2022-12-310000312069bcs:HomeLoansMemberifrs-full:FinancialAssetsAtAmortisedCostMembersrt:AmericasMemberifrs-full:LoansAndReceivablesCategoryMember2022-12-310000312069srt:EuropeMemberbcs:HomeLoansMemberifrs-full:FinancialAssetsAtAmortisedCostMemberifrs-full:LoansAndReceivablesCategoryMember2022-12-310000312069bcs:HomeLoansMemberbcs:OtherRegionsMemberifrs-full:FinancialAssetsAtAmortisedCostMemberifrs-full:LoansAndReceivablesCategoryMember2022-12-310000312069bcs:HomeLoansMemberifrs-full:FinancialAssetsAtAmortisedCostMemberifrs-full:LoansAndReceivablesCategoryMember2022-12-310000312069bcs:HomeLoansMemberifrs-full:FinancialAssetsAtAmortisedCostMemberifrs-full:LoansAndReceivablesCategoryMemberifrs-full:TwelvemonthExpectedCreditLossesMember2022-12-310000312069ifrs-full:LifetimeExpectedCreditLossesMemberbcs:HomeLoansMemberifrs-full:FinancialAssetsAtAmortisedCostMemberifrs-full:LoansAndReceivablesCategoryMemberifrs-full:FinancialInstrumentsNotCreditimpairedMember2022-12-310000312069ifrs-full:LifetimeExpectedCreditLossesMemberbcs:HomeLoansMemberifrs-full:FinancialInstrumentsCreditimpairedMemberifrs-full:FinancialAssetsAtAmortisedCostMemberifrs-full:LoansAndReceivablesCategoryMember2022-12-310000312069bcs:BusinessAndOtherServicesMemberifrs-full:CountryOfDomicileMemberifrs-full:FinancialAssetsAtAmortisedCostMemberifrs-full:LoansAndReceivablesCategoryMember2022-12-310000312069bcs:BusinessAndOtherServicesMemberifrs-full:FinancialAssetsAtAmortisedCostMembersrt:AmericasMemberifrs-full:LoansAndReceivablesCategoryMember2022-12-310000312069bcs:BusinessAndOtherServicesMembersrt:EuropeMemberifrs-full:FinancialAssetsAtAmortisedCostMemberifrs-full:LoansAndReceivablesCategoryMember2022-12-310000312069bcs:BusinessAndOtherServicesMemberbcs:OtherRegionsMemberifrs-full:FinancialAssetsAtAmortisedCostMemberifrs-full:LoansAndReceivablesCategoryMember2022-12-310000312069bcs:BusinessAndOtherServicesMemberifrs-full:FinancialAssetsAtAmortisedCostMemberifrs-full:LoansAndReceivablesCategoryMember2022-12-310000312069bcs:BusinessAndOtherServicesMemberifrs-full:FinancialAssetsAtAmortisedCostMemberifrs-full:LoansAndReceivablesCategoryMemberifrs-full:TwelvemonthExpectedCreditLossesMember2022-12-310000312069bcs:BusinessAndOtherServicesMemberifrs-full:LifetimeExpectedCreditLossesMemberifrs-full:FinancialAssetsAtAmortisedCostMemberifrs-full:LoansAndReceivablesCategoryMemberifrs-full:FinancialInstrumentsNotCreditimpairedMember2022-12-310000312069bcs:BusinessAndOtherServicesMemberifrs-full:LifetimeExpectedCreditLossesMemberifrs-full:FinancialInstrumentsCreditimpairedMemberifrs-full:FinancialAssetsAtAmortisedCostMemberifrs-full:LoansAndReceivablesCategoryMember2022-12-310000312069ifrs-full:CountryOfDomicileMemberifrs-full:FinancialAssetsAtAmortisedCostMemberifrs-full:LoansAndReceivablesCategoryMemberbcs:OtherFinancialInstitutionsMember2022-12-310000312069ifrs-full:FinancialAssetsAtAmortisedCostMembersrt:AmericasMemberifrs-full:LoansAndReceivablesCategoryMemberbcs:OtherFinancialInstitutionsMember2022-12-310000312069srt:EuropeMemberifrs-full:FinancialAssetsAtAmortisedCostMemberifrs-full:LoansAndReceivablesCategoryMemberbcs:OtherFinancialInstitutionsMember2022-12-310000312069bcs:OtherRegionsMemberifrs-full:FinancialAssetsAtAmortisedCostMemberifrs-full:LoansAndReceivablesCategoryMemberbcs:OtherFinancialInstitutionsMember2022-12-310000312069ifrs-full:FinancialAssetsAtAmortisedCostMemberifrs-full:LoansAndReceivablesCategoryMemberbcs:OtherFinancialInstitutionsMember2022-12-310000312069ifrs-full:FinancialAssetsAtAmortisedCostMemberifrs-full:LoansAndReceivablesCategoryMemberbcs:OtherFinancialInstitutionsMemberifrs-full:TwelvemonthExpectedCreditLossesMember2022-12-310000312069ifrs-full:LifetimeExpectedCreditLossesMemberifrs-full:FinancialAssetsAtAmortisedCostMemberifrs-full:LoansAndReceivablesCategoryMemberbcs:OtherFinancialInstitutionsMemberifrs-full:FinancialInstrumentsNotCreditimpairedMember2022-12-310000312069ifrs-full:LifetimeExpectedCreditLossesMemberifrs-full:FinancialInstrumentsCreditimpairedMemberifrs-full:FinancialAssetsAtAmortisedCostMemberifrs-full:LoansAndReceivablesCategoryMemberbcs:OtherFinancialInstitutionsMember2022-12-310000312069bcs:CardsUnsecuredLoansAndOtherPersonalLendingMemberifrs-full:CountryOfDomicileMemberifrs-full:FinancialAssetsAtAmortisedCostMemberifrs-full:LoansAndReceivablesCategoryMember2022-12-310000312069bcs:CardsUnsecuredLoansAndOtherPersonalLendingMemberifrs-full:FinancialAssetsAtAmortisedCostMembersrt:AmericasMemberifrs-full:LoansAndReceivablesCategoryMember2022-12-310000312069bcs:CardsUnsecuredLoansAndOtherPersonalLendingMembersrt:EuropeMemberifrs-full:FinancialAssetsAtAmortisedCostMemberifrs-full:LoansAndReceivablesCategoryMember2022-12-310000312069bcs:CardsUnsecuredLoansAndOtherPersonalLendingMemberbcs:OtherRegionsMemberifrs-full:FinancialAssetsAtAmortisedCostMemberifrs-full:LoansAndReceivablesCategoryMember2022-12-310000312069bcs:CardsUnsecuredLoansAndOtherPersonalLendingMemberifrs-full:FinancialAssetsAtAmortisedCostMemberifrs-full:LoansAndReceivablesCategoryMember2022-12-310000312069bcs:CardsUnsecuredLoansAndOtherPersonalLendingMemberifrs-full:FinancialAssetsAtAmortisedCostMemberifrs-full:LoansAndReceivablesCategoryMemberifrs-full:TwelvemonthExpectedCreditLossesMember2022-12-310000312069bcs:CardsUnsecuredLoansAndOtherPersonalLendingMemberifrs-full:LifetimeExpectedCreditLossesMemberifrs-full:FinancialAssetsAtAmortisedCostMemberifrs-full:LoansAndReceivablesCategoryMemberifrs-full:FinancialInstrumentsNotCreditimpairedMember2022-12-310000312069bcs:CardsUnsecuredLoansAndOtherPersonalLendingMemberifrs-full:LifetimeExpectedCreditLossesMemberifrs-full:FinancialInstrumentsCreditimpairedMemberifrs-full:FinancialAssetsAtAmortisedCostMemberifrs-full:LoansAndReceivablesCategoryMember2022-12-310000312069ifrs-full:CountryOfDomicileMemberifrs-full:FinancialAssetsAtAmortisedCostMemberifrs-full:LoansAndReceivablesCategoryMember2022-12-310000312069ifrs-full:FinancialAssetsAtAmortisedCostMembersrt:AmericasMemberifrs-full:LoansAndReceivablesCategoryMember2022-12-310000312069srt:EuropeMemberifrs-full:FinancialAssetsAtAmortisedCostMemberifrs-full:LoansAndReceivablesCategoryMember2022-12-310000312069bcs:OtherRegionsMemberifrs-full:FinancialAssetsAtAmortisedCostMemberifrs-full:LoansAndReceivablesCategoryMember2022-12-310000312069ifrs-full:CountryOfDomicileMemberifrs-full:DebtSecuritiesMemberifrs-full:FinancialAssetsAtAmortisedCostMember2022-12-310000312069ifrs-full:DebtSecuritiesMemberifrs-full:FinancialAssetsAtAmortisedCostMembersrt:AmericasMember2022-12-310000312069ifrs-full:DebtSecuritiesMembersrt:EuropeMemberifrs-full:FinancialAssetsAtAmortisedCostMember2022-12-310000312069ifrs-full:DebtSecuritiesMemberbcs:OtherRegionsMemberifrs-full:FinancialAssetsAtAmortisedCostMember2022-12-310000312069ifrs-full:CountryOfDomicileMemberbcs:LoansAndAdvancesAtAmortisedCostIncludingDebtSecuritiesMember2022-12-310000312069bcs:LoansAndAdvancesAtAmortisedCostIncludingDebtSecuritiesMembersrt:AmericasMember2022-12-310000312069srt:EuropeMemberbcs:LoansAndAdvancesAtAmortisedCostIncludingDebtSecuritiesMember2022-12-310000312069bcs:OtherRegionsMemberbcs:LoansAndAdvancesAtAmortisedCostIncludingDebtSecuritiesMember2022-12-310000312069ifrs-full:CountryOfDomicileMemberifrs-full:GrossCarryingAmountMemberifrs-full:ItemsOfContingentLiabilitiesMemberbcs:OffBalanceSheetLoanCommitmentsAndFinancialGuaranteeContractsMember2022-12-310000312069srt:AmericasMemberifrs-full:GrossCarryingAmountMemberifrs-full:ItemsOfContingentLiabilitiesMemberbcs:OffBalanceSheetLoanCommitmentsAndFinancialGuaranteeContractsMember2022-12-310000312069srt:EuropeMemberifrs-full:GrossCarryingAmountMemberifrs-full:ItemsOfContingentLiabilitiesMemberbcs:OffBalanceSheetLoanCommitmentsAndFinancialGuaranteeContractsMember2022-12-310000312069bcs:OtherRegionsMemberifrs-full:GrossCarryingAmountMemberifrs-full:ItemsOfContingentLiabilitiesMemberbcs:OffBalanceSheetLoanCommitmentsAndFinancialGuaranteeContractsMember2022-12-310000312069ifrs-full:GrossCarryingAmountMemberifrs-full:ItemsOfContingentLiabilitiesMemberbcs:OffBalanceSheetLoanCommitmentsAndFinancialGuaranteeContractsMember2022-12-310000312069ifrs-full:GrossCarryingAmountMemberifrs-full:ItemsOfContingentLiabilitiesMemberifrs-full:TwelvemonthExpectedCreditLossesMemberbcs:OffBalanceSheetLoanCommitmentsAndFinancialGuaranteeContractsMember2022-12-310000312069ifrs-full:LifetimeExpectedCreditLossesMemberifrs-full:GrossCarryingAmountMemberifrs-full:FinancialInstrumentsNotCreditimpairedMemberifrs-full:ItemsOfContingentLiabilitiesMemberbcs:OffBalanceSheetLoanCommitmentsAndFinancialGuaranteeContractsMember2022-12-310000312069ifrs-full:LifetimeExpectedCreditLossesMemberifrs-full:FinancialInstrumentsCreditimpairedMemberifrs-full:GrossCarryingAmountMemberifrs-full:ItemsOfContingentLiabilitiesMemberbcs:OffBalanceSheetLoanCommitmentsAndFinancialGuaranteeContractsMember2022-12-310000312069ifrs-full:CountryOfDomicileMemberifrs-full:LoanCommitmentsMemberifrs-full:GrossCarryingAmountMemberbcs:OffBalanceSheetLoanCommitmentsAndFinancialGuaranteeContractsMember2022-12-310000312069ifrs-full:LoanCommitmentsMembersrt:AmericasMemberifrs-full:GrossCarryingAmountMemberbcs:OffBalanceSheetLoanCommitmentsAndFinancialGuaranteeContractsMember2022-12-310000312069srt:EuropeMemberifrs-full:LoanCommitmentsMemberifrs-full:GrossCarryingAmountMemberbcs:OffBalanceSheetLoanCommitmentsAndFinancialGuaranteeContractsMember2022-12-310000312069bcs:OtherRegionsMemberifrs-full:LoanCommitmentsMemberifrs-full:GrossCarryingAmountMemberbcs:OffBalanceSheetLoanCommitmentsAndFinancialGuaranteeContractsMember2022-12-310000312069ifrs-full:LoanCommitmentsMemberifrs-full:GrossCarryingAmountMemberbcs:OffBalanceSheetLoanCommitmentsAndFinancialGuaranteeContractsMember2022-12-310000312069ifrs-full:LoanCommitmentsMemberifrs-full:GrossCarryingAmountMemberifrs-full:TwelvemonthExpectedCreditLossesMemberbcs:OffBalanceSheetLoanCommitmentsAndFinancialGuaranteeContractsMember2022-12-310000312069ifrs-full:LifetimeExpectedCreditLossesMemberifrs-full:LoanCommitmentsMemberifrs-full:GrossCarryingAmountMemberifrs-full:FinancialInstrumentsNotCreditimpairedMemberbcs:OffBalanceSheetLoanCommitmentsAndFinancialGuaranteeContractsMember2022-12-310000312069ifrs-full:LifetimeExpectedCreditLossesMemberifrs-full:FinancialInstrumentsCreditimpairedMemberifrs-full:LoanCommitmentsMemberifrs-full:GrossCarryingAmountMemberbcs:OffBalanceSheetLoanCommitmentsAndFinancialGuaranteeContractsMember2022-12-310000312069ifrs-full:CountryOfDomicileMemberifrs-full:GrossCarryingAmountMemberbcs:OffBalanceSheetLoanCommitmentsAndFinancialGuaranteeContractsMember2022-12-310000312069srt:AmericasMemberifrs-full:GrossCarryingAmountMemberbcs:OffBalanceSheetLoanCommitmentsAndFinancialGuaranteeContractsMember2022-12-310000312069srt:EuropeMemberifrs-full:GrossCarryingAmountMemberbcs:OffBalanceSheetLoanCommitmentsAndFinancialGuaranteeContractsMember2022-12-310000312069bcs:OtherRegionsMemberifrs-full:GrossCarryingAmountMemberbcs:OffBalanceSheetLoanCommitmentsAndFinancialGuaranteeContractsMember2022-12-310000312069ifrs-full:DebtSecuritiesMemberifrs-full:FinancialAssetsAtAmortisedCostMemberbcs:GovernmentAndCentralBankMember2023-12-310000312069ifrs-full:DebtSecuritiesMemberifrs-full:FinancialAssetsAtAmortisedCostMemberbcs:GovernmentAndCentralBankMember2022-12-310000312069ifrs-full:DebtSecuritiesMemberifrs-full:FinancialAssetsAtAmortisedCostMemberbcs:OtherFinancialInstitutionsMember2023-12-310000312069ifrs-full:DebtSecuritiesMemberifrs-full:FinancialAssetsAtAmortisedCostMemberbcs:OtherFinancialInstitutionsMember2022-12-310000312069ifrs-full:DebtSecuritiesMemberifrs-full:FinancialAssetsAtAmortisedCostMemberbcs:MaterialsAndBuildingMember2023-12-310000312069ifrs-full:DebtSecuritiesMemberifrs-full:FinancialAssetsAtAmortisedCostMemberbcs:MaterialsAndBuildingMember2022-12-310000312069ifrs-full:DebtSecuritiesMemberifrs-full:FinancialAssetsAtAmortisedCostMemberbcs:BanksMember2023-12-310000312069ifrs-full:DebtSecuritiesMemberifrs-full:FinancialAssetsAtAmortisedCostMemberbcs:BanksMember2022-12-310000312069bcs:ProbabilityOfDefaultZeroToPointSixtyPercentMemberifrs-full:InternalCreditGradesMember2023-12-310000312069bcs:ProbabilityOfDefaultPointSixtyToElevenPointThreeFivePercentMemberifrs-full:InternalCreditGradesMember2023-12-310000312069ifrs-full:InternalCreditGradesMemberbcs:ProbabilityOfDefaultElevenPointThreeFiveToOneHundredPercentMember2023-12-310000312069ifrs-full:InternalCreditGradesMember2023-12-310000312069bcs:ProbabilityOfDefaultZeroToPointSixtyPercentMemberifrs-full:InternalCreditGradesMemberifrs-full:MortgagesMember2023-12-310000312069bcs:ProbabilityOfDefaultPointSixtyToElevenPointThreeFivePercentMemberifrs-full:InternalCreditGradesMemberifrs-full:MortgagesMember2023-12-310000312069ifrs-full:InternalCreditGradesMemberifrs-full:MortgagesMemberbcs:ProbabilityOfDefaultElevenPointThreeFiveToOneHundredPercentMember2023-12-310000312069ifrs-full:InternalCreditGradesMemberifrs-full:MortgagesMember2023-12-310000312069bcs:CreditCardsRetailMemberbcs:ProbabilityOfDefaultZeroToPointSixtyPercentMemberifrs-full:InternalCreditGradesMember2023-12-310000312069bcs:CreditCardsRetailMemberbcs:ProbabilityOfDefaultPointSixtyToElevenPointThreeFivePercentMemberifrs-full:InternalCreditGradesMember2023-12-310000312069bcs:CreditCardsRetailMemberifrs-full:InternalCreditGradesMemberbcs:ProbabilityOfDefaultElevenPointThreeFiveToOneHundredPercentMember2023-12-310000312069bcs:CreditCardsRetailMemberifrs-full:InternalCreditGradesMember2023-12-310000312069bcs:ProbabilityOfDefaultZeroToPointSixtyPercentMemberifrs-full:InternalCreditGradesMemberbcs:OtherRetailMember2023-12-310000312069bcs:ProbabilityOfDefaultPointSixtyToElevenPointThreeFivePercentMemberifrs-full:InternalCreditGradesMemberbcs:OtherRetailMember2023-12-310000312069ifrs-full:InternalCreditGradesMemberbcs:OtherRetailMemberbcs:ProbabilityOfDefaultElevenPointThreeFiveToOneHundredPercentMember2023-12-310000312069ifrs-full:InternalCreditGradesMemberbcs:OtherRetailMember2023-12-310000312069bcs:ProbabilityOfDefaultZeroToPointSixtyPercentMemberifrs-full:InternalCreditGradesMemberifrs-full:CorporateLoansMember2023-12-310000312069bcs:ProbabilityOfDefaultPointSixtyToElevenPointThreeFivePercentMemberifrs-full:InternalCreditGradesMemberifrs-full:CorporateLoansMember2023-12-310000312069ifrs-full:InternalCreditGradesMemberifrs-full:CorporateLoansMemberbcs:ProbabilityOfDefaultElevenPointThreeFiveToOneHundredPercentMember2023-12-310000312069ifrs-full:InternalCreditGradesMemberifrs-full:CorporateLoansMember2023-12-310000312069bcs:ProbabilityOfDefaultZeroToPointSixtyPercentMemberifrs-full:InternalCreditGradesMemberifrs-full:FinancialAssetsAtAmortisedCostCategoryMember2023-12-310000312069bcs:ProbabilityOfDefaultPointSixtyToElevenPointThreeFivePercentMemberifrs-full:InternalCreditGradesMemberifrs-full:FinancialAssetsAtAmortisedCostCategoryMember2023-12-310000312069ifrs-full:InternalCreditGradesMemberifrs-full:FinancialAssetsAtAmortisedCostCategoryMemberbcs:ProbabilityOfDefaultElevenPointThreeFiveToOneHundredPercentMember2023-12-310000312069ifrs-full:InternalCreditGradesMemberifrs-full:FinancialAssetsAtAmortisedCostCategoryMember2023-12-310000312069bcs:ProbabilityOfDefaultZeroToPointSixtyPercentMemberifrs-full:InternalCreditGradesMemberifrs-full:DebtSecuritiesMember2023-12-310000312069bcs:ProbabilityOfDefaultPointSixtyToElevenPointThreeFivePercentMemberifrs-full:InternalCreditGradesMemberifrs-full:DebtSecuritiesMember2023-12-310000312069ifrs-full:InternalCreditGradesMemberbcs:ProbabilityOfDefaultElevenPointThreeFiveToOneHundredPercentMemberifrs-full:DebtSecuritiesMember2023-12-310000312069ifrs-full:InternalCreditGradesMemberifrs-full:DebtSecuritiesMember2023-12-310000312069bcs:ProbabilityOfDefaultZeroToPointSixtyPercentMemberifrs-full:InternalCreditGradesMemberbcs:TradedLoansMember2023-12-310000312069bcs:ProbabilityOfDefaultPointSixtyToElevenPointThreeFivePercentMemberifrs-full:InternalCreditGradesMemberbcs:TradedLoansMember2023-12-310000312069ifrs-full:InternalCreditGradesMemberbcs:ProbabilityOfDefaultElevenPointThreeFiveToOneHundredPercentMemberbcs:TradedLoansMember2023-12-310000312069ifrs-full:InternalCreditGradesMemberbcs:TradedLoansMember2023-12-310000312069bcs:ProbabilityOfDefaultZeroToPointSixtyPercentMemberifrs-full:InternalCreditGradesMemberifrs-full:LoansAndReceivablesCategoryMember2023-12-310000312069bcs:ProbabilityOfDefaultPointSixtyToElevenPointThreeFivePercentMemberifrs-full:InternalCreditGradesMemberifrs-full:LoansAndReceivablesCategoryMember2023-12-310000312069ifrs-full:InternalCreditGradesMemberbcs:ProbabilityOfDefaultElevenPointThreeFiveToOneHundredPercentMemberifrs-full:LoansAndReceivablesCategoryMember2023-12-310000312069ifrs-full:InternalCreditGradesMemberifrs-full:LoansAndReceivablesCategoryMember2023-12-310000312069bcs:ProbabilityOfDefaultZeroToPointSixtyPercentMemberifrs-full:InternalCreditGradesMemberbcs:ReverseRepurchaseAgreementsMember2023-12-310000312069bcs:ProbabilityOfDefaultPointSixtyToElevenPointThreeFivePercentMemberifrs-full:InternalCreditGradesMemberbcs:ReverseRepurchaseAgreementsMember2023-12-310000312069ifrs-full:InternalCreditGradesMemberbcs:ProbabilityOfDefaultElevenPointThreeFiveToOneHundredPercentMemberbcs:ReverseRepurchaseAgreementsMember2023-12-310000312069ifrs-full:InternalCreditGradesMemberbcs:ReverseRepurchaseAgreementsMember2023-12-310000312069bcs:ProbabilityOfDefaultZeroToPointSixtyPercentMemberbcs:OtherFinancialAssetsMemberifrs-full:InternalCreditGradesMember2023-12-310000312069bcs:ProbabilityOfDefaultPointSixtyToElevenPointThreeFivePercentMemberbcs:OtherFinancialAssetsMemberifrs-full:InternalCreditGradesMember2023-12-310000312069bcs:OtherFinancialAssetsMemberifrs-full:InternalCreditGradesMemberbcs:ProbabilityOfDefaultElevenPointThreeFiveToOneHundredPercentMember2023-12-310000312069bcs:OtherFinancialAssetsMemberifrs-full:InternalCreditGradesMember2023-12-310000312069bcs:ProbabilityOfDefaultZeroToPointSixtyPercentMemberifrs-full:InternalCreditGradesMember2022-12-310000312069bcs:ProbabilityOfDefaultPointSixtyToElevenPointThreeFivePercentMemberifrs-full:InternalCreditGradesMember2022-12-310000312069ifrs-full:InternalCreditGradesMemberbcs:ProbabilityOfDefaultElevenPointThreeFiveToOneHundredPercentMember2022-12-310000312069ifrs-full:InternalCreditGradesMember2022-12-310000312069bcs:ProbabilityOfDefaultZeroToPointSixtyPercentMemberifrs-full:InternalCreditGradesMemberifrs-full:MortgagesMember2022-12-310000312069bcs:ProbabilityOfDefaultPointSixtyToElevenPointThreeFivePercentMemberifrs-full:InternalCreditGradesMemberifrs-full:MortgagesMember2022-12-310000312069ifrs-full:InternalCreditGradesMemberifrs-full:MortgagesMemberbcs:ProbabilityOfDefaultElevenPointThreeFiveToOneHundredPercentMember2022-12-310000312069ifrs-full:InternalCreditGradesMemberifrs-full:MortgagesMember2022-12-310000312069bcs:CreditCardsRetailMemberbcs:ProbabilityOfDefaultZeroToPointSixtyPercentMemberifrs-full:InternalCreditGradesMember2022-12-310000312069bcs:CreditCardsRetailMemberbcs:ProbabilityOfDefaultPointSixtyToElevenPointThreeFivePercentMemberifrs-full:InternalCreditGradesMember2022-12-310000312069bcs:CreditCardsRetailMemberifrs-full:InternalCreditGradesMemberbcs:ProbabilityOfDefaultElevenPointThreeFiveToOneHundredPercentMember2022-12-310000312069bcs:CreditCardsRetailMemberifrs-full:InternalCreditGradesMember2022-12-310000312069bcs:ProbabilityOfDefaultZeroToPointSixtyPercentMemberifrs-full:InternalCreditGradesMemberbcs:OtherRetailMember2022-12-310000312069bcs:ProbabilityOfDefaultPointSixtyToElevenPointThreeFivePercentMemberifrs-full:InternalCreditGradesMemberbcs:OtherRetailMember2022-12-310000312069ifrs-full:InternalCreditGradesMemberbcs:OtherRetailMemberbcs:ProbabilityOfDefaultElevenPointThreeFiveToOneHundredPercentMember2022-12-310000312069ifrs-full:InternalCreditGradesMemberbcs:OtherRetailMember2022-12-310000312069bcs:ProbabilityOfDefaultZeroToPointSixtyPercentMemberifrs-full:InternalCreditGradesMemberifrs-full:CorporateLoansMember2022-12-310000312069bcs:ProbabilityOfDefaultPointSixtyToElevenPointThreeFivePercentMemberifrs-full:InternalCreditGradesMemberifrs-full:CorporateLoansMember2022-12-310000312069ifrs-full:InternalCreditGradesMemberifrs-full:CorporateLoansMemberbcs:ProbabilityOfDefaultElevenPointThreeFiveToOneHundredPercentMember2022-12-310000312069ifrs-full:InternalCreditGradesMemberifrs-full:CorporateLoansMember2022-12-310000312069bcs:ProbabilityOfDefaultZeroToPointSixtyPercentMemberifrs-full:InternalCreditGradesMemberifrs-full:FinancialAssetsAtAmortisedCostCategoryMember2022-12-310000312069bcs:ProbabilityOfDefaultPointSixtyToElevenPointThreeFivePercentMemberifrs-full:InternalCreditGradesMemberifrs-full:FinancialAssetsAtAmortisedCostCategoryMember2022-12-310000312069ifrs-full:InternalCreditGradesMemberifrs-full:FinancialAssetsAtAmortisedCostCategoryMemberbcs:ProbabilityOfDefaultElevenPointThreeFiveToOneHundredPercentMember2022-12-310000312069ifrs-full:InternalCreditGradesMemberifrs-full:FinancialAssetsAtAmortisedCostCategoryMember2022-12-310000312069bcs:ProbabilityOfDefaultZeroToPointSixtyPercentMemberifrs-full:InternalCreditGradesMemberifrs-full:DebtSecuritiesMember2022-12-310000312069bcs:ProbabilityOfDefaultPointSixtyToElevenPointThreeFivePercentMemberifrs-full:InternalCreditGradesMemberifrs-full:DebtSecuritiesMember2022-12-310000312069ifrs-full:InternalCreditGradesMemberbcs:ProbabilityOfDefaultElevenPointThreeFiveToOneHundredPercentMemberifrs-full:DebtSecuritiesMember2022-12-310000312069ifrs-full:InternalCreditGradesMemberifrs-full:DebtSecuritiesMember2022-12-310000312069bcs:ProbabilityOfDefaultZeroToPointSixtyPercentMemberifrs-full:InternalCreditGradesMemberbcs:TradedLoansMember2022-12-310000312069bcs:ProbabilityOfDefaultPointSixtyToElevenPointThreeFivePercentMemberifrs-full:InternalCreditGradesMemberbcs:TradedLoansMember2022-12-310000312069ifrs-full:InternalCreditGradesMemberbcs:ProbabilityOfDefaultElevenPointThreeFiveToOneHundredPercentMemberbcs:TradedLoansMember2022-12-310000312069ifrs-full:InternalCreditGradesMemberbcs:TradedLoansMember2022-12-310000312069bcs:ProbabilityOfDefaultZeroToPointSixtyPercentMemberifrs-full:InternalCreditGradesMemberifrs-full:LoansAndReceivablesCategoryMember2022-12-310000312069bcs:ProbabilityOfDefaultPointSixtyToElevenPointThreeFivePercentMemberifrs-full:InternalCreditGradesMemberifrs-full:LoansAndReceivablesCategoryMember2022-12-310000312069ifrs-full:InternalCreditGradesMemberbcs:ProbabilityOfDefaultElevenPointThreeFiveToOneHundredPercentMemberifrs-full:LoansAndReceivablesCategoryMember2022-12-310000312069ifrs-full:InternalCreditGradesMemberifrs-full:LoansAndReceivablesCategoryMember2022-12-310000312069bcs:ProbabilityOfDefaultZeroToPointSixtyPercentMemberifrs-full:InternalCreditGradesMemberbcs:ReverseRepurchaseAgreementsMember2022-12-310000312069bcs:ProbabilityOfDefaultPointSixtyToElevenPointThreeFivePercentMemberifrs-full:InternalCreditGradesMemberbcs:ReverseRepurchaseAgreementsMember2022-12-310000312069ifrs-full:InternalCreditGradesMemberbcs:ProbabilityOfDefaultElevenPointThreeFiveToOneHundredPercentMemberbcs:ReverseRepurchaseAgreementsMember2022-12-310000312069ifrs-full:InternalCreditGradesMemberbcs:ReverseRepurchaseAgreementsMember2022-12-310000312069bcs:ProbabilityOfDefaultZeroToPointSixtyPercentMemberbcs:OtherFinancialAssetsMemberifrs-full:InternalCreditGradesMember2022-12-310000312069bcs:ProbabilityOfDefaultPointSixtyToElevenPointThreeFivePercentMemberbcs:OtherFinancialAssetsMemberifrs-full:InternalCreditGradesMember2022-12-310000312069bcs:OtherFinancialAssetsMemberifrs-full:InternalCreditGradesMemberbcs:ProbabilityOfDefaultElevenPointThreeFiveToOneHundredPercentMember2022-12-310000312069bcs:OtherFinancialAssetsMemberifrs-full:InternalCreditGradesMember2022-12-310000312069ifrs-full:MortgagesMemberbcs:ProbabilityOfDefaultZeroToPointZeroFivePercentMemberifrs-full:GrossCarryingAmountMemberbcs:StrongIncludingInvestmentGradeMemberifrs-full:TwelvemonthExpectedCreditLossesMember2023-12-310000312069ifrs-full:LifetimeExpectedCreditLossesMemberifrs-full:MortgagesMemberbcs:ProbabilityOfDefaultZeroToPointZeroFivePercentMemberifrs-full:GrossCarryingAmountMemberifrs-full:FinancialInstrumentsNotCreditimpairedMemberbcs:StrongIncludingInvestmentGradeMember2023-12-310000312069ifrs-full:LifetimeExpectedCreditLossesMemberifrs-full:MortgagesMemberbcs:ProbabilityOfDefaultZeroToPointZeroFivePercentMemberifrs-full:FinancialInstrumentsCreditimpairedMemberifrs-full:GrossCarryingAmountMemberbcs:StrongIncludingInvestmentGradeMember2023-12-310000312069ifrs-full:MortgagesMemberbcs:ProbabilityOfDefaultZeroToPointZeroFivePercentMemberifrs-full:GrossCarryingAmountMemberbcs:ExpectedCreditLossesMemberbcs:StrongIncludingInvestmentGradeMember2023-12-310000312069ifrs-full:AccumulatedImpairmentMemberifrs-full:MortgagesMemberbcs:ProbabilityOfDefaultZeroToPointZeroFivePercentMemberbcs:StrongIncludingInvestmentGradeMemberifrs-full:TwelvemonthExpectedCreditLossesMember2023-12-310000312069ifrs-full:AccumulatedImpairmentMemberifrs-full:LifetimeExpectedCreditLossesMemberifrs-full:MortgagesMemberbcs:ProbabilityOfDefaultZeroToPointZeroFivePercentMemberifrs-full:FinancialInstrumentsNotCreditimpairedMemberbcs:StrongIncludingInvestmentGradeMember2023-12-310000312069ifrs-full:AccumulatedImpairmentMemberifrs-full:LifetimeExpectedCreditLossesMemberifrs-full:MortgagesMemberbcs:ProbabilityOfDefaultZeroToPointZeroFivePercentMemberifrs-full:FinancialInstrumentsCreditimpairedMemberbcs:StrongIncludingInvestmentGradeMember2023-12-310000312069ifrs-full:AccumulatedImpairmentMemberifrs-full:MortgagesMemberbcs:ProbabilityOfDefaultZeroToPointZeroFivePercentMemberbcs:ExpectedCreditLossesMemberbcs:StrongIncludingInvestmentGradeMember2023-12-310000312069ifrs-full:MortgagesMemberbcs:ProbabilityOfDefaultZeroToPointZeroFivePercentMemberbcs:StrongIncludingInvestmentGradeMember2023-12-310000312069ifrs-full:MortgagesMemberifrs-full:GrossCarryingAmountMemberbcs:ProbabilityOfDefaultPointZeroFiveToPointOneFivePercentMemberbcs:StrongIncludingInvestmentGradeMemberifrs-full:TwelvemonthExpectedCreditLossesMember2023-12-310000312069ifrs-full:LifetimeExpectedCreditLossesMemberifrs-full:MortgagesMemberifrs-full:GrossCarryingAmountMemberbcs:ProbabilityOfDefaultPointZeroFiveToPointOneFivePercentMemberifrs-full:FinancialInstrumentsNotCreditimpairedMemberbcs:StrongIncludingInvestmentGradeMember2023-12-310000312069ifrs-full:LifetimeExpectedCreditLossesMemberifrs-full:MortgagesMemberifrs-full:FinancialInstrumentsCreditimpairedMemberifrs-full:GrossCarryingAmountMemberbcs:ProbabilityOfDefaultPointZeroFiveToPointOneFivePercentMemberbcs:StrongIncludingInvestmentGradeMember2023-12-310000312069ifrs-full:MortgagesMemberifrs-full:GrossCarryingAmountMemberbcs:ExpectedCreditLossesMemberbcs:ProbabilityOfDefaultPointZeroFiveToPointOneFivePercentMemberbcs:StrongIncludingInvestmentGradeMember2023-12-310000312069ifrs-full:AccumulatedImpairmentMemberifrs-full:MortgagesMemberbcs:ProbabilityOfDefaultPointZeroFiveToPointOneFivePercentMemberbcs:StrongIncludingInvestmentGradeMemberifrs-full:TwelvemonthExpectedCreditLossesMember2023-12-310000312069ifrs-full:AccumulatedImpairmentMemberifrs-full:LifetimeExpectedCreditLossesMemberifrs-full:MortgagesMemberbcs:ProbabilityOfDefaultPointZeroFiveToPointOneFivePercentMemberifrs-full:FinancialInstrumentsNotCreditimpairedMemberbcs:StrongIncludingInvestmentGradeMember2023-12-310000312069ifrs-full:AccumulatedImpairmentMemberifrs-full:LifetimeExpectedCreditLossesMemberifrs-full:MortgagesMemberifrs-full:FinancialInstrumentsCreditimpairedMemberbcs:ProbabilityOfDefaultPointZeroFiveToPointOneFivePercentMemberbcs:StrongIncludingInvestmentGradeMember2023-12-310000312069ifrs-full:AccumulatedImpairmentMemberifrs-full:MortgagesMemberbcs:ExpectedCreditLossesMemberbcs:ProbabilityOfDefaultPointZeroFiveToPointOneFivePercentMemberbcs:StrongIncludingInvestmentGradeMember2023-12-310000312069ifrs-full:MortgagesMemberbcs:ProbabilityOfDefaultPointZeroFiveToPointOneFivePercentMemberbcs:StrongIncludingInvestmentGradeMember2023-12-310000312069ifrs-full:MortgagesMemberbcs:ProbabilityOfDefaultPointOneFiveToPointThreePercentMemberifrs-full:GrossCarryingAmountMemberbcs:StrongIncludingInvestmentGradeMemberifrs-full:TwelvemonthExpectedCreditLossesMember2023-12-310000312069ifrs-full:LifetimeExpectedCreditLossesMemberifrs-full:MortgagesMemberbcs:ProbabilityOfDefaultPointOneFiveToPointThreePercentMemberifrs-full:GrossCarryingAmountMemberifrs-full:FinancialInstrumentsNotCreditimpairedMemberbcs:StrongIncludingInvestmentGradeMember2023-12-310000312069ifrs-full:LifetimeExpectedCreditLossesMemberifrs-full:MortgagesMemberifrs-full:FinancialInstrumentsCreditimpairedMemberbcs:ProbabilityOfDefaultPointOneFiveToPointThreePercentMemberifrs-full:GrossCarryingAmountMemberbcs:StrongIncludingInvestmentGradeMember2023-12-310000312069ifrs-full:MortgagesMemberbcs:ProbabilityOfDefaultPointOneFiveToPointThreePercentMemberifrs-full:GrossCarryingAmountMemberbcs:ExpectedCreditLossesMemberbcs:StrongIncludingInvestmentGradeMember2023-12-310000312069ifrs-full:AccumulatedImpairmentMemberifrs-full:MortgagesMemberbcs:ProbabilityOfDefaultPointOneFiveToPointThreePercentMemberbcs:StrongIncludingInvestmentGradeMemberifrs-full:TwelvemonthExpectedCreditLossesMember2023-12-310000312069ifrs-full:AccumulatedImpairmentMemberifrs-full:LifetimeExpectedCreditLossesMemberifrs-full:MortgagesMemberbcs:ProbabilityOfDefaultPointOneFiveToPointThreePercentMemberifrs-full:FinancialInstrumentsNotCreditimpairedMemberbcs:StrongIncludingInvestmentGradeMember2023-12-310000312069ifrs-full:AccumulatedImpairmentMemberifrs-full:LifetimeExpectedCreditLossesMemberifrs-full:MortgagesMemberifrs-full:FinancialInstrumentsCreditimpairedMemberbcs:ProbabilityOfDefaultPointOneFiveToPointThreePercentMemberbcs:StrongIncludingInvestmentGradeMember2023-12-310000312069ifrs-full:AccumulatedImpairmentMemberifrs-full:MortgagesMemberbcs:ProbabilityOfDefaultPointOneFiveToPointThreePercentMemberbcs:ExpectedCreditLossesMemberbcs:StrongIncludingInvestmentGradeMember2023-12-310000312069ifrs-full:MortgagesMemberbcs:ProbabilityOfDefaultPointOneFiveToPointThreePercentMemberbcs:StrongIncludingInvestmentGradeMember2023-12-310000312069ifrs-full:MortgagesMemberbcs:ProbabilityOfDefaultPointThreeToPointSixPercentMemberifrs-full:GrossCarryingAmountMemberbcs:StrongIncludingInvestmentGradeMemberifrs-full:TwelvemonthExpectedCreditLossesMember2023-12-310000312069ifrs-full:LifetimeExpectedCreditLossesMemberifrs-full:MortgagesMemberbcs:ProbabilityOfDefaultPointThreeToPointSixPercentMemberifrs-full:GrossCarryingAmountMemberifrs-full:FinancialInstrumentsNotCreditimpairedMemberbcs:StrongIncludingInvestmentGradeMember2023-12-310000312069ifrs-full:LifetimeExpectedCreditLossesMemberifrs-full:MortgagesMemberbcs:ProbabilityOfDefaultPointThreeToPointSixPercentMemberifrs-full:FinancialInstrumentsCreditimpairedMemberifrs-full:GrossCarryingAmountMemberbcs:StrongIncludingInvestmentGradeMember2023-12-310000312069ifrs-full:MortgagesMemberbcs:ProbabilityOfDefaultPointThreeToPointSixPercentMemberifrs-full:GrossCarryingAmountMemberbcs:ExpectedCreditLossesMemberbcs:StrongIncludingInvestmentGradeMember2023-12-310000312069ifrs-full:AccumulatedImpairmentMemberifrs-full:MortgagesMemberbcs:ProbabilityOfDefaultPointThreeToPointSixPercentMemberbcs:StrongIncludingInvestmentGradeMemberifrs-full:TwelvemonthExpectedCreditLossesMember2023-12-310000312069ifrs-full:AccumulatedImpairmentMemberifrs-full:LifetimeExpectedCreditLossesMemberifrs-full:MortgagesMemberbcs:ProbabilityOfDefaultPointThreeToPointSixPercentMemberifrs-full:FinancialInstrumentsNotCreditimpairedMemberbcs:StrongIncludingInvestmentGradeMember2023-12-310000312069ifrs-full:AccumulatedImpairmentMemberifrs-full:LifetimeExpectedCreditLossesMemberifrs-full:MortgagesMemberbcs:ProbabilityOfDefaultPointThreeToPointSixPercentMemberifrs-full:FinancialInstrumentsCreditimpairedMemberbcs:StrongIncludingInvestmentGradeMember2023-12-310000312069ifrs-full:AccumulatedImpairmentMemberifrs-full:MortgagesMemberbcs:ProbabilityOfDefaultPointThreeToPointSixPercentMemberbcs:ExpectedCreditLossesMemberbcs:StrongIncludingInvestmentGradeMember2023-12-310000312069ifrs-full:MortgagesMemberbcs:ProbabilityOfDefaultPointThreeToPointSixPercentMemberbcs:StrongIncludingInvestmentGradeMember2023-12-310000312069bcs:ProbabilityOfDefaultPointSixtyToTwoPointOneFivePercentMemberifrs-full:MortgagesMemberbcs:SatisfactoryBBPlusToBMemberifrs-full:GrossCarryingAmountMemberifrs-full:TwelvemonthExpectedCreditLossesMember2023-12-310000312069bcs:ProbabilityOfDefaultPointSixtyToTwoPointOneFivePercentMemberifrs-full:LifetimeExpectedCreditLossesMemberifrs-full:MortgagesMemberbcs:SatisfactoryBBPlusToBMemberifrs-full:GrossCarryingAmountMemberifrs-full:FinancialInstrumentsNotCreditimpairedMember2023-12-310000312069bcs:ProbabilityOfDefaultPointSixtyToTwoPointOneFivePercentMemberifrs-full:LifetimeExpectedCreditLossesMemberifrs-full:MortgagesMemberifrs-full:FinancialInstrumentsCreditimpairedMemberbcs:SatisfactoryBBPlusToBMemberifrs-full:GrossCarryingAmountMember2023-12-310000312069bcs:ProbabilityOfDefaultPointSixtyToTwoPointOneFivePercentMemberifrs-full:MortgagesMemberbcs:SatisfactoryBBPlusToBMemberifrs-full:GrossCarryingAmountMemberbcs:ExpectedCreditLossesMember2023-12-310000312069bcs:ProbabilityOfDefaultPointSixtyToTwoPointOneFivePercentMemberifrs-full:AccumulatedImpairmentMemberifrs-full:MortgagesMemberbcs:SatisfactoryBBPlusToBMemberifrs-full:TwelvemonthExpectedCreditLossesMember2023-12-310000312069bcs:ProbabilityOfDefaultPointSixtyToTwoPointOneFivePercentMemberifrs-full:AccumulatedImpairmentMemberifrs-full:LifetimeExpectedCreditLossesMemberifrs-full:MortgagesMemberbcs:SatisfactoryBBPlusToBMemberifrs-full:FinancialInstrumentsNotCreditimpairedMember2023-12-310000312069bcs:ProbabilityOfDefaultPointSixtyToTwoPointOneFivePercentMemberifrs-full:AccumulatedImpairmentMemberifrs-full:LifetimeExpectedCreditLossesMemberifrs-full:MortgagesMemberifrs-full:FinancialInstrumentsCreditimpairedMemberbcs:SatisfactoryBBPlusToBMember2023-12-310000312069bcs:ProbabilityOfDefaultPointSixtyToTwoPointOneFivePercentMemberifrs-full:AccumulatedImpairmentMemberifrs-full:MortgagesMemberbcs:SatisfactoryBBPlusToBMemberbcs:ExpectedCreditLossesMember2023-12-310000312069bcs:ProbabilityOfDefaultPointSixtyToTwoPointOneFivePercentMemberifrs-full:MortgagesMemberbcs:SatisfactoryBBPlusToBMember2023-12-310000312069bcs:ProbabilityOfDefaultTwoPointOneFiveToElevenPointThreeFivePercentMemberifrs-full:MortgagesMemberbcs:SatisfactoryBBPlusToBMemberifrs-full:GrossCarryingAmountMemberifrs-full:TwelvemonthExpectedCreditLossesMember2023-12-310000312069ifrs-full:LifetimeExpectedCreditLossesMemberbcs:ProbabilityOfDefaultTwoPointOneFiveToElevenPointThreeFivePercentMemberifrs-full:MortgagesMemberbcs:SatisfactoryBBPlusToBMemberifrs-full:GrossCarryingAmountMemberifrs-full:FinancialInstrumentsNotCreditimpairedMember2023-12-310000312069ifrs-full:LifetimeExpectedCreditLossesMemberbcs:ProbabilityOfDefaultTwoPointOneFiveToElevenPointThreeFivePercentMemberifrs-full:MortgagesMemberifrs-full:FinancialInstrumentsCreditimpairedMemberbcs:SatisfactoryBBPlusToBMemberifrs-full:GrossCarryingAmountMember2023-12-310000312069bcs:ProbabilityOfDefaultTwoPointOneFiveToElevenPointThreeFivePercentMemberifrs-full:MortgagesMemberbcs:SatisfactoryBBPlusToBMemberifrs-full:GrossCarryingAmountMemberbcs:ExpectedCreditLossesMember2023-12-310000312069ifrs-full:AccumulatedImpairmentMemberbcs:ProbabilityOfDefaultTwoPointOneFiveToElevenPointThreeFivePercentMemberifrs-full:MortgagesMemberbcs:SatisfactoryBBPlusToBMemberifrs-full:TwelvemonthExpectedCreditLossesMember2023-12-310000312069ifrs-full:AccumulatedImpairmentMemberifrs-full:LifetimeExpectedCreditLossesMemberbcs:ProbabilityOfDefaultTwoPointOneFiveToElevenPointThreeFivePercentMemberifrs-full:MortgagesMemberbcs:SatisfactoryBBPlusToBMemberifrs-full:FinancialInstrumentsNotCreditimpairedMember2023-12-310000312069ifrs-full:AccumulatedImpairmentMemberifrs-full:LifetimeExpectedCreditLossesMemberbcs:ProbabilityOfDefaultTwoPointOneFiveToElevenPointThreeFivePercentMemberifrs-full:MortgagesMemberifrs-full:FinancialInstrumentsCreditimpairedMemberbcs:SatisfactoryBBPlusToBMember2023-12-310000312069ifrs-full:AccumulatedImpairmentMemberbcs:ProbabilityOfDefaultTwoPointOneFiveToElevenPointThreeFivePercentMemberifrs-full:MortgagesMemberbcs:SatisfactoryBBPlusToBMemberbcs:ExpectedCreditLossesMember2023-12-310000312069bcs:ProbabilityOfDefaultTwoPointOneFiveToElevenPointThreeFivePercentMemberifrs-full:MortgagesMemberbcs:SatisfactoryBBPlusToBMember2023-12-310000312069bcs:ProbabilityOfDefaultElevenPointThreeFiveToOneHundredPercentMemberifrs-full:MortgagesMemberbcs:HigherRiskBMinusAndBelowMemberifrs-full:GrossCarryingAmountMemberifrs-full:TwelvemonthExpectedCreditLossesMember2023-12-310000312069ifrs-full:LifetimeExpectedCreditLossesMemberbcs:ProbabilityOfDefaultElevenPointThreeFiveToOneHundredPercentMemberifrs-full:MortgagesMemberbcs:HigherRiskBMinusAndBelowMemberifrs-full:GrossCarryingAmountMemberifrs-full:FinancialInstrumentsNotCreditimpairedMember2023-12-310000312069ifrs-full:LifetimeExpectedCreditLossesMemberbcs:ProbabilityOfDefaultElevenPointThreeFiveToOneHundredPercentMemberifrs-full:MortgagesMemberifrs-full:FinancialInstrumentsCreditimpairedMemberbcs:HigherRiskBMinusAndBelowMemberifrs-full:GrossCarryingAmountMember2023-12-310000312069bcs:ProbabilityOfDefaultElevenPointThreeFiveToOneHundredPercentMemberifrs-full:MortgagesMemberbcs:HigherRiskBMinusAndBelowMemberifrs-full:GrossCarryingAmountMemberbcs:ExpectedCreditLossesMember2023-12-310000312069ifrs-full:AccumulatedImpairmentMemberbcs:ProbabilityOfDefaultElevenPointThreeFiveToOneHundredPercentMemberifrs-full:MortgagesMemberbcs:HigherRiskBMinusAndBelowMemberifrs-full:TwelvemonthExpectedCreditLossesMember2023-12-310000312069ifrs-full:AccumulatedImpairmentMemberifrs-full:LifetimeExpectedCreditLossesMemberbcs:ProbabilityOfDefaultElevenPointThreeFiveToOneHundredPercentMemberifrs-full:MortgagesMemberbcs:HigherRiskBMinusAndBelowMemberifrs-full:FinancialInstrumentsNotCreditimpairedMember2023-12-310000312069ifrs-full:AccumulatedImpairmentMemberifrs-full:LifetimeExpectedCreditLossesMemberbcs:ProbabilityOfDefaultElevenPointThreeFiveToOneHundredPercentMemberifrs-full:MortgagesMemberifrs-full:FinancialInstrumentsCreditimpairedMemberbcs:HigherRiskBMinusAndBelowMember2023-12-310000312069ifrs-full:AccumulatedImpairmentMemberbcs:ProbabilityOfDefaultElevenPointThreeFiveToOneHundredPercentMemberifrs-full:MortgagesMemberbcs:HigherRiskBMinusAndBelowMemberbcs:ExpectedCreditLossesMember2023-12-310000312069ifrs-full:MortgagesMemberbcs:ProbabilityOfDefaultElevenPointThreeFiveToOneHundredPercentMemberbcs:HigherRiskBMinusAndBelowMember2023-12-310000312069ifrs-full:MortgagesMemberbcs:ProbabilityOfDefaultOneHundredPercentMemberifrs-full:GrossCarryingAmountMemberifrs-full:TwelvemonthExpectedCreditLossesMember2023-12-310000312069ifrs-full:LifetimeExpectedCreditLossesMemberifrs-full:MortgagesMemberbcs:ProbabilityOfDefaultOneHundredPercentMemberifrs-full:GrossCarryingAmountMemberifrs-full:FinancialInstrumentsNotCreditimpairedMember2023-12-310000312069ifrs-full:LifetimeExpectedCreditLossesMemberifrs-full:MortgagesMemberifrs-full:FinancialInstrumentsCreditimpairedMemberbcs:ProbabilityOfDefaultOneHundredPercentMemberifrs-full:GrossCarryingAmountMember2023-12-310000312069ifrs-full:MortgagesMemberbcs:ProbabilityOfDefaultOneHundredPercentMemberifrs-full:GrossCarryingAmountMemberbcs:ExpectedCreditLossesMember2023-12-310000312069ifrs-full:AccumulatedImpairmentMemberifrs-full:MortgagesMemberbcs:ProbabilityOfDefaultOneHundredPercentMemberifrs-full:TwelvemonthExpectedCreditLossesMember2023-12-310000312069ifrs-full:AccumulatedImpairmentMemberifrs-full:LifetimeExpectedCreditLossesMemberifrs-full:MortgagesMemberbcs:ProbabilityOfDefaultOneHundredPercentMemberifrs-full:FinancialInstrumentsNotCreditimpairedMember2023-12-310000312069ifrs-full:AccumulatedImpairmentMemberifrs-full:LifetimeExpectedCreditLossesMemberifrs-full:MortgagesMemberifrs-full:FinancialInstrumentsCreditimpairedMemberbcs:ProbabilityOfDefaultOneHundredPercentMember2023-12-310000312069ifrs-full:AccumulatedImpairmentMemberifrs-full:MortgagesMemberbcs:ProbabilityOfDefaultOneHundredPercentMemberbcs:ExpectedCreditLossesMember2023-12-310000312069ifrs-full:MortgagesMemberbcs:ProbabilityOfDefaultOneHundredPercentMember2023-12-310000312069ifrs-full:MortgagesMemberifrs-full:GrossCarryingAmountMemberbcs:ExpectedCreditLossesMember2023-12-310000312069ifrs-full:AccumulatedImpairmentMemberifrs-full:MortgagesMemberbcs:ExpectedCreditLossesMember2023-12-310000312069ifrs-full:MortgagesMember2023-12-310000312069bcs:CreditCardsRetailMemberbcs:ProbabilityOfDefaultZeroToPointZeroFivePercentMemberifrs-full:GrossCarryingAmountMemberbcs:StrongIncludingInvestmentGradeMemberifrs-full:TwelvemonthExpectedCreditLossesMember2023-12-310000312069bcs:CreditCardsRetailMemberifrs-full:LifetimeExpectedCreditLossesMemberbcs:ProbabilityOfDefaultZeroToPointZeroFivePercentMemberifrs-full:GrossCarryingAmountMemberifrs-full:FinancialInstrumentsNotCreditimpairedMemberbcs:StrongIncludingInvestmentGradeMember2023-12-310000312069bcs:CreditCardsRetailMemberifrs-full:LifetimeExpectedCreditLossesMemberbcs:ProbabilityOfDefaultZeroToPointZeroFivePercentMemberifrs-full:FinancialInstrumentsCreditimpairedMemberifrs-full:GrossCarryingAmountMemberbcs:StrongIncludingInvestmentGradeMember2023-12-310000312069bcs:CreditCardsRetailMemberbcs:ProbabilityOfDefaultZeroToPointZeroFivePercentMemberifrs-full:GrossCarryingAmountMemberbcs:ExpectedCreditLossesMemberbcs:StrongIncludingInvestmentGradeMember2023-12-310000312069bcs:CreditCardsRetailMemberifrs-full:AccumulatedImpairmentMemberbcs:ProbabilityOfDefaultZeroToPointZeroFivePercentMemberbcs:StrongIncludingInvestmentGradeMemberifrs-full:TwelvemonthExpectedCreditLossesMember2023-12-310000312069bcs:CreditCardsRetailMemberifrs-full:AccumulatedImpairmentMemberifrs-full:LifetimeExpectedCreditLossesMemberbcs:ProbabilityOfDefaultZeroToPointZeroFivePercentMemberifrs-full:FinancialInstrumentsNotCreditimpairedMemberbcs:StrongIncludingInvestmentGradeMember2023-12-310000312069bcs:CreditCardsRetailMemberifrs-full:AccumulatedImpairmentMemberifrs-full:LifetimeExpectedCreditLossesMemberbcs:ProbabilityOfDefaultZeroToPointZeroFivePercentMemberifrs-full:FinancialInstrumentsCreditimpairedMemberbcs:StrongIncludingInvestmentGradeMember2023-12-310000312069bcs:CreditCardsRetailMemberifrs-full:AccumulatedImpairmentMemberbcs:ProbabilityOfDefaultZeroToPointZeroFivePercentMemberbcs:ExpectedCreditLossesMemberbcs:StrongIncludingInvestmentGradeMember2023-12-310000312069bcs:CreditCardsRetailMemberbcs:ProbabilityOfDefaultZeroToPointZeroFivePercentMemberbcs:StrongIncludingInvestmentGradeMember2023-12-310000312069bcs:CreditCardsRetailMemberifrs-full:GrossCarryingAmountMemberbcs:ProbabilityOfDefaultPointZeroFiveToPointOneFivePercentMemberbcs:StrongIncludingInvestmentGradeMemberifrs-full:TwelvemonthExpectedCreditLossesMember2023-12-310000312069bcs:CreditCardsRetailMemberifrs-full:LifetimeExpectedCreditLossesMemberifrs-full:GrossCarryingAmountMemberbcs:ProbabilityOfDefaultPointZeroFiveToPointOneFivePercentMemberifrs-full:FinancialInstrumentsNotCreditimpairedMemberbcs:StrongIncludingInvestmentGradeMember2023-12-310000312069bcs:CreditCardsRetailMemberifrs-full:LifetimeExpectedCreditLossesMemberifrs-full:FinancialInstrumentsCreditimpairedMemberifrs-full:GrossCarryingAmountMemberbcs:ProbabilityOfDefaultPointZeroFiveToPointOneFivePercentMemberbcs:StrongIncludingInvestmentGradeMember2023-12-310000312069bcs:CreditCardsRetailMemberifrs-full:GrossCarryingAmountMemberbcs:ExpectedCreditLossesMemberbcs:ProbabilityOfDefaultPointZeroFiveToPointOneFivePercentMemberbcs:StrongIncludingInvestmentGradeMember2023-12-310000312069bcs:CreditCardsRetailMemberifrs-full:AccumulatedImpairmentMemberbcs:ProbabilityOfDefaultPointZeroFiveToPointOneFivePercentMemberbcs:StrongIncludingInvestmentGradeMemberifrs-full:TwelvemonthExpectedCreditLossesMember2023-12-310000312069bcs:CreditCardsRetailMemberifrs-full:AccumulatedImpairmentMemberifrs-full:LifetimeExpectedCreditLossesMemberbcs:ProbabilityOfDefaultPointZeroFiveToPointOneFivePercentMemberifrs-full:FinancialInstrumentsNotCreditimpairedMemberbcs:StrongIncludingInvestmentGradeMember2023-12-310000312069bcs:CreditCardsRetailMemberifrs-full:AccumulatedImpairmentMemberifrs-full:LifetimeExpectedCreditLossesMemberifrs-full:FinancialInstrumentsCreditimpairedMemberbcs:ProbabilityOfDefaultPointZeroFiveToPointOneFivePercentMemberbcs:StrongIncludingInvestmentGradeMember2023-12-310000312069bcs:CreditCardsRetailMemberifrs-full:AccumulatedImpairmentMemberbcs:ExpectedCreditLossesMemberbcs:ProbabilityOfDefaultPointZeroFiveToPointOneFivePercentMemberbcs:StrongIncludingInvestmentGradeMember2023-12-310000312069bcs:CreditCardsRetailMemberbcs:ProbabilityOfDefaultPointZeroFiveToPointOneFivePercentMemberbcs:StrongIncludingInvestmentGradeMember2023-12-310000312069bcs:CreditCardsRetailMemberbcs:ProbabilityOfDefaultPointOneFiveToPointThreePercentMemberifrs-full:GrossCarryingAmountMemberbcs:StrongIncludingInvestmentGradeMemberifrs-full:TwelvemonthExpectedCreditLossesMember2023-12-310000312069bcs:CreditCardsRetailMemberifrs-full:LifetimeExpectedCreditLossesMemberbcs:ProbabilityOfDefaultPointOneFiveToPointThreePercentMemberifrs-full:GrossCarryingAmountMemberifrs-full:FinancialInstrumentsNotCreditimpairedMemberbcs:StrongIncludingInvestmentGradeMember2023-12-310000312069bcs:CreditCardsRetailMemberifrs-full:LifetimeExpectedCreditLossesMemberifrs-full:FinancialInstrumentsCreditimpairedMemberbcs:ProbabilityOfDefaultPointOneFiveToPointThreePercentMemberifrs-full:GrossCarryingAmountMemberbcs:StrongIncludingInvestmentGradeMember2023-12-310000312069bcs:CreditCardsRetailMemberbcs:ProbabilityOfDefaultPointOneFiveToPointThreePercentMemberifrs-full:GrossCarryingAmountMemberbcs:ExpectedCreditLossesMemberbcs:StrongIncludingInvestmentGradeMember2023-12-310000312069bcs:CreditCardsRetailMemberifrs-full:AccumulatedImpairmentMemberbcs:ProbabilityOfDefaultPointOneFiveToPointThreePercentMemberbcs:StrongIncludingInvestmentGradeMemberifrs-full:TwelvemonthExpectedCreditLossesMember2023-12-310000312069bcs:CreditCardsRetailMemberifrs-full:AccumulatedImpairmentMemberifrs-full:LifetimeExpectedCreditLossesMemberbcs:ProbabilityOfDefaultPointOneFiveToPointThreePercentMemberifrs-full:FinancialInstrumentsNotCreditimpairedMemberbcs:StrongIncludingInvestmentGradeMember2023-12-310000312069bcs:CreditCardsRetailMemberifrs-full:AccumulatedImpairmentMemberifrs-full:LifetimeExpectedCreditLossesMemberifrs-full:FinancialInstrumentsCreditimpairedMemberbcs:ProbabilityOfDefaultPointOneFiveToPointThreePercentMemberbcs:StrongIncludingInvestmentGradeMember2023-12-310000312069bcs:CreditCardsRetailMemberifrs-full:AccumulatedImpairmentMemberbcs:ProbabilityOfDefaultPointOneFiveToPointThreePercentMemberbcs:ExpectedCreditLossesMemberbcs:StrongIncludingInvestmentGradeMember2023-12-310000312069bcs:CreditCardsRetailMemberbcs:ProbabilityOfDefaultPointOneFiveToPointThreePercentMemberbcs:StrongIncludingInvestmentGradeMember2023-12-310000312069bcs:CreditCardsRetailMemberbcs:ProbabilityOfDefaultPointThreeToPointSixPercentMemberifrs-full:GrossCarryingAmountMemberbcs:StrongIncludingInvestmentGradeMemberifrs-full:TwelvemonthExpectedCreditLossesMember2023-12-310000312069bcs:CreditCardsRetailMemberifrs-full:LifetimeExpectedCreditLossesMemberbcs:ProbabilityOfDefaultPointThreeToPointSixPercentMemberifrs-full:GrossCarryingAmountMemberifrs-full:FinancialInstrumentsNotCreditimpairedMemberbcs:StrongIncludingInvestmentGradeMember2023-12-310000312069bcs:CreditCardsRetailMemberifrs-full:LifetimeExpectedCreditLossesMemberbcs:ProbabilityOfDefaultPointThreeToPointSixPercentMemberifrs-full:FinancialInstrumentsCreditimpairedMemberifrs-full:GrossCarryingAmountMemberbcs:StrongIncludingInvestmentGradeMember2023-12-310000312069bcs:CreditCardsRetailMemberbcs:ProbabilityOfDefaultPointThreeToPointSixPercentMemberifrs-full:GrossCarryingAmountMemberbcs:ExpectedCreditLossesMemberbcs:StrongIncludingInvestmentGradeMember2023-12-310000312069bcs:CreditCardsRetailMemberifrs-full:AccumulatedImpairmentMemberbcs:ProbabilityOfDefaultPointThreeToPointSixPercentMemberbcs:StrongIncludingInvestmentGradeMemberifrs-full:TwelvemonthExpectedCreditLossesMember2023-12-310000312069bcs:CreditCardsRetailMemberifrs-full:AccumulatedImpairmentMemberifrs-full:LifetimeExpectedCreditLossesMemberbcs:ProbabilityOfDefaultPointThreeToPointSixPercentMemberifrs-full:FinancialInstrumentsNotCreditimpairedMemberbcs:StrongIncludingInvestmentGradeMember2023-12-310000312069bcs:CreditCardsRetailMemberifrs-full:AccumulatedImpairmentMemberifrs-full:LifetimeExpectedCreditLossesMemberbcs:ProbabilityOfDefaultPointThreeToPointSixPercentMemberifrs-full:FinancialInstrumentsCreditimpairedMemberbcs:StrongIncludingInvestmentGradeMember2023-12-310000312069bcs:CreditCardsRetailMemberifrs-full:AccumulatedImpairmentMemberbcs:ProbabilityOfDefaultPointThreeToPointSixPercentMemberbcs:ExpectedCreditLossesMemberbcs:StrongIncludingInvestmentGradeMember2023-12-310000312069bcs:CreditCardsRetailMemberbcs:ProbabilityOfDefaultPointThreeToPointSixPercentMemberbcs:StrongIncludingInvestmentGradeMember2023-12-310000312069bcs:ProbabilityOfDefaultPointSixtyToTwoPointOneFivePercentMemberbcs:CreditCardsRetailMemberbcs:SatisfactoryBBPlusToBMemberifrs-full:GrossCarryingAmountMemberifrs-full:TwelvemonthExpectedCreditLossesMember2023-12-310000312069bcs:ProbabilityOfDefaultPointSixtyToTwoPointOneFivePercentMemberbcs:CreditCardsRetailMemberifrs-full:LifetimeExpectedCreditLossesMemberbcs:SatisfactoryBBPlusToBMemberifrs-full:GrossCarryingAmountMemberifrs-full:FinancialInstrumentsNotCreditimpairedMember2023-12-310000312069bcs:ProbabilityOfDefaultPointSixtyToTwoPointOneFivePercentMemberbcs:CreditCardsRetailMemberifrs-full:LifetimeExpectedCreditLossesMemberifrs-full:FinancialInstrumentsCreditimpairedMemberbcs:SatisfactoryBBPlusToBMemberifrs-full:GrossCarryingAmountMember2023-12-310000312069bcs:ProbabilityOfDefaultPointSixtyToTwoPointOneFivePercentMemberbcs:CreditCardsRetailMemberbcs:SatisfactoryBBPlusToBMemberifrs-full:GrossCarryingAmountMemberbcs:ExpectedCreditLossesMember2023-12-310000312069bcs:ProbabilityOfDefaultPointSixtyToTwoPointOneFivePercentMemberbcs:CreditCardsRetailMemberifrs-full:AccumulatedImpairmentMemberbcs:SatisfactoryBBPlusToBMemberifrs-full:TwelvemonthExpectedCreditLossesMember2023-12-310000312069bcs:ProbabilityOfDefaultPointSixtyToTwoPointOneFivePercentMemberbcs:CreditCardsRetailMemberifrs-full:AccumulatedImpairmentMemberifrs-full:LifetimeExpectedCreditLossesMemberbcs:SatisfactoryBBPlusToBMemberifrs-full:FinancialInstrumentsNotCreditimpairedMember2023-12-310000312069bcs:ProbabilityOfDefaultPointSixtyToTwoPointOneFivePercentMemberbcs:CreditCardsRetailMemberifrs-full:AccumulatedImpairmentMemberifrs-full:LifetimeExpectedCreditLossesMemberifrs-full:FinancialInstrumentsCreditimpairedMemberbcs:SatisfactoryBBPlusToBMember2023-12-310000312069bcs:ProbabilityOfDefaultPointSixtyToTwoPointOneFivePercentMemberbcs:CreditCardsRetailMemberifrs-full:AccumulatedImpairmentMemberbcs:SatisfactoryBBPlusToBMemberbcs:ExpectedCreditLossesMember2023-12-310000312069bcs:CreditCardsRetailMemberbcs:ProbabilityOfDefaultPointSixtyToTwoPointOneFivePercentMemberbcs:SatisfactoryBBPlusToBMember2023-12-310000312069bcs:CreditCardsRetailMemberbcs:ProbabilityOfDefaultTwoPointOneFiveToElevenPointThreeFivePercentMemberbcs:SatisfactoryBBPlusToBMemberifrs-full:GrossCarryingAmountMemberifrs-full:TwelvemonthExpectedCreditLossesMember2023-12-310000312069bcs:CreditCardsRetailMemberifrs-full:LifetimeExpectedCreditLossesMemberbcs:ProbabilityOfDefaultTwoPointOneFiveToElevenPointThreeFivePercentMemberbcs:SatisfactoryBBPlusToBMemberifrs-full:GrossCarryingAmountMemberifrs-full:FinancialInstrumentsNotCreditimpairedMember2023-12-310000312069bcs:CreditCardsRetailMemberifrs-full:LifetimeExpectedCreditLossesMemberbcs:ProbabilityOfDefaultTwoPointOneFiveToElevenPointThreeFivePercentMemberifrs-full:FinancialInstrumentsCreditimpairedMemberbcs:SatisfactoryBBPlusToBMemberifrs-full:GrossCarryingAmountMember2023-12-310000312069bcs:CreditCardsRetailMemberbcs:ProbabilityOfDefaultTwoPointOneFiveToElevenPointThreeFivePercentMemberbcs:SatisfactoryBBPlusToBMemberifrs-full:GrossCarryingAmountMemberbcs:ExpectedCreditLossesMember2023-12-310000312069bcs:CreditCardsRetailMemberifrs-full:AccumulatedImpairmentMemberbcs:ProbabilityOfDefaultTwoPointOneFiveToElevenPointThreeFivePercentMemberbcs:SatisfactoryBBPlusToBMemberifrs-full:TwelvemonthExpectedCreditLossesMember2023-12-310000312069bcs:CreditCardsRetailMemberifrs-full:AccumulatedImpairmentMemberifrs-full:LifetimeExpectedCreditLossesMemberbcs:ProbabilityOfDefaultTwoPointOneFiveToElevenPointThreeFivePercentMemberbcs:SatisfactoryBBPlusToBMemberifrs-full:FinancialInstrumentsNotCreditimpairedMember2023-12-310000312069bcs:CreditCardsRetailMemberifrs-full:AccumulatedImpairmentMemberifrs-full:LifetimeExpectedCreditLossesMemberbcs:ProbabilityOfDefaultTwoPointOneFiveToElevenPointThreeFivePercentMemberifrs-full:FinancialInstrumentsCreditimpairedMemberbcs:SatisfactoryBBPlusToBMember2023-12-310000312069bcs:CreditCardsRetailMemberifrs-full:AccumulatedImpairmentMemberbcs:ProbabilityOfDefaultTwoPointOneFiveToElevenPointThreeFivePercentMemberbcs:SatisfactoryBBPlusToBMemberbcs:ExpectedCreditLossesMember2023-12-310000312069bcs:CreditCardsRetailMemberbcs:ProbabilityOfDefaultTwoPointOneFiveToElevenPointThreeFivePercentMemberbcs:SatisfactoryBBPlusToBMember2023-12-310000312069bcs:CreditCardsRetailMemberbcs:ProbabilityOfDefaultElevenPointThreeFiveToOneHundredPercentMemberbcs:HigherRiskBMinusAndBelowMemberifrs-full:GrossCarryingAmountMemberifrs-full:TwelvemonthExpectedCreditLossesMember2023-12-310000312069bcs:CreditCardsRetailMemberifrs-full:LifetimeExpectedCreditLossesMemberbcs:ProbabilityOfDefaultElevenPointThreeFiveToOneHundredPercentMemberbcs:HigherRiskBMinusAndBelowMemberifrs-full:GrossCarryingAmountMemberifrs-full:FinancialInstrumentsNotCreditimpairedMember2023-12-310000312069bcs:CreditCardsRetailMemberifrs-full:LifetimeExpectedCreditLossesMemberbcs:ProbabilityOfDefaultElevenPointThreeFiveToOneHundredPercentMemberifrs-full:FinancialInstrumentsCreditimpairedMemberbcs:HigherRiskBMinusAndBelowMemberifrs-full:GrossCarryingAmountMember2023-12-310000312069bcs:CreditCardsRetailMemberbcs:ProbabilityOfDefaultElevenPointThreeFiveToOneHundredPercentMemberbcs:HigherRiskBMinusAndBelowMemberifrs-full:GrossCarryingAmountMemberbcs:ExpectedCreditLossesMember2023-12-310000312069bcs:CreditCardsRetailMemberifrs-full:AccumulatedImpairmentMemberbcs:ProbabilityOfDefaultElevenPointThreeFiveToOneHundredPercentMemberbcs:HigherRiskBMinusAndBelowMemberifrs-full:TwelvemonthExpectedCreditLossesMember2023-12-310000312069bcs:CreditCardsRetailMemberifrs-full:AccumulatedImpairmentMemberifrs-full:LifetimeExpectedCreditLossesMemberbcs:ProbabilityOfDefaultElevenPointThreeFiveToOneHundredPercentMemberbcs:HigherRiskBMinusAndBelowMemberifrs-full:FinancialInstrumentsNotCreditimpairedMember2023-12-310000312069bcs:CreditCardsRetailMemberifrs-full:AccumulatedImpairmentMemberifrs-full:LifetimeExpectedCreditLossesMemberbcs:ProbabilityOfDefaultElevenPointThreeFiveToOneHundredPercentMemberifrs-full:FinancialInstrumentsCreditimpairedMemberbcs:HigherRiskBMinusAndBelowMember2023-12-310000312069bcs:CreditCardsRetailMemberifrs-full:AccumulatedImpairmentMemberbcs:ProbabilityOfDefaultElevenPointThreeFiveToOneHundredPercentMemberbcs:HigherRiskBMinusAndBelowMemberbcs:ExpectedCreditLossesMember2023-12-310000312069bcs:CreditCardsRetailMemberbcs:ProbabilityOfDefaultElevenPointThreeFiveToOneHundredPercentMemberbcs:HigherRiskBMinusAndBelowMember2023-12-310000312069bcs:CreditCardsRetailMemberbcs:ProbabilityOfDefaultOneHundredPercentMemberifrs-full:GrossCarryingAmountMemberifrs-full:TwelvemonthExpectedCreditLossesMember2023-12-310000312069bcs:CreditCardsRetailMemberifrs-full:LifetimeExpectedCreditLossesMemberbcs:ProbabilityOfDefaultOneHundredPercentMemberifrs-full:GrossCarryingAmountMemberifrs-full:FinancialInstrumentsNotCreditimpairedMember2023-12-310000312069bcs:CreditCardsRetailMemberifrs-full:LifetimeExpectedCreditLossesMemberifrs-full:FinancialInstrumentsCreditimpairedMemberbcs:ProbabilityOfDefaultOneHundredPercentMemberifrs-full:GrossCarryingAmountMember2023-12-310000312069bcs:CreditCardsRetailMemberbcs:ProbabilityOfDefaultOneHundredPercentMemberifrs-full:GrossCarryingAmountMemberbcs:ExpectedCreditLossesMember2023-12-310000312069bcs:CreditCardsRetailMemberifrs-full:AccumulatedImpairmentMemberbcs:ProbabilityOfDefaultOneHundredPercentMemberifrs-full:TwelvemonthExpectedCreditLossesMember2023-12-310000312069bcs:CreditCardsRetailMemberifrs-full:AccumulatedImpairmentMemberifrs-full:LifetimeExpectedCreditLossesMemberbcs:ProbabilityOfDefaultOneHundredPercentMemberifrs-full:FinancialInstrumentsNotCreditimpairedMember2023-12-310000312069bcs:CreditCardsRetailMemberifrs-full:AccumulatedImpairmentMemberifrs-full:LifetimeExpectedCreditLossesMemberifrs-full:FinancialInstrumentsCreditimpairedMemberbcs:ProbabilityOfDefaultOneHundredPercentMember2023-12-310000312069bcs:CreditCardsRetailMemberifrs-full:AccumulatedImpairmentMemberbcs:ProbabilityOfDefaultOneHundredPercentMemberbcs:ExpectedCreditLossesMember2023-12-310000312069bcs:CreditCardsRetailMemberbcs:ProbabilityOfDefaultOneHundredPercentMember2023-12-310000312069bcs:CreditCardsRetailMemberifrs-full:GrossCarryingAmountMemberbcs:ExpectedCreditLossesMember2023-12-310000312069bcs:CreditCardsRetailMemberifrs-full:AccumulatedImpairmentMemberbcs:ExpectedCreditLossesMember2023-12-310000312069bcs:CreditCardsRetailMember2023-12-310000312069bcs:OtherRetailMemberbcs:ProbabilityOfDefaultZeroToPointZeroFivePercentMemberifrs-full:GrossCarryingAmountMemberbcs:StrongIncludingInvestmentGradeMemberifrs-full:TwelvemonthExpectedCreditLossesMember2023-12-310000312069ifrs-full:LifetimeExpectedCreditLossesMemberbcs:OtherRetailMemberbcs:ProbabilityOfDefaultZeroToPointZeroFivePercentMemberifrs-full:GrossCarryingAmountMemberifrs-full:FinancialInstrumentsNotCreditimpairedMemberbcs:StrongIncludingInvestmentGradeMember2023-12-310000312069ifrs-full:LifetimeExpectedCreditLossesMemberbcs:OtherRetailMemberbcs:ProbabilityOfDefaultZeroToPointZeroFivePercentMemberifrs-full:FinancialInstrumentsCreditimpairedMemberifrs-full:GrossCarryingAmountMemberbcs:StrongIncludingInvestmentGradeMember2023-12-310000312069bcs:OtherRetailMemberbcs:ProbabilityOfDefaultZeroToPointZeroFivePercentMemberifrs-full:GrossCarryingAmountMemberbcs:ExpectedCreditLossesMemberbcs:StrongIncludingInvestmentGradeMember2023-12-310000312069ifrs-full:AccumulatedImpairmentMemberbcs:OtherRetailMemberbcs:ProbabilityOfDefaultZeroToPointZeroFivePercentMemberbcs:StrongIncludingInvestmentGradeMemberifrs-full:TwelvemonthExpectedCreditLossesMember2023-12-310000312069ifrs-full:AccumulatedImpairmentMemberifrs-full:LifetimeExpectedCreditLossesMemberbcs:OtherRetailMemberbcs:ProbabilityOfDefaultZeroToPointZeroFivePercentMemberifrs-full:FinancialInstrumentsNotCreditimpairedMemberbcs:StrongIncludingInvestmentGradeMember2023-12-310000312069ifrs-full:AccumulatedImpairmentMemberifrs-full:LifetimeExpectedCreditLossesMemberbcs:OtherRetailMemberbcs:ProbabilityOfDefaultZeroToPointZeroFivePercentMemberifrs-full:FinancialInstrumentsCreditimpairedMemberbcs:StrongIncludingInvestmentGradeMember2023-12-310000312069ifrs-full:AccumulatedImpairmentMemberbcs:OtherRetailMemberbcs:ProbabilityOfDefaultZeroToPointZeroFivePercentMemberbcs:ExpectedCreditLossesMemberbcs:StrongIncludingInvestmentGradeMember2023-12-310000312069bcs:OtherRetailMemberbcs:ProbabilityOfDefaultZeroToPointZeroFivePercentMemberbcs:StrongIncludingInvestmentGradeMember2023-12-310000312069bcs:OtherRetailMemberifrs-full:GrossCarryingAmountMemberbcs:ProbabilityOfDefaultPointZeroFiveToPointOneFivePercentMemberbcs:StrongIncludingInvestmentGradeMemberifrs-full:TwelvemonthExpectedCreditLossesMember2023-12-310000312069ifrs-full:LifetimeExpectedCreditLossesMemberbcs:OtherRetailMemberifrs-full:GrossCarryingAmountMemberbcs:ProbabilityOfDefaultPointZeroFiveToPointOneFivePercentMemberifrs-full:FinancialInstrumentsNotCreditimpairedMemberbcs:StrongIncludingInvestmentGradeMember2023-12-310000312069ifrs-full:LifetimeExpectedCreditLossesMemberbcs:OtherRetailMemberifrs-full:FinancialInstrumentsCreditimpairedMemberifrs-full:GrossCarryingAmountMemberbcs:ProbabilityOfDefaultPointZeroFiveToPointOneFivePercentMemberbcs:StrongIncludingInvestmentGradeMember2023-12-310000312069bcs:OtherRetailMemberifrs-full:GrossCarryingAmountMemberbcs:ExpectedCreditLossesMemberbcs:ProbabilityOfDefaultPointZeroFiveToPointOneFivePercentMemberbcs:StrongIncludingInvestmentGradeMember2023-12-310000312069ifrs-full:AccumulatedImpairmentMemberbcs:OtherRetailMemberbcs:ProbabilityOfDefaultPointZeroFiveToPointOneFivePercentMemberbcs:StrongIncludingInvestmentGradeMemberifrs-full:TwelvemonthExpectedCreditLossesMember2023-12-310000312069ifrs-full:AccumulatedImpairmentMemberifrs-full:LifetimeExpectedCreditLossesMemberbcs:OtherRetailMemberbcs:ProbabilityOfDefaultPointZeroFiveToPointOneFivePercentMemberifrs-full:FinancialInstrumentsNotCreditimpairedMemberbcs:StrongIncludingInvestmentGradeMember2023-12-310000312069ifrs-full:AccumulatedImpairmentMemberifrs-full:LifetimeExpectedCreditLossesMemberbcs:OtherRetailMemberifrs-full:FinancialInstrumentsCreditimpairedMemberbcs:ProbabilityOfDefaultPointZeroFiveToPointOneFivePercentMemberbcs:StrongIncludingInvestmentGradeMember2023-12-310000312069ifrs-full:AccumulatedImpairmentMemberbcs:OtherRetailMemberbcs:ExpectedCreditLossesMemberbcs:ProbabilityOfDefaultPointZeroFiveToPointOneFivePercentMemberbcs:StrongIncludingInvestmentGradeMember2023-12-310000312069bcs:OtherRetailMemberbcs:ProbabilityOfDefaultPointZeroFiveToPointOneFivePercentMemberbcs:StrongIncludingInvestmentGradeMember2023-12-310000312069bcs:OtherRetailMemberbcs:ProbabilityOfDefaultPointOneFiveToPointThreePercentMemberifrs-full:GrossCarryingAmountMemberbcs:StrongIncludingInvestmentGradeMemberifrs-full:TwelvemonthExpectedCreditLossesMember2023-12-310000312069ifrs-full:LifetimeExpectedCreditLossesMemberbcs:OtherRetailMemberbcs:ProbabilityOfDefaultPointOneFiveToPointThreePercentMemberifrs-full:GrossCarryingAmountMemberifrs-full:FinancialInstrumentsNotCreditimpairedMemberbcs:StrongIncludingInvestmentGradeMember2023-12-310000312069ifrs-full:LifetimeExpectedCreditLossesMemberbcs:OtherRetailMemberifrs-full:FinancialInstrumentsCreditimpairedMemberbcs:ProbabilityOfDefaultPointOneFiveToPointThreePercentMemberifrs-full:GrossCarryingAmountMemberbcs:StrongIncludingInvestmentGradeMember2023-12-310000312069bcs:OtherRetailMemberbcs:ProbabilityOfDefaultPointOneFiveToPointThreePercentMemberifrs-full:GrossCarryingAmountMemberbcs:ExpectedCreditLossesMemberbcs:StrongIncludingInvestmentGradeMember2023-12-310000312069ifrs-full:AccumulatedImpairmentMemberbcs:OtherRetailMemberbcs:ProbabilityOfDefaultPointOneFiveToPointThreePercentMemberbcs:StrongIncludingInvestmentGradeMemberifrs-full:TwelvemonthExpectedCreditLossesMember2023-12-310000312069ifrs-full:AccumulatedImpairmentMemberifrs-full:LifetimeExpectedCreditLossesMemberbcs:OtherRetailMemberbcs:ProbabilityOfDefaultPointOneFiveToPointThreePercentMemberifrs-full:FinancialInstrumentsNotCreditimpairedMemberbcs:StrongIncludingInvestmentGradeMember2023-12-310000312069ifrs-full:AccumulatedImpairmentMemberifrs-full:LifetimeExpectedCreditLossesMemberbcs:OtherRetailMemberifrs-full:FinancialInstrumentsCreditimpairedMemberbcs:ProbabilityOfDefaultPointOneFiveToPointThreePercentMemberbcs:StrongIncludingInvestmentGradeMember2023-12-310000312069ifrs-full:AccumulatedImpairmentMemberbcs:OtherRetailMemberbcs:ProbabilityOfDefaultPointOneFiveToPointThreePercentMemberbcs:ExpectedCreditLossesMemberbcs:StrongIncludingInvestmentGradeMember2023-12-310000312069bcs:OtherRetailMemberbcs:ProbabilityOfDefaultPointOneFiveToPointThreePercentMemberbcs:StrongIncludingInvestmentGradeMember2023-12-310000312069bcs:OtherRetailMemberbcs:ProbabilityOfDefaultPointThreeToPointSixPercentMemberifrs-full:GrossCarryingAmountMemberbcs:StrongIncludingInvestmentGradeMemberifrs-full:TwelvemonthExpectedCreditLossesMember2023-12-310000312069ifrs-full:LifetimeExpectedCreditLossesMemberbcs:OtherRetailMemberbcs:ProbabilityOfDefaultPointThreeToPointSixPercentMemberifrs-full:GrossCarryingAmountMemberifrs-full:FinancialInstrumentsNotCreditimpairedMemberbcs:StrongIncludingInvestmentGradeMember2023-12-310000312069ifrs-full:LifetimeExpectedCreditLossesMemberbcs:OtherRetailMemberbcs:ProbabilityOfDefaultPointThreeToPointSixPercentMemberifrs-full:FinancialInstrumentsCreditimpairedMemberifrs-full:GrossCarryingAmountMemberbcs:StrongIncludingInvestmentGradeMember2023-12-310000312069bcs:OtherRetailMemberbcs:ProbabilityOfDefaultPointThreeToPointSixPercentMemberifrs-full:GrossCarryingAmountMemberbcs:ExpectedCreditLossesMemberbcs:StrongIncludingInvestmentGradeMember2023-12-310000312069ifrs-full:AccumulatedImpairmentMemberbcs:OtherRetailMemberbcs:ProbabilityOfDefaultPointThreeToPointSixPercentMemberbcs:StrongIncludingInvestmentGradeMemberifrs-full:TwelvemonthExpectedCreditLossesMember2023-12-310000312069ifrs-full:AccumulatedImpairmentMemberifrs-full:LifetimeExpectedCreditLossesMemberbcs:OtherRetailMemberbcs:ProbabilityOfDefaultPointThreeToPointSixPercentMemberifrs-full:FinancialInstrumentsNotCreditimpairedMemberbcs:StrongIncludingInvestmentGradeMember2023-12-310000312069ifrs-full:AccumulatedImpairmentMemberifrs-full:LifetimeExpectedCreditLossesMemberbcs:OtherRetailMemberbcs:ProbabilityOfDefaultPointThreeToPointSixPercentMemberifrs-full:FinancialInstrumentsCreditimpairedMemberbcs:StrongIncludingInvestmentGradeMember2023-12-310000312069ifrs-full:AccumulatedImpairmentMemberbcs:OtherRetailMemberbcs:ProbabilityOfDefaultPointThreeToPointSixPercentMemberbcs:ExpectedCreditLossesMemberbcs:StrongIncludingInvestmentGradeMember2023-12-310000312069bcs:OtherRetailMemberbcs:ProbabilityOfDefaultPointThreeToPointSixPercentMemberbcs:StrongIncludingInvestmentGradeMember2023-12-310000312069bcs:ProbabilityOfDefaultPointSixtyToTwoPointOneFivePercentMemberbcs:OtherRetailMemberbcs:SatisfactoryBBPlusToBMemberifrs-full:GrossCarryingAmountMemberifrs-full:TwelvemonthExpectedCreditLossesMember2023-12-310000312069bcs:ProbabilityOfDefaultPointSixtyToTwoPointOneFivePercentMemberifrs-full:LifetimeExpectedCreditLossesMemberbcs:OtherRetailMemberbcs:SatisfactoryBBPlusToBMemberifrs-full:GrossCarryingAmountMemberifrs-full:FinancialInstrumentsNotCreditimpairedMember2023-12-310000312069bcs:ProbabilityOfDefaultPointSixtyToTwoPointOneFivePercentMemberifrs-full:LifetimeExpectedCreditLossesMemberbcs:OtherRetailMemberifrs-full:FinancialInstrumentsCreditimpairedMemberbcs:SatisfactoryBBPlusToBMemberifrs-full:GrossCarryingAmountMember2023-12-310000312069bcs:ProbabilityOfDefaultPointSixtyToTwoPointOneFivePercentMemberbcs:OtherRetailMemberbcs:SatisfactoryBBPlusToBMemberifrs-full:GrossCarryingAmountMemberbcs:ExpectedCreditLossesMember2023-12-310000312069bcs:ProbabilityOfDefaultPointSixtyToTwoPointOneFivePercentMemberifrs-full:AccumulatedImpairmentMemberbcs:OtherRetailMemberbcs:SatisfactoryBBPlusToBMemberifrs-full:TwelvemonthExpectedCreditLossesMember2023-12-310000312069bcs:ProbabilityOfDefaultPointSixtyToTwoPointOneFivePercentMemberifrs-full:AccumulatedImpairmentMemberifrs-full:LifetimeExpectedCreditLossesMemberbcs:OtherRetailMemberbcs:SatisfactoryBBPlusToBMemberifrs-full:FinancialInstrumentsNotCreditimpairedMember2023-12-310000312069bcs:ProbabilityOfDefaultPointSixtyToTwoPointOneFivePercentMemberifrs-full:AccumulatedImpairmentMemberifrs-full:LifetimeExpectedCreditLossesMemberbcs:OtherRetailMemberifrs-full:FinancialInstrumentsCreditimpairedMemberbcs:SatisfactoryBBPlusToBMember2023-12-310000312069bcs:ProbabilityOfDefaultPointSixtyToTwoPointOneFivePercentMemberifrs-full:AccumulatedImpairmentMemberbcs:OtherRetailMemberbcs:SatisfactoryBBPlusToBMemberbcs:ExpectedCreditLossesMember2023-12-310000312069bcs:ProbabilityOfDefaultPointSixtyToTwoPointOneFivePercentMemberbcs:OtherRetailMemberbcs:SatisfactoryBBPlusToBMember2023-12-310000312069bcs:ProbabilityOfDefaultTwoPointOneFiveToElevenPointThreeFivePercentMemberbcs:OtherRetailMemberbcs:SatisfactoryBBPlusToBMemberifrs-full:GrossCarryingAmountMemberifrs-full:TwelvemonthExpectedCreditLossesMember2023-12-310000312069ifrs-full:LifetimeExpectedCreditLossesMemberbcs:ProbabilityOfDefaultTwoPointOneFiveToElevenPointThreeFivePercentMemberbcs:OtherRetailMemberbcs:SatisfactoryBBPlusToBMemberifrs-full:GrossCarryingAmountMemberifrs-full:FinancialInstrumentsNotCreditimpairedMember2023-12-310000312069ifrs-full:LifetimeExpectedCreditLossesMemberbcs:ProbabilityOfDefaultTwoPointOneFiveToElevenPointThreeFivePercentMemberbcs:OtherRetailMemberifrs-full:FinancialInstrumentsCreditimpairedMemberbcs:SatisfactoryBBPlusToBMemberifrs-full:GrossCarryingAmountMember2023-12-310000312069bcs:ProbabilityOfDefaultTwoPointOneFiveToElevenPointThreeFivePercentMemberbcs:OtherRetailMemberbcs:SatisfactoryBBPlusToBMemberifrs-full:GrossCarryingAmountMemberbcs:ExpectedCreditLossesMember2023-12-310000312069ifrs-full:AccumulatedImpairmentMemberbcs:ProbabilityOfDefaultTwoPointOneFiveToElevenPointThreeFivePercentMemberbcs:OtherRetailMemberbcs:SatisfactoryBBPlusToBMemberifrs-full:TwelvemonthExpectedCreditLossesMember2023-12-310000312069ifrs-full:AccumulatedImpairmentMemberifrs-full:LifetimeExpectedCreditLossesMemberbcs:ProbabilityOfDefaultTwoPointOneFiveToElevenPointThreeFivePercentMemberbcs:OtherRetailMemberbcs:SatisfactoryBBPlusToBMemberifrs-full:FinancialInstrumentsNotCreditimpairedMember2023-12-310000312069ifrs-full:AccumulatedImpairmentMemberifrs-full:LifetimeExpectedCreditLossesMemberbcs:ProbabilityOfDefaultTwoPointOneFiveToElevenPointThreeFivePercentMemberbcs:OtherRetailMemberifrs-full:FinancialInstrumentsCreditimpairedMemberbcs:SatisfactoryBBPlusToBMember2023-12-310000312069ifrs-full:AccumulatedImpairmentMemberbcs:ProbabilityOfDefaultTwoPointOneFiveToElevenPointThreeFivePercentMemberbcs:OtherRetailMemberbcs:SatisfactoryBBPlusToBMemberbcs:ExpectedCreditLossesMember2023-12-310000312069bcs:ProbabilityOfDefaultTwoPointOneFiveToElevenPointThreeFivePercentMemberbcs:OtherRetailMemberbcs:SatisfactoryBBPlusToBMember2023-12-310000312069bcs:ProbabilityOfDefaultElevenPointThreeFiveToOneHundredPercentMemberbcs:OtherRetailMemberbcs:HigherRiskBMinusAndBelowMemberifrs-full:GrossCarryingAmountMemberifrs-full:TwelvemonthExpectedCreditLossesMember2023-12-310000312069ifrs-full:LifetimeExpectedCreditLossesMemberbcs:ProbabilityOfDefaultElevenPointThreeFiveToOneHundredPercentMemberbcs:OtherRetailMemberbcs:HigherRiskBMinusAndBelowMemberifrs-full:GrossCarryingAmountMemberifrs-full:FinancialInstrumentsNotCreditimpairedMember2023-12-310000312069ifrs-full:LifetimeExpectedCreditLossesMemberbcs:ProbabilityOfDefaultElevenPointThreeFiveToOneHundredPercentMemberbcs:OtherRetailMemberifrs-full:FinancialInstrumentsCreditimpairedMemberbcs:HigherRiskBMinusAndBelowMemberifrs-full:GrossCarryingAmountMember2023-12-310000312069bcs:ProbabilityOfDefaultElevenPointThreeFiveToOneHundredPercentMemberbcs:OtherRetailMemberbcs:HigherRiskBMinusAndBelowMemberifrs-full:GrossCarryingAmountMemberbcs:ExpectedCreditLossesMember2023-12-310000312069ifrs-full:AccumulatedImpairmentMemberbcs:ProbabilityOfDefaultElevenPointThreeFiveToOneHundredPercentMemberbcs:OtherRetailMemberbcs:HigherRiskBMinusAndBelowMemberifrs-full:TwelvemonthExpectedCreditLossesMember2023-12-310000312069ifrs-full:AccumulatedImpairmentMemberifrs-full:LifetimeExpectedCreditLossesMemberbcs:ProbabilityOfDefaultElevenPointThreeFiveToOneHundredPercentMemberbcs:OtherRetailMemberbcs:HigherRiskBMinusAndBelowMemberifrs-full:FinancialInstrumentsNotCreditimpairedMember2023-12-310000312069ifrs-full:AccumulatedImpairmentMemberifrs-full:LifetimeExpectedCreditLossesMemberbcs:ProbabilityOfDefaultElevenPointThreeFiveToOneHundredPercentMemberbcs:OtherRetailMemberifrs-full:FinancialInstrumentsCreditimpairedMemberbcs:HigherRiskBMinusAndBelowMember2023-12-310000312069ifrs-full:AccumulatedImpairmentMemberbcs:ProbabilityOfDefaultElevenPointThreeFiveToOneHundredPercentMemberbcs:OtherRetailMemberbcs:HigherRiskBMinusAndBelowMemberbcs:ExpectedCreditLossesMember2023-12-310000312069bcs:OtherRetailMemberbcs:ProbabilityOfDefaultElevenPointThreeFiveToOneHundredPercentMemberbcs:HigherRiskBMinusAndBelowMember2023-12-310000312069bcs:OtherRetailMemberbcs:ProbabilityOfDefaultOneHundredPercentMemberifrs-full:GrossCarryingAmountMemberifrs-full:TwelvemonthExpectedCreditLossesMember2023-12-310000312069ifrs-full:LifetimeExpectedCreditLossesMemberbcs:OtherRetailMemberbcs:ProbabilityOfDefaultOneHundredPercentMemberifrs-full:GrossCarryingAmountMemberifrs-full:FinancialInstrumentsNotCreditimpairedMember2023-12-310000312069ifrs-full:LifetimeExpectedCreditLossesMemberbcs:OtherRetailMemberifrs-full:FinancialInstrumentsCreditimpairedMemberbcs:ProbabilityOfDefaultOneHundredPercentMemberifrs-full:GrossCarryingAmountMember2023-12-310000312069bcs:OtherRetailMemberbcs:ProbabilityOfDefaultOneHundredPercentMemberifrs-full:GrossCarryingAmountMemberbcs:ExpectedCreditLossesMember2023-12-310000312069ifrs-full:AccumulatedImpairmentMemberbcs:OtherRetailMemberbcs:ProbabilityOfDefaultOneHundredPercentMemberifrs-full:TwelvemonthExpectedCreditLossesMember2023-12-310000312069ifrs-full:AccumulatedImpairmentMemberifrs-full:LifetimeExpectedCreditLossesMemberbcs:OtherRetailMemberbcs:ProbabilityOfDefaultOneHundredPercentMemberifrs-full:FinancialInstrumentsNotCreditimpairedMember2023-12-310000312069ifrs-full:AccumulatedImpairmentMemberifrs-full:LifetimeExpectedCreditLossesMemberbcs:OtherRetailMemberifrs-full:FinancialInstrumentsCreditimpairedMemberbcs:ProbabilityOfDefaultOneHundredPercentMember2023-12-310000312069ifrs-full:AccumulatedImpairmentMemberbcs:OtherRetailMemberbcs:ProbabilityOfDefaultOneHundredPercentMemberbcs:ExpectedCreditLossesMember2023-12-310000312069bcs:OtherRetailMemberbcs:ProbabilityOfDefaultOneHundredPercentMember2023-12-310000312069bcs:OtherRetailMemberifrs-full:GrossCarryingAmountMemberbcs:ExpectedCreditLossesMember2023-12-310000312069ifrs-full:AccumulatedImpairmentMemberbcs:OtherRetailMemberbcs:ExpectedCreditLossesMember2023-12-310000312069bcs:OtherRetailMember2023-12-310000312069ifrs-full:CorporateLoansMemberbcs:ProbabilityOfDefaultZeroToPointZeroFivePercentMemberifrs-full:GrossCarryingAmountMemberbcs:StrongIncludingInvestmentGradeMemberifrs-full:TwelvemonthExpectedCreditLossesMember2023-12-310000312069ifrs-full:LifetimeExpectedCreditLossesMemberifrs-full:CorporateLoansMemberbcs:ProbabilityOfDefaultZeroToPointZeroFivePercentMemberifrs-full:GrossCarryingAmountMemberifrs-full:FinancialInstrumentsNotCreditimpairedMemberbcs:StrongIncludingInvestmentGradeMember2023-12-310000312069ifrs-full:LifetimeExpectedCreditLossesMemberifrs-full:CorporateLoansMemberbcs:ProbabilityOfDefaultZeroToPointZeroFivePercentMemberifrs-full:FinancialInstrumentsCreditimpairedMemberifrs-full:GrossCarryingAmountMemberbcs:StrongIncludingInvestmentGradeMember2023-12-310000312069ifrs-full:CorporateLoansMemberbcs:ProbabilityOfDefaultZeroToPointZeroFivePercentMemberifrs-full:GrossCarryingAmountMemberbcs:ExpectedCreditLossesMemberbcs:StrongIncludingInvestmentGradeMember2023-12-310000312069ifrs-full:AccumulatedImpairmentMemberifrs-full:CorporateLoansMemberbcs:ProbabilityOfDefaultZeroToPointZeroFivePercentMemberbcs:StrongIncludingInvestmentGradeMemberifrs-full:TwelvemonthExpectedCreditLossesMember2023-12-310000312069ifrs-full:AccumulatedImpairmentMemberifrs-full:LifetimeExpectedCreditLossesMemberifrs-full:CorporateLoansMemberbcs:ProbabilityOfDefaultZeroToPointZeroFivePercentMemberifrs-full:FinancialInstrumentsNotCreditimpairedMemberbcs:StrongIncludingInvestmentGradeMember2023-12-310000312069ifrs-full:AccumulatedImpairmentMemberifrs-full:LifetimeExpectedCreditLossesMemberifrs-full:CorporateLoansMemberbcs:ProbabilityOfDefaultZeroToPointZeroFivePercentMemberifrs-full:FinancialInstrumentsCreditimpairedMemberbcs:StrongIncludingInvestmentGradeMember2023-12-310000312069ifrs-full:AccumulatedImpairmentMemberifrs-full:CorporateLoansMemberbcs:ProbabilityOfDefaultZeroToPointZeroFivePercentMemberbcs:ExpectedCreditLossesMemberbcs:StrongIncludingInvestmentGradeMember2023-12-310000312069ifrs-full:CorporateLoansMemberbcs:ProbabilityOfDefaultZeroToPointZeroFivePercentMemberbcs:StrongIncludingInvestmentGradeMember2023-12-310000312069ifrs-full:CorporateLoansMemberifrs-full:GrossCarryingAmountMemberbcs:ProbabilityOfDefaultPointZeroFiveToPointOneFivePercentMemberbcs:StrongIncludingInvestmentGradeMemberifrs-full:TwelvemonthExpectedCreditLossesMember2023-12-310000312069ifrs-full:LifetimeExpectedCreditLossesMemberifrs-full:CorporateLoansMemberifrs-full:GrossCarryingAmountMemberbcs:ProbabilityOfDefaultPointZeroFiveToPointOneFivePercentMemberifrs-full:FinancialInstrumentsNotCreditimpairedMemberbcs:StrongIncludingInvestmentGradeMember2023-12-310000312069ifrs-full:LifetimeExpectedCreditLossesMemberifrs-full:CorporateLoansMemberifrs-full:FinancialInstrumentsCreditimpairedMemberifrs-full:GrossCarryingAmountMemberbcs:ProbabilityOfDefaultPointZeroFiveToPointOneFivePercentMemberbcs:StrongIncludingInvestmentGradeMember2023-12-310000312069ifrs-full:CorporateLoansMemberifrs-full:GrossCarryingAmountMemberbcs:ExpectedCreditLossesMemberbcs:ProbabilityOfDefaultPointZeroFiveToPointOneFivePercentMemberbcs:StrongIncludingInvestmentGradeMember2023-12-310000312069ifrs-full:AccumulatedImpairmentMemberifrs-full:CorporateLoansMemberbcs:ProbabilityOfDefaultPointZeroFiveToPointOneFivePercentMemberbcs:StrongIncludingInvestmentGradeMemberifrs-full:TwelvemonthExpectedCreditLossesMember2023-12-310000312069ifrs-full:AccumulatedImpairmentMemberifrs-full:LifetimeExpectedCreditLossesMemberifrs-full:CorporateLoansMemberbcs:ProbabilityOfDefaultPointZeroFiveToPointOneFivePercentMemberifrs-full:FinancialInstrumentsNotCreditimpairedMemberbcs:StrongIncludingInvestmentGradeMember2023-12-310000312069ifrs-full:AccumulatedImpairmentMemberifrs-full:LifetimeExpectedCreditLossesMemberifrs-full:CorporateLoansMemberifrs-full:FinancialInstrumentsCreditimpairedMemberbcs:ProbabilityOfDefaultPointZeroFiveToPointOneFivePercentMemberbcs:StrongIncludingInvestmentGradeMember2023-12-310000312069ifrs-full:AccumulatedImpairmentMemberifrs-full:CorporateLoansMemberbcs:ExpectedCreditLossesMemberbcs:ProbabilityOfDefaultPointZeroFiveToPointOneFivePercentMemberbcs:StrongIncludingInvestmentGradeMember2023-12-310000312069ifrs-full:CorporateLoansMemberbcs:ProbabilityOfDefaultPointZeroFiveToPointOneFivePercentMemberbcs:StrongIncludingInvestmentGradeMember2023-12-310000312069ifrs-full:CorporateLoansMemberbcs:ProbabilityOfDefaultPointOneFiveToPointThreePercentMemberifrs-full:GrossCarryingAmountMemberbcs:StrongIncludingInvestmentGradeMemberifrs-full:TwelvemonthExpectedCreditLossesMember2023-12-310000312069ifrs-full:LifetimeExpectedCreditLossesMemberifrs-full:CorporateLoansMemberbcs:ProbabilityOfDefaultPointOneFiveToPointThreePercentMemberifrs-full:GrossCarryingAmountMemberifrs-full:FinancialInstrumentsNotCreditimpairedMemberbcs:StrongIncludingInvestmentGradeMember2023-12-310000312069ifrs-full:LifetimeExpectedCreditLossesMemberifrs-full:CorporateLoansMemberifrs-full:FinancialInstrumentsCreditimpairedMemberbcs:ProbabilityOfDefaultPointOneFiveToPointThreePercentMemberifrs-full:GrossCarryingAmountMemberbcs:StrongIncludingInvestmentGradeMember2023-12-310000312069ifrs-full:CorporateLoansMemberbcs:ProbabilityOfDefaultPointOneFiveToPointThreePercentMemberifrs-full:GrossCarryingAmountMemberbcs:ExpectedCreditLossesMemberbcs:StrongIncludingInvestmentGradeMember2023-12-310000312069ifrs-full:AccumulatedImpairmentMemberifrs-full:CorporateLoansMemberbcs:ProbabilityOfDefaultPointOneFiveToPointThreePercentMemberbcs:StrongIncludingInvestmentGradeMemberifrs-full:TwelvemonthExpectedCreditLossesMember2023-12-310000312069ifrs-full:AccumulatedImpairmentMemberifrs-full:LifetimeExpectedCreditLossesMemberifrs-full:CorporateLoansMemberbcs:ProbabilityOfDefaultPointOneFiveToPointThreePercentMemberifrs-full:FinancialInstrumentsNotCreditimpairedMemberbcs:StrongIncludingInvestmentGradeMember2023-12-310000312069ifrs-full:AccumulatedImpairmentMemberifrs-full:LifetimeExpectedCreditLossesMemberifrs-full:CorporateLoansMemberifrs-full:FinancialInstrumentsCreditimpairedMemberbcs:ProbabilityOfDefaultPointOneFiveToPointThreePercentMemberbcs:StrongIncludingInvestmentGradeMember2023-12-310000312069ifrs-full:AccumulatedImpairmentMemberifrs-full:CorporateLoansMemberbcs:ProbabilityOfDefaultPointOneFiveToPointThreePercentMemberbcs:ExpectedCreditLossesMemberbcs:StrongIncludingInvestmentGradeMember2023-12-310000312069ifrs-full:CorporateLoansMemberbcs:ProbabilityOfDefaultPointOneFiveToPointThreePercentMemberbcs:StrongIncludingInvestmentGradeMember2023-12-310000312069ifrs-full:CorporateLoansMemberbcs:ProbabilityOfDefaultPointThreeToPointSixPercentMemberifrs-full:GrossCarryingAmountMemberbcs:StrongIncludingInvestmentGradeMemberifrs-full:TwelvemonthExpectedCreditLossesMember2023-12-310000312069ifrs-full:LifetimeExpectedCreditLossesMemberifrs-full:CorporateLoansMemberbcs:ProbabilityOfDefaultPointThreeToPointSixPercentMemberifrs-full:GrossCarryingAmountMemberifrs-full:FinancialInstrumentsNotCreditimpairedMemberbcs:StrongIncludingInvestmentGradeMember2023-12-310000312069ifrs-full:LifetimeExpectedCreditLossesMemberifrs-full:CorporateLoansMemberbcs:ProbabilityOfDefaultPointThreeToPointSixPercentMemberifrs-full:FinancialInstrumentsCreditimpairedMemberifrs-full:GrossCarryingAmountMemberbcs:StrongIncludingInvestmentGradeMember2023-12-310000312069ifrs-full:CorporateLoansMemberbcs:ProbabilityOfDefaultPointThreeToPointSixPercentMemberifrs-full:GrossCarryingAmountMemberbcs:ExpectedCreditLossesMemberbcs:StrongIncludingInvestmentGradeMember2023-12-310000312069ifrs-full:AccumulatedImpairmentMemberifrs-full:CorporateLoansMemberbcs:ProbabilityOfDefaultPointThreeToPointSixPercentMemberbcs:StrongIncludingInvestmentGradeMemberifrs-full:TwelvemonthExpectedCreditLossesMember2023-12-310000312069ifrs-full:AccumulatedImpairmentMemberifrs-full:LifetimeExpectedCreditLossesMemberifrs-full:CorporateLoansMemberbcs:ProbabilityOfDefaultPointThreeToPointSixPercentMemberifrs-full:FinancialInstrumentsNotCreditimpairedMemberbcs:StrongIncludingInvestmentGradeMember2023-12-310000312069ifrs-full:AccumulatedImpairmentMemberifrs-full:LifetimeExpectedCreditLossesMemberifrs-full:CorporateLoansMemberbcs:ProbabilityOfDefaultPointThreeToPointSixPercentMemberifrs-full:FinancialInstrumentsCreditimpairedMemberbcs:StrongIncludingInvestmentGradeMember2023-12-310000312069ifrs-full:AccumulatedImpairmentMemberifrs-full:CorporateLoansMemberbcs:ProbabilityOfDefaultPointThreeToPointSixPercentMemberbcs:ExpectedCreditLossesMemberbcs:StrongIncludingInvestmentGradeMember2023-12-310000312069ifrs-full:CorporateLoansMemberbcs:ProbabilityOfDefaultPointThreeToPointSixPercentMemberbcs:StrongIncludingInvestmentGradeMember2023-12-310000312069bcs:ProbabilityOfDefaultPointSixtyToTwoPointOneFivePercentMemberifrs-full:CorporateLoansMemberbcs:SatisfactoryBBPlusToBMemberifrs-full:GrossCarryingAmountMemberifrs-full:TwelvemonthExpectedCreditLossesMember2023-12-310000312069bcs:ProbabilityOfDefaultPointSixtyToTwoPointOneFivePercentMemberifrs-full:LifetimeExpectedCreditLossesMemberifrs-full:CorporateLoansMemberbcs:SatisfactoryBBPlusToBMemberifrs-full:GrossCarryingAmountMemberifrs-full:FinancialInstrumentsNotCreditimpairedMember2023-12-310000312069bcs:ProbabilityOfDefaultPointSixtyToTwoPointOneFivePercentMemberifrs-full:LifetimeExpectedCreditLossesMemberifrs-full:CorporateLoansMemberifrs-full:FinancialInstrumentsCreditimpairedMemberbcs:SatisfactoryBBPlusToBMemberifrs-full:GrossCarryingAmountMember2023-12-310000312069bcs:ProbabilityOfDefaultPointSixtyToTwoPointOneFivePercentMemberifrs-full:CorporateLoansMemberbcs:SatisfactoryBBPlusToBMemberifrs-full:GrossCarryingAmountMemberbcs:ExpectedCreditLossesMember2023-12-310000312069bcs:ProbabilityOfDefaultPointSixtyToTwoPointOneFivePercentMemberifrs-full:AccumulatedImpairmentMemberifrs-full:CorporateLoansMemberbcs:SatisfactoryBBPlusToBMemberifrs-full:TwelvemonthExpectedCreditLossesMember2023-12-310000312069bcs:ProbabilityOfDefaultPointSixtyToTwoPointOneFivePercentMemberifrs-full:AccumulatedImpairmentMemberifrs-full:LifetimeExpectedCreditLossesMemberifrs-full:CorporateLoansMemberbcs:SatisfactoryBBPlusToBMemberifrs-full:FinancialInstrumentsNotCreditimpairedMember2023-12-310000312069bcs:ProbabilityOfDefaultPointSixtyToTwoPointOneFivePercentMemberifrs-full:AccumulatedImpairmentMemberifrs-full:LifetimeExpectedCreditLossesMemberifrs-full:CorporateLoansMemberifrs-full:FinancialInstrumentsCreditimpairedMemberbcs:SatisfactoryBBPlusToBMember2023-12-310000312069bcs:ProbabilityOfDefaultPointSixtyToTwoPointOneFivePercentMemberifrs-full:AccumulatedImpairmentMemberifrs-full:CorporateLoansMemberbcs:SatisfactoryBBPlusToBMemberbcs:ExpectedCreditLossesMember2023-12-310000312069bcs:ProbabilityOfDefaultPointSixtyToTwoPointOneFivePercentMemberifrs-full:CorporateLoansMemberbcs:SatisfactoryBBPlusToBMember2023-12-310000312069ifrs-full:CorporateLoansMemberbcs:ProbabilityOfDefaultTwoPointOneFiveToElevenPointThreeFivePercentMemberbcs:SatisfactoryBBPlusToBMemberifrs-full:GrossCarryingAmountMemberifrs-full:TwelvemonthExpectedCreditLossesMember2023-12-310000312069ifrs-full:LifetimeExpectedCreditLossesMemberifrs-full:CorporateLoansMemberbcs:ProbabilityOfDefaultTwoPointOneFiveToElevenPointThreeFivePercentMemberbcs:SatisfactoryBBPlusToBMemberifrs-full:GrossCarryingAmountMemberifrs-full:FinancialInstrumentsNotCreditimpairedMember2023-12-310000312069ifrs-full:LifetimeExpectedCreditLossesMemberifrs-full:CorporateLoansMemberbcs:ProbabilityOfDefaultTwoPointOneFiveToElevenPointThreeFivePercentMemberifrs-full:FinancialInstrumentsCreditimpairedMemberbcs:SatisfactoryBBPlusToBMemberifrs-full:GrossCarryingAmountMember2023-12-310000312069ifrs-full:CorporateLoansMemberbcs:ProbabilityOfDefaultTwoPointOneFiveToElevenPointThreeFivePercentMemberbcs:SatisfactoryBBPlusToBMemberifrs-full:GrossCarryingAmountMemberbcs:ExpectedCreditLossesMember2023-12-310000312069ifrs-full:AccumulatedImpairmentMemberifrs-full:CorporateLoansMemberbcs:ProbabilityOfDefaultTwoPointOneFiveToElevenPointThreeFivePercentMemberbcs:SatisfactoryBBPlusToBMemberifrs-full:TwelvemonthExpectedCreditLossesMember2023-12-310000312069ifrs-full:AccumulatedImpairmentMemberifrs-full:LifetimeExpectedCreditLossesMemberifrs-full:CorporateLoansMemberbcs:ProbabilityOfDefaultTwoPointOneFiveToElevenPointThreeFivePercentMemberbcs:SatisfactoryBBPlusToBMemberifrs-full:FinancialInstrumentsNotCreditimpairedMember2023-12-310000312069ifrs-full:AccumulatedImpairmentMemberifrs-full:LifetimeExpectedCreditLossesMemberifrs-full:CorporateLoansMemberbcs:ProbabilityOfDefaultTwoPointOneFiveToElevenPointThreeFivePercentMemberifrs-full:FinancialInstrumentsCreditimpairedMemberbcs:SatisfactoryBBPlusToBMember2023-12-310000312069ifrs-full:AccumulatedImpairmentMemberifrs-full:CorporateLoansMemberbcs:ProbabilityOfDefaultTwoPointOneFiveToElevenPointThreeFivePercentMemberbcs:SatisfactoryBBPlusToBMemberbcs:ExpectedCreditLossesMember2023-12-310000312069ifrs-full:CorporateLoansMemberbcs:ProbabilityOfDefaultTwoPointOneFiveToElevenPointThreeFivePercentMemberbcs:SatisfactoryBBPlusToBMember2023-12-310000312069ifrs-full:CorporateLoansMemberbcs:ProbabilityOfDefaultElevenPointThreeFiveToOneHundredPercentMemberbcs:HigherRiskBMinusAndBelowMemberifrs-full:GrossCarryingAmountMemberifrs-full:TwelvemonthExpectedCreditLossesMember2023-12-310000312069ifrs-full:LifetimeExpectedCreditLossesMemberifrs-full:CorporateLoansMemberbcs:ProbabilityOfDefaultElevenPointThreeFiveToOneHundredPercentMemberbcs:HigherRiskBMinusAndBelowMemberifrs-full:GrossCarryingAmountMemberifrs-full:FinancialInstrumentsNotCreditimpairedMember2023-12-310000312069ifrs-full:LifetimeExpectedCreditLossesMemberifrs-full:CorporateLoansMemberbcs:ProbabilityOfDefaultElevenPointThreeFiveToOneHundredPercentMemberifrs-full:FinancialInstrumentsCreditimpairedMemberbcs:HigherRiskBMinusAndBelowMemberifrs-full:GrossCarryingAmountMember2023-12-310000312069ifrs-full:CorporateLoansMemberbcs:ProbabilityOfDefaultElevenPointThreeFiveToOneHundredPercentMemberbcs:HigherRiskBMinusAndBelowMemberifrs-full:GrossCarryingAmountMemberbcs:ExpectedCreditLossesMember2023-12-310000312069ifrs-full:AccumulatedImpairmentMemberifrs-full:CorporateLoansMemberbcs:ProbabilityOfDefaultElevenPointThreeFiveToOneHundredPercentMemberbcs:HigherRiskBMinusAndBelowMemberifrs-full:TwelvemonthExpectedCreditLossesMember2023-12-310000312069ifrs-full:AccumulatedImpairmentMemberifrs-full:LifetimeExpectedCreditLossesMemberifrs-full:CorporateLoansMemberbcs:ProbabilityOfDefaultElevenPointThreeFiveToOneHundredPercentMemberbcs:HigherRiskBMinusAndBelowMemberifrs-full:FinancialInstrumentsNotCreditimpairedMember2023-12-310000312069ifrs-full:AccumulatedImpairmentMemberifrs-full:LifetimeExpectedCreditLossesMemberifrs-full:CorporateLoansMemberbcs:ProbabilityOfDefaultElevenPointThreeFiveToOneHundredPercentMemberifrs-full:FinancialInstrumentsCreditimpairedMemberbcs:HigherRiskBMinusAndBelowMember2023-12-310000312069ifrs-full:AccumulatedImpairmentMemberifrs-full:CorporateLoansMemberbcs:ProbabilityOfDefaultElevenPointThreeFiveToOneHundredPercentMemberbcs:HigherRiskBMinusAndBelowMemberbcs:ExpectedCreditLossesMember2023-12-310000312069ifrs-full:CorporateLoansMemberbcs:ProbabilityOfDefaultElevenPointThreeFiveToOneHundredPercentMemberbcs:HigherRiskBMinusAndBelowMember2023-12-310000312069ifrs-full:CorporateLoansMemberbcs:ProbabilityOfDefaultOneHundredPercentMemberifrs-full:GrossCarryingAmountMemberifrs-full:TwelvemonthExpectedCreditLossesMember2023-12-310000312069ifrs-full:LifetimeExpectedCreditLossesMemberifrs-full:CorporateLoansMemberbcs:ProbabilityOfDefaultOneHundredPercentMemberifrs-full:GrossCarryingAmountMemberifrs-full:FinancialInstrumentsNotCreditimpairedMember2023-12-310000312069ifrs-full:LifetimeExpectedCreditLossesMemberifrs-full:CorporateLoansMemberifrs-full:FinancialInstrumentsCreditimpairedMemberbcs:ProbabilityOfDefaultOneHundredPercentMemberifrs-full:GrossCarryingAmountMember2023-12-310000312069ifrs-full:CorporateLoansMemberbcs:ProbabilityOfDefaultOneHundredPercentMemberifrs-full:GrossCarryingAmountMemberbcs:ExpectedCreditLossesMember2023-12-310000312069ifrs-full:AccumulatedImpairmentMemberifrs-full:CorporateLoansMemberbcs:ProbabilityOfDefaultOneHundredPercentMemberifrs-full:TwelvemonthExpectedCreditLossesMember2023-12-310000312069ifrs-full:AccumulatedImpairmentMemberifrs-full:LifetimeExpectedCreditLossesMemberifrs-full:CorporateLoansMemberbcs:ProbabilityOfDefaultOneHundredPercentMemberifrs-full:FinancialInstrumentsNotCreditimpairedMember2023-12-310000312069ifrs-full:AccumulatedImpairmentMemberifrs-full:LifetimeExpectedCreditLossesMemberifrs-full:CorporateLoansMemberifrs-full:FinancialInstrumentsCreditimpairedMemberbcs:ProbabilityOfDefaultOneHundredPercentMember2023-12-310000312069ifrs-full:AccumulatedImpairmentMemberifrs-full:CorporateLoansMemberbcs:ProbabilityOfDefaultOneHundredPercentMemberbcs:ExpectedCreditLossesMember2023-12-310000312069ifrs-full:CorporateLoansMemberbcs:ProbabilityOfDefaultOneHundredPercentMember2023-12-310000312069ifrs-full:CorporateLoansMemberifrs-full:GrossCarryingAmountMemberbcs:ExpectedCreditLossesMember2023-12-310000312069ifrs-full:AccumulatedImpairmentMemberifrs-full:CorporateLoansMemberbcs:ExpectedCreditLossesMember2023-12-310000312069ifrs-full:CorporateLoansMember2023-12-310000312069bcs:ProbabilityOfDefaultZeroToPointZeroFivePercentMemberifrs-full:GrossCarryingAmountMemberifrs-full:LoansAndReceivablesCategoryMemberbcs:StrongIncludingInvestmentGradeMemberifrs-full:TwelvemonthExpectedCreditLossesMember2023-12-310000312069ifrs-full:LifetimeExpectedCreditLossesMemberbcs:ProbabilityOfDefaultZeroToPointZeroFivePercentMemberifrs-full:GrossCarryingAmountMemberifrs-full:LoansAndReceivablesCategoryMemberifrs-full:FinancialInstrumentsNotCreditimpairedMemberbcs:StrongIncludingInvestmentGradeMember2023-12-310000312069ifrs-full:LifetimeExpectedCreditLossesMemberbcs:ProbabilityOfDefaultZeroToPointZeroFivePercentMemberifrs-full:FinancialInstrumentsCreditimpairedMemberifrs-full:GrossCarryingAmountMemberifrs-full:LoansAndReceivablesCategoryMemberbcs:StrongIncludingInvestmentGradeMember2023-12-310000312069bcs:ProbabilityOfDefaultZeroToPointZeroFivePercentMemberifrs-full:GrossCarryingAmountMemberbcs:ExpectedCreditLossesMemberifrs-full:LoansAndReceivablesCategoryMemberbcs:StrongIncludingInvestmentGradeMember2023-12-310000312069ifrs-full:AccumulatedImpairmentMemberbcs:ProbabilityOfDefaultZeroToPointZeroFivePercentMemberifrs-full:LoansAndReceivablesCategoryMemberbcs:StrongIncludingInvestmentGradeMemberifrs-full:TwelvemonthExpectedCreditLossesMember2023-12-310000312069ifrs-full:AccumulatedImpairmentMemberifrs-full:LifetimeExpectedCreditLossesMemberbcs:ProbabilityOfDefaultZeroToPointZeroFivePercentMemberifrs-full:LoansAndReceivablesCategoryMemberifrs-full:FinancialInstrumentsNotCreditimpairedMemberbcs:StrongIncludingInvestmentGradeMember2023-12-310000312069ifrs-full:AccumulatedImpairmentMemberifrs-full:LifetimeExpectedCreditLossesMemberbcs:ProbabilityOfDefaultZeroToPointZeroFivePercentMemberifrs-full:FinancialInstrumentsCreditimpairedMemberifrs-full:LoansAndReceivablesCategoryMemberbcs:StrongIncludingInvestmentGradeMember2023-12-310000312069ifrs-full:AccumulatedImpairmentMemberbcs:ProbabilityOfDefaultZeroToPointZeroFivePercentMemberbcs:ExpectedCreditLossesMemberifrs-full:LoansAndReceivablesCategoryMemberbcs:StrongIncludingInvestmentGradeMember2023-12-310000312069bcs:ProbabilityOfDefaultZeroToPointZeroFivePercentMemberifrs-full:LoansAndReceivablesCategoryMemberbcs:StrongIncludingInvestmentGradeMember2023-12-310000312069ifrs-full:GrossCarryingAmountMemberifrs-full:LoansAndReceivablesCategoryMemberbcs:ProbabilityOfDefaultPointZeroFiveToPointOneFivePercentMemberbcs:StrongIncludingInvestmentGradeMemberifrs-full:TwelvemonthExpectedCreditLossesMember2023-12-310000312069ifrs-full:LifetimeExpectedCreditLossesMemberifrs-full:GrossCarryingAmountMemberifrs-full:LoansAndReceivablesCategoryMemberbcs:ProbabilityOfDefaultPointZeroFiveToPointOneFivePercentMemberifrs-full:FinancialInstrumentsNotCreditimpairedMemberbcs:StrongIncludingInvestmentGradeMember2023-12-310000312069ifrs-full:LifetimeExpectedCreditLossesMemberifrs-full:FinancialInstrumentsCreditimpairedMemberifrs-full:GrossCarryingAmountMemberifrs-full:LoansAndReceivablesCategoryMemberbcs:ProbabilityOfDefaultPointZeroFiveToPointOneFivePercentMemberbcs:StrongIncludingInvestmentGradeMember2023-12-310000312069ifrs-full:GrossCarryingAmountMemberbcs:ExpectedCreditLossesMemberifrs-full:LoansAndReceivablesCategoryMemberbcs:ProbabilityOfDefaultPointZeroFiveToPointOneFivePercentMemberbcs:StrongIncludingInvestmentGradeMember2023-12-310000312069ifrs-full:AccumulatedImpairmentMemberifrs-full:LoansAndReceivablesCategoryMemberbcs:ProbabilityOfDefaultPointZeroFiveToPointOneFivePercentMemberbcs:StrongIncludingInvestmentGradeMemberifrs-full:TwelvemonthExpectedCreditLossesMember2023-12-310000312069ifrs-full:AccumulatedImpairmentMemberifrs-full:LifetimeExpectedCreditLossesMemberifrs-full:LoansAndReceivablesCategoryMemberbcs:ProbabilityOfDefaultPointZeroFiveToPointOneFivePercentMemberifrs-full:FinancialInstrumentsNotCreditimpairedMemberbcs:StrongIncludingInvestmentGradeMember2023-12-310000312069ifrs-full:AccumulatedImpairmentMemberifrs-full:LifetimeExpectedCreditLossesMemberifrs-full:FinancialInstrumentsCreditimpairedMemberifrs-full:LoansAndReceivablesCategoryMemberbcs:ProbabilityOfDefaultPointZeroFiveToPointOneFivePercentMemberbcs:StrongIncludingInvestmentGradeMember2023-12-310000312069ifrs-full:AccumulatedImpairmentMemberbcs:ExpectedCreditLossesMemberifrs-full:LoansAndReceivablesCategoryMemberbcs:ProbabilityOfDefaultPointZeroFiveToPointOneFivePercentMemberbcs:StrongIncludingInvestmentGradeMember2023-12-310000312069ifrs-full:LoansAndReceivablesCategoryMemberbcs:ProbabilityOfDefaultPointZeroFiveToPointOneFivePercentMemberbcs:StrongIncludingInvestmentGradeMember2023-12-310000312069bcs:ProbabilityOfDefaultPointOneFiveToPointThreePercentMemberifrs-full:GrossCarryingAmountMemberifrs-full:LoansAndReceivablesCategoryMemberbcs:StrongIncludingInvestmentGradeMemberifrs-full:TwelvemonthExpectedCreditLossesMember2023-12-310000312069ifrs-full:LifetimeExpectedCreditLossesMemberbcs:ProbabilityOfDefaultPointOneFiveToPointThreePercentMemberifrs-full:GrossCarryingAmountMemberifrs-full:LoansAndReceivablesCategoryMemberifrs-full:FinancialInstrumentsNotCreditimpairedMemberbcs:StrongIncludingInvestmentGradeMember2023-12-310000312069ifrs-full:LifetimeExpectedCreditLossesMemberifrs-full:FinancialInstrumentsCreditimpairedMemberbcs:ProbabilityOfDefaultPointOneFiveToPointThreePercentMemberifrs-full:GrossCarryingAmountMemberifrs-full:LoansAndReceivablesCategoryMemberbcs:StrongIncludingInvestmentGradeMember2023-12-310000312069bcs:ProbabilityOfDefaultPointOneFiveToPointThreePercentMemberifrs-full:GrossCarryingAmountMemberbcs:ExpectedCreditLossesMemberifrs-full:LoansAndReceivablesCategoryMemberbcs:StrongIncludingInvestmentGradeMember2023-12-310000312069ifrs-full:AccumulatedImpairmentMemberbcs:ProbabilityOfDefaultPointOneFiveToPointThreePercentMemberifrs-full:LoansAndReceivablesCategoryMemberbcs:StrongIncludingInvestmentGradeMemberifrs-full:TwelvemonthExpectedCreditLossesMember2023-12-310000312069ifrs-full:AccumulatedImpairmentMemberifrs-full:LifetimeExpectedCreditLossesMemberbcs:ProbabilityOfDefaultPointOneFiveToPointThreePercentMemberifrs-full:LoansAndReceivablesCategoryMemberifrs-full:FinancialInstrumentsNotCreditimpairedMemberbcs:StrongIncludingInvestmentGradeMember2023-12-310000312069ifrs-full:AccumulatedImpairmentMemberifrs-full:LifetimeExpectedCreditLossesMemberifrs-full:FinancialInstrumentsCreditimpairedMemberbcs:ProbabilityOfDefaultPointOneFiveToPointThreePercentMemberifrs-full:LoansAndReceivablesCategoryMemberbcs:StrongIncludingInvestmentGradeMember2023-12-310000312069ifrs-full:AccumulatedImpairmentMemberbcs:ProbabilityOfDefaultPointOneFiveToPointThreePercentMemberbcs:ExpectedCreditLossesMemberifrs-full:LoansAndReceivablesCategoryMemberbcs:StrongIncludingInvestmentGradeMember2023-12-310000312069bcs:ProbabilityOfDefaultPointOneFiveToPointThreePercentMemberifrs-full:LoansAndReceivablesCategoryMemberbcs:StrongIncludingInvestmentGradeMember2023-12-310000312069bcs:ProbabilityOfDefaultPointThreeToPointSixPercentMemberifrs-full:GrossCarryingAmountMemberifrs-full:LoansAndReceivablesCategoryMemberbcs:StrongIncludingInvestmentGradeMemberifrs-full:TwelvemonthExpectedCreditLossesMember2023-12-310000312069ifrs-full:LifetimeExpectedCreditLossesMemberbcs:ProbabilityOfDefaultPointThreeToPointSixPercentMemberifrs-full:GrossCarryingAmountMemberifrs-full:LoansAndReceivablesCategoryMemberifrs-full:FinancialInstrumentsNotCreditimpairedMemberbcs:StrongIncludingInvestmentGradeMember2023-12-310000312069ifrs-full:LifetimeExpectedCreditLossesMemberbcs:ProbabilityOfDefaultPointThreeToPointSixPercentMemberifrs-full:FinancialInstrumentsCreditimpairedMemberifrs-full:GrossCarryingAmountMemberifrs-full:LoansAndReceivablesCategoryMemberbcs:StrongIncludingInvestmentGradeMember2023-12-310000312069bcs:ProbabilityOfDefaultPointThreeToPointSixPercentMemberifrs-full:GrossCarryingAmountMemberbcs:ExpectedCreditLossesMemberifrs-full:LoansAndReceivablesCategoryMemberbcs:StrongIncludingInvestmentGradeMember2023-12-310000312069ifrs-full:AccumulatedImpairmentMemberbcs:ProbabilityOfDefaultPointThreeToPointSixPercentMemberifrs-full:LoansAndReceivablesCategoryMemberbcs:StrongIncludingInvestmentGradeMemberifrs-full:TwelvemonthExpectedCreditLossesMember2023-12-310000312069ifrs-full:AccumulatedImpairmentMemberifrs-full:LifetimeExpectedCreditLossesMemberbcs:ProbabilityOfDefaultPointThreeToPointSixPercentMemberifrs-full:LoansAndReceivablesCategoryMemberifrs-full:FinancialInstrumentsNotCreditimpairedMemberbcs:StrongIncludingInvestmentGradeMember2023-12-310000312069ifrs-full:AccumulatedImpairmentMemberifrs-full:LifetimeExpectedCreditLossesMemberbcs:ProbabilityOfDefaultPointThreeToPointSixPercentMemberifrs-full:FinancialInstrumentsCreditimpairedMemberifrs-full:LoansAndReceivablesCategoryMemberbcs:StrongIncludingInvestmentGradeMember2023-12-310000312069ifrs-full:AccumulatedImpairmentMemberbcs:ProbabilityOfDefaultPointThreeToPointSixPercentMemberbcs:ExpectedCreditLossesMemberifrs-full:LoansAndReceivablesCategoryMemberbcs:StrongIncludingInvestmentGradeMember2023-12-310000312069bcs:ProbabilityOfDefaultPointThreeToPointSixPercentMemberifrs-full:LoansAndReceivablesCategoryMemberbcs:StrongIncludingInvestmentGradeMember2023-12-310000312069bcs:ProbabilityOfDefaultPointSixtyToTwoPointOneFivePercentMemberbcs:SatisfactoryBBPlusToBMemberifrs-full:GrossCarryingAmountMemberifrs-full:LoansAndReceivablesCategoryMemberifrs-full:TwelvemonthExpectedCreditLossesMember2023-12-310000312069bcs:ProbabilityOfDefaultPointSixtyToTwoPointOneFivePercentMemberifrs-full:LifetimeExpectedCreditLossesMemberbcs:SatisfactoryBBPlusToBMemberifrs-full:GrossCarryingAmountMemberifrs-full:LoansAndReceivablesCategoryMemberifrs-full:FinancialInstrumentsNotCreditimpairedMember2023-12-310000312069bcs:ProbabilityOfDefaultPointSixtyToTwoPointOneFivePercentMemberifrs-full:LifetimeExpectedCreditLossesMemberifrs-full:FinancialInstrumentsCreditimpairedMemberbcs:SatisfactoryBBPlusToBMemberifrs-full:GrossCarryingAmountMemberifrs-full:LoansAndReceivablesCategoryMember2023-12-310000312069bcs:ProbabilityOfDefaultPointSixtyToTwoPointOneFivePercentMemberbcs:SatisfactoryBBPlusToBMemberifrs-full:GrossCarryingAmountMemberbcs:ExpectedCreditLossesMemberifrs-full:LoansAndReceivablesCategoryMember2023-12-310000312069bcs:ProbabilityOfDefaultPointSixtyToTwoPointOneFivePercentMemberifrs-full:AccumulatedImpairmentMemberbcs:SatisfactoryBBPlusToBMemberifrs-full:LoansAndReceivablesCategoryMemberifrs-full:TwelvemonthExpectedCreditLossesMember2023-12-310000312069bcs:ProbabilityOfDefaultPointSixtyToTwoPointOneFivePercentMemberifrs-full:AccumulatedImpairmentMemberifrs-full:LifetimeExpectedCreditLossesMemberbcs:SatisfactoryBBPlusToBMemberifrs-full:LoansAndReceivablesCategoryMemberifrs-full:FinancialInstrumentsNotCreditimpairedMember2023-12-310000312069bcs:ProbabilityOfDefaultPointSixtyToTwoPointOneFivePercentMemberifrs-full:AccumulatedImpairmentMemberifrs-full:LifetimeExpectedCreditLossesMemberifrs-full:FinancialInstrumentsCreditimpairedMemberbcs:SatisfactoryBBPlusToBMemberifrs-full:LoansAndReceivablesCategoryMember2023-12-310000312069bcs:ProbabilityOfDefaultPointSixtyToTwoPointOneFivePercentMemberifrs-full:AccumulatedImpairmentMemberbcs:SatisfactoryBBPlusToBMemberbcs:ExpectedCreditLossesMemberifrs-full:LoansAndReceivablesCategoryMember2023-12-310000312069bcs:ProbabilityOfDefaultPointSixtyToTwoPointOneFivePercentMemberbcs:SatisfactoryBBPlusToBMemberifrs-full:LoansAndReceivablesCategoryMember2023-12-310000312069bcs:ProbabilityOfDefaultTwoPointOneFiveToElevenPointThreeFivePercentMemberbcs:SatisfactoryBBPlusToBMemberifrs-full:GrossCarryingAmountMemberifrs-full:LoansAndReceivablesCategoryMemberifrs-full:TwelvemonthExpectedCreditLossesMember2023-12-310000312069ifrs-full:LifetimeExpectedCreditLossesMemberbcs:ProbabilityOfDefaultTwoPointOneFiveToElevenPointThreeFivePercentMemberbcs:SatisfactoryBBPlusToBMemberifrs-full:GrossCarryingAmountMemberifrs-full:LoansAndReceivablesCategoryMemberifrs-full:FinancialInstrumentsNotCreditimpairedMember2023-12-310000312069ifrs-full:LifetimeExpectedCreditLossesMemberbcs:ProbabilityOfDefaultTwoPointOneFiveToElevenPointThreeFivePercentMemberifrs-full:FinancialInstrumentsCreditimpairedMemberbcs:SatisfactoryBBPlusToBMemberifrs-full:GrossCarryingAmountMemberifrs-full:LoansAndReceivablesCategoryMember2023-12-310000312069bcs:ProbabilityOfDefaultTwoPointOneFiveToElevenPointThreeFivePercentMemberbcs:SatisfactoryBBPlusToBMemberifrs-full:GrossCarryingAmountMemberbcs:ExpectedCreditLossesMemberifrs-full:LoansAndReceivablesCategoryMember2023-12-310000312069ifrs-full:AccumulatedImpairmentMemberbcs:ProbabilityOfDefaultTwoPointOneFiveToElevenPointThreeFivePercentMemberbcs:SatisfactoryBBPlusToBMemberifrs-full:LoansAndReceivablesCategoryMemberifrs-full:TwelvemonthExpectedCreditLossesMember2023-12-310000312069ifrs-full:AccumulatedImpairmentMemberifrs-full:LifetimeExpectedCreditLossesMemberbcs:ProbabilityOfDefaultTwoPointOneFiveToElevenPointThreeFivePercentMemberbcs:SatisfactoryBBPlusToBMemberifrs-full:LoansAndReceivablesCategoryMemberifrs-full:FinancialInstrumentsNotCreditimpairedMember2023-12-310000312069ifrs-full:AccumulatedImpairmentMemberifrs-full:LifetimeExpectedCreditLossesMemberbcs:ProbabilityOfDefaultTwoPointOneFiveToElevenPointThreeFivePercentMemberifrs-full:FinancialInstrumentsCreditimpairedMemberbcs:SatisfactoryBBPlusToBMemberifrs-full:LoansAndReceivablesCategoryMember2023-12-310000312069ifrs-full:AccumulatedImpairmentMemberbcs:ProbabilityOfDefaultTwoPointOneFiveToElevenPointThreeFivePercentMemberbcs:SatisfactoryBBPlusToBMemberbcs:ExpectedCreditLossesMemberifrs-full:LoansAndReceivablesCategoryMember2023-12-310000312069bcs:ProbabilityOfDefaultTwoPointOneFiveToElevenPointThreeFivePercentMemberbcs:SatisfactoryBBPlusToBMemberifrs-full:LoansAndReceivablesCategoryMember2023-12-310000312069bcs:ProbabilityOfDefaultElevenPointThreeFiveToOneHundredPercentMemberbcs:HigherRiskBMinusAndBelowMemberifrs-full:GrossCarryingAmountMemberifrs-full:LoansAndReceivablesCategoryMemberifrs-full:TwelvemonthExpectedCreditLossesMember2023-12-310000312069ifrs-full:LifetimeExpectedCreditLossesMemberbcs:ProbabilityOfDefaultElevenPointThreeFiveToOneHundredPercentMemberbcs:HigherRiskBMinusAndBelowMemberifrs-full:GrossCarryingAmountMemberifrs-full:LoansAndReceivablesCategoryMemberifrs-full:FinancialInstrumentsNotCreditimpairedMember2023-12-310000312069ifrs-full:LifetimeExpectedCreditLossesMemberbcs:ProbabilityOfDefaultElevenPointThreeFiveToOneHundredPercentMemberifrs-full:FinancialInstrumentsCreditimpairedMemberbcs:HigherRiskBMinusAndBelowMemberifrs-full:GrossCarryingAmountMemberifrs-full:LoansAndReceivablesCategoryMember2023-12-310000312069bcs:ProbabilityOfDefaultElevenPointThreeFiveToOneHundredPercentMemberbcs:HigherRiskBMinusAndBelowMemberifrs-full:GrossCarryingAmountMemberbcs:ExpectedCreditLossesMemberifrs-full:LoansAndReceivablesCategoryMember2023-12-310000312069ifrs-full:AccumulatedImpairmentMemberbcs:ProbabilityOfDefaultElevenPointThreeFiveToOneHundredPercentMemberbcs:HigherRiskBMinusAndBelowMemberifrs-full:LoansAndReceivablesCategoryMemberifrs-full:TwelvemonthExpectedCreditLossesMember2023-12-310000312069ifrs-full:AccumulatedImpairmentMemberifrs-full:LifetimeExpectedCreditLossesMemberbcs:ProbabilityOfDefaultElevenPointThreeFiveToOneHundredPercentMemberbcs:HigherRiskBMinusAndBelowMemberifrs-full:LoansAndReceivablesCategoryMemberifrs-full:FinancialInstrumentsNotCreditimpairedMember2023-12-310000312069ifrs-full:AccumulatedImpairmentMemberifrs-full:LifetimeExpectedCreditLossesMemberbcs:ProbabilityOfDefaultElevenPointThreeFiveToOneHundredPercentMemberifrs-full:FinancialInstrumentsCreditimpairedMemberbcs:HigherRiskBMinusAndBelowMemberifrs-full:LoansAndReceivablesCategoryMember2023-12-310000312069ifrs-full:AccumulatedImpairmentMemberbcs:ProbabilityOfDefaultElevenPointThreeFiveToOneHundredPercentMemberbcs:HigherRiskBMinusAndBelowMemberbcs:ExpectedCreditLossesMemberifrs-full:LoansAndReceivablesCategoryMember2023-12-310000312069bcs:ProbabilityOfDefaultElevenPointThreeFiveToOneHundredPercentMemberbcs:HigherRiskBMinusAndBelowMemberifrs-full:LoansAndReceivablesCategoryMember2023-12-310000312069bcs:ProbabilityOfDefaultOneHundredPercentMemberifrs-full:GrossCarryingAmountMemberifrs-full:LoansAndReceivablesCategoryMemberifrs-full:TwelvemonthExpectedCreditLossesMember2023-12-310000312069ifrs-full:LifetimeExpectedCreditLossesMemberbcs:ProbabilityOfDefaultOneHundredPercentMemberifrs-full:GrossCarryingAmountMemberifrs-full:LoansAndReceivablesCategoryMemberifrs-full:FinancialInstrumentsNotCreditimpairedMember2023-12-310000312069ifrs-full:LifetimeExpectedCreditLossesMemberifrs-full:FinancialInstrumentsCreditimpairedMemberbcs:ProbabilityOfDefaultOneHundredPercentMemberifrs-full:GrossCarryingAmountMemberifrs-full:LoansAndReceivablesCategoryMember2023-12-310000312069bcs:ProbabilityOfDefaultOneHundredPercentMemberifrs-full:GrossCarryingAmountMemberbcs:ExpectedCreditLossesMemberifrs-full:LoansAndReceivablesCategoryMember2023-12-310000312069ifrs-full:AccumulatedImpairmentMemberbcs:ProbabilityOfDefaultOneHundredPercentMemberifrs-full:LoansAndReceivablesCategoryMemberifrs-full:TwelvemonthExpectedCreditLossesMember2023-12-310000312069ifrs-full:AccumulatedImpairmentMemberifrs-full:LifetimeExpectedCreditLossesMemberbcs:ProbabilityOfDefaultOneHundredPercentMemberifrs-full:LoansAndReceivablesCategoryMemberifrs-full:FinancialInstrumentsNotCreditimpairedMember2023-12-310000312069ifrs-full:AccumulatedImpairmentMemberifrs-full:LifetimeExpectedCreditLossesMemberifrs-full:FinancialInstrumentsCreditimpairedMemberbcs:ProbabilityOfDefaultOneHundredPercentMemberifrs-full:LoansAndReceivablesCategoryMember2023-12-310000312069ifrs-full:AccumulatedImpairmentMemberbcs:ProbabilityOfDefaultOneHundredPercentMemberbcs:ExpectedCreditLossesMemberifrs-full:LoansAndReceivablesCategoryMember2023-12-310000312069bcs:ProbabilityOfDefaultOneHundredPercentMemberifrs-full:LoansAndReceivablesCategoryMember2023-12-310000312069ifrs-full:GrossCarryingAmountMemberifrs-full:LoansAndReceivablesCategoryMemberifrs-full:TwelvemonthExpectedCreditLossesMember2023-12-310000312069ifrs-full:LifetimeExpectedCreditLossesMemberifrs-full:GrossCarryingAmountMemberifrs-full:LoansAndReceivablesCategoryMemberifrs-full:FinancialInstrumentsNotCreditimpairedMember2023-12-310000312069ifrs-full:LifetimeExpectedCreditLossesMemberifrs-full:FinancialInstrumentsCreditimpairedMemberifrs-full:GrossCarryingAmountMemberifrs-full:LoansAndReceivablesCategoryMember2023-12-310000312069ifrs-full:GrossCarryingAmountMemberbcs:ExpectedCreditLossesMemberifrs-full:LoansAndReceivablesCategoryMember2023-12-310000312069ifrs-full:AccumulatedImpairmentMemberifrs-full:LoansAndReceivablesCategoryMemberifrs-full:TwelvemonthExpectedCreditLossesMember2023-12-310000312069ifrs-full:AccumulatedImpairmentMemberifrs-full:LifetimeExpectedCreditLossesMemberifrs-full:LoansAndReceivablesCategoryMemberifrs-full:FinancialInstrumentsNotCreditimpairedMember2023-12-310000312069ifrs-full:AccumulatedImpairmentMemberifrs-full:LifetimeExpectedCreditLossesMemberifrs-full:FinancialInstrumentsCreditimpairedMemberifrs-full:LoansAndReceivablesCategoryMember2023-12-310000312069ifrs-full:AccumulatedImpairmentMemberbcs:ExpectedCreditLossesMemberifrs-full:LoansAndReceivablesCategoryMember2023-12-310000312069ifrs-full:MortgagesMemberbcs:ProbabilityOfDefaultZeroToPointZeroFivePercentMemberifrs-full:GrossCarryingAmountMemberbcs:StrongIncludingInvestmentGradeMemberifrs-full:TwelvemonthExpectedCreditLossesMember2022-12-310000312069ifrs-full:LifetimeExpectedCreditLossesMemberifrs-full:MortgagesMemberbcs:ProbabilityOfDefaultZeroToPointZeroFivePercentMemberifrs-full:GrossCarryingAmountMemberifrs-full:FinancialInstrumentsNotCreditimpairedMemberbcs:StrongIncludingInvestmentGradeMember2022-12-310000312069ifrs-full:LifetimeExpectedCreditLossesMemberifrs-full:MortgagesMemberbcs:ProbabilityOfDefaultZeroToPointZeroFivePercentMemberifrs-full:FinancialInstrumentsCreditimpairedMemberifrs-full:GrossCarryingAmountMemberbcs:StrongIncludingInvestmentGradeMember2022-12-310000312069ifrs-full:MortgagesMemberbcs:ProbabilityOfDefaultZeroToPointZeroFivePercentMemberifrs-full:GrossCarryingAmountMemberbcs:ExpectedCreditLossesMemberbcs:StrongIncludingInvestmentGradeMember2022-12-310000312069ifrs-full:AccumulatedImpairmentMemberifrs-full:MortgagesMemberbcs:ProbabilityOfDefaultZeroToPointZeroFivePercentMemberbcs:StrongIncludingInvestmentGradeMemberifrs-full:TwelvemonthExpectedCreditLossesMember2022-12-310000312069ifrs-full:AccumulatedImpairmentMemberifrs-full:LifetimeExpectedCreditLossesMemberifrs-full:MortgagesMemberbcs:ProbabilityOfDefaultZeroToPointZeroFivePercentMemberifrs-full:FinancialInstrumentsNotCreditimpairedMemberbcs:StrongIncludingInvestmentGradeMember2022-12-310000312069ifrs-full:AccumulatedImpairmentMemberifrs-full:LifetimeExpectedCreditLossesMemberifrs-full:MortgagesMemberbcs:ProbabilityOfDefaultZeroToPointZeroFivePercentMemberifrs-full:FinancialInstrumentsCreditimpairedMemberbcs:StrongIncludingInvestmentGradeMember2022-12-310000312069ifrs-full:AccumulatedImpairmentMemberifrs-full:MortgagesMemberbcs:ProbabilityOfDefaultZeroToPointZeroFivePercentMemberbcs:ExpectedCreditLossesMemberbcs:StrongIncludingInvestmentGradeMember2022-12-310000312069ifrs-full:MortgagesMemberbcs:ProbabilityOfDefaultZeroToPointZeroFivePercentMemberbcs:StrongIncludingInvestmentGradeMember2022-12-310000312069ifrs-full:MortgagesMemberifrs-full:GrossCarryingAmountMemberbcs:ProbabilityOfDefaultPointZeroFiveToPointOneFivePercentMemberbcs:StrongIncludingInvestmentGradeMemberifrs-full:TwelvemonthExpectedCreditLossesMember2022-12-310000312069ifrs-full:LifetimeExpectedCreditLossesMemberifrs-full:MortgagesMemberifrs-full:GrossCarryingAmountMemberbcs:ProbabilityOfDefaultPointZeroFiveToPointOneFivePercentMemberifrs-full:FinancialInstrumentsNotCreditimpairedMemberbcs:StrongIncludingInvestmentGradeMember2022-12-310000312069ifrs-full:LifetimeExpectedCreditLossesMemberifrs-full:MortgagesMemberifrs-full:FinancialInstrumentsCreditimpairedMemberifrs-full:GrossCarryingAmountMemberbcs:ProbabilityOfDefaultPointZeroFiveToPointOneFivePercentMemberbcs:StrongIncludingInvestmentGradeMember2022-12-310000312069ifrs-full:MortgagesMemberifrs-full:GrossCarryingAmountMemberbcs:ExpectedCreditLossesMemberbcs:ProbabilityOfDefaultPointZeroFiveToPointOneFivePercentMemberbcs:StrongIncludingInvestmentGradeMember2022-12-310000312069ifrs-full:AccumulatedImpairmentMemberifrs-full:MortgagesMemberbcs:ProbabilityOfDefaultPointZeroFiveToPointOneFivePercentMemberbcs:StrongIncludingInvestmentGradeMemberifrs-full:TwelvemonthExpectedCreditLossesMember2022-12-310000312069ifrs-full:AccumulatedImpairmentMemberifrs-full:LifetimeExpectedCreditLossesMemberifrs-full:MortgagesMemberbcs:ProbabilityOfDefaultPointZeroFiveToPointOneFivePercentMemberifrs-full:FinancialInstrumentsNotCreditimpairedMemberbcs:StrongIncludingInvestmentGradeMember2022-12-310000312069ifrs-full:AccumulatedImpairmentMemberifrs-full:LifetimeExpectedCreditLossesMemberifrs-full:MortgagesMemberifrs-full:FinancialInstrumentsCreditimpairedMemberbcs:ProbabilityOfDefaultPointZeroFiveToPointOneFivePercentMemberbcs:StrongIncludingInvestmentGradeMember2022-12-310000312069ifrs-full:AccumulatedImpairmentMemberifrs-full:MortgagesMemberbcs:ExpectedCreditLossesMemberbcs:ProbabilityOfDefaultPointZeroFiveToPointOneFivePercentMemberbcs:StrongIncludingInvestmentGradeMember2022-12-310000312069ifrs-full:MortgagesMemberbcs:ProbabilityOfDefaultPointZeroFiveToPointOneFivePercentMemberbcs:StrongIncludingInvestmentGradeMember2022-12-310000312069ifrs-full:MortgagesMemberbcs:ProbabilityOfDefaultPointOneFiveToPointThreePercentMemberifrs-full:GrossCarryingAmountMemberbcs:StrongIncludingInvestmentGradeMemberifrs-full:TwelvemonthExpectedCreditLossesMember2022-12-310000312069ifrs-full:LifetimeExpectedCreditLossesMemberifrs-full:MortgagesMemberbcs:ProbabilityOfDefaultPointOneFiveToPointThreePercentMemberifrs-full:GrossCarryingAmountMemberifrs-full:FinancialInstrumentsNotCreditimpairedMemberbcs:StrongIncludingInvestmentGradeMember2022-12-310000312069ifrs-full:LifetimeExpectedCreditLossesMemberifrs-full:MortgagesMemberifrs-full:FinancialInstrumentsCreditimpairedMemberbcs:ProbabilityOfDefaultPointOneFiveToPointThreePercentMemberifrs-full:GrossCarryingAmountMemberbcs:StrongIncludingInvestmentGradeMember2022-12-310000312069ifrs-full:MortgagesMemberbcs:ProbabilityOfDefaultPointOneFiveToPointThreePercentMemberifrs-full:GrossCarryingAmountMemberbcs:ExpectedCreditLossesMemberbcs:StrongIncludingInvestmentGradeMember2022-12-310000312069ifrs-full:AccumulatedImpairmentMemberifrs-full:MortgagesMemberbcs:ProbabilityOfDefaultPointOneFiveToPointThreePercentMemberbcs:StrongIncludingInvestmentGradeMemberifrs-full:TwelvemonthExpectedCreditLossesMember2022-12-310000312069ifrs-full:AccumulatedImpairmentMemberifrs-full:LifetimeExpectedCreditLossesMemberifrs-full:MortgagesMemberbcs:ProbabilityOfDefaultPointOneFiveToPointThreePercentMemberifrs-full:FinancialInstrumentsNotCreditimpairedMemberbcs:StrongIncludingInvestmentGradeMember2022-12-310000312069ifrs-full:AccumulatedImpairmentMemberifrs-full:LifetimeExpectedCreditLossesMemberifrs-full:MortgagesMemberifrs-full:FinancialInstrumentsCreditimpairedMemberbcs:ProbabilityOfDefaultPointOneFiveToPointThreePercentMemberbcs:StrongIncludingInvestmentGradeMember2022-12-310000312069ifrs-full:AccumulatedImpairmentMemberifrs-full:MortgagesMemberbcs:ProbabilityOfDefaultPointOneFiveToPointThreePercentMemberbcs:ExpectedCreditLossesMemberbcs:StrongIncludingInvestmentGradeMember2022-12-310000312069ifrs-full:MortgagesMemberbcs:ProbabilityOfDefaultPointOneFiveToPointThreePercentMemberbcs:StrongIncludingInvestmentGradeMember2022-12-310000312069ifrs-full:MortgagesMemberbcs:ProbabilityOfDefaultPointThreeToPointSixPercentMemberifrs-full:GrossCarryingAmountMemberbcs:StrongIncludingInvestmentGradeMemberifrs-full:TwelvemonthExpectedCreditLossesMember2022-12-310000312069ifrs-full:LifetimeExpectedCreditLossesMemberifrs-full:MortgagesMemberbcs:ProbabilityOfDefaultPointThreeToPointSixPercentMemberifrs-full:GrossCarryingAmountMemberifrs-full:FinancialInstrumentsNotCreditimpairedMemberbcs:StrongIncludingInvestmentGradeMember2022-12-310000312069ifrs-full:LifetimeExpectedCreditLossesMemberifrs-full:MortgagesMemberbcs:ProbabilityOfDefaultPointThreeToPointSixPercentMemberifrs-full:FinancialInstrumentsCreditimpairedMemberifrs-full:GrossCarryingAmountMemberbcs:StrongIncludingInvestmentGradeMember2022-12-310000312069ifrs-full:MortgagesMemberbcs:ProbabilityOfDefaultPointThreeToPointSixPercentMemberifrs-full:GrossCarryingAmountMemberbcs:ExpectedCreditLossesMemberbcs:StrongIncludingInvestmentGradeMember2022-12-310000312069ifrs-full:AccumulatedImpairmentMemberifrs-full:MortgagesMemberbcs:ProbabilityOfDefaultPointThreeToPointSixPercentMemberbcs:StrongIncludingInvestmentGradeMemberifrs-full:TwelvemonthExpectedCreditLossesMember2022-12-310000312069ifrs-full:AccumulatedImpairmentMemberifrs-full:LifetimeExpectedCreditLossesMemberifrs-full:MortgagesMemberbcs:ProbabilityOfDefaultPointThreeToPointSixPercentMemberifrs-full:FinancialInstrumentsNotCreditimpairedMemberbcs:StrongIncludingInvestmentGradeMember2022-12-310000312069ifrs-full:AccumulatedImpairmentMemberifrs-full:LifetimeExpectedCreditLossesMemberifrs-full:MortgagesMemberbcs:ProbabilityOfDefaultPointThreeToPointSixPercentMemberifrs-full:FinancialInstrumentsCreditimpairedMemberbcs:StrongIncludingInvestmentGradeMember2022-12-310000312069ifrs-full:AccumulatedImpairmentMemberifrs-full:MortgagesMemberbcs:ProbabilityOfDefaultPointThreeToPointSixPercentMemberbcs:ExpectedCreditLossesMemberbcs:StrongIncludingInvestmentGradeMember2022-12-310000312069ifrs-full:MortgagesMemberbcs:ProbabilityOfDefaultPointThreeToPointSixPercentMemberbcs:StrongIncludingInvestmentGradeMember2022-12-310000312069bcs:ProbabilityOfDefaultPointSixtyToTwoPointOneFivePercentMemberifrs-full:MortgagesMemberbcs:SatisfactoryBBPlusToBMemberifrs-full:GrossCarryingAmountMemberifrs-full:TwelvemonthExpectedCreditLossesMember2022-12-310000312069bcs:ProbabilityOfDefaultPointSixtyToTwoPointOneFivePercentMemberifrs-full:LifetimeExpectedCreditLossesMemberifrs-full:MortgagesMemberbcs:SatisfactoryBBPlusToBMemberifrs-full:GrossCarryingAmountMemberifrs-full:FinancialInstrumentsNotCreditimpairedMember2022-12-310000312069bcs:ProbabilityOfDefaultPointSixtyToTwoPointOneFivePercentMemberifrs-full:LifetimeExpectedCreditLossesMemberifrs-full:MortgagesMemberifrs-full:FinancialInstrumentsCreditimpairedMemberbcs:SatisfactoryBBPlusToBMemberifrs-full:GrossCarryingAmountMember2022-12-310000312069bcs:ProbabilityOfDefaultPointSixtyToTwoPointOneFivePercentMemberifrs-full:MortgagesMemberbcs:SatisfactoryBBPlusToBMemberifrs-full:GrossCarryingAmountMemberbcs:ExpectedCreditLossesMember2022-12-310000312069bcs:ProbabilityOfDefaultPointSixtyToTwoPointOneFivePercentMemberifrs-full:AccumulatedImpairmentMemberifrs-full:MortgagesMemberbcs:SatisfactoryBBPlusToBMemberifrs-full:TwelvemonthExpectedCreditLossesMember2022-12-310000312069bcs:ProbabilityOfDefaultPointSixtyToTwoPointOneFivePercentMemberifrs-full:AccumulatedImpairmentMemberifrs-full:LifetimeExpectedCreditLossesMemberifrs-full:MortgagesMemberbcs:SatisfactoryBBPlusToBMemberifrs-full:FinancialInstrumentsNotCreditimpairedMember2022-12-310000312069bcs:ProbabilityOfDefaultPointSixtyToTwoPointOneFivePercentMemberifrs-full:AccumulatedImpairmentMemberifrs-full:LifetimeExpectedCreditLossesMemberifrs-full:MortgagesMemberifrs-full:FinancialInstrumentsCreditimpairedMemberbcs:SatisfactoryBBPlusToBMember2022-12-310000312069bcs:ProbabilityOfDefaultPointSixtyToTwoPointOneFivePercentMemberifrs-full:AccumulatedImpairmentMemberifrs-full:MortgagesMemberbcs:SatisfactoryBBPlusToBMemberbcs:ExpectedCreditLossesMember2022-12-310000312069bcs:ProbabilityOfDefaultPointSixtyToTwoPointOneFivePercentMemberifrs-full:MortgagesMemberbcs:SatisfactoryBBPlusToBMember2022-12-310000312069bcs:ProbabilityOfDefaultTwoPointOneFiveToElevenPointThreeFivePercentMemberifrs-full:MortgagesMemberbcs:SatisfactoryBBPlusToBMemberifrs-full:GrossCarryingAmountMemberifrs-full:TwelvemonthExpectedCreditLossesMember2022-12-310000312069ifrs-full:LifetimeExpectedCreditLossesMemberbcs:ProbabilityOfDefaultTwoPointOneFiveToElevenPointThreeFivePercentMemberifrs-full:MortgagesMemberbcs:SatisfactoryBBPlusToBMemberifrs-full:GrossCarryingAmountMemberifrs-full:FinancialInstrumentsNotCreditimpairedMember2022-12-310000312069ifrs-full:LifetimeExpectedCreditLossesMemberbcs:ProbabilityOfDefaultTwoPointOneFiveToElevenPointThreeFivePercentMemberifrs-full:MortgagesMemberifrs-full:FinancialInstrumentsCreditimpairedMemberbcs:SatisfactoryBBPlusToBMemberifrs-full:GrossCarryingAmountMember2022-12-310000312069bcs:ProbabilityOfDefaultTwoPointOneFiveToElevenPointThreeFivePercentMemberifrs-full:MortgagesMemberbcs:SatisfactoryBBPlusToBMemberifrs-full:GrossCarryingAmountMemberbcs:ExpectedCreditLossesMember2022-12-310000312069ifrs-full:AccumulatedImpairmentMemberbcs:ProbabilityOfDefaultTwoPointOneFiveToElevenPointThreeFivePercentMemberifrs-full:MortgagesMemberbcs:SatisfactoryBBPlusToBMemberifrs-full:TwelvemonthExpectedCreditLossesMember2022-12-310000312069ifrs-full:AccumulatedImpairmentMemberifrs-full:LifetimeExpectedCreditLossesMemberbcs:ProbabilityOfDefaultTwoPointOneFiveToElevenPointThreeFivePercentMemberifrs-full:MortgagesMemberbcs:SatisfactoryBBPlusToBMemberifrs-full:FinancialInstrumentsNotCreditimpairedMember2022-12-310000312069ifrs-full:AccumulatedImpairmentMemberifrs-full:LifetimeExpectedCreditLossesMemberbcs:ProbabilityOfDefaultTwoPointOneFiveToElevenPointThreeFivePercentMemberifrs-full:MortgagesMemberifrs-full:FinancialInstrumentsCreditimpairedMemberbcs:SatisfactoryBBPlusToBMember2022-12-310000312069ifrs-full:AccumulatedImpairmentMemberbcs:ProbabilityOfDefaultTwoPointOneFiveToElevenPointThreeFivePercentMemberifrs-full:MortgagesMemberbcs:SatisfactoryBBPlusToBMemberbcs:ExpectedCreditLossesMember2022-12-310000312069bcs:ProbabilityOfDefaultTwoPointOneFiveToElevenPointThreeFivePercentMemberifrs-full:MortgagesMemberbcs:SatisfactoryBBPlusToBMember2022-12-310000312069bcs:ProbabilityOfDefaultElevenPointThreeFiveToOneHundredPercentMemberifrs-full:MortgagesMemberbcs:HigherRiskBMinusAndBelowMemberifrs-full:GrossCarryingAmountMemberifrs-full:TwelvemonthExpectedCreditLossesMember2022-12-310000312069ifrs-full:LifetimeExpectedCreditLossesMemberbcs:ProbabilityOfDefaultElevenPointThreeFiveToOneHundredPercentMemberifrs-full:MortgagesMemberbcs:HigherRiskBMinusAndBelowMemberifrs-full:GrossCarryingAmountMemberifrs-full:FinancialInstrumentsNotCreditimpairedMember2022-12-310000312069ifrs-full:LifetimeExpectedCreditLossesMemberbcs:ProbabilityOfDefaultElevenPointThreeFiveToOneHundredPercentMemberifrs-full:MortgagesMemberifrs-full:FinancialInstrumentsCreditimpairedMemberbcs:HigherRiskBMinusAndBelowMemberifrs-full:GrossCarryingAmountMember2022-12-310000312069bcs:ProbabilityOfDefaultElevenPointThreeFiveToOneHundredPercentMemberifrs-full:MortgagesMemberbcs:HigherRiskBMinusAndBelowMemberifrs-full:GrossCarryingAmountMemberbcs:ExpectedCreditLossesMember2022-12-310000312069ifrs-full:AccumulatedImpairmentMemberbcs:ProbabilityOfDefaultElevenPointThreeFiveToOneHundredPercentMemberifrs-full:MortgagesMemberbcs:HigherRiskBMinusAndBelowMemberifrs-full:TwelvemonthExpectedCreditLossesMember2022-12-310000312069ifrs-full:AccumulatedImpairmentMemberifrs-full:LifetimeExpectedCreditLossesMemberbcs:ProbabilityOfDefaultElevenPointThreeFiveToOneHundredPercentMemberifrs-full:MortgagesMemberbcs:HigherRiskBMinusAndBelowMemberifrs-full:FinancialInstrumentsNotCreditimpairedMember2022-12-310000312069ifrs-full:AccumulatedImpairmentMemberifrs-full:LifetimeExpectedCreditLossesMemberbcs:ProbabilityOfDefaultElevenPointThreeFiveToOneHundredPercentMemberifrs-full:MortgagesMemberifrs-full:FinancialInstrumentsCreditimpairedMemberbcs:HigherRiskBMinusAndBelowMember2022-12-310000312069ifrs-full:AccumulatedImpairmentMemberbcs:ProbabilityOfDefaultElevenPointThreeFiveToOneHundredPercentMemberifrs-full:MortgagesMemberbcs:HigherRiskBMinusAndBelowMemberbcs:ExpectedCreditLossesMember2022-12-310000312069ifrs-full:MortgagesMemberbcs:ProbabilityOfDefaultElevenPointThreeFiveToOneHundredPercentMemberbcs:HigherRiskBMinusAndBelowMember2022-12-310000312069ifrs-full:MortgagesMemberbcs:ProbabilityOfDefaultOneHundredPercentMemberifrs-full:GrossCarryingAmountMemberifrs-full:TwelvemonthExpectedCreditLossesMember2022-12-310000312069ifrs-full:LifetimeExpectedCreditLossesMemberifrs-full:MortgagesMemberbcs:ProbabilityOfDefaultOneHundredPercentMemberifrs-full:GrossCarryingAmountMemberifrs-full:FinancialInstrumentsNotCreditimpairedMember2022-12-310000312069ifrs-full:LifetimeExpectedCreditLossesMemberifrs-full:MortgagesMemberifrs-full:FinancialInstrumentsCreditimpairedMemberbcs:ProbabilityOfDefaultOneHundredPercentMemberifrs-full:GrossCarryingAmountMember2022-12-310000312069ifrs-full:MortgagesMemberbcs:ProbabilityOfDefaultOneHundredPercentMemberifrs-full:GrossCarryingAmountMemberbcs:ExpectedCreditLossesMember2022-12-310000312069ifrs-full:AccumulatedImpairmentMemberifrs-full:MortgagesMemberbcs:ProbabilityOfDefaultOneHundredPercentMemberifrs-full:TwelvemonthExpectedCreditLossesMember2022-12-310000312069ifrs-full:AccumulatedImpairmentMemberifrs-full:LifetimeExpectedCreditLossesMemberifrs-full:MortgagesMemberbcs:ProbabilityOfDefaultOneHundredPercentMemberifrs-full:FinancialInstrumentsNotCreditimpairedMember2022-12-310000312069ifrs-full:AccumulatedImpairmentMemberifrs-full:LifetimeExpectedCreditLossesMemberifrs-full:MortgagesMemberifrs-full:FinancialInstrumentsCreditimpairedMemberbcs:ProbabilityOfDefaultOneHundredPercentMember2022-12-310000312069ifrs-full:AccumulatedImpairmentMemberifrs-full:MortgagesMemberbcs:ProbabilityOfDefaultOneHundredPercentMemberbcs:ExpectedCreditLossesMember2022-12-310000312069ifrs-full:MortgagesMemberbcs:ProbabilityOfDefaultOneHundredPercentMember2022-12-310000312069ifrs-full:MortgagesMemberifrs-full:GrossCarryingAmountMemberbcs:ExpectedCreditLossesMember2022-12-310000312069ifrs-full:AccumulatedImpairmentMemberifrs-full:MortgagesMemberbcs:ExpectedCreditLossesMember2022-12-310000312069ifrs-full:MortgagesMember2022-12-310000312069bcs:CreditCardsRetailMemberbcs:ProbabilityOfDefaultZeroToPointZeroFivePercentMemberifrs-full:GrossCarryingAmountMemberbcs:StrongIncludingInvestmentGradeMemberifrs-full:TwelvemonthExpectedCreditLossesMember2022-12-310000312069bcs:CreditCardsRetailMemberifrs-full:LifetimeExpectedCreditLossesMemberbcs:ProbabilityOfDefaultZeroToPointZeroFivePercentMemberifrs-full:GrossCarryingAmountMemberifrs-full:FinancialInstrumentsNotCreditimpairedMemberbcs:StrongIncludingInvestmentGradeMember2022-12-310000312069bcs:CreditCardsRetailMemberifrs-full:LifetimeExpectedCreditLossesMemberbcs:ProbabilityOfDefaultZeroToPointZeroFivePercentMemberifrs-full:FinancialInstrumentsCreditimpairedMemberifrs-full:GrossCarryingAmountMemberbcs:StrongIncludingInvestmentGradeMember2022-12-310000312069bcs:CreditCardsRetailMemberbcs:ProbabilityOfDefaultZeroToPointZeroFivePercentMemberifrs-full:GrossCarryingAmountMemberbcs:ExpectedCreditLossesMemberbcs:StrongIncludingInvestmentGradeMember2022-12-310000312069bcs:CreditCardsRetailMemberifrs-full:AccumulatedImpairmentMemberbcs:ProbabilityOfDefaultZeroToPointZeroFivePercentMemberbcs:StrongIncludingInvestmentGradeMemberifrs-full:TwelvemonthExpectedCreditLossesMember2022-12-310000312069bcs:CreditCardsRetailMemberifrs-full:AccumulatedImpairmentMemberifrs-full:LifetimeExpectedCreditLossesMemberbcs:ProbabilityOfDefaultZeroToPointZeroFivePercentMemberifrs-full:FinancialInstrumentsNotCreditimpairedMemberbcs:StrongIncludingInvestmentGradeMember2022-12-310000312069bcs:CreditCardsRetailMemberifrs-full:AccumulatedImpairmentMemberifrs-full:LifetimeExpectedCreditLossesMemberbcs:ProbabilityOfDefaultZeroToPointZeroFivePercentMemberifrs-full:FinancialInstrumentsCreditimpairedMemberbcs:StrongIncludingInvestmentGradeMember2022-12-310000312069bcs:CreditCardsRetailMemberifrs-full:AccumulatedImpairmentMemberbcs:ProbabilityOfDefaultZeroToPointZeroFivePercentMemberbcs:ExpectedCreditLossesMemberbcs:StrongIncludingInvestmentGradeMember2022-12-310000312069bcs:CreditCardsRetailMemberbcs:ProbabilityOfDefaultZeroToPointZeroFivePercentMemberbcs:StrongIncludingInvestmentGradeMember2022-12-310000312069bcs:CreditCardsRetailMemberifrs-full:GrossCarryingAmountMemberbcs:ProbabilityOfDefaultPointZeroFiveToPointOneFivePercentMemberbcs:StrongIncludingInvestmentGradeMemberifrs-full:TwelvemonthExpectedCreditLossesMember2022-12-310000312069bcs:CreditCardsRetailMemberifrs-full:LifetimeExpectedCreditLossesMemberifrs-full:GrossCarryingAmountMemberbcs:ProbabilityOfDefaultPointZeroFiveToPointOneFivePercentMemberifrs-full:FinancialInstrumentsNotCreditimpairedMemberbcs:StrongIncludingInvestmentGradeMember2022-12-310000312069bcs:CreditCardsRetailMemberifrs-full:LifetimeExpectedCreditLossesMemberifrs-full:FinancialInstrumentsCreditimpairedMemberifrs-full:GrossCarryingAmountMemberbcs:ProbabilityOfDefaultPointZeroFiveToPointOneFivePercentMemberbcs:StrongIncludingInvestmentGradeMember2022-12-310000312069bcs:CreditCardsRetailMemberifrs-full:GrossCarryingAmountMemberbcs:ExpectedCreditLossesMemberbcs:ProbabilityOfDefaultPointZeroFiveToPointOneFivePercentMemberbcs:StrongIncludingInvestmentGradeMember2022-12-310000312069bcs:CreditCardsRetailMemberifrs-full:AccumulatedImpairmentMemberbcs:ProbabilityOfDefaultPointZeroFiveToPointOneFivePercentMemberbcs:StrongIncludingInvestmentGradeMemberifrs-full:TwelvemonthExpectedCreditLossesMember2022-12-310000312069bcs:CreditCardsRetailMemberifrs-full:AccumulatedImpairmentMemberifrs-full:LifetimeExpectedCreditLossesMemberbcs:ProbabilityOfDefaultPointZeroFiveToPointOneFivePercentMemberifrs-full:FinancialInstrumentsNotCreditimpairedMemberbcs:StrongIncludingInvestmentGradeMember2022-12-310000312069bcs:CreditCardsRetailMemberifrs-full:AccumulatedImpairmentMemberifrs-full:LifetimeExpectedCreditLossesMemberifrs-full:FinancialInstrumentsCreditimpairedMemberbcs:ProbabilityOfDefaultPointZeroFiveToPointOneFivePercentMemberbcs:StrongIncludingInvestmentGradeMember2022-12-310000312069bcs:CreditCardsRetailMemberifrs-full:AccumulatedImpairmentMemberbcs:ExpectedCreditLossesMemberbcs:ProbabilityOfDefaultPointZeroFiveToPointOneFivePercentMemberbcs:StrongIncludingInvestmentGradeMember2022-12-310000312069bcs:CreditCardsRetailMemberbcs:ProbabilityOfDefaultPointZeroFiveToPointOneFivePercentMemberbcs:StrongIncludingInvestmentGradeMember2022-12-310000312069bcs:CreditCardsRetailMemberbcs:ProbabilityOfDefaultPointOneFiveToPointThreePercentMemberifrs-full:GrossCarryingAmountMemberbcs:StrongIncludingInvestmentGradeMemberifrs-full:TwelvemonthExpectedCreditLossesMember2022-12-310000312069bcs:CreditCardsRetailMemberifrs-full:LifetimeExpectedCreditLossesMemberbcs:ProbabilityOfDefaultPointOneFiveToPointThreePercentMemberifrs-full:GrossCarryingAmountMemberifrs-full:FinancialInstrumentsNotCreditimpairedMemberbcs:StrongIncludingInvestmentGradeMember2022-12-310000312069bcs:CreditCardsRetailMemberifrs-full:LifetimeExpectedCreditLossesMemberifrs-full:FinancialInstrumentsCreditimpairedMemberbcs:ProbabilityOfDefaultPointOneFiveToPointThreePercentMemberifrs-full:GrossCarryingAmountMemberbcs:StrongIncludingInvestmentGradeMember2022-12-310000312069bcs:CreditCardsRetailMemberbcs:ProbabilityOfDefaultPointOneFiveToPointThreePercentMemberifrs-full:GrossCarryingAmountMemberbcs:ExpectedCreditLossesMemberbcs:StrongIncludingInvestmentGradeMember2022-12-310000312069bcs:CreditCardsRetailMemberifrs-full:AccumulatedImpairmentMemberbcs:ProbabilityOfDefaultPointOneFiveToPointThreePercentMemberbcs:StrongIncludingInvestmentGradeMemberifrs-full:TwelvemonthExpectedCreditLossesMember2022-12-310000312069bcs:CreditCardsRetailMemberifrs-full:AccumulatedImpairmentMemberifrs-full:LifetimeExpectedCreditLossesMemberbcs:ProbabilityOfDefaultPointOneFiveToPointThreePercentMemberifrs-full:FinancialInstrumentsNotCreditimpairedMemberbcs:StrongIncludingInvestmentGradeMember2022-12-310000312069bcs:CreditCardsRetailMemberifrs-full:AccumulatedImpairmentMemberifrs-full:LifetimeExpectedCreditLossesMemberifrs-full:FinancialInstrumentsCreditimpairedMemberbcs:ProbabilityOfDefaultPointOneFiveToPointThreePercentMemberbcs:StrongIncludingInvestmentGradeMember2022-12-310000312069bcs:CreditCardsRetailMemberifrs-full:AccumulatedImpairmentMemberbcs:ProbabilityOfDefaultPointOneFiveToPointThreePercentMemberbcs:ExpectedCreditLossesMemberbcs:StrongIncludingInvestmentGradeMember2022-12-310000312069bcs:CreditCardsRetailMemberbcs:ProbabilityOfDefaultPointOneFiveToPointThreePercentMemberbcs:StrongIncludingInvestmentGradeMember2022-12-310000312069bcs:CreditCardsRetailMemberbcs:ProbabilityOfDefaultPointThreeToPointSixPercentMemberifrs-full:GrossCarryingAmountMemberbcs:StrongIncludingInvestmentGradeMemberifrs-full:TwelvemonthExpectedCreditLossesMember2022-12-310000312069bcs:CreditCardsRetailMemberifrs-full:LifetimeExpectedCreditLossesMemberbcs:ProbabilityOfDefaultPointThreeToPointSixPercentMemberifrs-full:GrossCarryingAmountMemberifrs-full:FinancialInstrumentsNotCreditimpairedMemberbcs:StrongIncludingInvestmentGradeMember2022-12-310000312069bcs:CreditCardsRetailMemberifrs-full:LifetimeExpectedCreditLossesMemberbcs:ProbabilityOfDefaultPointThreeToPointSixPercentMemberifrs-full:FinancialInstrumentsCreditimpairedMemberifrs-full:GrossCarryingAmountMemberbcs:StrongIncludingInvestmentGradeMember2022-12-310000312069bcs:CreditCardsRetailMemberbcs:ProbabilityOfDefaultPointThreeToPointSixPercentMemberifrs-full:GrossCarryingAmountMemberbcs:ExpectedCreditLossesMemberbcs:StrongIncludingInvestmentGradeMember2022-12-310000312069bcs:CreditCardsRetailMemberifrs-full:AccumulatedImpairmentMemberbcs:ProbabilityOfDefaultPointThreeToPointSixPercentMemberbcs:StrongIncludingInvestmentGradeMemberifrs-full:TwelvemonthExpectedCreditLossesMember2022-12-310000312069bcs:CreditCardsRetailMemberifrs-full:AccumulatedImpairmentMemberifrs-full:LifetimeExpectedCreditLossesMemberbcs:ProbabilityOfDefaultPointThreeToPointSixPercentMemberifrs-full:FinancialInstrumentsNotCreditimpairedMemberbcs:StrongIncludingInvestmentGradeMember2022-12-310000312069bcs:CreditCardsRetailMemberifrs-full:AccumulatedImpairmentMemberifrs-full:LifetimeExpectedCreditLossesMemberbcs:ProbabilityOfDefaultPointThreeToPointSixPercentMemberifrs-full:FinancialInstrumentsCreditimpairedMemberbcs:StrongIncludingInvestmentGradeMember2022-12-310000312069bcs:CreditCardsRetailMemberifrs-full:AccumulatedImpairmentMemberbcs:ProbabilityOfDefaultPointThreeToPointSixPercentMemberbcs:ExpectedCreditLossesMemberbcs:StrongIncludingInvestmentGradeMember2022-12-310000312069bcs:CreditCardsRetailMemberbcs:ProbabilityOfDefaultPointThreeToPointSixPercentMemberbcs:StrongIncludingInvestmentGradeMember2022-12-310000312069bcs:ProbabilityOfDefaultPointSixtyToTwoPointOneFivePercentMemberbcs:CreditCardsRetailMemberbcs:SatisfactoryBBPlusToBMemberifrs-full:GrossCarryingAmountMemberifrs-full:TwelvemonthExpectedCreditLossesMember2022-12-310000312069bcs:ProbabilityOfDefaultPointSixtyToTwoPointOneFivePercentMemberbcs:CreditCardsRetailMemberifrs-full:LifetimeExpectedCreditLossesMemberbcs:SatisfactoryBBPlusToBMemberifrs-full:GrossCarryingAmountMemberifrs-full:FinancialInstrumentsNotCreditimpairedMember2022-12-310000312069bcs:ProbabilityOfDefaultPointSixtyToTwoPointOneFivePercentMemberbcs:CreditCardsRetailMemberifrs-full:LifetimeExpectedCreditLossesMemberifrs-full:FinancialInstrumentsCreditimpairedMemberbcs:SatisfactoryBBPlusToBMemberifrs-full:GrossCarryingAmountMember2022-12-310000312069bcs:ProbabilityOfDefaultPointSixtyToTwoPointOneFivePercentMemberbcs:CreditCardsRetailMemberbcs:SatisfactoryBBPlusToBMemberifrs-full:GrossCarryingAmountMemberbcs:ExpectedCreditLossesMember2022-12-310000312069bcs:ProbabilityOfDefaultPointSixtyToTwoPointOneFivePercentMemberbcs:CreditCardsRetailMemberifrs-full:AccumulatedImpairmentMemberbcs:SatisfactoryBBPlusToBMemberifrs-full:TwelvemonthExpectedCreditLossesMember2022-12-310000312069bcs:ProbabilityOfDefaultPointSixtyToTwoPointOneFivePercentMemberbcs:CreditCardsRetailMemberifrs-full:AccumulatedImpairmentMemberifrs-full:LifetimeExpectedCreditLossesMemberbcs:SatisfactoryBBPlusToBMemberifrs-full:FinancialInstrumentsNotCreditimpairedMember2022-12-310000312069bcs:ProbabilityOfDefaultPointSixtyToTwoPointOneFivePercentMemberbcs:CreditCardsRetailMemberifrs-full:AccumulatedImpairmentMemberifrs-full:LifetimeExpectedCreditLossesMemberifrs-full:FinancialInstrumentsCreditimpairedMemberbcs:SatisfactoryBBPlusToBMember2022-12-310000312069bcs:ProbabilityOfDefaultPointSixtyToTwoPointOneFivePercentMemberbcs:CreditCardsRetailMemberifrs-full:AccumulatedImpairmentMemberbcs:SatisfactoryBBPlusToBMemberbcs:ExpectedCreditLossesMember2022-12-310000312069bcs:CreditCardsRetailMemberbcs:ProbabilityOfDefaultPointSixtyToTwoPointOneFivePercentMemberbcs:SatisfactoryBBPlusToBMember2022-12-310000312069bcs:CreditCardsRetailMemberbcs:ProbabilityOfDefaultTwoPointOneFiveToElevenPointThreeFivePercentMemberbcs:SatisfactoryBBPlusToBMemberifrs-full:GrossCarryingAmountMemberifrs-full:TwelvemonthExpectedCreditLossesMember2022-12-310000312069bcs:CreditCardsRetailMemberifrs-full:LifetimeExpectedCreditLossesMemberbcs:ProbabilityOfDefaultTwoPointOneFiveToElevenPointThreeFivePercentMemberbcs:SatisfactoryBBPlusToBMemberifrs-full:GrossCarryingAmountMemberifrs-full:FinancialInstrumentsNotCreditimpairedMember2022-12-310000312069bcs:CreditCardsRetailMemberifrs-full:LifetimeExpectedCreditLossesMemberbcs:ProbabilityOfDefaultTwoPointOneFiveToElevenPointThreeFivePercentMemberifrs-full:FinancialInstrumentsCreditimpairedMemberbcs:SatisfactoryBBPlusToBMemberifrs-full:GrossCarryingAmountMember2022-12-310000312069bcs:CreditCardsRetailMemberbcs:ProbabilityOfDefaultTwoPointOneFiveToElevenPointThreeFivePercentMemberbcs:SatisfactoryBBPlusToBMemberifrs-full:GrossCarryingAmountMemberbcs:ExpectedCreditLossesMember2022-12-310000312069bcs:CreditCardsRetailMemberifrs-full:AccumulatedImpairmentMemberbcs:ProbabilityOfDefaultTwoPointOneFiveToElevenPointThreeFivePercentMemberbcs:SatisfactoryBBPlusToBMemberifrs-full:TwelvemonthExpectedCreditLossesMember2022-12-310000312069bcs:CreditCardsRetailMemberifrs-full:AccumulatedImpairmentMemberifrs-full:LifetimeExpectedCreditLossesMemberbcs:ProbabilityOfDefaultTwoPointOneFiveToElevenPointThreeFivePercentMemberbcs:SatisfactoryBBPlusToBMemberifrs-full:FinancialInstrumentsNotCreditimpairedMember2022-12-310000312069bcs:CreditCardsRetailMemberifrs-full:AccumulatedImpairmentMemberifrs-full:LifetimeExpectedCreditLossesMemberbcs:ProbabilityOfDefaultTwoPointOneFiveToElevenPointThreeFivePercentMemberifrs-full:FinancialInstrumentsCreditimpairedMemberbcs:SatisfactoryBBPlusToBMember2022-12-310000312069bcs:CreditCardsRetailMemberifrs-full:AccumulatedImpairmentMemberbcs:ProbabilityOfDefaultTwoPointOneFiveToElevenPointThreeFivePercentMemberbcs:SatisfactoryBBPlusToBMemberbcs:ExpectedCreditLossesMember2022-12-310000312069bcs:CreditCardsRetailMemberbcs:ProbabilityOfDefaultTwoPointOneFiveToElevenPointThreeFivePercentMemberbcs:SatisfactoryBBPlusToBMember2022-12-310000312069bcs:CreditCardsRetailMemberbcs:ProbabilityOfDefaultElevenPointThreeFiveToOneHundredPercentMemberbcs:HigherRiskBMinusAndBelowMemberifrs-full:GrossCarryingAmountMemberifrs-full:TwelvemonthExpectedCreditLossesMember2022-12-310000312069bcs:CreditCardsRetailMemberifrs-full:LifetimeExpectedCreditLossesMemberbcs:ProbabilityOfDefaultElevenPointThreeFiveToOneHundredPercentMemberbcs:HigherRiskBMinusAndBelowMemberifrs-full:GrossCarryingAmountMemberifrs-full:FinancialInstrumentsNotCreditimpairedMember2022-12-310000312069bcs:CreditCardsRetailMemberifrs-full:LifetimeExpectedCreditLossesMemberbcs:ProbabilityOfDefaultElevenPointThreeFiveToOneHundredPercentMemberifrs-full:FinancialInstrumentsCreditimpairedMemberbcs:HigherRiskBMinusAndBelowMemberifrs-full:GrossCarryingAmountMember2022-12-310000312069bcs:CreditCardsRetailMemberbcs:ProbabilityOfDefaultElevenPointThreeFiveToOneHundredPercentMemberbcs:HigherRiskBMinusAndBelowMemberifrs-full:GrossCarryingAmountMemberbcs:ExpectedCreditLossesMember2022-12-310000312069bcs:CreditCardsRetailMemberifrs-full:AccumulatedImpairmentMemberbcs:ProbabilityOfDefaultElevenPointThreeFiveToOneHundredPercentMemberbcs:HigherRiskBMinusAndBelowMemberifrs-full:TwelvemonthExpectedCreditLossesMember2022-12-310000312069bcs:CreditCardsRetailMemberifrs-full:AccumulatedImpairmentMemberifrs-full:LifetimeExpectedCreditLossesMemberbcs:ProbabilityOfDefaultElevenPointThreeFiveToOneHundredPercentMemberbcs:HigherRiskBMinusAndBelowMemberifrs-full:FinancialInstrumentsNotCreditimpairedMember2022-12-310000312069bcs:CreditCardsRetailMemberifrs-full:AccumulatedImpairmentMemberifrs-full:LifetimeExpectedCreditLossesMemberbcs:ProbabilityOfDefaultElevenPointThreeFiveToOneHundredPercentMemberifrs-full:FinancialInstrumentsCreditimpairedMemberbcs:HigherRiskBMinusAndBelowMember2022-12-310000312069bcs:CreditCardsRetailMemberifrs-full:AccumulatedImpairmentMemberbcs:ProbabilityOfDefaultElevenPointThreeFiveToOneHundredPercentMemberbcs:HigherRiskBMinusAndBelowMemberbcs:ExpectedCreditLossesMember2022-12-310000312069bcs:CreditCardsRetailMemberbcs:ProbabilityOfDefaultElevenPointThreeFiveToOneHundredPercentMemberbcs:HigherRiskBMinusAndBelowMember2022-12-310000312069bcs:CreditCardsRetailMemberbcs:ProbabilityOfDefaultOneHundredPercentMemberifrs-full:GrossCarryingAmountMemberifrs-full:TwelvemonthExpectedCreditLossesMember2022-12-310000312069bcs:CreditCardsRetailMemberifrs-full:LifetimeExpectedCreditLossesMemberbcs:ProbabilityOfDefaultOneHundredPercentMemberifrs-full:GrossCarryingAmountMemberifrs-full:FinancialInstrumentsNotCreditimpairedMember2022-12-310000312069bcs:CreditCardsRetailMemberifrs-full:LifetimeExpectedCreditLossesMemberifrs-full:FinancialInstrumentsCreditimpairedMemberbcs:ProbabilityOfDefaultOneHundredPercentMemberifrs-full:GrossCarryingAmountMember2022-12-310000312069bcs:CreditCardsRetailMemberbcs:ProbabilityOfDefaultOneHundredPercentMemberifrs-full:GrossCarryingAmountMemberbcs:ExpectedCreditLossesMember2022-12-310000312069bcs:CreditCardsRetailMemberifrs-full:AccumulatedImpairmentMemberbcs:ProbabilityOfDefaultOneHundredPercentMemberifrs-full:TwelvemonthExpectedCreditLossesMember2022-12-310000312069bcs:CreditCardsRetailMemberifrs-full:AccumulatedImpairmentMemberifrs-full:LifetimeExpectedCreditLossesMemberbcs:ProbabilityOfDefaultOneHundredPercentMemberifrs-full:FinancialInstrumentsNotCreditimpairedMember2022-12-310000312069bcs:CreditCardsRetailMemberifrs-full:AccumulatedImpairmentMemberifrs-full:LifetimeExpectedCreditLossesMemberifrs-full:FinancialInstrumentsCreditimpairedMemberbcs:ProbabilityOfDefaultOneHundredPercentMember2022-12-310000312069bcs:CreditCardsRetailMemberifrs-full:AccumulatedImpairmentMemberbcs:ProbabilityOfDefaultOneHundredPercentMemberbcs:ExpectedCreditLossesMember2022-12-310000312069bcs:CreditCardsRetailMemberbcs:ProbabilityOfDefaultOneHundredPercentMember2022-12-310000312069bcs:CreditCardsRetailMemberifrs-full:GrossCarryingAmountMemberbcs:ExpectedCreditLossesMember2022-12-310000312069bcs:CreditCardsRetailMemberifrs-full:AccumulatedImpairmentMemberbcs:ExpectedCreditLossesMember2022-12-310000312069bcs:CreditCardsRetailMember2022-12-310000312069bcs:OtherRetailMemberbcs:ProbabilityOfDefaultZeroToPointZeroFivePercentMemberifrs-full:GrossCarryingAmountMemberbcs:StrongIncludingInvestmentGradeMemberifrs-full:TwelvemonthExpectedCreditLossesMember2022-12-310000312069ifrs-full:LifetimeExpectedCreditLossesMemberbcs:OtherRetailMemberbcs:ProbabilityOfDefaultZeroToPointZeroFivePercentMemberifrs-full:GrossCarryingAmountMemberifrs-full:FinancialInstrumentsNotCreditimpairedMemberbcs:StrongIncludingInvestmentGradeMember2022-12-310000312069ifrs-full:LifetimeExpectedCreditLossesMemberbcs:OtherRetailMemberbcs:ProbabilityOfDefaultZeroToPointZeroFivePercentMemberifrs-full:FinancialInstrumentsCreditimpairedMemberifrs-full:GrossCarryingAmountMemberbcs:StrongIncludingInvestmentGradeMember2022-12-310000312069bcs:OtherRetailMemberbcs:ProbabilityOfDefaultZeroToPointZeroFivePercentMemberifrs-full:GrossCarryingAmountMemberbcs:ExpectedCreditLossesMemberbcs:StrongIncludingInvestmentGradeMember2022-12-310000312069ifrs-full:AccumulatedImpairmentMemberbcs:OtherRetailMemberbcs:ProbabilityOfDefaultZeroToPointZeroFivePercentMemberbcs:StrongIncludingInvestmentGradeMemberifrs-full:TwelvemonthExpectedCreditLossesMember2022-12-310000312069ifrs-full:AccumulatedImpairmentMemberifrs-full:LifetimeExpectedCreditLossesMemberbcs:OtherRetailMemberbcs:ProbabilityOfDefaultZeroToPointZeroFivePercentMemberifrs-full:FinancialInstrumentsNotCreditimpairedMemberbcs:StrongIncludingInvestmentGradeMember2022-12-310000312069ifrs-full:AccumulatedImpairmentMemberifrs-full:LifetimeExpectedCreditLossesMemberbcs:OtherRetailMemberbcs:ProbabilityOfDefaultZeroToPointZeroFivePercentMemberifrs-full:FinancialInstrumentsCreditimpairedMemberbcs:StrongIncludingInvestmentGradeMember2022-12-310000312069ifrs-full:AccumulatedImpairmentMemberbcs:OtherRetailMemberbcs:ProbabilityOfDefaultZeroToPointZeroFivePercentMemberbcs:ExpectedCreditLossesMemberbcs:StrongIncludingInvestmentGradeMember2022-12-310000312069bcs:OtherRetailMemberbcs:ProbabilityOfDefaultZeroToPointZeroFivePercentMemberbcs:StrongIncludingInvestmentGradeMember2022-12-310000312069bcs:OtherRetailMemberifrs-full:GrossCarryingAmountMemberbcs:ProbabilityOfDefaultPointZeroFiveToPointOneFivePercentMemberbcs:StrongIncludingInvestmentGradeMemberifrs-full:TwelvemonthExpectedCreditLossesMember2022-12-310000312069ifrs-full:LifetimeExpectedCreditLossesMemberbcs:OtherRetailMemberifrs-full:GrossCarryingAmountMemberbcs:ProbabilityOfDefaultPointZeroFiveToPointOneFivePercentMemberifrs-full:FinancialInstrumentsNotCreditimpairedMemberbcs:StrongIncludingInvestmentGradeMember2022-12-310000312069ifrs-full:LifetimeExpectedCreditLossesMemberbcs:OtherRetailMemberifrs-full:FinancialInstrumentsCreditimpairedMemberifrs-full:GrossCarryingAmountMemberbcs:ProbabilityOfDefaultPointZeroFiveToPointOneFivePercentMemberbcs:StrongIncludingInvestmentGradeMember2022-12-310000312069bcs:OtherRetailMemberifrs-full:GrossCarryingAmountMemberbcs:ExpectedCreditLossesMemberbcs:ProbabilityOfDefaultPointZeroFiveToPointOneFivePercentMemberbcs:StrongIncludingInvestmentGradeMember2022-12-310000312069ifrs-full:AccumulatedImpairmentMemberbcs:OtherRetailMemberbcs:ProbabilityOfDefaultPointZeroFiveToPointOneFivePercentMemberbcs:StrongIncludingInvestmentGradeMemberifrs-full:TwelvemonthExpectedCreditLossesMember2022-12-310000312069ifrs-full:AccumulatedImpairmentMemberifrs-full:LifetimeExpectedCreditLossesMemberbcs:OtherRetailMemberbcs:ProbabilityOfDefaultPointZeroFiveToPointOneFivePercentMemberifrs-full:FinancialInstrumentsNotCreditimpairedMemberbcs:StrongIncludingInvestmentGradeMember2022-12-310000312069ifrs-full:AccumulatedImpairmentMemberifrs-full:LifetimeExpectedCreditLossesMemberbcs:OtherRetailMemberifrs-full:FinancialInstrumentsCreditimpairedMemberbcs:ProbabilityOfDefaultPointZeroFiveToPointOneFivePercentMemberbcs:StrongIncludingInvestmentGradeMember2022-12-310000312069ifrs-full:AccumulatedImpairmentMemberbcs:OtherRetailMemberbcs:ExpectedCreditLossesMemberbcs:ProbabilityOfDefaultPointZeroFiveToPointOneFivePercentMemberbcs:StrongIncludingInvestmentGradeMember2022-12-310000312069bcs:OtherRetailMemberbcs:ProbabilityOfDefaultPointZeroFiveToPointOneFivePercentMemberbcs:StrongIncludingInvestmentGradeMember2022-12-310000312069bcs:OtherRetailMemberbcs:ProbabilityOfDefaultPointOneFiveToPointThreePercentMemberifrs-full:GrossCarryingAmountMemberbcs:StrongIncludingInvestmentGradeMemberifrs-full:TwelvemonthExpectedCreditLossesMember2022-12-310000312069ifrs-full:LifetimeExpectedCreditLossesMemberbcs:OtherRetailMemberbcs:ProbabilityOfDefaultPointOneFiveToPointThreePercentMemberifrs-full:GrossCarryingAmountMemberifrs-full:FinancialInstrumentsNotCreditimpairedMemberbcs:StrongIncludingInvestmentGradeMember2022-12-310000312069ifrs-full:LifetimeExpectedCreditLossesMemberbcs:OtherRetailMemberifrs-full:FinancialInstrumentsCreditimpairedMemberbcs:ProbabilityOfDefaultPointOneFiveToPointThreePercentMemberifrs-full:GrossCarryingAmountMemberbcs:StrongIncludingInvestmentGradeMember2022-12-310000312069bcs:OtherRetailMemberbcs:ProbabilityOfDefaultPointOneFiveToPointThreePercentMemberifrs-full:GrossCarryingAmountMemberbcs:ExpectedCreditLossesMemberbcs:StrongIncludingInvestmentGradeMember2022-12-310000312069ifrs-full:AccumulatedImpairmentMemberbcs:OtherRetailMemberbcs:ProbabilityOfDefaultPointOneFiveToPointThreePercentMemberbcs:StrongIncludingInvestmentGradeMemberifrs-full:TwelvemonthExpectedCreditLossesMember2022-12-310000312069ifrs-full:AccumulatedImpairmentMemberifrs-full:LifetimeExpectedCreditLossesMemberbcs:OtherRetailMemberbcs:ProbabilityOfDefaultPointOneFiveToPointThreePercentMemberifrs-full:FinancialInstrumentsNotCreditimpairedMemberbcs:StrongIncludingInvestmentGradeMember2022-12-310000312069ifrs-full:AccumulatedImpairmentMemberifrs-full:LifetimeExpectedCreditLossesMemberbcs:OtherRetailMemberifrs-full:FinancialInstrumentsCreditimpairedMemberbcs:ProbabilityOfDefaultPointOneFiveToPointThreePercentMemberbcs:StrongIncludingInvestmentGradeMember2022-12-310000312069ifrs-full:AccumulatedImpairmentMemberbcs:OtherRetailMemberbcs:ProbabilityOfDefaultPointOneFiveToPointThreePercentMemberbcs:ExpectedCreditLossesMemberbcs:StrongIncludingInvestmentGradeMember2022-12-310000312069bcs:OtherRetailMemberbcs:ProbabilityOfDefaultPointOneFiveToPointThreePercentMemberbcs:StrongIncludingInvestmentGradeMember2022-12-310000312069bcs:OtherRetailMemberbcs:ProbabilityOfDefaultPointThreeToPointSixPercentMemberifrs-full:GrossCarryingAmountMemberbcs:StrongIncludingInvestmentGradeMemberifrs-full:TwelvemonthExpectedCreditLossesMember2022-12-310000312069ifrs-full:LifetimeExpectedCreditLossesMemberbcs:OtherRetailMemberbcs:ProbabilityOfDefaultPointThreeToPointSixPercentMemberifrs-full:GrossCarryingAmountMemberifrs-full:FinancialInstrumentsNotCreditimpairedMemberbcs:StrongIncludingInvestmentGradeMember2022-12-310000312069ifrs-full:LifetimeExpectedCreditLossesMemberbcs:OtherRetailMemberbcs:ProbabilityOfDefaultPointThreeToPointSixPercentMemberifrs-full:FinancialInstrumentsCreditimpairedMemberifrs-full:GrossCarryingAmountMemberbcs:StrongIncludingInvestmentGradeMember2022-12-310000312069bcs:OtherRetailMemberbcs:ProbabilityOfDefaultPointThreeToPointSixPercentMemberifrs-full:GrossCarryingAmountMemberbcs:ExpectedCreditLossesMemberbcs:StrongIncludingInvestmentGradeMember2022-12-310000312069ifrs-full:AccumulatedImpairmentMemberbcs:OtherRetailMemberbcs:ProbabilityOfDefaultPointThreeToPointSixPercentMemberbcs:StrongIncludingInvestmentGradeMemberifrs-full:TwelvemonthExpectedCreditLossesMember2022-12-310000312069ifrs-full:AccumulatedImpairmentMemberifrs-full:LifetimeExpectedCreditLossesMemberbcs:OtherRetailMemberbcs:ProbabilityOfDefaultPointThreeToPointSixPercentMemberifrs-full:FinancialInstrumentsNotCreditimpairedMemberbcs:StrongIncludingInvestmentGradeMember2022-12-310000312069ifrs-full:AccumulatedImpairmentMemberifrs-full:LifetimeExpectedCreditLossesMemberbcs:OtherRetailMemberbcs:ProbabilityOfDefaultPointThreeToPointSixPercentMemberifrs-full:FinancialInstrumentsCreditimpairedMemberbcs:StrongIncludingInvestmentGradeMember2022-12-310000312069ifrs-full:AccumulatedImpairmentMemberbcs:OtherRetailMemberbcs:ProbabilityOfDefaultPointThreeToPointSixPercentMemberbcs:ExpectedCreditLossesMemberbcs:StrongIncludingInvestmentGradeMember2022-12-310000312069bcs:OtherRetailMemberbcs:ProbabilityOfDefaultPointThreeToPointSixPercentMemberbcs:StrongIncludingInvestmentGradeMember2022-12-310000312069bcs:ProbabilityOfDefaultPointSixtyToTwoPointOneFivePercentMemberbcs:OtherRetailMemberbcs:SatisfactoryBBPlusToBMemberifrs-full:GrossCarryingAmountMemberifrs-full:TwelvemonthExpectedCreditLossesMember2022-12-310000312069bcs:ProbabilityOfDefaultPointSixtyToTwoPointOneFivePercentMemberifrs-full:LifetimeExpectedCreditLossesMemberbcs:OtherRetailMemberbcs:SatisfactoryBBPlusToBMemberifrs-full:GrossCarryingAmountMemberifrs-full:FinancialInstrumentsNotCreditimpairedMember2022-12-310000312069bcs:ProbabilityOfDefaultPointSixtyToTwoPointOneFivePercentMemberifrs-full:LifetimeExpectedCreditLossesMemberbcs:OtherRetailMemberifrs-full:FinancialInstrumentsCreditimpairedMemberbcs:SatisfactoryBBPlusToBMemberifrs-full:GrossCarryingAmountMember2022-12-310000312069bcs:ProbabilityOfDefaultPointSixtyToTwoPointOneFivePercentMemberbcs:OtherRetailMemberbcs:SatisfactoryBBPlusToBMemberifrs-full:GrossCarryingAmountMemberbcs:ExpectedCreditLossesMember2022-12-310000312069bcs:ProbabilityOfDefaultPointSixtyToTwoPointOneFivePercentMemberifrs-full:AccumulatedImpairmentMemberbcs:OtherRetailMemberbcs:SatisfactoryBBPlusToBMemberifrs-full:TwelvemonthExpectedCreditLossesMember2022-12-310000312069bcs:ProbabilityOfDefaultPointSixtyToTwoPointOneFivePercentMemberifrs-full:AccumulatedImpairmentMemberifrs-full:LifetimeExpectedCreditLossesMemberbcs:OtherRetailMemberbcs:SatisfactoryBBPlusToBMemberifrs-full:FinancialInstrumentsNotCreditimpairedMember2022-12-310000312069bcs:ProbabilityOfDefaultPointSixtyToTwoPointOneFivePercentMemberifrs-full:AccumulatedImpairmentMemberifrs-full:LifetimeExpectedCreditLossesMemberbcs:OtherRetailMemberifrs-full:FinancialInstrumentsCreditimpairedMemberbcs:SatisfactoryBBPlusToBMember2022-12-310000312069bcs:ProbabilityOfDefaultPointSixtyToTwoPointOneFivePercentMemberifrs-full:AccumulatedImpairmentMemberbcs:OtherRetailMemberbcs:SatisfactoryBBPlusToBMemberbcs:ExpectedCreditLossesMember2022-12-310000312069bcs:ProbabilityOfDefaultPointSixtyToTwoPointOneFivePercentMemberbcs:OtherRetailMemberbcs:SatisfactoryBBPlusToBMember2022-12-310000312069bcs:ProbabilityOfDefaultTwoPointOneFiveToElevenPointThreeFivePercentMemberbcs:OtherRetailMemberbcs:SatisfactoryBBPlusToBMemberifrs-full:GrossCarryingAmountMemberifrs-full:TwelvemonthExpectedCreditLossesMember2022-12-310000312069ifrs-full:LifetimeExpectedCreditLossesMemberbcs:ProbabilityOfDefaultTwoPointOneFiveToElevenPointThreeFivePercentMemberbcs:OtherRetailMemberbcs:SatisfactoryBBPlusToBMemberifrs-full:GrossCarryingAmountMemberifrs-full:FinancialInstrumentsNotCreditimpairedMember2022-12-310000312069ifrs-full:LifetimeExpectedCreditLossesMemberbcs:ProbabilityOfDefaultTwoPointOneFiveToElevenPointThreeFivePercentMemberbcs:OtherRetailMemberifrs-full:FinancialInstrumentsCreditimpairedMemberbcs:SatisfactoryBBPlusToBMemberifrs-full:GrossCarryingAmountMember2022-12-310000312069bcs:ProbabilityOfDefaultTwoPointOneFiveToElevenPointThreeFivePercentMemberbcs:OtherRetailMemberbcs:SatisfactoryBBPlusToBMemberifrs-full:GrossCarryingAmountMemberbcs:ExpectedCreditLossesMember2022-12-310000312069ifrs-full:AccumulatedImpairmentMemberbcs:ProbabilityOfDefaultTwoPointOneFiveToElevenPointThreeFivePercentMemberbcs:OtherRetailMemberbcs:SatisfactoryBBPlusToBMemberifrs-full:TwelvemonthExpectedCreditLossesMember2022-12-310000312069ifrs-full:AccumulatedImpairmentMemberifrs-full:LifetimeExpectedCreditLossesMemberbcs:ProbabilityOfDefaultTwoPointOneFiveToElevenPointThreeFivePercentMemberbcs:OtherRetailMemberbcs:SatisfactoryBBPlusToBMemberifrs-full:FinancialInstrumentsNotCreditimpairedMember2022-12-310000312069ifrs-full:AccumulatedImpairmentMemberifrs-full:LifetimeExpectedCreditLossesMemberbcs:ProbabilityOfDefaultTwoPointOneFiveToElevenPointThreeFivePercentMemberbcs:OtherRetailMemberifrs-full:FinancialInstrumentsCreditimpairedMemberbcs:SatisfactoryBBPlusToBMember2022-12-310000312069ifrs-full:AccumulatedImpairmentMemberbcs:ProbabilityOfDefaultTwoPointOneFiveToElevenPointThreeFivePercentMemberbcs:OtherRetailMemberbcs:SatisfactoryBBPlusToBMemberbcs:ExpectedCreditLossesMember2022-12-310000312069bcs:ProbabilityOfDefaultTwoPointOneFiveToElevenPointThreeFivePercentMemberbcs:OtherRetailMemberbcs:SatisfactoryBBPlusToBMember2022-12-310000312069bcs:ProbabilityOfDefaultElevenPointThreeFiveToOneHundredPercentMemberbcs:OtherRetailMemberbcs:HigherRiskBMinusAndBelowMemberifrs-full:GrossCarryingAmountMemberifrs-full:TwelvemonthExpectedCreditLossesMember2022-12-310000312069ifrs-full:LifetimeExpectedCreditLossesMemberbcs:ProbabilityOfDefaultElevenPointThreeFiveToOneHundredPercentMemberbcs:OtherRetailMemberbcs:HigherRiskBMinusAndBelowMemberifrs-full:GrossCarryingAmountMemberifrs-full:FinancialInstrumentsNotCreditimpairedMember2022-12-310000312069ifrs-full:LifetimeExpectedCreditLossesMemberbcs:ProbabilityOfDefaultElevenPointThreeFiveToOneHundredPercentMemberbcs:OtherRetailMemberifrs-full:FinancialInstrumentsCreditimpairedMemberbcs:HigherRiskBMinusAndBelowMemberifrs-full:GrossCarryingAmountMember2022-12-310000312069bcs:ProbabilityOfDefaultElevenPointThreeFiveToOneHundredPercentMemberbcs:OtherRetailMemberbcs:HigherRiskBMinusAndBelowMemberifrs-full:GrossCarryingAmountMemberbcs:ExpectedCreditLossesMember2022-12-310000312069ifrs-full:AccumulatedImpairmentMemberbcs:ProbabilityOfDefaultElevenPointThreeFiveToOneHundredPercentMemberbcs:OtherRetailMemberbcs:HigherRiskBMinusAndBelowMemberifrs-full:TwelvemonthExpectedCreditLossesMember2022-12-310000312069ifrs-full:AccumulatedImpairmentMemberifrs-full:LifetimeExpectedCreditLossesMemberbcs:ProbabilityOfDefaultElevenPointThreeFiveToOneHundredPercentMemberbcs:OtherRetailMemberbcs:HigherRiskBMinusAndBelowMemberifrs-full:FinancialInstrumentsNotCreditimpairedMember2022-12-310000312069ifrs-full:AccumulatedImpairmentMemberifrs-full:LifetimeExpectedCreditLossesMemberbcs:ProbabilityOfDefaultElevenPointThreeFiveToOneHundredPercentMemberbcs:OtherRetailMemberifrs-full:FinancialInstrumentsCreditimpairedMemberbcs:HigherRiskBMinusAndBelowMember2022-12-310000312069ifrs-full:AccumulatedImpairmentMemberbcs:ProbabilityOfDefaultElevenPointThreeFiveToOneHundredPercentMemberbcs:OtherRetailMemberbcs:HigherRiskBMinusAndBelowMemberbcs:ExpectedCreditLossesMember2022-12-310000312069bcs:OtherRetailMemberbcs:ProbabilityOfDefaultElevenPointThreeFiveToOneHundredPercentMemberbcs:HigherRiskBMinusAndBelowMember2022-12-310000312069bcs:OtherRetailMemberbcs:ProbabilityOfDefaultOneHundredPercentMemberifrs-full:GrossCarryingAmountMemberifrs-full:TwelvemonthExpectedCreditLossesMember2022-12-310000312069ifrs-full:LifetimeExpectedCreditLossesMemberbcs:OtherRetailMemberbcs:ProbabilityOfDefaultOneHundredPercentMemberifrs-full:GrossCarryingAmountMemberifrs-full:FinancialInstrumentsNotCreditimpairedMember2022-12-310000312069ifrs-full:LifetimeExpectedCreditLossesMemberbcs:OtherRetailMemberifrs-full:FinancialInstrumentsCreditimpairedMemberbcs:ProbabilityOfDefaultOneHundredPercentMemberifrs-full:GrossCarryingAmountMember2022-12-310000312069bcs:OtherRetailMemberbcs:ProbabilityOfDefaultOneHundredPercentMemberifrs-full:GrossCarryingAmountMemberbcs:ExpectedCreditLossesMember2022-12-310000312069ifrs-full:AccumulatedImpairmentMemberbcs:OtherRetailMemberbcs:ProbabilityOfDefaultOneHundredPercentMemberifrs-full:TwelvemonthExpectedCreditLossesMember2022-12-310000312069ifrs-full:AccumulatedImpairmentMemberifrs-full:LifetimeExpectedCreditLossesMemberbcs:OtherRetailMemberbcs:ProbabilityOfDefaultOneHundredPercentMemberifrs-full:FinancialInstrumentsNotCreditimpairedMember2022-12-310000312069ifrs-full:AccumulatedImpairmentMemberifrs-full:LifetimeExpectedCreditLossesMemberbcs:OtherRetailMemberifrs-full:FinancialInstrumentsCreditimpairedMemberbcs:ProbabilityOfDefaultOneHundredPercentMember2022-12-310000312069ifrs-full:AccumulatedImpairmentMemberbcs:OtherRetailMemberbcs:ProbabilityOfDefaultOneHundredPercentMemberbcs:ExpectedCreditLossesMember2022-12-310000312069bcs:OtherRetailMemberbcs:ProbabilityOfDefaultOneHundredPercentMember2022-12-310000312069bcs:OtherRetailMemberifrs-full:GrossCarryingAmountMemberbcs:ExpectedCreditLossesMember2022-12-310000312069ifrs-full:AccumulatedImpairmentMemberbcs:OtherRetailMemberbcs:ExpectedCreditLossesMember2022-12-310000312069bcs:OtherRetailMember2022-12-310000312069ifrs-full:CorporateLoansMemberbcs:ProbabilityOfDefaultZeroToPointZeroFivePercentMemberifrs-full:GrossCarryingAmountMemberbcs:StrongIncludingInvestmentGradeMemberifrs-full:TwelvemonthExpectedCreditLossesMember2022-12-310000312069ifrs-full:LifetimeExpectedCreditLossesMemberifrs-full:CorporateLoansMemberbcs:ProbabilityOfDefaultZeroToPointZeroFivePercentMemberifrs-full:GrossCarryingAmountMemberifrs-full:FinancialInstrumentsNotCreditimpairedMemberbcs:StrongIncludingInvestmentGradeMember2022-12-310000312069ifrs-full:LifetimeExpectedCreditLossesMemberifrs-full:CorporateLoansMemberbcs:ProbabilityOfDefaultZeroToPointZeroFivePercentMemberifrs-full:FinancialInstrumentsCreditimpairedMemberifrs-full:GrossCarryingAmountMemberbcs:StrongIncludingInvestmentGradeMember2022-12-310000312069ifrs-full:CorporateLoansMemberbcs:ProbabilityOfDefaultZeroToPointZeroFivePercentMemberifrs-full:GrossCarryingAmountMemberbcs:ExpectedCreditLossesMemberbcs:StrongIncludingInvestmentGradeMember2022-12-310000312069ifrs-full:AccumulatedImpairmentMemberifrs-full:CorporateLoansMemberbcs:ProbabilityOfDefaultZeroToPointZeroFivePercentMemberbcs:StrongIncludingInvestmentGradeMemberifrs-full:TwelvemonthExpectedCreditLossesMember2022-12-310000312069ifrs-full:AccumulatedImpairmentMemberifrs-full:LifetimeExpectedCreditLossesMemberifrs-full:CorporateLoansMemberbcs:ProbabilityOfDefaultZeroToPointZeroFivePercentMemberifrs-full:FinancialInstrumentsNotCreditimpairedMemberbcs:StrongIncludingInvestmentGradeMember2022-12-310000312069ifrs-full:AccumulatedImpairmentMemberifrs-full:LifetimeExpectedCreditLossesMemberifrs-full:CorporateLoansMemberbcs:ProbabilityOfDefaultZeroToPointZeroFivePercentMemberifrs-full:FinancialInstrumentsCreditimpairedMemberbcs:StrongIncludingInvestmentGradeMember2022-12-310000312069ifrs-full:AccumulatedImpairmentMemberifrs-full:CorporateLoansMemberbcs:ProbabilityOfDefaultZeroToPointZeroFivePercentMemberbcs:ExpectedCreditLossesMemberbcs:StrongIncludingInvestmentGradeMember2022-12-310000312069ifrs-full:CorporateLoansMemberbcs:ProbabilityOfDefaultZeroToPointZeroFivePercentMemberbcs:StrongIncludingInvestmentGradeMember2022-12-310000312069ifrs-full:CorporateLoansMemberifrs-full:GrossCarryingAmountMemberbcs:ProbabilityOfDefaultPointZeroFiveToPointOneFivePercentMemberbcs:StrongIncludingInvestmentGradeMemberifrs-full:TwelvemonthExpectedCreditLossesMember2022-12-310000312069ifrs-full:LifetimeExpectedCreditLossesMemberifrs-full:CorporateLoansMemberifrs-full:GrossCarryingAmountMemberbcs:ProbabilityOfDefaultPointZeroFiveToPointOneFivePercentMemberifrs-full:FinancialInstrumentsNotCreditimpairedMemberbcs:StrongIncludingInvestmentGradeMember2022-12-310000312069ifrs-full:LifetimeExpectedCreditLossesMemberifrs-full:CorporateLoansMemberifrs-full:FinancialInstrumentsCreditimpairedMemberifrs-full:GrossCarryingAmountMemberbcs:ProbabilityOfDefaultPointZeroFiveToPointOneFivePercentMemberbcs:StrongIncludingInvestmentGradeMember2022-12-310000312069ifrs-full:CorporateLoansMemberifrs-full:GrossCarryingAmountMemberbcs:ExpectedCreditLossesMemberbcs:ProbabilityOfDefaultPointZeroFiveToPointOneFivePercentMemberbcs:StrongIncludingInvestmentGradeMember2022-12-310000312069ifrs-full:AccumulatedImpairmentMemberifrs-full:CorporateLoansMemberbcs:ProbabilityOfDefaultPointZeroFiveToPointOneFivePercentMemberbcs:StrongIncludingInvestmentGradeMemberifrs-full:TwelvemonthExpectedCreditLossesMember2022-12-310000312069ifrs-full:AccumulatedImpairmentMemberifrs-full:LifetimeExpectedCreditLossesMemberifrs-full:CorporateLoansMemberbcs:ProbabilityOfDefaultPointZeroFiveToPointOneFivePercentMemberifrs-full:FinancialInstrumentsNotCreditimpairedMemberbcs:StrongIncludingInvestmentGradeMember2022-12-310000312069ifrs-full:AccumulatedImpairmentMemberifrs-full:LifetimeExpectedCreditLossesMemberifrs-full:CorporateLoansMemberifrs-full:FinancialInstrumentsCreditimpairedMemberbcs:ProbabilityOfDefaultPointZeroFiveToPointOneFivePercentMemberbcs:StrongIncludingInvestmentGradeMember2022-12-310000312069ifrs-full:AccumulatedImpairmentMemberifrs-full:CorporateLoansMemberbcs:ExpectedCreditLossesMemberbcs:ProbabilityOfDefaultPointZeroFiveToPointOneFivePercentMemberbcs:StrongIncludingInvestmentGradeMember2022-12-310000312069ifrs-full:CorporateLoansMemberbcs:ProbabilityOfDefaultPointZeroFiveToPointOneFivePercentMemberbcs:StrongIncludingInvestmentGradeMember2022-12-310000312069ifrs-full:CorporateLoansMemberbcs:ProbabilityOfDefaultPointOneFiveToPointThreePercentMemberifrs-full:GrossCarryingAmountMemberbcs:StrongIncludingInvestmentGradeMemberifrs-full:TwelvemonthExpectedCreditLossesMember2022-12-310000312069ifrs-full:LifetimeExpectedCreditLossesMemberifrs-full:CorporateLoansMemberbcs:ProbabilityOfDefaultPointOneFiveToPointThreePercentMemberifrs-full:GrossCarryingAmountMemberifrs-full:FinancialInstrumentsNotCreditimpairedMemberbcs:StrongIncludingInvestmentGradeMember2022-12-310000312069ifrs-full:LifetimeExpectedCreditLossesMemberifrs-full:CorporateLoansMemberifrs-full:FinancialInstrumentsCreditimpairedMemberbcs:ProbabilityOfDefaultPointOneFiveToPointThreePercentMemberifrs-full:GrossCarryingAmountMemberbcs:StrongIncludingInvestmentGradeMember2022-12-310000312069ifrs-full:CorporateLoansMemberbcs:ProbabilityOfDefaultPointOneFiveToPointThreePercentMemberifrs-full:GrossCarryingAmountMemberbcs:ExpectedCreditLossesMemberbcs:StrongIncludingInvestmentGradeMember2022-12-310000312069ifrs-full:AccumulatedImpairmentMemberifrs-full:CorporateLoansMemberbcs:ProbabilityOfDefaultPointOneFiveToPointThreePercentMemberbcs:StrongIncludingInvestmentGradeMemberifrs-full:TwelvemonthExpectedCreditLossesMember2022-12-310000312069ifrs-full:AccumulatedImpairmentMemberifrs-full:LifetimeExpectedCreditLossesMemberifrs-full:CorporateLoansMemberbcs:ProbabilityOfDefaultPointOneFiveToPointThreePercentMemberifrs-full:FinancialInstrumentsNotCreditimpairedMemberbcs:StrongIncludingInvestmentGradeMember2022-12-310000312069ifrs-full:AccumulatedImpairmentMemberifrs-full:LifetimeExpectedCreditLossesMemberifrs-full:CorporateLoansMemberifrs-full:FinancialInstrumentsCreditimpairedMemberbcs:ProbabilityOfDefaultPointOneFiveToPointThreePercentMemberbcs:StrongIncludingInvestmentGradeMember2022-12-310000312069ifrs-full:AccumulatedImpairmentMemberifrs-full:CorporateLoansMemberbcs:ProbabilityOfDefaultPointOneFiveToPointThreePercentMemberbcs:ExpectedCreditLossesMemberbcs:StrongIncludingInvestmentGradeMember2022-12-310000312069ifrs-full:CorporateLoansMemberbcs:ProbabilityOfDefaultPointOneFiveToPointThreePercentMemberbcs:StrongIncludingInvestmentGradeMember2022-12-310000312069ifrs-full:CorporateLoansMemberbcs:ProbabilityOfDefaultPointThreeToPointSixPercentMemberifrs-full:GrossCarryingAmountMemberbcs:StrongIncludingInvestmentGradeMemberifrs-full:TwelvemonthExpectedCreditLossesMember2022-12-310000312069ifrs-full:LifetimeExpectedCreditLossesMemberifrs-full:CorporateLoansMemberbcs:ProbabilityOfDefaultPointThreeToPointSixPercentMemberifrs-full:GrossCarryingAmountMemberifrs-full:FinancialInstrumentsNotCreditimpairedMemberbcs:StrongIncludingInvestmentGradeMember2022-12-310000312069ifrs-full:LifetimeExpectedCreditLossesMemberifrs-full:CorporateLoansMemberbcs:ProbabilityOfDefaultPointThreeToPointSixPercentMemberifrs-full:FinancialInstrumentsCreditimpairedMemberifrs-full:GrossCarryingAmountMemberbcs:StrongIncludingInvestmentGradeMember2022-12-310000312069ifrs-full:CorporateLoansMemberbcs:ProbabilityOfDefaultPointThreeToPointSixPercentMemberifrs-full:GrossCarryingAmountMemberbcs:ExpectedCreditLossesMemberbcs:StrongIncludingInvestmentGradeMember2022-12-310000312069ifrs-full:AccumulatedImpairmentMemberifrs-full:CorporateLoansMemberbcs:ProbabilityOfDefaultPointThreeToPointSixPercentMemberbcs:StrongIncludingInvestmentGradeMemberifrs-full:TwelvemonthExpectedCreditLossesMember2022-12-310000312069ifrs-full:AccumulatedImpairmentMemberifrs-full:LifetimeExpectedCreditLossesMemberifrs-full:CorporateLoansMemberbcs:ProbabilityOfDefaultPointThreeToPointSixPercentMemberifrs-full:FinancialInstrumentsNotCreditimpairedMemberbcs:StrongIncludingInvestmentGradeMember2022-12-310000312069ifrs-full:AccumulatedImpairmentMemberifrs-full:LifetimeExpectedCreditLossesMemberifrs-full:CorporateLoansMemberbcs:ProbabilityOfDefaultPointThreeToPointSixPercentMemberifrs-full:FinancialInstrumentsCreditimpairedMemberbcs:StrongIncludingInvestmentGradeMember2022-12-310000312069ifrs-full:AccumulatedImpairmentMemberifrs-full:CorporateLoansMemberbcs:ProbabilityOfDefaultPointThreeToPointSixPercentMemberbcs:ExpectedCreditLossesMemberbcs:StrongIncludingInvestmentGradeMember2022-12-310000312069ifrs-full:CorporateLoansMemberbcs:ProbabilityOfDefaultPointThreeToPointSixPercentMemberbcs:StrongIncludingInvestmentGradeMember2022-12-310000312069bcs:ProbabilityOfDefaultPointSixtyToTwoPointOneFivePercentMemberifrs-full:CorporateLoansMemberbcs:SatisfactoryBBPlusToBMemberifrs-full:GrossCarryingAmountMemberifrs-full:TwelvemonthExpectedCreditLossesMember2022-12-310000312069bcs:ProbabilityOfDefaultPointSixtyToTwoPointOneFivePercentMemberifrs-full:LifetimeExpectedCreditLossesMemberifrs-full:CorporateLoansMemberbcs:SatisfactoryBBPlusToBMemberifrs-full:GrossCarryingAmountMemberifrs-full:FinancialInstrumentsNotCreditimpairedMember2022-12-310000312069bcs:ProbabilityOfDefaultPointSixtyToTwoPointOneFivePercentMemberifrs-full:LifetimeExpectedCreditLossesMemberifrs-full:CorporateLoansMemberifrs-full:FinancialInstrumentsCreditimpairedMemberbcs:SatisfactoryBBPlusToBMemberifrs-full:GrossCarryingAmountMember2022-12-310000312069bcs:ProbabilityOfDefaultPointSixtyToTwoPointOneFivePercentMemberifrs-full:CorporateLoansMemberbcs:SatisfactoryBBPlusToBMemberifrs-full:GrossCarryingAmountMemberbcs:ExpectedCreditLossesMember2022-12-310000312069bcs:ProbabilityOfDefaultPointSixtyToTwoPointOneFivePercentMemberifrs-full:AccumulatedImpairmentMemberifrs-full:CorporateLoansMemberbcs:SatisfactoryBBPlusToBMemberifrs-full:TwelvemonthExpectedCreditLossesMember2022-12-310000312069bcs:ProbabilityOfDefaultPointSixtyToTwoPointOneFivePercentMemberifrs-full:AccumulatedImpairmentMemberifrs-full:LifetimeExpectedCreditLossesMemberifrs-full:CorporateLoansMemberbcs:SatisfactoryBBPlusToBMemberifrs-full:FinancialInstrumentsNotCreditimpairedMember2022-12-310000312069bcs:ProbabilityOfDefaultPointSixtyToTwoPointOneFivePercentMemberifrs-full:AccumulatedImpairmentMemberifrs-full:LifetimeExpectedCreditLossesMemberifrs-full:CorporateLoansMemberifrs-full:FinancialInstrumentsCreditimpairedMemberbcs:SatisfactoryBBPlusToBMember2022-12-310000312069bcs:ProbabilityOfDefaultPointSixtyToTwoPointOneFivePercentMemberifrs-full:AccumulatedImpairmentMemberifrs-full:CorporateLoansMemberbcs:SatisfactoryBBPlusToBMemberbcs:ExpectedCreditLossesMember2022-12-310000312069bcs:ProbabilityOfDefaultPointSixtyToTwoPointOneFivePercentMemberifrs-full:CorporateLoansMemberbcs:SatisfactoryBBPlusToBMember2022-12-310000312069ifrs-full:CorporateLoansMemberbcs:ProbabilityOfDefaultTwoPointOneFiveToElevenPointThreeFivePercentMemberbcs:SatisfactoryBBPlusToBMemberifrs-full:GrossCarryingAmountMemberifrs-full:TwelvemonthExpectedCreditLossesMember2022-12-310000312069ifrs-full:LifetimeExpectedCreditLossesMemberifrs-full:CorporateLoansMemberbcs:ProbabilityOfDefaultTwoPointOneFiveToElevenPointThreeFivePercentMemberbcs:SatisfactoryBBPlusToBMemberifrs-full:GrossCarryingAmountMemberifrs-full:FinancialInstrumentsNotCreditimpairedMember2022-12-310000312069ifrs-full:LifetimeExpectedCreditLossesMemberifrs-full:CorporateLoansMemberbcs:ProbabilityOfDefaultTwoPointOneFiveToElevenPointThreeFivePercentMemberifrs-full:FinancialInstrumentsCreditimpairedMemberbcs:SatisfactoryBBPlusToBMemberifrs-full:GrossCarryingAmountMember2022-12-310000312069ifrs-full:CorporateLoansMemberbcs:ProbabilityOfDefaultTwoPointOneFiveToElevenPointThreeFivePercentMemberbcs:SatisfactoryBBPlusToBMemberifrs-full:GrossCarryingAmountMemberbcs:ExpectedCreditLossesMember2022-12-310000312069ifrs-full:AccumulatedImpairmentMemberifrs-full:CorporateLoansMemberbcs:ProbabilityOfDefaultTwoPointOneFiveToElevenPointThreeFivePercentMemberbcs:SatisfactoryBBPlusToBMemberifrs-full:TwelvemonthExpectedCreditLossesMember2022-12-310000312069ifrs-full:AccumulatedImpairmentMemberifrs-full:LifetimeExpectedCreditLossesMemberifrs-full:CorporateLoansMemberbcs:ProbabilityOfDefaultTwoPointOneFiveToElevenPointThreeFivePercentMemberbcs:SatisfactoryBBPlusToBMemberifrs-full:FinancialInstrumentsNotCreditimpairedMember2022-12-310000312069ifrs-full:AccumulatedImpairmentMemberifrs-full:LifetimeExpectedCreditLossesMemberifrs-full:CorporateLoansMemberbcs:ProbabilityOfDefaultTwoPointOneFiveToElevenPointThreeFivePercentMemberifrs-full:FinancialInstrumentsCreditimpairedMemberbcs:SatisfactoryBBPlusToBMember2022-12-310000312069ifrs-full:AccumulatedImpairmentMemberifrs-full:CorporateLoansMemberbcs:ProbabilityOfDefaultTwoPointOneFiveToElevenPointThreeFivePercentMemberbcs:SatisfactoryBBPlusToBMemberbcs:ExpectedCreditLossesMember2022-12-310000312069ifrs-full:CorporateLoansMemberbcs:ProbabilityOfDefaultTwoPointOneFiveToElevenPointThreeFivePercentMemberbcs:SatisfactoryBBPlusToBMember2022-12-310000312069ifrs-full:CorporateLoansMemberbcs:ProbabilityOfDefaultElevenPointThreeFiveToOneHundredPercentMemberbcs:HigherRiskBMinusAndBelowMemberifrs-full:GrossCarryingAmountMemberifrs-full:TwelvemonthExpectedCreditLossesMember2022-12-310000312069ifrs-full:LifetimeExpectedCreditLossesMemberifrs-full:CorporateLoansMemberbcs:ProbabilityOfDefaultElevenPointThreeFiveToOneHundredPercentMemberbcs:HigherRiskBMinusAndBelowMemberifrs-full:GrossCarryingAmountMemberifrs-full:FinancialInstrumentsNotCreditimpairedMember2022-12-310000312069ifrs-full:LifetimeExpectedCreditLossesMemberifrs-full:CorporateLoansMemberbcs:ProbabilityOfDefaultElevenPointThreeFiveToOneHundredPercentMemberifrs-full:FinancialInstrumentsCreditimpairedMemberbcs:HigherRiskBMinusAndBelowMemberifrs-full:GrossCarryingAmountMember2022-12-310000312069ifrs-full:CorporateLoansMemberbcs:ProbabilityOfDefaultElevenPointThreeFiveToOneHundredPercentMemberbcs:HigherRiskBMinusAndBelowMemberifrs-full:GrossCarryingAmountMemberbcs:ExpectedCreditLossesMember2022-12-310000312069ifrs-full:AccumulatedImpairmentMemberifrs-full:CorporateLoansMemberbcs:ProbabilityOfDefaultElevenPointThreeFiveToOneHundredPercentMemberbcs:HigherRiskBMinusAndBelowMemberifrs-full:TwelvemonthExpectedCreditLossesMember2022-12-310000312069ifrs-full:AccumulatedImpairmentMemberifrs-full:LifetimeExpectedCreditLossesMemberifrs-full:CorporateLoansMemberbcs:ProbabilityOfDefaultElevenPointThreeFiveToOneHundredPercentMemberbcs:HigherRiskBMinusAndBelowMemberifrs-full:FinancialInstrumentsNotCreditimpairedMember2022-12-310000312069ifrs-full:AccumulatedImpairmentMemberifrs-full:LifetimeExpectedCreditLossesMemberifrs-full:CorporateLoansMemberbcs:ProbabilityOfDefaultElevenPointThreeFiveToOneHundredPercentMemberifrs-full:FinancialInstrumentsCreditimpairedMemberbcs:HigherRiskBMinusAndBelowMember2022-12-310000312069ifrs-full:AccumulatedImpairmentMemberifrs-full:CorporateLoansMemberbcs:ProbabilityOfDefaultElevenPointThreeFiveToOneHundredPercentMemberbcs:HigherRiskBMinusAndBelowMemberbcs:ExpectedCreditLossesMember2022-12-310000312069ifrs-full:CorporateLoansMemberbcs:ProbabilityOfDefaultElevenPointThreeFiveToOneHundredPercentMemberbcs:HigherRiskBMinusAndBelowMember2022-12-310000312069ifrs-full:CorporateLoansMemberbcs:ProbabilityOfDefaultOneHundredPercentMemberifrs-full:GrossCarryingAmountMemberifrs-full:TwelvemonthExpectedCreditLossesMember2022-12-310000312069ifrs-full:LifetimeExpectedCreditLossesMemberifrs-full:CorporateLoansMemberbcs:ProbabilityOfDefaultOneHundredPercentMemberifrs-full:GrossCarryingAmountMemberifrs-full:FinancialInstrumentsNotCreditimpairedMember2022-12-310000312069ifrs-full:LifetimeExpectedCreditLossesMemberifrs-full:CorporateLoansMemberifrs-full:FinancialInstrumentsCreditimpairedMemberbcs:ProbabilityOfDefaultOneHundredPercentMemberifrs-full:GrossCarryingAmountMember2022-12-310000312069ifrs-full:CorporateLoansMemberbcs:ProbabilityOfDefaultOneHundredPercentMemberifrs-full:GrossCarryingAmountMemberbcs:ExpectedCreditLossesMember2022-12-310000312069ifrs-full:AccumulatedImpairmentMemberifrs-full:CorporateLoansMemberbcs:ProbabilityOfDefaultOneHundredPercentMemberifrs-full:TwelvemonthExpectedCreditLossesMember2022-12-310000312069ifrs-full:AccumulatedImpairmentMemberifrs-full:LifetimeExpectedCreditLossesMemberifrs-full:CorporateLoansMemberbcs:ProbabilityOfDefaultOneHundredPercentMemberifrs-full:FinancialInstrumentsNotCreditimpairedMember2022-12-310000312069ifrs-full:AccumulatedImpairmentMemberifrs-full:LifetimeExpectedCreditLossesMemberifrs-full:CorporateLoansMemberifrs-full:FinancialInstrumentsCreditimpairedMemberbcs:ProbabilityOfDefaultOneHundredPercentMember2022-12-310000312069ifrs-full:AccumulatedImpairmentMemberifrs-full:CorporateLoansMemberbcs:ProbabilityOfDefaultOneHundredPercentMemberbcs:ExpectedCreditLossesMember2022-12-310000312069ifrs-full:CorporateLoansMemberbcs:ProbabilityOfDefaultOneHundredPercentMember2022-12-310000312069ifrs-full:CorporateLoansMemberifrs-full:GrossCarryingAmountMemberbcs:ExpectedCreditLossesMember2022-12-310000312069ifrs-full:AccumulatedImpairmentMemberifrs-full:CorporateLoansMemberbcs:ExpectedCreditLossesMember2022-12-310000312069ifrs-full:CorporateLoansMember2022-12-310000312069bcs:ProbabilityOfDefaultZeroToPointZeroFivePercentMemberifrs-full:GrossCarryingAmountMemberifrs-full:LoansAndReceivablesCategoryMemberbcs:StrongIncludingInvestmentGradeMemberifrs-full:TwelvemonthExpectedCreditLossesMember2022-12-310000312069ifrs-full:LifetimeExpectedCreditLossesMemberbcs:ProbabilityOfDefaultZeroToPointZeroFivePercentMemberifrs-full:GrossCarryingAmountMemberifrs-full:LoansAndReceivablesCategoryMemberifrs-full:FinancialInstrumentsNotCreditimpairedMemberbcs:StrongIncludingInvestmentGradeMember2022-12-310000312069ifrs-full:LifetimeExpectedCreditLossesMemberbcs:ProbabilityOfDefaultZeroToPointZeroFivePercentMemberifrs-full:FinancialInstrumentsCreditimpairedMemberifrs-full:GrossCarryingAmountMemberifrs-full:LoansAndReceivablesCategoryMemberbcs:StrongIncludingInvestmentGradeMember2022-12-310000312069bcs:ProbabilityOfDefaultZeroToPointZeroFivePercentMemberifrs-full:GrossCarryingAmountMemberbcs:ExpectedCreditLossesMemberifrs-full:LoansAndReceivablesCategoryMemberbcs:StrongIncludingInvestmentGradeMember2022-12-310000312069ifrs-full:AccumulatedImpairmentMemberbcs:ProbabilityOfDefaultZeroToPointZeroFivePercentMemberifrs-full:LoansAndReceivablesCategoryMemberbcs:StrongIncludingInvestmentGradeMemberifrs-full:TwelvemonthExpectedCreditLossesMember2022-12-310000312069ifrs-full:AccumulatedImpairmentMemberifrs-full:LifetimeExpectedCreditLossesMemberbcs:ProbabilityOfDefaultZeroToPointZeroFivePercentMemberifrs-full:LoansAndReceivablesCategoryMemberifrs-full:FinancialInstrumentsNotCreditimpairedMemberbcs:StrongIncludingInvestmentGradeMember2022-12-310000312069ifrs-full:AccumulatedImpairmentMemberifrs-full:LifetimeExpectedCreditLossesMemberbcs:ProbabilityOfDefaultZeroToPointZeroFivePercentMemberifrs-full:FinancialInstrumentsCreditimpairedMemberifrs-full:LoansAndReceivablesCategoryMemberbcs:StrongIncludingInvestmentGradeMember2022-12-310000312069ifrs-full:AccumulatedImpairmentMemberbcs:ProbabilityOfDefaultZeroToPointZeroFivePercentMemberbcs:ExpectedCreditLossesMemberifrs-full:LoansAndReceivablesCategoryMemberbcs:StrongIncludingInvestmentGradeMember2022-12-310000312069bcs:ProbabilityOfDefaultZeroToPointZeroFivePercentMemberifrs-full:LoansAndReceivablesCategoryMemberbcs:StrongIncludingInvestmentGradeMember2022-12-310000312069ifrs-full:GrossCarryingAmountMemberifrs-full:LoansAndReceivablesCategoryMemberbcs:ProbabilityOfDefaultPointZeroFiveToPointOneFivePercentMemberbcs:StrongIncludingInvestmentGradeMemberifrs-full:TwelvemonthExpectedCreditLossesMember2022-12-310000312069ifrs-full:LifetimeExpectedCreditLossesMemberifrs-full:GrossCarryingAmountMemberifrs-full:LoansAndReceivablesCategoryMemberbcs:ProbabilityOfDefaultPointZeroFiveToPointOneFivePercentMemberifrs-full:FinancialInstrumentsNotCreditimpairedMemberbcs:StrongIncludingInvestmentGradeMember2022-12-310000312069ifrs-full:LifetimeExpectedCreditLossesMemberifrs-full:FinancialInstrumentsCreditimpairedMemberifrs-full:GrossCarryingAmountMemberifrs-full:LoansAndReceivablesCategoryMemberbcs:ProbabilityOfDefaultPointZeroFiveToPointOneFivePercentMemberbcs:StrongIncludingInvestmentGradeMember2022-12-310000312069ifrs-full:GrossCarryingAmountMemberbcs:ExpectedCreditLossesMemberifrs-full:LoansAndReceivablesCategoryMemberbcs:ProbabilityOfDefaultPointZeroFiveToPointOneFivePercentMemberbcs:StrongIncludingInvestmentGradeMember2022-12-310000312069ifrs-full:AccumulatedImpairmentMemberifrs-full:LoansAndReceivablesCategoryMemberbcs:ProbabilityOfDefaultPointZeroFiveToPointOneFivePercentMemberbcs:StrongIncludingInvestmentGradeMemberifrs-full:TwelvemonthExpectedCreditLossesMember2022-12-310000312069ifrs-full:AccumulatedImpairmentMemberifrs-full:LifetimeExpectedCreditLossesMemberifrs-full:LoansAndReceivablesCategoryMemberbcs:ProbabilityOfDefaultPointZeroFiveToPointOneFivePercentMemberifrs-full:FinancialInstrumentsNotCreditimpairedMemberbcs:StrongIncludingInvestmentGradeMember2022-12-310000312069ifrs-full:AccumulatedImpairmentMemberifrs-full:LifetimeExpectedCreditLossesMemberifrs-full:FinancialInstrumentsCreditimpairedMemberifrs-full:LoansAndReceivablesCategoryMemberbcs:ProbabilityOfDefaultPointZeroFiveToPointOneFivePercentMemberbcs:StrongIncludingInvestmentGradeMember2022-12-310000312069ifrs-full:AccumulatedImpairmentMemberbcs:ExpectedCreditLossesMemberifrs-full:LoansAndReceivablesCategoryMemberbcs:ProbabilityOfDefaultPointZeroFiveToPointOneFivePercentMemberbcs:StrongIncludingInvestmentGradeMember2022-12-310000312069ifrs-full:LoansAndReceivablesCategoryMemberbcs:ProbabilityOfDefaultPointZeroFiveToPointOneFivePercentMemberbcs:StrongIncludingInvestmentGradeMember2022-12-310000312069bcs:ProbabilityOfDefaultPointOneFiveToPointThreePercentMemberifrs-full:GrossCarryingAmountMemberifrs-full:LoansAndReceivablesCategoryMemberbcs:StrongIncludingInvestmentGradeMemberifrs-full:TwelvemonthExpectedCreditLossesMember2022-12-310000312069ifrs-full:LifetimeExpectedCreditLossesMemberbcs:ProbabilityOfDefaultPointOneFiveToPointThreePercentMemberifrs-full:GrossCarryingAmountMemberifrs-full:LoansAndReceivablesCategoryMemberifrs-full:FinancialInstrumentsNotCreditimpairedMemberbcs:StrongIncludingInvestmentGradeMember2022-12-310000312069ifrs-full:LifetimeExpectedCreditLossesMemberifrs-full:FinancialInstrumentsCreditimpairedMemberbcs:ProbabilityOfDefaultPointOneFiveToPointThreePercentMemberifrs-full:GrossCarryingAmountMemberifrs-full:LoansAndReceivablesCategoryMemberbcs:StrongIncludingInvestmentGradeMember2022-12-310000312069bcs:ProbabilityOfDefaultPointOneFiveToPointThreePercentMemberifrs-full:GrossCarryingAmountMemberbcs:ExpectedCreditLossesMemberifrs-full:LoansAndReceivablesCategoryMemberbcs:StrongIncludingInvestmentGradeMember2022-12-310000312069ifrs-full:AccumulatedImpairmentMemberbcs:ProbabilityOfDefaultPointOneFiveToPointThreePercentMemberifrs-full:LoansAndReceivablesCategoryMemberbcs:StrongIncludingInvestmentGradeMemberifrs-full:TwelvemonthExpectedCreditLossesMember2022-12-310000312069ifrs-full:AccumulatedImpairmentMemberifrs-full:LifetimeExpectedCreditLossesMemberbcs:ProbabilityOfDefaultPointOneFiveToPointThreePercentMemberifrs-full:LoansAndReceivablesCategoryMemberifrs-full:FinancialInstrumentsNotCreditimpairedMemberbcs:StrongIncludingInvestmentGradeMember2022-12-310000312069ifrs-full:AccumulatedImpairmentMemberifrs-full:LifetimeExpectedCreditLossesMemberifrs-full:FinancialInstrumentsCreditimpairedMemberbcs:ProbabilityOfDefaultPointOneFiveToPointThreePercentMemberifrs-full:LoansAndReceivablesCategoryMemberbcs:StrongIncludingInvestmentGradeMember2022-12-310000312069ifrs-full:AccumulatedImpairmentMemberbcs:ProbabilityOfDefaultPointOneFiveToPointThreePercentMemberbcs:ExpectedCreditLossesMemberifrs-full:LoansAndReceivablesCategoryMemberbcs:StrongIncludingInvestmentGradeMember2022-12-310000312069bcs:ProbabilityOfDefaultPointOneFiveToPointThreePercentMemberifrs-full:LoansAndReceivablesCategoryMemberbcs:StrongIncludingInvestmentGradeMember2022-12-310000312069bcs:ProbabilityOfDefaultPointThreeToPointSixPercentMemberifrs-full:GrossCarryingAmountMemberifrs-full:LoansAndReceivablesCategoryMemberbcs:StrongIncludingInvestmentGradeMemberifrs-full:TwelvemonthExpectedCreditLossesMember2022-12-310000312069ifrs-full:LifetimeExpectedCreditLossesMemberbcs:ProbabilityOfDefaultPointThreeToPointSixPercentMemberifrs-full:GrossCarryingAmountMemberifrs-full:LoansAndReceivablesCategoryMemberifrs-full:FinancialInstrumentsNotCreditimpairedMemberbcs:StrongIncludingInvestmentGradeMember2022-12-310000312069ifrs-full:LifetimeExpectedCreditLossesMemberbcs:ProbabilityOfDefaultPointThreeToPointSixPercentMemberifrs-full:FinancialInstrumentsCreditimpairedMemberifrs-full:GrossCarryingAmountMemberifrs-full:LoansAndReceivablesCategoryMemberbcs:StrongIncludingInvestmentGradeMember2022-12-310000312069bcs:ProbabilityOfDefaultPointThreeToPointSixPercentMemberifrs-full:GrossCarryingAmountMemberbcs:ExpectedCreditLossesMemberifrs-full:LoansAndReceivablesCategoryMemberbcs:StrongIncludingInvestmentGradeMember2022-12-310000312069ifrs-full:AccumulatedImpairmentMemberbcs:ProbabilityOfDefaultPointThreeToPointSixPercentMemberifrs-full:LoansAndReceivablesCategoryMemberbcs:StrongIncludingInvestmentGradeMemberifrs-full:TwelvemonthExpectedCreditLossesMember2022-12-310000312069ifrs-full:AccumulatedImpairmentMemberifrs-full:LifetimeExpectedCreditLossesMemberbcs:ProbabilityOfDefaultPointThreeToPointSixPercentMemberifrs-full:LoansAndReceivablesCategoryMemberifrs-full:FinancialInstrumentsNotCreditimpairedMemberbcs:StrongIncludingInvestmentGradeMember2022-12-310000312069ifrs-full:AccumulatedImpairmentMemberifrs-full:LifetimeExpectedCreditLossesMemberbcs:ProbabilityOfDefaultPointThreeToPointSixPercentMemberifrs-full:FinancialInstrumentsCreditimpairedMemberifrs-full:LoansAndReceivablesCategoryMemberbcs:StrongIncludingInvestmentGradeMember2022-12-310000312069ifrs-full:AccumulatedImpairmentMemberbcs:ProbabilityOfDefaultPointThreeToPointSixPercentMemberbcs:ExpectedCreditLossesMemberifrs-full:LoansAndReceivablesCategoryMemberbcs:StrongIncludingInvestmentGradeMember2022-12-310000312069bcs:ProbabilityOfDefaultPointThreeToPointSixPercentMemberifrs-full:LoansAndReceivablesCategoryMemberbcs:StrongIncludingInvestmentGradeMember2022-12-310000312069bcs:ProbabilityOfDefaultPointSixtyToTwoPointOneFivePercentMemberbcs:SatisfactoryBBPlusToBMemberifrs-full:GrossCarryingAmountMemberifrs-full:LoansAndReceivablesCategoryMemberifrs-full:TwelvemonthExpectedCreditLossesMember2022-12-310000312069bcs:ProbabilityOfDefaultPointSixtyToTwoPointOneFivePercentMemberifrs-full:LifetimeExpectedCreditLossesMemberbcs:SatisfactoryBBPlusToBMemberifrs-full:GrossCarryingAmountMemberifrs-full:LoansAndReceivablesCategoryMemberifrs-full:FinancialInstrumentsNotCreditimpairedMember2022-12-310000312069bcs:ProbabilityOfDefaultPointSixtyToTwoPointOneFivePercentMemberifrs-full:LifetimeExpectedCreditLossesMemberifrs-full:FinancialInstrumentsCreditimpairedMemberbcs:SatisfactoryBBPlusToBMemberifrs-full:GrossCarryingAmountMemberifrs-full:LoansAndReceivablesCategoryMember2022-12-310000312069bcs:ProbabilityOfDefaultPointSixtyToTwoPointOneFivePercentMemberbcs:SatisfactoryBBPlusToBMemberifrs-full:GrossCarryingAmountMemberbcs:ExpectedCreditLossesMemberifrs-full:LoansAndReceivablesCategoryMember2022-12-310000312069bcs:ProbabilityOfDefaultPointSixtyToTwoPointOneFivePercentMemberifrs-full:AccumulatedImpairmentMemberbcs:SatisfactoryBBPlusToBMemberifrs-full:LoansAndReceivablesCategoryMemberifrs-full:TwelvemonthExpectedCreditLossesMember2022-12-310000312069bcs:ProbabilityOfDefaultPointSixtyToTwoPointOneFivePercentMemberifrs-full:AccumulatedImpairmentMemberifrs-full:LifetimeExpectedCreditLossesMemberbcs:SatisfactoryBBPlusToBMemberifrs-full:LoansAndReceivablesCategoryMemberifrs-full:FinancialInstrumentsNotCreditimpairedMember2022-12-310000312069bcs:ProbabilityOfDefaultPointSixtyToTwoPointOneFivePercentMemberifrs-full:AccumulatedImpairmentMemberifrs-full:LifetimeExpectedCreditLossesMemberifrs-full:FinancialInstrumentsCreditimpairedMemberbcs:SatisfactoryBBPlusToBMemberifrs-full:LoansAndReceivablesCategoryMember2022-12-310000312069bcs:ProbabilityOfDefaultPointSixtyToTwoPointOneFivePercentMemberifrs-full:AccumulatedImpairmentMemberbcs:SatisfactoryBBPlusToBMemberbcs:ExpectedCreditLossesMemberifrs-full:LoansAndReceivablesCategoryMember2022-12-310000312069bcs:ProbabilityOfDefaultPointSixtyToTwoPointOneFivePercentMemberbcs:SatisfactoryBBPlusToBMemberifrs-full:LoansAndReceivablesCategoryMember2022-12-310000312069bcs:ProbabilityOfDefaultTwoPointOneFiveToElevenPointThreeFivePercentMemberbcs:SatisfactoryBBPlusToBMemberifrs-full:GrossCarryingAmountMemberifrs-full:LoansAndReceivablesCategoryMemberifrs-full:TwelvemonthExpectedCreditLossesMember2022-12-310000312069ifrs-full:LifetimeExpectedCreditLossesMemberbcs:ProbabilityOfDefaultTwoPointOneFiveToElevenPointThreeFivePercentMemberbcs:SatisfactoryBBPlusToBMemberifrs-full:GrossCarryingAmountMemberifrs-full:LoansAndReceivablesCategoryMemberifrs-full:FinancialInstrumentsNotCreditimpairedMember2022-12-310000312069ifrs-full:LifetimeExpectedCreditLossesMemberbcs:ProbabilityOfDefaultTwoPointOneFiveToElevenPointThreeFivePercentMemberifrs-full:FinancialInstrumentsCreditimpairedMemberbcs:SatisfactoryBBPlusToBMemberifrs-full:GrossCarryingAmountMemberifrs-full:LoansAndReceivablesCategoryMember2022-12-310000312069bcs:ProbabilityOfDefaultTwoPointOneFiveToElevenPointThreeFivePercentMemberbcs:SatisfactoryBBPlusToBMemberifrs-full:GrossCarryingAmountMemberbcs:ExpectedCreditLossesMemberifrs-full:LoansAndReceivablesCategoryMember2022-12-310000312069ifrs-full:AccumulatedImpairmentMemberbcs:ProbabilityOfDefaultTwoPointOneFiveToElevenPointThreeFivePercentMemberbcs:SatisfactoryBBPlusToBMemberifrs-full:LoansAndReceivablesCategoryMemberifrs-full:TwelvemonthExpectedCreditLossesMember2022-12-310000312069ifrs-full:AccumulatedImpairmentMemberifrs-full:LifetimeExpectedCreditLossesMemberbcs:ProbabilityOfDefaultTwoPointOneFiveToElevenPointThreeFivePercentMemberbcs:SatisfactoryBBPlusToBMemberifrs-full:LoansAndReceivablesCategoryMemberifrs-full:FinancialInstrumentsNotCreditimpairedMember2022-12-310000312069ifrs-full:AccumulatedImpairmentMemberifrs-full:LifetimeExpectedCreditLossesMemberbcs:ProbabilityOfDefaultTwoPointOneFiveToElevenPointThreeFivePercentMemberifrs-full:FinancialInstrumentsCreditimpairedMemberbcs:SatisfactoryBBPlusToBMemberifrs-full:LoansAndReceivablesCategoryMember2022-12-310000312069ifrs-full:AccumulatedImpairmentMemberbcs:ProbabilityOfDefaultTwoPointOneFiveToElevenPointThreeFivePercentMemberbcs:SatisfactoryBBPlusToBMemberbcs:ExpectedCreditLossesMemberifrs-full:LoansAndReceivablesCategoryMember2022-12-310000312069bcs:ProbabilityOfDefaultTwoPointOneFiveToElevenPointThreeFivePercentMemberbcs:SatisfactoryBBPlusToBMemberifrs-full:LoansAndReceivablesCategoryMember2022-12-310000312069bcs:ProbabilityOfDefaultElevenPointThreeFiveToOneHundredPercentMemberbcs:HigherRiskBMinusAndBelowMemberifrs-full:GrossCarryingAmountMemberifrs-full:LoansAndReceivablesCategoryMemberifrs-full:TwelvemonthExpectedCreditLossesMember2022-12-310000312069ifrs-full:LifetimeExpectedCreditLossesMemberbcs:ProbabilityOfDefaultElevenPointThreeFiveToOneHundredPercentMemberbcs:HigherRiskBMinusAndBelowMemberifrs-full:GrossCarryingAmountMemberifrs-full:LoansAndReceivablesCategoryMemberifrs-full:FinancialInstrumentsNotCreditimpairedMember2022-12-310000312069ifrs-full:LifetimeExpectedCreditLossesMemberbcs:ProbabilityOfDefaultElevenPointThreeFiveToOneHundredPercentMemberifrs-full:FinancialInstrumentsCreditimpairedMemberbcs:HigherRiskBMinusAndBelowMemberifrs-full:GrossCarryingAmountMemberifrs-full:LoansAndReceivablesCategoryMember2022-12-310000312069bcs:ProbabilityOfDefaultElevenPointThreeFiveToOneHundredPercentMemberbcs:HigherRiskBMinusAndBelowMemberifrs-full:GrossCarryingAmountMemberbcs:ExpectedCreditLossesMemberifrs-full:LoansAndReceivablesCategoryMember2022-12-310000312069ifrs-full:AccumulatedImpairmentMemberbcs:ProbabilityOfDefaultElevenPointThreeFiveToOneHundredPercentMemberbcs:HigherRiskBMinusAndBelowMemberifrs-full:LoansAndReceivablesCategoryMemberifrs-full:TwelvemonthExpectedCreditLossesMember2022-12-310000312069ifrs-full:AccumulatedImpairmentMemberifrs-full:LifetimeExpectedCreditLossesMemberbcs:ProbabilityOfDefaultElevenPointThreeFiveToOneHundredPercentMemberbcs:HigherRiskBMinusAndBelowMemberifrs-full:LoansAndReceivablesCategoryMemberifrs-full:FinancialInstrumentsNotCreditimpairedMember2022-12-310000312069ifrs-full:AccumulatedImpairmentMemberifrs-full:LifetimeExpectedCreditLossesMemberbcs:ProbabilityOfDefaultElevenPointThreeFiveToOneHundredPercentMemberifrs-full:FinancialInstrumentsCreditimpairedMemberbcs:HigherRiskBMinusAndBelowMemberifrs-full:LoansAndReceivablesCategoryMember2022-12-310000312069ifrs-full:AccumulatedImpairmentMemberbcs:ProbabilityOfDefaultElevenPointThreeFiveToOneHundredPercentMemberbcs:HigherRiskBMinusAndBelowMemberbcs:ExpectedCreditLossesMemberifrs-full:LoansAndReceivablesCategoryMember2022-12-310000312069bcs:ProbabilityOfDefaultElevenPointThreeFiveToOneHundredPercentMemberbcs:HigherRiskBMinusAndBelowMemberifrs-full:LoansAndReceivablesCategoryMember2022-12-310000312069bcs:ProbabilityOfDefaultOneHundredPercentMemberifrs-full:GrossCarryingAmountMemberifrs-full:LoansAndReceivablesCategoryMemberifrs-full:TwelvemonthExpectedCreditLossesMember2022-12-310000312069ifrs-full:LifetimeExpectedCreditLossesMemberbcs:ProbabilityOfDefaultOneHundredPercentMemberifrs-full:GrossCarryingAmountMemberifrs-full:LoansAndReceivablesCategoryMemberifrs-full:FinancialInstrumentsNotCreditimpairedMember2022-12-310000312069ifrs-full:LifetimeExpectedCreditLossesMemberifrs-full:FinancialInstrumentsCreditimpairedMemberbcs:ProbabilityOfDefaultOneHundredPercentMemberifrs-full:GrossCarryingAmountMemberifrs-full:LoansAndReceivablesCategoryMember2022-12-310000312069bcs:ProbabilityOfDefaultOneHundredPercentMemberifrs-full:GrossCarryingAmountMemberbcs:ExpectedCreditLossesMemberifrs-full:LoansAndReceivablesCategoryMember2022-12-310000312069ifrs-full:AccumulatedImpairmentMemberbcs:ProbabilityOfDefaultOneHundredPercentMemberifrs-full:LoansAndReceivablesCategoryMemberifrs-full:TwelvemonthExpectedCreditLossesMember2022-12-310000312069ifrs-full:AccumulatedImpairmentMemberifrs-full:LifetimeExpectedCreditLossesMemberbcs:ProbabilityOfDefaultOneHundredPercentMemberifrs-full:LoansAndReceivablesCategoryMemberifrs-full:FinancialInstrumentsNotCreditimpairedMember2022-12-310000312069ifrs-full:AccumulatedImpairmentMemberifrs-full:LifetimeExpectedCreditLossesMemberifrs-full:FinancialInstrumentsCreditimpairedMemberbcs:ProbabilityOfDefaultOneHundredPercentMemberifrs-full:LoansAndReceivablesCategoryMember2022-12-310000312069ifrs-full:AccumulatedImpairmentMemberbcs:ProbabilityOfDefaultOneHundredPercentMemberbcs:ExpectedCreditLossesMemberifrs-full:LoansAndReceivablesCategoryMember2022-12-310000312069bcs:ProbabilityOfDefaultOneHundredPercentMemberifrs-full:LoansAndReceivablesCategoryMember2022-12-310000312069ifrs-full:GrossCarryingAmountMemberifrs-full:LoansAndReceivablesCategoryMemberifrs-full:TwelvemonthExpectedCreditLossesMember2022-12-310000312069ifrs-full:LifetimeExpectedCreditLossesMemberifrs-full:GrossCarryingAmountMemberifrs-full:LoansAndReceivablesCategoryMemberifrs-full:FinancialInstrumentsNotCreditimpairedMember2022-12-310000312069ifrs-full:LifetimeExpectedCreditLossesMemberifrs-full:FinancialInstrumentsCreditimpairedMemberifrs-full:GrossCarryingAmountMemberifrs-full:LoansAndReceivablesCategoryMember2022-12-310000312069ifrs-full:GrossCarryingAmountMemberbcs:ExpectedCreditLossesMemberifrs-full:LoansAndReceivablesCategoryMember2022-12-310000312069ifrs-full:AccumulatedImpairmentMemberifrs-full:LoansAndReceivablesCategoryMemberifrs-full:TwelvemonthExpectedCreditLossesMember2022-12-310000312069ifrs-full:AccumulatedImpairmentMemberifrs-full:LifetimeExpectedCreditLossesMemberifrs-full:LoansAndReceivablesCategoryMemberifrs-full:FinancialInstrumentsNotCreditimpairedMember2022-12-310000312069ifrs-full:AccumulatedImpairmentMemberifrs-full:LifetimeExpectedCreditLossesMemberifrs-full:FinancialInstrumentsCreditimpairedMemberifrs-full:LoansAndReceivablesCategoryMember2022-12-310000312069ifrs-full:AccumulatedImpairmentMemberbcs:ExpectedCreditLossesMemberifrs-full:LoansAndReceivablesCategoryMember2022-12-310000312069bcs:ProbabilityOfDefaultZeroToPointZeroFivePercentMemberifrs-full:ContingentLiabilitiesMemberifrs-full:GrossCarryingAmountMemberbcs:StrongIncludingInvestmentGradeMemberifrs-full:TwelvemonthExpectedCreditLossesMember2023-12-310000312069ifrs-full:LifetimeExpectedCreditLossesMemberbcs:ProbabilityOfDefaultZeroToPointZeroFivePercentMemberifrs-full:ContingentLiabilitiesMemberifrs-full:GrossCarryingAmountMemberifrs-full:FinancialInstrumentsNotCreditimpairedMemberbcs:StrongIncludingInvestmentGradeMember2023-12-310000312069ifrs-full:LifetimeExpectedCreditLossesMemberbcs:ProbabilityOfDefaultZeroToPointZeroFivePercentMemberifrs-full:ContingentLiabilitiesMemberifrs-full:FinancialInstrumentsCreditimpairedMemberifrs-full:GrossCarryingAmountMemberbcs:StrongIncludingInvestmentGradeMember2023-12-310000312069bcs:ProbabilityOfDefaultZeroToPointZeroFivePercentMemberifrs-full:ContingentLiabilitiesMemberifrs-full:GrossCarryingAmountMemberbcs:ExpectedCreditLossesMemberbcs:StrongIncludingInvestmentGradeMember2023-12-310000312069ifrs-full:AccumulatedImpairmentMemberbcs:ProbabilityOfDefaultZeroToPointZeroFivePercentMemberifrs-full:ContingentLiabilitiesMemberbcs:StrongIncludingInvestmentGradeMemberifrs-full:TwelvemonthExpectedCreditLossesMember2023-12-310000312069ifrs-full:AccumulatedImpairmentMemberifrs-full:LifetimeExpectedCreditLossesMemberbcs:ProbabilityOfDefaultZeroToPointZeroFivePercentMemberifrs-full:ContingentLiabilitiesMemberifrs-full:FinancialInstrumentsNotCreditimpairedMemberbcs:StrongIncludingInvestmentGradeMember2023-12-310000312069ifrs-full:AccumulatedImpairmentMemberifrs-full:LifetimeExpectedCreditLossesMemberbcs:ProbabilityOfDefaultZeroToPointZeroFivePercentMemberifrs-full:ContingentLiabilitiesMemberifrs-full:FinancialInstrumentsCreditimpairedMemberbcs:StrongIncludingInvestmentGradeMember2023-12-310000312069ifrs-full:AccumulatedImpairmentMemberbcs:ProbabilityOfDefaultZeroToPointZeroFivePercentMemberifrs-full:ContingentLiabilitiesMemberbcs:ExpectedCreditLossesMemberbcs:StrongIncludingInvestmentGradeMember2023-12-310000312069bcs:ProbabilityOfDefaultZeroToPointZeroFivePercentMemberifrs-full:ContingentLiabilitiesMemberbcs:StrongIncludingInvestmentGradeMember2023-12-310000312069ifrs-full:ContingentLiabilitiesMemberifrs-full:GrossCarryingAmountMemberbcs:ProbabilityOfDefaultPointZeroFiveToPointOneFivePercentMemberbcs:StrongIncludingInvestmentGradeMemberifrs-full:TwelvemonthExpectedCreditLossesMember2023-12-310000312069ifrs-full:LifetimeExpectedCreditLossesMemberifrs-full:ContingentLiabilitiesMemberifrs-full:GrossCarryingAmountMemberbcs:ProbabilityOfDefaultPointZeroFiveToPointOneFivePercentMemberifrs-full:FinancialInstrumentsNotCreditimpairedMemberbcs:StrongIncludingInvestmentGradeMember2023-12-310000312069ifrs-full:LifetimeExpectedCreditLossesMemberifrs-full:ContingentLiabilitiesMemberifrs-full:FinancialInstrumentsCreditimpairedMemberifrs-full:GrossCarryingAmountMemberbcs:ProbabilityOfDefaultPointZeroFiveToPointOneFivePercentMemberbcs:StrongIncludingInvestmentGradeMember2023-12-310000312069ifrs-full:ContingentLiabilitiesMemberifrs-full:GrossCarryingAmountMemberbcs:ExpectedCreditLossesMemberbcs:ProbabilityOfDefaultPointZeroFiveToPointOneFivePercentMemberbcs:StrongIncludingInvestmentGradeMember2023-12-310000312069ifrs-full:AccumulatedImpairmentMemberifrs-full:ContingentLiabilitiesMemberbcs:ProbabilityOfDefaultPointZeroFiveToPointOneFivePercentMemberbcs:StrongIncludingInvestmentGradeMemberifrs-full:TwelvemonthExpectedCreditLossesMember2023-12-310000312069ifrs-full:AccumulatedImpairmentMemberifrs-full:LifetimeExpectedCreditLossesMemberifrs-full:ContingentLiabilitiesMemberbcs:ProbabilityOfDefaultPointZeroFiveToPointOneFivePercentMemberifrs-full:FinancialInstrumentsNotCreditimpairedMemberbcs:StrongIncludingInvestmentGradeMember2023-12-310000312069ifrs-full:AccumulatedImpairmentMemberifrs-full:LifetimeExpectedCreditLossesMemberifrs-full:ContingentLiabilitiesMemberifrs-full:FinancialInstrumentsCreditimpairedMemberbcs:ProbabilityOfDefaultPointZeroFiveToPointOneFivePercentMemberbcs:StrongIncludingInvestmentGradeMember2023-12-310000312069ifrs-full:AccumulatedImpairmentMemberifrs-full:ContingentLiabilitiesMemberbcs:ExpectedCreditLossesMemberbcs:ProbabilityOfDefaultPointZeroFiveToPointOneFivePercentMemberbcs:StrongIncludingInvestmentGradeMember2023-12-310000312069ifrs-full:ContingentLiabilitiesMemberbcs:ProbabilityOfDefaultPointZeroFiveToPointOneFivePercentMemberbcs:StrongIncludingInvestmentGradeMember2023-12-310000312069ifrs-full:ContingentLiabilitiesMemberbcs:ProbabilityOfDefaultPointOneFiveToPointThreePercentMemberifrs-full:GrossCarryingAmountMemberbcs:StrongIncludingInvestmentGradeMemberifrs-full:TwelvemonthExpectedCreditLossesMember2023-12-310000312069ifrs-full:LifetimeExpectedCreditLossesMemberifrs-full:ContingentLiabilitiesMemberbcs:ProbabilityOfDefaultPointOneFiveToPointThreePercentMemberifrs-full:GrossCarryingAmountMemberifrs-full:FinancialInstrumentsNotCreditimpairedMemberbcs:StrongIncludingInvestmentGradeMember2023-12-310000312069ifrs-full:LifetimeExpectedCreditLossesMemberifrs-full:ContingentLiabilitiesMemberifrs-full:FinancialInstrumentsCreditimpairedMemberbcs:ProbabilityOfDefaultPointOneFiveToPointThreePercentMemberifrs-full:GrossCarryingAmountMemberbcs:StrongIncludingInvestmentGradeMember2023-12-310000312069ifrs-full:ContingentLiabilitiesMemberbcs:ProbabilityOfDefaultPointOneFiveToPointThreePercentMemberifrs-full:GrossCarryingAmountMemberbcs:ExpectedCreditLossesMemberbcs:StrongIncludingInvestmentGradeMember2023-12-310000312069ifrs-full:AccumulatedImpairmentMemberifrs-full:ContingentLiabilitiesMemberbcs:ProbabilityOfDefaultPointOneFiveToPointThreePercentMemberbcs:StrongIncludingInvestmentGradeMemberifrs-full:TwelvemonthExpectedCreditLossesMember2023-12-310000312069ifrs-full:AccumulatedImpairmentMemberifrs-full:LifetimeExpectedCreditLossesMemberifrs-full:ContingentLiabilitiesMemberbcs:ProbabilityOfDefaultPointOneFiveToPointThreePercentMemberifrs-full:FinancialInstrumentsNotCreditimpairedMemberbcs:StrongIncludingInvestmentGradeMember2023-12-310000312069ifrs-full:AccumulatedImpairmentMemberifrs-full:LifetimeExpectedCreditLossesMemberifrs-full:ContingentLiabilitiesMemberifrs-full:FinancialInstrumentsCreditimpairedMemberbcs:ProbabilityOfDefaultPointOneFiveToPointThreePercentMemberbcs:StrongIncludingInvestmentGradeMember2023-12-310000312069ifrs-full:AccumulatedImpairmentMemberifrs-full:ContingentLiabilitiesMemberbcs:ProbabilityOfDefaultPointOneFiveToPointThreePercentMemberbcs:ExpectedCreditLossesMemberbcs:StrongIncludingInvestmentGradeMember2023-12-310000312069ifrs-full:ContingentLiabilitiesMemberbcs:ProbabilityOfDefaultPointOneFiveToPointThreePercentMemberbcs:StrongIncludingInvestmentGradeMember2023-12-310000312069bcs:ProbabilityOfDefaultPointThreeToPointSixPercentMemberifrs-full:ContingentLiabilitiesMemberifrs-full:GrossCarryingAmountMemberbcs:StrongIncludingInvestmentGradeMemberifrs-full:TwelvemonthExpectedCreditLossesMember2023-12-310000312069ifrs-full:LifetimeExpectedCreditLossesMemberbcs:ProbabilityOfDefaultPointThreeToPointSixPercentMemberifrs-full:ContingentLiabilitiesMemberifrs-full:GrossCarryingAmountMemberifrs-full:FinancialInstrumentsNotCreditimpairedMemberbcs:StrongIncludingInvestmentGradeMember2023-12-310000312069ifrs-full:LifetimeExpectedCreditLossesMemberbcs:ProbabilityOfDefaultPointThreeToPointSixPercentMemberifrs-full:ContingentLiabilitiesMemberifrs-full:FinancialInstrumentsCreditimpairedMemberifrs-full:GrossCarryingAmountMemberbcs:StrongIncludingInvestmentGradeMember2023-12-310000312069bcs:ProbabilityOfDefaultPointThreeToPointSixPercentMemberifrs-full:ContingentLiabilitiesMemberifrs-full:GrossCarryingAmountMemberbcs:ExpectedCreditLossesMemberbcs:StrongIncludingInvestmentGradeMember2023-12-310000312069ifrs-full:AccumulatedImpairmentMemberbcs:ProbabilityOfDefaultPointThreeToPointSixPercentMemberifrs-full:ContingentLiabilitiesMemberbcs:StrongIncludingInvestmentGradeMemberifrs-full:TwelvemonthExpectedCreditLossesMember2023-12-310000312069ifrs-full:AccumulatedImpairmentMemberifrs-full:LifetimeExpectedCreditLossesMemberbcs:ProbabilityOfDefaultPointThreeToPointSixPercentMemberifrs-full:ContingentLiabilitiesMemberifrs-full:FinancialInstrumentsNotCreditimpairedMemberbcs:StrongIncludingInvestmentGradeMember2023-12-310000312069ifrs-full:AccumulatedImpairmentMemberifrs-full:LifetimeExpectedCreditLossesMemberbcs:ProbabilityOfDefaultPointThreeToPointSixPercentMemberifrs-full:ContingentLiabilitiesMemberifrs-full:FinancialInstrumentsCreditimpairedMemberbcs:StrongIncludingInvestmentGradeMember2023-12-310000312069ifrs-full:AccumulatedImpairmentMemberbcs:ProbabilityOfDefaultPointThreeToPointSixPercentMemberifrs-full:ContingentLiabilitiesMemberbcs:ExpectedCreditLossesMemberbcs:StrongIncludingInvestmentGradeMember2023-12-310000312069bcs:ProbabilityOfDefaultPointThreeToPointSixPercentMemberifrs-full:ContingentLiabilitiesMemberbcs:StrongIncludingInvestmentGradeMember2023-12-310000312069bcs:ProbabilityOfDefaultPointSixtyToTwoPointOneFivePercentMemberifrs-full:ContingentLiabilitiesMemberbcs:SatisfactoryBBPlusToBMemberifrs-full:GrossCarryingAmountMemberifrs-full:TwelvemonthExpectedCreditLossesMember2023-12-310000312069bcs:ProbabilityOfDefaultPointSixtyToTwoPointOneFivePercentMemberifrs-full:LifetimeExpectedCreditLossesMemberifrs-full:ContingentLiabilitiesMemberbcs:SatisfactoryBBPlusToBMemberifrs-full:GrossCarryingAmountMemberifrs-full:FinancialInstrumentsNotCreditimpairedMember2023-12-310000312069bcs:ProbabilityOfDefaultPointSixtyToTwoPointOneFivePercentMemberifrs-full:LifetimeExpectedCreditLossesMemberifrs-full:ContingentLiabilitiesMemberifrs-full:FinancialInstrumentsCreditimpairedMemberbcs:SatisfactoryBBPlusToBMemberifrs-full:GrossCarryingAmountMember2023-12-310000312069bcs:ProbabilityOfDefaultPointSixtyToTwoPointOneFivePercentMemberifrs-full:ContingentLiabilitiesMemberbcs:SatisfactoryBBPlusToBMemberifrs-full:GrossCarryingAmountMemberbcs:ExpectedCreditLossesMember2023-12-310000312069bcs:ProbabilityOfDefaultPointSixtyToTwoPointOneFivePercentMemberifrs-full:AccumulatedImpairmentMemberifrs-full:ContingentLiabilitiesMemberbcs:SatisfactoryBBPlusToBMemberifrs-full:TwelvemonthExpectedCreditLossesMember2023-12-310000312069bcs:ProbabilityOfDefaultPointSixtyToTwoPointOneFivePercentMemberifrs-full:AccumulatedImpairmentMemberifrs-full:LifetimeExpectedCreditLossesMemberifrs-full:ContingentLiabilitiesMemberbcs:SatisfactoryBBPlusToBMemberifrs-full:FinancialInstrumentsNotCreditimpairedMember2023-12-310000312069bcs:ProbabilityOfDefaultPointSixtyToTwoPointOneFivePercentMemberifrs-full:AccumulatedImpairmentMemberifrs-full:LifetimeExpectedCreditLossesMemberifrs-full:ContingentLiabilitiesMemberifrs-full:FinancialInstrumentsCreditimpairedMemberbcs:SatisfactoryBBPlusToBMember2023-12-310000312069bcs:ProbabilityOfDefaultPointSixtyToTwoPointOneFivePercentMemberifrs-full:AccumulatedImpairmentMemberifrs-full:ContingentLiabilitiesMemberbcs:SatisfactoryBBPlusToBMemberbcs:ExpectedCreditLossesMember2023-12-310000312069bcs:ProbabilityOfDefaultPointSixtyToTwoPointOneFivePercentMemberbcs:SatisfactoryBBPlusToBMemberifrs-full:ContingentLiabilitiesMember2023-12-310000312069bcs:ProbabilityOfDefaultTwoPointOneFiveToElevenPointThreeFivePercentMemberifrs-full:ContingentLiabilitiesMemberbcs:SatisfactoryBBPlusToBMemberifrs-full:GrossCarryingAmountMemberifrs-full:TwelvemonthExpectedCreditLossesMember2023-12-310000312069ifrs-full:LifetimeExpectedCreditLossesMemberbcs:ProbabilityOfDefaultTwoPointOneFiveToElevenPointThreeFivePercentMemberifrs-full:ContingentLiabilitiesMemberbcs:SatisfactoryBBPlusToBMemberifrs-full:GrossCarryingAmountMemberifrs-full:FinancialInstrumentsNotCreditimpairedMember2023-12-310000312069ifrs-full:LifetimeExpectedCreditLossesMemberbcs:ProbabilityOfDefaultTwoPointOneFiveToElevenPointThreeFivePercentMemberifrs-full:ContingentLiabilitiesMemberifrs-full:FinancialInstrumentsCreditimpairedMemberbcs:SatisfactoryBBPlusToBMemberifrs-full:GrossCarryingAmountMember2023-12-310000312069bcs:ProbabilityOfDefaultTwoPointOneFiveToElevenPointThreeFivePercentMemberifrs-full:ContingentLiabilitiesMemberbcs:SatisfactoryBBPlusToBMemberifrs-full:GrossCarryingAmountMemberbcs:ExpectedCreditLossesMember2023-12-310000312069ifrs-full:AccumulatedImpairmentMemberbcs:ProbabilityOfDefaultTwoPointOneFiveToElevenPointThreeFivePercentMemberifrs-full:ContingentLiabilitiesMemberbcs:SatisfactoryBBPlusToBMemberifrs-full:TwelvemonthExpectedCreditLossesMember2023-12-310000312069ifrs-full:AccumulatedImpairmentMemberifrs-full:LifetimeExpectedCreditLossesMemberbcs:ProbabilityOfDefaultTwoPointOneFiveToElevenPointThreeFivePercentMemberifrs-full:ContingentLiabilitiesMemberbcs:SatisfactoryBBPlusToBMemberifrs-full:FinancialInstrumentsNotCreditimpairedMember2023-12-310000312069ifrs-full:AccumulatedImpairmentMemberifrs-full:LifetimeExpectedCreditLossesMemberbcs:ProbabilityOfDefaultTwoPointOneFiveToElevenPointThreeFivePercentMemberifrs-full:ContingentLiabilitiesMemberifrs-full:FinancialInstrumentsCreditimpairedMemberbcs:SatisfactoryBBPlusToBMember2023-12-310000312069ifrs-full:AccumulatedImpairmentMemberbcs:ProbabilityOfDefaultTwoPointOneFiveToElevenPointThreeFivePercentMemberifrs-full:ContingentLiabilitiesMemberbcs:SatisfactoryBBPlusToBMemberbcs:ExpectedCreditLossesMember2023-12-310000312069bcs:ProbabilityOfDefaultTwoPointOneFiveToElevenPointThreeFivePercentMemberbcs:SatisfactoryBBPlusToBMemberifrs-full:ContingentLiabilitiesMember2023-12-310000312069bcs:ProbabilityOfDefaultElevenPointThreeFiveToOneHundredPercentMemberifrs-full:ContingentLiabilitiesMemberbcs:HigherRiskBMinusAndBelowMemberifrs-full:GrossCarryingAmountMemberifrs-full:TwelvemonthExpectedCreditLossesMember2023-12-310000312069ifrs-full:LifetimeExpectedCreditLossesMemberbcs:ProbabilityOfDefaultElevenPointThreeFiveToOneHundredPercentMemberifrs-full:ContingentLiabilitiesMemberbcs:HigherRiskBMinusAndBelowMemberifrs-full:GrossCarryingAmountMemberifrs-full:FinancialInstrumentsNotCreditimpairedMember2023-12-310000312069ifrs-full:LifetimeExpectedCreditLossesMemberbcs:ProbabilityOfDefaultElevenPointThreeFiveToOneHundredPercentMemberifrs-full:ContingentLiabilitiesMemberifrs-full:FinancialInstrumentsCreditimpairedMemberbcs:HigherRiskBMinusAndBelowMemberifrs-full:GrossCarryingAmountMember2023-12-310000312069bcs:ProbabilityOfDefaultElevenPointThreeFiveToOneHundredPercentMemberifrs-full:ContingentLiabilitiesMemberbcs:HigherRiskBMinusAndBelowMemberifrs-full:GrossCarryingAmountMemberbcs:ExpectedCreditLossesMember2023-12-310000312069ifrs-full:AccumulatedImpairmentMemberbcs:ProbabilityOfDefaultElevenPointThreeFiveToOneHundredPercentMemberifrs-full:ContingentLiabilitiesMemberbcs:HigherRiskBMinusAndBelowMemberifrs-full:TwelvemonthExpectedCreditLossesMember2023-12-310000312069ifrs-full:AccumulatedImpairmentMemberifrs-full:LifetimeExpectedCreditLossesMemberbcs:ProbabilityOfDefaultElevenPointThreeFiveToOneHundredPercentMemberifrs-full:ContingentLiabilitiesMemberbcs:HigherRiskBMinusAndBelowMemberifrs-full:FinancialInstrumentsNotCreditimpairedMember2023-12-310000312069ifrs-full:AccumulatedImpairmentMemberifrs-full:LifetimeExpectedCreditLossesMemberbcs:ProbabilityOfDefaultElevenPointThreeFiveToOneHundredPercentMemberifrs-full:ContingentLiabilitiesMemberifrs-full:FinancialInstrumentsCreditimpairedMemberbcs:HigherRiskBMinusAndBelowMember2023-12-310000312069ifrs-full:AccumulatedImpairmentMemberbcs:ProbabilityOfDefaultElevenPointThreeFiveToOneHundredPercentMemberifrs-full:ContingentLiabilitiesMemberbcs:HigherRiskBMinusAndBelowMemberbcs:ExpectedCreditLossesMember2023-12-310000312069bcs:ProbabilityOfDefaultElevenPointThreeFiveToOneHundredPercentMemberifrs-full:ContingentLiabilitiesMemberbcs:HigherRiskBMinusAndBelowMember2023-12-310000312069ifrs-full:ContingentLiabilitiesMemberbcs:ProbabilityOfDefaultOneHundredPercentMemberifrs-full:GrossCarryingAmountMemberifrs-full:TwelvemonthExpectedCreditLossesMember2023-12-310000312069ifrs-full:LifetimeExpectedCreditLossesMemberifrs-full:ContingentLiabilitiesMemberbcs:ProbabilityOfDefaultOneHundredPercentMemberifrs-full:GrossCarryingAmountMemberifrs-full:FinancialInstrumentsNotCreditimpairedMember2023-12-310000312069ifrs-full:LifetimeExpectedCreditLossesMemberifrs-full:ContingentLiabilitiesMemberifrs-full:FinancialInstrumentsCreditimpairedMemberbcs:ProbabilityOfDefaultOneHundredPercentMemberifrs-full:GrossCarryingAmountMember2023-12-310000312069ifrs-full:ContingentLiabilitiesMemberbcs:ProbabilityOfDefaultOneHundredPercentMemberifrs-full:GrossCarryingAmountMemberbcs:ExpectedCreditLossesMember2023-12-310000312069ifrs-full:AccumulatedImpairmentMemberifrs-full:ContingentLiabilitiesMemberbcs:ProbabilityOfDefaultOneHundredPercentMemberifrs-full:TwelvemonthExpectedCreditLossesMember2023-12-310000312069ifrs-full:AccumulatedImpairmentMemberifrs-full:LifetimeExpectedCreditLossesMemberifrs-full:ContingentLiabilitiesMemberbcs:ProbabilityOfDefaultOneHundredPercentMemberifrs-full:FinancialInstrumentsNotCreditimpairedMember2023-12-310000312069ifrs-full:AccumulatedImpairmentMemberifrs-full:LifetimeExpectedCreditLossesMemberifrs-full:ContingentLiabilitiesMemberifrs-full:FinancialInstrumentsCreditimpairedMemberbcs:ProbabilityOfDefaultOneHundredPercentMember2023-12-310000312069ifrs-full:AccumulatedImpairmentMemberifrs-full:ContingentLiabilitiesMemberbcs:ProbabilityOfDefaultOneHundredPercentMemberbcs:ExpectedCreditLossesMember2023-12-310000312069ifrs-full:ContingentLiabilitiesMemberbcs:ProbabilityOfDefaultOneHundredPercentMember2023-12-310000312069ifrs-full:ContingentLiabilitiesMemberifrs-full:GrossCarryingAmountMemberifrs-full:TwelvemonthExpectedCreditLossesMember2023-12-310000312069ifrs-full:LifetimeExpectedCreditLossesMemberifrs-full:ContingentLiabilitiesMemberifrs-full:GrossCarryingAmountMemberifrs-full:FinancialInstrumentsNotCreditimpairedMember2023-12-310000312069ifrs-full:LifetimeExpectedCreditLossesMemberifrs-full:FinancialInstrumentsCreditimpairedMemberifrs-full:ContingentLiabilitiesMemberifrs-full:GrossCarryingAmountMember2023-12-310000312069ifrs-full:ContingentLiabilitiesMemberifrs-full:GrossCarryingAmountMemberbcs:ExpectedCreditLossesMember2023-12-310000312069ifrs-full:AccumulatedImpairmentMemberifrs-full:ContingentLiabilitiesMemberifrs-full:TwelvemonthExpectedCreditLossesMember2023-12-310000312069ifrs-full:AccumulatedImpairmentMemberifrs-full:LifetimeExpectedCreditLossesMemberifrs-full:ContingentLiabilitiesMemberifrs-full:FinancialInstrumentsNotCreditimpairedMember2023-12-310000312069ifrs-full:AccumulatedImpairmentMemberifrs-full:LifetimeExpectedCreditLossesMemberifrs-full:FinancialInstrumentsCreditimpairedMemberifrs-full:ContingentLiabilitiesMember2023-12-310000312069ifrs-full:AccumulatedImpairmentMemberifrs-full:ContingentLiabilitiesMemberbcs:ExpectedCreditLossesMember2023-12-310000312069ifrs-full:ContingentLiabilitiesMember2023-12-310000312069bcs:ProbabilityOfDefaultZeroToPointZeroFivePercentMemberifrs-full:ContingentLiabilitiesMemberifrs-full:GrossCarryingAmountMemberbcs:StrongIncludingInvestmentGradeMemberifrs-full:TwelvemonthExpectedCreditLossesMember2022-12-310000312069ifrs-full:LifetimeExpectedCreditLossesMemberbcs:ProbabilityOfDefaultZeroToPointZeroFivePercentMemberifrs-full:ContingentLiabilitiesMemberifrs-full:GrossCarryingAmountMemberifrs-full:FinancialInstrumentsNotCreditimpairedMemberbcs:StrongIncludingInvestmentGradeMember2022-12-310000312069ifrs-full:LifetimeExpectedCreditLossesMemberbcs:ProbabilityOfDefaultZeroToPointZeroFivePercentMemberifrs-full:ContingentLiabilitiesMemberifrs-full:FinancialInstrumentsCreditimpairedMemberifrs-full:GrossCarryingAmountMemberbcs:StrongIncludingInvestmentGradeMember2022-12-310000312069bcs:ProbabilityOfDefaultZeroToPointZeroFivePercentMemberifrs-full:ContingentLiabilitiesMemberifrs-full:GrossCarryingAmountMemberbcs:ExpectedCreditLossesMemberbcs:StrongIncludingInvestmentGradeMember2022-12-310000312069ifrs-full:AccumulatedImpairmentMemberbcs:ProbabilityOfDefaultZeroToPointZeroFivePercentMemberifrs-full:ContingentLiabilitiesMemberbcs:StrongIncludingInvestmentGradeMemberifrs-full:TwelvemonthExpectedCreditLossesMember2022-12-310000312069ifrs-full:AccumulatedImpairmentMemberifrs-full:LifetimeExpectedCreditLossesMemberbcs:ProbabilityOfDefaultZeroToPointZeroFivePercentMemberifrs-full:ContingentLiabilitiesMemberifrs-full:FinancialInstrumentsNotCreditimpairedMemberbcs:StrongIncludingInvestmentGradeMember2022-12-310000312069ifrs-full:AccumulatedImpairmentMemberifrs-full:LifetimeExpectedCreditLossesMemberbcs:ProbabilityOfDefaultZeroToPointZeroFivePercentMemberifrs-full:ContingentLiabilitiesMemberifrs-full:FinancialInstrumentsCreditimpairedMemberbcs:StrongIncludingInvestmentGradeMember2022-12-310000312069ifrs-full:AccumulatedImpairmentMemberbcs:ProbabilityOfDefaultZeroToPointZeroFivePercentMemberifrs-full:ContingentLiabilitiesMemberbcs:ExpectedCreditLossesMemberbcs:StrongIncludingInvestmentGradeMember2022-12-310000312069bcs:ProbabilityOfDefaultZeroToPointZeroFivePercentMemberifrs-full:ContingentLiabilitiesMemberbcs:StrongIncludingInvestmentGradeMember2022-12-310000312069ifrs-full:ContingentLiabilitiesMemberifrs-full:GrossCarryingAmountMemberbcs:ProbabilityOfDefaultPointZeroFiveToPointOneFivePercentMemberbcs:StrongIncludingInvestmentGradeMemberifrs-full:TwelvemonthExpectedCreditLossesMember2022-12-310000312069ifrs-full:LifetimeExpectedCreditLossesMemberifrs-full:ContingentLiabilitiesMemberifrs-full:GrossCarryingAmountMemberbcs:ProbabilityOfDefaultPointZeroFiveToPointOneFivePercentMemberifrs-full:FinancialInstrumentsNotCreditimpairedMemberbcs:StrongIncludingInvestmentGradeMember2022-12-310000312069ifrs-full:LifetimeExpectedCreditLossesMemberifrs-full:ContingentLiabilitiesMemberifrs-full:FinancialInstrumentsCreditimpairedMemberifrs-full:GrossCarryingAmountMemberbcs:ProbabilityOfDefaultPointZeroFiveToPointOneFivePercentMemberbcs:StrongIncludingInvestmentGradeMember2022-12-310000312069ifrs-full:ContingentLiabilitiesMemberifrs-full:GrossCarryingAmountMemberbcs:ExpectedCreditLossesMemberbcs:ProbabilityOfDefaultPointZeroFiveToPointOneFivePercentMemberbcs:StrongIncludingInvestmentGradeMember2022-12-310000312069ifrs-full:AccumulatedImpairmentMemberifrs-full:ContingentLiabilitiesMemberbcs:ProbabilityOfDefaultPointZeroFiveToPointOneFivePercentMemberbcs:StrongIncludingInvestmentGradeMemberifrs-full:TwelvemonthExpectedCreditLossesMember2022-12-310000312069ifrs-full:AccumulatedImpairmentMemberifrs-full:LifetimeExpectedCreditLossesMemberifrs-full:ContingentLiabilitiesMemberbcs:ProbabilityOfDefaultPointZeroFiveToPointOneFivePercentMemberifrs-full:FinancialInstrumentsNotCreditimpairedMemberbcs:StrongIncludingInvestmentGradeMember2022-12-310000312069ifrs-full:AccumulatedImpairmentMemberifrs-full:LifetimeExpectedCreditLossesMemberifrs-full:ContingentLiabilitiesMemberifrs-full:FinancialInstrumentsCreditimpairedMemberbcs:ProbabilityOfDefaultPointZeroFiveToPointOneFivePercentMemberbcs:StrongIncludingInvestmentGradeMember2022-12-310000312069ifrs-full:AccumulatedImpairmentMemberifrs-full:ContingentLiabilitiesMemberbcs:ExpectedCreditLossesMemberbcs:ProbabilityOfDefaultPointZeroFiveToPointOneFivePercentMemberbcs:StrongIncludingInvestmentGradeMember2022-12-310000312069ifrs-full:ContingentLiabilitiesMemberbcs:ProbabilityOfDefaultPointZeroFiveToPointOneFivePercentMemberbcs:StrongIncludingInvestmentGradeMember2022-12-310000312069ifrs-full:ContingentLiabilitiesMemberbcs:ProbabilityOfDefaultPointOneFiveToPointThreePercentMemberifrs-full:GrossCarryingAmountMemberbcs:StrongIncludingInvestmentGradeMemberifrs-full:TwelvemonthExpectedCreditLossesMember2022-12-310000312069ifrs-full:LifetimeExpectedCreditLossesMemberifrs-full:ContingentLiabilitiesMemberbcs:ProbabilityOfDefaultPointOneFiveToPointThreePercentMemberifrs-full:GrossCarryingAmountMemberifrs-full:FinancialInstrumentsNotCreditimpairedMemberbcs:StrongIncludingInvestmentGradeMember2022-12-310000312069ifrs-full:LifetimeExpectedCreditLossesMemberifrs-full:ContingentLiabilitiesMemberifrs-full:FinancialInstrumentsCreditimpairedMemberbcs:ProbabilityOfDefaultPointOneFiveToPointThreePercentMemberifrs-full:GrossCarryingAmountMemberbcs:StrongIncludingInvestmentGradeMember2022-12-310000312069ifrs-full:ContingentLiabilitiesMemberbcs:ProbabilityOfDefaultPointOneFiveToPointThreePercentMemberifrs-full:GrossCarryingAmountMemberbcs:ExpectedCreditLossesMemberbcs:StrongIncludingInvestmentGradeMember2022-12-310000312069ifrs-full:AccumulatedImpairmentMemberifrs-full:ContingentLiabilitiesMemberbcs:ProbabilityOfDefaultPointOneFiveToPointThreePercentMemberbcs:StrongIncludingInvestmentGradeMemberifrs-full:TwelvemonthExpectedCreditLossesMember2022-12-310000312069ifrs-full:AccumulatedImpairmentMemberifrs-full:LifetimeExpectedCreditLossesMemberifrs-full:ContingentLiabilitiesMemberbcs:ProbabilityOfDefaultPointOneFiveToPointThreePercentMemberifrs-full:FinancialInstrumentsNotCreditimpairedMemberbcs:StrongIncludingInvestmentGradeMember2022-12-310000312069ifrs-full:AccumulatedImpairmentMemberifrs-full:LifetimeExpectedCreditLossesMemberifrs-full:ContingentLiabilitiesMemberifrs-full:FinancialInstrumentsCreditimpairedMemberbcs:ProbabilityOfDefaultPointOneFiveToPointThreePercentMemberbcs:StrongIncludingInvestmentGradeMember2022-12-310000312069ifrs-full:AccumulatedImpairmentMemberifrs-full:ContingentLiabilitiesMemberbcs:ProbabilityOfDefaultPointOneFiveToPointThreePercentMemberbcs:ExpectedCreditLossesMemberbcs:StrongIncludingInvestmentGradeMember2022-12-310000312069ifrs-full:ContingentLiabilitiesMemberbcs:ProbabilityOfDefaultPointOneFiveToPointThreePercentMemberbcs:StrongIncludingInvestmentGradeMember2022-12-310000312069bcs:ProbabilityOfDefaultPointThreeToPointSixPercentMemberifrs-full:ContingentLiabilitiesMemberifrs-full:GrossCarryingAmountMemberbcs:StrongIncludingInvestmentGradeMemberifrs-full:TwelvemonthExpectedCreditLossesMember2022-12-310000312069ifrs-full:LifetimeExpectedCreditLossesMemberbcs:ProbabilityOfDefaultPointThreeToPointSixPercentMemberifrs-full:ContingentLiabilitiesMemberifrs-full:GrossCarryingAmountMemberifrs-full:FinancialInstrumentsNotCreditimpairedMemberbcs:StrongIncludingInvestmentGradeMember2022-12-310000312069ifrs-full:LifetimeExpectedCreditLossesMemberbcs:ProbabilityOfDefaultPointThreeToPointSixPercentMemberifrs-full:ContingentLiabilitiesMemberifrs-full:FinancialInstrumentsCreditimpairedMemberifrs-full:GrossCarryingAmountMemberbcs:StrongIncludingInvestmentGradeMember2022-12-310000312069bcs:ProbabilityOfDefaultPointThreeToPointSixPercentMemberifrs-full:ContingentLiabilitiesMemberifrs-full:GrossCarryingAmountMemberbcs:ExpectedCreditLossesMemberbcs:StrongIncludingInvestmentGradeMember2022-12-310000312069ifrs-full:AccumulatedImpairmentMemberbcs:ProbabilityOfDefaultPointThreeToPointSixPercentMemberifrs-full:ContingentLiabilitiesMemberbcs:StrongIncludingInvestmentGradeMemberifrs-full:TwelvemonthExpectedCreditLossesMember2022-12-310000312069ifrs-full:AccumulatedImpairmentMemberifrs-full:LifetimeExpectedCreditLossesMemberbcs:ProbabilityOfDefaultPointThreeToPointSixPercentMemberifrs-full:ContingentLiabilitiesMemberifrs-full:FinancialInstrumentsNotCreditimpairedMemberbcs:StrongIncludingInvestmentGradeMember2022-12-310000312069ifrs-full:AccumulatedImpairmentMemberifrs-full:LifetimeExpectedCreditLossesMemberbcs:ProbabilityOfDefaultPointThreeToPointSixPercentMemberifrs-full:ContingentLiabilitiesMemberifrs-full:FinancialInstrumentsCreditimpairedMemberbcs:StrongIncludingInvestmentGradeMember2022-12-310000312069ifrs-full:AccumulatedImpairmentMemberbcs:ProbabilityOfDefaultPointThreeToPointSixPercentMemberifrs-full:ContingentLiabilitiesMemberbcs:ExpectedCreditLossesMemberbcs:StrongIncludingInvestmentGradeMember2022-12-310000312069bcs:ProbabilityOfDefaultPointThreeToPointSixPercentMemberifrs-full:ContingentLiabilitiesMemberbcs:StrongIncludingInvestmentGradeMember2022-12-310000312069bcs:ProbabilityOfDefaultPointSixtyToTwoPointOneFivePercentMemberifrs-full:ContingentLiabilitiesMemberbcs:SatisfactoryBBPlusToBMemberifrs-full:GrossCarryingAmountMemberifrs-full:TwelvemonthExpectedCreditLossesMember2022-12-310000312069bcs:ProbabilityOfDefaultPointSixtyToTwoPointOneFivePercentMemberifrs-full:LifetimeExpectedCreditLossesMemberifrs-full:ContingentLiabilitiesMemberbcs:SatisfactoryBBPlusToBMemberifrs-full:GrossCarryingAmountMemberifrs-full:FinancialInstrumentsNotCreditimpairedMember2022-12-310000312069bcs:ProbabilityOfDefaultPointSixtyToTwoPointOneFivePercentMemberifrs-full:LifetimeExpectedCreditLossesMemberifrs-full:ContingentLiabilitiesMemberifrs-full:FinancialInstrumentsCreditimpairedMemberbcs:SatisfactoryBBPlusToBMemberifrs-full:GrossCarryingAmountMember2022-12-310000312069bcs:ProbabilityOfDefaultPointSixtyToTwoPointOneFivePercentMemberifrs-full:ContingentLiabilitiesMemberbcs:SatisfactoryBBPlusToBMemberifrs-full:GrossCarryingAmountMemberbcs:ExpectedCreditLossesMember2022-12-310000312069bcs:ProbabilityOfDefaultPointSixtyToTwoPointOneFivePercentMemberifrs-full:AccumulatedImpairmentMemberifrs-full:ContingentLiabilitiesMemberbcs:SatisfactoryBBPlusToBMemberifrs-full:TwelvemonthExpectedCreditLossesMember2022-12-310000312069bcs:ProbabilityOfDefaultPointSixtyToTwoPointOneFivePercentMemberifrs-full:AccumulatedImpairmentMemberifrs-full:LifetimeExpectedCreditLossesMemberifrs-full:ContingentLiabilitiesMemberbcs:SatisfactoryBBPlusToBMemberifrs-full:FinancialInstrumentsNotCreditimpairedMember2022-12-310000312069bcs:ProbabilityOfDefaultPointSixtyToTwoPointOneFivePercentMemberifrs-full:AccumulatedImpairmentMemberifrs-full:LifetimeExpectedCreditLossesMemberifrs-full:ContingentLiabilitiesMemberifrs-full:FinancialInstrumentsCreditimpairedMemberbcs:SatisfactoryBBPlusToBMember2022-12-310000312069bcs:ProbabilityOfDefaultPointSixtyToTwoPointOneFivePercentMemberifrs-full:AccumulatedImpairmentMemberifrs-full:ContingentLiabilitiesMemberbcs:SatisfactoryBBPlusToBMemberbcs:ExpectedCreditLossesMember2022-12-310000312069bcs:ProbabilityOfDefaultPointSixtyToTwoPointOneFivePercentMemberbcs:SatisfactoryBBPlusToBMemberifrs-full:ContingentLiabilitiesMember2022-12-310000312069bcs:ProbabilityOfDefaultTwoPointOneFiveToElevenPointThreeFivePercentMemberifrs-full:ContingentLiabilitiesMemberbcs:SatisfactoryBBPlusToBMemberifrs-full:GrossCarryingAmountMemberifrs-full:TwelvemonthExpectedCreditLossesMember2022-12-310000312069ifrs-full:LifetimeExpectedCreditLossesMemberbcs:ProbabilityOfDefaultTwoPointOneFiveToElevenPointThreeFivePercentMemberifrs-full:ContingentLiabilitiesMemberbcs:SatisfactoryBBPlusToBMemberifrs-full:GrossCarryingAmountMemberifrs-full:FinancialInstrumentsNotCreditimpairedMember2022-12-310000312069ifrs-full:LifetimeExpectedCreditLossesMemberbcs:ProbabilityOfDefaultTwoPointOneFiveToElevenPointThreeFivePercentMemberifrs-full:ContingentLiabilitiesMemberifrs-full:FinancialInstrumentsCreditimpairedMemberbcs:SatisfactoryBBPlusToBMemberifrs-full:GrossCarryingAmountMember2022-12-310000312069bcs:ProbabilityOfDefaultTwoPointOneFiveToElevenPointThreeFivePercentMemberifrs-full:ContingentLiabilitiesMemberbcs:SatisfactoryBBPlusToBMemberifrs-full:GrossCarryingAmountMemberbcs:ExpectedCreditLossesMember2022-12-310000312069ifrs-full:AccumulatedImpairmentMemberbcs:ProbabilityOfDefaultTwoPointOneFiveToElevenPointThreeFivePercentMemberifrs-full:ContingentLiabilitiesMemberbcs:SatisfactoryBBPlusToBMemberifrs-full:TwelvemonthExpectedCreditLossesMember2022-12-310000312069ifrs-full:AccumulatedImpairmentMemberifrs-full:LifetimeExpectedCreditLossesMemberbcs:ProbabilityOfDefaultTwoPointOneFiveToElevenPointThreeFivePercentMemberifrs-full:ContingentLiabilitiesMemberbcs:SatisfactoryBBPlusToBMemberifrs-full:FinancialInstrumentsNotCreditimpairedMember2022-12-310000312069ifrs-full:AccumulatedImpairmentMemberifrs-full:LifetimeExpectedCreditLossesMemberbcs:ProbabilityOfDefaultTwoPointOneFiveToElevenPointThreeFivePercentMemberifrs-full:ContingentLiabilitiesMemberifrs-full:FinancialInstrumentsCreditimpairedMemberbcs:SatisfactoryBBPlusToBMember2022-12-310000312069ifrs-full:AccumulatedImpairmentMemberbcs:ProbabilityOfDefaultTwoPointOneFiveToElevenPointThreeFivePercentMemberifrs-full:ContingentLiabilitiesMemberbcs:SatisfactoryBBPlusToBMemberbcs:ExpectedCreditLossesMember2022-12-310000312069bcs:ProbabilityOfDefaultTwoPointOneFiveToElevenPointThreeFivePercentMemberbcs:SatisfactoryBBPlusToBMemberifrs-full:ContingentLiabilitiesMember2022-12-310000312069bcs:ProbabilityOfDefaultElevenPointThreeFiveToOneHundredPercentMemberifrs-full:ContingentLiabilitiesMemberbcs:HigherRiskBMinusAndBelowMemberifrs-full:GrossCarryingAmountMemberifrs-full:TwelvemonthExpectedCreditLossesMember2022-12-310000312069ifrs-full:LifetimeExpectedCreditLossesMemberbcs:ProbabilityOfDefaultElevenPointThreeFiveToOneHundredPercentMemberifrs-full:ContingentLiabilitiesMemberbcs:HigherRiskBMinusAndBelowMemberifrs-full:GrossCarryingAmountMemberifrs-full:FinancialInstrumentsNotCreditimpairedMember2022-12-310000312069ifrs-full:LifetimeExpectedCreditLossesMemberbcs:ProbabilityOfDefaultElevenPointThreeFiveToOneHundredPercentMemberifrs-full:ContingentLiabilitiesMemberifrs-full:FinancialInstrumentsCreditimpairedMemberbcs:HigherRiskBMinusAndBelowMemberifrs-full:GrossCarryingAmountMember2022-12-310000312069bcs:ProbabilityOfDefaultElevenPointThreeFiveToOneHundredPercentMemberifrs-full:ContingentLiabilitiesMemberbcs:HigherRiskBMinusAndBelowMemberifrs-full:GrossCarryingAmountMemberbcs:ExpectedCreditLossesMember2022-12-310000312069ifrs-full:AccumulatedImpairmentMemberbcs:ProbabilityOfDefaultElevenPointThreeFiveToOneHundredPercentMemberifrs-full:ContingentLiabilitiesMemberbcs:HigherRiskBMinusAndBelowMemberifrs-full:TwelvemonthExpectedCreditLossesMember2022-12-310000312069ifrs-full:AccumulatedImpairmentMemberifrs-full:LifetimeExpectedCreditLossesMemberbcs:ProbabilityOfDefaultElevenPointThreeFiveToOneHundredPercentMemberifrs-full:ContingentLiabilitiesMemberbcs:HigherRiskBMinusAndBelowMemberifrs-full:FinancialInstrumentsNotCreditimpairedMember2022-12-310000312069ifrs-full:AccumulatedImpairmentMemberifrs-full:LifetimeExpectedCreditLossesMemberbcs:ProbabilityOfDefaultElevenPointThreeFiveToOneHundredPercentMemberifrs-full:ContingentLiabilitiesMemberifrs-full:FinancialInstrumentsCreditimpairedMemberbcs:HigherRiskBMinusAndBelowMember2022-12-310000312069ifrs-full:AccumulatedImpairmentMemberbcs:ProbabilityOfDefaultElevenPointThreeFiveToOneHundredPercentMemberifrs-full:ContingentLiabilitiesMemberbcs:HigherRiskBMinusAndBelowMemberbcs:ExpectedCreditLossesMember2022-12-310000312069bcs:ProbabilityOfDefaultElevenPointThreeFiveToOneHundredPercentMemberifrs-full:ContingentLiabilitiesMemberbcs:HigherRiskBMinusAndBelowMember2022-12-310000312069ifrs-full:ContingentLiabilitiesMemberbcs:ProbabilityOfDefaultOneHundredPercentMemberifrs-full:GrossCarryingAmountMemberifrs-full:TwelvemonthExpectedCreditLossesMember2022-12-310000312069ifrs-full:LifetimeExpectedCreditLossesMemberifrs-full:ContingentLiabilitiesMemberbcs:ProbabilityOfDefaultOneHundredPercentMemberifrs-full:GrossCarryingAmountMemberifrs-full:FinancialInstrumentsNotCreditimpairedMember2022-12-310000312069ifrs-full:LifetimeExpectedCreditLossesMemberifrs-full:ContingentLiabilitiesMemberifrs-full:FinancialInstrumentsCreditimpairedMemberbcs:ProbabilityOfDefaultOneHundredPercentMemberifrs-full:GrossCarryingAmountMember2022-12-310000312069ifrs-full:ContingentLiabilitiesMemberbcs:ProbabilityOfDefaultOneHundredPercentMemberifrs-full:GrossCarryingAmountMemberbcs:ExpectedCreditLossesMember2022-12-310000312069ifrs-full:AccumulatedImpairmentMemberifrs-full:ContingentLiabilitiesMemberbcs:ProbabilityOfDefaultOneHundredPercentMemberifrs-full:TwelvemonthExpectedCreditLossesMember2022-12-310000312069ifrs-full:AccumulatedImpairmentMemberifrs-full:LifetimeExpectedCreditLossesMemberifrs-full:ContingentLiabilitiesMemberbcs:ProbabilityOfDefaultOneHundredPercentMemberifrs-full:FinancialInstrumentsNotCreditimpairedMember2022-12-310000312069ifrs-full:AccumulatedImpairmentMemberifrs-full:LifetimeExpectedCreditLossesMemberifrs-full:ContingentLiabilitiesMemberifrs-full:FinancialInstrumentsCreditimpairedMemberbcs:ProbabilityOfDefaultOneHundredPercentMember2022-12-310000312069ifrs-full:AccumulatedImpairmentMemberifrs-full:ContingentLiabilitiesMemberbcs:ProbabilityOfDefaultOneHundredPercentMemberbcs:ExpectedCreditLossesMember2022-12-310000312069ifrs-full:ContingentLiabilitiesMemberbcs:ProbabilityOfDefaultOneHundredPercentMember2022-12-310000312069ifrs-full:ContingentLiabilitiesMemberifrs-full:GrossCarryingAmountMemberifrs-full:TwelvemonthExpectedCreditLossesMember2022-12-310000312069ifrs-full:LifetimeExpectedCreditLossesMemberifrs-full:ContingentLiabilitiesMemberifrs-full:GrossCarryingAmountMemberifrs-full:FinancialInstrumentsNotCreditimpairedMember2022-12-310000312069ifrs-full:LifetimeExpectedCreditLossesMemberifrs-full:FinancialInstrumentsCreditimpairedMemberifrs-full:ContingentLiabilitiesMemberifrs-full:GrossCarryingAmountMember2022-12-310000312069ifrs-full:ContingentLiabilitiesMemberifrs-full:GrossCarryingAmountMemberbcs:ExpectedCreditLossesMember2022-12-310000312069ifrs-full:AccumulatedImpairmentMemberifrs-full:ContingentLiabilitiesMemberifrs-full:TwelvemonthExpectedCreditLossesMember2022-12-310000312069ifrs-full:AccumulatedImpairmentMemberifrs-full:LifetimeExpectedCreditLossesMemberifrs-full:ContingentLiabilitiesMemberifrs-full:FinancialInstrumentsNotCreditimpairedMember2022-12-310000312069ifrs-full:AccumulatedImpairmentMemberifrs-full:LifetimeExpectedCreditLossesMemberifrs-full:FinancialInstrumentsCreditimpairedMemberifrs-full:ContingentLiabilitiesMember2022-12-310000312069ifrs-full:AccumulatedImpairmentMemberifrs-full:ContingentLiabilitiesMemberbcs:ExpectedCreditLossesMember2022-12-310000312069ifrs-full:ContingentLiabilitiesMember2022-12-310000312069bcs:ProbabilityOfDefaultZeroToPointZeroFivePercentMemberifrs-full:LoanCommitmentsMemberifrs-full:GrossCarryingAmountMemberbcs:StrongIncludingInvestmentGradeMemberifrs-full:TwelvemonthExpectedCreditLossesMember2023-12-310000312069ifrs-full:LifetimeExpectedCreditLossesMemberbcs:ProbabilityOfDefaultZeroToPointZeroFivePercentMemberifrs-full:LoanCommitmentsMemberifrs-full:GrossCarryingAmountMemberifrs-full:FinancialInstrumentsNotCreditimpairedMemberbcs:StrongIncludingInvestmentGradeMember2023-12-310000312069ifrs-full:LifetimeExpectedCreditLossesMemberbcs:ProbabilityOfDefaultZeroToPointZeroFivePercentMemberifrs-full:FinancialInstrumentsCreditimpairedMemberifrs-full:LoanCommitmentsMemberifrs-full:GrossCarryingAmountMemberbcs:StrongIncludingInvestmentGradeMember2023-12-310000312069bcs:ProbabilityOfDefaultZeroToPointZeroFivePercentMemberifrs-full:LoanCommitmentsMemberifrs-full:GrossCarryingAmountMemberbcs:ExpectedCreditLossesMemberbcs:StrongIncludingInvestmentGradeMember2023-12-310000312069ifrs-full:AccumulatedImpairmentMemberbcs:ProbabilityOfDefaultZeroToPointZeroFivePercentMemberifrs-full:LoanCommitmentsMemberbcs:StrongIncludingInvestmentGradeMemberifrs-full:TwelvemonthExpectedCreditLossesMember2023-12-310000312069ifrs-full:AccumulatedImpairmentMemberifrs-full:LifetimeExpectedCreditLossesMemberbcs:ProbabilityOfDefaultZeroToPointZeroFivePercentMemberifrs-full:LoanCommitmentsMemberifrs-full:FinancialInstrumentsNotCreditimpairedMemberbcs:StrongIncludingInvestmentGradeMember2023-12-310000312069ifrs-full:AccumulatedImpairmentMemberifrs-full:LifetimeExpectedCreditLossesMemberbcs:ProbabilityOfDefaultZeroToPointZeroFivePercentMemberifrs-full:FinancialInstrumentsCreditimpairedMemberifrs-full:LoanCommitmentsMemberbcs:StrongIncludingInvestmentGradeMember2023-12-310000312069ifrs-full:AccumulatedImpairmentMemberbcs:ProbabilityOfDefaultZeroToPointZeroFivePercentMemberifrs-full:LoanCommitmentsMemberbcs:ExpectedCreditLossesMemberbcs:StrongIncludingInvestmentGradeMember2023-12-310000312069bcs:ProbabilityOfDefaultZeroToPointZeroFivePercentMemberifrs-full:LoanCommitmentsMemberbcs:StrongIncludingInvestmentGradeMember2023-12-310000312069ifrs-full:LoanCommitmentsMemberifrs-full:GrossCarryingAmountMemberbcs:ProbabilityOfDefaultPointZeroFiveToPointOneFivePercentMemberbcs:StrongIncludingInvestmentGradeMemberifrs-full:TwelvemonthExpectedCreditLossesMember2023-12-310000312069ifrs-full:LifetimeExpectedCreditLossesMemberifrs-full:LoanCommitmentsMemberifrs-full:GrossCarryingAmountMemberbcs:ProbabilityOfDefaultPointZeroFiveToPointOneFivePercentMemberifrs-full:FinancialInstrumentsNotCreditimpairedMemberbcs:StrongIncludingInvestmentGradeMember2023-12-310000312069ifrs-full:LifetimeExpectedCreditLossesMemberifrs-full:FinancialInstrumentsCreditimpairedMemberifrs-full:LoanCommitmentsMemberifrs-full:GrossCarryingAmountMemberbcs:ProbabilityOfDefaultPointZeroFiveToPointOneFivePercentMemberbcs:StrongIncludingInvestmentGradeMember2023-12-310000312069ifrs-full:LoanCommitmentsMemberifrs-full:GrossCarryingAmountMemberbcs:ExpectedCreditLossesMemberbcs:ProbabilityOfDefaultPointZeroFiveToPointOneFivePercentMemberbcs:StrongIncludingInvestmentGradeMember2023-12-310000312069ifrs-full:AccumulatedImpairmentMemberifrs-full:LoanCommitmentsMemberbcs:ProbabilityOfDefaultPointZeroFiveToPointOneFivePercentMemberbcs:StrongIncludingInvestmentGradeMemberifrs-full:TwelvemonthExpectedCreditLossesMember2023-12-310000312069ifrs-full:AccumulatedImpairmentMemberifrs-full:LifetimeExpectedCreditLossesMemberifrs-full:LoanCommitmentsMemberbcs:ProbabilityOfDefaultPointZeroFiveToPointOneFivePercentMemberifrs-full:FinancialInstrumentsNotCreditimpairedMemberbcs:StrongIncludingInvestmentGradeMember2023-12-310000312069ifrs-full:AccumulatedImpairmentMemberifrs-full:LifetimeExpectedCreditLossesMemberifrs-full:FinancialInstrumentsCreditimpairedMemberifrs-full:LoanCommitmentsMemberbcs:ProbabilityOfDefaultPointZeroFiveToPointOneFivePercentMemberbcs:StrongIncludingInvestmentGradeMember2023-12-310000312069ifrs-full:AccumulatedImpairmentMemberifrs-full:LoanCommitmentsMemberbcs:ExpectedCreditLossesMemberbcs:ProbabilityOfDefaultPointZeroFiveToPointOneFivePercentMemberbcs:StrongIncludingInvestmentGradeMember2023-12-310000312069ifrs-full:LoanCommitmentsMemberbcs:ProbabilityOfDefaultPointZeroFiveToPointOneFivePercentMemberbcs:StrongIncludingInvestmentGradeMember2023-12-310000312069bcs:ProbabilityOfDefaultPointOneFiveToPointThreePercentMemberifrs-full:LoanCommitmentsMemberifrs-full:GrossCarryingAmountMemberbcs:StrongIncludingInvestmentGradeMemberifrs-full:TwelvemonthExpectedCreditLossesMember2023-12-310000312069ifrs-full:LifetimeExpectedCreditLossesMemberbcs:ProbabilityOfDefaultPointOneFiveToPointThreePercentMemberifrs-full:LoanCommitmentsMemberifrs-full:GrossCarryingAmountMemberifrs-full:FinancialInstrumentsNotCreditimpairedMemberbcs:StrongIncludingInvestmentGradeMember2023-12-310000312069ifrs-full:LifetimeExpectedCreditLossesMemberifrs-full:FinancialInstrumentsCreditimpairedMemberbcs:ProbabilityOfDefaultPointOneFiveToPointThreePercentMemberifrs-full:LoanCommitmentsMemberifrs-full:GrossCarryingAmountMemberbcs:StrongIncludingInvestmentGradeMember2023-12-310000312069bcs:ProbabilityOfDefaultPointOneFiveToPointThreePercentMemberifrs-full:LoanCommitmentsMemberifrs-full:GrossCarryingAmountMemberbcs:ExpectedCreditLossesMemberbcs:StrongIncludingInvestmentGradeMember2023-12-310000312069ifrs-full:AccumulatedImpairmentMemberbcs:ProbabilityOfDefaultPointOneFiveToPointThreePercentMemberifrs-full:LoanCommitmentsMemberbcs:StrongIncludingInvestmentGradeMemberifrs-full:TwelvemonthExpectedCreditLossesMember2023-12-310000312069ifrs-full:AccumulatedImpairmentMemberifrs-full:LifetimeExpectedCreditLossesMemberbcs:ProbabilityOfDefaultPointOneFiveToPointThreePercentMemberifrs-full:LoanCommitmentsMemberifrs-full:FinancialInstrumentsNotCreditimpairedMemberbcs:StrongIncludingInvestmentGradeMember2023-12-310000312069ifrs-full:AccumulatedImpairmentMemberifrs-full:LifetimeExpectedCreditLossesMemberifrs-full:FinancialInstrumentsCreditimpairedMemberbcs:ProbabilityOfDefaultPointOneFiveToPointThreePercentMemberifrs-full:LoanCommitmentsMemberbcs:StrongIncludingInvestmentGradeMember2023-12-310000312069ifrs-full:AccumulatedImpairmentMemberbcs:ProbabilityOfDefaultPointOneFiveToPointThreePercentMemberifrs-full:LoanCommitmentsMemberbcs:ExpectedCreditLossesMemberbcs:StrongIncludingInvestmentGradeMember2023-12-310000312069bcs:ProbabilityOfDefaultPointOneFiveToPointThreePercentMemberifrs-full:LoanCommitmentsMemberbcs:StrongIncludingInvestmentGradeMember2023-12-310000312069bcs:ProbabilityOfDefaultPointThreeToPointSixPercentMemberifrs-full:LoanCommitmentsMemberifrs-full:GrossCarryingAmountMemberbcs:StrongIncludingInvestmentGradeMemberifrs-full:TwelvemonthExpectedCreditLossesMember2023-12-310000312069ifrs-full:LifetimeExpectedCreditLossesMemberbcs:ProbabilityOfDefaultPointThreeToPointSixPercentMemberifrs-full:LoanCommitmentsMemberifrs-full:GrossCarryingAmountMemberifrs-full:FinancialInstrumentsNotCreditimpairedMemberbcs:StrongIncludingInvestmentGradeMember2023-12-310000312069ifrs-full:LifetimeExpectedCreditLossesMemberbcs:ProbabilityOfDefaultPointThreeToPointSixPercentMemberifrs-full:FinancialInstrumentsCreditimpairedMemberifrs-full:LoanCommitmentsMemberifrs-full:GrossCarryingAmountMemberbcs:StrongIncludingInvestmentGradeMember2023-12-310000312069bcs:ProbabilityOfDefaultPointThreeToPointSixPercentMemberifrs-full:LoanCommitmentsMemberifrs-full:GrossCarryingAmountMemberbcs:ExpectedCreditLossesMemberbcs:StrongIncludingInvestmentGradeMember2023-12-310000312069ifrs-full:AccumulatedImpairmentMemberbcs:ProbabilityOfDefaultPointThreeToPointSixPercentMemberifrs-full:LoanCommitmentsMemberbcs:StrongIncludingInvestmentGradeMemberifrs-full:TwelvemonthExpectedCreditLossesMember2023-12-310000312069ifrs-full:AccumulatedImpairmentMemberifrs-full:LifetimeExpectedCreditLossesMemberbcs:ProbabilityOfDefaultPointThreeToPointSixPercentMemberifrs-full:LoanCommitmentsMemberifrs-full:FinancialInstrumentsNotCreditimpairedMemberbcs:StrongIncludingInvestmentGradeMember2023-12-310000312069ifrs-full:AccumulatedImpairmentMemberifrs-full:LifetimeExpectedCreditLossesMemberbcs:ProbabilityOfDefaultPointThreeToPointSixPercentMemberifrs-full:FinancialInstrumentsCreditimpairedMemberifrs-full:LoanCommitmentsMemberbcs:StrongIncludingInvestmentGradeMember2023-12-310000312069ifrs-full:AccumulatedImpairmentMemberbcs:ProbabilityOfDefaultPointThreeToPointSixPercentMemberifrs-full:LoanCommitmentsMemberbcs:ExpectedCreditLossesMemberbcs:StrongIncludingInvestmentGradeMember2023-12-310000312069bcs:ProbabilityOfDefaultPointThreeToPointSixPercentMemberifrs-full:LoanCommitmentsMemberbcs:StrongIncludingInvestmentGradeMember2023-12-310000312069bcs:ProbabilityOfDefaultPointSixtyToTwoPointOneFivePercentMemberbcs:SatisfactoryBBPlusToBMemberifrs-full:LoanCommitmentsMemberifrs-full:GrossCarryingAmountMemberifrs-full:TwelvemonthExpectedCreditLossesMember2023-12-310000312069bcs:ProbabilityOfDefaultPointSixtyToTwoPointOneFivePercentMemberifrs-full:LifetimeExpectedCreditLossesMemberbcs:SatisfactoryBBPlusToBMemberifrs-full:LoanCommitmentsMemberifrs-full:GrossCarryingAmountMemberifrs-full:FinancialInstrumentsNotCreditimpairedMember2023-12-310000312069bcs:ProbabilityOfDefaultPointSixtyToTwoPointOneFivePercentMemberifrs-full:LifetimeExpectedCreditLossesMemberifrs-full:FinancialInstrumentsCreditimpairedMemberbcs:SatisfactoryBBPlusToBMemberifrs-full:LoanCommitmentsMemberifrs-full:GrossCarryingAmountMember2023-12-310000312069bcs:ProbabilityOfDefaultPointSixtyToTwoPointOneFivePercentMemberbcs:SatisfactoryBBPlusToBMemberifrs-full:LoanCommitmentsMemberifrs-full:GrossCarryingAmountMemberbcs:ExpectedCreditLossesMember2023-12-310000312069bcs:ProbabilityOfDefaultPointSixtyToTwoPointOneFivePercentMemberifrs-full:AccumulatedImpairmentMemberbcs:SatisfactoryBBPlusToBMemberifrs-full:LoanCommitmentsMemberifrs-full:TwelvemonthExpectedCreditLossesMember2023-12-310000312069bcs:ProbabilityOfDefaultPointSixtyToTwoPointOneFivePercentMemberifrs-full:AccumulatedImpairmentMemberifrs-full:LifetimeExpectedCreditLossesMemberbcs:SatisfactoryBBPlusToBMemberifrs-full:LoanCommitmentsMemberifrs-full:FinancialInstrumentsNotCreditimpairedMember2023-12-310000312069bcs:ProbabilityOfDefaultPointSixtyToTwoPointOneFivePercentMemberifrs-full:AccumulatedImpairmentMemberifrs-full:LifetimeExpectedCreditLossesMemberifrs-full:FinancialInstrumentsCreditimpairedMemberbcs:SatisfactoryBBPlusToBMemberifrs-full:LoanCommitmentsMember2023-12-310000312069bcs:ProbabilityOfDefaultPointSixtyToTwoPointOneFivePercentMemberifrs-full:AccumulatedImpairmentMemberbcs:SatisfactoryBBPlusToBMemberifrs-full:LoanCommitmentsMemberbcs:ExpectedCreditLossesMember2023-12-310000312069bcs:ProbabilityOfDefaultPointSixtyToTwoPointOneFivePercentMemberbcs:SatisfactoryBBPlusToBMemberifrs-full:LoanCommitmentsMember2023-12-310000312069bcs:ProbabilityOfDefaultTwoPointOneFiveToElevenPointThreeFivePercentMemberbcs:SatisfactoryBBPlusToBMemberifrs-full:LoanCommitmentsMemberifrs-full:GrossCarryingAmountMemberifrs-full:TwelvemonthExpectedCreditLossesMember2023-12-310000312069ifrs-full:LifetimeExpectedCreditLossesMemberbcs:ProbabilityOfDefaultTwoPointOneFiveToElevenPointThreeFivePercentMemberbcs:SatisfactoryBBPlusToBMemberifrs-full:LoanCommitmentsMemberifrs-full:GrossCarryingAmountMemberifrs-full:FinancialInstrumentsNotCreditimpairedMember2023-12-310000312069ifrs-full:LifetimeExpectedCreditLossesMemberbcs:ProbabilityOfDefaultTwoPointOneFiveToElevenPointThreeFivePercentMemberifrs-full:FinancialInstrumentsCreditimpairedMemberbcs:SatisfactoryBBPlusToBMemberifrs-full:LoanCommitmentsMemberifrs-full:GrossCarryingAmountMember2023-12-310000312069bcs:ProbabilityOfDefaultTwoPointOneFiveToElevenPointThreeFivePercentMemberbcs:SatisfactoryBBPlusToBMemberifrs-full:LoanCommitmentsMemberifrs-full:GrossCarryingAmountMemberbcs:ExpectedCreditLossesMember2023-12-310000312069ifrs-full:AccumulatedImpairmentMemberbcs:ProbabilityOfDefaultTwoPointOneFiveToElevenPointThreeFivePercentMemberbcs:SatisfactoryBBPlusToBMemberifrs-full:LoanCommitmentsMemberifrs-full:TwelvemonthExpectedCreditLossesMember2023-12-310000312069ifrs-full:AccumulatedImpairmentMemberifrs-full:LifetimeExpectedCreditLossesMemberbcs:ProbabilityOfDefaultTwoPointOneFiveToElevenPointThreeFivePercentMemberbcs:SatisfactoryBBPlusToBMemberifrs-full:LoanCommitmentsMemberifrs-full:FinancialInstrumentsNotCreditimpairedMember2023-12-310000312069ifrs-full:AccumulatedImpairmentMemberifrs-full:LifetimeExpectedCreditLossesMemberbcs:ProbabilityOfDefaultTwoPointOneFiveToElevenPointThreeFivePercentMemberifrs-full:FinancialInstrumentsCreditimpairedMemberbcs:SatisfactoryBBPlusToBMemberifrs-full:LoanCommitmentsMember2023-12-310000312069ifrs-full:AccumulatedImpairmentMemberbcs:ProbabilityOfDefaultTwoPointOneFiveToElevenPointThreeFivePercentMemberbcs:SatisfactoryBBPlusToBMemberifrs-full:LoanCommitmentsMemberbcs:ExpectedCreditLossesMember2023-12-310000312069bcs:ProbabilityOfDefaultTwoPointOneFiveToElevenPointThreeFivePercentMemberbcs:SatisfactoryBBPlusToBMemberifrs-full:LoanCommitmentsMember2023-12-310000312069bcs:ProbabilityOfDefaultElevenPointThreeFiveToOneHundredPercentMemberifrs-full:LoanCommitmentsMemberbcs:HigherRiskBMinusAndBelowMemberifrs-full:GrossCarryingAmountMemberifrs-full:TwelvemonthExpectedCreditLossesMember2023-12-310000312069ifrs-full:LifetimeExpectedCreditLossesMemberbcs:ProbabilityOfDefaultElevenPointThreeFiveToOneHundredPercentMemberifrs-full:LoanCommitmentsMemberbcs:HigherRiskBMinusAndBelowMemberifrs-full:GrossCarryingAmountMemberifrs-full:FinancialInstrumentsNotCreditimpairedMember2023-12-310000312069ifrs-full:LifetimeExpectedCreditLossesMemberbcs:ProbabilityOfDefaultElevenPointThreeFiveToOneHundredPercentMemberifrs-full:FinancialInstrumentsCreditimpairedMemberifrs-full:LoanCommitmentsMemberbcs:HigherRiskBMinusAndBelowMemberifrs-full:GrossCarryingAmountMember2023-12-310000312069bcs:ProbabilityOfDefaultElevenPointThreeFiveToOneHundredPercentMemberifrs-full:LoanCommitmentsMemberbcs:HigherRiskBMinusAndBelowMemberifrs-full:GrossCarryingAmountMemberbcs:ExpectedCreditLossesMember2023-12-310000312069ifrs-full:AccumulatedImpairmentMemberbcs:ProbabilityOfDefaultElevenPointThreeFiveToOneHundredPercentMemberifrs-full:LoanCommitmentsMemberbcs:HigherRiskBMinusAndBelowMemberifrs-full:TwelvemonthExpectedCreditLossesMember2023-12-310000312069ifrs-full:AccumulatedImpairmentMemberifrs-full:LifetimeExpectedCreditLossesMemberbcs:ProbabilityOfDefaultElevenPointThreeFiveToOneHundredPercentMemberifrs-full:LoanCommitmentsMemberbcs:HigherRiskBMinusAndBelowMemberifrs-full:FinancialInstrumentsNotCreditimpairedMember2023-12-310000312069ifrs-full:AccumulatedImpairmentMemberifrs-full:LifetimeExpectedCreditLossesMemberbcs:ProbabilityOfDefaultElevenPointThreeFiveToOneHundredPercentMemberifrs-full:FinancialInstrumentsCreditimpairedMemberifrs-full:LoanCommitmentsMemberbcs:HigherRiskBMinusAndBelowMember2023-12-310000312069ifrs-full:AccumulatedImpairmentMemberbcs:ProbabilityOfDefaultElevenPointThreeFiveToOneHundredPercentMemberifrs-full:LoanCommitmentsMemberbcs:HigherRiskBMinusAndBelowMemberbcs:ExpectedCreditLossesMember2023-12-310000312069bcs:ProbabilityOfDefaultElevenPointThreeFiveToOneHundredPercentMemberifrs-full:LoanCommitmentsMemberbcs:HigherRiskBMinusAndBelowMember2023-12-310000312069ifrs-full:LoanCommitmentsMemberbcs:ProbabilityOfDefaultOneHundredPercentMemberifrs-full:GrossCarryingAmountMemberifrs-full:TwelvemonthExpectedCreditLossesMember2023-12-310000312069ifrs-full:LifetimeExpectedCreditLossesMemberifrs-full:LoanCommitmentsMemberbcs:ProbabilityOfDefaultOneHundredPercentMemberifrs-full:GrossCarryingAmountMemberifrs-full:FinancialInstrumentsNotCreditimpairedMember2023-12-310000312069ifrs-full:LifetimeExpectedCreditLossesMemberifrs-full:FinancialInstrumentsCreditimpairedMemberifrs-full:LoanCommitmentsMemberbcs:ProbabilityOfDefaultOneHundredPercentMemberifrs-full:GrossCarryingAmountMember2023-12-310000312069ifrs-full:LoanCommitmentsMemberbcs:ProbabilityOfDefaultOneHundredPercentMemberifrs-full:GrossCarryingAmountMemberbcs:ExpectedCreditLossesMember2023-12-310000312069ifrs-full:AccumulatedImpairmentMemberifrs-full:LoanCommitmentsMemberbcs:ProbabilityOfDefaultOneHundredPercentMemberifrs-full:TwelvemonthExpectedCreditLossesMember2023-12-310000312069ifrs-full:AccumulatedImpairmentMemberifrs-full:LifetimeExpectedCreditLossesMemberifrs-full:LoanCommitmentsMemberbcs:ProbabilityOfDefaultOneHundredPercentMemberifrs-full:FinancialInstrumentsNotCreditimpairedMember2023-12-310000312069ifrs-full:AccumulatedImpairmentMemberifrs-full:LifetimeExpectedCreditLossesMemberifrs-full:FinancialInstrumentsCreditimpairedMemberifrs-full:LoanCommitmentsMemberbcs:ProbabilityOfDefaultOneHundredPercentMember2023-12-310000312069ifrs-full:AccumulatedImpairmentMemberifrs-full:LoanCommitmentsMemberbcs:ProbabilityOfDefaultOneHundredPercentMemberbcs:ExpectedCreditLossesMember2023-12-310000312069ifrs-full:LoanCommitmentsMemberbcs:ProbabilityOfDefaultOneHundredPercentMember2023-12-310000312069ifrs-full:LoanCommitmentsMemberifrs-full:GrossCarryingAmountMemberifrs-full:TwelvemonthExpectedCreditLossesMember2023-12-310000312069ifrs-full:LifetimeExpectedCreditLossesMemberifrs-full:LoanCommitmentsMemberifrs-full:GrossCarryingAmountMemberifrs-full:FinancialInstrumentsNotCreditimpairedMember2023-12-310000312069ifrs-full:LifetimeExpectedCreditLossesMemberifrs-full:FinancialInstrumentsCreditimpairedMemberifrs-full:LoanCommitmentsMemberifrs-full:GrossCarryingAmountMember2023-12-310000312069ifrs-full:LoanCommitmentsMemberifrs-full:GrossCarryingAmountMemberbcs:ExpectedCreditLossesMember2023-12-310000312069ifrs-full:AccumulatedImpairmentMemberifrs-full:LoanCommitmentsMemberifrs-full:TwelvemonthExpectedCreditLossesMember2023-12-310000312069ifrs-full:AccumulatedImpairmentMemberifrs-full:LifetimeExpectedCreditLossesMemberifrs-full:LoanCommitmentsMemberifrs-full:FinancialInstrumentsNotCreditimpairedMember2023-12-310000312069ifrs-full:AccumulatedImpairmentMemberifrs-full:LifetimeExpectedCreditLossesMemberifrs-full:FinancialInstrumentsCreditimpairedMemberifrs-full:LoanCommitmentsMember2023-12-310000312069ifrs-full:AccumulatedImpairmentMemberifrs-full:LoanCommitmentsMemberbcs:ExpectedCreditLossesMember2023-12-310000312069ifrs-full:LoanCommitmentsMember2023-12-310000312069bcs:ProbabilityOfDefaultZeroToPointZeroFivePercentMemberifrs-full:LoanCommitmentsMemberifrs-full:GrossCarryingAmountMemberbcs:StrongIncludingInvestmentGradeMemberifrs-full:TwelvemonthExpectedCreditLossesMember2022-12-310000312069ifrs-full:LifetimeExpectedCreditLossesMemberbcs:ProbabilityOfDefaultZeroToPointZeroFivePercentMemberifrs-full:LoanCommitmentsMemberifrs-full:GrossCarryingAmountMemberifrs-full:FinancialInstrumentsNotCreditimpairedMemberbcs:StrongIncludingInvestmentGradeMember2022-12-310000312069ifrs-full:LifetimeExpectedCreditLossesMemberbcs:ProbabilityOfDefaultZeroToPointZeroFivePercentMemberifrs-full:FinancialInstrumentsCreditimpairedMemberifrs-full:LoanCommitmentsMemberifrs-full:GrossCarryingAmountMemberbcs:StrongIncludingInvestmentGradeMember2022-12-310000312069bcs:ProbabilityOfDefaultZeroToPointZeroFivePercentMemberifrs-full:LoanCommitmentsMemberifrs-full:GrossCarryingAmountMemberbcs:ExpectedCreditLossesMemberbcs:StrongIncludingInvestmentGradeMember2022-12-310000312069ifrs-full:AccumulatedImpairmentMemberbcs:ProbabilityOfDefaultZeroToPointZeroFivePercentMemberifrs-full:LoanCommitmentsMemberbcs:StrongIncludingInvestmentGradeMemberifrs-full:TwelvemonthExpectedCreditLossesMember2022-12-310000312069ifrs-full:AccumulatedImpairmentMemberifrs-full:LifetimeExpectedCreditLossesMemberbcs:ProbabilityOfDefaultZeroToPointZeroFivePercentMemberifrs-full:LoanCommitmentsMemberifrs-full:FinancialInstrumentsNotCreditimpairedMemberbcs:StrongIncludingInvestmentGradeMember2022-12-310000312069ifrs-full:AccumulatedImpairmentMemberifrs-full:LifetimeExpectedCreditLossesMemberbcs:ProbabilityOfDefaultZeroToPointZeroFivePercentMemberifrs-full:FinancialInstrumentsCreditimpairedMemberifrs-full:LoanCommitmentsMemberbcs:StrongIncludingInvestmentGradeMember2022-12-310000312069ifrs-full:AccumulatedImpairmentMemberbcs:ProbabilityOfDefaultZeroToPointZeroFivePercentMemberifrs-full:LoanCommitmentsMemberbcs:ExpectedCreditLossesMemberbcs:StrongIncludingInvestmentGradeMember2022-12-310000312069bcs:ProbabilityOfDefaultZeroToPointZeroFivePercentMemberifrs-full:LoanCommitmentsMemberbcs:StrongIncludingInvestmentGradeMember2022-12-310000312069ifrs-full:LoanCommitmentsMemberifrs-full:GrossCarryingAmountMemberbcs:ProbabilityOfDefaultPointZeroFiveToPointOneFivePercentMemberbcs:StrongIncludingInvestmentGradeMemberifrs-full:TwelvemonthExpectedCreditLossesMember2022-12-310000312069ifrs-full:LifetimeExpectedCreditLossesMemberifrs-full:LoanCommitmentsMemberifrs-full:GrossCarryingAmountMemberbcs:ProbabilityOfDefaultPointZeroFiveToPointOneFivePercentMemberifrs-full:FinancialInstrumentsNotCreditimpairedMemberbcs:StrongIncludingInvestmentGradeMember2022-12-310000312069ifrs-full:LifetimeExpectedCreditLossesMemberifrs-full:FinancialInstrumentsCreditimpairedMemberifrs-full:LoanCommitmentsMemberifrs-full:GrossCarryingAmountMemberbcs:ProbabilityOfDefaultPointZeroFiveToPointOneFivePercentMemberbcs:StrongIncludingInvestmentGradeMember2022-12-310000312069ifrs-full:LoanCommitmentsMemberifrs-full:GrossCarryingAmountMemberbcs:ExpectedCreditLossesMemberbcs:ProbabilityOfDefaultPointZeroFiveToPointOneFivePercentMemberbcs:StrongIncludingInvestmentGradeMember2022-12-310000312069ifrs-full:AccumulatedImpairmentMemberifrs-full:LoanCommitmentsMemberbcs:ProbabilityOfDefaultPointZeroFiveToPointOneFivePercentMemberbcs:StrongIncludingInvestmentGradeMemberifrs-full:TwelvemonthExpectedCreditLossesMember2022-12-310000312069ifrs-full:AccumulatedImpairmentMemberifrs-full:LifetimeExpectedCreditLossesMemberifrs-full:LoanCommitmentsMemberbcs:ProbabilityOfDefaultPointZeroFiveToPointOneFivePercentMemberifrs-full:FinancialInstrumentsNotCreditimpairedMemberbcs:StrongIncludingInvestmentGradeMember2022-12-310000312069ifrs-full:AccumulatedImpairmentMemberifrs-full:LifetimeExpectedCreditLossesMemberifrs-full:FinancialInstrumentsCreditimpairedMemberifrs-full:LoanCommitmentsMemberbcs:ProbabilityOfDefaultPointZeroFiveToPointOneFivePercentMemberbcs:StrongIncludingInvestmentGradeMember2022-12-310000312069ifrs-full:AccumulatedImpairmentMemberifrs-full:LoanCommitmentsMemberbcs:ExpectedCreditLossesMemberbcs:ProbabilityOfDefaultPointZeroFiveToPointOneFivePercentMemberbcs:StrongIncludingInvestmentGradeMember2022-12-310000312069ifrs-full:LoanCommitmentsMemberbcs:ProbabilityOfDefaultPointZeroFiveToPointOneFivePercentMemberbcs:StrongIncludingInvestmentGradeMember2022-12-310000312069bcs:ProbabilityOfDefaultPointOneFiveToPointThreePercentMemberifrs-full:LoanCommitmentsMemberifrs-full:GrossCarryingAmountMemberbcs:StrongIncludingInvestmentGradeMemberifrs-full:TwelvemonthExpectedCreditLossesMember2022-12-310000312069ifrs-full:LifetimeExpectedCreditLossesMemberbcs:ProbabilityOfDefaultPointOneFiveToPointThreePercentMemberifrs-full:LoanCommitmentsMemberifrs-full:GrossCarryingAmountMemberifrs-full:FinancialInstrumentsNotCreditimpairedMemberbcs:StrongIncludingInvestmentGradeMember2022-12-310000312069ifrs-full:LifetimeExpectedCreditLossesMemberifrs-full:FinancialInstrumentsCreditimpairedMemberbcs:ProbabilityOfDefaultPointOneFiveToPointThreePercentMemberifrs-full:LoanCommitmentsMemberifrs-full:GrossCarryingAmountMemberbcs:StrongIncludingInvestmentGradeMember2022-12-310000312069bcs:ProbabilityOfDefaultPointOneFiveToPointThreePercentMemberifrs-full:LoanCommitmentsMemberifrs-full:GrossCarryingAmountMemberbcs:ExpectedCreditLossesMemberbcs:StrongIncludingInvestmentGradeMember2022-12-310000312069ifrs-full:AccumulatedImpairmentMemberbcs:ProbabilityOfDefaultPointOneFiveToPointThreePercentMemberifrs-full:LoanCommitmentsMemberbcs:StrongIncludingInvestmentGradeMemberifrs-full:TwelvemonthExpectedCreditLossesMember2022-12-310000312069ifrs-full:AccumulatedImpairmentMemberifrs-full:LifetimeExpectedCreditLossesMemberbcs:ProbabilityOfDefaultPointOneFiveToPointThreePercentMemberifrs-full:LoanCommitmentsMemberifrs-full:FinancialInstrumentsNotCreditimpairedMemberbcs:StrongIncludingInvestmentGradeMember2022-12-310000312069ifrs-full:AccumulatedImpairmentMemberifrs-full:LifetimeExpectedCreditLossesMemberifrs-full:FinancialInstrumentsCreditimpairedMemberbcs:ProbabilityOfDefaultPointOneFiveToPointThreePercentMemberifrs-full:LoanCommitmentsMemberbcs:StrongIncludingInvestmentGradeMember2022-12-310000312069ifrs-full:AccumulatedImpairmentMemberbcs:ProbabilityOfDefaultPointOneFiveToPointThreePercentMemberifrs-full:LoanCommitmentsMemberbcs:ExpectedCreditLossesMemberbcs:StrongIncludingInvestmentGradeMember2022-12-310000312069bcs:ProbabilityOfDefaultPointOneFiveToPointThreePercentMemberifrs-full:LoanCommitmentsMemberbcs:StrongIncludingInvestmentGradeMember2022-12-310000312069bcs:ProbabilityOfDefaultPointThreeToPointSixPercentMemberifrs-full:LoanCommitmentsMemberifrs-full:GrossCarryingAmountMemberbcs:StrongIncludingInvestmentGradeMemberifrs-full:TwelvemonthExpectedCreditLossesMember2022-12-310000312069ifrs-full:LifetimeExpectedCreditLossesMemberbcs:ProbabilityOfDefaultPointThreeToPointSixPercentMemberifrs-full:LoanCommitmentsMemberifrs-full:GrossCarryingAmountMemberifrs-full:FinancialInstrumentsNotCreditimpairedMemberbcs:StrongIncludingInvestmentGradeMember2022-12-310000312069ifrs-full:LifetimeExpectedCreditLossesMemberbcs:ProbabilityOfDefaultPointThreeToPointSixPercentMemberifrs-full:FinancialInstrumentsCreditimpairedMemberifrs-full:LoanCommitmentsMemberifrs-full:GrossCarryingAmountMemberbcs:StrongIncludingInvestmentGradeMember2022-12-310000312069bcs:ProbabilityOfDefaultPointThreeToPointSixPercentMemberifrs-full:LoanCommitmentsMemberifrs-full:GrossCarryingAmountMemberbcs:ExpectedCreditLossesMemberbcs:StrongIncludingInvestmentGradeMember2022-12-310000312069ifrs-full:AccumulatedImpairmentMemberbcs:ProbabilityOfDefaultPointThreeToPointSixPercentMemberifrs-full:LoanCommitmentsMemberbcs:StrongIncludingInvestmentGradeMemberifrs-full:TwelvemonthExpectedCreditLossesMember2022-12-310000312069ifrs-full:AccumulatedImpairmentMemberifrs-full:LifetimeExpectedCreditLossesMemberbcs:ProbabilityOfDefaultPointThreeToPointSixPercentMemberifrs-full:LoanCommitmentsMemberifrs-full:FinancialInstrumentsNotCreditimpairedMemberbcs:StrongIncludingInvestmentGradeMember2022-12-310000312069ifrs-full:AccumulatedImpairmentMemberifrs-full:LifetimeExpectedCreditLossesMemberbcs:ProbabilityOfDefaultPointThreeToPointSixPercentMemberifrs-full:FinancialInstrumentsCreditimpairedMemberifrs-full:LoanCommitmentsMemberbcs:StrongIncludingInvestmentGradeMember2022-12-310000312069ifrs-full:AccumulatedImpairmentMemberbcs:ProbabilityOfDefaultPointThreeToPointSixPercentMemberifrs-full:LoanCommitmentsMemberbcs:ExpectedCreditLossesMemberbcs:StrongIncludingInvestmentGradeMember2022-12-310000312069bcs:ProbabilityOfDefaultPointThreeToPointSixPercentMemberifrs-full:LoanCommitmentsMemberbcs:StrongIncludingInvestmentGradeMember2022-12-310000312069bcs:ProbabilityOfDefaultPointSixtyToTwoPointOneFivePercentMemberbcs:SatisfactoryBBPlusToBMemberifrs-full:LoanCommitmentsMemberifrs-full:GrossCarryingAmountMemberifrs-full:TwelvemonthExpectedCreditLossesMember2022-12-310000312069bcs:ProbabilityOfDefaultPointSixtyToTwoPointOneFivePercentMemberifrs-full:LifetimeExpectedCreditLossesMemberbcs:SatisfactoryBBPlusToBMemberifrs-full:LoanCommitmentsMemberifrs-full:GrossCarryingAmountMemberifrs-full:FinancialInstrumentsNotCreditimpairedMember2022-12-310000312069bcs:ProbabilityOfDefaultPointSixtyToTwoPointOneFivePercentMemberifrs-full:LifetimeExpectedCreditLossesMemberifrs-full:FinancialInstrumentsCreditimpairedMemberbcs:SatisfactoryBBPlusToBMemberifrs-full:LoanCommitmentsMemberifrs-full:GrossCarryingAmountMember2022-12-310000312069bcs:ProbabilityOfDefaultPointSixtyToTwoPointOneFivePercentMemberbcs:SatisfactoryBBPlusToBMemberifrs-full:LoanCommitmentsMemberifrs-full:GrossCarryingAmountMemberbcs:ExpectedCreditLossesMember2022-12-310000312069bcs:ProbabilityOfDefaultPointSixtyToTwoPointOneFivePercentMemberifrs-full:AccumulatedImpairmentMemberbcs:SatisfactoryBBPlusToBMemberifrs-full:LoanCommitmentsMemberifrs-full:TwelvemonthExpectedCreditLossesMember2022-12-310000312069bcs:ProbabilityOfDefaultPointSixtyToTwoPointOneFivePercentMemberifrs-full:AccumulatedImpairmentMemberifrs-full:LifetimeExpectedCreditLossesMemberbcs:SatisfactoryBBPlusToBMemberifrs-full:LoanCommitmentsMemberifrs-full:FinancialInstrumentsNotCreditimpairedMember2022-12-310000312069bcs:ProbabilityOfDefaultPointSixtyToTwoPointOneFivePercentMemberifrs-full:AccumulatedImpairmentMemberifrs-full:LifetimeExpectedCreditLossesMemberifrs-full:FinancialInstrumentsCreditimpairedMemberbcs:SatisfactoryBBPlusToBMemberifrs-full:LoanCommitmentsMember2022-12-310000312069bcs:ProbabilityOfDefaultPointSixtyToTwoPointOneFivePercentMemberifrs-full:AccumulatedImpairmentMemberbcs:SatisfactoryBBPlusToBMemberifrs-full:LoanCommitmentsMemberbcs:ExpectedCreditLossesMember2022-12-310000312069bcs:ProbabilityOfDefaultPointSixtyToTwoPointOneFivePercentMemberbcs:SatisfactoryBBPlusToBMemberifrs-full:LoanCommitmentsMember2022-12-310000312069bcs:ProbabilityOfDefaultTwoPointOneFiveToElevenPointThreeFivePercentMemberbcs:SatisfactoryBBPlusToBMemberifrs-full:LoanCommitmentsMemberifrs-full:GrossCarryingAmountMemberifrs-full:TwelvemonthExpectedCreditLossesMember2022-12-310000312069ifrs-full:LifetimeExpectedCreditLossesMemberbcs:ProbabilityOfDefaultTwoPointOneFiveToElevenPointThreeFivePercentMemberbcs:SatisfactoryBBPlusToBMemberifrs-full:LoanCommitmentsMemberifrs-full:GrossCarryingAmountMemberifrs-full:FinancialInstrumentsNotCreditimpairedMember2022-12-310000312069ifrs-full:LifetimeExpectedCreditLossesMemberbcs:ProbabilityOfDefaultTwoPointOneFiveToElevenPointThreeFivePercentMemberifrs-full:FinancialInstrumentsCreditimpairedMemberbcs:SatisfactoryBBPlusToBMemberifrs-full:LoanCommitmentsMemberifrs-full:GrossCarryingAmountMember2022-12-310000312069bcs:ProbabilityOfDefaultTwoPointOneFiveToElevenPointThreeFivePercentMemberbcs:SatisfactoryBBPlusToBMemberifrs-full:LoanCommitmentsMemberifrs-full:GrossCarryingAmountMemberbcs:ExpectedCreditLossesMember2022-12-310000312069ifrs-full:AccumulatedImpairmentMemberbcs:ProbabilityOfDefaultTwoPointOneFiveToElevenPointThreeFivePercentMemberbcs:SatisfactoryBBPlusToBMemberifrs-full:LoanCommitmentsMemberifrs-full:TwelvemonthExpectedCreditLossesMember2022-12-310000312069ifrs-full:AccumulatedImpairmentMemberifrs-full:LifetimeExpectedCreditLossesMemberbcs:ProbabilityOfDefaultTwoPointOneFiveToElevenPointThreeFivePercentMemberbcs:SatisfactoryBBPlusToBMemberifrs-full:LoanCommitmentsMemberifrs-full:FinancialInstrumentsNotCreditimpairedMember2022-12-310000312069ifrs-full:AccumulatedImpairmentMemberifrs-full:LifetimeExpectedCreditLossesMemberbcs:ProbabilityOfDefaultTwoPointOneFiveToElevenPointThreeFivePercentMemberifrs-full:FinancialInstrumentsCreditimpairedMemberbcs:SatisfactoryBBPlusToBMemberifrs-full:LoanCommitmentsMember2022-12-310000312069ifrs-full:AccumulatedImpairmentMemberbcs:ProbabilityOfDefaultTwoPointOneFiveToElevenPointThreeFivePercentMemberbcs:SatisfactoryBBPlusToBMemberifrs-full:LoanCommitmentsMemberbcs:ExpectedCreditLossesMember2022-12-310000312069bcs:ProbabilityOfDefaultTwoPointOneFiveToElevenPointThreeFivePercentMemberbcs:SatisfactoryBBPlusToBMemberifrs-full:LoanCommitmentsMember2022-12-310000312069bcs:ProbabilityOfDefaultElevenPointThreeFiveToOneHundredPercentMemberifrs-full:LoanCommitmentsMemberbcs:HigherRiskBMinusAndBelowMemberifrs-full:GrossCarryingAmountMemberifrs-full:TwelvemonthExpectedCreditLossesMember2022-12-310000312069ifrs-full:LifetimeExpectedCreditLossesMemberbcs:ProbabilityOfDefaultElevenPointThreeFiveToOneHundredPercentMemberifrs-full:LoanCommitmentsMemberbcs:HigherRiskBMinusAndBelowMemberifrs-full:GrossCarryingAmountMemberifrs-full:FinancialInstrumentsNotCreditimpairedMember2022-12-310000312069ifrs-full:LifetimeExpectedCreditLossesMemberbcs:ProbabilityOfDefaultElevenPointThreeFiveToOneHundredPercentMemberifrs-full:FinancialInstrumentsCreditimpairedMemberifrs-full:LoanCommitmentsMemberbcs:HigherRiskBMinusAndBelowMemberifrs-full:GrossCarryingAmountMember2022-12-310000312069bcs:ProbabilityOfDefaultElevenPointThreeFiveToOneHundredPercentMemberifrs-full:LoanCommitmentsMemberbcs:HigherRiskBMinusAndBelowMemberifrs-full:GrossCarryingAmountMemberbcs:ExpectedCreditLossesMember2022-12-310000312069ifrs-full:AccumulatedImpairmentMemberbcs:ProbabilityOfDefaultElevenPointThreeFiveToOneHundredPercentMemberifrs-full:LoanCommitmentsMemberbcs:HigherRiskBMinusAndBelowMemberifrs-full:TwelvemonthExpectedCreditLossesMember2022-12-310000312069ifrs-full:AccumulatedImpairmentMemberifrs-full:LifetimeExpectedCreditLossesMemberbcs:ProbabilityOfDefaultElevenPointThreeFiveToOneHundredPercentMemberifrs-full:LoanCommitmentsMemberbcs:HigherRiskBMinusAndBelowMemberifrs-full:FinancialInstrumentsNotCreditimpairedMember2022-12-310000312069ifrs-full:AccumulatedImpairmentMemberifrs-full:LifetimeExpectedCreditLossesMemberbcs:ProbabilityOfDefaultElevenPointThreeFiveToOneHundredPercentMemberifrs-full:FinancialInstrumentsCreditimpairedMemberifrs-full:LoanCommitmentsMemberbcs:HigherRiskBMinusAndBelowMember2022-12-310000312069ifrs-full:AccumulatedImpairmentMemberbcs:ProbabilityOfDefaultElevenPointThreeFiveToOneHundredPercentMemberifrs-full:LoanCommitmentsMemberbcs:HigherRiskBMinusAndBelowMemberbcs:ExpectedCreditLossesMember2022-12-310000312069bcs:ProbabilityOfDefaultElevenPointThreeFiveToOneHundredPercentMemberifrs-full:LoanCommitmentsMemberbcs:HigherRiskBMinusAndBelowMember2022-12-310000312069ifrs-full:LoanCommitmentsMemberbcs:ProbabilityOfDefaultOneHundredPercentMemberifrs-full:GrossCarryingAmountMemberifrs-full:TwelvemonthExpectedCreditLossesMember2022-12-310000312069ifrs-full:LifetimeExpectedCreditLossesMemberifrs-full:LoanCommitmentsMemberbcs:ProbabilityOfDefaultOneHundredPercentMemberifrs-full:GrossCarryingAmountMemberifrs-full:FinancialInstrumentsNotCreditimpairedMember2022-12-310000312069ifrs-full:LifetimeExpectedCreditLossesMemberifrs-full:FinancialInstrumentsCreditimpairedMemberifrs-full:LoanCommitmentsMemberbcs:ProbabilityOfDefaultOneHundredPercentMemberifrs-full:GrossCarryingAmountMember2022-12-310000312069ifrs-full:LoanCommitmentsMemberbcs:ProbabilityOfDefaultOneHundredPercentMemberifrs-full:GrossCarryingAmountMemberbcs:ExpectedCreditLossesMember2022-12-310000312069ifrs-full:AccumulatedImpairmentMemberifrs-full:LoanCommitmentsMemberbcs:ProbabilityOfDefaultOneHundredPercentMemberifrs-full:TwelvemonthExpectedCreditLossesMember2022-12-310000312069ifrs-full:AccumulatedImpairmentMemberifrs-full:LifetimeExpectedCreditLossesMemberifrs-full:LoanCommitmentsMemberbcs:ProbabilityOfDefaultOneHundredPercentMemberifrs-full:FinancialInstrumentsNotCreditimpairedMember2022-12-310000312069ifrs-full:AccumulatedImpairmentMemberifrs-full:LifetimeExpectedCreditLossesMemberifrs-full:FinancialInstrumentsCreditimpairedMemberifrs-full:LoanCommitmentsMemberbcs:ProbabilityOfDefaultOneHundredPercentMember2022-12-310000312069ifrs-full:AccumulatedImpairmentMemberifrs-full:LoanCommitmentsMemberbcs:ProbabilityOfDefaultOneHundredPercentMemberbcs:ExpectedCreditLossesMember2022-12-310000312069ifrs-full:LoanCommitmentsMemberbcs:ProbabilityOfDefaultOneHundredPercentMember2022-12-310000312069ifrs-full:LoanCommitmentsMemberifrs-full:GrossCarryingAmountMemberifrs-full:TwelvemonthExpectedCreditLossesMember2022-12-310000312069ifrs-full:LifetimeExpectedCreditLossesMemberifrs-full:LoanCommitmentsMemberifrs-full:GrossCarryingAmountMemberifrs-full:FinancialInstrumentsNotCreditimpairedMember2022-12-310000312069ifrs-full:LifetimeExpectedCreditLossesMemberifrs-full:FinancialInstrumentsCreditimpairedMemberifrs-full:LoanCommitmentsMemberifrs-full:GrossCarryingAmountMember2022-12-310000312069ifrs-full:LoanCommitmentsMemberifrs-full:GrossCarryingAmountMemberbcs:ExpectedCreditLossesMember2022-12-310000312069ifrs-full:AccumulatedImpairmentMemberifrs-full:LoanCommitmentsMemberifrs-full:TwelvemonthExpectedCreditLossesMember2022-12-310000312069ifrs-full:AccumulatedImpairmentMemberifrs-full:LifetimeExpectedCreditLossesMemberifrs-full:LoanCommitmentsMemberifrs-full:FinancialInstrumentsNotCreditimpairedMember2022-12-310000312069ifrs-full:AccumulatedImpairmentMemberifrs-full:LifetimeExpectedCreditLossesMemberifrs-full:FinancialInstrumentsCreditimpairedMemberifrs-full:LoanCommitmentsMember2022-12-310000312069ifrs-full:AccumulatedImpairmentMemberifrs-full:LoanCommitmentsMemberbcs:ExpectedCreditLossesMember2022-12-310000312069ifrs-full:LoanCommitmentsMember2022-12-310000312069ifrs-full:CurrencyRiskMemberifrs-full:DerivativesMember2023-12-310000312069ifrs-full:CurrencyRiskMemberifrs-full:DerivativesMember2022-12-310000312069ifrs-full:DerivativesMemberifrs-full:InterestRateRiskMember2023-12-310000312069ifrs-full:DerivativesMemberifrs-full:InterestRateRiskMember2022-12-310000312069ifrs-full:CreditRiskMemberifrs-full:DerivativesMember2023-12-310000312069ifrs-full:CreditRiskMemberifrs-full:DerivativesMember2022-12-310000312069ifrs-full:EquityPriceRiskMemberifrs-full:DerivativesMember2023-12-310000312069ifrs-full:EquityPriceRiskMemberifrs-full:DerivativesMember2022-12-310000312069ifrs-full:CommodityPriceRiskMemberifrs-full:DerivativesMember2023-12-310000312069ifrs-full:CommodityPriceRiskMemberifrs-full:DerivativesMember2022-12-310000312069ifrs-full:DerivativesMember2023-12-310000312069ifrs-full:DerivativesMember2022-12-310000312069ifrs-full:WeightedAverageMemberifrs-full:CreditRiskMember2023-12-310000312069ifrs-full:TopOfRangeMemberifrs-full:CreditRiskMember2023-12-310000312069ifrs-full:BottomOfRangeMemberifrs-full:CreditRiskMember2023-12-310000312069ifrs-full:WeightedAverageMemberifrs-full:CreditRiskMember2022-12-310000312069ifrs-full:TopOfRangeMemberifrs-full:CreditRiskMember2022-12-310000312069ifrs-full:BottomOfRangeMemberifrs-full:CreditRiskMember2022-12-310000312069ifrs-full:WeightedAverageMemberifrs-full:InterestRateRiskMember2023-12-310000312069ifrs-full:TopOfRangeMemberifrs-full:InterestRateRiskMember2023-12-310000312069ifrs-full:BottomOfRangeMemberifrs-full:InterestRateRiskMember2023-12-310000312069ifrs-full:WeightedAverageMemberifrs-full:InterestRateRiskMember2022-12-310000312069ifrs-full:TopOfRangeMemberifrs-full:InterestRateRiskMember2022-12-310000312069ifrs-full:BottomOfRangeMemberifrs-full:InterestRateRiskMember2022-12-310000312069ifrs-full:WeightedAverageMemberifrs-full:EquityPriceRiskMember2023-12-310000312069ifrs-full:TopOfRangeMemberifrs-full:EquityPriceRiskMember2023-12-310000312069ifrs-full:BottomOfRangeMemberifrs-full:EquityPriceRiskMember2023-12-310000312069ifrs-full:WeightedAverageMemberifrs-full:EquityPriceRiskMember2022-12-310000312069ifrs-full:TopOfRangeMemberifrs-full:EquityPriceRiskMember2022-12-310000312069ifrs-full:BottomOfRangeMemberifrs-full:EquityPriceRiskMember2022-12-310000312069bcs:BasisRiskMemberifrs-full:WeightedAverageMember2023-12-310000312069ifrs-full:TopOfRangeMemberbcs:BasisRiskMember2023-12-310000312069bcs:BasisRiskMemberifrs-full:BottomOfRangeMember2023-12-310000312069bcs:BasisRiskMemberifrs-full:WeightedAverageMember2022-12-310000312069ifrs-full:TopOfRangeMemberbcs:BasisRiskMember2022-12-310000312069bcs:BasisRiskMemberifrs-full:BottomOfRangeMember2022-12-310000312069ifrs-full:WeightedAverageMemberbcs:SpreadRiskMember2023-12-310000312069ifrs-full:TopOfRangeMemberbcs:SpreadRiskMember2023-12-310000312069bcs:SpreadRiskMemberifrs-full:BottomOfRangeMember2023-12-310000312069ifrs-full:WeightedAverageMemberbcs:SpreadRiskMember2022-12-310000312069ifrs-full:TopOfRangeMemberbcs:SpreadRiskMember2022-12-310000312069bcs:SpreadRiskMemberifrs-full:BottomOfRangeMember2022-12-310000312069ifrs-full:WeightedAverageMemberifrs-full:CurrencyRiskMember2023-12-310000312069ifrs-full:TopOfRangeMemberifrs-full:CurrencyRiskMember2023-12-310000312069ifrs-full:CurrencyRiskMemberifrs-full:BottomOfRangeMember2023-12-310000312069ifrs-full:WeightedAverageMemberifrs-full:CurrencyRiskMember2022-12-310000312069ifrs-full:TopOfRangeMemberifrs-full:CurrencyRiskMember2022-12-310000312069ifrs-full:CurrencyRiskMemberifrs-full:BottomOfRangeMember2022-12-310000312069ifrs-full:WeightedAverageMemberifrs-full:CommodityPriceRiskMember2023-12-310000312069ifrs-full:TopOfRangeMemberifrs-full:CommodityPriceRiskMember2023-12-310000312069ifrs-full:CommodityPriceRiskMemberifrs-full:BottomOfRangeMember2023-12-310000312069ifrs-full:WeightedAverageMemberifrs-full:CommodityPriceRiskMember2022-12-310000312069ifrs-full:TopOfRangeMemberifrs-full:CommodityPriceRiskMember2022-12-310000312069ifrs-full:CommodityPriceRiskMemberifrs-full:BottomOfRangeMember2022-12-310000312069ifrs-full:WeightedAverageMemberbcs:InflationRiskMember2023-12-310000312069ifrs-full:TopOfRangeMemberbcs:InflationRiskMember2023-12-310000312069ifrs-full:BottomOfRangeMemberbcs:InflationRiskMember2023-12-310000312069ifrs-full:WeightedAverageMemberbcs:InflationRiskMember2022-12-310000312069ifrs-full:TopOfRangeMemberbcs:InflationRiskMember2022-12-310000312069ifrs-full:BottomOfRangeMemberbcs:InflationRiskMember2022-12-310000312069ifrs-full:WeightedAverageMemberifrs-full:RiskDiversificationEffectMember2023-12-310000312069ifrs-full:WeightedAverageMemberifrs-full:RiskDiversificationEffectMember2022-12-310000312069ifrs-full:WeightedAverageMember2023-12-310000312069ifrs-full:TopOfRangeMember2023-12-310000312069ifrs-full:BottomOfRangeMember2023-12-310000312069ifrs-full:WeightedAverageMember2022-12-310000312069ifrs-full:TopOfRangeMember2022-12-310000312069ifrs-full:BottomOfRangeMember2022-12-310000312069ifrs-full:NotLaterThanOneMonthMember2023-12-310000312069ifrs-full:LaterThanOneMonthAndNotLaterThanThreeMonthsMember2023-12-310000312069ifrs-full:LaterThanThreeMonthsAndNotLaterThanSixMonthsMember2023-12-310000312069ifrs-full:LaterThanSixMonthsAndNotLaterThanOneYearMember2023-12-310000312069ifrs-full:LaterThanOneYearAndNotLaterThanThreeYearsMember2023-12-310000312069ifrs-full:LaterThanThreeYearsAndNotLaterThanFiveYearsMember2023-12-310000312069ifrs-full:LaterThanFiveYearsMember2023-12-310000312069ifrs-full:NotLaterThanOneMonthMember2022-12-310000312069ifrs-full:LaterThanOneMonthAndNotLaterThanThreeMonthsMember2022-12-310000312069ifrs-full:LaterThanThreeMonthsAndNotLaterThanSixMonthsMember2022-12-310000312069ifrs-full:LaterThanSixMonthsAndNotLaterThanOneYearMember2022-12-310000312069ifrs-full:LaterThanOneYearAndNotLaterThanThreeYearsMember2022-12-310000312069ifrs-full:LaterThanThreeYearsAndNotLaterThanFiveYearsMember2022-12-310000312069ifrs-full:LaterThanFiveYearsMember2022-12-310000312069bcs:FullyLoadedCommonEquityTierOneCapitalMember2023-12-310000312069bcs:FullyLoadedCommonEquityTierOneCapitalMember2022-12-310000312069bcs:TransitionalAtOneCapitalMember2023-12-310000312069bcs:TransitionalAtOneCapitalMember2022-12-310000312069bcs:PRATransitionalTierOneCapitalMember2023-12-310000312069bcs:PRATransitionalTierOneCapitalMember2022-12-310000312069bcs:TierTwoCapitalInstrumentsMember2023-12-310000312069bcs:TierTwoCapitalInstrumentsMember2022-12-310000312069bcs:IneligibleT2CapitalMember2023-12-310000312069bcs:IneligibleT2CapitalMember2022-12-310000312069bcs:EligibleLiabilitiesMember2023-12-310000312069bcs:EligibleLiabilitiesMember2022-12-310000312069currency:USD2023-12-310000312069currency:EUR2023-12-310000312069currency:JPY2023-12-310000312069bcs:OtherCurrenciesMember2023-12-310000312069ifrs-full:CurrencyRiskMember2023-12-310000312069currency:USD2022-12-310000312069currency:EUR2022-12-310000312069currency:JPY2022-12-310000312069bcs:OtherCurrenciesMember2022-12-310000312069ifrs-full:CurrencyRiskMember2022-12-310000312069ifrs-full:CurrencyRiskMember2023-01-012023-12-310000312069currency:USD2023-01-012023-12-310000312069currency:EUR2023-01-012023-12-310000312069bcs:BarclaysUkMemberbcs:TwentyFiveBasisPointsSensitivityAnalysisMemberifrs-full:InterestRateRiskMember2023-01-012023-12-310000312069bcs:BarclaysInternationalMemberbcs:TwentyFiveBasisPointsSensitivityAnalysisMemberifrs-full:InterestRateRiskMember2023-01-012023-12-310000312069bcs:TwentyFiveBasisPointsSensitivityAnalysisMemberifrs-full:UnallocatedAmountsMemberifrs-full:InterestRateRiskMember2023-01-012023-12-310000312069bcs:TwentyFiveBasisPointsSensitivityAnalysisMemberifrs-full:InterestRateRiskMember2023-01-012023-12-310000312069bcs:BarclaysUkMemberbcs:TwentyFiveBasisPointsSensitivityAnalysisMemberifrs-full:InterestRateRiskMember2022-01-012022-12-310000312069bcs:BarclaysInternationalMemberbcs:TwentyFiveBasisPointsSensitivityAnalysisMemberifrs-full:InterestRateRiskMember2022-01-012022-12-310000312069bcs:TwentyFiveBasisPointsSensitivityAnalysisMemberifrs-full:UnallocatedAmountsMemberifrs-full:InterestRateRiskMember2022-01-012022-12-310000312069bcs:TwentyFiveBasisPointsSensitivityAnalysisMemberifrs-full:InterestRateRiskMember2022-01-012022-12-310000312069currency:GBPbcs:TwentyFiveBasisPointsSensitivityAnalysisMember2023-01-012023-12-310000312069currency:GBPbcs:TwentyFiveBasisPointsSensitivityAnalysisMember2022-01-012022-12-310000312069bcs:TwentyFiveBasisPointsSensitivityAnalysisMembercurrency:USD2023-01-012023-12-310000312069bcs:TwentyFiveBasisPointsSensitivityAnalysisMembercurrency:USD2022-01-012022-12-310000312069currency:EURbcs:TwentyFiveBasisPointsSensitivityAnalysisMember2023-01-012023-12-310000312069currency:EURbcs:TwentyFiveBasisPointsSensitivityAnalysisMember2022-01-012022-12-310000312069bcs:TwentyFiveBasisPointsSensitivityAnalysisMembersrt:OtherCurrencyMember2023-01-012023-12-310000312069bcs:TwentyFiveBasisPointsSensitivityAnalysisMembersrt:OtherCurrencyMember2022-01-012022-12-310000312069bcs:TaxExpenseIncomeMemberbcs:TwentyFiveBasisPointsSensitivityAnalysisMemberifrs-full:InterestRateRiskMember2023-01-012023-12-310000312069bcs:TaxExpenseIncomeMemberbcs:TwentyFiveBasisPointsSensitivityAnalysisMemberifrs-full:InterestRateRiskMember2022-01-012022-12-310000312069ifrs-full:RetainedEarningsMemberbcs:TwentyFiveBasisPointsSensitivityAnalysisMemberifrs-full:InterestRateRiskMember2023-01-012023-12-310000312069ifrs-full:RetainedEarningsMemberbcs:TwentyFiveBasisPointsSensitivityAnalysisMemberifrs-full:InterestRateRiskMember2022-01-012022-12-310000312069ifrs-full:RetainedEarningsMemberbcs:TwentyFiveBasisPointsSensitivityAnalysisMemberifrs-full:InterestRateRiskMember2023-12-310000312069ifrs-full:RetainedEarningsMemberbcs:TwentyFiveBasisPointsSensitivityAnalysisMemberifrs-full:InterestRateRiskMember2022-12-310000312069bcs:TwentyFiveBasisPointsSensitivityAnalysisMemberifrs-full:ReserveOfGainsAndLossesOnRemeasuringAvailableforsaleFinancialAssetsMemberifrs-full:InterestRateRiskMember2023-12-310000312069bcs:TwentyFiveBasisPointsSensitivityAnalysisMemberifrs-full:ReserveOfGainsAndLossesOnRemeasuringAvailableforsaleFinancialAssetsMemberifrs-full:InterestRateRiskMember2022-12-310000312069bcs:TwentyFiveBasisPointsSensitivityAnalysisMemberifrs-full:ReserveOfCashFlowHedgesMemberifrs-full:InterestRateRiskMember2023-12-310000312069bcs:TwentyFiveBasisPointsSensitivityAnalysisMemberifrs-full:ReserveOfCashFlowHedgesMemberifrs-full:InterestRateRiskMember2022-12-310000312069bcs:TaxExpenseIncomeMemberbcs:TwentyFiveBasisPointsSensitivityAnalysisMemberifrs-full:InterestRateRiskMember2023-12-310000312069bcs:TaxExpenseIncomeMemberbcs:TwentyFiveBasisPointsSensitivityAnalysisMemberifrs-full:InterestRateRiskMember2022-12-310000312069bcs:TwentyFiveBasisPointsSensitivityAnalysisMemberifrs-full:InterestRateRiskMember2023-12-310000312069bcs:TwentyFiveBasisPointsSensitivityAnalysisMemberifrs-full:InterestRateRiskMember2022-12-310000312069ifrs-full:EquityAttributableToOwnersOfParentMemberbcs:TwentyFiveBasisPointsSensitivityAnalysisMemberifrs-full:InterestRateRiskMember2023-12-310000312069ifrs-full:EquityAttributableToOwnersOfParentMemberbcs:TwentyFiveBasisPointsSensitivityAnalysisMemberifrs-full:InterestRateRiskMember2022-12-3100003120692021-01-012021-12-31iso4217:GBPxbrli:shares0000312069bcs:IssuedCapitalAndSharePremiumMember2022-12-310000312069ifrs-full:OtherEquityInterestMember2022-12-310000312069ifrs-full:OtherReservesMember2022-12-310000312069ifrs-full:RetainedEarningsMember2022-12-310000312069ifrs-full:EquityAttributableToOwnersOfParentMember2022-12-310000312069ifrs-full:NoncontrollingInterestsMember2022-12-310000312069ifrs-full:OtherEquityInterestMember2023-01-012023-12-310000312069ifrs-full:RetainedEarningsMember2023-01-012023-12-310000312069ifrs-full:EquityAttributableToOwnersOfParentMember2023-01-012023-12-310000312069ifrs-full:NoncontrollingInterestsMember2023-01-012023-12-310000312069ifrs-full:OtherReservesMember2023-01-012023-12-310000312069bcs:IssuedCapitalAndSharePremiumMember2023-01-012023-12-310000312069bcs:IssuedCapitalAndSharePremiumMember2023-12-310000312069ifrs-full:OtherEquityInterestMember2023-12-310000312069ifrs-full:OtherReservesMember2023-12-310000312069ifrs-full:RetainedEarningsMember2023-12-310000312069ifrs-full:EquityAttributableToOwnersOfParentMember2023-12-310000312069ifrs-full:NoncontrollingInterestsMember2023-12-310000312069bcs:IssuedCapitalAndSharePremiumMember2021-12-310000312069ifrs-full:OtherEquityInterestMember2021-12-310000312069ifrs-full:OtherReservesMember2021-12-310000312069ifrs-full:RetainedEarningsMember2021-12-310000312069ifrs-full:EquityAttributableToOwnersOfParentMember2021-12-310000312069ifrs-full:NoncontrollingInterestsMember2021-12-3100003120692021-12-310000312069ifrs-full:OtherEquityInterestMember2022-01-012022-12-310000312069ifrs-full:RetainedEarningsMember2022-01-012022-12-310000312069ifrs-full:EquityAttributableToOwnersOfParentMember2022-01-012022-12-310000312069ifrs-full:NoncontrollingInterestsMember2022-01-012022-12-310000312069ifrs-full:OtherReservesMember2022-01-012022-12-310000312069bcs:IssuedCapitalAndSharePremiumMember2022-01-012022-12-310000312069bcs:IssuedCapitalAndSharePremiumMember2020-12-310000312069ifrs-full:OtherEquityInterestMember2020-12-310000312069ifrs-full:OtherReservesMember2020-12-310000312069ifrs-full:RetainedEarningsMember2020-12-310000312069ifrs-full:EquityAttributableToOwnersOfParentMember2020-12-310000312069ifrs-full:NoncontrollingInterestsMember2020-12-3100003120692020-12-310000312069ifrs-full:OtherEquityInterestMember2021-01-012021-12-310000312069ifrs-full:RetainedEarningsMember2021-01-012021-12-310000312069ifrs-full:EquityAttributableToOwnersOfParentMember2021-01-012021-12-310000312069ifrs-full:NoncontrollingInterestsMember2021-01-012021-12-310000312069ifrs-full:OtherReservesMember2021-01-012021-12-310000312069bcs:IssuedCapitalAndSharePremiumMember2021-01-012021-12-310000312069srt:ParentCompanyMember2023-01-012023-12-310000312069srt:ParentCompanyMember2022-01-012022-12-310000312069srt:ParentCompanyMember2021-01-012021-12-310000312069srt:ParentCompanyMember2023-12-31bcs:employee0000312069srt:ParentCompanyMember2022-12-310000312069srt:ParentCompanyMember2021-12-310000312069bcs:IssuedCapitalAndSharePremiumMembersrt:ParentCompanyMember2022-12-310000312069ifrs-full:OtherEquityInterestMembersrt:ParentCompanyMember2022-12-310000312069ifrs-full:OtherReservesMembersrt:ParentCompanyMember2022-12-310000312069ifrs-full:RetainedEarningsMembersrt:ParentCompanyMember2022-12-310000312069ifrs-full:OtherEquityInterestMembersrt:ParentCompanyMember2023-01-012023-12-310000312069ifrs-full:RetainedEarningsMembersrt:ParentCompanyMember2023-01-012023-12-310000312069bcs:IssuedCapitalAndSharePremiumMembersrt:ParentCompanyMember2023-01-012023-12-310000312069ifrs-full:OtherReservesMembersrt:ParentCompanyMember2023-01-012023-12-310000312069bcs:IssuedCapitalAndSharePremiumMembersrt:ParentCompanyMember2023-12-310000312069ifrs-full:OtherEquityInterestMembersrt:ParentCompanyMember2023-12-310000312069ifrs-full:OtherReservesMembersrt:ParentCompanyMember2023-12-310000312069ifrs-full:RetainedEarningsMembersrt:ParentCompanyMember2023-12-310000312069bcs:IssuedCapitalAndSharePremiumMembersrt:ParentCompanyMember2021-12-310000312069ifrs-full:OtherEquityInterestMembersrt:ParentCompanyMember2021-12-310000312069ifrs-full:OtherReservesMembersrt:ParentCompanyMember2021-12-310000312069ifrs-full:RetainedEarningsMembersrt:ParentCompanyMember2021-12-310000312069ifrs-full:OtherEquityInterestMembersrt:ParentCompanyMember2022-01-012022-12-310000312069ifrs-full:RetainedEarningsMembersrt:ParentCompanyMember2022-01-012022-12-310000312069bcs:IssuedCapitalAndSharePremiumMembersrt:ParentCompanyMember2022-01-012022-12-310000312069ifrs-full:OtherReservesMembersrt:ParentCompanyMember2022-01-012022-12-310000312069bcs:IssuedCapitalAndSharePremiumMembersrt:ParentCompanyMember2020-12-310000312069ifrs-full:OtherEquityInterestMembersrt:ParentCompanyMember2020-12-310000312069ifrs-full:OtherReservesMembersrt:ParentCompanyMember2020-12-310000312069ifrs-full:RetainedEarningsMembersrt:ParentCompanyMember2020-12-310000312069srt:ParentCompanyMember2020-12-310000312069ifrs-full:OtherEquityInterestMembersrt:ParentCompanyMember2021-01-012021-12-310000312069ifrs-full:RetainedEarningsMembersrt:ParentCompanyMember2021-01-012021-12-310000312069bcs:IssuedCapitalAndSharePremiumMembersrt:ParentCompanyMember2021-01-012021-12-310000312069ifrs-full:OtherReservesMembersrt:ParentCompanyMember2021-01-012021-12-31bcs:segment0000312069bcs:BarclaysUkMemberifrs-full:OperatingSegmentsMember2023-01-012023-12-310000312069bcs:BarclaysInternationalMemberifrs-full:OperatingSegmentsMember2023-01-012023-12-310000312069ifrs-full:UnallocatedAmountsMember2023-01-012023-12-310000312069bcs:BarclaysUkMemberifrs-full:OperatingSegmentsMember2023-12-310000312069bcs:BarclaysInternationalMemberifrs-full:OperatingSegmentsMember2023-12-310000312069ifrs-full:UnallocatedAmountsMember2023-12-310000312069bcs:BarclaysUkMemberifrs-full:OperatingSegmentsMember2022-01-012022-12-310000312069bcs:BarclaysInternationalMemberifrs-full:OperatingSegmentsMember2022-01-012022-12-310000312069ifrs-full:UnallocatedAmountsMember2022-01-012022-12-310000312069bcs:BarclaysUkMemberifrs-full:OperatingSegmentsMember2022-12-310000312069bcs:BarclaysInternationalMemberifrs-full:OperatingSegmentsMember2022-12-310000312069ifrs-full:UnallocatedAmountsMember2022-12-310000312069bcs:BarclaysUkMemberifrs-full:OperatingSegmentsMember2021-01-012021-12-310000312069bcs:BarclaysInternationalMemberifrs-full:OperatingSegmentsMember2021-01-012021-12-310000312069ifrs-full:UnallocatedAmountsMember2021-01-012021-12-310000312069bcs:BarclaysUkMemberifrs-full:OperatingSegmentsMember2021-12-310000312069bcs:BarclaysInternationalMemberifrs-full:OperatingSegmentsMember2021-12-310000312069ifrs-full:UnallocatedAmountsMember2021-12-310000312069bcs:BarclaysUkMember2021-12-310000312069ifrs-full:CountryOfDomicileMember2023-01-012023-12-310000312069ifrs-full:CountryOfDomicileMember2022-01-012022-12-310000312069ifrs-full:CountryOfDomicileMember2021-01-012021-12-310000312069srt:EuropeMember2023-01-012023-12-310000312069srt:EuropeMember2022-01-012022-12-310000312069srt:EuropeMember2021-01-012021-12-310000312069srt:AmericasMember2023-01-012023-12-310000312069srt:AmericasMember2022-01-012022-12-310000312069srt:AmericasMember2021-01-012021-12-310000312069bcs:AfricaAndMiddleEastMember2023-01-012023-12-310000312069bcs:AfricaAndMiddleEastMember2022-01-012022-12-310000312069bcs:AfricaAndMiddleEastMember2021-01-012021-12-310000312069srt:AsiaMember2023-01-012023-12-310000312069srt:AsiaMember2022-01-012022-12-310000312069srt:AsiaMember2021-01-012021-12-310000312069country:US2023-01-012023-12-310000312069country:US2022-01-012022-12-310000312069country:US2021-01-012021-12-310000312069bcs:BarclaysUkMemberbcs:TransactionalBankingServicesMemberifrs-full:OperatingSegmentsMember2023-01-012023-12-310000312069bcs:BarclaysInternationalMemberbcs:TransactionalBankingServicesMemberifrs-full:OperatingSegmentsMember2023-01-012023-12-310000312069ifrs-full:UnallocatedAmountsMemberbcs:TransactionalBankingServicesMember2023-01-012023-12-310000312069bcs:TransactionalBankingServicesMember2023-01-012023-12-310000312069bcs:ManagementAndAdvisoryServicesMemberbcs:BarclaysUkMemberifrs-full:OperatingSegmentsMember2023-01-012023-12-310000312069bcs:ManagementAndAdvisoryServicesMemberbcs:BarclaysInternationalMemberifrs-full:OperatingSegmentsMember2023-01-012023-12-310000312069bcs:ManagementAndAdvisoryServicesMemberifrs-full:UnallocatedAmountsMember2023-01-012023-12-310000312069bcs:ManagementAndAdvisoryServicesMember2023-01-012023-12-310000312069bcs:BarclaysUkMemberbcs:BrokerageCommissionsAndClientExecutionFeesMemberifrs-full:OperatingSegmentsMember2023-01-012023-12-310000312069bcs:BarclaysInternationalMemberbcs:BrokerageCommissionsAndClientExecutionFeesMemberifrs-full:OperatingSegmentsMember2023-01-012023-12-310000312069bcs:BrokerageCommissionsAndClientExecutionFeesMemberifrs-full:UnallocatedAmountsMember2023-01-012023-12-310000312069bcs:BrokerageCommissionsAndClientExecutionFeesMember2023-01-012023-12-310000312069bcs:UnderwritingSyndicationAndCommitmentFeesMemberbcs:BarclaysUkMemberifrs-full:OperatingSegmentsMember2023-01-012023-12-310000312069bcs:UnderwritingSyndicationAndCommitmentFeesMemberbcs:BarclaysInternationalMemberifrs-full:OperatingSegmentsMember2023-01-012023-12-310000312069bcs:UnderwritingSyndicationAndCommitmentFeesMemberifrs-full:UnallocatedAmountsMember2023-01-012023-12-310000312069bcs:UnderwritingSyndicationAndCommitmentFeesMember2023-01-012023-12-310000312069bcs:BarclaysUkMemberbcs:OtherFeesMemberifrs-full:OperatingSegmentsMember2023-01-012023-12-310000312069bcs:BarclaysInternationalMemberbcs:OtherFeesMemberifrs-full:OperatingSegmentsMember2023-01-012023-12-310000312069ifrs-full:UnallocatedAmountsMemberbcs:OtherFeesMember2023-01-012023-12-310000312069bcs:OtherFeesMember2023-01-012023-12-310000312069bcs:BarclaysUkMemberbcs:TransactionalBankingServicesMemberifrs-full:OperatingSegmentsMember2022-01-012022-12-310000312069bcs:BarclaysInternationalMemberbcs:TransactionalBankingServicesMemberifrs-full:OperatingSegmentsMember2022-01-012022-12-310000312069ifrs-full:UnallocatedAmountsMemberbcs:TransactionalBankingServicesMember2022-01-012022-12-310000312069bcs:TransactionalBankingServicesMember2022-01-012022-12-310000312069bcs:ManagementAndAdvisoryServicesMemberbcs:BarclaysUkMemberifrs-full:OperatingSegmentsMember2022-01-012022-12-310000312069bcs:ManagementAndAdvisoryServicesMemberbcs:BarclaysInternationalMemberifrs-full:OperatingSegmentsMember2022-01-012022-12-310000312069bcs:ManagementAndAdvisoryServicesMemberifrs-full:UnallocatedAmountsMember2022-01-012022-12-310000312069bcs:ManagementAndAdvisoryServicesMember2022-01-012022-12-310000312069bcs:BarclaysUkMemberbcs:BrokerageCommissionsAndClientExecutionFeesMemberifrs-full:OperatingSegmentsMember2022-01-012022-12-310000312069bcs:BarclaysInternationalMemberbcs:BrokerageCommissionsAndClientExecutionFeesMemberifrs-full:OperatingSegmentsMember2022-01-012022-12-310000312069bcs:BrokerageCommissionsAndClientExecutionFeesMemberifrs-full:UnallocatedAmountsMember2022-01-012022-12-310000312069bcs:BrokerageCommissionsAndClientExecutionFeesMember2022-01-012022-12-310000312069bcs:UnderwritingSyndicationAndCommitmentFeesMemberbcs:BarclaysUkMemberifrs-full:OperatingSegmentsMember2022-01-012022-12-310000312069bcs:UnderwritingSyndicationAndCommitmentFeesMemberbcs:BarclaysInternationalMemberifrs-full:OperatingSegmentsMember2022-01-012022-12-310000312069bcs:UnderwritingSyndicationAndCommitmentFeesMemberifrs-full:UnallocatedAmountsMember2022-01-012022-12-310000312069bcs:UnderwritingSyndicationAndCommitmentFeesMember2022-01-012022-12-310000312069bcs:BarclaysUkMemberbcs:OtherFeesMemberifrs-full:OperatingSegmentsMember2022-01-012022-12-310000312069bcs:BarclaysInternationalMemberbcs:OtherFeesMemberifrs-full:OperatingSegmentsMember2022-01-012022-12-310000312069ifrs-full:UnallocatedAmountsMemberbcs:OtherFeesMember2022-01-012022-12-310000312069bcs:OtherFeesMember2022-01-012022-12-310000312069bcs:BarclaysUkMemberbcs:TransactionalBankingServicesMemberifrs-full:OperatingSegmentsMember2021-01-012021-12-310000312069bcs:BarclaysInternationalMemberbcs:TransactionalBankingServicesMemberifrs-full:OperatingSegmentsMember2021-01-012021-12-310000312069ifrs-full:UnallocatedAmountsMemberbcs:TransactionalBankingServicesMember2021-01-012021-12-310000312069bcs:TransactionalBankingServicesMember2021-01-012021-12-310000312069bcs:ManagementAndAdvisoryServicesMemberbcs:BarclaysUkMemberifrs-full:OperatingSegmentsMember2021-01-012021-12-310000312069bcs:ManagementAndAdvisoryServicesMemberbcs:BarclaysInternationalMemberifrs-full:OperatingSegmentsMember2021-01-012021-12-310000312069bcs:ManagementAndAdvisoryServicesMemberifrs-full:UnallocatedAmountsMember2021-01-012021-12-310000312069bcs:ManagementAndAdvisoryServicesMember2021-01-012021-12-310000312069bcs:BarclaysUkMemberbcs:BrokerageCommissionsAndClientExecutionFeesMemberifrs-full:OperatingSegmentsMember2021-01-012021-12-310000312069bcs:BarclaysInternationalMemberbcs:BrokerageCommissionsAndClientExecutionFeesMemberifrs-full:OperatingSegmentsMember2021-01-012021-12-310000312069bcs:BrokerageCommissionsAndClientExecutionFeesMemberifrs-full:UnallocatedAmountsMember2021-01-012021-12-310000312069bcs:BrokerageCommissionsAndClientExecutionFeesMember2021-01-012021-12-310000312069bcs:UnderwritingSyndicationAndCommitmentFeesMemberbcs:BarclaysUkMemberifrs-full:OperatingSegmentsMember2021-01-012021-12-310000312069bcs:UnderwritingSyndicationAndCommitmentFeesMemberbcs:BarclaysInternationalMemberifrs-full:OperatingSegmentsMember2021-01-012021-12-310000312069bcs:UnderwritingSyndicationAndCommitmentFeesMemberifrs-full:UnallocatedAmountsMember2021-01-012021-12-310000312069bcs:UnderwritingSyndicationAndCommitmentFeesMember2021-01-012021-12-310000312069bcs:BarclaysUkMemberbcs:OtherFeesMemberifrs-full:OperatingSegmentsMember2021-01-012021-12-310000312069bcs:BarclaysInternationalMemberbcs:OtherFeesMemberifrs-full:OperatingSegmentsMember2021-01-012021-12-310000312069ifrs-full:UnallocatedAmountsMemberbcs:OtherFeesMember2021-01-012021-12-310000312069bcs:OtherFeesMember2021-01-012021-12-310000312069ifrs-full:FinancialAssetsAtFairValueThroughProfitOrLossClassifiedAsHeldForTradingCategoryMemberifrs-full:FinancialLiabilitiesAtFairValueThroughProfitOrLossThatMeetDefinitionOfHeldForTradingCategoryMember2023-01-012023-12-310000312069ifrs-full:FinancialAssetsAtFairValueThroughProfitOrLossClassifiedAsHeldForTradingCategoryMemberifrs-full:FinancialLiabilitiesAtFairValueThroughProfitOrLossThatMeetDefinitionOfHeldForTradingCategoryMember2022-01-012022-12-310000312069ifrs-full:FinancialAssetsAtFairValueThroughProfitOrLossClassifiedAsHeldForTradingCategoryMemberifrs-full:FinancialLiabilitiesAtFairValueThroughProfitOrLossThatMeetDefinitionOfHeldForTradingCategoryMember2021-01-012021-12-310000312069ifrs-full:FinancialAssetsAtFairValueThroughProfitOrLossDesignatedUponInitialRecognitionCategoryMemberifrs-full:FinancialLiabilitiesAtFairValueThroughProfitOrLossDesignatedUponInitialRecognitionCategoryMember2023-01-012023-12-310000312069ifrs-full:FinancialAssetsAtFairValueThroughProfitOrLossDesignatedUponInitialRecognitionCategoryMemberifrs-full:FinancialLiabilitiesAtFairValueThroughProfitOrLossDesignatedUponInitialRecognitionCategoryMember2022-01-012022-12-310000312069ifrs-full:FinancialAssetsAtFairValueThroughProfitOrLossDesignatedUponInitialRecognitionCategoryMemberifrs-full:FinancialLiabilitiesAtFairValueThroughProfitOrLossDesignatedUponInitialRecognitionCategoryMember2021-01-012021-12-310000312069ifrs-full:FinancialAssetsAtFairValueThroughProfitOrLossMandatorilyMeasuredAtFairValueCategoryMember2023-01-012023-12-310000312069ifrs-full:FinancialAssetsAtFairValueThroughProfitOrLossMandatorilyMeasuredAtFairValueCategoryMember2022-01-012022-12-310000312069ifrs-full:FinancialAssetsAtFairValueThroughProfitOrLossMandatorilyMeasuredAtFairValueCategoryMember2021-01-012021-12-310000312069bcs:AbsaGroupLimitedMember2022-04-012022-09-3000003120692023-10-012023-12-310000312069bcs:WholesalePortfoliosMember2023-01-012023-12-310000312069ifrs-full:BottomOfRangeMemberbcs:WholesalePortfoliosMember2023-01-012023-12-310000312069srt:MinimumMemberifrs-full:BottomOfRangeMemberbcs:RetailPortfoliosMember2023-01-012023-12-310000312069srt:MaximumMemberifrs-full:BottomOfRangeMemberbcs:RetailPortfoliosMember2023-01-012023-12-310000312069ifrs-full:TopOfRangeMemberbcs:RetailPortfoliosMember2023-01-012023-12-310000312069ifrs-full:FinancialAssetsAtAmortisedCostMemberifrs-full:LoansAndReceivablesCategoryMember2023-01-012023-12-310000312069ifrs-full:FinancialAssetsAtAmortisedCostMemberifrs-full:LoansAndReceivablesCategoryMember2022-01-012022-12-310000312069ifrs-full:FinancialAssetsAtAmortisedCostMemberifrs-full:LoansAndReceivablesCategoryMember2021-01-012021-12-310000312069bcs:OffBalanceSheetLoanCommitmentsAndFinancialGuaranteeContractsMember2023-01-012023-12-310000312069bcs:OffBalanceSheetLoanCommitmentsAndFinancialGuaranteeContractsMember2022-01-012022-12-310000312069bcs:OffBalanceSheetLoanCommitmentsAndFinancialGuaranteeContractsMember2021-01-012021-12-310000312069ifrs-full:LoansAndReceivablesCategoryMember2021-01-012021-12-310000312069ifrs-full:TradeReceivablesMember2023-01-012023-12-310000312069ifrs-full:TradeReceivablesMember2022-01-012022-12-310000312069ifrs-full:TradeReceivablesMember2021-01-012021-12-310000312069ifrs-full:FinancialAssetsMeasuredAtFairValueThroughOtherComprehensiveIncomeCategoryMember2023-01-012023-12-310000312069ifrs-full:FinancialAssetsMeasuredAtFairValueThroughOtherComprehensiveIncomeCategoryMember2022-01-012022-12-310000312069ifrs-full:FinancialAssetsMeasuredAtFairValueThroughOtherComprehensiveIncomeCategoryMember2021-01-012021-12-310000312069bcs:OtherFinancialAssetsMemberifrs-full:FinancialAssetsAtAmortisedCostMember2023-01-012023-12-310000312069bcs:OtherFinancialAssetsMemberifrs-full:FinancialAssetsAtAmortisedCostMember2022-01-012022-12-310000312069bcs:OtherFinancialAssetsMemberifrs-full:FinancialAssetsAtAmortisedCostMember2021-01-012021-12-310000312069ifrs-full:FinancialGuaranteeContractsMemberbcs:ThirdPartiesMember2023-01-012023-12-310000312069ifrs-full:FinancialGuaranteeContractsMemberbcs:ThirdPartiesMember2022-01-012022-12-310000312069ifrs-full:FinancialGuaranteeContractsMemberbcs:ThirdPartiesMember2021-01-012021-12-310000312069bcs:GermanConsumerFinancePortfolioMemberifrs-full:AssetsAndLiabilitiesClassifiedAsHeldForSaleMember2023-01-012023-12-310000312069ifrs-full:WeightedAverageMember2023-01-012023-12-310000312069ifrs-full:WeightedAverageMember2022-01-012022-12-310000312069ifrs-full:WeightedAverageMember2021-01-012021-12-310000312069bcs:HMRevenueAndCustomsHMRCAssessmentsConcerningUKCorporationTaxMemberifrs-full:LegalProceedingsProvisionMember2023-01-012023-12-310000312069bcs:HMRevenueAndCustomsHMRCAssessmentsConcerningUKCorporationTaxMemberifrs-full:LegalProceedingsProvisionMember2023-12-310000312069bcs:USIntermediateHoldingCompanyTaxGroupMember2023-12-310000312069bcs:USIntermediateHoldingCompanyTaxGroupMember2022-12-310000312069bcs:UnitedStatesBranchTaxGroupMemberMember2023-12-310000312069bcs:UnitedStatesBranchTaxGroupMemberMember2022-12-310000312069bcs:OtherSubsidiariesMember2023-12-310000312069bcs:OtherSubsidiariesMember2022-12-310000312069bcs:USIntermediateHoldingCompanyTaxGroupMemberifrs-full:UnusedTaxLossesMember2023-12-310000312069bcs:USIntermediateHoldingCompanyTaxGroupMemberifrs-full:UnusedTaxLossesMember2022-12-310000312069bcs:LossInCurrentOrPriorYearMemberbcs:USIntermediateHoldingCompanyTaxGroupMember2023-12-310000312069bcs:LossInCurrentOrPriorYearMemberbcs:USIntermediateHoldingCompanyTaxGroupMember2022-12-310000312069bcs:LossInCurrentOrPriorYearExpectedToExpireMemberbcs:USIntermediateHoldingCompanyTaxGroupMember2023-12-310000312069ifrs-full:UnusedTaxLossesMembersrt:ParentCompanyMember2023-12-310000312069ifrs-full:UnusedTaxLossesMembersrt:ParentCompanyMember2022-12-310000312069ifrs-full:UnusedTaxLossesMemberbcs:OtherSubsidiariesMember2023-12-310000312069ifrs-full:UnusedTaxLossesMemberbcs:OtherSubsidiariesMember2022-12-310000312069bcs:LossInCurrentOrPriorYearMemberbcs:OtherSubsidiariesMember2023-12-310000312069bcs:LossInCurrentOrPriorYearMemberbcs:OtherSubsidiariesMember2022-12-310000312069bcs:FixedAssetTimingDifferencesMember2022-12-310000312069ifrs-full:FinancialAssetsAtFairValueThroughOtherComprehensiveIncomeCategoryMember2022-12-310000312069ifrs-full:CashFlowHedgesMember2022-12-310000312069ifrs-full:PresentValueOfDefinedBenefitObligationMember2022-12-310000312069ifrs-full:AllowanceForCreditLossesMember2022-12-310000312069bcs:OwnCreditMember2022-12-310000312069bcs:ShareBasedCompensationAndDeferredCompensationMember2022-12-310000312069ifrs-full:OtherTemporaryDifferencesMember2022-12-310000312069ifrs-full:UnusedTaxLossesMember2022-12-310000312069bcs:FixedAssetTimingDifferencesMember2023-01-012023-12-310000312069ifrs-full:FinancialAssetsAtFairValueThroughOtherComprehensiveIncomeCategoryMember2023-01-012023-12-310000312069ifrs-full:CashFlowHedgesMember2023-01-012023-12-310000312069ifrs-full:PresentValueOfDefinedBenefitObligationMember2023-01-012023-12-310000312069ifrs-full:AllowanceForCreditLossesMember2023-01-012023-12-310000312069bcs:OwnCreditMember2023-01-012023-12-310000312069bcs:ShareBasedCompensationAndDeferredCompensationMember2023-01-012023-12-310000312069ifrs-full:OtherTemporaryDifferencesMember2023-01-012023-12-310000312069ifrs-full:UnusedTaxLossesMember2023-01-012023-12-310000312069bcs:FixedAssetTimingDifferencesMember2023-12-310000312069ifrs-full:FinancialAssetsAtFairValueThroughOtherComprehensiveIncomeCategoryMember2023-12-310000312069ifrs-full:CashFlowHedgesMember2023-12-310000312069ifrs-full:PresentValueOfDefinedBenefitObligationMember2023-12-310000312069ifrs-full:AllowanceForCreditLossesMember2023-12-310000312069bcs:OwnCreditMember2023-12-310000312069bcs:ShareBasedCompensationAndDeferredCompensationMember2023-12-310000312069ifrs-full:OtherTemporaryDifferencesMember2023-12-310000312069ifrs-full:UnusedTaxLossesMember2023-12-310000312069bcs:FixedAssetTimingDifferencesMember2021-12-310000312069ifrs-full:FinancialAssetsAtFairValueThroughOtherComprehensiveIncomeCategoryMember2021-12-310000312069ifrs-full:CashFlowHedgesMember2021-12-310000312069ifrs-full:PresentValueOfDefinedBenefitObligationMember2021-12-310000312069ifrs-full:AllowanceForCreditLossesMember2021-12-310000312069bcs:OwnCreditMember2021-12-310000312069bcs:ShareBasedCompensationAndDeferredCompensationMember2021-12-310000312069ifrs-full:OtherTemporaryDifferencesMember2021-12-310000312069ifrs-full:UnusedTaxLossesMember2021-12-310000312069bcs:FixedAssetTimingDifferencesMember2022-01-012022-12-310000312069ifrs-full:FinancialAssetsAtFairValueThroughOtherComprehensiveIncomeCategoryMember2022-01-012022-12-310000312069ifrs-full:CashFlowHedgesMember2022-01-012022-12-310000312069ifrs-full:PresentValueOfDefinedBenefitObligationMember2022-01-012022-12-310000312069ifrs-full:AllowanceForCreditLossesMember2022-01-012022-12-310000312069bcs:OwnCreditMember2022-01-012022-12-310000312069bcs:ShareBasedCompensationAndDeferredCompensationMember2022-01-012022-12-310000312069ifrs-full:OtherTemporaryDifferencesMember2022-01-012022-12-310000312069ifrs-full:UnusedTaxLossesMember2022-01-012022-12-310000312069ifrs-full:LaterThanOneYearMember2023-12-310000312069ifrs-full:LaterThanOneYearMember2022-12-310000312069ifrs-full:TemporaryDifferenceMember2023-12-310000312069ifrs-full:TemporaryDifferenceMember2022-12-310000312069bcs:CapitalLossesMember2023-12-310000312069bcs:CapitalLossesMember2022-12-310000312069bcs:WithinFiveYearsMember2023-12-310000312069bcs:WithinFiveYearsMember2022-12-310000312069bcs:WithinSixToTenYearsMember2023-12-310000312069bcs:WithinSixToTenYearsMember2022-12-310000312069bcs:WithinElevenToTwentyYearsMember2023-12-310000312069bcs:WithinElevenToTwentyYearsMember2022-12-310000312069bcs:IndefinitelyMember2023-12-310000312069bcs:IndefinitelyMember2022-12-310000312069bcs:EmployeeShareSchemesAndScripDividendProgrammeMember2023-01-012023-12-310000312069bcs:EmployeeShareSchemesAndScripDividendProgrammeMember2022-01-012022-12-310000312069bcs:EmployeeShareSchemesAndScripDividendProgrammeMember2021-01-012021-12-310000312069ifrs-full:BottomOfRangeMember2023-01-012023-12-310000312069ifrs-full:TopOfRangeMember2023-01-012023-12-310000312069bcs:AntiDilutiveMember2023-01-012023-12-310000312069bcs:AntiDilutiveMember2022-01-012022-12-310000312069bcs:AntiDilutiveMember2021-01-012021-12-310000312069ifrs-full:WeightedAverageMemberbcs:EmployeeShareSchemesAndScripDividendProgrammeMember2023-01-012023-12-310000312069ifrs-full:WeightedAverageMemberbcs:EmployeeShareSchemesAndScripDividendProgrammeMember2022-01-012022-12-310000312069ifrs-full:WeightedAverageMemberbcs:EmployeeShareSchemesAndScripDividendProgrammeMember2021-01-012021-12-310000312069ifrs-full:OrdinarySharesMember2023-01-012023-12-310000312069ifrs-full:OrdinarySharesMember2023-12-310000312069ifrs-full:PotentialOrdinaryShareTransactionsMember2023-01-012023-12-3100003120692023-04-012023-06-3000003120692022-04-012022-06-3000003120692021-04-012021-06-3000003120692020-01-012020-12-31bcs:shareBuyback0000312069ifrs-full:OrdinarySharesMember2022-01-012022-12-310000312069ifrs-full:OrdinarySharesMember2021-01-012021-12-310000312069ifrs-full:DebtSecuritiesMember2023-12-310000312069ifrs-full:DebtSecuritiesMember2022-12-310000312069ifrs-full:TradingEquitySecuritiesMember2023-12-310000312069ifrs-full:TradingEquitySecuritiesMember2022-12-310000312069bcs:TradedLoansMember2023-12-310000312069bcs:TradedLoansMember2022-12-310000312069bcs:CommoditiesMember2023-12-310000312069bcs:CommoditiesMember2022-12-310000312069ifrs-full:FinancialAssetsAtFairValueThroughProfitOrLossDesignatedUponInitialRecognitionCategoryMember2023-12-310000312069ifrs-full:FinancialAssetsAtFairValueThroughProfitOrLossDesignatedUponInitialRecognitionCategoryMember2022-12-310000312069ifrs-full:FinancialAssetsAtFairValueThroughProfitOrLossMandatorilyMeasuredAtFairValueCategoryMember2023-12-310000312069ifrs-full:FinancialAssetsAtFairValueThroughProfitOrLossMandatorilyMeasuredAtFairValueCategoryMember2022-12-310000312069ifrs-full:FinancialAssetsAtFairValueThroughProfitOrLossCategoryMember2023-12-310000312069ifrs-full:FinancialAssetsAtFairValueThroughProfitOrLossCategoryMember2022-12-310000312069ifrs-full:CreditRiskMemberifrs-full:DerivativesMember2023-01-012023-12-310000312069ifrs-full:CreditRiskMemberifrs-full:DerivativesMember2022-01-012022-12-310000312069bcs:HeldForTradingMemberifrs-full:DerivativesMember2023-12-310000312069bcs:HeldForTradingMemberifrs-full:AtFairValueMember2023-12-310000312069bcs:HeldForTradingMemberifrs-full:DerivativesMember2022-12-310000312069bcs:HeldForTradingMemberifrs-full:AtFairValueMember2022-12-310000312069bcs:HeldForRiskManagementMemberifrs-full:DerivativesMember2023-12-310000312069bcs:HeldForRiskManagementMemberifrs-full:AtFairValueMember2023-12-310000312069bcs:HeldForRiskManagementMemberifrs-full:DerivativesMember2022-12-310000312069bcs:HeldForRiskManagementMemberifrs-full:AtFairValueMember2022-12-310000312069ifrs-full:AtFairValueMember2023-12-310000312069ifrs-full:AtFairValueMember2022-12-310000312069bcs:OTCDerivativesMemberifrs-full:CurrencyRiskMemberbcs:HeldForTradingMemberifrs-full:DerivativesMember2023-12-310000312069bcs:OTCDerivativesMemberifrs-full:CurrencyRiskMemberbcs:HeldForTradingMemberifrs-full:AtFairValueMember2023-12-310000312069bcs:OTCDerivativesMemberifrs-full:CurrencyRiskMemberbcs:HeldForTradingMemberifrs-full:DerivativesMember2022-12-310000312069bcs:OTCDerivativesMemberifrs-full:CurrencyRiskMemberbcs:HeldForTradingMemberifrs-full:AtFairValueMember2022-12-310000312069bcs:ClearedByCentralCounterpartyMemberifrs-full:CurrencyRiskMemberbcs:HeldForTradingMemberifrs-full:DerivativesMember2023-12-310000312069bcs:ClearedByCentralCounterpartyMemberifrs-full:CurrencyRiskMemberbcs:HeldForTradingMemberifrs-full:AtFairValueMember2023-12-310000312069bcs:ClearedByCentralCounterpartyMemberifrs-full:CurrencyRiskMemberbcs:HeldForTradingMemberifrs-full:DerivativesMember2022-12-310000312069bcs:ClearedByCentralCounterpartyMemberifrs-full:CurrencyRiskMemberbcs:HeldForTradingMemberifrs-full:AtFairValueMember2022-12-310000312069ifrs-full:CurrencyRiskMemberbcs:HeldForTradingMemberbcs:ExchangeTradedDerivativesMemberifrs-full:DerivativesMember2023-12-310000312069ifrs-full:CurrencyRiskMemberbcs:HeldForTradingMemberbcs:ExchangeTradedDerivativesMemberifrs-full:AtFairValueMember2023-12-310000312069ifrs-full:CurrencyRiskMemberbcs:HeldForTradingMemberbcs:ExchangeTradedDerivativesMemberifrs-full:DerivativesMember2022-12-310000312069ifrs-full:CurrencyRiskMemberbcs:HeldForTradingMemberbcs:ExchangeTradedDerivativesMemberifrs-full:AtFairValueMember2022-12-310000312069ifrs-full:CurrencyRiskMemberbcs:HeldForTradingMemberifrs-full:DerivativesMember2023-12-310000312069ifrs-full:CurrencyRiskMemberbcs:HeldForTradingMemberifrs-full:AtFairValueMember2023-12-310000312069ifrs-full:CurrencyRiskMemberbcs:HeldForTradingMemberifrs-full:DerivativesMember2022-12-310000312069ifrs-full:CurrencyRiskMemberbcs:HeldForTradingMemberifrs-full:AtFairValueMember2022-12-310000312069bcs:OTCDerivativesMemberbcs:HeldForTradingMemberifrs-full:DerivativesMemberifrs-full:InterestRateRiskMember2023-12-310000312069bcs:OTCDerivativesMemberbcs:HeldForTradingMemberifrs-full:AtFairValueMemberifrs-full:InterestRateRiskMember2023-12-310000312069bcs:OTCDerivativesMemberbcs:HeldForTradingMemberifrs-full:DerivativesMemberifrs-full:InterestRateRiskMember2022-12-310000312069bcs:OTCDerivativesMemberbcs:HeldForTradingMemberifrs-full:AtFairValueMemberifrs-full:InterestRateRiskMember2022-12-310000312069bcs:ClearedByCentralCounterpartyMemberbcs:HeldForTradingMemberifrs-full:DerivativesMemberifrs-full:InterestRateRiskMember2023-12-310000312069bcs:ClearedByCentralCounterpartyMemberbcs:HeldForTradingMemberifrs-full:AtFairValueMemberifrs-full:InterestRateRiskMember2023-12-310000312069bcs:ClearedByCentralCounterpartyMemberbcs:HeldForTradingMemberifrs-full:DerivativesMemberifrs-full:InterestRateRiskMember2022-12-310000312069bcs:ClearedByCentralCounterpartyMemberbcs:HeldForTradingMemberifrs-full:AtFairValueMemberifrs-full:InterestRateRiskMember2022-12-310000312069bcs:HeldForTradingMemberbcs:ExchangeTradedDerivativesMemberifrs-full:DerivativesMemberifrs-full:InterestRateRiskMember2023-12-310000312069bcs:HeldForTradingMemberbcs:ExchangeTradedDerivativesMemberifrs-full:AtFairValueMemberifrs-full:InterestRateRiskMember2023-12-310000312069bcs:HeldForTradingMemberbcs:ExchangeTradedDerivativesMemberifrs-full:DerivativesMemberifrs-full:InterestRateRiskMember2022-12-310000312069bcs:HeldForTradingMemberbcs:ExchangeTradedDerivativesMemberifrs-full:AtFairValueMemberifrs-full:InterestRateRiskMember2022-12-310000312069bcs:HeldForTradingMemberifrs-full:DerivativesMemberifrs-full:InterestRateRiskMember2023-12-310000312069bcs:HeldForTradingMemberifrs-full:AtFairValueMemberifrs-full:InterestRateRiskMember2023-12-310000312069bcs:HeldForTradingMemberifrs-full:DerivativesMemberifrs-full:InterestRateRiskMember2022-12-310000312069bcs:HeldForTradingMemberifrs-full:AtFairValueMemberifrs-full:InterestRateRiskMember2022-12-310000312069bcs:OTCDerivativesMemberbcs:HeldForTradingMemberifrs-full:CreditRiskMemberifrs-full:DerivativesMember2023-12-310000312069bcs:OTCDerivativesMemberbcs:HeldForTradingMemberifrs-full:AtFairValueMemberifrs-full:CreditRiskMember2023-12-310000312069bcs:OTCDerivativesMemberbcs:HeldForTradingMemberifrs-full:CreditRiskMemberifrs-full:DerivativesMember2022-12-310000312069bcs:OTCDerivativesMemberbcs:HeldForTradingMemberifrs-full:AtFairValueMemberifrs-full:CreditRiskMember2022-12-310000312069bcs:ClearedByCentralCounterpartyMemberbcs:HeldForTradingMemberifrs-full:CreditRiskMemberifrs-full:DerivativesMember2023-12-310000312069bcs:ClearedByCentralCounterpartyMemberbcs:HeldForTradingMemberifrs-full:AtFairValueMemberifrs-full:CreditRiskMember2023-12-310000312069bcs:ClearedByCentralCounterpartyMemberbcs:HeldForTradingMemberifrs-full:CreditRiskMemberifrs-full:DerivativesMember2022-12-310000312069bcs:ClearedByCentralCounterpartyMemberbcs:HeldForTradingMemberifrs-full:AtFairValueMemberifrs-full:CreditRiskMember2022-12-310000312069bcs:HeldForTradingMemberifrs-full:CreditRiskMemberifrs-full:DerivativesMember2023-12-310000312069bcs:HeldForTradingMemberifrs-full:AtFairValueMemberifrs-full:CreditRiskMember2023-12-310000312069bcs:HeldForTradingMemberifrs-full:CreditRiskMemberifrs-full:DerivativesMember2022-12-310000312069bcs:HeldForTradingMemberifrs-full:AtFairValueMemberifrs-full:CreditRiskMember2022-12-310000312069bcs:OTCDerivativesMemberbcs:HeldForTradingMemberifrs-full:EquityPriceRiskMemberifrs-full:DerivativesMember2023-12-310000312069bcs:OTCDerivativesMemberbcs:HeldForTradingMemberifrs-full:EquityPriceRiskMemberifrs-full:AtFairValueMember2023-12-310000312069bcs:OTCDerivativesMemberbcs:HeldForTradingMemberifrs-full:EquityPriceRiskMemberifrs-full:DerivativesMember2022-12-310000312069bcs:OTCDerivativesMemberbcs:HeldForTradingMemberifrs-full:EquityPriceRiskMemberifrs-full:AtFairValueMember2022-12-310000312069bcs:HeldForTradingMemberbcs:ExchangeTradedDerivativesMemberifrs-full:EquityPriceRiskMemberifrs-full:DerivativesMember2023-12-310000312069bcs:HeldForTradingMemberbcs:ExchangeTradedDerivativesMemberifrs-full:EquityPriceRiskMemberifrs-full:AtFairValueMember2023-12-310000312069bcs:HeldForTradingMemberbcs:ExchangeTradedDerivativesMemberifrs-full:EquityPriceRiskMemberifrs-full:DerivativesMember2022-12-310000312069bcs:HeldForTradingMemberbcs:ExchangeTradedDerivativesMemberifrs-full:EquityPriceRiskMemberifrs-full:AtFairValueMember2022-12-310000312069bcs:HeldForTradingMemberifrs-full:EquityPriceRiskMemberifrs-full:DerivativesMember2023-12-310000312069bcs:HeldForTradingMemberifrs-full:EquityPriceRiskMemberifrs-full:AtFairValueMember2023-12-310000312069bcs:HeldForTradingMemberifrs-full:EquityPriceRiskMemberifrs-full:DerivativesMember2022-12-310000312069bcs:HeldForTradingMemberifrs-full:EquityPriceRiskMemberifrs-full:AtFairValueMember2022-12-310000312069bcs:OTCDerivativesMemberbcs:HeldForTradingMemberifrs-full:CommodityPriceRiskMemberifrs-full:DerivativesMember2023-12-310000312069bcs:OTCDerivativesMemberbcs:HeldForTradingMemberifrs-full:CommodityPriceRiskMemberifrs-full:AtFairValueMember2023-12-310000312069bcs:OTCDerivativesMemberbcs:HeldForTradingMemberifrs-full:CommodityPriceRiskMemberifrs-full:DerivativesMember2022-12-310000312069bcs:OTCDerivativesMemberbcs:HeldForTradingMemberifrs-full:CommodityPriceRiskMemberifrs-full:AtFairValueMember2022-12-310000312069bcs:HeldForTradingMemberifrs-full:CommodityPriceRiskMemberbcs:ExchangeTradedDerivativesMemberifrs-full:DerivativesMember2023-12-310000312069bcs:HeldForTradingMemberifrs-full:CommodityPriceRiskMemberbcs:ExchangeTradedDerivativesMemberifrs-full:AtFairValueMember2023-12-310000312069bcs:HeldForTradingMemberifrs-full:CommodityPriceRiskMemberbcs:ExchangeTradedDerivativesMemberifrs-full:DerivativesMember2022-12-310000312069bcs:HeldForTradingMemberifrs-full:CommodityPriceRiskMemberbcs:ExchangeTradedDerivativesMemberifrs-full:AtFairValueMember2022-12-310000312069bcs:HeldForTradingMemberifrs-full:CommodityPriceRiskMemberifrs-full:DerivativesMember2023-12-310000312069bcs:HeldForTradingMemberifrs-full:CommodityPriceRiskMemberifrs-full:AtFairValueMember2023-12-310000312069bcs:HeldForTradingMemberifrs-full:CommodityPriceRiskMemberifrs-full:DerivativesMember2022-12-310000312069bcs:HeldForTradingMemberifrs-full:CommodityPriceRiskMemberifrs-full:AtFairValueMember2022-12-310000312069bcs:OTCDerivativesMemberbcs:HeldForTradingMemberifrs-full:DerivativesMember2023-12-310000312069bcs:OTCDerivativesMemberbcs:HeldForTradingMemberifrs-full:AtFairValueMember2023-12-310000312069bcs:OTCDerivativesMemberbcs:HeldForTradingMemberifrs-full:DerivativesMember2022-12-310000312069bcs:OTCDerivativesMemberbcs:HeldForTradingMemberifrs-full:AtFairValueMember2022-12-310000312069bcs:ClearedByCentralCounterpartyMemberbcs:HeldForTradingMemberifrs-full:DerivativesMember2023-12-310000312069bcs:ClearedByCentralCounterpartyMemberbcs:HeldForTradingMemberifrs-full:AtFairValueMember2023-12-310000312069bcs:ClearedByCentralCounterpartyMemberbcs:HeldForTradingMemberifrs-full:DerivativesMember2022-12-310000312069bcs:ClearedByCentralCounterpartyMemberbcs:HeldForTradingMemberifrs-full:AtFairValueMember2022-12-310000312069bcs:HeldForTradingMemberbcs:ExchangeTradedDerivativesMemberifrs-full:DerivativesMember2023-12-310000312069bcs:HeldForTradingMemberbcs:ExchangeTradedDerivativesMemberifrs-full:AtFairValueMember2023-12-310000312069bcs:HeldForTradingMemberbcs:ExchangeTradedDerivativesMemberifrs-full:DerivativesMember2022-12-310000312069bcs:HeldForTradingMemberbcs:ExchangeTradedDerivativesMemberifrs-full:AtFairValueMember2022-12-310000312069bcs:OTCDerivativesMemberifrs-full:CurrencyRiskMemberifrs-full:CashFlowHedgesMemberbcs:HeldForRiskManagementMemberifrs-full:DerivativesMember2023-12-310000312069bcs:OTCDerivativesMemberifrs-full:CurrencyRiskMemberifrs-full:CashFlowHedgesMemberbcs:HeldForRiskManagementMemberifrs-full:AtFairValueMember2023-12-310000312069bcs:OTCDerivativesMemberifrs-full:CurrencyRiskMemberifrs-full:CashFlowHedgesMemberbcs:HeldForRiskManagementMemberifrs-full:DerivativesMember2022-12-310000312069bcs:OTCDerivativesMemberifrs-full:CurrencyRiskMemberifrs-full:CashFlowHedgesMemberbcs:HeldForRiskManagementMemberifrs-full:AtFairValueMember2022-12-310000312069bcs:OTCDerivativesMemberifrs-full:CashFlowHedgesMemberbcs:HeldForRiskManagementMemberifrs-full:DerivativesMemberifrs-full:InterestRateRiskMember2023-12-310000312069bcs:OTCDerivativesMemberifrs-full:CashFlowHedgesMemberbcs:HeldForRiskManagementMemberifrs-full:AtFairValueMemberifrs-full:InterestRateRiskMember2023-12-310000312069bcs:OTCDerivativesMemberifrs-full:CashFlowHedgesMemberbcs:HeldForRiskManagementMemberifrs-full:DerivativesMemberifrs-full:InterestRateRiskMember2022-12-310000312069bcs:OTCDerivativesMemberifrs-full:CashFlowHedgesMemberbcs:HeldForRiskManagementMemberifrs-full:AtFairValueMemberifrs-full:InterestRateRiskMember2022-12-310000312069bcs:ClearedByCentralCounterpartyMemberifrs-full:CashFlowHedgesMemberbcs:HeldForRiskManagementMemberifrs-full:DerivativesMemberifrs-full:InterestRateRiskMember2023-12-310000312069bcs:ClearedByCentralCounterpartyMemberifrs-full:CashFlowHedgesMemberbcs:HeldForRiskManagementMemberifrs-full:AtFairValueMemberifrs-full:InterestRateRiskMember2023-12-310000312069bcs:ClearedByCentralCounterpartyMemberifrs-full:CashFlowHedgesMemberbcs:HeldForRiskManagementMemberifrs-full:DerivativesMemberifrs-full:InterestRateRiskMember2022-12-310000312069bcs:ClearedByCentralCounterpartyMemberifrs-full:CashFlowHedgesMemberbcs:HeldForRiskManagementMemberifrs-full:AtFairValueMemberifrs-full:InterestRateRiskMember2022-12-310000312069ifrs-full:CashFlowHedgesMemberbcs:HeldForRiskManagementMemberifrs-full:DerivativesMember2023-12-310000312069ifrs-full:CashFlowHedgesMemberbcs:HeldForRiskManagementMemberifrs-full:AtFairValueMember2023-12-310000312069ifrs-full:CashFlowHedgesMemberbcs:HeldForRiskManagementMemberifrs-full:DerivativesMember2022-12-310000312069ifrs-full:CashFlowHedgesMemberbcs:HeldForRiskManagementMemberifrs-full:AtFairValueMember2022-12-310000312069bcs:OTCDerivativesMemberbcs:HeldForRiskManagementMemberifrs-full:FairValueHedgesMemberifrs-full:DerivativesMemberifrs-full:InterestRateRiskMember2023-12-310000312069bcs:OTCDerivativesMemberbcs:HeldForRiskManagementMemberifrs-full:AtFairValueMemberifrs-full:FairValueHedgesMemberifrs-full:InterestRateRiskMember2023-12-310000312069bcs:OTCDerivativesMemberbcs:HeldForRiskManagementMemberifrs-full:FairValueHedgesMemberifrs-full:DerivativesMemberifrs-full:InterestRateRiskMember2022-12-310000312069bcs:OTCDerivativesMemberbcs:HeldForRiskManagementMemberifrs-full:AtFairValueMemberifrs-full:FairValueHedgesMemberifrs-full:InterestRateRiskMember2022-12-310000312069bcs:ClearedByCentralCounterpartyMemberbcs:HeldForRiskManagementMemberifrs-full:FairValueHedgesMemberifrs-full:DerivativesMemberifrs-full:InterestRateRiskMember2023-12-310000312069bcs:ClearedByCentralCounterpartyMemberbcs:HeldForRiskManagementMemberifrs-full:AtFairValueMemberifrs-full:FairValueHedgesMemberifrs-full:InterestRateRiskMember2023-12-310000312069bcs:ClearedByCentralCounterpartyMemberbcs:HeldForRiskManagementMemberifrs-full:FairValueHedgesMemberifrs-full:DerivativesMemberifrs-full:InterestRateRiskMember2022-12-310000312069bcs:ClearedByCentralCounterpartyMemberbcs:HeldForRiskManagementMemberifrs-full:AtFairValueMemberifrs-full:FairValueHedgesMemberifrs-full:InterestRateRiskMember2022-12-310000312069bcs:HeldForRiskManagementMemberifrs-full:FairValueHedgesMemberifrs-full:DerivativesMember2023-12-310000312069bcs:HeldForRiskManagementMemberifrs-full:AtFairValueMemberifrs-full:FairValueHedgesMember2023-12-310000312069bcs:HeldForRiskManagementMemberifrs-full:FairValueHedgesMemberifrs-full:DerivativesMember2022-12-310000312069bcs:HeldForRiskManagementMemberifrs-full:AtFairValueMemberifrs-full:FairValueHedgesMember2022-12-310000312069bcs:OTCDerivativesMemberifrs-full:CurrencyRiskMemberifrs-full:HedgesOfNetInvestmentInForeignOperationsMemberbcs:HeldForRiskManagementMemberifrs-full:DerivativesMember2023-12-310000312069bcs:OTCDerivativesMemberifrs-full:CurrencyRiskMemberifrs-full:HedgesOfNetInvestmentInForeignOperationsMemberbcs:HeldForRiskManagementMemberifrs-full:AtFairValueMember2023-12-310000312069bcs:OTCDerivativesMemberifrs-full:CurrencyRiskMemberifrs-full:HedgesOfNetInvestmentInForeignOperationsMemberbcs:HeldForRiskManagementMemberifrs-full:DerivativesMember2022-12-310000312069bcs:OTCDerivativesMemberifrs-full:CurrencyRiskMemberifrs-full:HedgesOfNetInvestmentInForeignOperationsMemberbcs:HeldForRiskManagementMemberifrs-full:AtFairValueMember2022-12-310000312069ifrs-full:HedgesOfNetInvestmentInForeignOperationsMemberbcs:HeldForRiskManagementMemberifrs-full:DerivativesMember2023-12-310000312069ifrs-full:HedgesOfNetInvestmentInForeignOperationsMemberbcs:HeldForRiskManagementMemberifrs-full:AtFairValueMember2023-12-310000312069ifrs-full:HedgesOfNetInvestmentInForeignOperationsMemberbcs:HeldForRiskManagementMemberifrs-full:DerivativesMember2022-12-310000312069ifrs-full:HedgesOfNetInvestmentInForeignOperationsMemberbcs:HeldForRiskManagementMemberifrs-full:AtFairValueMember2022-12-310000312069bcs:OTCDerivativesMemberbcs:HeldForRiskManagementMemberifrs-full:DerivativesMember2023-12-310000312069bcs:OTCDerivativesMemberbcs:HeldForRiskManagementMemberifrs-full:AtFairValueMember2023-12-310000312069bcs:OTCDerivativesMemberbcs:HeldForRiskManagementMemberifrs-full:DerivativesMember2022-12-310000312069bcs:OTCDerivativesMemberbcs:HeldForRiskManagementMemberifrs-full:AtFairValueMember2022-12-310000312069bcs:ClearedByCentralCounterpartyMemberbcs:HeldForRiskManagementMemberifrs-full:DerivativesMember2023-12-310000312069bcs:ClearedByCentralCounterpartyMemberbcs:HeldForRiskManagementMemberifrs-full:AtFairValueMember2023-12-310000312069bcs:ClearedByCentralCounterpartyMemberbcs:HeldForRiskManagementMemberifrs-full:DerivativesMember2022-12-310000312069bcs:ClearedByCentralCounterpartyMemberbcs:HeldForRiskManagementMemberifrs-full:AtFairValueMember2022-12-310000312069ifrs-full:LoansAndReceivablesCategoryMemberifrs-full:FinancialAssetsAtAmortisedCostCategoryMemberifrs-full:FairValueHedgesMemberifrs-full:InterestRateRiskMember2023-12-310000312069ifrs-full:LoansAndReceivablesCategoryMemberifrs-full:FinancialAssetsAtAmortisedCostCategoryMemberifrs-full:FairValueHedgesMemberifrs-full:InterestRateRiskMember2023-01-012023-12-310000312069ifrs-full:LoansAndReceivablesCategoryMemberifrs-full:FinancialAssetsAtAmortisedCostCategoryMemberifrs-full:FairValueHedgesMemberifrs-full:OtherPriceRiskMember2023-12-310000312069ifrs-full:LoansAndReceivablesCategoryMemberifrs-full:FinancialAssetsAtAmortisedCostCategoryMemberifrs-full:FairValueHedgesMemberifrs-full:OtherPriceRiskMember2023-01-012023-12-310000312069bcs:HedgedAssetsMemberifrs-full:DebtSecuritiesMemberifrs-full:FairValueHedgesMemberifrs-full:InterestRateRiskMember2023-12-310000312069bcs:HedgedAssetsMemberifrs-full:DebtSecuritiesMemberifrs-full:FairValueHedgesMemberifrs-full:InterestRateRiskMember2023-01-012023-12-310000312069bcs:HedgedAssetsMemberifrs-full:DebtSecuritiesMemberifrs-full:FairValueHedgesMemberifrs-full:OtherPriceRiskMember2023-12-310000312069bcs:HedgedAssetsMemberifrs-full:DebtSecuritiesMemberifrs-full:FairValueHedgesMemberifrs-full:OtherPriceRiskMember2023-01-012023-12-310000312069bcs:HedgedAssetsMemberifrs-full:FinancialAssetsAtFairValueThroughOtherComprehensiveIncomeCategoryMemberifrs-full:FairValueHedgesMemberifrs-full:InterestRateRiskMember2023-12-310000312069bcs:HedgedAssetsMemberifrs-full:FinancialAssetsAtFairValueThroughOtherComprehensiveIncomeCategoryMemberifrs-full:FairValueHedgesMemberifrs-full:InterestRateRiskMember2023-01-012023-12-310000312069bcs:HedgedAssetsMemberifrs-full:FinancialAssetsAtFairValueThroughOtherComprehensiveIncomeCategoryMemberifrs-full:FairValueHedgesMemberifrs-full:OtherPriceRiskMember2023-12-310000312069bcs:HedgedAssetsMemberifrs-full:FinancialAssetsAtFairValueThroughOtherComprehensiveIncomeCategoryMemberifrs-full:FairValueHedgesMemberifrs-full:OtherPriceRiskMember2023-01-012023-12-310000312069bcs:HedgedAssetsMemberifrs-full:FairValueHedgesMember2023-12-310000312069bcs:HedgedAssetsMemberifrs-full:FairValueHedgesMember2023-01-012023-12-310000312069ifrs-full:DebtSecuritiesMemberifrs-full:FairValueHedgesMemberifrs-full:InterestRateRiskMember2023-12-310000312069ifrs-full:DebtSecuritiesMemberifrs-full:FairValueHedgesMemberifrs-full:InterestRateRiskMember2023-01-012023-12-310000312069bcs:HedgedLiabilitiesMemberifrs-full:FairValueHedgesMember2023-12-310000312069bcs:HedgedLiabilitiesMemberifrs-full:FairValueHedgesMember2023-01-012023-12-310000312069ifrs-full:FairValueHedgesMember2023-12-310000312069ifrs-full:FairValueHedgesMember2023-01-012023-12-310000312069ifrs-full:LoansAndReceivablesCategoryMemberifrs-full:FinancialAssetsAtAmortisedCostCategoryMemberifrs-full:FairValueHedgesMemberifrs-full:InterestRateRiskMember2022-12-310000312069ifrs-full:LoansAndReceivablesCategoryMemberifrs-full:FinancialAssetsAtAmortisedCostCategoryMemberifrs-full:FairValueHedgesMemberifrs-full:InterestRateRiskMember2022-01-012022-12-310000312069ifrs-full:LoansAndReceivablesCategoryMemberifrs-full:FinancialAssetsAtAmortisedCostCategoryMemberifrs-full:FairValueHedgesMemberifrs-full:OtherPriceRiskMember2022-12-310000312069ifrs-full:LoansAndReceivablesCategoryMemberifrs-full:FinancialAssetsAtAmortisedCostCategoryMemberifrs-full:FairValueHedgesMemberifrs-full:OtherPriceRiskMember2022-01-012022-12-310000312069bcs:HedgedAssetsMemberifrs-full:DebtSecuritiesMemberifrs-full:FairValueHedgesMemberifrs-full:InterestRateRiskMember2022-12-310000312069bcs:HedgedAssetsMemberifrs-full:DebtSecuritiesMemberifrs-full:FairValueHedgesMemberifrs-full:InterestRateRiskMember2022-01-012022-12-310000312069bcs:HedgedAssetsMemberifrs-full:DebtSecuritiesMemberifrs-full:FairValueHedgesMemberifrs-full:OtherPriceRiskMember2022-12-310000312069bcs:HedgedAssetsMemberifrs-full:DebtSecuritiesMemberifrs-full:FairValueHedgesMemberifrs-full:OtherPriceRiskMember2022-01-012022-12-310000312069bcs:HedgedAssetsMemberifrs-full:FinancialAssetsAtFairValueThroughOtherComprehensiveIncomeCategoryMemberifrs-full:FairValueHedgesMemberifrs-full:InterestRateRiskMember2022-12-310000312069bcs:HedgedAssetsMemberifrs-full:FinancialAssetsAtFairValueThroughOtherComprehensiveIncomeCategoryMemberifrs-full:FairValueHedgesMemberifrs-full:InterestRateRiskMember2022-01-012022-12-310000312069bcs:HedgedAssetsMemberifrs-full:FinancialAssetsAtFairValueThroughOtherComprehensiveIncomeCategoryMemberifrs-full:FairValueHedgesMemberifrs-full:OtherPriceRiskMember2022-12-310000312069bcs:HedgedAssetsMemberifrs-full:FinancialAssetsAtFairValueThroughOtherComprehensiveIncomeCategoryMemberifrs-full:FairValueHedgesMemberifrs-full:OtherPriceRiskMember2022-01-012022-12-310000312069bcs:HedgedAssetsMemberifrs-full:FairValueHedgesMember2022-12-310000312069bcs:HedgedAssetsMemberifrs-full:FairValueHedgesMember2022-01-012022-12-310000312069ifrs-full:DebtSecuritiesMemberifrs-full:FairValueHedgesMemberifrs-full:InterestRateRiskMember2022-12-310000312069ifrs-full:DebtSecuritiesMemberifrs-full:FairValueHedgesMemberifrs-full:InterestRateRiskMember2022-01-012022-12-310000312069bcs:HedgedLiabilitiesMemberifrs-full:FairValueHedgesMember2022-12-310000312069bcs:HedgedLiabilitiesMemberifrs-full:FairValueHedgesMember2022-01-012022-12-310000312069ifrs-full:FairValueHedgesMember2022-12-310000312069ifrs-full:FairValueHedgesMember2022-01-012022-12-310000312069ifrs-full:DerivativesMemberifrs-full:FairValueHedgesMemberifrs-full:InterestRateRiskMember2023-12-310000312069ifrs-full:LoanCommitmentsMemberifrs-full:FairValueHedgesMemberifrs-full:InterestRateRiskMember2023-12-310000312069ifrs-full:FairValueHedgesMemberifrs-full:InterestRateRiskMember2023-12-310000312069ifrs-full:FairValueHedgesMemberifrs-full:InterestRateRiskMember2023-01-012023-12-310000312069ifrs-full:DerivativesMemberifrs-full:FairValueHedgesMemberifrs-full:OtherPriceRiskMember2023-12-310000312069ifrs-full:LoanCommitmentsMemberifrs-full:FairValueHedgesMemberifrs-full:OtherPriceRiskMember2023-12-310000312069ifrs-full:FairValueHedgesMemberifrs-full:OtherPriceRiskMember2023-12-310000312069ifrs-full:FairValueHedgesMemberifrs-full:OtherPriceRiskMember2023-01-012023-12-310000312069ifrs-full:DerivativesMemberifrs-full:FairValueHedgesMember2023-12-310000312069ifrs-full:LoanCommitmentsMemberifrs-full:FairValueHedgesMember2023-12-310000312069ifrs-full:DerivativesMemberifrs-full:FairValueHedgesMemberifrs-full:InterestRateRiskMember2022-12-310000312069ifrs-full:LoanCommitmentsMemberifrs-full:FairValueHedgesMemberifrs-full:InterestRateRiskMember2022-12-310000312069ifrs-full:FairValueHedgesMemberifrs-full:InterestRateRiskMember2022-12-310000312069ifrs-full:FairValueHedgesMemberifrs-full:InterestRateRiskMember2022-01-012022-12-310000312069ifrs-full:DerivativesMemberifrs-full:FairValueHedgesMemberifrs-full:OtherPriceRiskMember2022-12-310000312069ifrs-full:LoanCommitmentsMemberifrs-full:FairValueHedgesMemberifrs-full:OtherPriceRiskMember2022-12-310000312069ifrs-full:FairValueHedgesMemberifrs-full:OtherPriceRiskMember2022-12-310000312069ifrs-full:FairValueHedgesMemberifrs-full:OtherPriceRiskMember2022-01-012022-12-310000312069ifrs-full:DerivativesMemberifrs-full:FairValueHedgesMember2022-12-310000312069ifrs-full:LoanCommitmentsMemberifrs-full:FairValueHedgesMember2022-12-310000312069ifrs-full:FixedInterestRateMemberifrs-full:CurrentMemberifrs-full:FairValueHedgesMemberifrs-full:InterestRateRiskMember2023-12-310000312069ifrs-full:LaterThanOneYearAndNotLaterThanTwoYearsMemberifrs-full:FixedInterestRateMemberifrs-full:FairValueHedgesMemberifrs-full:InterestRateRiskMember2023-12-310000312069ifrs-full:LaterThanTwoYearsAndNotLaterThanThreeYearsMemberifrs-full:FixedInterestRateMemberifrs-full:FairValueHedgesMemberifrs-full:InterestRateRiskMember2023-12-310000312069ifrs-full:FixedInterestRateMemberifrs-full:LaterThanThreeYearsAndNotLaterThanFourYearsMemberifrs-full:FairValueHedgesMemberifrs-full:InterestRateRiskMember2023-12-310000312069ifrs-full:FixedInterestRateMemberifrs-full:LaterThanFourYearsAndNotLaterThanFiveYearsMemberifrs-full:FairValueHedgesMemberifrs-full:InterestRateRiskMember2023-12-310000312069ifrs-full:FixedInterestRateMemberifrs-full:FairValueHedgesMemberbcs:LaterThanFiveYearsAndNotLaterThanSixYearsMemberifrs-full:InterestRateRiskMember2023-12-310000312069bcs:LaterThanSixYearsMemberifrs-full:FixedInterestRateMemberifrs-full:FairValueHedgesMemberifrs-full:InterestRateRiskMember2023-12-310000312069ifrs-full:FixedInterestRateMemberifrs-full:CurrentMemberifrs-full:FairValueHedgesMemberifrs-full:OtherPriceRiskMember2023-12-310000312069ifrs-full:LaterThanOneYearAndNotLaterThanTwoYearsMemberifrs-full:FixedInterestRateMemberifrs-full:FairValueHedgesMemberifrs-full:OtherPriceRiskMember2023-12-310000312069ifrs-full:LaterThanTwoYearsAndNotLaterThanThreeYearsMemberifrs-full:FixedInterestRateMemberifrs-full:FairValueHedgesMemberifrs-full:OtherPriceRiskMember2023-12-310000312069ifrs-full:FixedInterestRateMemberifrs-full:LaterThanThreeYearsAndNotLaterThanFourYearsMemberifrs-full:FairValueHedgesMemberifrs-full:OtherPriceRiskMember2023-12-310000312069ifrs-full:FixedInterestRateMemberifrs-full:LaterThanFourYearsAndNotLaterThanFiveYearsMemberifrs-full:FairValueHedgesMemberifrs-full:OtherPriceRiskMember2023-12-310000312069ifrs-full:FixedInterestRateMemberifrs-full:FairValueHedgesMemberbcs:LaterThanFiveYearsAndNotLaterThanSixYearsMemberifrs-full:OtherPriceRiskMember2023-12-310000312069bcs:LaterThanSixYearsMemberifrs-full:FixedInterestRateMemberifrs-full:FairValueHedgesMemberifrs-full:OtherPriceRiskMember2023-12-310000312069ifrs-full:FixedInterestRateMemberifrs-full:FairValueHedgesMemberifrs-full:InterestRateRiskMember2023-12-31bcs:hedge0000312069ifrs-full:FixedInterestRateMemberifrs-full:FairValueHedgesMemberifrs-full:InterestRateRiskMember2022-12-310000312069ifrs-full:FixedInterestRateMemberifrs-full:FairValueHedgesMemberifrs-full:OtherPriceRiskMember2023-12-310000312069ifrs-full:FixedInterestRateMemberifrs-full:FairValueHedgesMemberifrs-full:OtherPriceRiskMember2022-12-310000312069ifrs-full:LoansAndReceivablesCategoryMemberifrs-full:FinancialAssetsAtAmortisedCostCategoryMemberifrs-full:CashFlowHedgesMemberifrs-full:InterestRateRiskMember2023-01-012023-12-310000312069ifrs-full:LoansAndReceivablesCategoryMemberifrs-full:FinancialAssetsAtAmortisedCostCategoryMemberifrs-full:CashFlowHedgesMemberifrs-full:InterestRateRiskMember2023-12-310000312069bcs:CashAndBankBalancesAtCentralBanksMemberifrs-full:CashFlowHedgesMemberifrs-full:InterestRateRiskMember2023-01-012023-12-310000312069bcs:CashAndBankBalancesAtCentralBanksMemberifrs-full:CashFlowHedgesMemberifrs-full:InterestRateRiskMember2023-12-310000312069ifrs-full:LoansAndReceivablesCategoryMemberifrs-full:FinancialAssetsAtAmortisedCostCategoryMemberifrs-full:CurrencyRiskMemberifrs-full:CashFlowHedgesMember2023-01-012023-12-310000312069ifrs-full:LoansAndReceivablesCategoryMemberifrs-full:FinancialAssetsAtAmortisedCostCategoryMemberifrs-full:CurrencyRiskMemberifrs-full:CashFlowHedgesMember2023-12-310000312069ifrs-full:FinancialAssetsAtAmortisedCostCategoryMemberifrs-full:CurrencyRiskMemberifrs-full:DebtSecuritiesMemberifrs-full:CashFlowHedgesMember2023-01-012023-12-310000312069ifrs-full:FinancialAssetsAtAmortisedCostCategoryMemberifrs-full:CurrencyRiskMemberifrs-full:DebtSecuritiesMemberifrs-full:CashFlowHedgesMember2023-12-310000312069ifrs-full:FinancialAssetsAtAmortisedCostCategoryMemberifrs-full:DebtSecuritiesMemberifrs-full:CashFlowHedgesMemberifrs-full:OtherPriceRiskMember2023-01-012023-12-310000312069ifrs-full:FinancialAssetsAtAmortisedCostCategoryMemberifrs-full:DebtSecuritiesMemberifrs-full:CashFlowHedgesMemberifrs-full:OtherPriceRiskMember2023-12-310000312069ifrs-full:HedgesOfNetInvestmentInForeignOperationsMembercurrency:USD2023-01-012023-12-310000312069ifrs-full:HedgesOfNetInvestmentInForeignOperationsMembercurrency:USD2023-12-310000312069ifrs-full:HedgesOfNetInvestmentInForeignOperationsMembercurrency:EUR2023-01-012023-12-310000312069ifrs-full:HedgesOfNetInvestmentInForeignOperationsMembercurrency:EUR2023-12-310000312069bcs:OtherCurrenciesMemberifrs-full:HedgesOfNetInvestmentInForeignOperationsMember2023-01-012023-12-310000312069bcs:OtherCurrenciesMemberifrs-full:HedgesOfNetInvestmentInForeignOperationsMember2023-12-310000312069ifrs-full:HedgesOfNetInvestmentInForeignOperationsMember2023-01-012023-12-310000312069ifrs-full:HedgesOfNetInvestmentInForeignOperationsMember2023-12-310000312069ifrs-full:LoansAndReceivablesCategoryMemberifrs-full:FinancialAssetsAtAmortisedCostCategoryMemberifrs-full:CashFlowHedgesMemberifrs-full:InterestRateRiskMember2022-01-012022-12-310000312069ifrs-full:LoansAndReceivablesCategoryMemberifrs-full:FinancialAssetsAtAmortisedCostCategoryMemberifrs-full:CashFlowHedgesMemberifrs-full:InterestRateRiskMember2022-12-310000312069bcs:CashAndBankBalancesAtCentralBanksMemberifrs-full:CashFlowHedgesMemberifrs-full:InterestRateRiskMember2022-01-012022-12-310000312069bcs:CashAndBankBalancesAtCentralBanksMemberifrs-full:CashFlowHedgesMemberifrs-full:InterestRateRiskMember2022-12-310000312069ifrs-full:LoansAndReceivablesCategoryMemberifrs-full:FinancialAssetsAtAmortisedCostCategoryMemberifrs-full:CurrencyRiskMemberifrs-full:CashFlowHedgesMember2022-01-012022-12-310000312069ifrs-full:LoansAndReceivablesCategoryMemberifrs-full:FinancialAssetsAtAmortisedCostCategoryMemberifrs-full:CurrencyRiskMemberifrs-full:CashFlowHedgesMember2022-12-310000312069ifrs-full:FinancialAssetsAtAmortisedCostCategoryMemberifrs-full:CurrencyRiskMemberifrs-full:DebtSecuritiesMemberifrs-full:CashFlowHedgesMember2022-01-012022-12-310000312069ifrs-full:FinancialAssetsAtAmortisedCostCategoryMemberifrs-full:CurrencyRiskMemberifrs-full:DebtSecuritiesMemberifrs-full:CashFlowHedgesMember2022-12-310000312069ifrs-full:FinancialAssetsAtAmortisedCostCategoryMemberifrs-full:DebtSecuritiesMemberifrs-full:CashFlowHedgesMemberifrs-full:OtherPriceRiskMember2022-01-012022-12-310000312069ifrs-full:FinancialAssetsAtAmortisedCostCategoryMemberifrs-full:DebtSecuritiesMemberifrs-full:CashFlowHedgesMemberifrs-full:OtherPriceRiskMember2022-12-310000312069ifrs-full:HedgesOfNetInvestmentInForeignOperationsMembercurrency:USD2022-01-012022-12-310000312069ifrs-full:HedgesOfNetInvestmentInForeignOperationsMembercurrency:USD2022-12-310000312069ifrs-full:HedgesOfNetInvestmentInForeignOperationsMembercurrency:EUR2022-01-012022-12-310000312069ifrs-full:HedgesOfNetInvestmentInForeignOperationsMembercurrency:EUR2022-12-310000312069bcs:OtherCurrenciesMemberifrs-full:HedgesOfNetInvestmentInForeignOperationsMember2022-01-012022-12-310000312069bcs:OtherCurrenciesMemberifrs-full:HedgesOfNetInvestmentInForeignOperationsMember2022-12-310000312069ifrs-full:HedgesOfNetInvestmentInForeignOperationsMember2022-01-012022-12-310000312069ifrs-full:HedgesOfNetInvestmentInForeignOperationsMember2022-12-310000312069ifrs-full:CashFlowHedgesMemberifrs-full:DerivativesMemberifrs-full:InterestRateRiskMember2023-12-310000312069ifrs-full:CashFlowHedgesMemberifrs-full:LoanCommitmentsMemberifrs-full:InterestRateRiskMember2023-12-310000312069ifrs-full:CashFlowHedgesMemberifrs-full:InterestRateRiskMember2023-12-310000312069ifrs-full:CashFlowHedgesMemberifrs-full:InterestRateRiskMember2023-01-012023-12-310000312069ifrs-full:CurrencyRiskMemberifrs-full:CashFlowHedgesMemberifrs-full:DerivativesMember2023-12-310000312069ifrs-full:CurrencyRiskMemberifrs-full:CashFlowHedgesMemberifrs-full:LoanCommitmentsMember2023-12-310000312069ifrs-full:CurrencyRiskMemberifrs-full:CashFlowHedgesMember2023-12-310000312069ifrs-full:CurrencyRiskMemberifrs-full:CashFlowHedgesMember2023-01-012023-12-310000312069ifrs-full:CashFlowHedgesMemberifrs-full:DerivativesMemberifrs-full:OtherPriceRiskMember2023-12-310000312069ifrs-full:CashFlowHedgesMemberifrs-full:LoanCommitmentsMemberifrs-full:OtherPriceRiskMember2023-12-310000312069ifrs-full:CashFlowHedgesMemberifrs-full:OtherPriceRiskMember2023-12-310000312069ifrs-full:CashFlowHedgesMemberifrs-full:OtherPriceRiskMember2023-01-012023-12-310000312069ifrs-full:CashFlowHedgesMemberifrs-full:DerivativesMember2023-12-310000312069ifrs-full:CashFlowHedgesMemberifrs-full:LoanCommitmentsMember2023-12-310000312069ifrs-full:CurrencyRiskMemberifrs-full:HedgesOfNetInvestmentInForeignOperationsMemberifrs-full:DerivativesMember2023-12-310000312069ifrs-full:CurrencyRiskMemberifrs-full:HedgesOfNetInvestmentInForeignOperationsMemberifrs-full:LoanCommitmentsMember2023-12-310000312069ifrs-full:CurrencyRiskMemberifrs-full:HedgesOfNetInvestmentInForeignOperationsMember2023-12-310000312069ifrs-full:CurrencyRiskMemberifrs-full:HedgesOfNetInvestmentInForeignOperationsMember2023-01-012023-12-310000312069ifrs-full:CashFlowHedgesMemberifrs-full:DerivativesMemberifrs-full:InterestRateRiskMember2022-12-310000312069ifrs-full:CashFlowHedgesMemberifrs-full:LoanCommitmentsMemberifrs-full:InterestRateRiskMember2022-12-310000312069ifrs-full:CashFlowHedgesMemberifrs-full:InterestRateRiskMember2022-12-310000312069ifrs-full:CashFlowHedgesMemberifrs-full:InterestRateRiskMember2022-01-012022-12-310000312069ifrs-full:CurrencyRiskMemberifrs-full:CashFlowHedgesMemberifrs-full:DerivativesMember2022-12-310000312069ifrs-full:CurrencyRiskMemberifrs-full:CashFlowHedgesMemberifrs-full:LoanCommitmentsMember2022-12-310000312069ifrs-full:CurrencyRiskMemberifrs-full:CashFlowHedgesMember2022-12-310000312069ifrs-full:CurrencyRiskMemberifrs-full:CashFlowHedgesMember2022-01-012022-12-310000312069ifrs-full:CashFlowHedgesMemberifrs-full:DerivativesMemberifrs-full:OtherPriceRiskMember2022-12-310000312069ifrs-full:CashFlowHedgesMemberifrs-full:LoanCommitmentsMemberifrs-full:OtherPriceRiskMember2022-12-310000312069ifrs-full:CashFlowHedgesMemberifrs-full:OtherPriceRiskMember2022-12-310000312069ifrs-full:CashFlowHedgesMemberifrs-full:OtherPriceRiskMember2022-01-012022-12-310000312069ifrs-full:CashFlowHedgesMemberifrs-full:DerivativesMember2022-12-310000312069ifrs-full:CashFlowHedgesMemberifrs-full:LoanCommitmentsMember2022-12-310000312069ifrs-full:CurrencyRiskMemberifrs-full:HedgesOfNetInvestmentInForeignOperationsMemberifrs-full:DerivativesMember2022-12-310000312069ifrs-full:CurrencyRiskMemberifrs-full:HedgesOfNetInvestmentInForeignOperationsMemberifrs-full:LoanCommitmentsMember2022-12-310000312069ifrs-full:CurrencyRiskMemberifrs-full:HedgesOfNetInvestmentInForeignOperationsMember2022-12-310000312069ifrs-full:CurrencyRiskMemberifrs-full:HedgesOfNetInvestmentInForeignOperationsMember2022-01-012022-12-310000312069currency:JPYifrs-full:CurrencyRiskMemberifrs-full:CashFlowHedgesMember2023-12-310000312069currency:JPYifrs-full:CurrencyRiskMemberifrs-full:CashFlowHedgesMember2022-12-31bcs:japaneseYenPerPound0000312069ifrs-full:CurrencyRiskMemberifrs-full:CashFlowHedgesMembercurrency:USD2023-12-310000312069ifrs-full:CurrencyRiskMemberifrs-full:CashFlowHedgesMembercurrency:USD2022-12-31iso4217:USDutr:lb0000312069bcs:InterestIncomeMemberifrs-full:InterestRateRiskMember2023-01-012023-12-310000312069bcs:InterestIncomeMemberifrs-full:InterestRateRiskMember2022-01-012022-12-310000312069ifrs-full:CurrencyRiskMemberbcs:TradingIncomeMember2023-01-012023-12-310000312069ifrs-full:CurrencyRiskMemberbcs:TradingIncomeMember2022-01-012022-12-310000312069bcs:TradingIncomeMember2023-01-012023-12-310000312069bcs:TradingIncomeMember2022-01-012022-12-310000312069ifrs-full:DebtSecuritiesMember2023-12-310000312069ifrs-full:DebtSecuritiesMember2022-12-310000312069ifrs-full:EquityInvestmentsMember2023-12-310000312069ifrs-full:EquityInvestmentsMember2022-12-310000312069bcs:ContractualCarryingAmountDueOnMaturityMember2023-12-310000312069bcs:ContractualCarryingAmountDueOnMaturityMember2022-12-310000312069ifrs-full:Level1OfFairValueHierarchyMemberifrs-full:AtFairValueMember2023-12-310000312069ifrs-full:Level2OfFairValueHierarchyMemberifrs-full:AtFairValueMember2023-12-310000312069ifrs-full:Level3OfFairValueHierarchyMemberifrs-full:AtFairValueMember2023-12-310000312069ifrs-full:Level1OfFairValueHierarchyMemberifrs-full:AtFairValueMember2022-12-310000312069ifrs-full:Level2OfFairValueHierarchyMemberifrs-full:AtFairValueMember2022-12-310000312069ifrs-full:Level3OfFairValueHierarchyMemberifrs-full:AtFairValueMember2022-12-310000312069ifrs-full:Level3OfFairValueHierarchyMemberifrs-full:InterestRateRiskMember2023-12-310000312069ifrs-full:Level3OfFairValueHierarchyMemberifrs-full:InterestRateRiskMember2022-12-310000312069ifrs-full:CurrencyRiskMemberifrs-full:Level3OfFairValueHierarchyMember2023-12-310000312069ifrs-full:CurrencyRiskMemberifrs-full:Level3OfFairValueHierarchyMember2022-12-310000312069ifrs-full:Level3OfFairValueHierarchyMemberifrs-full:CreditRiskMember2023-12-310000312069ifrs-full:Level3OfFairValueHierarchyMemberifrs-full:CreditRiskMember2022-12-310000312069ifrs-full:Level3OfFairValueHierarchyMemberifrs-full:EquityPriceRiskMember2023-12-310000312069ifrs-full:Level3OfFairValueHierarchyMemberifrs-full:EquityPriceRiskMember2022-12-310000312069ifrs-full:Level3OfFairValueHierarchyMemberifrs-full:CorporateLoansMember2023-12-310000312069ifrs-full:Level3OfFairValueHierarchyMemberifrs-full:CorporateLoansMember2022-12-310000312069ifrs-full:Level3OfFairValueHierarchyMemberbcs:ReverseRepurchaseAndRepurchaseAgreementsMember2023-12-310000312069ifrs-full:Level3OfFairValueHierarchyMemberbcs:ReverseRepurchaseAndRepurchaseAgreementsMember2022-12-310000312069ifrs-full:Level3OfFairValueHierarchyMemberbcs:NonAssetBackedLoansMember2023-12-310000312069ifrs-full:Level3OfFairValueHierarchyMemberbcs:NonAssetBackedLoansMember2022-12-310000312069ifrs-full:Level3OfFairValueHierarchyMemberbcs:PrivateEquityInvestmentsMember2023-12-310000312069ifrs-full:Level3OfFairValueHierarchyMemberbcs:PrivateEquityInvestmentsMember2022-12-310000312069bcs:OtherFinancialAssetsAndLiabilitiesGroupOneMemberifrs-full:Level3OfFairValueHierarchyMember2023-12-310000312069bcs:OtherFinancialAssetsAndLiabilitiesGroupOneMemberifrs-full:Level3OfFairValueHierarchyMember2022-12-310000312069ifrs-full:Level3OfFairValueHierarchyMember2023-12-310000312069ifrs-full:Level3OfFairValueHierarchyMember2022-12-310000312069ifrs-full:RecurringFairValueMeasurementMemberifrs-full:Level3OfFairValueHierarchyMemberifrs-full:CorporateLoansMemberifrs-full:FinancialAssetsAtFairValueThroughProfitOrLossClassifiedAsHeldForTradingCategoryMember2022-12-310000312069ifrs-full:RecurringFairValueMeasurementMemberifrs-full:Level3OfFairValueHierarchyMemberifrs-full:CorporateLoansMemberifrs-full:FinancialAssetsAtFairValueThroughProfitOrLossClassifiedAsHeldForTradingCategoryMember2023-01-012023-12-310000312069ifrs-full:RecurringFairValueMeasurementMemberifrs-full:CorporateLoansMemberifrs-full:Level3OfFairValueHierarchyMemberifrs-full:FinancialAssetsAtFairValueThroughProfitOrLossClassifiedAsHeldForTradingCategoryMemberbcs:FinancialAssetsAtFairValueThroughProfitOrLossCategoryTradingMember2023-01-012023-12-310000312069ifrs-full:RecurringFairValueMeasurementMemberbcs:FinancialAssetsAtFairValueThroughProfitOrLossCategoryOtherIncomeMemberifrs-full:CorporateLoansMemberifrs-full:Level3OfFairValueHierarchyMemberifrs-full:FinancialAssetsAtFairValueThroughProfitOrLossClassifiedAsHeldForTradingCategoryMember2023-01-012023-12-310000312069ifrs-full:RecurringFairValueMeasurementMemberifrs-full:Level3OfFairValueHierarchyMemberifrs-full:CorporateLoansMemberifrs-full:FinancialAssetsAtFairValueThroughProfitOrLossClassifiedAsHeldForTradingCategoryMember2023-12-310000312069ifrs-full:RecurringFairValueMeasurementMemberifrs-full:Level3OfFairValueHierarchyMemberbcs:NonAssetBackedLoansMemberifrs-full:FinancialAssetsAtFairValueThroughProfitOrLossClassifiedAsHeldForTradingCategoryMember2022-12-310000312069ifrs-full:RecurringFairValueMeasurementMemberifrs-full:Level3OfFairValueHierarchyMemberbcs:NonAssetBackedLoansMemberifrs-full:FinancialAssetsAtFairValueThroughProfitOrLossClassifiedAsHeldForTradingCategoryMember2023-01-012023-12-310000312069ifrs-full:RecurringFairValueMeasurementMemberbcs:NonAssetBackedLoansMemberifrs-full:Level3OfFairValueHierarchyMemberifrs-full:FinancialAssetsAtFairValueThroughProfitOrLossClassifiedAsHeldForTradingCategoryMemberbcs:FinancialAssetsAtFairValueThroughProfitOrLossCategoryTradingMember2023-01-012023-12-310000312069ifrs-full:RecurringFairValueMeasurementMemberbcs:FinancialAssetsAtFairValueThroughProfitOrLossCategoryOtherIncomeMemberbcs:NonAssetBackedLoansMemberifrs-full:Level3OfFairValueHierarchyMemberifrs-full:FinancialAssetsAtFairValueThroughProfitOrLossClassifiedAsHeldForTradingCategoryMember2023-01-012023-12-310000312069ifrs-full:RecurringFairValueMeasurementMemberifrs-full:Level3OfFairValueHierarchyMemberbcs:NonAssetBackedLoansMemberifrs-full:FinancialAssetsAtFairValueThroughProfitOrLossClassifiedAsHeldForTradingCategoryMember2023-12-310000312069bcs:OtherFinancialAssetsAndLiabilitiesGroupOneMemberifrs-full:RecurringFairValueMeasurementMemberifrs-full:Level3OfFairValueHierarchyMemberifrs-full:FinancialAssetsAtFairValueThroughProfitOrLossClassifiedAsHeldForTradingCategoryMember2022-12-310000312069bcs:OtherFinancialAssetsAndLiabilitiesGroupOneMemberifrs-full:RecurringFairValueMeasurementMemberifrs-full:Level3OfFairValueHierarchyMemberifrs-full:FinancialAssetsAtFairValueThroughProfitOrLossClassifiedAsHeldForTradingCategoryMember2023-01-012023-12-310000312069bcs:OtherFinancialAssetsAndLiabilitiesGroupOneMemberifrs-full:RecurringFairValueMeasurementMemberifrs-full:Level3OfFairValueHierarchyMemberifrs-full:FinancialAssetsAtFairValueThroughProfitOrLossClassifiedAsHeldForTradingCategoryMemberbcs:FinancialAssetsAtFairValueThroughProfitOrLossCategoryTradingMember2023-01-012023-12-310000312069bcs:OtherFinancialAssetsAndLiabilitiesGroupOneMemberifrs-full:RecurringFairValueMeasurementMemberbcs:FinancialAssetsAtFairValueThroughProfitOrLossCategoryOtherIncomeMemberifrs-full:Level3OfFairValueHierarchyMemberifrs-full:FinancialAssetsAtFairValueThroughProfitOrLossClassifiedAsHeldForTradingCategoryMember2023-01-012023-12-310000312069bcs:OtherFinancialAssetsAndLiabilitiesGroupOneMemberifrs-full:RecurringFairValueMeasurementMemberifrs-full:Level3OfFairValueHierarchyMemberifrs-full:FinancialAssetsAtFairValueThroughProfitOrLossClassifiedAsHeldForTradingCategoryMember2023-12-310000312069ifrs-full:RecurringFairValueMeasurementMemberifrs-full:Level3OfFairValueHierarchyMemberifrs-full:FinancialAssetsAtFairValueThroughProfitOrLossClassifiedAsHeldForTradingCategoryMember2022-12-310000312069ifrs-full:RecurringFairValueMeasurementMemberifrs-full:Level3OfFairValueHierarchyMemberifrs-full:FinancialAssetsAtFairValueThroughProfitOrLossClassifiedAsHeldForTradingCategoryMember2023-01-012023-12-310000312069ifrs-full:RecurringFairValueMeasurementMemberifrs-full:Level3OfFairValueHierarchyMemberifrs-full:FinancialAssetsAtFairValueThroughProfitOrLossClassifiedAsHeldForTradingCategoryMemberbcs:FinancialAssetsAtFairValueThroughProfitOrLossCategoryTradingMember2023-01-012023-12-310000312069ifrs-full:RecurringFairValueMeasurementMemberbcs:FinancialAssetsAtFairValueThroughProfitOrLossCategoryOtherIncomeMemberifrs-full:Level3OfFairValueHierarchyMemberifrs-full:FinancialAssetsAtFairValueThroughProfitOrLossClassifiedAsHeldForTradingCategoryMember2023-01-012023-12-310000312069ifrs-full:RecurringFairValueMeasurementMemberifrs-full:Level3OfFairValueHierarchyMemberifrs-full:FinancialAssetsAtFairValueThroughProfitOrLossClassifiedAsHeldForTradingCategoryMember2023-12-310000312069ifrs-full:RecurringFairValueMeasurementMemberifrs-full:Level3OfFairValueHierarchyMemberifrs-full:CorporateLoansMemberifrs-full:FinancialAssetsAtFairValueThroughProfitOrLossCategoryMember2022-12-310000312069ifrs-full:RecurringFairValueMeasurementMemberifrs-full:Level3OfFairValueHierarchyMemberifrs-full:CorporateLoansMemberifrs-full:FinancialAssetsAtFairValueThroughProfitOrLossCategoryMember2023-01-012023-12-310000312069ifrs-full:RecurringFairValueMeasurementMemberifrs-full:CorporateLoansMemberifrs-full:Level3OfFairValueHierarchyMemberbcs:FinancialAssetsAtFairValueThroughProfitOrLossCategoryTradingMemberifrs-full:FinancialAssetsAtFairValueThroughProfitOrLossCategoryMember2023-01-012023-12-310000312069ifrs-full:RecurringFairValueMeasurementMemberbcs:FinancialAssetsAtFairValueThroughProfitOrLossCategoryOtherIncomeMemberifrs-full:CorporateLoansMemberifrs-full:Level3OfFairValueHierarchyMemberifrs-full:FinancialAssetsAtFairValueThroughProfitOrLossCategoryMember2023-01-012023-12-310000312069ifrs-full:RecurringFairValueMeasurementMemberifrs-full:Level3OfFairValueHierarchyMemberifrs-full:CorporateLoansMemberifrs-full:FinancialAssetsAtFairValueThroughProfitOrLossCategoryMember2023-12-310000312069ifrs-full:RecurringFairValueMeasurementMemberifrs-full:Level3OfFairValueHierarchyMemberbcs:NonAssetBackedLoansMemberifrs-full:FinancialAssetsAtFairValueThroughProfitOrLossCategoryMember2022-12-310000312069ifrs-full:RecurringFairValueMeasurementMemberifrs-full:Level3OfFairValueHierarchyMemberbcs:NonAssetBackedLoansMemberifrs-full:FinancialAssetsAtFairValueThroughProfitOrLossCategoryMember2023-01-012023-12-310000312069ifrs-full:RecurringFairValueMeasurementMemberbcs:NonAssetBackedLoansMemberifrs-full:Level3OfFairValueHierarchyMemberbcs:FinancialAssetsAtFairValueThroughProfitOrLossCategoryTradingMemberifrs-full:FinancialAssetsAtFairValueThroughProfitOrLossCategoryMember2023-01-012023-12-310000312069ifrs-full:RecurringFairValueMeasurementMemberbcs:FinancialAssetsAtFairValueThroughProfitOrLossCategoryOtherIncomeMemberbcs:NonAssetBackedLoansMemberifrs-full:Level3OfFairValueHierarchyMemberifrs-full:FinancialAssetsAtFairValueThroughProfitOrLossCategoryMember2023-01-012023-12-310000312069ifrs-full:RecurringFairValueMeasurementMemberifrs-full:Level3OfFairValueHierarchyMemberbcs:NonAssetBackedLoansMemberifrs-full:FinancialAssetsAtFairValueThroughProfitOrLossCategoryMember2023-12-310000312069ifrs-full:RecurringFairValueMeasurementMemberifrs-full:Level3OfFairValueHierarchyMemberbcs:PrivateEquityInvestmentsMemberifrs-full:FinancialAssetsAtFairValueThroughProfitOrLossCategoryMember2022-12-310000312069ifrs-full:RecurringFairValueMeasurementMemberifrs-full:Level3OfFairValueHierarchyMemberbcs:PrivateEquityInvestmentsMemberifrs-full:FinancialAssetsAtFairValueThroughProfitOrLossCategoryMember2023-01-012023-12-310000312069ifrs-full:RecurringFairValueMeasurementMemberifrs-full:Level3OfFairValueHierarchyMemberbcs:PrivateEquityInvestmentsMemberbcs:FinancialAssetsAtFairValueThroughProfitOrLossCategoryTradingMemberifrs-full:FinancialAssetsAtFairValueThroughProfitOrLossCategoryMember2023-01-012023-12-310000312069ifrs-full:RecurringFairValueMeasurementMemberbcs:FinancialAssetsAtFairValueThroughProfitOrLossCategoryOtherIncomeMemberifrs-full:Level3OfFairValueHierarchyMemberbcs:PrivateEquityInvestmentsMemberifrs-full:FinancialAssetsAtFairValueThroughProfitOrLossCategoryMember2023-01-012023-12-310000312069ifrs-full:RecurringFairValueMeasurementMemberifrs-full:Level3OfFairValueHierarchyMemberbcs:PrivateEquityInvestmentsMemberifrs-full:FinancialAssetsAtFairValueThroughProfitOrLossCategoryMember2023-12-310000312069ifrs-full:RecurringFairValueMeasurementMemberifrs-full:Level3OfFairValueHierarchyMemberbcs:ReverseRepurchaseAndRepurchaseAgreementsMemberifrs-full:FinancialAssetsAtFairValueThroughProfitOrLossCategoryMember2022-12-310000312069ifrs-full:RecurringFairValueMeasurementMemberifrs-full:Level3OfFairValueHierarchyMemberbcs:ReverseRepurchaseAndRepurchaseAgreementsMemberifrs-full:FinancialAssetsAtFairValueThroughProfitOrLossCategoryMember2023-01-012023-12-310000312069ifrs-full:RecurringFairValueMeasurementMemberifrs-full:Level3OfFairValueHierarchyMemberbcs:ReverseRepurchaseAndRepurchaseAgreementsMemberbcs:FinancialAssetsAtFairValueThroughProfitOrLossCategoryTradingMemberifrs-full:FinancialAssetsAtFairValueThroughProfitOrLossCategoryMember2023-01-012023-12-310000312069ifrs-full:RecurringFairValueMeasurementMemberbcs:FinancialAssetsAtFairValueThroughProfitOrLossCategoryOtherIncomeMemberifrs-full:Level3OfFairValueHierarchyMemberbcs:ReverseRepurchaseAndRepurchaseAgreementsMemberifrs-full:FinancialAssetsAtFairValueThroughProfitOrLossCategoryMember2023-01-012023-12-310000312069ifrs-full:RecurringFairValueMeasurementMemberifrs-full:Level3OfFairValueHierarchyMemberbcs:ReverseRepurchaseAndRepurchaseAgreementsMemberifrs-full:FinancialAssetsAtFairValueThroughProfitOrLossCategoryMember2023-12-310000312069bcs:OtherFinancialAssetsAndLiabilitiesGroupOneMemberifrs-full:RecurringFairValueMeasurementMemberifrs-full:Level3OfFairValueHierarchyMemberifrs-full:FinancialAssetsAtFairValueThroughProfitOrLossCategoryMember2022-12-310000312069bcs:OtherFinancialAssetsAndLiabilitiesGroupOneMemberifrs-full:RecurringFairValueMeasurementMemberifrs-full:Level3OfFairValueHierarchyMemberifrs-full:FinancialAssetsAtFairValueThroughProfitOrLossCategoryMember2023-01-012023-12-310000312069bcs:OtherFinancialAssetsAndLiabilitiesGroupOneMemberifrs-full:RecurringFairValueMeasurementMemberifrs-full:Level3OfFairValueHierarchyMemberbcs:FinancialAssetsAtFairValueThroughProfitOrLossCategoryTradingMemberifrs-full:FinancialAssetsAtFairValueThroughProfitOrLossCategoryMember2023-01-012023-12-310000312069bcs:OtherFinancialAssetsAndLiabilitiesGroupOneMemberifrs-full:RecurringFairValueMeasurementMemberbcs:FinancialAssetsAtFairValueThroughProfitOrLossCategoryOtherIncomeMemberifrs-full:Level3OfFairValueHierarchyMemberifrs-full:FinancialAssetsAtFairValueThroughProfitOrLossCategoryMember2023-01-012023-12-310000312069bcs:OtherFinancialAssetsAndLiabilitiesGroupOneMemberifrs-full:RecurringFairValueMeasurementMemberifrs-full:Level3OfFairValueHierarchyMemberifrs-full:FinancialAssetsAtFairValueThroughProfitOrLossCategoryMember2023-12-310000312069ifrs-full:RecurringFairValueMeasurementMemberifrs-full:Level3OfFairValueHierarchyMemberifrs-full:FinancialAssetsAtFairValueThroughProfitOrLossCategoryMember2022-12-310000312069ifrs-full:RecurringFairValueMeasurementMemberifrs-full:Level3OfFairValueHierarchyMemberifrs-full:FinancialAssetsAtFairValueThroughProfitOrLossCategoryMember2023-01-012023-12-310000312069ifrs-full:RecurringFairValueMeasurementMemberifrs-full:Level3OfFairValueHierarchyMemberbcs:FinancialAssetsAtFairValueThroughProfitOrLossCategoryTradingMemberifrs-full:FinancialAssetsAtFairValueThroughProfitOrLossCategoryMember2023-01-012023-12-310000312069ifrs-full:RecurringFairValueMeasurementMemberbcs:FinancialAssetsAtFairValueThroughProfitOrLossCategoryOtherIncomeMemberifrs-full:Level3OfFairValueHierarchyMemberifrs-full:FinancialAssetsAtFairValueThroughProfitOrLossCategoryMember2023-01-012023-12-310000312069ifrs-full:RecurringFairValueMeasurementMemberifrs-full:Level3OfFairValueHierarchyMemberifrs-full:FinancialAssetsAtFairValueThroughProfitOrLossCategoryMember2023-12-310000312069ifrs-full:RecurringFairValueMeasurementMemberifrs-full:Level3OfFairValueHierarchyMemberifrs-full:CorporateLoansMemberifrs-full:FinancialAssetsAtFairValueThroughOtherComprehensiveIncomeCategoryMember2022-12-310000312069ifrs-full:RecurringFairValueMeasurementMemberifrs-full:Level3OfFairValueHierarchyMemberifrs-full:CorporateLoansMemberifrs-full:FinancialAssetsAtFairValueThroughOtherComprehensiveIncomeCategoryMember2023-01-012023-12-310000312069ifrs-full:RecurringFairValueMeasurementMemberifrs-full:CorporateLoansMemberifrs-full:Level3OfFairValueHierarchyMemberifrs-full:FinancialAssetsAtFairValueThroughOtherComprehensiveIncomeCategoryMemberbcs:FinancialAssetsAtFairValueThroughProfitOrLossCategoryTradingMember2023-01-012023-12-310000312069ifrs-full:RecurringFairValueMeasurementMemberbcs:FinancialAssetsAtFairValueThroughProfitOrLossCategoryOtherIncomeMemberifrs-full:CorporateLoansMemberifrs-full:Level3OfFairValueHierarchyMemberifrs-full:FinancialAssetsAtFairValueThroughOtherComprehensiveIncomeCategoryMember2023-01-012023-12-310000312069ifrs-full:RecurringFairValueMeasurementMemberifrs-full:Level3OfFairValueHierarchyMemberifrs-full:CorporateLoansMemberifrs-full:FinancialAssetsAtFairValueThroughOtherComprehensiveIncomeCategoryMember2023-12-310000312069ifrs-full:RecurringFairValueMeasurementMemberifrs-full:Level3OfFairValueHierarchyMemberbcs:NonAssetBackedLoansMemberifrs-full:FinancialAssetsAtFairValueThroughOtherComprehensiveIncomeCategoryMember2022-12-310000312069ifrs-full:RecurringFairValueMeasurementMemberifrs-full:Level3OfFairValueHierarchyMemberbcs:NonAssetBackedLoansMemberifrs-full:FinancialAssetsAtFairValueThroughOtherComprehensiveIncomeCategoryMember2023-01-012023-12-310000312069ifrs-full:RecurringFairValueMeasurementMemberbcs:NonAssetBackedLoansMemberifrs-full:Level3OfFairValueHierarchyMemberifrs-full:FinancialAssetsAtFairValueThroughOtherComprehensiveIncomeCategoryMemberbcs:FinancialAssetsAtFairValueThroughProfitOrLossCategoryTradingMember2023-01-012023-12-310000312069ifrs-full:RecurringFairValueMeasurementMemberbcs:FinancialAssetsAtFairValueThroughProfitOrLossCategoryOtherIncomeMemberbcs:NonAssetBackedLoansMemberifrs-full:Level3OfFairValueHierarchyMemberifrs-full:FinancialAssetsAtFairValueThroughOtherComprehensiveIncomeCategoryMember2023-01-012023-12-310000312069ifrs-full:RecurringFairValueMeasurementMemberifrs-full:Level3OfFairValueHierarchyMemberbcs:NonAssetBackedLoansMemberifrs-full:FinancialAssetsAtFairValueThroughOtherComprehensiveIncomeCategoryMember2023-12-310000312069ifrs-full:RecurringFairValueMeasurementMemberifrs-full:Level3OfFairValueHierarchyMemberifrs-full:FinancialAssetsAtFairValueThroughOtherComprehensiveIncomeCategoryMemberbcs:PrivateEquityInvestmentsMember2022-12-310000312069ifrs-full:RecurringFairValueMeasurementMemberifrs-full:Level3OfFairValueHierarchyMemberifrs-full:FinancialAssetsAtFairValueThroughOtherComprehensiveIncomeCategoryMemberbcs:PrivateEquityInvestmentsMember2023-01-012023-12-310000312069ifrs-full:RecurringFairValueMeasurementMemberifrs-full:Level3OfFairValueHierarchyMemberifrs-full:FinancialAssetsAtFairValueThroughOtherComprehensiveIncomeCategoryMemberbcs:PrivateEquityInvestmentsMemberbcs:FinancialAssetsAtFairValueThroughProfitOrLossCategoryTradingMember2023-01-012023-12-310000312069ifrs-full:RecurringFairValueMeasurementMemberbcs:FinancialAssetsAtFairValueThroughProfitOrLossCategoryOtherIncomeMemberifrs-full:Level3OfFairValueHierarchyMemberifrs-full:FinancialAssetsAtFairValueThroughOtherComprehensiveIncomeCategoryMemberbcs:PrivateEquityInvestmentsMember2023-01-012023-12-310000312069ifrs-full:RecurringFairValueMeasurementMemberifrs-full:Level3OfFairValueHierarchyMemberifrs-full:FinancialAssetsAtFairValueThroughOtherComprehensiveIncomeCategoryMemberbcs:PrivateEquityInvestmentsMember2023-12-310000312069bcs:OtherFinancialAssetsAndLiabilitiesGroupOneMemberifrs-full:RecurringFairValueMeasurementMemberifrs-full:Level3OfFairValueHierarchyMemberifrs-full:FinancialAssetsAtFairValueThroughOtherComprehensiveIncomeCategoryMember2022-12-310000312069bcs:OtherFinancialAssetsAndLiabilitiesGroupOneMemberifrs-full:RecurringFairValueMeasurementMemberifrs-full:Level3OfFairValueHierarchyMemberifrs-full:FinancialAssetsAtFairValueThroughOtherComprehensiveIncomeCategoryMember2023-01-012023-12-310000312069bcs:OtherFinancialAssetsAndLiabilitiesGroupOneMemberifrs-full:RecurringFairValueMeasurementMemberifrs-full:Level3OfFairValueHierarchyMemberifrs-full:FinancialAssetsAtFairValueThroughOtherComprehensiveIncomeCategoryMemberbcs:FinancialAssetsAtFairValueThroughProfitOrLossCategoryTradingMember2023-01-012023-12-310000312069bcs:OtherFinancialAssetsAndLiabilitiesGroupOneMemberifrs-full:RecurringFairValueMeasurementMemberbcs:FinancialAssetsAtFairValueThroughProfitOrLossCategoryOtherIncomeMemberifrs-full:Level3OfFairValueHierarchyMemberifrs-full:FinancialAssetsAtFairValueThroughOtherComprehensiveIncomeCategoryMember2023-01-012023-12-310000312069bcs:OtherFinancialAssetsAndLiabilitiesGroupOneMemberifrs-full:RecurringFairValueMeasurementMemberifrs-full:Level3OfFairValueHierarchyMemberifrs-full:FinancialAssetsAtFairValueThroughOtherComprehensiveIncomeCategoryMember2023-12-310000312069ifrs-full:RecurringFairValueMeasurementMemberifrs-full:Level3OfFairValueHierarchyMemberifrs-full:FinancialAssetsAtFairValueThroughOtherComprehensiveIncomeCategoryMember2022-12-310000312069ifrs-full:RecurringFairValueMeasurementMemberifrs-full:Level3OfFairValueHierarchyMemberifrs-full:FinancialAssetsAtFairValueThroughOtherComprehensiveIncomeCategoryMember2023-01-012023-12-310000312069ifrs-full:RecurringFairValueMeasurementMemberifrs-full:Level3OfFairValueHierarchyMemberifrs-full:FinancialAssetsAtFairValueThroughOtherComprehensiveIncomeCategoryMemberbcs:FinancialAssetsAtFairValueThroughProfitOrLossCategoryTradingMember2023-01-012023-12-310000312069ifrs-full:RecurringFairValueMeasurementMemberbcs:FinancialAssetsAtFairValueThroughProfitOrLossCategoryOtherIncomeMemberifrs-full:Level3OfFairValueHierarchyMemberifrs-full:FinancialAssetsAtFairValueThroughOtherComprehensiveIncomeCategoryMember2023-01-012023-12-310000312069ifrs-full:RecurringFairValueMeasurementMemberifrs-full:Level3OfFairValueHierarchyMemberifrs-full:FinancialAssetsAtFairValueThroughOtherComprehensiveIncomeCategoryMember2023-12-310000312069ifrs-full:InvestmentPropertyMemberifrs-full:RecurringFairValueMeasurementMemberifrs-full:Level3OfFairValueHierarchyMember2022-12-310000312069ifrs-full:InvestmentPropertyMemberifrs-full:RecurringFairValueMeasurementMemberifrs-full:Level3OfFairValueHierarchyMember2023-01-012023-12-310000312069ifrs-full:InvestmentPropertyMemberifrs-full:RecurringFairValueMeasurementMemberifrs-full:Level3OfFairValueHierarchyMemberbcs:FinancialAssetsAtFairValueThroughProfitOrLossCategoryTradingMember2023-01-012023-12-310000312069ifrs-full:InvestmentPropertyMemberifrs-full:RecurringFairValueMeasurementMemberbcs:FinancialAssetsAtFairValueThroughProfitOrLossCategoryOtherIncomeMemberifrs-full:Level3OfFairValueHierarchyMember2023-01-012023-12-310000312069ifrs-full:InvestmentPropertyMemberifrs-full:RecurringFairValueMeasurementMemberifrs-full:Level3OfFairValueHierarchyMember2023-12-310000312069ifrs-full:RecurringFairValueMeasurementMemberifrs-full:Level3OfFairValueHierarchyMemberifrs-full:FinancialLiabilitiesAtFairValueThroughProfitOrLossThatMeetDefinitionOfHeldForTradingCategoryMember2022-12-310000312069ifrs-full:RecurringFairValueMeasurementMemberifrs-full:Level3OfFairValueHierarchyMemberifrs-full:FinancialLiabilitiesAtFairValueThroughProfitOrLossThatMeetDefinitionOfHeldForTradingCategoryMember2023-01-012023-12-310000312069ifrs-full:RecurringFairValueMeasurementMemberbcs:FinancialLiabilitiesAtFairValueThroughProfitOrLossCategoryTradingMemberifrs-full:Level3OfFairValueHierarchyMemberifrs-full:FinancialLiabilitiesAtFairValueThroughProfitOrLossThatMeetDefinitionOfHeldForTradingCategoryMember2023-01-012023-12-310000312069ifrs-full:RecurringFairValueMeasurementMemberifrs-full:Level3OfFairValueHierarchyMemberbcs:FinancialLiabilitiesAtFairValueThroughProfitOrLossCategoryOtherIncomeMemberifrs-full:FinancialLiabilitiesAtFairValueThroughProfitOrLossThatMeetDefinitionOfHeldForTradingCategoryMember2023-01-012023-12-310000312069ifrs-full:RecurringFairValueMeasurementMemberifrs-full:Level3OfFairValueHierarchyMemberifrs-full:FinancialLiabilitiesAtFairValueThroughProfitOrLossThatMeetDefinitionOfHeldForTradingCategoryMember2023-12-310000312069ifrs-full:RecurringFairValueMeasurementMemberifrs-full:Level3OfFairValueHierarchyMemberifrs-full:FinancialLiabilitiesAtFairValueThroughProfitOrLossDesignatedUponInitialRecognitionCategoryMember2022-12-310000312069ifrs-full:RecurringFairValueMeasurementMemberifrs-full:Level3OfFairValueHierarchyMemberifrs-full:FinancialLiabilitiesAtFairValueThroughProfitOrLossDesignatedUponInitialRecognitionCategoryMember2023-01-012023-12-310000312069ifrs-full:RecurringFairValueMeasurementMemberbcs:FinancialLiabilitiesAtFairValueThroughProfitOrLossCategoryTradingMemberifrs-full:Level3OfFairValueHierarchyMemberifrs-full:FinancialLiabilitiesAtFairValueThroughProfitOrLossDesignatedUponInitialRecognitionCategoryMember2023-01-012023-12-310000312069ifrs-full:RecurringFairValueMeasurementMemberifrs-full:Level3OfFairValueHierarchyMemberbcs:FinancialLiabilitiesAtFairValueThroughProfitOrLossCategoryOtherIncomeMemberifrs-full:FinancialLiabilitiesAtFairValueThroughProfitOrLossDesignatedUponInitialRecognitionCategoryMember2023-01-012023-12-310000312069ifrs-full:RecurringFairValueMeasurementMemberifrs-full:Level3OfFairValueHierarchyMemberifrs-full:FinancialLiabilitiesAtFairValueThroughProfitOrLossDesignatedUponInitialRecognitionCategoryMember2023-12-310000312069ifrs-full:RecurringFairValueMeasurementMemberifrs-full:Level3OfFairValueHierarchyMemberifrs-full:DerivativesMemberifrs-full:InterestRateRiskMember2022-12-310000312069ifrs-full:RecurringFairValueMeasurementMemberifrs-full:Level3OfFairValueHierarchyMemberifrs-full:DerivativesMemberifrs-full:InterestRateRiskMember2023-01-012023-12-310000312069ifrs-full:RecurringFairValueMeasurementMemberifrs-full:Level3OfFairValueHierarchyMemberbcs:NetAssetsLiabilitiesAtFairValueThroughProfitOrLossCategoryTradingIncomeMemberifrs-full:DerivativesMemberifrs-full:InterestRateRiskMember2023-01-012023-12-310000312069ifrs-full:RecurringFairValueMeasurementMemberifrs-full:Level3OfFairValueHierarchyMemberbcs:NetAssetsLiabilitiesAtFairValueThroughProfitOrLossCategoryOtherIncomeMemberifrs-full:DerivativesMemberifrs-full:InterestRateRiskMember2023-01-012023-12-310000312069ifrs-full:RecurringFairValueMeasurementMemberifrs-full:Level3OfFairValueHierarchyMemberifrs-full:DerivativesMemberifrs-full:InterestRateRiskMember2023-12-310000312069ifrs-full:RecurringFairValueMeasurementMemberifrs-full:CurrencyRiskMemberifrs-full:Level3OfFairValueHierarchyMemberifrs-full:DerivativesMember2022-12-310000312069ifrs-full:RecurringFairValueMeasurementMemberifrs-full:CurrencyRiskMemberifrs-full:Level3OfFairValueHierarchyMemberifrs-full:DerivativesMember2023-01-012023-12-310000312069ifrs-full:RecurringFairValueMeasurementMemberifrs-full:CurrencyRiskMemberifrs-full:Level3OfFairValueHierarchyMemberbcs:NetAssetsLiabilitiesAtFairValueThroughProfitOrLossCategoryTradingIncomeMemberifrs-full:DerivativesMember2023-01-012023-12-310000312069ifrs-full:RecurringFairValueMeasurementMemberifrs-full:CurrencyRiskMemberifrs-full:Level3OfFairValueHierarchyMemberbcs:NetAssetsLiabilitiesAtFairValueThroughProfitOrLossCategoryOtherIncomeMemberifrs-full:DerivativesMember2023-01-012023-12-310000312069ifrs-full:RecurringFairValueMeasurementMemberifrs-full:CurrencyRiskMemberifrs-full:Level3OfFairValueHierarchyMemberifrs-full:DerivativesMember2023-12-310000312069ifrs-full:RecurringFairValueMeasurementMemberifrs-full:Level3OfFairValueHierarchyMemberifrs-full:CreditRiskMemberifrs-full:DerivativesMember2022-12-310000312069ifrs-full:RecurringFairValueMeasurementMemberifrs-full:Level3OfFairValueHierarchyMemberifrs-full:CreditRiskMemberifrs-full:DerivativesMember2023-01-012023-12-310000312069ifrs-full:RecurringFairValueMeasurementMemberifrs-full:Level3OfFairValueHierarchyMemberbcs:NetAssetsLiabilitiesAtFairValueThroughProfitOrLossCategoryTradingIncomeMemberifrs-full:CreditRiskMemberifrs-full:DerivativesMember2023-01-012023-12-310000312069ifrs-full:RecurringFairValueMeasurementMemberifrs-full:Level3OfFairValueHierarchyMemberbcs:NetAssetsLiabilitiesAtFairValueThroughProfitOrLossCategoryOtherIncomeMemberifrs-full:CreditRiskMemberifrs-full:DerivativesMember2023-01-012023-12-310000312069ifrs-full:RecurringFairValueMeasurementMemberifrs-full:Level3OfFairValueHierarchyMemberifrs-full:CreditRiskMemberifrs-full:DerivativesMember2023-12-310000312069ifrs-full:RecurringFairValueMeasurementMemberifrs-full:Level3OfFairValueHierarchyMemberifrs-full:EquityPriceRiskMemberifrs-full:DerivativesMember2022-12-310000312069ifrs-full:RecurringFairValueMeasurementMemberifrs-full:Level3OfFairValueHierarchyMemberifrs-full:EquityPriceRiskMemberifrs-full:DerivativesMember2023-01-012023-12-310000312069ifrs-full:RecurringFairValueMeasurementMemberifrs-full:Level3OfFairValueHierarchyMemberifrs-full:EquityPriceRiskMemberbcs:NetAssetsLiabilitiesAtFairValueThroughProfitOrLossCategoryTradingIncomeMemberifrs-full:DerivativesMember2023-01-012023-12-310000312069ifrs-full:RecurringFairValueMeasurementMemberifrs-full:Level3OfFairValueHierarchyMemberbcs:NetAssetsLiabilitiesAtFairValueThroughProfitOrLossCategoryOtherIncomeMemberifrs-full:EquityPriceRiskMemberifrs-full:DerivativesMember2023-01-012023-12-310000312069ifrs-full:RecurringFairValueMeasurementMemberifrs-full:Level3OfFairValueHierarchyMemberifrs-full:EquityPriceRiskMemberifrs-full:DerivativesMember2023-12-310000312069ifrs-full:RecurringFairValueMeasurementMemberifrs-full:Level3OfFairValueHierarchyMemberifrs-full:DerivativesMember2022-12-310000312069ifrs-full:RecurringFairValueMeasurementMemberifrs-full:Level3OfFairValueHierarchyMemberifrs-full:DerivativesMember2023-01-012023-12-310000312069ifrs-full:RecurringFairValueMeasurementMemberifrs-full:Level3OfFairValueHierarchyMemberbcs:NetAssetsLiabilitiesAtFairValueThroughProfitOrLossCategoryTradingIncomeMemberifrs-full:DerivativesMember2023-01-012023-12-310000312069ifrs-full:RecurringFairValueMeasurementMemberifrs-full:Level3OfFairValueHierarchyMemberbcs:NetAssetsLiabilitiesAtFairValueThroughProfitOrLossCategoryOtherIncomeMemberifrs-full:DerivativesMember2023-01-012023-12-310000312069ifrs-full:RecurringFairValueMeasurementMemberifrs-full:Level3OfFairValueHierarchyMemberifrs-full:DerivativesMember2023-12-310000312069ifrs-full:RecurringFairValueMeasurementMemberifrs-full:Level3OfFairValueHierarchyMember2022-12-310000312069ifrs-full:RecurringFairValueMeasurementMemberifrs-full:Level3OfFairValueHierarchyMember2023-01-012023-12-310000312069ifrs-full:RecurringFairValueMeasurementMemberifrs-full:Level3OfFairValueHierarchyMemberbcs:NetAssetsLiabilitiesAtFairValueThroughProfitOrLossCategoryTradingIncomeMember2023-01-012023-12-310000312069ifrs-full:RecurringFairValueMeasurementMemberifrs-full:Level3OfFairValueHierarchyMemberbcs:NetAssetsLiabilitiesAtFairValueThroughProfitOrLossCategoryOtherIncomeMember2023-01-012023-12-310000312069ifrs-full:RecurringFairValueMeasurementMemberifrs-full:Level3OfFairValueHierarchyMember2023-12-310000312069ifrs-full:RecurringFairValueMeasurementMemberifrs-full:Level3OfFairValueHierarchyMemberifrs-full:CorporateLoansMemberifrs-full:FinancialAssetsAtFairValueThroughProfitOrLossClassifiedAsHeldForTradingCategoryMember2021-12-310000312069ifrs-full:RecurringFairValueMeasurementMemberifrs-full:Level3OfFairValueHierarchyMemberifrs-full:CorporateLoansMemberifrs-full:FinancialAssetsAtFairValueThroughProfitOrLossClassifiedAsHeldForTradingCategoryMember2022-01-012022-12-310000312069ifrs-full:RecurringFairValueMeasurementMemberifrs-full:CorporateLoansMemberifrs-full:Level3OfFairValueHierarchyMemberifrs-full:FinancialAssetsAtFairValueThroughProfitOrLossClassifiedAsHeldForTradingCategoryMemberbcs:FinancialAssetsAtFairValueThroughProfitOrLossCategoryTradingMember2022-01-012022-12-310000312069ifrs-full:RecurringFairValueMeasurementMemberbcs:FinancialAssetsAtFairValueThroughProfitOrLossCategoryOtherIncomeMemberifrs-full:CorporateLoansMemberifrs-full:Level3OfFairValueHierarchyMemberifrs-full:FinancialAssetsAtFairValueThroughProfitOrLossClassifiedAsHeldForTradingCategoryMember2022-01-012022-12-310000312069ifrs-full:RecurringFairValueMeasurementMemberifrs-full:Level3OfFairValueHierarchyMemberbcs:NonAssetBackedLoansMemberifrs-full:FinancialAssetsAtFairValueThroughProfitOrLossClassifiedAsHeldForTradingCategoryMember2021-12-310000312069ifrs-full:RecurringFairValueMeasurementMemberifrs-full:Level3OfFairValueHierarchyMemberbcs:NonAssetBackedLoansMemberifrs-full:FinancialAssetsAtFairValueThroughProfitOrLossClassifiedAsHeldForTradingCategoryMember2022-01-012022-12-310000312069ifrs-full:RecurringFairValueMeasurementMemberbcs:NonAssetBackedLoansMemberifrs-full:Level3OfFairValueHierarchyMemberifrs-full:FinancialAssetsAtFairValueThroughProfitOrLossClassifiedAsHeldForTradingCategoryMemberbcs:FinancialAssetsAtFairValueThroughProfitOrLossCategoryTradingMember2022-01-012022-12-310000312069ifrs-full:RecurringFairValueMeasurementMemberbcs:FinancialAssetsAtFairValueThroughProfitOrLossCategoryOtherIncomeMemberbcs:NonAssetBackedLoansMemberifrs-full:Level3OfFairValueHierarchyMemberifrs-full:FinancialAssetsAtFairValueThroughProfitOrLossClassifiedAsHeldForTradingCategoryMember2022-01-012022-12-310000312069bcs:OtherFinancialAssetsAndLiabilitiesGroupOneMemberifrs-full:RecurringFairValueMeasurementMemberifrs-full:Level3OfFairValueHierarchyMemberifrs-full:FinancialAssetsAtFairValueThroughProfitOrLossClassifiedAsHeldForTradingCategoryMember2021-12-310000312069bcs:OtherFinancialAssetsAndLiabilitiesGroupOneMemberifrs-full:RecurringFairValueMeasurementMemberifrs-full:Level3OfFairValueHierarchyMemberifrs-full:FinancialAssetsAtFairValueThroughProfitOrLossClassifiedAsHeldForTradingCategoryMember2022-01-012022-12-310000312069bcs:OtherFinancialAssetsAndLiabilitiesGroupOneMemberifrs-full:RecurringFairValueMeasurementMemberifrs-full:Level3OfFairValueHierarchyMemberifrs-full:FinancialAssetsAtFairValueThroughProfitOrLossClassifiedAsHeldForTradingCategoryMemberbcs:FinancialAssetsAtFairValueThroughProfitOrLossCategoryTradingMember2022-01-012022-12-310000312069bcs:OtherFinancialAssetsAndLiabilitiesGroupOneMemberifrs-full:RecurringFairValueMeasurementMemberbcs:FinancialAssetsAtFairValueThroughProfitOrLossCategoryOtherIncomeMemberifrs-full:Level3OfFairValueHierarchyMemberifrs-full:FinancialAssetsAtFairValueThroughProfitOrLossClassifiedAsHeldForTradingCategoryMember2022-01-012022-12-310000312069ifrs-full:RecurringFairValueMeasurementMemberifrs-full:Level3OfFairValueHierarchyMemberifrs-full:FinancialAssetsAtFairValueThroughProfitOrLossClassifiedAsHeldForTradingCategoryMember2021-12-310000312069ifrs-full:RecurringFairValueMeasurementMemberifrs-full:Level3OfFairValueHierarchyMemberifrs-full:FinancialAssetsAtFairValueThroughProfitOrLossClassifiedAsHeldForTradingCategoryMember2022-01-012022-12-310000312069ifrs-full:RecurringFairValueMeasurementMemberifrs-full:Level3OfFairValueHierarchyMemberifrs-full:FinancialAssetsAtFairValueThroughProfitOrLossClassifiedAsHeldForTradingCategoryMemberbcs:FinancialAssetsAtFairValueThroughProfitOrLossCategoryTradingMember2022-01-012022-12-310000312069ifrs-full:RecurringFairValueMeasurementMemberbcs:FinancialAssetsAtFairValueThroughProfitOrLossCategoryOtherIncomeMemberifrs-full:Level3OfFairValueHierarchyMemberifrs-full:FinancialAssetsAtFairValueThroughProfitOrLossClassifiedAsHeldForTradingCategoryMember2022-01-012022-12-310000312069ifrs-full:RecurringFairValueMeasurementMemberifrs-full:Level3OfFairValueHierarchyMemberifrs-full:CorporateLoansMemberifrs-full:FinancialAssetsAtFairValueThroughProfitOrLossCategoryMember2021-12-310000312069ifrs-full:RecurringFairValueMeasurementMemberifrs-full:Level3OfFairValueHierarchyMemberifrs-full:CorporateLoansMemberifrs-full:FinancialAssetsAtFairValueThroughProfitOrLossCategoryMember2022-01-012022-12-310000312069ifrs-full:RecurringFairValueMeasurementMemberifrs-full:CorporateLoansMemberifrs-full:Level3OfFairValueHierarchyMemberbcs:FinancialAssetsAtFairValueThroughProfitOrLossCategoryTradingMemberifrs-full:FinancialAssetsAtFairValueThroughProfitOrLossCategoryMember2022-01-012022-12-310000312069ifrs-full:RecurringFairValueMeasurementMemberbcs:FinancialAssetsAtFairValueThroughProfitOrLossCategoryOtherIncomeMemberifrs-full:CorporateLoansMemberifrs-full:Level3OfFairValueHierarchyMemberifrs-full:FinancialAssetsAtFairValueThroughProfitOrLossCategoryMember2022-01-012022-12-310000312069ifrs-full:RecurringFairValueMeasurementMemberifrs-full:Level3OfFairValueHierarchyMemberbcs:NonAssetBackedLoansMemberifrs-full:FinancialAssetsAtFairValueThroughProfitOrLossCategoryMember2021-12-310000312069ifrs-full:RecurringFairValueMeasurementMemberifrs-full:Level3OfFairValueHierarchyMemberbcs:NonAssetBackedLoansMemberifrs-full:FinancialAssetsAtFairValueThroughProfitOrLossCategoryMember2022-01-012022-12-310000312069ifrs-full:RecurringFairValueMeasurementMemberbcs:NonAssetBackedLoansMemberifrs-full:Level3OfFairValueHierarchyMemberbcs:FinancialAssetsAtFairValueThroughProfitOrLossCategoryTradingMemberifrs-full:FinancialAssetsAtFairValueThroughProfitOrLossCategoryMember2022-01-012022-12-310000312069ifrs-full:RecurringFairValueMeasurementMemberbcs:FinancialAssetsAtFairValueThroughProfitOrLossCategoryOtherIncomeMemberbcs:NonAssetBackedLoansMemberifrs-full:Level3OfFairValueHierarchyMemberifrs-full:FinancialAssetsAtFairValueThroughProfitOrLossCategoryMember2022-01-012022-12-310000312069ifrs-full:RecurringFairValueMeasurementMemberifrs-full:Level3OfFairValueHierarchyMemberbcs:PrivateEquityInvestmentsMemberifrs-full:FinancialAssetsAtFairValueThroughProfitOrLossCategoryMember2021-12-310000312069ifrs-full:RecurringFairValueMeasurementMemberifrs-full:Level3OfFairValueHierarchyMemberbcs:PrivateEquityInvestmentsMemberifrs-full:FinancialAssetsAtFairValueThroughProfitOrLossCategoryMember2022-01-012022-12-310000312069ifrs-full:RecurringFairValueMeasurementMemberifrs-full:Level3OfFairValueHierarchyMemberbcs:PrivateEquityInvestmentsMemberbcs:FinancialAssetsAtFairValueThroughProfitOrLossCategoryTradingMemberifrs-full:FinancialAssetsAtFairValueThroughProfitOrLossCategoryMember2022-01-012022-12-310000312069ifrs-full:RecurringFairValueMeasurementMemberbcs:FinancialAssetsAtFairValueThroughProfitOrLossCategoryOtherIncomeMemberifrs-full:Level3OfFairValueHierarchyMemberbcs:PrivateEquityInvestmentsMemberifrs-full:FinancialAssetsAtFairValueThroughProfitOrLossCategoryMember2022-01-012022-12-310000312069ifrs-full:RecurringFairValueMeasurementMemberifrs-full:Level3OfFairValueHierarchyMemberbcs:ReverseRepurchaseAndRepurchaseAgreementsMemberifrs-full:FinancialAssetsAtFairValueThroughProfitOrLossCategoryMember2021-12-310000312069ifrs-full:RecurringFairValueMeasurementMemberifrs-full:Level3OfFairValueHierarchyMemberbcs:ReverseRepurchaseAndRepurchaseAgreementsMemberifrs-full:FinancialAssetsAtFairValueThroughProfitOrLossCategoryMember2022-01-012022-12-310000312069ifrs-full:RecurringFairValueMeasurementMemberifrs-full:Level3OfFairValueHierarchyMemberbcs:ReverseRepurchaseAndRepurchaseAgreementsMemberbcs:FinancialAssetsAtFairValueThroughProfitOrLossCategoryTradingMemberifrs-full:FinancialAssetsAtFairValueThroughProfitOrLossCategoryMember2022-01-012022-12-310000312069ifrs-full:RecurringFairValueMeasurementMemberbcs:FinancialAssetsAtFairValueThroughProfitOrLossCategoryOtherIncomeMemberifrs-full:Level3OfFairValueHierarchyMemberbcs:ReverseRepurchaseAndRepurchaseAgreementsMemberifrs-full:FinancialAssetsAtFairValueThroughProfitOrLossCategoryMember2022-01-012022-12-310000312069bcs:OtherFinancialAssetsAndLiabilitiesGroupOneMemberifrs-full:RecurringFairValueMeasurementMemberifrs-full:Level3OfFairValueHierarchyMemberifrs-full:FinancialAssetsAtFairValueThroughProfitOrLossCategoryMember2021-12-310000312069bcs:OtherFinancialAssetsAndLiabilitiesGroupOneMemberifrs-full:RecurringFairValueMeasurementMemberifrs-full:Level3OfFairValueHierarchyMemberifrs-full:FinancialAssetsAtFairValueThroughProfitOrLossCategoryMember2022-01-012022-12-310000312069bcs:OtherFinancialAssetsAndLiabilitiesGroupOneMemberifrs-full:RecurringFairValueMeasurementMemberifrs-full:Level3OfFairValueHierarchyMemberbcs:FinancialAssetsAtFairValueThroughProfitOrLossCategoryTradingMemberifrs-full:FinancialAssetsAtFairValueThroughProfitOrLossCategoryMember2022-01-012022-12-310000312069bcs:OtherFinancialAssetsAndLiabilitiesGroupOneMemberifrs-full:RecurringFairValueMeasurementMemberbcs:FinancialAssetsAtFairValueThroughProfitOrLossCategoryOtherIncomeMemberifrs-full:Level3OfFairValueHierarchyMemberifrs-full:FinancialAssetsAtFairValueThroughProfitOrLossCategoryMember2022-01-012022-12-310000312069ifrs-full:RecurringFairValueMeasurementMemberifrs-full:Level3OfFairValueHierarchyMemberifrs-full:FinancialAssetsAtFairValueThroughProfitOrLossCategoryMember2021-12-310000312069ifrs-full:RecurringFairValueMeasurementMemberifrs-full:Level3OfFairValueHierarchyMemberifrs-full:FinancialAssetsAtFairValueThroughProfitOrLossCategoryMember2022-01-012022-12-310000312069ifrs-full:RecurringFairValueMeasurementMemberifrs-full:Level3OfFairValueHierarchyMemberbcs:FinancialAssetsAtFairValueThroughProfitOrLossCategoryTradingMemberifrs-full:FinancialAssetsAtFairValueThroughProfitOrLossCategoryMember2022-01-012022-12-310000312069ifrs-full:RecurringFairValueMeasurementMemberbcs:FinancialAssetsAtFairValueThroughProfitOrLossCategoryOtherIncomeMemberifrs-full:Level3OfFairValueHierarchyMemberifrs-full:FinancialAssetsAtFairValueThroughProfitOrLossCategoryMember2022-01-012022-12-310000312069ifrs-full:RecurringFairValueMeasurementMemberifrs-full:Level3OfFairValueHierarchyMemberifrs-full:FinancialAssetsAtFairValueThroughOtherComprehensiveIncomeCategoryMemberbcs:PrivateEquityInvestmentsMember2021-12-310000312069ifrs-full:RecurringFairValueMeasurementMemberifrs-full:Level3OfFairValueHierarchyMemberifrs-full:FinancialAssetsAtFairValueThroughOtherComprehensiveIncomeCategoryMemberbcs:PrivateEquityInvestmentsMember2022-01-012022-12-310000312069ifrs-full:RecurringFairValueMeasurementMemberifrs-full:Level3OfFairValueHierarchyMemberifrs-full:FinancialAssetsAtFairValueThroughOtherComprehensiveIncomeCategoryMemberbcs:PrivateEquityInvestmentsMemberbcs:FinancialAssetsAtFairValueThroughProfitOrLossCategoryTradingMember2022-01-012022-12-310000312069ifrs-full:RecurringFairValueMeasurementMemberbcs:FinancialAssetsAtFairValueThroughProfitOrLossCategoryOtherIncomeMemberifrs-full:Level3OfFairValueHierarchyMemberifrs-full:FinancialAssetsAtFairValueThroughOtherComprehensiveIncomeCategoryMemberbcs:PrivateEquityInvestmentsMember2022-01-012022-12-310000312069bcs:OtherFinancialAssetsAndLiabilitiesGroupOneMemberifrs-full:RecurringFairValueMeasurementMemberifrs-full:Level3OfFairValueHierarchyMemberifrs-full:FinancialAssetsAtFairValueThroughOtherComprehensiveIncomeCategoryMember2021-12-310000312069bcs:OtherFinancialAssetsAndLiabilitiesGroupOneMemberifrs-full:RecurringFairValueMeasurementMemberifrs-full:Level3OfFairValueHierarchyMemberifrs-full:FinancialAssetsAtFairValueThroughOtherComprehensiveIncomeCategoryMember2022-01-012022-12-310000312069bcs:OtherFinancialAssetsAndLiabilitiesGroupOneMemberifrs-full:RecurringFairValueMeasurementMemberifrs-full:Level3OfFairValueHierarchyMemberifrs-full:FinancialAssetsAtFairValueThroughOtherComprehensiveIncomeCategoryMemberbcs:FinancialAssetsAtFairValueThroughProfitOrLossCategoryTradingMember2022-01-012022-12-310000312069bcs:OtherFinancialAssetsAndLiabilitiesGroupOneMemberifrs-full:RecurringFairValueMeasurementMemberbcs:FinancialAssetsAtFairValueThroughProfitOrLossCategoryOtherIncomeMemberifrs-full:Level3OfFairValueHierarchyMemberifrs-full:FinancialAssetsAtFairValueThroughOtherComprehensiveIncomeCategoryMember2022-01-012022-12-310000312069ifrs-full:RecurringFairValueMeasurementMemberifrs-full:Level3OfFairValueHierarchyMemberifrs-full:FinancialAssetsAtFairValueThroughOtherComprehensiveIncomeCategoryMember2021-12-310000312069ifrs-full:RecurringFairValueMeasurementMemberifrs-full:Level3OfFairValueHierarchyMemberifrs-full:FinancialAssetsAtFairValueThroughOtherComprehensiveIncomeCategoryMember2022-01-012022-12-310000312069ifrs-full:RecurringFairValueMeasurementMemberifrs-full:Level3OfFairValueHierarchyMemberifrs-full:FinancialAssetsAtFairValueThroughOtherComprehensiveIncomeCategoryMemberbcs:FinancialAssetsAtFairValueThroughProfitOrLossCategoryTradingMember2022-01-012022-12-310000312069ifrs-full:RecurringFairValueMeasurementMemberbcs:FinancialAssetsAtFairValueThroughProfitOrLossCategoryOtherIncomeMemberifrs-full:Level3OfFairValueHierarchyMemberifrs-full:FinancialAssetsAtFairValueThroughOtherComprehensiveIncomeCategoryMember2022-01-012022-12-310000312069ifrs-full:InvestmentPropertyMemberifrs-full:RecurringFairValueMeasurementMemberifrs-full:Level3OfFairValueHierarchyMember2021-12-310000312069ifrs-full:InvestmentPropertyMemberifrs-full:RecurringFairValueMeasurementMemberifrs-full:Level3OfFairValueHierarchyMember2022-01-012022-12-310000312069ifrs-full:InvestmentPropertyMemberifrs-full:RecurringFairValueMeasurementMemberifrs-full:Level3OfFairValueHierarchyMemberbcs:FinancialAssetsAtFairValueThroughProfitOrLossCategoryTradingMember2022-01-012022-12-310000312069ifrs-full:InvestmentPropertyMemberifrs-full:RecurringFairValueMeasurementMemberbcs:FinancialAssetsAtFairValueThroughProfitOrLossCategoryOtherIncomeMemberifrs-full:Level3OfFairValueHierarchyMember2022-01-012022-12-310000312069ifrs-full:RecurringFairValueMeasurementMemberifrs-full:Level3OfFairValueHierarchyMemberifrs-full:FinancialLiabilitiesAtFairValueThroughProfitOrLossThatMeetDefinitionOfHeldForTradingCategoryMember2021-12-310000312069ifrs-full:RecurringFairValueMeasurementMemberifrs-full:Level3OfFairValueHierarchyMemberifrs-full:FinancialLiabilitiesAtFairValueThroughProfitOrLossThatMeetDefinitionOfHeldForTradingCategoryMember2022-01-012022-12-310000312069ifrs-full:RecurringFairValueMeasurementMemberbcs:FinancialLiabilitiesAtFairValueThroughProfitOrLossCategoryTradingMemberifrs-full:Level3OfFairValueHierarchyMemberifrs-full:FinancialLiabilitiesAtFairValueThroughProfitOrLossThatMeetDefinitionOfHeldForTradingCategoryMember2022-01-012022-12-310000312069ifrs-full:RecurringFairValueMeasurementMemberifrs-full:Level3OfFairValueHierarchyMemberbcs:FinancialLiabilitiesAtFairValueThroughProfitOrLossCategoryOtherIncomeMemberifrs-full:FinancialLiabilitiesAtFairValueThroughProfitOrLossThatMeetDefinitionOfHeldForTradingCategoryMember2022-01-012022-12-310000312069ifrs-full:RecurringFairValueMeasurementMemberifrs-full:Level3OfFairValueHierarchyMemberifrs-full:FinancialLiabilitiesAtFairValueThroughProfitOrLossDesignatedUponInitialRecognitionCategoryMember2021-12-310000312069ifrs-full:RecurringFairValueMeasurementMemberifrs-full:Level3OfFairValueHierarchyMemberifrs-full:FinancialLiabilitiesAtFairValueThroughProfitOrLossDesignatedUponInitialRecognitionCategoryMember2022-01-012022-12-310000312069ifrs-full:RecurringFairValueMeasurementMemberbcs:FinancialLiabilitiesAtFairValueThroughProfitOrLossCategoryTradingMemberifrs-full:Level3OfFairValueHierarchyMemberifrs-full:FinancialLiabilitiesAtFairValueThroughProfitOrLossDesignatedUponInitialRecognitionCategoryMember2022-01-012022-12-310000312069ifrs-full:RecurringFairValueMeasurementMemberifrs-full:Level3OfFairValueHierarchyMemberbcs:FinancialLiabilitiesAtFairValueThroughProfitOrLossCategoryOtherIncomeMemberifrs-full:FinancialLiabilitiesAtFairValueThroughProfitOrLossDesignatedUponInitialRecognitionCategoryMember2022-01-012022-12-310000312069ifrs-full:RecurringFairValueMeasurementMemberifrs-full:Level3OfFairValueHierarchyMemberifrs-full:DerivativesMemberifrs-full:InterestRateRiskMember2021-12-310000312069ifrs-full:RecurringFairValueMeasurementMemberifrs-full:Level3OfFairValueHierarchyMemberifrs-full:DerivativesMemberifrs-full:InterestRateRiskMember2022-01-012022-12-310000312069ifrs-full:RecurringFairValueMeasurementMemberifrs-full:Level3OfFairValueHierarchyMemberbcs:NetAssetsLiabilitiesAtFairValueThroughProfitOrLossCategoryTradingIncomeMemberifrs-full:DerivativesMemberifrs-full:InterestRateRiskMember2022-01-012022-12-310000312069ifrs-full:RecurringFairValueMeasurementMemberifrs-full:Level3OfFairValueHierarchyMemberbcs:NetAssetsLiabilitiesAtFairValueThroughProfitOrLossCategoryOtherIncomeMemberifrs-full:DerivativesMemberifrs-full:InterestRateRiskMember2022-01-012022-12-310000312069ifrs-full:RecurringFairValueMeasurementMemberifrs-full:CurrencyRiskMemberifrs-full:Level3OfFairValueHierarchyMemberifrs-full:DerivativesMember2021-12-310000312069ifrs-full:RecurringFairValueMeasurementMemberifrs-full:CurrencyRiskMemberifrs-full:Level3OfFairValueHierarchyMemberifrs-full:DerivativesMember2022-01-012022-12-310000312069ifrs-full:RecurringFairValueMeasurementMemberifrs-full:CurrencyRiskMemberifrs-full:Level3OfFairValueHierarchyMemberbcs:NetAssetsLiabilitiesAtFairValueThroughProfitOrLossCategoryTradingIncomeMemberifrs-full:DerivativesMember2022-01-012022-12-310000312069ifrs-full:RecurringFairValueMeasurementMemberifrs-full:CurrencyRiskMemberifrs-full:Level3OfFairValueHierarchyMemberbcs:NetAssetsLiabilitiesAtFairValueThroughProfitOrLossCategoryOtherIncomeMemberifrs-full:DerivativesMember2022-01-012022-12-310000312069ifrs-full:RecurringFairValueMeasurementMemberifrs-full:Level3OfFairValueHierarchyMemberifrs-full:CreditRiskMemberifrs-full:DerivativesMember2021-12-310000312069ifrs-full:RecurringFairValueMeasurementMemberifrs-full:Level3OfFairValueHierarchyMemberifrs-full:CreditRiskMemberifrs-full:DerivativesMember2022-01-012022-12-310000312069ifrs-full:RecurringFairValueMeasurementMemberifrs-full:Level3OfFairValueHierarchyMemberbcs:NetAssetsLiabilitiesAtFairValueThroughProfitOrLossCategoryTradingIncomeMemberifrs-full:CreditRiskMemberifrs-full:DerivativesMember2022-01-012022-12-310000312069ifrs-full:RecurringFairValueMeasurementMemberifrs-full:Level3OfFairValueHierarchyMemberbcs:NetAssetsLiabilitiesAtFairValueThroughProfitOrLossCategoryOtherIncomeMemberifrs-full:CreditRiskMemberifrs-full:DerivativesMember2022-01-012022-12-310000312069ifrs-full:RecurringFairValueMeasurementMemberifrs-full:Level3OfFairValueHierarchyMemberifrs-full:EquityPriceRiskMemberifrs-full:DerivativesMember2021-12-310000312069ifrs-full:RecurringFairValueMeasurementMemberifrs-full:Level3OfFairValueHierarchyMemberifrs-full:EquityPriceRiskMemberifrs-full:DerivativesMember2022-01-012022-12-310000312069ifrs-full:RecurringFairValueMeasurementMemberifrs-full:Level3OfFairValueHierarchyMemberifrs-full:EquityPriceRiskMemberbcs:NetAssetsLiabilitiesAtFairValueThroughProfitOrLossCategoryTradingIncomeMemberifrs-full:DerivativesMember2022-01-012022-12-310000312069ifrs-full:RecurringFairValueMeasurementMemberifrs-full:Level3OfFairValueHierarchyMemberbcs:NetAssetsLiabilitiesAtFairValueThroughProfitOrLossCategoryOtherIncomeMemberifrs-full:EquityPriceRiskMemberifrs-full:DerivativesMember2022-01-012022-12-310000312069ifrs-full:RecurringFairValueMeasurementMemberifrs-full:Level3OfFairValueHierarchyMemberifrs-full:DerivativesMember2021-12-310000312069ifrs-full:RecurringFairValueMeasurementMemberifrs-full:Level3OfFairValueHierarchyMemberifrs-full:DerivativesMember2022-01-012022-12-310000312069ifrs-full:RecurringFairValueMeasurementMemberifrs-full:Level3OfFairValueHierarchyMemberbcs:NetAssetsLiabilitiesAtFairValueThroughProfitOrLossCategoryTradingIncomeMemberifrs-full:DerivativesMember2022-01-012022-12-310000312069ifrs-full:RecurringFairValueMeasurementMemberifrs-full:Level3OfFairValueHierarchyMemberbcs:NetAssetsLiabilitiesAtFairValueThroughProfitOrLossCategoryOtherIncomeMemberifrs-full:DerivativesMember2022-01-012022-12-310000312069ifrs-full:RecurringFairValueMeasurementMemberifrs-full:Level3OfFairValueHierarchyMember2021-12-310000312069ifrs-full:RecurringFairValueMeasurementMemberifrs-full:Level3OfFairValueHierarchyMember2022-01-012022-12-310000312069ifrs-full:RecurringFairValueMeasurementMemberifrs-full:Level3OfFairValueHierarchyMemberbcs:NetAssetsLiabilitiesAtFairValueThroughProfitOrLossCategoryTradingIncomeMember2022-01-012022-12-310000312069ifrs-full:RecurringFairValueMeasurementMemberifrs-full:Level3OfFairValueHierarchyMemberbcs:NetAssetsLiabilitiesAtFairValueThroughProfitOrLossCategoryOtherIncomeMember2022-01-012022-12-310000312069ifrs-full:Level3OfFairValueHierarchyMemberifrs-full:FinancialAssetsAtFairValueThroughProfitOrLossClassifiedAsHeldForTradingCategoryMember2023-01-012023-12-310000312069ifrs-full:Level3OfFairValueHierarchyMemberifrs-full:FinancialAssetsAtFairValueThroughProfitOrLossClassifiedAsHeldForTradingCategoryMember2022-01-012022-12-310000312069ifrs-full:Level3OfFairValueHierarchyMemberifrs-full:FinancialAssetsAtFairValueThroughProfitOrLossCategoryMember2023-01-012023-12-310000312069ifrs-full:Level3OfFairValueHierarchyMemberifrs-full:FinancialAssetsAtFairValueThroughProfitOrLossCategoryMember2022-01-012022-12-310000312069ifrs-full:Level3OfFairValueHierarchyMemberifrs-full:FinancialAssetsAtFairValueThroughOtherComprehensiveIncomeCategoryMember2023-01-012023-12-310000312069ifrs-full:Level3OfFairValueHierarchyMemberifrs-full:FinancialAssetsAtFairValueThroughOtherComprehensiveIncomeCategoryMember2022-01-012022-12-310000312069ifrs-full:InvestmentPropertyMemberifrs-full:Level3OfFairValueHierarchyMember2023-01-012023-12-310000312069ifrs-full:InvestmentPropertyMemberifrs-full:Level3OfFairValueHierarchyMember2022-01-012022-12-310000312069ifrs-full:Level3OfFairValueHierarchyMemberifrs-full:FinancialLiabilitiesAtFairValueThroughProfitOrLossThatMeetDefinitionOfHeldForTradingCategoryMember2023-01-012023-12-310000312069ifrs-full:Level3OfFairValueHierarchyMemberifrs-full:FinancialLiabilitiesAtFairValueThroughProfitOrLossThatMeetDefinitionOfHeldForTradingCategoryMember2022-01-012022-12-310000312069ifrs-full:Level3OfFairValueHierarchyMemberifrs-full:FinancialLiabilitiesAtFairValueThroughProfitOrLossDesignatedUponInitialRecognitionCategoryMember2023-01-012023-12-310000312069ifrs-full:Level3OfFairValueHierarchyMemberifrs-full:FinancialLiabilitiesAtFairValueThroughProfitOrLossDesignatedUponInitialRecognitionCategoryMember2022-01-012022-12-310000312069ifrs-full:Level3OfFairValueHierarchyMemberifrs-full:DerivativesMember2023-01-012023-12-310000312069ifrs-full:Level3OfFairValueHierarchyMemberifrs-full:DerivativesMember2022-01-012022-12-310000312069ifrs-full:Level3OfFairValueHierarchyMember2023-01-012023-12-310000312069ifrs-full:Level3OfFairValueHierarchyMember2022-01-012022-12-310000312069ifrs-full:CurrentEstimateOfFutureCashOutflowsToBePaidToFulfilObligationMeasurementInputMemberifrs-full:Level3OfFairValueHierarchyMemberifrs-full:BottomOfRangeMemberifrs-full:DiscountedCashFlowMemberifrs-full:InterestRateRiskMember2023-12-310000312069ifrs-full:TopOfRangeMemberifrs-full:CurrentEstimateOfFutureCashOutflowsToBePaidToFulfilObligationMeasurementInputMemberifrs-full:Level3OfFairValueHierarchyMemberifrs-full:DiscountedCashFlowMemberifrs-full:InterestRateRiskMember2023-12-310000312069ifrs-full:CurrentEstimateOfFutureCashOutflowsToBePaidToFulfilObligationMeasurementInputMemberifrs-full:Level3OfFairValueHierarchyMemberifrs-full:BottomOfRangeMemberifrs-full:DiscountedCashFlowMemberifrs-full:InterestRateRiskMember2022-12-310000312069ifrs-full:TopOfRangeMemberifrs-full:CurrentEstimateOfFutureCashOutflowsToBePaidToFulfilObligationMeasurementInputMemberifrs-full:Level3OfFairValueHierarchyMemberifrs-full:DiscountedCashFlowMemberifrs-full:InterestRateRiskMember2022-12-310000312069ifrs-full:Level3OfFairValueHierarchyMemberifrs-full:BottomOfRangeMemberifrs-full:DiscountedCashFlowMemberifrs-full:CreditSpreadMeasurementInputMemberifrs-full:InterestRateRiskMember2023-12-310000312069ifrs-full:TopOfRangeMemberifrs-full:Level3OfFairValueHierarchyMemberifrs-full:DiscountedCashFlowMemberifrs-full:CreditSpreadMeasurementInputMemberifrs-full:InterestRateRiskMember2023-12-310000312069ifrs-full:Level3OfFairValueHierarchyMemberifrs-full:BottomOfRangeMemberifrs-full:DiscountedCashFlowMemberifrs-full:CreditSpreadMeasurementInputMemberifrs-full:InterestRateRiskMember2022-12-310000312069ifrs-full:TopOfRangeMemberifrs-full:Level3OfFairValueHierarchyMemberifrs-full:DiscountedCashFlowMemberifrs-full:CreditSpreadMeasurementInputMemberifrs-full:InterestRateRiskMember2022-12-310000312069ifrs-full:Level3OfFairValueHierarchyMemberifrs-full:HistoricalVolatilityForSharesMeasurementInputMemberifrs-full:BottomOfRangeMemberifrs-full:DiscountedCashFlowMemberifrs-full:InterestRateRiskMember2023-12-310000312069ifrs-full:TopOfRangeMemberifrs-full:Level3OfFairValueHierarchyMemberifrs-full:HistoricalVolatilityForSharesMeasurementInputMemberifrs-full:DiscountedCashFlowMemberifrs-full:InterestRateRiskMember2023-12-310000312069ifrs-full:Level3OfFairValueHierarchyMemberifrs-full:HistoricalVolatilityForSharesMeasurementInputMemberifrs-full:BottomOfRangeMemberifrs-full:DiscountedCashFlowMemberifrs-full:InterestRateRiskMember2022-12-310000312069ifrs-full:TopOfRangeMemberifrs-full:Level3OfFairValueHierarchyMemberifrs-full:HistoricalVolatilityForSharesMeasurementInputMemberifrs-full:DiscountedCashFlowMemberifrs-full:InterestRateRiskMember2022-12-310000312069bcs:GrowthMeasurementInputMemberifrs-full:Level3OfFairValueHierarchyMemberifrs-full:BottomOfRangeMemberifrs-full:DiscountedCashFlowMemberifrs-full:InterestRateRiskMember2023-12-310000312069ifrs-full:TopOfRangeMemberbcs:GrowthMeasurementInputMemberifrs-full:Level3OfFairValueHierarchyMemberifrs-full:DiscountedCashFlowMemberifrs-full:InterestRateRiskMember2023-12-310000312069bcs:GrowthMeasurementInputMemberifrs-full:Level3OfFairValueHierarchyMemberifrs-full:BottomOfRangeMemberifrs-full:DiscountedCashFlowMemberifrs-full:InterestRateRiskMember2022-12-310000312069ifrs-full:TopOfRangeMemberbcs:GrowthMeasurementInputMemberifrs-full:Level3OfFairValueHierarchyMemberifrs-full:DiscountedCashFlowMemberifrs-full:InterestRateRiskMember2022-12-310000312069ifrs-full:CurrentEstimateOfFutureCashOutflowsToBePaidToFulfilObligationMeasurementInputMemberifrs-full:Level3OfFairValueHierarchyMemberifrs-full:BottomOfRangeMemberbcs:CorrelationModelMemberifrs-full:InterestRateRiskMember2023-12-310000312069ifrs-full:TopOfRangeMemberifrs-full:CurrentEstimateOfFutureCashOutflowsToBePaidToFulfilObligationMeasurementInputMemberifrs-full:Level3OfFairValueHierarchyMemberbcs:CorrelationModelMemberifrs-full:InterestRateRiskMember2023-12-310000312069ifrs-full:CurrentEstimateOfFutureCashOutflowsToBePaidToFulfilObligationMeasurementInputMemberifrs-full:Level3OfFairValueHierarchyMemberifrs-full:BottomOfRangeMemberbcs:CorrelationModelMemberifrs-full:InterestRateRiskMember2022-12-310000312069ifrs-full:TopOfRangeMemberifrs-full:CurrentEstimateOfFutureCashOutflowsToBePaidToFulfilObligationMeasurementInputMemberifrs-full:Level3OfFairValueHierarchyMemberbcs:CorrelationModelMemberifrs-full:InterestRateRiskMember2022-12-310000312069ifrs-full:Level3OfFairValueHierarchyMemberifrs-full:HistoricalVolatilityForSharesMeasurementInputMemberifrs-full:BottomOfRangeMemberifrs-full:OptionPricingModelMemberifrs-full:InterestRateRiskMember2023-12-310000312069ifrs-full:TopOfRangeMemberifrs-full:Level3OfFairValueHierarchyMemberifrs-full:HistoricalVolatilityForSharesMeasurementInputMemberifrs-full:OptionPricingModelMemberifrs-full:InterestRateRiskMember2023-12-310000312069ifrs-full:Level3OfFairValueHierarchyMemberifrs-full:HistoricalVolatilityForSharesMeasurementInputMemberifrs-full:BottomOfRangeMemberifrs-full:OptionPricingModelMemberifrs-full:InterestRateRiskMember2022-12-310000312069ifrs-full:TopOfRangeMemberifrs-full:Level3OfFairValueHierarchyMemberifrs-full:HistoricalVolatilityForSharesMeasurementInputMemberifrs-full:OptionPricingModelMemberifrs-full:InterestRateRiskMember2022-12-310000312069ifrs-full:InterestRateMeasurementInputMemberifrs-full:Level3OfFairValueHierarchyMemberifrs-full:BottomOfRangeMemberifrs-full:OptionPricingModelMemberifrs-full:InterestRateRiskMember2023-12-310000312069ifrs-full:TopOfRangeMemberifrs-full:InterestRateMeasurementInputMemberifrs-full:Level3OfFairValueHierarchyMemberifrs-full:OptionPricingModelMemberifrs-full:InterestRateRiskMember2023-12-310000312069ifrs-full:InterestRateMeasurementInputMemberifrs-full:Level3OfFairValueHierarchyMemberifrs-full:BottomOfRangeMemberifrs-full:OptionPricingModelMemberifrs-full:InterestRateRiskMember2022-12-310000312069ifrs-full:TopOfRangeMemberifrs-full:InterestRateMeasurementInputMemberifrs-full:Level3OfFairValueHierarchyMemberifrs-full:OptionPricingModelMemberifrs-full:InterestRateRiskMember2022-12-310000312069ifrs-full:Level3OfFairValueHierarchyMemberifrs-full:BottomOfRangeMemberifrs-full:OptionPricingModelMemberifrs-full:InterestRateRiskMemberbcs:ProbabilityOfDefaultForeignExchangeMeasurementInputMember2023-12-310000312069ifrs-full:TopOfRangeMemberifrs-full:Level3OfFairValueHierarchyMemberifrs-full:OptionPricingModelMemberifrs-full:InterestRateRiskMemberbcs:ProbabilityOfDefaultForeignExchangeMeasurementInputMember2023-12-310000312069ifrs-full:Level3OfFairValueHierarchyMemberifrs-full:BottomOfRangeMemberifrs-full:OptionPricingModelMemberifrs-full:InterestRateRiskMemberbcs:ProbabilityOfDefaultForeignExchangeMeasurementInputMember2022-12-310000312069ifrs-full:TopOfRangeMemberifrs-full:Level3OfFairValueHierarchyMemberifrs-full:OptionPricingModelMemberifrs-full:InterestRateRiskMemberbcs:ProbabilityOfDefaultForeignExchangeMeasurementInputMember2022-12-310000312069ifrs-full:Level3OfFairValueHierarchyMemberifrs-full:BottomOfRangeMemberifrs-full:ProbabilityOfDefaultMeasurementInputMemberifrs-full:OptionPricingModelMemberifrs-full:InterestRateRiskMember2023-12-310000312069ifrs-full:TopOfRangeMemberifrs-full:Level3OfFairValueHierarchyMemberifrs-full:ProbabilityOfDefaultMeasurementInputMemberifrs-full:OptionPricingModelMemberifrs-full:InterestRateRiskMember2023-12-310000312069ifrs-full:Level3OfFairValueHierarchyMemberifrs-full:BottomOfRangeMemberifrs-full:ProbabilityOfDefaultMeasurementInputMemberifrs-full:OptionPricingModelMemberifrs-full:InterestRateRiskMember2022-12-310000312069ifrs-full:TopOfRangeMemberifrs-full:Level3OfFairValueHierarchyMemberifrs-full:ProbabilityOfDefaultMeasurementInputMemberifrs-full:OptionPricingModelMemberifrs-full:InterestRateRiskMember2022-12-310000312069ifrs-full:Level3OfFairValueHierarchyMemberifrs-full:BottomOfRangeMemberifrs-full:DiscountedCashFlowMemberifrs-full:CreditRiskMemberifrs-full:CreditSpreadMeasurementInputMember2023-12-310000312069ifrs-full:TopOfRangeMemberifrs-full:Level3OfFairValueHierarchyMemberifrs-full:DiscountedCashFlowMemberifrs-full:CreditRiskMemberifrs-full:CreditSpreadMeasurementInputMember2023-12-310000312069ifrs-full:Level3OfFairValueHierarchyMemberifrs-full:BottomOfRangeMemberifrs-full:DiscountedCashFlowMemberifrs-full:CreditRiskMemberifrs-full:CreditSpreadMeasurementInputMember2022-12-310000312069ifrs-full:TopOfRangeMemberifrs-full:Level3OfFairValueHierarchyMemberifrs-full:DiscountedCashFlowMemberifrs-full:CreditRiskMemberifrs-full:CreditSpreadMeasurementInputMember2022-12-310000312069ifrs-full:MarketComparablePricesMemberifrs-full:Level3OfFairValueHierarchyMemberifrs-full:AdjustmentToMidmarketConsensusPriceMeasurementInputMemberifrs-full:BottomOfRangeMemberifrs-full:CreditRiskMember2023-12-310000312069ifrs-full:TopOfRangeMemberifrs-full:MarketComparablePricesMemberifrs-full:Level3OfFairValueHierarchyMemberifrs-full:AdjustmentToMidmarketConsensusPriceMeasurementInputMemberifrs-full:CreditRiskMember2023-12-310000312069ifrs-full:MarketComparablePricesMemberifrs-full:Level3OfFairValueHierarchyMemberifrs-full:AdjustmentToMidmarketConsensusPriceMeasurementInputMemberifrs-full:BottomOfRangeMemberifrs-full:CreditRiskMember2022-12-310000312069ifrs-full:TopOfRangeMemberifrs-full:MarketComparablePricesMemberifrs-full:Level3OfFairValueHierarchyMemberifrs-full:AdjustmentToMidmarketConsensusPriceMeasurementInputMemberifrs-full:CreditRiskMember2022-12-310000312069ifrs-full:Level3OfFairValueHierarchyMemberifrs-full:HistoricalVolatilityForSharesMeasurementInputMemberifrs-full:BottomOfRangeMemberifrs-full:EquityPriceRiskMemberifrs-full:OptionPricingModelMember2023-12-310000312069ifrs-full:TopOfRangeMemberifrs-full:Level3OfFairValueHierarchyMemberifrs-full:HistoricalVolatilityForSharesMeasurementInputMemberifrs-full:EquityPriceRiskMemberifrs-full:OptionPricingModelMember2023-12-310000312069ifrs-full:Level3OfFairValueHierarchyMemberifrs-full:HistoricalVolatilityForSharesMeasurementInputMemberifrs-full:BottomOfRangeMemberifrs-full:EquityPriceRiskMemberifrs-full:OptionPricingModelMember2022-12-310000312069ifrs-full:TopOfRangeMemberifrs-full:Level3OfFairValueHierarchyMemberifrs-full:HistoricalVolatilityForSharesMeasurementInputMemberifrs-full:EquityPriceRiskMemberifrs-full:OptionPricingModelMember2022-12-310000312069ifrs-full:RevenueMultipleMeasurementInputMemberifrs-full:Level3OfFairValueHierarchyMemberifrs-full:BottomOfRangeMemberifrs-full:EquityPriceRiskMemberifrs-full:OptionPricingModelMember2023-12-310000312069ifrs-full:TopOfRangeMemberifrs-full:RevenueMultipleMeasurementInputMemberifrs-full:Level3OfFairValueHierarchyMemberifrs-full:EquityPriceRiskMemberifrs-full:OptionPricingModelMember2023-12-310000312069ifrs-full:RevenueMultipleMeasurementInputMemberifrs-full:Level3OfFairValueHierarchyMemberifrs-full:BottomOfRangeMemberifrs-full:EquityPriceRiskMemberifrs-full:OptionPricingModelMember2022-12-310000312069ifrs-full:TopOfRangeMemberifrs-full:RevenueMultipleMeasurementInputMemberifrs-full:Level3OfFairValueHierarchyMemberifrs-full:EquityPriceRiskMemberifrs-full:OptionPricingModelMember2022-12-310000312069ifrs-full:Level3OfFairValueHierarchyMemberifrs-full:BottomOfRangeMemberifrs-full:EquityPriceRiskMemberifrs-full:DiscountedCashFlowMemberifrs-full:DiscountRateMeasurementInputMember2023-12-310000312069ifrs-full:TopOfRangeMemberifrs-full:Level3OfFairValueHierarchyMemberifrs-full:EquityPriceRiskMemberifrs-full:DiscountedCashFlowMemberifrs-full:DiscountRateMeasurementInputMember2023-12-310000312069ifrs-full:Level3OfFairValueHierarchyMemberifrs-full:BottomOfRangeMemberifrs-full:EquityPriceRiskMemberifrs-full:DiscountedCashFlowMemberifrs-full:DiscountRateMeasurementInputMember2022-12-310000312069ifrs-full:TopOfRangeMemberifrs-full:Level3OfFairValueHierarchyMemberifrs-full:EquityPriceRiskMemberifrs-full:DiscountedCashFlowMemberifrs-full:DiscountRateMeasurementInputMember2022-12-310000312069bcs:NonAssetBackedLoansMemberbcs:LoanSpreadMeasurementInputMemberifrs-full:Level3OfFairValueHierarchyMemberifrs-full:BottomOfRangeMemberifrs-full:DiscountedCashFlowMember2023-12-310000312069ifrs-full:TopOfRangeMemberbcs:NonAssetBackedLoansMemberbcs:LoanSpreadMeasurementInputMemberifrs-full:Level3OfFairValueHierarchyMemberifrs-full:DiscountedCashFlowMember2023-12-310000312069bcs:NonAssetBackedLoansMemberbcs:LoanSpreadMeasurementInputMemberifrs-full:Level3OfFairValueHierarchyMemberifrs-full:BottomOfRangeMemberifrs-full:DiscountedCashFlowMember2022-12-310000312069ifrs-full:TopOfRangeMemberbcs:NonAssetBackedLoansMemberbcs:LoanSpreadMeasurementInputMemberifrs-full:Level3OfFairValueHierarchyMemberifrs-full:DiscountedCashFlowMember2022-12-310000312069bcs:NonAssetBackedLoansMemberifrs-full:Level3OfFairValueHierarchyMemberifrs-full:BottomOfRangeMemberifrs-full:DiscountedCashFlowMemberifrs-full:CreditSpreadMeasurementInputMember2023-12-310000312069ifrs-full:TopOfRangeMemberbcs:NonAssetBackedLoansMemberifrs-full:Level3OfFairValueHierarchyMemberifrs-full:DiscountedCashFlowMemberifrs-full:CreditSpreadMeasurementInputMember2023-12-310000312069bcs:NonAssetBackedLoansMemberifrs-full:Level3OfFairValueHierarchyMemberifrs-full:BottomOfRangeMemberifrs-full:DiscountedCashFlowMemberifrs-full:CreditSpreadMeasurementInputMember2022-12-310000312069ifrs-full:TopOfRangeMemberbcs:NonAssetBackedLoansMemberifrs-full:Level3OfFairValueHierarchyMemberifrs-full:DiscountedCashFlowMemberifrs-full:CreditSpreadMeasurementInputMember2022-12-310000312069bcs:NonAssetBackedLoansMemberifrs-full:Level3OfFairValueHierarchyMemberifrs-full:HistoricalVolatilityForSharesMeasurementInputMemberifrs-full:BottomOfRangeMemberifrs-full:DiscountedCashFlowMember2023-12-310000312069ifrs-full:TopOfRangeMemberbcs:NonAssetBackedLoansMemberifrs-full:Level3OfFairValueHierarchyMemberifrs-full:HistoricalVolatilityForSharesMeasurementInputMemberifrs-full:DiscountedCashFlowMember2023-12-310000312069bcs:NonAssetBackedLoansMemberifrs-full:Level3OfFairValueHierarchyMemberifrs-full:HistoricalVolatilityForSharesMeasurementInputMemberifrs-full:BottomOfRangeMemberifrs-full:DiscountedCashFlowMember2022-12-310000312069ifrs-full:TopOfRangeMemberbcs:NonAssetBackedLoansMemberifrs-full:Level3OfFairValueHierarchyMemberifrs-full:HistoricalVolatilityForSharesMeasurementInputMemberifrs-full:DiscountedCashFlowMember2022-12-310000312069ifrs-full:MarketComparablePricesMemberbcs:NonAssetBackedLoansMemberifrs-full:Level3OfFairValueHierarchyMemberifrs-full:AdjustmentToMidmarketConsensusPriceMeasurementInputMemberifrs-full:BottomOfRangeMember2023-12-310000312069ifrs-full:TopOfRangeMemberifrs-full:MarketComparablePricesMemberbcs:NonAssetBackedLoansMemberifrs-full:Level3OfFairValueHierarchyMemberifrs-full:AdjustmentToMidmarketConsensusPriceMeasurementInputMember2023-12-310000312069ifrs-full:MarketComparablePricesMemberbcs:NonAssetBackedLoansMemberifrs-full:Level3OfFairValueHierarchyMemberifrs-full:AdjustmentToMidmarketConsensusPriceMeasurementInputMemberifrs-full:BottomOfRangeMember2022-12-310000312069ifrs-full:TopOfRangeMemberifrs-full:MarketComparablePricesMemberbcs:NonAssetBackedLoansMemberifrs-full:Level3OfFairValueHierarchyMemberifrs-full:AdjustmentToMidmarketConsensusPriceMeasurementInputMember2022-12-310000312069bcs:EBITDAMultipleMemberifrs-full:Level3OfFairValueHierarchyMemberifrs-full:BottomOfRangeMemberbcs:MultiPeriodExcessEBITDAMethodMemberbcs:PrivateEquityInvestmentsMember2023-12-310000312069ifrs-full:TopOfRangeMemberbcs:EBITDAMultipleMemberifrs-full:Level3OfFairValueHierarchyMemberbcs:MultiPeriodExcessEBITDAMethodMemberbcs:PrivateEquityInvestmentsMember2023-12-310000312069bcs:EBITDAMultipleMemberifrs-full:Level3OfFairValueHierarchyMemberifrs-full:BottomOfRangeMemberbcs:MultiPeriodExcessEBITDAMethodMemberbcs:PrivateEquityInvestmentsMember2022-12-310000312069ifrs-full:TopOfRangeMemberbcs:EBITDAMultipleMemberifrs-full:Level3OfFairValueHierarchyMemberbcs:MultiPeriodExcessEBITDAMethodMemberbcs:PrivateEquityInvestmentsMember2022-12-310000312069ifrs-full:Level3OfFairValueHierarchyMemberifrs-full:MultiperiodExcessEarningsMethodMemberifrs-full:BottomOfRangeMemberbcs:PrivateEquityInvestmentsMemberbcs:EarningsMultipleMember2023-12-310000312069ifrs-full:TopOfRangeMemberifrs-full:Level3OfFairValueHierarchyMemberifrs-full:MultiperiodExcessEarningsMethodMemberbcs:PrivateEquityInvestmentsMemberbcs:EarningsMultipleMember2023-12-310000312069ifrs-full:Level3OfFairValueHierarchyMemberifrs-full:MultiperiodExcessEarningsMethodMemberifrs-full:BottomOfRangeMemberbcs:PrivateEquityInvestmentsMemberbcs:EarningsMultipleMember2022-12-310000312069ifrs-full:TopOfRangeMemberifrs-full:Level3OfFairValueHierarchyMemberifrs-full:MultiperiodExcessEarningsMethodMemberbcs:PrivateEquityInvestmentsMemberbcs:EarningsMultipleMember2022-12-310000312069ifrs-full:Level3OfFairValueHierarchyMemberifrs-full:BottomOfRangeMemberifrs-full:DiscountedCashFlowMemberbcs:PrivateEquityInvestmentsMemberifrs-full:CreditSpreadMeasurementInputMember2023-12-310000312069ifrs-full:TopOfRangeMemberifrs-full:Level3OfFairValueHierarchyMemberifrs-full:DiscountedCashFlowMemberbcs:PrivateEquityInvestmentsMemberifrs-full:CreditSpreadMeasurementInputMember2023-12-310000312069ifrs-full:Level3OfFairValueHierarchyMemberifrs-full:BottomOfRangeMemberifrs-full:DiscountedCashFlowMemberbcs:PrivateEquityInvestmentsMemberifrs-full:CreditSpreadMeasurementInputMember2022-12-310000312069ifrs-full:TopOfRangeMemberifrs-full:Level3OfFairValueHierarchyMemberifrs-full:DiscountedCashFlowMemberbcs:PrivateEquityInvestmentsMemberifrs-full:CreditSpreadMeasurementInputMember2022-12-310000312069ifrs-full:Level3OfFairValueHierarchyMemberifrs-full:BottomOfRangeMemberifrs-full:DiscountedCashFlowMemberbcs:PrivateEquityInvestmentsMemberifrs-full:DiscountRateMeasurementInputMember2023-12-310000312069ifrs-full:TopOfRangeMemberifrs-full:Level3OfFairValueHierarchyMemberifrs-full:DiscountedCashFlowMemberbcs:PrivateEquityInvestmentsMemberifrs-full:DiscountRateMeasurementInputMember2023-12-310000312069ifrs-full:Level3OfFairValueHierarchyMemberifrs-full:BottomOfRangeMemberifrs-full:DiscountedCashFlowMemberbcs:PrivateEquityInvestmentsMemberifrs-full:DiscountRateMeasurementInputMember2022-12-310000312069ifrs-full:TopOfRangeMemberifrs-full:Level3OfFairValueHierarchyMemberifrs-full:DiscountedCashFlowMemberbcs:PrivateEquityInvestmentsMemberifrs-full:DiscountRateMeasurementInputMember2022-12-310000312069ifrs-full:MarketComparablePricesMemberifrs-full:CorporateLoansMemberifrs-full:Level3OfFairValueHierarchyMemberifrs-full:AdjustmentToMidmarketConsensusPriceMeasurementInputMemberifrs-full:BottomOfRangeMember2023-12-310000312069ifrs-full:TopOfRangeMemberifrs-full:MarketComparablePricesMemberifrs-full:CorporateLoansMemberifrs-full:Level3OfFairValueHierarchyMemberifrs-full:AdjustmentToMidmarketConsensusPriceMeasurementInputMember2023-12-310000312069ifrs-full:MarketComparablePricesMemberifrs-full:CorporateLoansMemberifrs-full:Level3OfFairValueHierarchyMemberifrs-full:AdjustmentToMidmarketConsensusPriceMeasurementInputMemberifrs-full:BottomOfRangeMember2022-12-310000312069ifrs-full:TopOfRangeMemberifrs-full:MarketComparablePricesMemberifrs-full:CorporateLoansMemberifrs-full:Level3OfFairValueHierarchyMemberifrs-full:AdjustmentToMidmarketConsensusPriceMeasurementInputMember2022-12-310000312069ifrs-full:CorporateLoansMemberbcs:LoanSpreadMeasurementInputMemberifrs-full:Level3OfFairValueHierarchyMemberifrs-full:BottomOfRangeMemberifrs-full:DiscountedCashFlowMember2023-12-310000312069ifrs-full:TopOfRangeMemberifrs-full:CorporateLoansMemberbcs:LoanSpreadMeasurementInputMemberifrs-full:Level3OfFairValueHierarchyMemberifrs-full:DiscountedCashFlowMember2023-12-310000312069ifrs-full:CorporateLoansMemberbcs:LoanSpreadMeasurementInputMemberifrs-full:Level3OfFairValueHierarchyMemberifrs-full:BottomOfRangeMemberifrs-full:DiscountedCashFlowMember2022-12-310000312069ifrs-full:TopOfRangeMemberifrs-full:CorporateLoansMemberbcs:LoanSpreadMeasurementInputMemberifrs-full:Level3OfFairValueHierarchyMemberifrs-full:DiscountedCashFlowMember2022-12-310000312069ifrs-full:Level3OfFairValueHierarchyMemberifrs-full:BottomOfRangeMemberifrs-full:DiscountedCashFlowMemberbcs:RepoSpreadMeasurementInputMemberbcs:RepurchaseAndReverseRepurchaseAgreementsMember2023-12-310000312069ifrs-full:TopOfRangeMemberifrs-full:Level3OfFairValueHierarchyMemberifrs-full:DiscountedCashFlowMemberbcs:RepoSpreadMeasurementInputMemberbcs:RepurchaseAndReverseRepurchaseAgreementsMember2023-12-310000312069ifrs-full:Level3OfFairValueHierarchyMemberifrs-full:BottomOfRangeMemberifrs-full:DiscountedCashFlowMemberbcs:RepoSpreadMeasurementInputMemberbcs:RepurchaseAndReverseRepurchaseAgreementsMember2022-12-310000312069ifrs-full:TopOfRangeMemberifrs-full:Level3OfFairValueHierarchyMemberifrs-full:DiscountedCashFlowMemberbcs:RepoSpreadMeasurementInputMemberbcs:RepurchaseAndReverseRepurchaseAgreementsMember2022-12-310000312069ifrs-full:Level3OfFairValueHierarchyMemberifrs-full:BottomOfRangeMemberifrs-full:CreditSpreadMeasurementInputMember2023-12-310000312069ifrs-full:TopOfRangeMemberifrs-full:Level3OfFairValueHierarchyMemberifrs-full:CreditSpreadMeasurementInputMember2023-12-310000312069ifrs-full:Level3OfFairValueHierarchyMemberifrs-full:BottomOfRangeMemberifrs-full:CreditSpreadMeasurementInputMember2022-12-310000312069ifrs-full:TopOfRangeMemberifrs-full:Level3OfFairValueHierarchyMemberifrs-full:CreditSpreadMeasurementInputMember2022-12-310000312069bcs:EducationSocialHousingAndLocalAuthorityPorfolioMemberbcs:LoanSpreadMeasurementInputMemberifrs-full:Level3OfFairValueHierarchyMemberifrs-full:BottomOfRangeMember2023-12-310000312069ifrs-full:TopOfRangeMemberbcs:EducationSocialHousingAndLocalAuthorityPorfolioMemberbcs:LoanSpreadMeasurementInputMemberifrs-full:Level3OfFairValueHierarchyMember2023-12-310000312069bcs:EducationSocialHousingAndLocalAuthorityPorfolioMemberbcs:LoanSpreadMeasurementInputMemberifrs-full:Level3OfFairValueHierarchyMemberifrs-full:BottomOfRangeMember2022-12-310000312069ifrs-full:TopOfRangeMemberbcs:EducationSocialHousingAndLocalAuthorityPorfolioMemberbcs:LoanSpreadMeasurementInputMemberifrs-full:Level3OfFairValueHierarchyMember2022-12-310000312069bcs:EducationSocialHousingAndLocalAuthorityPorfolioMemberifrs-full:Level3OfFairValueHierarchyMember2023-01-012023-12-310000312069bcs:EducationSocialHousingAndLocalAuthorityPorfolioMemberbcs:LoanSpreadMeasurementInputMemberifrs-full:Level3OfFairValueHierarchyMembersrt:MaximumMember2023-12-310000312069ifrs-full:TopOfRangeMemberifrs-full:RecurringFairValueMeasurementMemberifrs-full:Level3OfFairValueHierarchyMemberifrs-full:DerivativesMemberifrs-full:InterestRateRiskMember2023-01-012023-12-310000312069ifrs-full:RecurringFairValueMeasurementMemberifrs-full:Level3OfFairValueHierarchyMemberifrs-full:BottomOfRangeMemberifrs-full:DerivativesMemberifrs-full:InterestRateRiskMember2023-01-012023-12-310000312069ifrs-full:TopOfRangeMemberifrs-full:RecurringFairValueMeasurementMemberifrs-full:Level3OfFairValueHierarchyMemberifrs-full:DerivativesMemberifrs-full:InterestRateRiskMember2022-01-012022-12-310000312069ifrs-full:RecurringFairValueMeasurementMemberifrs-full:Level3OfFairValueHierarchyMemberifrs-full:BottomOfRangeMemberifrs-full:DerivativesMemberifrs-full:InterestRateRiskMember2022-01-012022-12-310000312069ifrs-full:TopOfRangeMemberifrs-full:RecurringFairValueMeasurementMemberifrs-full:CurrencyRiskMemberifrs-full:Level3OfFairValueHierarchyMemberifrs-full:DerivativesMember2023-01-012023-12-310000312069ifrs-full:RecurringFairValueMeasurementMemberifrs-full:CurrencyRiskMemberifrs-full:Level3OfFairValueHierarchyMemberifrs-full:BottomOfRangeMemberifrs-full:DerivativesMember2023-01-012023-12-310000312069ifrs-full:TopOfRangeMemberifrs-full:RecurringFairValueMeasurementMemberifrs-full:CurrencyRiskMemberifrs-full:Level3OfFairValueHierarchyMemberifrs-full:DerivativesMember2022-01-012022-12-310000312069ifrs-full:RecurringFairValueMeasurementMemberifrs-full:CurrencyRiskMemberifrs-full:Level3OfFairValueHierarchyMemberifrs-full:BottomOfRangeMemberifrs-full:DerivativesMember2022-01-012022-12-310000312069ifrs-full:TopOfRangeMemberifrs-full:RecurringFairValueMeasurementMemberifrs-full:Level3OfFairValueHierarchyMemberifrs-full:CreditRiskMemberifrs-full:DerivativesMember2023-01-012023-12-310000312069ifrs-full:RecurringFairValueMeasurementMemberifrs-full:Level3OfFairValueHierarchyMemberifrs-full:BottomOfRangeMemberifrs-full:CreditRiskMemberifrs-full:DerivativesMember2023-01-012023-12-310000312069ifrs-full:TopOfRangeMemberifrs-full:RecurringFairValueMeasurementMemberifrs-full:Level3OfFairValueHierarchyMemberifrs-full:CreditRiskMemberifrs-full:DerivativesMember2022-01-012022-12-310000312069ifrs-full:RecurringFairValueMeasurementMemberifrs-full:Level3OfFairValueHierarchyMemberifrs-full:BottomOfRangeMemberifrs-full:CreditRiskMemberifrs-full:DerivativesMember2022-01-012022-12-310000312069ifrs-full:TopOfRangeMemberifrs-full:RecurringFairValueMeasurementMemberifrs-full:Level3OfFairValueHierarchyMemberifrs-full:EquityPriceRiskMemberifrs-full:DerivativesMember2023-01-012023-12-310000312069ifrs-full:RecurringFairValueMeasurementMemberifrs-full:Level3OfFairValueHierarchyMemberifrs-full:BottomOfRangeMemberifrs-full:EquityPriceRiskMemberifrs-full:DerivativesMember2023-01-012023-12-310000312069ifrs-full:TopOfRangeMemberifrs-full:RecurringFairValueMeasurementMemberifrs-full:Level3OfFairValueHierarchyMemberifrs-full:EquityPriceRiskMemberifrs-full:DerivativesMember2022-01-012022-12-310000312069ifrs-full:RecurringFairValueMeasurementMemberifrs-full:Level3OfFairValueHierarchyMemberifrs-full:BottomOfRangeMemberifrs-full:EquityPriceRiskMemberifrs-full:DerivativesMember2022-01-012022-12-310000312069ifrs-full:TopOfRangeMemberifrs-full:RecurringFairValueMeasurementMemberifrs-full:CorporateLoansMemberifrs-full:Level3OfFairValueHierarchyMemberifrs-full:DerivativesMember2023-01-012023-12-310000312069ifrs-full:RecurringFairValueMeasurementMemberifrs-full:CorporateLoansMemberifrs-full:Level3OfFairValueHierarchyMemberifrs-full:BottomOfRangeMemberifrs-full:DerivativesMember2023-01-012023-12-310000312069ifrs-full:TopOfRangeMemberifrs-full:RecurringFairValueMeasurementMemberifrs-full:CorporateLoansMemberifrs-full:Level3OfFairValueHierarchyMemberifrs-full:DerivativesMember2022-01-012022-12-310000312069ifrs-full:RecurringFairValueMeasurementMemberifrs-full:CorporateLoansMemberifrs-full:Level3OfFairValueHierarchyMemberifrs-full:BottomOfRangeMemberifrs-full:DerivativesMember2022-01-012022-12-310000312069ifrs-full:TopOfRangeMemberifrs-full:RecurringFairValueMeasurementMemberbcs:NonAssetBackedLoansMemberifrs-full:Level3OfFairValueHierarchyMemberifrs-full:DerivativesMember2023-01-012023-12-310000312069ifrs-full:RecurringFairValueMeasurementMemberbcs:NonAssetBackedLoansMemberifrs-full:Level3OfFairValueHierarchyMemberifrs-full:BottomOfRangeMemberifrs-full:DerivativesMember2023-01-012023-12-310000312069ifrs-full:TopOfRangeMemberifrs-full:RecurringFairValueMeasurementMemberbcs:NonAssetBackedLoansMemberifrs-full:Level3OfFairValueHierarchyMemberifrs-full:DerivativesMember2022-01-012022-12-310000312069ifrs-full:RecurringFairValueMeasurementMemberbcs:NonAssetBackedLoansMemberifrs-full:Level3OfFairValueHierarchyMemberifrs-full:BottomOfRangeMemberifrs-full:DerivativesMember2022-01-012022-12-310000312069ifrs-full:TopOfRangeMemberifrs-full:RecurringFairValueMeasurementMemberifrs-full:Level3OfFairValueHierarchyMemberbcs:PrivateEquityInvestmentsMemberifrs-full:DerivativesMember2023-01-012023-12-310000312069ifrs-full:RecurringFairValueMeasurementMemberifrs-full:Level3OfFairValueHierarchyMemberifrs-full:BottomOfRangeMemberbcs:PrivateEquityInvestmentsMemberifrs-full:DerivativesMember2023-01-012023-12-310000312069ifrs-full:TopOfRangeMemberifrs-full:RecurringFairValueMeasurementMemberifrs-full:Level3OfFairValueHierarchyMemberbcs:PrivateEquityInvestmentsMemberifrs-full:DerivativesMember2022-01-012022-12-310000312069ifrs-full:RecurringFairValueMeasurementMemberifrs-full:Level3OfFairValueHierarchyMemberifrs-full:BottomOfRangeMemberbcs:PrivateEquityInvestmentsMemberifrs-full:DerivativesMember2022-01-012022-12-310000312069ifrs-full:TopOfRangeMemberbcs:OtherFinancialAssetsAndLiabilitiesGroupOneMemberifrs-full:RecurringFairValueMeasurementMemberifrs-full:Level3OfFairValueHierarchyMemberifrs-full:DerivativesMember2023-01-012023-12-310000312069bcs:OtherFinancialAssetsAndLiabilitiesGroupOneMemberifrs-full:RecurringFairValueMeasurementMemberifrs-full:Level3OfFairValueHierarchyMemberifrs-full:BottomOfRangeMemberifrs-full:DerivativesMember2023-01-012023-12-310000312069ifrs-full:TopOfRangeMemberbcs:OtherFinancialAssetsAndLiabilitiesGroupOneMemberifrs-full:RecurringFairValueMeasurementMemberifrs-full:Level3OfFairValueHierarchyMemberifrs-full:DerivativesMember2022-01-012022-12-310000312069bcs:OtherFinancialAssetsAndLiabilitiesGroupOneMemberifrs-full:RecurringFairValueMeasurementMemberifrs-full:Level3OfFairValueHierarchyMemberifrs-full:BottomOfRangeMemberifrs-full:DerivativesMember2022-01-012022-12-310000312069ifrs-full:TopOfRangeMemberifrs-full:RecurringFairValueMeasurementMemberifrs-full:Level3OfFairValueHierarchyMemberifrs-full:DerivativesMember2023-01-012023-12-310000312069ifrs-full:RecurringFairValueMeasurementMemberifrs-full:Level3OfFairValueHierarchyMemberifrs-full:BottomOfRangeMemberifrs-full:DerivativesMember2023-01-012023-12-310000312069ifrs-full:TopOfRangeMemberifrs-full:RecurringFairValueMeasurementMemberifrs-full:Level3OfFairValueHierarchyMemberifrs-full:DerivativesMember2022-01-012022-12-310000312069ifrs-full:RecurringFairValueMeasurementMemberifrs-full:Level3OfFairValueHierarchyMemberifrs-full:BottomOfRangeMemberifrs-full:DerivativesMember2022-01-012022-12-310000312069ifrs-full:TopOfRangeMemberifrs-full:Level3OfFairValueHierarchyMember2023-01-012023-12-310000312069ifrs-full:TopOfRangeMemberifrs-full:Level3OfFairValueHierarchyMember2022-01-012022-12-310000312069ifrs-full:Level3OfFairValueHierarchyMemberbcs:ExitPriceAdjustmentsDerivedFromMarketBidOfferSpreadsMember2023-12-310000312069ifrs-full:Level3OfFairValueHierarchyMemberbcs:ExitPriceAdjustmentsDerivedFromMarketBidOfferSpreadsMember2022-12-310000312069bcs:UncollateralisedDerivativeFundingMemberifrs-full:Level3OfFairValueHierarchyMember2023-12-310000312069bcs:UncollateralisedDerivativeFundingMemberifrs-full:Level3OfFairValueHierarchyMember2022-12-310000312069ifrs-full:Level3OfFairValueHierarchyMemberbcs:DerivativeCreditValuationAdjustmentsMember2023-12-310000312069ifrs-full:Level3OfFairValueHierarchyMemberbcs:DerivativeCreditValuationAdjustmentsMember2022-12-310000312069bcs:DerivativeDebitValuationAdjustmentsMemberifrs-full:Level3OfFairValueHierarchyMember2023-12-310000312069bcs:DerivativeDebitValuationAdjustmentsMemberifrs-full:Level3OfFairValueHierarchyMember2022-12-310000312069ifrs-full:Level3OfFairValueHierarchyMemberbcs:ExitPriceAdjustmentsDerivedFromMarketBidOfferSpreadsMember2023-01-012023-12-310000312069bcs:UncollateralisedDerivativeFundingMemberifrs-full:Level3OfFairValueHierarchyMember2023-01-012023-12-310000312069bcs:DerivativeCreditValuationAdjustmentsMember2023-01-012023-12-310000312069bcs:DerivativeCreditValuationAdjustmentsMember2023-12-310000312069bcs:DerivativeDebitValuationAdjustmentsMemberifrs-full:Level3OfFairValueHierarchyMember2023-01-012023-12-310000312069bcs:FinancialInstrumentsAtFairValueCategoryMemberifrs-full:Level3OfFairValueHierarchyMember2023-12-310000312069bcs:FinancialInstrumentsAtFairValueCategoryMemberifrs-full:Level3OfFairValueHierarchyMember2022-12-310000312069ifrs-full:Level3OfFairValueHierarchyMemberbcs:FinancialInstrumentsAtAmortisedCostCategoryMember2023-12-310000312069ifrs-full:Level3OfFairValueHierarchyMemberbcs:FinancialInstrumentsAtAmortisedCostCategoryMember2022-12-310000312069bcs:FinancialInstrumentsAtFairValueCategoryMemberifrs-full:Level3OfFairValueHierarchyMember2023-01-012023-12-310000312069bcs:FinancialInstrumentsAtFairValueCategoryMemberifrs-full:Level3OfFairValueHierarchyMember2022-01-012022-12-310000312069ifrs-full:Level3OfFairValueHierarchyMemberbcs:FinancialInstrumentsAtAmortisedCostCategoryMember2023-01-012023-12-310000312069ifrs-full:Level3OfFairValueHierarchyMemberbcs:FinancialInstrumentsAtAmortisedCostCategoryMember2022-01-012022-12-310000312069bcs:BrokeredCertificatesOfDepositMember2023-12-310000312069bcs:BrokeredCertificatesOfDepositMember2022-12-310000312069ifrs-full:GrossCarryingAmountMember2023-12-310000312069ifrs-full:NotMeasuredAtFairValueInStatementOfFinancialPositionButForWhichFairValueIsDisclosedMember2023-12-310000312069ifrs-full:Level1OfFairValueHierarchyMemberifrs-full:NotMeasuredAtFairValueInStatementOfFinancialPositionButForWhichFairValueIsDisclosedMember2023-12-310000312069ifrs-full:Level2OfFairValueHierarchyMemberifrs-full:NotMeasuredAtFairValueInStatementOfFinancialPositionButForWhichFairValueIsDisclosedMember2023-12-310000312069ifrs-full:Level3OfFairValueHierarchyMemberifrs-full:NotMeasuredAtFairValueInStatementOfFinancialPositionButForWhichFairValueIsDisclosedMember2023-12-310000312069ifrs-full:GrossCarryingAmountMember2022-12-310000312069ifrs-full:NotMeasuredAtFairValueInStatementOfFinancialPositionButForWhichFairValueIsDisclosedMember2022-12-310000312069ifrs-full:Level1OfFairValueHierarchyMemberifrs-full:NotMeasuredAtFairValueInStatementOfFinancialPositionButForWhichFairValueIsDisclosedMember2022-12-310000312069ifrs-full:Level2OfFairValueHierarchyMemberifrs-full:NotMeasuredAtFairValueInStatementOfFinancialPositionButForWhichFairValueIsDisclosedMember2022-12-310000312069ifrs-full:Level3OfFairValueHierarchyMemberifrs-full:NotMeasuredAtFairValueInStatementOfFinancialPositionButForWhichFairValueIsDisclosedMember2022-12-310000312069ifrs-full:DerivativesMember2023-12-310000312069bcs:ReverseRepurchaseAgreementsAndOtherSimilarSecuredLendingMember2023-12-310000312069bcs:FinancialAssetsSubjectToOffsettingMember2023-12-310000312069ifrs-full:DerivativesMember2023-12-310000312069bcs:RepurchaseAgreementsAndOtherSimilarSecuredBorrowingMember2023-12-310000312069bcs:FinancialLiabilitiesSubjectToOffsettingMember2023-12-310000312069ifrs-full:DerivativesMember2022-12-310000312069bcs:ReverseRepurchaseAgreementsAndOtherSimilarSecuredLendingMember2022-12-310000312069bcs:FinancialAssetsSubjectToOffsettingMember2022-12-310000312069ifrs-full:DerivativesMember2022-12-310000312069bcs:RepurchaseAgreementsAndOtherSimilarSecuredBorrowingMember2022-12-310000312069bcs:FinancialLiabilitiesSubjectToOffsettingMember2022-12-310000312069bcs:CashCollateralNettedMemberifrs-full:DerivativesMember2023-12-310000312069bcs:CashCollateralNettedMemberifrs-full:DerivativesMember2022-12-310000312069ifrs-full:DerivativesMemberbcs:CashCollateralNettedMember2023-12-310000312069ifrs-full:DerivativesMemberbcs:CashCollateralNettedMember2022-12-310000312069bcs:ReverseRepurchaseAgreementsAndOtherSimilarSecuredLendingMemberifrs-full:FinancialAssetsAtFairValueThroughProfitOrLossDesignatedUponInitialRecognitionCategoryMember2023-12-310000312069bcs:ReverseRepurchaseAgreementsAndOtherSimilarSecuredLendingMemberifrs-full:FinancialAssetsAtFairValueThroughProfitOrLossDesignatedUponInitialRecognitionCategoryMember2022-12-310000312069ifrs-full:FinancialAssetsAtAmortisedCostMemberbcs:ReverseRepurchaseAgreementsAndOtherSimilarSecuredLendingMember2023-12-310000312069ifrs-full:FinancialAssetsAtAmortisedCostMemberbcs:ReverseRepurchaseAgreementsAndOtherSimilarSecuredLendingMember2022-12-310000312069bcs:RepurchaseAgreementsAndOtherSimilarSecuredBorrowingMemberifrs-full:FinancialLiabilitiesAtFairValueMember2023-12-310000312069bcs:RepurchaseAgreementsAndOtherSimilarSecuredBorrowingMemberifrs-full:FinancialLiabilitiesAtFairValueMember2022-12-310000312069bcs:RepurchaseAgreementsAndOtherSimilarSecuredBorrowingMemberifrs-full:FinancialLiabilitiesAtAmortisedCostMember2023-12-310000312069bcs:RepurchaseAgreementsAndOtherSimilarSecuredBorrowingMemberifrs-full:FinancialLiabilitiesAtAmortisedCostMember2022-12-310000312069ifrs-full:BottomOfRangeMemberifrs-full:BuildingsMember2023-01-012023-12-310000312069ifrs-full:TopOfRangeMemberifrs-full:BuildingsMember2023-01-012023-12-310000312069ifrs-full:LeaseholdImprovementsMemberifrs-full:BottomOfRangeMember2023-01-012023-12-310000312069ifrs-full:LeaseholdImprovementsMemberifrs-full:TopOfRangeMember2023-01-012023-12-310000312069ifrs-full:CommunicationAndNetworkEquipmentMemberifrs-full:BottomOfRangeMember2023-01-012023-12-310000312069ifrs-full:TopOfRangeMemberifrs-full:CommunicationAndNetworkEquipmentMember2023-01-012023-12-310000312069ifrs-full:ComputerEquipmentMemberifrs-full:BottomOfRangeMember2023-01-012023-12-310000312069ifrs-full:TopOfRangeMemberifrs-full:ComputerEquipmentMember2023-01-012023-12-310000312069ifrs-full:FixturesAndFittingsMemberifrs-full:BottomOfRangeMember2023-01-012023-12-310000312069ifrs-full:TopOfRangeMemberifrs-full:FixturesAndFittingsMember2023-01-012023-12-310000312069ifrs-full:InvestmentPropertyMemberifrs-full:GrossCarryingAmountMember2022-12-310000312069ifrs-full:LandAndBuildingsMemberifrs-full:GrossCarryingAmountMember2022-12-310000312069ifrs-full:CommunicationAndNetworkEquipmentMemberifrs-full:GrossCarryingAmountMember2022-12-310000312069ifrs-full:RightofuseAssetsMemberifrs-full:GrossCarryingAmountMember2022-12-310000312069ifrs-full:InvestmentPropertyMemberifrs-full:GrossCarryingAmountMember2023-01-012023-12-310000312069ifrs-full:LandAndBuildingsMemberifrs-full:GrossCarryingAmountMember2023-01-012023-12-310000312069ifrs-full:CommunicationAndNetworkEquipmentMemberifrs-full:GrossCarryingAmountMember2023-01-012023-12-310000312069ifrs-full:RightofuseAssetsMemberifrs-full:GrossCarryingAmountMember2023-01-012023-12-310000312069ifrs-full:GrossCarryingAmountMember2023-01-012023-12-310000312069ifrs-full:InvestmentPropertyMemberifrs-full:GrossCarryingAmountMember2023-12-310000312069ifrs-full:LandAndBuildingsMemberifrs-full:GrossCarryingAmountMember2023-12-310000312069ifrs-full:CommunicationAndNetworkEquipmentMemberifrs-full:GrossCarryingAmountMember2023-12-310000312069ifrs-full:RightofuseAssetsMemberifrs-full:GrossCarryingAmountMember2023-12-310000312069ifrs-full:InvestmentPropertyMemberifrs-full:AccumulatedDepreciationAmortisationAndImpairmentMember2022-12-310000312069ifrs-full:LandAndBuildingsMemberifrs-full:AccumulatedDepreciationAmortisationAndImpairmentMember2022-12-310000312069ifrs-full:CommunicationAndNetworkEquipmentMemberifrs-full:AccumulatedDepreciationAmortisationAndImpairmentMember2022-12-310000312069ifrs-full:RightofuseAssetsMemberifrs-full:AccumulatedDepreciationAmortisationAndImpairmentMember2022-12-310000312069ifrs-full:AccumulatedDepreciationAmortisationAndImpairmentMember2022-12-310000312069ifrs-full:InvestmentPropertyMemberifrs-full:AccumulatedDepreciationAmortisationAndImpairmentMember2023-01-012023-12-310000312069ifrs-full:LandAndBuildingsMemberifrs-full:AccumulatedDepreciationAmortisationAndImpairmentMember2023-01-012023-12-310000312069ifrs-full:CommunicationAndNetworkEquipmentMemberifrs-full:AccumulatedDepreciationAmortisationAndImpairmentMember2023-01-012023-12-310000312069ifrs-full:RightofuseAssetsMemberifrs-full:AccumulatedDepreciationAmortisationAndImpairmentMember2023-01-012023-12-310000312069ifrs-full:AccumulatedDepreciationAmortisationAndImpairmentMember2023-01-012023-12-310000312069ifrs-full:InvestmentPropertyMemberifrs-full:AccumulatedDepreciationAmortisationAndImpairmentMember2023-12-310000312069ifrs-full:LandAndBuildingsMemberifrs-full:AccumulatedDepreciationAmortisationAndImpairmentMember2023-12-310000312069ifrs-full:CommunicationAndNetworkEquipmentMemberifrs-full:AccumulatedDepreciationAmortisationAndImpairmentMember2023-12-310000312069ifrs-full:RightofuseAssetsMemberifrs-full:AccumulatedDepreciationAmortisationAndImpairmentMember2023-12-310000312069ifrs-full:AccumulatedDepreciationAmortisationAndImpairmentMember2023-12-310000312069ifrs-full:InvestmentPropertyMember2023-12-310000312069ifrs-full:LandAndBuildingsMember2023-12-310000312069ifrs-full:CommunicationAndNetworkEquipmentMember2023-12-310000312069ifrs-full:RightofuseAssetsMember2023-12-310000312069ifrs-full:InvestmentPropertyMemberifrs-full:GrossCarryingAmountMember2021-12-310000312069ifrs-full:LandAndBuildingsMemberifrs-full:GrossCarryingAmountMember2021-12-310000312069ifrs-full:CommunicationAndNetworkEquipmentMemberifrs-full:GrossCarryingAmountMember2021-12-310000312069ifrs-full:RightofuseAssetsMemberifrs-full:GrossCarryingAmountMember2021-12-310000312069ifrs-full:GrossCarryingAmountMember2021-12-310000312069ifrs-full:InvestmentPropertyMemberifrs-full:GrossCarryingAmountMember2022-01-012022-12-310000312069ifrs-full:LandAndBuildingsMemberifrs-full:GrossCarryingAmountMember2022-01-012022-12-310000312069ifrs-full:CommunicationAndNetworkEquipmentMemberifrs-full:GrossCarryingAmountMember2022-01-012022-12-310000312069ifrs-full:RightofuseAssetsMemberifrs-full:GrossCarryingAmountMember2022-01-012022-12-310000312069ifrs-full:GrossCarryingAmountMember2022-01-012022-12-310000312069ifrs-full:InvestmentPropertyMemberifrs-full:AccumulatedDepreciationAmortisationAndImpairmentMember2021-12-310000312069ifrs-full:LandAndBuildingsMemberifrs-full:AccumulatedDepreciationAmortisationAndImpairmentMember2021-12-310000312069ifrs-full:CommunicationAndNetworkEquipmentMemberifrs-full:AccumulatedDepreciationAmortisationAndImpairmentMember2021-12-310000312069ifrs-full:RightofuseAssetsMemberifrs-full:AccumulatedDepreciationAmortisationAndImpairmentMember2021-12-310000312069ifrs-full:AccumulatedDepreciationAmortisationAndImpairmentMember2021-12-310000312069ifrs-full:InvestmentPropertyMemberifrs-full:AccumulatedDepreciationAmortisationAndImpairmentMember2022-01-012022-12-310000312069ifrs-full:LandAndBuildingsMemberifrs-full:AccumulatedDepreciationAmortisationAndImpairmentMember2022-01-012022-12-310000312069ifrs-full:CommunicationAndNetworkEquipmentMemberifrs-full:AccumulatedDepreciationAmortisationAndImpairmentMember2022-01-012022-12-310000312069ifrs-full:RightofuseAssetsMemberifrs-full:AccumulatedDepreciationAmortisationAndImpairmentMember2022-01-012022-12-310000312069ifrs-full:AccumulatedDepreciationAmortisationAndImpairmentMember2022-01-012022-12-310000312069ifrs-full:InvestmentPropertyMember2022-12-310000312069ifrs-full:LandAndBuildingsMember2022-12-310000312069ifrs-full:CommunicationAndNetworkEquipmentMember2022-12-310000312069ifrs-full:RightofuseAssetsMember2022-12-310000312069ifrs-full:InvestmentPropertyMember2023-01-012023-12-310000312069ifrs-full:InvestmentPropertyMember2022-01-012022-12-310000312069ifrs-full:NotLaterThanOneYearMember2023-12-310000312069ifrs-full:NotLaterThanOneYearMember2022-12-310000312069ifrs-full:LaterThanOneYearAndNotLaterThanTwoYearsMember2023-12-310000312069ifrs-full:LaterThanOneYearAndNotLaterThanTwoYearsMember2022-12-310000312069ifrs-full:LaterThanTwoYearsAndNotLaterThanThreeYearsMember2023-12-310000312069ifrs-full:LaterThanTwoYearsAndNotLaterThanThreeYearsMember2022-12-310000312069ifrs-full:LaterThanThreeYearsAndNotLaterThanFourYearsMember2023-12-310000312069ifrs-full:LaterThanThreeYearsAndNotLaterThanFourYearsMember2022-12-310000312069ifrs-full:LaterThanFourYearsAndNotLaterThanFiveYearsMember2023-12-310000312069ifrs-full:LaterThanFourYearsAndNotLaterThanFiveYearsMember2022-12-310000312069ifrs-full:LaterThanFiveYearsAndNotLaterThanTenYearsMember2023-12-310000312069ifrs-full:LaterThanFiveYearsAndNotLaterThanTenYearsMember2022-12-310000312069ifrs-full:LaterThanTenYearsMember2023-12-310000312069ifrs-full:LaterThanTenYearsMember2022-12-31bcs:lease0000312069ifrs-full:ComputerSoftwareMemberifrs-full:BottomOfRangeMemberifrs-full:InternallyGeneratedMember2023-01-012023-12-310000312069ifrs-full:TopOfRangeMemberifrs-full:ComputerSoftwareMemberifrs-full:InternallyGeneratedMember2023-01-012023-12-310000312069ifrs-full:NotInternallyGeneratedMemberifrs-full:ComputerSoftwareMemberifrs-full:BottomOfRangeMember2023-01-012023-12-310000312069ifrs-full:TopOfRangeMemberifrs-full:NotInternallyGeneratedMemberifrs-full:ComputerSoftwareMember2023-01-012023-12-310000312069ifrs-full:BottomOfRangeMemberifrs-full:CustomerrelatedIntangibleAssetsMember2023-01-012023-12-310000312069ifrs-full:TopOfRangeMemberifrs-full:CustomerrelatedIntangibleAssetsMember2023-01-012023-12-310000312069ifrs-full:BottomOfRangeMemberbcs:LicencesAndOtherMember2023-01-012023-12-310000312069ifrs-full:TopOfRangeMemberbcs:LicencesAndOtherMember2023-01-012023-12-310000312069bcs:CoreBankingPlatformsMemberifrs-full:BottomOfRangeMemberifrs-full:InternallyGeneratedMember2023-01-012023-12-310000312069ifrs-full:TopOfRangeMemberbcs:CoreBankingPlatformsMemberifrs-full:InternallyGeneratedMember2023-01-012023-12-310000312069ifrs-full:GoodwillMemberifrs-full:GrossCarryingAmountMember2022-12-310000312069ifrs-full:ComputerSoftwareMemberifrs-full:GrossCarryingAmountMemberifrs-full:InternallyGeneratedMember2022-12-310000312069ifrs-full:NotInternallyGeneratedMemberifrs-full:ComputerSoftwareMemberifrs-full:GrossCarryingAmountMember2022-12-310000312069ifrs-full:BrandNamesMemberifrs-full:GrossCarryingAmountMember2022-12-310000312069ifrs-full:CustomerrelatedIntangibleAssetsMemberifrs-full:GrossCarryingAmountMember2022-12-310000312069bcs:LicencesAndOtherMemberifrs-full:GrossCarryingAmountMember2022-12-310000312069ifrs-full:GoodwillMemberifrs-full:GrossCarryingAmountMember2023-01-012023-12-310000312069ifrs-full:ComputerSoftwareMemberifrs-full:GrossCarryingAmountMemberifrs-full:InternallyGeneratedMember2023-01-012023-12-310000312069ifrs-full:NotInternallyGeneratedMemberifrs-full:ComputerSoftwareMemberifrs-full:GrossCarryingAmountMember2023-01-012023-12-310000312069ifrs-full:BrandNamesMemberifrs-full:GrossCarryingAmountMember2023-01-012023-12-310000312069ifrs-full:CustomerrelatedIntangibleAssetsMemberifrs-full:GrossCarryingAmountMember2023-01-012023-12-310000312069bcs:LicencesAndOtherMemberifrs-full:GrossCarryingAmountMember2023-01-012023-12-310000312069ifrs-full:GoodwillMemberifrs-full:GrossCarryingAmountMember2023-12-310000312069ifrs-full:ComputerSoftwareMemberifrs-full:GrossCarryingAmountMemberifrs-full:InternallyGeneratedMember2023-12-310000312069ifrs-full:NotInternallyGeneratedMemberifrs-full:ComputerSoftwareMemberifrs-full:GrossCarryingAmountMember2023-12-310000312069ifrs-full:BrandNamesMemberifrs-full:GrossCarryingAmountMember2023-12-310000312069ifrs-full:CustomerrelatedIntangibleAssetsMemberifrs-full:GrossCarryingAmountMember2023-12-310000312069bcs:LicencesAndOtherMemberifrs-full:GrossCarryingAmountMember2023-12-310000312069ifrs-full:GoodwillMemberifrs-full:AccumulatedDepreciationAmortisationAndImpairmentMember2022-12-310000312069ifrs-full:ComputerSoftwareMemberifrs-full:AccumulatedDepreciationAmortisationAndImpairmentMemberifrs-full:InternallyGeneratedMember2022-12-310000312069ifrs-full:NotInternallyGeneratedMemberifrs-full:ComputerSoftwareMemberifrs-full:AccumulatedDepreciationAmortisationAndImpairmentMember2022-12-310000312069ifrs-full:BrandNamesMemberifrs-full:AccumulatedDepreciationAmortisationAndImpairmentMember2022-12-310000312069ifrs-full:CustomerrelatedIntangibleAssetsMemberifrs-full:AccumulatedDepreciationAmortisationAndImpairmentMember2022-12-310000312069bcs:LicencesAndOtherMemberifrs-full:AccumulatedDepreciationAmortisationAndImpairmentMember2022-12-310000312069ifrs-full:GoodwillMemberifrs-full:AccumulatedDepreciationAmortisationAndImpairmentMember2023-01-012023-12-310000312069ifrs-full:ComputerSoftwareMemberifrs-full:AccumulatedDepreciationAmortisationAndImpairmentMemberifrs-full:InternallyGeneratedMember2023-01-012023-12-310000312069ifrs-full:NotInternallyGeneratedMemberifrs-full:ComputerSoftwareMemberifrs-full:AccumulatedDepreciationAmortisationAndImpairmentMember2023-01-012023-12-310000312069ifrs-full:BrandNamesMemberifrs-full:AccumulatedDepreciationAmortisationAndImpairmentMember2023-01-012023-12-310000312069ifrs-full:CustomerrelatedIntangibleAssetsMemberifrs-full:AccumulatedDepreciationAmortisationAndImpairmentMember2023-01-012023-12-310000312069bcs:LicencesAndOtherMemberifrs-full:AccumulatedDepreciationAmortisationAndImpairmentMember2023-01-012023-12-310000312069ifrs-full:GoodwillMemberifrs-full:AccumulatedDepreciationAmortisationAndImpairmentMember2023-12-310000312069ifrs-full:ComputerSoftwareMemberifrs-full:AccumulatedDepreciationAmortisationAndImpairmentMemberifrs-full:InternallyGeneratedMember2023-12-310000312069ifrs-full:NotInternallyGeneratedMemberifrs-full:ComputerSoftwareMemberifrs-full:AccumulatedDepreciationAmortisationAndImpairmentMember2023-12-310000312069ifrs-full:BrandNamesMemberifrs-full:AccumulatedDepreciationAmortisationAndImpairmentMember2023-12-310000312069ifrs-full:CustomerrelatedIntangibleAssetsMemberifrs-full:AccumulatedDepreciationAmortisationAndImpairmentMember2023-12-310000312069bcs:LicencesAndOtherMemberifrs-full:AccumulatedDepreciationAmortisationAndImpairmentMember2023-12-310000312069ifrs-full:GoodwillMember2023-12-310000312069ifrs-full:ComputerSoftwareMemberifrs-full:InternallyGeneratedMember2023-12-310000312069ifrs-full:NotInternallyGeneratedMemberifrs-full:ComputerSoftwareMember2023-12-310000312069ifrs-full:BrandNamesMember2023-12-310000312069ifrs-full:CustomerrelatedIntangibleAssetsMember2023-12-310000312069bcs:LicencesAndOtherMember2023-12-310000312069ifrs-full:GoodwillMemberifrs-full:GrossCarryingAmountMember2021-12-310000312069ifrs-full:ComputerSoftwareMemberifrs-full:GrossCarryingAmountMemberifrs-full:InternallyGeneratedMember2021-12-310000312069ifrs-full:NotInternallyGeneratedMemberifrs-full:ComputerSoftwareMemberifrs-full:GrossCarryingAmountMember2021-12-310000312069ifrs-full:BrandNamesMemberifrs-full:GrossCarryingAmountMember2021-12-310000312069ifrs-full:CustomerrelatedIntangibleAssetsMemberifrs-full:GrossCarryingAmountMember2021-12-310000312069bcs:LicencesAndOtherMemberifrs-full:GrossCarryingAmountMember2021-12-310000312069ifrs-full:GoodwillMemberifrs-full:GrossCarryingAmountMember2022-01-012022-12-310000312069ifrs-full:ComputerSoftwareMemberifrs-full:GrossCarryingAmountMemberifrs-full:InternallyGeneratedMember2022-01-012022-12-310000312069ifrs-full:NotInternallyGeneratedMemberifrs-full:ComputerSoftwareMemberifrs-full:GrossCarryingAmountMember2022-01-012022-12-310000312069ifrs-full:BrandNamesMemberifrs-full:GrossCarryingAmountMember2022-01-012022-12-310000312069ifrs-full:CustomerrelatedIntangibleAssetsMemberifrs-full:GrossCarryingAmountMember2022-01-012022-12-310000312069bcs:LicencesAndOtherMemberifrs-full:GrossCarryingAmountMember2022-01-012022-12-310000312069ifrs-full:GoodwillMemberifrs-full:AccumulatedDepreciationAmortisationAndImpairmentMember2021-12-310000312069ifrs-full:ComputerSoftwareMemberifrs-full:AccumulatedDepreciationAmortisationAndImpairmentMemberifrs-full:InternallyGeneratedMember2021-12-310000312069ifrs-full:NotInternallyGeneratedMemberifrs-full:ComputerSoftwareMemberifrs-full:AccumulatedDepreciationAmortisationAndImpairmentMember2021-12-310000312069ifrs-full:BrandNamesMemberifrs-full:AccumulatedDepreciationAmortisationAndImpairmentMember2021-12-310000312069ifrs-full:CustomerrelatedIntangibleAssetsMemberifrs-full:AccumulatedDepreciationAmortisationAndImpairmentMember2021-12-310000312069bcs:LicencesAndOtherMemberifrs-full:AccumulatedDepreciationAmortisationAndImpairmentMember2021-12-310000312069ifrs-full:GoodwillMemberifrs-full:AccumulatedDepreciationAmortisationAndImpairmentMember2022-01-012022-12-310000312069ifrs-full:ComputerSoftwareMemberifrs-full:AccumulatedDepreciationAmortisationAndImpairmentMemberifrs-full:InternallyGeneratedMember2022-01-012022-12-310000312069ifrs-full:NotInternallyGeneratedMemberifrs-full:ComputerSoftwareMemberifrs-full:AccumulatedDepreciationAmortisationAndImpairmentMember2022-01-012022-12-310000312069ifrs-full:BrandNamesMemberifrs-full:AccumulatedDepreciationAmortisationAndImpairmentMember2022-01-012022-12-310000312069ifrs-full:CustomerrelatedIntangibleAssetsMemberifrs-full:AccumulatedDepreciationAmortisationAndImpairmentMember2022-01-012022-12-310000312069bcs:LicencesAndOtherMemberifrs-full:AccumulatedDepreciationAmortisationAndImpairmentMember2022-01-012022-12-310000312069ifrs-full:GoodwillMember2022-12-310000312069ifrs-full:ComputerSoftwareMemberifrs-full:InternallyGeneratedMember2022-12-310000312069ifrs-full:NotInternallyGeneratedMemberifrs-full:ComputerSoftwareMember2022-12-310000312069ifrs-full:BrandNamesMember2022-12-310000312069ifrs-full:CustomerrelatedIntangibleAssetsMember2022-12-310000312069bcs:LicencesAndOtherMember2022-12-310000312069bcs:SignOnBonusPaymentsToCoBrandMember2023-01-012023-12-310000312069bcs:GermanConsumerFinancePortfolioMemberifrs-full:AssetsAndLiabilitiesClassifiedAsHeldForSaleMember2023-01-012023-12-310000312069bcs:PersonalBankingUnitedKingdomMemberbcs:BarclaysUkMember2023-12-310000312069bcs:PersonalBankingUnitedKingdomMemberbcs:BarclaysUkMember2022-12-310000312069bcs:BarclaysUkMemberbcs:WoolwichMember2023-12-310000312069bcs:BarclaysUkMemberbcs:WoolwichMember2022-12-310000312069bcs:BarclaysUkMemberbcs:OtherBarclaysUnitedKingdomMember2023-12-310000312069bcs:BarclaysUkMemberbcs:OtherBarclaysUnitedKingdomMember2022-12-310000312069bcs:InvestmentBankMember2023-12-310000312069bcs:InvestmentBankMember2022-12-310000312069bcs:MerchantAcquiringMember2023-01-012023-12-310000312069bcs:PersonalBankingUnitedKingdomMember2023-12-310000312069bcs:PersonalBankingUnitedKingdomMember2022-12-310000312069bcs:CardsAndPaymentsMember2023-12-310000312069bcs:CardsAndPaymentsMember2022-12-310000312069bcs:OtherBarclaysUnitedKingdomMember2023-12-310000312069bcs:OtherBarclaysUnitedKingdomMember2022-12-310000312069bcs:BarclaycardUKMember2023-12-310000312069bcs:BarclaycardUKMember2022-12-310000312069ifrs-full:IndividualAssetsOrCashgeneratingUnitsMember2023-12-310000312069ifrs-full:IndividualAssetsOrCashgeneratingUnitsMember2022-12-310000312069bcs:PersonalBankingUnitedKingdomMemberifrs-full:DiscountRateMeasurementInputMember2023-12-310000312069bcs:PersonalBankingUnitedKingdomMemberbcs:GrowthRateMeasurementInputMember2023-12-310000312069bcs:PersonalBankingUnitedKingdomMemberifrs-full:CapitalisationRateMeasurementInputMember2023-12-310000312069bcs:PersonalBankingUnitedKingdomMemberifrs-full:FinancialForecastOfCashFlowsForCashgeneratingUnitMeasurementInputMember2023-12-310000312069bcs:CardsAndPaymentsMemberifrs-full:DiscountRateMeasurementInputMember2023-12-310000312069bcs:GrowthRateMeasurementInputMemberbcs:CardsAndPaymentsMember2023-12-310000312069ifrs-full:CapitalisationRateMeasurementInputMemberbcs:CardsAndPaymentsMember2023-12-310000312069bcs:CardsAndPaymentsMemberifrs-full:FinancialForecastOfCashFlowsForCashgeneratingUnitMeasurementInputMember2023-12-310000312069bcs:PersonalBankingUKAndCardAndPaymentsMember2023-12-310000312069ifrs-full:RestructuringProvisionMember2022-12-310000312069bcs:CustomerRedressMember2022-12-310000312069ifrs-full:LegalProceedingsProvisionMember2022-12-310000312069ifrs-full:MiscellaneousOtherProvisionsMember2022-12-310000312069bcs:ProvisionsOtherThanUndrawnContractuallyCommittedFacilitiesAndGuaranteesMember2022-12-310000312069ifrs-full:RestructuringProvisionMember2023-01-012023-12-310000312069bcs:CustomerRedressMember2023-01-012023-12-310000312069ifrs-full:LegalProceedingsProvisionMember2023-01-012023-12-310000312069ifrs-full:MiscellaneousOtherProvisionsMember2023-01-012023-12-310000312069bcs:ProvisionsOtherThanUndrawnContractuallyCommittedFacilitiesAndGuaranteesMember2023-01-012023-12-310000312069ifrs-full:RestructuringProvisionMember2023-12-310000312069bcs:CustomerRedressMember2023-12-310000312069ifrs-full:LegalProceedingsProvisionMember2023-12-310000312069ifrs-full:MiscellaneousOtherProvisionsMember2023-12-310000312069bcs:ProvisionsOtherThanUndrawnContractuallyCommittedFacilitiesAndGuaranteesMember2023-12-310000312069bcs:UndrawnContractuallyCommittedFacilitiesAndGuaranteesMember2022-12-310000312069bcs:UndrawnContractuallyCommittedFacilitiesAndGuaranteesMember2023-01-012023-12-310000312069bcs:UndrawnContractuallyCommittedFacilitiesAndGuaranteesMember2023-12-310000312069ifrs-full:FinancialGuaranteeContractsMemberbcs:GuaranteesAndLettersOfCreditPledgedAsCollateralSecurityMember2023-12-310000312069ifrs-full:FinancialGuaranteeContractsMemberbcs:GuaranteesAndLettersOfCreditPledgedAsCollateralSecurityMember2022-12-310000312069bcs:PerformanceGuaranteesAcceptancesAndEndorsementsMemberifrs-full:FinancialGuaranteeContractsMember2023-12-310000312069bcs:PerformanceGuaranteesAcceptancesAndEndorsementsMemberifrs-full:FinancialGuaranteeContractsMember2022-12-310000312069ifrs-full:FinancialGuaranteeContractsMember2023-12-310000312069ifrs-full:FinancialGuaranteeContractsMember2022-12-310000312069ifrs-full:FinancialGuaranteeContractsMemberifrs-full:AtFairValueMember2023-12-310000312069ifrs-full:FinancialGuaranteeContractsMemberifrs-full:AtFairValueMember2022-12-310000312069bcs:DocumentaryCreditsAndOtherShortTermTradeRelatedTransactionsMemberifrs-full:LoanCommitmentsMember2023-12-310000312069bcs:DocumentaryCreditsAndOtherShortTermTradeRelatedTransactionsMemberifrs-full:LoanCommitmentsMember2022-12-310000312069bcs:StandbyFacilitiesCreditLinesAndOtherCommitmentsMemberifrs-full:LoanCommitmentsMember2023-12-310000312069bcs:StandbyFacilitiesCreditLinesAndOtherCommitmentsMemberifrs-full:LoanCommitmentsMember2022-12-310000312069ifrs-full:LoanCommitmentsMemberifrs-full:AtFairValueMember2023-12-310000312069ifrs-full:LoanCommitmentsMemberifrs-full:AtFairValueMember2022-12-310000312069ifrs-full:ProvisionForCreditCommitmentsMember2023-12-310000312069ifrs-full:ProvisionForCreditCommitmentsMember2022-12-310000312069bcs:BarclaysBankPlcMemberbcs:FCAProceedingsAndOtherInvestigationsMember2008-01-012008-12-31bcs:agreement0000312069bcs:BarclaysBankPlcMemberbcs:FCAProceedingsAndOtherInvestigationsMember2013-01-012013-12-310000312069bcs:BarclaysBankPlcMemberbcs:FCAProceedingsAndOtherInvestigationsMember2022-09-012022-09-300000312069bcs:OtherProceedingsMember2023-11-012023-11-30bcs:request0000312069bcs:BarclaysBankPlcMemberbcs:LawsuitsWithSpecifiedDamagesSoughtMemberbcs:USDLIBORCasesInMDLCourtMember2012-01-012012-12-31bcs:lawsuitiso4217:USD0000312069bcs:SterlingLIBORCaseInSDNYMember2016-01-012016-12-310000312069bcs:BarclaysBankPlcMemberbcs:JapaneseYenLIBORCaseInSDNYMemberbcs:ExchangeBasedClassClaimsMember2023-01-012023-12-310000312069bcs:BarclaysBankPlcMemberbcs:NonUSBenchmarksCivilActionsMemberbcs:ExchangeBasedClassClaimsMember2023-01-012023-12-31bcs:claim0000312069bcs:BarclaysBankPlcMemberbcs:BarclaysCapitalIncMemberbcs:SecuritiesAndExchangeCommissionMemberbcs:ConsolidatedFxActionMember2018-01-012018-12-310000312069bcs:NonUSForexCivilActionsMember2020-01-012020-12-310000312069bcs:OriginatedAndSoldToThirdPartiesByAcquiredSubsidiaryMemberbcs:USResidentialAndCommercialMortgageRelatedActivityAndLitigationMemberbcs:RmbsRepurchaseRequestsMember2007-01-012007-07-010000312069bcs:OriginatedAndSoldToThirdPartiesByAcquiredSubsidiaryMemberbcs:USResidentialAndCommercialMortgageRelatedActivityAndLitigationMemberbcs:RmbsRepurchaseRequestsMember2022-06-012022-06-300000312069bcs:CivilActionsInRespectOfVRDOPrivatePlaintiffsMember2023-01-012023-12-310000312069bcs:CivilActionsInRespectOfVRDOSNDYMember2023-01-012023-12-310000312069bcs:InterestRateSwapAndCreditDefaultSwapUSCivilActionsMember2023-01-012023-12-310000312069bcs:BarclaysBankPlcMemberbcs:BdcFinanceLlcMember2008-01-012008-12-310000312069bcs:BarclaysBankPlcMemberbcs:BdcFinanceLlcMember2021-04-012021-04-300000312069bcs:CivilActionsInRespectOfTheUSAntiTerrorismActMember2023-01-012023-12-310000312069bcs:CivilActionsInRespectOfTheUSAntiTerrorismActEDNYMember2023-01-012023-12-31bcs:plaintiff0000312069bcs:CivilActionsInRespectOfTheUSAntiTerrorismActEDNYMember2023-01-012023-01-300000312069bcs:CivilActionsInRespectOfTheUSAntiTerrorismActEDNYMember2023-12-012023-12-310000312069bcs:CivilActionsInRespectOfTheUSAntiTerrorismActSDNYMember2023-01-012023-01-300000312069bcs:DerivativeTransactionsCivilActionMember2021-01-012021-12-310000312069bcs:MotorFinanceCommissionArrangementsMemberbcs:PotentialMajorLitigationMember2024-01-012024-01-31bcs:decision0000312069bcs:OverIssuanceOfSecuritiesInTheUSMember2023-01-012023-12-310000312069bcs:HMRevenueAndCustomsHMRCAssessmentsConcerningUKValueAddedTaxMember2018-01-012018-12-310000312069bcs:HMRevenueAndCustomsHMRCAssessmentsConcerningUKValueAddedTaxMemberbcs:BarclaysUkMember2018-01-012018-12-310000312069bcs:BarclaysBankPlcMemberbcs:HMRevenueAndCustomsHMRCAssessmentsConcerningUKValueAddedTaxMember2018-01-012018-12-310000312069bcs:A7119FixedToFloatingRateSubordinatedCallableNotesDue2034Membersrt:ParentCompanyMemberbcs:FixedToFloatingInterestRateMember2023-01-012023-12-310000312069bcs:A7119FixedToFloatingRateSubordinatedCallableNotesDue2034Membersrt:ParentCompanyMemberbcs:FixedToFloatingInterestRateMember2023-12-310000312069bcs:USDFloatingRateNotesMemberbcs:OtherSubsidiariesMemberifrs-full:FloatingInterestRateMember2023-01-012023-12-310000312069bcs:JPYFloatingRateNotesMemberbcs:OtherSubsidiariesMemberifrs-full:FloatingInterestRateMember2023-01-012023-12-310000312069bcs:A2FixedRateSubordinatedNotesMemberifrs-full:FixedInterestRateMembersrt:ParentCompanyMember2023-01-012023-12-310000312069bcs:A2FixedRateSubordinatedNotesMemberifrs-full:FixedInterestRateMembersrt:ParentCompanyMember2023-12-310000312069bcs:A4375FixedRateSubordinatedNotesDue2024Memberifrs-full:FixedInterestRateMembersrt:ParentCompanyMember2023-01-012023-12-310000312069bcs:A4375FixedRateSubordinatedNotesDue2024Memberifrs-full:FixedInterestRateMembersrt:ParentCompanyMember2023-12-310000312069bcs:BarclaysBankPlcMemberbcs:EURSubordinatedFloatingRateNotesMemberifrs-full:FloatingInterestRateMember2023-01-012023-12-310000312069bcs:BarclaysBankPlcMemberifrs-full:FloatingInterestRateMemberbcs:USDJuniorUndatedFloatingRateNotesMember2023-01-012023-12-310000312069bcs:BarclaysBankPlcMemberifrs-full:FloatingInterestRateMemberbcs:USDJuniorUndatedFloatingRateNotesMember2023-12-310000312069bcs:BarclaysBankPlcMemberifrs-full:FloatingInterestRateMemberbcs:USDJuniorUndatedFloatingRateNotesMember2022-12-310000312069bcs:BarclaysBankPlcMember2023-12-310000312069bcs:BarclaysBankPlcMember2022-12-310000312069ifrs-full:FixedInterestRateMemberbcs:A2FixedRateSubordinatedCallableNotesDue2028Membersrt:ParentCompanyMember2023-12-31iso4217:EUR0000312069ifrs-full:FixedInterestRateMemberbcs:A2FixedRateSubordinatedCallableNotesDue2028Membersrt:ParentCompanyMember2022-12-310000312069bcs:A4375FixedRateSubordinatedNotesDue2024Memberifrs-full:FixedInterestRateMembersrt:ParentCompanyMember2022-12-310000312069ifrs-full:FixedInterestRateMembersrt:ParentCompanyMemberbcs:A375ResettingSubordinatedCallableNotesGBPDue2030Member2023-12-310000312069ifrs-full:FixedInterestRateMembersrt:ParentCompanyMemberbcs:A375ResettingSubordinatedCallableNotesGBPDue2030Member2022-12-310000312069ifrs-full:FixedInterestRateMemberbcs:A375ResettingSubordinatedCallableNotesSGDDue2030Membersrt:ParentCompanyMember2023-12-31iso4217:SGD0000312069ifrs-full:FixedInterestRateMemberbcs:A375ResettingSubordinatedCallableNotesSGDDue2030Membersrt:ParentCompanyMember2022-12-310000312069bcs:A520FixedRateSubordinatedNotesDue2026Memberifrs-full:FixedInterestRateMembersrt:ParentCompanyMember2023-12-310000312069bcs:A520FixedRateSubordinatedNotesDue2026Memberifrs-full:FixedInterestRateMembersrt:ParentCompanyMember2022-12-310000312069ifrs-full:FixedInterestRateMembersrt:ParentCompanyMemberbcs:A1125FixedRateResettingSubordinatedCallableNotesDue2031Member2023-12-310000312069ifrs-full:FixedInterestRateMembersrt:ParentCompanyMemberbcs:A1125FixedRateResettingSubordinatedCallableNotesDue2031Member2022-12-310000312069ifrs-full:FixedInterestRateMembersrt:ParentCompanyMemberbcs:A4836FixedRateSubordinatedCallableNotesDue2028Member2023-12-310000312069ifrs-full:FixedInterestRateMembersrt:ParentCompanyMemberbcs:A4836FixedRateSubordinatedCallableNotesDue2028Member2022-12-310000312069ifrs-full:FixedInterestRateMemberbcs:A8407FixedRateResettingCallableNotesDue2032Membersrt:ParentCompanyMember2023-12-310000312069ifrs-full:FixedInterestRateMemberbcs:A8407FixedRateResettingCallableNotesDue2032Membersrt:ParentCompanyMember2022-12-310000312069bcs:A5088CallableTierTwoNotesMembersrt:ParentCompanyMemberbcs:FixedToFloatingInterestRateMember2023-12-310000312069bcs:A5088CallableTierTwoNotesMembersrt:ParentCompanyMemberbcs:FixedToFloatingInterestRateMember2022-12-310000312069ifrs-full:FixedInterestRateMembersrt:ParentCompanyMemberbcs:A3564FixedRateResettingSubordinatedCallableNotesDue2035Member2023-12-310000312069ifrs-full:FixedInterestRateMembersrt:ParentCompanyMemberbcs:A3564FixedRateResettingSubordinatedCallableNotesDue2035Member2022-12-310000312069bcs:A7119FixedToFloatingRateSubordinatedCallableNotesDue2034Membersrt:ParentCompanyMemberbcs:FixedToFloatingInterestRateMember2022-12-310000312069bcs:A3811FixedRateResettingSubordinatedCallableNotesDue2042Memberifrs-full:FixedInterestRateMembersrt:ParentCompanyMember2023-12-310000312069bcs:A3811FixedRateResettingSubordinatedCallableNotesDue2042Memberifrs-full:FixedInterestRateMembersrt:ParentCompanyMember2022-12-310000312069bcs:BarclaysBankPlcMemberbcs:SubordinatedFloatingRateNotesDue2023BCS23CMemberifrs-full:FloatingInterestRateMember2023-12-310000312069bcs:BarclaysBankPlcMemberbcs:SubordinatedFloatingRateNotesDue2023BCS23CMemberifrs-full:FloatingInterestRateMember2022-12-310000312069bcs:BarclaysBankPlcMemberifrs-full:FixedInterestRateMemberbcs:A575FixedRateSubordinatedNotesDue2026Member2023-12-310000312069bcs:BarclaysBankPlcMemberifrs-full:FixedInterestRateMemberbcs:A575FixedRateSubordinatedNotesDue2026Member2022-12-310000312069bcs:BarclaysBankPlcMemberbcs:A54ReverseDualCurrencySubordinatedLoanDue2027Member2023-12-31iso4217:JPY0000312069bcs:BarclaysBankPlcMemberbcs:A54ReverseDualCurrencySubordinatedLoanDue2027Member2022-12-310000312069bcs:BarclaysBankPlcMemberbcs:A633SubordinatedNotesDue2032Member2023-12-310000312069bcs:BarclaysBankPlcMemberbcs:A633SubordinatedNotesDue2032Member2022-12-310000312069bcs:SubordinatedFloatingRateNotesDue2040Memberbcs:BarclaysBankPlcMemberifrs-full:FloatingInterestRateMember2023-12-310000312069bcs:SubordinatedFloatingRateNotesDue2040Memberbcs:BarclaysBankPlcMemberifrs-full:FloatingInterestRateMember2022-12-310000312069ifrs-full:OrdinarySharesMember2022-12-310000312069ifrs-full:IssuedCapitalMemberifrs-full:OrdinarySharesMember2022-12-310000312069ifrs-full:SharePremiumMemberifrs-full:OrdinarySharesMember2022-12-310000312069ifrs-full:IssuedCapitalMemberifrs-full:OrdinarySharesMember2023-01-012023-12-310000312069ifrs-full:SharePremiumMemberifrs-full:OrdinarySharesMember2023-01-012023-12-310000312069ifrs-full:IssuedCapitalMemberifrs-full:OrdinarySharesMember2023-12-310000312069ifrs-full:SharePremiumMemberifrs-full:OrdinarySharesMember2023-12-310000312069ifrs-full:OrdinarySharesMember2021-12-310000312069ifrs-full:IssuedCapitalMemberifrs-full:OrdinarySharesMember2021-12-310000312069ifrs-full:SharePremiumMemberifrs-full:OrdinarySharesMember2021-12-310000312069ifrs-full:IssuedCapitalMemberifrs-full:OrdinarySharesMember2022-01-012022-12-310000312069ifrs-full:SharePremiumMemberifrs-full:OrdinarySharesMember2022-01-012022-12-310000312069ifrs-full:OrdinarySharesMember2023-05-030000312069bcs:FixedRateResettingPerpetualSubordinatedContingentConvertibleSecuritiesMemberbcs:AdditionalTier1SecuritiesMember2023-01-012023-12-31bcs:issuance0000312069bcs:FixedRateResettingPerpetualSubordinatedContingentConvertibleSecuritiesMemberbcs:AdditionalTier1SecuritiesMember2022-01-012022-12-31bcs:redemption0000312069bcs:FixedRateResettingPerpetualSubordinatedContingentConvertibleSecuritiesMemberbcs:AdditionalTier1SecuritiesMember2023-12-310000312069bcs:FixedRateResettingPerpetualSubordinatedContingentConvertibleSecuritiesMemberbcs:AdditionalTier1SecuritiesMember2022-12-310000312069ifrs-full:FixedInterestRateMembersrt:ParentCompanyMemberbcs:A725PerpetualSubordinatedContingentConvertibleSecuritiesDue2023Memberbcs:AdditionalTier1SecuritiesMember2023-12-310000312069ifrs-full:FixedInterestRateMembersrt:ParentCompanyMemberbcs:A725PerpetualSubordinatedContingentConvertibleSecuritiesDue2023Memberbcs:AdditionalTier1SecuritiesMember2022-12-310000312069bcs:A775PerpetualSubordinatedContingentConvertibleSecuritiesDue2023Memberifrs-full:FixedInterestRateMembersrt:ParentCompanyMemberbcs:AdditionalTier1SecuritiesMember2023-12-310000312069bcs:A775PerpetualSubordinatedContingentConvertibleSecuritiesDue2023Memberifrs-full:FixedInterestRateMembersrt:ParentCompanyMemberbcs:AdditionalTier1SecuritiesMember2022-12-310000312069ifrs-full:FixedInterestRateMembersrt:ParentCompanyMemberbcs:A5875PerpetualSubordinatedContingentConvertibleSecuritiesDue2024Memberbcs:AdditionalTier1SecuritiesMember2023-12-310000312069ifrs-full:FixedInterestRateMembersrt:ParentCompanyMemberbcs:A5875PerpetualSubordinatedContingentConvertibleSecuritiesDue2024Memberbcs:AdditionalTier1SecuritiesMember2022-12-310000312069ifrs-full:FixedInterestRateMemberbcs:A8PerpetualSubordinatedContingentConvertibleSecuritiesDue2024Membersrt:ParentCompanyMemberbcs:AdditionalTier1SecuritiesMember2023-12-310000312069ifrs-full:FixedInterestRateMemberbcs:A8PerpetualSubordinatedContingentConvertibleSecuritiesDue2024Membersrt:ParentCompanyMemberbcs:AdditionalTier1SecuritiesMember2022-12-310000312069ifrs-full:FixedInterestRateMembersrt:ParentCompanyMemberbcs:A7125PerpetualSubordinatedContingentConvertibleSecuritiesDue2025Memberbcs:AdditionalTier1SecuritiesMember2023-12-310000312069ifrs-full:FixedInterestRateMembersrt:ParentCompanyMemberbcs:A7125PerpetualSubordinatedContingentConvertibleSecuritiesDue2025Memberbcs:AdditionalTier1SecuritiesMember2022-12-310000312069ifrs-full:FixedInterestRateMembersrt:ParentCompanyMemberbcs:A6375PerpetualSubordinatedContingentConvertibleSecuritiesDue2025Memberbcs:AdditionalTier1SecuritiesMember2023-12-310000312069ifrs-full:FixedInterestRateMembersrt:ParentCompanyMemberbcs:A6375PerpetualSubordinatedContingentConvertibleSecuritiesDue2025Memberbcs:AdditionalTier1SecuritiesMember2022-12-310000312069bcs:A6125PerpetualSubordinatedContingentConvertibleSecuritiesDue2025Memberifrs-full:FixedInterestRateMembersrt:ParentCompanyMemberbcs:AdditionalTier1SecuritiesMember2023-12-310000312069bcs:A6125PerpetualSubordinatedContingentConvertibleSecuritiesDue2025Memberifrs-full:FixedInterestRateMembersrt:ParentCompanyMemberbcs:AdditionalTier1SecuritiesMember2022-12-310000312069ifrs-full:FixedInterestRateMemberbcs:A8300PerpetualSubordinatedContingentConvertibleSecuritiesMembersrt:ParentCompanyMemberbcs:AdditionalTier1SecuritiesMember2023-12-310000312069ifrs-full:FixedInterestRateMemberbcs:A8300PerpetualSubordinatedContingentConvertibleSecuritiesMembersrt:ParentCompanyMemberbcs:AdditionalTier1SecuritiesMember2022-12-310000312069bcs:A8875PerpetualSubordinatedContingentConvertibleSecuritiesMemberifrs-full:FixedInterestRateMembersrt:ParentCompanyMemberbcs:AdditionalTier1SecuritiesMember2023-12-310000312069bcs:A8875PerpetualSubordinatedContingentConvertibleSecuritiesMemberifrs-full:FixedInterestRateMembersrt:ParentCompanyMemberbcs:AdditionalTier1SecuritiesMember2022-12-310000312069bcs:A4375PerpetualSubordinatedContingentConvertibleSecuritiesMemberifrs-full:FixedInterestRateMembersrt:ParentCompanyMemberbcs:AdditionalTier1SecuritiesMember2023-12-310000312069bcs:A4375PerpetualSubordinatedContingentConvertibleSecuritiesMemberifrs-full:FixedInterestRateMembersrt:ParentCompanyMemberbcs:AdditionalTier1SecuritiesMember2022-12-310000312069ifrs-full:FixedInterestRateMembersrt:ParentCompanyMemberbcs:A9250PerpetualSubordinatedContingentConvertibleSecuritiesMemberbcs:AdditionalTier1SecuritiesMember2023-12-310000312069ifrs-full:FixedInterestRateMembersrt:ParentCompanyMemberbcs:A9250PerpetualSubordinatedContingentConvertibleSecuritiesMemberbcs:AdditionalTier1SecuritiesMember2022-12-310000312069bcs:A7300PerpetualSubordinatedContingentConvertibleSecuritiesMemberifrs-full:FixedInterestRateMembersrt:ParentCompanyMemberbcs:AdditionalTier1SecuritiesMember2023-12-310000312069bcs:A7300PerpetualSubordinatedContingentConvertibleSecuritiesMemberifrs-full:FixedInterestRateMembersrt:ParentCompanyMemberbcs:AdditionalTier1SecuritiesMember2022-12-310000312069ifrs-full:FixedInterestRateMemberbcs:A8000PerpetualSubordinatedContingentConvertibleSecuritiesMembersrt:ParentCompanyMemberbcs:AdditionalTier1SecuritiesMember2023-12-310000312069ifrs-full:FixedInterestRateMemberbcs:A8000PerpetualSubordinatedContingentConvertibleSecuritiesMembersrt:ParentCompanyMemberbcs:AdditionalTier1SecuritiesMember2022-12-310000312069ifrs-full:FixedInterestRateMembersrt:ParentCompanyMemberbcs:A9625PerpetualSubordinatedContingentConvertibleSecuritiesMemberbcs:AdditionalTier1SecuritiesMember2023-12-310000312069ifrs-full:FixedInterestRateMembersrt:ParentCompanyMemberbcs:A9625PerpetualSubordinatedContingentConvertibleSecuritiesMemberbcs:AdditionalTier1SecuritiesMember2022-12-310000312069ifrs-full:FixedInterestRateMembersrt:ParentCompanyMemberbcs:AdditionalTier1SecuritiesMember2023-12-310000312069ifrs-full:FixedInterestRateMembersrt:ParentCompanyMemberbcs:AdditionalTier1SecuritiesMember2022-12-310000312069ifrs-full:ReserveOfExchangeDifferencesOnTranslationMember2023-12-310000312069ifrs-full:ReserveOfExchangeDifferencesOnTranslationMember2022-12-310000312069ifrs-full:ReserveOfGainsAndLossesOnFinancialAssetsMeasuredAtFairValueThroughOtherComprehensiveIncomeMember2023-12-310000312069ifrs-full:ReserveOfGainsAndLossesOnFinancialAssetsMeasuredAtFairValueThroughOtherComprehensiveIncomeMember2022-12-310000312069ifrs-full:ReserveOfCashFlowHedgesMember2023-12-310000312069ifrs-full:ReserveOfCashFlowHedgesMember2022-12-310000312069ifrs-full:ReserveOfChangeInFairValueOfFinancialLiabilityAttributableToChangeInCreditRiskOfLiabilityMember2023-12-310000312069ifrs-full:ReserveOfChangeInFairValueOfFinancialLiabilityAttributableToChangeInCreditRiskOfLiabilityMember2022-12-310000312069bcs:OtherReservesAndTreasurySharesMember2023-12-310000312069bcs:OtherReservesAndTreasurySharesMember2022-12-310000312069ifrs-full:PreferenceSharesMemberbcs:BarclaysBankPlcMember2023-01-012023-12-310000312069ifrs-full:PreferenceSharesMemberbcs:BarclaysBankPlcMember2022-01-012022-12-310000312069ifrs-full:PreferenceSharesMemberbcs:BarclaysBankPlcMember2023-12-310000312069ifrs-full:PreferenceSharesMemberbcs:BarclaysBankPlcMember2022-12-310000312069bcs:UpperTier2InstrumentsMemberbcs:BarclaysBankPlcMember2023-01-012023-12-310000312069bcs:UpperTier2InstrumentsMemberbcs:BarclaysBankPlcMember2022-01-012022-12-310000312069bcs:UpperTier2InstrumentsMemberbcs:BarclaysBankPlcMember2023-12-310000312069bcs:UpperTier2InstrumentsMemberbcs:BarclaysBankPlcMember2022-12-310000312069bcs:OtherNonControllingInterestsMember2023-01-012023-12-310000312069bcs:OtherNonControllingInterestsMember2022-01-012022-12-310000312069bcs:OtherNonControllingInterestsMember2023-12-310000312069bcs:OtherNonControllingInterestsMember2022-12-310000312069ifrs-full:NoncontrollingInterestsMemberbcs:UpperTier2InstrumentsMember2023-12-310000312069ifrs-full:NoncontrollingInterestsMemberbcs:UpperTier2InstrumentsMember2022-12-310000312069ifrs-full:NoncontrollingInterestsMemberbcs:UpperTier2InstrumentsMember2023-01-012023-12-310000312069ifrs-full:NoncontrollingInterestsMemberbcs:UpperTier2InstrumentsMember2022-01-012022-12-310000312069bcs:UpperTier2InstrumentsMemberbcs:BarclaysBankPlcMemberbcs:UndatedFloatingRatePrimaryCapitalNotesSeriesOneMemberifrs-full:FloatingInterestRateMember2023-01-012023-12-310000312069bcs:UpperTier2InstrumentsMemberbcs:BarclaysBankPlcMemberbcs:UndatedFloatingRatePrimaryCapitalNotesSeriesTwoMemberifrs-full:FloatingInterestRateMember2023-01-012023-12-310000312069bcs:UpperTier2InstrumentsMemberbcs:BarclaysBankPlcMemberbcs:A9PermanentInterestBearingCapitalBondsMember2023-12-310000312069bcs:UpperTier2InstrumentsMemberbcs:BarclaysBankPlcMemberbcs:A9PermanentInterestBearingCapitalBondsMember2023-01-012023-12-310000312069bcs:BarclaysBankPlcMemberbcs:BarclaysBankPlcMember2023-01-012023-12-310000312069bcs:UpperTier2InstrumentsMemberbcs:BarclaysBankPlcMemberbcs:A6125UndatedSubordinatedNotesMember2023-12-310000312069bcs:BarclaysBankPlcMemberifrs-full:PreferenceSharesMemberbcs:USDollarPreferenceSharesMember2023-12-310000312069bcs:BarclaysBankPlcMemberifrs-full:PreferenceSharesMemberbcs:USDollarPreferenceSharesMember2022-12-310000312069bcs:BarclaysBankPlcMemberifrs-full:PreferenceSharesMemberbcs:EuroPreferenceSharesMember2023-12-310000312069bcs:BarclaysBankPlcMemberifrs-full:PreferenceSharesMemberbcs:EuroPreferenceSharesMember2022-12-310000312069bcs:UpperTier2InstrumentsMemberbcs:BarclaysBankPlcMemberbcs:UndatedFloatingRatePrimaryCapitalNotesSeriesOneMemberifrs-full:FloatingInterestRateMember2023-12-310000312069bcs:UpperTier2InstrumentsMemberbcs:BarclaysBankPlcMemberbcs:UndatedFloatingRatePrimaryCapitalNotesSeriesOneMemberifrs-full:FloatingInterestRateMember2022-12-310000312069bcs:UpperTier2InstrumentsMemberbcs:BarclaysBankPlcMemberbcs:UndatedFloatingRatePrimaryCapitalNotesSeriesTwoMemberifrs-full:FloatingInterestRateMember2023-12-310000312069bcs:UpperTier2InstrumentsMemberbcs:BarclaysBankPlcMemberbcs:UndatedFloatingRatePrimaryCapitalNotesSeriesTwoMemberifrs-full:FloatingInterestRateMember2022-12-310000312069bcs:UpperTier2InstrumentsMemberbcs:BarclaysBankPlcMemberbcs:A503UndatedReverseDualCurrencySubordinatedNoteMember2023-12-310000312069bcs:UpperTier2InstrumentsMemberbcs:BarclaysBankPlcMemberbcs:A503UndatedReverseDualCurrencySubordinatedNoteMember2022-12-310000312069bcs:A50ReverseDualCurrencySubordinatedMemberbcs:UpperTier2InstrumentsMemberbcs:BarclaysBankPlcMember2023-12-310000312069bcs:A50ReverseDualCurrencySubordinatedMemberbcs:UpperTier2InstrumentsMemberbcs:BarclaysBankPlcMember2022-12-310000312069bcs:UpperTier2InstrumentsMemberbcs:BarclaysBankPlcMemberbcs:A9PermanentInterestBearingCapitalBondsMember2022-12-310000312069bcs:UpperTier2InstrumentsMemberbcs:BarclaysBankPlcMemberbcs:A6125UndatedSubordinatedNotesMember2022-12-310000312069bcs:PensionDefinedContributionPlansMember2023-01-012023-12-310000312069bcs:PensionDefinedContributionPlansMember2022-01-012022-12-310000312069bcs:PensionDefinedContributionPlansMember2021-01-012021-12-310000312069ifrs-full:PensionDefinedBenefitPlansMember2023-01-012023-12-310000312069ifrs-full:PensionDefinedBenefitPlansMember2022-01-012022-12-310000312069ifrs-full:PensionDefinedBenefitPlansMember2021-01-012021-12-310000312069ifrs-full:InternallyGeneratedMember2023-01-012023-12-310000312069ifrs-full:InternallyGeneratedMember2022-01-012022-12-310000312069ifrs-full:InternallyGeneratedMember2021-01-012021-12-310000312069bcs:DeferredShareValuePlanShareValuePlanMember2023-01-012023-12-310000312069bcs:DeferredShareValuePlanShareValuePlanMember2022-01-012022-12-310000312069bcs:DeferredShareValuePlanShareValuePlanMember2021-01-012021-12-310000312069bcs:OtherSchemesMember2023-01-012023-12-310000312069bcs:OtherSchemesMember2022-01-012022-12-310000312069bcs:OtherSchemesMember2021-01-012021-12-310000312069bcs:DeferredShareValuePlanShareValuePlanMember2023-12-310000312069bcs:DeferredShareValuePlanShareValuePlanMember2022-12-310000312069bcs:OtherSchemesMemberifrs-full:BottomOfRangeMember2023-12-310000312069ifrs-full:TopOfRangeMemberbcs:OtherSchemesMember2023-12-310000312069bcs:OtherSchemesMemberifrs-full:BottomOfRangeMember2023-01-012023-12-310000312069ifrs-full:TopOfRangeMemberbcs:OtherSchemesMember2023-01-012023-12-310000312069bcs:OtherSchemesMember2023-12-310000312069bcs:OtherSchemesMemberifrs-full:BottomOfRangeMember2022-12-310000312069ifrs-full:TopOfRangeMemberbcs:OtherSchemesMember2022-12-310000312069bcs:OtherSchemesMemberifrs-full:BottomOfRangeMember2022-01-012022-12-310000312069ifrs-full:TopOfRangeMemberbcs:OtherSchemesMember2022-01-012022-12-310000312069bcs:OtherSchemesMember2022-12-310000312069bcs:SharesaveMemberifrs-full:BottomOfRangeMember2023-01-012023-12-31bcs:year0000312069ifrs-full:TopOfRangeMemberbcs:SharesaveMember2023-01-012023-12-310000312069bcs:DeferredShareValuePlanShareValuePlanMember2021-12-310000312069bcs:OtherSchemesMember2021-12-310000312069bcs:SharesaveMember2022-12-310000312069bcs:SharesaveMember2021-12-310000312069bcs:SharesaveMember2023-01-012023-12-310000312069bcs:SharesaveMember2022-01-012022-12-310000312069bcs:SharesaveMember2023-12-310000312069bcs:EmployeeBenefitAndOtherTrustsMember2023-12-310000312069bcs:EmployeeBenefitAndOtherTrustsMember2022-12-310000312069bcs:EmployeeBenefitAndOtherTrustsMember2023-01-012023-12-310000312069bcs:EmployeeBenefitAndOtherTrustsMember2022-01-012022-12-310000312069bcs:CertainShareBasedPaymentSchemesMemberifrs-full:RetainedEarningsMemberifrs-full:ForwardContractMemberifrs-full:AtCostMember2023-01-012023-12-310000312069ifrs-full:CountryOfDomicileMemberifrs-full:DefinedBenefitPlansOtherThanMultiemployerPlansStatePlansAndPlansThatShareRisksBetweenEntitiesUnderCommonControlMemberifrs-full:PensionDefinedBenefitPlansMember2023-12-310000312069ifrs-full:CountryOfDomicileMemberifrs-full:DefinedBenefitPlansOtherThanMultiemployerPlansStatePlansAndPlansThatShareRisksBetweenEntitiesUnderCommonControlMemberifrs-full:PensionDefinedBenefitPlansMember2022-12-310000312069srt:DirectorMember2023-12-31bcs:director0000312069bcs:IndependentDirectorMember2023-12-310000312069bcs:MemberNominatedDirectorMember2023-12-310000312069ifrs-full:CountryOfDomicileMemberifrs-full:DefinedBenefitPlansOtherThanMultiemployerPlansStatePlansAndPlansThatShareRisksBetweenEntitiesUnderCommonControlMemberifrs-full:PresentValueOfDefinedBenefitObligationMemberifrs-full:PensionDefinedBenefitPlansMember2022-12-310000312069ifrs-full:CountryOfDomicileMemberifrs-full:DefinedBenefitPlansOtherThanMultiemployerPlansStatePlansAndPlansThatShareRisksBetweenEntitiesUnderCommonControlMemberifrs-full:PresentValueOfDefinedBenefitObligationMemberifrs-full:PensionDefinedBenefitPlansMember2021-12-310000312069ifrs-full:CountryOfDomicileMemberifrs-full:DefinedBenefitPlansOtherThanMultiemployerPlansStatePlansAndPlansThatShareRisksBetweenEntitiesUnderCommonControlMemberifrs-full:PresentValueOfDefinedBenefitObligationMemberifrs-full:PensionDefinedBenefitPlansMember2023-01-012023-12-310000312069ifrs-full:CountryOfDomicileMemberifrs-full:DefinedBenefitPlansOtherThanMultiemployerPlansStatePlansAndPlansThatShareRisksBetweenEntitiesUnderCommonControlMemberifrs-full:PresentValueOfDefinedBenefitObligationMemberifrs-full:PensionDefinedBenefitPlansMember2022-01-012022-12-310000312069ifrs-full:CountryOfDomicileMemberifrs-full:DefinedBenefitPlansOtherThanMultiemployerPlansStatePlansAndPlansThatShareRisksBetweenEntitiesUnderCommonControlMemberifrs-full:PresentValueOfDefinedBenefitObligationMemberifrs-full:PensionDefinedBenefitPlansMember2023-12-310000312069ifrs-full:PlanAssetsMember2022-12-310000312069ifrs-full:CountryOfDomicileMemberifrs-full:DefinedBenefitPlansOtherThanMultiemployerPlansStatePlansAndPlansThatShareRisksBetweenEntitiesUnderCommonControlMemberifrs-full:PlanAssetsMemberifrs-full:PensionDefinedBenefitPlansMember2022-12-310000312069ifrs-full:PlanAssetsMember2021-12-310000312069ifrs-full:CountryOfDomicileMemberifrs-full:DefinedBenefitPlansOtherThanMultiemployerPlansStatePlansAndPlansThatShareRisksBetweenEntitiesUnderCommonControlMemberifrs-full:PlanAssetsMemberifrs-full:PensionDefinedBenefitPlansMember2021-12-310000312069ifrs-full:PlanAssetsMember2023-01-012023-12-310000312069ifrs-full:CountryOfDomicileMemberifrs-full:DefinedBenefitPlansOtherThanMultiemployerPlansStatePlansAndPlansThatShareRisksBetweenEntitiesUnderCommonControlMemberifrs-full:PlanAssetsMemberifrs-full:PensionDefinedBenefitPlansMember2023-01-012023-12-310000312069ifrs-full:PlanAssetsMember2022-01-012022-12-310000312069ifrs-full:CountryOfDomicileMemberifrs-full:DefinedBenefitPlansOtherThanMultiemployerPlansStatePlansAndPlansThatShareRisksBetweenEntitiesUnderCommonControlMemberifrs-full:PlanAssetsMemberifrs-full:PensionDefinedBenefitPlansMember2022-01-012022-12-310000312069ifrs-full:PlanAssetsMember2023-12-310000312069ifrs-full:CountryOfDomicileMemberifrs-full:DefinedBenefitPlansOtherThanMultiemployerPlansStatePlansAndPlansThatShareRisksBetweenEntitiesUnderCommonControlMemberifrs-full:PlanAssetsMemberifrs-full:PensionDefinedBenefitPlansMember2023-12-310000312069ifrs-full:ForeignCountriesMemberifrs-full:PresentValueOfDefinedBenefitObligationMemberifrs-full:PensionDefinedBenefitPlansMember2023-12-310000312069ifrs-full:ForeignCountriesMemberifrs-full:PresentValueOfDefinedBenefitObligationMemberifrs-full:PensionDefinedBenefitPlansMember2022-12-310000312069bcs:OtherPensionSchemesMemberifrs-full:PresentValueOfDefinedBenefitObligationMemberifrs-full:PostemploymentMedicalDefinedBenefitPlansMember2023-12-310000312069bcs:OtherPensionSchemesMemberifrs-full:PresentValueOfDefinedBenefitObligationMemberifrs-full:PostemploymentMedicalDefinedBenefitPlansMember2022-12-310000312069bcs:NotLaterThanTenYearsMemberifrs-full:CountryOfDomicileMemberifrs-full:DefinedBenefitPlansOtherThanMultiemployerPlansStatePlansAndPlansThatShareRisksBetweenEntitiesUnderCommonControlMemberifrs-full:PresentValueOfDefinedBenefitObligationMemberifrs-full:PensionDefinedBenefitPlansMember2023-01-012023-12-310000312069ifrs-full:CountryOfDomicileMemberifrs-full:DefinedBenefitPlansOtherThanMultiemployerPlansStatePlansAndPlansThatShareRisksBetweenEntitiesUnderCommonControlMemberifrs-full:PresentValueOfDefinedBenefitObligationMemberbcs:LaterThanElevenYearsAndNotLaterThanTwentyYearsMemberifrs-full:PensionDefinedBenefitPlansMember2023-01-012023-12-310000312069ifrs-full:CountryOfDomicileMemberifrs-full:DefinedBenefitPlansOtherThanMultiemployerPlansStatePlansAndPlansThatShareRisksBetweenEntitiesUnderCommonControlMemberifrs-full:PresentValueOfDefinedBenefitObligationMemberbcs:LaterThanTwentyYearsAndNotLaterThanThirtyYearsMemberifrs-full:PensionDefinedBenefitPlansMember2023-01-012023-12-310000312069ifrs-full:CountryOfDomicileMemberifrs-full:DefinedBenefitPlansOtherThanMultiemployerPlansStatePlansAndPlansThatShareRisksBetweenEntitiesUnderCommonControlMemberifrs-full:PensionDefinedBenefitPlansMember2023-01-012023-12-310000312069ifrs-full:CountryOfDomicileMemberifrs-full:DefinedBenefitPlansOtherThanMultiemployerPlansStatePlansAndPlansThatShareRisksBetweenEntitiesUnderCommonControlMemberifrs-full:PensionDefinedBenefitPlansMember2022-01-012022-12-310000312069bcs:ActuarialAssumptionOfKeyFinancialAssumptionsMemberifrs-full:CountryOfDomicileMemberifrs-full:DefinedBenefitPlansOtherThanMultiemployerPlansStatePlansAndPlansThatShareRisksBetweenEntitiesUnderCommonControlMemberifrs-full:PensionDefinedBenefitPlansMember2023-12-310000312069bcs:ActuarialAssumptionOfKeyFinancialAssumptionsMemberifrs-full:CountryOfDomicileMemberifrs-full:DefinedBenefitPlansOtherThanMultiemployerPlansStatePlansAndPlansThatShareRisksBetweenEntitiesUnderCommonControlMemberifrs-full:PensionDefinedBenefitPlansMember2022-12-310000312069ifrs-full:CountryOfDomicileMemberifrs-full:DefinedBenefitPlansOtherThanMultiemployerPlansStatePlansAndPlansThatShareRisksBetweenEntitiesUnderCommonControlMemberbcs:LifeExpectancyAt60ForCurrentPensionersMalesMemberifrs-full:PensionDefinedBenefitPlansMember2023-01-012023-12-310000312069ifrs-full:CountryOfDomicileMemberifrs-full:DefinedBenefitPlansOtherThanMultiemployerPlansStatePlansAndPlansThatShareRisksBetweenEntitiesUnderCommonControlMemberbcs:LifeExpectancyAt60ForCurrentPensionersMalesMemberifrs-full:PensionDefinedBenefitPlansMember2022-01-012022-12-310000312069ifrs-full:CountryOfDomicileMemberifrs-full:DefinedBenefitPlansOtherThanMultiemployerPlansStatePlansAndPlansThatShareRisksBetweenEntitiesUnderCommonControlMemberbcs:LifeExpectancyAt60ForCurrentPensionersMalesMemberifrs-full:PensionDefinedBenefitPlansMember2021-01-012021-12-310000312069bcs:LifeExpectancyAt60ForCurrentPensionersFemalesMemberifrs-full:CountryOfDomicileMemberifrs-full:DefinedBenefitPlansOtherThanMultiemployerPlansStatePlansAndPlansThatShareRisksBetweenEntitiesUnderCommonControlMemberifrs-full:PensionDefinedBenefitPlansMember2023-01-012023-12-310000312069bcs:LifeExpectancyAt60ForCurrentPensionersFemalesMemberifrs-full:CountryOfDomicileMemberifrs-full:DefinedBenefitPlansOtherThanMultiemployerPlansStatePlansAndPlansThatShareRisksBetweenEntitiesUnderCommonControlMemberifrs-full:PensionDefinedBenefitPlansMember2022-01-012022-12-310000312069bcs:LifeExpectancyAt60ForCurrentPensionersFemalesMemberifrs-full:CountryOfDomicileMemberifrs-full:DefinedBenefitPlansOtherThanMultiemployerPlansStatePlansAndPlansThatShareRisksBetweenEntitiesUnderCommonControlMemberifrs-full:PensionDefinedBenefitPlansMember2021-01-012021-12-310000312069ifrs-full:CountryOfDomicileMemberifrs-full:DefinedBenefitPlansOtherThanMultiemployerPlansStatePlansAndPlansThatShareRisksBetweenEntitiesUnderCommonControlMemberbcs:LifeExpectancyAt60ForFuturePensionersAt40YearsMalesMemberifrs-full:PensionDefinedBenefitPlansMember2023-01-012023-12-310000312069ifrs-full:CountryOfDomicileMemberifrs-full:DefinedBenefitPlansOtherThanMultiemployerPlansStatePlansAndPlansThatShareRisksBetweenEntitiesUnderCommonControlMemberbcs:LifeExpectancyAt60ForFuturePensionersAt40YearsMalesMemberifrs-full:PensionDefinedBenefitPlansMember2022-01-012022-12-310000312069ifrs-full:CountryOfDomicileMemberifrs-full:DefinedBenefitPlansOtherThanMultiemployerPlansStatePlansAndPlansThatShareRisksBetweenEntitiesUnderCommonControlMemberbcs:LifeExpectancyAt60ForFuturePensionersAt40YearsMalesMemberifrs-full:PensionDefinedBenefitPlansMember2021-01-012021-12-310000312069bcs:LifeExpectancyAt60ForFuturePensionersAt40YearsFemalesMemberifrs-full:CountryOfDomicileMemberifrs-full:DefinedBenefitPlansOtherThanMultiemployerPlansStatePlansAndPlansThatShareRisksBetweenEntitiesUnderCommonControlMemberifrs-full:PensionDefinedBenefitPlansMember2023-01-012023-12-310000312069bcs:LifeExpectancyAt60ForFuturePensionersAt40YearsFemalesMemberifrs-full:CountryOfDomicileMemberifrs-full:DefinedBenefitPlansOtherThanMultiemployerPlansStatePlansAndPlansThatShareRisksBetweenEntitiesUnderCommonControlMemberifrs-full:PensionDefinedBenefitPlansMember2022-01-012022-12-310000312069bcs:LifeExpectancyAt60ForFuturePensionersAt40YearsFemalesMemberifrs-full:CountryOfDomicileMemberifrs-full:DefinedBenefitPlansOtherThanMultiemployerPlansStatePlansAndPlansThatShareRisksBetweenEntitiesUnderCommonControlMemberifrs-full:PensionDefinedBenefitPlansMember2021-01-012021-12-310000312069ifrs-full:CountryOfDomicileMemberbcs:ActuarialAssumptionOfChangeInDiscountRateByFiftyBasisPointsMemberifrs-full:DefinedBenefitPlansOtherThanMultiemployerPlansStatePlansAndPlansThatShareRisksBetweenEntitiesUnderCommonControlMemberifrs-full:PensionDefinedBenefitPlansMember2023-12-310000312069ifrs-full:CountryOfDomicileMemberbcs:ActuarialAssumptionOfChangeInDiscountRateByFiftyBasisPointsMemberifrs-full:DefinedBenefitPlansOtherThanMultiemployerPlansStatePlansAndPlansThatShareRisksBetweenEntitiesUnderCommonControlMemberifrs-full:PensionDefinedBenefitPlansMember2022-12-310000312069ifrs-full:CountryOfDomicileMemberifrs-full:DefinedBenefitPlansOtherThanMultiemployerPlansStatePlansAndPlansThatShareRisksBetweenEntitiesUnderCommonControlMemberbcs:ActuarialAssumptionOfChangeInDiscountRateByTwentyFiveBasisPointsMemberifrs-full:PensionDefinedBenefitPlansMember2023-12-310000312069ifrs-full:CountryOfDomicileMemberifrs-full:DefinedBenefitPlansOtherThanMultiemployerPlansStatePlansAndPlansThatShareRisksBetweenEntitiesUnderCommonControlMemberbcs:ActuarialAssumptionOfChangeInDiscountRateByTwentyFiveBasisPointsMemberifrs-full:PensionDefinedBenefitPlansMember2022-12-310000312069ifrs-full:CountryOfDomicileMemberifrs-full:DefinedBenefitPlansOtherThanMultiemployerPlansStatePlansAndPlansThatShareRisksBetweenEntitiesUnderCommonControlMemberifrs-full:PensionDefinedBenefitPlansMemberbcs:ActuarialAssumptionOfChangeInExpectedInflationRateByFiftyBasisPointsMember2023-12-310000312069ifrs-full:CountryOfDomicileMemberifrs-full:DefinedBenefitPlansOtherThanMultiemployerPlansStatePlansAndPlansThatShareRisksBetweenEntitiesUnderCommonControlMemberifrs-full:PensionDefinedBenefitPlansMemberbcs:ActuarialAssumptionOfChangeInExpectedInflationRateByFiftyBasisPointsMember2022-12-310000312069ifrs-full:CountryOfDomicileMemberifrs-full:DefinedBenefitPlansOtherThanMultiemployerPlansStatePlansAndPlansThatShareRisksBetweenEntitiesUnderCommonControlMemberbcs:ActuarialAssumptionOfChangeInExpectedInflationRateByTwentyFiveBasisPointsMemberifrs-full:PensionDefinedBenefitPlansMember2023-12-310000312069ifrs-full:CountryOfDomicileMemberifrs-full:DefinedBenefitPlansOtherThanMultiemployerPlansStatePlansAndPlansThatShareRisksBetweenEntitiesUnderCommonControlMemberbcs:ActuarialAssumptionOfChangeInExpectedInflationRateByTwentyFiveBasisPointsMemberifrs-full:PensionDefinedBenefitPlansMember2022-12-310000312069ifrs-full:CountryOfDomicileMemberbcs:ActuarialAssumptionOfChangeInLifeExpectancyAfterRetirementMemberifrs-full:DefinedBenefitPlansOtherThanMultiemployerPlansStatePlansAndPlansThatShareRisksBetweenEntitiesUnderCommonControlMemberifrs-full:PensionDefinedBenefitPlansMember2023-01-012023-12-310000312069ifrs-full:CountryOfDomicileMemberbcs:ActuarialAssumptionOfChangeInLifeExpectancyAfterRetirementMemberifrs-full:DefinedBenefitPlansOtherThanMultiemployerPlansStatePlansAndPlansThatShareRisksBetweenEntitiesUnderCommonControlMemberifrs-full:PensionDefinedBenefitPlansMember2023-12-310000312069ifrs-full:CountryOfDomicileMemberbcs:ActuarialAssumptionOfChangeInLifeExpectancyAfterRetirementMemberifrs-full:DefinedBenefitPlansOtherThanMultiemployerPlansStatePlansAndPlansThatShareRisksBetweenEntitiesUnderCommonControlMemberifrs-full:PensionDefinedBenefitPlansMember2022-12-310000312069ifrs-full:PlanAssetsMemberifrs-full:EquityInvestmentsMemberifrs-full:Level1OfFairValueHierarchyMember2023-12-310000312069ifrs-full:Level2And3OfFairValueHierarchyMemberifrs-full:PlanAssetsMemberifrs-full:EquityInvestmentsMember2023-12-310000312069ifrs-full:PlanAssetsMemberifrs-full:EquityInvestmentsMember2023-12-310000312069ifrs-full:CountryOfDomicileMemberifrs-full:DefinedBenefitPlansOtherThanMultiemployerPlansStatePlansAndPlansThatShareRisksBetweenEntitiesUnderCommonControlMemberifrs-full:PlanAssetsMemberifrs-full:EquityInvestmentsMemberifrs-full:Level1OfFairValueHierarchyMemberifrs-full:PensionDefinedBenefitPlansMember2023-12-310000312069ifrs-full:CountryOfDomicileMemberifrs-full:Level2And3OfFairValueHierarchyMemberifrs-full:DefinedBenefitPlansOtherThanMultiemployerPlansStatePlansAndPlansThatShareRisksBetweenEntitiesUnderCommonControlMemberifrs-full:PlanAssetsMemberifrs-full:EquityInvestmentsMemberifrs-full:PensionDefinedBenefitPlansMember2023-12-310000312069ifrs-full:CountryOfDomicileMemberifrs-full:DefinedBenefitPlansOtherThanMultiemployerPlansStatePlansAndPlansThatShareRisksBetweenEntitiesUnderCommonControlMemberifrs-full:PlanAssetsMemberifrs-full:EquityInvestmentsMemberifrs-full:PensionDefinedBenefitPlansMember2023-12-310000312069bcs:PrivateEquityInvestmentsMemberifrs-full:PlanAssetsMemberifrs-full:Level1OfFairValueHierarchyMember2023-12-310000312069bcs:PrivateEquityInvestmentsMemberifrs-full:Level2And3OfFairValueHierarchyMemberifrs-full:PlanAssetsMember2023-12-310000312069bcs:PrivateEquityInvestmentsMemberifrs-full:PlanAssetsMember2023-12-310000312069bcs:PrivateEquityInvestmentsMemberifrs-full:CountryOfDomicileMemberifrs-full:DefinedBenefitPlansOtherThanMultiemployerPlansStatePlansAndPlansThatShareRisksBetweenEntitiesUnderCommonControlMemberifrs-full:PlanAssetsMemberifrs-full:Level1OfFairValueHierarchyMemberifrs-full:PensionDefinedBenefitPlansMember2023-12-310000312069bcs:PrivateEquityInvestmentsMemberifrs-full:CountryOfDomicileMemberifrs-full:Level2And3OfFairValueHierarchyMemberifrs-full:DefinedBenefitPlansOtherThanMultiemployerPlansStatePlansAndPlansThatShareRisksBetweenEntitiesUnderCommonControlMemberifrs-full:PlanAssetsMemberifrs-full:PensionDefinedBenefitPlansMember2023-12-310000312069bcs:PrivateEquityInvestmentsMemberifrs-full:CountryOfDomicileMemberifrs-full:DefinedBenefitPlansOtherThanMultiemployerPlansStatePlansAndPlansThatShareRisksBetweenEntitiesUnderCommonControlMemberifrs-full:PlanAssetsMemberifrs-full:PensionDefinedBenefitPlansMember2023-12-310000312069bcs:BondsFixedGovernmentMemberifrs-full:PlanAssetsMemberifrs-full:Level1OfFairValueHierarchyMember2023-12-310000312069ifrs-full:Level2And3OfFairValueHierarchyMemberbcs:BondsFixedGovernmentMemberifrs-full:PlanAssetsMember2023-12-310000312069bcs:BondsFixedGovernmentMemberifrs-full:PlanAssetsMember2023-12-310000312069ifrs-full:CountryOfDomicileMemberifrs-full:DefinedBenefitPlansOtherThanMultiemployerPlansStatePlansAndPlansThatShareRisksBetweenEntitiesUnderCommonControlMemberbcs:BondsFixedGovernmentMemberifrs-full:PlanAssetsMemberifrs-full:Level1OfFairValueHierarchyMemberifrs-full:PensionDefinedBenefitPlansMember2023-12-310000312069ifrs-full:CountryOfDomicileMemberifrs-full:Level2And3OfFairValueHierarchyMemberifrs-full:DefinedBenefitPlansOtherThanMultiemployerPlansStatePlansAndPlansThatShareRisksBetweenEntitiesUnderCommonControlMemberbcs:BondsFixedGovernmentMemberifrs-full:PlanAssetsMemberifrs-full:PensionDefinedBenefitPlansMember2023-12-310000312069ifrs-full:CountryOfDomicileMemberifrs-full:DefinedBenefitPlansOtherThanMultiemployerPlansStatePlansAndPlansThatShareRisksBetweenEntitiesUnderCommonControlMemberbcs:BondsFixedGovernmentMemberifrs-full:PlanAssetsMemberifrs-full:PensionDefinedBenefitPlansMember2023-12-310000312069bcs:BondsIndexLinkedGovernmentMemberifrs-full:PlanAssetsMemberifrs-full:Level1OfFairValueHierarchyMember2023-12-310000312069ifrs-full:Level2And3OfFairValueHierarchyMemberbcs:BondsIndexLinkedGovernmentMemberifrs-full:PlanAssetsMember2023-12-310000312069bcs:BondsIndexLinkedGovernmentMemberifrs-full:PlanAssetsMember2023-12-310000312069ifrs-full:CountryOfDomicileMemberifrs-full:DefinedBenefitPlansOtherThanMultiemployerPlansStatePlansAndPlansThatShareRisksBetweenEntitiesUnderCommonControlMemberbcs:BondsIndexLinkedGovernmentMemberifrs-full:PlanAssetsMemberifrs-full:Level1OfFairValueHierarchyMemberifrs-full:PensionDefinedBenefitPlansMember2023-12-310000312069ifrs-full:CountryOfDomicileMemberifrs-full:Level2And3OfFairValueHierarchyMemberifrs-full:DefinedBenefitPlansOtherThanMultiemployerPlansStatePlansAndPlansThatShareRisksBetweenEntitiesUnderCommonControlMemberbcs:BondsIndexLinkedGovernmentMemberifrs-full:PlanAssetsMemberifrs-full:PensionDefinedBenefitPlansMember2023-12-310000312069ifrs-full:CountryOfDomicileMemberifrs-full:DefinedBenefitPlansOtherThanMultiemployerPlansStatePlansAndPlansThatShareRisksBetweenEntitiesUnderCommonControlMemberbcs:BondsIndexLinkedGovernmentMemberifrs-full:PlanAssetsMemberifrs-full:PensionDefinedBenefitPlansMember2023-12-310000312069ifrs-full:PlanAssetsMemberifrs-full:Level1OfFairValueHierarchyMemberbcs:BondsCorporateAndOtherMember2023-12-310000312069ifrs-full:Level2And3OfFairValueHierarchyMemberifrs-full:PlanAssetsMemberbcs:BondsCorporateAndOtherMember2023-12-310000312069ifrs-full:PlanAssetsMemberbcs:BondsCorporateAndOtherMember2023-12-310000312069ifrs-full:CountryOfDomicileMemberifrs-full:DefinedBenefitPlansOtherThanMultiemployerPlansStatePlansAndPlansThatShareRisksBetweenEntitiesUnderCommonControlMemberifrs-full:PlanAssetsMemberifrs-full:Level1OfFairValueHierarchyMemberifrs-full:PensionDefinedBenefitPlansMemberbcs:BondsCorporateAndOtherMember2023-12-310000312069ifrs-full:CountryOfDomicileMemberifrs-full:Level2And3OfFairValueHierarchyMemberifrs-full:DefinedBenefitPlansOtherThanMultiemployerPlansStatePlansAndPlansThatShareRisksBetweenEntitiesUnderCommonControlMemberifrs-full:PlanAssetsMemberifrs-full:PensionDefinedBenefitPlansMemberbcs:BondsCorporateAndOtherMember2023-12-310000312069ifrs-full:CountryOfDomicileMemberifrs-full:DefinedBenefitPlansOtherThanMultiemployerPlansStatePlansAndPlansThatShareRisksBetweenEntitiesUnderCommonControlMemberifrs-full:PlanAssetsMemberifrs-full:PensionDefinedBenefitPlansMemberbcs:BondsCorporateAndOtherMember2023-12-310000312069ifrs-full:InvestmentPropertyMemberifrs-full:PlanAssetsMemberifrs-full:Level1OfFairValueHierarchyMember2023-12-310000312069ifrs-full:InvestmentPropertyMemberifrs-full:Level2And3OfFairValueHierarchyMemberifrs-full:PlanAssetsMember2023-12-310000312069ifrs-full:InvestmentPropertyMemberifrs-full:PlanAssetsMember2023-12-310000312069ifrs-full:InvestmentPropertyMemberifrs-full:CountryOfDomicileMemberifrs-full:DefinedBenefitPlansOtherThanMultiemployerPlansStatePlansAndPlansThatShareRisksBetweenEntitiesUnderCommonControlMemberifrs-full:PlanAssetsMemberifrs-full:Level1OfFairValueHierarchyMemberifrs-full:PensionDefinedBenefitPlansMember2023-12-310000312069ifrs-full:InvestmentPropertyMemberifrs-full:CountryOfDomicileMemberifrs-full:Level2And3OfFairValueHierarchyMemberifrs-full:DefinedBenefitPlansOtherThanMultiemployerPlansStatePlansAndPlansThatShareRisksBetweenEntitiesUnderCommonControlMemberifrs-full:PlanAssetsMemberifrs-full:PensionDefinedBenefitPlansMember2023-12-310000312069ifrs-full:InvestmentPropertyMemberifrs-full:CountryOfDomicileMemberifrs-full:DefinedBenefitPlansOtherThanMultiemployerPlansStatePlansAndPlansThatShareRisksBetweenEntitiesUnderCommonControlMemberifrs-full:PlanAssetsMemberifrs-full:PensionDefinedBenefitPlansMember2023-12-310000312069ifrs-full:PlanAssetsMemberifrs-full:Level1OfFairValueHierarchyMemberifrs-full:NetworkInfrastructureMember2023-12-310000312069ifrs-full:Level2And3OfFairValueHierarchyMemberifrs-full:PlanAssetsMemberifrs-full:NetworkInfrastructureMember2023-12-310000312069ifrs-full:PlanAssetsMemberifrs-full:NetworkInfrastructureMember2023-12-310000312069ifrs-full:CountryOfDomicileMemberifrs-full:DefinedBenefitPlansOtherThanMultiemployerPlansStatePlansAndPlansThatShareRisksBetweenEntitiesUnderCommonControlMemberifrs-full:PlanAssetsMemberifrs-full:Level1OfFairValueHierarchyMemberifrs-full:NetworkInfrastructureMemberifrs-full:PensionDefinedBenefitPlansMember2023-12-310000312069ifrs-full:CountryOfDomicileMemberifrs-full:Level2And3OfFairValueHierarchyMemberifrs-full:DefinedBenefitPlansOtherThanMultiemployerPlansStatePlansAndPlansThatShareRisksBetweenEntitiesUnderCommonControlMemberifrs-full:PlanAssetsMemberifrs-full:NetworkInfrastructureMemberifrs-full:PensionDefinedBenefitPlansMember2023-12-310000312069ifrs-full:CountryOfDomicileMemberifrs-full:DefinedBenefitPlansOtherThanMultiemployerPlansStatePlansAndPlansThatShareRisksBetweenEntitiesUnderCommonControlMemberifrs-full:PlanAssetsMemberifrs-full:NetworkInfrastructureMemberifrs-full:PensionDefinedBenefitPlansMember2023-12-310000312069ifrs-full:PlanAssetsMemberifrs-full:HedgeFundInvestmentsMemberifrs-full:Level1OfFairValueHierarchyMember2023-12-310000312069ifrs-full:Level2And3OfFairValueHierarchyMemberifrs-full:PlanAssetsMemberifrs-full:HedgeFundInvestmentsMember2023-12-310000312069ifrs-full:PlanAssetsMemberifrs-full:HedgeFundInvestmentsMember2023-12-310000312069ifrs-full:CountryOfDomicileMemberifrs-full:DefinedBenefitPlansOtherThanMultiemployerPlansStatePlansAndPlansThatShareRisksBetweenEntitiesUnderCommonControlMemberifrs-full:PlanAssetsMemberifrs-full:HedgeFundInvestmentsMemberifrs-full:Level1OfFairValueHierarchyMemberifrs-full:PensionDefinedBenefitPlansMember2023-12-310000312069ifrs-full:CountryOfDomicileMemberifrs-full:Level2And3OfFairValueHierarchyMemberifrs-full:DefinedBenefitPlansOtherThanMultiemployerPlansStatePlansAndPlansThatShareRisksBetweenEntitiesUnderCommonControlMemberifrs-full:PlanAssetsMemberifrs-full:HedgeFundInvestmentsMemberifrs-full:PensionDefinedBenefitPlansMember2023-12-310000312069ifrs-full:CountryOfDomicileMemberifrs-full:DefinedBenefitPlansOtherThanMultiemployerPlansStatePlansAndPlansThatShareRisksBetweenEntitiesUnderCommonControlMemberifrs-full:PlanAssetsMemberifrs-full:HedgeFundInvestmentsMemberifrs-full:PensionDefinedBenefitPlansMember2023-12-310000312069ifrs-full:DerivativesMemberifrs-full:PlanAssetsMemberifrs-full:Level1OfFairValueHierarchyMember2023-12-310000312069ifrs-full:DerivativesMemberifrs-full:Level2And3OfFairValueHierarchyMemberifrs-full:PlanAssetsMember2023-12-310000312069ifrs-full:DerivativesMemberifrs-full:PlanAssetsMember2023-12-310000312069ifrs-full:DerivativesMemberifrs-full:CountryOfDomicileMemberifrs-full:DefinedBenefitPlansOtherThanMultiemployerPlansStatePlansAndPlansThatShareRisksBetweenEntitiesUnderCommonControlMemberifrs-full:PlanAssetsMemberifrs-full:Level1OfFairValueHierarchyMemberifrs-full:PensionDefinedBenefitPlansMember2023-12-310000312069ifrs-full:DerivativesMemberifrs-full:CountryOfDomicileMemberifrs-full:Level2And3OfFairValueHierarchyMemberifrs-full:DefinedBenefitPlansOtherThanMultiemployerPlansStatePlansAndPlansThatShareRisksBetweenEntitiesUnderCommonControlMemberifrs-full:PlanAssetsMemberifrs-full:PensionDefinedBenefitPlansMember2023-12-310000312069ifrs-full:DerivativesMemberifrs-full:CountryOfDomicileMemberifrs-full:DefinedBenefitPlansOtherThanMultiemployerPlansStatePlansAndPlansThatShareRisksBetweenEntitiesUnderCommonControlMemberifrs-full:PlanAssetsMemberifrs-full:PensionDefinedBenefitPlansMember2023-12-310000312069ifrs-full:ReinsuranceContractsHeldMemberifrs-full:PlanAssetsMemberifrs-full:Level1OfFairValueHierarchyMember2023-12-310000312069ifrs-full:Level2And3OfFairValueHierarchyMemberifrs-full:ReinsuranceContractsHeldMemberifrs-full:PlanAssetsMember2023-12-310000312069ifrs-full:ReinsuranceContractsHeldMemberifrs-full:PlanAssetsMember2023-12-310000312069ifrs-full:CountryOfDomicileMemberifrs-full:ReinsuranceContractsHeldMemberifrs-full:DefinedBenefitPlansOtherThanMultiemployerPlansStatePlansAndPlansThatShareRisksBetweenEntitiesUnderCommonControlMemberifrs-full:PlanAssetsMemberifrs-full:Level1OfFairValueHierarchyMemberifrs-full:PensionDefinedBenefitPlansMember2023-12-310000312069ifrs-full:CountryOfDomicileMemberifrs-full:Level2And3OfFairValueHierarchyMemberifrs-full:ReinsuranceContractsHeldMemberifrs-full:DefinedBenefitPlansOtherThanMultiemployerPlansStatePlansAndPlansThatShareRisksBetweenEntitiesUnderCommonControlMemberifrs-full:PlanAssetsMemberifrs-full:PensionDefinedBenefitPlansMember2023-12-310000312069ifrs-full:CountryOfDomicileMemberifrs-full:ReinsuranceContractsHeldMemberifrs-full:DefinedBenefitPlansOtherThanMultiemployerPlansStatePlansAndPlansThatShareRisksBetweenEntitiesUnderCommonControlMemberifrs-full:PlanAssetsMemberifrs-full:PensionDefinedBenefitPlansMember2023-12-310000312069bcs:CashAndCashEquivalentsMemberifrs-full:PlanAssetsMemberifrs-full:Level1OfFairValueHierarchyMember2023-12-310000312069bcs:CashAndCashEquivalentsMemberifrs-full:Level2And3OfFairValueHierarchyMemberifrs-full:PlanAssetsMember2023-12-310000312069bcs:CashAndCashEquivalentsMemberifrs-full:PlanAssetsMember2023-12-310000312069bcs:CashAndCashEquivalentsMemberifrs-full:CountryOfDomicileMemberifrs-full:DefinedBenefitPlansOtherThanMultiemployerPlansStatePlansAndPlansThatShareRisksBetweenEntitiesUnderCommonControlMemberifrs-full:PlanAssetsMemberifrs-full:Level1OfFairValueHierarchyMemberifrs-full:PensionDefinedBenefitPlansMember2023-12-310000312069bcs:CashAndCashEquivalentsMemberifrs-full:CountryOfDomicileMemberifrs-full:Level2And3OfFairValueHierarchyMemberifrs-full:DefinedBenefitPlansOtherThanMultiemployerPlansStatePlansAndPlansThatShareRisksBetweenEntitiesUnderCommonControlMemberifrs-full:PlanAssetsMemberifrs-full:PensionDefinedBenefitPlansMember2023-12-310000312069bcs:CashAndCashEquivalentsMemberifrs-full:CountryOfDomicileMemberifrs-full:DefinedBenefitPlansOtherThanMultiemployerPlansStatePlansAndPlansThatShareRisksBetweenEntitiesUnderCommonControlMemberifrs-full:PlanAssetsMemberifrs-full:PensionDefinedBenefitPlansMember2023-12-310000312069ifrs-full:InvestmentFundsMemberifrs-full:PlanAssetsMemberifrs-full:Level1OfFairValueHierarchyMember2023-12-310000312069ifrs-full:InvestmentFundsMemberifrs-full:Level2And3OfFairValueHierarchyMemberifrs-full:PlanAssetsMember2023-12-310000312069ifrs-full:InvestmentFundsMemberifrs-full:PlanAssetsMember2023-12-310000312069ifrs-full:InvestmentFundsMemberifrs-full:CountryOfDomicileMemberifrs-full:DefinedBenefitPlansOtherThanMultiemployerPlansStatePlansAndPlansThatShareRisksBetweenEntitiesUnderCommonControlMemberifrs-full:PlanAssetsMemberifrs-full:Level1OfFairValueHierarchyMemberifrs-full:PensionDefinedBenefitPlansMember2023-12-310000312069ifrs-full:InvestmentFundsMemberifrs-full:CountryOfDomicileMemberifrs-full:Level2And3OfFairValueHierarchyMemberifrs-full:DefinedBenefitPlansOtherThanMultiemployerPlansStatePlansAndPlansThatShareRisksBetweenEntitiesUnderCommonControlMemberifrs-full:PlanAssetsMemberifrs-full:PensionDefinedBenefitPlansMember2023-12-310000312069ifrs-full:InvestmentFundsMemberifrs-full:CountryOfDomicileMemberifrs-full:DefinedBenefitPlansOtherThanMultiemployerPlansStatePlansAndPlansThatShareRisksBetweenEntitiesUnderCommonControlMemberifrs-full:PlanAssetsMemberifrs-full:PensionDefinedBenefitPlansMember2023-12-310000312069ifrs-full:PlanAssetsMemberifrs-full:Level1OfFairValueHierarchyMemberbcs:OtherNonQuotedAssetsMember2023-12-310000312069ifrs-full:Level2And3OfFairValueHierarchyMemberifrs-full:PlanAssetsMemberbcs:OtherNonQuotedAssetsMember2023-12-310000312069ifrs-full:PlanAssetsMemberbcs:OtherNonQuotedAssetsMember2023-12-310000312069ifrs-full:CountryOfDomicileMemberifrs-full:DefinedBenefitPlansOtherThanMultiemployerPlansStatePlansAndPlansThatShareRisksBetweenEntitiesUnderCommonControlMemberifrs-full:PlanAssetsMemberifrs-full:Level1OfFairValueHierarchyMemberbcs:OtherNonQuotedAssetsMemberifrs-full:PensionDefinedBenefitPlansMember2023-12-310000312069ifrs-full:CountryOfDomicileMemberifrs-full:Level2And3OfFairValueHierarchyMemberifrs-full:DefinedBenefitPlansOtherThanMultiemployerPlansStatePlansAndPlansThatShareRisksBetweenEntitiesUnderCommonControlMemberifrs-full:PlanAssetsMemberbcs:OtherNonQuotedAssetsMemberifrs-full:PensionDefinedBenefitPlansMember2023-12-310000312069ifrs-full:CountryOfDomicileMemberifrs-full:DefinedBenefitPlansOtherThanMultiemployerPlansStatePlansAndPlansThatShareRisksBetweenEntitiesUnderCommonControlMemberifrs-full:PlanAssetsMemberbcs:OtherNonQuotedAssetsMemberifrs-full:PensionDefinedBenefitPlansMember2023-12-310000312069ifrs-full:PlanAssetsMemberifrs-full:Level1OfFairValueHierarchyMember2023-12-310000312069ifrs-full:Level2And3OfFairValueHierarchyMemberifrs-full:PlanAssetsMember2023-12-310000312069ifrs-full:CountryOfDomicileMemberifrs-full:DefinedBenefitPlansOtherThanMultiemployerPlansStatePlansAndPlansThatShareRisksBetweenEntitiesUnderCommonControlMemberifrs-full:PlanAssetsMemberifrs-full:Level1OfFairValueHierarchyMemberifrs-full:PensionDefinedBenefitPlansMember2023-12-310000312069ifrs-full:CountryOfDomicileMemberifrs-full:Level2And3OfFairValueHierarchyMemberifrs-full:DefinedBenefitPlansOtherThanMultiemployerPlansStatePlansAndPlansThatShareRisksBetweenEntitiesUnderCommonControlMemberifrs-full:PlanAssetsMemberifrs-full:PensionDefinedBenefitPlansMember2023-12-310000312069ifrs-full:PlanAssetsMemberifrs-full:EquityInvestmentsMemberifrs-full:Level1OfFairValueHierarchyMember2022-12-310000312069ifrs-full:Level2And3OfFairValueHierarchyMemberifrs-full:PlanAssetsMemberifrs-full:EquityInvestmentsMember2022-12-310000312069ifrs-full:PlanAssetsMemberifrs-full:EquityInvestmentsMember2022-12-310000312069ifrs-full:CountryOfDomicileMemberifrs-full:DefinedBenefitPlansOtherThanMultiemployerPlansStatePlansAndPlansThatShareRisksBetweenEntitiesUnderCommonControlMemberifrs-full:PlanAssetsMemberifrs-full:EquityInvestmentsMemberifrs-full:Level1OfFairValueHierarchyMemberifrs-full:PensionDefinedBenefitPlansMember2022-12-310000312069ifrs-full:CountryOfDomicileMemberifrs-full:Level2And3OfFairValueHierarchyMemberifrs-full:DefinedBenefitPlansOtherThanMultiemployerPlansStatePlansAndPlansThatShareRisksBetweenEntitiesUnderCommonControlMemberifrs-full:PlanAssetsMemberifrs-full:EquityInvestmentsMemberifrs-full:PensionDefinedBenefitPlansMember2022-12-310000312069ifrs-full:CountryOfDomicileMemberifrs-full:DefinedBenefitPlansOtherThanMultiemployerPlansStatePlansAndPlansThatShareRisksBetweenEntitiesUnderCommonControlMemberifrs-full:PlanAssetsMemberifrs-full:EquityInvestmentsMemberifrs-full:PensionDefinedBenefitPlansMember2022-12-310000312069bcs:PrivateEquityInvestmentsMemberifrs-full:PlanAssetsMemberifrs-full:Level1OfFairValueHierarchyMember2022-12-310000312069bcs:PrivateEquityInvestmentsMemberifrs-full:Level2And3OfFairValueHierarchyMemberifrs-full:PlanAssetsMember2022-12-310000312069bcs:PrivateEquityInvestmentsMemberifrs-full:PlanAssetsMember2022-12-310000312069bcs:PrivateEquityInvestmentsMemberifrs-full:CountryOfDomicileMemberifrs-full:DefinedBenefitPlansOtherThanMultiemployerPlansStatePlansAndPlansThatShareRisksBetweenEntitiesUnderCommonControlMemberifrs-full:PlanAssetsMemberifrs-full:Level1OfFairValueHierarchyMemberifrs-full:PensionDefinedBenefitPlansMember2022-12-310000312069bcs:PrivateEquityInvestmentsMemberifrs-full:CountryOfDomicileMemberifrs-full:Level2And3OfFairValueHierarchyMemberifrs-full:DefinedBenefitPlansOtherThanMultiemployerPlansStatePlansAndPlansThatShareRisksBetweenEntitiesUnderCommonControlMemberifrs-full:PlanAssetsMemberifrs-full:PensionDefinedBenefitPlansMember2022-12-310000312069bcs:PrivateEquityInvestmentsMemberifrs-full:CountryOfDomicileMemberifrs-full:DefinedBenefitPlansOtherThanMultiemployerPlansStatePlansAndPlansThatShareRisksBetweenEntitiesUnderCommonControlMemberifrs-full:PlanAssetsMemberifrs-full:PensionDefinedBenefitPlansMember2022-12-310000312069bcs:BondsFixedGovernmentMemberifrs-full:PlanAssetsMemberifrs-full:Level1OfFairValueHierarchyMember2022-12-310000312069ifrs-full:Level2And3OfFairValueHierarchyMemberbcs:BondsFixedGovernmentMemberifrs-full:PlanAssetsMember2022-12-310000312069bcs:BondsFixedGovernmentMemberifrs-full:PlanAssetsMember2022-12-310000312069ifrs-full:CountryOfDomicileMemberifrs-full:DefinedBenefitPlansOtherThanMultiemployerPlansStatePlansAndPlansThatShareRisksBetweenEntitiesUnderCommonControlMemberbcs:BondsFixedGovernmentMemberifrs-full:PlanAssetsMemberifrs-full:Level1OfFairValueHierarchyMemberifrs-full:PensionDefinedBenefitPlansMember2022-12-310000312069ifrs-full:CountryOfDomicileMemberifrs-full:Level2And3OfFairValueHierarchyMemberifrs-full:DefinedBenefitPlansOtherThanMultiemployerPlansStatePlansAndPlansThatShareRisksBetweenEntitiesUnderCommonControlMemberbcs:BondsFixedGovernmentMemberifrs-full:PlanAssetsMemberifrs-full:PensionDefinedBenefitPlansMember2022-12-310000312069ifrs-full:CountryOfDomicileMemberifrs-full:DefinedBenefitPlansOtherThanMultiemployerPlansStatePlansAndPlansThatShareRisksBetweenEntitiesUnderCommonControlMemberbcs:BondsFixedGovernmentMemberifrs-full:PlanAssetsMemberifrs-full:PensionDefinedBenefitPlansMember2022-12-310000312069bcs:BondsIndexLinkedGovernmentMemberifrs-full:PlanAssetsMemberifrs-full:Level1OfFairValueHierarchyMember2022-12-310000312069ifrs-full:Level2And3OfFairValueHierarchyMemberbcs:BondsIndexLinkedGovernmentMemberifrs-full:PlanAssetsMember2022-12-310000312069bcs:BondsIndexLinkedGovernmentMemberifrs-full:PlanAssetsMember2022-12-310000312069ifrs-full:CountryOfDomicileMemberifrs-full:DefinedBenefitPlansOtherThanMultiemployerPlansStatePlansAndPlansThatShareRisksBetweenEntitiesUnderCommonControlMemberbcs:BondsIndexLinkedGovernmentMemberifrs-full:PlanAssetsMemberifrs-full:Level1OfFairValueHierarchyMemberifrs-full:PensionDefinedBenefitPlansMember2022-12-310000312069ifrs-full:CountryOfDomicileMemberifrs-full:Level2And3OfFairValueHierarchyMemberifrs-full:DefinedBenefitPlansOtherThanMultiemployerPlansStatePlansAndPlansThatShareRisksBetweenEntitiesUnderCommonControlMemberbcs:BondsIndexLinkedGovernmentMemberifrs-full:PlanAssetsMemberifrs-full:PensionDefinedBenefitPlansMember2022-12-310000312069ifrs-full:CountryOfDomicileMemberifrs-full:DefinedBenefitPlansOtherThanMultiemployerPlansStatePlansAndPlansThatShareRisksBetweenEntitiesUnderCommonControlMemberbcs:BondsIndexLinkedGovernmentMemberifrs-full:PlanAssetsMemberifrs-full:PensionDefinedBenefitPlansMember2022-12-310000312069ifrs-full:PlanAssetsMemberifrs-full:Level1OfFairValueHierarchyMemberbcs:BondsCorporateAndOtherMember2022-12-310000312069ifrs-full:Level2And3OfFairValueHierarchyMemberifrs-full:PlanAssetsMemberbcs:BondsCorporateAndOtherMember2022-12-310000312069ifrs-full:PlanAssetsMemberbcs:BondsCorporateAndOtherMember2022-12-310000312069ifrs-full:CountryOfDomicileMemberifrs-full:DefinedBenefitPlansOtherThanMultiemployerPlansStatePlansAndPlansThatShareRisksBetweenEntitiesUnderCommonControlMemberifrs-full:PlanAssetsMemberifrs-full:Level1OfFairValueHierarchyMemberifrs-full:PensionDefinedBenefitPlansMemberbcs:BondsCorporateAndOtherMember2022-12-310000312069ifrs-full:CountryOfDomicileMemberifrs-full:Level2And3OfFairValueHierarchyMemberifrs-full:DefinedBenefitPlansOtherThanMultiemployerPlansStatePlansAndPlansThatShareRisksBetweenEntitiesUnderCommonControlMemberifrs-full:PlanAssetsMemberifrs-full:PensionDefinedBenefitPlansMemberbcs:BondsCorporateAndOtherMember2022-12-310000312069ifrs-full:CountryOfDomicileMemberifrs-full:DefinedBenefitPlansOtherThanMultiemployerPlansStatePlansAndPlansThatShareRisksBetweenEntitiesUnderCommonControlMemberifrs-full:PlanAssetsMemberifrs-full:PensionDefinedBenefitPlansMemberbcs:BondsCorporateAndOtherMember2022-12-310000312069ifrs-full:InvestmentPropertyMemberifrs-full:PlanAssetsMemberifrs-full:Level1OfFairValueHierarchyMember2022-12-310000312069ifrs-full:InvestmentPropertyMemberifrs-full:Level2And3OfFairValueHierarchyMemberifrs-full:PlanAssetsMember2022-12-310000312069ifrs-full:InvestmentPropertyMemberifrs-full:PlanAssetsMember2022-12-310000312069ifrs-full:InvestmentPropertyMemberifrs-full:CountryOfDomicileMemberifrs-full:DefinedBenefitPlansOtherThanMultiemployerPlansStatePlansAndPlansThatShareRisksBetweenEntitiesUnderCommonControlMemberifrs-full:PlanAssetsMemberifrs-full:Level1OfFairValueHierarchyMemberifrs-full:PensionDefinedBenefitPlansMember2022-12-310000312069ifrs-full:InvestmentPropertyMemberifrs-full:CountryOfDomicileMemberifrs-full:Level2And3OfFairValueHierarchyMemberifrs-full:DefinedBenefitPlansOtherThanMultiemployerPlansStatePlansAndPlansThatShareRisksBetweenEntitiesUnderCommonControlMemberifrs-full:PlanAssetsMemberifrs-full:PensionDefinedBenefitPlansMember2022-12-310000312069ifrs-full:InvestmentPropertyMemberifrs-full:CountryOfDomicileMemberifrs-full:DefinedBenefitPlansOtherThanMultiemployerPlansStatePlansAndPlansThatShareRisksBetweenEntitiesUnderCommonControlMemberifrs-full:PlanAssetsMemberifrs-full:PensionDefinedBenefitPlansMember2022-12-310000312069ifrs-full:PlanAssetsMemberifrs-full:Level1OfFairValueHierarchyMemberifrs-full:NetworkInfrastructureMember2022-12-310000312069ifrs-full:Level2And3OfFairValueHierarchyMemberifrs-full:PlanAssetsMemberifrs-full:NetworkInfrastructureMember2022-12-310000312069ifrs-full:PlanAssetsMemberifrs-full:NetworkInfrastructureMember2022-12-310000312069ifrs-full:CountryOfDomicileMemberifrs-full:DefinedBenefitPlansOtherThanMultiemployerPlansStatePlansAndPlansThatShareRisksBetweenEntitiesUnderCommonControlMemberifrs-full:PlanAssetsMemberifrs-full:Level1OfFairValueHierarchyMemberifrs-full:NetworkInfrastructureMemberifrs-full:PensionDefinedBenefitPlansMember2022-12-310000312069ifrs-full:CountryOfDomicileMemberifrs-full:Level2And3OfFairValueHierarchyMemberifrs-full:DefinedBenefitPlansOtherThanMultiemployerPlansStatePlansAndPlansThatShareRisksBetweenEntitiesUnderCommonControlMemberifrs-full:PlanAssetsMemberifrs-full:NetworkInfrastructureMemberifrs-full:PensionDefinedBenefitPlansMember2022-12-310000312069ifrs-full:CountryOfDomicileMemberifrs-full:DefinedBenefitPlansOtherThanMultiemployerPlansStatePlansAndPlansThatShareRisksBetweenEntitiesUnderCommonControlMemberifrs-full:PlanAssetsMemberifrs-full:NetworkInfrastructureMemberifrs-full:PensionDefinedBenefitPlansMember2022-12-310000312069ifrs-full:PlanAssetsMemberifrs-full:HedgeFundInvestmentsMemberifrs-full:Level1OfFairValueHierarchyMember2022-12-310000312069ifrs-full:Level2And3OfFairValueHierarchyMemberifrs-full:PlanAssetsMemberifrs-full:HedgeFundInvestmentsMember2022-12-310000312069ifrs-full:PlanAssetsMemberifrs-full:HedgeFundInvestmentsMember2022-12-310000312069ifrs-full:CountryOfDomicileMemberifrs-full:DefinedBenefitPlansOtherThanMultiemployerPlansStatePlansAndPlansThatShareRisksBetweenEntitiesUnderCommonControlMemberifrs-full:PlanAssetsMemberifrs-full:HedgeFundInvestmentsMemberifrs-full:Level1OfFairValueHierarchyMemberifrs-full:PensionDefinedBenefitPlansMember2022-12-310000312069ifrs-full:CountryOfDomicileMemberifrs-full:Level2And3OfFairValueHierarchyMemberifrs-full:DefinedBenefitPlansOtherThanMultiemployerPlansStatePlansAndPlansThatShareRisksBetweenEntitiesUnderCommonControlMemberifrs-full:PlanAssetsMemberifrs-full:HedgeFundInvestmentsMemberifrs-full:PensionDefinedBenefitPlansMember2022-12-310000312069ifrs-full:CountryOfDomicileMemberifrs-full:DefinedBenefitPlansOtherThanMultiemployerPlansStatePlansAndPlansThatShareRisksBetweenEntitiesUnderCommonControlMemberifrs-full:PlanAssetsMemberifrs-full:HedgeFundInvestmentsMemberifrs-full:PensionDefinedBenefitPlansMember2022-12-310000312069ifrs-full:DerivativesMemberifrs-full:PlanAssetsMemberifrs-full:Level1OfFairValueHierarchyMember2022-12-310000312069ifrs-full:DerivativesMemberifrs-full:Level2And3OfFairValueHierarchyMemberifrs-full:PlanAssetsMember2022-12-310000312069ifrs-full:DerivativesMemberifrs-full:PlanAssetsMember2022-12-310000312069ifrs-full:DerivativesMemberifrs-full:CountryOfDomicileMemberifrs-full:DefinedBenefitPlansOtherThanMultiemployerPlansStatePlansAndPlansThatShareRisksBetweenEntitiesUnderCommonControlMemberifrs-full:PlanAssetsMemberifrs-full:Level1OfFairValueHierarchyMemberifrs-full:PensionDefinedBenefitPlansMember2022-12-310000312069ifrs-full:DerivativesMemberifrs-full:CountryOfDomicileMemberifrs-full:Level2And3OfFairValueHierarchyMemberifrs-full:DefinedBenefitPlansOtherThanMultiemployerPlansStatePlansAndPlansThatShareRisksBetweenEntitiesUnderCommonControlMemberifrs-full:PlanAssetsMemberifrs-full:PensionDefinedBenefitPlansMember2022-12-310000312069ifrs-full:DerivativesMemberifrs-full:CountryOfDomicileMemberifrs-full:DefinedBenefitPlansOtherThanMultiemployerPlansStatePlansAndPlansThatShareRisksBetweenEntitiesUnderCommonControlMemberifrs-full:PlanAssetsMemberifrs-full:PensionDefinedBenefitPlansMember2022-12-310000312069ifrs-full:ReinsuranceContractsHeldMemberifrs-full:PlanAssetsMemberifrs-full:Level1OfFairValueHierarchyMember2022-12-310000312069ifrs-full:Level2And3OfFairValueHierarchyMemberifrs-full:ReinsuranceContractsHeldMemberifrs-full:PlanAssetsMember2022-12-310000312069ifrs-full:ReinsuranceContractsHeldMemberifrs-full:PlanAssetsMember2022-12-310000312069ifrs-full:CountryOfDomicileMemberifrs-full:ReinsuranceContractsHeldMemberifrs-full:DefinedBenefitPlansOtherThanMultiemployerPlansStatePlansAndPlansThatShareRisksBetweenEntitiesUnderCommonControlMemberifrs-full:PlanAssetsMemberifrs-full:Level1OfFairValueHierarchyMemberifrs-full:PensionDefinedBenefitPlansMember2022-12-310000312069ifrs-full:CountryOfDomicileMemberifrs-full:Level2And3OfFairValueHierarchyMemberifrs-full:ReinsuranceContractsHeldMemberifrs-full:DefinedBenefitPlansOtherThanMultiemployerPlansStatePlansAndPlansThatShareRisksBetweenEntitiesUnderCommonControlMemberifrs-full:PlanAssetsMemberifrs-full:PensionDefinedBenefitPlansMember2022-12-310000312069ifrs-full:CountryOfDomicileMemberifrs-full:ReinsuranceContractsHeldMemberifrs-full:DefinedBenefitPlansOtherThanMultiemployerPlansStatePlansAndPlansThatShareRisksBetweenEntitiesUnderCommonControlMemberifrs-full:PlanAssetsMemberifrs-full:PensionDefinedBenefitPlansMember2022-12-310000312069bcs:CashAndCashEquivalentsMemberifrs-full:PlanAssetsMemberifrs-full:Level1OfFairValueHierarchyMember2022-12-310000312069bcs:CashAndCashEquivalentsMemberifrs-full:Level2And3OfFairValueHierarchyMemberifrs-full:PlanAssetsMember2022-12-310000312069bcs:CashAndCashEquivalentsMemberifrs-full:PlanAssetsMember2022-12-310000312069bcs:CashAndCashEquivalentsMemberifrs-full:CountryOfDomicileMemberifrs-full:DefinedBenefitPlansOtherThanMultiemployerPlansStatePlansAndPlansThatShareRisksBetweenEntitiesUnderCommonControlMemberifrs-full:PlanAssetsMemberifrs-full:Level1OfFairValueHierarchyMemberifrs-full:PensionDefinedBenefitPlansMember2022-12-310000312069bcs:CashAndCashEquivalentsMemberifrs-full:CountryOfDomicileMemberifrs-full:Level2And3OfFairValueHierarchyMemberifrs-full:DefinedBenefitPlansOtherThanMultiemployerPlansStatePlansAndPlansThatShareRisksBetweenEntitiesUnderCommonControlMemberifrs-full:PlanAssetsMemberifrs-full:PensionDefinedBenefitPlansMember2022-12-310000312069bcs:CashAndCashEquivalentsMemberifrs-full:CountryOfDomicileMemberifrs-full:DefinedBenefitPlansOtherThanMultiemployerPlansStatePlansAndPlansThatShareRisksBetweenEntitiesUnderCommonControlMemberifrs-full:PlanAssetsMemberifrs-full:PensionDefinedBenefitPlansMember2022-12-310000312069ifrs-full:InvestmentFundsMemberifrs-full:PlanAssetsMemberifrs-full:Level1OfFairValueHierarchyMember2022-12-310000312069ifrs-full:InvestmentFundsMemberifrs-full:Level2And3OfFairValueHierarchyMemberifrs-full:PlanAssetsMember2022-12-310000312069ifrs-full:InvestmentFundsMemberifrs-full:PlanAssetsMember2022-12-310000312069ifrs-full:InvestmentFundsMemberifrs-full:CountryOfDomicileMemberifrs-full:DefinedBenefitPlansOtherThanMultiemployerPlansStatePlansAndPlansThatShareRisksBetweenEntitiesUnderCommonControlMemberifrs-full:PlanAssetsMemberifrs-full:Level1OfFairValueHierarchyMemberifrs-full:PensionDefinedBenefitPlansMember2022-12-310000312069ifrs-full:InvestmentFundsMemberifrs-full:CountryOfDomicileMemberifrs-full:Level2And3OfFairValueHierarchyMemberifrs-full:DefinedBenefitPlansOtherThanMultiemployerPlansStatePlansAndPlansThatShareRisksBetweenEntitiesUnderCommonControlMemberifrs-full:PlanAssetsMemberifrs-full:PensionDefinedBenefitPlansMember2022-12-310000312069ifrs-full:InvestmentFundsMemberifrs-full:CountryOfDomicileMemberifrs-full:DefinedBenefitPlansOtherThanMultiemployerPlansStatePlansAndPlansThatShareRisksBetweenEntitiesUnderCommonControlMemberifrs-full:PlanAssetsMemberifrs-full:PensionDefinedBenefitPlansMember2022-12-310000312069ifrs-full:PlanAssetsMemberifrs-full:Level1OfFairValueHierarchyMemberbcs:OtherNonQuotedAssetsMember2022-12-310000312069ifrs-full:Level2And3OfFairValueHierarchyMemberifrs-full:PlanAssetsMemberbcs:OtherNonQuotedAssetsMember2022-12-310000312069ifrs-full:PlanAssetsMemberbcs:OtherNonQuotedAssetsMember2022-12-310000312069ifrs-full:CountryOfDomicileMemberifrs-full:DefinedBenefitPlansOtherThanMultiemployerPlansStatePlansAndPlansThatShareRisksBetweenEntitiesUnderCommonControlMemberifrs-full:PlanAssetsMemberifrs-full:Level1OfFairValueHierarchyMemberbcs:OtherNonQuotedAssetsMemberifrs-full:PensionDefinedBenefitPlansMember2022-12-310000312069ifrs-full:CountryOfDomicileMemberifrs-full:Level2And3OfFairValueHierarchyMemberifrs-full:DefinedBenefitPlansOtherThanMultiemployerPlansStatePlansAndPlansThatShareRisksBetweenEntitiesUnderCommonControlMemberifrs-full:PlanAssetsMemberbcs:OtherNonQuotedAssetsMemberifrs-full:PensionDefinedBenefitPlansMember2022-12-310000312069ifrs-full:CountryOfDomicileMemberifrs-full:DefinedBenefitPlansOtherThanMultiemployerPlansStatePlansAndPlansThatShareRisksBetweenEntitiesUnderCommonControlMemberifrs-full:PlanAssetsMemberbcs:OtherNonQuotedAssetsMemberifrs-full:PensionDefinedBenefitPlansMember2022-12-310000312069ifrs-full:PlanAssetsMemberifrs-full:Level1OfFairValueHierarchyMember2022-12-310000312069ifrs-full:Level2And3OfFairValueHierarchyMemberifrs-full:PlanAssetsMember2022-12-310000312069ifrs-full:CountryOfDomicileMemberifrs-full:DefinedBenefitPlansOtherThanMultiemployerPlansStatePlansAndPlansThatShareRisksBetweenEntitiesUnderCommonControlMemberifrs-full:PlanAssetsMemberifrs-full:Level1OfFairValueHierarchyMemberifrs-full:PensionDefinedBenefitPlansMember2022-12-310000312069ifrs-full:CountryOfDomicileMemberifrs-full:Level2And3OfFairValueHierarchyMemberifrs-full:DefinedBenefitPlansOtherThanMultiemployerPlansStatePlansAndPlansThatShareRisksBetweenEntitiesUnderCommonControlMemberifrs-full:PlanAssetsMemberifrs-full:PensionDefinedBenefitPlansMember2022-12-310000312069ifrs-full:CountryOfDomicileMemberbcs:CashMemberifrs-full:DefinedBenefitPlansOtherThanMultiemployerPlansStatePlansAndPlansThatShareRisksBetweenEntitiesUnderCommonControlMemberifrs-full:PlanAssetsMemberifrs-full:PensionDefinedBenefitPlansMember2023-12-310000312069ifrs-full:CountryOfDomicileMemberbcs:CashMemberifrs-full:DefinedBenefitPlansOtherThanMultiemployerPlansStatePlansAndPlansThatShareRisksBetweenEntitiesUnderCommonControlMemberifrs-full:PlanAssetsMemberifrs-full:PensionDefinedBenefitPlansMember2022-12-310000312069ifrs-full:CountryOfDomicileMemberifrs-full:DefinedBenefitPlansOtherThanMultiemployerPlansStatePlansAndPlansThatShareRisksBetweenEntitiesUnderCommonControlMemberifrs-full:PlanAssetsMemberbcs:ReceivablesPayablesMemberifrs-full:PensionDefinedBenefitPlansMember2023-12-310000312069ifrs-full:CountryOfDomicileMemberifrs-full:DefinedBenefitPlansOtherThanMultiemployerPlansStatePlansAndPlansThatShareRisksBetweenEntitiesUnderCommonControlMemberifrs-full:PlanAssetsMemberbcs:ReceivablesPayablesMemberifrs-full:PensionDefinedBenefitPlansMember2022-12-310000312069ifrs-full:CountryOfDomicileMemberifrs-full:DefinedBenefitPlansOtherThanMultiemployerPlansStatePlansAndPlansThatShareRisksBetweenEntitiesUnderCommonControlMemberifrs-full:PlanAssetsMemberbcs:PooledCashFundsMemberifrs-full:PensionDefinedBenefitPlansMember2023-12-310000312069ifrs-full:CountryOfDomicileMemberifrs-full:DefinedBenefitPlansOtherThanMultiemployerPlansStatePlansAndPlansThatShareRisksBetweenEntitiesUnderCommonControlMemberifrs-full:PlanAssetsMemberbcs:PooledCashFundsMemberifrs-full:PensionDefinedBenefitPlansMember2022-12-310000312069ifrs-full:CountryOfDomicileMemberifrs-full:DefinedBenefitPlansOtherThanMultiemployerPlansStatePlansAndPlansThatShareRisksBetweenEntitiesUnderCommonControlMemberifrs-full:PlanAssetsMemberifrs-full:PensionDefinedBenefitPlansMemberbcs:RepurchaseAgreementsMember2023-12-310000312069ifrs-full:CountryOfDomicileMemberifrs-full:DefinedBenefitPlansOtherThanMultiemployerPlansStatePlansAndPlansThatShareRisksBetweenEntitiesUnderCommonControlMemberifrs-full:PlanAssetsMemberifrs-full:PensionDefinedBenefitPlansMemberbcs:RepurchaseAgreementsMember2022-12-310000312069ifrs-full:PlanAssetsMembersrt:ParentCompanyMember2023-12-310000312069ifrs-full:PlanAssetsMembersrt:ParentCompanyMember2022-12-310000312069ifrs-full:CountryOfDomicileMemberifrs-full:DefinedBenefitPlansOtherThanMultiemployerPlansStatePlansAndPlansThatShareRisksBetweenEntitiesUnderCommonControlMemberifrs-full:PlanAssetsMember2023-12-31bcs:contract0000312069ifrs-full:CountryOfDomicileMemberifrs-full:DefinedBenefitPlansOtherThanMultiemployerPlansStatePlansAndPlansThatShareRisksBetweenEntitiesUnderCommonControlMemberbcs:LongevityReinuranceContratNettingMemberifrs-full:PensionDefinedBenefitPlansMember2023-12-310000312069ifrs-full:CountryOfDomicileMemberifrs-full:DefinedBenefitPlansOtherThanMultiemployerPlansStatePlansAndPlansThatShareRisksBetweenEntitiesUnderCommonControlMemberbcs:LongevityReinuranceContratNettingMemberifrs-full:PensionDefinedBenefitPlansMember2022-12-310000312069bcs:DeficitContributionsValuationRecoveryPlanCurrentYearMemberifrs-full:CountryOfDomicileMemberifrs-full:DefinedBenefitPlansOtherThanMultiemployerPlansStatePlansAndPlansThatShareRisksBetweenEntitiesUnderCommonControlMemberifrs-full:PensionDefinedBenefitPlansMember2023-09-300000312069ifrs-full:CountryOfDomicileMemberbcs:DeficitContributionsValuationRecoveryPlanPriorYearMemberifrs-full:DefinedBenefitPlansOtherThanMultiemployerPlansStatePlansAndPlansThatShareRisksBetweenEntitiesUnderCommonControlMemberifrs-full:PensionDefinedBenefitPlansMember2022-09-300000312069ifrs-full:CountryOfDomicileMemberbcs:BarclaysBankPlcMemberifrs-full:DefinedBenefitPlansOtherThanMultiemployerPlansStatePlansAndPlansThatShareRisksBetweenEntitiesUnderCommonControlMemberifrs-full:BottomOfRangeMemberifrs-full:PensionDefinedBenefitPlansMember2023-12-310000312069ifrs-full:CountryOfDomicileMemberbcs:BarclaysBankPlcMemberifrs-full:DefinedBenefitPlansOtherThanMultiemployerPlansStatePlansAndPlansThatShareRisksBetweenEntitiesUnderCommonControlMemberifrs-full:PensionDefinedBenefitPlansMember2023-12-310000312069ifrs-full:CountryOfDomicileMemberifrs-full:DefinedBenefitPlansOtherThanMultiemployerPlansStatePlansAndPlansThatShareRisksBetweenEntitiesUnderCommonControlMemberifrs-full:PensionDefinedBenefitPlansMember2021-01-012021-12-310000312069bcs:Section75ContributionPlanMember2023-01-012023-12-310000312069bcs:Section75ContributionPlanMember2022-01-012022-12-310000312069ifrs-full:CountryOfDomicileMemberbcs:PensionDefinedContributionPlansMemberifrs-full:DefinedBenefitPlansOtherThanMultiemployerPlansStatePlansAndPlansThatShareRisksBetweenEntitiesUnderCommonControlMember2023-01-012023-12-310000312069ifrs-full:CountryOfDomicileMemberbcs:PensionDefinedContributionPlansMemberbcs:BarclaysPensionSavingsPlanMember2023-01-012023-12-310000312069bcs:BarclaysBankPlcMember2023-01-012023-12-310000312069bcs:BarclaysBankUkPlcMember2023-01-012023-12-310000312069bcs:BarclaysBankIrelandPlcMember2023-01-012023-12-310000312069bcs:BarclaysServicesLimitedMember2023-01-012023-12-310000312069bcs:BarclaysCapitalIncMember2023-01-012023-12-310000312069bcs:BarclaysCapitalSecuritiesLimitedMember2023-01-012023-12-310000312069bcs:BarclaysSecuritiesJapanLimitedMember2023-01-012023-12-310000312069bcs:BarclaysUsLlcMember2023-01-012023-12-310000312069bcs:BarclaysBankDelawareMember2023-01-012023-12-310000312069ifrs-full:UnconsolidatedStructuredEntitiesMember2023-01-012023-12-310000312069ifrs-full:SubsidiariesMember2023-12-310000312069ifrs-full:SubsidiariesMember2022-12-310000312069bcs:ContractualBackstopLiquidityFacilitiesMemberbcs:CommercialPaperCPAndMediumTermNoteConduitsMember2023-12-310000312069bcs:ContractualBackstopLiquidityFacilitiesMemberbcs:CommercialPaperCPAndMediumTermNoteConduitsMember2022-12-310000312069bcs:EmployeeBenefitAndOtherTrustsMember2023-12-310000312069bcs:EmployeeBenefitAndOtherTrustsMember2022-12-310000312069ifrs-full:AssetbackedFinancingsMember2023-12-310000312069bcs:ShortTermTradedInterestsMember2023-12-310000312069bcs:TradedDerivativesMember2023-12-310000312069bcs:OtherInterestsMember2023-12-310000312069ifrs-full:UnconsolidatedStructuredEntitiesMember2023-12-310000312069ifrs-full:AssetbackedFinancingsMember2022-12-310000312069bcs:ShortTermTradedInterestsMember2022-12-310000312069bcs:TradedDerivativesMember2022-12-310000312069bcs:OtherInterestsMember2022-12-310000312069ifrs-full:UnconsolidatedStructuredEntitiesMember2022-12-31bcs:entity0000312069ifrs-full:SecuritisationVehiclesMember2022-12-310000312069ifrs-full:SecuritisationVehiclesMemberifrs-full:NotLaterThanThreeMonthsMemberifrs-full:DebtSecuritiesMember2023-01-012023-12-310000312069ifrs-full:DerivativesMemberifrs-full:UnconsolidatedStructuredEntitiesMember2023-12-310000312069ifrs-full:DerivativesMemberifrs-full:UnconsolidatedStructuredEntitiesMember2022-12-310000312069ifrs-full:SecuritisationVehiclesMember2023-12-310000312069ifrs-full:SecuritiesLendingMember2023-12-310000312069bcs:OtherInvestmentProgramMember2023-12-310000312069srt:ConsolidationEliminationsMemberbcs:OtherInterestsMember2023-12-310000312069ifrs-full:SecuritiesLendingMember2022-12-310000312069bcs:OtherInvestmentProgramMember2022-12-310000312069srt:ConsolidationEliminationsMemberbcs:OtherInterestsMember2022-12-310000312069ifrs-full:SecuritiesLendingMemberifrs-full:DebtSecuritiesMember2023-01-012023-12-310000312069bcs:BusinessGrowthFundMember2023-12-310000312069bcs:BusinessGrowthFundMember2022-12-310000312069bcs:BusinessGrowthFundMember2023-01-012023-12-310000312069bcs:BusinessGrowthFundMember2022-01-012022-12-310000312069ifrs-full:AssociatesMember2023-01-012023-12-310000312069ifrs-full:AssociatesMember2022-01-012022-12-310000312069ifrs-full:AssociatesMember2021-01-012021-12-310000312069ifrs-full:JointVenturesMember2023-01-012023-12-310000312069ifrs-full:JointVenturesMember2022-01-012022-12-310000312069ifrs-full:JointVenturesMember2021-01-012021-12-310000312069ifrs-full:JointVenturesMemberifrs-full:AssociatesMember2023-01-012023-12-310000312069ifrs-full:JointVenturesMemberifrs-full:AssociatesMember2022-01-012022-12-310000312069ifrs-full:JointVenturesMemberifrs-full:AssociatesMember2023-12-310000312069ifrs-full:JointVenturesMemberifrs-full:AssociatesMember2022-12-310000312069bcs:CreditCardsRetailMemberifrs-full:FinancialAssetsAtAmortisedCostCategoryMemberifrs-full:SecuritisationVehiclesMember2023-12-310000312069bcs:CreditCardsRetailMemberifrs-full:FinancialAssetsAtAmortisedCostCategoryMemberifrs-full:SecuritisationVehiclesMember2022-12-310000312069ifrs-full:FinancialAssetsAtAmortisedCostCategoryMemberifrs-full:SecuritisationVehiclesMemberbcs:FairValueMortgageLoansMember2023-12-310000312069ifrs-full:FinancialAssetsAtAmortisedCostCategoryMemberifrs-full:SecuritisationVehiclesMemberbcs:FairValueMortgageLoansMember2022-12-310000312069ifrs-full:SecuritisationVehiclesMemberbcs:FairValueMortgageLoansMemberifrs-full:FinancialAssetsAtFairValueThroughProfitOrLossCategoryMember2023-12-310000312069ifrs-full:SecuritisationVehiclesMemberbcs:FairValueMortgageLoansMemberifrs-full:FinancialAssetsAtFairValueThroughProfitOrLossCategoryMember2022-12-310000312069bcs:CreditCardsRetailMemberifrs-full:FinancialAssetsAtAmortisedCostCategoryMember2023-12-310000312069bcs:CreditCardsRetailMemberifrs-full:FinancialAssetsAtAmortisedCostCategoryMember2022-12-310000312069ifrs-full:AssetbackedFinancingsMember2023-12-310000312069ifrs-full:AssetbackedFinancingsMember2023-01-012023-12-310000312069bcs:ResidentialMortgageBackedSecuritiesMember2023-12-310000312069bcs:ResidentialMortgageBackedSecuritiesMember2023-01-012023-12-310000312069bcs:CommercialMortgageBackedSecurityMember2023-12-310000312069bcs:CommercialMortgageBackedSecurityMember2023-01-012023-12-310000312069ifrs-full:AssetbackedFinancingsMember2022-12-310000312069ifrs-full:AssetbackedFinancingsMember2022-01-012022-12-310000312069bcs:ResidentialMortgageBackedSecuritiesMember2022-12-310000312069bcs:ResidentialMortgageBackedSecuritiesMember2022-01-012022-12-310000312069bcs:CommercialMortgageBackedSecurityMember2022-12-310000312069bcs:CommercialMortgageBackedSecurityMember2022-01-012022-12-310000312069ifrs-full:TradeReceivablesMember2023-12-310000312069ifrs-full:TradeReceivablesMember2022-12-310000312069ifrs-full:FinancialAssetsAtFairValueThroughProfitOrLossClassifiedAsHeldForTradingCategoryMember2023-12-310000312069ifrs-full:FinancialAssetsAtFairValueThroughProfitOrLossClassifiedAsHeldForTradingCategoryMember2022-12-310000312069ifrs-full:DerivativesMember2023-12-310000312069bcs:ReverseRepurchaseAndRepurchaseAgreementsMember2023-12-310000312069ifrs-full:SecuritiesLendingMember2023-12-310000312069bcs:OtherFinancialAssetsMember2023-12-310000312069ifrs-full:DerivativesMember2022-12-310000312069bcs:ReverseRepurchaseAndRepurchaseAgreementsMember2022-12-310000312069ifrs-full:SecuritiesLendingMember2022-12-310000312069bcs:OtherFinancialAssetsMember2022-12-310000312069ifrs-full:SecuritisationVehiclesMemberbcs:OtherFinancialAssetsMember2023-12-310000312069ifrs-full:SecuritisationVehiclesMemberbcs:OtherFinancialAssetsMember2022-12-310000312069bcs:AssetBackedFundingProgrammesMember2023-12-310000312069bcs:AssetBackedFundingProgrammesMember2022-12-310000312069ifrs-full:AssociatesMember2023-01-012023-12-310000312069ifrs-full:JointVenturesWhereEntityIsVenturerMember2023-01-012023-12-310000312069bcs:PensionFundsUnitTrustsAndInvestmentFundsMember2023-01-012023-12-310000312069ifrs-full:AssociatesMember2023-12-310000312069ifrs-full:JointVenturesWhereEntityIsVenturerMember2023-12-310000312069bcs:PensionFundsUnitTrustsAndInvestmentFundsMember2023-12-310000312069ifrs-full:AssociatesMember2022-01-012022-12-310000312069ifrs-full:JointVenturesWhereEntityIsVenturerMember2022-01-012022-12-310000312069bcs:PensionFundsUnitTrustsAndInvestmentFundsMember2022-01-012022-12-310000312069ifrs-full:AssociatesMember2022-12-310000312069ifrs-full:JointVenturesWhereEntityIsVenturerMember2022-12-310000312069bcs:PensionFundsUnitTrustsAndInvestmentFundsMember2022-12-310000312069ifrs-full:AssociatesMember2021-01-012021-12-310000312069ifrs-full:JointVenturesWhereEntityIsVenturerMember2021-01-012021-12-310000312069bcs:PensionFundsUnitTrustsAndInvestmentFundsMember2021-01-012021-12-310000312069ifrs-full:KeyManagementPersonnelOfEntityOrParentMember2022-12-310000312069ifrs-full:KeyManagementPersonnelOfEntityOrParentMember2021-12-310000312069ifrs-full:KeyManagementPersonnelOfEntityOrParentMember2023-01-012023-12-310000312069ifrs-full:KeyManagementPersonnelOfEntityOrParentMember2022-01-012022-12-310000312069ifrs-full:KeyManagementPersonnelOfEntityOrParentMember2023-12-310000312069bcs:DeferredShareValuePlanShareValuePlanMembersrt:DirectorMember2023-01-012023-12-310000312069bcs:DeferredShareValuePlanShareValuePlanMembersrt:DirectorMember2022-01-012022-12-310000312069bcs:DeferredShareValuePlanShareValuePlanMembersrt:DirectorMember2021-01-012021-12-310000312069srt:DirectorMember2023-01-012023-12-310000312069srt:DirectorMember2022-01-012022-12-310000312069srt:DirectorMember2021-01-012021-12-310000312069bcs:DirectorsAndOfficersMemberifrs-full:OrdinarySharesMember2023-12-310000312069bcs:DirectorsAndOfficersMemberifrs-full:OrdinarySharesMember2022-12-310000312069bcs:DirectorsAndOfficersMemberbcs:SharesaveMemberifrs-full:OrdinarySharesMember2023-12-310000312069bcs:DirectorsAndOfficersMemberbcs:SharesaveMemberifrs-full:OrdinarySharesMember2022-12-310000312069bcs:DirectorsAndOfficersMemberbcs:SharesaveMemberifrs-full:OrdinarySharesMember2023-01-012023-12-310000312069srt:DirectorMemberbcs:PensionDefinedContributionPlansMember2023-12-310000312069srt:DirectorMemberbcs:PensionDefinedContributionPlansMember2022-12-310000312069ifrs-full:SubsidiariesMember2023-01-012023-12-310000312069ifrs-full:SubsidiariesMember2022-01-012022-12-310000312069ifrs-full:SubsidiariesMember2021-01-012021-12-310000312069bcs:OtherAuditRelatedFeesMember2023-01-012023-12-310000312069bcs:OtherAuditRelatedFeesMember2022-01-012022-12-310000312069bcs:OtherAuditRelatedFeesMember2021-01-012021-12-310000312069bcs:OtherAuditorServicesMember2023-01-012023-12-310000312069bcs:OtherAuditorServicesMember2022-01-012022-12-310000312069bcs:OtherAuditorServicesMember2021-01-012021-12-310000312069bcs:AuditFeeRelatingToPreviousYearMember2023-01-012023-12-310000312069bcs:AuditFeeRelatingToPreviousYearMember2022-01-012022-12-310000312069bcs:AuditFeeRelatingToPreviousYearMember2021-01-012021-12-310000312069bcs:BarclaysPensionSchemeMember2023-01-012023-12-310000312069bcs:BarclaysPensionSchemeMember2022-01-012022-12-310000312069bcs:BarclaysPensionSchemeMember2021-01-012021-12-310000312069bcs:KlynveldPeatMarwickGoerdelerMember2023-01-012023-12-310000312069bcs:KlynveldPeatMarwickGoerdelerMember2022-01-012022-12-310000312069bcs:KlynveldPeatMarwickGoerdelerMember2021-01-012021-12-310000312069bcs:OtherAuditRelatedFeesMemberbcs:KlynveldPeatMarwickGoerdelerMember2023-01-012023-12-310000312069bcs:OtherAuditRelatedFeesMemberbcs:KlynveldPeatMarwickGoerdelerMember2022-01-012022-12-310000312069bcs:OtherAuditRelatedFeesMemberbcs:KlynveldPeatMarwickGoerdelerMember2021-01-012021-12-310000312069ifrs-full:DisposalGroupsClassifiedAsHeldForSaleMember2023-12-310000312069bcs:TescoPersonalFinancePLCMemberifrs-full:MajorBusinessCombinationMember2024-02-092024-02-090000312069bcs:TescoPersonalFinancePLCMemberifrs-full:MajorBusinessCombinationMember2024-02-090000312069bcs:CreditCardsRetailMemberbcs:TescoPersonalFinancePLCMemberifrs-full:MajorBusinessCombinationMember2024-02-090000312069bcs:TescoPersonalFinancePLCMemberifrs-full:MortgagesMemberifrs-full:MajorBusinessCombinationMember2024-02-090000312069srt:ParentCompanyMemberbcs:BarclaysExecutionServicesLimitedMember2023-01-012023-12-310000312069srt:ParentCompanyMemberbcs:BarclaysUkMember2023-01-012023-12-310000312069srt:ParentCompanyMemberbcs:BarclaysBankPlcMember2023-01-012023-12-310000312069ifrs-full:SubsidiariesMembersrt:ParentCompanyMember2023-01-012023-12-310000312069ifrs-full:SubsidiariesMembersrt:ParentCompanyMember2022-01-012022-12-310000312069ifrs-full:SubsidiariesMembersrt:ParentCompanyMember2021-01-012021-12-310000312069srt:ParentCompanyMemberbcs:AdditionalTier1SecuritiesMember2023-01-012023-12-310000312069srt:ParentCompanyMemberbcs:AdditionalTier1SecuritiesMember2022-01-012022-12-310000312069srt:ParentCompanyMemberbcs:AdditionalTier1SecuritiesMember2021-01-012021-12-310000312069srt:ParentCompanyMemberbcs:BarclaysBankPlcMember2023-12-310000312069srt:ParentCompanyMemberbcs:BarclaysBankPlcMember2022-12-310000312069srt:ParentCompanyMemberbcs:BarclaysBankPlcMemberbcs:AdditionalTier1SecuritiesMember2023-12-310000312069srt:ParentCompanyMemberbcs:BarclaysBankPlcMemberbcs:AdditionalTier1SecuritiesMember2022-12-310000312069srt:ParentCompanyMemberbcs:BarclaysUkMember2023-12-310000312069srt:ParentCompanyMemberbcs:BarclaysUkMember2022-12-310000312069srt:ParentCompanyMemberbcs:BarclaysUkMemberbcs:AdditionalTier1SecuritiesMember2023-12-310000312069srt:ParentCompanyMemberbcs:BarclaysUkMemberbcs:AdditionalTier1SecuritiesMember2022-12-310000312069srt:ParentCompanyMemberbcs:BarclaysBankPlcMemberbcs:AdditionalTier1SecuritiesMember2023-01-012023-12-310000312069ifrs-full:OnDemandMemberifrs-full:SubsidiariesMembersrt:ParentCompanyMemberbcs:FixedToFloatingInterestRateMember2023-01-012023-12-310000312069ifrs-full:FixedInterestRateMemberifrs-full:OnDemandMembersrt:ParentCompanyMemberbcs:SeniorNotessMember2023-01-012023-12-310000312069ifrs-full:OnDemandMembersrt:ParentCompanyMemberbcs:FixedToFloatingInterestRateMemberbcs:SeniorNotessMember2023-01-012023-12-310000312069ifrs-full:OnDemandMembersrt:ParentCompanyMemberbcs:SeniorNotessMemberifrs-full:FloatingInterestRateMember2023-01-012023-12-310000312069bcs:SharesClassBClassCAndClassDMember2023-01-012023-12-310000312069bcs:SharesClassEClassFClassGClassHAndClassIMember2023-01-012023-12-310000312069bcs:SharesClassJMember2023-01-012023-12-310000312069bcs:SharesClassKMember2023-01-012023-12-310000312069bcs:BarclaycardFundingPLCMembercountry:GB2023-01-012023-12-310000312069bcs:PSACreditCompanyLimitedMemberbcs:AOrdinarySharesMembercountry:GB2023-01-012023-12-310000312069bcs:PSACreditCompanyLimitedMemberbcs:COrdinarySharesMembercountry:GB2023-01-012023-12-310000312069bcs:BarclaysCoveredBondsLimitedLiabilityPartnershipMembercountry:GB2023-01-012023-12-310000312069country:GBbcs:BarclaysSecuredFundingLMLimitedMember2023-01-012023-12-310000312069country:GBbcs:IglooRegenerationGeneralPartnerLimitedMember2023-01-012023-12-310000312069country:GBbcs:TradeIdeasLimitedMember2023-01-012023-12-310000312069bcs:EquistoneFounderPartnerIIL.P.Membercountry:GB2023-01-012023-12-310000312069country:GBbcs:EquistoneFounderPartnerIIIL.P.Member2023-01-012023-12-310000312069country:GBbcs:IntelligentProcessingSolutionsLimitedMember2023-01-012023-12-310000312069bcs:FullHouseHoldingsLimitedMembercountry:GB2023-01-012023-12-310000312069country:GBbcs:BGFGroupPLCMember2023-01-012023-12-310000312069country:GBbcs:PalmsRowHealthcareHoldingsLimitedMember2023-01-012023-12-310000312069country:GBbcs:AVFITIDEILPMember2023-01-012023-12-310000312069bcs:AOrdinarySharesMemberbcs:FintechForInternationalDevelopmentLimitedMembercountry:GB2023-01-012023-12-310000312069bcs:BOrdinarySharesMemberbcs:FintechForInternationalDevelopmentLimitedMembercountry:GB2023-01-012023-12-310000312069country:GBbcs:FemaleInnovatorsLabLPMember2023-01-012023-12-310000312069country:GBbcs:BMCUKLtdMember2023-01-012023-12-310000312069country:GBbcs:BarclaysBlackFormationInvestmentsILPMember2023-01-012023-12-310000312069country:GBbcs:BarclaysBlackFormationInvestmentsIILPMember2023-01-012023-12-310000312069bcs:BuchananWharfGlasgowManagementLimitedMembercountry:GB2023-01-012023-12-310000312069country:BEbcs:EuphonyBeneluxNVInLiquidationMember2023-01-012023-12-310000312069country:KYbcs:CupricCanyonCapitalGPLimitedMember2023-01-012023-12-310000312069country:KYbcs:CupricCanyonCapitalLPMember2023-01-012023-12-310000312069country:KYbcs:NewmanHoldingsLimitedMember2023-01-012023-12-310000312069country:KYbcs:SouthernPeaksMiningLPMember2023-01-012023-12-310000312069country:KYbcs:SPMGPLimitedMember2023-01-012023-12-310000312069bcs:WooriBCPegasusSecuritizationSpecialtyCo.LtdMembercountry:KR2023-01-012023-12-310000312069country:LUbcs:BarclaysAlzinInvestmentsS.aR.l.Member2023-01-012023-12-310000312069country:LUbcs:BarclaysBordangInvestmentsS.aR.l.Member2023-01-012023-12-310000312069country:LUbcs:BarclaysLamorakInvestmentsS.aR.l.Member2023-01-012023-12-310000312069country:LUbcs:PreferredFundingS.aR.l.Member2023-01-012023-12-310000312069country:LUbcs:PreferredInvestmentsS.aR.l.Member2023-01-012023-12-310000312069country:MTbcs:RS2SoftwarePLCMember2023-01-012023-12-310000312069bcs:TulipOilHoldingBVMemberbcs:AOrdinarySharesMembercountry:NL2023-01-012023-12-310000312069bcs:TulipOilHoldingBVMemberbcs:COrdinarySharesMembercountry:NL2023-01-012023-12-310000312069country:SEbcs:EnterCardGroupABMember2023-01-012023-12-310000312069country:USbcs:DGSolarLesseeLLCMember2023-01-012023-12-310000312069country:USbcs:DGSolarLesseeIILLCMember2023-01-012023-12-310000312069country:USbcs:VSBCSolarLesseeILLCMember2023-01-012023-12-310000312069country:USbcs:SabineOilGasHoldingsInc.Member2023-01-012023-12-310000312069country:GBbcs:VaultexUKLimitedMember2023-01-012023-12-310000312069srt:ParentCompanyMemberbcs:VaultexUKLimitedMember2023-01-012023-12-310000312069bcs:JVPartnerMemberbcs:VaultexUKLimitedMember2023-01-012023-12-310000312069bcs:NonJVPartnerMemberbcs:VaultexUKLimitedMember2023-01-012023-12-310000312069bcs:VaultexUKLimitedMember2023-01-012023-12-31
SECURITIES AND EXCHANGE COMMISSION
WASHINGTON, DC 20549
FORM 20-F
(Mark One)
| |
| REGISTRATION STATEMENT PURSUANT TO SECTION 12(b) OR 12(g) OF THE SECURITIES EXCHANGE ACT OF 1934 |
OR
| |
| ANNUAL REPORT PURSUANT TO SECTION 13 OR 15(d) OF THE SECURITIES EXCHANGE ACT OF 1934 |
For the fiscal year ended 31 December 2023
OR
| |
| TRANSITION REPORT PURSUANT TO SECTION 13 OR 15(d) OF THE SECURITIES EXCHANGE ACT OF 1934 |
For the transition period from _______________to _______________
| |
| SHELL COMPANY REPORT PURSUANT TO SECTION 13 OR 15(d) OF THE SECURITIES EXCHANGE ACT OF 1934 |
Date of event requiring this shell company report _______________
BARCLAYS PLC
(Exact Name of Registrant as Specified in its Charter)
England
(Jurisdiction of Incorporation or Organization)
1 CHURCHILL PLACE, LONDON E14 5HP, England
(Address of Principal Executive Offices)
KATHRYN ROBERTS, +44 (0)20 7116 8774, KATHRYN.ROBERTS@BARCLAYS.COM
1 CHURCHILL PLACE, LONDON E14 5HP, England
(Name, Telephone, E-mail and/or Facsimile number and Address of Company Contact Person)
Securities registered or to be registered pursuant to Section 12(b) of the Act:
| | |
| | Name of each exchange on which registered |
| | |
| | |
| | |
American Depositary Shares, each representing four 25p ordinary shares | | |
| | |
4.375% Fixed Rate Subordinated Notes due 2024 | | |
| | |
3.65% Fixed Rate Senior Notes due 2025 | | |
| | |
5.25% Fixed Rate Senior Notes due 2045 | | |
| | |
4.375% Fixed Rate Senior Notes due 2026 | | |
| | |
5.20% Fixed Rate Subordinated Notes due 2026 | | |
| | |
4.337% Fixed Rate Senior Notes due 2028 | | |
| | |
| | |
4.950% Fixed Rate Senior Notes due 2047 | | |
| | |
4.836% Fixed Rate Subordinated Callable Notes due 2028 | | |
| | |
3.250% Fixed Rate Senior Notes due 2033 | | |
| | |
4.972% Fixed-to-Floating Rate Senior Notes due 2029 | | |
| | |
3.932% Fixed-to-Floating Rate Senior Notes due 2025 | | |
| | |
5.088% Fixed-to-Floating Rate Subordinated Notes due 2030 | | |
| | |
2.852% Fixed-to-Floating Rate Senior Notes due 2026 | | |
| | |
2.645% Fixed Rate Resetting Senior Callable Notes due 2031 | | |
| | |
3.564% Fixed Rate Resetting Subordinated Callable Notes due 2035 | | |
| | |
2.667% Fixed Rate Resetting Senior Callable Notes due 2032 | | |
| | |
3.811% Fixed Rate Resetting Subordinated Callable Notes due 2042 | | |
| | |
2.279% Fixed Rate Resetting Senior Callable Notes due 2027 | | |
| | |
2.894% Fixed Rate Resetting Senior Callable Notes due 2032 | | |
| | |
3.330% Fixed Rate Resetting Senior Callable Notes due 2042 | | |
| | |
5.304% Fixed Rate Resetting Senior Callable Notes due 2026 | | |
| | |
5.501% Fixed Rate Resetting Senior Callable Notes due 2028 | | |
| | |
5.746% Fixed Rate Resetting Senior Callable Notes due 2033 | | |
| | |
7.325% Fixed Rate Resetting Senior Callable Notes due 2026 | | |
| | |
7.385% Fixed Rate Resetting Senior Callable Notes due 2028 | | |
| | |
7.437% Fixed Rate Resetting Senior Callable Notes due 2033 | | |
| | |
5.829% Fixed-to-Floating Rate Resetting Senior Callable Notes due 2027 | | |
| | |
6.224% Fixed-to-Floating Rate Resetting Senior Callable Notes due 2034 | | |
| | |
7.119% Fixed-to-Floating Rate Subordinated Callable Notes due 2034 | | |
| | |
6.496% Fixed-to-Floating Rate Senior Callable Notes due 2027 | | |
| | |
6.490% Fixed-to-Floating Rate Senior Callable Notes due 2029 | | |
| | |
6.692% Fixed-to-Floating Rate Senior Callable Notes due 2034 | | |
| | |
Floating Rate Senior Callable Notes due 2027 | | |
* Not for trading, but in connection with the registration of American Depository Shares, pursuant to the requirements to the Securities
and Exchange Commission.
Securities registered or to be registered pursuant to Section 12(g) of the Act: None
Securities for which there is a reporting obligation pursuant to Section 15(d) of the Act: None
Indicate the number of outstanding shares of each of the issuer’s classes of capital or common stock as of the close of the period
covered by the annual report.
Indicate by check mark if the registrant is a well-known seasoned issuer, as defined in Rule 405 of the Securities Act.
Yes þ No ¨
If this report is an annual or transition report, indicate by check mark if the registrant is not required to file reports pursuant to Section 13
or 15(d) of the Securities Exchange Act of 1934.
Yes ¨ No þ
Note – Checking the box above will not relieve any registrant required to file reports pursuant to Section 13 or 15(d) of the Securities
Exchange Act of 1934 from their obligations under those Sections.
Indicate by check mark whether the registrant (1) has filed all reports required to be filed by Section 13 or 15(d) of the Securities
Exchange Act of 1934 during the preceding 12 months (or for such shorter period that the registrant was required to file such reports),
and (2) has been subject to such filing requirements for the past 90 days.
Yes þ No ¨
Indicate by check mark whether the registrant has submitted electronically every Interactive Data File required to be submitted
pursuant to Rule 405 of Regulation S-T (§ 232.405 of this chapter) during the preceding 12 months (or for such shorter period that the
registrant was required to submit such files).
Yes þ No ¨
Indicate by check mark whether the registrant is a large accelerated filer, an accelerated filer, a non-accelerated filer, or an emerging
growth company. See definition of “large accelerated filer”, “accelerated filer” and “emerging growth company” in Rule 12b-2 of the
Exchange Act:
If an emerging growth company that prepares its financial statements in accordance with U.S. GAAP, indicate by check mark if the
registrant has elected not to use the extended transition period for complying with any new or revised financial accounting standards†
provided pursuant to Section 13(a) of the Exchange Act. ¨
†The term “new or revised financial accounting standard” refers to any update issued by the Financial Accounting Standards
Board to its Accounting Standards Codification after April 5, 2012.
Indicate by check mark whether the registrant has filed a report on and attestation to its management’s assessment of the
effectiveness of its internal control over financial reporting under Section 404(b) of the Sarbanes-Oxley Act (15 U.S.C. 7262(b)) by the
registered public accounting firm that prepared or issued its audit report. þ
If securities are registered pursuant to Section 12(b) of the Act, indicate by check mark whether the financial statements of the
registrant included in the filing reflect the correction of an error to previously issued financial statements.¨
Indicate by check mark whether any of those error corrections are restatements that required a recovery analysis of incentive- based
compensation received by any of the registrant's executive officers during the relevant recovery period pursuant to §240.10D-1(b). ¨
*Indicate by check mark which basis of accounting the registrant has used to prepare the financial statements included in this filing:
U.S. GAAP ¨
International Financial Reporting Standards as issued by the International Accounting Standards Board þ
Other ¨
*If “Other” has been checked in response to the previous question, indicate by check mark which financial statement item the registrant
has elected to follow:
Item 17 ¨
Item 18 ¨
If this is an annual report, indicate by check mark whether the registrant is a shell company (as defined in Rule 12b-2 of the Exchange
Act).
Yes ¨ No þ
(APPLICABLE ONLY TO ISSUERS INVOLVED IN BANKRUPTCY PROCEEDINGS DURING THE PAST FIVE YEARS)
Indicate by check mark whether the registrant has filed all documents and reports required to be filed by Sections 12, 13 or 15(d) of the
Securities Exchange Act of 1934 subsequent to the distribution of securities under a plan confirmed by a court.
Yes ¨ No ¨
SEC Form 20-F Cross reference information
| | | |
| Page and caption references in this document* | |
| | | |
| Identity of Directors, Senior Management and Advisers | | |
| | | |
| Offer Statistics and Expected Timetable | | |
| | | |
| | | |
| B. Capitalization and indebtedness | | |
| C. Reason for the offer and use of proceeds | | |
| | | |
| Information on the Company | | |
| A. History and development of the company | i (Notes), 80-82, 301-319, 383-387 (Note 25), 423, 430 | |
| | iii (Market and other data), 188-189, 290-299, 338-340 (Note 2) | |
| C. Organizational structure | 402-407 (Notes 33 and 34), 417-419 (Note 43) | |
| D. Property, plants and equipment | 373-376 (Notes 19 and 20) | |
| Unresolved staff comments | | |
| Operating and Financial Review and Prospects | | |
| | 101-106, 193-194, 200-211, 282, 286-287, 290-299, 301-319, 354-360 (Note 14) | |
| B. Liquidity and capital resources | 193-194, 206-207, 267-276, 278, 330, 333, 334 (Note 1), 354-360 (Note 14), 388-391 (Notes 26 and 27), 402-403 (Note 33), 408-409 (Note 36), 447-458 | |
| C. Research and development, patents and licenses, etc | | |
| | 186-199, 266-285, 301-319 | |
| E. Critical Accounting Estimates | | |
| Directors, Senior Management and Employees | | |
| A. Directors and senior management | | |
| | 119-157, 394-401 (Notes 31 and 32), 412-414 (Note 38), 445-446, 460 | |
| | 72-75, 77-79, 93-100, 110-111, 119, 156-157, 437-439 | |
| | 14-16, 307, 309, 314, 338-340 (Note 2), 442 | |
| | | |
| | 154-155, 394-395 (Note 31), 412-414 (Note 38), 440, 445-446, 460 | |
| F. Disclosure of a registrant’s action to recover erroneously awarded compensation | | |
| Major Shareholders and Related Party Transactions | | |
| | | |
| B. Related party transactions | | |
| C. Interests of experts and counsel | | |
| | | |
| A. Consolidated statements and other financial information | | |
| | | |
| | | |
| A. Offer and listing details | | |
| | | |
| | | |
| | | |
| | | |
| | | |
| | | |
| | | |
| B. Memorandum and Articles of Association | | |
| | | |
| | | |
| | | |
| F. Dividends and paying agents | | |
| | | |
| | | |
| I. Subsidiary information | 402-403 (Note 33), 417-419 (Note 43) | |
| J. Annual Report to Security Holders | | |
| Quantitative and Qualitative Disclosure about Market Risk | 184-299, 354-371 (Notes 14-17) | |
| Description of Securities Other than Equity Securities | | |
| | | |
| | | |
| | | |
| D. American Depository Shares | | |
| Defaults, Dividend Averages and Delinquencies | | |
| Material Modifications to the Rights of Security Holders and Use of Proceeds | | |
| | | |
| A. Disclosure controls and procedures | | |
| B. Management's annual report on internal control over financial reporting | | |
| C. Attestation report of the registered public accounting firm | | |
| D. Changes in internal control over financial reporting | | |
| Audit Committee Financial Expert | | |
| | | |
| Principal Accountant Fees and Services | | |
| Exemptions from Listing Standards for Audit Committees | | |
| Purchases of Equity Securities by the Issuer and Affiliated Purchasers | | |
| Change in Registrant's Certifying Accountant | | |
| | | |
| | | |
| | | |
| Disclosure Regarding Foreign Jurisdictions that Prevent Inspections | | |
| | | |
| | 82, 105, 180-181, 194-195, 287 | |
| | | |
| | | |
| | | |
| | | |
* Captions have been included only in respect of pages with multiple sections on the same page in order to identify the relevant caption on that
page covered by the corresponding Form 20-F item number.
2023 Annual Report on Form 20-F Notes The terms Barclays or Group refer to Barclays PLC together with its subsidiaries. Unless otherwise stated, the income statement analysis compares the year ended 31 December 2023 to the corresponding twelve months of 2022 and balance sheet analysis as at 31 December 2023 with comparatives relating to 31 December 2022. The abbreviations ‘£m’ and ‘£bn’ represent millions and thousands of millions of Pounds Sterling respectively; the abbreviations ‘$m’ and ‘$bn’ represent millions and thousands of millions of US Dollars respectively; and the abbreviations ‘€m’ and ‘€bn’ represent millions and thousands of millions of Euros respectively. There are a number of key judgement areas, for example impairment calculations, which are based on models and which are subject to ongoing adjustment and modifications. Reported numbers reflect best estimates and judgements at the given point in time. Relevant terms that are used in this document but are not defined under applicable regulatory guidance or International Financial Reporting Standards (IFRS) are explained in the results glossary that can be accessed at home.barclays/investor-relations/reports-and-events/latest-financial-results. Barclays is a frequent issuer in the debt capital markets and regularly meets with investors via formal road-shows and other ad hoc meetings. Consistent with its usual practice, Barclays expects that from time to time over the coming quarter it will meet with investors globally to discuss these results and other matters relating to the Group. Non-IFRS performance measures Barclays management believes that the non-IFRS performance measures included in this document provide valuable information to the readers of the financial statements as they enable the reader to identify a more consistent basis for comparing the businesses’ performance between financial periods and provide more detail concerning the elements of performance which the managers of these businesses are most directly able to influence or are relevant for an assessment of the Group. They also reflect an important aspect of the way in which operating targets are defined and performance is monitored by Barclays management. However, any non-IFRS performance measures in this document are not a substitute for IFRS measures and readers should consider the IFRS measures as well. Refer to the appendix on pages 315 to 319 for further information and calculations of non-IFRS performance measures included throughout this document, and the most directly comparable IFRS measures. Key non-IFRS measures included in this document, and the most directly comparable IFRS measures, are: – Attributable profit/(loss) excluding litigation and conduct represents attributable profit/(loss) excluding litigation and conduct charges. The comparable IFRS measure is attributable profit/(loss). – Average allocated equity represents the average shareholders’ equity that is allocated to the businesses. The comparable IFRS measure is average equity. A reconciliation is provided on pages 316; – Average allocated tangible equity is calculated as the average of the previous month’s period end allocated tangible equity and the current month’s period end allocated tangible equity. The average allocated tangible equity for the period is the average of the monthly averages within that period. Period end allocated tangible equity is calculated as 13.5% (2022: 13.5%) of RWAs for each business, adjusted for capital deductions, excluding goodwill and intangible assets, reflecting the assumptions the Group uses for capital planning purposes. Head Office allocated tangible equity represents the difference between the Group’s tangible shareholders’ equity and the amounts allocated to businesses. The comparable IFRS measure is average equity. A reconciliation is provided on page 316; – Average tangible equity is calculated as the average of the previous month’s period end tangible equity and the current month’s period end tangible equity. The average tangible shareholders’ equity for the period is the average of the monthly averages within that period. The comparable IFRS measure is average equity. A reconciliation is provided on page 316; – Basic earnings per share excluding litigation and conduct is calculated by dividing statutory profit after tax attributable to ordinary shareholders excluding litigation and conduct charges, by the basic weighted average number of shares. The comparable IFRS measure is basic earnings per share; – Cost: income ratio excluding litigation and conduct represents operating expenses excluding litigation and conduct charges, divided by total income. The comparable IFRS measure is cost: income ratio; – Operating expenses excluding litigation and conduct represents operating expenses excluding litigation and conduct charges. The comparable IFRS measure is operating expenses. A reconciliation is provided on page 318; – Pre-provision profits is calculated by excluding credit impairment charges from profit before tax. The comparable IFRS measure is profit before tax. – Pre-provision profits excluding litigation and conduct is calculated by excluding litigation and conduct, and credit impairment charges from profit before tax. The comparable IFRS measure is profit before tax. – Profit/(loss) before tax excluding Q423 structural cost actions represents profit/(loss) before tax excluding Q423 structural cost actions. The comparable IFRS measure is profit/(loss) before tax. A reconciliation is provided on page 317; – Profit/(loss) before tax excluding litigation and conduct represents profit/(loss) before tax excluding litigation and conduct charges. The comparable IFRS measure is profit/(loss) before tax. – Profit/(loss) before tax excluding the impact of the Over-issuance of Securities represents profit/(loss) before tax excluding the impact of the Over- issuance of Securities The comparable IFRS measure is profit/(loss) before tax. A reconciliation is provided on page 317; – Return on average allocated equity represents the return on shareholders’ equity that is allocated to the businesses. The comparable IFRS measure is return on equity. A reconciliation is provided on page 319; – Return on average allocated tangible equity is calculated as the annualised profit after tax attributable to ordinary equity holders of the parent, as a proportion of average allocated tangible equity. The comparable IFRS measure is return on equity. A reconciliation is provided on page 319; – Return on average allocated tangible equity excluding litigation and conduct is calculated as the annualised profit after tax attributable to ordinary equity holders of the parent excluding litigation and conduct charges, as a proportion of average allocated tangible equity. The comparable IFRS measure is return on equity. – Return on average tangible shareholders’ equity is calculated as the annualised profit after tax attributable to ordinary equity holders of the parent, as a proportion of average shareholders’ equity excluding non-controlling interests and other equity instruments adjusted for the deduction of intangible assets and goodwill. The comparable IFRS measure is return on equity. A reconciliation is provided on page 319; – Tangible net asset value per share is calculated by dividing shareholders’ equity, excluding non-controlling interests and other equity instruments, less goodwill and intangible assets, by the number of issued ordinary shares. A reconciliation is provided on page 318. – Return on average tangible shareholders’ equity excluding the impact of Q423 structural cost actions is calculated by excluding the impact of Q423 structural cost actions from the return on average tangible equity calculation. A reconciliation is provided on page 317;
– Return on average tangible shareholders’ equity excluding inorganic activity is calculated by excluding the impact of the inorganic activity from the return on average tangible equity calculation; – Return on average tangible shareholders’ equity excluding the impact of the Over-issuance of Securities is calculated by excluding the impact of the Over-issuance of Securities from the return on average tangible equity calculation. A reconciliation is provided on page 317; – Cost: income ratio excluding Q423 structural cost actions represents operating expenses excluding the impact of Q423 structural cost actions, divided by total income. The comparable IFRS measure is cost: income ratio.A reconciliation is provided on page 317; – Cost: income ratio excluding the impact of the Over-issuance of Securities represents operating expenses excluding the impact of the Over- issuance of Securities, divided by total income. The comparable IFRS measure is cost: income ratio. A reconciliation is provided on page 317; – Operating expenses excluding Q423 structural cost actions represents operating expenses excluding Q423 structural cost actions. The comparable IFRS measure is operating expenses. A reconciliation is provided on page 317; – Operating expenses excluding the impact of the Over-issuance of Securities represents operating expenses excluding the impact of the Over- issuance of Securities. The comparable IFRS measure is operating expenses. A reconciliation is provided on page 317; – Income excluding the impact of the Over-issuance of Securities represents income excluding the impact of the Over-issuance of Securities. The comparable IFRS measure is income. A reconciliation is provided on page 317; and – Income excluding the impact of Q423 structural cost actions represents income excluding the impact of Q423 structural cost actions. The comparable IFRS measure is income. A reconciliation is provided on page 317. Forward-looking statements This document contains certain forward-looking statements within the meaning of Section 21E of the US Securities Exchange Act of 1934, as amended, and Section 27A of the US Securities Act of 1933, as amended, with respect to the Group. Barclays cautions readers that no forward-looking statement is a guarantee of future performance and that actual results or other financial condition or performance measures could differ materially from those contained in the forward-looking statements. Forward-looking statements can be identified by the fact that they do not relate only to historical or current facts. Forward-looking statements sometimes use words such as ‘may’, ‘will’, ‘seek’, ‘continue’, ‘aim’, ‘anticipate’, ‘target’, ‘projected’, ‘expect’, ‘estimate’, ‘intend’, ‘plan’, ‘goal’, ‘believe’, ‘achieve’ or other words of similar meaning. Forward-looking statements can be made in writing but also may be made verbally by directors, officers and employees of the Group (including during management presentations) in connection with this document. Examples of forward-looking statements include, among others, statements or guidance regarding or relating to the Group’s future financial position, business strategy, income levels, costs, assets and liabilities, impairment charges, provisions, capital, leverage and other regulatory ratios, capital distributions (including policy on dividends and share buybacks), return on tangible equity, projected levels of growth in banking and financial markets, industry trends, any commitments and targets (including environmental, social and governance (ESG) commitments and targets), plans and objectives for future operations and other statements that are not historical or current facts. By their nature, forward-looking statements involve risk and uncertainty because they relate to future events and circumstances. Forward-looking statements speak only as at the date on which they are made. Forward-looking statements may be affected by a number of factors, including, without limitation: changes in legislation, regulations, governmental and regulatory policies, expectations and actions, voluntary codes of practices and the interpretation thereof, changes in IFRS and other accounting standards, including practices with regard to the interpretation and application thereof and emerging and developing ESG reporting standards; the outcome of current and future legal proceedings and regulatory investigations; the Group’s ability along with governments and other stakeholders to measure, manage and mitigate the impacts of climate change effectively; environmental, social and geopolitical risks and incidents, pandemics and similar events beyond the Group’s control; the impact of competition in the banking and financial services industry; capital, liquidity, leverage and other regulatory rules and requirements applicable to past, current and future periods; UK, US, Eurozone and global macroeconomic and business conditions, including inflation; volatility in credit and capital markets; market related risks such as changes in interest rates and foreign exchange rates; reforms to benchmark interest rates and indices; higher or lower asset valuations; changes in credit ratings of any entity within the Group or any securities issued by it; changes in counterparty risk; changes in consumer behaviour; the direct and indirect consequences of the conflicts in Ukraine and the Middle East on European and global macroeconomic conditions, political stability and financial markets; political elections; developments in the UK’s relationship with the European Union (EU); the risk of cyberattacks, information or security breaches, technology failures or other operational disruptions and any subsequent impacts on the Group’s reputation, business or operations; the Group’s ability to access funding; and the success of acquisitions, disposals and other strategic transactions. A number of these factors are beyond the Group’s control. As a result, the Group’s actual financial position, results, financial and non-financial metrics or performance measures or its ability to meet commitments and targets may differ materially from the statements or guidance set forth in the Group’s forward-looking statements. In setting its targets and outlook for the period 2024-2026, Barclays has made certain assumptions about the macro-economic environment, including, without limitation, inflation, interest and unemployment rates, the different markets and competitive conditions in which Barclays operates, and its ability to grow certain businesses and achieve costs savings and other structural actions. Additional risks and factors which may impact the Group’s future financial condition and performance are identified in Barclays PLC’s filings with the SEC (including, without limitation, Barclays PLC’s Annual Report on Form 20-F for the financial year ended 31 December 2023), which are available on the SEC’s website at www.sec.gov. Subject to Barclays PLC’s obligations under the applicable laws and regulations of any relevant jurisdiction (including, without limitation, the UK and the US) in relation to disclosure and ongoing information, we undertake no obligation to update publicly or revise any forward-looking statements, whether as a result of new information, future events or otherwise. Market and other data This document contains information, including statistical data, about certain Barclays markets and its competitive position. Except as otherwise indicated, this information is taken or derived from Datastream and other external sources. Barclays cannot guarantee the accuracy of information taken from external sources, or that, in respect of internal estimates, a third party using different methods would obtain the same estimates as Barclays. Uses of Internet addresses This document contains inactive textual addresses to internet websites operated by us and third parties. Reference to such websites is made for information purposes only, and information found at such websites is not incorporated by reference into this document. References to Strategic Report and Pillar 3 Report This document contains references throughout to the Barclays PLC Strategic Report and Pillar 3 Report. References to the aforementioned reports are made for information purposes only, and information found in said reports is not incorporated by reference into
this document.
Strategy 2 Climate & Sustainability 18 Governance ■ Governance contents 71 ■ Directors’ report 72 ■ Remuneration report 119 Risk review ■ Risk review contents 182 ■ Risk management 184 ■ Material existing and emerging risks 186 ■ Principal risk management 200 ■ Risk performance 212 ■ Supervision and regulation 290 Financial review ■ Financial review contents 300 ■ Key performance indicators 301 ■ Consolidated summary income statement 303 ■ Income statement commentary 304 ■ Consolidated summary balance sheet 305 ■ Balance sheet commentary 306 ■ Analysis of results by business 307 ■ Non-IFRS performance measures 315 Financial statements ■ Financial statements contents 320 ■ Consolidated financial statements 325 ■ Notes to the financial statements 334 Shareholder information ■ Key dates, Annual General Meeting, dividends, and other useful information 421
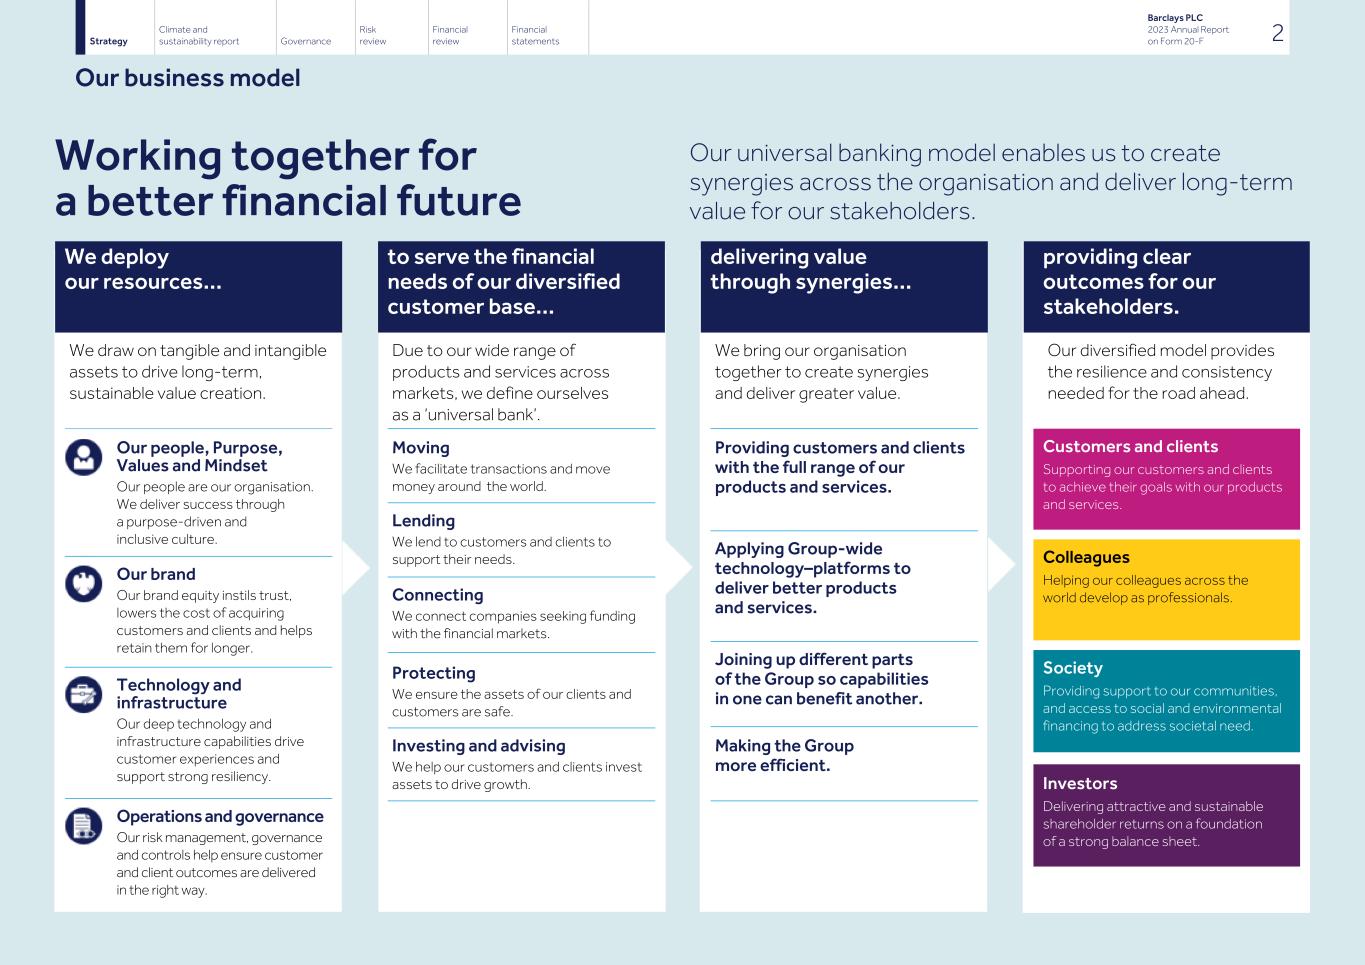
Working together for a better financial future Our universal banking model enables us to create synergies across the organisation and deliver long-term value for our stakeholders. We deploy our resources... We draw on tangible and intangible assets to drive long-term, sustainable value creation. Our people, Purpose, Values and Mindset Our people are our organisation. We deliver success through a purpose-driven and inclusive culture. Our brand Our brand equity instils trust, lowers the cost of acquiring customers and clients and helps retain them for longer. Technology and infrastructure Our deep technology and infrastructure capabilities drive customer experiences and support strong resiliency. Operations and governance Our risk management, governance and controls help ensure customer and client outcomes are delivered in the right way. to serve the financial needs of our diversified customer base... Due to our wide range of products and services across markets, we define ourselves as a ‘universal bank’. Moving We facilitate transactions and move money around the world. Lending We lend to customers and clients to support their needs. Connecting We connect companies seeking funding with the financial markets. Protecting We ensure the assets of our clients and customers are safe. Investing and advising We help our customers and clients invest assets to drive growth. delivering value through synergies... We bring our organisation together to create synergies and deliver greater value. Providing customers and clients with the full range of our products and services. Applying Group-wide technology–platforms to deliver better products and services. Joining up different parts of the Group so capabilities in one can benefit another. Making the Group more efficient. providing clear outcomes for our stakeholders. Our diversified model provides the resilience and consistency needed for the road ahead. Customers and clients Supporting our customers and clients to achieve their goals with our products and services. Colleagues Helping our colleagues across the world develop as professionals. Society Providing support to our communities, and access to social and environmental financing to address societal need. Investors Delivering attractive and sustainable shareholder returns on a foundation of a strong balance sheet. Strategy Climate and sustainability report Governance Risk review Financial review Financial statements Barclays PLC 2023 Annual Report on Form 20-F 2 Our business model
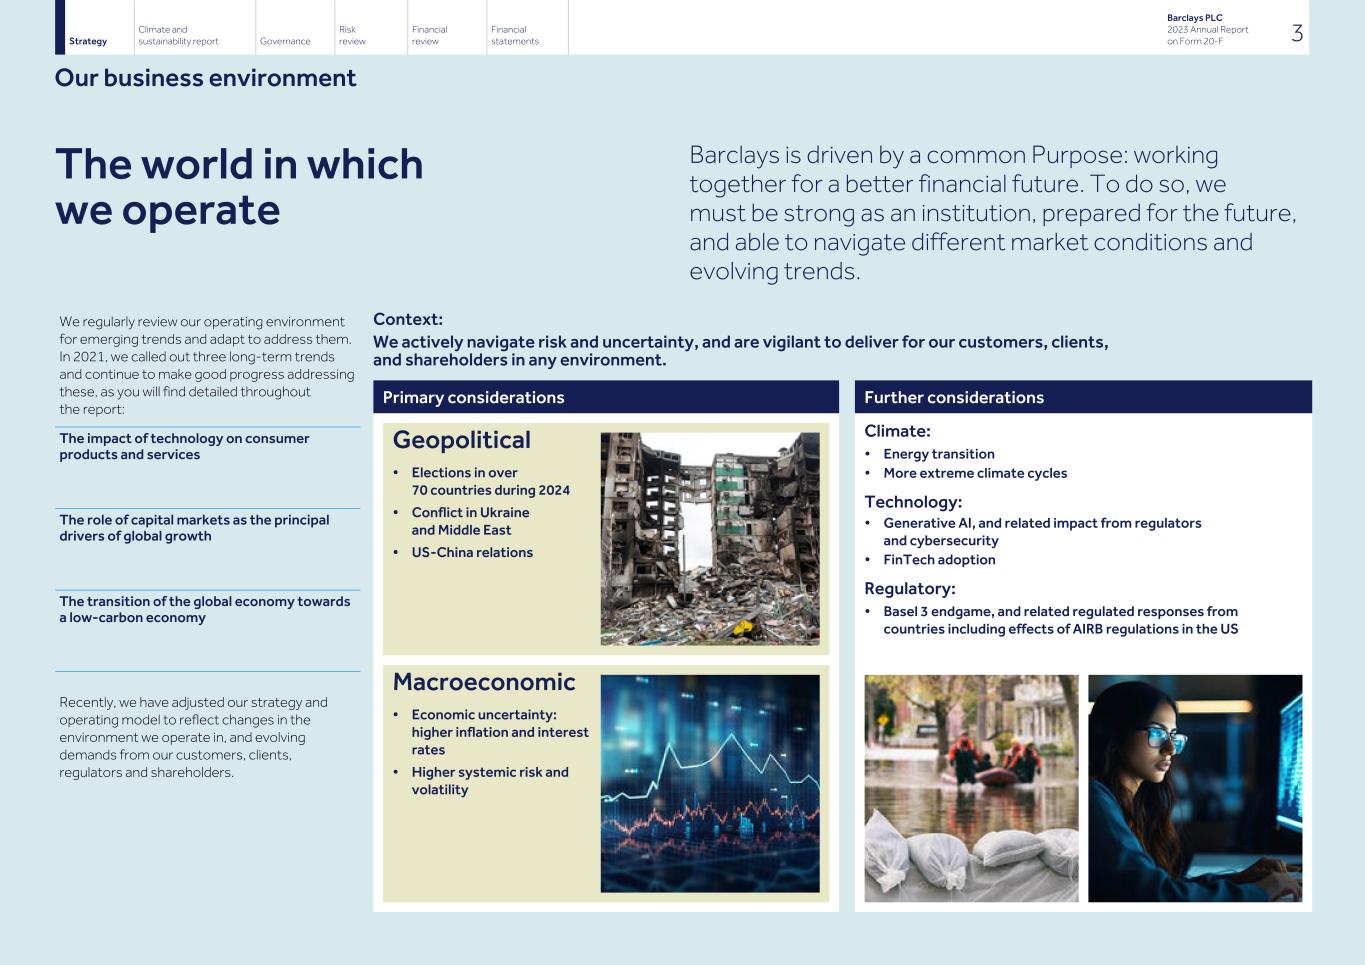
The world in which we operate Barclays is driven by a common Purpose: working together for a better financial future. To do so, we must be strong as an institution, prepared for the future, and able to navigate different market conditions and evolving trends. We regularly review our operating environment for emerging trends and adapt to address them. In 2021, we called out three long-term trends and continue to make good progress addressing these, as you will find detailed throughout the report: The impact of technology on consumer products and services The role of capital markets as the principal drivers of global growth The transition of the global economy towards a low-carbon economy Recently, we have adjusted our strategy and operating model to reflect changes in the environment we operate in, and evolving demands from our customers, clients, regulators and shareholders. Context: We actively navigate risk and uncertainty, and are vigilant to deliver for our customers, clients, and shareholders in any environment. Primary considerations Further considerations Climate: • Energy transition • More extreme climate cycles Technology: • Generative AI, and related impact from regulators and cybersecurity • FinTech adoption Regulatory: • Basel 3 endgame, and related regulated responses from countries including effects of AIRB regulations in the US Geopolitical • Elections in over 70 countries during 2024 • Conflict in Ukraine and Middle East • US-China relations Macroeconomic • Economic uncertainty: higher inflation and interest rates • Higher systemic risk and volatility Strategy Climate and sustainability report Governance Risk review Financial review Financial statements Barclays PLC 2023 Annual Report on Form 20-F 3 Our business environment
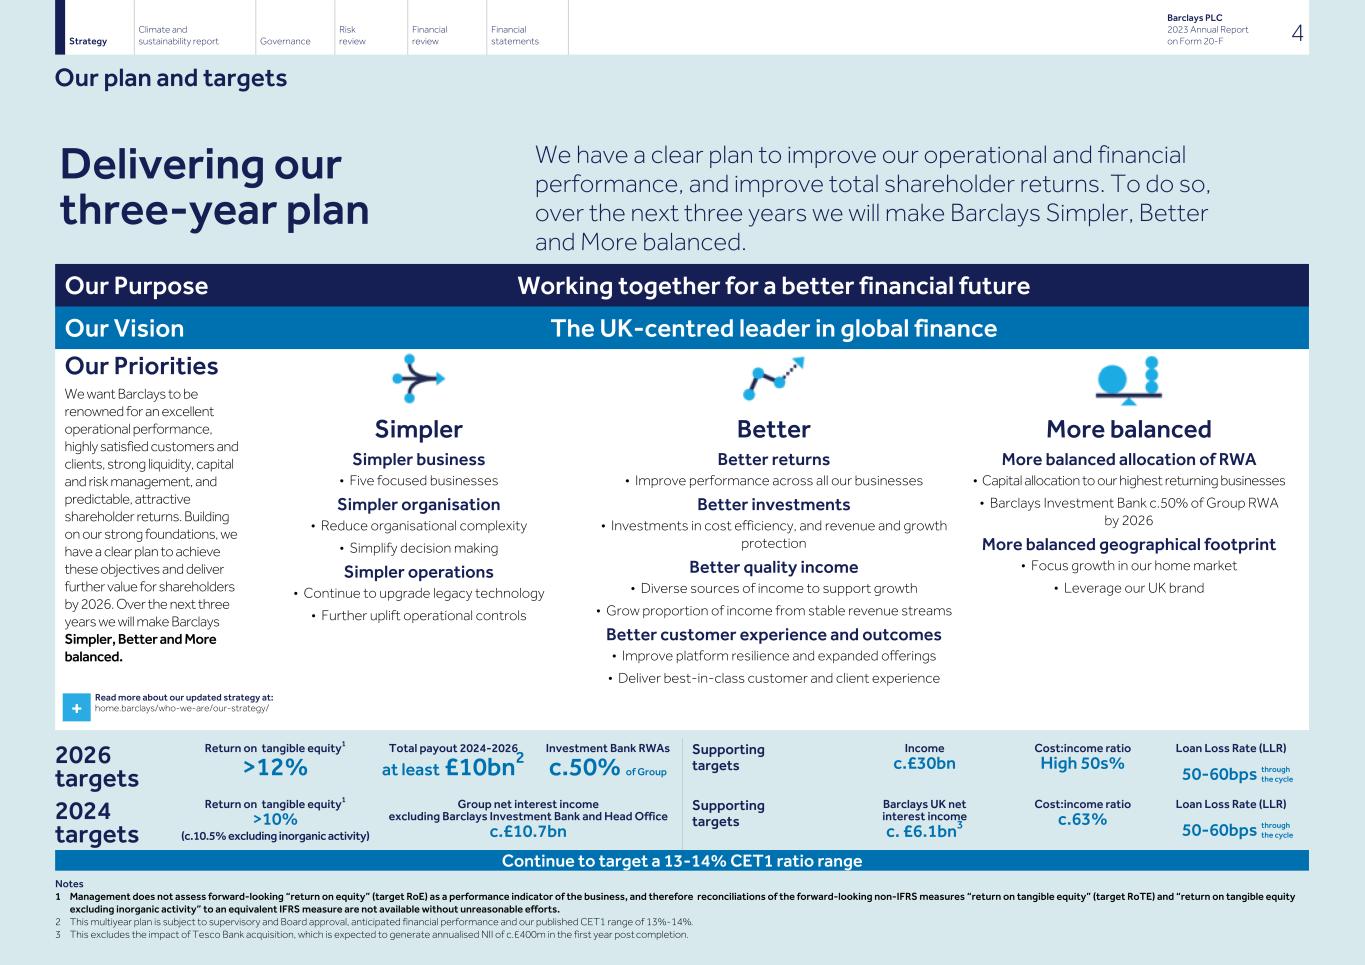
Delivering our three-year plan We have a clear plan to improve our operational and financial performance, and improve total shareholder returns. To do so, over the next three years we will make Barclays Simpler, Better and More balanced. Our Purpose Working together for a better financial future Our Vision The UK-centred leader in global finance Our Priorities We want Barclays to be renowned for an excellent operational performance, highly satisfied customers and clients, strong liquidity, capital and risk management, and predictable, attractive shareholder returns. Building on our strong foundations, we have a clear plan to achieve these objectives and deliver further value for shareholders by 2026. Over the next three years we will make Barclays Simpler, Better and More balanced. Simpler Better More balanced Simpler business • Five focused businesses Simpler organisation • Reduce organisational complexity • Simplify decision making Simpler operations • Continue to upgrade legacy technology • Further uplift operational controls Better returns • Improve performance across all our businesses Better investments • Investments in cost efficiency, and revenue and growth protection Better quality income • Diverse sources of income to support growth • Grow proportion of income from stable revenue streams Better customer experience and outcomes • Improve platform resilience and expanded offerings • Deliver best-in-class customer and client experience More balanced allocation of RWA • Capital allocation to our highest returning businesses • Barclays Investment Bank c.50% of Group RWA by 2026 More balanced geographical footprint • Focus growth in our home market • Leverage our UK brand 2026 targets Return on tangible equity1 >12% Total payout 2024-2026 at least £10bn2 Investment Bank RWAs c.50% of Group Supporting targets Income c.£30bn Cost:income ratio High 50s% Loan Loss Rate (LLR) 50-60bps through the cycle 2024 targets Return on tangible equity1 >10% (c.10.5% excluding inorganic activity) Group net interest income excluding Barclays Investment Bank and Head Office c.£10.7bn Supporting targets Barclays UK net interest income c. £6.1bn3 Cost:income ratio c.63% Loan Loss Rate (LLR) 50-60bps through the cycle Continue to target a 13-14% CET1 ratio range Notes 1 Management does not assess forward-looking “return on equity” (target RoE) as a performance indicator of the business, and therefore reconciliations of the forward-looking non-IFRS measures “return on tangible equity” (target RoTE) and “return on tangible equity excluding inorganic activity” to an equivalent IFRS measure are not available without unreasonable efforts. 2 This multiyear plan is subject to supervisory and Board approval, anticipated financial performance and our published CET1 range of 13%-14%. 3 This excludes the impact of Tesco Bank acquisition, which is expected to generate annualised NII of c.£400m in the first year post completion. Strategy Climate and sustainability report Governance Risk review Financial review Financial statements Barclays PLC 2023 Annual Report on Form 20-F 4 Our plan and targets + Read more about our updated strategy at: home.barclays/who-we-are/our-strategy/
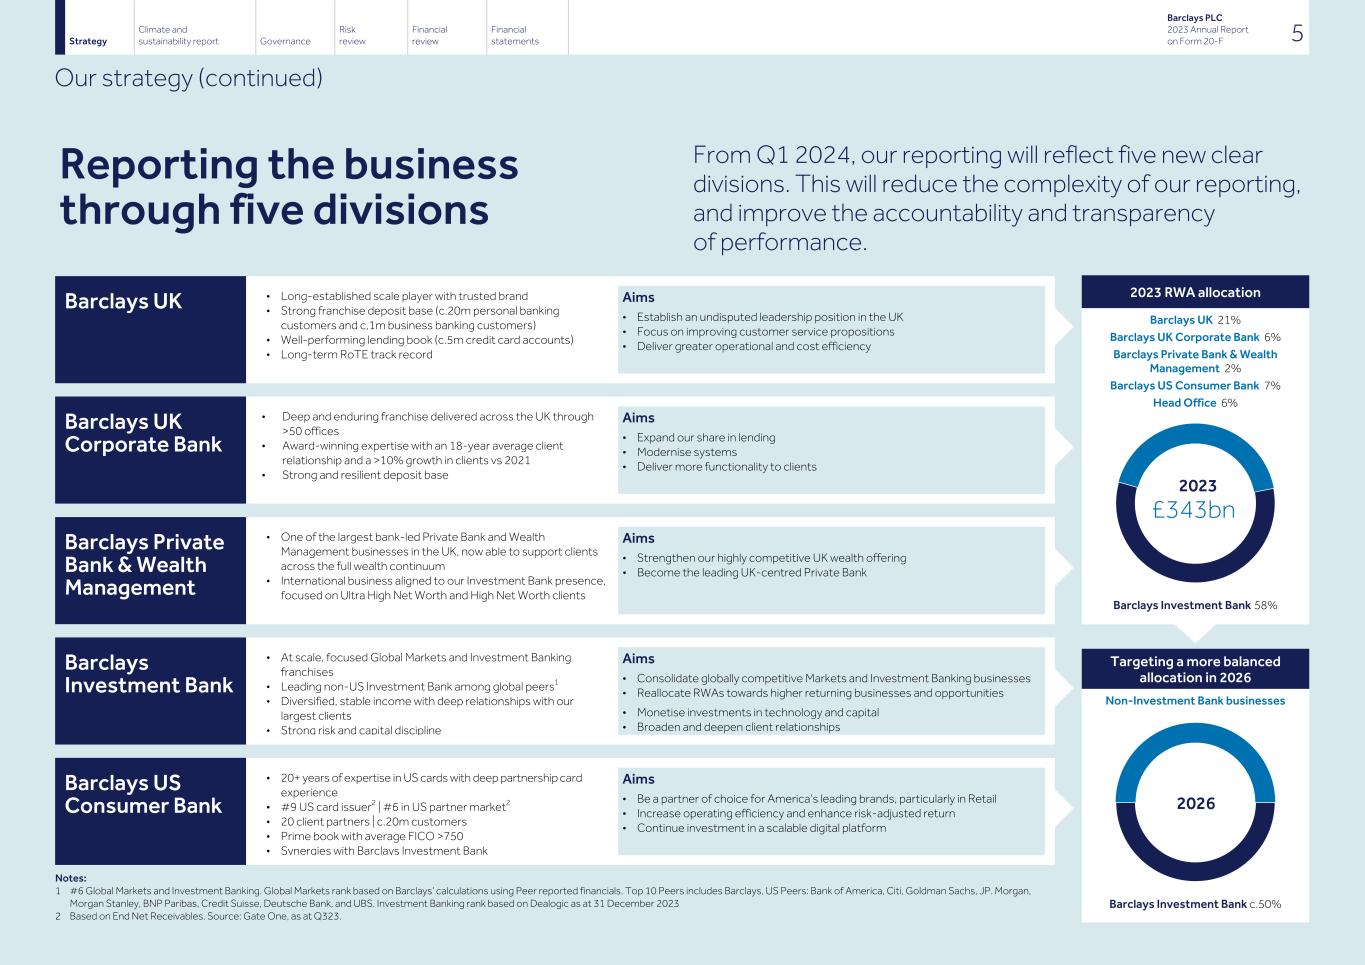
Reporting the business through five divisions From Q1 2024, our reporting will reflect five new clear divisions. This will reduce the complexity of our reporting, and improve the accountability and transparency of performance. Barclays UK • Long-established scale player with trusted brand • Strong franchise deposit base (c.20m personal banking customers and c,1m business banking customers) • Well-performing lending book (c.5m credit card accounts) • Long-term RoTE track record Aims • Establish an undisputed leadership position in the UK • Focus on improving customer service propositions • Deliver greater operational and cost efficiency Barclays UK Corporate Bank • Deep and enduring franchise delivered across the UK through >50 offices • Award-winning expertise with an 18-year average client relationship and a >10% growth in clients vs 2021 • Strong and resilient deposit base Aims • Expand our share in lending • Modernise systems • Deliver more functionality to clients Barclays Private Bank & Wealth Management • One of the largest bank-led Private Bank and Wealth Management businesses in the UK, now able to support clients across the full wealth continuum • International business aligned to our Investment Bank presence, focused on Ultra High Net Worth and High Net Worth clients Aims • Strengthen our highly competitive UK wealth offering • Become the leading UK-centred Private Bank Barclays Investment Bank • At scale, focused Global Markets and Investment Banking franchises • Leading non-US Investment Bank among global peers1 • Diversified, stable income with deep relationships with our largest clients • Strong risk and capital discipline Aims • Consolidate globally competitive Markets and Investment Banking businesses • Reallocate RWAs towards higher returning businesses and opportunities • Monetise investments in technology and capital • Broaden and deepen client relationships Barclays US Consumer Bank • 20+ years of expertise in US cards with deep partnership card experience • #9 US card issuer2 | #6 in US partner market2 • 20 client partners | c.20m customers • Prime book with average FICO >750 • Synergies with Barclays Investment Bank Aims • Be a partner of choice for America’s leading brands, particularly in Retail • Increase operating efficiency and enhance risk-adjusted return • Continue investment in a scalable digital platform Notes: 1 #6 Global Markets and Investment Banking. Global Markets rank based on Barclays’ calculations using Peer reported financials. Top 10 Peers includes Barclays, US Peers: Bank of America, Citi, Goldman Sachs, JP. Morgan, Morgan Stanley, BNP Paribas, Credit Suisse, Deutsche Bank, and UBS. Investment Banking rank based on Dealogic as at 31 December 2023 2 Based on End Net Receivables. Source: Gate One, as at Q323. Strategy Climate and sustainability report Governance Risk review Financial review Financial statements Barclays PLC 2023 Annual Report on Form 20-F 5 Our strategy (continued) 2023 RWA allocation Barclays UK 21% Barclays UK Corporate Bank 6% Barclays Private Bank & Wealth Management 2% Barclays US Consumer Bank 7% Head Office 6% Barclays Investment Bank	58% Targeting a more balanced allocation in 2026 Non-Investment Bank businesses Barclays Investment Bank c.50% 2023 £343bn 2026
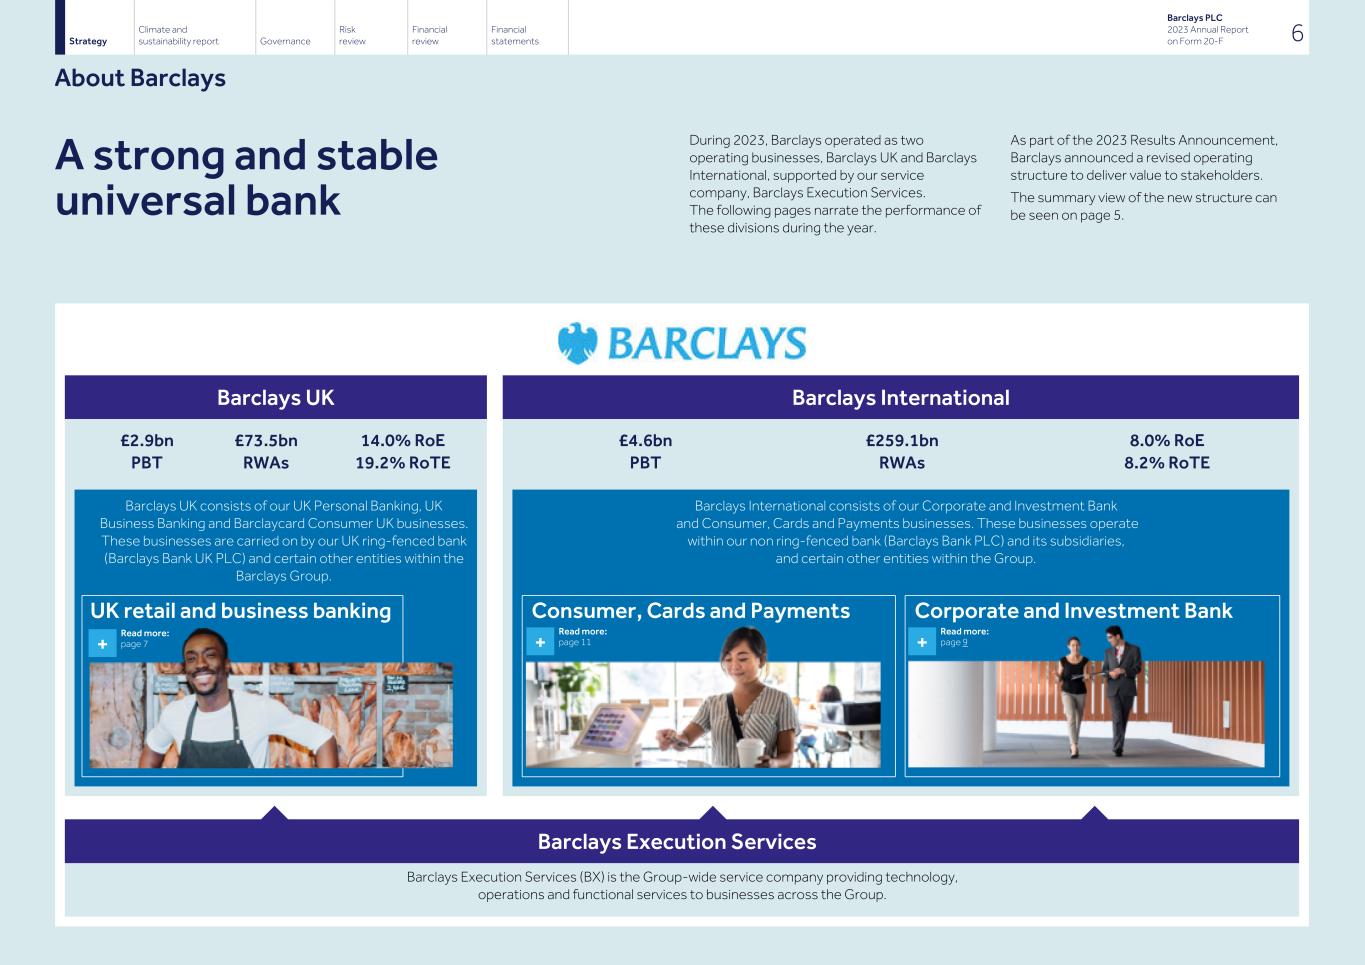
A strong and stable universal bank During 2023, Barclays operated as two operating businesses, Barclays UK and Barclays International, supported by our service company, Barclays Execution Services. The following pages narrate the performance of these divisions during the year. As part of the 2023 Results Announcement, Barclays announced a revised operating structure to deliver value to stakeholders. The summary view of the new structure can be seen on page 5. Barclays UK Barclays International £2.9bn PBT £73.5bn RWAs 14.0% RoE 19.2% RoTE £4.6bn PBT £259.1bn RWAs 8.0% RoE 8.2% RoTE Barclays UK consists of our UK Personal Banking, UK Business Banking and Barclaycard Consumer UK businesses. These businesses are carried on by our UK ring-fenced bank (Barclays Bank UK PLC) and certain other entities within the Barclays Group. Barclays International consists of our Corporate and Investment Bank and Consumer, Cards and Payments businesses. These businesses operate within our non ring-fenced bank (Barclays Bank PLC) and its subsidiaries, and certain other entities within the Group. UK retail and business banking Consumer, Cards and Payments Corporate and Investment Bank Barclays Execution Services Barclays Execution Services (BX) is the Group-wide service company providing technology, operations and functional services to businesses across the Group. Strategy Climate and sustainability report Governance Risk review Financial review Financial statements Barclays PLC 2023 Annual Report on Form 20-F 6 About Barclays + Read more: page 7 + Read more: page 11 + Read more: page 9
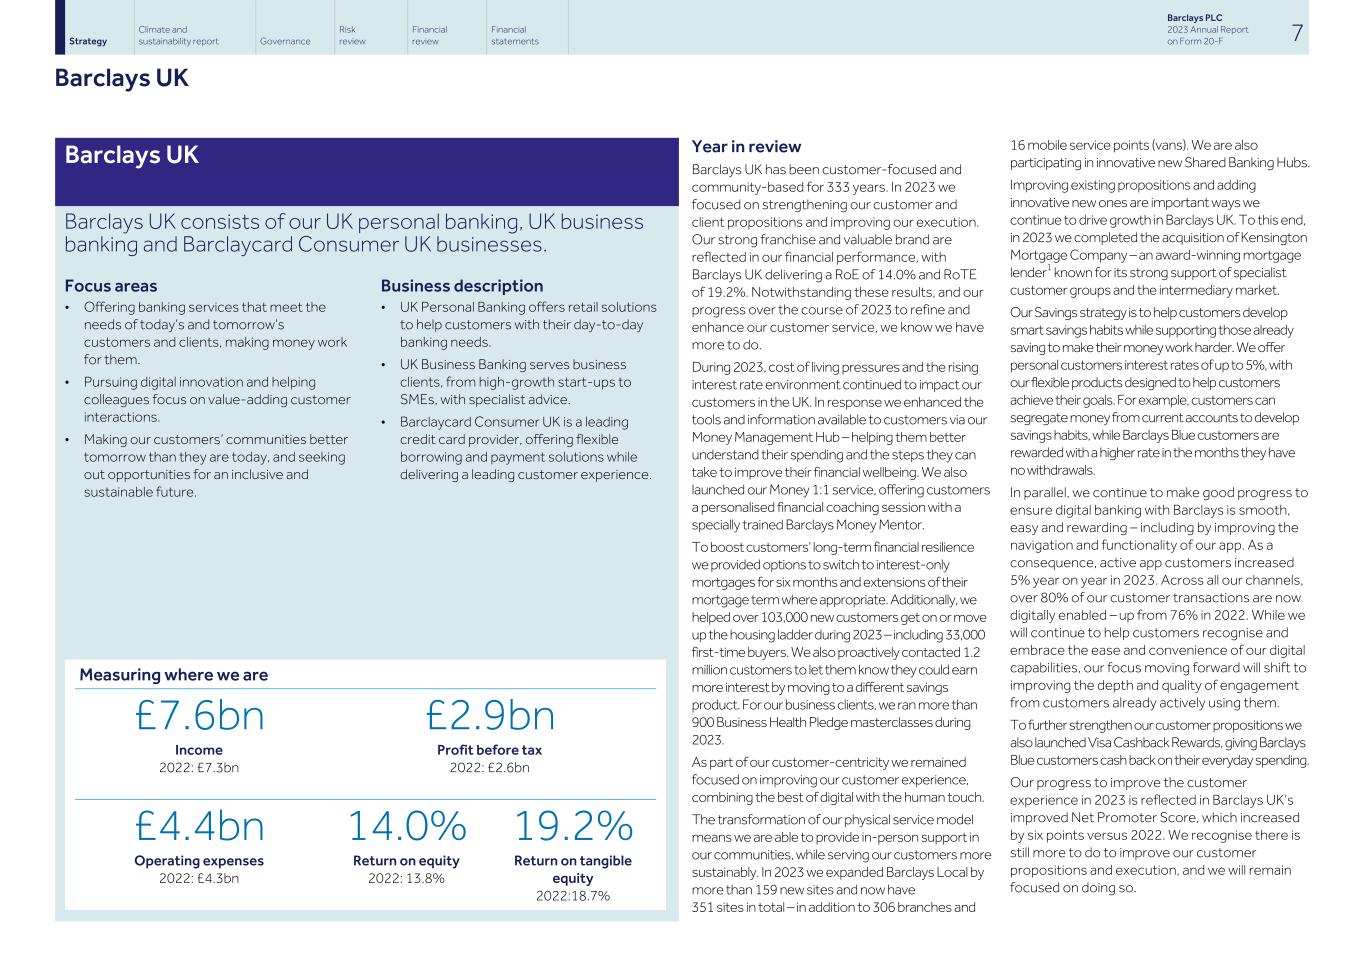
Barclays UK Barclays UK consists of our UK personal banking, UK business banking and Barclaycard Consumer UK businesses. Focus areas • Offering banking services that meet the needs of today’s and tomorrow’s customers and clients, making money work for them. • Pursuing digital innovation and helping colleagues focus on value-adding customer interactions. • Making our customers’ communities better tomorrow than they are today, and seeking out opportunities for an inclusive and sustainable future. Business description • UK Personal Banking offers retail solutions to help customers with their day-to-day banking needs. • UK Business Banking serves business clients, from high-growth start-ups to SMEs, with specialist advice. • Barclaycard Consumer UK is a leading credit card provider, offering flexible borrowing and payment solutions while delivering a leading customer experience. Year in review Barclays UK has been customer-focused and community-based for 333 years. In 2023 we focused on strengthening our customer and client propositions and improving our execution. Our strong franchise and valuable brand are reflected in our financial performance, with Barclays UK delivering a RoE of 14.0% and RoTE of 19.2%. Notwithstanding these results, and our progress over the course of 2023 to refine and enhance our customer service, we know we have more to do. During 2023, cost of living pressures and the rising interest rate environment continued to impact our customers in the UK. In response we enhanced the tools and information available to customers via our Money Management Hub – helping them better understand their spending and the steps they can take to improve their financial wellbeing. We also launched our Money 1:1 service, offering customers a personalised financial coaching session with a specially trained Barclays Money Mentor. To boost customers’ long-term financial resilience we provided options to switch to interest-only mortgages for six months and extensions of their mortgage term where appropriate. Additionally, we helped over 103,000 new customers get on or move up the housing ladder during 2023 – including 33,000 first-time buyers. We also proactively contacted 1.2 million customers to let them know they could earn more interest by moving to a different savings product. For our business clients, we ran more than 900 Business Health Pledge masterclasses during 2023. As part of our customer-centricity we remained focused on improving our customer experience, combining the best of digital with the human touch. The transformation of our physical service model means we are able to provide in-person support in our communities, while serving our customers more sustainably. In 2023 we expanded Barclays Local by more than 159 new sites and now have 351 sites in total – in addition to 306 branches and 16 mobile service points (vans). We are also participating in innovative new Shared Banking Hubs. Improving existing propositions and adding innovative new ones are important ways we continue to drive growth in Barclays UK. To this end, in 2023 we completed the acquisition of Kensington Mortgage Company – an award-winning mortgage lender1 known for its strong support of specialist customer groups and the intermediary market. Our Savings strategy is to help customers develop smart savings habits while supporting those already saving to make their money work harder. We offer personal customers interest rates of up to 5%, with our flexible products designed to help customers achieve their goals. For example, customers can segregate money from current accounts to develop savings habits, while Barclays Blue customers are rewarded with a higher rate in the months they have no withdrawals. In parallel, we continue to make good progress to ensure digital banking with Barclays is smooth, easy and rewarding – including by improving the navigation and functionality of our app. As a consequence, active app customers increased 5% year on year in 2023. Across all our channels, over 80% of our customer transactions are now digitally enabled – up from 76% in 2022. While we will continue to help customers recognise and embrace the ease and convenience of our digital capabilities, our focus moving forward will shift to improving the depth and quality of engagement from customers already actively using them. To further strengthen our customer propositions we also launched Visa Cashback Rewards, giving Barclays Blue customers cash back on their everyday spending. Our progress to improve the customer experience in 2023 is reflected in Barclays UK’s improved Net Promoter Score, which increased by six points versus 2022. We recognise there is still more to do to improve our customer propositions and execution, and we will remain focused on doing so. Strategy Climate and sustainability report Governance Risk review Financial review Financial statements Barclays PLC 2023 Annual Report on Form 20-F 7 Barclays UK Measuring where we are £7.6bn Income 2022: £7.3bn £2.9bn Profit before tax 2022: £2.6bn £4.4bn Operating expenses 2022: £4.3bn 14.0% Return on equity 2022: 13.8% 19.2% Return on tangible equity 2022:18.7%
Our focus on making communities better tomorrow than they are today is reflected in our growing network of Barclays Eagle Labs. Our 37 business incubators across the UK – which include nine new locations added in 2023 – are part of our ambition to be a bank where entrepreneurs start, scale and achieve their growth ambitions. In 2023 Eagle Labs supported over 4,500 businesses, while Barclays UK more broadly supported over 47,000 new start-up or scale-up customers – including Climate Tech start-ups working on innovative technology to deliver a more sustainable future. We were also entrusted by the UK Government with a £12m Digital Growth Grant to further support the growth of UK tech start-ups and scale-ups over the next two years. The Grant will help deliver 20 national programmes and more than 8,000 business interventions, including our Sustainability Bridge programme, to enable ambitious entrepreneurs. Another key way we support customers is through our focus on sustainability. This year we expanded and improved sustainability-related propositions for customers, including a new Green Barclayloan for Business that offers no arrangement fees for lending above £25,000 on a range of green assets – supporting our business customers in their transition to net zero. We also expanded our existing Asset Finance proposition via our partner Propel2, offering business customers fixed rates on a wider range of green assets, including new fully electric vehicles and solar photovoltaic panels. Additionally, we extended our Greener Home Reward scheme, which offers a cash reward of up to £2,000 for eligible residential mortgage customers who install eligible energy- efficiency-related measures in their homes.3 Note: 1 In 2023 Kensington Mortgage Company won 'Best Specialist Mortgage Lender' at both the What Mortgage and Your Mortgage Awards. It was also named 'Best Intermediary Lender' at the Personal Finance Awards and 'Best Online Mortgage Provider' at the Moneyfacts Awards. 2 Further detail can be found at barclays.co.uk/business-banking/borrow/ asset-finance/ 3 Further detail can be found at barclays.co.uk/mortgages/greener-home- reward/ Strategy Climate and sustainability report Governance Risk review Financial review Financial statements Barclays PLC 2023 Annual Report on Form 20-F 8 Barclays UK (continued)
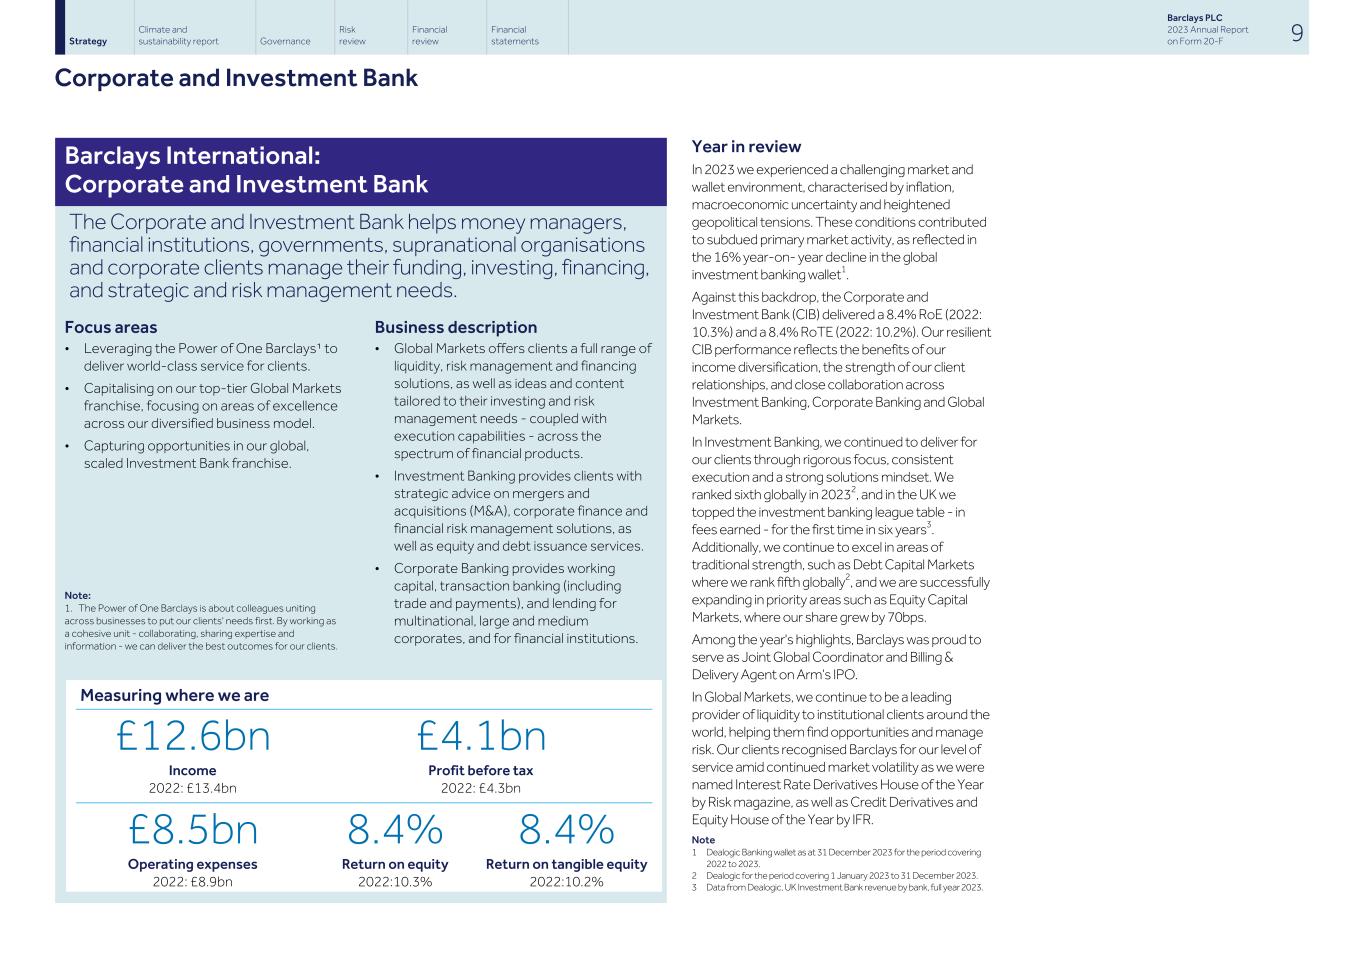
Barclays International: Corporate and Investment Bank The Corporate and Investment Bank helps money managers, financial institutions, governments, supranational organisations and corporate clients manage their funding, investing, financing, and strategic and risk management needs. Focus areas • Leveraging the Power of One Barclays¹ to deliver world-class service for clients. • Capitalising on our top-tier Global Markets franchise, focusing on areas of excellence across our diversified business model. • Capturing opportunities in our global, scaled Investment Bank franchise. Note: 1. The Power of One Barclays is about colleagues uniting across businesses to put our clients' needs first. By working as a cohesive unit - collaborating, sharing expertise and information - we can deliver the best outcomes for our clients. Business description • Global Markets offers clients a full range of liquidity, risk management and financing solutions, as well as ideas and content tailored to their investing and risk management needs - coupled with execution capabilities - across the spectrum of financial products. • Investment Banking provides clients with strategic advice on mergers and acquisitions (M&A), corporate finance and financial risk management solutions, as well as equity and debt issuance services. • Corporate Banking provides working capital, transaction banking (including trade and payments), and lending for multinational, large and medium corporates, and for financial institutions. Year in review In 2023 we experienced a challenging market and wallet environment, characterised by inflation, macroeconomic uncertainty and heightened geopolitical tensions. These conditions contributed to subdued primary market activity, as reflected in the 16% year-on- year decline in the global investment banking wallet1. Against this backdrop, the Corporate and Investment Bank (CIB) delivered a 8.4% RoE (2022: 10.3%) and a 8.4% RoTE (2022: 10.2%). Our resilient CIB performance reflects the benefits of our income diversification, the strength of our client relationships, and close collaboration across Investment Banking, Corporate Banking and Global Markets. In Investment Banking, we continued to deliver for our clients through rigorous focus, consistent execution and a strong solutions mindset. We ranked sixth globally in 20232, and in the UK we topped the investment banking league table - in fees earned - for the first time in six years3. Additionally, we continue to excel in areas of traditional strength, such as Debt Capital Markets where we rank fifth globally2, and we are successfully expanding in priority areas such as Equity Capital Markets, where our share grew by 70bps. Among the year's highlights, Barclays was proud to serve as Joint Global Coordinator and Billing & Delivery Agent on Arm’s IPO. In Global Markets, we continue to be a leading provider of liquidity to institutional clients around the world, helping them find opportunities and manage risk. Our clients recognised Barclays for our level of service amid continued market volatility as we were named Interest Rate Derivatives House of the Year by Risk magazine, as well as Credit Derivatives and Equity House of the Year by IFR. Note 1 Dealogic Banking wallet as at 31 December 2023 for the period covering 2022 to 2023. 2 Dealogic for the period covering 1 January 2023 to 31 December 2023. 3 Data from Dealogic, UK Investment Bank revenue by bank, full year 2023. Strategy Climate and sustainability report Governance Risk review Financial review Financial statements Barclays PLC 2023 Annual Report on Form 20-F 9 Corporate and Investment Bank Measuring where we are £12.6bn Income 2022: £13.4bn £4.1bn Profit before tax 2022: £4.3bn £8.5bn Operating expenses 2022: £8.9bn 8.4% Return on equity 2022:10.3% 8.4% Return on tangible equity 2022:10.2%
We continued to grow share of wallet with our Global Markets top 100 clients. Income from our top 100 clients is up 5% year on year, despite lower client activity in markets across the industry. Additionally, client market share data for the first half of 2023 indicates our Global Markets business now ranks fifth globally (up from sixth) with institutional clients1. Our focus remains on delivering sustainable through-the-cycle returns and we have the breadth of capabilities across Fixed Income and Equities, combined with a top tier Financing business, to deliver on this. We continued to make progress against some of our key strategic initiatives, which offset compressed financing spreads and a weaker environment for intermediation. In parallel, we continued to grow our financing capabilities to deliver more stable, higher returning income. Over the past five years our ranking in Prime Services has moved up from 7 rank to joint 5 rank, complementing our existing strength in Fixed Income Financing where we ranked joint 1 for 20232. Our Research team provides industry-leading analysis and investment advice for our institutional clients. For the second year in a row, Barclays ranked Top 3 for Fixed Income Research3 in Institutional Investor Research 2023 rankings - and Top 5 in European Equity Research3 for the first time - underscoring the value clients and investors place on our differentiated content. The CIB continues to play a fundamental role in Barclays’ commitment to invest in the transition to a low-carbon economy. This includes delivery towards the Group target to facilitate $1tn of Sustainable and Transition Financing by the end of 2030, providing green, sustainable and transition products and services that will support our clients and the global economy to accelerate the transition to net zero. In addition, we continue to invest thoughtfully in our talent to meet client demands and deliver the best service. In early 2024 we announced the formation of a new Energy Transition Group to support our ambition to be a leading adviser and financier to clients as they transition to a low- carbon future. In Corporate Banking, revenues grew off the back of elevated deposits income which continued to benefit from a strong net interest margin, and increased deposit balances from clients. We continued to make progress expanding our international capabilities, building out our Corporate Banking businesses in the US and Europe, alongside strengthening our digital capabilities globally to provide our clients with seamless access to our transaction banking product set. Note: 1 Based on Barclays analysis using internal and external sources. 2 Coalition Greenwich Competitor Analytics, 1H23 Global Results. Analysis based on the following banks: Barclays, BoA, BNP, CITI, CS, DB, GS, JPM, MS and UBS. Analysis is based on Barclays' internal revenue numbers and business structure. 3 institutionalinvestor.com/section/research. Strategy Climate and sustainability report Governance Risk review Financial review Financial statements Barclays PLC 2023 Annual Report on Form 20-F 10 Corporate and Investment Bank (continued)
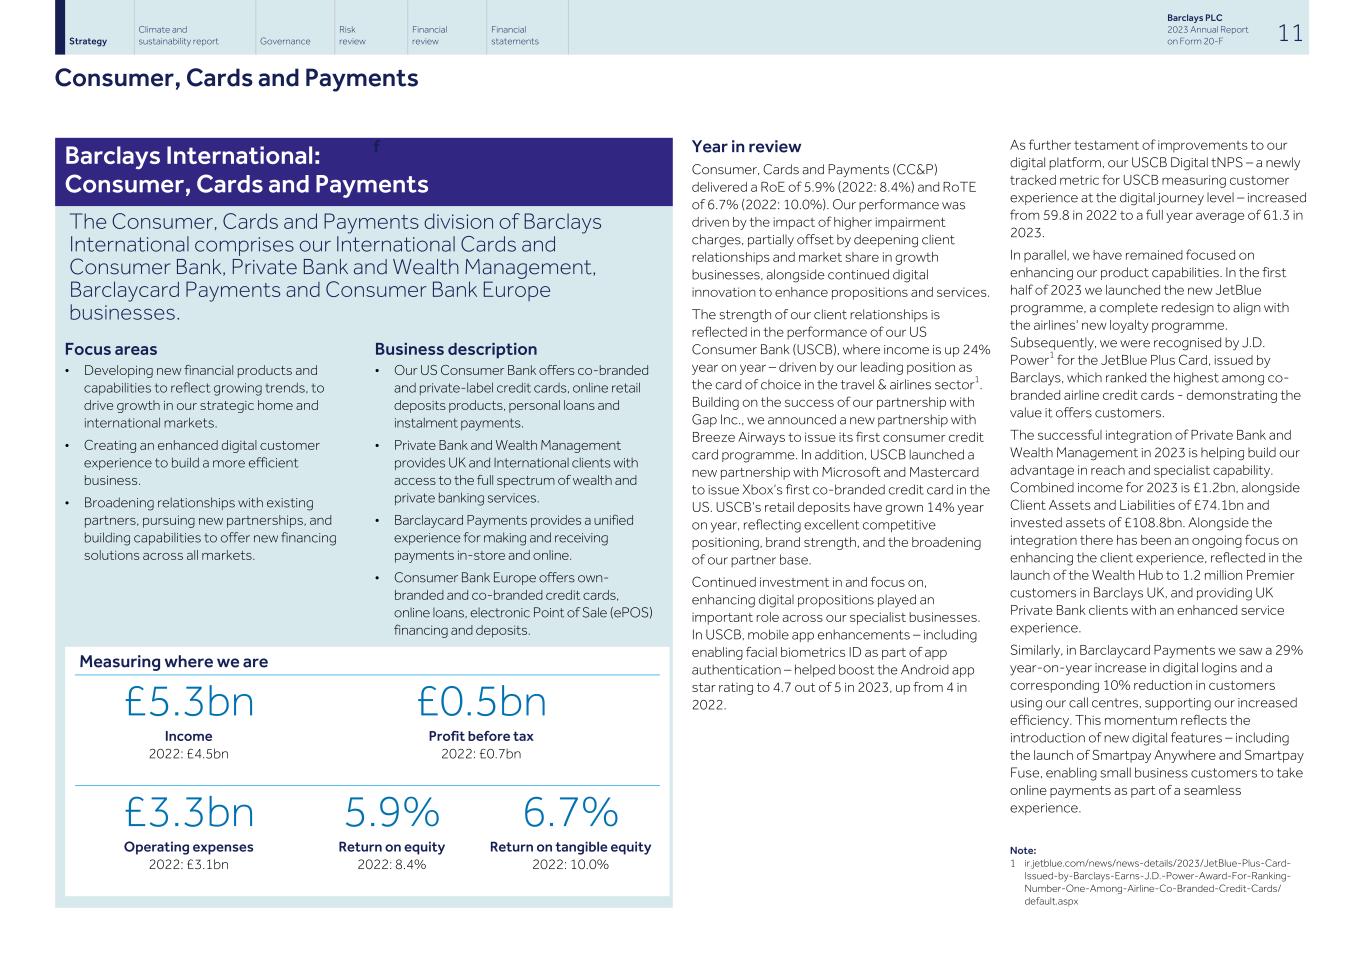
Barclays International: Consumer, Cards and Payments The Consumer, Cards and Payments division of Barclays International comprises our International Cards and Consumer Bank, Private Bank and Wealth Management, Barclaycard Payments and Consumer Bank Europe businesses. Focus areas • Developing new financial products and capabilities to reflect growing trends, to drive growth in our strategic home and international markets. • Creating an enhanced digital customer experience to build a more efficient business. • Broadening relationships with existing partners, pursuing new partnerships, and building capabilities to offer new financing solutions across all markets. Business description • Our US Consumer Bank offers co-branded and private-label credit cards, online retail deposits products, personal loans and instalment payments. • Private Bank and Wealth Management provides UK and International clients with access to the full spectrum of wealth and private banking services. • Barclaycard Payments provides a unified experience for making and receiving payments in-store and online. • Consumer Bank Europe offers own- branded and co-branded credit cards, online loans, electronic Point of Sale (ePOS) financing and deposits. f Year in review Consumer, Cards and Payments (CC&P) delivered a RoE of 5.9% (2022: 8.4%) and RoTE of 6.7% (2022: 10.0%). Our performance was driven by the impact of higher impairment charges, partially offset by deepening client relationships and market share in growth businesses, alongside continued digital innovation to enhance propositions and services. The strength of our client relationships is reflected in the performance of our US Consumer Bank (USCB), where income is up 24% year on year – driven by our leading position as the card of choice in the travel & airlines sector1. Building on the success of our partnership with Gap Inc., we announced a new partnership with Breeze Airways to issue its first consumer credit card programme. In addition, USCB launched a new partnership with Microsoft and Mastercard to issue Xbox’s first co-branded credit card in the US. USCB’s retail deposits have grown 14% year on year, reflecting excellent competitive positioning, brand strength, and the broadening of our partner base. Continued investment in and focus on, enhancing digital propositions played an important role across our specialist businesses. In USCB, mobile app enhancements – including enabling facial biometrics ID as part of app authentication – helped boost the Android app star rating to 4.7 out of 5 in 2023, up from 4 in 2022. As further testament of improvements to our digital platform, our USCB Digital tNPS – a newly tracked metric for USCB measuring customer experience at the digital journey level – increased from 59.8 in 2022 to a full year average of 61.3 in 2023. In parallel, we have remained focused on enhancing our product capabilities. In the first half of 2023 we launched the new JetBlue programme, a complete redesign to align with the airlines' new loyalty programme. Subsequently, we were recognised by J.D. Power1 for the JetBlue Plus Card, issued by Barclays, which ranked the highest among co- branded airline credit cards - demonstrating the value it offers customers. The successful integration of Private Bank and Wealth Management in 2023 is helping build our advantage in reach and specialist capability. Combined income for 2023 is £1.2bn, alongside Client Assets and Liabilities of £74.1bn and invested assets of £108.8bn. Alongside the integration there has been an ongoing focus on enhancing the client experience, reflected in the launch of the Wealth Hub to 1.2 million Premier customers in Barclays UK, and providing UK Private Bank clients with an enhanced service experience. Similarly, in Barclaycard Payments we saw a 29% year-on-year increase in digital logins and a corresponding 10% reduction in customers using our call centres, supporting our increased efficiency. This momentum reflects the introduction of new digital features – including the launch of Smartpay Anywhere and Smartpay Fuse, enabling small business customers to take online payments as part of a seamless experience. Note: 1 ir.jetblue.com/news/news-details/2023/JetBlue-Plus-Card- Issued-by-Barclays-Earns-J.D.-Power-Award-For-Ranking- Number-One-Among-Airline-Co-Branded-Credit-Cards/ default.aspx Strategy Climate and sustainability report Governance Risk review Financial review Financial statements Barclays PLC 2023 Annual Report on Form 20-F 11 Consumer, Cards and Payments Measuring where we are £5.3bn Income 2022: £4.5bn £0.5bn Profit before tax 2022: £0.7bn £3.3bn Operating expenses 2022: £3.1bn 5.9% Return on equity 2022: 8.4% 6.7% Return on tangible equity 2022: 10.0%

We continued to build our client portfolio, signing new business deals in 2023 with prominent brands including department store Fenwick and plumbing and heating specialist Wolseley. Barclaycard Payments and Barclays Corporate Banking were chosen by Fenwick to provide a range of banking and payment services to support the growth and digitisation of the business – testament to the breadth of our business services, collaboration, and digital capabilities. Consumer Bank Europe delivered a strong performance, growing its deposit book 206% year on year, driven by our continued focus on enhancing the customer experience. We launched the in-app call facility to significantly improve the efficiency and speed of customer service. We also continued to be a leading provider of consumer finance through our credit cards and personal loans business. Strategy Climate and sustainability report Governance Risk review Financial review Financial statements Barclays PLC 2023 Annual Report on Form 20-F 12 Consumer, Cards and Payments (continued)
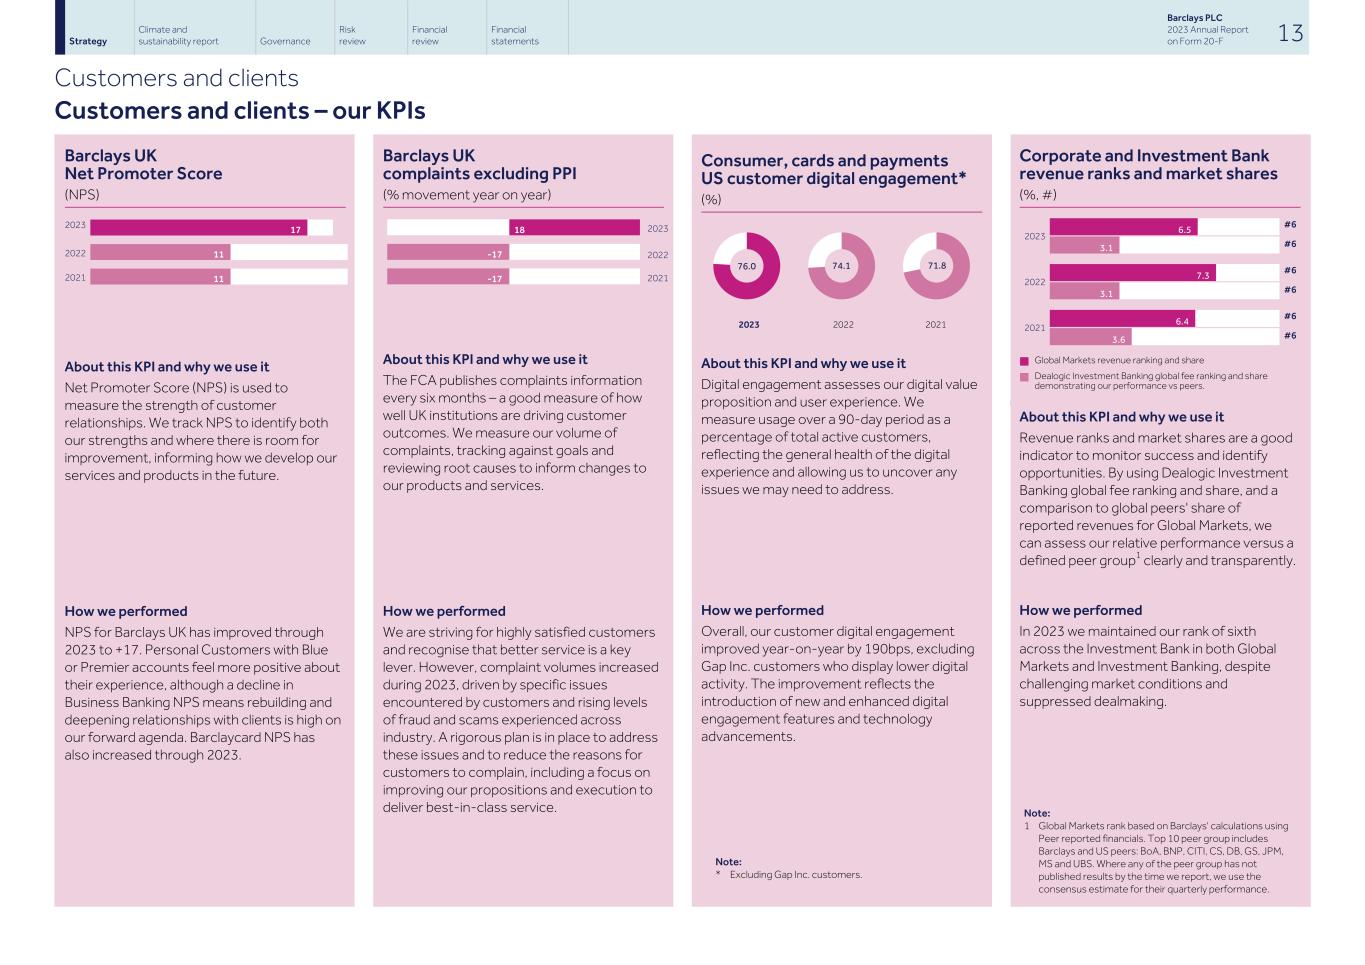
Barclays UK Net Promoter Score (NPS) 2023 2022 2021 17 11 11 2 9 9 About this KPI and why we use it Net Promoter Score (NPS) is used to measure the strength of customer relationships. We track NPS to identify both our strengths and where there is room for improvement, informing how we develop our services and products in the future. How we performed NPS for Barclays UK has improved through 2023 to +17. Personal Customers with Blue or Premier accounts feel more positive about their experience, although a decline in Business Banking NPS means rebuilding and deepening relationships with clients is high on our forward agenda. Barclaycard NPS has also increased through 2023. Barclays UK complaints excluding PPI (% movement year on year) 18 -17 -17 2023 2022 2021 About this KPI and why we use it The FCA publishes complaints information every six months – a good measure of how well UK institutions are driving customer outcomes. We measure our volume of complaints, tracking against goals and reviewing root causes to inform changes to our products and services. How we performed We are striving for highly satisfied customers and recognise that better service is a key lever. However, complaint volumes increased during 2023, driven by specific issues encountered by customers and rising levels of fraud and scams experienced across industry. A rigorous plan is in place to address these issues and to reduce the reasons for customers to complain, including a focus on improving our propositions and execution to deliver best-in-class service. Consumer, cards and payments US customer digital engagement* (%) 76.0 74.1 71.8 2023 2022 2021 About this KPI and why we use it Digital engagement assesses our digital value proposition and user experience. We measure usage over a 90-day period as a percentage of total active customers, reflecting the general health of the digital experience and allowing us to uncover any issues we may need to address. How we performed Overall, our customer digital engagement improved year-on-year by 190bps, excluding Gap Inc. customers who display lower digital activity. The improvement reflects the introduction of new and enhanced digital engagement features and technology advancements. Note: * Excluding Gap Inc. customers. Corporate and Investment Bank revenue ranks and market shares (%, #) 2023 6.5 3.1 #6 #6 2022 7.3 3.1 2.7 6.9 #6 #6 2021 6.4 3.6 3.6 6.4 #6 #6 n Global Markets revenue ranking and share n Dealogic Investment Banking global fee ranking and share demonstrating our performance vs peers. About this KPI and why we use it Revenue ranks and market shares are a good indicator to monitor success and identify opportunities. By using Dealogic Investment Banking global fee ranking and share, and a comparison to global peers' share of reported revenues for Global Markets, we can assess our relative performance versus a defined peer group1 clearly and transparently. How we performed In 2023 we maintained our rank of sixth across the Investment Bank in both Global Markets and Investment Banking, despite challenging market conditions and suppressed dealmaking. Note: 1 Global Markets rank based on Barclays' calculations using Peer reported financials. Top 10 peer group includes Barclays and US peers: BoA, BNP, CITI, CS, DB, GS, JPM, MS and UBS. Where any of the peer group has not published results by the time we report, we use the consensus estimate for their quarterly performance. Strategy Climate and sustainability report Governance Risk review Financial review Financial statements Barclays PLC 2023 Annual Report on Form 20-F 13 Customers and clients Customers and clients – our KPIs

Colleagues Our colleagues are connected by a shared Purpose, Values and Mindset, and commitment to delivering to a consistently excellent standard. We strive to make Barclays a great place to work, empower colleagues to attain sustainable high performance and deliver strong results for stakeholders Where to find out more: Engaging with colleagues Barclays has a diverse talent pool of around 90,000 colleagues across the world. We engage in regular dialogue with our colleagues to understand what is working well and where there are opportunities to improve. This includes townhalls, skip-level meetings, site visits, leader- led engagement and surveys. We maintain an engagement approach in line with the UK's Financial Reporting Council (FRC) governance recommendations. Our regular all-colleague Your View surveys give individuals the opportunity to share their views on how they find working at Barclays. This year’s survey generally shows improvement to our scores: Engagement increased +2ppt to 86%, alongside our highest scores to date for Wellbeing (88%) and Inclusion (83%). In addition, our broader Continuous Listening Strategy includes pulse surveys deployed throughout the employee lifecycle, capturing insights that help us improve the colleague experience. Maintaining a strong and effective partnership with Unite1, national works councils and the Barclays Group European Forum helps us gather feedback. We continue to consult with colleague representatives on major change programmes impacting our people, to minimise compulsory job losses and focus on reskilling and redeployment. Achieving a consistently excellent standard As our CEO discusses in his letter, Barclays continues to focus on delivering to a higher operating standard via our Group-wide cultural change programme, Consistently Excellent. This programme challenges colleagues to address five key areas – Precision, Service, Focus, Efficiency and Diversity of thought – to establish a new operating standard. This higher standard is becoming part of our culture and we are working hard to equip everyone with the right skills to achieve this, while rewarding progress. We have incorporated it into our existing Values and Mindset behaviours and as part of an enhanced set of leadership behaviours. We also began updating our key processes for attracting, retaining and developing talent, planning for succession, and recognising and rewarding performance. To help create a common understanding across the Group, we led Consistently Excellent workshops throughout 2023 for our senior leaders. In 2024, all colleagues will be invited to attend these workshops. Progress in embedding this new operating standard with colleagues is reflected in the results from our Autumn 2023 Your View survey. 89% of colleagues felt their peers “have a good understanding of what it means to be a consistently excellent organisation”. Further, 62% (+2ppt) of colleagues said it was “simple and straightforward to get things done at Barclays”, a concept in line with one of our key Consistently Excellent focus areas, although this result shows there is still more to be done in making Barclays more efficient. Investing in our talent Our talent ambition underpins Barclays’ approach to talent attraction, retention and development. We relaunched our ambition in 2023 to focus on the skills and capabilities we require for the future, and set the benchmark for what it means to lead at Barclays through our refreshed leadership framework. Together, these set clear behavioural expectations for our leaders, and enable our leaders to create the right culture for colleagues to deliver to a consistently excellent standard. Using this framework we aim to empower Barclays leaders to create an environment of psychological safety and inclusion, and to foster a culture of learning and curiosity where colleagues can thrive – supporting all colleagues across Barclays to grow and progress their careers. Strategy Climate and sustainability report Governance Risk review Financial review Financial statements Barclays PLC 2023 Annual Report on Form 20-F 14 Colleagues + For more information on our commitment to building a diverse, equitable and inclusive workplace, see: home.barclays/who-we- are/our-strategy/diversity-and-inclusion/ For additional colleague KPIs please visit our ESG resource hub at https://home.barclays/sustainability/esg-resource-hub/ reporting-and-disclosures/

To empower our colleagues to attain sustainable high performance, we continued to deliver our flagship leadership development programmes: the Enterprise Leaders’ Summit, our Strategic Leaders Programme, and our award-winning Aspire programme. With our Diversity, Equity and Inclusion (DEI) agenda in mind, we continue to attract candidates who possess the capabilities, critical skills and experience required to provide exceptional service to our customers and clients. In 2023, our graduate intake was over 36% female, while our undergraduate Discovery Diversity Programme focused on showcasing successful career paths for underrepresented minorities. These hiring programmes have helped drive applications from a diverse pool of candidates. To further promote social mobility, we will continue our extensive apprentice hiring programme through engagement with educational institutions. Delivering on our Diversity, Equity and Inclusion plans and ambitions At the end of 2023, 5.1% of UK and 21% of US colleagues were from underrepresented ethnicities, surpassing our ambitions two years early. We are now resetting this ambition to achieve a further 12.5% and 5% respective increase in the UK and the US by the end of 2025. To hold ourselves accountable at a senior level we have set a new ambition to increase the number of Managing Directors from underrepresented ethnicities by 50% – to 84 in the UK and US combined by the end of 2025. At the end of 2023 this was 55. We are also progressing towards our ambition of 33% representation of women in senior leadership roles (Managing Directors and Directors) by the end of 2025. At the end of 2023 this was 30%. Maintaining our focus on wellbeing In our Autumn 2023 Your View survey the Wellbeing Index score rose to 88% favourable (+2ppt year on year), demonstrating our maintained focus on wellbeing. We remain committed to supporting colleague wellbeing using data-driven insights and engagement through leader-led initiatives such as the 'Healthy to Talk' campaign on World Mental Health Day. This is supplemented by dedicated people leader workshops exploring practical ways to continue to embed wellbeing into ways of working. There are now over 47,500 colleagues registered on our Be Well wellbeing portal – the highest number since its launch – while our mental health awareness eLearning has been completed by 84% of colleagues and 90% of people leaders. Introducing structured hybrid working Following our continuous test and learn approach, Barclays has adapted its ways of working to introduce structured hybrid working – supporting colleagues to connect in-person and plan their work to make the most of both their time in the office and remotely. Building connections is a vital part of our culture. In our Autumn 2023 Your View survey, 76% of colleagues told us that their team’s hybrid approach enables them to deliver the best outcomes for our colleagues, clients and customers. We continue to monitor colleague perceptions and may evolve our hybrid working approach further as we gather insights and learnings. Our people policies Our people policies2 help us recruit the best people, provide equal opportunities and create an inclusive culture in line with our Purpose, Values and Mindset, and in support of our long- term success. They are regularly reviewed and updated to ensure alignment with our broader people strategy. A great place to work We were delighted to receive a number of awards in 2023 in recognition of our efforts, including: • Times Graduate Employer of Choice Award – Finance category • LinkedIn Top UK Employer – for the third consecutive year • Times Top 100 Graduate Employers – Top 10 We are committed to paying our colleagues fairly and appropriately relative to their role, skills, experience and performance. This means our remuneration policies reward performance in line with our Purpose, Values and Mindset, and our consistently excellent standard. We also encourage our colleagues to benefit from Barclays’ performance by enrolling in our employee share ownership plans. Companies Act Diversity Disclosure On a Companies Act 2006 414C basis3 as at 31 December 2023, Barclays employs 98,662 colleagues across the world (54,032 male, 44,219 female, and 411 undisclosed), including 423 senior managers (318 male, 105 female), and 13 Board of Directors at Barclays PLC (8 male, 5 female). + Read more about our commitment to fair pay in the Remuneration report, on pages 119, and in our Fair Pay Report. Notes: 1 The collective bargaining coverage of Unite in the UK represents 80% (2022: 82%) of our UK workforce and 40% (2022: 43%) of our global workforce. 2 Our policies reflect relevant employment law, including the provisions of the Universal Declaration of Human Rights and the International Labour Organization (ILO) Declaration on Fundamental Principles and Rights at Work. 3 Headcount basis, including colleagues on long-term leave. Undisclosed refers to colleagues who do not record their gender in our systems. 'Senior managers' is defined by the Companies Act and is different to both our Senior Managers under the FCA and PRA Senior Managers regime, and a narrower scope than our Director and Managing Director corporate grades. It includes Barclays PLC Group Executive Committee members, their direct reports and directors on the boards of undertakings of the Group, but excludes Directors on the Board of Barclays PLC. Where such persons hold multiple directorships across the Group they are only counted once. Strategy Climate and sustainability report Governance Risk review Financial review Financial statements Barclays PLC 2023 Annual Report on Form 20-F 15 Colleagues (continued)
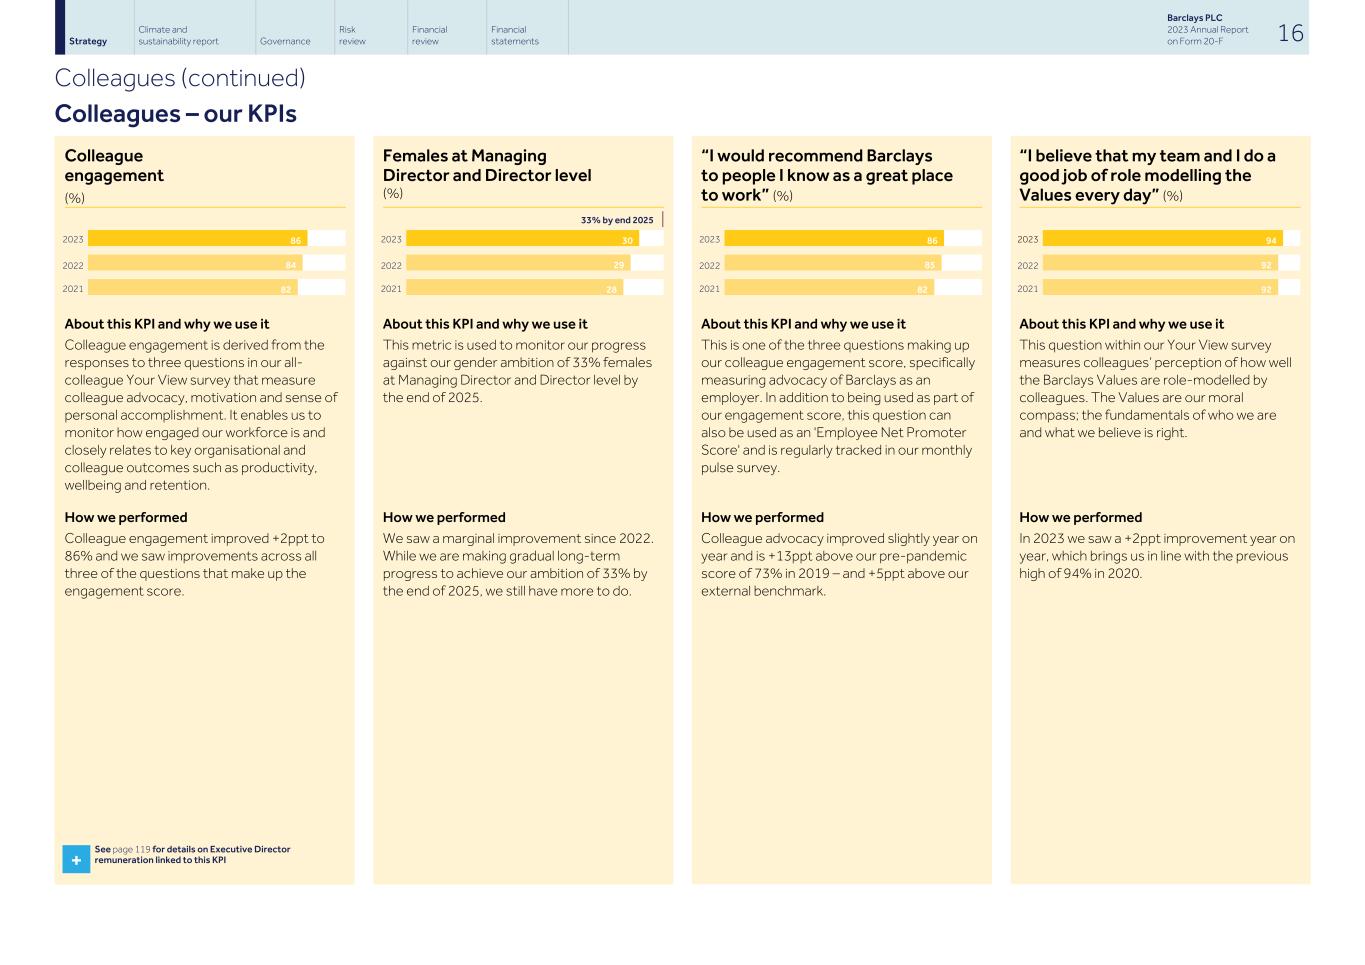
Colleague engagement (%) 2023 2022 2021 86 84 82 About this KPI and why we use it Colleague engagement is derived from the responses to three questions in our all- colleague Your View survey that measure colleague advocacy, motivation and sense of personal accomplishment. It enables us to monitor how engaged our workforce is and closely relates to key organisational and colleague outcomes such as productivity, wellbeing and retention. How we performed Colleague engagement improved +2ppt to 86% and we saw improvements across all three of the questions that make up the engagement score. Females at Managing Director and Director level (%) 2023 2022 2021 30 29 28 About this KPI and why we use it This metric is used to monitor our progress against our gender ambition of 33% females at Managing Director and Director level by the end of 2025. How we performed We saw a marginal improvement since 2022. While we are making gradual long-term progress to achieve our ambition of 33% by the end of 2025, we still have more to do. “I would recommend Barclays to people I know as a great place to work” (%) 2023 2022 2021 86 85 82 About this KPI and why we use it This is one of the three questions making up our colleague engagement score, specifically measuring advocacy of Barclays as an employer. In addition to being used as part of our engagement score, this question can also be used as an 'Employee Net Promoter Score' and is regularly tracked in our monthly pulse survey. How we performed Colleague advocacy improved slightly year on year and is +13ppt above our pre-pandemic score of 73% in 2019 – and +5ppt above our external benchmark. “I believe that my team and I do a good job of role modelling the Values every day” (%) 2023 2022 2021 94 92 92 About this KPI and why we use it This question within our Your View survey measures colleagues’ perception of how well the Barclays Values are role-modelled by colleagues. The Values are our moral compass; the fundamentals of who we are and what we believe is right. How we performed In 2023 we saw a +2ppt improvement year on year, which brings us in line with the previous high of 94% in 2020. Strategy Climate and sustainability report Governance Risk review Financial review Financial statements Barclays PLC 2023 Annual Report on Form 20-F 16 Colleagues (continued) Colleagues – our KPIs + See page 119 for details on Executive Director remuneration linked to this KPI 33% by end 2025
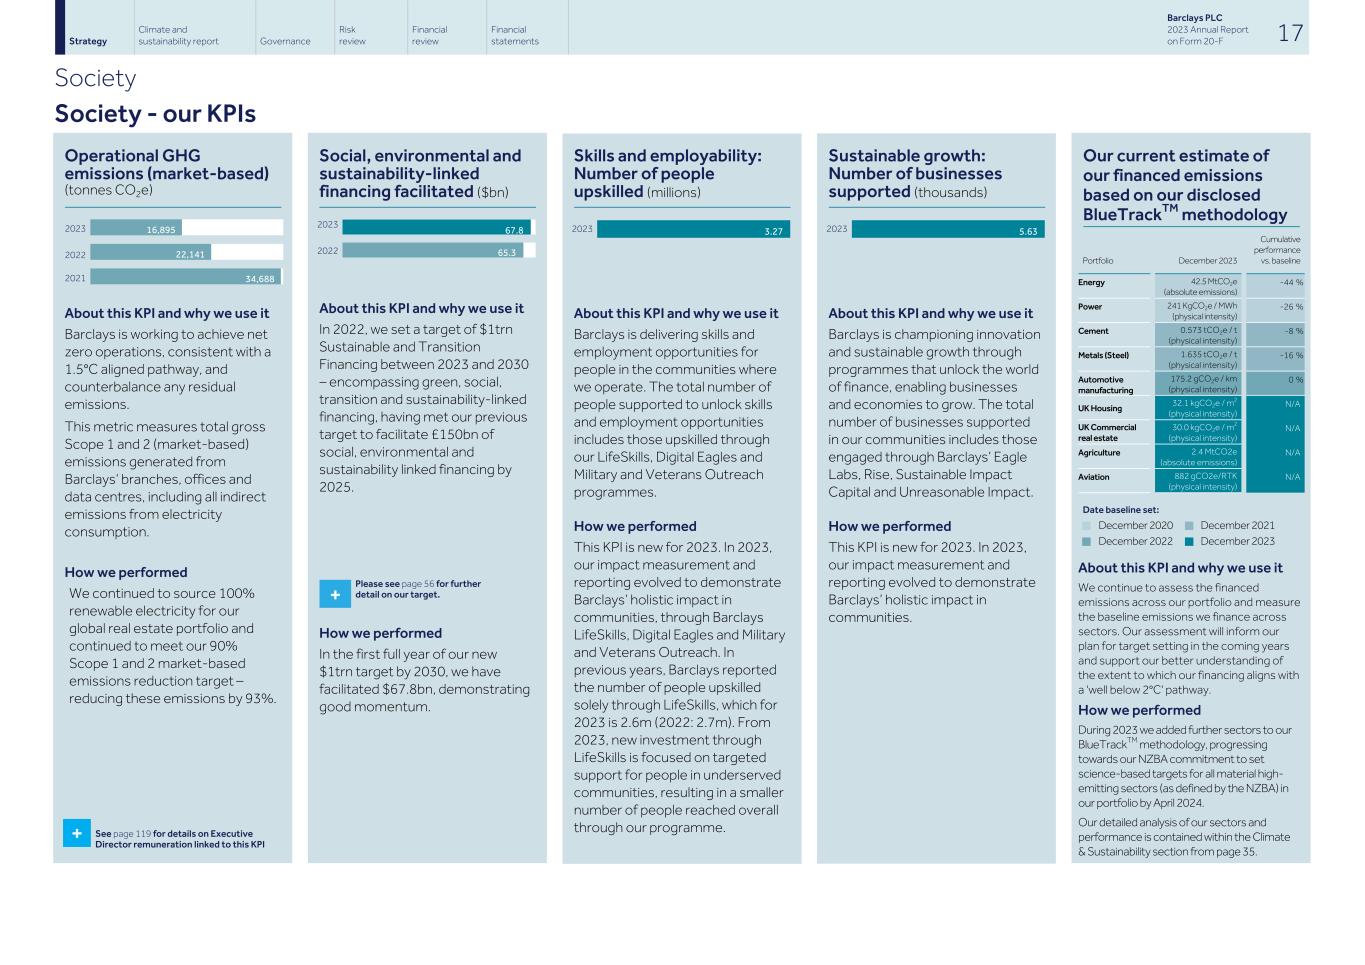
Operational GHG emissions (market-based) (tonnes CO2e) 2023 2022 2021 16,895 22,141 34,688 About this KPI and why we use it Barclays is working to achieve net zero operations, consistent with a 1.5°C aligned pathway, and counterbalance any residual emissions. This metric measures total gross Scope 1 and 2 (market-based) emissions generated from Barclays’ branches, offices and data centres, including all indirect emissions from electricity consumption. How we performed We continued to source 100% renewable electricity for our global real estate portfolio and continued to meet our 90% Scope 1 and 2 market-based emissions reduction target – reducing these emissions by 93%. + See page 119 for details on Executive Director remuneration linked to this KPI Social, environmental and sustainability-linked financing facilitated ($bn) 2023 2022 67.8 65.3 About this KPI and why we use it In 2022, we set a target of $1trn Sustainable and Transition Financing between 2023 and 2030 – encompassing green, social, transition and sustainability-linked financing, having met our previous target to facilitate £150bn of social, environmental and sustainability linked financing by 2025. How we performed In the first full year of our new $1trn target by 2030, we have facilitated $67.8bn, demonstrating good momentum. Skills and employability: Number of people upskilled (millions) 2023 3.27 About this KPI and why we use it Barclays is delivering skills and employment opportunities for people in the communities where we operate. The total number of people supported to unlock skills and employment opportunities includes those upskilled through our LifeSkills, Digital Eagles and Military and Veterans Outreach programmes. How we performed This KPI is new for 2023. In 2023, our impact measurement and reporting evolved to demonstrate Barclays’ holistic impact in communities, through Barclays LifeSkills, Digital Eagles and Military and Veterans Outreach. In previous years, Barclays reported the number of people upskilled solely through LifeSkills, which for 2023 is 2.6m (2022: 2.7m). From 2023, new investment through LifeSkills is focused on targeted support for people in underserved communities, resulting in a smaller number of people reached overall through our programme. Sustainable growth: Number of businesses supported (thousands) 2023 5.63 About this KPI and why we use it Barclays is championing innovation and sustainable growth through programmes that unlock the world of finance, enabling businesses and economies to grow. The total number of businesses supported in our communities includes those engaged through Barclays’ Eagle Labs, Rise, Sustainable Impact Capital and Unreasonable Impact. How we performed This KPI is new for 2023. In 2023, our impact measurement and reporting evolved to demonstrate Barclays’ holistic impact in communities. Our current estimate of our financed emissions based on our disclosed BlueTrackTM methodology Portfolio December 2023 Cumulative performance vs. baseline Energy 42.5 MtCO2e (absolute emissions) -44 % Power 241 KgCO2e / MWh (physical intensity) -26 % Cement 0.573 tCO2e / t (physical intensity) -8 % Metals (Steel) 1.635 tCO2e / t (physical intensity) -16 % Automotive manufacturing 175.2 gCO2e / km (physical intensity) 0 % UK Housing 32.1 kgCO2e / m2 (physical intensity) N/A UK Commercial real estate 30.0 kgCO2e / m2 (physical intensity) N/A Agriculture 2.4 MtCO2e (absolute emissions) N/A Aviation 882 gCO2e/RTK (physical intensity) N/A Date baseline set: n December 2020 n December 2021 n December 2022 n December 2023 About this KPI and why we use it We continue to assess the financed emissions across our portfolio and measure the baseline emissions we finance across sectors. Our assessment will inform our plan for target setting in the coming years and support our better understanding of the extent to which our financing aligns with a 'well below 2°C' pathway. How we performed During 2023 we added further sectors to our BlueTrackTM methodology, progressing towards our NZBA commitment to set science-based targets for all material high- emitting sectors (as defined by the NZBA) in our portfolio by April 2024. Our detailed analysis of our sectors and performance is contained within the Climate & Sustainability section from page 35. Strategy Climate and sustainability report Governance Risk review Financial review Financial statements Barclays PLC 2023 Annual Report on Form 20-F 17 Society Society - our KPIs + Please see page 56 for further detail on our target.
A strategy for a better financial future Our climate strategy is driven by consideration of relevant risks and opportunities and in alignment with our Purpose: working together for a better financial future for our customers, clients and communities. Barclays’ climate strategy 1 2 3 Achieving net zero operations Reducing our financed emissions Financing the transition Barclays is working to reduce its Scope 1, Scope 2 and Scope 3 operational emissions consistent with a 1.5°C aligned pathway, and counterbalance any residual emissions. Barclays is committed to aligning its financing with the goals and timelines of the Paris Agreement, consistent with limiting the increase in global temperatures to 1.5°C. Barclays is helping to provide the green and sustainable finance required to transform the economies, customers and clients we serve. Our strategy is underpinned by the way we assess and manage our exposure to climate-related risk We have a clear shareholder endorsed climate strategy to achieve our ambition of being a net zero bank by 2050 by achieving net zero operations, reducing our financed emissions and financing the transition. We are committed to achieving net zero operations and have continued to make progress, achieving a 51% reduction of Scope 1 and 2 location-based greenhouse gas emissions milestone ahead of schedule. We continued to source 100% renewable electricity for our global real estate portfolio and met our 90% Scope 1 and 2 market-based emissions reduction target – reducing these emissions by 93%. We are also committed to reducing our financed emissions, those deriving from the activities of the clients that we finance and those generated in their respective value chains, by providing financial advice and support as they transition to a low-carbon economy. We have now set 2030 emissions reduction targets for eight of the highest-emitting sectors in our portfolio: Energy, Power, Cement, Steel, Automotive manufacturing, Aviation, Agriculture and Commercial Real Estate; and have assessed the baseline and convergence point for our UK Housing portfolio. This meets our commitment under the NZBA to set targets for material high- emitting sectors in our portfolio. Our 2030 target-setting includes the integration of 1.5oC aligned scenarios, such as the IEA Net Zero 2050 scenario, in our financed emission targets, and includes ranges for certain sectors to reflect dependencies outside our control that will determine how quickly our financed emissions can be reduced in these sectors. This year, we have further extended the scope of our calculations to cover the full in-scope balance sheet financed emissions, largely aligned to the PCAF Standard. We used our methodology for measuring our financed emissions and tracking them at a portfolio level against the goals and timelines of the Paris Agreement – this methodology is called BlueTrack™. Capital is critical for a successful energy transition and we are focusing our financing to those clients actively engaged in the energy transition. The scale of our business gives us the opportunity to help finance the energy transition – to use our global reach, products, expertise and position in the global economy to work with our clients, including those in the Energy sector, as they transition to a low-carbon business model. To reduce reliance on fossil fuels the world needs to accelerate and scale the supply and capacity of renewables and climate tech solutions that will help to decarbonise high-emitting activities. The Climate Policy Initiative estimates that this requires at least $4.3trillion of climate finance a year by 20301. Note: 1 Climate Policy Initiative - Global Landscape of Climate Finance: A Decade in Data https://www.climatepolicyinitiative.org/wp- content/uploads/2022/10/Global-Landscape-of-Climate- Finance-A-Decade-of-Data.pdf Strategy Climate and sustainability report Governance Risk review Financial review Financial statements Barclays PLC 2023 Annual Report on Form 20-F 18 Barclays’ climate strategy
Barclays is committed to help finance the energy transition. In 2022 we set a target to facilitate $1trn of Sustainable and Transition Financing between 2023 and the end of 2030. During 2023, we facilitated $67.8bn of sustainable and transition financing. $67.4bn was sustainable financing and $0.4bn was transition financing that qualified against our new Transition Finance Framework. We are also focused on investing and scaling the climate tech – hydrogen, carbon capture, batteries, amongst others – needed by society and our clients to transition, generate economic growth and create a new wave of green jobs. To support this, we have a mandate to invest up to £500m of Barclays’ own capital by the end of 2027 and we have invested £138m into 21 innovative companies to date. An important lever for reducing our financed emissions is our policy. In February 2024, we updated our Climate Change Statement with new restrictions on financing upstream oil and gas, including unconventional oil and gas and additional Enhanced Due Diligence (EDD) requirements for biomass. Fossil fuels are still required for many essential activities – including electricity generation, transport and heating. In the International Energy Agency NZE scenario, new long lead time upstream oil and gas projects are not required on a 1.5°C-aligned pathway. For current and future (declining) global demand to be satisfied, investment is needed to support existing assets, while clean energy is scaled2. Barclays understands the critical importance of energy being secure, reliable and affordable for our customers and clients. Barclays will continue to support an energy sector in transition, focusing on the diversified energy companies investing in low carbon and with greater scrutiny on those engaged in developing new oil and gas projects. The trajectory for our clients’ transition to a low- carbon economy is influenced by a number of external factors, including market developments, technological advancement, the public policy environment, geopolitical developments and regional variations, behavioural change in society and the scale of change needed to adapt their business models. Client transition pathways will vary, even within the same sectors and geographies. Many highly carbon-intensive sectors require finance to transition to a low carbon economy. Restricting the flow of capital to these sectors could be harmful to the pace of the transition, limiting the real terms impact on global warming. The energy companies unable or unwilling to reduce their emissions or play a role in the energy transition may find it increasingly difficult to access financing from Barclays. We are committed to continuing the work we began in 2020. Our climate strategy will continue to evolve and adapt in light of the rapidly changing environment and the need to support governments and clients, in our efforts to meet our ambition of being a net zero bank by 2050. Note: 2 International Energy Agency - Net Zero Roadmap, 2023 Update https://iea.blob.core.windows.net/ assets/9a698da4-4002-4e53-8ef3-631d8971bf84/ NetZeroRoadmap_AGlobalPathwaytoKeepthe1.5CGoalinReach -2023Update.pdf + Please see the Barclays Climate and Sustainability report from page 18 for further details on Barclays' ambition to be a net zero bank. Barclays' climate, sustainability, and ESG-related data, targets and progress can be found within the ESG Data Centre within our ESG Resource Hub. Further details on our BlueTrackTM methodology can be found within our Financed Emissions Methodology paper (published in 2024) accessible at: home.barclays/ sustainability/esg-resource-hub/reporting-and- disclosures/ Collaborating with the Transition Plan Taskforce The Transition Plan Taskforce (TPT) was launched by HM Treasury in March 2022 with a mandate to bring together leaders from industry, academia, and regulators to develop good practice for transition plan disclosures for the finance sector and the real economy. Barclays participated in a number of working groups for the TPT, including inputting into the Banks Sector Guidance – which adds further depth and detail for preparers of transition plans operating in the banking sector. Barclays contributed to the development of the additional guidance, sharing its views on particular nuances of transition planning for banks – including the incorporation of nature and just transition elements. The guidance was published for consultation in October 2023, with Barclays participating in the launch event. Our approach to TPT disclosures Over 2023, Barclays participated in a number of working groups of the Transition Plan Taskforce (TPT), supporting the development of its framework for transition plan disclosures. We are developing our approach to the TPT’s recommendations, taking into account relevant guidance as it develops, and elements of the TPT’s Disclosure Framework (including the Implementation Guidance and draft Banks Sector Guidance) are addressed in our climate related disclosures included in this Annual Report on Form 20-F. During 2024, we will look to further develop elements of our climate disclosures including transition planning. This will be reflected in future disclosures, as we work towards publishing our own transition plan. Strategy Climate and sustainability report Governance Risk review Financial review Financial statements Barclays PLC 2023 Annual Report on Form 20-F 19 Risks and opportunities (continued) + Further details can be found at: transitiontaskforce.net/wp-content/uploads/2023/11/TPT-Banks-Sector- Guidance.pdf
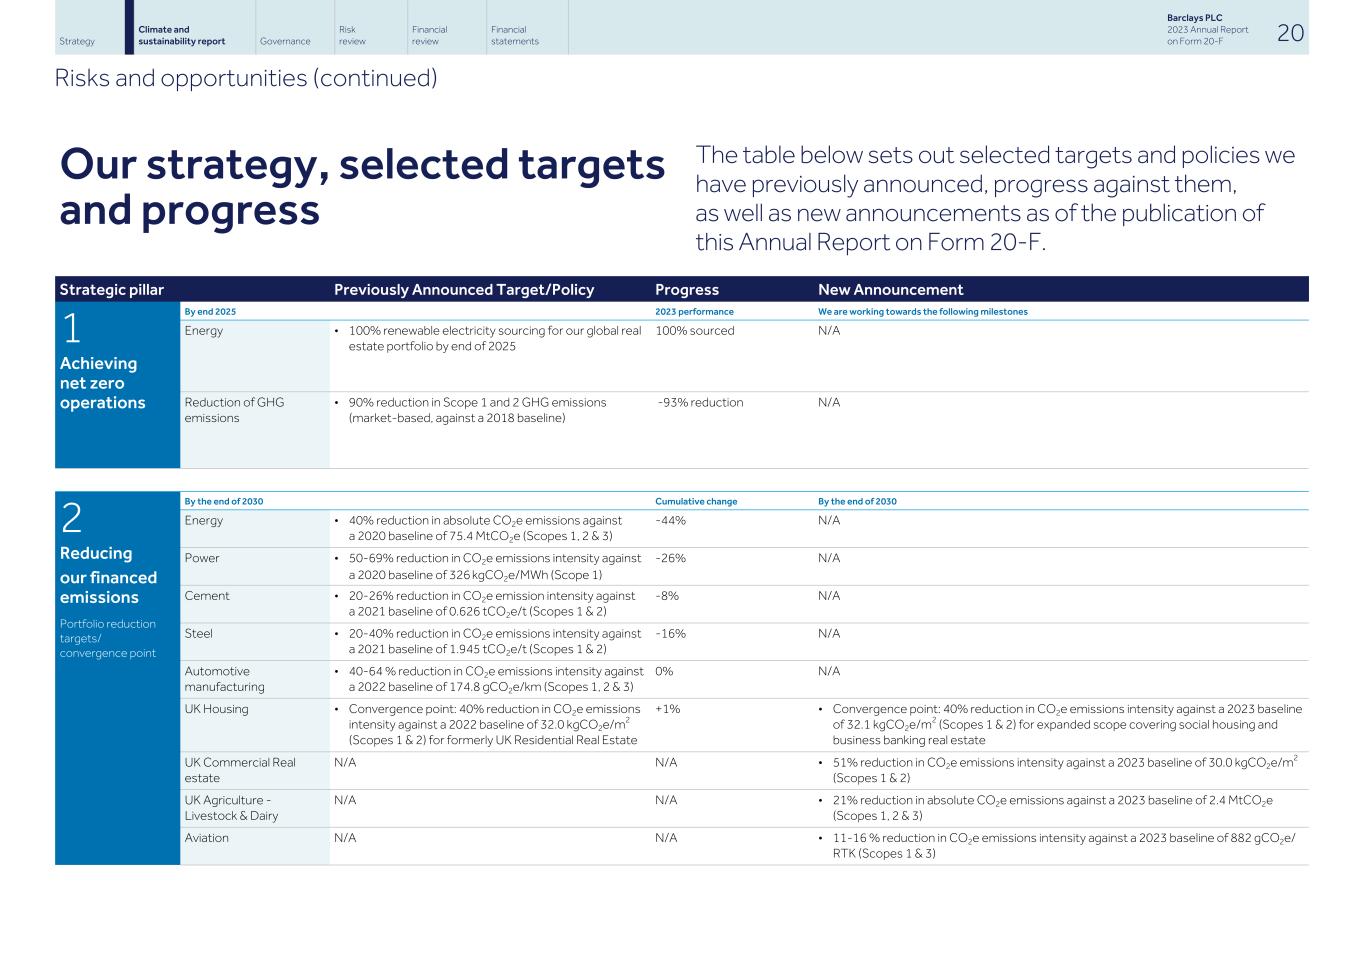
Our strategy, selected targets and progress The table below sets out selected targets and policies we have previously announced, progress against them, as well as new announcements as of the publication of this Annual Report on Form 20-F. Strategic pillar Previously Announced Target/Policy Progress New Announcement 1 Achieving net zero operations By end 2025 2023 performance We are working towards the following milestones Energy • 100% renewable electricity sourcing for our global real estate portfolio by end of 2025 100% sourced N/A Reduction of GHG emissions • 90% reduction in Scope 1 and 2 GHG emissions (market-based, against a 2018 baseline) -93% reduction N/A 2 Reducing our financed emissions Portfolio reduction targets/ convergence point By the end of 2030 Cumulative change By the end of 2030 Energy • 40% reduction in absolute CO2e emissions against a 2020 baseline of 75.4 MtCO2e (Scopes 1, 2 & 3) -44% N/A Power • 50-69% reduction in CO2e emissions intensity against a 2020 baseline of 326 kgCO2e/MWh (Scope 1) -26% N/A Cement • 20-26% reduction in CO2e emission intensity against a 2021 baseline of 0.626 tCO2e/t (Scopes 1 & 2) -8% N/A Steel • 20-40% reduction in CO2e emissions intensity against a 2021 baseline of 1.945 tCO2e/t (Scopes 1 & 2) -16% N/A Automotive manufacturing • 40-64 % reduction in CO2e emissions intensity against a 2022 baseline of 174.8 gCO2e/km (Scopes 1, 2 & 3) 0% N/A UK Housing • Convergence point: 40% reduction in CO2e emissions intensity against a 2022 baseline of 32.0 kgCO2e/m2 (Scopes 1 & 2) for formerly UK Residential Real Estate +1% • Convergence point: 40% reduction in CO2e emissions intensity against a 2023 baseline of 32.1 kgCO2e/m2 (Scopes 1 & 2) for expanded scope covering social housing and business banking real estate UK Commercial Real estate N/A N/A • 51% reduction in CO2e emissions intensity against a 2023 baseline of 30.0 kgCO2e/m2 (Scopes 1 & 2) UK Agriculture - Livestock & Dairy N/A N/A • 21% reduction in absolute CO2e emissions against a 2023 baseline of 2.4 MtCO2e (Scopes 1, 2 & 3) Aviation N/A N/A • 11-16 % reduction in CO2e emissions intensity against a 2023 baseline of 882 gCO2e/ RTK (Scopes 1 & 3) Strategy Climate and sustainability report Governance Risk review Financial review Financial statements Barclays PLC 2023 Annual Report on Form 20-F 20 Risks and opportunities (continued)
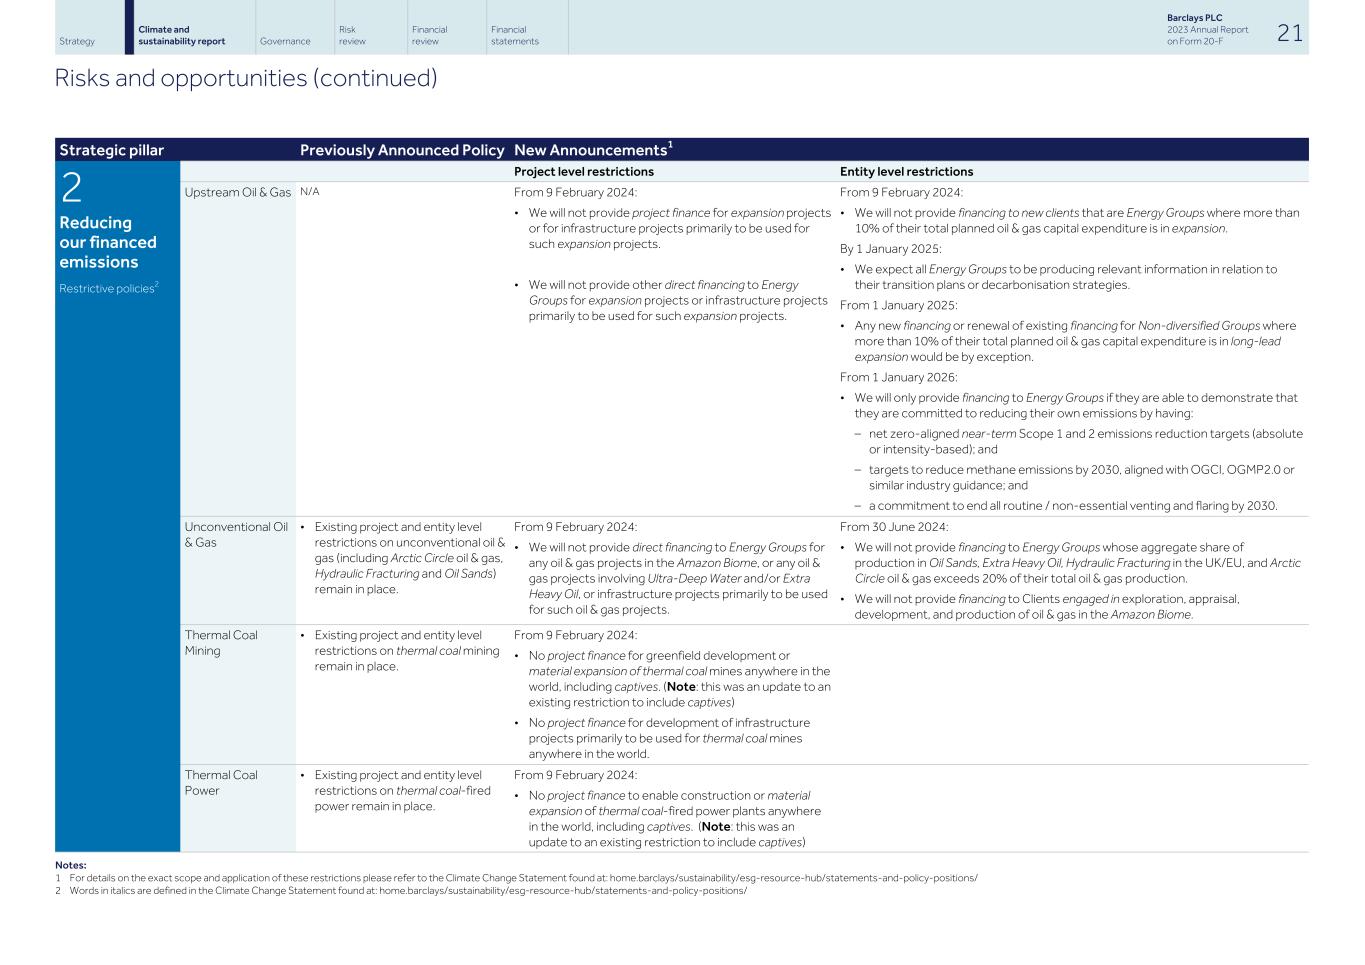
Strategic pillar Previously Announced Policy New Announcements1 2 Reducing our financed emissions Restrictive policies2 Project level restrictions Entity level restrictions Upstream Oil & Gas N/A From 9 February 2024: • We will not provide project finance for expansion projects or for infrastructure projects primarily to be used for such expansion projects. • We will not provide other direct financing to Energy Groups for expansion projects or infrastructure projects primarily to be used for such expansion projects. From 9 February 2024: • We will not provide financing to new clients that are Energy Groups where more than 10% of their total planned oil & gas capital expenditure is in expansion. By 1 January 2025: • We expect all Energy Groups to be producing relevant information in relation to their transition plans or decarbonisation strategies. From 1 January 2025: • Any new financing or renewal of existing financing for Non-diversified Groups where more than 10% of their total planned oil & gas capital expenditure is in long-lead expansion would be by exception. From 1 January 2026: • We will only provide financing to Energy Groups if they are able to demonstrate that they are committed to reducing their own emissions by having: – net zero-aligned near-term Scope 1 and 2 emissions reduction targets (absolute or intensity-based); and – targets to reduce methane emissions by 2030, aligned with OGCI, OGMP2.0 or similar industry guidance; and – a commitment to end all routine / non-essential venting and flaring by 2030. Unconventional Oil & Gas • Existing project and entity level restrictions on unconventional oil & gas (including Arctic Circle oil & gas, Hydraulic Fracturing and Oil Sands) remain in place. From 9 February 2024: • We will not provide direct financing to Energy Groups for any oil & gas projects in the Amazon Biome, or any oil & gas projects involving Ultra-Deep Water and/or Extra Heavy Oil, or infrastructure projects primarily to be used for such oil & gas projects. From 30 June 2024: • We will not provide financing to Energy Groups whose aggregate share of production in Oil Sands, Extra Heavy Oil, Hydraulic Fracturing in the UK/EU, and Arctic Circle oil & gas exceeds 20% of their total oil & gas production. • We will not provide financing to Clients engaged in exploration, appraisal, development, and production of oil & gas in the Amazon Biome. Thermal Coal Mining • Existing project and entity level restrictions on thermal coal mining remain in place. From 9 February 2024: • No project finance for greenfield development or material expansion of thermal coal mines anywhere in the world, including captives. (Note: this was an update to an existing restriction to include captives) • No project finance for development of infrastructure projects primarily to be used for thermal coal mines anywhere in the world. Thermal Coal Power • Existing project and entity level restrictions on thermal coal-fired power remain in place. From 9 February 2024: • No project finance to enable construction or material expansion of thermal coal-fired power plants anywhere in the world, including captives. (Note: this was an update to an existing restriction to include captives) Notes: 1 For details on the exact scope and application of these restrictions please refer to the Climate Change Statement found at: home.barclays/sustainability/esg-resource-hub/statements-and-policy-positions/ 2 Words in italics are defined in the Climate Change Statement found at: home.barclays/sustainability/esg-resource-hub/statements-and-policy-positions/ Strategy Climate and sustainability report Governance Risk review Financial review Financial statements Barclays PLC 2023 Annual Report on Form 20-F 21 Risks and opportunities (continued)
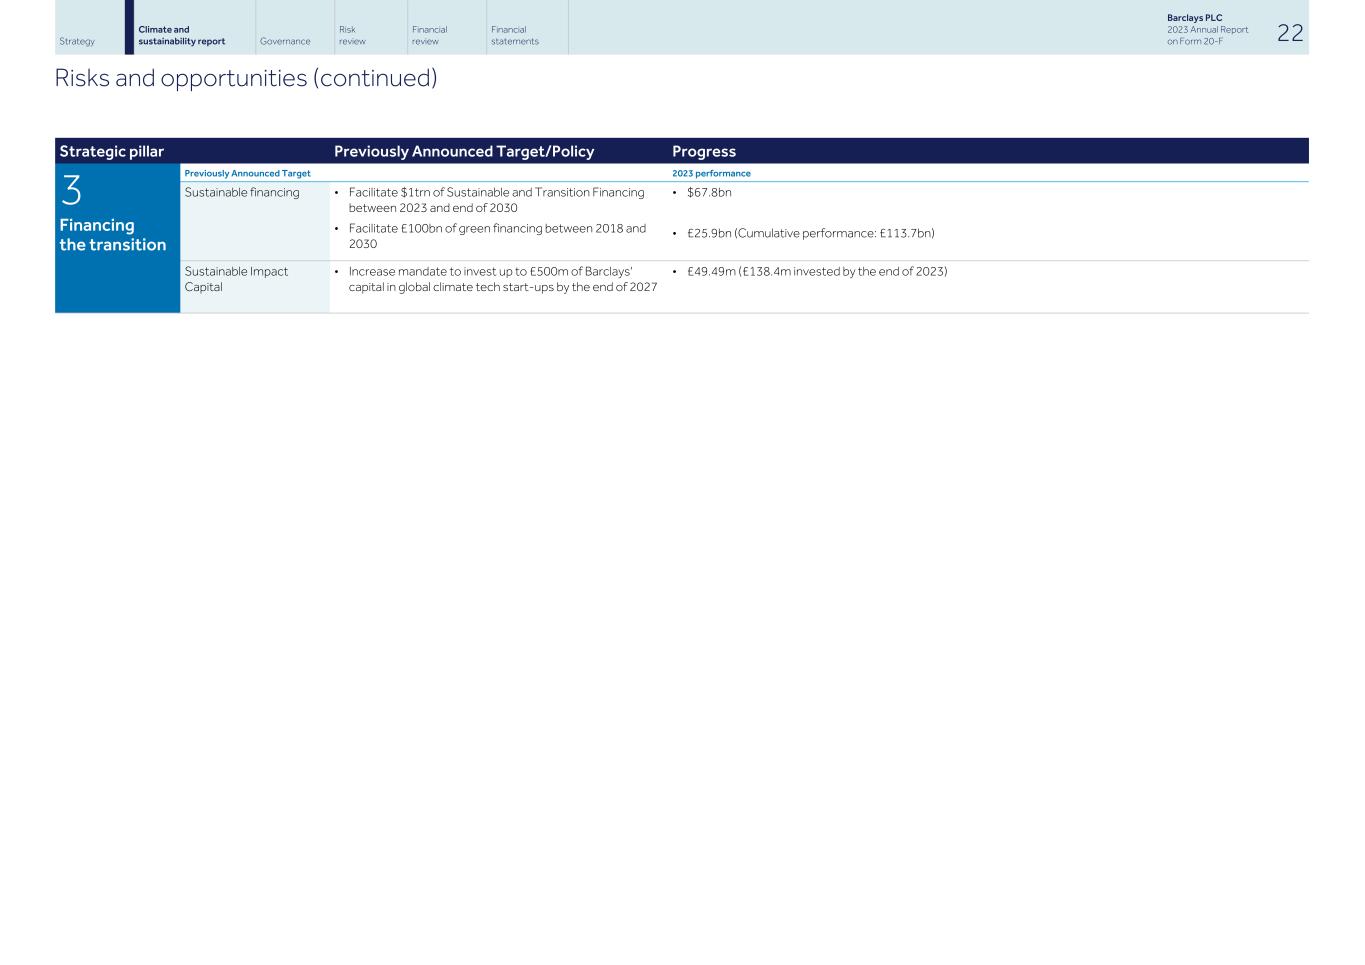
Strategic pillar Previously Announced Target/Policy Progress 3 Financing the transition Previously Announced Target 2023 performance Sustainable financing • Facilitate $1trn of Sustainable and Transition Financing between 2023 and end of 2030 • Facilitate £100bn of green financing between 2018 and 2030 • $67.8bn • £25.9bn (Cumulative performance: £113.7bn) Sustainable Impact Capital • Increase mandate to invest up to £500m of Barclays' capital in global climate tech start-ups by the end of 2027 • £49.49m (£138.4m invested by the end of 2023) Strategy Climate and sustainability report Governance Risk review Financial review Financial statements Barclays PLC 2023 Annual Report on Form 20-F 22 Risks and opportunities (continued)
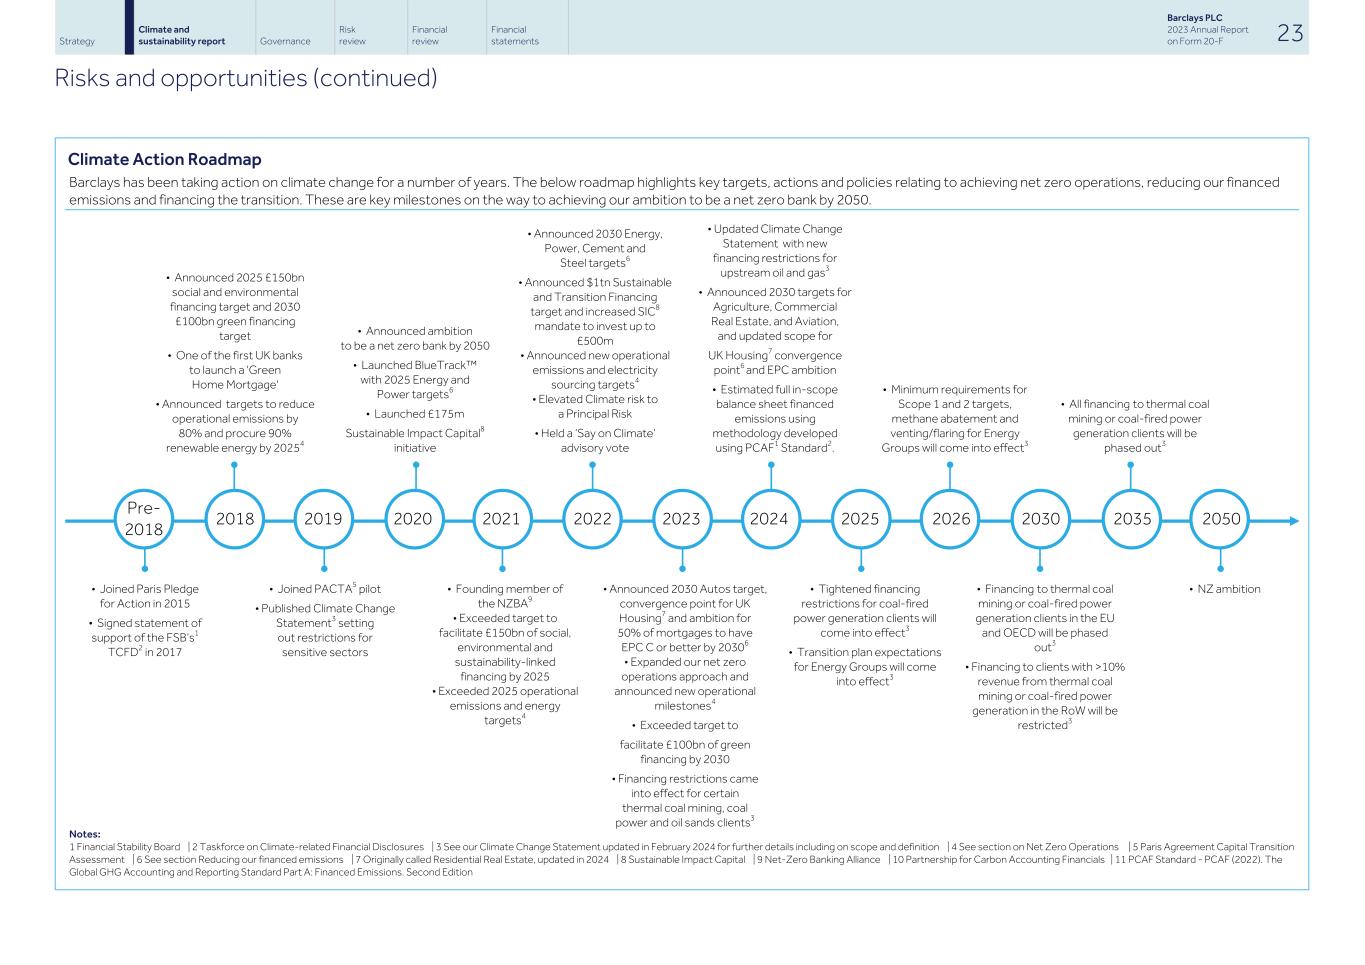
Climate Action Roadmap Barclays has been taking action on climate change for a number of years. The below roadmap highlights key targets, actions and policies relating to achieving net zero operations, reducing our financed emissions and financing the transition. These are key milestones on the way to achieving our ambition to be a net zero bank by 2050. Pre- 2018 2018 2019 2020 2021 2022 2023 2024 2025 2026 2030 2035 2050 Notes: 1 Financial Stability Board | 2 Taskforce on Climate-related Financial Disclosures | 3 See our Climate Change Statement updated in February 2024 for further details including on scope and definition | 4 See section on Net Zero Operations | 5 Paris Agreement Capital Transition Assessment | 6 See section Reducing our financed emissions | 7 Originally called Residential Real Estate, updated in 2024 | 8 Sustainable Impact Capital | 9 Net-Zero Banking Alliance | 10 Partnership for Carbon Accounting Financials | 11 PCAF Standard - PCAF (2022). The Global GHG Accounting and Reporting Standard Part A: Financed Emissions. Second Edition Strategy Climate and sustainability report Governance Risk review Financial review Financial statements Barclays PLC 2023 Annual Report on Form 20-F 23 Risks and opportunities (continued) • Joined Paris Pledge for Action in 2015 • Signed statement of support of the FSB’s1 TCFD2 in 2017 • Joined PACTA5 pilot • Published Climate Change Statement3 setting out restrictions for sensitive sectors • Founding member of the NZBA9 • Exceeded target to facilitate £150bn of social, environmental and sustainability-linked financing by 2025 • Exceeded 2025 operational emissions and energy targets4 • Announced 2030 Autos target, convergence point for UK Housing7 and ambition for 50% of mortgages to have EPC C or better by 20306 • Expanded our net zero operations approach and announced new operational milestones4 • Exceeded target to facilitate £100bn of green financing by 2030 • Financing restrictions came into effect for certain thermal coal mining, coal power and oil sands clients3 • Tightened financing restrictions for coal-fired power generation clients will come into effect3 • Transition plan expectations for Energy Groups will come into effect3 • Financing to thermal coal mining or coal-fired power generation clients in the EU and OECD will be phased out3 • Financing to clients with >10% revenue from thermal coal mining or coal-fired power generation in the RoW will be restricted3 • NZ ambition • Announced 2025 £150bn social and environmental financing target and 2030 £100bn green financing target • One of the first UK banks to launch a 'Green Home Mortgage' • Announced targets to reduce operational emissions by 80% and procure 90% renewable energy by 20254 • Announced ambition to be a net zero bank by 2050 • Launched BlueTrack™ with 2025 Energy and Power targets6 • Launched £175m Sustainable Impact Capital8 initiative • Announced 2030 Energy, Power, Cement and Steel targets6 • Announced $1tn Sustainable and Transition Financing target and increased SIC8 mandate to invest up to £500m • Announced new operational emissions and electricity sourcing targets4 • Elevated Climate risk to a Principal Risk • Held a ‘Say on Climate’ advisory vote • Updated Climate Change Statement with new financing restrictions for upstream oil and gas3 • Announced 2030 targets for Agriculture, Commercial Real Estate, and Aviation, and updated scope for UK Housing7 convergence point6 and EPC ambition • Estimated full in-scope balance sheet financed emissions using methodology developed using PCAF1 Standard2. • Minimum requirements for Scope 1 and 2 targets, methane abatement and venting/flaring for Energy Groups will come into effect3 • All financing to thermal coal mining or coal-fired power generation clients will be phased out3
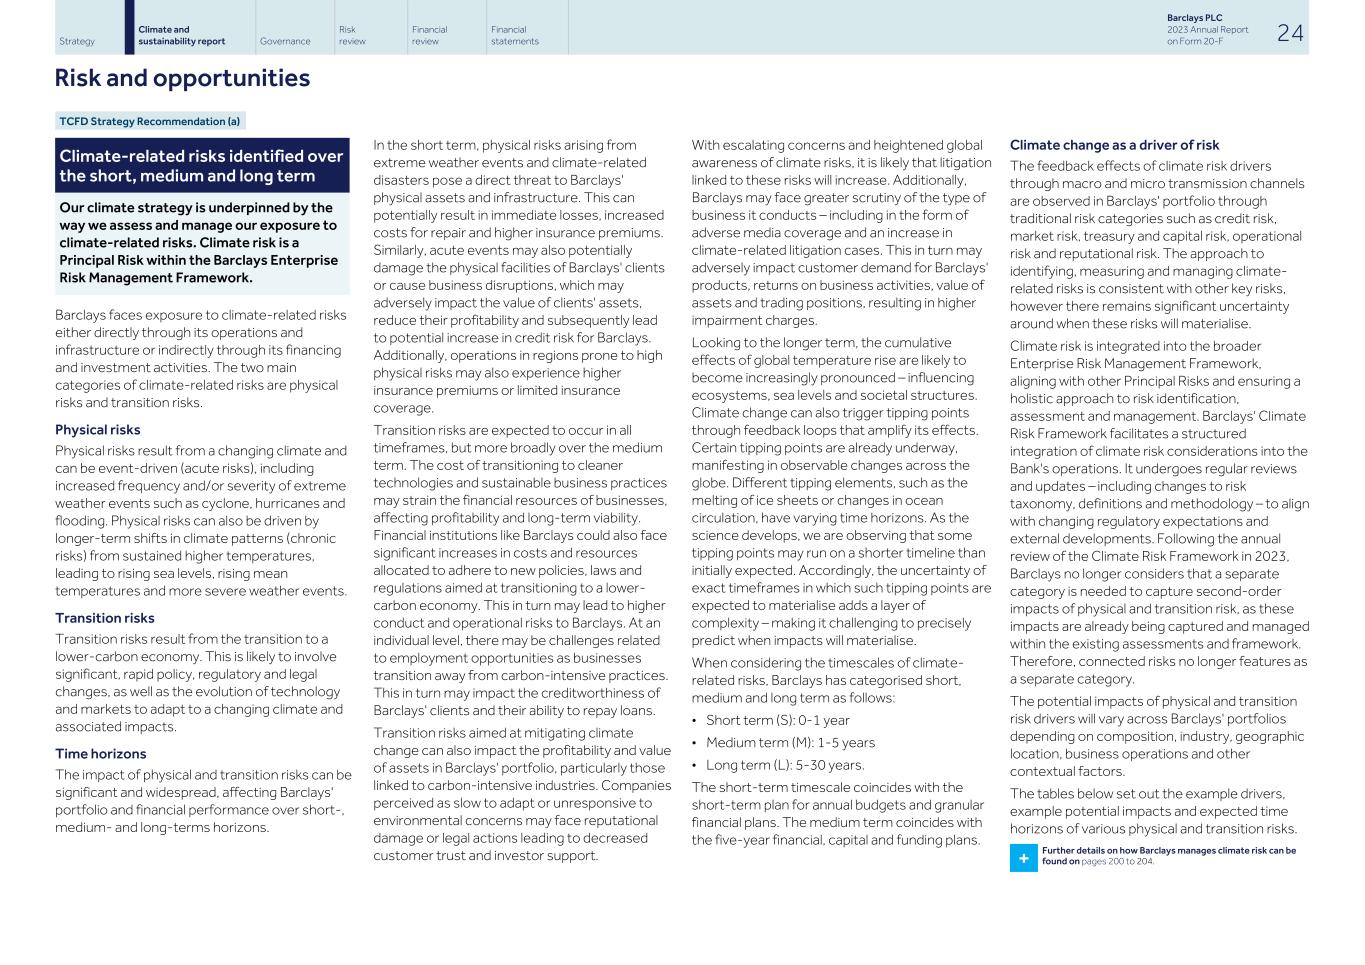
Climate-related risks identified over the short, medium and long term Our climate strategy is underpinned by the way we assess and manage our exposure to climate-related risks. Climate risk is a Principal Risk within the Barclays Enterprise Risk Management Framework. Barclays faces exposure to climate-related risks either directly through its operations and infrastructure or indirectly through its financing and investment activities. The two main categories of climate-related risks are physical risks and transition risks. Physical risks Physical risks result from a changing climate and can be event-driven (acute risks), including increased frequency and/or severity of extreme weather events such as cyclone, hurricanes and flooding. Physical risks can also be driven by longer-term shifts in climate patterns (chronic risks) from sustained higher temperatures, leading to rising sea levels, rising mean temperatures and more severe weather events. Transition risks Transition risks result from the transition to a lower-carbon economy. This is likely to involve significant, rapid policy, regulatory and legal changes, as well as the evolution of technology and markets to adapt to a changing climate and associated impacts. Time horizons The impact of physical and transition risks can be significant and widespread, affecting Barclays' portfolio and financial performance over short-, medium- and long-terms horizons. In the short term, physical risks arising from extreme weather events and climate-related disasters pose a direct threat to Barclays' physical assets and infrastructure. This can potentially result in immediate losses, increased costs for repair and higher insurance premiums. Similarly, acute events may also potentially damage the physical facilities of Barclays' clients or cause business disruptions, which may adversely impact the value of clients' assets, reduce their profitability and subsequently lead to potential increase in credit risk for Barclays. Additionally, operations in regions prone to high physical risks may also experience higher insurance premiums or limited insurance coverage. Transition risks are expected to occur in all timeframes, but more broadly over the medium term. The cost of transitioning to cleaner technologies and sustainable business practices may strain the financial resources of businesses, affecting profitability and long-term viability. Financial institutions like Barclays could also face significant increases in costs and resources allocated to adhere to new policies, laws and regulations aimed at transitioning to a lower- carbon economy. This in turn may lead to higher conduct and operational risks to Barclays. At an individual level, there may be challenges related to employment opportunities as businesses transition away from carbon-intensive practices. This in turn may impact the creditworthiness of Barclays' clients and their ability to repay loans. Transition risks aimed at mitigating climate change can also impact the profitability and value of assets in Barclays' portfolio, particularly those linked to carbon-intensive industries. Companies perceived as slow to adapt or unresponsive to environmental concerns may face reputational damage or legal actions leading to decreased customer trust and investor support. With escalating concerns and heightened global awareness of climate risks, it is likely that litigation linked to these risks will increase. Additionally, Barclays may face greater scrutiny of the type of business it conducts – including in the form of adverse media coverage and an increase in climate-related litigation cases. This in turn may adversely impact customer demand for Barclays' products, returns on business activities, value of assets and trading positions, resulting in higher impairment charges. Looking to the longer term, the cumulative effects of global temperature rise are likely to become increasingly pronounced – influencing ecosystems, sea levels and societal structures. Climate change can also trigger tipping points through feedback loops that amplify its effects. Certain tipping points are already underway, manifesting in observable changes across the globe. Different tipping elements, such as the melting of ice sheets or changes in ocean circulation, have varying time horizons. As the science develops, we are observing that some tipping points may run on a shorter timeline than initially expected. Accordingly, the uncertainty of exact timeframes in which such tipping points are expected to materialise adds a layer of complexity – making it challenging to precisely predict when impacts will materialise. When considering the timescales of climate- related risks, Barclays has categorised short, medium and long term as follows: • Short term (S): 0-1 year • Medium term (M): 1-5 years • Long term (L): 5-30 years. The short-term timescale coincides with the short-term plan for annual budgets and granular financial plans. The medium term coincides with the five-year financial, capital and funding plans. Climate change as a driver of risk The feedback effects of climate risk drivers through macro and micro transmission channels are observed in Barclays' portfolio through traditional risk categories such as credit risk, market risk, treasury and capital risk, operational risk and reputational risk. The approach to identifying, measuring and managing climate- related risks is consistent with other key risks, however there remains significant uncertainty around when these risks will materialise. Climate risk is integrated into the broader Enterprise Risk Management Framework, aligning with other Principal Risks and ensuring a holistic approach to risk identification, assessment and management. Barclays' Climate Risk Framework facilitates a structured integration of climate risk considerations into the Bank's operations. It undergoes regular reviews and updates – including changes to risk taxonomy, definitions and methodology – to align with changing regulatory expectations and external developments. Following the annual review of the Climate Risk Framework in 2023, Barclays no longer considers that a separate category is needed to capture second-order impacts of physical and transition risk, as these impacts are already being captured and managed within the existing assessments and framework. Therefore, connected risks no longer features as a separate category. The potential impacts of physical and transition risk drivers will vary across Barclays' portfolios depending on composition, industry, geographic location, business operations and other contextual factors. The tables below set out the example drivers, example potential impacts and expected time horizons of various physical and transition risks. + Further details on how Barclays manages climate risk can be found on pages 200 to 204. Strategy Climate and sustainability report Governance Risk review Financial review Financial statements Barclays PLC 2023 Annual Report on Form 20-F 24 Risk and opportunities TCFD Strategy Recommendation (a)
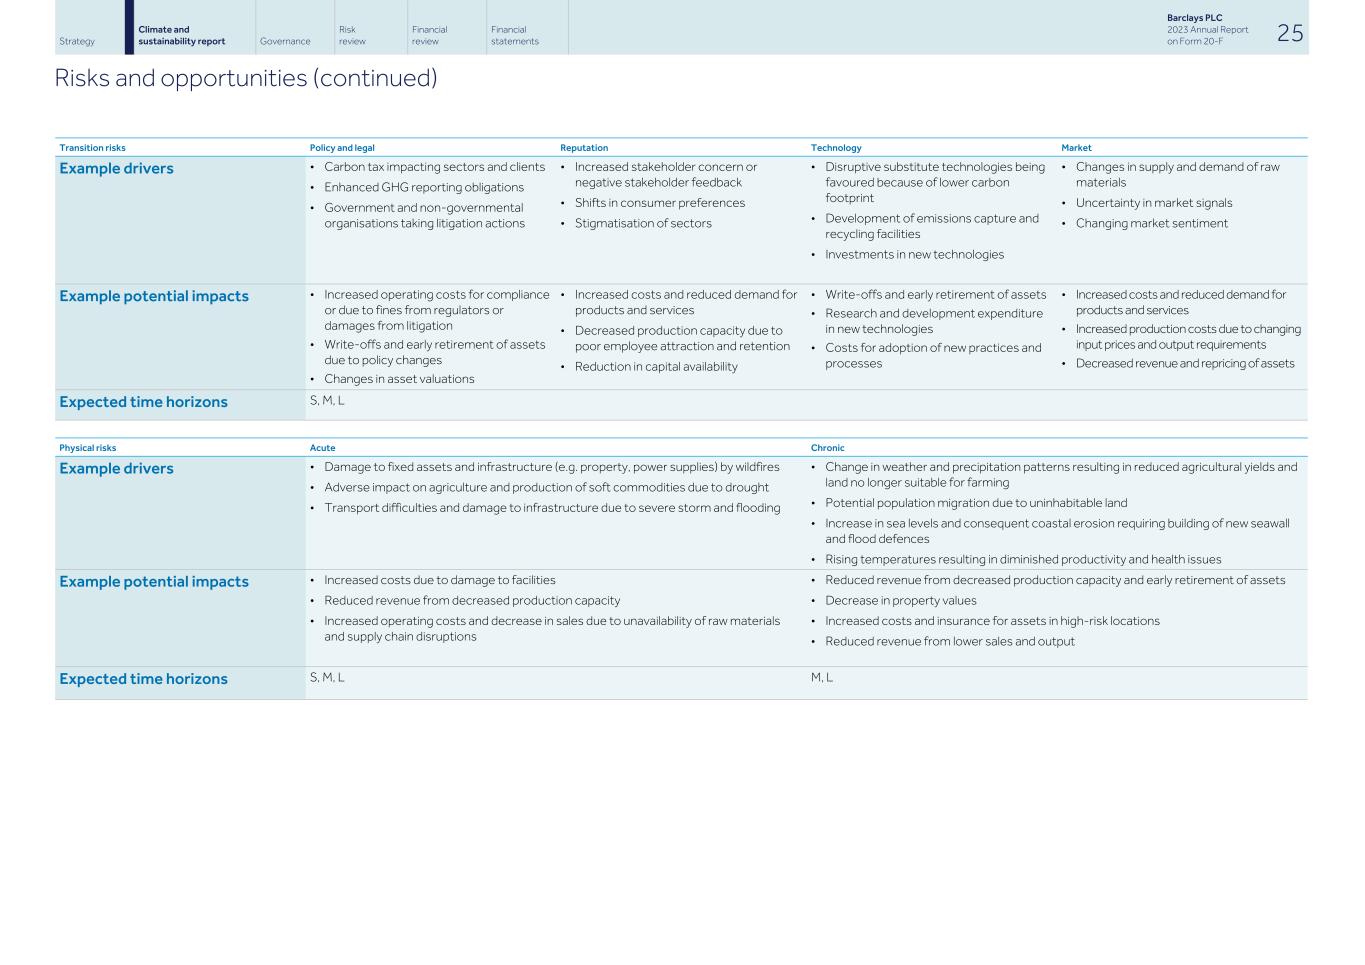
Transition risks Policy and legal Reputation Technology Market Example drivers • Carbon tax impacting sectors and clients • Enhanced GHG reporting obligations • Government and non-governmental organisations taking litigation actions • Increased stakeholder concern or negative stakeholder feedback • Shifts in consumer preferences • Stigmatisation of sectors • Disruptive substitute technologies being favoured because of lower carbon footprint • Development of emissions capture and recycling facilities • Investments in new technologies • Changes in supply and demand of raw materials • Uncertainty in market signals • Changing market sentiment Example potential impacts • Increased operating costs for compliance or due to fines from regulators or damages from litigation • Write-offs and early retirement of assets due to policy changes • Changes in asset valuations • Increased costs and reduced demand for products and services • Decreased production capacity due to poor employee attraction and retention • Reduction in capital availability • Write-offs and early retirement of assets • Research and development expenditure in new technologies • Costs for adoption of new practices and processes • Increased costs and reduced demand for products and services • Increased production costs due to changing input prices and output requirements • Decreased revenue and repricing of assets Expected time horizons S, M, L Physical risks Acute Chronic Example drivers • Damage to fixed assets and infrastructure (e.g. property, power supplies) by wildfires • Adverse impact on agriculture and production of soft commodities due to drought • Transport difficulties and damage to infrastructure due to severe storm and flooding • Change in weather and precipitation patterns resulting in reduced agricultural yields and land no longer suitable for farming • Potential population migration due to uninhabitable land • Increase in sea levels and consequent coastal erosion requiring building of new seawall and flood defences • Rising temperatures resulting in diminished productivity and health issues Example potential impacts • Increased costs due to damage to facilities • Reduced revenue from decreased production capacity • Increased operating costs and decrease in sales due to unavailability of raw materials and supply chain disruptions • Reduced revenue from decreased production capacity and early retirement of assets • Decrease in property values • Increased costs and insurance for assets in high-risk locations • Reduced revenue from lower sales and output Expected time horizons S, M, L M, L Strategy Climate and sustainability report Governance Risk review Financial review Financial statements Barclays PLC 2023 Annual Report on Form 20-F 25 Risks and opportunities (continued)
i i Building our understanding of nature-related risk Nature-related risks arise from an organisation's dependencies and impacts on nature. These risks can be physical risks and transition risks, which in turn can present financial risks1. As such, this year we have undertaken further work to develop our understanding of nature-related risks and how these relate to different industry sectors. Building on last year's heatmap analysis, we have updated our approach using publicly available data and explored a wider set of impacts and dependencies. This work has been designed to help build our understanding of the material nature- related impacts, dependencies, risks and opportunities within priority industry sectors, and indicate where we might focus further analysis, as we continue to build our nature related assessment and decision-making capabilities. Through this work, we have developed an updated heatmap by mapping industry classification codes and the associated qualitative nature-related impact and dependency ratings from ENCORE2 and SBTN3 to Barclays' internal sector classifications. The mapping was undertaken for sectors with material impacts and dependencies as identified by TNFD in its Guidance for Financial Institutions4. We then undertook an exploratory exercise which highlighted in which of these industry sectors particular nature-related impacts and dependencies are most likely to occur. This work created a heatmap with ratings representing an average global view of the potential impacts and dependencies that may be associated with the direct operations of companies in these sectors. The preliminary heatmap analysis highlighted that, for most of the priority industry sectors, there are a number of potential impacts and dependencies rated as high or very high, including impacts related to land-use change, water use and pollution, as well as dependencies on ecosystem services such as ground and surface water, climate regulation and flood-storm protection. These insights will be used to help inform our future analysis, taking into account that this represents one data source, and specific nature related risks within the same sector might vary substantially from company or project and an aggregated heatmap is not necessarily representative of the actual impacts and dependencies of Barclays’ client base. Our proposed next steps include building on the TNFD LEAP pilot undertaken in 2022/2023 to conduct further sector-level analysis, taking into account the results of the heatmap, Barclays’ exposure and client base and emerging thinking on impact and risk data and methodologies. Notes: 1 Source: https://tnfd.global/wp-content/uploads/2023/08/Recommendations_of_the_Taskforce_on_Nature- related_Financial_Disclosures_September_2023.pdf?v=1695118661 2 ENCORE stands for Exploring Natural Capital Opportunities, Risks, and Exposure and is a tool developed by Global Economy, UNEP-FI, and UNEP- WCMC. 3 SBTN stands for Science Based Targets Network and builds on the momentum of the Science Based Targets initiative helping companies set science-based targets for nature. 4 Source: https://tnfd.global/wp-content/uploads/2023/08/Guidance_for_Financial_Institutions_v1.pdf Nature-related data, models and methodologies are a nascent area and therefore evolving and reliant on externally sourced data mapped to internal sector identifiers, with various limitations. We will continue to review the applied data, models, and methodologies, as such the results of similar assessments are likely to change in the future. Strategy Climate and sustainability report Governance Risk review Financial review Financial statements Barclays PLC 2023 Annual Report on Form 20-F 26 Risks and opportunities (continued)
Climate-related opportunities identified over the short, medium and long term Barclays has enhanced its focus on sustainable and transition finance over the last two years. At the end of 2022, we announced a new target to facilitate $1trn of Sustainable and Transition Finance. This followed a review of the financing requirements arising from the global transition to a low-carbon economy if the world is to avoid the worst effects of climate change and the potential addressable market for Barclays. During 2023 we built on this work to develop a Group-wide sustainable finance strategy to operationalise our ambition. The market opportunity We recognise the opportunities arising from the global transition to a low-carbon economy – which will involve scaling up zero or near-zero emitting technologies and businesses and supporting emissions reductions in high-emitting and hard-to-abate sectors if the world is to avoid the worst effects of climate change. In 2022, we completed a review of the market and identified three medium-term thematic areas of potential opportunity for Barclays, as outlined below. Although markets may have evolved during 2023 we believe these still represent growth opportunities for Barclays. Energy Transition Finance The analysis indicated that, based on current policy, technology and market developments, Energy Transition Finance – including renewables and nascent or early-stage climate technologies that are needed to scale to support the transition to net zero – represents an estimated 10-year addressable opportunity of over $16trn across North America, Europe and Asia Pacific (excluding China). This extends to up to $24trn over the same time period if policy, technology and market developments step up to deliver on net zero by 2050. This consists of a number of mature and scaling technologies with renewable energy (including wind and solar) and low-emissions transport (including electric vehicles, fuel cell electric vehicles and mass transit) expected to make up over half of the addressable market through to 2030. The analysis also indicated significant longer-term opportunities in financing the scaling of capabilities in nascent technologies such as carbon capture utilisation and storage (CCUS) and hydrogen solutions. Sustainable finance instruments Sustainable finance instruments represent an estimated $3.5trn-6trn annual issuance opportunity through to 2030 across North America, Europe and Asia Pacific (excluding China), with Europe expected to remain the primary market for ESG debt. The analysis indicated that all ESG instruments are expected to grow to 2030 with ESG debt excluding green bonds and loans represents an estimated 10-year $400-650bn cumulative financing opportunity for Barclays based on our global market share in sustainable finance instruments. Retail and business banking Barclays UK recognises the environmental and societal benefits – and the commercial opportunities – that can be delivered through financing the UK economy's transition to net zero. Embracing the challenge of capturing opportunities from the transition to a low-carbon economy aligns with Barclays’ purpose and positions us to capitalise on the growing market for sustainable finance. Our 2022 market review indicated that, within the UK, sustainable opportunities in retail and business banking represent a $225-286bn market opportunity by 2025, increasing to an estimated $640bn-1trn by 2030. According to our 2022 market review, Green Home Mortgages represent the largest individual market for Barclays UK by 2030. We are actively exploring ways to unlock the decarbonisation of homes at scale by developing secured and unsecured lending for energy-efficiency-related technologies. We are also exploring strategic partnerships to provide customers and businesses with financing and guidance to make more sustainable choices. However, there are significant dependencies for this opportunity to be realised – namely customer demand, supply chain maturity and policy intervention. Assessing the market opportunity To determine the addressable global market for sustainable finance to 2030, Barclays' 2022 market review leveraged widely used and credible third-party sources including the IEA, IRENA, Climate Bonds Initiative and the IFC as well as Barclays' own industry, ESG and market research. The analysis considered the investment needed through to 2030 for the world to align to net zero, including the accelerated scenarios reflecting possible policy and market developments. Having determined the global addressable market, Barclays developed scenarios for the Bank's potential market for various asset classes, product sets, technological sectors and geographic markets, validated through comparison with historic growth rates and our projected share of the overall market. $1trn Sustainable and Transition Financing Target Following analysis of the market opportunity for sustainable financing, together with a review of the Group's capabilities, in December 2022 we announced a new target to facilitate $1trn of Sustainable and Transition Financing between 2023 and the end of 2030, + Further details of Barclays' sustainable finance targets can be found on page 56. We recognise that we must tackle the decarbonisation of 'hard-to-abate' sectors that are carbon intensive – including through scaling and commercialising new technologies such as hydrogen and carbon capture. During 2023 we developed a Transition Finance Framework, which we announced in early 2024. The Transition Finance Framework sets out the criteria for the inclusion of transition financing in our $1trn target. The inclusion of transition financing reflects our recognition of the importance of lending and facilitating funding and investing in technologies and activities that support GHG emission reduction (directly or indirectly) in high-emitting and hard-to-abate sectors. + Further details of Barclays' Transition Finance Framework can be found on page 59. Strategy Climate and sustainability report Governance Risk review Financial review Financial statements Barclays PLC 2023 Annual Report on Form 20-F 27 Risks and opportunities (continued)
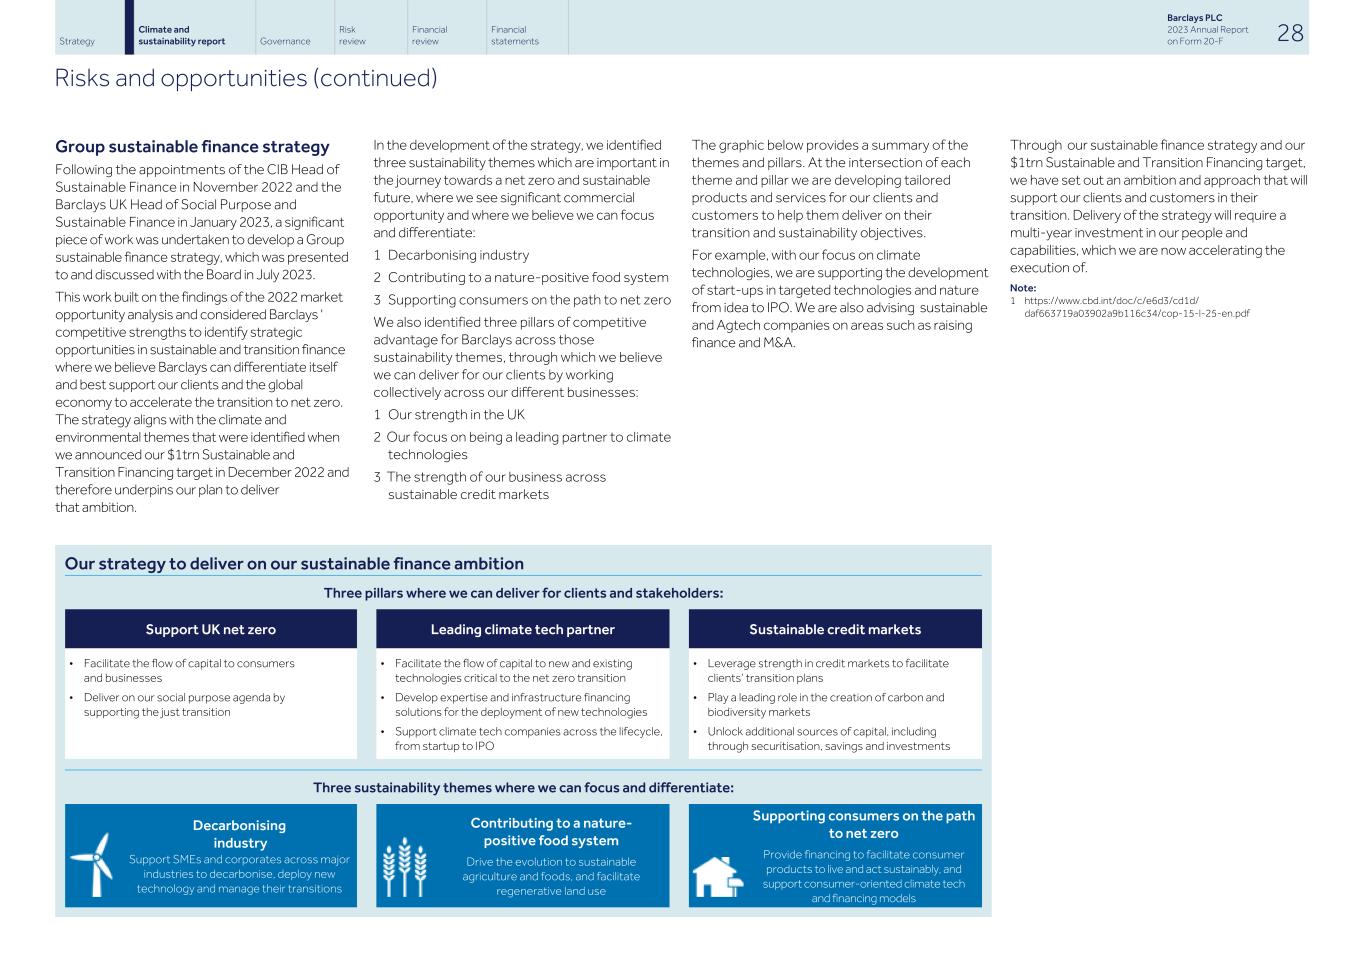
Group sustainable finance strategy Following the appointments of the CIB Head of Sustainable Finance in November 2022 and the Barclays UK Head of Social Purpose and Sustainable Finance in January 2023, a significant piece of work was undertaken to develop a Group sustainable finance strategy, which was presented to and discussed with the Board in July 2023. This work built on the findings of the 2022 market opportunity analysis and considered Barclays ' competitive strengths to identify strategic opportunities in sustainable and transition finance where we believe Barclays can differentiate itself and best support our clients and the global economy to accelerate the transition to net zero. The strategy aligns with the climate and environmental themes that were identified when we announced our $1trn Sustainable and Transition Financing target in December 2022 and therefore underpins our plan to deliver that ambition. Our strategy to deliver on our sustainable finance ambition Three pillars where we can deliver for clients and stakeholders: Support UK net zero Leading climate tech partner Sustainable credit markets • Facilitate the flow of capital to consumers and businesses • Deliver on our social purpose agenda by supporting the just transition • Facilitate the flow of capital to new and existing technologies critical to the net zero transition • Develop expertise and infrastructure financing solutions for the deployment of new technologies • Support climate tech companies across the lifecycle, from startup to IPO • Leverage strength in credit markets to facilitate clients’ transition plans • Play a leading role in the creation of carbon and biodiversity markets • Unlock additional sources of capital, including through securitisation, savings and investments Three sustainability themes where we can focus and differentiate: Decarbonising industry Support SMEs and corporates across major industries to decarbonise, deploy new technology and manage their transitions Contributing to a nature- positive food system Drive the evolution to sustainable agriculture and foods, and facilitate regenerative land use Supporting consumers on the path to net zero Provide financing to facilitate consumer products to live and act sustainably, and support consumer-oriented climate tech and financing models In the development of the strategy, we identified three sustainability themes which are important in the journey towards a net zero and sustainable future, where we see significant commercial opportunity and where we believe we can focus and differentiate: 1 Decarbonising industry 2 Contributing to a nature-positive food system 3 Supporting consumers on the path to net zero We also identified three pillars of competitive advantage for Barclays across those sustainability themes, through which we believe we can deliver for our clients by working collectively across our different businesses: 1 Our strength in the UK 2 Our focus on being a leading partner to climate technologies 3 The strength of our business across sustainable credit markets The graphic below provides a summary of the themes and pillars. At the intersection of each theme and pillar we are developing tailored products and services for our clients and customers to help them deliver on their transition and sustainability objectives. For example, with our focus on climate technologies, we are supporting the development of start-ups in targeted technologies and nature from idea to IPO. We are also advising sustainable and Agtech companies on areas such as raising finance and M&A. Through our sustainable finance strategy and our $1trn Sustainable and Transition Financing target, we have set out an ambition and approach that will support our clients and customers in their transition. Delivery of the strategy will require a multi-year investment in our people and capabilities, which we are now accelerating the execution of. Note: 1 https://www.cbd.int/doc/c/e6d3/cd1d/ daf663719a03902a9b116c34/cop-15-l-25-en.pdf Strategy Climate and sustainability report Governance Risk review Financial review Financial statements Barclays PLC 2023 Annual Report on Form 20-F 28 Risks and opportunities (continued)
Achieving net zero operations Although financed emissions account for the greatest proportion of our climate impact, we have also continued addressing our operational emissions – an important factor in meeting our ambition to be a net zero bank by 2050. Defining net zero operations We define net zero operations as the state in which we will achieve a GHG reduction of our Scope 1, Scope 2 and Scope 3 operational emissions1 consistent with a 1.5oC-aligned pathway and counterbalance any residual emissions. We continue to review and develop our approach to net zero operations as standards to understand and define net zero evolve rapidly. Net zero operations strategy Our net zero operations strategy has two components: • Reduce our Scope 1 and 2 emissions through energy efficiency, electrification of our buildings and vehicles, renewable electricity sourcing and replacing fossil-fuel-powered infrastructure with low-emission alternatives • Reduce Scope 3 operational emissions by engaging with our key stakeholders, including suppliers2 and colleagues, to track, manage and reduce their GHG emissions – while embedding net zero principles across our policies and contractual requirements. Progress to date In 2023 we achieved our milestone3 of 50% reduction of our Scope 1 and 2 location-based GHG emissions ahead of 2030 – reducing these emissions by 51%. We continued to source 100% renewable electricity4 for our global real estate portfolio5 and continued to meet our 90% Scope 1 and 2 market-based emissions reduction target6 – reducing these emissions by 93%. Key contributors to our progress include global real estate portfolio right-sizing7 and energy efficiency programmes, as well as company vehicles electrification, and our continued focus on renewable electricity sourcing. For our Scope 3 operational emissions, our focus remained on engaging with our key stakeholders and making data enhancements, particularly by acquiring primary supplier data and evolving our accounting methodology in line with industry standards and best practice. We also continued to pursue the integration of ESG considerations and expectations into processes throughout the procurement lifecycle. We expect that our progress against our net zero operations targets and milestones is likely to be variable and non-linear. Our net zero operations strategy is dependent on broader industry, technological and regulatory changes that are outside Barclays’ control and may affect our ability to achieve our targets and milestones. Further, as the accounting standards and data underlying our net zero operations strategy continue to evolve and be refined, this could impact our metrics, targets and milestones. Progress against our targets and milestones may also be impacted by management decisions based on key drivers unrelated to climate, for example prudent risk management practices. Our intent is to enhance data collection and accuracy to help identify key contributors to our impact, determine opportunities for improvement, and support the integration of sustainability into our business operations. Notes: 1 We define our Scope 3 operational emissions to include supply chain, waste, business travel and leased assets. 2 In this Achieving net zero operations section, when referring to suppliers and supply chain, we are referring to Third-Party Service Suppliers (TPSPs). 3 In this Achieving net zero operations section, a reference to a "milestone” denotes an indicator we are working towards and report against. 4 We maintained 100% renewable electricity sourcing for our global real estate portfolio through instruments including green tariffs (55%) and energy attribute certificates (EACs)(45%). 5 Global real estate portfolio includes offices, branches, campuses and data centres. 6 In this Achieving net zero operations section, a reference to a “target” denotes an indicator linked to our executive remuneration. 7 By right-sizing, we are optimising our space and associated resources for our operational needs. Strategy Climate and sustainability report Governance Risk review Financial review Financial statements Barclays PLC 2023 Annual Report on Form 20-F 29 Implementing our Climate Strategy (continued) TCFD Strategy Recommendation (b) | Strategic Pillar 1
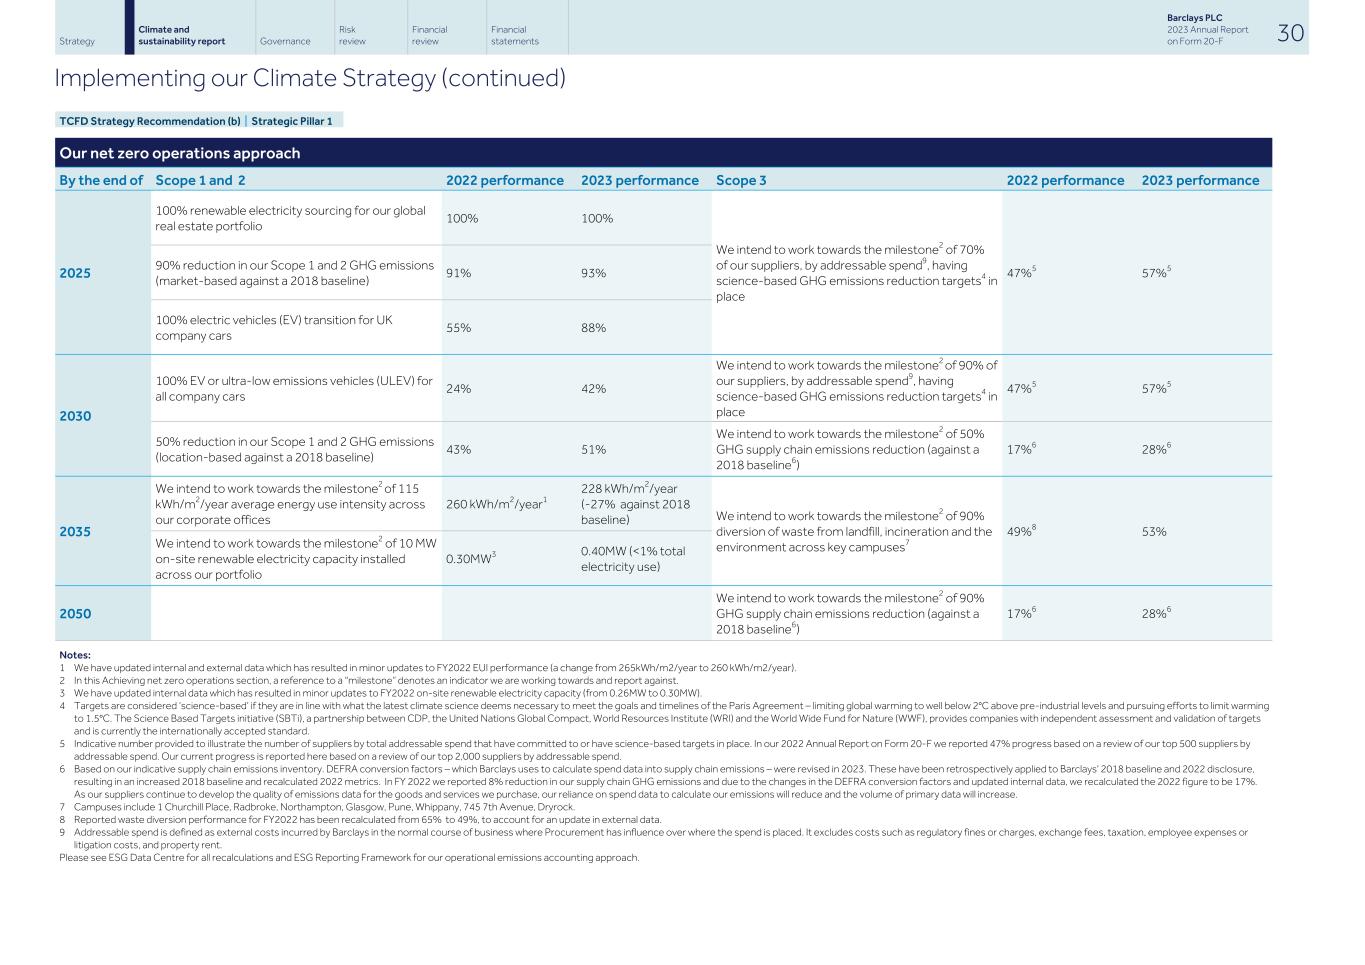
Our net zero operations approach By the end of Scope 1 and 2 2022 performance 2023 performance Scope 3 2022 performance 2023 performance 2025 100% renewable electricity sourcing for our global real estate portfolio 100% 100% We intend to work towards the milestone2 of 70% of our suppliers, by addressable spend9, having science-based GHG emissions reduction targets4 in place 47%5 57%590% reduction in our Scope 1 and 2 GHG emissions (market-based against a 2018 baseline) 91% 93% 100% electric vehicles (EV) transition for UK company cars 55% 88% 2030 100% EV or ultra-low emissions vehicles (ULEV) for all company cars 24% 42% We intend to work towards the milestone2 of 90% of our suppliers, by addressable spend9, having science-based GHG emissions reduction targets4 in place 47%5 57%5 50% reduction in our Scope 1 and 2 GHG emissions (location-based against a 2018 baseline) 43% 51% We intend to work towards the milestone2 of 50% GHG supply chain emissions reduction (against a 2018 baseline6) 17%6 28%6 2035 We intend to work towards the milestone2 of 115 kWh/m2/year average energy use intensity across our corporate offices 260 kWh/m2/year1 228 kWh/m2/year (-27% against 2018 baseline) We intend to work towards the milestone2 of 90% diversion of waste from landfill, incineration and the environment across key campuses7 49%8 53% We intend to work towards the milestone2 of 10 MW on-site renewable electricity capacity installed across our portfolio 0.30MW3 0.40MW (<1% total electricity use) 2050 We intend to work towards the milestone2 of 90% GHG supply chain emissions reduction (against a 2018 baseline6) 17%6 28%6 Notes: 1 We have updated internal and external data which has resulted in minor updates to FY2022 EUI performance (a change from 265kWh/m2/year to 260 kWh/m2/year). 2 In this Achieving net zero operations section, a reference to a "milestone” denotes an indicator we are working towards and report against. 3 We have updated internal data which has resulted in minor updates to FY2022 on-site renewable electricity capacity (from 0.26MW to 0.30MW). 4 Targets are considered ‘science-based’ if they are in line with what the latest climate science deems necessary to meet the goals and timelines of the Paris Agreement – limiting global warming to well below 2°C above pre-industrial levels and pursuing efforts to limit warming to 1.5°C. The Science Based Targets initiative (SBTi), a partnership between CDP, the United Nations Global Compact, World Resources Institute (WRI) and the World Wide Fund for Nature (WWF), provides companies with independent assessment and validation of targets and is currently the internationally accepted standard. 5 Indicative number provided to illustrate the number of suppliers by total addressable spend that have committed to or have science-based targets in place. In our 2022 Annual Report on Form 20-F we reported 47% progress based on a review of our top 500 suppliers by addressable spend. Our current progress is reported here based on a review of our top 2,000 suppliers by addressable spend. 6 Based on our indicative supply chain emissions inventory. DEFRA conversion factors – which Barclays uses to calculate spend data into supply chain emissions – were revised in 2023. These have been retrospectively applied to Barclays' 2018 baseline and 2022 disclosure, resulting in an increased 2018 baseline and recalculated 2022 metrics. In FY 2022 we reported 8% reduction in our supply chain GHG emissions and due to the changes in the DEFRA conversion factors and updated internal data, we recalculated the 2022 figure to be 17%. As our suppliers continue to develop the quality of emissions data for the goods and services we purchase, our reliance on spend data to calculate our emissions will reduce and the volume of primary data will increase. 7 Campuses include 1 Churchill Place, Radbroke, Northampton, Glasgow, Pune, Whippany, 745 7th Avenue, Dryrock. 8 Reported waste diversion performance for FY2022 has been recalculated from 65% to 49%, to account for an update in external data. 9 Addressable spend is defined as external costs incurred by Barclays in the normal course of business where Procurement has influence over where the spend is placed. It excludes costs such as regulatory fines or charges, exchange fees, taxation, employee expenses or litigation costs, and property rent. Please see ESG Data Centre for all recalculations and ESG Reporting Framework for our operational emissions accounting approach. Strategy Climate and sustainability report Governance Risk review Financial review Financial statements Barclays PLC 2023 Annual Report on Form 20-F 30 Implementing our Climate Strategy (continued) TCFD Strategy Recommendation (b) | Strategic Pillar 1
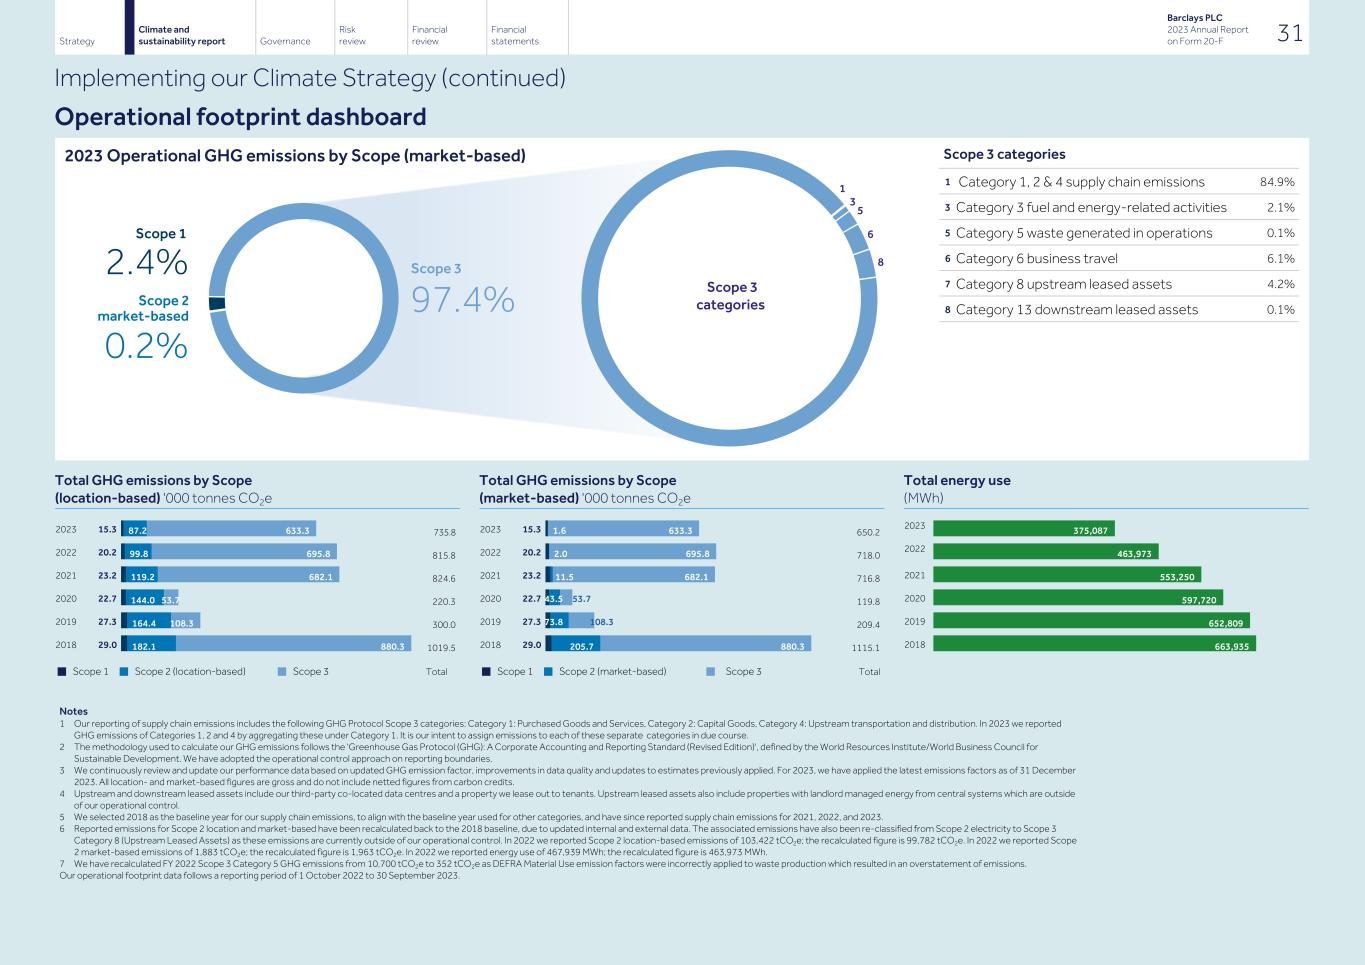
2023 Operational GHG emissions by Scope (market-based) Scope 3 categories 1 Category 1, 2 & 4 supply chain emissions 84.9% 3 Category 3 fuel and energy-related activities 2.1% 5 Category 5 waste generated in operations 0.1% 6 Category 6 business travel 6.1% 7 Category 8 upstream leased assets 4.2% 8 Category 13 downstream leased assets 0.1% Total GHG emissions by Scope (location-based) '000 tonnes CO2e 2023 15.3 2022 20.2 2021 23.2 2020 22.7 2019 27.3 2018 29.0 87.2 99.8 119.2 144.0 164.4 182.1 633.3 695.8 682.1 53.7 108.3 880.3 735.8 815.8 824.6 220.3 300.0 1019.5 n Scope 1 n Scope 2 (location-based) n Scope 3 Total Total GHG emissions by Scope (market-based) '000 tonnes CO2e 2023 15.3 2022 20.2 2021 23.2 2020 22.7 2019 27.3 2018 29.0 1.6 2.0 11.5 205.7 633.3 695.8 682.1 880.3 650.2 718.0 716.8 119.8 209.4 1115.1 n Scope 1 n Scope 2 (market-based) n Scope 3 Total Total energy use (MWh) 2023 2022 2021 2020 2019 2018 375,087 463,973 553,250 597,720 652,809 663,935 Notes 1 Our reporting of supply chain emissions includes the following GHG Protocol Scope 3 categories: Category 1: Purchased Goods and Services, Category 2: Capital Goods, Category 4: Upstream transportation and distribution. In 2023 we reported GHG emissions of Categories 1, 2 and 4 by aggregating these under Category 1. It is our intent to assign emissions to each of these separate categories in due course. 2 The methodology used to calculate our GHG emissions follows the 'Greenhouse Gas Protocol (GHG): A Corporate Accounting and Reporting Standard (Revised Edition)', defined by the World Resources Institute/World Business Council for Sustainable Development. We have adopted the operational control approach on reporting boundaries. 3 We continuously review and update our performance data based on updated GHG emission factor, improvements in data quality and updates to estimates previously applied. For 2023, we have applied the latest emissions factors as of 31 December 2023. All location- and market-based figures are gross and do not include netted figures from carbon credits. 4 Upstream and downstream leased assets include our third-party co-located data centres and a property we lease out to tenants. Upstream leased assets also include properties with landlord managed energy from central systems which are outside of our operational control. 5 We selected 2018 as the baseline year for our supply chain emissions, to align with the baseline year used for other categories, and have since reported supply chain emissions for 2021, 2022, and 2023. 6 Reported emissions for Scope 2 location and market-based have been recalculated back to the 2018 baseline, due to updated internal and external data. The associated emissions have also been re-classified from Scope 2 electricity to Scope 3 Category 8 (Upstream Leased Assets) as these emissions are currently outside of our operational control. In 2022 we reported Scope 2 location-based emissions of 103,422 tCO2e; the recalculated figure is 99,782 tCO2e. In 2022 we reported Scope 2 market-based emissions of 1,883 tCO2e; the recalculated figure is 1,963 tCO2e. In 2022 we reported energy use of 467,939 MWh; the recalculated figure is 463,973 MWh. 7 We have recalculated FY 2022 Scope 3 Category 5 GHG emissions from 10,700 tCO2e to 352 tCO2e as DEFRA Material Use emission factors were incorrectly applied to waste production which resulted in an overstatement of emissions. Our operational footprint data follows a reporting period of 1 October 2022 to 30 September 2023. Strategy Climate and sustainability report Governance Risk review Financial review Financial statements Barclays PLC 2023 Annual Report on Form 20-F 31 Implementing our Climate Strategy (continued) Operational footprint dashboard 97.4% 0.2% 2.4% Scope 3 Scope 2 Scope 1 3 5 6 8 1 Scope 3 categories 43.5 53.7 73.8 108.3 market-based
Reducing our Scope 1 and 2 emissions In 2023, to reduce our Scope 1 and 2 emissions, we maintained focus on improving energy efficiency and replacing fossil-fuel-powered infrastructure with lower-emission alternatives. Energy efficiency measures reduce our overall energy demand and reliance on the grid to power our operations. Concurrently, by replacing fossil- fuel-powered infrastructure, for example, by electrifying our buildings and company vehicles, we will aim to eliminate a significant part of our Scope 1 emissions and prepare our infrastructure to consume electricity from renewable sources. Increasing energy efficiency To continually improve operational energy efficiency, in 2023 we maintained global demand reduction programmes and right-sized1 our global real estate portfolio – resulting in 44% energy consumption reduction against a 2018 baseline. These efforts also contributed to progress against our global corporate offices,2 energy use intensity (EUI) milestone by reducing our EUI by 27% against a 2018 baseline. Our global energy optimisation programme contributed to our EUI reduction by adjusting corporate offices' settings and systems during periods of low or no occupancy to reduce our demand for energy while keeping our buildings running. In 20233 the programme contributed to approximately 9.1 GWh in energy savings at our UK corporate offices – equivalent to the annual electricity consumption of approximately 2,600 UK households. Programme projects included Glasgow campus baseload4 reductions, where we reduced overnight usage of building equipment such as our lighting, heating and cooling systems, and power reductions for our building equipment at 1 Churchill Place in London, planned over bank holidays. Moving forward, we plan to implement the energy optimisation programme at additional corporate offices. Electrification and replacing fossil-fuel- powered infrastructure In 2023 we continued electrifying our real estate portfolio by replacing end-of-life natural gas heating and cooling equipment with electric- powered alternatives and prioritising electrification in campus developments wherever possible, For example, at our Glasgow campus we replaced natural gas boilers with an air source heat pump – leading to an 84% reduction in Scope 1 GHG emissions compared to 2022 at that campus. As part of the campus redevelopments at 1 Churchill Place, we are electrifying our kitchen cooking stoves. We will continue to incorporate electrification and fossil- fuel-powered infrastructure replacement into future real estate decisions. As part of our commitment to Climate Group's EV100 initiative, we have also made progress in transitioning our corporate vehicle fleet to electric vehicles (EVs) or ultra-low emissions vehicles (ULEVs). By the end of 2023 88% of our UK fleet was converted to EVs and 42% of our global fleet was converted to EVs or ULEVs. All UK colleagues provided with a company car for their role have also been offered funded home-charging equipment to ease the transition to a fully electrified fleet. In addition, we are replacing existing mobile banking vans with electric vans, providing a less carbon-intensive method of serving our Barclays UK customers and communities compared to the previous diesel-fuelled vehicles. Replacing fossil fuels with renewable energy In 2023 we maintained 100% renewable electricity sourcing for our global real estate portfolio through instruments including green tariffs5 (55%) and energy attribute certificates6 (EACs)(45%), continuing to meet our 2025 target ahead of schedule. We also maintained our long-term focus on planning additional on-site renewable energy installations and exploring tools like Power Purchase Agreements (PPAs) that bring additional renewable energy to the grid. We continued developing strategies for on-site renewable energy installations such as solar panels, and have coordinated with stakeholders like local utilities and planning boards with the intent of installing these types of projects in coming years. Sites with existing solar panel installations, including Glasgow, Pune, Northampton and Cambridge Eagle Lab, have 0.40 MW of renewable electricity capacity. Beginning in 2024, up to 80%7 of Barclays' annual UK electricity needs will be sourced through a PPA supporting Creag Riabhach, an onshore wind farm project in Scotland. Scope 1 and 2 emissions data accounting We continue to work on improving our data quality and accounting methodologies to make meaningful comparisons of emissions data over time and to make informed strategic decisions. Given the evolving nature of climate data and methodologies, past-period figures may change to reflect updates. To manage the impact of these changes we have detailed our operational climate data accounting approach in the ESG Reporting Framework on our ESG Resource Hub.	 Notes: 1 By right-sizing we are optimising our space and associated resources for our operational needs. 2 Corporate offices include offices and campuses. 3 Data represents reduction from 1 October 2022 to 30 September 2023. 4 Baseload is the minimum load experienced by a building energy system over a given period of time, that must be supplied at all times. 5 Green tariffs are programmes in regulated electricity markets offered by utilities, allowing large commercial and industrial customers to buy bundled renewable electricity from a specific project through a special utility tariff rate. 6 Energy attribute certificates are the official documentation to prove renewable energy procurement. Each EAC represents proof that 1 MWh of renewable energy has been produced and added to the grid. Global EAC standards for renewable claims are primarily Guarantees of Origin in Europe and UK,Renewable Energy Certificates (RECs) in North America and International RECs (I-RECs) in a growing number of countries in Asia, Africa, the Middle East and Latin America. 7 Figure has been estimated using 2022 UK real estate property portfolio electricity consumption as a reference. Strategy Climate and sustainability report Governance Risk review Financial review Financial statements Barclays PLC 2023 Annual Report on Form 20-F 32 Implementing our Climate Strategy (continued) TCFD Strategy Recommendation (b) | Strategic Pillar 1
Addressing our Scope 3 operational emissions Supply chain To support our net zero operations strategy, in 2023 we continued to implement our supply chain net zero pathway. As part of our pathway we are working towards a 50% reduction in our supply chain GHG emissions by the end of 2030 and a long-term milestone of 90% emissions reduction by end of 2050 (both against a 2018 baseline). In developing our supply chain net zero emissions pathway, we used the Science Based Targets initiative (SBTi) Corporate Net Zero Standard and Target Setting Tool, consistent with a 1.5ºC- aligned pathway. Engagement and integration Engagement with our suppliers is a key vehicle for change. Our strategy is to engage proactively and constructively across our supplier organisations to increase climate transparency and accountability, and promote emissions reduction. In 2023 we invited 489 of our suppliers to disclose climate- related information such as governance, risk strategy, targets and performance, emissions methodology and data related to climate change, through CDP. We achieved a 75% participation rate, representing approximately 75% of Barclays' 2023 supply chain emissions. In 2022 we updated our standard supplier contract terms with requirements relating to climate change, including an obligation for our suppliers to have an emissions reduction programme in place by 2025, supported by a public reduction target and a commitment to achieve net zero GHG emissions no later than 2050. In 2023 we continued to embed the discussion and negotiation of these terms into new contracts and renewals. This is one of the steps we are taking to work towards our milestone of 90% of our suppliers, by addressable spend, to have science-based GHG emissions reduction targets in place by end of 2030. The terms also include a requirement for our suppliers to periodically disclose their direct and indirect GHG emissions using a recognised standard, such as the GHG Protocol Corporate Accounting and Reporting Standard. We have also continued to work internally with our Sourcing colleagues to embed the consideration of GHG emissions into some of our key tenders for Supplier and Product selection. We are starting to embed the consideration of GHG emissions at the point of demand through seeking less-GHG-emission- intensive ways of meeting our needs. For example, the procurement process for capital projects now integrates sustainability into building design principles through embedding a Sustainability Design and Construction Checklist. Lastly, to support our engagement with suppliers, in 2023 we conducted an intelligence gathering exercise across our top 2,000 suppliers (based on spend1) to seek understanding of their position on environmental and social matters. Data enhancement Our strategy to achieve our milestones is underpinned by obtaining more accurate emissions data from our suppliers, to inform our approach to reducing emissions. Ultimately, we are reliant on our suppliers to provide accurate product-level primary data, in addition to reducing GHG emissions associated with the goods and services we purchase from them, to achieve emissions reductions across their own organisations. To measure progress towards our emissions reduction milestones and inform our supplier intervention strategy, reliable primary GHG emissions data will need to be collected and tracked over time across our supplier organisations. In 2022 primary data accounted for approximately 15% of our supply chain emissions inventory, increasing to 27% in 2023. We understand that our success depends on that of our suppliers, and that progress may be variable and non-linear. Geographic considerations, resource capacities, data availability, legal requirements, market conditions and the varying transition pathways individual companies take, given the technologies available, may all affect the speed at which they can reduce emissions. Supply chain baseline DEFRA conversion factors – which Barclays uses to calculate spend data into supply chain emissions – were revised in 2023. These have been retrospectively applied to Barclays' 2018 baseline and 2022 supply chain emissions, resulting in an increased 2018 baseline and revised 2022 figures. Our 2022 performance against supply chain milestone2 increased from 8% to 17% due to the change in the DEFRA conversion factors and updated internal data. As our suppliers continue to develop the quality of emissions data for the goods and services we purchase, our reliance on spend data to calculate our emissions will reduce and the volume of primary data will increase. Notes 1 In this section, when referring to 'spend', this is addressable spend, defined as external costs incurred by Barclays in the normal course of business where Procurement has influence over where the spend is placed. It excludes costs such as regulatory fines or charges, exchange fees, taxation, employee expenses or litigation costs, and property rent. 2 Milestones referred to include: 'By end of 2030 we intend to work towards the milestone of 50% GHG supply chain emissions reduction (against a 2018 baseline).' and 'By end of 2050 we intend to work towards the milestone of 90% GHG supply chain emissions reduction (against a 2018 baseline)'. Strategy Climate and sustainability report Governance Risk review Financial review Financial statements Barclays PLC 2023 Annual Report on Form 20-F 33 Implementing our Climate Strategy (continued) TCFD Strategy Recommendation (b) | Strategic Pillar 1
Business travel In 2023 we continued engaging with our stakeholders and colleagues to provide information and tools to encourage more sustainable travel choices. For example, we updated our booking and reporting platforms to highlight low-carbon modes of transport for our colleagues, including EV rentals where available. We provided colleagues with additional guidelines illustrating how they can reduce their travel emissions – identifying, for example, where they could combine multiple trips or switch from air to rail travel. We also continued to engage with our preferred airline partners to explore their plans to use sustainable aviation fuel (SAF). Our 2023 total colleague business travel emissions reduced by 43% against a 2018 baseline – noting these emissions doubled compared to 2022 due to a return to business travel post-COVID. We will continue to engage with our stakeholders and provide colleagues with the tools and resources to align with our net zero ambition. Our intent is to improve the accuracy of our business travel data to better inform emission reduction strategies. Leased assets and waste While our leased assets and waste emissions are lower than other operational emissions, we are pursuing opportunities to reduce them. For example, in 2023 we introduced a Green Leasing Toolkit to support engagements with landlords by encouraging the inclusion of our sustainability criteria throughout the leasing real estate lifecycle. The toolkit includes guidance and preferred contractual language for lease preferences. We are also embedding circular economy principles within our operations. Carbon credits We are currently reviewing our approach to the use of voluntary carbon market credits for operational emissions. We remain supportive of initiatives to enhance the integrity of the voluntary carbon market across both the supply and demand side. Supporting our colleagues Our goal is to provide colleagues with the tools and support needed to help reduce their individual environmental footprints. In 2023, for example: • We continued to expand our range of green benefits for colleagues, including our UK EV salary sacrifice and UK and Ireland Bike4Work schemes. In 2023 over 900 colleagues ordered EVs through salary sacrifice and over 650 made use of Bike4Work • Officially launched in 2022, our Barclays Go Green sustainability gamification programme helps colleagues take and track actions that reduce their personal environmental footprint. In 2023, colleagues participated in over 20,000 activities – such as switching off laptop equipment, opting for lower-carbon travel methods and replacing single-use items like cups with reusable alternatives • Our 14 global employee-led environment networks created and participated in activities aligned with Barclays’ climate and sustainability strategy. Strategy Climate and sustainability report Governance Risk review Financial review Financial statements Barclays PLC 2023 Annual Report on Form 20-F 34 Implementing our Climate Strategy (continued) TCFD Strategy Recommendation (b) | Strategic Pillar 1
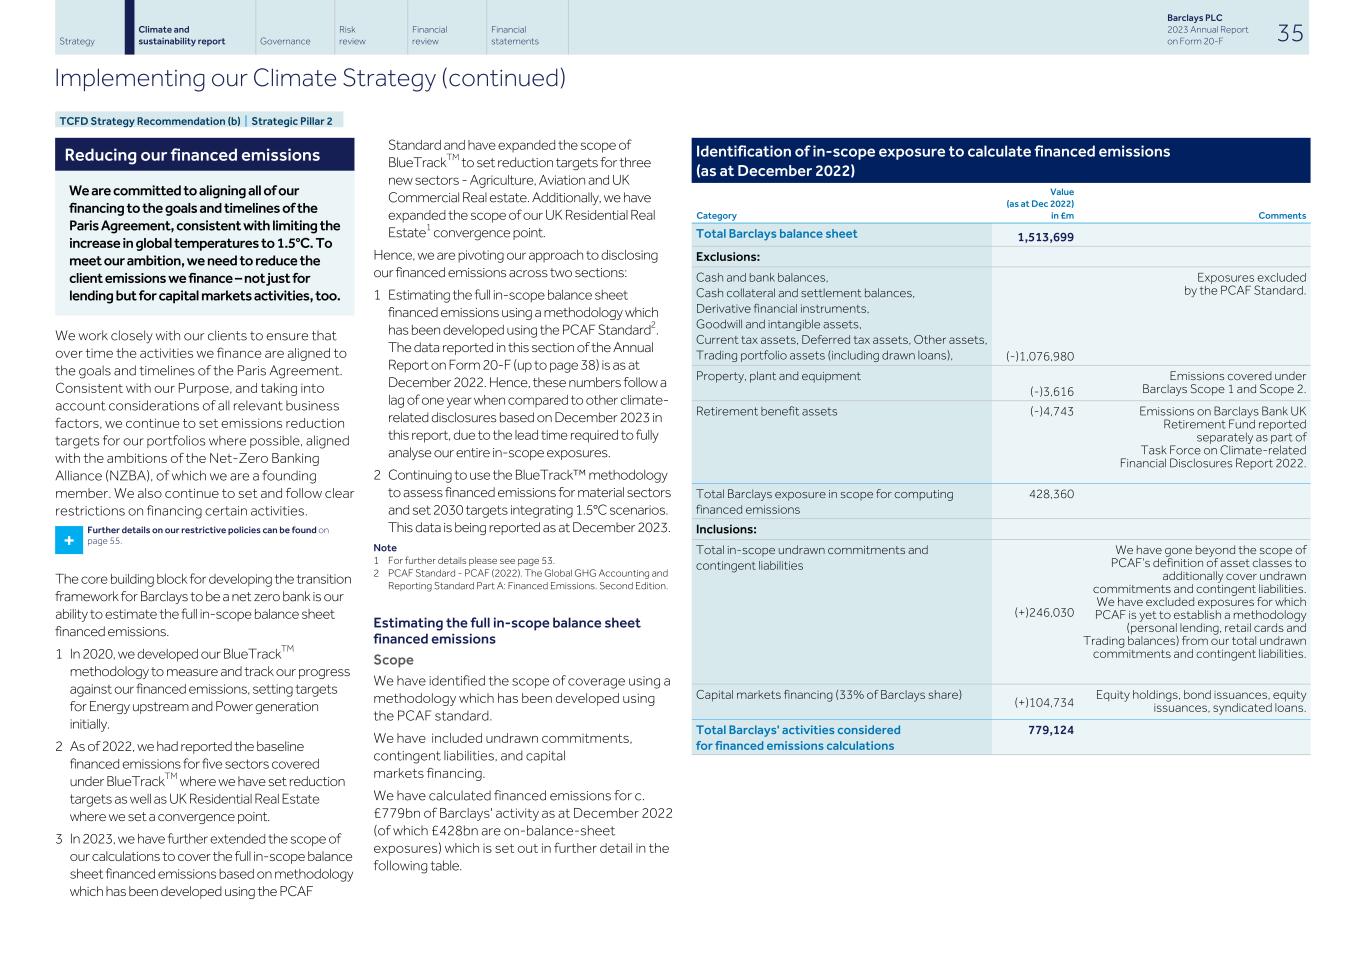
Reducing our financed emissions We are committed to aligning all of our financing to the goals and timelines of the Paris Agreement, consistent with limiting the increase in global temperatures to 1.5°C. To meet our ambition, we need to reduce the client emissions we finance – not just for lending but for capital markets activities, too. We work closely with our clients to ensure that over time the activities we finance are aligned to the goals and timelines of the Paris Agreement. Consistent with our Purpose, and taking into account considerations of all relevant business factors, we continue to set emissions reduction targets for our portfolios where possible, aligned with the ambitions of the Net-Zero Banking Alliance (NZBA), of which we are a founding member. We also continue to set and follow clear restrictions on financing certain activities. + Further details on our restrictive policies can be found on page 55. The core building block for developing the transition framework for Barclays to be a net zero bank is our ability to estimate the full in-scope balance sheet financed emissions. 1 In 2020, we developed our BlueTrackTM methodology to measure and track our progress against our financed emissions, setting targets for Energy upstream and Power generation initially. 2 As of 2022, we had reported the baseline financed emissions for five sectors covered under BlueTrackTM where we have set reduction targets as well as UK Residential Real Estate where we set a convergence point. 3 In 2023, we have further extended the scope of our calculations to cover the full in-scope balance sheet financed emissions based on methodology which has been developed using the PCAF Standard and have expanded the scope of BlueTrackTM to set reduction targets for three new sectors - Agriculture, Aviation and UK Commercial Real estate. Additionally, we have expanded the scope of our UK Residential Real Estate1 convergence point. Hence, we are pivoting our approach to disclosing our financed emissions across two sections: 1 Estimating the full in-scope balance sheet financed emissions using a methodology which has been developed using the PCAF Standard2. The data reported in this section of the Annual Report on Form 20-F (up to page 38) is as at December 2022. Hence, these numbers follow a lag of one year when compared to other climate- related disclosures based on December 2023 in this report, due to the lead time required to fully analyse our entire in-scope exposures. 2 Continuing to use the BlueTrack™ methodology to assess financed emissions for material sectors and set 2030 targets integrating 1.5°C scenarios. This data is being reported as at December 2023. Note 1 For further details please see page 53. 2 PCAF Standard - PCAF (2022). The Global GHG Accounting and Reporting Standard Part A: Financed Emissions. Second Edition. Estimating the full in-scope balance sheet financed emissions Scope We have identified the scope of coverage using a methodology which has been developed using the PCAF standard. We have included undrawn commitments, contingent liabilities, and capital markets financing. We have calculated financed emissions for c. £779bn of Barclays' activity as at December 2022 (of which £428bn are on-balance-sheet exposures) which is set out in further detail in the following table. Identification of in-scope exposure to calculate financed emissions (as at December 2022) Category Value (as at Dec 2022) in £m Comments Total Barclays balance sheet 1,513,699 Exclusions: Cash and bank balances, Cash collateral and settlement balances, Derivative financial instruments, Goodwill and intangible assets, Current tax assets, Deferred tax assets, Other assets, Trading portfolio assets (including drawn loans), Retail lending (personal lending, retail cards) and (-)1,076,980 Exposures excluded by the PCAF Standard. Property, plant and equipment (-)3,616 Emissions covered under Barclays Scope 1 and Scope 2. Retirement benefit assets (-)4,743 Emissions on Barclays Bank UK Retirement Fund reported separately as part of Task Force on Climate-related Financial Disclosures Report 2022. Total Barclays exposure in scope for computing financed emissions 428,360 Inclusions: Total in-scope undrawn commitments and contingent liabilities (+)246,030 We have gone beyond the scope of PCAF’s definition of asset classes to additionally cover undrawn commitments and contingent liabilities. We have excluded exposures for which PCAF is yet to establish a methodology (personal lending, retail cards and Trading balances) from our total undrawn commitments and contingent liabilities. Capital markets financing (33% of Barclays share) (+)104,734 Equity holdings, bond issuances, equity issuances, syndicated loans. Total Barclays' activities considered for financed emissions calculations 779,124 Strategy Climate and sustainability report Governance Risk review Financial review Financial statements Barclays PLC 2023 Annual Report on Form 20-F 35 Implementing our Climate Strategy (continued) TCFD Strategy Recommendation (b) | Strategic Pillar 2
Basis of preparation Our approach for calculating financed emissions is based on a methodology which has been developed using the PCAF Standard with the following key exceptions: 1 We have gone beyond the scope of PCAF’s definition of asset classes to additionally cover undrawn commitments, contingent liabilities and capital markets financing activities. For instance, in the case of a loan we consider the committed amount (both drawn and undrawn), as opposed to just outstanding amounts (which is the approach preferred by PCAF) for calculating financed emissions. 2 We have also consistently used the book value of equity and debt for all clients to calculate the attribution factor, while PCAF recommends using the Enterprise Value Including Cash (EVIC) for listed entities. 3 PCAF recommends calculating emissions at a client level. For certain sectors, clients could have presence in activities across multiple parts of the value chain and in such cases reported emissions may not be consistent and reliable to estimate financed emissions. To overcome this challenge we calculate emissions at an activity level, using a range of options aligned to the PCAF Standard's guidance to calculate client emissions. For certain activities – including fossil fuel exploration and production, electric power generation and automotive manufacturing – we employ asset-level production data to estimate client emissions. For activities such as cement and steel production, we use client-reported emissions. Where we do not have sufficient data on reported emissions or physical activities – for example in relation to mortgages where we do not have EPC data available – we use fall-backs based on emission factors. For an immaterial part of our balance sheet (c. 1%), where the appropriate sector fall-backs could not be reliably obtained, we have used the overall portfolio average economic emissions intensity to estimate emissions. + Our Financed Emissions Methodology paper (published in 2024) provides more details of our methodology and can be found within the ESG Resource Hub: home.barclays/ sustainability/esg-resource-hub/reporting-and-disclosures/ Emissions coverage We have computed our overall financed emissions based on Scope 1 and Scope 2 of our clients’ emissions as at December 2022. Hence, these numbers follow a lag of one year when compared to other disclosures based on December 2023 in this report. The lag of one year is due to the lead time required to fully analyse our entire in-scope exposures. We have excluded our clients’ Scope 3 emissions from these calculations except for activities where we have set a target on Scope 3 emissions – which includes Energy Upstream, Automotive manufacturing LDVs, Aviation and UK Agriculture. - Livestock and Dairy Farming. This is due to challenges in sourcing reliable and consistent data, not just on reported Scope 3 emissions but also the fall-back emission factors for downstream emission estimations. As we refine our approach and data sourcing strategy, we will assess the suitability of including Scope 3 emissions in our financed emissions disclosures. Aligned to the guidance issued by the NZBA, our metrics and targets for all sectors capture emissions on a CO2e basis. For activities where we have set targets, we have assessed which GHGs are relevant and material for the respective sector. Results Barclays has assessed the extent to which the business is aligned to a well-below 2 oC pathway by calculating an estimate of our financed emissions for the full in-scope balance sheet as at December 2022, which has enabled us to calculate the coverage of our financed emissions reduction targets across our portfolio (including integration of 1.5°C aligned scenarios and ranges for certain sectors to reflect dependencies outside our control that will determine how quickly our financed emissions can be reduced in these sectors). Our estimation of our overall financed emissions indicates a total annual Scope 1,2 emissions of c.80MtCO2e for FY2022. Among these, we have set 2030 financed emissions targets covering our clients’ Scope 1,2 emissions (including integration of 1.5°C aligned scenarios and ranges for certain sectors and including UK Housing for which we have set a convergence point) for 55% of our full in-scope balance sheet financed emissions. Beyond this we have also set 2030 targets integrating a 1.5°C aligned scenario covering Scope 3 emissions for Energy Upstream, Automotive manufacturing LDVs, Aviation and UK Agriculture – Livestock and Dairy Farming. Strategy Climate and sustainability report Governance Risk review Financial review Financial statements Barclays PLC 2023 Annual Report on Form 20-F 36 Implementing our Climate Strategy (continued) TCFD Strategy Recommendation (b) | Strategic Pillar 2
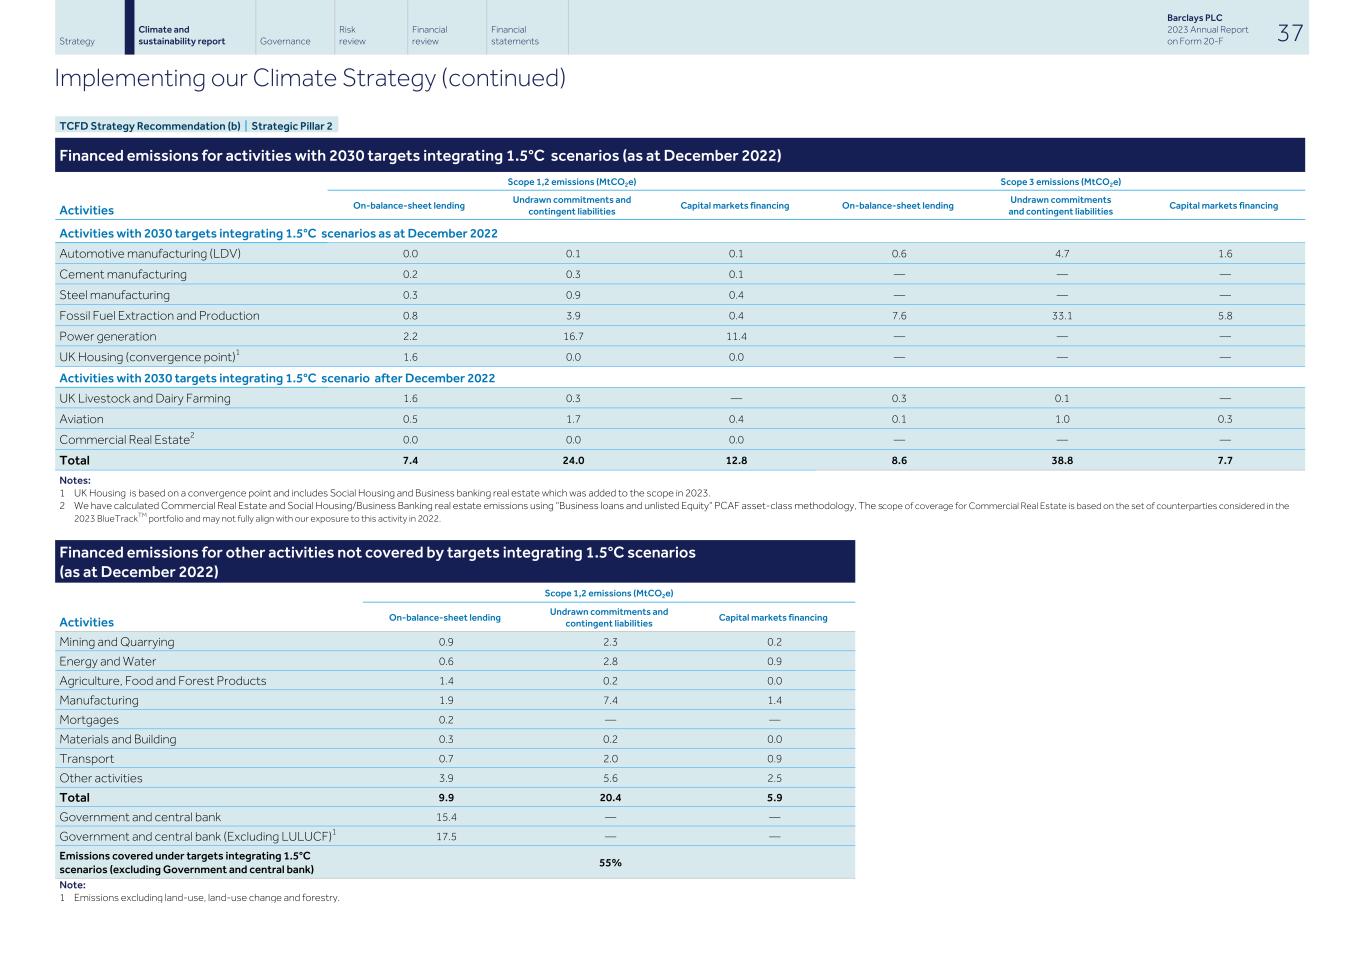
Activities with 2030 targets integrating 1.5°C scenarios as at December 2022 Automotive manufacturing (LDV) 0.0 0.1 0.1 0.6 4.7 1.6 Cement manufacturing 0.2 0.3 0.1 — — — Steel manufacturing 0.3 0.9 0.4 — — — Fossil Fuel Extraction and Production 0.8 3.9 0.4 7.6 33.1 5.8 Power generation 2.2 16.7 11.4 — — — UK Housing (convergence point)1 1.6 0.0 0.0 — — — Activities with 2030 targets integrating 1.5°C scenario after December 2022 UK Livestock and Dairy Farming 1.6 0.3 — 0.3 0.1 — Aviation 0.5 1.7 0.4 0.1 1.0 0.3 Commercial Real Estate2 0.0 0.0 0.0 — — — Total 7.4 24.0 12.8 8.6 38.8 7.7 Notes: 1 UK Housing is based on a convergence point and includes Social Housing and Business banking real estate which was added to the scope in 2023. 2 We have calculated Commercial Real Estate and Social Housing/Business Banking real estate emissions using “Business loans and unlisted Equity” PCAF asset-class methodology, The scope of coverage for Commercial Real Estate is based on the set of counterparties considered in the 2023 BlueTrackTM portfolio and may not fully align with our exposure to this activity in 2022. Financed emissions for activities with 2030 targets integrating 1.5°C scenarios (as at December 2022) Activities Scope 1,2 emissions (MtCO2e) Scope 3 emissions (MtCO2e) On-balance-sheet lending Undrawn commitments and contingent liabilities Capital markets financing On-balance-sheet lending Undrawn commitments and contingent liabilities Capital markets financing Financed emissions for other activities not covered by targets integrating 1.5°C scenarios (as at December 2022) Activities Scope 1,2 emissions (MtCO2e) On-balance-sheet lending Undrawn commitments and contingent liabilities Capital markets financing Mining and Quarrying 0.9 2.3 0.2 Energy and Water 0.6 2.8 0.9 Agriculture, Food and Forest Products 1.4 0.2 0.0 Manufacturing 1.9 7.4 1.4 Mortgages 0.2 — — Materials and Building 0.3 0.2 0.0 Transport 0.7 2.0 0.9 Other activities 3.9 5.6 2.5 Total 9.9 20.4 5.9 Government and central bank 15.4 — — Government and central bank (Excluding LULUCF)1 17.5 — — Emissions covered under targets integrating 1.5°C scenarios (excluding Government and central bank) 55% Note: 1 Emissions excluding land-use, land-use change and forestry. Strategy Climate and sustainability report Governance Risk review Financial review Financial statements Barclays PLC 2023 Annual Report on Form 20-F 37 Implementing our Climate Strategy (continued) TCFD Strategy Recommendation (b) | Strategic Pillar 2
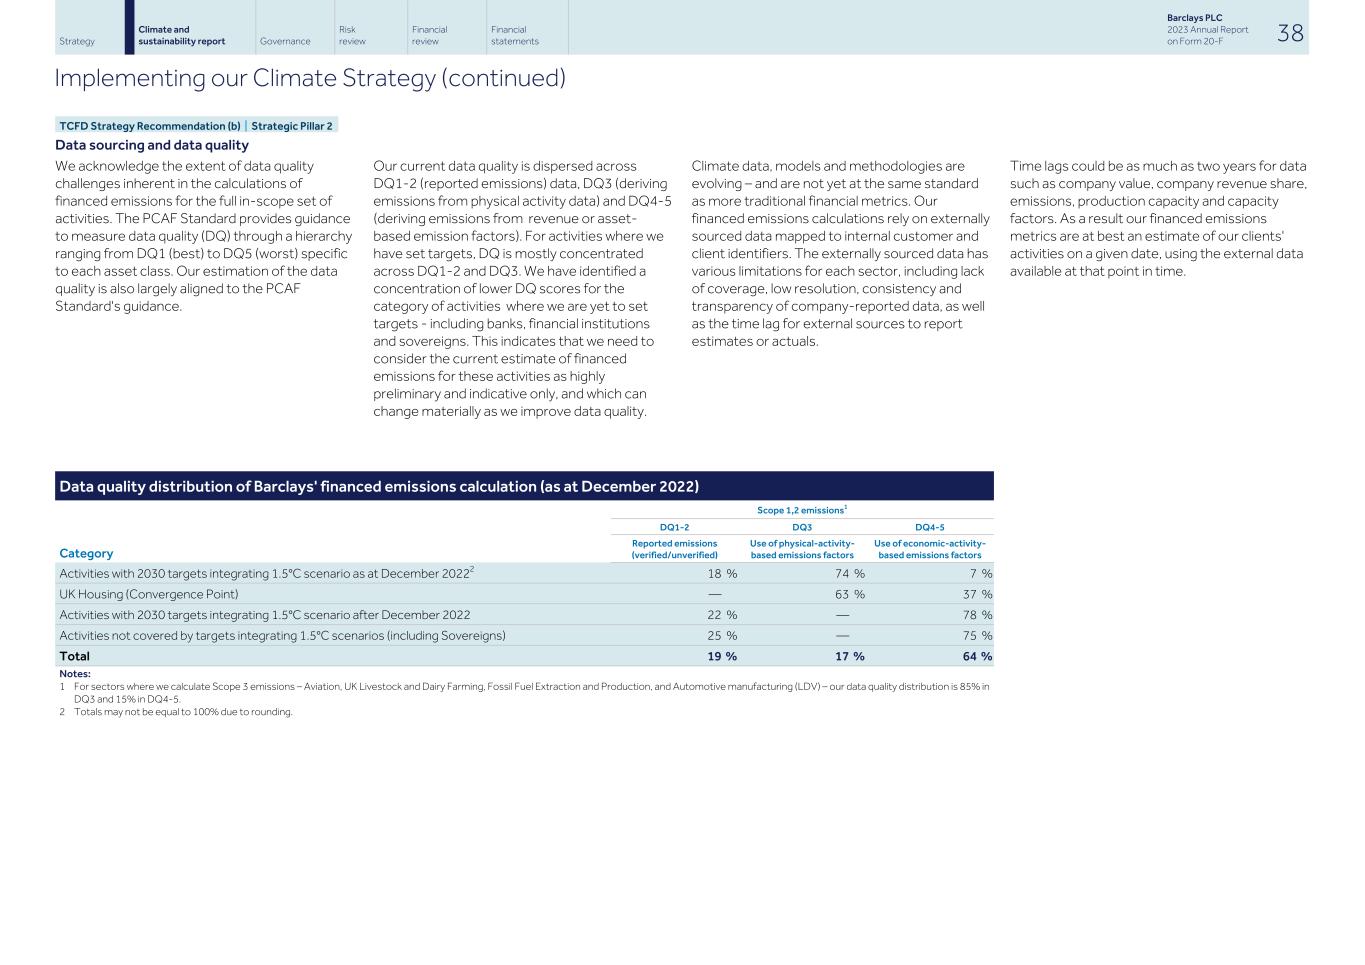
Data sourcing and data quality We acknowledge the extent of data quality challenges inherent in the calculations of financed emissions for the full in-scope set of activities. The PCAF Standard provides guidance to measure data quality (DQ) through a hierarchy ranging from DQ1 (best) to DQ5 (worst) specific to each asset class. Our estimation of the data quality is also largely aligned to the PCAF Standard's guidance. Our current data quality is dispersed across DQ1-2 (reported emissions) data, DQ3 (deriving emissions from physical activity data) and DQ4-5 (deriving emissions from revenue or asset- based emission factors). For activities where we have set targets, DQ is mostly concentrated across DQ1-2 and DQ3. We have identified a concentration of lower DQ scores for the category of activities where we are yet to set targets - including banks, financial institutions and sovereigns. This indicates that we need to consider the current estimate of financed emissions for these activities as highly preliminary and indicative only, and which can change materially as we improve data quality. Climate data, models and methodologies are evolving – and are not yet at the same standard as more traditional financial metrics. Our financed emissions calculations rely on externally sourced data mapped to internal customer and client identifiers. The externally sourced data has various limitations for each sector, including lack of coverage, low resolution, consistency and transparency of company-reported data, as well as the time lag for external sources to report estimates or actuals. Time lags could be as much as two years for data such as company value, company revenue share, emissions, production capacity and capacity factors. As a result our financed emissions metrics are at best an estimate of our clients' activities on a given date, using the external data available at that point in time. Data quality distribution of Barclays' financed emissions calculation (as at December 2022) Category Scope 1,2 emissions1 DQ1-2 DQ3 DQ4-5 Reported emissions (verified/unverified) Use of physical-activity- based emissions factors Use of economic-activity- based emissions factors Activities with 2030 targets integrating 1.5°C scenario as at December 20222 18 % 74 % 7 % UK Housing (Convergence Point) — 63 % 37 % Activities with 2030 targets integrating 1.5°C scenario after December 2022 22 % — 78 % Activities not covered by targets integrating 1.5°C scenarios (including Sovereigns) 25 % — 75 % Total 19 % 17 % 64 % Notes: 1 For sectors where we calculate Scope 3 emissions – Aviation, UK Livestock and Dairy Farming, Fossil Fuel Extraction and Production, and Automotive manufacturing (LDV) – our data quality distribution is 85% in DQ3 and 15% in DQ4-5. 2 Totals may not be equal to 100% due to rounding. Strategy Climate and sustainability report Governance Risk review Financial review Financial statements Barclays PLC 2023 Annual Report on Form 20-F 38 Implementing our Climate Strategy (continued) TCFD Strategy Recommendation (b) | Strategic Pillar 2
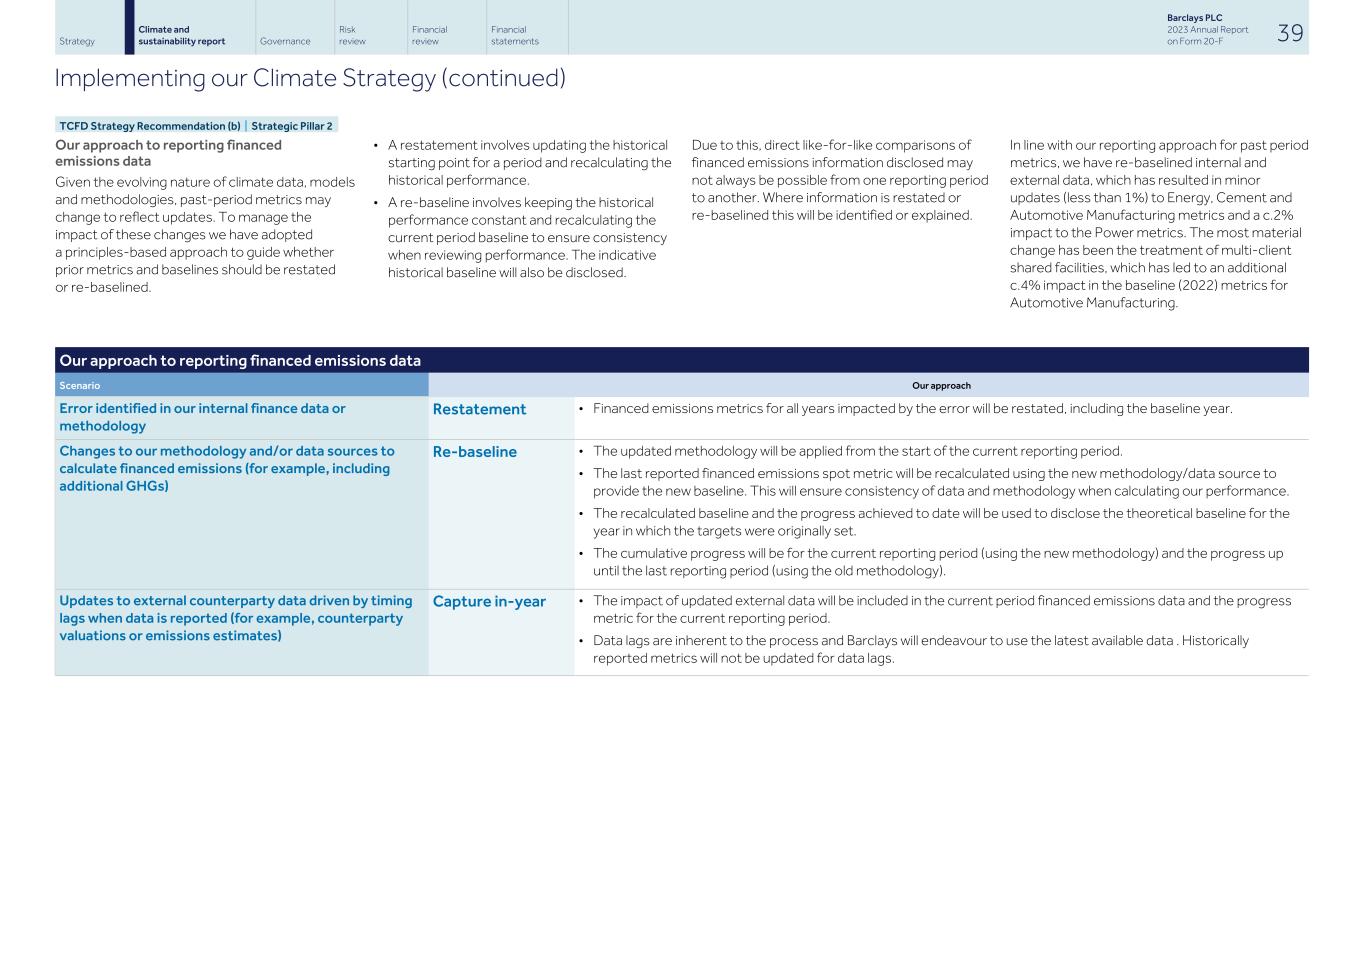
Our approach to reporting financed emissions data Given the evolving nature of climate data, models and methodologies, past-period metrics may change to reflect updates. To manage the impact of these changes we have adopted a principles-based approach to guide whether prior metrics and baselines should be restated or re-baselined. Our approach to reporting financed emissions data Scenario Our approach Error identified in our internal finance data or methodology Restatement • Financed emissions metrics for all years impacted by the error will be restated, including the baseline year. Changes to our methodology and/or data sources to calculate financed emissions (for example, including additional GHGs) Re-baseline • The updated methodology will be applied from the start of the current reporting period. • The last reported financed emissions spot metric will be recalculated using the new methodology/data source to provide the new baseline. This will ensure consistency of data and methodology when calculating our performance. • The recalculated baseline and the progress achieved to date will be used to disclose the theoretical baseline for the year in which the targets were originally set. • The cumulative progress will be for the current reporting period (using the new methodology) and the progress up until the last reporting period (using the old methodology). Updates to external counterparty data driven by timing lags when data is reported (for example, counterparty valuations or emissions estimates) Capture in-year • The impact of updated external data will be included in the current period financed emissions data and the progress metric for the current reporting period. • Data lags are inherent to the process and Barclays will endeavour to use the latest available data . Historically reported metrics will not be updated for data lags. • A restatement involves updating the historical starting point for a period and recalculating the historical performance. • A re-baseline involves keeping the historical performance constant and recalculating the current period baseline to ensure consistency when reviewing performance. The indicative historical baseline will also be disclosed. Due to this, direct like-for-like comparisons of financed emissions information disclosed may not always be possible from one reporting period to another. Where information is restated or re-baselined this will be identified or explained. In line with our reporting approach for past period metrics, we have re-baselined internal and external data, which has resulted in minor updates (less than 1%) to Energy, Cement and Automotive Manufacturing metrics and a c.2% impact to the Power metrics. The most material change has been the treatment of multi-client shared facilities, which has led to an additional c.4% impact in the baseline (2022) metrics for Automotive Manufacturing. Strategy Climate and sustainability report Governance Risk review Financial review Financial statements Barclays PLC 2023 Annual Report on Form 20-F 39 Implementing our Climate Strategy (continued) TCFD Strategy Recommendation (b) | Strategic Pillar 2
Assessing financed emissions for material sectors and net-zero-aligned targets Basis of preparation As part of our commitment under the NZBA, we have set targets for material1 high-emitting sectors in our portfolio. We have developed our BlueTrackTM methodology to measure and track our targets, which incorporate a 1.5°C scenario for our 2030 targets, for these high emitting material sectors2. BlueTrackTM starts by selecting a benchmark for a sector that defines how financed emissions for a portfolio need to change over time, in line with the goals and timelines of the Paris Agreement – consistent with scenarios limiting the increase in global temperatures to 1.5°C. We measure the financed emissions within a selected boundary for a sector, then aggregate these into a portfolio- level metric – which is then compared to the benchmark. BlueTrackTM is being expanded to cover the Agriculture, Aviation and UK Commercial Real Estate sectors. The Residential Real Estate sector is also being expanded to include housing associations and small business buy-to-let lending, and is now referred to as UK Housing. During 2023 we assessed our baseline emissions from our Shipping sector portfolio as part of our NZBA commitment to set targets covering the transportation sector. This assessment concluded that we provided limited financing to a small number of clients and have limited financed emissions overall. We have therefore not set a target for the Shipping sector at this time. We may reassess our approach in the future should this become a more material contributor to our overall financed emissions. + Our Financed Emissions Methodology paper (published in 2024) provides more details of our methodology and can be found within the ESG Resource Hub at: home.barclays/ sustainability/esg-resource-hub/reporting-and-disclosures/ Sector boundaries We have set targets on the segment of the value chain where either (i) it is generally recognised that decarbonisation efforts are likely to spur the rest of the sector value chain to fall into alignment or (ii) where financiers are likely to have more influence over companies active in that segment. Our choice of segment is based on Barclays' own view, informed by guidance and recommended practice from portfolio alignment initiatives such as PACTA, SBTi and others. Emissions scope For each sector target in BlueTrackTM we must consider which of a company's emissions we should measure – for example, direct or indirect emissions, or selected greenhouse gases such as carbon dioxide and methane. We define this according to the GHG Protocol definition of Scope 1, 2, and 3 emissions. Within the boundary of our target we aim to capture the part of a company's value chain that generates most of their emissions, taking into account considerations including materiality, consistency to benchmark, level of control and whether the emissions can be abated by the company. For example, our Upstream Energy target includes Scope 3 emissions – recognising they are significant for a company extracting fossil fuels. The financed emissions covered under BlueTrackTM are therefore a subset of the total financed emissions for each customer or client, as they only include the portion of the client's activities that are within both the value chain we have chosen for the sector and the scope of emissions we deem material for that activity. Use of carbon credits We do not allow company-purchased offsets such as carbon credits to reduce emissions, as we believe it is important to base a metric on operational activities under a company's control – rather than on unrelated credits, the availability of which may be limited. The methodology does allow company-operated removals, such as on-site carbon capture at a plant – however, given this is currently marginal in the context of emissions, there is currently no impact on our portfolio-financed emissions metrics. Target metrics Barclays uses two financed emissions metrics to set targets: 1. Emissions Intensity: how much CO2e (Carbon Dioxide Equivalent) is released on average for a certain amount of economic activity or material produced; 2. Absolute Emissions: a measure of the absolute emissions generated, or fair share, of the company's emissions over time. We use absolute emissions for the Energy and Agriculture sectors, whose decarbonisation pathway relies on a reduction in production volume as well as on a reduction in intensity. The Energy sector cannot reduce its carbon emissions intensity below a certain point – a barrel of oil cannot be decarbonised, for instance – and therefore a reduction in absolute carbon emissions is more appropriate. The Agriculture sector requires a shift away from the production of meat and dairy towards alternative protein sources, as farmers respond to changing diets. We use emissions intensity for the other sectors, whose decarbonisation pathway relies primarily on reduction in intensity rather than volumes. These metrics are sensitive to factors which are not directly related to real world emissions, such as changes in the book value of debt and equity, for absolute emissions, and changes in revenue share for emissions intensity. Reference scenarios Each of our 2030 target ranges is developed with reference to a 1.5°C-aligned scenario. For the majority this is the IEA's Net Zero by 2050 (NZE2050) scenario. In calculating a convergence point for our UK Housing portfolio and a target for UK Agriculture, we use a UK-focused Balanced Net Zero Scenario developed by the UK's Climate Change Committee (CCC BNZ). For the UK CRE portfolio we use the CRREM scenario that provides decarbonisation pathways across different property types consistent with the NZE2050 scenario. For the Aviation sector we use the Mission Possible Partnership (MPP)'s 'Prudent' (PRU) scenario – a 1.5°C-compatible roadmap for the sector to achieve net zero emissions by 2050. Baseline year We measure our financed emissions for each portfolio against a baseline metric determined in the year we first assessed that target. The baseline year therefore varies across the nine sectors assessed to date, to ensure we are using the most up-to-date data available when we set our targets – or, in the case of UK Housing, a convergence point. Use of target ranges For Power, Cement, Steel, Automotive manufacturing and Aviation, we have set emissions intensity targets using a target range. While we are clear on the reduction required to align with the 1.5oC benchmark pathway – the higher emissions reduction in the range – we recognise there are dependencies outside our control that will determine how quickly our financed emissions intensity can be reduced in these sectors. The lower emissions reduction in the range reflects our view of the sector, client pathways and commitments at the time of setting the target. We seek to achieve the higher emissions reduction, consistent with our net zero ambition, but achieving it will depend on external factors. Notes: 1 As defined in Foundations of Climate Mitigation Target Setting published by the UNEP Finance Initiative (https:// www.unepfi.org/wordpress/wp-content/uploads/2022/05/ Foundations-for-climate-mitigation-target-setting.pdf). 2 When we first developed BlueTrack, the best available scenario to develop Paris-aligned benchmarks for our financing portfolios was the International Energy Agency’s Sustainable Development Scenario (SDS) which was aligned to a 1.7°C world. The 2025 targets set for the Energy and Power sectors were informed by the SDS scenario. Strategy Climate and sustainability report Governance Risk review Financial review Financial statements Barclays PLC 2023 Annual Report on Form 20-F 40 Implementing our Climate Strategy (continued) TCFD Strategy Recommendation (b) | Strategic Pillar 2
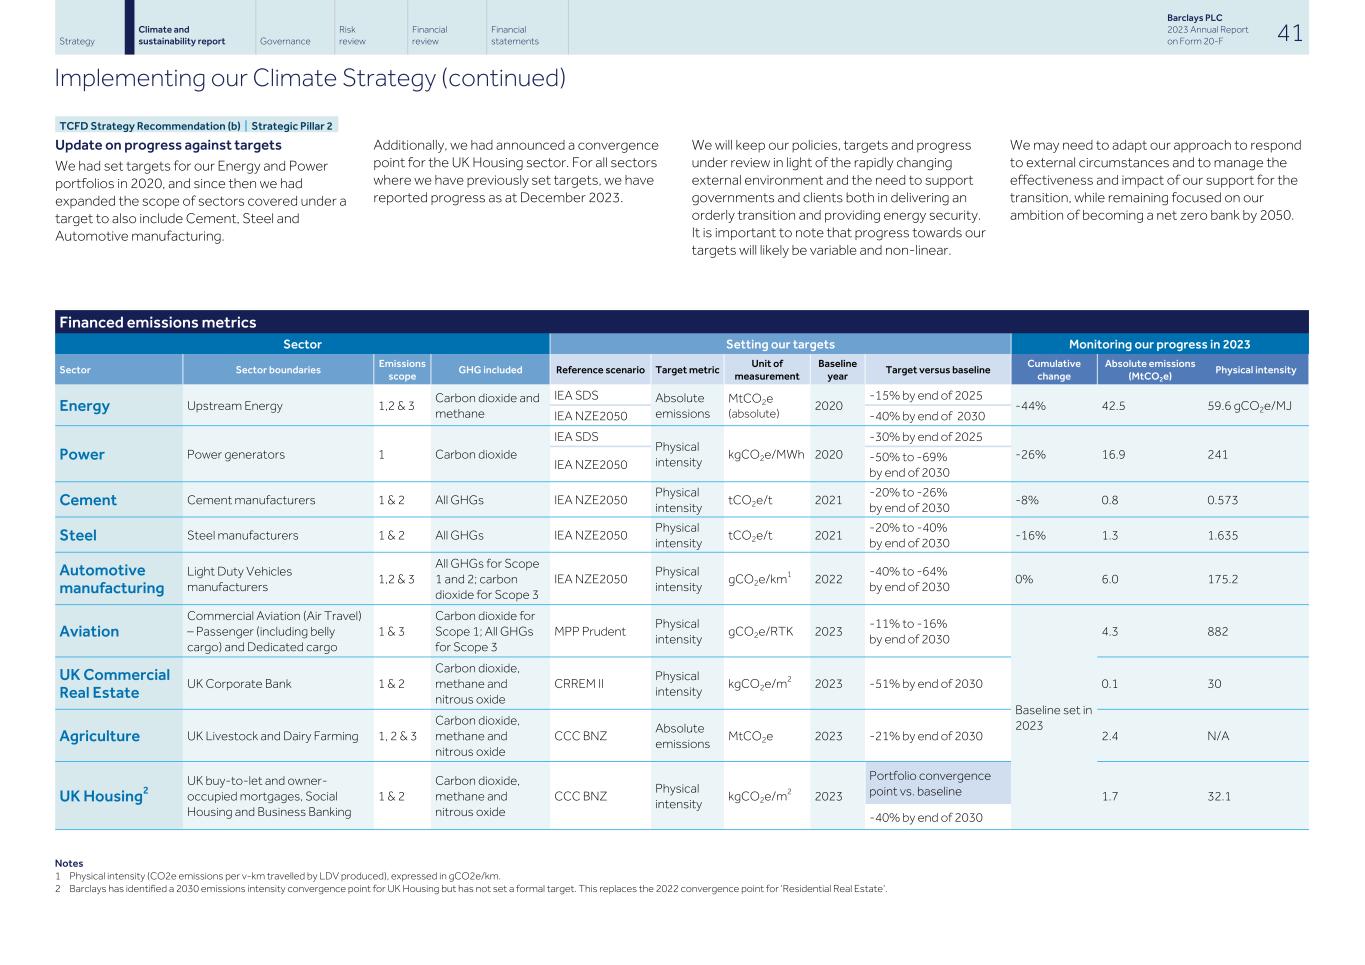
Update on progress against targets We had set targets for our Energy and Power portfolios in 2020, and since then we had expanded the scope of sectors covered under a target to also include Cement, Steel and Automotive manufacturing. Additionally, we had announced a convergence point for the UK Housing sector. For all sectors where we have previously set targets, we have reported progress as at December 2023. We will keep our policies, targets and progress under review in light of the rapidly changing external environment and the need to support governments and clients both in delivering an orderly transition and providing energy security. It is important to note that progress towards our targets will likely be variable and non-linear. We may need to adapt our approach to respond to external circumstances and to manage the effectiveness and impact of our support for the transition, while remaining focused on our ambition of becoming a net zero bank by 2050. Financed emissions metrics Sector Setting our targets Monitoring our progress in 2023 Sector Sector boundaries Emissions scope GHG included Reference scenario Target metric Unit of measurement Baseline year Target versus baseline Cumulative change Absolute emissions (MtCO2e) Physical intensity Energy Upstream Energy 1,2 & 3 Carbon dioxide and methane IEA SDS Absolute emissions MtCO2e (absolute) 2020 -15% by end of 2025 -44% 42.5 59.6 gCO2e/MJ IEA NZE2050 -40% by end of 2030 Power Power generators 1 Carbon dioxide IEA SDS Physical intensity kgCO2e/MWh 2020 -30% by end of 2025 -26% 16.9 241 IEA NZE2050 -50% to -69% by end of 2030 Cement Cement manufacturers 1 & 2 All GHGs IEA NZE2050 Physical intensity tCO2e/t 2021 -20% to -26% by end of 2030 -8% 0.8 0.573 Steel Steel manufacturers 1 & 2 All GHGs IEA NZE2050 Physical intensity tCO2e/t 2021 -20% to -40% by end of 2030 -16% 1.3 1.635 Automotive manufacturing Light Duty Vehicles manufacturers 1,2 & 3 All GHGs for Scope 1 and 2; carbon dioxide for Scope 3 IEA NZE2050 Physical intensity gCO2e/km1 2022 -40% to -64% by end of 2030 0% 6.0 175.2 Aviation Commercial Aviation (Air Travel) – Passenger (including belly cargo) and Dedicated cargo 1 & 3 Carbon dioxide for Scope 1; All GHGs for Scope 3 MPP Prudent Physical intensity gCO2e/RTK 2023 -11% to -16% by end of 2030 Baseline set in 2023 4.3 882 UK Commercial Real Estate UK Corporate Bank 1 & 2 Carbon dioxide, methane and nitrous oxide CRREM II Physical intensity kgCO2e/m2 2023 -51% by end of 2030 0.1 30 Agriculture UK Livestock and Dairy Farming 1, 2 & 3 Carbon dioxide, methane and nitrous oxide CCC BNZ Absolute emissions MtCO2e 2023 -21% by end of 2030 2.4 N/A UK Housing2 UK buy-to-let and owner- occupied mortgages, Social Housing and Business Banking 1 & 2 Carbon dioxide, methane and nitrous oxide CCC BNZ Physical intensity kgCO2e/m2 2023 Portfolio convergence point vs. baseline 1.7 32.1 -40% by end of 2030 Notes 1 Physical intensity (CO2e emissions per v-km travelled by LDV produced), expressed in gCO2e/km. 2 Barclays has identified a 2030 emissions intensity convergence point for UK Housing but has not set a formal target. This replaces the 2022 convergence point for ‘Residential Real Estate’. Strategy Climate and sustainability report Governance Risk review Financial review Financial statements Barclays PLC 2023 Annual Report on Form 20-F 41 Implementing our Climate Strategy (continued) TCFD Strategy Recommendation (b) | Strategic Pillar 2
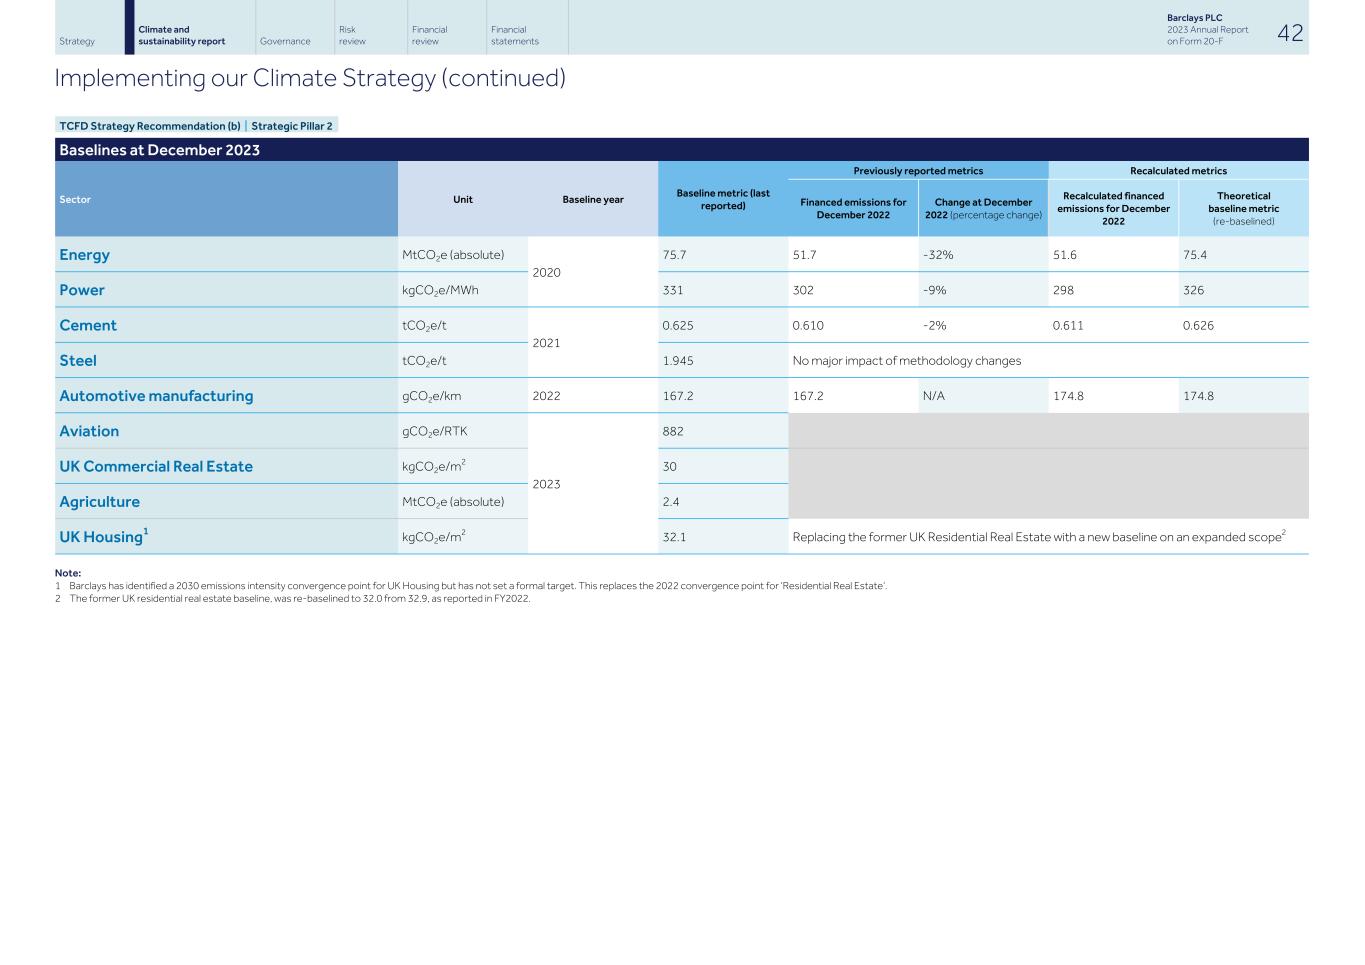
Baselines at December 2023 Sector Unit Baseline year Baseline metric (last reported) Previously reported metrics Recalculated metrics Financed emissions for December 2022 Change at December 2022 (percentage change) Recalculated financed emissions for December 2022 Theoretical baseline metric (re-baselined) Energy MtCO2e (absolute) 2020 75.7 51.7 -32% 51.6 75.4 Power kgCO2e/MWh 331 302 -9% 298 326 Cement tCO2e/t 2021 0.625 0.610 -2% 0.611 0.626 Steel tCO2e/t 1.945 No major impact of methodology changes Automotive manufacturing gCO2e/km 2022 167.2 167.2 N/A 174.8 174.8 Aviation gCO2e/RTK 2023 882 UK Commercial Real Estate kgCO2e/m2 30 Agriculture MtCO2e (absolute) 2.4 UK Housing1 kgCO2e/m2 32.1 Replacing the former UK Residential Real Estate with a new baseline on an expanded scope2 Note: 1 Barclays has identified a 2030 emissions intensity convergence point for UK Housing but has not set a formal target. This replaces the 2022 convergence point for ‘Residential Real Estate’. 2 The former UK residential real estate baseline, was re-baselined to 32.0 from 32.9, as reported in FY2022. Strategy Climate and sustainability report Governance Risk review Financial review Financial statements Barclays PLC 2023 Annual Report on Form 20-F 42 Implementing our Climate Strategy (continued) TCFD Strategy Recommendation (b) | Strategic Pillar 2
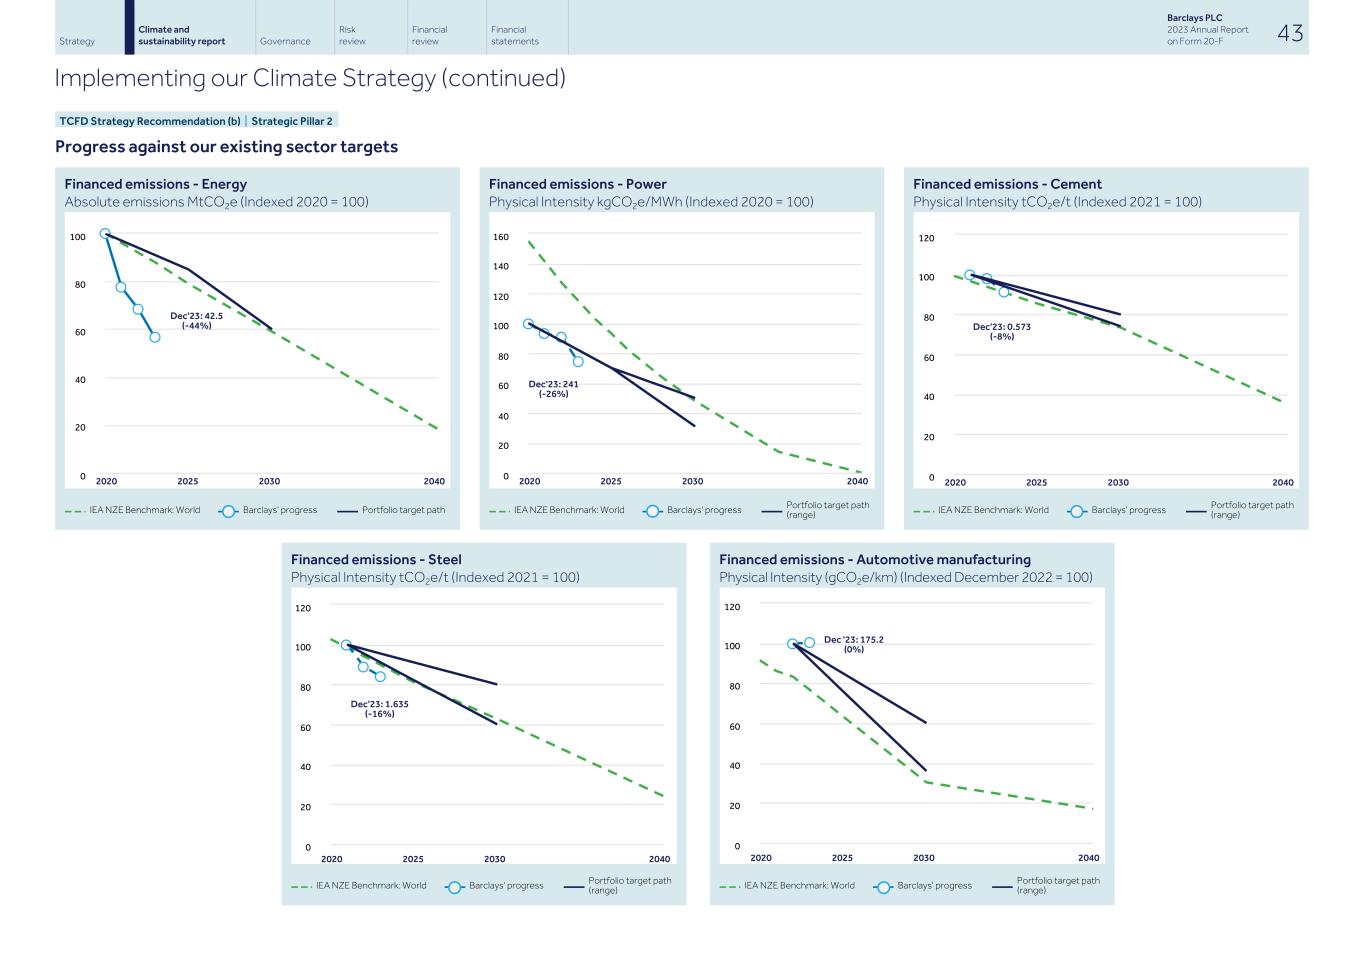
Progress against our existing sector targets Financed emissions - Energy Absolute emissions MtCO2e (Indexed 2020 = 100) IEA NZE Benchmark: World Barclays' progress Portfolio target path Financed emissions - Power Physical Intensity kgCO2e/MWh (Indexed 2020 = 100) IEA NZE Benchmark: World Barclays' progress Portfolio target path (range) Financed emissions - Cement Physical Intensity tCO2e/t (Indexed 2021 = 100) IEA NZE Benchmark: World Barclays' progress Portfolio target path (range) Financed emissions - Steel Physical Intensity tCO2e/t (Indexed 2021 = 100) IEA NZE Benchmark: World Barclays' progress Portfolio target path (range) Financed emissions - Automotive manufacturing Physical Intensity (gCO2e/km) (Indexed December 2022 = 100) IEA NZE Benchmark: World Barclays' progress Portfolio target path (range) Strategy Climate and sustainability report Governance Risk review Financial review Financial statements Barclays PLC 2023 Annual Report on Form 20-F 43 Implementing our Climate Strategy (continued) TCFD Strategy Recommendation (b) | Strategic Pillar 2 0 20 40 60 80 100 120 140 160 Dec'23: 241 (-26%) 0 20 40 60 80 100 Dec'23: 42.5 (-44%) 0 20 40 60 80 100 120 Dec'23: 0.573 (-8%) 0 20 40 60 80 100 120 2020 2025 2030 2040 Dec'23: 1.635 (-16%) 0 20 40 60 80 100 120 2020 2025 2030 2040 Dec '23: 175.2 (0%) 2020 2025 2030 2040 2020 2025 2030 2040 2020 2025 2030 2040
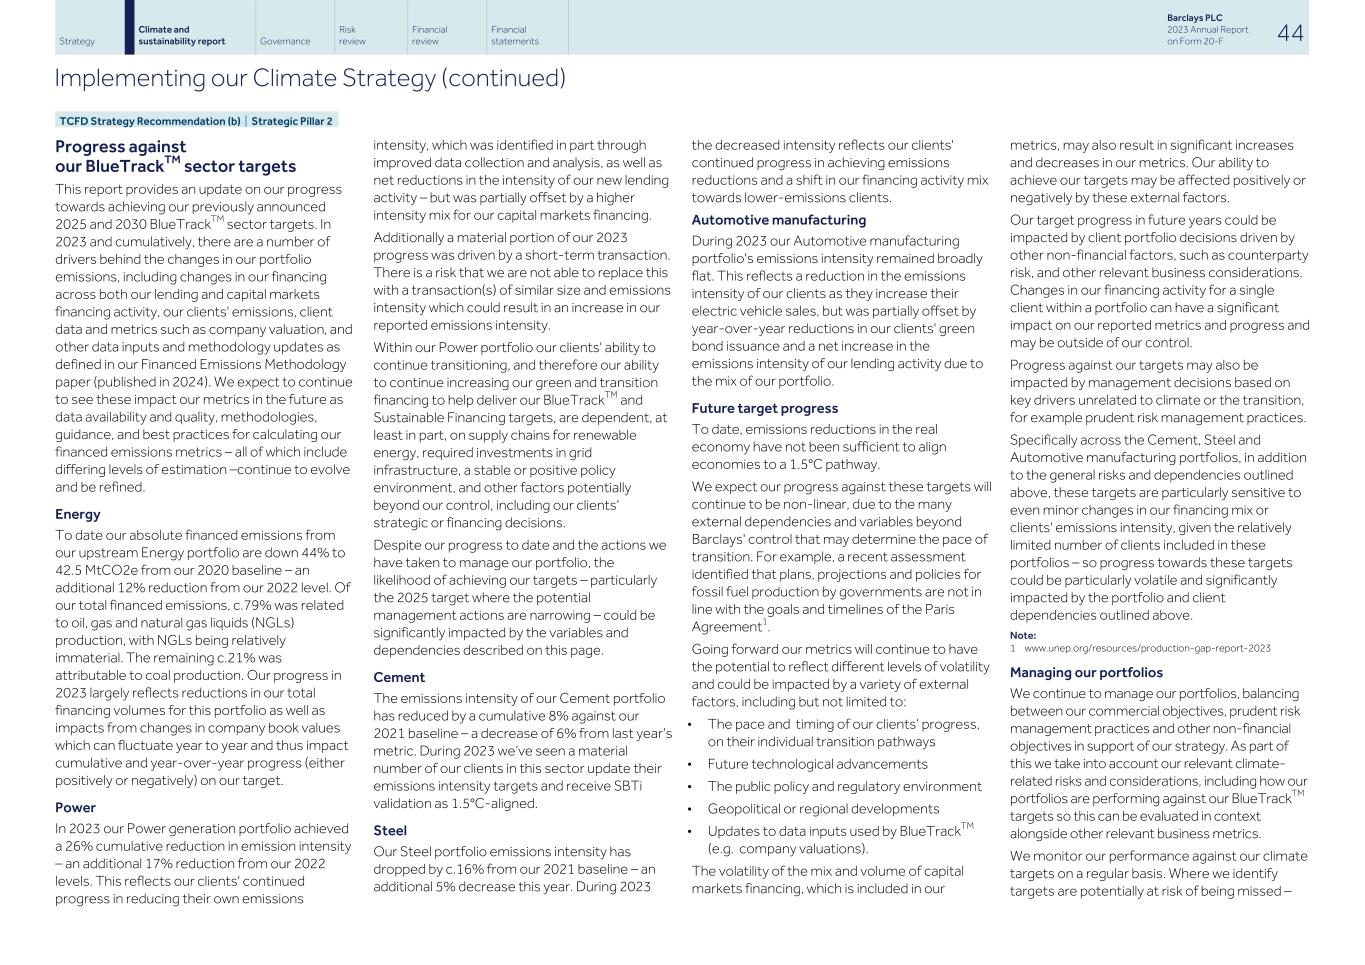
Progress against our BlueTrackTM sector targets This report provides an update on our progress towards achieving our previously announced 2025 and 2030 BlueTrackTM sector targets. In 2023 and cumulatively, there are a number of drivers behind the changes in our portfolio emissions, including changes in our financing across both our lending and capital markets financing activity, our clients' emissions, client data and metrics such as company valuation, and other data inputs and methodology updates as defined in our Financed Emissions Methodology paper (published in 2024). We expect to continue to see these impact our metrics in the future as data availability and quality, methodologies, guidance, and best practices for calculating our financed emissions metrics – all of which include differing levels of estimation –continue to evolve and be refined. Energy To date our absolute financed emissions from our upstream Energy portfolio are down 44% to 42.5 MtCO2e from our 2020 baseline – an additional 12% reduction from our 2022 level. Of our total financed emissions, c.79% was related to oil, gas and natural gas liquids (NGLs) production, with NGLs being relatively immaterial. The remaining c.21% was attributable to coal production. Our progress in 2023 largely reflects reductions in our total financing volumes for this portfolio as well as impacts from changes in company book values which can fluctuate year to year and thus impact cumulative and year-over-year progress (either positively or negatively) on our target. Power In 2023 our Power generation portfolio achieved a 26% cumulative reduction in emission intensity – an additional 17% reduction from our 2022 levels. This reflects our clients' continued progress in reducing their own emissions intensity, which was identified in part through improved data collection and analysis, as well as net reductions in the intensity of our new lending activity – but was partially offset by a higher intensity mix for our capital markets financing. Additionally a material portion of our 2023 progress was driven by a short-term transaction. There is a risk that we are not able to replace this with a transaction(s) of similar size and emissions intensity which could result in an increase in our reported emissions intensity. Within our Power portfolio our clients' ability to continue transitioning, and therefore our ability to continue increasing our green and transition financing to help deliver our BlueTrackTM and Sustainable Financing targets, are dependent, at least in part, on supply chains for renewable energy, required investments in grid infrastructure, a stable or positive policy environment, and other factors potentially beyond our control, including our clients' strategic or financing decisions. Despite our progress to date and the actions we have taken to manage our portfolio, the likelihood of achieving our targets – particularly the 2025 target where the potential management actions are narrowing – could be significantly impacted by the variables and dependencies described on this page. Cement The emissions intensity of our Cement portfolio has reduced by a cumulative 8% against our 2021 baseline – a decrease of 6% from last year’s metric. During 2023 we’ve seen a material number of our clients in this sector update their emissions intensity targets and receive SBTi validation as 1.5°C-aligned. Steel Our Steel portfolio emissions intensity has dropped by c.16% from our 2021 baseline – an additional 5% decrease this year. During 2023 the decreased intensity reflects our clients' continued progress in achieving emissions reductions and a shift in our financing activity mix towards lower-emissions clients. Automotive manufacturing During 2023 our Automotive manufacturing portfolio's emissions intensity remained broadly flat. This reflects a reduction in the emissions intensity of our clients as they increase their electric vehicle sales, but was partially offset by year-over-year reductions in our clients' green bond issuance and a net increase in the emissions intensity of our lending activity due to the mix of our portfolio. Future target progress To date, emissions reductions in the real economy have not been sufficient to align economies to a 1.5°C pathway. We expect our progress against these targets will continue to be non-linear, due to the many external dependencies and variables beyond Barclays' control that may determine the pace of transition. For example, a recent assessment identified that plans, projections and policies for fossil fuel production by governments are not in line with the goals and timelines of the Paris Agreement1. Going forward our metrics will continue to have the potential to reflect different levels of volatility and could be impacted by a variety of external factors, including but not limited to: • The pace and timing of our clients’ progress, on their individual transition pathways • Future technological advancements • The public policy and regulatory environment • Geopolitical or regional developments • Updates to data inputs used by BlueTrackTM (e.g. company valuations). The volatility of the mix and volume of capital markets financing, which is included in our metrics, may also result in significant increases and decreases in our metrics. Our ability to achieve our targets may be affected positively or negatively by these external factors. Our target progress in future years could be impacted by client portfolio decisions driven by other non-financial factors, such as counterparty risk, and other relevant business considerations. Changes in our financing activity for a single client within a portfolio can have a significant impact on our reported metrics and progress and may be outside of our control. Progress against our targets may also be impacted by management decisions based on key drivers unrelated to climate or the transition, for example prudent risk management practices. Specifically across the Cement, Steel and Automotive manufacturing portfolios, in addition to the general risks and dependencies outlined above, these targets are particularly sensitive to even minor changes in our financing mix or clients' emissions intensity, given the relatively limited number of clients included in these portfolios – so progress towards these targets could be particularly volatile and significantly impacted by the portfolio and client dependencies outlined above. Note: 1 www.unep.org/resources/production-gap-report-2023 Managing our portfolios We continue to manage our portfolios, balancing between our commercial objectives, prudent risk management practices and other non-financial objectives in support of our strategy. As part of this we take into account our relevant climate- related risks and considerations, including how our portfolios are performing against our BlueTrackTM targets so this can be evaluated in context alongside other relevant business metrics. We monitor our performance against our climate targets on a regular basis. Where we identify targets are potentially at risk of being missed – Strategy Climate and sustainability report Governance Risk review Financial review Financial statements Barclays PLC 2023 Annual Report on Form 20-F 44 Implementing our Climate Strategy (continued) TCFD Strategy Recommendation (b) | Strategic Pillar 2
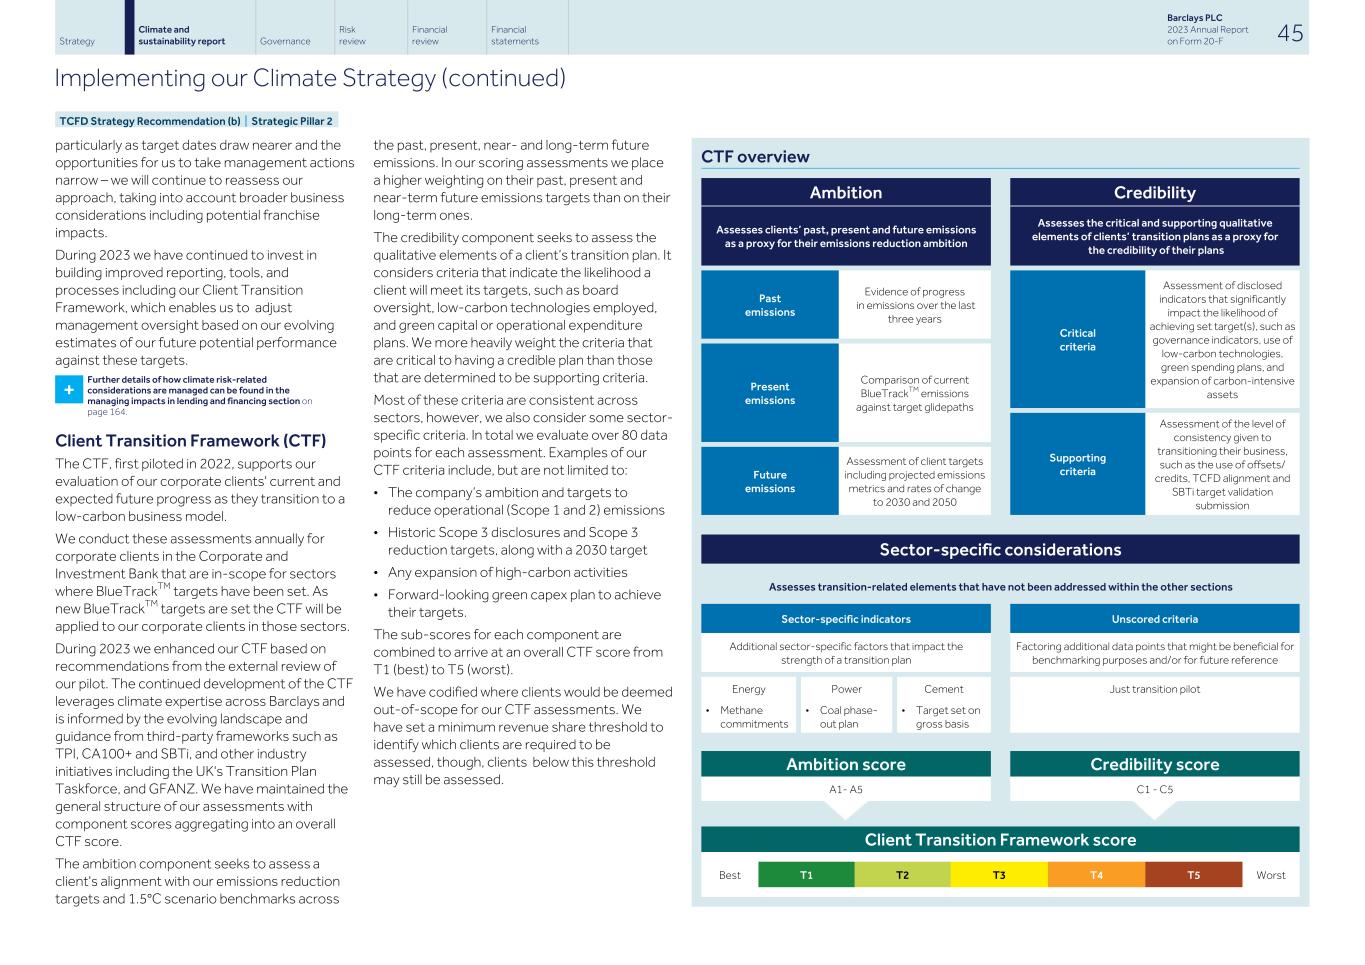
particularly as target dates draw nearer and the opportunities for us to take management actions narrow – we will continue to reassess our approach, taking into account broader business considerations including potential franchise impacts. During 2023 we have continued to invest in building improved reporting, tools, and processes including our Client Transition Framework, which enables us to adjust management oversight based on our evolving estimates of our future potential performance against these targets. + Further details of how climate risk-related considerations are managed can be found in the managing impacts in lending and financing section on page 164. Client Transition Framework (CTF) The CTF, first piloted in 2022, supports our evaluation of our corporate clients' current and expected future progress as they transition to a low-carbon business model. We conduct these assessments annually for corporate clients in the Corporate and Investment Bank that are in-scope for sectors where BlueTrackTM targets have been set. As new BlueTrackTM targets are set the CTF will be applied to our corporate clients in those sectors. During 2023 we enhanced our CTF based on recommendations from the external review of our pilot. The continued development of the CTF leverages climate expertise across Barclays and is informed by the evolving landscape and guidance from third-party frameworks such as TPI, CA100+ and SBTi, and other industry initiatives including the UK's Transition Plan Taskforce, and GFANZ. We have maintained the general structure of our assessments with component scores aggregating into an overall CTF score. The ambition component seeks to assess a client's alignment with our emissions reduction targets and 1.5°C scenario benchmarks across the past, present, near- and long-term future emissions. In our scoring assessments we place a higher weighting on their past, present and near-term future emissions targets than on their long-term ones. The credibility component seeks to assess the qualitative elements of a client’s transition plan. It considers criteria that indicate the likelihood a client will meet its targets, such as board oversight, low-carbon technologies employed, and green capital or operational expenditure plans. We more heavily weight the criteria that are critical to having a credible plan than those that are determined to be supporting criteria. Most of these criteria are consistent across sectors, however, we also consider some sector- specific criteria. In total we evaluate over 80 data points for each assessment. Examples of our CTF criteria include, but are not limited to: • The company’s ambition and targets to reduce operational (Scope 1 and 2) emissions • Historic Scope 3 disclosures and Scope 3 reduction targets, along with a 2030 target • Any expansion of high-carbon activities • Forward-looking green capex plan to achieve their targets. The sub-scores for each component are combined to arrive at an overall CTF score from T1 (best) to T5 (worst). We have codified where clients would be deemed out-of-scope for our CTF assessments. We have set a minimum revenue share threshold to identify which clients are required to be assessed, though, clients below this threshold may still be assessed. CTF overview Ambition Credibility Assesses clients’ past, present and future emissions as a proxy for their emissions reduction ambition Assesses the critical and supporting qualitative elements of clients’ transition plans as a proxy for the credibility of their plans Past emissions Evidence of progress in emissions over the last three years Critical criteria Assessment of disclosed indicators that significantly impact the likelihood of achieving set target(s), such as governance indicators, use of low-carbon technologies, green spending plans, and expansion of carbon-intensive assets Present emissions Comparison of current BlueTrackTM emissions against target glidepaths Supporting criteria Assessment of the level of consistency given to transitioning their business, such as the use of offsets/ credits, TCFD alignment and SBTi target validation submission Future emissions Assessment of client targets including projected emissions metrics and rates of change to 2030 and 2050 Sector-specific considerations Assesses transition-related elements that have not been addressed within the other sections Sector-specific indicators Unscored criteria Additional sector-specific factors that impact the strength of a transition plan Factoring additional data points that might be beneficial for benchmarking purposes and/or for future reference Energy Power Cement Just transition pilot • Methane commitments • Coal phase- out plan • Target set on gross basis Ambition score Credibility score A1- A5 C1 - C5 Client Transition Framework score Best T1 T2 T3 T4 T5 Worst Strategy Climate and sustainability report Governance Risk review Financial review Financial statements Barclays PLC 2023 Annual Report on Form 20-F 45 Implementing our Climate Strategy (continued) TCFD Strategy Recommendation (b) | Strategic Pillar 2
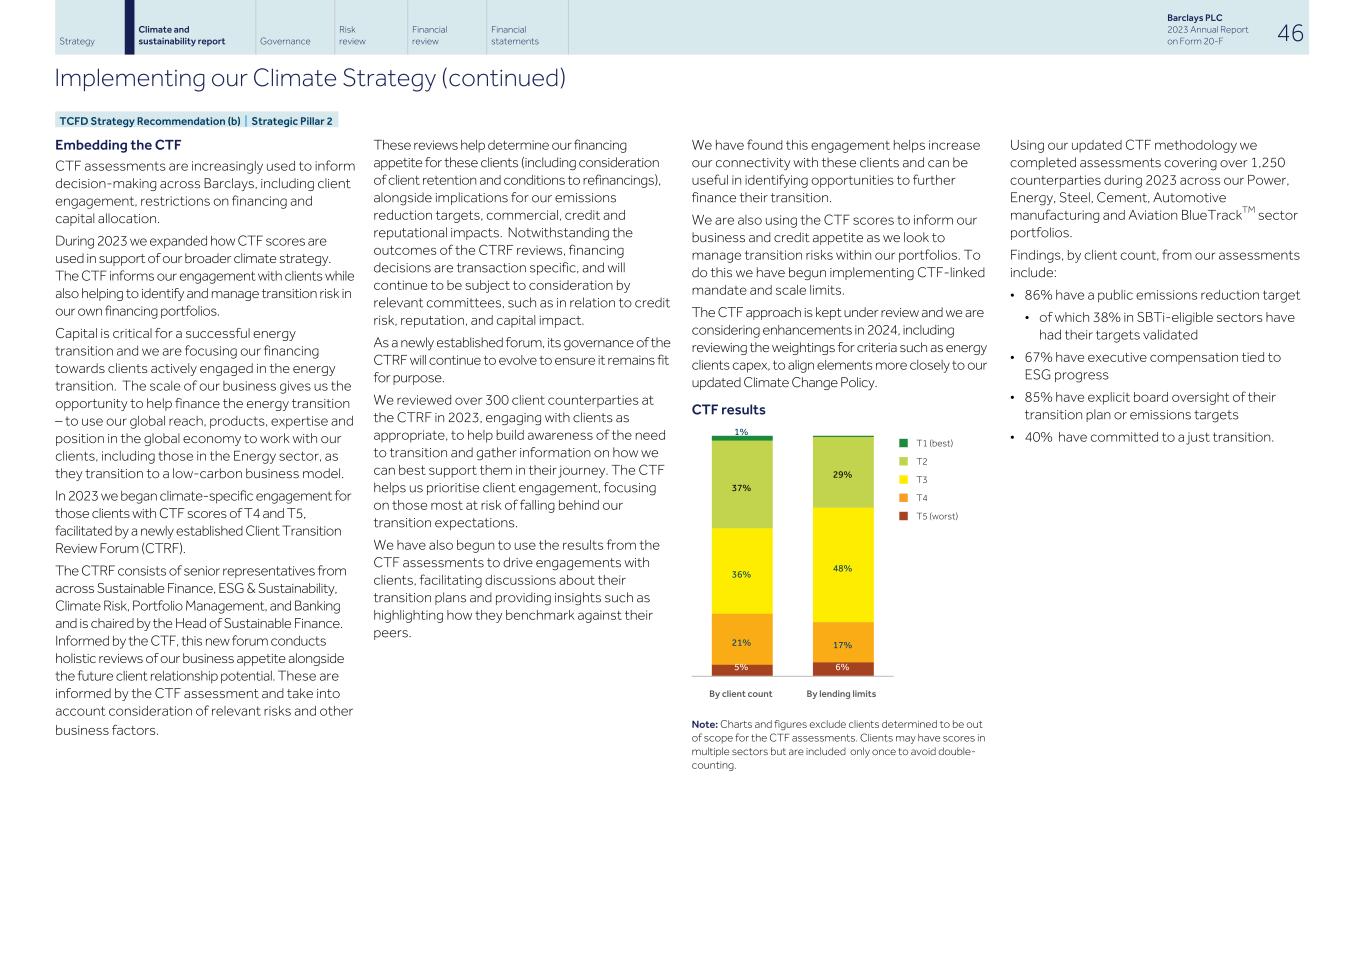
Embedding the CTF CTF assessments are increasingly used to inform decision-making across Barclays, including client engagement, restrictions on financing and capital allocation. During 2023 we expanded how CTF scores are used in support of our broader climate strategy. The CTF informs our engagement with clients while also helping to identify and manage transition risk in our own financing portfolios. Capital is critical for a successful energy transition and we are focusing our financing towards clients actively engaged in the energy transition. The scale of our business gives us the opportunity to help finance the energy transition – to use our global reach, products, expertise and position in the global economy to work with our clients, including those in the Energy sector, as they transition to a low-carbon business model. In 2023 we began climate-specific engagement for those clients with CTF scores of T4 and T5, facilitated by a newly established Client Transition Review Forum (CTRF). The CTRF consists of senior representatives from across Sustainable Finance, ESG & Sustainability, Climate Risk, Portfolio Management, and Banking and is chaired by the Head of Sustainable Finance. Informed by the CTF, this new forum conducts holistic reviews of our business appetite alongside the future client relationship potential. These are informed by the CTF assessment and take into account consideration of relevant risks and other business factors.		 These reviews help determine our financing appetite for these clients (including consideration of client retention and conditions to refinancings), alongside implications for our emissions reduction targets, commercial, credit and reputational impacts.  Notwithstanding the outcomes of the CTRF reviews, financing decisions are transaction specific, and will continue to be subject to consideration by relevant committees, such as in relation to credit risk, reputation, and capital impact. As a newly established forum, its governance of the CTRF will continue to evolve to ensure it remains fit for purpose. We reviewed over 300 client counterparties at the CTRF in 2023, engaging with clients as appropriate, to help build awareness of the need to transition and gather information on how we can best support them in their journey. The CTF helps us prioritise client engagement, focusing on those most at risk of falling behind our transition expectations. We have also begun to use the results from the CTF assessments to drive engagements with clients, facilitating discussions about their transition plans and providing insights such as highlighting how they benchmark against their peers. We have found this engagement helps increase our connectivity with these clients and can be useful in identifying opportunities to further finance their transition. We are also using the CTF scores to inform our business and credit appetite as we look to manage transition risks within our portfolios. To do this we have begun implementing CTF-linked mandate and scale limits. The CTF approach is kept under review and we are considering enhancements in 2024, including reviewing the weightings for criteria such as energy clients capex, to align elements more closely to our updated Climate Change Policy. CTF results 5% 6% 21% 17% 36% 48% 37% 29% 1% By client count By lending limits n T1 (best) n T2 n T3 n T4 n T5 (worst) Note: Charts and figures exclude clients determined to be out of scope for the CTF assessments. Clients may have scores in multiple sectors but are included only once to avoid double- counting. Using our updated CTF methodology we completed assessments covering over 1,250 counterparties during 2023 across our Power, Energy, Steel, Cement, Automotive manufacturing and Aviation BlueTrackTM sector portfolios. Findings, by client count, from our assessments include: • 86% have a public emissions reduction target • of which 38% in SBTi-eligible sectors have had their targets validated • 67% have executive compensation tied to ESG progress • 85% have explicit board oversight of their transition plan or emissions targets • 40% have committed to a just transition. Strategy Climate and sustainability report Governance Risk review Financial review Financial statements Barclays PLC 2023 Annual Report on Form 20-F 46 Implementing our Climate Strategy (continued) TCFD Strategy Recommendation (b) | Strategic Pillar 2
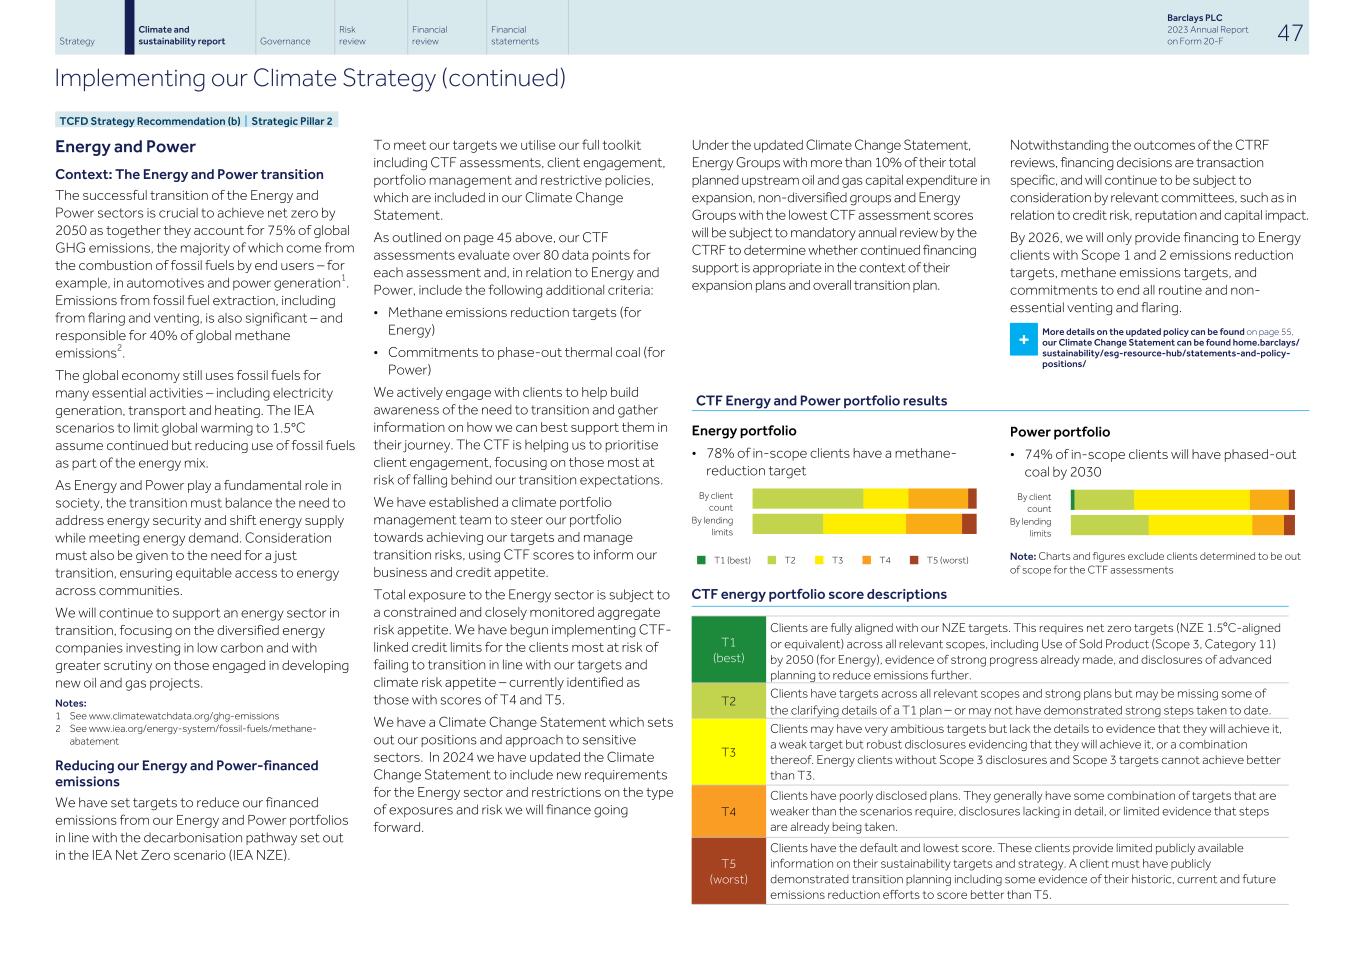
Energy and Power Context: The Energy and Power transition The successful transition of the Energy and Power sectors is crucial to achieve net zero by 2050 as together they account for 75% of global GHG emissions, the majority of which come from the combustion of fossil fuels by end users – for example, in automotives and power generation1. Emissions from fossil fuel extraction, including from flaring and venting, is also significant – and responsible for 40% of global methane emissions2. The global economy still uses fossil fuels for many essential activities – including electricity generation, transport and heating. The IEA scenarios to limit global warming to 1.5°C assume continued but reducing use of fossil fuels as part of the energy mix. As Energy and Power play a fundamental role in society, the transition must balance the need to address energy security and shift energy supply while meeting energy demand. Consideration must also be given to the need for a just transition, ensuring equitable access to energy across communities. We will continue to support an energy sector in transition, focusing on the diversified energy companies investing in low carbon and with greater scrutiny on those engaged in developing new oil and gas projects. Notes: 1 See www.climatewatchdata.org/ghg-emissions 2 See www.iea.org/energy-system/fossil-fuels/methane- abatement Reducing our Energy and Power-financed emissions We have set targets to reduce our financed emissions from our Energy and Power portfolios in line with the decarbonisation pathway set out in the IEA Net Zero scenario (IEA NZE). To meet our targets we utilise our full toolkit including CTF assessments, client engagement, portfolio management and restrictive policies, which are included in our Climate Change Statement. As outlined on page 45 above, our CTF assessments evaluate over 80 data points for each assessment and, in relation to Energy and Power, include the following additional criteria: • Methane emissions reduction targets (for Energy) • Commitments to phase-out thermal coal (for Power) We actively engage with clients to help build awareness of the need to transition and gather information on how we can best support them in their journey. The CTF is helping us to prioritise client engagement, focusing on those most at risk of falling behind our transition expectations. We have established a climate portfolio management team to steer our portfolio towards achieving our targets and manage transition risks, using CTF scores to inform our business and credit appetite. Total exposure to the Energy sector is subject to a constrained and closely monitored aggregate risk appetite. We have begun implementing CTF- linked credit limits for the clients most at risk of failing to transition in line with our targets and climate risk appetite – currently identified as those with scores of T4 and T5. We have a Climate Change Statement which sets out our positions and approach to sensitive sectors. In 2024 we have updated the Climate Change Statement to include new requirements for the Energy sector and restrictions on the type of exposures and risk we will finance going forward. Under the updated Climate Change Statement, Energy Groups with more than 10% of their total planned upstream oil and gas capital expenditure in expansion, non-diversified groups and Energy Groups with the lowest CTF assessment scores will be subject to mandatory annual review by the CTRF to determine whether continued financing support is appropriate in the context of their expansion plans and overall transition plan. CTF Energy and Power portfolio results Energy portfolio • 78% of in-scope clients have a methane- reduction target By client count By lending limits n T1 (best) n T2 n T3 n T4 n T5 (worst) CTF energy portfolio score descriptions T1 (best) Clients are fully aligned with our NZE targets. This requires net zero targets (NZE 1.5°C-aligned or equivalent) across all relevant scopes, including Use of Sold Product (Scope 3, Category 11) by 2050 (for Energy), evidence of strong progress already made, and disclosures of advanced planning to reduce emissions further. T2 Clients have targets across all relevant scopes and strong plans but may be missing some of the clarifying details of a T1 plan – or may not have demonstrated strong steps taken to date. T3 Clients may have very ambitious targets but lack the details to evidence that they will achieve it, a weak target but robust disclosures evidencing that they will achieve it, or a combination thereof. Energy clients without Scope 3 disclosures and Scope 3 targets cannot achieve better than T3. T4 Clients have poorly disclosed plans. They generally have some combination of targets that are weaker than the scenarios require, disclosures lacking in detail, or limited evidence that steps are already being taken. T5 (worst) Clients have the default and lowest score. These clients provide limited publicly available information on their sustainability targets and strategy. A client must have publicly demonstrated transition planning including some evidence of their historic, current and future emissions reduction efforts to score better than T5. Notwithstanding the outcomes of the CTRF reviews, financing decisions are transaction specific, and will continue to be subject to consideration by relevant committees, such as in relation to credit risk, reputation and capital impact. By 2026, we will only provide financing to Energy clients with Scope 1 and 2 emissions reduction targets, methane emissions targets, and commitments to end all routine and non- essential venting and flaring. + More details on the updated policy can be found on page 55, our Climate Change Statement can be found home.barclays/ sustainability/esg-resource-hub/statements-and-policy- positions/ Power portfolio • 74% of in-scope clients will have phased-out coal by 2030 By client count By lending limits Note: Charts and figures exclude clients determined to be out of scope for the CTF assessments Strategy Climate and sustainability report Governance Risk review Financial review Financial statements Barclays PLC 2023 Annual Report on Form 20-F 47 Implementing our Climate Strategy (continued) TCFD Strategy Recommendation (b) | Strategic Pillar 2
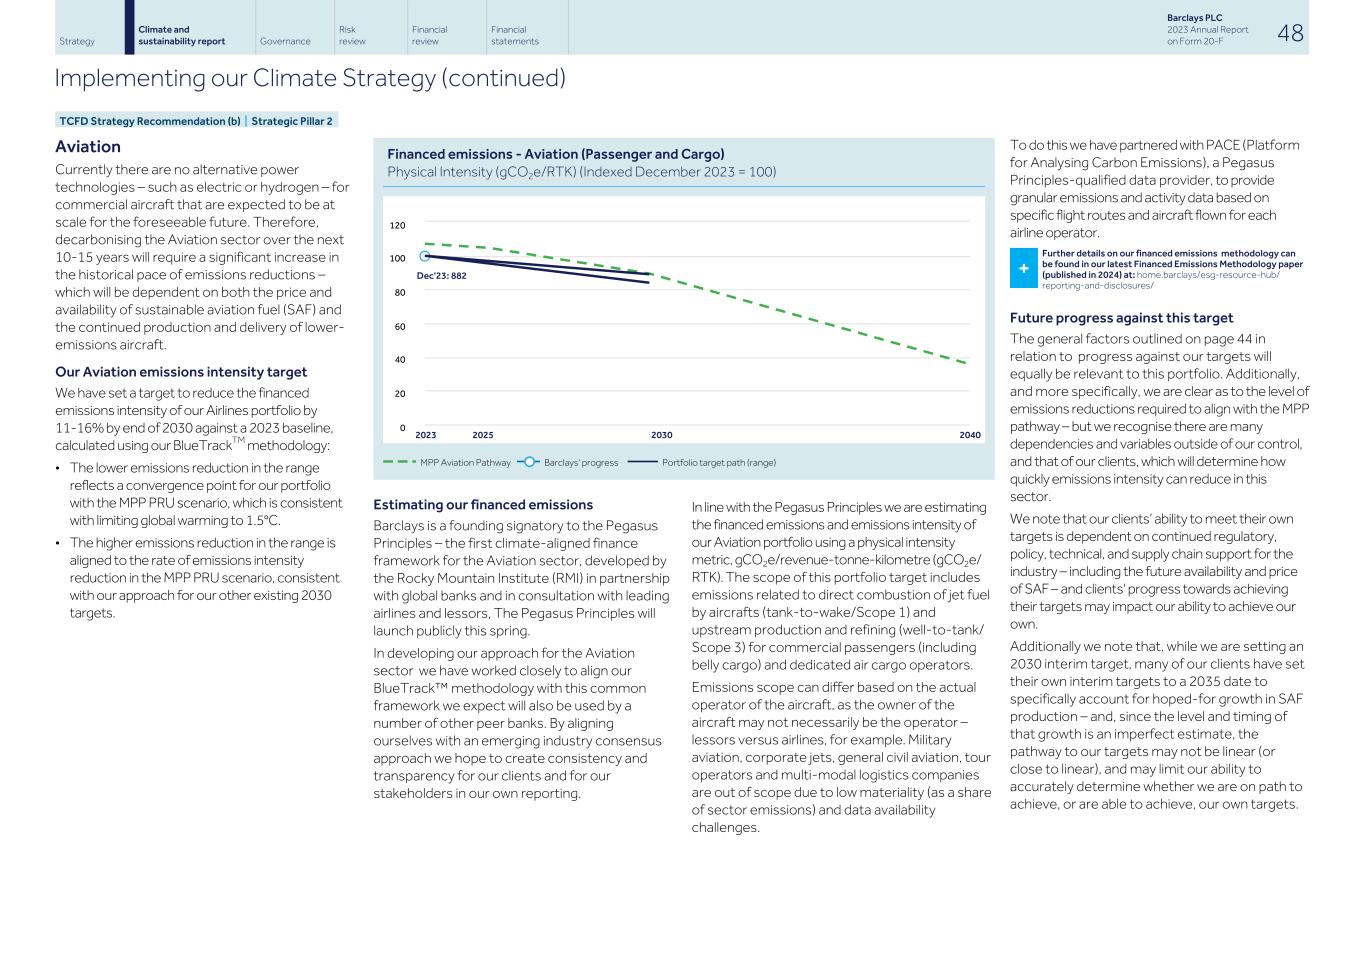
Aviation Currently there are no alternative power technologies – such as electric or hydrogen – for commercial aircraft that are expected to be at scale for the foreseeable future. Therefore, decarbonising the Aviation sector over the next 10-15 years will require a significant increase in the historical pace of emissions reductions – which will be dependent on both the price and availability of sustainable aviation fuel (SAF) and the continued production and delivery of lower- emissions aircraft. Our Aviation emissions intensity target We have set a target to reduce the financed emissions intensity of our Airlines portfolio by 11-16% by end of 2030 against a 2023 baseline, calculated using our BlueTrackTM methodology: • The lower emissions reduction in the range reflects a convergence point for our portfolio with the MPP PRU scenario, which is consistent with limiting global warming to 1.5°C. • The higher emissions reduction in the range is aligned to the rate of emissions intensity reduction in the MPP PRU scenario, consistent with our approach for our other existing 2030 targets. Financed emissions - Aviation (Passenger and Cargo) Physical Intensity (gCO2e/RTK) (Indexed December 2023 = 100) MPP Aviation Pathway Barclays' progress Portfolio target path (range) Estimating our financed emissions Barclays is a founding signatory to the Pegasus Principles – the first climate-aligned finance framework for the Aviation sector, developed by the Rocky Mountain Institute (RMI) in partnership with global banks and in consultation with leading airlines and lessors, The Pegasus Principles will launch publicly this spring. In developing our approach for the Aviation sector we have worked closely to align our BlueTrack™ methodology with this common framework we expect will also be used by a number of other peer banks. By aligning ourselves with an emerging industry consensus approach we hope to create consistency and transparency for our clients and for our stakeholders in our own reporting. In line with the Pegasus Principles we are estimating the financed emissions and emissions intensity of our Aviation portfolio using a physical intensity metric, gCO2e/revenue-tonne-kilometre (gCO2e/ RTK). The scope of this portfolio target includes emissions related to direct combustion of jet fuel by aircrafts (tank-to-wake/Scope 1) and upstream production and refining (well-to-tank/ Scope 3) for commercial passengers (including belly cargo) and dedicated air cargo operators. Emissions scope can differ based on the actual operator of the aircraft, as the owner of the aircraft may not necessarily be the operator – lessors versus airlines, for example. Military aviation, corporate jets, general civil aviation, tour operators and multi-modal logistics companies are out of scope due to low materiality (as a share of sector emissions) and data availability challenges. To do this we have partnered with PACE (Platform for Analysing Carbon Emissions), a Pegasus Principles-qualified data provider, to provide granular emissions and activity data based on specific flight routes and aircraft flown for each airline operator. + Further details on our financed emissions methodology can be found in our latest Financed Emissions Methodology paper (published in 2024) at: home.barclays/esg-resource-hub/ reporting-and-disclosures/ Future progress against this target The general factors outlined on page 44 in relation to progress against our targets will equally be relevant to this portfolio. Additionally, and more specifically, we are clear as to the level of emissions reductions required to align with the MPP pathway – but we recognise there are many dependencies and variables outside of our control, and that of our clients, which will determine how quickly emissions intensity can reduce in this sector. We note that our clients’ ability to meet their own targets is dependent on continued regulatory, policy, technical, and supply chain support for the industry – including the future availability and price of SAF – and clients' progress towards achieving their targets may impact our ability to achieve our own. Additionally we note that, while we are setting an 2030 interim target, many of our clients have set their own interim targets to a 2035 date to specifically account for hoped-for growth in SAF production – and, since the level and timing of that growth is an imperfect estimate, the pathway to our targets may not be linear (or close to linear), and may limit our ability to accurately determine whether we are on path to achieve, or are able to achieve, our own targets. Strategy Climate and sustainability report Governance Risk review Financial review Financial statements Barclays PLC 2023 Annual Report on Form 20-F 48 Implementing our Climate Strategy (continued) TCFD Strategy Recommendation (b) | Strategic Pillar 2 2023 2025 2030 2040 0 20 40 60 80 100 120 Dec'23: 882
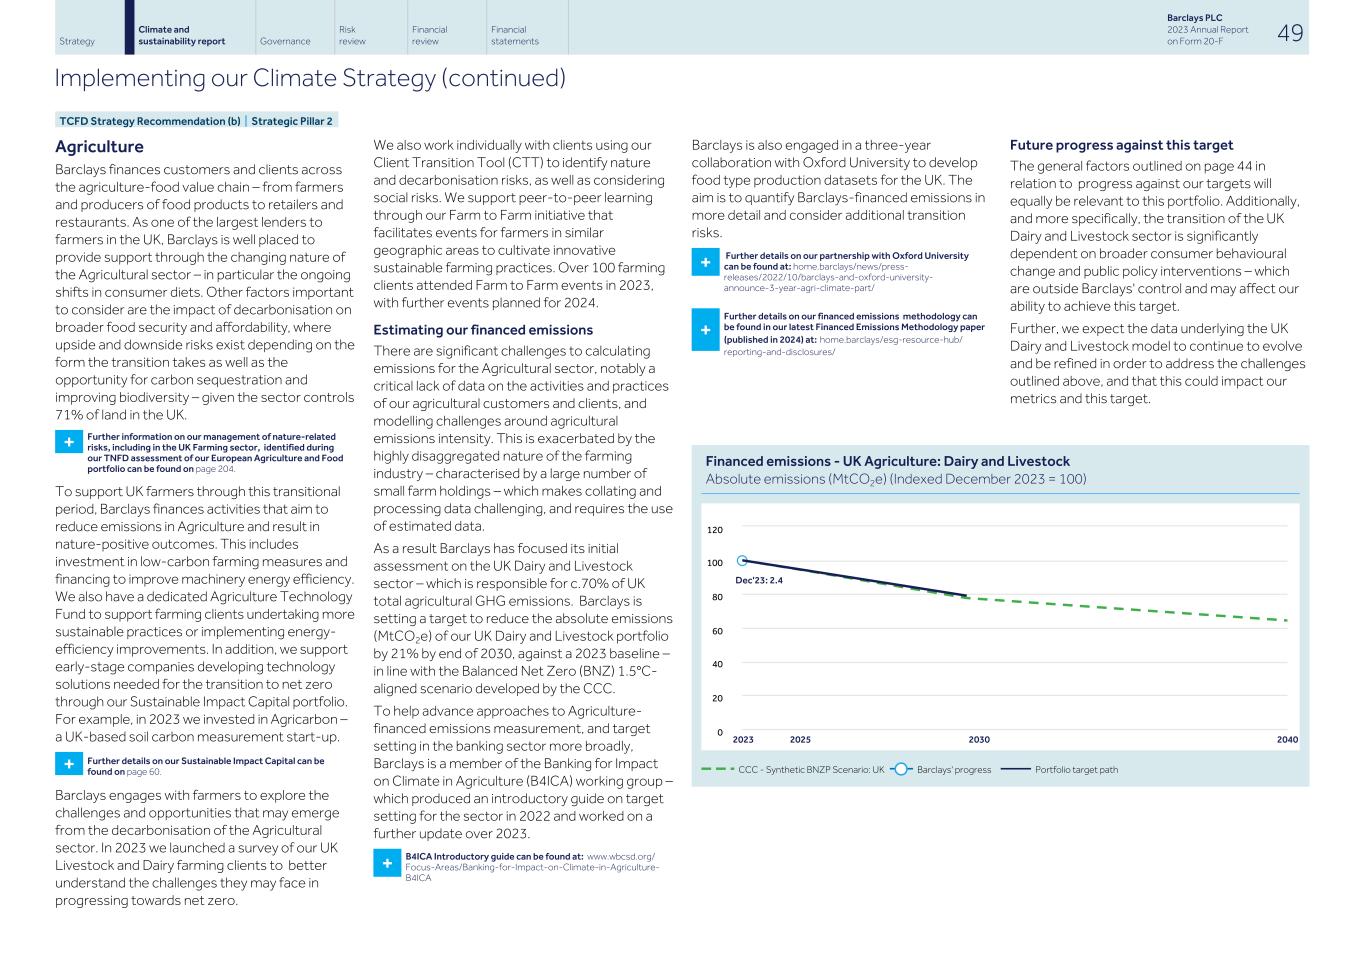
Agriculture Barclays finances customers and clients across the agriculture-food value chain – from farmers and producers of food products to retailers and restaurants. As one of the largest lenders to farmers in the UK, Barclays is well placed to provide support through the changing nature of the Agricultural sector – in particular the ongoing shifts in consumer diets. Other factors important to consider are the impact of decarbonisation on broader food security and affordability, where upside and downside risks exist depending on the form the transition takes as well as the opportunity for carbon sequestration and improving biodiversity – given the sector controls 71% of land in the UK. + Further information on our management of nature-related risks, including in the UK Farming sector, identified during our TNFD assessment of our European Agriculture and Food portfolio can be found on page 204. To support UK farmers through this transitional period, Barclays finances activities that aim to reduce emissions in Agriculture and result in nature-positive outcomes. This includes investment in low-carbon farming measures and financing to improve machinery energy efficiency. We also have a dedicated Agriculture Technology Fund to support farming clients undertaking more sustainable practices or implementing energy- efficiency improvements. In addition, we support early-stage companies developing technology solutions needed for the transition to net zero through our Sustainable Impact Capital portfolio. For example, in 2023 we invested in Agricarbon – a UK-based soil carbon measurement start-up. + Further details on our Sustainable Impact Capital can be found on page 60. Barclays engages with farmers to explore the challenges and opportunities that may emerge from the decarbonisation of the Agricultural sector. In 2023 we launched a survey of our UK Livestock and Dairy farming clients to better understand the challenges they may face in progressing towards net zero. We also work individually with clients using our Client Transition Tool (CTT) to identify nature and decarbonisation risks, as well as considering social risks. We support peer-to-peer learning through our Farm to Farm initiative that facilitates events for farmers in similar geographic areas to cultivate innovative sustainable farming practices. Over 100 farming clients attended Farm to Farm events in 2023, with further events planned for 2024. Estimating our financed emissions	 There are significant challenges to calculating emissions for the Agricultural sector, notably a critical lack of data on the activities and practices of our agricultural customers and clients, and modelling challenges around agricultural emissions intensity. This is exacerbated by the highly disaggregated nature of the farming industry – characterised by a large number of small farm holdings – which makes collating and processing data challenging, and requires the use of estimated data. As a result Barclays has focused its initial assessment on the UK Dairy and Livestock sector – which is responsible for c.70% of UK total agricultural GHG emissions. Barclays is setting a target to reduce the absolute emissions (MtCO2e) of our UK Dairy and Livestock portfolio by 21% by end of 2030, against a 2023 baseline – in line with the Balanced Net Zero (BNZ) 1.5°C- aligned scenario developed by the CCC. To help advance approaches to Agriculture- financed emissions measurement, and target setting in the banking sector more broadly, Barclays is a member of the Banking for Impact on Climate in Agriculture (B4ICA) working group – which produced an introductory guide on target setting for the sector in 2022 and worked on a further update over 2023. + B4ICA Introductory guide can be found at: www.wbcsd.org/ Focus-Areas/Banking-for-Impact-on-Climate-in-Agriculture- B4ICA Barclays is also engaged in a three-year collaboration with Oxford University to develop food type production datasets for the UK. The aim is to quantify Barclays-financed emissions in more detail and consider additional transition risks. + Further details on our partnership with Oxford University can be found at: home.barclays/news/press- releases/2022/10/barclays-and-oxford-university- announce-3-year-agri-climate-part/ + Further details on our financed emissions methodology can be found in our latest Financed Emissions Methodology paper (published in 2024) at:	home.barclays/esg-resource-hub/ reporting-and-disclosures/ Financed emissions - UK Agriculture: Dairy and Livestock Absolute emissions (MtCO2e) (Indexed December 2023 = 100) CCC - Synthetic BNZP Scenario: UK Barclays' progress Portfolio target path Future progress against this target The general factors outlined on page 44 in relation to progress against our targets will equally be relevant to this portfolio. Additionally, and more specifically, the transition of the UK Dairy and Livestock sector is significantly dependent on broader consumer behavioural change and public policy interventions – which are outside Barclays' control and may affect our ability to achieve this target. Further, we expect the data underlying the UK Dairy and Livestock model to continue to evolve and be refined in order to address the challenges outlined above, and that this could impact our metrics and this target. Strategy Climate and sustainability report Governance Risk review Financial review Financial statements Barclays PLC 2023 Annual Report on Form 20-F 49 Implementing our Climate Strategy (continued) TCFD Strategy Recommendation (b) | Strategic Pillar 2 0 20 40 60 80 100 120 Dec'23: 2.4 2023 2025 2030 2040
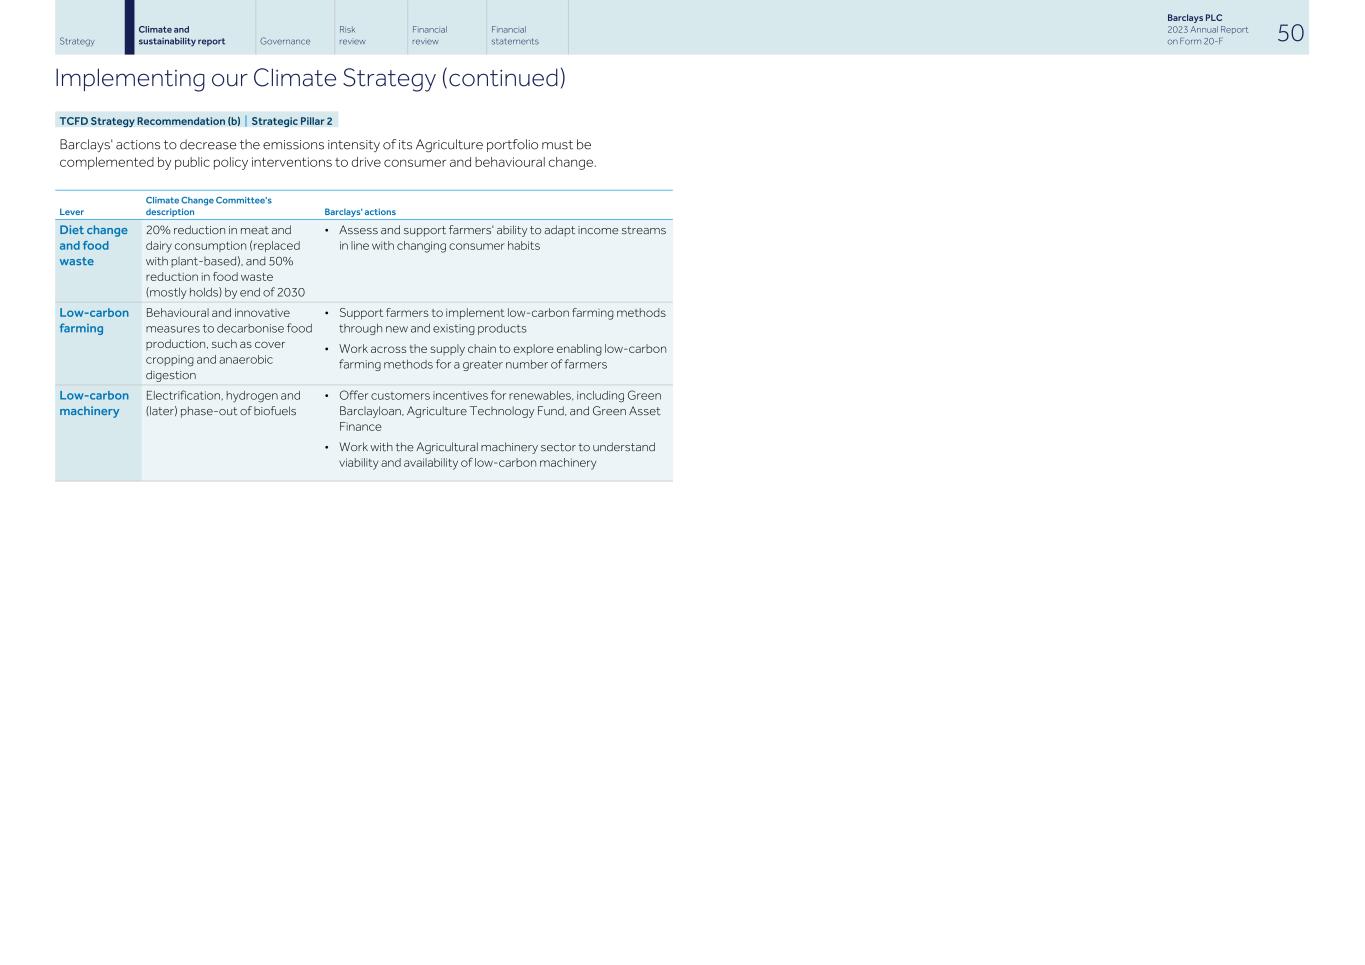
Barclays' actions to decrease the emissions intensity of its Agriculture portfolio must be complemented by public policy interventions to drive consumer and behavioural change. Lever Climate Change Committee's description Barclays' actions Diet change and food waste 20% reduction in meat and dairy consumption (replaced with plant-based), and 50% reduction in food waste (mostly holds) by end of 2030 • Assess and support farmers' ability to adapt income streams in line with changing consumer habits Low-carbon farming Behavioural and innovative measures to decarbonise food production, such as cover cropping and anaerobic digestion • Support farmers to implement low-carbon farming methods through new and existing products • Work across the supply chain to explore enabling low-carbon farming methods for a greater number of farmers Low-carbon machinery Electrification, hydrogen and (later) phase-out of biofuels • Offer customers incentives for renewables, including Green Barclayloan, Agriculture Technology Fund, and Green Asset Finance • Work with the Agricultural machinery sector to understand viability and availability of low-carbon machinery Strategy Climate and sustainability report Governance Risk review Financial review Financial statements Barclays PLC 2023 Annual Report on Form 20-F 50 Implementing our Climate Strategy (continued) TCFD Strategy Recommendation (b) | Strategic Pillar 2
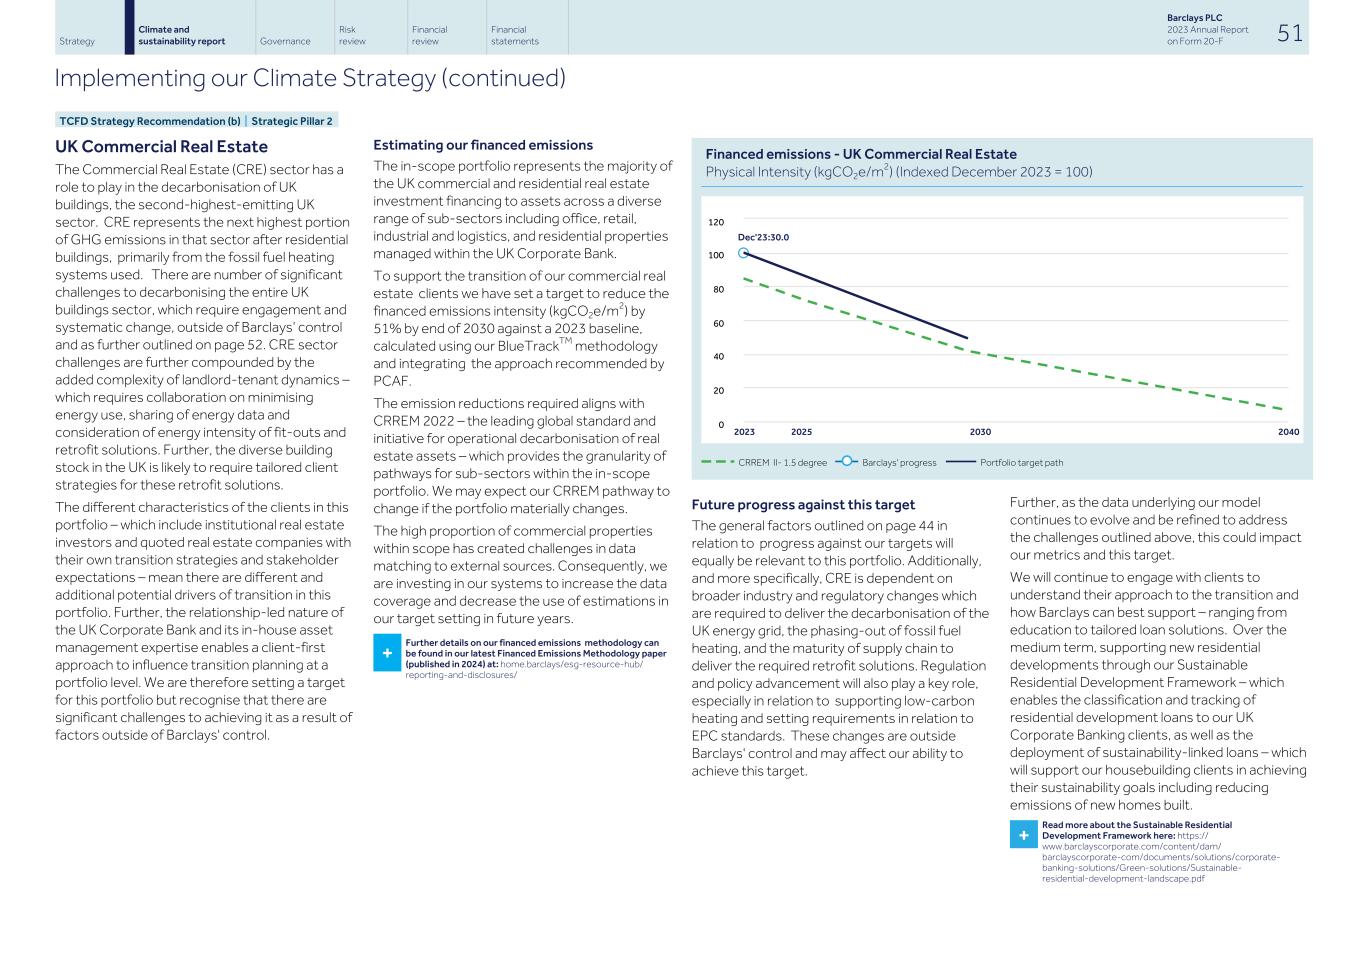
UK Commercial Real Estate The Commercial Real Estate (CRE) sector has a role to play in the decarbonisation of UK buildings, the second-highest-emitting UK sector. CRE represents the next highest portion of GHG emissions in that sector after residential buildings, primarily from the fossil fuel heating systems used. There are number of significant challenges to decarbonising the entire UK buildings sector, which require engagement and systematic change, outside of Barclays’ control and as further outlined on page 52. CRE sector challenges are further compounded by the added complexity of landlord-tenant dynamics – which requires collaboration on minimising energy use, sharing of energy data and consideration of energy intensity of fit-outs and retrofit solutions. Further, the diverse building stock in the UK is likely to require tailored client strategies for these retrofit solutions. The different characteristics of the clients in this portfolio – which include institutional real estate investors and quoted real estate companies with their own transition strategies and stakeholder expectations – mean there are different and additional potential drivers of transition in this portfolio. Further, the relationship-led nature of the UK Corporate Bank and its in-house asset management expertise enables a client-first approach to influence transition planning at a portfolio level. We are therefore setting a target for this portfolio but recognise that there are significant challenges to achieving it as a result of factors outside of Barclays' control. Estimating our financed emissions The in-scope portfolio represents the majority of the UK commercial and residential real estate investment financing to assets across a diverse range of sub-sectors including office, retail, industrial and logistics, and residential properties managed within the UK Corporate Bank. To support the transition of our commercial real estate clients we have set a target to reduce the financed emissions intensity (kgCO2e/m2) by 51% by end of 2030 against a 2023 baseline, calculated using our BlueTrackTM methodology and integrating the approach recommended by PCAF. The emission reductions required aligns with CRREM 2022 – the leading global standard and initiative for operational decarbonisation of real estate assets – which provides the granularity of pathways for sub-sectors within the in-scope portfolio. We may expect our CRREM pathway to change if the portfolio materially changes. The high proportion of commercial properties within scope has created challenges in data matching to external sources. Consequently, we are investing in our systems to increase the data coverage and decrease the use of estimations in our target setting in future years. + Further details on our financed emissions methodology can be found in our latest Financed Emissions Methodology paper (published in 2024) at: home.barclays/esg-resource-hub/ reporting-and-disclosures/ Financed emissions - UK Commercial Real Estate Physical Intensity (kgCO2e/m2) (Indexed December 2023 = 100) CRREM II- 1.5 degree Barclays' progress Portfolio target path Future progress against this target The general factors outlined on page 44 in relation to progress against our targets will equally be relevant to this portfolio. Additionally, and more specifically, CRE is dependent on broader industry and regulatory changes which are required to deliver the decarbonisation of the UK energy grid, the phasing-out of fossil fuel heating, and the maturity of supply chain to deliver the required retrofit solutions. Regulation and policy advancement will also play a key role, especially in relation to supporting low-carbon heating and setting requirements in relation to EPC standards. These changes are outside Barclays' control and may affect our ability to achieve this target. Further, as the data underlying our model continues to evolve and be refined to address the challenges outlined above, this could impact our metrics and this target. We will continue to engage with clients to understand their approach to the transition and how Barclays can best support – ranging from education to tailored loan solutions. Over the medium term, supporting new residential developments through our Sustainable Residential Development Framework – which enables the classification and tracking of residential development loans to our UK Corporate Banking clients, as well as the deployment of sustainability-linked loans – which will support our housebuilding clients in achieving their sustainability goals including reducing emissions of new homes built. + Read more about the Sustainable Residential Development Framework here: https:// www.barclayscorporate.com/content/dam/ barclayscorporate-com/documents/solutions/corporate- banking-solutions/Green-solutions/Sustainable- residential-development-landscape.pdf Strategy Climate and sustainability report Governance Risk review Financial review Financial statements Barclays PLC 2023 Annual Report on Form 20-F 51 Implementing our Climate Strategy (continued) TCFD Strategy Recommendation (b) | Strategic Pillar 2 0 20 40 60 80 100 120 Dec'23:30.0 2023 2025 2030 2040
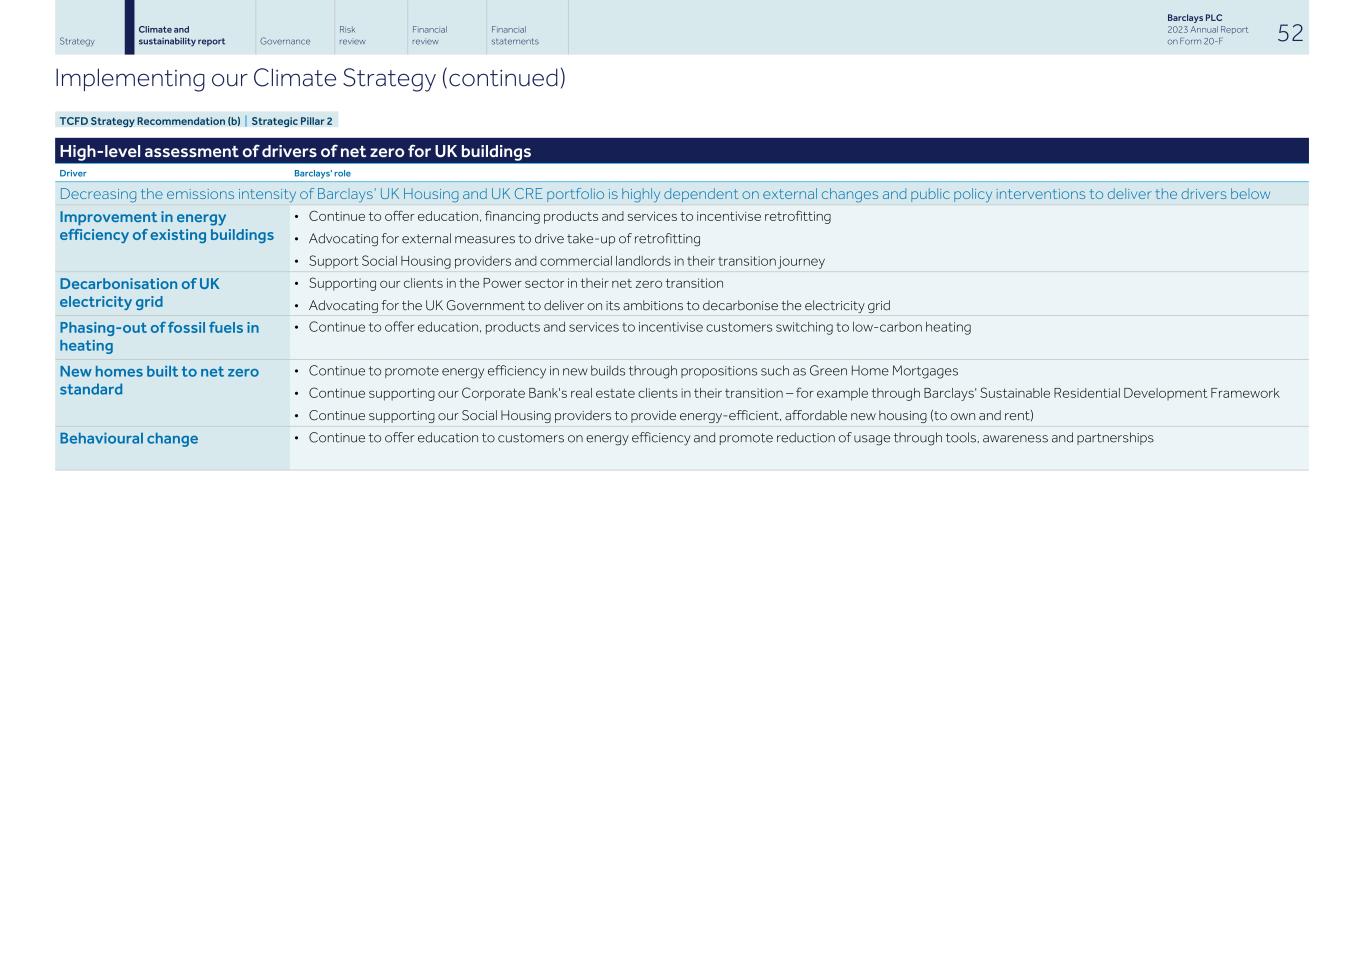
High-level assessment of drivers of net zero for UK buildings Driver Barclays' role Decreasing the emissions intensity of Barclays’ UK Housing and UK CRE portfolio is highly dependent on external changes and public policy interventions to deliver the drivers below Improvement in energy efficiency of existing buildings • Continue to offer education, financing products and services to incentivise retrofitting • Advocating for external measures to drive take-up of retrofitting • Support Social Housing providers and commercial landlords in their transition journey Decarbonisation of UK electricity grid • Supporting our clients in the Power sector in their net zero transition • Advocating for the UK Government to deliver on its ambitions to decarbonise the electricity grid Phasing-out of fossil fuels in heating • Continue to offer education, products and services to incentivise customers switching to low-carbon heating New homes built to net zero standard • Continue to promote energy efficiency in new builds through propositions such as Green Home Mortgages • Continue supporting our Corporate Bank's real estate clients in their transition – for example through Barclays' Sustainable Residential Development Framework • Continue supporting our Social Housing providers to provide energy-efficient, affordable new housing (to own and rent) Behavioural change • Continue to offer education to customers on energy efficiency and promote reduction of usage through tools, awareness and partnerships Strategy Climate and sustainability report Governance Risk review Financial review Financial statements Barclays PLC 2023 Annual Report on Form 20-F 52 Implementing our Climate Strategy (continued) TCFD Strategy Recommendation (b) | Strategic Pillar 2
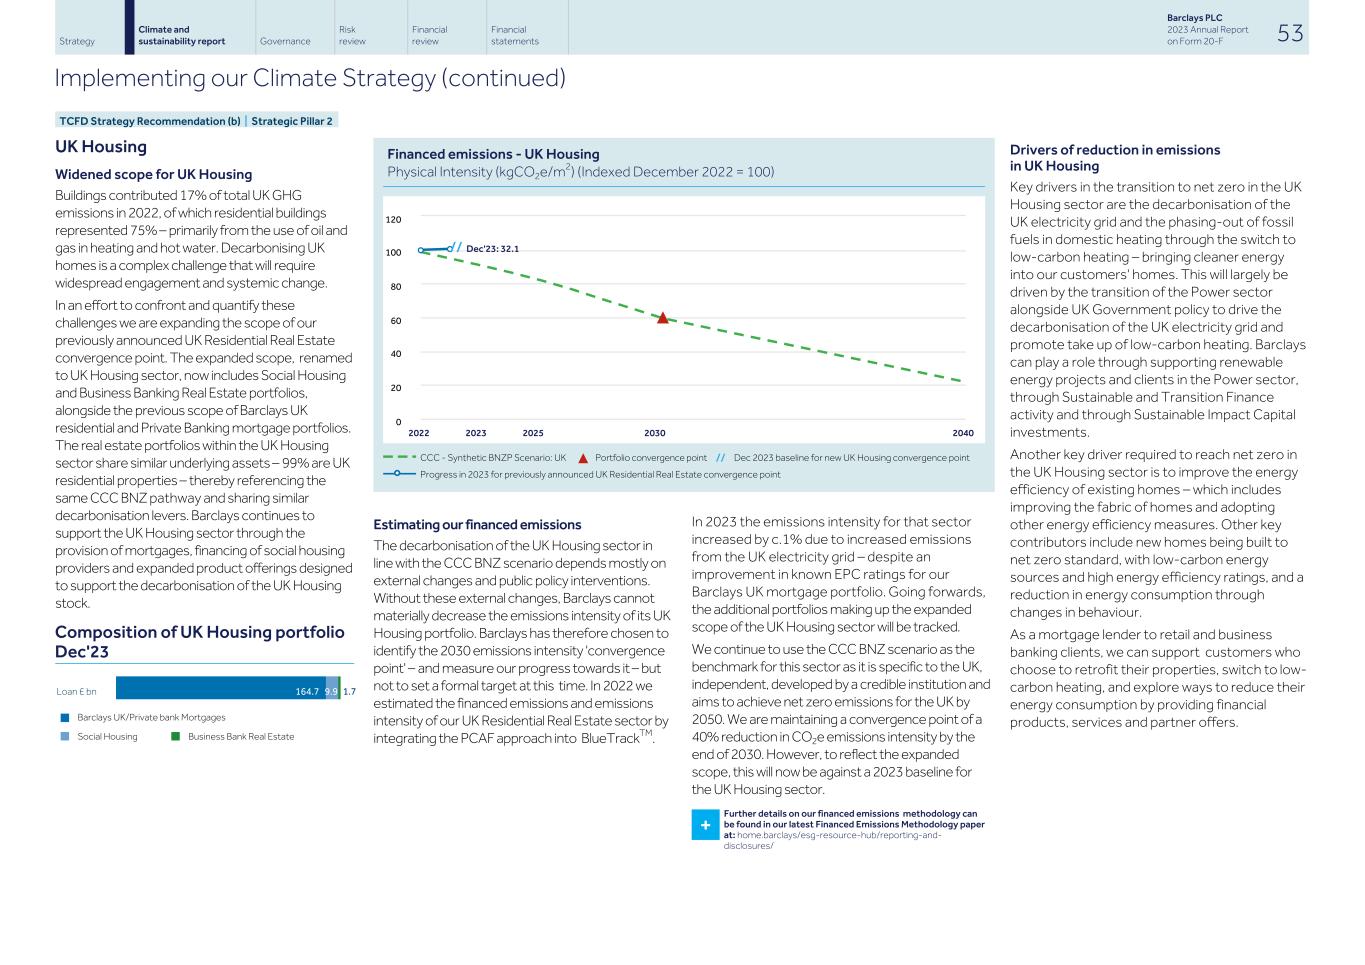
UK Housing Widened scope for UK Housing Buildings contributed 17% of total UK GHG emissions in 2022, of which residential buildings represented 75% – primarily from the use of oil and gas in heating and hot water. Decarbonising UK homes is a complex challenge that will require widespread engagement and systemic change. In an effort to confront and quantify these challenges we are expanding the scope of our previously announced UK Residential Real Estate convergence point. The expanded scope, renamed to UK Housing sector, now includes Social Housing and Business Banking Real Estate portfolios, alongside the previous scope of Barclays UK residential and Private Banking mortgage portfolios. The real estate portfolios within the UK Housing sector share similar underlying assets – 99% are UK residential properties – thereby referencing the same CCC BNZ pathway and sharing similar decarbonisation levers. Barclays continues to support the UK Housing sector through the provision of mortgages, financing of social housing providers and expanded product offerings designed to support the decarbonisation of the UK Housing stock. Composition of UK Housing portfolio Dec'23 164.7 9.9 1.7Loan £ bn n Barclays UK/Private bank Mortgages n Social Housing n Business Bank Real Estate Financed emissions - UK Housing Physical Intensity (kgCO2e/m2) (Indexed December 2022 = 100) CCC - Synthetic BNZP Scenario: UK ▲ Portfolio convergence point // Dec 2023 baseline for new UK Housing convergence point Progress in 2023 for previously announced UK Residential Real Estate convergence point Estimating our financed emissions The decarbonisation of the UK Housing sector in line with the CCC BNZ scenario depends mostly on external changes and public policy interventions. Without these external changes, Barclays cannot materially decrease the emissions intensity of its UK Housing portfolio. Barclays has therefore chosen to identify the 2030 emissions intensity 'convergence point' – and measure our progress towards it – but not to set a formal target at this time. In 2022 we estimated the financed emissions and emissions intensity of our UK Residential Real Estate sector by integrating the PCAF approach into BlueTrackTM. In 2023 the emissions intensity for that sector increased by c.1% due to increased emissions from the UK electricity grid – despite an improvement in known EPC ratings for our Barclays UK mortgage portfolio. Going forwards, the additional portfolios making up the expanded scope of the UK Housing sector will be tracked. We continue to use the CCC BNZ scenario as the benchmark for this sector as it is specific to the UK, independent, developed by a credible institution and aims to achieve net zero emissions for the UK by 2050. We are maintaining a convergence point of a 40% reduction in CO2e emissions intensity by the end of 2030. However, to reflect the expanded scope, this will now be against a 2023 baseline for the UK Housing sector. Further details on our financed emissions methodology can be found in our latest Financed Emissions Methodology paper at: home.barclays/esg-resource-hub/reporting-and- disclosures/ + Drivers of reduction in emissions in UK Housing Key drivers in the transition to net zero in the UK Housing sector are the decarbonisation of the UK electricity grid and the phasing-out of fossil fuels in domestic heating through the switch to low-carbon heating – bringing cleaner energy into our customers' homes. This will largely be driven by the transition of the Power sector alongside UK Government policy to drive the decarbonisation of the UK electricity grid and promote take up of low-carbon heating. Barclays can play a role through supporting renewable energy projects and clients in the Power sector, through Sustainable and Transition Finance activity and through Sustainable Impact Capital investments. Another key driver required to reach net zero in the UK Housing sector is to improve the energy efficiency of existing homes – which includes improving the fabric of homes and adopting other energy efficiency measures. Other key contributors include new homes being built to net zero standard, with low-carbon energy sources and high energy efficiency ratings, and a reduction in energy consumption through changes in behaviour. As a mortgage lender to retail and business banking clients, we can support customers who choose to retrofit their properties, switch to low- carbon heating, and explore ways to reduce their energy consumption by providing financial products, services and partner offers. Strategy Climate and sustainability report Governance Risk review Financial review Financial statements Barclays PLC 2023 Annual Report on Form 20-F 53 Implementing our Climate Strategy (continued) TCFD Strategy Recommendation (b) | Strategic Pillar 2 0 20 40 60 80 100 120 // Dec'23: 32.1 2022 2023 2025 2030 2040
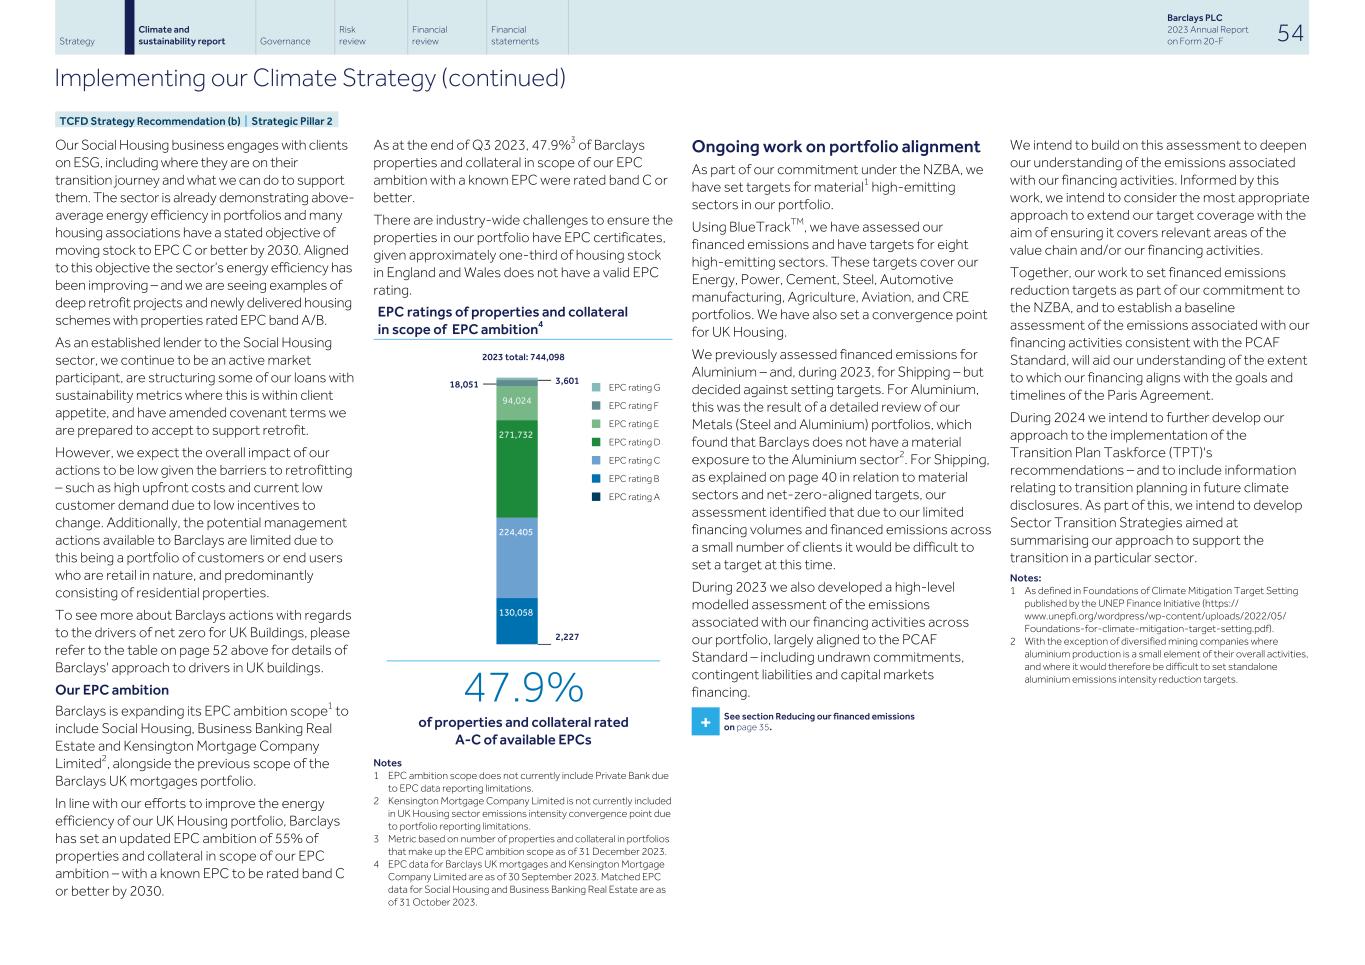
Our Social Housing business engages with clients on ESG, including where they are on their transition journey and what we can do to support them. The sector is already demonstrating above- average energy efficiency in portfolios and many housing associations have a stated objective of moving stock to EPC C or better by 2030. Aligned to this objective the sector’s energy efficiency has been improving – and we are seeing examples of deep retrofit projects and newly delivered housing schemes with properties rated EPC band A/B. As an established lender to the Social Housing sector, we continue to be an active market participant, are structuring some of our loans with sustainability metrics where this is within client appetite, and have amended covenant terms we are prepared to accept to support retrofit. However, we expect the overall impact of our actions to be low given the barriers to retrofitting – such as high upfront costs and current low customer demand due to low incentives to change. Additionally, the potential management actions available to Barclays are limited due to this being a portfolio of customers or end users who are retail in nature, and predominantly consisting of residential properties. To see more about Barclays actions with regards to the drivers of net zero for UK Buildings, please refer to the table on page 52 above for details of Barclays' approach to drivers in UK buildings. Our EPC ambition Barclays is expanding its EPC ambition scope1 to include Social Housing, Business Banking Real Estate and Kensington Mortgage Company Limited2, alongside the previous scope of the Barclays UK mortgages portfolio. In line with our efforts to improve the energy efficiency of our UK Housing portfolio, Barclays has set an updated EPC ambition of 55% of properties and collateral in scope of our EPC ambition – with a known EPC to be rated band C or better by 2030. As at the end of Q3 2023, 47.9%3 of Barclays properties and collateral in scope of our EPC ambition with a known EPC were rated band C or better. There are industry-wide challenges to ensure the properties in our portfolio have EPC certificates, given approximately one-third of housing stock in England and Wales does not have a valid EPC rating. EPC	ratings of properties and collateral in scope of EPC ambition4 2023 total: 744,098 18,051 94,024 271,732 224,405 130,058 3,601 2,227 n EPC rating G n EPC rating F n EPC rating E n EPC rating D n EPC rating C n EPC rating B n EPC rating A 47.9% of properties and collateral rated A-C of available EPCs Notes 1 EPC ambition scope does not currently include Private Bank due to EPC data reporting limitations. 2 Kensington Mortgage Company Limited is not currently included in UK Housing sector emissions intensity convergence point due to portfolio reporting limitations. 3 Metric based on number of properties and collateral in portfolios that make up the EPC ambition scope as of 31 December 2023. 4 EPC data for Barclays UK mortgages and Kensington Mortgage Company Limited are as of 30 September 2023. Matched EPC data for Social Housing and Business Banking Real Estate are as of 31 October 2023. Ongoing work on portfolio alignment As part of our commitment under the NZBA, we have set targets for material1 high-emitting sectors in our portfolio. Using BlueTrackTM, we have assessed our financed emissions and have targets for eight high-emitting sectors. These targets cover our Energy, Power, Cement, Steel, Automotive manufacturing, Agriculture, Aviation, and CRE portfolios. We have also set a convergence point for UK Housing. We previously assessed financed emissions for Aluminium – and, during 2023, for Shipping – but decided against setting targets. For Aluminium, this was the result of a detailed review of our Metals (Steel and Aluminium) portfolios, which found that Barclays does not have a material exposure to the Aluminium sector2. For Shipping, as explained on page 40 in relation to material sectors and net-zero-aligned targets, our assessment identified that due to our limited financing volumes and financed emissions across a small number of clients it would be difficult to set a target at this time. During 2023 we also developed a high-level modelled assessment of the emissions associated with our financing activities across our portfolio, largely aligned to the PCAF Standard – including undrawn commitments, contingent liabilities and capital markets financing. + See section Reducing our financed emissions on page 35. We intend to build on this assessment to deepen our understanding of the emissions associated with our financing activities. Informed by this work, we intend to consider the most appropriate approach to extend our target coverage with the aim of ensuring it covers relevant areas of the value chain and/or our financing activities. Together, our work to set financed emissions reduction targets as part of our commitment to the NZBA, and to establish a baseline assessment of the emissions associated with our financing activities consistent with the PCAF Standard, will aid our understanding of the extent to which our financing aligns with the goals and timelines of the Paris Agreement. During 2024 we intend to further develop our approach to the implementation of the Transition Plan Taskforce (TPT)'s recommendations – and to include information relating to transition planning in future climate disclosures. As part of this, we intend to develop Sector Transition Strategies aimed at summarising our approach to support the transition in a particular sector. Notes: 1 As defined in Foundations of Climate Mitigation Target Setting published by the UNEP Finance Initiative (https:// www.unepfi.org/wordpress/wp-content/uploads/2022/05/ Foundations-for-climate-mitigation-target-setting.pdf). 2 With the exception of diversified mining companies where aluminium production is a small element of their overall activities, and where it would therefore be difficult to set standalone aluminium emissions intensity reduction targets. Strategy Climate and sustainability report Governance Risk review Financial review Financial statements Barclays PLC 2023 Annual Report on Form 20-F 54 Implementing our Climate Strategy (continued) TCFD Strategy Recommendation (b) | Strategic Pillar 2
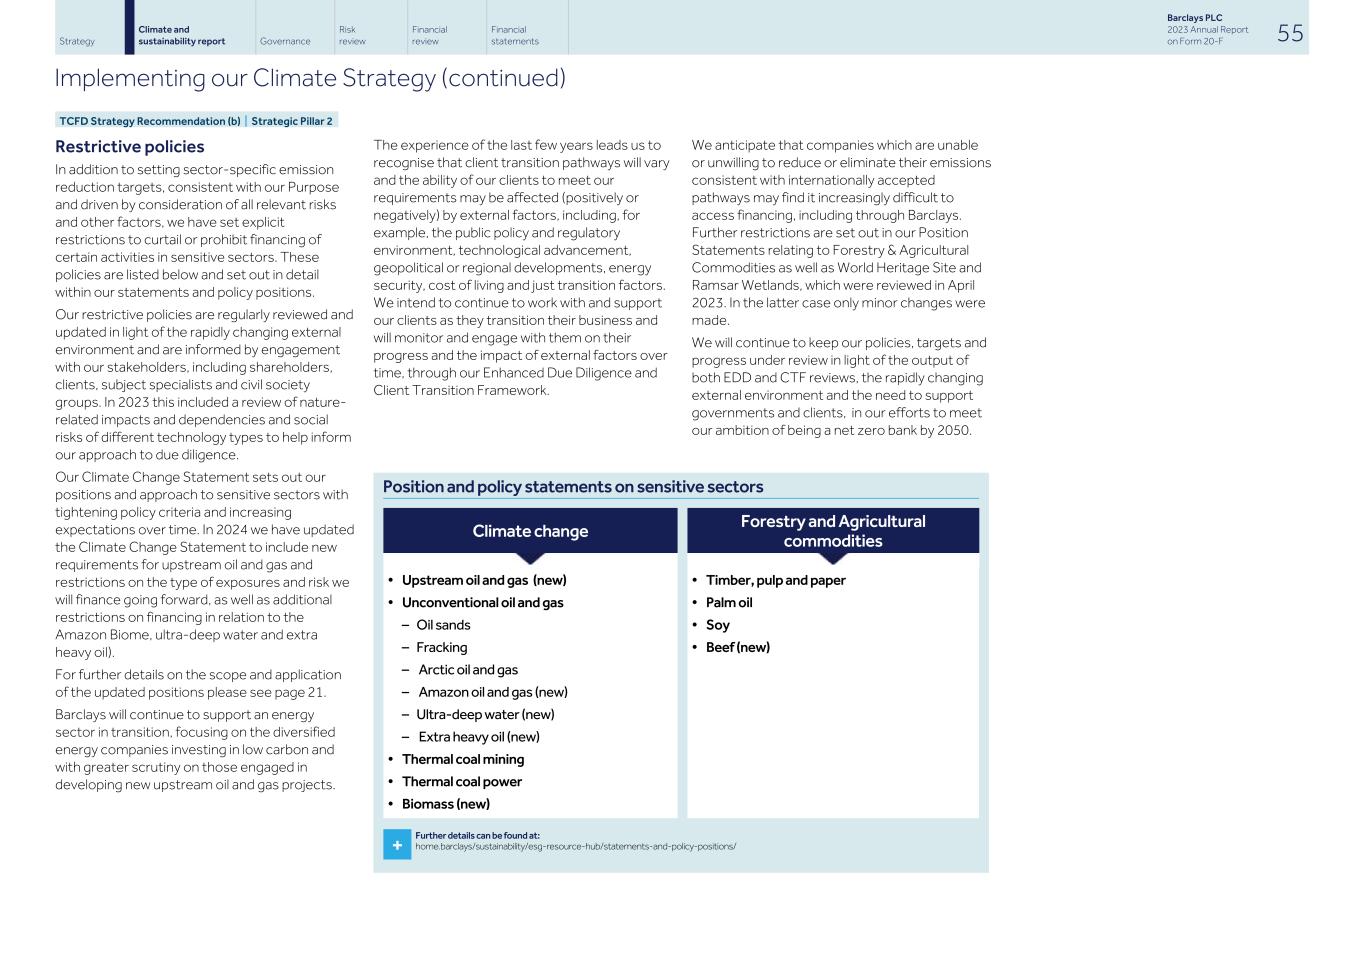
Restrictive policies In addition to setting sector-specific emission reduction targets, consistent with our Purpose and driven by consideration of all relevant risks and other factors, we have set explicit restrictions to curtail or prohibit financing of certain activities in sensitive sectors. These policies are listed below and set out in detail within our statements and policy positions. Our restrictive policies are regularly reviewed and updated in light of the rapidly changing external environment and are informed by engagement with our stakeholders, including shareholders, clients, subject specialists and civil society groups. In 2023 this included a review of nature- related impacts and dependencies and social risks of different technology types to help inform our approach to due diligence. Our Climate Change Statement sets out our positions and approach to sensitive sectors with tightening policy criteria and increasing expectations over time. In 2024 we have updated the Climate Change Statement to include new requirements for upstream oil and gas and restrictions on the type of exposures and risk we will finance going forward, as well as additional restrictions on financing in relation to the Amazon Biome, ultra-deep water and extra heavy oil). For further details on the scope and application of the updated positions please see page 21. Barclays will continue to support an energy sector in transition, focusing on the diversified energy companies investing in low carbon and with greater scrutiny on those engaged in developing new upstream oil and gas projects. The experience of the last few years leads us to recognise that client transition pathways will vary and the ability of our clients to meet our requirements may be affected (positively or negatively) by external factors, including, for example, the public policy and regulatory environment, technological advancement, geopolitical or regional developments, energy security, cost of living and just transition factors. We intend to continue to work with and support our clients as they transition their business and will monitor and engage with them on their progress and the impact of external factors over time, through our Enhanced Due Diligence and Client Transition Framework. Position and policy statements on sensitive sectors Climate change Forestry and Agricultural commodities • Upstream oil and gas (new) • Unconventional oil and gas – Oil sands – Fracking – Arctic oil and gas – Amazon oil and gas (new) – Ultra-deep water (new) – Extra heavy oil (new) • Thermal coal mining • Thermal coal power • Biomass (new) • Timber, pulp and paper • Palm oil • Soy • Beef (new) + Further details can be found at: home.barclays/sustainability/esg-resource-hub/statements-and-policy-positions/ We anticipate that companies which are unable or unwilling to reduce or eliminate their emissions consistent with internationally accepted pathways may find it increasingly difficult to access financing, including through Barclays. Further restrictions are set out in our Position Statements relating to Forestry & Agricultural Commodities as well as World Heritage Site and Ramsar Wetlands, which were reviewed in April 2023. In the latter case only minor changes were made. We will continue to keep our policies, targets and progress under review in light of the output of both EDD and CTF reviews, the rapidly changing external environment and the need to support governments and clients, in our efforts to meet our ambition of being a net zero bank by 2050. Strategy Climate and sustainability report Governance Risk review Financial review Financial statements Barclays PLC 2023 Annual Report on Form 20-F 55 Implementing our Climate Strategy (continued) TCFD Strategy Recommendation (b) | Strategic Pillar 2
Financing the transition In light of the progress made against our previously announced targets, and after a strategic review of the Group's capabilities, market demand and growth opportunities, in December 2022 we announced a new target to facilitate $1trn of Sustainable and Transition Financing between 2023 and the end of 2030. We also announced an extension of our Sustainable Impact Capital portfolio, with a new mandate to invest up to £500m into global climate tech start-ups by the end of 2027. Facilitating $1trn of Sustainable and Transition Financing At Barclays we are clear that addressing climate change is a complex challenge that demands a fundamental transformation of the global economy. Low-carbon technologies, infrastructure and capacity must be scaled up to meet growing energy demands and for the world to reach net zero. The financial sector has an important role to play in supporting the transition and we are determined to play our part. We are deploying financing to help scale-up the necessary activities needed in the transition to net zero. + For further details on climate-related opportunities see page 27. In December 2022 we announced a new target, to facilitate $1trn of Sustainable and Transition Financing between 2023 and the end of 2030. This followed our two previously announced targets: to deliver £150bn of social, environmental and sustainability-linked financing by 2025, which we surpassed in 2021, and to deliver £100bn of green financing by 2030, which we surpassed in 2023. Our $1trn target encompasses the green, social, transition and broader sustainability-linked financing requirements of clients including corporates, governments and the public sector, financial institutions and consumers. This includes financing of climate and environmental solutions including green mortgages, energy- efficient technology and renewable energy, as well as financing for broader social and sustainability work – including sustainability-linked structures and areas such as affordable housing. We are also facilitating funding into green technologies and low- carbon infrastructure projects, as well as using our advisory capabilities, product sets and financial expertise to help our customers and clients realise their own transitions to a low-carbon economy. The inclusion of transition financing in this target reflects our recognition of the importance of supporting the decarbonisation of hard-to-abate sectors that are carbon intensive. In early 2024 we announced our Transition Finance Framework (TFF), which outlines the criteria for transactions to qualify as transition financing and sits alongside our Sustainable Finance Framework (SFF) to define what can be included against this target. Our ability to meet the $1trn target and progress towards it from year to year will be dependent on a number of factors and variables outside our control. Factors such as market conditions, policy, laws, regulation, geopolitical developments and stakeholder expectations - including approaches to product labelling and regulatory scrutiny of green, sustainability-linked and social products - could impact lending and capital markets appetite and our approach to risk management, and therefore present a risk to our progress against, and delivery of, the target. Additionally, new climate and decarbonisation technologies may scale at varying rates, including being reliant on the supply and demand of raw materials, which may impact financing volumes. 	 We will continue to review and adapt our approach to Sustainable and Transition Financing in response to the evolving market opportunities. Progress against our $1trn target During 2023 we facilitated $67.8bn of Sustainable and Transition Financing, of which $67.4bn was sustainable financing, slightly up on 2022 of $65.3bn, and $0.4bn was transition financing that qualified against our new Transition Finance Framework. Our facilitation of $67.8bn of Sustainable and Transition Financing in a challenging market demonstrates our continued focus on supporting our clients on their sustainability journeys. Bond issuance1 was the largest product category in 2023, accounting for 76% of total Sustainable and Transition Financing while loans and equity accounted for 19% and 3% respectively. This mix showed a small shift towards bond activity and away from loans compared to the mix of our 2022 sustainable financing of $65.3bn, which comprised 71% bond issuance, 26% loans and 2% equity. Sustainable finance Sustainable financing, aligned to our Sustainable Finance Framework, consists of financing for dedicated use of proceeds, financing for clients with an eligible business mix in relevant environmental and social categories, and sustainability-linked financing which refers to general purpose funding. Social financing Raising finance for clients including supranational, national and regional development institutions was a key driver of the $32.4bn of social financing facilitated in 2023 (2022: $30.0bn). In 2023, we continued to see issuers aligning their financing commitments to social use of proceeds bonds which allocate funds to categories such as access to healthcare, affordable housing and essential services. As in 2022, we have also seen the use of social KPIs within sustainability-linked financing such as targets linked to gender diversity. Environmental financing In 2023, we facilitated $24.1bn of environmental financing (2022: $21.7bn). This performance reflected continued demand from our clients and our strategy to work with them to help facilitate their transitions to a low-carbon economy. Sustainability-linked financing Sustainability-linked bonds (SLBs) and sustainability-linked loans (SLLs) are forward- looking, performance-based debt instruments issued with specific sustainability performance targets. Our sustainability-linked financing totalled $10.9bn in 2023 (2022: $13.7bn). The sustainability-linked market continues to be of importance to both investors and issuers alike who use these instruments to embed their sustainability targets into financing commitments and we look forward to continuing to work with our clients to innovate the product set. Strategy Climate and sustainability report Governance Risk review Financial review Financial statements Barclays PLC 2023 Annual Report on Form 20-F 56 Implementing our Climate Strategy (continued) TCFD Strategy Recommendation (b) | Strategic Pillar 3
Transition financing In 2023, we facilitated $0.4bn of transition financing under our new Transition Finance Framework. While new technologies are still emerging, we are identifying opportunities to finance decarbonisation pathways across high- emitting sectors, including energy, power, chemicals, and metals. We are looking to play a role in supporting a range of carbon and emission reduction projects – from the manufacturing of blue hydrogen and related infrastructure for end-use sectors with limited decarbonisation alternatives, to the electrification of compressor units, resulting in the elimination of natural gas use, as well as the adoption of low-carbon technologies, As emerging technologies scale and continue to develop, we are committed to leveraging our expertise to further identify opportunities for transition financing. + For further details on our Sustainable Finance Framework and Transition Finance Framework see page 59. Facilitating £100bn of green financing Since 2018 we have facilitated a total of £113.7bn green financing – exceeding our target of £100bn well ahead of the 2030 target date. In 2023 we facilitated £25.9bn (2022: £25.5bn), comprising: • Labelled use of proceeds and general purpose financing in environmental categories of £19.8bn (2022: £18.0bn) • Sustainability-linked financing that incorporates environmental performance targets of £6.2bn (2022:£7.5bn). Breaking down our green financing by product type, the largest category in 2023 was bond issuance – accounting for 63% of the total (2022: 61%). Loans and equity made up 30% (2022: 33%) and 6% (2022: 4%) respectively. Note 1 Bond issuance includes Bonds (DCM), CMBS, Securitization, Munis and PCM Debt. Sustainable Impact Capital portfolio: Mandate to invest up to £500m into global climate technology start-ups We firmly believe that innovation is key to tackling climate change and we are committed to supporting transformative change by investing our own capital in entrepreneurial companies. In 2020 Barclays announced that it would invest up to £175m equity capital in environmentally focused climate technology companies by 2025 – helping support our clients to transition towards a low-carbon economy, scale solutions to environmental challenges, and fill their growth-stage funding gaps. In evidence of the success of the investments, in December 2022 we announced an increase of the investment mandate to invest up to £500m by the end of 2027. To date we have invested £138m into 21 innovative companies. These investments have supported many aspects of climate tech innovation, from property retrofit solutions to long-duration energy storage and hydrogen technologies. We continue to drive wider commercial and strategic opportunities for Barclays UK, Corporate Banking and Investment Banking with those companies. We continue to focus on decarbonisation technologies supporting transition within carbon-intensive sectors, particularly where Barclays has meaningful client exposure – such as Power, Industry, Transport, Agriculture and Real Estate – including solutions delivering carbon capture, carbon dioxide removal and green hydrogen. Strategy Climate and sustainability report Governance Risk review Financial review Financial statements Barclays PLC 2023 Annual Report on Form 20-F 57 Implementing our Climate Strategy (continued) TCFD Strategy Recommendation (b) | Strategic Pillar 3
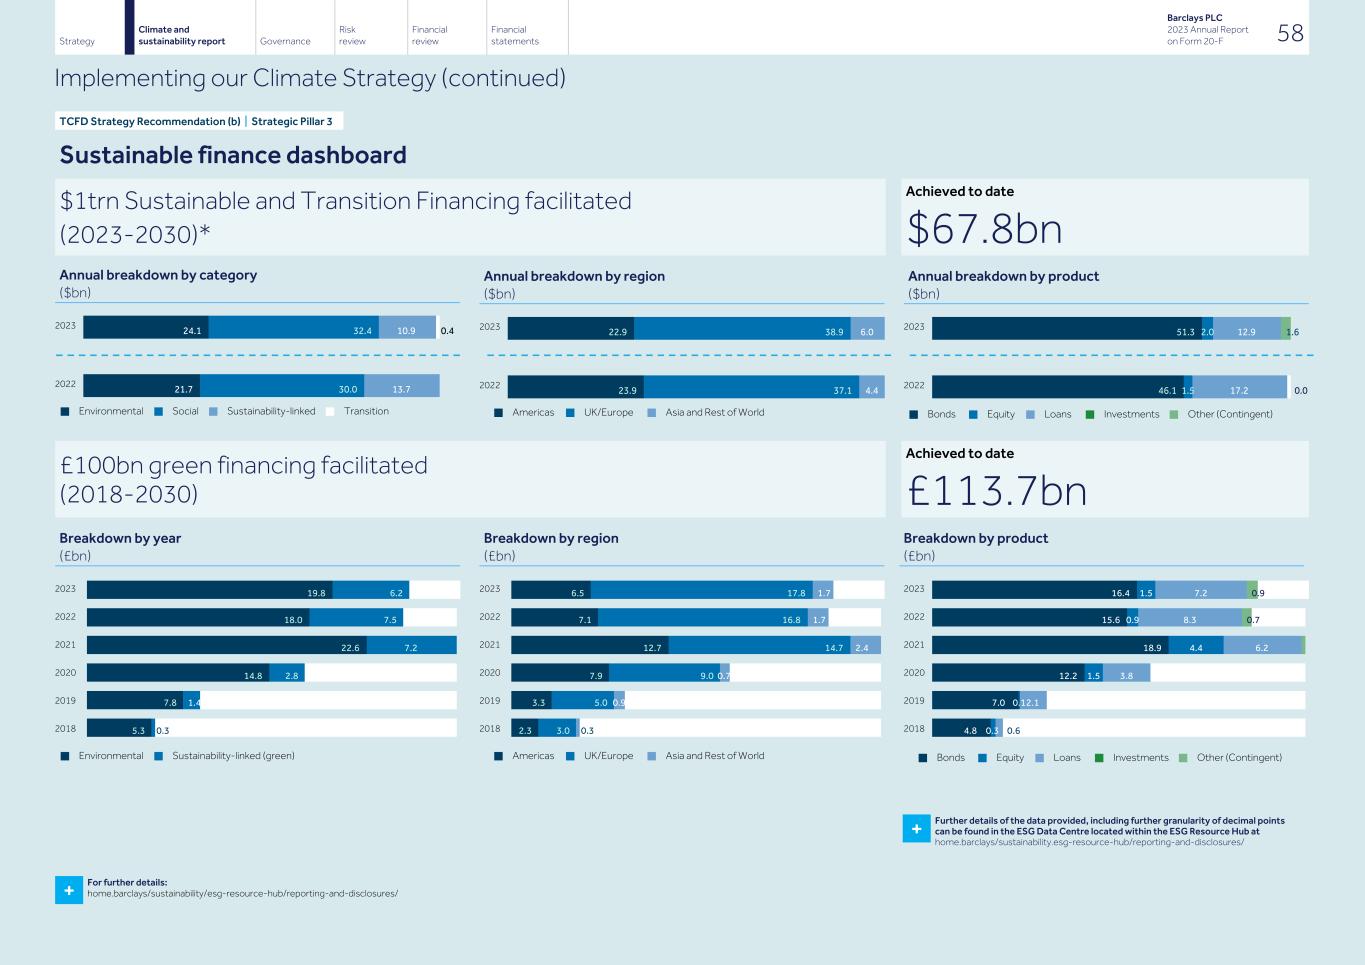
Sustainable finance dashboard $1trn Sustainable and Transition Financing facilitated (2023-2030)* Achieved to date $67.8bn Annual breakdown by category ($bn) 2023 24.1 32.4 10.9 0.4 2022 21.7 30.0 13.7 n Environmental n Social n Sustainability-linked n Transition Annual breakdown by region ($bn) 2023 22.9 38.9 6.0 2022 23.9 37.1 4.4 n Americas n UK/Europe n Asia and Rest of World Annual breakdown by product ($bn) 2023 51.3 2.0 12.9 1.6 2022 46.1 1.5 17.2 0.0 n Bonds n Equity n Loans n Investments n Other (Contingent) £100bn green financing facilitated (2018-2030) Achieved to date £113.7bn Breakdown by year (£bn) 2023 2022 2021 2020 2019 2018 19.8 18.0 22.6 14.8 7.8 5.3 6.2 7.5 7.2 2.8 1.4 0.3 n Environmental n Sustainability-linked (green) Breakdown by region (£bn) 2023 2022 2021 2020 2019 2018 6.5 7.1 12.7 7.9 3.3 2.3 17.8 16.8 14.7 9.0 5.0 3.0 1.7 1.7 2.4 0.7 0.9 0.3 n Americas n UK/Europe n Asia and Rest of World Breakdown by product (£bn) 2023 2022 2021 2020 2019 2018 16.4 15.6 18.9 12.2 7.0 4.8 1.5 0.9 4.4 1.5 0.1 0.3 7.2 8.3 6.2 3.8 2.1 0.6 0.9 0.7 n Bonds n Equity n Loans n Investments n Other (Contingent) + Further details of the data provided, including further granularity of decimal points can be found in the ESG Data Centre located within the ESG Resource Hub at home.barclays/sustainability.esg-resource-hub/reporting-and-disclosures/ + For further details: home.barclays/sustainability/esg-resource-hub/reporting-and-disclosures/ Strategy Climate and sustainability report Governance Risk review Financial review Financial statements Barclays PLC 2023 Annual Report on Form 20-F 58 Implementing our Climate Strategy (continued) TCFD Strategy Recommendation (b) | Strategic Pillar 3
Barclays' Sustainable and Transition Finance Frameworks Sustainable Finance Framework We seek to be transparent about our approach to reporting against our sustainable finance targets. Our sustainable financing is tracked using the methodology set out in the Barclays Sustainable Finance Framework (SFF). This framework defines the criteria we use for social financing, sustainable financing, green financing and sustainability-linked financing. This includes ‘dedicated purpose’ green and social financing, ‘general purpose’ financing based on eligible company business mix and sustainability-linked financing, and sets out applicable criteria drawing on industry guidelines and principles. It should be noted that the methodology is reliant on a range of data sources including Dealogic and Bloomberg transaction listings and league tables, as well as other third-party data and verification sources including company disclosures to aid the classification of financing into eligible green and social categories. We recognise that the quality, consistency and comparability of the data relied upon is not yet of the same standard as more traditional financial metrics and presents an inherent limitation to the performance reported. We will continue to review available data sources and enhance our methodology and processes to improve the robustness of the performance disclosed. The legal and regulatory landscape relating to sustainable financing – including the naming and categorisation of products as ‘green’, ‘social’, ‘sustainability-linked’ and otherwise – is rapidly evolving with differing regulations across jurisdictions. We may wish to revisit our approach in that context in the future. There is currently no globally accepted framework or definition (legal, regulatory or otherwise) governing what constitutes 'ESG', 'green', 'sustainable', or similarly labelled products – nor is there unanimous agreement on what attributes a particular investment, product or asset should have to be labelled as such. Furthermore, no assurance can be given that a globally accepted definition or consensus will develop over time. We will continue to monitor and comply with applicable jurisdictional regulatory taxonomy definitions and product labelling obligations as they emerge. As innovation in sustainable finance continues to accelerate, we will continue to review and update our SFF, our measurement of our performance against targets, and keep our general approach under review. We have updated our SFF to version 4.1, published in February 2024, which will apply to financing volumes from January 2024 tracked against our target to facilitate $1trn of Sustainable and Transition Financing between 2023 and the end of 2030. + Barclays' Sustainable Finance Framework can be found online in our ESG Resource Hub at: home.barclays/ sustainability/esg-resource-hub/reporting-and-disclosures/ Transition Finance Framework Our transition financing is tracked using the methodology set out in the Barclays Transition Finance Framework (TFF). Barclays has developed and published in February 2024 the first version of the TFF for classifying financing as 'transition' for the purpose of tracking and disclosing our performance against our target to facilitate $1trn of Sustainable and Transition Financing between 2023 and the end of 2030. The inclusion of transition financing in this target reflects our recognition of the importance of lending, facilitating funding and investing in technologies and activities that support GHG emissions reduction, directly or indirectly, in high-emitting and hard-to-abate sectors. The TFF is complementary to our Sustainable Finance Framework, The TFF augments the scope of Barclays' SFF and determines the eligibility of transition activities that sit outside the sustainable finance already covered by the SFF. As there is no universal consensus as to how to define 'transition' activities, Barclays has developed its own definition of transition finance as follows: Our definition of transition finance Transition finance is any financing including lending, capital markets and other financing solutions provided to clients for activities – including technologies – that support GHG emissions reduction directly or indirectly in high-emitting and hard-to- abate sectors towards a 1.5°C pathway. The TFF outlines the criteria for eligible transactions with a set of defined principles to guide us in the application of our definition of transition finance as we support high-emitting clients and finance real economy decarbonisation. As innovation and market principles in relation to transition finance continue to accelerate and evolve, we will continue to consider and develop our definition of transition finance and the coverage under the TFF. + Barclays' Transition Finance Framework can be found online in our ESG Resource Hub at: home.barclays/sustainability/esg- resource-hub/reporting-and-disclosures/ Strategy Climate and sustainability report Governance Risk review Financial review Financial statements Barclays PLC 2023 Annual Report on Form 20-F 59 Implementing our Climate Strategy (continued) TCFD Strategy Recommendation (b) | Strategic Pillar 3
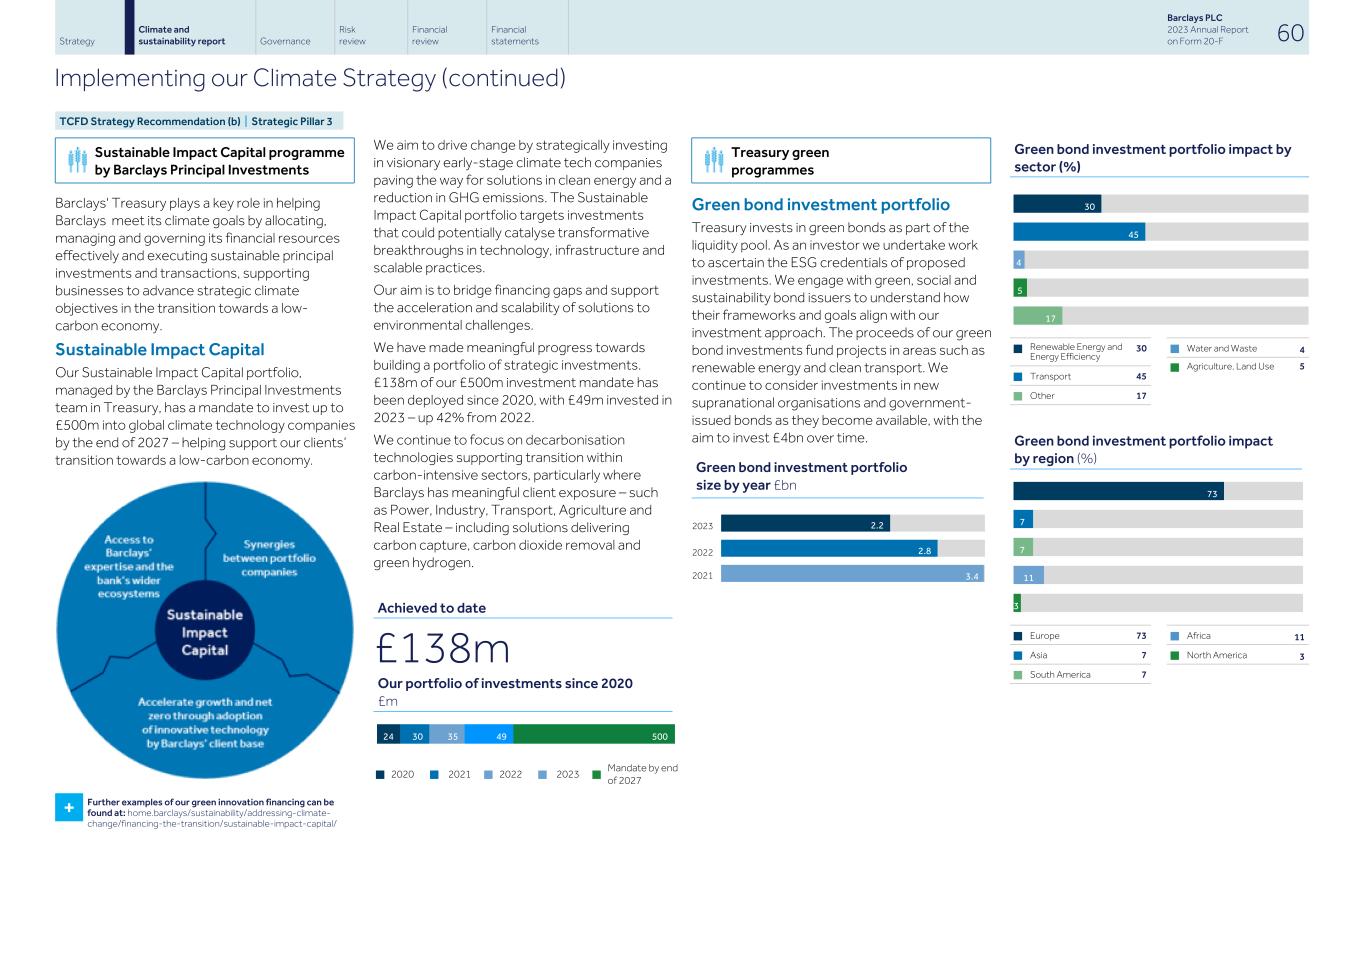
Sustainable Impact Capital programme by Barclays Principal Investments Barclays' Treasury plays a key role in helping Barclays meet its climate goals by allocating, managing and governing its financial resources effectively and executing sustainable principal investments and transactions, supporting businesses to advance strategic climate objectives in the transition towards a low- carbon economy. Sustainable Impact Capital Our Sustainable Impact Capital portfolio, managed by the Barclays Principal Investments team in Treasury, has a mandate to invest up to £500m into global climate technology companies by the end of 2027 – helping support our clients’ transition towards a low-carbon economy. + Further examples of our green innovation financing can be found at: home.barclays/sustainability/addressing-climate- change/financing-the-transition/sustainable-impact-capital/ We aim to drive change by strategically investing in visionary early-stage climate tech companies paving the way for solutions in clean energy and a reduction in GHG emissions. The Sustainable Impact Capital portfolio targets investments that could potentially catalyse transformative breakthroughs in technology, infrastructure and scalable practices. Our aim is to bridge financing gaps and support the acceleration and scalability of solutions to environmental challenges. We have made meaningful progress towards building a portfolio of strategic investments. £138m of our £500m investment mandate has been deployed since 2020, with £49m invested in 2023 – up 42% from 2022. We continue to focus on decarbonisation technologies supporting transition within carbon-intensive sectors, particularly where Barclays has meaningful client exposure – such as Power, Industry, Transport, Agriculture and Real Estate – including solutions delivering carbon capture, carbon dioxide removal and green hydrogen. Achieved to date £138m Our portfolio of investments since 2020 £m 24 30 35 49 500 n 2020 n 2021 n 2022 n 2023 n Mandate by end of 2027 Treasury green programmes Green bond investment portfolio Treasury invests in green bonds as part of the liquidity pool. As an investor we undertake work to ascertain the ESG credentials of proposed investments. We engage with green, social and sustainability bond issuers to understand how their frameworks and goals align with our investment approach. The proceeds of our green bond investments fund projects in areas such as renewable energy and clean transport. We continue to consider investments in new supranational organisations and government- issued bonds as they become available, with the aim to invest £4bn over time. Green bond investment portfolio size by year £bn 2023 2022 2021 2.2 2.8 3.4 Green bond investment portfolio impact by sector (%) 30 45 4 5 17 n Renewable Energy and Energy Efficiency 30 n Water and Waste 4 n Agriculture, Land Use 5 n Transport 45 n Other 17 Green bond investment portfolio impact by region (%) 73 7 7 11 3 n Europe 73 n Africa 11 n Asia 7 n North America 3 n South America 7 Strategy Climate and sustainability report Governance Risk review Financial review Financial statements Barclays PLC 2023 Annual Report on Form 20-F 60 Implementing our Climate Strategy (continued) TCFD Strategy Recommendation (b) | Strategic Pillar 3
Embedding climate and sustainability into our business We are embedding climate and sustainability throughout Barclays, taking into account the impact of climate-related risks and opportunities on our businesses, strategy and financial planning. Our Climate Strategy is underpinned by the way we assess and manage our exposure to climate- related risk, as well as by our purpose to work together for a better financial future for our customers, clients and communities. The risks associated with climate change are subject to rapidly increasing societal, regulatory and policy focus both in the UK and internationally. In 2022, Climate risk became a Principal Risk within our Enterprise Risk Management Framework, aiming to ensure a holistic approach to risk identification, assessment and management. Barclays' Climate Risk Framework facilitates the structured integration of climate risk considerations into the Bank's operations. It undergoes regular reviews and updates – including changes to risk taxonomy, definitions and methodology – which align to align the Framework with changing regulatory expectations and external developments. + Further details on climate risk identification, assessment and management can be navigated via the Risk Review contents section on page 182. We continue to build on our inclusion of Climate Strategy and climate-related risks and opportunities in our financial planning, working to further embed these considerations into our products and services and operations. We have continued to work on embedding climate and sustainability considerations into the culture of the organisation through training and knowledge building. We have developed several climate- and sustainability-related mandatory and non-mandatory training initiatives across the organisation and provided training to a number of functions across the Group. Impact of climate-related risks and opportunities on our business, strategy and financial planning Barclays’ 2023 financial planning process included a review of our strategy, its implementation, and tracking of our progress against climate-related targets – as well as capturing a view of climate-related risks and opportunities. During 2023 we enhanced our monthly reporting framework to cover a view of the balance sheet and revenue from Sustainable Financing. This supports our ability to review our sustainable financing portfolio at greater granularity and improve relevant business engagement through the financial planning process. Enhancements were made to help us further evaluate the portfolio's performance and identify opportunities to maximise revenue generation activities. These outputs have been incorporated in our financial planning process for 2023. Our planning process also considered current climate policies to ensure they are included in the base scenario. We also considered impairment over the horizon of the financial plan. At this point in time, there are no material amendments required to the financial plan. All key businesses and functions are involved in integrating climate-related risks and opportunities into our financial planning process. Implementing our Climate Strategy is managed through central Sustainable Finance teams under the Heads of Sustainable Finance for both CIB and Barclays UK. We are developing processes and levers that we anticipate will allow us to further engage and impact the businesses we work with. For example: • The three pillars of our Climate Strategy, as well as our Sustainable and Transition Financing target of $1trn, are key drivers of our finance planning process with a pathway to achieve this as well as risks and opportunities reviewed with business heads • We continue to develop our green, sustainable and transition finance banking product sets, including for retail customers, (for example green mortgages), bonds/loans (including Project Finance for renewables) and securitised products • We strive to continue to decarbonise our own operations, reducing our Scope 1 and 2 emissions and our Scope 3 operational emissions • We are tracking progress towards portfolio alignment of our financed emissions with the goals and timelines of the Paris Agreement through BlueTrack™, which includes a number of portfolio alignment metrics and levers available to manage the portfolio against these targets while understanding their financial implications. The metrics are subject to second-line review by the Climate Risk team to assess the strategy against the targets. We have developed an internal approach to track and monitor progress against our targets and how we govern these internally • We conduct portfolio reviews to monitor whether business activities are conducted within Barclays’ mandate and aligned with our expectations, and whether they are of an appropriate scale relative to the risk and reward of the underlying activities. Mandate & Scale Exposure Controls form part of our overall Risk Appetite Control Framework and climate risks have been integrated into annual credit portfolio reviews for elevated risk sectors since 2020. Furthermore, we have introduced mandate and scale limits linked to scoring within our Client Transition Framework. Strategy Climate and sustainability report Governance Risk review Financial review Financial statements Barclays PLC 2023 Annual Report on Form 20-F 61 Implementing our Climate Strategy (continued) TCFD Strategy Recommendation (b)
The 2023 financial planning process used a five- year climate baseline scenario to consider the impacts of climate risks. The baseline scenario considered the impact of current and agreed climate policies across the UK, US and EU on macroeconomic variables such as GDP and Unemployment. This was done via a detailed assessment of climate policy impacts, likelihood of implementation and current level of policy progress. The outcome of this assessment led to a comparison between the climate baseline scenario and the scenarios used for financial planning, indicating a current deminimis impact on the macroeconomic variables used to project financial performance. We will continue to review how climate risks manifest in the economy through a baseline scenario – and, where these impacts increase, will consider those within our financial planning process. Workstreams specifically related to finance have been further embedded within our overall global financial planning processes, including dedicated climate management reporting information. Further details of how this work has served as an input in our five-year financial planning process are set out below – including our approach to sustainable financing, targets and capital investments. During the 2023 financial planning process we assessed the financial impact of embedding individual parts of our Climate Strategy, new initiatives and targets across our businesses. This includes the wholesale credit book, sustainable financing and sustainable lending in the CIB, and initiatives across our retail businesses such as green mortgages and sustainable investing. Build-out of new product capabilities including Global Project Finance are also captured. A range of scenario analyses was undertaken this year with the aim to further uncover areas of risk and opportunity, as well as integrate climate scenario analysis into our strategic and financial planning. This included two climate stress-tests with the results allowing Barclays to understand resilience to Climate risk in those scenarios. The strategic review of sustainable financing was also refreshed during the year across Barclays UK and the CIB. The review built upon both new and previously identified commercial opportunities. The output was considered in the financial planning process, including incremental revenue, cost and capital. Key opportunities continue to reside within Equity Capital Markets, Debt Capital Markets and lending, and some smaller new markets. The planning process included an assessment of our financed emissions reduction targets for some of our highest-emitting sectors: Energy, Power, Cement, Automotive and Steel. Barclays has set absolute emissions or emissions intensity targets for these sectors and the impacts of meeting them are integrated into the financial planning process. Barclays continues to engage with our clients to support their transition to a low-carbon economy. Our current emissions targets are not forecasted to materially impact financial performance over the next five years. The financial planning process also covered a review of our net zero operations strategy. Building on the hiring of our Heads of Sustainable Finance in CIB and Barclays UK, over the past year we have continued to grow our existing talent with several strategic hires – with a focus on expanding our product capabilities as we continue to drive performance against our selected targets. Each hire will allow us to further accelerate our Climate Strategy and increase co- ordination, with a focus on how we can help our customers and clients with their individual transitions to a low-carbon economy. We will continue to further enhance how our Climate Strategy is embedded into the way we think about financial planning over the coming years – reflecting on the progress we made during 2023. Incentives For the Executive Directors of Barclays PLC, an element of each of their annual bonus awards and Long-Term Incentive Plan awards is driven by non-financial performance measures – including measures relating to climate and sustainability. Barclays’ performance against non-financial measures, including ESG metrics, is also explicitly considered in the determination of the incentive pool – directly impacting pay levels of the wider workforce. Non-financial performance for the Executive Directors’ 2023 annual bonus and the 2023 incentives pool was assessed against three categories: Customers and clients; Colleagues; and Climate and Sustainability. The latter included climate-related measures such as performance against our Sustainable and Transition Financing target, financed emissions reduction targets, carbon footprint reduction, and increase in renewable energy usage – as well as measures relating to our investment in communities. + Further details can be found in our Remuneration report from page 119. Strategy Climate and sustainability report Governance Risk review Financial review Financial statements Barclays PLC 2023 Annual Report on Form 20-F 62 Implementing our Climate Strategy (continued) TCFD Strategy Recommendation (b)
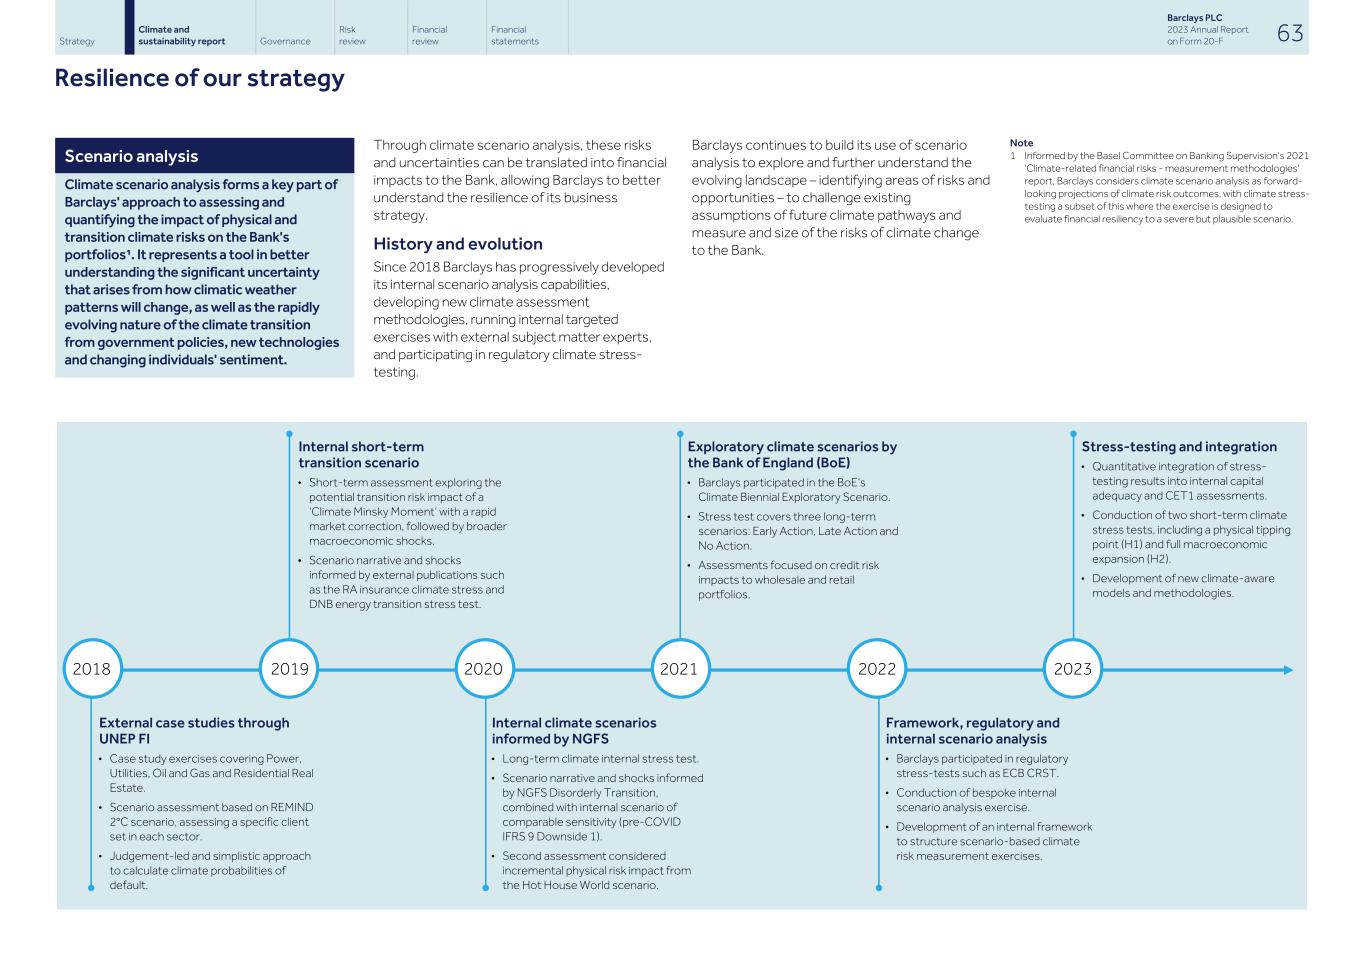
Scenario analysis Climate scenario analysis forms a key part of Barclays' approach to assessing and quantifying the impact of physical and transition climate risks on the Bank's portfolios¹. It represents a tool in better understanding the significant uncertainty that arises from how climatic weather patterns will change, as well as the rapidly evolving nature of the climate transition from government policies, new technologies and changing individuals' sentiment. Through climate scenario analysis, these risks and uncertainties can be translated into financial impacts to the Bank, allowing Barclays to better understand the resilience of its business strategy. History and evolution Since 2018 Barclays has progressively developed its internal scenario analysis capabilities, developing new climate assessment methodologies, running internal targeted exercises with external subject matter experts, and participating in regulatory climate stress- testing. Barclays continues to build its use of scenario analysis to explore and further understand the evolving landscape – identifying areas of risks and opportunities – to challenge existing assumptions of future climate pathways and measure and size of the risks of climate change to the Bank. Note 1 Informed by the Basel Committee on Banking Supervision's 2021 'Climate-related financial risks - measurement methodologies' report, Barclays considers climate scenario analysis as forward- looking projections of climate risk outcomes, with climate stress- testing a subset of this where the exercise is designed to evaluate financial resiliency to a severe but plausible scenario. Internal short-term transition scenario • Short-term assessment exploring the potential transition risk impact of a ‘Climate Minsky Moment’ with a rapid market correction, followed by broader macroeconomic shocks. • Scenario narrative and shocks informed by external publications such as the RA insurance climate stress and DNB energy transition stress test. Exploratory climate scenarios by the Bank of England (BoE) • Barclays participated in the BoE’s Climate Biennial Exploratory Scenario. • Stress test covers three long-term scenarios: Early Action, Late Action and No Action. • Assessments focused on credit risk impacts to wholesale and retail portfolios. Stress-testing and integration • Quantitative integration of stress- testing results into internal capital adequacy and CET1 assessments. • Conduction of two short-term climate stress tests, including a physical tipping point (H1) and full macroeconomic expansion (H2). • Development of new climate-aware models and methodologies. 2018 2019 2020 2021 2022 2023 External case studies through UNEP FI • Case study exercises covering Power, Utilities, Oil and Gas and Residential Real Estate. • Scenario assessment based on REMIND 2°C scenario, assessing a specific client set in each sector. • Judgement-led and simplistic approach to calculate climate probabilities of default. Internal climate scenarios informed by NGFS • Long-term climate internal stress test. • Scenario narrative and shocks informed by NGFS Disorderly Transition, combined with internal scenario of comparable sensitivity (pre-COVID IFRS 9 Downside 1). • Second assessment considered incremental physical risk impact from the Hot House World scenario. Framework, regulatory and internal scenario analysis • Barclays participated in regulatory stress-tests such as ECB CRST. • Conduction of bespoke internal scenario analysis exercise. • Development of an internal framework to structure scenario-based climate risk measurement exercises. Strategy Climate and sustainability report Governance Risk review Financial review Financial statements Barclays PLC 2023 Annual Report on Form 20-F 63 Resilience of our strategy
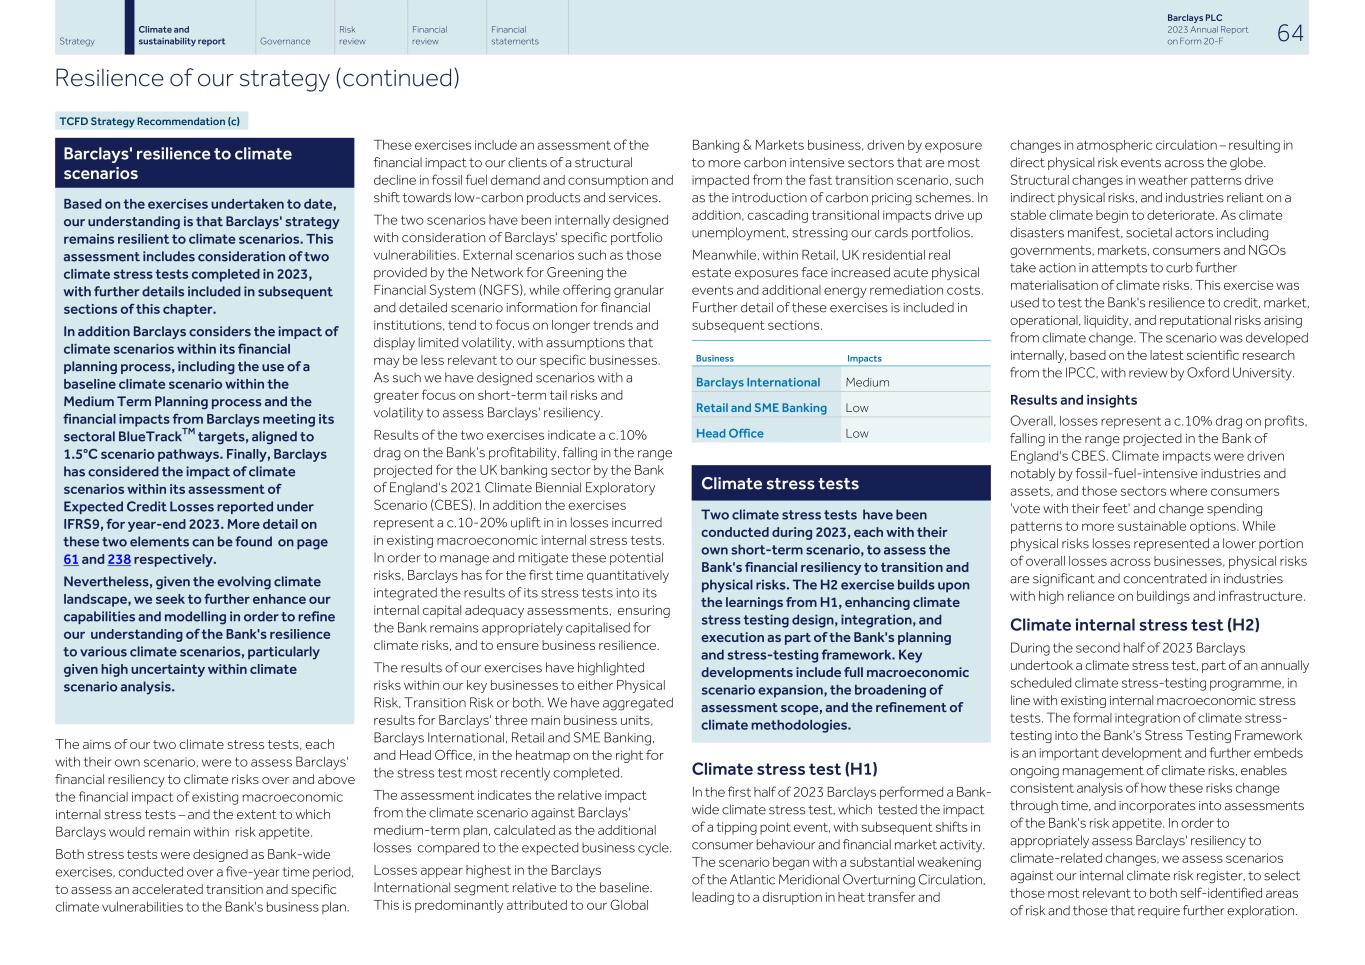
Barclays' resilience to climate scenarios Based on the exercises undertaken to date, our understanding is that Barclays' strategy remains resilient to climate scenarios. This assessment includes consideration of two climate stress tests completed in 2023, with further details included in subsequent sections of this chapter. In addition Barclays considers the impact of climate scenarios within its financial planning process, including the use of a baseline climate scenario within the Medium Term Planning process and the financial impacts from Barclays meeting its sectoral BlueTrackTM targets, aligned to 1.5°C scenario pathways. Finally, Barclays has considered the impact of climate scenarios within its assessment of Expected Credit Losses reported under IFRS9, for year-end 2023. More detail on these two elements can be found on page 61 and 238 respectively. Nevertheless, given the evolving climate landscape, we seek to further enhance our capabilities and modelling in order to refine our understanding of the Bank's resilience to various climate scenarios, particularly given high uncertainty within climate scenario analysis. The aims of our two climate stress tests, each with their own scenario, were to assess Barclays' financial resiliency to climate risks over and above the financial impact of existing macroeconomic internal stress tests – and the extent to which Barclays would remain within risk appetite. Both stress tests were designed as Bank-wide exercises, conducted over a five-year time period, to assess an accelerated transition and specific climate vulnerabilities to the Bank's business plan. These exercises include an assessment of the financial impact to our clients of a structural decline in fossil fuel demand and consumption and shift towards low-carbon products and services. The two scenarios have been internally designed with consideration of Barclays' specific portfolio vulnerabilities. External scenarios such as those provided by the Network for Greening the Financial System (NGFS), while offering granular and detailed scenario information for financial institutions, tend to focus on longer trends and display limited volatility, with assumptions that may be less relevant to our specific businesses. As such we have designed scenarios with a greater focus on short-term tail risks and volatility to assess Barclays' resiliency. Results of the two exercises indicate a c.10% drag on the Bank’s profitability, falling in the range projected for the UK banking sector by the Bank of England's 2021 Climate Biennial Exploratory Scenario (CBES). In addition the exercises represent a c.10-20% uplift in in losses incurred in existing macroeconomic internal stress tests. In order to manage and mitigate these potential risks, Barclays has for the first time quantitatively integrated the results of its stress tests into its internal capital adequacy assessments, ensuring the Bank remains appropriately capitalised for climate risks, and to ensure business resilience. The results of our exercises have highlighted risks within our key businesses to either Physical Risk, Transition Risk or both. We have aggregated results for Barclays' three main business units, Barclays International, Retail and SME Banking, and Head Office, in the heatmap on the right for the stress test most recently completed. The assessment indicates the relative impact from the climate scenario against Barclays' medium-term plan, calculated as the additional losses compared to the expected business cycle. Losses appear highest in the Barclays International segment relative to the baseline. This is predominantly attributed to our Global Banking & Markets business, driven by exposure to more carbon intensive sectors that are most impacted from the fast transition scenario, such as the introduction of carbon pricing schemes. In addition, cascading transitional impacts drive up unemployment, stressing our cards portfolios. Meanwhile, within Retail, UK residential real estate exposures face increased acute physical events and additional energy remediation costs. Further detail of these exercises is included in subsequent sections. Business Impacts Barclays International Medium Retail and SME Banking Low Head Office Low Climate stress tests Two climate stress tests have been conducted during 2023, each with their own short-term scenario, to assess the Bank's financial resiliency to transition and physical risks. The H2 exercise builds upon the learnings from H1, enhancing climate stress testing design, integration, and execution as part of the Bank's planning and stress-testing framework. Key developments include full macroeconomic scenario expansion, the broadening of assessment scope, and the refinement of climate methodologies. Climate stress test (H1) In the first half of 2023 Barclays performed a Bank- wide climate stress test, which tested the impact of a tipping point event, with subsequent shifts in consumer behaviour and financial market activity. The scenario began with a substantial weakening of the Atlantic Meridional Overturning Circulation, leading to a disruption in heat transfer and changes in atmospheric circulation – resulting in direct physical risk events across the globe. Structural changes in weather patterns drive indirect physical risks, and industries reliant on a stable climate begin to deteriorate. As climate disasters manifest, societal actors including governments, markets, consumers and NGOs take action in attempts to curb further materialisation of climate risks. This exercise was used to test the Bank's resilience to credit, market, operational, liquidity, and reputational risks arising from climate change. The scenario was developed internally, based on the latest scientific research from the IPCC, with review by Oxford University. Results and insights Overall, losses represent a c.10% drag on profits, falling in the range projected in the Bank of England's CBES. Climate impacts were driven notably by fossil-fuel-intensive industries and assets, and those sectors where consumers 'vote with their feet' and change spending patterns to more sustainable options. While physical risks losses represented a lower portion of overall losses across businesses, physical risks are significant and concentrated in industries with high reliance on buildings and infrastructure. Climate internal stress test (H2) During the second half of 2023 Barclays undertook a climate stress test, part of an annually scheduled climate stress-testing programme, in line with existing internal macroeconomic stress tests. The formal integration of climate stress- testing into the Bank's Stress Testing Framework is an important development and further embeds ongoing management of climate risks, enables consistent analysis of how these risks change through time, and incorporates into assessments of the Bank's risk appetite. In order to appropriately assess Barclays' resiliency to climate-related changes, we assess scenarios against our internal climate risk register, to select those most relevant to both self-identified areas of risk and those that require further exploration. Strategy Climate and sustainability report Governance Risk review Financial review Financial statements Barclays PLC 2023 Annual Report on Form 20-F 64 Resilience of our strategy (continued) TCFD Strategy Recommendation (c)
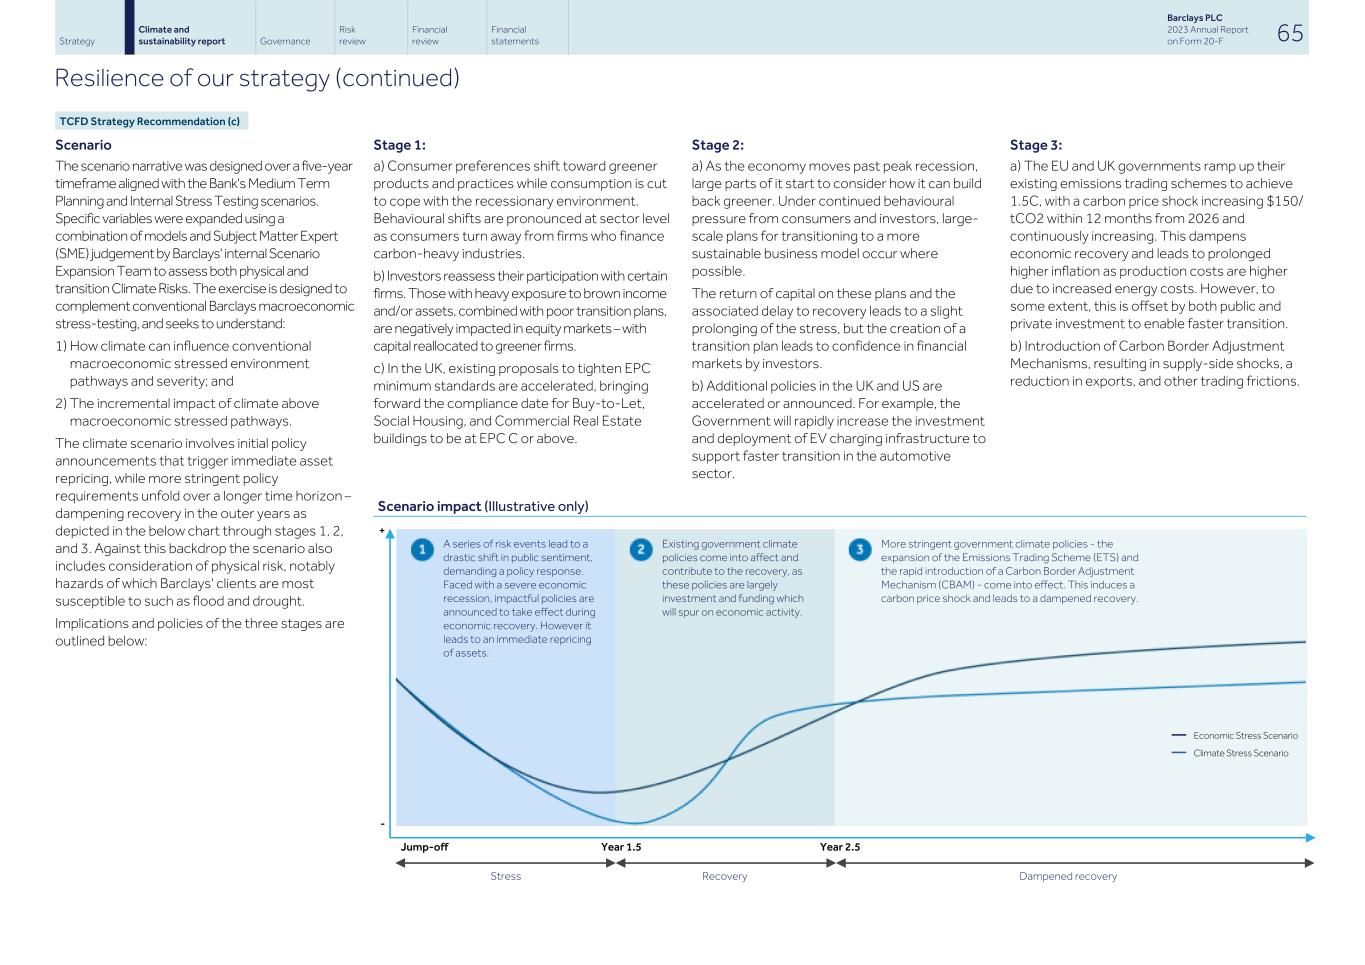
Scenario The scenario narrative was designed over a five-year timeframe aligned with the Bank's Medium Term Planning and Internal Stress Testing scenarios. Specific variables were expanded using a combination of models and Subject Matter Expert (SME) judgement by Barclays' internal Scenario Expansion Team to assess both physical and transition Climate Risks. The exercise is designed to complement conventional Barclays macroeconomic stress-testing, and seeks to understand: 1) How climate can influence conventional macroeconomic stressed environment pathways and severity; and 2) The incremental impact of climate above macroeconomic stressed pathways. The climate scenario involves initial policy announcements that trigger immediate asset repricing, while more stringent policy requirements unfold over a longer time horizon – dampening recovery in the outer years as depicted in the below chart through stages 1, 2, and 3. Against this backdrop the scenario also includes consideration of physical risk, notably hazards of which Barclays' clients are most susceptible to such as flood and drought. Implications and policies of the three stages are outlined below: Stage 1: a) Consumer preferences shift toward greener products and practices while consumption is cut to cope with the recessionary environment. Behavioural shifts are pronounced at sector level as consumers turn away from firms who finance carbon-heavy industries. b) Investors reassess their participation with certain firms. Those with heavy exposure to brown income and/or assets, combined with poor transition plans, are negatively impacted in equity markets – with capital reallocated to greener firms. c) In the UK, existing proposals to tighten EPC minimum standards are accelerated, bringing forward the compliance date for Buy-to-Let, Social Housing, and Commercial Real Estate buildings to be at EPC C or above. Scenario impact (Illustrative only) A series of risk events lead to a drastic shift in public sentiment, demanding a policy response. Faced with a severe economic recession, impactful policies are announced to take effect during economic recovery. However it leads to an immediate repricing of assets. Existing government climate policies come into affect and contribute to the recovery, as these policies are largely investment and funding which will spur on economic activity. More stringent government climate policies - the expansion of the Emissions Trading Scheme (ETS) and the rapid introduction of a Carbon Border Adjustment Mechanism (CBAM) - come into effect. This induces a carbon price shock and leads to a dampened recovery. — Economic Stress Scenario — Climate Stress Scenario Jump-off Year 1.5 Year 2.5 Stress Recovery Dampened recovery Stage 2: a) As the economy moves past peak recession, large parts of it start to consider how it can build back greener. Under continued behavioural pressure from consumers and investors, large- scale plans for transitioning to a more sustainable business model occur where possible. The return of capital on these plans and the associated delay to recovery leads to a slight prolonging of the stress, but the creation of a transition plan leads to confidence in financial markets by investors. b) Additional policies in the UK and US are accelerated or announced. For example, the Government will rapidly increase the investment and deployment of EV charging infrastructure to support faster transition in the automotive sector. Stage 3: a) The EU and UK governments ramp up their existing emissions trading schemes to achieve 1.5C, with a carbon price shock increasing $150/ tCO2 within 12 months from 2026 and continuously increasing. This dampens economic recovery and leads to prolonged higher inflation as production costs are higher due to increased energy costs. However, to some extent, this is offset by both public and private investment to enable faster transition. b) Introduction of Carbon Border Adjustment Mechanisms, resulting in supply-side shocks, a reduction in exports, and other trading frictions. Strategy Climate and sustainability report Governance Risk review Financial review Financial statements Barclays PLC 2023 Annual Report on Form 20-F 65 Resilience of our strategy (continued) TCFD Strategy Recommendation (c) + -
The scenario will have significant impacts on Barclays, including: 1) Amplified market shocks: additional to existing macroeconomic shocks, there will be further equity and credit shocks for brown industries and financiers, as a result of immediate repricing. 2) Amplified credit deterioration: additional credit risk on brown industries as a result of lower earnings expectations and refinancing risks. 3) Increase in frequency of physical risk events: throughout the time horizon, there is an increase in the occurrence of physical hazards such as flood, hurricanes and droughts. Following the above narrative, scenario variables are provided with varying levels of granularity. For example, global variables – notably demand in climate-sensitive sectors such as Energy, Power and Automotive – national variables – including unemployment rates, GDP, HPI, CPI, government legislation on EPC with further distinction between commercial and residential real estate – and property level variables, including subsidence and flood. Calibration is guided by the narrative with consideration for compounding effects of existing economic downturn and climate stresses, informing the shape and magnitude of variable calibration over the scenario horizon. Material technological development has not been assumed within the economic projections, given the immediate and short time horizon of the scenario.Variables are leveraged to assess impacts on Credit Risk, Market Risk, Counterparty Credit Risk, Underwriting, Non- traded Market Risk, Income and Balance Sheet, Expenses, Pension, Liquidity, and Capital across Barclays – with a focus on UK, US, and EU regions. Results and insights Overall, losses are comparable with those seen in H1, also representing a c.10% drag on profits. While losses are significant, they remain manageable within the Bank's existing risk profile. Within Barclays International, losses were driven mostly by companies operating in heavily emission-intensive industries due to rising carbon prices over the scenario, or those within sectors where demand for products and services rapidly fall due to consumer behaviour shifts or wider decarbonisation of the economy. In addition, market pressures and government policies on low-energy-efficiency Commercial Real Estate leads to deterioration in these markets both in the UK and US. In addition, rising unemployment rates across Barclays' major operating geographies cause negative impacts on consumer affordability through the loss of jobs and a weakened macroeconomic environment. Nevertheless, Barclays remains resilient to these additional losses, and current risk management mitigates these macroeconomic drivers. Retail and SME segment is impacted by higher frequency of acute events with real estate and agricultural assets susceptible to physical risks such as drought and flood. Despite this, the portfolios remain resilient due to availability of household insurance and the strong loan-to- value profile of the lending. Sensitivity analysis was conducted to severely constrained household insurance availability, with Barclays remaining resilient, albeit noting small populations would be impacted significantly. We will continue to refine and adapt our insurance assumptions to reflect ongoing changes in market expectations. In addition, while transition policies on emissions reduction and energy efficiency improvements do yield greater impacts, especially as customers begin to price energy performance more explicitly in their decisions, the resultant drag on annual profits remains manageable. We acknowledge, however, that further advances in modelling capability and data availability are needed to fully understand the extent of these losses, given high uncertainty in climate scenario analysis. For example, the scenario does not capture compounding and interaction effects between physical and transition risks that could potentially amplify such loss. As such, Barclays' annual climate stress-testing cycle is in place to address these uncertainties, by testing our business resilience under different climate scenarios and continuously refining our climate methodologies. 2023 Enhancements and beyond During 2023 Barclays made several key enhancements across climate scenario development, climate risk modelling, and the ways we embed climate learnings into our risk management. • Climate scenarios are designed and developed with our internal specialist scenario expansion team, leveraging the tools and approaches of the existing scenario expansion processes and supplementing these with specific climate analysis. This ensures consistency in climate scenario design alongside existing regulatory internal scenarios, as well as detailed and granular climate scenario expansion. • Climate risk models are developed according to Barclays' Climate Credit Risk Adjustment Framework, such that model execution across our suite of climate models follows a consistent process – adhering to defined principles and integrated strategically with our existing model suite whilst still having the flexibility to include portfolio-specific constraints and characteristics. Although for stress-testing purposes Barclays' focus remains on five-year scenarios aligned with our usual planning horizon, models in development are designed to enable assessment of longer horizons – 10 years or longer – should we decide to explore these in the future. Climate Credit Risk Adjustment Framework Further design and piloting of Barclays' climate risk model methodology is underway, focusing on integrating new climate modelling techniques into the Bank's existing financial analysis processes. The target state is a flexible and adaptable process that can support various modelling techniques and allow us to test a wide range of possible future scenarios. Estimates of incremental credit risk spreads will be integrated with Capital, Impairment and Stress Testing Models to quantify climate risk. Residential Real Estate We have continued to improve our understanding of how physical and transition risks could impact our Mortgages portfolio in the UK, reflecting on learnings in previous scenario analysis exercises such as the Bank of England's Climate Biennial Exploratory Scenario, engaging with specialist data providers, and undertaking quantitative analysis of the impacts of climate risks. Strategy Climate and sustainability report Governance Risk review Financial review Financial statements Barclays PLC 2023 Annual Report on Form 20-F 66 Resilience of our strategy (continued) TCFD Strategy Recommendation (c)
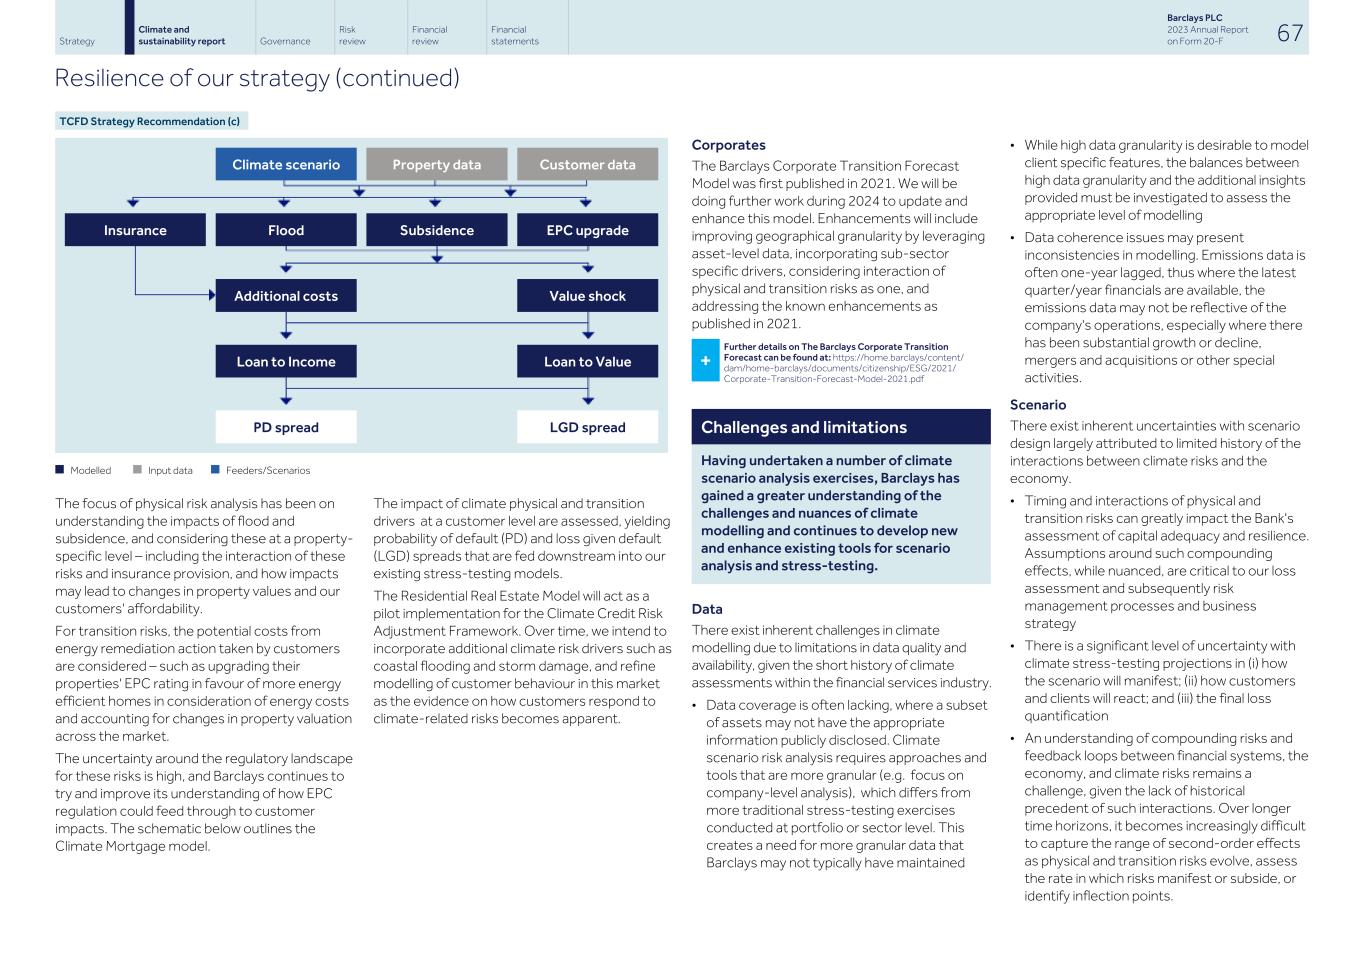
Climate scenario Property data Customer data Insurance Flood Subsidence EPC upgrade Additional costs Value shock Loan to Income Loan to Value PD spread LGD spread n Modelled n Input data n Feeders/Scenarios The focus of physical risk analysis has been on understanding the impacts of flood and subsidence, and considering these at a property- specific level – including the interaction of these risks and insurance provision, and how impacts may lead to changes in property values and our customers' affordability. For transition risks, the potential costs from energy remediation action taken by customers are considered – such as upgrading their properties' EPC rating in favour of more energy efficient homes in consideration of energy costs and accounting for changes in property valuation across the market. The uncertainty around the regulatory landscape for these risks is high, and Barclays continues to try and improve its understanding of how EPC regulation could feed through to customer impacts. The schematic below outlines the Climate Mortgage model. The impact of climate physical and transition drivers at a customer level are assessed, yielding probability of default (PD) and loss given default (LGD) spreads that are fed downstream into our existing stress-testing models. The Residential Real Estate Model will act as a pilot implementation for the Climate Credit Risk Adjustment Framework. Over time, we intend to incorporate additional climate risk drivers such as coastal flooding and storm damage, and refine modelling of customer behaviour in this market as the evidence on how customers respond to climate-related risks becomes apparent. Corporates The Barclays Corporate Transition Forecast Model was first published in 2021. We will be doing further work during 2024 to update and enhance this model. Enhancements will include improving geographical granularity by leveraging asset-level data, incorporating sub-sector specific drivers, considering interaction of physical and transition risks as one, and addressing the known enhancements as published in 2021. + Further details on The Barclays Corporate Transition Forecast can be found at: https://home.barclays/content/ dam/home-barclays/documents/citizenship/ESG/2021/ Corporate-Transition-Forecast-Model-2021.pdf Challenges and limitations Having undertaken a number of climate scenario analysis exercises, Barclays has gained a greater understanding of the challenges and nuances of climate modelling and continues to develop new and enhance existing tools for scenario analysis and stress-testing. Data There exist inherent challenges in climate modelling due to limitations in data quality and availability, given the short history of climate assessments within the financial services industry. • Data coverage is often lacking, where a subset of assets may not have the appropriate information publicly disclosed. Climate scenario risk analysis requires approaches and tools that are more granular (e.g. focus on company-level analysis), which differs from more traditional stress-testing exercises conducted at portfolio or sector level. This creates a need for more granular data that Barclays may not typically have maintained • While high data granularity is desirable to model client specific features, the balances between high data granularity and the additional insights provided must be investigated to assess the appropriate level of modelling • Data coherence issues may present inconsistencies in modelling. Emissions data is often one-year lagged, thus where the latest quarter/year financials are available, the emissions data may not be reflective of the company's operations, especially where there has been substantial growth or decline, mergers and acquisitions or other special activities. Scenario There exist inherent uncertainties with scenario design largely attributed to limited history of the interactions between climate risks and the economy. • Timing and interactions of physical and transition risks can greatly impact the Bank's assessment of capital adequacy and resilience. Assumptions around such compounding effects, while nuanced, are critical to our loss assessment and subsequently risk management processes and business strategy • There is a significant level of uncertainty with climate stress-testing projections in (i) how the scenario will manifest; (ii) how customers and clients will react; and (iii) the final loss quantification • An understanding of compounding risks and feedback loops between financial systems, the economy, and climate risks remains a challenge, given the lack of historical precedent of such interactions. Over longer time horizons, it becomes increasingly difficult to capture the range of second-order effects as physical and transition risks evolve, assess the rate in which risks manifest or subside, or identify inflection points. Strategy Climate and sustainability report Governance Risk review Financial review Financial statements Barclays PLC 2023 Annual Report on Form 20-F 67 Resilience of our strategy (continued) TCFD Strategy Recommendation (c)
Macro-dependencies and objectives We consider the following areas to represent some of the macro- dependencies that may impact our clients, customers and suppliers, and thus our ability to deliver our Climate Strategy. • Enhancing policy clarity in the real economy: Comprehensive, economy-wide decarbonisation policies are required across sectors and regions. The absence of clearly defined milestones for full decarbonisation at a national level introduces ambiguity over the channelling of financial resources to ensure an orderly and just transition • Optimising carbon-pricing mechanisms: A comprehensive carbon-pricing scheme is a key lever to address the current market failure of externalities from GHGs emissions. The UK and EU announcements for a carbon border adjustment mechanism (CBAM) will go some way to addressing this dependency. However, IMF research¹ shows prices (avg $6/ tCO2) are currently insufficient to achieve 1.5°C or 2°C targets Note: 1 imf.org/en/Blogs/Articles/2022/07/21/blog-more-countries- are-pricing-carbon-but-emissions-are-still-too-cheap • Enhancing attractiveness of technological innovations for lenders: A key commercial constraint on the scalability of climate technologies is access to cost-competitive capital. Improving risk-adjusted returns is required to incentivise private financial flows towards nascent technologies and developing nations – essential to limit global warming to 1.5°C. Blended finance mechanisms have potential to unlock large quantities of private investment when both public and philanthropic funds provide first loss tranches. The subsequent adjusted risk-return profiles can make previously high-risk investments marketable + Barclays is committed to scaling climate solutions through our Sustainable Impact Capital portfolio, with a mandate to invest up to £500m in global climate tech start-ups by the end of 2027. For further information see page 60. • Addressing sector-specific challenges: Myriad sector-specific challenges persist. This year a backlog of grid connectivity requests for new renewable power projects highlighted the complexity of a transition to net zero. Delays to approval for low-carbon projects impacts investor confidence, slowing the transition + For more information on sector-specific challenges and dependencies, see BlueTrackTM sector pages from 47 to 54. • Cultivating consumer confidence and investment incentives: Increased confidence in the multi-faceted and potential financial benefits of decarbonisation among society would help spur action. Clear messaging and incentives for households and businesses to generate tangible returns on investment in low-carbon products is critical for driving the transition towards net zero, particularly in sectors reliant on consumer behaviour such as Housing and Agriculture • Improving access to sustainability-related risk and impacts data: Accurate assessments of client data, including Scope 3 emissions, is needed to enable a data-driven approach required to mitigate non-financial risks and plot the path to net zero. The evolving nature of corporate and financial sector reporting, and the persistent challenges stemming from data gaps, can hinder progress towards these goals + Barclays remains engaged in the development of mechanisms to bridge these gaps, highlighted by our work with the Transition Plan Taskforce to set out transition plan disclosure guidance. For further details see page 19. • Global harmonisation of regulation: To date, an increasing number of countries and territories have some degree of mandatory ESG disclosure. Non-financial regulatory requirements are necessary for investors to accurately assess climate-related risks – however, major jurisdictions risk hindering the transition through regulatory fragmentation. As a bank with a global presence, interoperability of regulatory frameworks is essential to enable focused progress towards net zero. In addition to the risks arising from our clients' and suppliers' transitions, we are also dependent on wider market and geopolitical developments outside our control. For example, progress may be impacted by geopolitical developments that result in energy supply pressures or the varying pathways individual companies take to transition. Strategy Climate and sustainability report Governance Risk review Financial review Financial statements Barclays PLC 2023 Annual Report on Form 20-F 68 Resilience of our strategy (continued) TCFD Strategy Recommendation (c)
Information provided in climate and sustainability disclosures What is important to our investors and stakeholders evolves over time, and we aim to anticipate and respond to these changes. Disclosure expectations in relation to climate change and sustainability matters are particularly fast moving, and differ from more traditional areas of reporting including in relation to the level of detail and forward-looking nature of the information involved and the consideration of impacts on the environment and other persons. We have adapted our approach in relation to the disclosure of such matters. Our climate and sustainability disclosures take into account the wider context relevant to these topics, which may include evolving stakeholder views, the development of our climate strategy, longer timeframes for assessing potential risks and impacts, international long-term climate- and nature-based policy goals and evolving sustainability-related policy frameworks. Our climate and sustainability disclosures are subject to more uncertainty than disclosures relating to other subjects, given market challenges in relation to data reliability, consistency and timeliness – the use of estimates, judgements and assumptions which are likely to change over time, the application and development of data, models, scenarios and methodologies, the change in regulatory landscape, and variations in reporting standards. These factors mean disclosures may be amended, updated, and recalculated in future as market practice and data quality and availability develops, and could cause actual achievements, results, performance or other future events or conditions to differ, in some cases materially, from those stated, implied and/or reflected in any forward-looking statements or metrics included in our climate and sustainability disclosures. We give no assurance as to the likelihood of the achievement or reasonableness of any projections, estimates, forecasts, targets, commitments, ambitions, prospects or returns contained in our climate and sustainability disclosures and make no commitment to revise or update any such disclosures to reflect events or circumstances occurring or existing after the date of such statements. Disclaimers In preparing the climate and sustainability content within the Barclays PLC Annual Report on Form 20-F wherever it appears, we have: • Made certain key judgements, estimations and assumptions. This is, for example, the case in relation to financed emissions, portfolio alignment, classification of environmental and social financing, operational emissions and sustainability metrics, measurement of climate risk and scenario analysis • Used climate and sustainability data, models, scenarios and methodologies we consider to be appropriate and suitable for these purposes as at the date on which they were deployed. This includes data, models, scenarios and methodologies made available by third parties (over which we have no control) and which may have been prepared using a range of different methodologies, or where the basis of preparation may not be known to us. Methodologies, interpretations or assumptions may not be capable of being independently verified and may therefore be inaccurate. Climate and sustainability data, models, scenarios and methodologies are subject to future risks and uncertainties and may change over time. Climate and sustainability disclosures in this document, including climate and sustainability-related data, models and methodologies, are not of the same standard as those available in the context of other financial information and use a greater number and level of judgements, assumptions and estimates, including with respect to the classification of climate and sustainable financing activities. Climate and sustainability disclosures are also not subject to the same or equivalent disclosure standards, historical reference points, benchmarks or globally accepted accounting principles. Historical data cannot be relied on as a strong indicator of future trajectories in the case of climate change and its evolution. Outputs of models, processed data, scenario analysis and the application of methodologies will also be affected by underlying data quality, which can be hard to assess, or challenges in accessing data on a timely basis • Continued (and will continue) to review and develop our approach to data, models, scenarios and methodologies in line with market principles and standards as this subject area matures. The data, models, scenarios and methodologies used (including those made available by third parties) and the judgements, estimates and/or assumptions made in them or by us are rapidly evolving, and this may directly or indirectly affect the metrics, data points, targets, convergence points and milestones contained in the climate and sustainability content within the Annual Report on Form 20-F. Further, changes in external factors which are outside of our control such as accounting and/or reporting standards, improvements in data quality, data availability, or updates to methodologies and models and/ or updates or restatements of data by third parties, could impact – potentially materially – the performance metrics, data points, targets, convergence points and milestones contained in the climate and sustainability content within the Annual Report on Form 20-F. In future reports we may present some or all of the information for this reporting period (including information made available by third parties) using updated or more granular data or improved models, scenarios methodologies, market practices or standards. Equally, we may need to re-baseline, restate, revise, recalculate or recalibrate performance against targets, convergence points or milestones on the basis of such updated data. Strategy Climate and sustainability report Governance Risk review Financial review Financial statements Barclays PLC 2023 Annual Report on Form 20-F 69 Important information/Disclaimers
Such updated information may result in different outcomes than those included in the Annual Report on Form 20-F. It is important for readers and users of the Annual Report on Form 20-F to be aware that direct, like-for-like comparisons of each piece of information disclosed may not always be possible from one reporting period to another. The “Implementing our climate strategy” section of the Annual Report on Form 20-F highlights where information in respect of a previous reporting period has been updated. Our principles-based approach to reporting financed emissions data (see page 39) sets out when financed emissions information in respect of a prior year will be identified and explained • Included in the Annual Report on Form 20-F a number of graphics, infographics, text boxes and illustrative case studies and credentials which aim to give a high-level overview of certain elements of the climate and sustainability content within the Annual Report on Form 20-F and improve accessibility for readers. These graphics, infographics, text boxes and illustrative case studies and credentials are designed to be read within the context of the Annual Report on Form 20-F as a whole. There are a variety of internal and external factors which may impact our reported metrics and progress against our targets, convergence points and milestones. Strategy Climate and sustainability report Governance Risk review Financial review Financial statements Barclays PLC 2023 Annual Report on Form 20-F 70 Important information / Disclaimers (continued)
Board Governance Welcome to our 2023 Board Governance report. The report sets out the composition of our Board and explains how our Board governance framework operates, alongside the key areas of focus of our Board and Board Committees in 2023. Aim of our governance The primary aim of our governance is that it: • seeks to ensure that our decision-making is aligned to our Purpose, Values and Mindset • creates long-term sustainable value for our shareholders, having regard to the interests of all our stakeholders • is effective in providing constructive challenge, advice and support to management • provides checks and balances and drives informed, collaborative and accountable decision-making. Compliance with the Code • Our Board Governance report reflects the requirements of the 2018 UK Corporate Governance Code (the Code). • To view how we comply with the Code, please see pages 110 to 111. Certain additional information, signposted throughout this report, is available at home.barclays/corporategovernance Directors’ report Board of Directors 72 Group Executive Committee 76 Our governance framework 77 Key Board activities 80 Board Nominations Committee report 83 Board Audit Committee report 93 Board Risk Committee report 101 Board Sustainability Committee report 107 How we comply 110 Other statutory and regulatory information 112 Remuneration report 119 Strategy Climate and sustainability report Risk review Financial review Financial statements Barclays PLC 2023 Annual Report on Form 20-F 71Governance

Leading the Group, driven by our Purpose, Values and Mindset Board Committee membership Audit Committee member Nominations Committee member Remuneration Committee member Risk Committee member Sustainability Committee member Committee Chair Nigel Higgins Group Chairman Skills, experience and contribution: • seasoned business leader with extensive experience in, and understanding of, banking and the financial services industry • strong track record in leading and chairing organisations • significant experience in providing strategic advice to major international organisations and governments • keenly focused on culture and corporate governance. Nigel spent 36 years at Rothschild & Co. where he was most recently Deputy Chairman. Prior to that he was Chairman of the Group Executive Committee and Managing Partner of Rothschild & Co. Key current appointments: Chairman, Sadler’s Wells; Non-Executive Director, Tetra Laval Group Appointed: March 2019 (Board), May 2019 (Chairman) 	 C.S. Venkatakrishnan Group Chief Executive Skills, experience and contribution: • highly regarded leader with significant global banking experience • extensive background in financial markets and risk management • deep understanding of the business and the areas within which the Group operates. Prior to his appointment as Group Chief Executive, Venkat served as Head of Global Markets and Co-President of Barclays Bank PLC from October 2020 and Group Chief Risk Officer from 2016 to 2020. Before joining Barclays in 2016, Venkat worked at JPMorgan Chase from 1994, holding senior roles in Asset Management, Investment Banking, and in Risk. Key current appointments: Board Member, Institute of International Finance; Advisory member to the Board, Massachusetts Institute of Technology Golub Centre for Finance and Policy; Member of the UN Environment Programme Finance Initiative Leadership Council; Chair, Corporate Partnerships Board, The Royal Marsden Cancer Charity; Member, CNBC ESG Council Appointed: November 2021 Brian Gilvary Senior Independent Director (SID) Skills, experience and contribution: • extensive senior level experience of management, finance and strategy • deep experience of US and UK shareholder engagement • significant experience with, and understanding of, the challenges and opportunities inherent in advancing a sustainable energy future. Brian spent much of his career with BP p.l.c. in senior leadership roles, where he was most recently Chief Financial Officer. His other senior-level experience includes serving on the boards of various commercial and charitable organisations. Brian was Chair of The 100 Group of FTSE 100 Finance Directors, a member of the UK Treasury Financial Management Review Board and has served on various Business in the Community Leadership Teams. Key current appointments: Non-Executive Chair, INEOS Energy, an INEOS group company; Non-Executive Director, Defence Board, Ministry of Defence Appointed: February 2020 (Board), January 2021 (SID) 	 	 Strategy Climate and sustainability report Risk review Financial review Financial statements Barclays PLC 2023 Annual Report on Form 20-F 72Governance Directors’ report: Board of Directors

Robert Berry Independent Non-Executive Director Skills, experience and contribution: • proven track record of management of risk exposure for a global financial institution and building a modern group- wide risk management organisation • strong record of integrating risk management with strategy • significant experience in finance, model development and trading. Robert has deep risk management expertise having had a 28-year career at Goldman Sachs, where, prior to his retirement in 2018, he held the role of Co-Deputy Chief Risk Officer. Key current appointments: Trustee, High Watch Recovery Center (incorporating President, Alina Lodge) Appointed: February 2022 	 	 Tim Breedon CBE Independent Non-Executive Director Skills, experience and contribution: • significant experience in strategic planning • extensive financial services experience • detailed knowledge of risk management and UK and EU regulation. Tim is a member of the Board and is also Chair of Barclays Bank Ireland PLC (also referred to as Barclays Europe). He had a distinguished career with Legal & General where, among other roles, he was the Group Chief Executive Officer until June 2012. Tim also served as Chair of the Association of British Insurers. Key current appointments: Chairman, Apax Global Alpha Limited; Non- Executive Director, Quilter PLC Appointed: November 2012 Anna Cross Group Finance Director Skills, experience and contribution: • extensive accounting and financial services expertise • deep understanding of banking and retail sectors • significant financial leadership experience of financial institutions. Anna is a chartered accountant and Group Finance Director with responsibility for Finance, including Tax, Treasury, Investor Relations and Strategy. Prior to joining Barclays, Anna worked in both banking and retail and held various roles at Asda, HBOS and Lloyds Banking Group. Since joining Barclays in 2013, Anna was appointed Chief Financial Officer of Barclays Bank UK PLC in 2016, Group Financial Controller in 2019 and Deputy Group Finance Director in 2020. She joined the Group Executive Committee in February 2022, before taking up the role of Group Finance Director in April 2022. Key current appointments: Chair, The 100 Group of the FTSE Finance Directors Appointed: April 2022 Mohamed A. El-Erian Independent Non-Executive Director Skills, experience and contribution: • highly respected economist and investor • extensive experience in the asset management industry and multilateral institutions • deep knowledge and understanding of international economics and financial services sector. Mohamed currently serves as President of Queens' College, Cambridge University. He is Chief Economic Advisor at Allianz SE, the corporate parent of PIMCO (Pacific Investment Management Company LLC) where he formerly served as Chief Executive and Co-Chief Investment Officer. Mohamed is a regular columnist for Bloomberg Opinion and a contributing editor at the Financial Times. He spent 15 years at the IMF where he served as Deputy Director before moving to the private sector and financial services. Key current appointments: Lead Independent Director, Under Armour Inc.; Chief Economic Adviser, Allianz SE; Chairman, Gramercy Funds Management; Senior Advisor, Investcorp Bank BSC Appointed: January 2020 	 	 Strategy Climate and sustainability report Risk review Financial review Financial statements Barclays PLC 2023 Annual Report on Form 20-F 73Governance Directors’ report: Board of Directors (continued)

Dawn Fitzpatrick Independent Non-Executive Director Skills, experience and contribution: • extensive management experience of international financial institutions • strong financial and strategic leadership experience • detailed knowledge of the markets in which the Group operates. Dawn holds the role of Chief Executive Officer and Chief Investment Officer at Soros Fund Management LLC. Her previous experience includes 25 years with UBS, most recently as Head of Investments for UBS Asset Management. Key current appointments: Chief Executive Officer and Chief Investment Officer, Soros Fund Management LLC; Member, Advisory Board and Investment Committee of the Open Society Foundations’ Economic Justice Programme; Advisory Council Member, The Bretton Woods Committee; Chair, Financial Sector Advisory Council, Federal Reserve Bank of Dallas Appointed: September 2019 	 	 Mary Francis CBE Independent Non-Executive Director Skills, experience and contribution: • extensive board-level experience across a range of industries • strong focus on reputation management and promoting board governance values • detailed understanding of the interaction between public and private sectors. Mary's previous appointments include Non- Executive Directorships at the Bank of England, Alliance & Leicester, Aviva, Centrica and Swiss Re Group. In her executive career, Mary held senior positions with both HM Treasury and the Prime Minister's Office and served as Director General of the Association of British Insurers. Key current appointments: Senior Independent Director, PensionBee Group PLC; Member, UK Takeover Appeal Board Appointed: October 2016 	 Sir John Kingman Independent Non-Executive Director Skills, experience and contribution: • deep background in financial services • strong leadership qualities and chair experience • extensive expertise providing strategic advice to Government John is Chair of Barclays Bank UK PLC. He had a long Whitehall career, where he was Second Permanent Secretary to HM Treasury and was also closely involved in the UK response to the financial crisis, handling the resolution of Northern Rock and leading negotiations with RBS, Lloyds and HBOS on their £37bn recapitalisation. John was also the first Chief Executive of UK Financial Investments Ltd (UKFI); and from 2010-2012, he was Global Co-Head of the Financial Institutions Group at Rothschild. From 2016-2021 John was the first Chair of UK Research & Innovations, which oversees Government science funding of c£8bn a year. Between 2020 and January 2023, he was Chair of Tesco Personal Finance plc. Key current appointments: Chair, Legal & General Group plc; Trustee & Deputy Chair of the Board of Trustees, The National Gallery Appointed: June 2023 	 Marc Moses Independent Non-Executive Director Skills, experience and contribution: • strong technical finance background in accounting and audit-related matters • significant board and senior executive- level risk management experience • extensive knowledge of banking and financial services. Marc is a chartered accountant and his financial services experience extends over 43 years, initially as a trader and then in senior executive roles as an audit partner at PwC, and Chief Financial Officer of JPMorgan Europe. He joined HSBC in 2005 where he was Group Chief Risk Officer for nine years and joined the group board as an executive director in 2014. He retired from HSBC in 2019. Key current appointments: None Appointed: January 2023 	 Strategy Climate and sustainability report Risk review Financial review Financial statements Barclays PLC 2023 Annual Report on Form 20-F 74Governance Directors’ report: Board of Directors (continued)
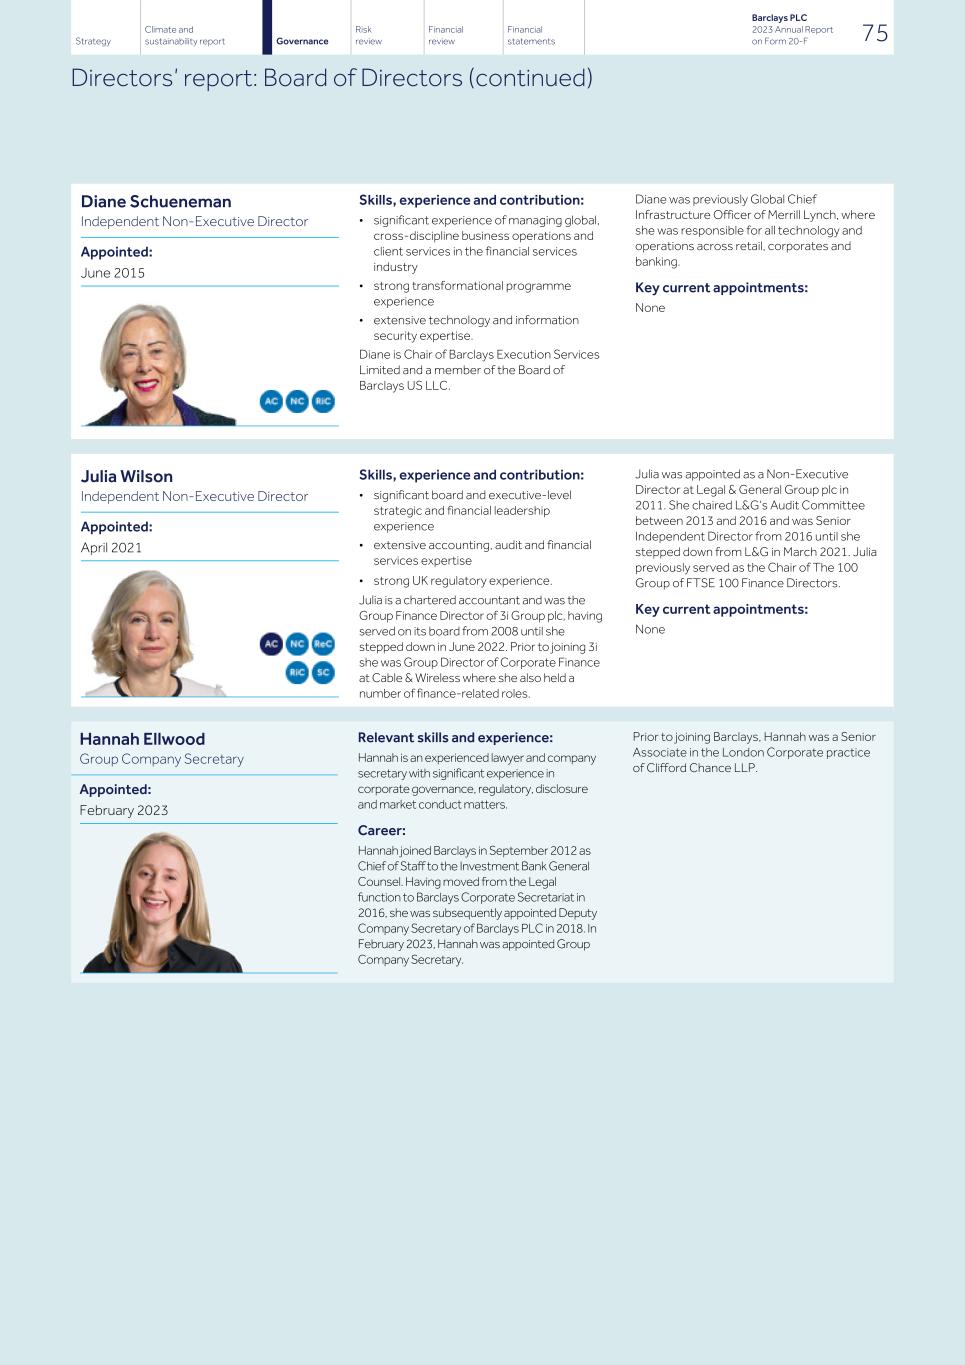
Diane Schueneman Independent Non-Executive Director Skills, experience and contribution: • significant experience of managing global, cross-discipline business operations and client services in the financial services industry • strong transformational programme experience • extensive technology and information security expertise. Diane is Chair of Barclays Execution Services Limited and a member of the Board of Barclays US LLC. Diane was previously Global Chief Infrastructure Officer of Merrill Lynch, where she was responsible for all technology and operations across retail, corporates and banking. Key current appointments: None Appointed: June 2015 	 	 Julia Wilson Independent Non-Executive Director Skills, experience and contribution: • significant board and executive-level strategic and financial leadership experience • extensive accounting, audit and financial services expertise • strong UK regulatory experience. Julia is a chartered accountant and was the Group Finance Director of 3i Group plc, having served on its board from 2008 until she stepped down in June 2022. Prior to joining 3i she was Group Director of Corporate Finance at Cable & Wireless where she also held a number of finance-related roles. Julia was appointed as a Non-Executive Director at Legal & General Group plc in 2011. She chaired L&G’s Audit Committee between 2013 and 2016 and was Senior Independent Director from 2016 until she stepped down from L&G in March 2021. Julia previously served as the Chair of The 100 Group of FTSE 100 Finance Directors. Key current appointments: None Appointed: April 2021 	 	 	 Hannah Ellwood Group Company Secretary Relevant skills and experience: Hannah is an experienced lawyer and company secretary with significant experience in corporate governance, regulatory, disclosure and market conduct matters. Career: Hannah joined Barclays in September 2012 as Chief of Staff to the Investment Bank General Counsel. Having moved from the Legal function to Barclays Corporate Secretariat in 2016, she was subsequently appointed Deputy Company Secretary of Barclays PLC in 2018. In February 2023, Hannah was appointed Group Company Secretary. Prior to joining Barclays, Hannah was a Senior Associate in the London Corporate practice of Clifford Chance LLP. Appointed: February 2023 Strategy Climate and sustainability report Risk review Financial review Financial statements Barclays PLC 2023 Annual Report on Form 20-F 75Governance Directors’ report: Board of Directors (continued)

Leading the delivery of Barclays' strategy As the most senior management committee for the Group, our Group Executive Committee (ExCo) supports the Group Chief Executive in executing the Group’s strategy. Changes in ExCo during 2023 • Alistair Currie was appointed Group Chief Operating Officer and Chief Executive of Barclays Execution Services Limited (BX), having previously served on ExCo as Global Head of Consumer Banking and Payments • Kirsty Everett joined as Group Chief Compliance Officer • Vim Maru joined as Global Head of Consumer Banking and Payments We are grateful for the contributions made by the ExCo members who stepped down in 2023: • Mark Ashton-Rigby stepped down as Group Chief Operating Officer and Chief Executive of BX • Matt Fitzwater stepped down as Interim Group Chief Compliance Officer Standing attendees The Group Chief Executive extends invites to a number of standing attendees to ExCo: • Craig Bright, Chief Information Officer • Adeel Khan and Stephen Dainton, Co- Heads of Global Markets • Cathal Deasy and Taylor Wright, Co- Heads of Investment Banking ExCo meetings are also attended on a regular basis by the Group Chief Internal Auditor, Lindsay O’Reilly. Ex-officio posts ExCo continues to utilise ex-officio positions on the Committee to broaden the scope of perspectives and contributions made, as well as to provide specialist input. During 2023, the following attended ExCo meetings as an ex-officio member, with each appointee serving for a four-month rotation: • Ingrid Hengster, CEO Barclays Germany and Global Chair, Investment Bank • Antoinette O'Neill, Chief Information Officer, Corporate and Investment Bank (CIB) • Betty Gee, Americas Head of Equities Distribution within the CIB C.S. Venkatakrishnan Group Chief Executive Anna Cross Group Finance Director Paul Compton Global Head of the Corporate and Investment Bank and President of BBPLC Alistair Currie Group Chief Operating Officer and Chief Executive, BX Kirsty Everett Group Chief Compliance Officer Matt Hammerstein Chief Executive Officer, Barclays UK Vim Maru Global Head of Consumer Banking and Payments Tristram Roberts Group Human Resources Director Taalib Shaah Group Chief Risk Officer Stephen Shapiro Group General Counsel Sasha Wiggins Group Head of Public Policy and Corporate Responsibility Strategy Climate and sustainability report Risk review Financial review Financial statements Barclays PLC 2023 Annual Report on Form 20-F 76Governance Directors’ report: Group Executive Committee
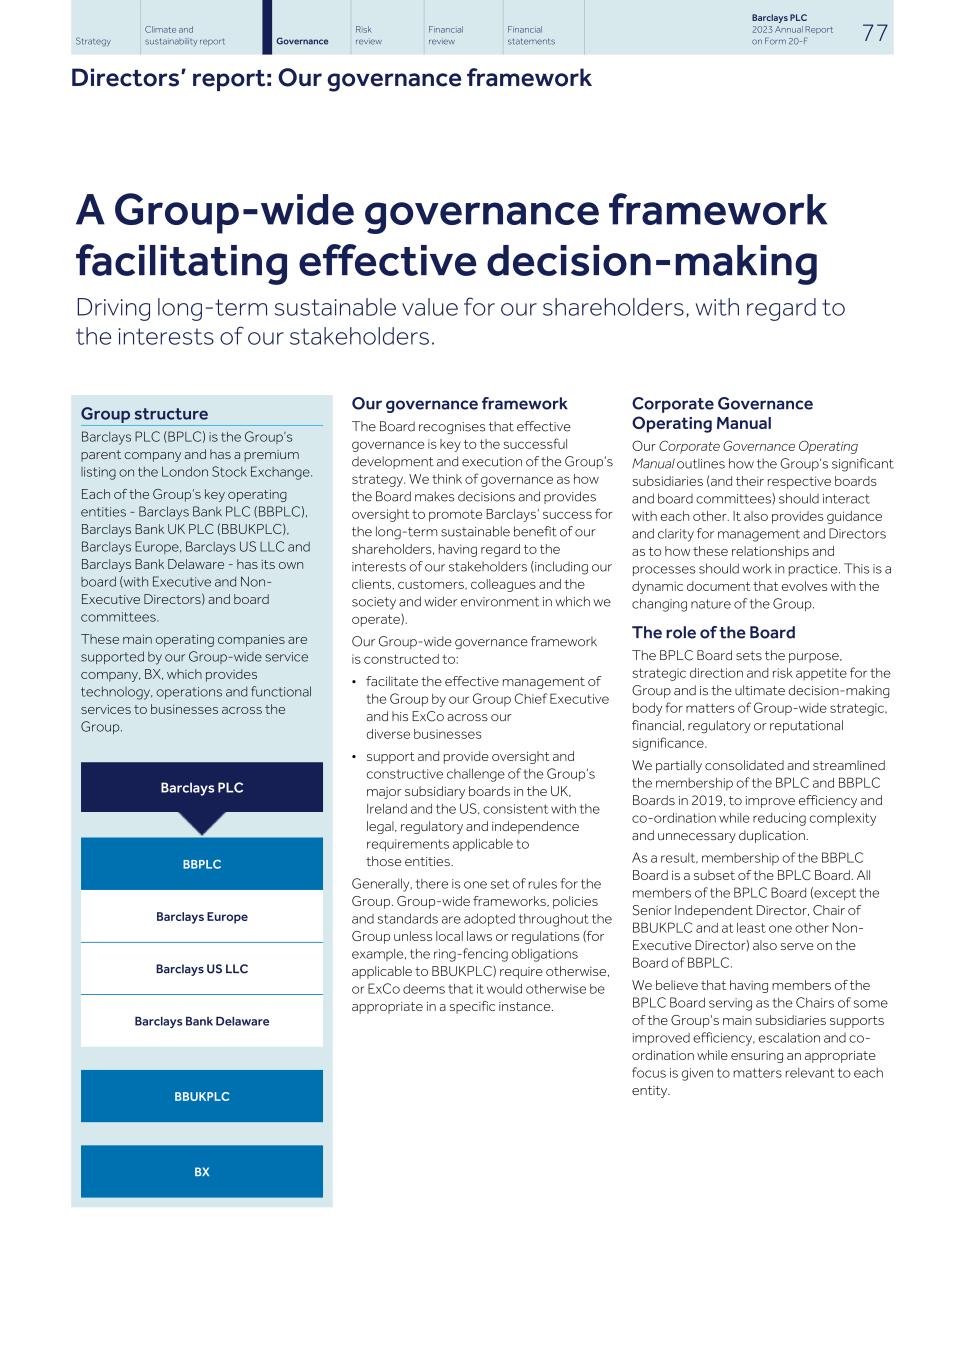
A Group-wide governance framework facilitating effective decision-making Driving long-term sustainable value for our shareholders, with regard to the interests of our stakeholders. Group structure Barclays PLC (BPLC) is the Group’s parent company and has a premium listing on the London Stock Exchange. Each of the Group’s key operating entities - Barclays Bank PLC (BBPLC), Barclays Bank UK PLC (BBUKPLC), Barclays Europe, Barclays US LLC and Barclays Bank Delaware - has its own board (with Executive and Non- Executive Directors) and board committees. These main operating companies are supported by our Group-wide service company, BX, which provides technology, operations and functional services to businesses across the Group. Barclays PLC BBPLC Barclays Europe Barclays US LLC Barclays Bank Delaware BBUKPLC BX Our governance framework The Board recognises that effective governance is key to the successful development and execution of the Group’s strategy. We think of governance as how the Board makes decisions and provides oversight to promote Barclays’ success for the long-term sustainable benefit of our shareholders, having regard to the interests of our stakeholders (including our clients, customers, colleagues and the society and wider environment in which we operate). Our Group-wide governance framework is constructed to: • facilitate the effective management of the Group by our Group Chief Executive and his ExCo across our diverse businesses • support and provide oversight and constructive challenge of the Group’s major subsidiary boards in the UK, Ireland and the US, consistent with the legal, regulatory and independence requirements applicable to those entities. Generally, there is one set of rules for the Group. Group-wide frameworks, policies and standards are adopted throughout the Group unless local laws or regulations (for example, the ring-fencing obligations applicable to BBUKPLC) require otherwise, or ExCo deems that it would otherwise be appropriate in a specific instance. Corporate Governance Operating Manual Our Corporate Governance Operating Manual outlines how the Group’s significant subsidiaries (and their respective boards and board committees) should interact with each other. It also provides guidance and clarity for management and Directors as to how these relationships and processes should work in practice. This is a dynamic document that evolves with the changing nature of the Group. The role of the Board The BPLC Board sets the purpose, strategic direction and risk appetite for the Group and is the ultimate decision-making body for matters of Group-wide strategic, financial, regulatory or reputational significance. We partially consolidated and streamlined the membership of the BPLC and BBPLC Boards in 2019, to improve efficiency and co-ordination while reducing complexity and unnecessary duplication. As a result, membership of the BBPLC Board is a subset of the BPLC Board. All members of the BPLC Board (except the Senior Independent Director, Chair of BBUKPLC and at least one other Non- Executive Director) also serve on the Board of BBPLC. We believe that having members of the BPLC Board serving as the Chairs of some of the Group’s main subsidiaries supports improved efficiency, escalation and co- ordination while ensuring an appropriate focus is given to matters relevant to each entity. Strategy Climate and sustainability report Risk review Financial review Financial statements Barclays PLC 2023 Annual Report on Form 20-F 77Governance Directors’ report: Our governance framework
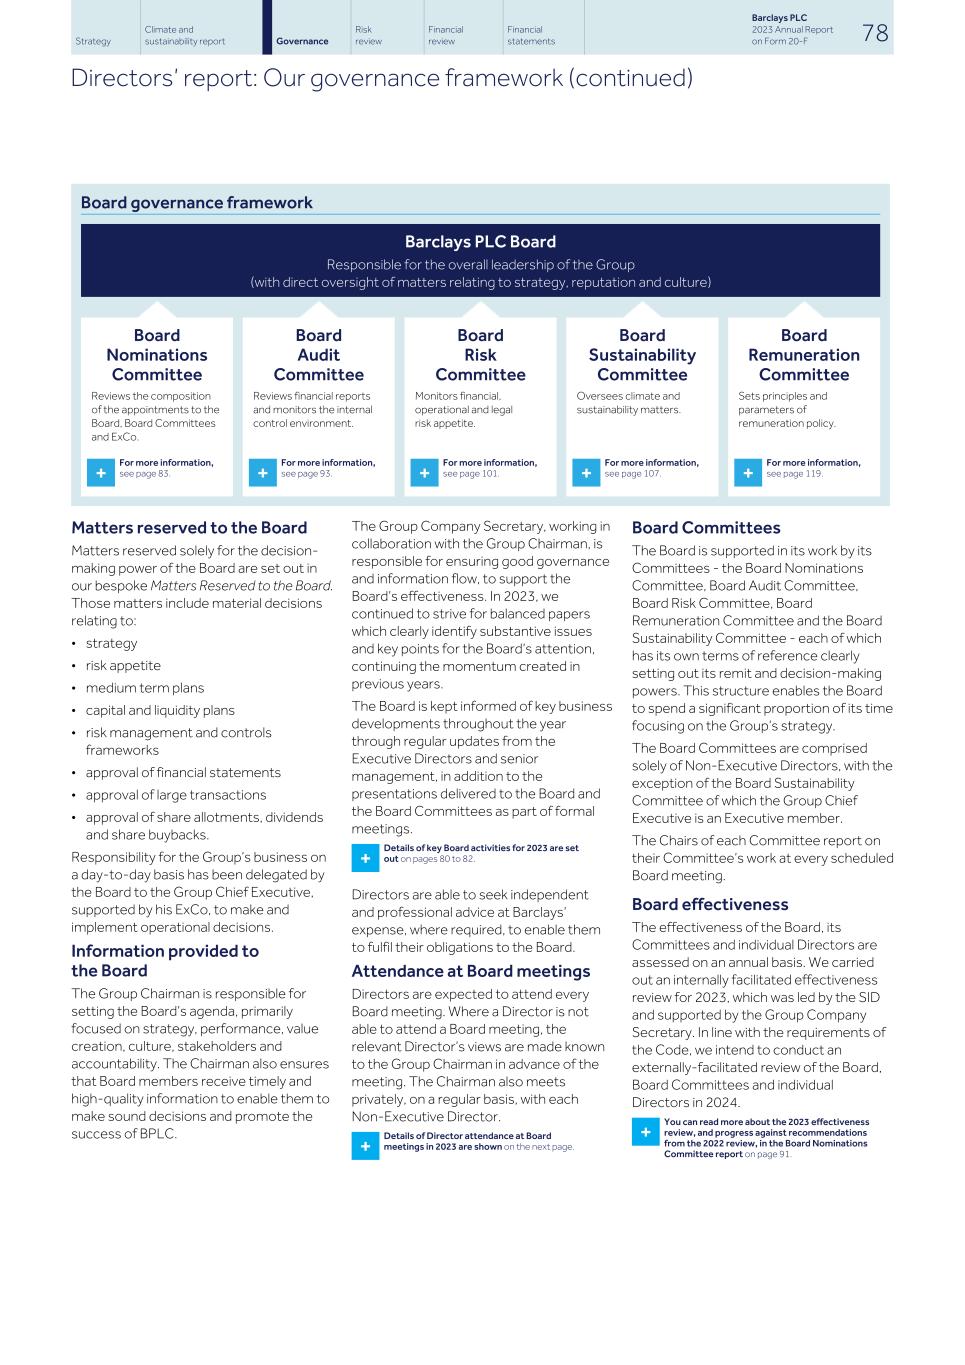
Board governance framework Barclays PLC Board Responsible for the overall leadership of the Group (with direct oversight of matters relating to strategy, reputation and culture) Board Nominations Committee Reviews the composition of the appointments to the Board, Board Committees and ExCo. Board Audit Committee Reviews financial reports and monitors the internal control environment. Board Risk Committee Monitors financial, operational and legal risk appetite. Board Sustainability Committee Oversees climate and sustainability matters. Board Remuneration Committee Sets principles and parameters of remuneration policy. + For more information, see page 83. + For more information, see page 93. + For more information, see page 101. + For more information, see page 107. + For more information, see page 119. Matters reserved to the Board Matters reserved solely for the decision- making power of the Board are set out in our bespoke Matters Reserved to the Board. Those matters include material decisions relating to: • strategy • risk appetite • medium term plans • capital and liquidity plans • risk management and controls frameworks • approval of financial statements • approval of large transactions • approval of share allotments, dividends and share buybacks. Responsibility for the Group’s business on a day-to-day basis has been delegated by the Board to the Group Chief Executive, supported by his ExCo, to make and implement operational decisions. Information provided to the Board The Group Chairman is responsible for setting the Board’s agenda, primarily focused on strategy, performance, value creation, culture, stakeholders and accountability. The Chairman also ensures that Board members receive timely and high-quality information to enable them to make sound decisions and promote the success of BPLC. The Group Company Secretary, working in collaboration with the Group Chairman, is responsible for ensuring good governance and information flow, to support the Board’s effectiveness. In 2023, we continued to strive for balanced papers which clearly identify substantive issues and key points for the Board’s attention, continuing the momentum created in previous years. The Board is kept informed of key business developments throughout the year through regular updates from the Executive Directors and senior management, in addition to the presentations delivered to the Board and the Board Committees as part of formal meetings. + Details of key Board activities for 2023 are set out on pages 80 to 82. Directors are able to seek independent and professional advice at Barclays’ expense, where required, to enable them to fulfil their obligations to the Board. Attendance at Board meetings Directors are expected to attend every Board meeting. Where a Director is not able to attend a Board meeting, the relevant Director’s views are made known to the Group Chairman in advance of the meeting. The Chairman also meets privately, on a regular basis, with each Non-Executive Director. + Details of Director attendance at Board meetings in 2023 are shown on the next page. Board Committees The Board is supported in its work by its Committees - the Board Nominations Committee, Board Audit Committee, Board Risk Committee, Board Remuneration Committee and the Board Sustainability Committee - each of which has its own terms of reference clearly setting out its remit and decision-making powers. This structure enables the Board to spend a significant proportion of its time focusing on the Group’s strategy. The Board Committees are comprised solely of Non-Executive Directors, with the exception of the Board Sustainability Committee of which the Group Chief Executive is an Executive member. The Chairs of each Committee report on their Committee’s work at every scheduled Board meeting. Board effectiveness The effectiveness of the Board, its Committees and individual Directors are assessed on an annual basis. We carried out an internally facilitated effectiveness review for 2023, which was led by the SID and supported by the Group Company Secretary. In line with the requirements of the Code, we intend to conduct an externally-facilitated review of the Board, Board Committees and individual Directors in 2024. + You can read more about the 2023 effectiveness review, and progress against recommendations from the 2022 review, in the Board Nominations Committee report on page 91. Strategy Climate and sustainability report Risk review Financial review Financial statements Barclays PLC 2023 Annual Report on Form 20-F 78Governance Directors’ report: Our governance framework (continued)
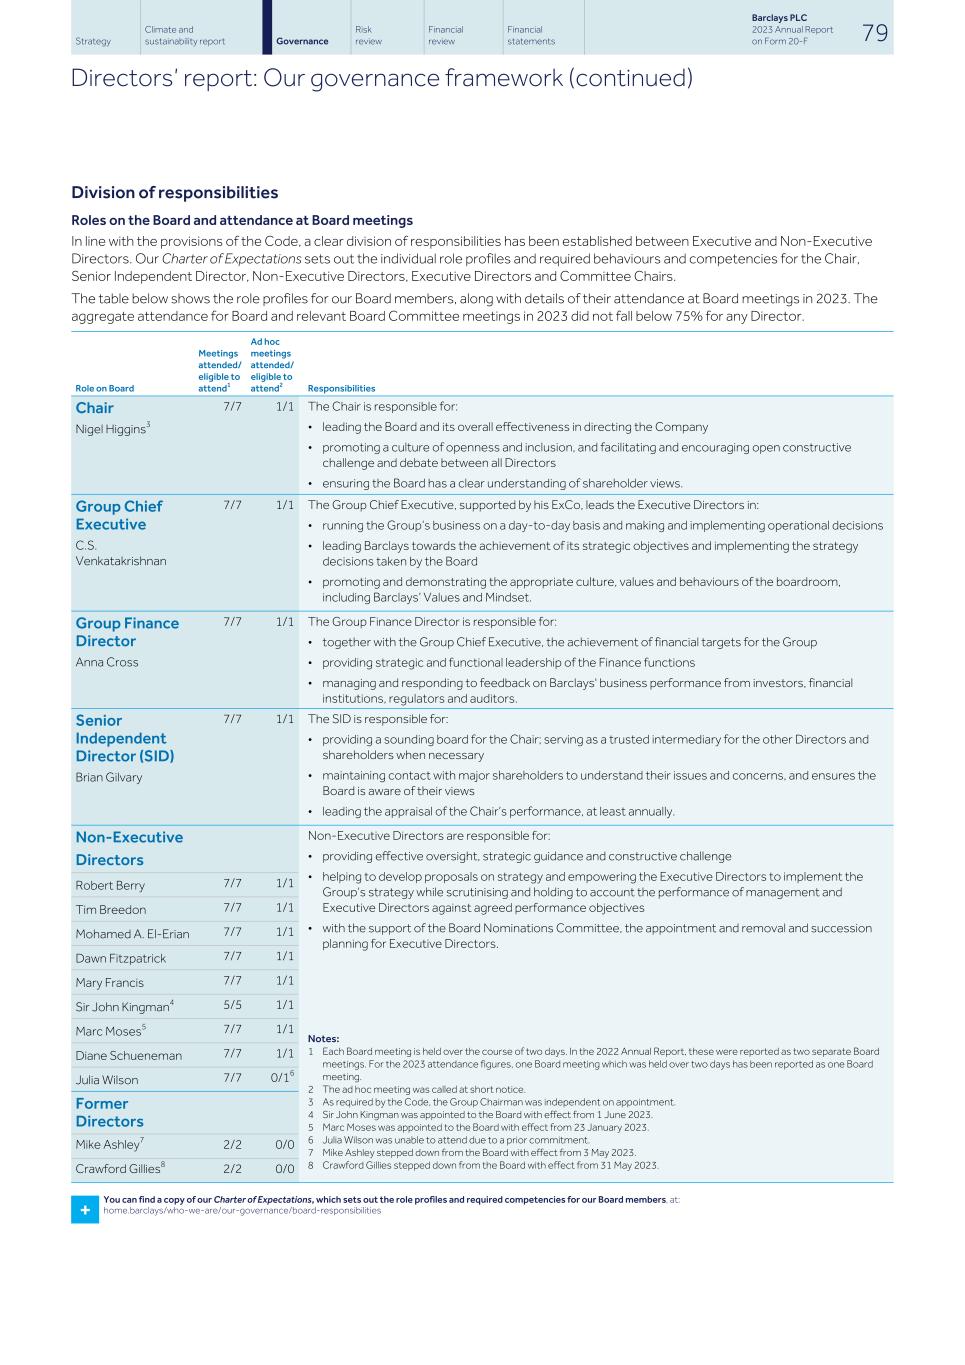
Division of responsibilities Roles on the Board and attendance at Board meetings In line with the provisions of the Code, a clear division of responsibilities has been established between Executive and Non-Executive Directors. Our Charter of Expectations sets out the individual role profiles and required behaviours and competencies for the Chair, Senior Independent Director, Non-Executive Directors, Executive Directors and Committee Chairs. The table below shows the role profiles for our Board members, along with details of their attendance at Board meetings in 2023. The aggregate attendance for Board and relevant Board Committee meetings in 2023 did not fall below 75% for any Director. Role on Board Meetings attended/ eligible to attend1 Ad hoc meetings attended/ eligible to attend2 Responsibilities Chair Nigel Higgins3 7/7 1/1 The Chair is responsible for: • leading the Board and its overall effectiveness in directing the Company • promoting a culture of openness and inclusion, and facilitating and encouraging open constructive challenge and debate between all Directors • ensuring the Board has a clear understanding of shareholder views. Group Chief Executive C.S. Venkatakrishnan 7/7 1/1 The Group Chief Executive, supported by his ExCo, leads the Executive Directors in: • running the Group’s business on a day-to-day basis and making and implementing operational decisions • leading Barclays towards the achievement of its strategic objectives and implementing the strategy decisions taken by the Board • promoting and demonstrating the appropriate culture, values and behaviours of the boardroom, including Barclays’ Values and Mindset. Group Finance Director Anna Cross 7/7 1/1 The Group Finance Director is responsible for: • together with the Group Chief Executive, the achievement of financial targets for the Group • providing strategic and functional leadership of the Finance functions • managing and responding to feedback on Barclays' business performance from investors, financial institutions, regulators and auditors. Senior Independent Director (SID) Brian Gilvary 7/7 1/1 The SID is responsible for: • providing a sounding board for the Chair; serving as a trusted intermediary for the other Directors and shareholders when necessary • maintaining contact with major shareholders to understand their issues and concerns, and ensures the Board is aware of their views • leading the appraisal of the Chair’s performance, at least annually. Non-Executive Directors Non-Executive Directors are responsible for: • providing effective oversight, strategic guidance and constructive challenge • helping to develop proposals on strategy and empowering the Executive Directors to implement the Group’s strategy while scrutinising and holding to account the performance of management and Executive Directors against agreed performance objectives • with the support of the Board Nominations Committee, the appointment and removal and succession planning for Executive Directors. Notes Notes: 1 Each Board meeting is held over the course of two days. In the 2022 Annual Report, these were reported as two separate Board meetings. For the 2023 attendance figures, one Board meeting which was held over two days has been reported as one Board meeting. 2 The ad hoc meeting was called at short notice. 3 As required by the Code, the Group Chairman was independent on appointment. 4 Sir John Kingman was appointed to the Board with effect from 1 June 2023. 5 Marc Moses was appointed to the Board with effect from 23 January 2023. 6 Julia Wilson was unable to attend due to a prior commitment. 7 Mike Ashley stepped down from the Board with effect from 3 May 2023. 8 Crawford Gillies stepped down from the Board with effect from 31 May 2023. Robert Berry 7/7 1/1 Tim Breedon 7/7 1/1 Mohamed A. El-Erian 7/7 1/1 Dawn Fitzpatrick 7/7 1/1 Mary Francis 7/7 1/1 Sir John Kingman4 5/5 1/1 Marc Moses5 7/7 1/1 Diane Schueneman 7/7 1/1 Julia Wilson 7/7 0/16 Former Directors Mike Ashley7 2/2 0/0 Crawford Gillies8 2/2 0/0 + You can find a copy of our Charter of Expectations, which sets out the role profiles and required competencies for our Board members, at: home.barclays/who-we-are/our-governance/board-responsibilities Strategy Climate and sustainability report Risk review Financial review Financial statements Barclays PLC 2023 Annual Report on Form 20-F 79Governance Directors’ report: Our governance framework (continued)
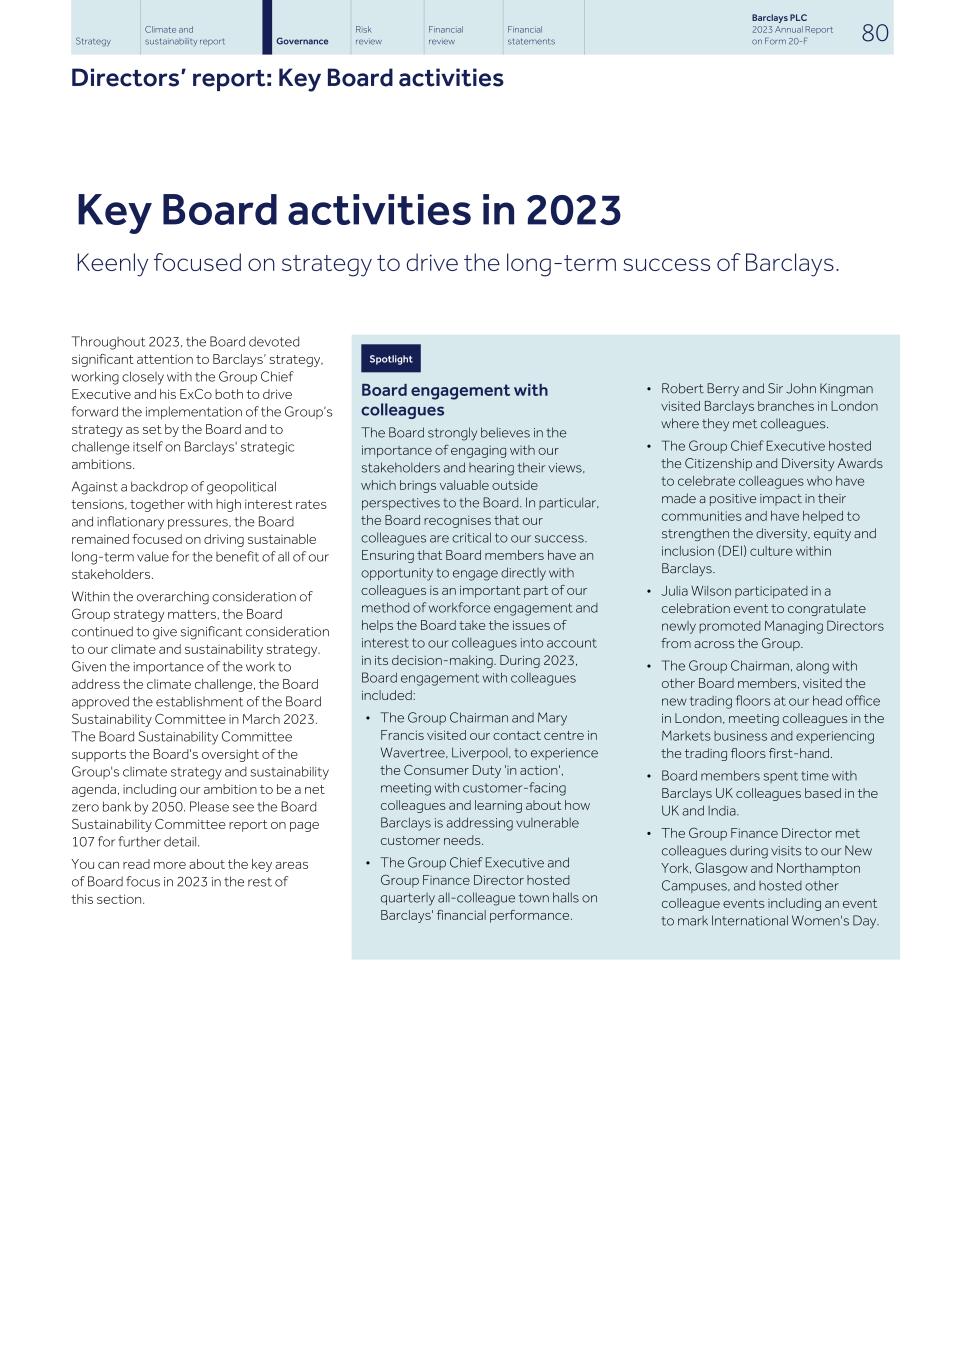
Key Board activities in 2023 Keenly focused on strategy to drive the long-term success of Barclays. Throughout 2023, the Board devoted significant attention to Barclays’ strategy, working closely with the Group Chief Executive and his ExCo both to drive forward the implementation of the Group’s strategy as set by the Board and to challenge itself on Barclays' strategic ambitions. Against a backdrop of geopolitical tensions, together with high interest rates and inflationary pressures, the Board remained focused on driving sustainable long-term value for the benefit of all of our stakeholders. Within the overarching consideration of Group strategy matters, the Board continued to give significant consideration to our climate and sustainability strategy. Given the importance of the work to address the climate challenge, the Board approved the establishment of the Board Sustainability Committee in March 2023. The Board Sustainability Committee supports the Board's oversight of the Group's climate strategy and sustainability agenda, including our ambition to be a net zero bank by 2050. Please see the Board Sustainability Committee report on page 107 for further detail. You can read more about the key areas of Board focus in 2023 in the rest of this section. Spotlight Board engagement with colleagues The Board strongly believes in the importance of engaging with our stakeholders and hearing their views, which brings valuable outside perspectives to the Board. In particular, the Board recognises that our colleagues are critical to our success. Ensuring that Board members have an opportunity to engage directly with colleagues is an important part of our method of workforce engagement and helps the Board take the issues of interest to our colleagues into account in its decision-making. During 2023, Board engagement with colleagues included: • The Group Chairman and Mary Francis visited our contact centre in Wavertree, Liverpool, to experience the Consumer Duty 'in action', meeting with customer-facing colleagues and learning about how Barclays is addressing vulnerable customer needs. • The Group Chief Executive and Group Finance Director hosted quarterly all-colleague town halls on Barclays' financial performance. • Robert Berry and Sir John Kingman visited Barclays branches in London where they met colleagues. • The Group Chief Executive hosted the Citizenship and Diversity Awards to celebrate colleagues who have made a positive impact in their communities and have helped to strengthen the diversity, equity and inclusion (DEI) culture within Barclays. • Julia Wilson participated in a celebration event to congratulate newly promoted Managing Directors from across the Group. • The Group Chairman, along with other Board members, visited the new trading floors at our head office in London, meeting colleagues in the Markets business and experiencing the trading floors first-hand. • Board members spent time with Barclays UK colleagues based in the UK and India. • The Group Finance Director met colleagues during visits to our New York, Glasgow and Northampton Campuses, and hosted other colleague events including an event to mark International Women's Day. Strategy Climate and sustainability report Risk review Financial review Financial statements Barclays PLC 2023 Annual Report on Form 20-F 80Governance Directors’ report: Key Board activities
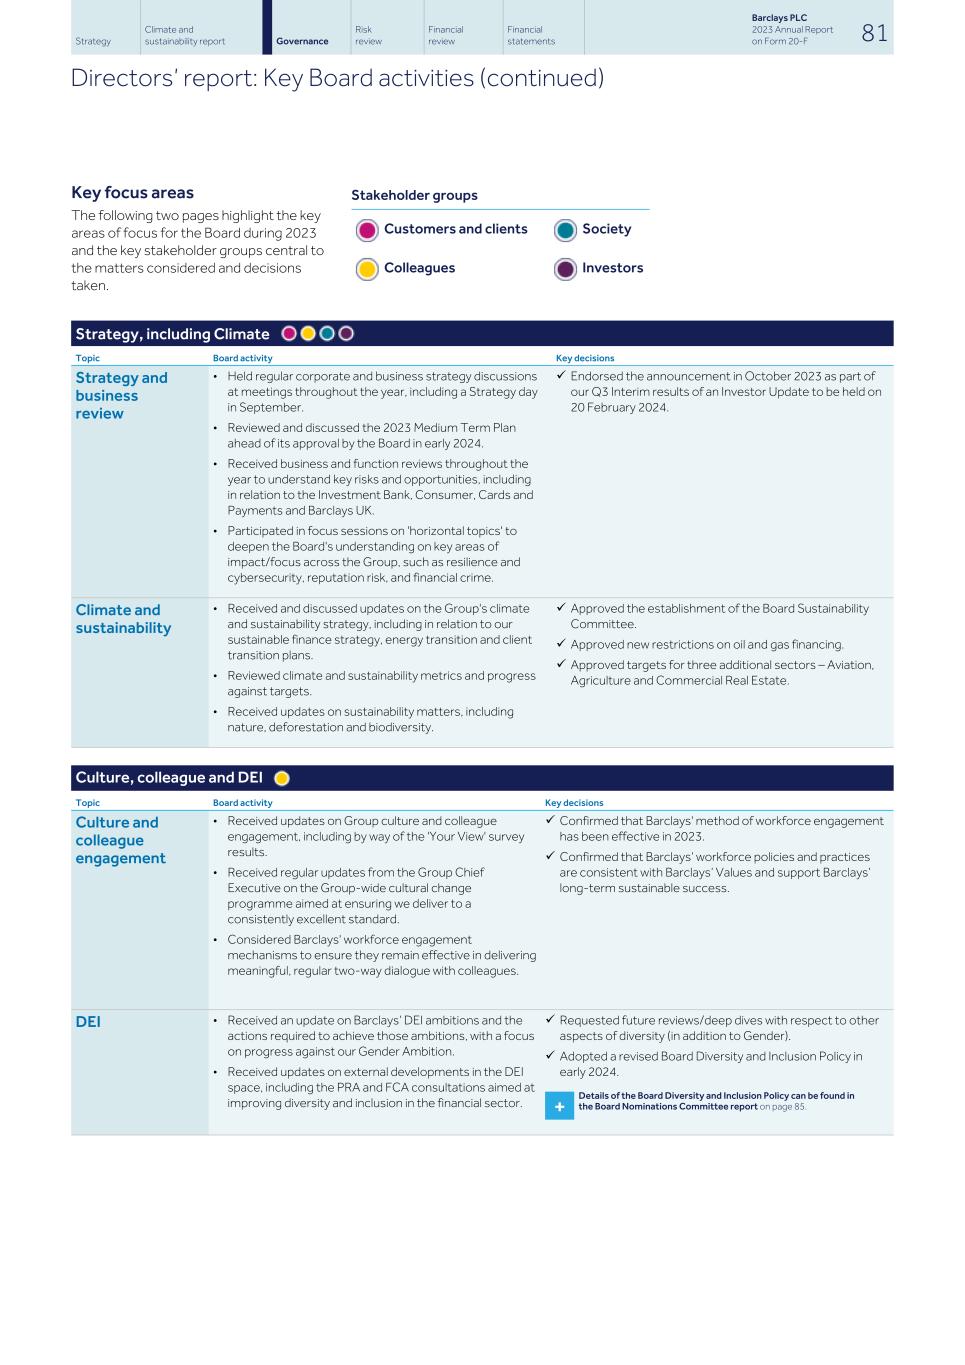
Key focus areas The following two pages highlight the key areas of focus for the Board during 2023 and the key stakeholder groups central to the matters considered and decisions taken. Stakeholder groups Customers and clients Society Colleagues Investors Strategy, including Climate Topic Board activity Key decisions Strategy and business review • Held regular corporate and business strategy discussions at meetings throughout the year, including a Strategy day in September. • Reviewed and discussed the 2023 Medium Term Plan ahead of its approval by the Board in early 2024. • Received business and function reviews throughout the year to understand key risks and opportunities, including in relation to the Investment Bank, Consumer, Cards and Payments and Barclays UK. • Participated in focus sessions on 'horizontal topics' to deepen the Board's understanding on key areas of impact/focus across the Group, such as resilience and cybersecurity, reputation risk, and financial crime. ü Endorsed the announcement in October 2023 as part of our Q3 Interim results of an Investor Update to be held on 20 February 2024. Climate and sustainability • Received and discussed updates on the Group's climate and sustainability strategy, including in relation to our sustainable finance strategy, energy transition and client transition plans. • Reviewed climate and sustainability metrics and progress against targets. • Received updates on sustainability matters, including nature, deforestation and biodiversity. ü Approved the establishment of the Board Sustainability Committee. ü Approved new restrictions on oil and gas financing. ü Approved targets for three additional sectors – Aviation, Agriculture and Commercial Real Estate. Culture, colleague and DEI Topic Board activity Key decisions Culture and colleague engagement • Received updates on Group culture and colleague engagement, including by way of the 'Your View' survey results. • Received regular updates from the Group Chief Executive on the Group-wide cultural change programme aimed at ensuring we deliver to a consistently excellent standard. • Considered Barclays' workforce engagement mechanisms to ensure they remain effective in delivering meaningful, regular two-way dialogue with colleagues. ü Confirmed that Barclays' method of workforce engagement has been effective in 2023. ü Confirmed that Barclays’ workforce policies and practices are consistent with Barclays’ Values and support Barclays’ long-term sustainable success. DEI • Received an update on Barclays’ DEI ambitions and the actions required to achieve those ambitions, with a focus on progress against our Gender Ambition. • Received updates on external developments in the DEI space, including the PRA and FCA consultations aimed at improving diversity and inclusion in the financial sector. ü Requested future reviews/deep dives with respect to other aspects of diversity (in addition to Gender). ü Adopted a revised Board Diversity and Inclusion Policy in early 2024. Strategy Climate and sustainability report Risk review Financial review Financial statements Barclays PLC 2023 Annual Report on Form 20-F 81Governance Directors’ report: Key Board activities (continued) 	 	 	 + Details of the Board Diversity and Inclusion Policy can be found in the Board Nominations Committee report on page 85.
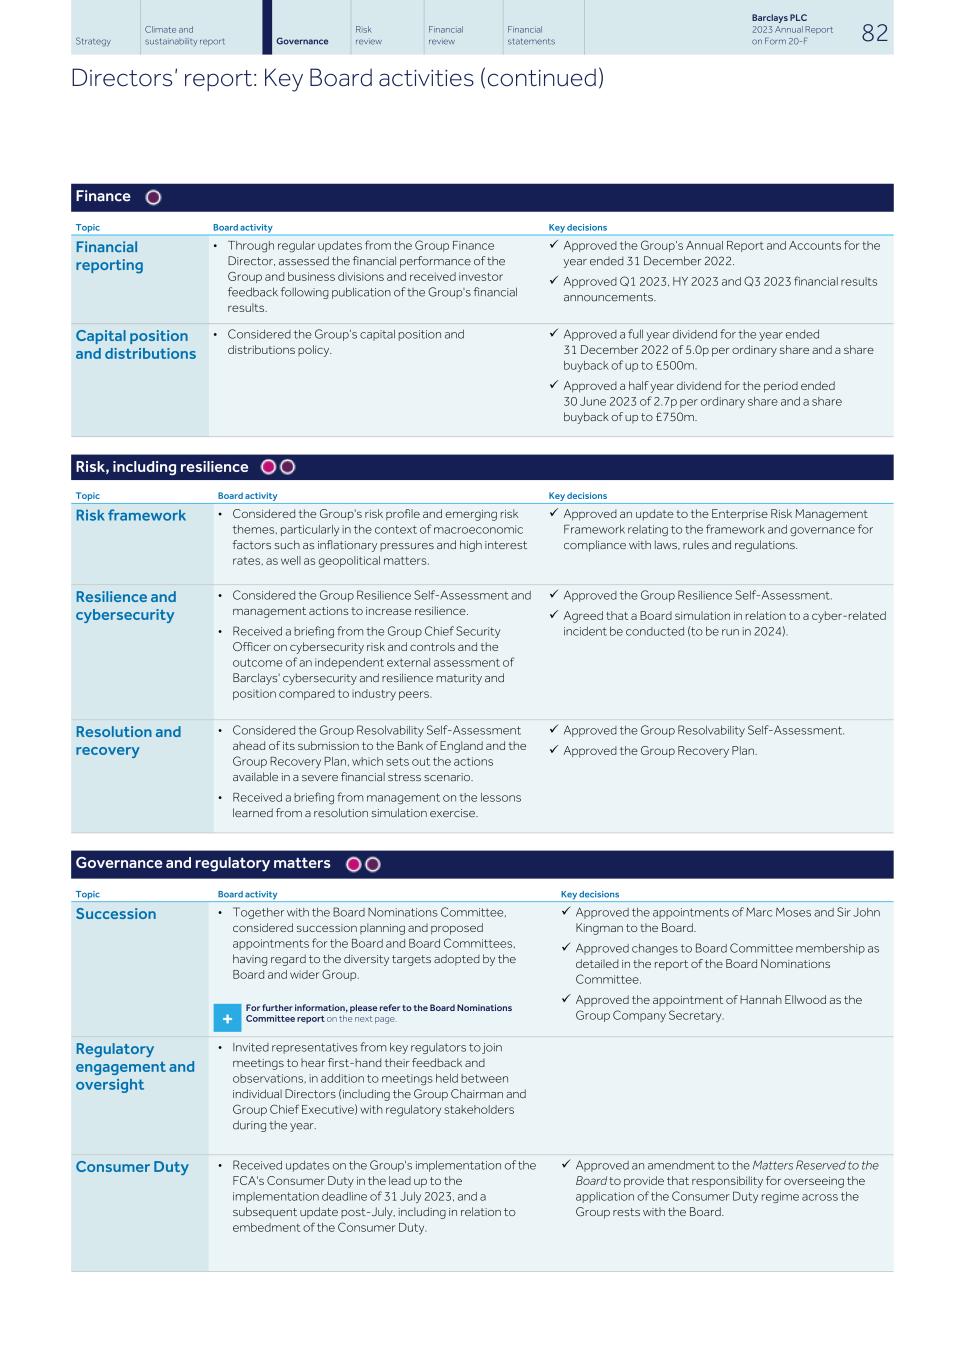
Finance Topic Board activity Key decisions Financial reporting • Through regular updates from the Group Finance Director, assessed the financial performance of the Group and business divisions and received investor feedback following publication of the Group's financial results. ü Approved the Group’s Annual Report and Accounts for the year ended 31 December 2022. ü Approved Q1 2023, HY 2023 and Q3 2023 financial results announcements. Capital position and distributions • Considered the Group’s capital position and distributions policy. ü Approved a full year dividend for the year ended 31 December 2022 of 5.0p per ordinary share and a share buyback of up to £500m. ü Approved a half year dividend for the period ended 30 June 2023 of 2.7p per ordinary share and a share buyback of up to £750m. Risk framework • Considered the Group's risk profile and emerging risk themes, particularly in the context of macroeconomic factors such as inflationary pressures and high interest rates, as well as geopolitical matters. ü Approved an update to the Enterprise Risk Management Framework relating to the framework and governance for compliance with laws, rules and regulations. Resilience and cybersecurity • Considered the Group Resilience Self-Assessment and management actions to increase resilience. • Received a briefing from the Group Chief Security Officer on cybersecurity risk and controls and the outcome of an independent external assessment of Barclays' cybersecurity and resilience maturity and position compared to industry peers. ü Approved the Group Resilience Self-Assessment. ü Agreed that a Board simulation in relation to a cyber-related incident be conducted (to be run in 2024). Resolution and recovery • Considered the Group Resolvability Self-Assessment ahead of its submission to the Bank of England and the Group Recovery Plan, which sets out the actions available in a severe financial stress scenario. • Received a briefing from management on the lessons learned from a resolution simulation exercise. ü Approved the Group Resolvability Self-Assessment. ü Approved the Group Recovery Plan. Risk, including resilience Topic Board activity Key decisions Governance and regulatory matters Topic Board activity Key decisions Succession • Together with the Board Nominations Committee, considered succession planning and proposed appointments for the Board and Board Committees, having regard to the diversity targets adopted by the Board and wider Group. ü Approved the appointments of Marc Moses and Sir John Kingman to the Board. ü Approved changes to Board Committee membership as detailed in the report of the Board Nominations Committee. ü Approved the appointment of Hannah Ellwood as the Group Company Secretary.+ For further information, please refer to the Board Nominations Committee report on the next page. Regulatory engagement and oversight • Invited representatives from key regulators to join meetings to hear first-hand their feedback and observations, in addition to meetings held between individual Directors (including the Group Chairman and Group Chief Executive) with regulatory stakeholders during the year. Consumer Duty • Received updates on the Group's implementation of the FCA's Consumer Duty in the lead up to the implementation deadline of 31 July 2023, and a subsequent update post-July, including in relation to embedment of the Consumer Duty. ü Approved an amendment to the Matters Reserved to the Board to provide that responsibility for overseeing the application of the Consumer Duty regime across the Group rests with the Board. Strategy Climate and sustainability report Risk review Financial review Financial statements Barclays PLC 2023 Annual Report on Form 20-F 82Governance Directors’ report: Key Board activities (continued) 	 	 	

Effective composition and robust succession plans, with a continued focus on diversity Ensuring that we continue to have the right balance of skills, experience and diversity on the Board, Board Committees and ExCo. Introduction In 2023, the Committee continued to perform a key role in supporting the delivery of the Group’s strategy through effective oversight of Board, Board Committee and ExCo composition, robust succession planning and evaluating Board performance. Through its work, the Committee ensures that the Board has the right balance of skills, experience and diversity of background and thought to be able to provide informed and constructive challenge to management while acting fairly in the interests of our stakeholders. Committee membership and activity during 2023 The Committee is chaired by our Group Chairman, with membership composed solely of Non-Executive Directors. Committee membership and meeting attendance during the year is set out opposite, and the Committee's activities during 2023 are described in this report. In discharging its responsibilities, the Committee takes into account feedback from key stakeholders, and from Board discussions more widely. + The Committee’s terms of reference are available at home.barclays/who-we-are/our-governance/board- committees/ Board Nominations Committee Nigel Higgins Chair, Board Nominations Committee Committee membership and meeting attendance during 20231 Member Meetings attended/eligible to attend (including ad hoc meetings) Nigel Higgins 3/3 Mohamed A. El-Erian 3/3 Brian Gilvary 3/3 Diane Schueneman 3/3 Julia Wilson 3/3 Note: 1 There were two scheduled meetings and one ad hoc meeting of the Committee in 2023. Changes to Board and Board Committee composition in 2023 Non-Executive Director Appointments Resignations Mike Ashley Audit (Chair) - 31 March 2023 Board - 3 May 2023 Audit (Committee) - 3 May 2023 Risk - 3 May 2023 Crawford Gillies Board - 31 May 2023 Brian Gilvary Risk - 1 June 2023 Sir John Kingman Board - 1 June 2023 Risk - 16 June 2023 Remuneration - 16 June 2023 Marc Moses Board - 23 January 2023 Audit - 23 January 2023 Risk - 23 January 2023 Julia Wilson Audit (Chair) - 1 April 2023 Remuneration - 1 July 2023 A new Board Sustainability Committee was established by the Board on 23 March 2023. The following Directors were appointed to the Committee: Nigel Higgins (Chair), Robert Berry, Dawn Fitzpatrick, Mary Francis, Brian Gilvary, C.S. Venkatakrishnan and Julia Wilson. Strategy Climate and sustainability report Risk review Financial review Financial statements Barclays PLC 2023 Annual Report on Form 20-F 83Governance Directors’ report: Board Nominations Committee report
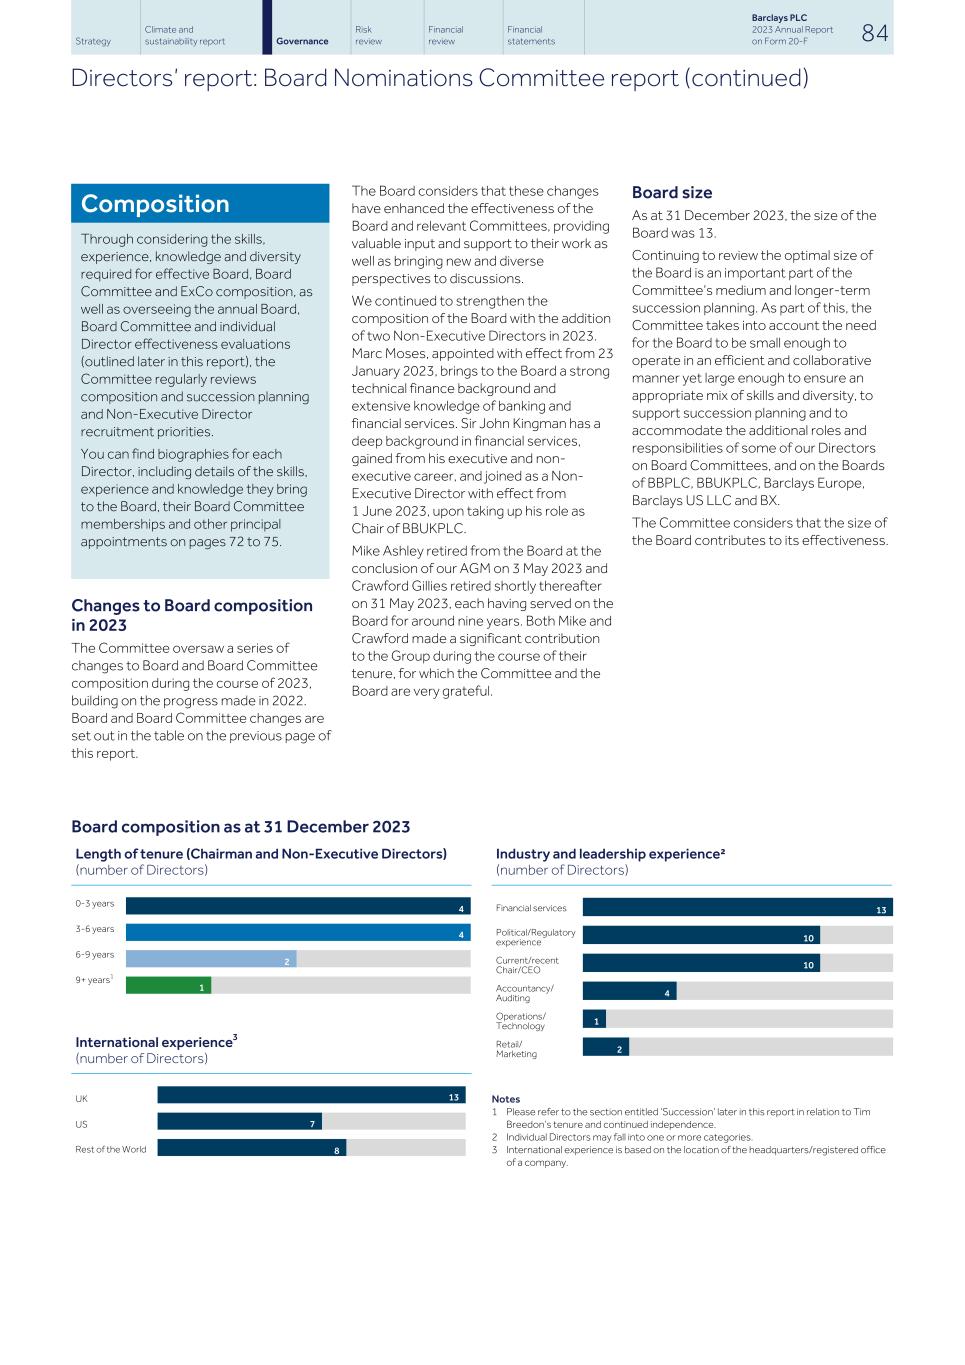
Composition Through considering the skills, experience, knowledge and diversity required for effective Board, Board Committee and ExCo composition, as well as overseeing the annual Board, Board Committee and individual Director effectiveness evaluations (outlined later in this report), the Committee regularly reviews composition and succession planning and Non-Executive Director recruitment priorities. You can find biographies for each Director, including details of the skills, experience and knowledge they bring to the Board, their Board Committee memberships and other principal appointments on pages 72 to 75. Changes to Board composition in 2023 The Committee oversaw a series of changes to Board and Board Committee composition during the course of 2023, building on the progress made in 2022. Board and Board Committee changes are set out in the table on the previous page of this report. The Board considers that these changes have enhanced the effectiveness of the Board and relevant Committees, providing valuable input and support to their work as well as bringing new and diverse perspectives to discussions. We continued to strengthen the composition of the Board with the addition of two Non-Executive Directors in 2023. Marc Moses, appointed with effect from 23 January 2023, brings to the Board a strong technical finance background and extensive knowledge of banking and financial services. Sir John Kingman has a deep background in financial services, gained from his executive and non- executive career, and joined as a Non- Executive Director with effect from 1 June 2023, upon taking up his role as Chair of BBUKPLC. Mike Ashley retired from the Board at the conclusion of our AGM on 3 May 2023 and Crawford Gillies retired shortly thereafter on 31 May 2023, each having served on the Board for around nine years. Both Mike and Crawford made a significant contribution to the Group during the course of their tenure, for which the Committee and the Board are very grateful. Board size As at 31 December 2023, the size of the Board was 13. Continuing to review the optimal size of the Board is an important part of the Committee’s medium and longer-term succession planning. As part of this, the Committee takes into account the need for the Board to be small enough to operate in an efficient and collaborative manner yet large enough to ensure an appropriate mix of skills and diversity, to support succession planning and to accommodate the additional roles and responsibilities of some of our Directors on Board Committees, and on the Boards of BBPLC, BBUKPLC, Barclays Europe, Barclays US LLC and BX. The Committee considers that the size of the Board contributes to its effectiveness. Board composition as at 31 December 2023 Length of tenure (Chairman and Non-Executive Directors) (number of Directors) 0-3 years 3-6 years 6-9 years 9+ years1 4 4 2 1 International experience3 (number of Directors) UK US Rest of the World 13 7 8 Industry and leadership experience² (number of Directors) Financial services Political/Regulatory experience Current/recent Chair/CEO Accountancy/ Auditing Operations/ Technology Retail/ Marketing 13 10 10 4 1 2 Notes 1 Please refer to the section entitled ‘Succession’ later in this report in relation to Tim Breedon’s tenure and continued independence. 2 Individual Directors may fall into one or more categories. 3 International experience is based on the location of the headquarters/registered office of a company. Strategy Climate and sustainability report Risk review Financial review Financial statements Barclays PLC 2023 Annual Report on Form 20-F 84Governance Directors’ report: Board Nominations Committee report (continued)
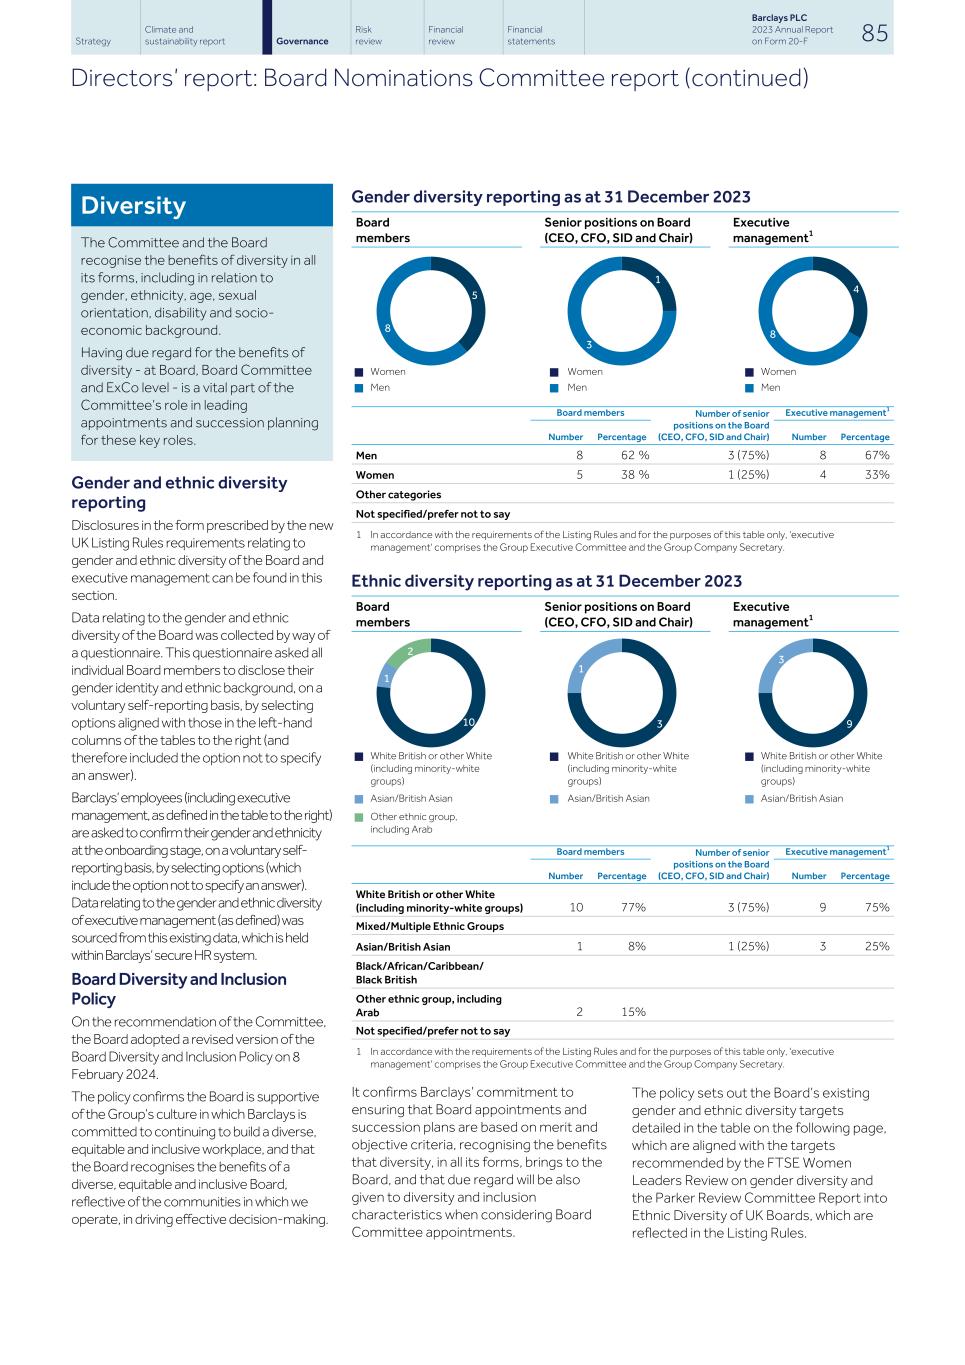
Diversity The Committee and the Board recognise the benefits of diversity in all its forms, including in relation to gender, ethnicity, age, sexual orientation, disability and socio- economic background. Having due regard for the benefits of diversity - at Board, Board Committee and ExCo level - is a vital part of the Committee’s role in leading appointments and succession planning for these key roles. Gender and ethnic diversity reporting Disclosures in the form prescribed by the new UK Listing Rules requirements relating to gender and ethnic diversity of the Board and executive management can be found in this section. Data relating to the gender and ethnic diversity of the Board was collected by way of a questionnaire. This questionnaire asked all individual Board members to disclose their gender identity and ethnic background, on a voluntary self-reporting basis, by selecting options aligned with those in the left-hand columns of the tables to the right (and therefore included the option not to specify an answer). Barclays’ employees (including executive management, as defined in the table to the right) are asked to confirm their gender and ethnicity at the onboarding stage, on a voluntary self- reporting basis, by selecting options (which include the option not to specify an answer). Data relating to the gender and ethnic diversity of executive management (as defined) was sourced from this existing data, which is held within Barclays’ secure HR system. Board Diversity and Inclusion Policy On the recommendation of the Committee, the Board adopted a revised version of the Board Diversity and Inclusion Policy on 8 February 2024. The policy confirms the Board is supportive of the Group’s culture in which Barclays is committed to continuing to build a diverse, equitable and inclusive workplace, and that the Board recognises the benefits of a diverse, equitable and inclusive Board, reflective of the communities in which we operate, in driving effective decision-making. Gender diversity reporting as at 31 December 2023 Board members Senior positions on Board (CEO, CFO, SID and Chair) Executive management1 n Women n Women n Women n Men n Men n Men Board members Number of senior positions on the Board (CEO, CFO, SID and Chair) Executive management1 Number Percentage Number Percentage Men 8 62 % 3 (75%) 8 67% Women 5 38 % 1 (25%) 4 33% Other categories Not specified/prefer not to say 1 In accordance with the requirements of the Listing Rules and for the purposes of this table only, 'executive management' comprises the Group Executive Committee and the Group Company Secretary. Ethnic diversity reporting as at 31 December 2023 Board members Senior positions on Board (CEO, CFO, SID and Chair) Executive management1 n White British or other White (including minority-white groups) n White British or other White (including minority-white groups) n White British or other White (including minority-white groups) n Asian/British Asian n Asian/British Asian n Asian/British Asian n Other ethnic group, including Arab Board members Number of senior positions on the Board (CEO, CFO, SID and Chair) Executive management1 Number Percentage Number Percentage White British or other White (including minority-white groups) 10 77% 3 (75%) 9 75% Mixed/Multiple Ethnic Groups Asian/British Asian 1 8% 1 (25%) 3 25% Black/African/Caribbean/ Black British Other ethnic group, including Arab 2 15% Not specified/prefer not to say 1 In accordance with the requirements of the Listing Rules and for the purposes of this table only, 'executive management' comprises the Group Executive Committee and the Group Company Secretary. It confirms Barclays’ commitment to ensuring that Board appointments and succession plans are based on merit and objective criteria, recognising the benefits that diversity, in all its forms, brings to the Board, and that due regard will be also given to diversity and inclusion characteristics when considering Board Committee appointments. The policy sets out the Board’s existing gender and ethnic diversity targets detailed in the table on the following page, which are aligned with the targets recommended by the FTSE Women Leaders Review on gender diversity and the Parker Review Committee Report into Ethnic Diversity of UK Boards, which are reflected in the Listing Rules. Strategy Climate and sustainability report Risk review Financial review Financial statements Barclays PLC 2023 Annual Report on Form 20-F 85Governance Directors’ report: Board Nominations Committee report (continued) 5 8 1 3 4 8 10 1 2 3 1 9 3
In addition, the policy also confirms the Board's ongoing commitment to operating in a way that supports diversity,equity and inclusion, where Directors’ views are both encouraged and heard. As set out in the table within this section, at 31 December 2023, the proportion of women on the Board was 38%. While this fell short of the 40% target set out in the Listing Rules, FTSE Women Leaders Review and our Board Diversity and Inclusion Policy, the Board satisfied the target of having at least one woman in a senior Board role. As we reported in our 2022 Annual Report and as set out in our Board Diversity and Inclusion Policy (as described above), the Committee and the Board remain committed to ensuring that all Board appointments and succession plans are based on merit and objective criteria, with due regard given to diversity, and focused on meeting our gender diversity targets as set out in our Board Diversity and Inclusion Policy by 2025 while continuing to bring the very best, diverse talent we can attract to the Board. You can read more about the Board appointment process and succession planning in the sections that follow. We also recognise and embrace the benefits of diversity at Board Committee level. As at 31 December 2023, Board Committee gender diversity was as follows: • Board Nominations Committee – 40% women • Board Audit Committee – 50% women • Board Risk Committee – 43% women • Board Sustainability Committee – 43% women • Board Remuneration Committee – 60% women Gender diversity within ExCo, ExCo direct reports and the wider workforce Group-wide, Barclays remains committed to its DEI vision and strategy, which was refreshed in 2022, and includes a series of principles and strategic priorities designed to support Barclays make progress against the six DEI agendas including its Gender Ambition, which is focused on improving gender diversity in senior leadership across Barclays. The Board received an update during the year on Barclays' DEI ambitions, including a focus on the Gender Ambition, as described in the Key Board activities section on page 80. In 2022, Barclays announced its refreshed Gender Ambition of 33% representation of women in senior leadership roles - Managing Directors and Directors - by the end of 2025, having achieved its initial target of 28% representation of women in these roles by the end of 2021. To achieve this ambition, Barclays focuses on the retention, development, progression and hiring of diverse talent at all levels. Regular reporting on progress against ambitions is shared with senior management. As at 31 December 2023, representation of women among Managing Directors and Directors was at 30% globally, and Barclays is focused on continuing its efforts to identify diverse talent in the market and develop existing diverse talent within Barclays. The Committee is also mindful of the voluntary target recommended by the FTSE Women Leaders Review of 40% representation of women for ExCo and their direct reports by the end of 2025. Board Diversity and Inclusion Policy - Targets Gender diversity target To ensure that by 2025: • the proportion of women on the Board is at least 40%; and • at least one of the following senior Board positions is held by a woman: Chair, Chief Executive, Senior Independent Director or Chief Financial Officer, and that this is maintained going forward. Ethnic diversity target To ensure that at least one Board member is from a minority ethnic background excluding white ethnic groups and that this is maintained going forward. As at 31 December 2023, representation of women among ExCo and their direct reports stood at 27%, remaining level with the 2022 year end position. While this fell short of the FTSE Women Leaders Review recommendation, increasing gender diversity within both ExCo and their direct reports, to ensure a diverse pipeline for ExCo succession, remains a key priority for Barclays and the Committee. In 2023, Barclays continued to have one ex-officio position on ExCo, with each appointee serving for a four-month rotation. This initiative, first introduced in 2016, broadens the scope of perspectives and contributions made to ExCo, while also providing appointees with exposure to matters of Group-wide significance and further leadership experience. In 2023, all three holders of this position were women. There are additional initiatives and actions being taken across our businesses to further strengthen the senior leadership pipeline; these include using the ex officio position at business unit executive committees, sponsorship programmes to support individual development and working with senior recruitment partners to strengthen our external pipeline. + You can find details of ExCo membership, including ex-officio appointees during the course of 2023, on page 76. + You can read more about Barclays' DEI vision and strategy and gender diversity at Barclays, including data on the percentage of women in Barclays’ wider workforce, in our Diversity, Equity and Inclusion report, which will be made available on our website later in 2024. Strategy Climate and sustainability report Risk review Financial review Financial statements Barclays PLC 2023 Annual Report on Form 20-F 86Governance Directors’ report: Board Nominations Committee report (continued)
Ethnic diversity reporting as at 31 December 2023 As at 31 December 2023, 23% of the Board (three members) were from a minority ethnic background (excluding minority white ethnic groups), meeting the targets set out in the Listing Rules, the recommendations contained within the Parker Review Committee Report into the Ethnic Diversity of UK Boards and the ethnic diversity target in the Board Diversity and Inclusion Policy. Alongside the Board, the Committee continues to support the Group’s Multicultural agenda, including Barclays' Underrepresented Race and Ethnicity Ambition. Venkat, our Group Chief Executive, has made a significant contribution to Barclays’ diversity agenda. Having achieved our Race at Work ambition to double the number of Black Managing Directors globally from nine to 18 by 2022, in January 2023, we set a new ambition to increase the population of Managing Directors from underrepresented ethnicities by at least 50% by the end of 2025. You can find more information on Barclays’ continued commitment to its Multicultural agenda, including information regarding our ethnic minority percentage target for ExCo and their direct reports and data relating to ethnic diversity in Barclays' wider workforce, in our Diversity, Equity and Inclusion report, which will be available on our website later in 2024. + You can read more about Barclays' approach to DEI within the Colleagues section from page 14. + You can find a copy of our Board Diversity and Inclusion Policy at home.barclays/who-we-are/ our-governance/our-framework-code-and-rules Process for appointments The Committee leads the process for Board appointments, ensuring that all appointments are based on merit and objective criteria - focusing on the skills, experience and knowledge required for the Board’s effectiveness and to support the continued delivery of the Group’s strategy - while also promoting diversity of background and opinion. Appointments to the Board are made following a formal, rigorous and transparent procedure, facilitated by the Committee with the aid of external search consultancy firms, as outlined in further detail below. Non-Executive Director recruitment The Committee regularly reviews and updates a series of skills-based Non- Executive Director recruitment priorities. These priorities underpin the searches required for the Board to ensure orderly succession as Non-Executive Directors approach the end of their tenure and to ensure an optimum balance of skills and experience on the Board. The Committee considered and refreshed the priorities in 2023, in light of Non- Executive Director recruitment activity, including the appointments of Marc Moses and Sir John Kingman during 2023 and two Non-Executive Directors having stepped down from the Board in 2023 at the end of their tenure. The Committee has agreed that all Board members should have the opportunity to meet leading candidates, and that diversity should remain a priority in all searches. Based on the agreed priorities, the Committee has set rigorous criteria for the roles it is seeking to fill, both in terms of experience and personal qualities. Independent search firms Spencer Stuart and Egon Zehnder supported our targeted external mapping and search processes for additional Non-Executive Directors to complement the range of skills on the Board in 2023, based on the agreed criteria. Diversity of background and experience remain at the forefront of those searches. Spencer Stuart and Egon Zehnder do not have any connection to Barclays or any of the Directors other than to assist with searches for executive and non-executive talent. Open advertising for Board positions was not used in 2023. The Committee will continue to review the Board’s recruitment priorities and give further consideration to the desired skills and experience for potential candidates, to ensure that due consideration continues to be given to strong potential candidates who would enhance the effectiveness of the Board. Non-Executive Director independence In line with the requirements of the Code, a majority of our Board comprises independent Non-Executive Directors. The independence of our Non-Executive Directors is considered by the Committee on an annual basis, having regard to the independence criteria set out in the Code. As part of this process, the Committee reviews the length of tenure of all Directors, which can affect independence, and makes any recommendations to the Board accordingly. The Committee reviewed the independence of all Non-Executive Directors serving on the Board as at 31 December 2023. The independence of those who had served on the Board for more than six years (Diane Schueneman and Mary Francis) and more than nine years (Tim Breedon) was subject to a more rigorous review. The Committee remains satisfied that the length of their tenure has no impact on their respective levels of independence or the effectiveness of their contributions. The Committee and the Board consider all of the Non-Executive Directors to be independent. For further details of the Committee’s review of the independence of Tim Breedon, please refer to the Succession section below. During 2023, Mike Ashley and Crawford Gillies stepped down from the Board. Mike and Crawford did not raise any concerns about the operation of the Board or management. Strategy Climate and sustainability report Risk review Financial review Financial statements Barclays PLC 2023 Annual Report on Form 20-F 87Governance Directors’ report: Board Nominations Committee report (continued)
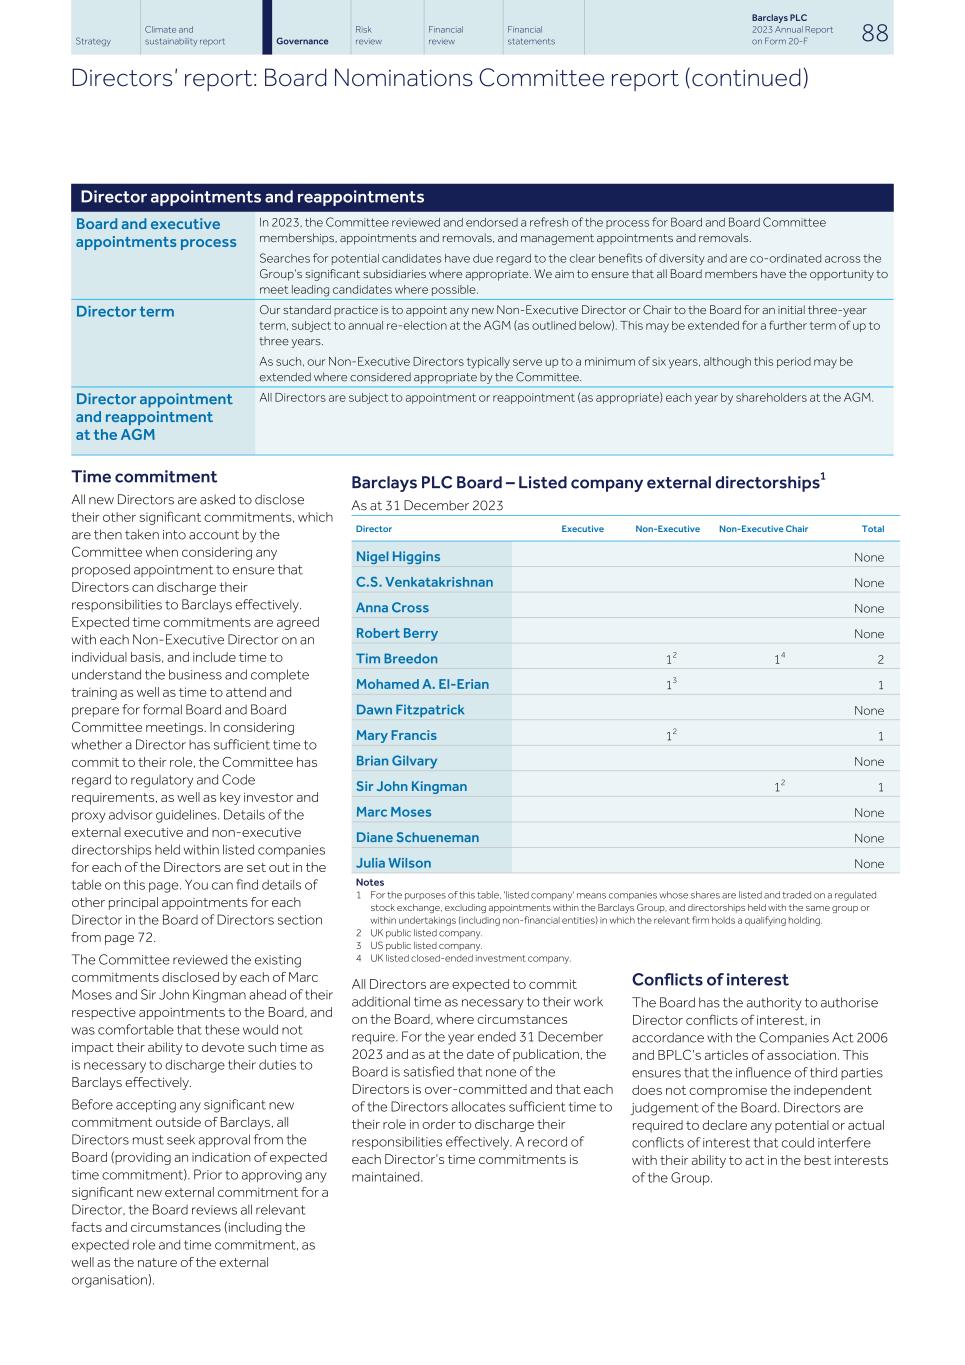
Director appointments and reappointments Board and executive appointments process In 2023, the Committee reviewed and endorsed a refresh of the process for Board and Board Committee memberships, appointments and removals, and management appointments and removals. Searches for potential candidates have due regard to the clear benefits of diversity and are co-ordinated across the Group’s significant subsidiaries where appropriate. We aim to ensure that all Board members have the opportunity to meet leading candidates where possible. Director term Our standard practice is to appoint any new Non-Executive Director or Chair to the Board for an initial three-year term, subject to annual re-election at the AGM (as outlined below). This may be extended for a further term of up to three years. As such, our Non-Executive Directors typically serve up to a minimum of six years, although this period may be extended where considered appropriate by the Committee. Director appointment and reappointment at the AGM All Directors are subject to appointment or reappointment (as appropriate) each year by shareholders at the AGM. Time commitment All new Directors are asked to disclose their other significant commitments, which are then taken into account by the Committee when considering any proposed appointment to ensure that Directors can discharge their responsibilities to Barclays effectively. Expected time commitments are agreed with each Non-Executive Director on an individual basis, and include time to understand the business and complete training as well as time to attend and prepare for formal Board and Board Committee meetings. In considering whether a Director has sufficient time to commit to their role, the Committee has regard to regulatory and Code requirements, as well as key investor and proxy advisor guidelines. Details of the external executive and non-executive directorships held within listed companies for each of the Directors are set out in the table on this page. You can find details of other principal appointments for each Director in the Board of Directors section from page 72. The Committee reviewed the existing commitments disclosed by each of Marc Moses and Sir John Kingman ahead of their respective appointments to the Board, and was comfortable that these would not impact their ability to devote such time as is necessary to discharge their duties to Barclays effectively. Before accepting any significant new commitment outside of Barclays, all Directors must seek approval from the Board (providing an indication of expected time commitment). Prior to approving any significant new external commitment for a Director, the Board reviews all relevant facts and circumstances (including the expected role and time commitment, as well as the nature of the external organisation). Barclays PLC Board – Listed company external directorships1 As at 31 December 2023 Director Executive Non-Executive Non-Executive Chair Total Nigel Higgins None C.S. Venkatakrishnan None Anna Cross None Robert Berry None Tim Breedon 12 14 2 Mohamed A. El-Erian 13 1 Dawn Fitzpatrick None Mary Francis 12 1 Brian Gilvary None Sir John Kingman 12 1 Marc Moses None Diane Schueneman None Julia Wilson None Notes 1 For the purposes of this table, 'listed company' means companies whose shares are listed and traded on a regulated stock exchange, excluding appointments within the Barclays Group, and directorships held with the same group or within undertakings (including non-financial entities) in which the relevant firm holds a qualifying holding. 2 UK public listed company. 3 US public listed company. 4 UK listed closed-ended investment company. All Directors are expected to commit additional time as necessary to their work on the Board, where circumstances require. For the year ended 31 December 2023 and as at the date of publication, the Board is satisfied that none of the Directors is over-committed and that each of the Directors allocates sufficient time to their role in order to discharge their responsibilities effectively. A record of each Director’s time commitments is maintained. Conflicts of interest The Board has the authority to authorise Director conflicts of interest, in accordance with the Companies Act 2006 and BPLC’s articles of association. This ensures that the influence of third parties does not compromise the independent judgement of the Board. Directors are required to declare any potential or actual conflicts of interest that could interfere with their ability to act in the best interests of the Group. Strategy Climate and sustainability report Risk review Financial review Financial statements Barclays PLC 2023 Annual Report on Form 20-F 88Governance Directors’ report: Board Nominations Committee report (continued)
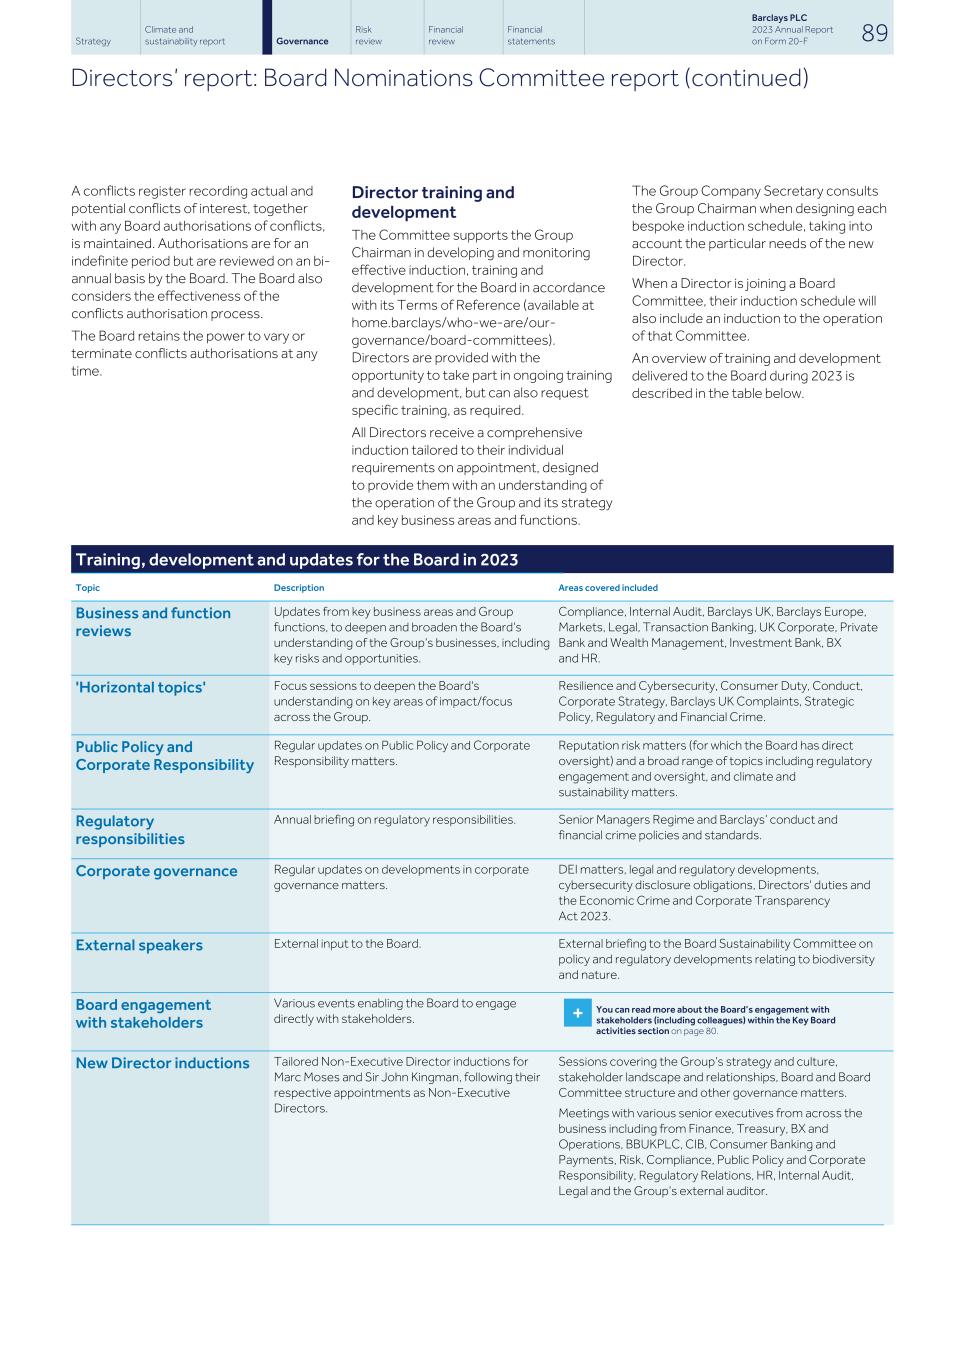
A conflicts register recording actual and potential conflicts of interest, together with any Board authorisations of conflicts, is maintained. Authorisations are for an indefinite period but are reviewed on an bi- annual basis by the Board. The Board also considers the effectiveness of the conflicts authorisation process. The Board retains the power to vary or terminate conflicts authorisations at any time. Director training and development The Committee supports the Group Chairman in developing and monitoring effective induction, training and development for the Board in accordance with its Terms of Reference (available at home.barclays/who-we-are/our- governance/board-committees). Directors are provided with the opportunity to take part in ongoing training and development, but can also request specific training, as required. All Directors receive a comprehensive induction tailored to their individual requirements on appointment, designed to provide them with an understanding of the operation of the Group and its strategy and key business areas and functions. The Group Company Secretary consults the Group Chairman when designing each bespoke induction schedule, taking into account the particular needs of the new Director. When a Director is joining a Board Committee, their induction schedule will also include an induction to the operation of that Committee. An overview of training and development delivered to the Board during 2023 is described in the table below. Training, development and updates for the Board in 2023 Topic Description Areas covered included Business and function reviews Updates from key business areas and Group functions, to deepen and broaden the Board’s understanding of the Group’s businesses, including key risks and opportunities. Compliance, Internal Audit, Barclays UK, Barclays Europe, Markets, Legal, Transaction Banking, UK Corporate, Private Bank and Wealth Management, Investment Bank, BX and HR. 'Horizontal topics' Focus sessions to deepen the Board's understanding on key areas of impact/focus across the Group. Resilience and Cybersecurity, Consumer Duty, Conduct, Corporate Strategy, Barclays UK Complaints, Strategic Policy, Regulatory and Financial Crime. Public Policy and Corporate Responsibility Regular updates on Public Policy and Corporate Responsibility matters. Reputation risk matters (for which the Board has direct oversight) and a broad range of topics including regulatory engagement and oversight, and climate and sustainability matters. Regulatory responsibilities Annual briefing on regulatory responsibilities. Senior Managers Regime and Barclays’ conduct and financial crime policies and standards. Corporate governance Regular updates on developments in corporate governance matters. DEI matters, legal and regulatory developments, cybersecurity disclosure obligations, Directors' duties and the Economic Crime and Corporate Transparency Act 2023. External speakers External input to the Board. External briefing to the Board Sustainability Committee on policy and regulatory developments relating to biodiversity and nature. Board engagement with stakeholders Various events enabling the Board to engage directly with stakeholders. + You can read more about the Board’s engagement with stakeholders (including colleagues) within the Key Board activities section on page 80. New Director inductions Tailored Non-Executive Director inductions for Marc Moses and Sir John Kingman, following their respective appointments as Non-Executive Directors. Sessions covering the Group’s strategy and culture, stakeholder landscape and relationships, Board and Board Committee structure and other governance matters. Meetings with various senior executives from across the business including from Finance, Treasury, BX and Operations, BBUKPLC, CIB, Consumer Banking and Payments, Risk, Compliance, Public Policy and Corporate Responsibility, Regulatory Relations, HR, Internal Audit, Legal and the Group’s external auditor. Strategy Climate and sustainability report Risk review Financial review Financial statements Barclays PLC 2023 Annual Report on Form 20-F 89Governance Directors’ report: Board Nominations Committee report (continued)
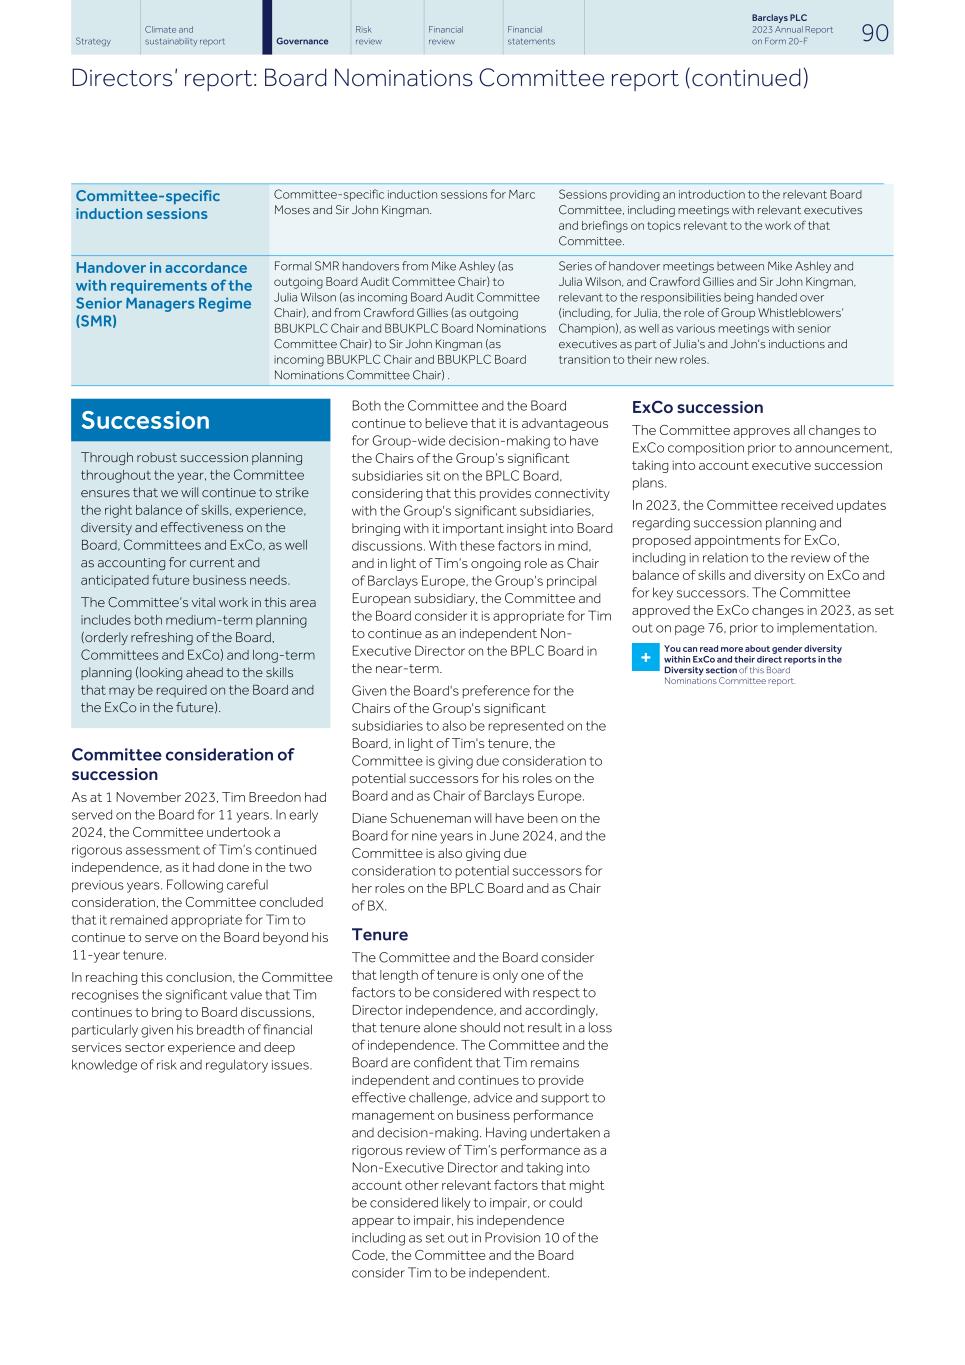
Committee-specific induction sessions Committee-specific induction sessions for Marc Moses and Sir John Kingman. Sessions providing an introduction to the relevant Board Committee, including meetings with relevant executives and briefings on topics relevant to the work of that Committee. Handover in accordance with requirements of the Senior Managers Regime (SMR) Formal SMR handovers from Mike Ashley (as outgoing Board Audit Committee Chair) to Julia Wilson (as incoming Board Audit Committee Chair), and from Crawford Gillies (as outgoing BBUKPLC Chair and BBUKPLC Board Nominations Committee Chair) to Sir John Kingman (as incoming BBUKPLC Chair and BBUKPLC Board Nominations Committee Chair) . Series of handover meetings between Mike Ashley and Julia Wilson, and Crawford Gillies and Sir John Kingman, relevant to the responsibilities being handed over (including, for Julia, the role of Group Whistleblowers’ Champion), as well as various meetings with senior executives as part of Julia's and John's inductions and transition to their new roles. Succession Through robust succession planning throughout the year, the Committee ensures that we will continue to strike the right balance of skills, experience, diversity and effectiveness on the Board, Committees and ExCo, as well as accounting for current and anticipated future business needs. The Committee’s vital work in this area includes both medium-term planning (orderly refreshing of the Board, Committees and ExCo) and long-term planning (looking ahead to the skills that may be required on the Board and the ExCo in the future). Committee consideration of succession As at 1 November 2023, Tim Breedon had served on the Board for 11 years. In early 2024, the Committee undertook a rigorous assessment of Tim’s continued independence, as it had done in the two previous years. Following careful consideration, the Committee concluded that it remained appropriate for Tim to continue to serve on the Board beyond his 11-year tenure. In reaching this conclusion, the Committee recognises the significant value that Tim continues to bring to Board discussions, particularly given his breadth of financial services sector experience and deep knowledge of risk and regulatory issues. Both the Committee and the Board continue to believe that it is advantageous for Group-wide decision-making to have the Chairs of the Group’s significant subsidiaries sit on the BPLC Board, considering that this provides connectivity with the Group's significant subsidiaries, bringing with it important insight into Board discussions. With these factors in mind, and in light of Tim’s ongoing role as Chair of Barclays Europe, the Group’s principal European subsidiary, the Committee and the Board consider it is appropriate for Tim to continue as an independent Non- Executive Director on the BPLC Board in the near-term. Given the Board's preference for the Chairs of the Group's significant subsidiaries to also be represented on the Board, in light of Tim's tenure, the Committee is giving due consideration to potential successors for his roles on the Board and as Chair of Barclays Europe. Diane Schueneman will have been on the Board for nine years in June 2024, and the Committee is also giving due consideration to potential successors for her roles on the BPLC Board and as Chair of BX. Tenure The Committee and the Board consider that length of tenure is only one of the factors to be considered with respect to Director independence, and accordingly, that tenure alone should not result in a loss of independence. The Committee and the Board are confident that Tim remains independent and continues to provide effective challenge, advice and support to management on business performance and decision-making. Having undertaken a rigorous review of Tim’s performance as a Non-Executive Director and taking into account other relevant factors that might be considered likely to impair, or could appear to impair, his independence including as set out in Provision 10 of the Code, the Committee and the Board consider Tim to be independent. ExCo succession The Committee approves all changes to ExCo composition prior to announcement, taking into account executive succession plans. In 2023, the Committee received updates regarding succession planning and proposed appointments for ExCo, including in relation to the review of the balance of skills and diversity on ExCo and for key successors. The Committee approved the ExCo changes in 2023, as set out on page 76, prior to implementation. + You can read more about gender diversity within ExCo and their direct reports in the Diversity section of this Board Nominations Committee report. Strategy Climate and sustainability report Risk review Financial review Financial statements Barclays PLC 2023 Annual Report on Form 20-F 90Governance Directors’ report: Board Nominations Committee report (continued)
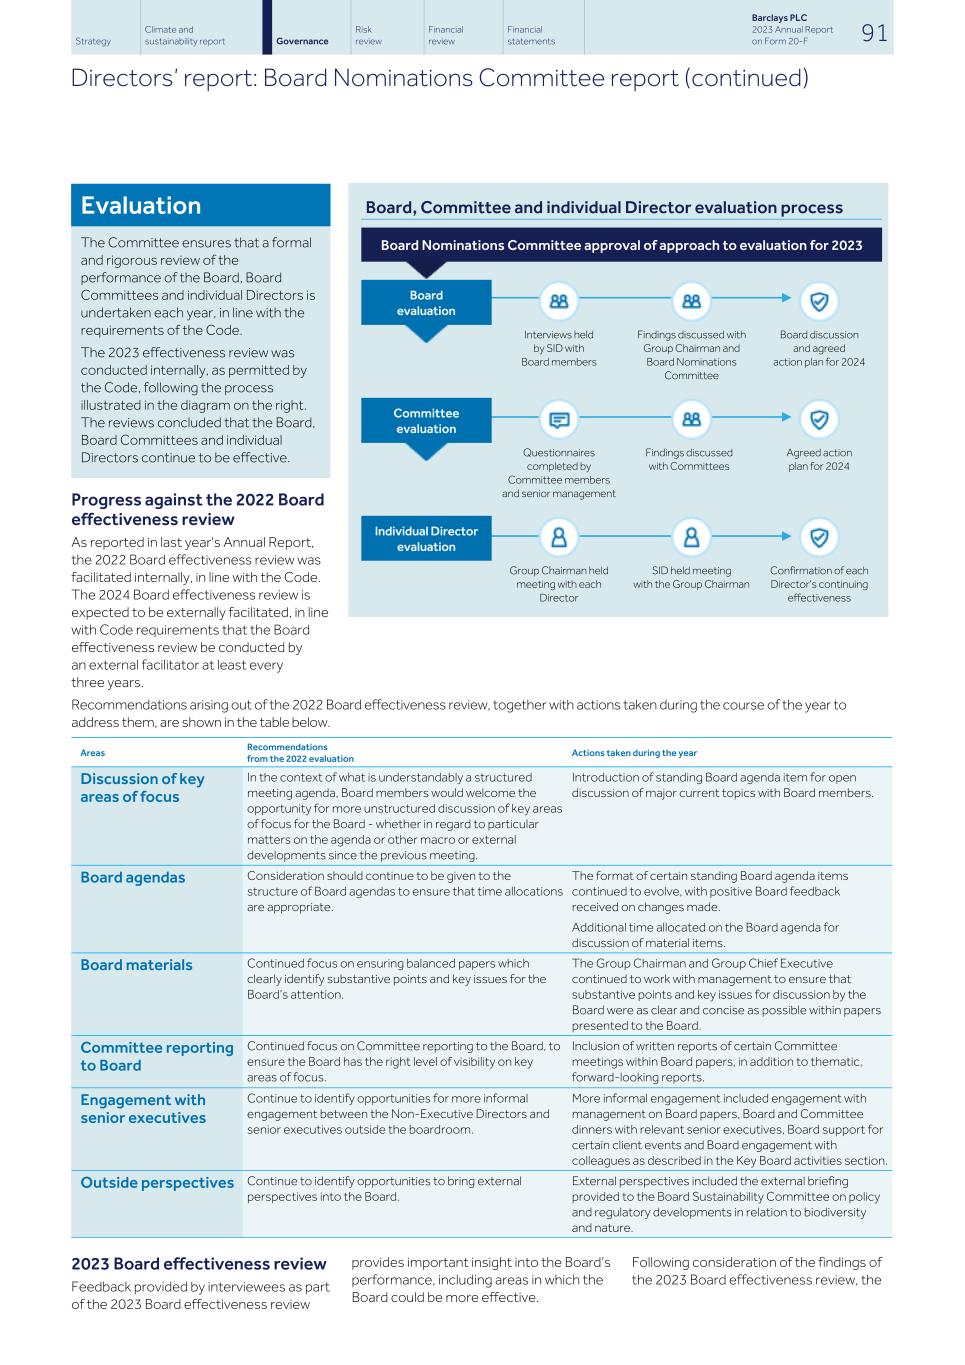
Evaluation The Committee ensures that a formal and rigorous review of the performance of the Board, Board Committees and individual Directors is undertaken each year, in line with the requirements of the Code. The 2023 effectiveness review was conducted internally, as permitted by the Code, following the process illustrated in the diagram on the right. The reviews concluded that the Board, Board Committees and individual Directors continue to be effective. Progress against the 2022 Board effectiveness review As reported in last year's Annual Report, the 2022 Board effectiveness review was facilitated internally, in line with the Code. The 2024 Board effectiveness review is expected to be externally facilitated, in line with Code requirements that the Board effectiveness review be conducted by an external facilitator at least every three years. Board, Committee and individual Director evaluation process Board Nominations Committee approval of approach to evaluation for 2023 Board evaluation Interviews held by SID with Board members Findings discussed with Group Chairman and Board Nominations Committee Board discussion and agreed action plan for 2024 Committee evaluation Questionnaires completed by Committee members and senior management Findings discussed with Committees Agreed action plan for 2024 Individual Director evaluation Group Chairman held meeting with each Director SID held meeting with the Group Chairman Confirmation of each Director’s continuing effectiveness Recommendations arising out of the 2022 Board effectiveness review, together with actions taken during the course of the year to address them, are shown in the table below. Discussion of key areas of focus In the context of what is understandably a structured meeting agenda, Board members would welcome the opportunity for more unstructured discussion of key areas of focus for the Board - whether in regard to particular matters on the agenda or other macro or external developments since the previous meeting. Introduction of standing Board agenda item for open discussion of major current topics with Board members. Board agendas Consideration should continue to be given to the structure of Board agendas to ensure that time allocations are appropriate. The format of certain standing Board agenda items continued to evolve, with positive Board feedback received on changes made. Additional time allocated on the Board agenda for discussion of material items. Board materials Continued focus on ensuring balanced papers which clearly identify substantive points and key issues for the Board’s attention. The Group Chairman and Group Chief Executive continued to work with management to ensure that substantive points and key issues for discussion by the Board were as clear and concise as possible within papers presented to the Board. Committee reporting to Board Continued focus on Committee reporting to the Board, to ensure the Board has the right level of visibility on key areas of focus. Inclusion of written reports of certain Committee meetings within Board papers, in addition to thematic, forward-looking reports. Engagement with senior executives Continue to identify opportunities for more informal engagement between the Non-Executive Directors and senior executives outside the boardroom. More informal engagement included engagement with management on Board papers, Board and Committee dinners with relevant senior executives, Board support for certain client events and Board engagement with colleagues as described in the Key Board activities section. Outside perspectives Continue to identify opportunities to bring external perspectives into the Board. External perspectives included the external briefing provided to the Board Sustainability Committee on policy and regulatory developments in relation to biodiversity and nature. Areas Recommendations from the 2022 evaluation Actions taken during the year 2023 Board effectiveness review Feedback provided by interviewees as part of the 2023 Board effectiveness review provides important insight into the Board’s performance, including areas in which the Board could be more effective. Following consideration of the findings of the 2023 Board effectiveness review, the Strategy Climate and sustainability report Risk review Financial review Financial statements Barclays PLC 2023 Annual Report on Form 20-F 91Governance Directors’ report: Board Nominations Committee report (continued)
Committee remains satisfied that the Board is operating effectively. Feedback from 2023 review Feedback from this review indicated that the Board is operating well and effectively, with Board members commenting favourably on the culture of the Board, where members feel able to share their different perspectives and views. Board members emphasised how this culture is supported by the inclusive style of the Group Chairman and his values-driven approach. The review indicated that Board composition is considered to be a strength, bringing together a range of diverse and complementary backgrounds, including deep financial services expertise. The interaction between the Board and the Board Committees was commented upon favourably, with regular reporting ensuring the Board has good visibility on key areas of focus. The review highlighted the positive relationship between the Board and management, and an appropriate level of support and challenge. Recommendations from 2023 review The 2023 review outlined the following key recommendations: • consider how Board agendas might be structured to (i) allow for deeper discussion of business performance; and (ii) create more flexibility for discussion of key topics and reflections within the agenda • identify opportunities for more open and wide-ranging discussions on big picture issues • continue to focus on ensuring balanced papers which clearly identify substantive points and key issues for the Board’s attention • continue to identify opportunities to bring external perspectives into the Board. 2023 Board Committee effectiveness review The Board Committee reviews are an important part of the way Barclays monitors and improves Committee performance and effectiveness, maximising strengths and highlighting areas for further development. The results of the 2023 Board Nominations Committee effectiveness review are reported below, and the results of the reviews of the effectiveness of the other Board Committees are reported within their individual reports elsewhere in this Board Governance report. Following consideration of the findings of the 2023 Board Committee effectiveness reviews, the Committee remains satisfied that each of the Board Committees are operating effectively. Review of Board Nominations Committee effectiveness The results of the 2023 review confirm the Committee is operating effectively. It is considered well constituted and chaired, providing high-quality oversight and constructive challenge to management in the areas within its remit. The review highlights that the Committee is considered to have the right level of skills and experience. Feedback indicates that the allocation of time between agenda items in Committee meetings is appropriate, with sufficient time for discussion and challenge, and focus on the right areas. The Committee’s interaction with the Board, Board Committees and senior management is considered effective, noting that sufficient time is allocated at Board meetings for the Chair to report to the Board on the work of the Committee. Feedback indicated that concurrent meetings of the BPLC and BBPLC Board Nominations Committee continue to be effective, with coverage of BBPLC matters within concurrent meetings considered appropriate. Interaction with the BBUKPLC Board Nominations Committee was also considered effective, confirming that the Committee continues to exercise sufficient oversight of issues relevant to the Committee’s remit relating to BBUKPLC. Individual Director effectiveness All Directors in office at the end of 2023 were subject to an individual effectiveness review. The Group Chairman considered each Director’s individual contribution to the Board as well as any feedback received as part of the broader Board and Board Committee effectiveness reviews. Based on these reviews, the Board accepted the view of the Committee that each Director to be proposed for election or re-election at the 2024 AGM continues to be effective and contributes to Barclays’ long-term sustainable success. All of the current Directors of the Company intend to submit themselves for election or re-election at the 2024 AGM and will be unanimously recommended by the Board for election or re-election as appropriate. Strategy Climate and sustainability report Risk review Financial review Financial statements Barclays PLC 2023 Annual Report on Form 20-F 92Governance Directors’ report: Board Nominations Committee report (continued)
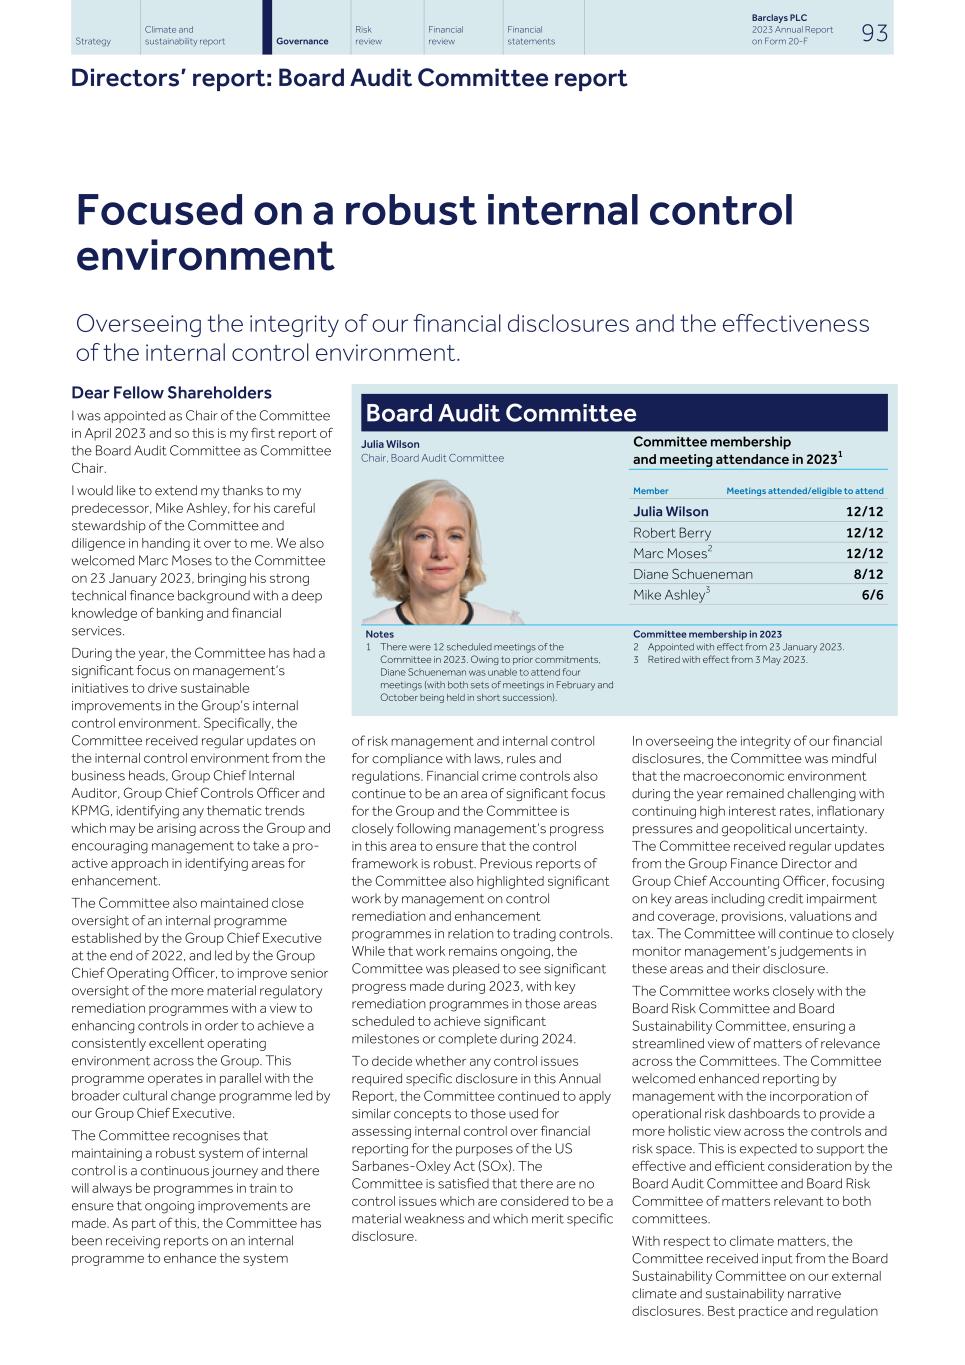
Focused on a robust internal control environment Overseeing the integrity of our financial disclosures and the effectiveness of the internal control environment. Dear Fellow Shareholders I was appointed as Chair of the Committee in April 2023 and so this is my first report of the Board Audit Committee as Committee Chair. I would like to extend my thanks to my predecessor, Mike Ashley, for his careful stewardship of the Committee and diligence in handing it over to me. We also welcomed Marc Moses to the Committee on 23 January 2023, bringing his strong technical finance background with a deep knowledge of banking and financial services. During the year, the Committee has had a significant focus on management’s initiatives to drive sustainable improvements in the Group’s internal control environment. Specifically, the Committee received regular updates on the internal control environment from the business heads, Group Chief Internal Auditor, Group Chief Controls Officer and KPMG, identifying any thematic trends which may be arising across the Group and encouraging management to take a pro- active approach in identifying areas for enhancement. The Committee also maintained close oversight of an internal programme established by the Group Chief Executive at the end of 2022, and led by the Group Chief Operating Officer, to improve senior oversight of the more material regulatory remediation programmes with a view to enhancing controls in order to achieve a consistently excellent operating environment across the Group. This programme operates in parallel with the broader cultural change programme led by our Group Chief Executive. The Committee recognises that maintaining a robust system of internal control is a continuous journey and there will always be programmes in train to ensure that ongoing improvements are made. As part of this, the Committee has been receiving reports on an internal programme to enhance the system Board Audit Committee Julia Wilson Chair, Board Audit Committee Committee membership and meeting attendance in 20231 Member Meetings attended/eligible to attend Julia Wilson 12/12 Robert Berry 12/12 Marc Moses2 12/12 Diane Schueneman 8/12 Mike Ashley3 6/6 Notes 1 There were 12 scheduled meetings of the Committee in 2023. Owing to prior commitments, Diane Schueneman was unable to attend four meetings (with both sets of meetings in February and October being held in short succession). Committee membership in 2023 2 Appointed with effect from 23 January 2023. 3 Retired with effect from 3 May 2023. of risk management and internal control for compliance with laws, rules and regulations. Financial crime controls also continue to be an area of significant focus for the Group and the Committee is closely following management’s progress in this area to ensure that the control framework is robust. Previous reports of the Committee also highlighted significant work by management on control remediation and enhancement programmes in relation to trading controls. While that work remains ongoing, the Committee was pleased to see significant progress made during 2023, with key remediation programmes in those areas scheduled to achieve significant milestones or complete during 2024. To decide whether any control issues required specific disclosure in this Annual Report, the Committee continued to apply similar concepts to those used for assessing internal control over financial reporting for the purposes of the US Sarbanes-Oxley Act (SOx). The Committee is satisfied that there are no control issues which are considered to be a material weakness and which merit specific disclosure. In overseeing the integrity of our financial disclosures, the Committee was mindful that the macroeconomic environment during the year remained challenging with continuing high interest rates, inflationary pressures and geopolitical uncertainty. The Committee received regular updates from the Group Finance Director and Group Chief Accounting Officer, focusing on key areas including credit impairment and coverage, provisions, valuations and tax. The Committee will continue to closely monitor management’s judgements in these areas and their disclosure. The Committee works closely with the Board Risk Committee and Board Sustainability Committee, ensuring a streamlined view of matters of relevance across the Committees. The Committee welcomed enhanced reporting by management with the incorporation of operational risk dashboards to provide a more holistic view across the controls and risk space. This is expected to support the effective and efficient consideration by the Board Audit Committee and Board Risk Committee of matters relevant to both committees. With respect to climate matters, the Committee received input from the Board Sustainability Committee on our external climate and sustainability narrative disclosures. Best practice and regulation Strategy Climate and sustainability report Risk review Financial review Financial statements Barclays PLC 2023 Annual Report on Form 20-F 93Governance Directors’ report: Board Audit Committee report
regarding climate and sustainability reporting and related assurance are still evolving, while investor and other stakeholder appetite for information continues to grow, and this is an area to which the Committee will continue to have close regard. Barclays’ climate strategy remains a key focus of the Group and the Committee continues to monitor that the impact of climate change has been addressed in preparing the Group’s financial statements. The independent assurance and challenge provided by both Barclays Internal Audit (BIA) and KPMG as statutory auditor are critical to the Committee’s oversight role in relation to internal controls and financial reporting. For this reason, the Committee continues to hold regular separate private sessions with each of the Group Chief Internal Auditor and the lead KPMG audit engagement partner without management present. The Committee has oversight of Barclays’ whistleblowing programme and I took over the role of Group Whistleblowers' Champion upon my appointment as Committee Chair. During 2023, I met with the FCA and also held regular meetings with the Whistleblowing team to understand their key areas of focus and the Committee continues to receive detailed semi-annual whistleblowing updates. Throughout the year I also held regular meetings with a number of other colleagues and stakeholders to discuss any material and emerging key issues impacting the Group (including its key subsidiaries) and of relevance to the Committee. This included regular meetings with the Chair of the BBUKPLC Board Audit Committee, the Group Finance Director, Group Chief Internal Auditor and lead KPMG audit partner. As Committee Chair, throughout the year I also engaged regularly with the Group’s key regulators, including meeting with representatives of the PRA, FCA and FRBNY. Committee effectiveness The results of the Committee effectiveness review for 2023 confirm the Committee is operating effectively. It is considered well constituted and chaired, providing an effective and appropriate level of challenge and oversight of the areas within its remit. Feedback recognised the effective transition of the Chair in April 2023. The review highlights that the Committee is considered to have the right level of skills and experience, including recent and relevant financial experience, and is of an appropriate size. Feedback indicates that the Committee is considered to operate at the right level of debate, and confirms that the allocation of time between agenda items in Committee meetings is appropriate, with sufficient time for discussion and challenge. The Committee’s interaction with the Board, Board Committees and senior management is considered effective, noting that sufficient time is allocated at Board meetings for the Chair to report to the Board on the work of the Committee. Feedback indicated that concurrent meetings of the BPLC and BBPLC Board Audit Committee continue to be effective, with coverage of BBPLC matters within concurrent meetings considered appropriate. Interaction with the BBUKPLC Board Audit Committee was also considered effective, confirming that the Committee continues to exercise sufficient oversight of issues relevant to the Committee’s remit relating to BBUKPLC. Please see the report of the Board Nominations Committee for details on the process for conducting the 2023 Committee effectiveness review. Looking ahead Management has made some significant progress on remediation during the course of 2023; maintaining that momentum in 2024 will be a key focus of the Committee. Finally, after some five years in the role, and having made significant progress in the operation and methodologies used by BIA, Lindsay O’Reilly will be stepping down as Group Chief Internal Auditor during 2024. The Committee will be looking to approve the appointment of a new Group Chief Internal Auditor in the coming months and would like to extend its thanks to Lindsay for her invaluable support, which is continuing through this transition period. Julia Wilson Chair, Board Audit Committee 19 February 2024 Strategy Climate and sustainability report Risk review Financial review Financial statements Barclays PLC 2023 Annual Report on Form 20-F 94Governance Directors’ report: Board Audit Committee report (continued)
Committee composition and meetings The Committee is composed solely of independent Non-Executive Directors. Membership of the Committee is designed to provide the breadth of financial expertise and commercial acumen that the Committee needs to fulfil its responsibilities. Its members as a whole have recent and relevant experience of the banking and financial services sector, in addition to general management and commercial experience; and are financially literate. Julia Wilson, the Committee Chair, and who is the designated financial expert on the Committee for the purposes of SOx, has significant corporate finance, tax and accounting experience including serving as the Group Finance Director of 3i plc from 2008 to 2022 and as Chair of the board audit committee at Legal & General Group plc. In 2023, the Committee met 12 times, with no ad hoc meetings held during the year (2022: 14 times, including four ad hoc meetings). Attendance by members at Committee meetings is shown on page 93. Committee meetings were attended by representatives from management, including the Group Chief Executive, Group Finance Director, Group Chief Internal Auditor, Group Chief Controls Officer, Group Chief Risk Officer, Group Chief Operating Officer, Group General Counsel and Group Chief Compliance Officer, as well as representatives from the businesses and other functions, and from BBPLC senior management reflecting the partially consolidated operation of the BPLC and BBPLC Committee meetings. The lead audit engagement partner of KPMG also attended Committee meetings. The Board, together with the Committee, is responsible for ensuring the independence and effectiveness of the internal audit function and external auditors. The appointment and removal of the Group Chief Internal Auditor is a matter reserved to the Committee, and the appointment and removal of the external auditor is a matter reserved to the Board based on the recommendation of the Committee. Neither task is delegated to management. Role of the Committee The role of the Committee is to review and monitor, among other things: • the integrity of the Group’s financial statements and related announcements • the effectiveness of the Group’s internal controls • the independence and effectiveness of the internal and external audit processes • the Group’s relationship with the external auditor • the effectiveness of the Group’s whistleblowing procedures. The Committee’s terms of reference are available at home.barclays/who- we-are/our-governance/board- committees/ Primary activities The Committee discharged its responsibilities in 2023 through monitoring the effectiveness of the internal control environment and internal and external audit processes, as well as the integrity of financial statements and related announcements having regard to the current macroeconomic environment. Financial reporting Fair, balanced and understandable reporting (including Country- by- Country Reporting and Modern Slavery Statement) In light of the Board’s obligation under the Code, the Committee assesses external reporting to ensure it is fair, balanced and understandable. In addition to this Annual Report and associated year-end reports, the Committee also reviewed the Group’s half-year and quarterly results announcements and the presentations to analysts. The Committee informed these reviews through: • consideration of reports of the Group Disclosure Committee • direct questioning of management on the transparency and accuracy of disclosures • consideration of the results of management’s processes relating to financial reporting matters, including the output of the Group’s internal control assessments and the SOx s404 internal control processes. The Committee closely considered the Group's financial disclosures and provided feedback, including on areas where disclosures could be enhanced. Recognising the increasing focus on, and prominence of, ESG reporting, the Committee considered the governance and assurance framework for such disclosures. The Committee emphasised the importance of management continuing to review and enhance the processes and controls around the disclosures (particularly in relation to the underlying data) as the disclosure framework and expected use of the information evolves. Having evaluated all of the available information, the assurances by management and underlying processes used to prepare the published financial information, the Committee concluded and recommended to the Board that the 2023 Annual Report and Accounts are fair, balanced and understandable. Areas of focus Role of Committee / Key issues considered Conclusion/action taken Strategy Climate and sustainability report Risk review Financial review Financial statements Barclays PLC 2023 Annual Report on Form 20-F 95Governance Directors’ report: Board Audit Committee report (continued)
Significant accounting judgements Conduct provisions (refer to Note 23 to the financial statements) Barclays makes certain assumptions and estimates, analysis of which underpins provisions made for the costs of customer redress. The Committee analyses the judgements and estimates made by management to evaluate the adequacy of the provisions, including with regards to Barclays' provisioning for legacy conduct issues. The Committee reviewed and challenged management’s approach to conduct provisions throughout the year and was satisfied that management's judgement and approach resulted in an adequate and appropriate level of provision in relation to the various conduct matters. Impairment of financial instruments (refer to Note 8 to the financial statements) The Committee monitors management's judgements in relation to expected credit losses (ECLs), which are modelled using a range of forecast economic scenarios. They use forward-looking models which require judgements to be made over modelling assumptions, including: • the determination of macroeconomic scenarios to be used • the methodology for weighting of scenarios • the criteria used to determine significant deterioration in credit quality • the application of management adjustments to the ECL modelled output. As part of its monitoring, the Committee considered regular reports from management on: • the impact of the macroeconomic environment, including high interest rates, inflationary pressures and unemployment levels • model changes and model validation, and the impact of this on the use of post-model adjustments • the refresh of macroeconomic variables and associated weighting. The Committee closely considered management’s judgement on impairment coverage levels, including the impact of increasing delinquency levels in certain areas of the portfolio. Having considered and scrutinised the reports, the Committee agreed with management’s conclusion that the impairment provision was appropriate. Impairment of goodwill and intangibles (refer to Note 21 to the financial statements) The Committee considers management's judgement in relation to goodwill and intangibles. The carrying value of goodwill and intangible assets is assessed on the basis of discounted forecast future earnings. Given the significant component of earnings attributable to net interest income, such forecasts are particularly sensitive to the level of long-term interest rates and assumed levels of future lending. The period over which intangible assets are amortised appropriately reflects the useful economic life. The Committee considered management's reports on its assessment of the Group's goodwill balances and intangibles to identify any indicators of impairment, including the methodology and controls applied to the process. The Committee was satisfied with management's determination on the indicators of impairment and quantum of the impairment amount identified. Legal, competition and regulatory provisions (refer to Note 25 to the financial statements) Barclays is engaged in various legal, competition and regulatory matters which may give rise to provisioning based on the facts. The level of provisioning is subject to management judgement on the basis of legal advice and is, therefore, an area of focus for the Committee. The Committee received regular reports on the status of current legal, competition and regulatory matters and considered the impact of those matters on the Group’s provision levels. It also oversaw enhancements in the reporting to the Committee on these matters. It considered management’s judgements on the level of provision to be taken and accompanying disclosures and agreed that the level of provision at the year end was appropriate. The Committee also reviewed the disclosures made in respect of legal, competition and regulatory matters, and concluded that they provided appropriate information for investors. Valuations (refer to Notes 13 to 17 to the financial statements) Barclays exercises judgement in the valuation and disclosure of financial instruments, derivative assets and certain portfolios, particularly where quoted market prices are not available. The Committee scrutinised management's approach to valuations, including in respect of pensions and the leveraged finance portfolio. The Committee was satisfied with the accounting treatment in respect of the various matters. Tax (refer to Note 9 to the financial statements) The Committee is responsible for considering the Group's tax strategy and overseeing compliance with the Group's Tax Principles. Barclays is subject to taxation in a number of jurisdictions globally and makes judgements with regard to provisioning for tax at risk and to the recognition and measurement of deferred tax assets. The Committee: • received reports from the Global Head of Tax, including updates on the work of the Tax Management Oversight Committee • reviewed the appropriateness of provisions made for uncertain tax positions and management’s approach to the tax treatment of index-linked gilts and its impact on the Group’s effective tax rate • considered the impact of the UK Government’s implementation of the OECD’s global minimum tax rules • monitored the Group’s interactions with tax authorities and the material tax risks for the Group. The Committee approved the UK Tax Strategy statement published in the Country Snapshot report and recommended the Country Snapshot to the Board for approval. Areas of focus Role of Committee / Key issues considered Conclusion/action taken Strategy Climate and sustainability report Risk review Financial review Financial statements Barclays PLC 2023 Annual Report on Form 20-F 96Governance Directors’ report: Board Audit Committee report (continued)
Going concern and viability Going concern and long-term viability Barclays is required to assess whether it is appropriate to prepare the financial statements on a going concern basis. In accordance with the Code, Barclays must provide a statement of its viability. To support this, the Committee considers both the going concern assumption and the form and content of the Viability Statement. The Committee considered both the going concern assumption and the form and content of the Viability Statement taking into account: • the MTP and Working Capital Report • the forecast capital, liquidity and funding profiles • the results of stress tests based on internal and regulatory assumptions. The Committee recommended to the Board that the financial statements should be prepared on a going concern basis and that there were no material uncertainties that would impact the going concern statement which required disclosure. The Committee recommended the Viability Statement to the Board for approval. Distributions Distributions and return of capital to shareholders The Committee assesses the distributable reserves position in considering management’s proposals for distributions (dividends and share buy-backs) for the full year ended 31 December 2022 and for the half year ended 30 June 2023. Having regard to the distributable reserves available to the Company, the Committee reviewed and reported to the Board on proposals for (i) a dividend for the financial year ended 31 December 2022 of 5.0p per share along with a share buy-back of up to £500m; and (ii) a dividend for the half year ended 30 June 2023 of 2.7p per share along with a share buy-back of up to £750m. In early 2024, the Committee reviewed and reported to the Board on the distributable reserves position for the full year dividend for the year ended 31 December 2023 along with a proposed share buy-back. Internal controls Internal controls and business control environment (read more about Barclays' internal control and risk management processes on page 111) The Committee considers the effectiveness of the overall control environment, including the status of any significant control issues and the progress of specific remediation plans. The Committee: • considered feedback received from regulatory stakeholders on the Group’s internal control environment and management’s response • evaluated and tracked the status of the more significant control matters through regular reports from the Group Chief Controls Officer • discussed reports from heads of key businesses (including Barclays UK and BBPLC) on their control environment, together with views from the second and third lines of defence. The Committee received regular deep dive reports on the more material remediation programmes across the Group, keeping a close eye on management’s progress and delivery against key milestones, including through to closure of a programme and validation by BIA. The Committee challenged management’s approach to measuring progress and emphasised the importance of qualitative factors such as the embedment and sustainability of programmes. Whistleblowing Raising concerns The Committee considers the adequacy of the Group’s arrangements to allow colleagues to raise concerns in confidence and anonymously without fear of retaliation, and the outcomes of any substantiated case. The Committee received detailed semi-annual reports on whistleblowing from management. It monitored key whistleblowing metrics, the 'speak up' culture across the Group (and key metrics underpinning this) and any potential whistleblowing trends which might emerge. The Committee also monitored the implementation of enhancements to the whistleblowing process following the external benchmarking review conducted in 2022. Areas of focus Role of Committee / Key issues considered Conclusion/action taken Strategy Climate and sustainability report Risk review Financial review Financial statements Barclays PLC 2023 Annual Report on Form 20-F 97Governance Directors’ report: Board Audit Committee report (continued)
Internal audit Internal audit The Committee monitors and assesses the performance of BIA and delivery of the internal audit plan, including scope of work performed, the level of resources, and the methodology and coverage of the internal audit plan. Through regular reports from BIA, the Committee: • reviewed and agreed internal audit plans, methodology and deliverables for 2023, including consideration of how regulatory priorities and required regulatory coverage has been reflected in the plan • reviewed BIA's audit reports in relation to specific audits, key areas of focus and themes • tracked the levels of adverse audits and issues raised by BIA and monitored related remediation plans • received regular updates on BIA colleague matters, including colleague engagement and resourcing • discussed BIA's assessment of the control environment and management control approach in Group companies and functions. The Committee noted the independence of the BIA function, and through reviewing BIA's quality assurance updates was pleased to see the reports demonstrating the independence of BIA’s quality assurance function. The Committee considered and was comfortable with the approach by BIA to embed the UK Consumer Duty into the BIA framework. The Committee conducted a performance assessment of BIA for 2023 and concluded it was satisfied with BIA's performance against its objectives agreed with the Committee Chair at the beginning of the year. At the end of the year, the Committee approved the 2024 audit plan, detailing the number of audits to be undertaken and the focus areas. It also approved BIA's Audit Charter following the annual review. External audit External audit The Committee monitors the work and performance of KPMG. The Committee: • met with key members of the KPMG audit team to discuss the 2023 audit plan and KPMG’s areas of focus • approved the 2023 audit plan and the main areas of focus for the year • assessed regular reports from KPMG on the progress of the 2023 audit and any material accounting and control issues identified • discussed KPMG’s draft reports on control areas of focus and the control environment ahead of the 2023 year end • approved the terms of the audit engagement letter and associated fees for 2023, on behalf of the Board. The Committee sought KPMG's views on a number of specific matters, including management's approach to critical accounting judgements and estimates, and sought to understand where KPMG had challenged management's assessment prior to reaching a conclusion. This included considering KPMG challenge in relation to key controls matters and the approach to disclosures in the Group's full year, half-year and interim financial results. The Committee considered KPMG’s response to the PRA Written Auditor Reporting for 2022, and discussed with KPMG the questions in scope for the 2023 Written Auditor Reporting. Areas of focus Role of Committee / Key issues considered Conclusion/action taken Strategy Climate and sustainability report Risk review Financial review Financial statements Barclays PLC 2023 Annual Report on Form 20-F 98Governance Directors’ report: Board Audit Committee report (continued)
External auditor Following an external audit tender in 2015, KPMG was appointed as Barclays’ statutory auditor with effect from the 2017 financial year. Stuart Crisp, Barclays’ lead audit engagement partner, has been in the role since 2022 and attends all meetings of the Committee. Assessing external auditor effectiveness, objectivity and independence and non-audit services The Committee is responsible for assessing the effectiveness, objectivity and independence of the Group’s statutory auditor. This responsibility was discharged by the Committee throughout the year at formal meetings, during private meetings with KPMG and through discussions with key Group executives. In particular, the Committee assessed KPMG’s effectiveness, objectivity and independence in the following ways: Throughout the year • Met with senior members of the KPMG audit team from the UK, Ireland and US to discuss the approach to the 2023 audit. • Reviewed regular reports from management on the non- audit services provided by KPMG to Barclays. • Reviewed regular reports from management detailing any employees or workers hired from KPMG. • Discussed with KPMG their consideration of internal controls over financial reporting. • Considered areas in which KPMG had challenged management’s assumptions in areas of key judgement. • Assessed any potential threats to independence that were self-identified and reported by KPMG, all of which were regarded by the Committee as being adequately addressed. Annual assessment, audit quality and external findings • The Group undertakes an annual formal assessment of KPMG’s performance, independence and objectivity. The assessment for 2023 was conducted in early 2024, by way of a questionnaire completed by key stakeholders across the Group who have regular interaction with KPMG. The questionnaire was designed to evaluate KPMG’s audit process, its effectiveness and overall output. • Consistent with previous years, in 2023 KPMG nominated a senior partner of the audit team to have specific responsibility for ensuring audit quality. The Committee received reports from him during the year on his assessment of audit quality. • The findings of the FRC’s Audit Quality Report on KPMG published in July 2023, including its inspection of the Barclays audit for the year ended 31 December 2021, provided further comfort to the Committee on the quality and effectiveness of KPMG’s audit, acknowledging that there remains areas for improvement. Outcome Taking into account the result of all of the above, the Committee considered that KPMG maintained its independence and objectivity, exercised robust challenge and demonstrated professional scepticism in the audit process. The Committee was therefore satisfied that the audit process was effective. Non-audit services In order to safeguard the auditor’s independence and objectivity, Barclays has in place the Group Policy on the Provision of Services by the Group Statutory Auditor (the Policy) setting out the circumstances in which the auditor may be engaged to provide non-audit services. The Policy applies to all Barclays subsidiaries and other material entities over which Barclays has significant influence. The core principle of the Policy is that non-audit services (other than those legally required to be carried out by the Group’s auditor) should be performed by the auditor only in certain controlled circumstances. A summary of the Policy can be found at home.barclays/ who-we-are/our-governance/auditor- independence/. The Policy sets out the type of services that the auditor is permitted to carry out and pre-approves certain of these services provided the fee is below a certain threshold, except for specific categories of permitted services that require explicit Committee approval. All other permitted services must be approved in advance by the Committee. The Policy requires that all proposed work must be sponsored by a senior executive who is not involved in any work to which the proposed engagement relates. The audit assignment partner must also confirm that the engagement has been approved in accordance with the auditor’s own internal ethical standards and does not pose any threat to the auditor’s independence or objectivity. The Policy is reviewed by the Committee on an annual basis to ensure that it is fit for purpose and that it reflects applicable rules and guidelines. The Policy is aligned with both the FRC’s requirements and KPMG’s own internal policy on non-audit services for FTSE 350 companies, which broadly restricts non-audit work to services that are ‘closely related’ to the audit. In early 2023, KPMG advised the Committee that, following on from an event notified to the Committee in late 2022, a further instance had been identified of a KPMG member firm having provided services in connection with the preparation of local statutory accounts of a small overseas subsidiary not in scope for the Group audit. KPMG assured the Committee, having made appropriate enquiries of their member firms providing services to the Group, that these were isolated instances. In these circumstances, the Committee agreed with KPMG’s assessment that this had not impaired their integrity or objectivity. In view of the events notified by KPMG, the Committee reviewed the Policy in early 2023 to determine whether any revisions were required to ensure such events did not arise again. While it was determined that the Policy provided sufficiently clear guidance in terms of prohibited non-audit service work, certain enhancements were made to the Policy to further support the operation of the Policy including by specifying examples of the type of work prohibited under each headline service. Strategy Climate and sustainability report Risk review Financial review Financial statements Barclays PLC 2023 Annual Report on Form 20-F 99Governance Directors’ report: Board Audit Committee report (continued)
The fees payable to KPMG for the year ended 31 December 2023 amounted to £78m (2022: £71m), of which £14m (2022: £13m) was payable in respect of non-audit services. A breakdown of the fees payable to the auditor for statutory audit and non- audit work can be found in Note 39 of the financial statements. Of the £14m of non- audit services provided by KPMG during 2023, the significant categories of engagement, i.e. services where the fees amounted to more than £500,000, included: • audit-related services: services in connection with CASS (Client Assets Sourcebook) audits • other services in connection with regulatory, compliance and internal control reports and specific audit procedures, required by law or regulation to be provided by the statutory auditor • other attestation and assurance services, such as ongoing attestation and assurance services for treasury and capital markets transactions to meet regulatory requirements, including regular reporting obligations and verification reports. The Statutory Audit Services for Large Companies Market Investigation (Mandatory Use of Competitive Tender Processes and Audit Committee Responsibilities) Order 2014 An external audit tender was conducted in 2015 and the decision was made to appoint KPMG as Barclays’ external auditor with effect from the 2017 financial year. Barclays is in compliance with the requirements of The Statutory Audit Services for Large Companies Market Investigation (Mandatory Use of Competitive Tender Processes and Audit Committee Responsibilities) Order 2014, which relates to the frequency and governance of tenders for the appointment of the external auditor and the setting of a policy on the provision of non-audit services. As explained in previous Committee reports, provided that KPMG continues to maintain its independence and objectivity, and the Committee remains satisfied with its performance, the Board does not intend to tender for an alternative external auditor to be appointed before the end of the current required period of 10 years. Accordingly, any tender is expected to be in respect of the 2027 financial year onwards and is likely to take place in 2025. The Committee has reconfirmed that it would not be appropriate to tender before this date. The Committee observed that there has been significant rotation of the senior members of the audit team since 2017 and more recent changes in certain members of the Barclays senior finance team, both of which have reduced any potential familiarisation threat. Strategy Climate and sustainability report Risk review Financial review Financial statements Barclays PLC 2023 Annual Report on Form 20-F 100Governance Directors’ report: Board Audit Committee report (continued)
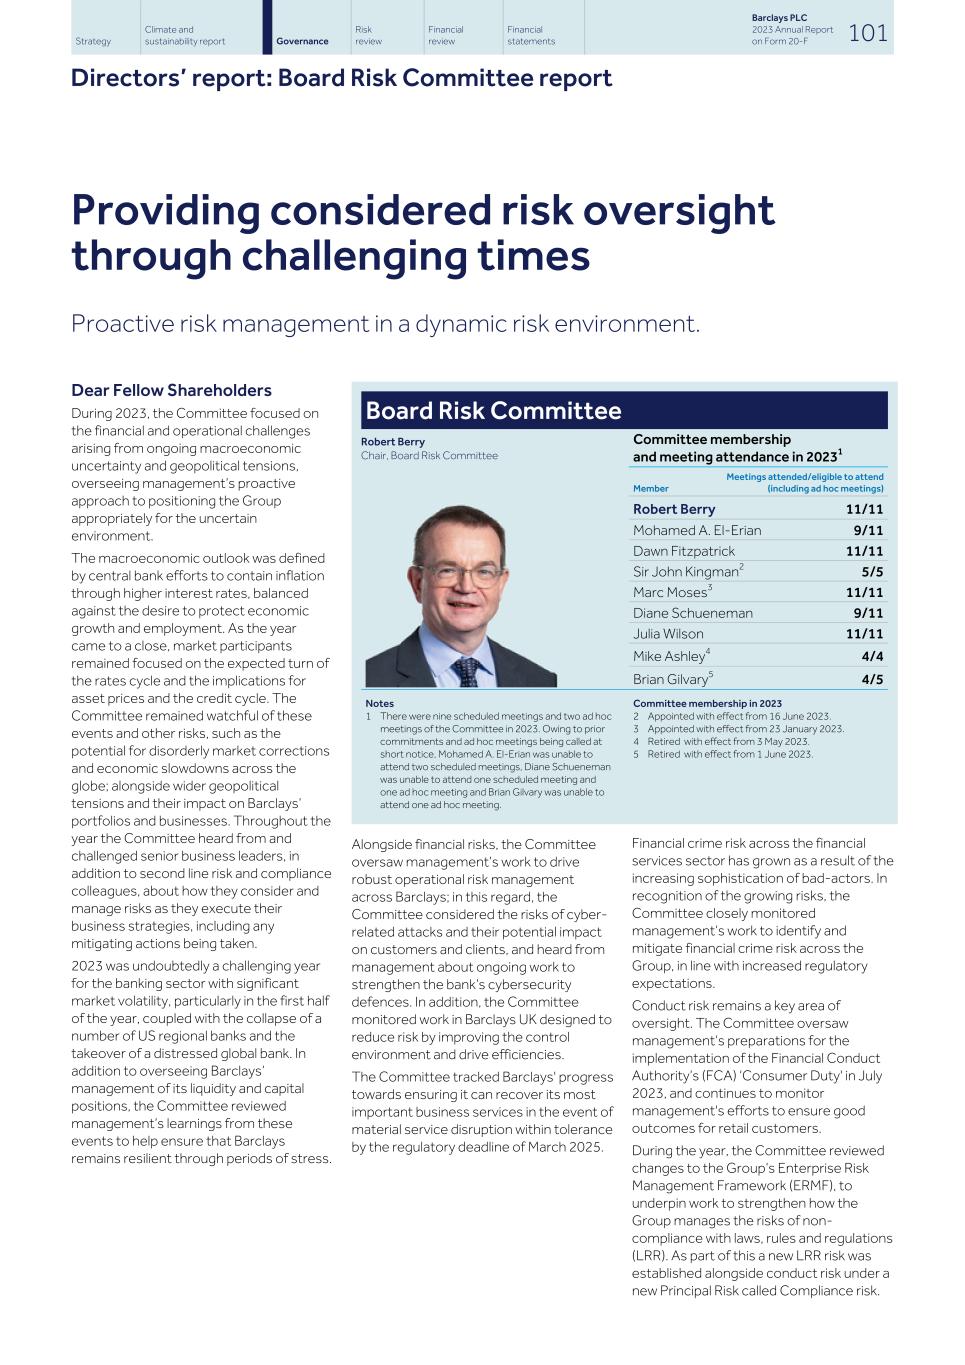
Providing considered risk oversight through challenging times Proactive risk management in a dynamic risk environment. Dear Fellow Shareholders During 2023, the Committee focused on the financial and operational challenges arising from ongoing macroeconomic uncertainty and geopolitical tensions, overseeing management’s proactive approach to positioning the Group appropriately for the uncertain environment. The macroeconomic outlook was defined by central bank efforts to contain inflation through higher interest rates, balanced against the desire to protect economic growth and employment. As the year came to a close, market participants remained focused on the expected turn of the rates cycle and the implications for asset prices and the credit cycle. The Committee remained watchful of these events and other risks, such as the potential for disorderly market corrections and economic slowdowns across the globe; alongside wider geopolitical tensions and their impact on Barclays’ portfolios and businesses. Throughout the year the Committee heard from and challenged senior business leaders, in addition to second line risk and compliance colleagues, about how they consider and manage risks as they execute their business strategies, including any mitigating actions being taken. 2023 was undoubtedly a challenging year for the banking sector with significant market volatility, particularly in the first half of the year, coupled with the collapse of a number of US regional banks and the takeover of a distressed global bank. In addition to overseeing Barclays’ management of its liquidity and capital positions, the Committee reviewed management’s learnings from these events to help ensure that Barclays remains resilient through periods of stress. Board Risk Committee Robert Berry Chair, Board Risk Committee Committee membership and meeting attendance in 20231 Member Meetings attended/eligible to attend (including ad hoc meetings) Robert Berry 11/11 Mohamed A. El-Erian 9/11 Dawn Fitzpatrick 11/11 Sir John Kingman2 5/5 Marc Moses3 11/11 Diane Schueneman 9/11 Julia Wilson 11/11 Mike Ashley4 4/4 Brian Gilvary5 4/5 Notes 1 There were nine scheduled meetings and two ad hoc meetings of the Committee in 2023. Owing to prior commitments and ad hoc meetings being called at short notice, Mohamed A. El-Erian was unable to attend two scheduled meetings, Diane Schueneman was unable to attend one scheduled meeting and one ad hoc meeting and Brian Gilvary was unable to attend one ad hoc meeting. Committee membership in 2023 2 Appointed with effect from 16 June 2023. 3 Appointed with effect from 23 January 2023. 4 Retired with effect from 3 May 2023. 5 Retired with effect from 1 June 2023. Notes Alongside financial risks, the Committee oversaw management’s work to drive robust operational risk management across Barclays; in this regard, the Committee considered the risks of cyber- related attacks and their potential impact on customers and clients, and heard from management about ongoing work to strengthen the bank’s cybersecurity defences. In addition, the Committee monitored work in Barclays UK designed to reduce risk by improving the control environment and drive efficiencies. The Committee tracked Barclays' progress towards ensuring it can recover its most important business services in the event of material service disruption within tolerance by the regulatory deadline of March 2025. Financial crime risk across the financial services sector has grown as a result of the increasing sophistication of bad-actors. In recognition of the growing risks, the Committee closely monitored management’s work to identify and mitigate financial crime risk across the Group, in line with increased regulatory expectations. Conduct risk remains a key area of oversight. The Committee oversaw management’s preparations for the implementation of the Financial Conduct Authority’s (FCA) ‘Consumer Duty' in July 2023, and continues to monitor management's efforts to ensure good outcomes for retail customers. During the year, the Committee reviewed changes to the Group’s Enterprise Risk Management Framework (ERMF), to underpin work to strengthen how the Group manages the risks of non- compliance with laws, rules and regulations (LRR). As part of this a new LRR risk was established alongside conduct risk under a new Principal Risk called Compliance risk. Strategy Climate and sustainability report Risk review Financial review Financial statements Barclays PLC 2023 Annual Report on Form 20-F 101Governance Directors’ report: Board Risk Committee report
The Committee continued to oversee how climate change is driving financial and operational risks, the materiality of their impact and how Barclays is managing them through the Climate Principal Risk Framework. The Committee received updates on the Bank’s ongoing advancements to its climate risk management approach, including the development of a risk appetite, monitored through a range of quantitative metrics. The Committee also heard from senior business leaders about how climate risks are being integrated into their business strategies and plans. The Committee approved the results of the 2023 internal climate stress test (CST) and considered lessons learned that will enable Barclays to better assess specific climate vulnerabilities as well as the impact that climate factors can have on the financial stresses used to calibrate overall risk appetite. The Committee will continue to maintain close oversight of the annual CST as it is further integrated into the Group’s planning and stress testing framework. As part of its work overseeing climate risk, the Committee worked closely with the Board Audit Committee and Board Sustainability Committee, ensuring a streamlined view of matters of relevance across the Committees. The Group uses models and data to support a broad range of business decisions and risk management activities across the Group. This is an area impacted by rapid technological change and increasing regulatory scrutiny and the Committee continued to focus on the Bank’s approach to managing the associated risks, including its approach to developing and validating models, and monitoring of their performance through a volatile macro environment. The volume of regulatory change across the global financial services industry is significant. The Committee heard from management about the impact of these changes for Barclays and the work necessary to ensure compliance. This is an area to which the Committee expects to devote attention in 2024 and beyond. By way of a final word, in 2023, the Committee oversaw a change to the senior management of the Compliance function, with the appointment of a new Group Chief Compliance Officer, Kirsty Everett, who took up the role in July 2023. In 2023 we also welcomed both Marc Moses and Sir John Kingman (Chair of Barclays UK) to the Committee, both of whom bring with them a deep knowledge of financial services. Committee effectiveness The results of the Committee effectiveness review for 2023 confirm the Committee is operating effectively; it is considered well constituted and chaired, providing an effective and appropriate level of challenge and oversight of the areas within its remit. Feedback noted members’ wide and diverse skills and experience, recognising that recent additions to Committee composition had been positive in providing the Committee with a deeper retail perspective. Feedback indicates that the Committee is considered to operate at the right level of debate. It also confirms that the allocation of time between agenda items in meetings is appropriate, with sufficient time for discussion and challenge. The Committee’s interaction with the Board, Board Committees and senior management is also considered effective, noting that sufficient time is allocated at Board meetings for the Chair to report to the Board on the work of the Committee. Feedback indicated that concurrent meetings of the BPLC and BBPLC Board Risk Committee continue to be effective, with coverage of BBPLC matters within concurrent meetings considered appropriate. Interaction with the BBUKPLC Board Risk Committee was also considered effective, confirming that the Committee continues to exercise appropriate oversight of issues relevant to the Committee’s remit relating to BBUKPLC. Please see the report of the Board Nominations Committee for further details on the process for conducting the 2023 Committee effectiveness review. Looking ahead The Committee actively encourages management to be alert to areas of emerging risk, particularly in light of the rapidly evolving macroeconomic, geopolitical and technological environments. As we move into 2024, geopolitical tensions, macroeconomic uncertainty and inflationary pressures are expected to continue, with further uncertainty on the horizon in light of the upcoming election cycles in many of our key markets, including the US and UK. The Committee will continue to work with management to anticipate, stress test and prepare for periods of volatility to prevent outsized or unexpected losses materialising and to manage emerging risks as they arise. Robert Berry Chair, Board Risk Committee 19 February 2024 Strategy Climate and sustainability report Risk review Financial review Financial statements Barclays PLC 2023 Annual Report on Form 20-F 102Governance Directors’ report: Board Risk Committee report (continued)
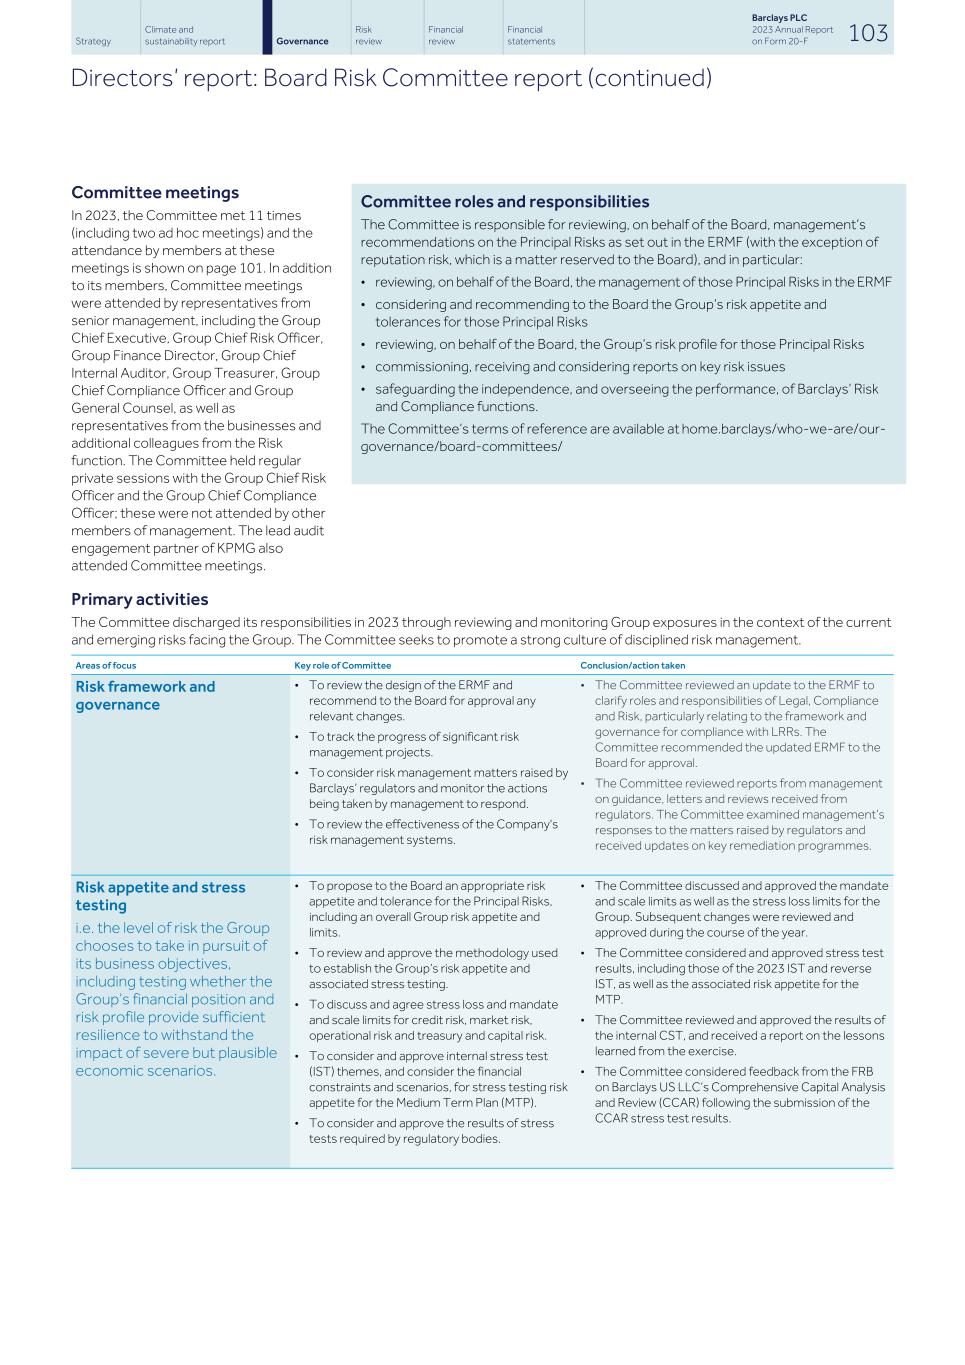
Committee meetings In 2023, the Committee met 11 times (including two ad hoc meetings) and the attendance by members at these meetings is shown on page 101. In addition to its members, Committee meetings were attended by representatives from senior management, including the Group Chief Executive, Group Chief Risk Officer, Group Finance Director, Group Chief Internal Auditor, Group Treasurer, Group Chief Compliance Officer and Group General Counsel, as well as representatives from the businesses and additional colleagues from the Risk function. The Committee held regular private sessions with the Group Chief Risk Officer and the Group Chief Compliance Officer; these were not attended by other members of management. The lead audit engagement partner of KPMG also attended Committee meetings. Committee roles and responsibilities The Committee is responsible for reviewing, on behalf of the Board, management’s recommendations on the Principal Risks as set out in the ERMF (with the exception of reputation risk, which is a matter reserved to the Board), and in particular: • reviewing, on behalf of the Board, the management of those Principal Risks in the ERMF • considering and recommending to the Board the Group’s risk appetite and tolerances for those Principal Risks • reviewing, on behalf of the Board, the Group’s risk profile for those Principal Risks • commissioning, receiving and considering reports on key risk issues • safeguarding the independence, and overseeing the performance, of Barclays’ Risk and Compliance functions. The Committee’s terms of reference are available at home.barclays/who-we-are/our- governance/board-committees/ Primary activities The Committee discharged its responsibilities in 2023 through reviewing and monitoring Group exposures in the context of the current and emerging risks facing the Group. The Committee seeks to promote a strong culture of disciplined risk management. Risk framework and governance • To review the design of the ERMF and recommend to the Board for approval any relevant changes. • To track the progress of significant risk management projects. • To consider risk management matters raised by Barclays’ regulators and monitor the actions being taken by management to respond. • To review the effectiveness of the Company's risk management systems. • The Committee reviewed an update to the ERMF to clarify roles and responsibilities of Legal, Compliance and Risk, particularly relating to the framework and governance for compliance with LRRs. The Committee recommended the updated ERMF to the Board for approval. • The Committee reviewed reports from management on guidance, letters and reviews received from regulators. The Committee examined management’s responses to the matters raised by regulators and received updates on key remediation programmes. Risk appetite and stress testing i.e. the level of risk the Group chooses to take in pursuit of its business objectives, including testing whether the Group’s financial position and risk profile provide sufficient resilience to withstand the impact of severe but plausible economic scenarios. • To propose to the Board an appropriate risk appetite and tolerance for the Principal Risks, including an overall Group risk appetite and limits. • To review and approve the methodology used to establish the Group’s risk appetite and associated stress testing. • To discuss and agree stress loss and mandate and scale limits for credit risk, market risk, operational risk and treasury and capital risk. • To consider and approve internal stress test (IST) themes, and consider the financial constraints and scenarios, for stress testing risk appetite for the Medium Term Plan (MTP). • To consider and approve the results of stress tests required by regulatory bodies. • The Committee discussed and approved the mandate and scale limits as well as the stress loss limits for the Group. Subsequent changes were reviewed and approved during the course of the year. • The Committee considered and approved stress test results, including those of the 2023 IST and reverse IST, as well as the associated risk appetite for the MTP. • The Committee reviewed and approved the results of the internal CST, and received a report on the lessons learned from the exercise. • The Committee considered feedback from the FRB on Barclays US LLC’s Comprehensive Capital Analysis and Review (CCAR) following the submission of the CCAR stress test results. Areas of focus Key role of Committee Conclusion/action taken Strategy Climate and sustainability report Risk review Financial review Financial statements Barclays PLC 2023 Annual Report on Form 20-F 103Governance Directors’ report: Board Risk Committee report (continued)
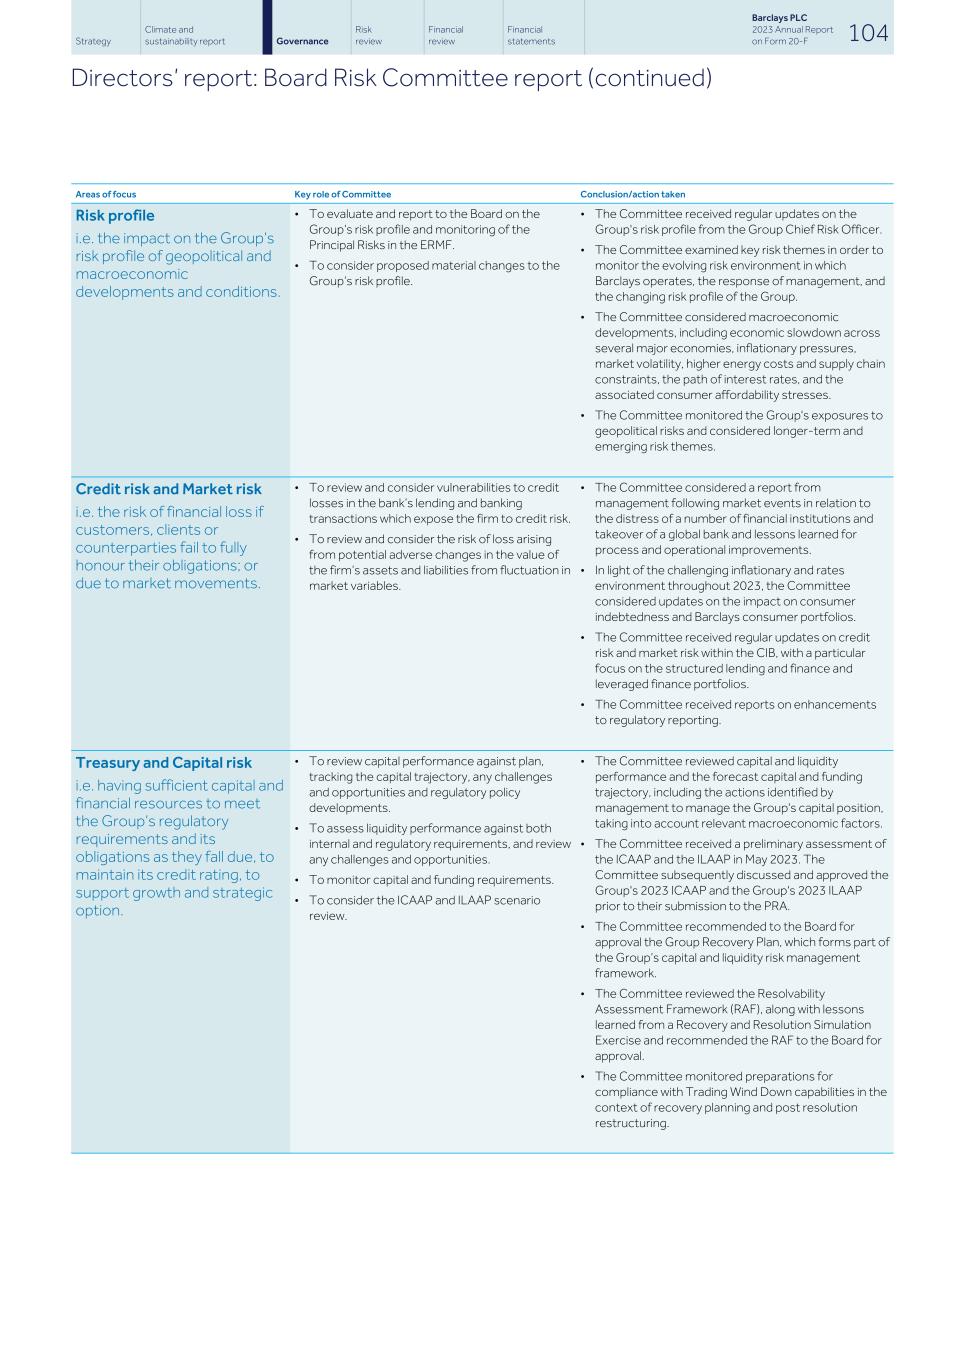
Risk profile i.e. the impact on the Group’s risk profile of geopolitical and macroeconomic developments and conditions. • To evaluate and report to the Board on the Group’s risk profile and monitoring of the Principal Risks in the ERMF. • To consider proposed material changes to the Group’s risk profile. • The Committee received regular updates on the Group's risk profile from the Group Chief Risk Officer. • The Committee examined key risk themes in order to monitor the evolving risk environment in which Barclays operates, the response of management, and the changing risk profile of the Group. • The Committee considered macroeconomic developments, including economic slowdown across several major economies, inflationary pressures, market volatility, higher energy costs and supply chain constraints, the path of interest rates, and the associated consumer affordability stresses. • The Committee monitored the Group's exposures to geopolitical risks and considered longer-term and emerging risk themes. Credit risk and Market risk i.e. the risk of financial loss if customers, clients or counterparties fail to fully honour their obligations; or due to market movements. • To review and consider vulnerabilities to credit losses in the bank’s lending and banking transactions which expose the firm to credit risk. • To review and consider the risk of loss arising from potential adverse changes in the value of the firm’s assets and liabilities from fluctuation in market variables. • The Committee considered a report from management following market events in relation to the distress of a number of financial institutions and takeover of a global bank and lessons learned for process and operational improvements. • In light of the challenging inflationary and rates environment throughout 2023, the Committee considered updates on the impact on consumer indebtedness and Barclays consumer portfolios. • The Committee received regular updates on credit risk and market risk within the CIB, with a particular focus on the structured lending and finance and leveraged finance portfolios. • The Committee received reports on enhancements to regulatory reporting. Treasury and Capital risk i.e. having sufficient capital and financial resources to meet the Group’s regulatory requirements and its obligations as they fall due, to maintain its credit rating, to support growth and strategic option. • To review capital performance against plan, tracking the capital trajectory, any challenges and opportunities and regulatory policy developments. • To assess liquidity performance against both internal and regulatory requirements, and review any challenges and opportunities. • To monitor capital and funding requirements. • To consider the ICAAP and ILAAP scenario review. • The Committee reviewed capital and liquidity performance and the forecast capital and funding trajectory, including the actions identified by management to manage the Group's capital position, taking into account relevant macroeconomic factors. • The Committee received a preliminary assessment of the ICAAP and the ILAAP in May 2023. The Committee subsequently discussed and approved the Group's 2023 ICAAP and the Group's 2023 ILAAP prior to their submission to the PRA. • The Committee recommended to the Board for approval the Group Recovery Plan, which forms part of the Group’s capital and liquidity risk management framework. • The Committee reviewed the Resolvability Assessment Framework (RAF), along with lessons learned from a Recovery and Resolution Simulation Exercise and recommended the RAF to the Board for approval. • The Committee monitored preparations for compliance with Trading Wind Down capabilities in the context of recovery planning and post resolution restructuring. Areas of focus Key role of Committee Conclusion/action taken Strategy Climate and sustainability report Risk review Financial review Financial statements Barclays PLC 2023 Annual Report on Form 20-F 104Governance Directors’ report: Board Risk Committee report (continued)
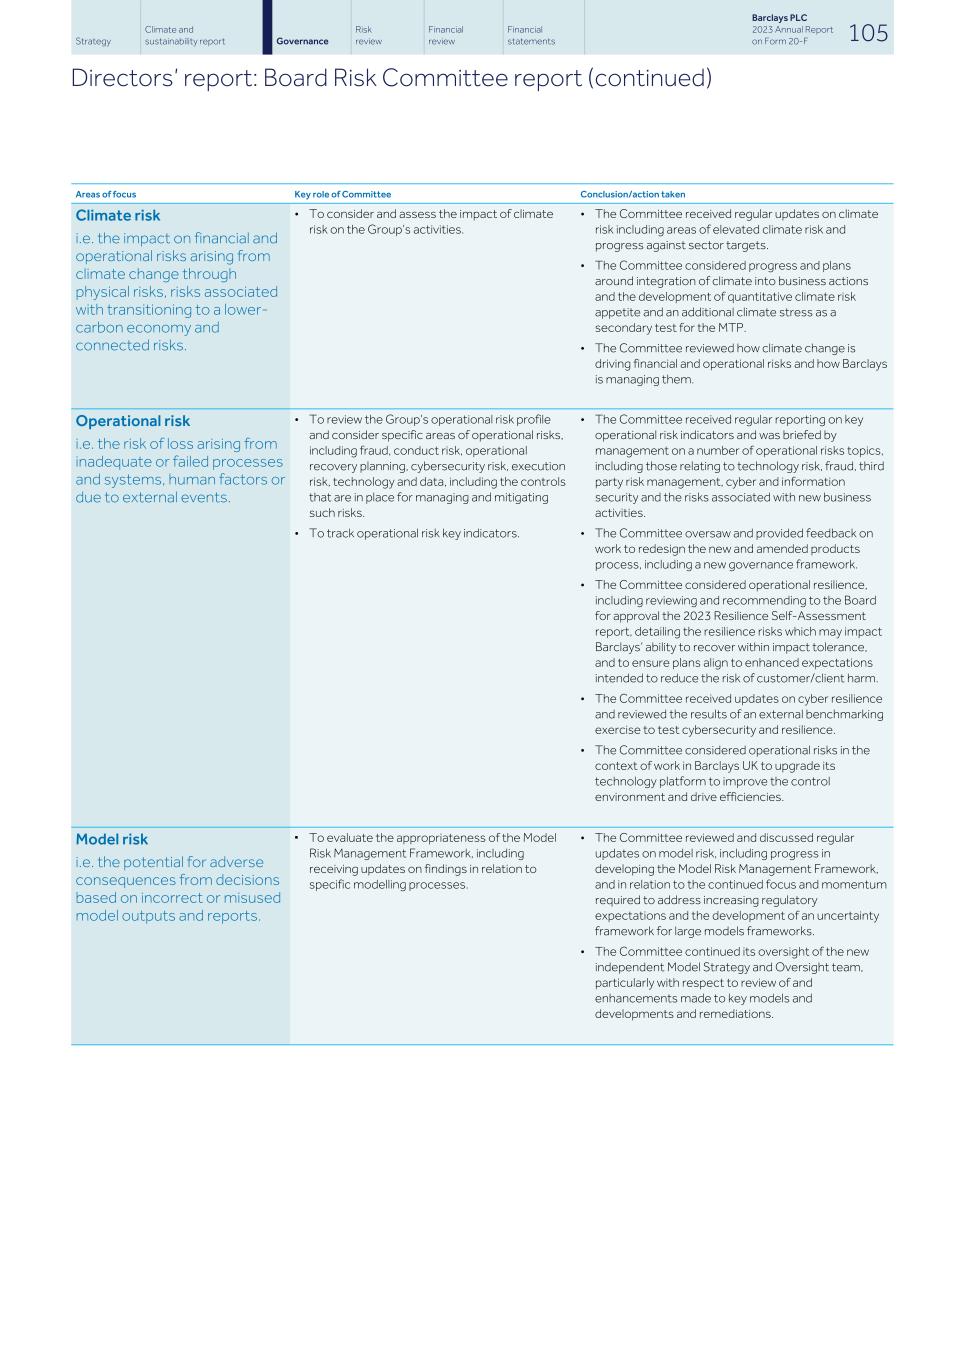
Climate risk i.e. the impact on financial and operational risks arising from climate change through physical risks, risks associated with transitioning to a lower- carbon economy and connected risks. • To consider and assess the impact of climate risk on the Group’s activities. • The Committee received regular updates on climate risk including areas of elevated climate risk and progress against sector targets. • The Committee considered progress and plans around integration of climate into business actions and the development of quantitative climate risk appetite and an additional climate stress as a secondary test for the MTP. • The Committee reviewed how climate change is driving financial and operational risks and how Barclays is managing them. Operational risk i.e. the risk of loss arising from inadequate or failed processes and systems, human factors or due to external events. • To review the Group’s operational risk profile and consider specific areas of operational risks, including fraud, conduct risk, operational recovery planning, cybersecurity risk, execution risk, technology and data, including the controls that are in place for managing and mitigating such risks. • To track operational risk key indicators. • The Committee received regular reporting on key operational risk indicators and was briefed by management on a number of operational risks topics, including those relating to technology risk, fraud, third party risk management, cyber and information security and the risks associated with new business activities. • The Committee oversaw and provided feedback on work to redesign the new and amended products process, including a new governance framework. • The Committee considered operational resilience, including reviewing and recommending to the Board for approval the 2023 Resilience Self-Assessment report, detailing the resilience risks which may impact Barclays’ ability to recover within impact tolerance, and to ensure plans align to enhanced expectations intended to reduce the risk of customer/client harm. • The Committee received updates on cyber resilience and reviewed the results of an external benchmarking exercise to test cybersecurity and resilience. • The Committee considered operational risks in the context of work in Barclays UK to upgrade its technology platform to improve the control environment and drive efficiencies. Model risk i.e. the potential for adverse consequences from decisions based on incorrect or misused model outputs and reports. ▪ To evaluate the appropriateness of the Model Risk Management Framework, including receiving updates on findings in relation to specific modelling processes. • The Committee reviewed and discussed regular updates on model risk, including progress in developing the Model Risk Management Framework, and in relation to the continued focus and momentum required to address increasing regulatory expectations and the development of an uncertainty framework for large models frameworks. • The Committee continued its oversight of the new independent Model Strategy and Oversight team, particularly with respect to review of and enhancements made to key models and developments and remediations. Areas of focus Key role of Committee Conclusion/action taken Strategy Climate and sustainability report Risk review Financial review Financial statements Barclays PLC 2023 Annual Report on Form 20-F 105Governance Directors’ report: Board Risk Committee report (continued)
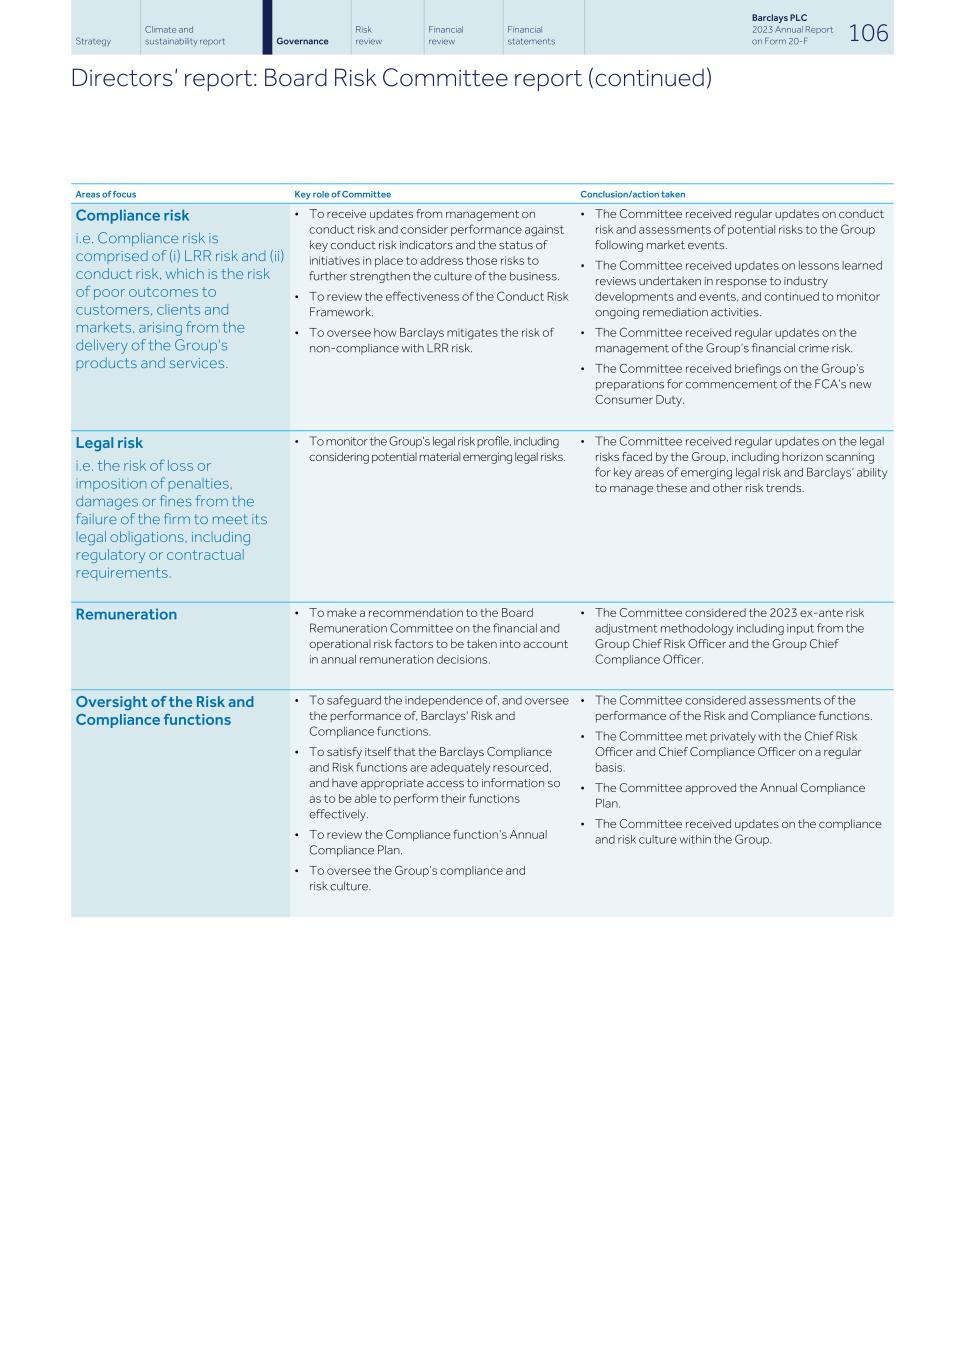
Compliance risk i.e. Compliance risk is comprised of (i) LRR risk and (ii) conduct risk, which is the risk of poor outcomes to customers, clients and markets, arising from the delivery of the Group's products and services. • To receive updates from management on conduct risk and consider performance against key conduct risk indicators and the status of initiatives in place to address those risks to further strengthen the culture of the business. • To review the effectiveness of the Conduct Risk Framework. • To oversee how Barclays mitigates the risk of non-compliance with LRR risk. • The Committee received regular updates on conduct risk and assessments of potential risks to the Group following market events. • The Committee received updates on lessons learned reviews undertaken in response to industry developments and events, and continued to monitor ongoing remediation activities. • The Committee received regular updates on the management of the Group’s financial crime risk. • The Committee received briefings on the Group’s preparations for commencement of the FCA’s new Consumer Duty. Legal risk i.e. the risk of loss or imposition of penalties, damages or fines from the failure of the firm to meet its legal obligations, including regulatory or contractual requirements. • To monitor the Group’s legal risk profile, including considering potential material emerging legal risks. • The Committee received regular updates on the legal risks faced by the Group, including horizon scanning for key areas of emerging legal risk and Barclays’ ability to manage these and other risk trends. Remuneration • To make a recommendation to the Board Remuneration Committee on the financial and operational risk factors to be taken into account in annual remuneration decisions. • The Committee considered the 2023 ex-ante risk adjustment methodology including input from the Group Chief Risk Officer and the Group Chief Compliance Officer. Oversight of the Risk and Compliance functions • To safeguard the independence of, and oversee the performance of, Barclays' Risk and Compliance functions. • To satisfy itself that the Barclays Compliance and Risk functions are adequately resourced, and have appropriate access to information so as to be able to perform their functions effectively. • To review the Compliance function’s Annual Compliance Plan. • To oversee the Group’s compliance and risk culture. • The Committee considered assessments of the performance of the Risk and Compliance functions. • The Committee met privately with the Chief Risk Officer and Chief Compliance Officer on a regular basis. • The Committee approved the Annual Compliance Plan. • The Committee received updates on the compliance and risk culture within the Group. Areas of focus Key role of Committee Conclusion/action taken Strategy Climate and sustainability report Risk review Financial review Financial statements Barclays PLC 2023 Annual Report on Form 20-F 106Governance Directors’ report: Board Risk Committee report (continued)
Driving forward our net zero ambition Overseeing our climate and sustainability strategy. Dear Fellow Shareholders I am delighted to present to you the first report of the Board Sustainability Committee. In March 2020, Barclays announced its ambition to be a net zero bank by 2050, becoming one of the first banks to do so. In 2023, we continued to pursue opportunities and support our clients as they transition their businesses to a low- carbon economy. When I wrote to you ahead of our 2023 AGM, I highlighted that a key commitment for Barclays over the subsequent 12 months was to help finance this transition and in December 2022 we announced a new target to facilitate $1trn of Sustainable and Transition Financing between 2023 and 2030, and increased our investment mandate to £500m of capital to invest in early-stage climate-tech companies by the end of 2027. Today we are reporting $67.8bn financing facilitated towards the $1trn Sustainable and Transition Financing target and £138m invested since March 2020 in 21 climate-tech companies. A second key priority was to assess baseline emissions for the four remaining high-emitting sectors in our portfolio, as well as developing a high-level modelled assessment of our overall balance sheet, consistent with the approach outlined by the Partnership for Carbon Accounting Financials (PCAF). We have announced new targets for Aviation, Commercial Real Estate and Agriculture, and published our first high-level modelled assessment under PCAF. We have also published our updated Climate Change Statement which includes new restrictions on oil and gas financing. In particular, we will stop directly financing new oil and gas projects, and have set clear expectations for our energy clients to produce transition or decarbonisation plans and set near-term targets to reduce emissions. The final key priority was to refine our Client Transition Framework so as to improve our ability to work with clients in high-emitting sectors on their individual transition plans. This will allow us to measure and monitor our clients’ decarbonisation progress and assess the implications for our targets, and to offer more tailored support to clients’ transition requirements. Board Sustainability Committee Nigel Higgins Chair, Board Sustainability Committee Committee membership and meeting attendance in 20231 Member Meetings attended/eligible to attend Nigel Higgins 4/4 Robert Berry 4/4 Dawn Fitzpatrick 3/4 Mary Francis 4/4 Brian Gilvary 2/4 C.S. Venkatakrishnan 4/4 Julia Wilson 4/4 Note 1 There were four scheduled Committee meetings held in 2023. Owing to prior commitments, Brian Gilvary was unable to attend two meetings and Dawn Fitzpatrick was unable to attend one meeting. The Board has direct oversight of and responsibility for the Group’s climate and sustainability strategy. However, given the importance of this work and the growing importance of other sustainability areas, including nature and biodiversity, in March 2023 the Board approved the establishment of a new Board Sustainability Committee to support and advise the Board in its oversight of climate and sustainability matters. The Committee receives presentations into the challenges and opportunities in this area (including external input on specific areas of focus), undertakes detailed reviews and discussions and makes recommendations to the Board on key topics. The table on page 109 provides an overview of the Committee’s work in 2023 supporting the Board in overseeing the activities to meet our climate priorities. In addition to myself, the members of the Committee are Robert Berry, Dawn Fitzpatrick, Mary Francis, Brian Gilvary, C.S. Venkatakrishnan and Julia Wilson. Tracy Corrigan also attends Committee meetings as a non-executive representative of the BBUKPLC Board. As an Executive member of the Committee, our Group Chief Executive brings invaluable climate and sustainability insight to the Committee’s discussions, including the views of key external stakeholders. He is also a member of the UNEP FI Leadership Council and a member of the CNBC ESG Council, and through those roles he is able to bring external perspectives of key climate/sustainability matters to the Committee’s discussions. Having cross-membership on the Committee with the Chairs of our Board Audit, Remuneration and Risk Committees, as well as connectivity with the BBUKPLC Board, helps to ensure a streamlined approach to Board-level oversight of all climate and sustainability related matters. Committee effectiveness The results of the Committee effectiveness review for 2023 confirm the Committee is operating effectively. It is considered well constituted and chaired, providing high-quality oversight and constructive challenge to management in the areas within its remit. The review highlights that the Committee is considered to have the right level of skills and experience, including climate/ sustainability expertise, and is of an appropriate size. The review noted the benefits of having cross-membership between the Committee and the Board Risk Committee and the Board Audit Committee, and having the Group Chief Executive as a member of the Committee in the context of the development of Barclays’ climate strategy as well as the skills and experience he brings to the Committee. Strategy Climate and sustainability report Risk review Financial review Financial statements Barclays PLC 2023 Annual Report on Form 20-F 107Governance Directors’ report: Board Sustainability Committee report
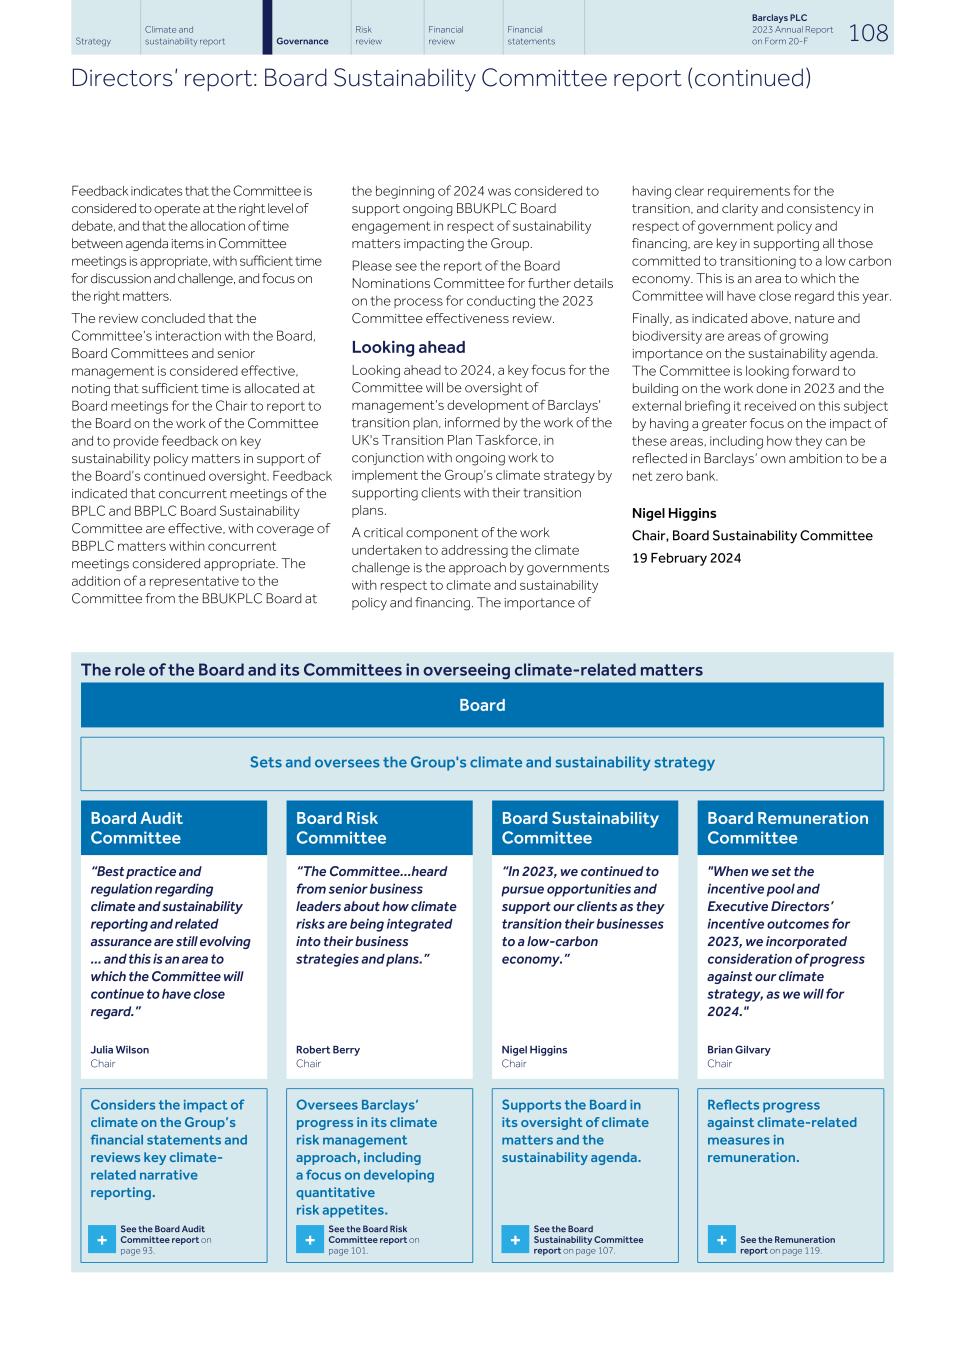
Feedback indicates that the Committee is considered to operate at the right level of debate, and that the allocation of time between agenda items in Committee meetings is appropriate, with sufficient time for discussion and challenge, and focus on the right matters. The review concluded that the Committee’s interaction with the Board, Board Committees and senior management is considered effective, noting that sufficient time is allocated at Board meetings for the Chair to report to the Board on the work of the Committee and to provide feedback on key sustainability policy matters in support of the Board’s continued oversight. Feedback indicated that concurrent meetings of the BPLC and BBPLC Board Sustainability Committee are effective, with coverage of BBPLC matters within concurrent meetings considered appropriate. The addition of a representative to the Committee from the BBUKPLC Board at the beginning of 2024 was considered to support ongoing BBUKPLC Board engagement in respect of sustainability matters impacting the Group. Please see the report of the Board Nominations Committee for further details on the process for conducting the 2023 Committee effectiveness review. Looking ahead Looking ahead to 2024, a key focus for the Committee will be oversight of management’s development of Barclays' transition plan, informed by the work of the UK's Transition Plan Taskforce, in conjunction with ongoing work to implement the Group’s climate strategy by supporting clients with their transition plans. A critical component of the work undertaken to addressing the climate challenge is the approach by governments with respect to climate and sustainability policy and financing. The importance of having clear requirements for the transition, and clarity and consistency in respect of government policy and financing, are key in supporting all those committed to transitioning to a low carbon economy. This is an area to which the Committee will have close regard this year. Finally, as indicated above, nature and biodiversity are areas of growing importance on the sustainability agenda. The Committee is looking forward to building on the work done in 2023 and the external briefing it received on this subject by having a greater focus on the impact of these areas, including how they can be reflected in Barclays’ own ambition to be a net zero bank. Nigel Higgins Chair, Board Sustainability Committee 19 February 2024 The role of the Board and its Committees in overseeing climate-related matters Board Sets and oversees the Group's climate and sustainability strategy Board Audit Committee Board Risk Committee Board Sustainability Committee Board Remuneration Committee “Best practice and regulation regarding climate and sustainability reporting and related assurance are still evolving … and this is an area to which the Committee will continue to have close regard.” “The Committee...heard from senior business leaders about how climate risks are being integrated into their business strategies and plans.” “In 2023, we continued to pursue opportunities and support our clients as they transition their businesses to a low-carbon economy.” "When we set the incentive pool and Executive Directors’ incentive outcomes for 2023, we incorporated consideration of progress against our climate strategy, as we will for 2024." Julia Wilson Chair Robert Berry Chair Nigel Higgins Chair Brian Gilvary Chair Considers the impact of climate on the Group’s financial statements and reviews key climate- related narrative reporting. Oversees Barclays’ progress in its climate risk management approach, including a focus on developing quantitative risk appetites. Supports the Board in its oversight of climate matters and the sustainability agenda. Reflects progress against climate-related measures in remuneration. Strategy Climate and sustainability report Risk review Financial review Financial statements Barclays PLC 2023 Annual Report on Form 20-F 108Governance Directors’ report: Board Sustainability Committee report (continued) + See the Board Audit Committee report on page 93. + See the Board Risk Committee report on page 101. + See the Board Sustainability Committee report on page 107. + See the Remuneration report on page 119.
Committee composition and meetings During 2023, the Committee met four times and the attendance by members at these meetings is shown on page 107. Committee meetings were also attended by representatives from management, including the Group Head of Public Policy and Corporate Responsibility, the Group Head of Sustainability, the Global Head of Sustainable Finance and the Head of Legal, Public Policy and Corporate Responsibility. Role of the Committee The role of the Committee is to provide oversight of climate matters and the sustainability agenda, and in particular to: • support and advise the Board on its oversight of climate and sustainability matters relating to (i) the services and products provided to Barclays’ clients and customers, (ii) particular sectors, and (iii) its own corporate activities • support the Board in monitoring the implementation of the Group’s climate and sustainability strategy • review and make recommendations to the Board on the suitability of the Group’s climate and sustainability strategy, position statements, frameworks, ambitions, metrics, and targets • report to the Board on the climate and sustainability matters for which it is responsible, escalating issues and making recommendations to the Board where appropriate. The Committee’s terms of reference are available at home.barclays/who-we-are/ our-governance/board-committees/ Primary activities During 2023, the Committee received updates from management in relation to the Group’s climate and sustainability strategy, as well as internal and external briefings and reports on climate and sustainability matters. Set out below are the key areas of focus for the Committee's work in 2023. Climate and sustainability strategy The Committee: • Considered management's sustainable finance strategy proposals, which focused on the actions required to accelerate support for our clients as they transition and for the Group to achieve its sustainable financing target and ambition to be a net zero bank. • Considered areas where the Group could focus, providing the greatest opportunity to support global endeavours to transition to a low carbon economy and help the Group achieve its strategic ambitions. • Reviewed proposals for the Group’s updated oil and gas policy and endorsed new restrictions on oil and gas financing. Target setting and progress against targets The Committee: • Considered management’s proposals for new targets and endorsed new targets for three additional sectors – Aviation, Agriculture and Commercial Real Estate. • Monitored the Group’s progress against its climate and sustainability targets. As part of this, the Committee received updates on progress towards the target to facilitate $1trn of Sustainable and Transition Financing by the end of 2030, and considered initiatives that were underway to provide further capability to achieve the target. Investor feedback The Committee considered investor feedback and the perspectives of both our institutional investors as well as our retail shareholder base. During the year, members of the Committee engaged with institutional investors on climate-related matters, helping inform the development of our climate strategy. Client Transition Framework (CTF) The Committee received updates on the Group’s work on the CTF, including management’s approach to working with clients going through CTF assessments, expected outcomes following the assessments and proposed expansion of the application of the framework following further targets set by the Group. External briefing: Nature The Committee received an external briefing on policy and regulatory developments in relation to biodiversity and nature and the work done by Barclays as part of the UNEP-FI pilot on nature-related risks and opportunities assessment. Areas of focus Conclusion/action taken Strategy Climate and sustainability report Risk review Financial review Financial statements Barclays PLC 2023 Annual Report on Form 20-F 109Governance Directors’ report: Board Sustainability Committee report (continued)
Reporting against the Code's principles and provisions As Barclays PLC is listed on the London Stock Exchange, the principles and provisions of the Code apply, a copy of which can be found at frc.org.uk. For the year ended 31 December 2023, and as at the date of this report, we are pleased to confirm that Barclays PLC has complied in full with the requirements of the Code. This section and our Board Governance report sets out how we complied with the Code in 2023. By virtue of the information included in the Annual Report, we comply with the corporate governance statement requirements of the FCA’s Disclosure and Transparency Rules (DTRs). The information required to be disclosed pursuant to DTR 7.2.6 is located on pages 112 to 117. Information in relation to the Board Diversity and Inclusion Policy, as required to be disclosed pursuant to DTR 7.2.8A, can be found on pages 85 to 87. Barclays is permitted by NYSE rules to follow UK corporate governance practices instead of those applied in the US. Any significant variations must be explained in Barclays' Form 20-F filing, found at the Securities and Exchange Commission’s EDGAR database or on our website, home.barclays. The way in which Barclays has applied the principles and provisions of the Code during 2023 is summarised below and on the next page. Board Leadership and Company Purpose Our Board governance is designed to deliver an effective and entrepreneurial Board, which discharges its role effectively and efficiently. Details can be found on pages 77 to 79, including our Group-wide governance framework and the Board's responsibilities. Key Board activities for 2023 are set out on pages 80 to 82. The Board is fully supportive of The Barclays Way, which sets out our Purpose, Values and Mindset, and is our Code of Conduct, providing a path for achieving a dynamic and positive culture in the Group. Refer to page 173 for further detail. Our Group Whistleblowing Standard enables colleagues to raise any matters of concern anonymously and is embedded into our business. Further information can be found on page 174. Throughout 2023, we engaged with our stakeholders through a variety of means. Examples of the Board's engagement with colleagues during 2023 can be found on page 80. Division of Responsibility The majority of the Board comprises independent Non-Executive Directors. The Group Chairman and Group Company Secretary work in collaboration to ensure an effective and efficient Board, as further described in Our governance framework from page 77. All Directors have access to the advice of the Group Company Secretary. The roles of Chair, Group Chief Executive, SID and Non-Executive Directors are defined within the Barclays Charter of Expectations, along with the behaviours and competencies for each role, as outlined on page 79. Directors are expected to commit sufficient time to ensure they can discharge their obligations to Barclays effectively, as detailed in our Board Nominations Committee report on page 88. The Board is responsible for setting the strategy for the Group. The day-to-day management of the Group is delegated by the Board to the Group Chief Executive who is supported by his ExCo, the composition of which is outlined on page 76. Details of the number of meetings of the Board and its Committees, and the individual attendance by Directors, can be found in Our governance framework on page 79 and in each respective Board Committee report. Composition, Succession and Evaluation All Board and senior management appointments are viewed through a diversity lens and are based on merit and objective criteria, which focus on the skills and experience required for the Board's effectiveness and the delivery of the Group's strategy. A revised Board Diversity and Inclusion Policy was adopted on 8 February 2024. For further detail, refer to the Board Nominations Committee report on page 85. Board appointments are made following a rigorous and transparent process facilitated by the Board Nominations Committee, with the aid of external search consultancy firms. All Directors are subject to annual re-election at the AGM. See page 112 for further detail. Each year, we carry out an effectiveness review to evaluate the performance of the Board, Board Committees and individual Directors. In line with the Code, the review was conducted internally for 2023, and is expected to be conducted externally in 2024. Refer to the Board Nominations Committee report on page 91 for details of the 2023 effectiveness review as well as progress against the findings from the 2022 review. Strategy Climate and sustainability report Risk review Financial review Financial statements Barclays PLC 2023 Annual Report on Form 20-F 110Governance Directors’ report: How we comply
Audit, Risk and Internal Control Remuneration The Board, together with the Board Audit Committee, is responsible for ensuring the integrity of this Annual Report and that the financial statements as a whole present a fair, balanced and understandable assessment of Barclays' performance, position and prospects. The Board, together with the Board Audit Committee, is responsible for ensuring the independence and effectiveness of the internal audit function and external auditors. The Directors are responsible for ensuring that management maintains an effective system of risk management and internal control and for assessing its effectiveness. Such a system is designed to identify, evaluate and manage, rather than eliminate, the risk of failure to achieve business objectives and can only provide reasonable, and not absolute, assurance against material misstatement or loss. Processes are in place for identifying, evaluating and managing the Principal Risks facing the Group. A key component of The Barclays Guide is the ERMF. The purpose of the ERMF is to identify and set minimum requirements of the main risks to the strategic objectives of the Group. The Group is committed to operating within a strong system of internal control. The Barclays Guide contains the overarching framework setting out the approach of the Group to internal governance. Key controls are assessed on a regular basis for both design and operating effectiveness. Issues arising out of these assessments, where appropriate, are reported to the Board Audit Committee. The Board Audit Committee oversees the control environment (and remediation of related issues). It also reviews annually the risk management and internal control system. The Board Audit Committee has concluded that throughout the year ended 31 December 2023 and to date, the Group has operated an effective system of internal control that provides reasonable assurance of financial and operational controls and compliance with laws and regulations. You can read more about the Board Audit Committee and its work, including its oversight of the internal control framework and areas of ongoing enhancement, from page 93. The Remuneration report from page 119 sets out the purpose and activities of the Board Remuneration Committee, a summary of the remuneration policy for the Executive Directors and how it is aligned with the policy for the wider workforce, as well as the Directors’ remuneration outcomes for 2023. The remuneration policies and procedures support the Group's strategy and enable us to reward sustainable performance, which is a key element of our Remuneration Philosophy, in line with our Values, Mindset and risk expectations. All Executive Director and senior management remuneration policies are developed in accordance with the Group's formal and transparent procedures (ensuring that no Director is involved in deciding their own remuneration outcome) and are, where possible, aligned to wider workforce policies. Board Remuneration Committee members exercise independent judgement and discretion when determining remuneration outcomes, considering the company and individual performance, wider workforce and other relevant stakeholder considerations. Strategy Climate and sustainability report Risk review Financial review Financial statements Barclays PLC 2023 Annual Report on Form 20-F 111Governance Directors’ report: How we comply (continued)
The Directors present their report together with the audited accounts for the year ended 31 December 2023. Other statutory and regulatory information Other information that is relevant to the Directors’ report, and which is incorporated by reference into this report, can be located as follows: Page Remuneration policy, including details of the remuneration of each Director and Directors’ interests in shares 125, 153 to 231 Corporate Governance Statement 110 to 111 Risk review 182 Disclosures required pursuant to Large and Medium-sized Companies and Groups (Accounts and Reports) Regulations 2008 as updated by Companies (Miscellaneous Reporting) Regulations 2018 can be found on the following pages: Page Engagement with employees (Sch. 7, Para 11 and 11A 2008/2018 Regs) 14 to 16 Engagement with suppliers, customers and others in a business relationship (Sch. 7, Para 11 B 2008/2018 Regs) 118, 13, 17 and 166 to 172 Financial instruments (Sch. 7, para 6 2008 Regs) 354 Hedge accounting policy (Sch. 7, para 6 2008 Regs) 354 Disclosures required pursuant to Listing Rule 9.8.4R can be found on the following pages: Page Allotment for cash of equity securities 390 Waiver of dividends 112 Section 414A of the Companies Act 2006 requires the Directors to present a Strategic report in the Annual Report and Financial Statements. Profit and dividends Statutory profit after tax for 2023 was £5,323m (2022: £5,973m). The 2023 full year dividend of 5.3p per ordinary share will be paid on 3 April 2024 to shareholders whose names are on the Register of Members at the close of business on 1 March 2024. With the 2023 half year dividend totalling 2.7p per ordinary share, paid in September 2023, the total dividend for 2023 is 8.0p (2022: 7.25p) per ordinary share. The half year and full year dividends for 2023 amounted to £1,210m (2022: £1,028m). BPLC also completed share buy-back programmes during 2023, further details of which can be found later in this section. Shareholders may have their dividends reinvested in Barclays by joining the Barclays Dividend Reinvestment Plan (DRIP). Further details regarding the DRIP can be found at home.barclays/dividends and shareview.co.uk/info/drip. The nominee company of certain Employee Benefit Trusts (EBTs) holding shares in Barclays in connection with the operation of our employee share plans has lodged evergreen dividend waivers on shares held by it that have not been allocated to employees. The total amount of dividends waived during the year ended 31 December 2023 was £1.70m (2022: £6.28m). Board of Directors The names of the current Directors of BPLC, along with their biographical details, are set out on pages 72 to 75 and are incorporated into this Directors’ report by reference. Changes to Directors during the year and up to the date of this report are set out below. Name Role Effective date Marc Moses Non- Executive Director Appointed 23 January 2023 Mike Ashley Non- Executive Director Resigned 3 May 2023 Crawford Gillies Non- Executive Director Resigned 31 May 2023 Sir John Kingman Non- Executive Director Appointed 1 June 2023 Appointment and retirement of Directors The appointment and retirement of Directors is governed by our Articles, the Code, the Companies Act 2006 and related legislation. The Articles may be amended only by a special resolution of the shareholders. The Board has the power to appoint additional Directors or to fill a casual vacancy among the Directors and any Director so appointed holds office only until the next AGM and may offer themselves for re- election. The Code recommends that all directors of FTSE 350 companies should be subject to annual re-election. All Directors intend to offer themselves for election or re-election at the 2024 AGM. Strategy Climate and sustainability report Risk review Financial review Financial statements Barclays PLC 2023 Annual Report on Form 20-F 112Governance Directors’ report: Other statutory and regulatory information
Directors’ indemnities Qualifying third party indemnity provisions (as defined by Section 234 of the Companies Act 2006) were in force during the course of the financial year ended 31 December 2023 for the benefit of the then Directors of the Company and the then Directors of certain of the Company's subsidiaries and, at the date of this report, are in force for the benefit of the Directors of the Company and the directors of certain of the Company's subsidiaries in relation to certain losses and liabilities which they may incur (or have incurred) in connection with their duties, powers or office. The Group also maintains Directors’ and Officers’ Liability Insurance which gives appropriate cover for legal action brought against its Directors. Qualifying pension scheme indemnity provisions (as defined by Section 235 of the Companies Act 2006) were in force during the course of the financial year ended 31 December 2023 for the benefit of the then Directors, and at the date of this report are in force for the benefit of directors of Barclays Pension Funds Trustees Limited as trustee of the Barclays Bank UK Retirement Fund, and Barclays Executive Schemes Trustees Limited as Trustee of Barclays Capital International Pension Scheme (No.1) and Barclays PLC Funded Unapproved Retirement Benefits Scheme. The directors of the trustees are indemnified against liability incurred in connection with the trustees’ activities in relation to the Barclays Bank UK Retirement Fund, Barclays Capital International Pension Scheme (No.1) and Barclays PLC Funded Unapproved Retirement Benefits Scheme. Political donations The Group did not give any money for political purposes in the UK or outside the UK, nor did it make any political donations to political parties or other political organisations or to any independent election candidates, nor did it incur any political expenditure during the year. In accordance with the US Federal Election Campaign Act, Barclays provides administrative support to a federal Political Action Committee (PAC) in the US, funded by the voluntary political contributions of eligible employees. The PAC is not controlled or funded by Barclays and all decisions regarding the amounts and recipients of contributions are directed by a steering committee comprising employees eligible to contribute to the PAC. Contributions to political organisations reported by the PAC during the calendar year 2023 totalled $60,159 (2022: $105,000). Country-by-Country reporting The Capital Requirements (Country-by- Country reporting) Regulations 2013 require the Company to publish additional information in respect of the year ended 31 December 2023. This information is included in the Barclays Country Snapshot available on the Barclays website: home.barclays/annualreport. Support for candidates and colleagues with disabilities and long-term conditions Barclays is committed to attracting and retaining a diverse workforce, and our commitment to inclusion means we want to ensure that candidates with disabilities and long-term health conditions receive support and adjustments in the application process and beyond. Barclays welcomes applications from all candidates and is committed to ensuring reasonable adjustments (accommodations) are put in place to ensure a fair and inclusive recruitment process. Barclays is committed to providing all colleagues with the support and tools they need to have a productive and fulfilling career. We can consider making adjustments to remove or reduce barriers colleagues might face if they have a disability, health concern or mental health condition We also ensure opportunities for training, career development and promotion are available to all. Research and development In the ordinary course of business, the Group develops new products and services in each of its business divisions. Greenhouse gas emissions, energy consumption and energy efficiency action Although financed emissions account for the greatest proportion of our climate impact, we have also continued addressing our operational emissions – an important factor in meeting our ambition to be a net zero bank by 2050. Progress to date In 2023 we achieved our milestone1 of 50% reduction of our Scope 1 and 2 location-based GHG emissions ahead of 2030 – reducing these emissions by 51%. We continued to source 100% renewable electricity2 for our global real estate portfolio3 and continued to meet our 90% Scope 1 and 2 market-based emissions reduction target4 – reducing these emissions by 93%. Key contributors to our progress include global real estate portfolio right-sizing5 and energy efficiency programmes, as well as company vehicles electrification, and our continued focus on renewable electricity sourcing. For our Scope 3 operational emissions our focus remained on engaging with our key stakeholders and making data enhancements, particularly by acquiring primary supplier data and evolving our accounting methodology in line with industry standards and best practice. We also continued to pursue the integration of ESG considerations and expectations into processes throughout the procurement lifecycle. We expect that our progress against our net zero operations targets and milestones is likely to be variable and non- linear. Our net zero operations strategy is dependent on broader industry, technological and regulatory changes that are outside Barclays’ control and may affect our ability to achieve our targets and milestones. Further, as the accounting standards and data underlying our net zero operations strategy continue to evolve and be refined, this could impact our metrics, targets and milestones. Strategy Climate and sustainability report Risk review Financial review Financial statements Barclays PLC 2023 Annual Report on Form 20-F 113Governance Directors’ report: Other statutory and regulatory information (continued)
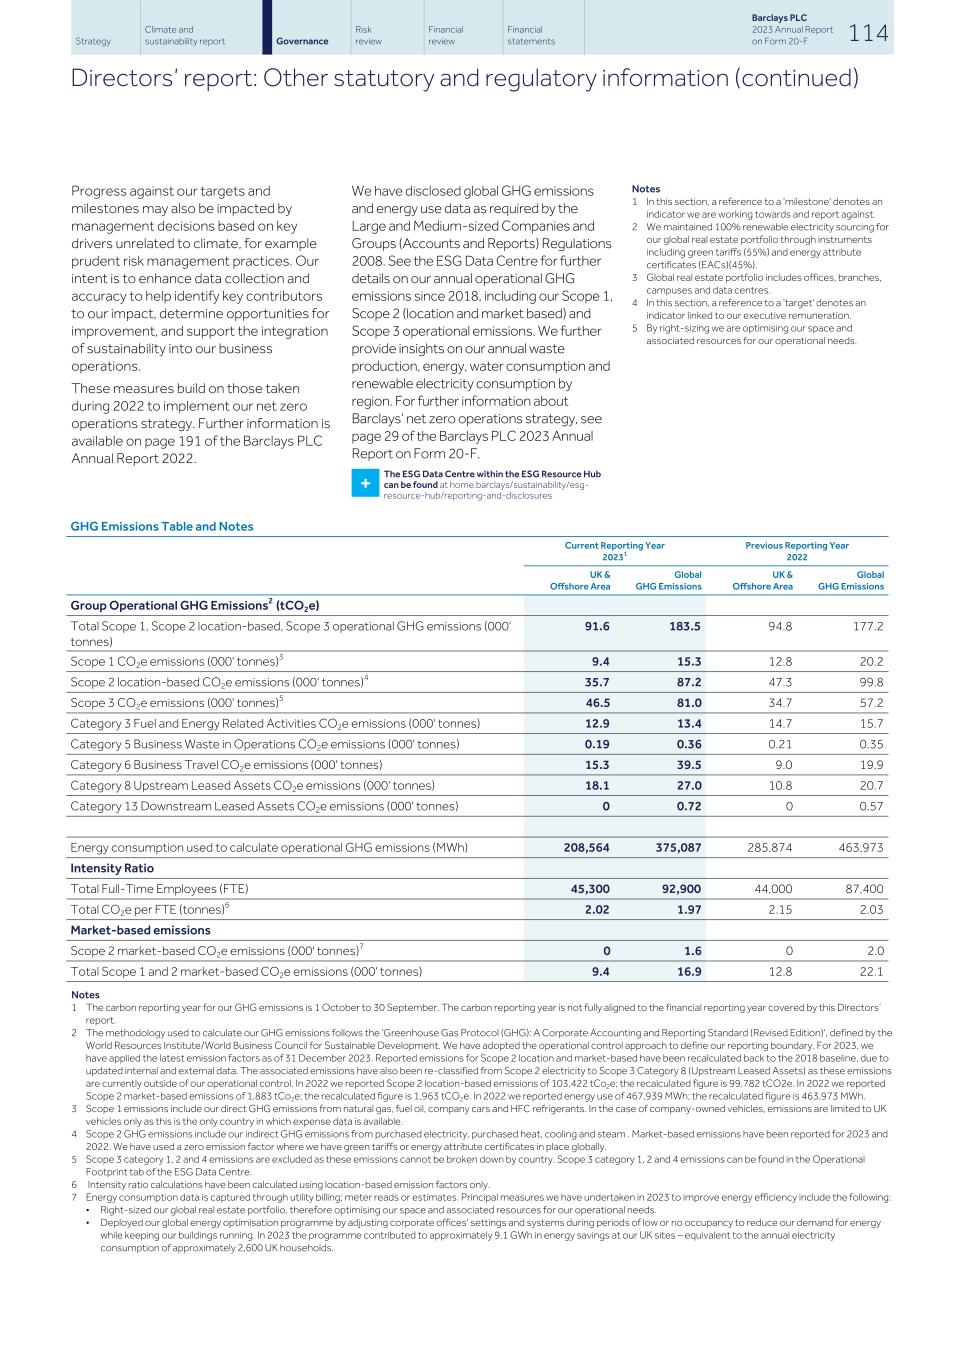
Progress against our targets and milestones may also be impacted by management decisions based on key drivers unrelated to climate, for example prudent risk management practices. Our intent is to enhance data collection and accuracy to help identify key contributors to our impact, determine opportunities for improvement, and support the integration of sustainability into our business operations. These measures build on those taken during 2022 to implement our net zero operations strategy. Further information is available on page 191 of the Barclays PLC Annual Report 2022. We have disclosed global GHG emissions and energy use data as required by the Large and Medium-sized Companies and Groups (Accounts and Reports) Regulations 2008. See the ESG Data Centre for further details on our annual operational GHG emissions since 2018, including our Scope 1, Scope 2 (location and market based) and Scope 3 operational emissions. We further provide insights on our annual waste production, energy, water consumption and renewable electricity consumption by region. For further information about Barclays’ net zero operations strategy, see page 29 of the Barclays PLC 2023 Annual Report on Form 20-F. + The ESG Data Centre within the ESG Resource Hub can be found at home.barclays/sustainability/esg- resource-hub/reporting-and-disclosures Notes 1 In this section, a reference to a 'milestone' denotes an indicator we are working towards and report against. 2 We maintained 100% renewable electricity sourcing for our global real estate portfolio through instruments including green tariffs (55%) and energy attribute certificates (EACs)(45%). 3 Global real estate portfolio includes offices, branches, campuses and data centres. 4 In this section, a reference to a 'target' denotes an indicator linked to our executive remuneration. 5 By right-sizing we are optimising our space and associated resources for our operational needs. GHG Emissions Table and Notes Current Reporting Year 20231 Previous Reporting Year 2022 UK & Offshore Area Global GHG Emissions UK & Offshore Area Global GHG Emissions Group Operational GHG Emissions2 (tCO2e) Total Scope 1, Scope 2 location-based, Scope 3 operational GHG emissions (000' tonnes) 91.6 183.5 94.8 177.2 Scope 1 CO2e emissions (000' tonnes)3 9.4 15.3 12.8 20.2 Scope 2 location-based CO2e emissions (000' tonnes)4 35.7 87.2 47.3 99.8 Scope 3 CO2e emissions (000' tonnes)5 46.5 81.0 34.7 57.2 Category 3 Fuel and Energy Related Activities CO2e emissions (000' tonnes) 12.9 13.4 14.7 15.7 Category 5 Business Waste in Operations CO2e emissions (000' tonnes) 0.19 0.36 0.21 0.35 Category 6 Business Travel CO2e emissions (000' tonnes) 15.3 39.5 9.0 19.9 Category 8 Upstream Leased Assets CO2e emissions (000' tonnes) 18.1 27.0 10.8 20.7 Category 13 Downstream Leased Assets CO2e emissions (000' tonnes) 0 0.72 0 0.57 Energy consumption used to calculate operational GHG emissions (MWh) 208,564 375,087 285,874 463,973 Intensity Ratio Total Full-Time Employees (FTE) 45,300 92,900 44,000 87,400 Total CO2e per FTE (tonnes)6 2.02 1.97 2.15 2.03 Market-based emissions Scope 2 market-based CO2e emissions (000' tonnes)7 0 1.6 0 2.0 Total Scope 1 and 2 market-based CO2e emissions (000' tonnes) 9.4 16.9 12.8 22.1 Notes 1 The carbon reporting year for our GHG emissions is 1 October to 30 September. The carbon reporting year is not fully aligned to the financial reporting year covered by this Directors’ report. 2 The methodology used to calculate our GHG emissions follows the 'Greenhouse Gas Protocol (GHG): A Corporate Accounting and Reporting Standard (Revised Edition)', defined by the World Resources Institute/World Business Council for Sustainable Development. We have adopted the operational control approach to define our reporting boundary. For 2023, we have applied the latest emission factors as of 31 December 2023. Reported emissions for Scope 2 location and market-based have been recalculated back to the 2018 baseline, due to updated internal and external data. The associated emissions have also been re-classified from Scope 2 electricity to Scope 3 Category 8 (Upstream Leased Assets) as these emissions are currently outside of our operational control. In 2022 we reported Scope 2 location-based emissions of 103,422 tCo2e; the recalculated figure is 99,782 tCO2e. In 2022 we reported Scope 2 market-based emissions of 1,883 tCo2e; the recalculated figure is 1,963 tCO2e. In 2022 we reported energy use of 467,939 MWh; the recalculated figure is 463,973 MWh. 3 Scope 1 emissions include our direct GHG emissions from natural gas, fuel oil, company cars and HFC refrigerants. In the case of company-owned vehicles, emissions are limited to UK vehicles only as this is the only country in which expense data is available. 4 Scope 2 GHG emissions include our indirect GHG emissions from purchased electricity, purchased heat, cooling and steam . Market-based emissions have been reported for 2023 and 2022. We have used a zero emission factor where we have green tariffs or energy attribute certificates in place globally. 5 Scope 3 category 1, 2 and 4 emissions are excluded as these emissions cannot be broken down by country. Scope 3 category 1, 2 and 4 emissions can be found in the Operational Footprint tab of the ESG Data Centre. 6 Intensity ratio calculations have been calculated using location-based emission factors only. 7 Energy consumption data is captured through utility billing; meter reads or estimates. Principal measures we have undertaken in 2023 to improve energy efficiency include the following: • Right-sized our global real estate portfolio, therefore optimising our space and associated resources for our operational needs. • Deployed our global energy optimisation programme by adjusting corporate offices' settings and systems during periods of low or no occupancy to reduce our demand for energy while keeping our buildings running. In 2023 the programme contributed to approximately 9.1 GWh in energy savings at our UK sites – equivalent to the annual electricity consumption of approximately 2,600 UK households. Strategy Climate and sustainability report Risk review Financial review Financial statements Barclays PLC 2023 Annual Report on Form 20-F 114Governance Directors’ report: Other statutory and regulatory information (continued)
Share capital Share capital structure The Company has ordinary shares in issue. The Company’s Articles also allow for the issuance of sterling, US dollar, euro and yen preference shares (preference shares). No preference shares have been issued as at 16 February 2024 (the latest practicable date for inclusion in this report). Ordinary shares therefore represent 100% of the total issued share capital as at 31 December 2023 and as at 16 February 2024 (the latest practicable date for inclusion in this report). Details of the movement in ordinary share capital during the year can be found in Note 27 to the financial statements. The rights and obligations attaching to the Company's ordinary shares and preference shares are set out in the Company's Articles, copies of which are available on the Company's website at home.barclays/corporategovernance. Voting Every member who is present in person or represented at any general meeting of the Company, and who is entitled to vote, has one vote on a show of hands. Every proxy present has one vote. The proxy will have one vote for, and one vote against, a resolution if he/she has been instructed to vote for, or against, the resolution by different members or in one direction by a member while another member has permitted the proxy discretion as to how to vote. On a poll, every member who is present in person or by proxy and who is entitled to vote has one vote for every share held. In the case of joint holders, only the vote of the senior holder (as determined by the order in the share register) or his/her proxy may be counted. If any sum payable remains unpaid in relation to a member’s shareholding, that member is not entitled to vote that share or exercise any other right in relation to a meeting of the Company unless the Board otherwise determines. If any member, or any other person appearing to be interested in any of the Company’s ordinary shares, is served with a notice under Section 793 of the Companies Act 2006 and does not supply the Company with the information required in the notice, then the Board, in its absolute discretion, may direct that that member shall not be entitled to attend or vote at any meeting of the Company. The Board may further direct that, if the shares of the defaulting member represent 0.25% or more of the issued shares of the relevant class, dividends or other monies payable on those shares shall be retained by the Company until the direction ceases to have effect and no transfer of those shares shall be registered (other than certain specified ‘excepted transfers’). A direction ceases to have effect seven days after the Company has received the information requested, or when the Company is notified that an excepted transfer of all of the relevant shares to a third party has occurred, or as the Board otherwise determines. Transfers Ordinary shares may be held in either certificated or uncertificated form. Certificated ordinary shares may be transferred in writing in any usual or other form approved by the Group Company Secretary and executed by or on behalf of the transferor. Transfers of uncertificated ordinary shares must be made in accordance with the Companies Act 2006 and the CREST Regulations. The Board is not bound to register a transfer of partly paid ordinary shares or fully paid shares in exceptional circumstances approved by the FCA. The Board may also decline to register an instrument of transfer of certificated ordinary shares unless (i) it is duly stamped, deposited at the prescribed place and accompanied by the share certificate(s) and such other evidence as reasonably required by the Board to evidence right to transfer, (ii) it is in respect of one class of shares only, and (iii) it is in favour of a single transferee or not more than four joint transferees (except in the case of executors or trustees of a member). The Company is not aware of any agreements between holders of securities that may result in restrictions on the transfer of securities or voting rights. Variation of rights The rights attached to any class of shares may be varied either with the consent in writing of the holders of at least 75% in nominal value of the issued shares of that class, or with the sanction of a special resolution passed at a separate meeting of the holders of the shares of that class. The rights of shares shall not (unless expressly provided by the rights attached to such shares) be deemed varied by the creation of further shares ranking equally with them or subsequent to them. Limitations on foreign shareholders There are no restrictions imposed by the Articles or (subject to the effect of any economic sanctions that may be in force from time to time) by current UK laws which relate only to non-residents of the UK and which limit the rights of such non- residents to hold or (when entitled to do so) vote the ordinary shares. Exercisability of rights under an employee share scheme EBTs operate in connection with certain of the Group’s Employee Share Plans (Plans). The trustees of the EBTs may exercise all rights attached to the shares in accordance with their fiduciary duties, other than as specifically restricted in the documents governing the Plans. The trustees of the EBTs have informed the Company that their normal policy is to abstain from voting in respect of the Barclays shares held in trust. The trustees of the Global Sharepurchase EBT and UK Sharepurchase EBT may vote in respect of Barclays shares held in the EBTs, but only as instructed by participants in those Plans in respect of their partnership shares and (when vested) matching and dividend shares. The trustees will not otherwise vote in respect of shares held in the Sharepurchase EBTs. Special rights There are no persons holding securities that carry special rights with regard to the control of the Company. Major shareholders Major shareholders do not have different voting rights from those of other shareholders. Information provided to the Company by substantial shareholders (holding voting rights of 3% or more in the financial instruments of the Company) pursuant to the DTRs are published via a Regulatory Information Service and is available on the Company’s website. As at 31 December 2023, the Company had been notified under Rule 5 of the DTRs of the following holdings of voting rights in its shares. Between 31 December 2023 and 16 February 2024 (the latest practicable date for inclusion in this report), the Company has not received any additional notifications pursuant to Rule 5 of the DTRs. Person interested Number of Barclays Shares % of total voting rights attaching to issued share capital1 Nature of holding (direct or indirect) BlackRock, Inc.2 944,022,209 5.78 indirect Notes 1 The percentage of voting rights detailed above was calculated at the time of the relevant disclosures made in accordance with Rule 5 of the DTRs. 2 Total shown includes 6,687,206 contracts for difference to which voting rights are attached. Part of the holding is held as American Depositary Receipts. On 25 January 2024, BlackRock, Inc. disclosed by way of a Schedule 13G filed with the SEC beneficial ownership of 1,303,920,163 ordinary shares of the Company as at 31 December 2023, representing 8.6% of that class of shares. Strategy Climate and sustainability report Risk review Financial review Financial statements Barclays PLC 2023 Annual Report on Form 20-F 115Governance Directors’ report: Other statutory and regulatory information (continued)
Powers of Directors to issue and allot or buy back the Company’s shares The powers of the Directors are determined by the Companies Act 2006 and the Company’s Articles. The Directors are authorised to issue and allot shares and to buy back shares subject to, and on the terms of, the annual shareholder approval at the AGM. Such authorities were granted by shareholders at the 2023 AGM. It will be proposed at the 2024 AGM that the Directors be granted new authorities to issue and allot and buy back shares. Repurchase of shares On 13 March 2023 and 28 July 2023 the Company commenced share buy-back programmes to purchase its ordinary shares of £0.25p each up a maximum consideration of £500m and £750m, respectively. The first share buy-back programme concluded on 14 April 2023 and the second share buy-back programme concluded on 23 October 2023. The Company repurchased for cancellation 343,041,720 ordinary shares at a volume weighted average price of 145.7549 pence per ordinary share during the first buy-back programme and 493,603,770 ordinary shares at a volume weighted average price of 151.9437 pence per ordinary share during the second buy- back programme. The purpose of the buy- back programmes was to reduce the Company’s number of outstanding ordinary shares. In aggregate, the Company purchased 836,645,490 ordinary shares during 2023 with an aggregate nominal value of approximately £209m (this represented approximately 5.5% of the Company's issued share capital as at 31 December 2023) for an aggregate consideration of £1,250m excluding taxes and expenses. All of the repurchased ordinary shares have been cancelled. No further shares have been repurchased since the completion of the second share buy-back programme on 23 October 2023. The maximum number of ordinary shares which could be repurchased by the Company as part of any share buy-back under the authority for on-market share buy-backs granted at the 2023 AGM is 1,093,533,143 ordinary shares (being 1,587,136,913 less the 493,603,770 shares repurchased as part of the second share buy-back programme). Distributable reserves As at 31 December 2023, the distributable reserves of the Company were £21,162m (2022: £21,701m). Change of control There are no significant agreements to which the Company is a party that take effect, alter or terminate on a change of control of the Company following a takeover bid. There are no agreements between the Company and its Directors or employees providing for compensation for loss of office or employment that occurs because of a takeover bid. Controls over financial reporting A framework of disclosure controls and procedures is in place to support the approval of the financial statements of the Group. Specific governance committees are responsible for examining the financial reports and disclosures to help ensure that they have been subject to adequate verification and comply with applicable standards and legislation. Where appropriate, these committees report their conclusions to the Board Audit Committee, which debates such conclusions and provides further challenge. Finally, the Board scrutinises and approves results announcements and the Annual Report to ensure that appropriate disclosures have been made. This governance process is designed to ensure that both management and the Board are given sufficient opportunity to debate and challenge the financial statements of the Group and other significant disclosures before they are made public. Management’s report on internal control over financial reporting Management is responsible for establishing and maintaining adequate internal control over financial reporting under the supervision of the principal executive and financial officers, to provide reasonable assurance regarding the reliability of financial reporting and the preparation of financial statements, in accordance with (a) UK-adopted international accounting standards; and (b) International Financial Reporting Standards (IFRS) as issued by the International Accounting Standards Board (IASB), including interpretations issued by the IFRS Interpretations Committee. Internal control over financial reporting includes policies and procedures that pertain to the maintenance of records that, in reasonable detail: • accurately and fairly reflect transactions and dispositions of assets • provide reasonable assurances that transactions are recorded as necessary to permit preparation of financial statements in accordance with UK- adopted international accounting standards and IFRS and that receipts and expenditures are being made only in accordance with authorisations of management and the respective Directors • provide reasonable assurance regarding prevention or timely detection of unauthorised acquisition, use or disposition of assets that could have a material effect on the financial statements. Internal control systems, no matter how well designed, have inherent limitations and may not prevent or detect misstatements. Also, projections of any evaluation of effectiveness to future periods are subject to the risk that internal control over financial reporting may become inadequate because of changes in conditions or that the degree of compliance with the policies or procedures may deteriorate. Management has assessed internal control over financial reporting as at 31 December 2023. In making its assessment, management utilised the criteria set out in the 2013 COSO framework. Management has concluded that, based on its assessment, internal control over financial reporting was effective as at 31 December 2023. The system of internal financial and operational controls is also subject to regulatory oversight in the UK and overseas. Further information on supervision by financial services regulators is provided under Supervision and Regulation in the Risk review section on pages 290 to 299. Changes in internal control over financial reporting There have been no changes that occurred during the period covered by this report, which have materially affected or are reasonably likely to materially affect the Group’s internal control over financial reporting. Strategy Climate and sustainability report Risk review Financial review Financial statements Barclays PLC 2023 Annual Report on Form 20-F 116Governance Directors’ report: Other statutory and regulatory information (continued)
Disclosure of information to the auditor Each Director confirms that, so far as he/ she is aware, there is no relevant audit information of which our auditor is unaware and that each of the Directors has taken all the steps that he/she ought to have taken as a Director to make himself/herself aware of any relevant audit information and to establish that our auditor is aware of that information. This confirmation is given pursuant to Section 418 of the Companies Act 2006 and should be interpreted in accordance with, and subject to, those provisions. Directors’ responsibilities The following statement, which should be read in conjunction with the Auditor’s report, is made with a view to distinguishing for shareholders the respective responsibilities of the Directors and of the auditor in relation to the accounts. Going concern The Group’s business activities and factors likely to affect its future development and performance are disclosed in the Risk review section of this report. The financial performance is disclosed within the Financial review with funding, liquidity and capital details contained within the Risk performance section. The Group’s objectives and policies in managing the financial risks to which it is exposed are discussed in the Risk management section. The Directors considered it appropriate to prepare the financial statements on a going concern basis. In preparing each of the Group and company financial statements, the Directors are required to: • assess the Group and Company’s ability to continue as a going concern, disclosing, as applicable, matters related to going concern • use the going concern basis of accounting unless they either intend to liquidate the Group or the Parent company or to cease operations, or have no realistic alternative but to do so. Preparation of accounts The Directors are required by the Companies Act 2006 to prepare Group and Company accounts for each financial year and, with regard to Group accounts, in accordance with UK-adopted international accounting standards. The Directors have prepared these accounts in accordance with (a) UK-adopted international accounting standards; and (b) IFRS as issued by the IASB, including interpretations issued by the IFRS Interpretations Committee. Pursuant to the Companies Act 2006, the Directors must not approve the accounts unless they are satisfied that they give a true and fair view of the state of affairs of the Group and the Company and of their profit or loss for that period. The Directors consider that, in preparing the financial statements, the Group and the Company have used appropriate accounting policies, supported by reasonable judgements and estimates, and that all accounting standards which they consider to be applicable have been followed. The Directors are satisfied that the Annual Report and financial statements, taken as a whole, are fair, balanced and understandable, and provide the information necessary for shareholders to assess the Group and Company’s position and performance, business model and strategy. The Directors are responsible for such internal controls as they determine are necessary to enable the preparation of financial statements that are free from material misstatement, whether due to fraud or error. Auditor’s report The Auditor’s report on the Financial Statements of Barclays PLC for the year ended 31 December 2023 was unmodified and its statement under Section 496 of the Companies Act 2006 was also unmodified. By order of the Board Hannah Ellwood Group Company Secretary 19 February 2024 Registered in England. Company No. 48839 Registered office: 1 Churchill Place, London E14 5HP Strategy Climate and sustainability report Risk review Financial review Financial statements Barclays PLC 2023 Annual Report on Form 20-F 117Governance Directors’ report: Other statutory and regulatory information (continued)

Supporting our supply chain Though our businesses are geographically diverse, more than 92%2 of our third-party spending is concentrated in the UK and the US with many of them having their own extensive supply chains. Our supply base is diverse across scale, ownership type and structure from privately-held start-ups to publicly-listed multinational corporations. Over the past several years, Barclays has sought to reduce the size of its supply chain while at the same time creating opportunities for diverse suppliers3 which encompass micro, small or medium-sized enterprises and diverse-owned4 businesses. Notes 1 Includes non-addressable spend and One Time Vendors (OTV). 2 92% by invoice value 3 Spending between Barclays and diverse suppliers is considered first-tier spending. Spending between Barclays’ first-tier suppliers that can trace subcontracted spend with diverse suppliers on Barclays-specific work is considered second-tier direct spending. 4 For Barclays, diverse suppliers are defined as either size diverse (small and medium sized enterprises) or ownership diverse (majority owned, controlled and operated by protected class groups, such as women, ethnic minorities, LGBT+, persons with disabilities, military veterans and for-profit social enterprises) Strategy Climate and sustainability report Risk review Financial review Financial statements Barclays PLC 2023 Annual Report on Form 20-F 118Governance Supporting our supply chain
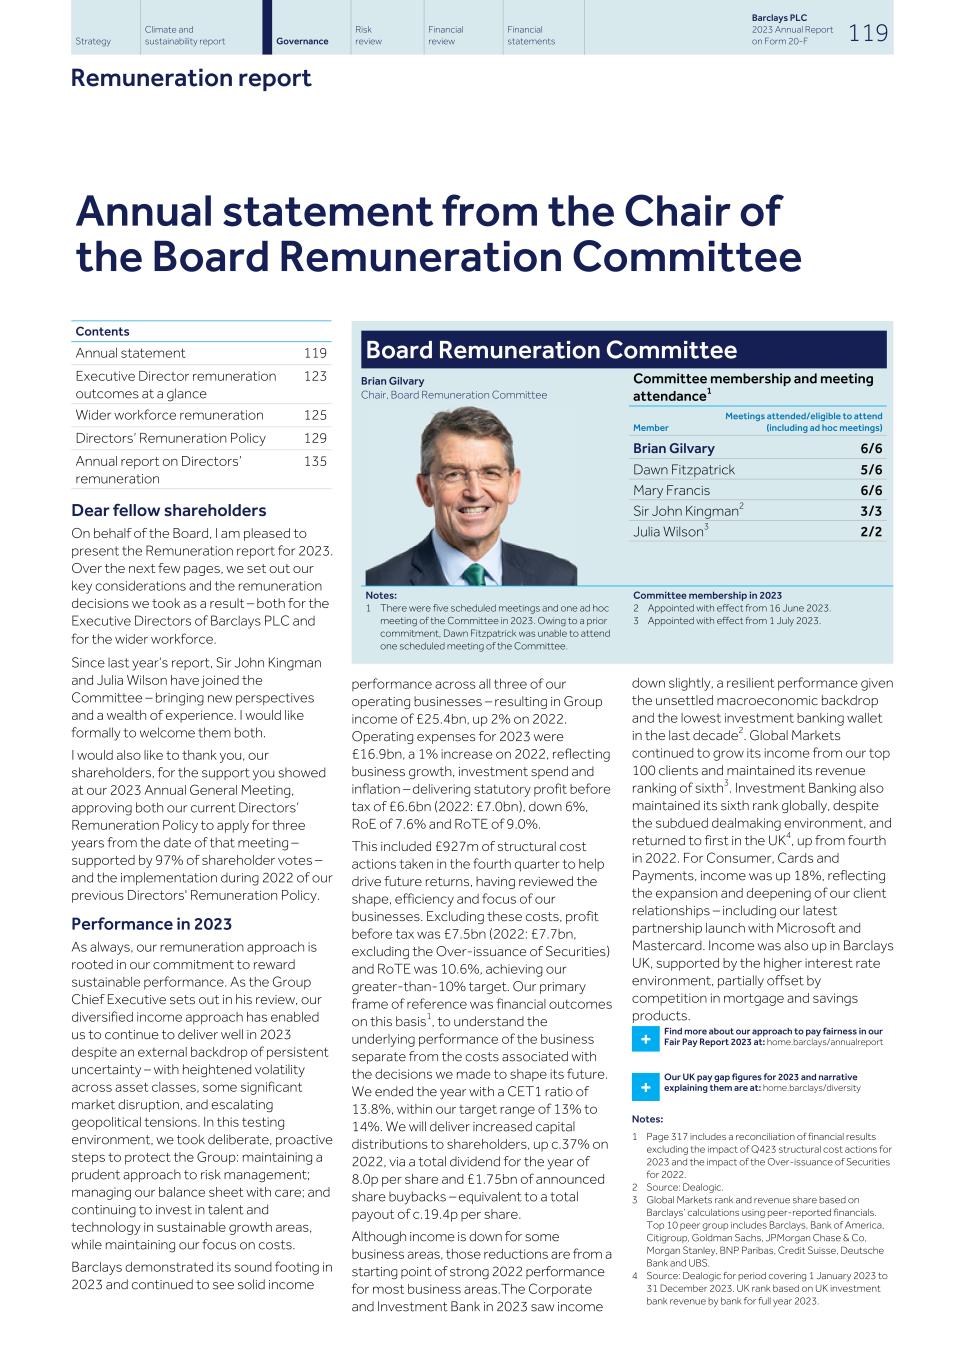
Annual statement from the Chair of the Board Remuneration Committee Contents Annual statement 119 Executive Director remuneration outcomes at a glance 123 Wider workforce remuneration 125 Directors’ Remuneration Policy 129 Annual report on Directors’ remuneration 135 Dear fellow shareholders On behalf of the Board, I am pleased to present the Remuneration report for 2023. Over the next few pages, we set out our key considerations and the remuneration decisions we took as a result – both for the Executive Directors of Barclays PLC and for the wider workforce. Since last year’s report, Sir John Kingman and Julia Wilson have joined the Committee – bringing new perspectives and a wealth of experience. I would like formally to welcome them both. I would also like to thank you, our shareholders, for the support you showed at our 2023 Annual General Meeting, approving both our current Directors’ Remuneration Policy to apply for three years from the date of that meeting – supported by 97% of shareholder votes – and the implementation during 2022 of our previous Directors' Remuneration Policy. Performance in 2023 As always, our remuneration approach is rooted in our commitment to reward sustainable performance. As the Group Chief Executive sets out in his review, our diversified income approach has enabled us to continue to deliver well in 2023 despite an external backdrop of persistent uncertainty – with heightened volatility across asset classes, some significant market disruption, and escalating geopolitical tensions. In this testing environment, we took deliberate, proactive steps to protect the Group: maintaining a prudent approach to risk management; managing our balance sheet with care; and continuing to invest in talent and technology in sustainable growth areas, while maintaining our focus on costs. Barclays demonstrated its sound footing in 2023 and continued to see solid income Board Remuneration Committee Brian Gilvary Chair, Board Remuneration Committee Committee membership and meeting attendance1 Member Meetings attended/eligible to attend (including ad hoc meetings) Brian Gilvary 6/6 Dawn Fitzpatrick 5/6 Mary Francis 6/6 Sir John Kingman2 3/3 Julia Wilson3 2/2 Notes: 1 There were five scheduled meetings and one ad hoc meeting of the Committee in 2023. Owing to a prior commitment, Dawn Fitzpatrick was unable to attend one scheduled meeting of the Committee. Committee membership in 2023 2 Appointed with effect from 16 June 2023. 3 Appointed with effect from 1 July 2023. performance across all three of our operating businesses – resulting in Group income of £25.4bn, up 2% on 2022. Operating expenses for 2023 were £16.9bn, a 1% increase on 2022, reflecting business growth, investment spend and inflation – delivering statutory profit before tax of £6.6bn (2022: £7.0bn), down 6%, RoE of 7.6% and RoTE of 9.0%. This included £927m of structural cost actions taken in the fourth quarter to help drive future returns, having reviewed the shape, efficiency and focus of our businesses. Excluding these costs, profit before tax was £7.5bn (2022: £7.7bn, excluding the Over-issuance of Securities) and RoTE was 10.6%, achieving our greater-than-10% target. Our primary frame of reference was financial outcomes on this basis1, to understand the underlying performance of the business separate from the costs associated with the decisions we made to shape its future. We ended the year with a CET1 ratio of 13.8%, within our target range of 13% to 14%. We will deliver increased capital distributions to shareholders, up c.37% on 2022, via a total dividend for the year of 8.0p per share and £1.75bn of announced share buybacks – equivalent to a total payout of c.19.4p per share. Although income is down for some business areas, those reductions are from a starting point of strong 2022 performance for most business areas.The Corporate and Investment Bank in 2023 saw income down slightly, a resilient performance given the unsettled macroeconomic backdrop and the lowest investment banking wallet in the last decade2. Global Markets continued to grow its income from our top 100 clients and maintained its revenue ranking of sixth3. Investment Banking also maintained its sixth rank globally, despite the subdued dealmaking environment, and returned to first in the UK4, up from fourth in 2022. For Consumer, Cards and Payments, income was up 18%, reflecting the expansion and deepening of our client relationships – including our latest partnership launch with Microsoft and Mastercard. Income was also up in Barclays UK, supported by the higher interest rate environment, partially offset by competition in mortgage and savings products. + Find more about our approach to pay fairness in our Fair Pay Report 2023 at: home.barclays/annualreport + Our UK pay gap figures for 2023 and narrative explaining them are at: home.barclays/diversity Notes: 1 Page 317 includes a reconciliation of financial results excluding the impact of Q423 structural cost actions for 2023 and the impact of the Over-issuance of Securities for 2022. 2 Source: Dealogic. 3 Global Markets rank and revenue share based on Barclays’ calculations using peer-reported financials. Top 10 peer group includes Barclays, Bank of America, Citigroup, Goldman Sachs, JPMorgan Chase & Co, Morgan Stanley, BNP Paribas, Credit Suisse, Deutsche Bank and UBS. 4 Source: Dealogic for period covering 1 January 2023 to 31 December 2023. UK rank based on UK investment bank revenue by bank for full year 2023. Strategy Climate and sustainability report Risk review Financial review Financial statements Barclays PLC 2023 Annual Report on Form 20-F 119Governance Remuneration report
The Committee has maintained its focus on ensuring we reward performance that is sustainable. During 2023 the management team has been embedding a new operating standard – Consistently Excellent – which aims to transform the operational resilience of Barclays. Raising our operating standards and reducing the impact on financial performance of unexpected issues will strengthen our foundation to deliver sustainable performance. This was reflected in our objective setting, performance assessment and reward processes for senior colleagues for 2023, and in our recognition platform for all colleagues, and will be embedded more deeply and widely during 2024. Striving to achieve a consistently excellent standard is becoming part of our culture, and initial feedback suggests our work to equip all colleagues with the right skills to achieve this resonates as a way of driving long-term success. Colleague remuneration Alongside rewarding sustainable performance, our Fair Pay Agenda continues to underpin all our remuneration decisions – ensuring we are paying colleagues fairly for the work they do and recognising the contributions of all, within the resources available to us. This is especially pertinent given the challenges colleagues continue to face – particularly those who are lower-paid, given higher- than-normal increases in the cost of living over recent years. You can read more in the 'Wider workforce remuneration' section on page 204 and in our sixth annual Fair Pay Report published alongside this Annual Report. We have also published our pay gap figures for employees in the UK and in Ireland. Paying at least a living wage to all our colleagues is a central element of our Fair Pay Agenda. We continue to ensure we meet or exceed living wage benchmarks in every jurisdiction in which our employees are based. In the UK our employees already received more than the Living Wage Foundation’s benchmarks, and we are further increasing our minimum UK full-time equivalent salary to £24,000. We continue to meet or exceed Fair Wage Network living wage benchmarks in all other countries. We have continued our work to be simpler, more transparent and more consistent in how we pay our more-junior colleagues. For more junior roles in Barclays UK and the support functions in the UK, we publish starting salaries by role – providing transparency for job candidates and existing staff alike. From 2023, the performance rating of each individual across this population consistently drives their annual bonus outcome as a percentage of their salary. In previous years a range of different approaches were used and the annual bonus outcomes for many of these roles were discretionary. In setting this year's incentive pool we considered Barclays’ financial and non- financial performance, and the performance of the individual businesses that make up the Group, in both absolute and relative terms. We considered each business's contribution to the achievement of our strategic targets and its importance to our future success. The Committee also wanted to recognise the resilience across our operating businesses, delivered against a backdrop of macroeconomic uncertainty, as well as the support our colleagues provided to customers and clients. Taking all of this into account, the Committee has approved a Group incentive pool for 2023 performance of £1,745m (2022: £1,790m), down 3% compared to the final incentive pool for 2022, which included a c.£500m reduction for risk and control issues that came to light during 2022. Risk and conduct adjustments to the 2023 incentive pool are materially less than those for 2022, so the incentive pool before risk adjustments each year fell by c.15% from 2023 to 2022. This level of incentive funding for 2023 reflects the lower year-on-year financial outcomes in some business areas, while also enabling us to reward colleagues for the performance delivered – recognising the progress made towards our strategic priorities and our ambition to be consistently excellent in our operations. We also considered the competitive market for hiring and retaining the talent we need to achieve those priorities in the future. In doing so, we weighed the views and expectations of you as shareholders, of our customers and clients, of our colleagues, and of our stakeholders in wider society. Consistent with our Fair Pay Agenda, we have chosen to protect the incentive outcomes for our more junior colleagues – so, in business areas where incentive spend was down year on year, more senior colleagues experienced greater reductions in annual bonus awards. As always, a significant portion of the pool will be delivered in shares, most of which will be deferred over a number of years. Executive Director remuneration Determining Executive Directors' pay outcomes The Committee considered the Executive Directors’ annual bonus outcomes in the context of the Group’s performance and the performance of each Executive Director during 2023. The 2023 annual bonus outcome for C.S. Venkatakrishnan (known as Venkat) was 53.3% of maximum, and for Anna Cross was 54.3% of maximum (2022: 75.4% for both). Profit before tax provided a 21.1% outcome out of a possible 50%, and the cost: income ratio provided a 2.7% outcome out of a possible 10%. Performance against the strategic non- financial measures was good, which resulted in a 16.5% outcome out of a possible 25% and the performance of each of the Executive Directors against their personal objectives was also assessed and taken into account (13.0% for Venkat and 14.0% for Anna out of a possible 15%). Before finalising those outcomes, the Committee reflected on their appropriateness. We reviewed the underlying financial health of the Group, which is strong and well-capitalised. We considered the bonus outcomes in the context of those for the wider workforce, ensuring suitable alignment both this year and over a multi-year period, and also compared to historical outcomes for the Executive Directors in the context of performance each year. We concluded that the outcomes are appropriate in the context of the performance achieved and that no further discretionary adjustment was warranted. Neither Venkat nor Anna Cross participated in the 2021-2023 LTIP cycle, as neither was an Executive Director at the time those awards were granted. The Committee did, however, assess performance against the measures for this LTIP cycle to determine the vesting outcome for the previous Group Finance Director, who is the sole remaining participant. This was 53.2% of the maximum, as outlined later in this report. The Committee decided to grant awards under the 2024-2026 LTIP cycle with a face value at grant of 140% of Fixed Pay for Venkat and 134% of Fixed Pay for Anna Cross, reflecting the personal contribution made by each to a solid 2023 performance – and to provide each with a significant incentive award subject to forward-looking performance conditions during 2024 to 2026. Strategy Climate and sustainability report Risk review Financial review Financial statements Barclays PLC 2023 Annual Report on Form 20-F 120Governance Remuneration report (continued)
The Executive Directors' pay in 2024 The Committee carefully considered the performance measures for the Executive Directors’ 2024 annual bonus and the 2024-2026 LTIP, and updated elements of both the financial and non-financial measures in each plan to better reflect the revised targets set out under 'Our strategy' from page 11, and our long-term climate strategy. For the 2024 annual bonus, a total operating expenses measure replaces cost: income ratio – reflecting the continued importance of cost discipline while providing a more focused and simpler measure of cost control within the year. Other financial measures and weightings in the bonus are unchanged. For the 2024-2026 LTIP we have increased slightly the weighting of RoTE, from 25% to 30%, given the focus on improving RoTE within the Group's 2026 targets. This is accommodated via a small reduction to the weighting of the relative total shareholder return measure from 25% to 20%. All other financial measures in the LTIP remain unchanged from the previous year's award, including the continued use of cost: income ratio as a longer-term cost measure. We also reviewed the non-financial measures for both the 2024 annual bonus and 2024-2026 LTIP, to ensure they reflect the Group’s shorter- and longer- term priorities. Our commitment to align our financing with the goals and timelines of the Paris Climate Agreement has been and remains a key component of our climate strategy. Many of our climate and sustainability targets are longer term, including through to 2050, and progress towards these is expected to be non- linear. As such, we have retained the Climate & sustainability category within the Strategic non-financial assessment for the annual bonus and LTIP, but increased its weighting in the LTIP from 10% to 15% – accommodating this by reducing the weighting of the LTIP risk-related measures (which this year also incorporate assessment of operational excellence) from 10% to 5%. At the same time the ways we approach and monitor risk, and ensure a high standard of operational performance, are fundamental to delivering sustainable performance every year. To reflect our focus on this across Barclays, we have included a Risk & operational excellence category within the Strategic non-financial element of the 2024 annual bonus, with a weighting of 10% – accommodated via a slight reduction in the weighting of other Strategic non-financial bonus measures. The Climate & sustainability, Customers & clients, and Colleagues categories are each weighted 5%. The Committee will continue to review the measures and weightings for the Executive Directors' incentives each year, to ensure they appropriately support the delivery of our strategy and reflect our priorities. In early 2024, the Committee reviewed the level of Fixed Pay for Venkat and Anna Cross, in the same way and at the same time as fixed pay was reviewed for the wider workforce. The Committee increased Fixed Pay by 2.5% for both Venkat and Anna, resulting in Fixed Pay of £2,947,000 and £1,845,000 respectively, effective from 1 March 2024. These percentage increases are significantly lower than the average across the wider workforce, in particular for other UK employees within the scope of the 2024 UK pay deal with the union Unite – with a 5.55% budget for salary increases for junior employees and a 3.75% budget for other union-recognised employees. Even following these Fixed Pay increases, the total compensation opportunity for each Executive Director remains well behind the median opportunity for equivalent roles across our international banking peer group. Shareholder alignment Of the total variable pay awards to Venkat and Anna Cross in respect of 2023 performance (2023 annual bonus plus 2024-2026 LTIP), 96% and 94% respectively will be in shares that must be retained for a period of between one and eight years from grant – aligning the Executive Directors' interests with those of our shareholders. Both Venkat and Anna Cross already have significant shareholdings. Group Chair and Non-Executive Director fees The Committee periodically reviews the Group Chair's fee, and the Directors' Remuneration Policy allows for increases of up to 20% during the policy's three-year term. The Committee last increased the Group Chair's fee with effect from 1 January 2023, having considered the fee in the context of the Chair fees paid across our international banking peer group – with a particular focus on the UK banks, given the regional differences in both the role and pay for non-executive directors including chairs. Prior to that, this fee had remained at the same level since 2015. Early in 2024, the Committee approved a 2% increase in the Group Chair's fee, from £840,000 to £856,800, effective 1 January 2024. Each year £100,000 of the fee will continue to be used to purchase Barclays shares that will be retained on the Group Chair's behalf until he retires from the Board. No other changes were made to the Group Chair's remuneration arrangements or benefits. In January 2024 the Board reviewed the other Non-Executive Directors' fees, which were also last increased with effect from 1 January 2023, and approved 2% increases to those fees effective 1 January 2024 (with the relevant Non- Executive Directors having recused themselves from those discussions). Update in respect of Jes Staley's remuneration As outlined in the 2021 Annual Report, Jes Staley stepped down from the role of Group Chief Executive on 31 October 2021 and his unvested awards were suspended pending further developments in respect of the regulatory and legal proceedings related to the FCA and PRA investigation regarding Mr Staley. In October 2023, the FCA issued a Decision Notice in relation to Mr Staley. Strategy Climate and sustainability report Risk review Financial review Financial statements Barclays PLC 2023 Annual Report on Form 20-F 121Governance Remuneration report (continued)
The Committee considered the detailed findings in this Decision Notice and concluded that Mr Staley should be ineligible for or forfeit a number of his awards, including the bonus award in respect of the 2021 performance year, all of his unvested LTIP awards – both those for which the performance had already been assessed and those still subject to performance conditions – and his other unvested deferred bonus awards from earlier years. The total value of the lapsed LTIP awards and forfeited deferred bonus awards at that time was £17.8m. Looking ahead As we move into 2024, the Committee maintains its commitment to rewarding sustainable performance. We will use our remuneration policies and practices to incentivise the Executive Directors and the management team to deliver our three year plan, improving operational and financial performance, and improving shareholder returns. We will support the management team to use performance management and pay: – to align the wider workforce to those same priorities – to reinforce the importance of good conduct, strong controls and risk management and – to support Barclays' Purpose, Values and Mindset, and its culture of operating at a consistently excellent standard. We will continue to engage with our shareholders and other stakeholders on pay and will be meeting with our largest shareholders to discuss our pay outcomes for 2023. Beyond this, we will maintain focus on our Fair Pay Agenda, continuing to support our colleagues and ensuring the way we pay our people supports the long-term health and success of the Group. Brian Gilvary Chair, Board Remuneration Committee February 2024 Removal of the regulatory requirement to operate a 2:1 'bonus cap' With effect from 31 October 2023, the PRA and FCA removed the UK regulatory requirement for certain banks, including Barclays, to apply a maximum 1:1 ratio of variable to fixed remuneration for employees who are deemed to have a material risk impact on their firm – known as Material Risk Takers (MRTs) – or up to a 2:1 ratio if shareholders approve the adoption of that higher maximum. Our shareholders approved the adoption of a 2:1 maximum ratio for Barclays MRTs around the time that these regulations first came into effect. Going forward, such banks – including Barclays – will be permitted to set their maximum variable pay ratios to be greater than 2:1. As the new regulations were published close to the end of 2023, the Committee determined that the 2:1 cap would continue to apply in Barclays for the 2023 performance year. The Committee will consider this further in respect of 2024 and future years. A relatively small number of our employees are potentially impacted by this regulatory change. Our Executive Directors’ maximum variable pay opportunity is governed by the Directors' Remuneration Policy that shareholders approved at our 2023 AGM, and therefore is unchanged by these new regulations. The Directors' Remuneration Policy will continue to apply until a new policy is approved by shareholders. No new Directors' Remuneration Policy is proposed for 2024. Strategy Climate and sustainability report Risk review Financial review Financial statements Barclays PLC 2023 Annual Report on Form 20-F 122Governance Remuneration report (continued)
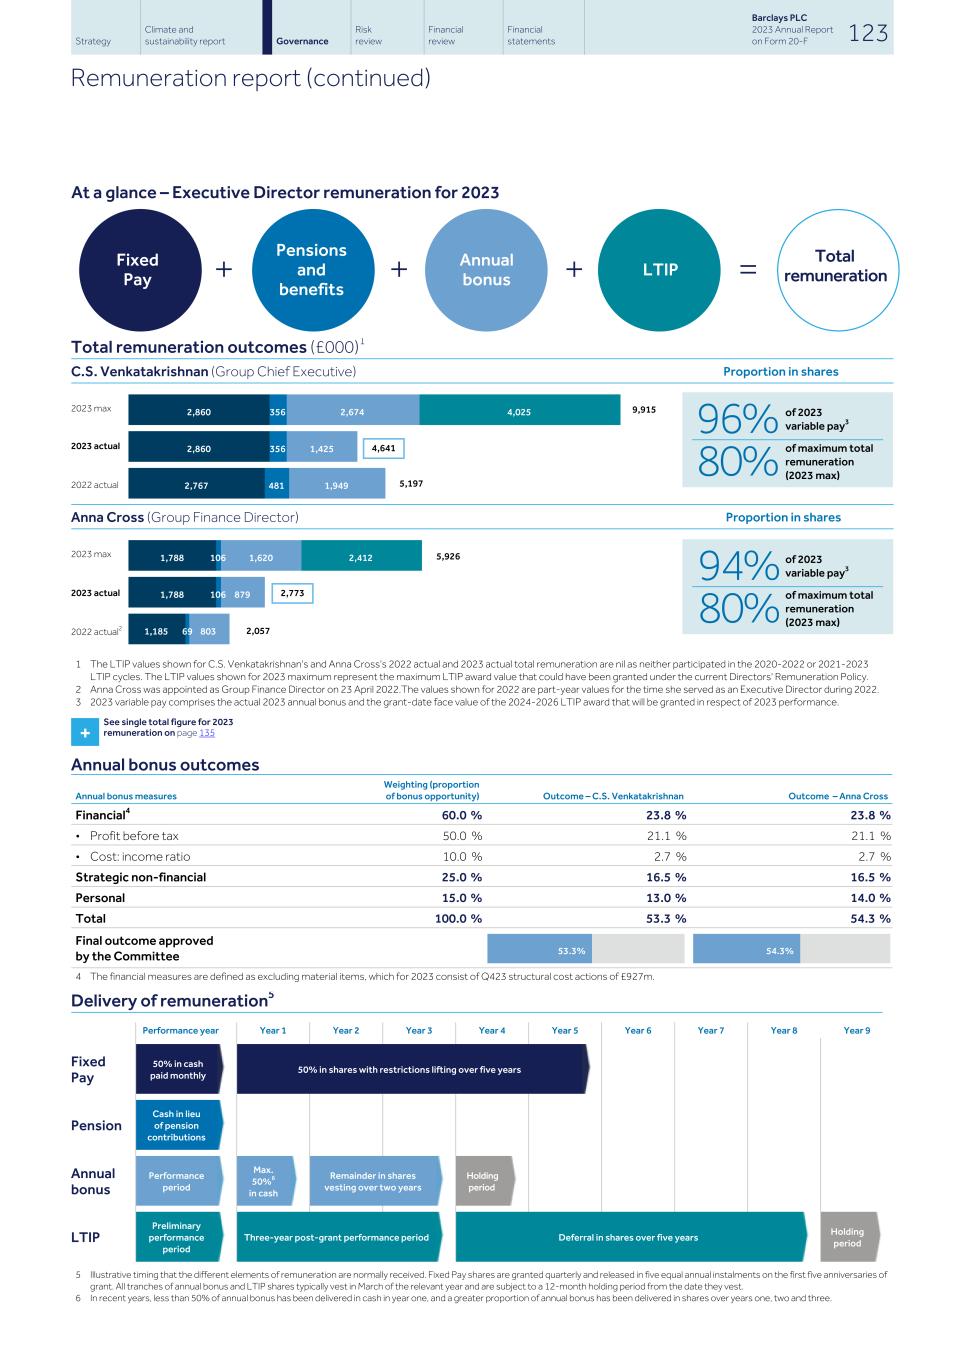
At a glance – Executive Director remuneration for 2023 Fixed Pay + Pensions and benefits + Annual bonus + LTIP = Total remuneration Total remuneration outcomes (£000)1 C.S. Venkatakrishnan (Group Chief Executive) Proportion in shares 2023 max 2023 actual 2022 actual 2,860 2,860 2,767 356 356 481 2,674 1,425 1,949 4,025 96% of 2023 variable pay3 80% of maximum total remuneration (2023 max) Anna Cross (Group Finance Director) Proportion in shares 2023 max 2023 actual 2022 actual2 1,788 1,788 1,185 106 106 69 1,620 879 803 2,412 94% of 2023 variable pay3 80% of maximum total remuneration (2023 max) 1 The LTIP values shown for C.S. Venkatakrishnan's and Anna Cross's 2022 actual and 2023 actual total remuneration are nil as neither participated in the 2020-2022 or 2021-2023 LTIP cycles. The LTIP values shown for 2023 maximum represent the maximum LTIP award value that could have been granted under the current Directors' Remuneration Policy. 2 Anna Cross was appointed as Group Finance Director on 23 April 2022.The values shown for 2022 are part-year values for the time she served as an Executive Director during 2022. 3 2023 variable pay comprises the actual 2023 annual bonus and the grant-date face value of the 2024-2026 LTIP award that will be granted in respect of 2023 performance. + See single total figure for 2023 remuneration on page 135 Annual bonus outcomes Annual bonus measures Weighting (proportion of bonus opportunity) Outcome – C.S. Venkatakrishnan Outcome – Anna Cross Financial4 60.0 % 23.8 % 23.8 % • Profit before tax 50.0 % 21.1 % 21.1 % • Cost: income ratio 10.0 % 2.7 % 2.7 % Strategic non-financial 25.0 % 16.5 % 16.5 % Personal 15.0 % 13.0 % 14.0 % Total 100.0 % 53.3 % 54.3 % Final outcome approved by the Committee 4 The financial measures are defined as excluding material items, which for 2023 consist of Q423 structural cost actions of £927m. Delivery of remuneration5 Performance year Year 1 Year 2 Year 3 Year 4 Year 5 Year 6 Year 7 Year 8 Year 9 Fixed Pay 50% in cash paid monthly 50% in shares with restrictions lifting over five years Pension Cash in lieu of pension contributions Annual bonus Performance period Max. 50%6 in cash Remainder in shares vesting over two years Holding period LTIP Preliminary performance period Three-year post-grant performance period Deferral in shares over five years Holding period 5 Illustrative timing that the different elements of remuneration are normally received. Fixed Pay shares are granted quarterly and released in five equal annual instalments on the first five anniversaries of grant. All tranches of annual bonus and LTIP shares typically vest in March of the relevant year and are subject to a 12-month holding period from the date they vest. 6 In recent years, less than 50% of annual bonus has been delivered in cash in year one, and a greater proportion of annual bonus has been delivered in shares over years one, two and three. Strategy Climate and sustainability report Risk review Financial review Financial statements Barclays PLC 2023 Annual Report on Form 20-F 123Governance Remuneration report (continued) 53.3% 54.3% 9,915 4,641 5,197 5,926 2,773 2,057
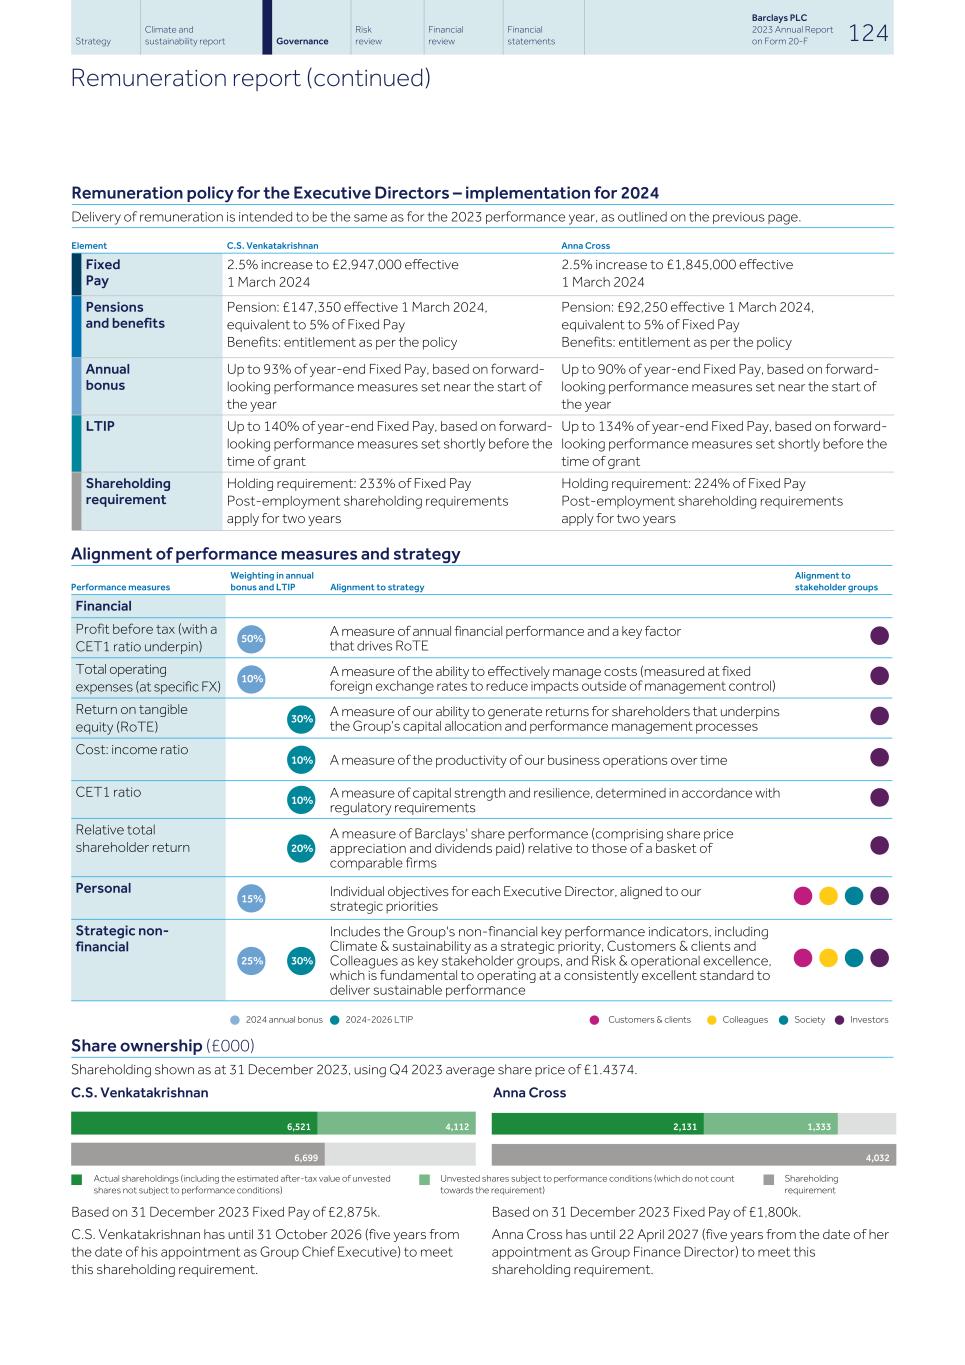
••••••• •• Remuneration policy for the Executive Directors – implementation for 2024 Delivery of remuneration is intended to be the same as for the 2023 performance year, as outlined on the previous page. Element C.S. Venkatakrishnan Anna Cross Fixed Pay 2.5% increase to £2,947,000 effective 1 March 2024 2.5% increase to £1,845,000 effective 1 March 2024 Pensions and benefits Pension: £147,350 effective 1 March 2024, equivalent to 5% of Fixed Pay Benefits: entitlement as per the policy Pension: £92,250 effective 1 March 2024, equivalent to 5% of Fixed Pay Benefits: entitlement as per the policy Annual bonus Up to 93% of year-end Fixed Pay, based on forward- looking performance measures set near the start of the year Up to 90% of year-end Fixed Pay, based on forward- looking performance measures set near the start of the year LTIP Up to 140% of year-end Fixed Pay, based on forward- looking performance measures set shortly before the time of grant Up to 134% of year-end Fixed Pay, based on forward- looking performance measures set shortly before the time of grant Shareholding requirement Holding requirement: 233% of Fixed Pay Post-employment shareholding requirements apply for two years Holding requirement: 224% of Fixed Pay Post-employment shareholding requirements apply for two years Alignment of performance measures and strategy Performance measures Weighting in annual bonus and LTIP Alignment to strategy Alignment to stakeholder groups Financial Profit before tax (with a CET1 ratio underpin) 50% A measure of annual financial performance and a key factor that drives RoTE • Total operating expenses (at specific FX) 10% A measure of the ability to effectively manage costs (measured at fixed foreign exchange rates to reduce impacts outside of management control) • Return on tangible equity (RoTE) 30% A measure of our ability to generate returns for shareholders that underpins the Group’s capital allocation and performance management processes • Cost: income ratio 10% A measure of the productivity of our business operations over time • CET1 ratio 10% A measure of capital strength and resilience, determined in accordance with regulatory requirements • Relative total shareholder return 20% A measure of Barclays' share performance (comprising share price appreciation and dividends paid) relative to those of a basket of comparable firms • Personal 15% Individual objectives for each Executive Director, aligned to our strategic priorities •••• Strategic non- financial 25% 30% Includes the Group's non-financial key performance indicators, including Climate & sustainability as a strategic priority, Customers & clients and Colleagues as key stakeholder groups, and Risk & operational excellence, which is fundamental to operating at a consistently excellent standard to deliver sustainable performance •••• l 2024 annual bonus l 2024-2026 LTIP l Customers & clients l Colleagues l Society l Investors Share ownership (£000) Shareholding shown as at 31 December 2023, using Q4 2023 average share price of £1.4374. C.S. Venkatakrishnan Anna Cross 6,521 4,112 6,699 Based on 31 December 2023 Fixed Pay of £2,875k. C.S. Venkatakrishnan has until 31 October 2026 (five years from the date of his appointment as Group Chief Executive) to meet this shareholding requirement. 2,131 1,333 4,032 Based on 31 December 2023 Fixed Pay of £1,800k. Anna Cross has until 22 April 2027 (five years from the date of her appointment as Group Finance Director) to meet this shareholding requirement. Strategy Climate and sustainability report Risk review Financial review Financial statements Barclays PLC 2023 Annual Report on Form 20-F 124Governance Remuneration report (continued) ¢ Actual shareholdings (including the estimated after-tax value of unvested shares not subject to performance conditions) ¢ Unvested shares subject to performance conditions (which do not count towards the requirement) ¢ Shareholding requirement
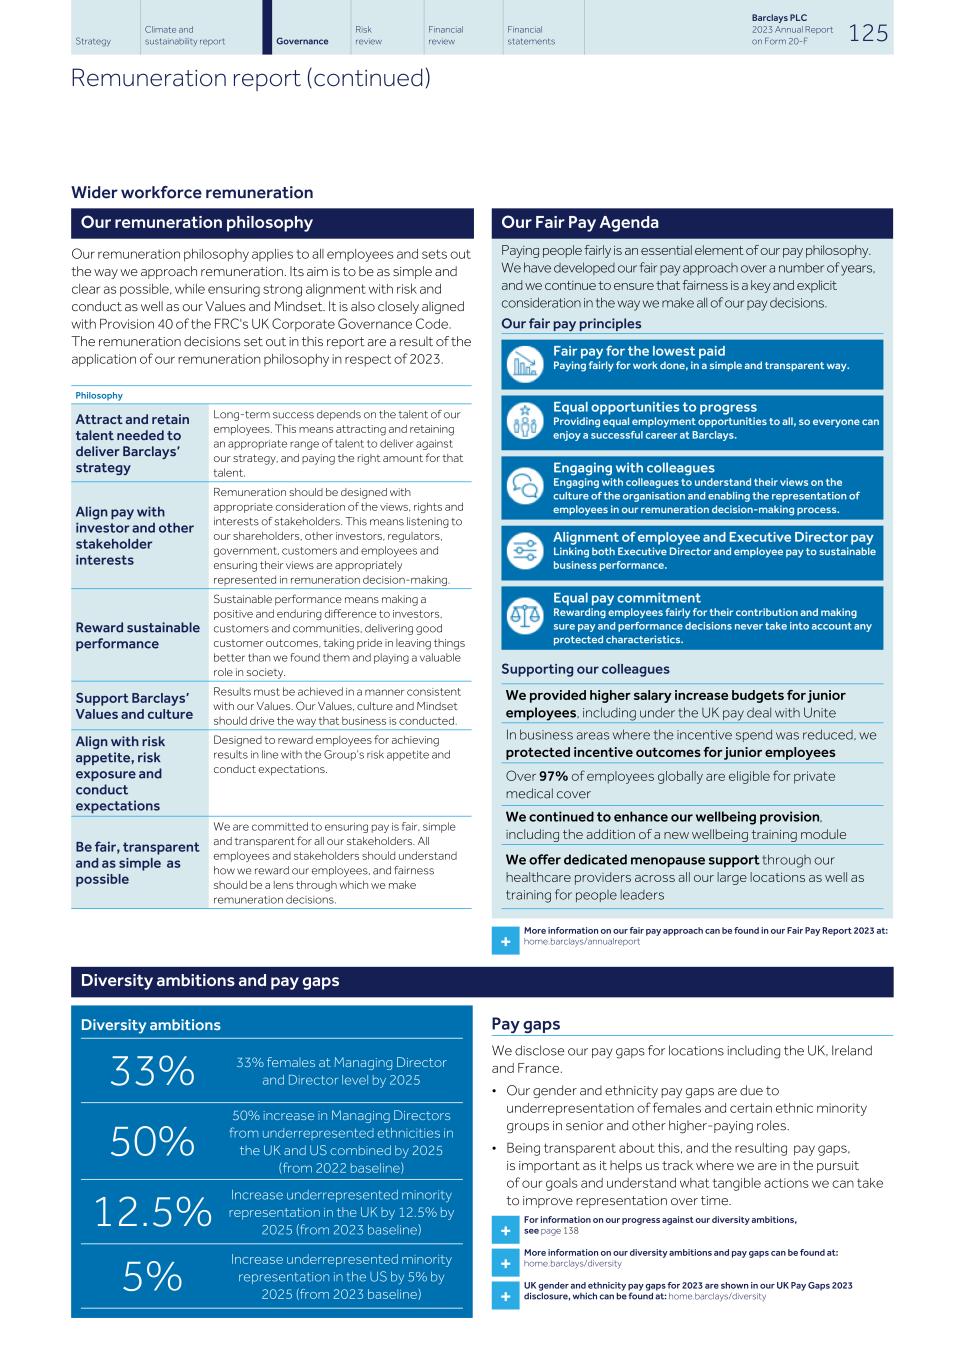
Wider workforce remuneration Our remuneration philosophy Our remuneration philosophy applies to all employees and sets out the way we approach remuneration. Its aim is to be as simple and clear as possible, while ensuring strong alignment with risk and conduct as well as our Values and Mindset. It is also closely aligned with Provision 40 of the FRC's UK Corporate Governance Code. The remuneration decisions set out in this report are a result of the application of our remuneration philosophy in respect of 2023. Philosophy Attract and retain talent needed to deliver Barclays’ strategy Long-term success depends on the talent of our employees. This means attracting and retaining an appropriate range of talent to deliver against our strategy, and paying the right amount for that talent. Align pay with investor and other stakeholder interests Remuneration should be designed with appropriate consideration of the views, rights and interests of stakeholders. This means listening to our shareholders, other investors, regulators, government, customers and employees and ensuring their views are appropriately represented in remuneration decision-making. Reward sustainable performance Sustainable performance means making a positive and enduring difference to investors, customers and communities, delivering good customer outcomes, taking pride in leaving things better than we found them and playing a valuable role in society. Support Barclays’ Values and culture Results must be achieved in a manner consistent with our Values. Our Values, culture and Mindset should drive the way that business is conducted. Align with risk appetite, risk exposure and conduct expectations Designed to reward employees for achieving results in line with the Group’s risk appetite and conduct expectations. Be fair, transparent and as simple as possible We are committed to ensuring pay is fair, simple and transparent for all our stakeholders. All employees and stakeholders should understand how we reward our employees, and fairness should be a lens through which we make remuneration decisions. Diversity ambitions and pay gaps Diversity ambitions 33% 33% females at Managing Director and Director level by 2025 50% 50% increase in Managing Directors from underrepresented ethnicities in the UK and US combined by 2025 (from 2022 baseline) 12.5% Increase underrepresented minority representation in the UK by 12.5% by 2025 (from 2023 baseline) 5% Increase underrepresented minority representation in the US by 5% by 2025 (from 2023 baseline) Our Fair Pay Agenda Paying people fairly is an essential element of our pay philosophy. We have developed our fair pay approach over a number of years, and we continue to ensure that fairness is a key and explicit consideration in the way we make all of our pay decisions. Our fair pay principles Fair pay for the lowest paid Paying fairly for work done, in a simple and transparent way. Equal opportunities to progress Providing equal employment opportunities to all, so everyone can enjoy a successful career at Barclays. Engaging with colleagues Engaging with colleagues to understand their views on the culture of the organisation and enabling the representation of employees in our remuneration decision-making process. Alignment of employee and Executive Director pay Linking both Executive Director and employee pay to sustainable business performance. Equal pay commitment Rewarding employees fairly for their contribution and making sure pay and performance decisions never take into account any protected characteristics. Supporting our colleagues We provided higher salary increase budgets for junior employees, including under the UK pay deal with Unite In business areas where the incentive spend was reduced, we protected incentive outcomes for junior employees Over 97% of employees globally are eligible for private medical cover We continued to enhance our wellbeing provision, including the addition of a new wellbeing training module We offer dedicated menopause support through our healthcare providers across all our large locations as well as training for people leaders + More information on our fair pay approach can be found in our Fair Pay Report 2023 at: home.barclays/annualreport Pay gaps We disclose our pay gaps for locations including the UK, Ireland and France. • Our gender and ethnicity pay gaps are due to underrepresentation of females and certain ethnic minority groups in senior and other higher-paying roles. • Being transparent about this, and the resulting pay gaps, is important as it helps us track where we are in the pursuit of our goals and understand what tangible actions we can take to improve representation over time. + For information on our progress against our diversity ambitions, see page 138 + More information on our diversity ambitions and pay gaps can be found at: home.barclays/diversity + UK gender and ethnicity pay gaps for 2023 are shown in our UK Pay Gaps 2023 disclosure, which can be found at: home.barclays/diversity Strategy Climate and sustainability report Risk review Financial review Financial statements Barclays PLC 2023 Annual Report on Form 20-F 125Governance Remuneration report (continued)
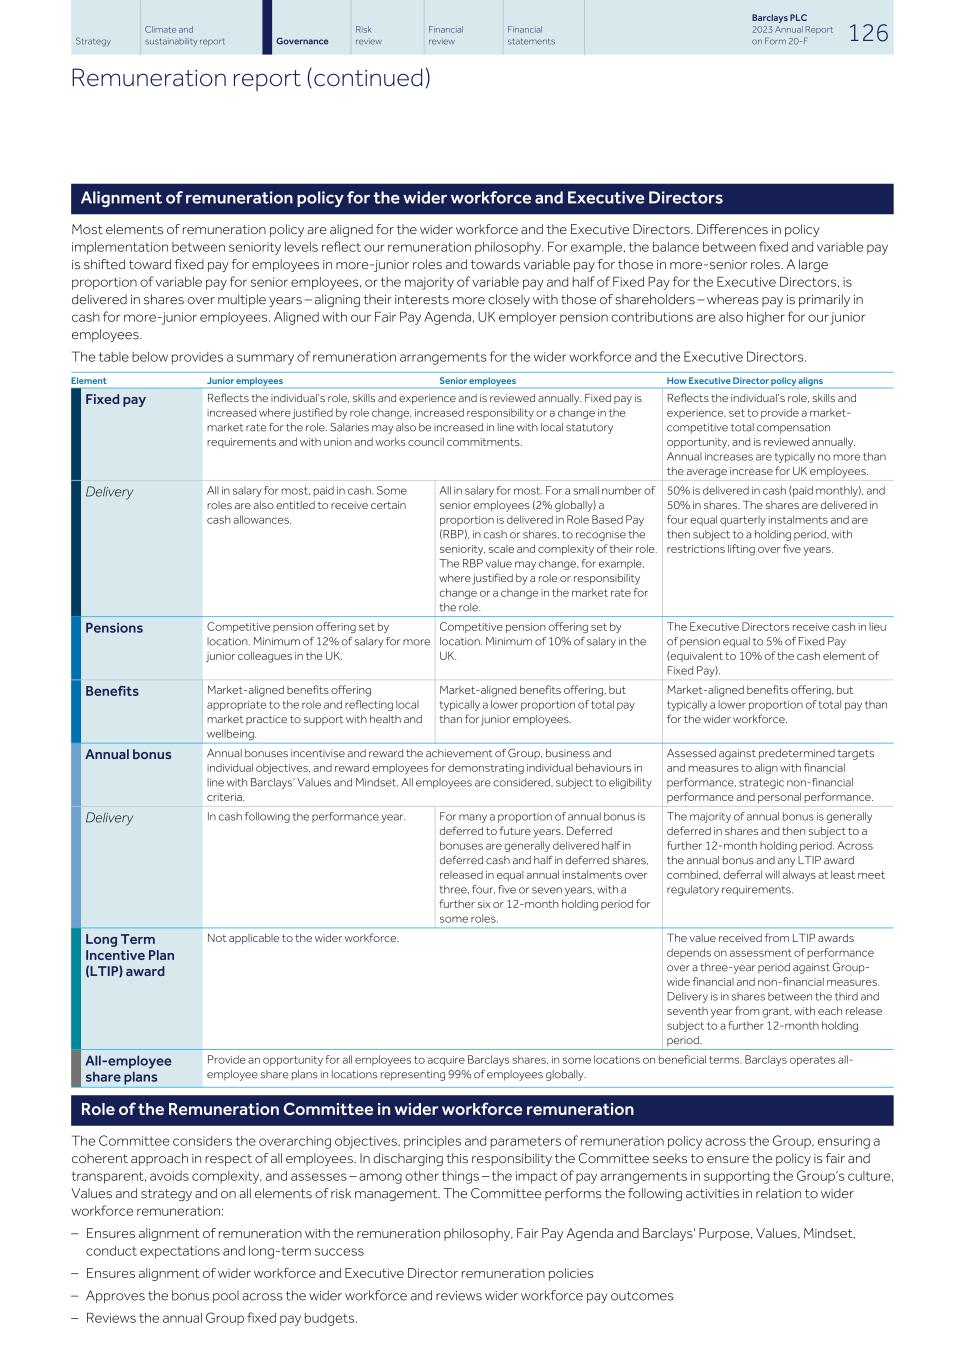
Alignment of remuneration policy for the wider workforce and Executive Directors Most elements of remuneration policy are aligned for the wider workforce and the Executive Directors. Differences in policy implementation between seniority levels reflect our remuneration philosophy. For example, the balance between fixed and variable pay is shifted toward fixed pay for employees in more-junior roles and towards variable pay for those in more-senior roles. A large proportion of variable pay for senior employees, or the majority of variable pay and half of Fixed Pay for the Executive Directors, is delivered in shares over multiple years – aligning their interests more closely with those of shareholders – whereas pay is primarily in cash for more-junior employees. Aligned with our Fair Pay Agenda, UK employer pension contributions are also higher for our junior employees. The table below provides a summary of remuneration arrangements for the wider workforce and the Executive Directors. Element Junior employees Senior employees How Executive Director policy aligns Fixed pay Reflects the individual’s role, skills and experience and is reviewed annually. Fixed pay is increased where justified by role change, increased responsibility or a change in the market rate for the role. Salaries may also be increased in line with local statutory requirements and with union and works council commitments. Reflects the individual’s role, skills and experience, set to provide a market- competitive total compensation opportunity, and is reviewed annually. Annual increases are typically no more than the average increase for UK employees. Delivery All in salary for most, paid in cash. Some roles are also entitled to receive certain cash allowances. All in salary for most. For a small number of senior employees (2% globally) a proportion is delivered in Role Based Pay (RBP), in cash or shares, to recognise the seniority, scale and complexity of their role. The RBP value may change, for example, where justified by a role or responsibility change or a change in the market rate for the role. 50% is delivered in cash (paid monthly), and 50% in shares. The shares are delivered in four equal quarterly instalments and are then subject to a holding period, with restrictions lifting over five years. Pensions Competitive pension offering set by location. Minimum of 12% of salary for more junior colleagues in the UK. Competitive pension offering set by location. Minimum of 10% of salary in the UK. The Executive Directors receive cash in lieu of pension equal to 5% of Fixed Pay (equivalent to 10% of the cash element of Fixed Pay). Benefits Market-aligned benefits offering appropriate to the role and reflecting local market practice to support with health and wellbeing. Market-aligned benefits offering, but typically a lower proportion of total pay than for junior employees. Market-aligned benefits offering, but typically a lower proportion of total pay than for the wider workforce. Annual bonus Annual bonuses incentivise and reward the achievement of Group, business and individual objectives, and reward employees for demonstrating individual behaviours in line with Barclays’ Values and Mindset. All employees are considered, subject to eligibility criteria. Assessed against predetermined targets and measures to align with financial performance, strategic non-financial performance and personal performance. Delivery In cash following the performance year. For many a proportion of annual bonus is deferred to future years. Deferred bonuses are generally delivered half in deferred cash and half in deferred shares, released in equal annual instalments over three, four, five or seven years, with a further six or 12-month holding period for some roles. The majority of annual bonus is generally deferred in shares and then subject to a further 12-month holding period. Across the annual bonus and any LTIP award combined, deferral will always at least meet regulatory requirements. Long Term Incentive Plan (LTIP) award Not applicable to the wider workforce. The value received from LTIP awards depends on assessment of performance over a three-year period against Group- wide financial and non-financial measures. Delivery is in shares between the third and seventh year from grant, with each release subject to a further 12-month holding period. All-employee share plans Provide an opportunity for all employees to acquire Barclays shares, in some locations on beneficial terms. Barclays operates all- employee share plans in locations representing 99% of employees globally. Role of the Remuneration Committee in wider workforce remuneration The Committee considers the overarching objectives, principles and parameters of remuneration policy across the Group, ensuring a coherent approach in respect of all employees. In discharging this responsibility the Committee seeks to ensure the policy is fair and transparent, avoids complexity, and assesses – among other things – the impact of pay arrangements in supporting the Group’s culture, Values and strategy and on all elements of risk management. The Committee performs the following activities in relation to wider workforce remuneration: – Ensures alignment of remuneration with the remuneration philosophy, Fair Pay Agenda and Barclays' Purpose, Values, Mindset, conduct expectations and long-term success – Ensures alignment of wider workforce and Executive Director remuneration policies – Approves the bonus pool across the wider workforce and reviews wider workforce pay outcomes – Reviews the annual Group fixed pay budgets. Strategy Climate and sustainability report Risk review Financial review Financial statements Barclays PLC 2023 Annual Report on Form 20-F 126Governance Remuneration report (continued)
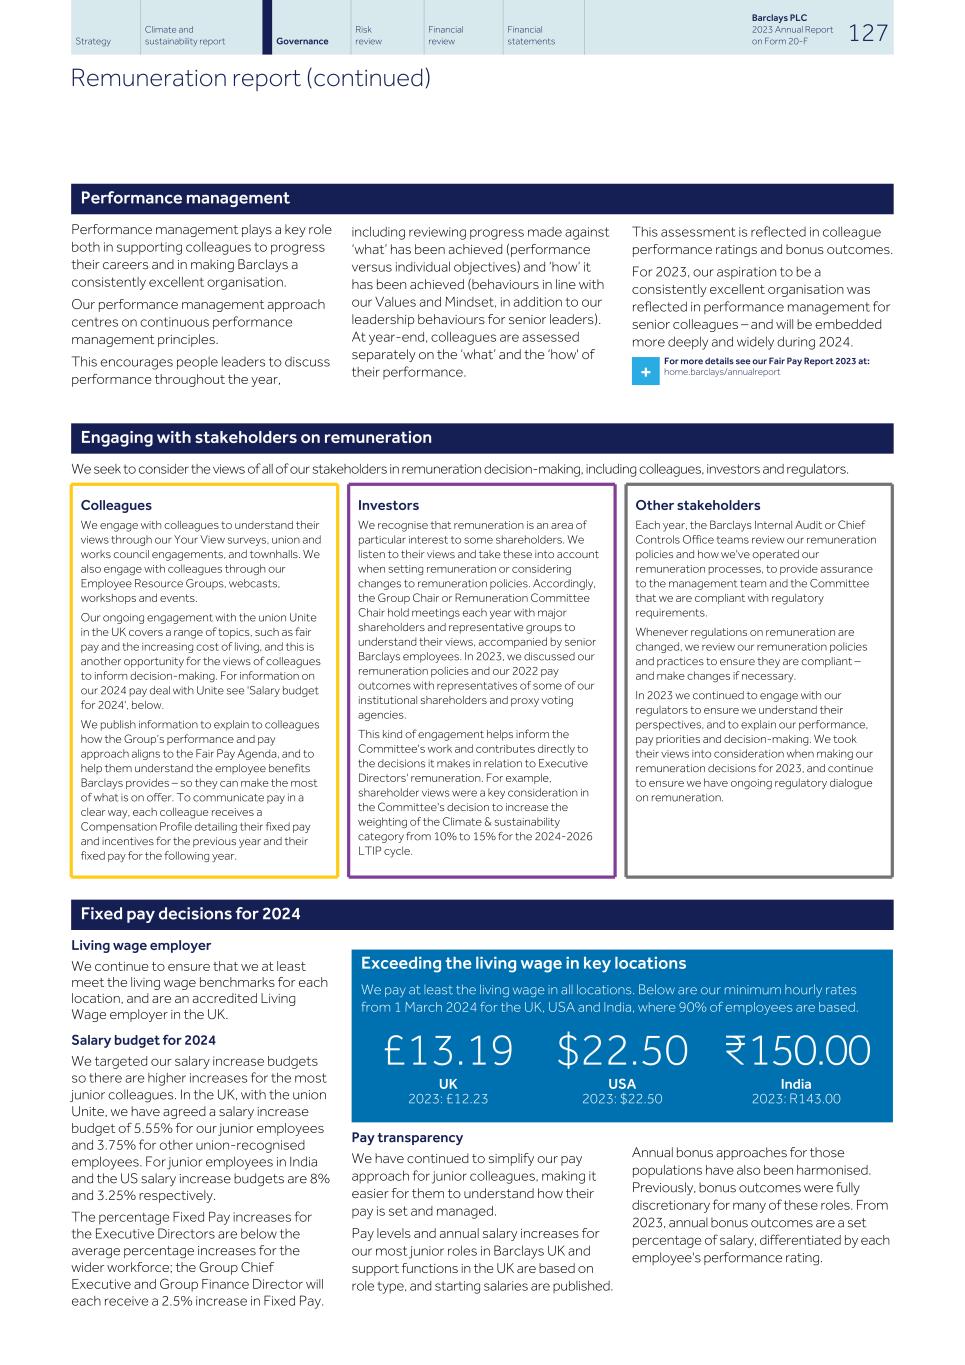
Performance management Performance management plays a key role both in supporting colleagues to progress their careers and in making Barclays a consistently excellent organisation. Our performance management approach centres on continuous performance management principles. This encourages people leaders to discuss performance throughout the year, including reviewing progress made against ‘what’ has been achieved (performance versus individual objectives) and ‘how’ it has been achieved (behaviours in line with our Values and Mindset, in addition to our leadership behaviours for senior leaders). At year-end, colleagues are assessed separately on the ‘what’ and the ‘how' of their performance. This assessment is reflected in colleague performance ratings and bonus outcomes. For 2023, our aspiration to be a consistently excellent organisation was reflected in performance management for senior colleagues – and will be embedded more deeply and widely during 2024. + For more details see our Fair Pay Report 2023 at: home.barclays/annualreport Engaging with stakeholders on remuneration We seek to consider the views of all of our stakeholders in remuneration decision-making, including colleagues, investors and regulators. Colleagues We engage with colleagues to understand their views through our Your View surveys, union and works council engagements, and townhalls. We also engage with colleagues through our Employee Resource Groups, webcasts, workshops and events. Our ongoing engagement with the union Unite in the UK covers a range of topics, such as fair pay and the increasing cost of living, and this is another opportunity for the views of colleagues to inform decision-making. For information on our 2024 pay deal with Unite see 'Salary budget for 2024', below. We publish information to explain to colleagues how the Group’s performance and pay approach aligns to the Fair Pay Agenda, and to help them understand the employee benefits Barclays provides – so they can make the most of what is on offer. To communicate pay in a clear way, each colleague receives a Compensation Profile detailing their fixed pay and incentives for the previous year and their fixed pay for the following year. Investors We recognise that remuneration is an area of particular interest to some shareholders. We listen to their views and take these into account when setting remuneration or considering changes to remuneration policies. Accordingly, the Group Chair or Remuneration Committee Chair hold meetings each year with major shareholders and representative groups to understand their views, accompanied by senior Barclays employees. In 2023, we discussed our remuneration policies and our 2022 pay outcomes with representatives of some of our institutional shareholders and proxy voting agencies. This kind of engagement helps inform the Committee's work and contributes directly to the decisions it makes in relation to Executive Directors' remuneration. For example, shareholder views were a key consideration in the Committee's decision to increase the weighting of the Climate & sustainability category from 10% to 15% for the 2024-2026 LTIP cycle. Other stakeholders Each year, the Barclays Internal Audit or Chief Controls Office teams review our remuneration policies and how we've operated our remuneration processes, to provide assurance to the management team and the Committee that we are compliant with regulatory requirements. Whenever regulations on remuneration are changed, we review our remuneration policies and practices to ensure they are compliant – and make changes if necessary. In 2023 we continued to engage with our regulators to ensure we understand their perspectives, and to explain our performance, pay priorities and decision-making. We took their views into consideration when making our remuneration decisions for 2023, and continue to ensure we have ongoing regulatory dialogue on remuneration. Fixed pay decisions for 2024 Living wage employer We continue to ensure that we at least meet the living wage benchmarks for each location, and are an accredited Living Wage employer in the UK. Salary budget for 2024 We targeted our salary increase budgets so there are higher increases for the most junior colleagues. In the UK, with the union Unite, we have agreed a salary increase budget of 5.55% for our junior employees and 3.75% for other union-recognised employees. For junior employees in India and the US salary increase budgets are 8% and 3.25% respectively. The percentage Fixed Pay increases for the Executive Directors are below the average percentage increases for the wider workforce; the Group Chief Executive and Group Finance Director will each receive a 2.5% increase in Fixed Pay. Exceeding the living wage in key locations We pay at least the living wage in all locations. Below are our minimum hourly rates from 1 March 2024 for the UK, USA and India, where 90% of employees are based. £13.19 UK 2023: £12.23 $22.50 USA 2023: $22.50 ₹150.00 India 2023: R143.00 Pay transparency We have continued to simplify our pay approach for junior colleagues, making it easier for them to understand how their pay is set and managed. Pay levels and annual salary increases for our most junior roles in Barclays UK and support functions in the UK are based on role type, and starting salaries are published. Annual bonus approaches for those populations have also been harmonised. Previously, bonus outcomes were fully discretionary for many of these roles. From 2023, annual bonus outcomes are a set percentage of salary, differentiated by each employee's performance rating. Strategy Climate and sustainability report Risk review Financial review Financial statements Barclays PLC 2023 Annual Report on Form 20-F 127Governance Remuneration report (continued)
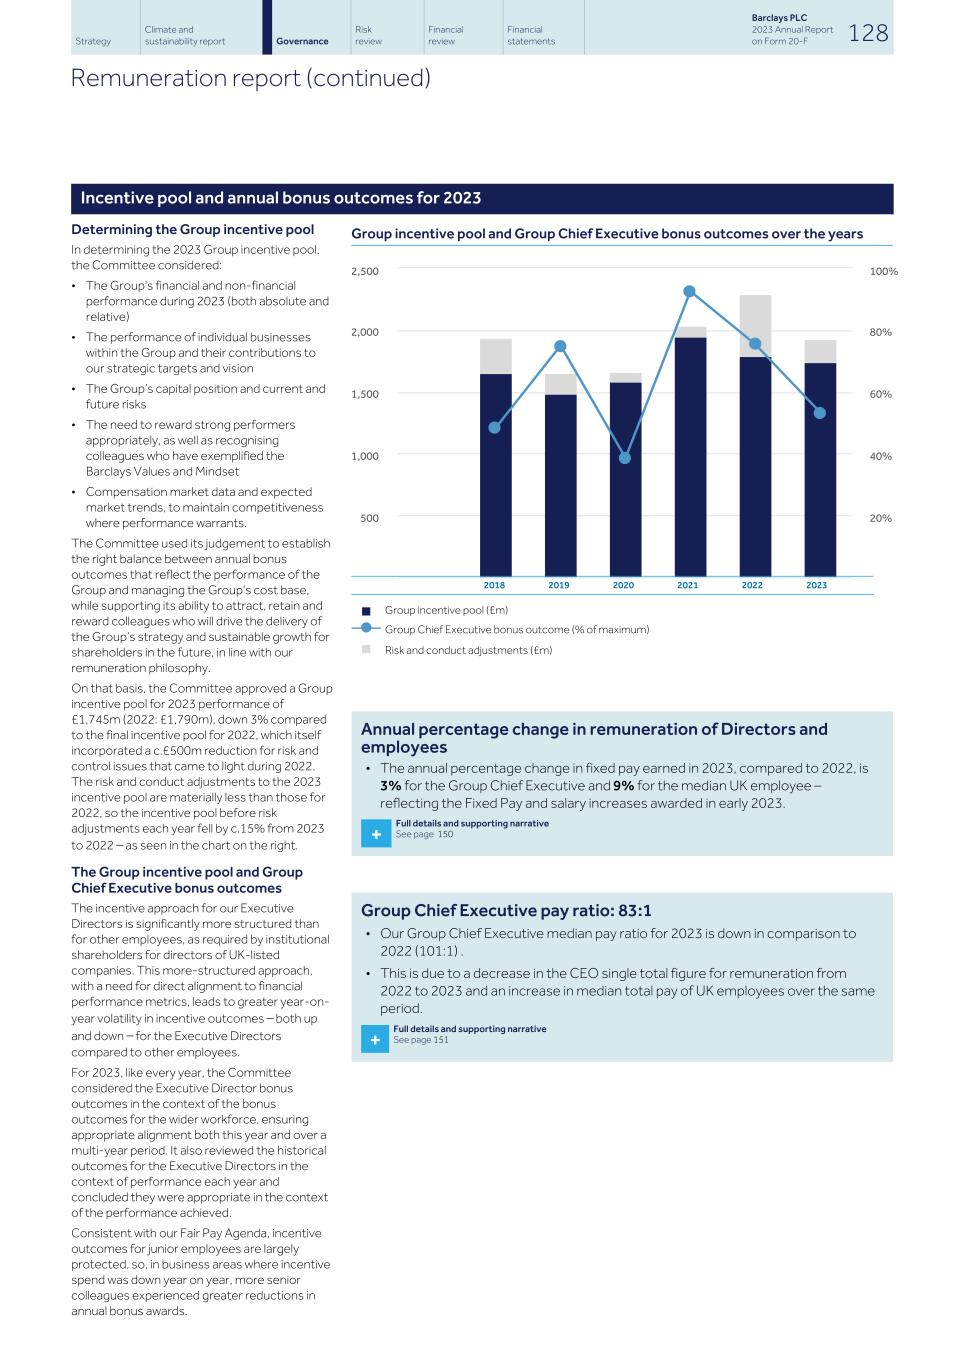
0 500 1,000 1,500 2,000 2,500 0% 20% 40% 60% 80% 100% Incentive pool and annual bonus outcomes for 2023 Determining the Group incentive pool In determining the 2023 Group incentive pool, the Committee considered: • The Group's financial and non-financial performance during 2023 (both absolute and relative) • The performance of individual businesses within the Group and their contributions to our strategic targets and vision • The Group’s capital position and current and future risks • The need to reward strong performers appropriately, as well as recognising colleagues who have exemplified the Barclays Values and Mindset • Compensation market data and expected market trends, to maintain competitiveness where performance warrants. The Committee used its judgement to establish the right balance between annual bonus outcomes that reflect the performance of the Group and managing the Group's cost base, while supporting its ability to attract, retain and reward colleagues who will drive the delivery of the Group’s strategy and sustainable growth for shareholders in the future, in line with our remuneration philosophy. On that basis, the Committee approved a Group incentive pool for 2023 performance of £1,745m (2022: £1,790m), down 3% compared to the final incentive pool for 2022, which itself incorporated a c.£500m reduction for risk and control issues that came to light during 2022. The risk and conduct adjustments to the 2023 incentive pool are materially less than those for 2022, so the incentive pool before risk adjustments each year fell by c.15% from 2023 to 2022 – as seen in the chart on the right. The Group incentive pool and Group Chief Executive bonus outcomes The incentive approach for our Executive Directors is significantly more structured than for other employees, as required by institutional shareholders for directors of UK-listed companies. This more-structured approach, with a need for direct alignment to financial performance metrics, leads to greater year-on- year volatility in incentive outcomes – both up and down – for the Executive Directors compared to other employees. For 2023, like every year, the Committee considered the Executive Director bonus outcomes in the context of the bonus outcomes for the wider workforce, ensuring appropriate alignment both this year and over a multi-year period. It also reviewed the historical outcomes for the Executive Directors in the context of performance each year and concluded they were appropriate in the context of the performance achieved. Consistent with our Fair Pay Agenda, incentive outcomes for junior employees are largely protected, so, in business areas where incentive spend was down year on year, more senior colleagues experienced greater reductions in annual bonus awards. Group incentive pool and Group Chief Executive bonus outcomes over the years 2018 2019 2020 2021 2022 2023 < Group incentive pool (£m) Group Chief Executive bonus outcome (% of maximum) < Risk and conduct adjustments (£m) Annual percentage change in remuneration of Directors and employees • The annual percentage change in fixed pay earned in 2023, compared to 2022, is 3% for the Group Chief Executive and 9% for the median UK employee – reflecting the Fixed Pay and salary increases awarded in early 2023. Group Chief Executive pay ratio: 83:1 • Our Group Chief Executive median pay ratio for 2023 is down in comparison to 2022 (101:1) . • This is due to a decrease in the CEO single total figure for remuneration from 2022 to 2023 and an increase in median total pay of UK employees over the same period. Strategy Climate and sustainability report Risk review Financial review Financial statements Barclays PLC 2023 Annual Report on Form 20-F 128Governance Remuneration report (continued) + Full details and supporting narrative See page 150 + Full details and supporting narrative See page 151
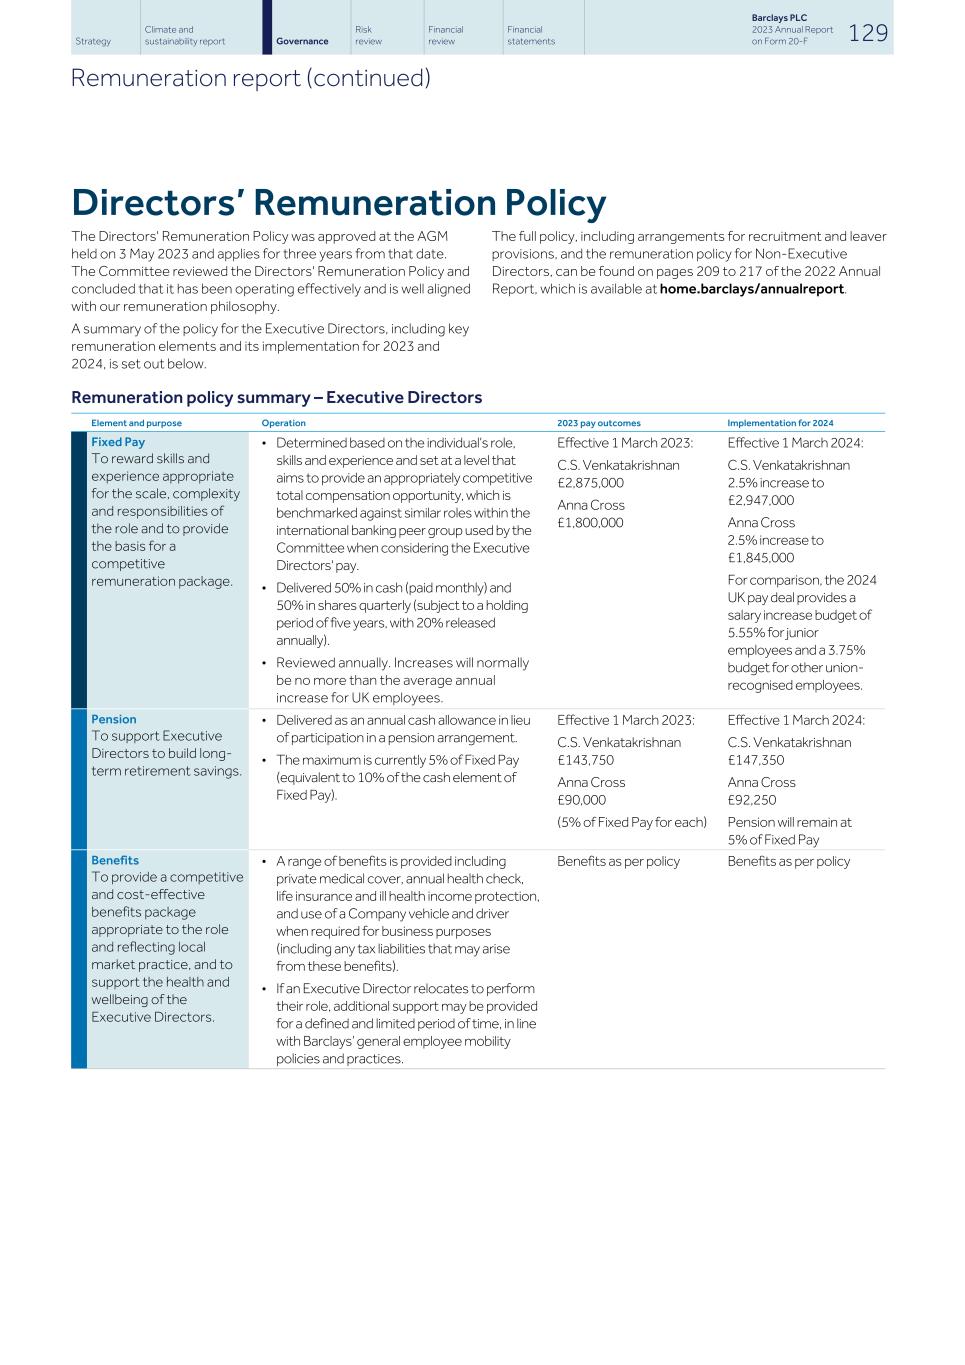
Directors’ Remuneration Policy The Directors' Remuneration Policy was approved at the AGM held on 3 May 2023 and applies for three years from that date. The Committee reviewed the Directors' Remuneration Policy and concluded that it has been operating effectively and is well aligned with our remuneration philosophy. A summary of the policy for the Executive Directors, including key remuneration elements and its implementation for 2023 and 2024, is set out below. The full policy, including arrangements for recruitment and leaver provisions, and the remuneration policy for Non-Executive Directors, can be found on pages 209 to 217 of the 2022 Annual Report, which is available at home.barclays/annualreport. Remuneration policy summary – Executive Directors Fixed Pay To reward skills and experience appropriate for the scale, complexity and responsibilities of the role and to provide the basis for a competitive remuneration package. • Determined based on the individual’s role, skills and experience and set at a level that aims to provide an appropriately competitive total compensation opportunity, which is benchmarked against similar roles within the international banking peer group used by the Committee when considering the Executive Directors' pay. • Delivered 50% in cash (paid monthly) and 50% in shares quarterly (subject to a holding period of five years, with 20% released annually). • Reviewed annually. Increases will normally be no more than the average annual increase for UK employees. Effective 1 March 2023: C.S. Venkatakrishnan £2,875,000 Anna Cross £1,800,000 Effective 1 March 2024: C.S. Venkatakrishnan 2.5% increase to £2,947,000 Anna Cross 2.5% increase to £1,845,000 For comparison, the 2024 UK pay deal provides a salary increase budget of 5.55% for junior employees and a 3.75% budget for other union- recognised employees. Pension To support Executive Directors to build long- term retirement savings. • Delivered as an annual cash allowance in lieu of participation in a pension arrangement. • The maximum is currently 5% of Fixed Pay (equivalent to 10% of the cash element of Fixed Pay). Effective 1 March 2023: C.S. Venkatakrishnan £143,750 Anna Cross £90,000 (5% of Fixed Pay for each) Effective 1 March 2024: C.S. Venkatakrishnan £147,350 Anna Cross £92,250 Pension will remain at 5% of Fixed Pay Benefits To provide a competitive and cost-effective benefits package appropriate to the role and reflecting local market practice, and to support the health and wellbeing of the Executive Directors. • A range of benefits is provided including private medical cover, annual health check, life insurance and ill health income protection, and use of a Company vehicle and driver when required for business purposes (including any tax liabilities that may arise from these benefits). • If an Executive Director relocates to perform their role, additional support may be provided for a defined and limited period of time, in line with Barclays’ general employee mobility policies and practices. Benefits as per policy Benefits as per policy Element and purpose Operation 2023 pay outcomes Implementation for 2024 Strategy Climate and sustainability report Risk review Financial review Financial statements Barclays PLC 2023 Annual Report on Form 20-F 129Governance Remuneration report (continued)
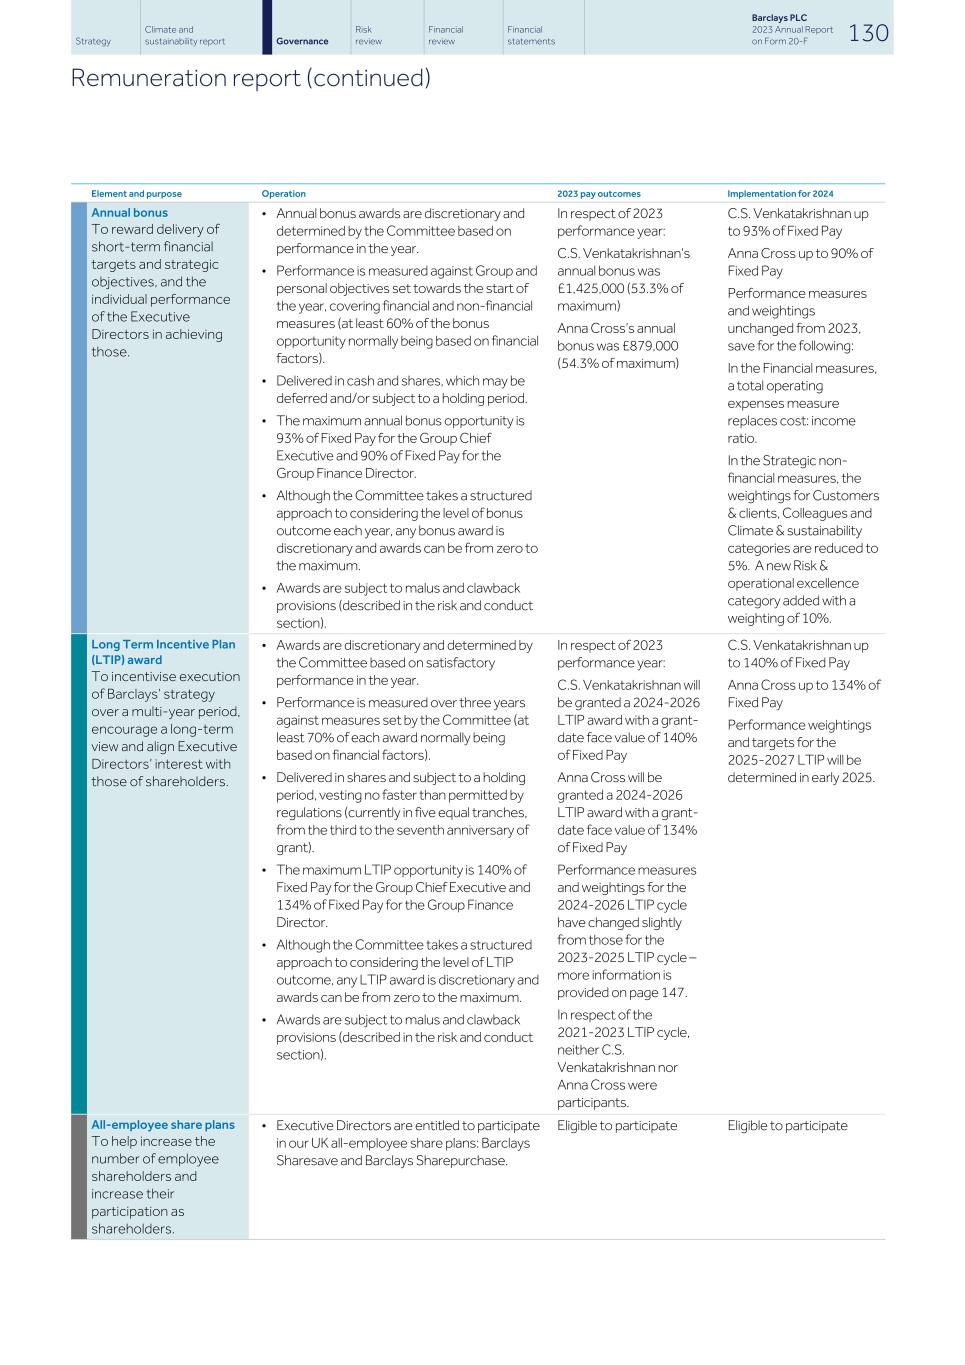
Annual bonus To reward delivery of short-term financial targets and strategic objectives, and the individual performance of the Executive Directors in achieving those. • Annual bonus awards are discretionary and determined by the Committee based on performance in the year. • Performance is measured against Group and personal objectives set towards the start of the year, covering financial and non-financial measures (at least 60% of the bonus opportunity normally being based on financial factors). • Delivered in cash and shares, which may be deferred and/or subject to a holding period. • The maximum annual bonus opportunity is 93% of Fixed Pay for the Group Chief Executive and 90% of Fixed Pay for the Group Finance Director. • Although the Committee takes a structured approach to considering the level of bonus outcome each year, any bonus award is discretionary and awards can be from zero to the maximum. • Awards are subject to malus and clawback provisions (described in the risk and conduct section). In respect of 2023 performance year: C.S. Venkatakrishnan’s annual bonus was £1,425,000 (53.3% of maximum) Anna Cross’s annual bonus was £879,000 (54.3% of maximum) C.S. Venkatakrishnan up to 93% of Fixed Pay Anna Cross up to 90% of Fixed Pay Performance measures and weightings unchanged from 2023, save for the following: In the Financial measures, a total operating expenses measure replaces cost: income ratio. In the Strategic non- financial measures, the weightings for Customers & clients, Colleagues and Climate & sustainability categories are reduced to 5%. A new Risk & operational excellence category added with a weighting of 10%. Long Term Incentive Plan (LTIP) award To incentivise execution of Barclays’ strategy over a multi-year period, encourage a long-term view and align Executive Directors’ interest with those of shareholders. • Awards are discretionary and determined by the Committee based on satisfactory performance in the year. • Performance is measured over three years against measures set by the Committee (at least 70% of each award normally being based on financial factors). • Delivered in shares and subject to a holding period, vesting no faster than permitted by regulations (currently in five equal tranches, from the third to the seventh anniversary of grant). • The maximum LTIP opportunity is 140% of Fixed Pay for the Group Chief Executive and 134% of Fixed Pay for the Group Finance Director. • Although the Committee takes a structured approach to considering the level of LTIP outcome, any LTIP award is discretionary and awards can be from zero to the maximum. • Awards are subject to malus and clawback provisions (described in the risk and conduct section). In respect of 2023 performance year: C.S. Venkatakrishnan will be granted a 2024-2026 LTIP award with a grant- date face value of 140% of Fixed Pay Anna Cross will be granted a 2024-2026 LTIP award with a grant- date face value of 134% of Fixed Pay Performance measures and weightings for the 2024-2026 LTIP cycle have changed slightly from those for the 2023-2025 LTIP cycle – more information is provided on page 147. In respect of the 2021-2023 LTIP cycle, neither C.S. Venkatakrishnan nor Anna Cross were participants. C.S. Venkatakrishnan up to 140% of Fixed Pay Anna Cross up to 134% of Fixed Pay Performance weightings and targets for the 2025-2027 LTIP will be determined in early 2025. All-employee share plans To help increase the number of employee shareholders and increase their participation as shareholders. • Executive Directors are entitled to participate in our UK all-employee share plans: Barclays Sharesave and Barclays Sharepurchase. Eligible to participate Eligible to participate Element and purpose Operation 2023 pay outcomes Implementation for 2024 Strategy Climate and sustainability report Risk review Financial review Financial statements Barclays PLC 2023 Annual Report on Form 20-F 130Governance Remuneration report (continued)
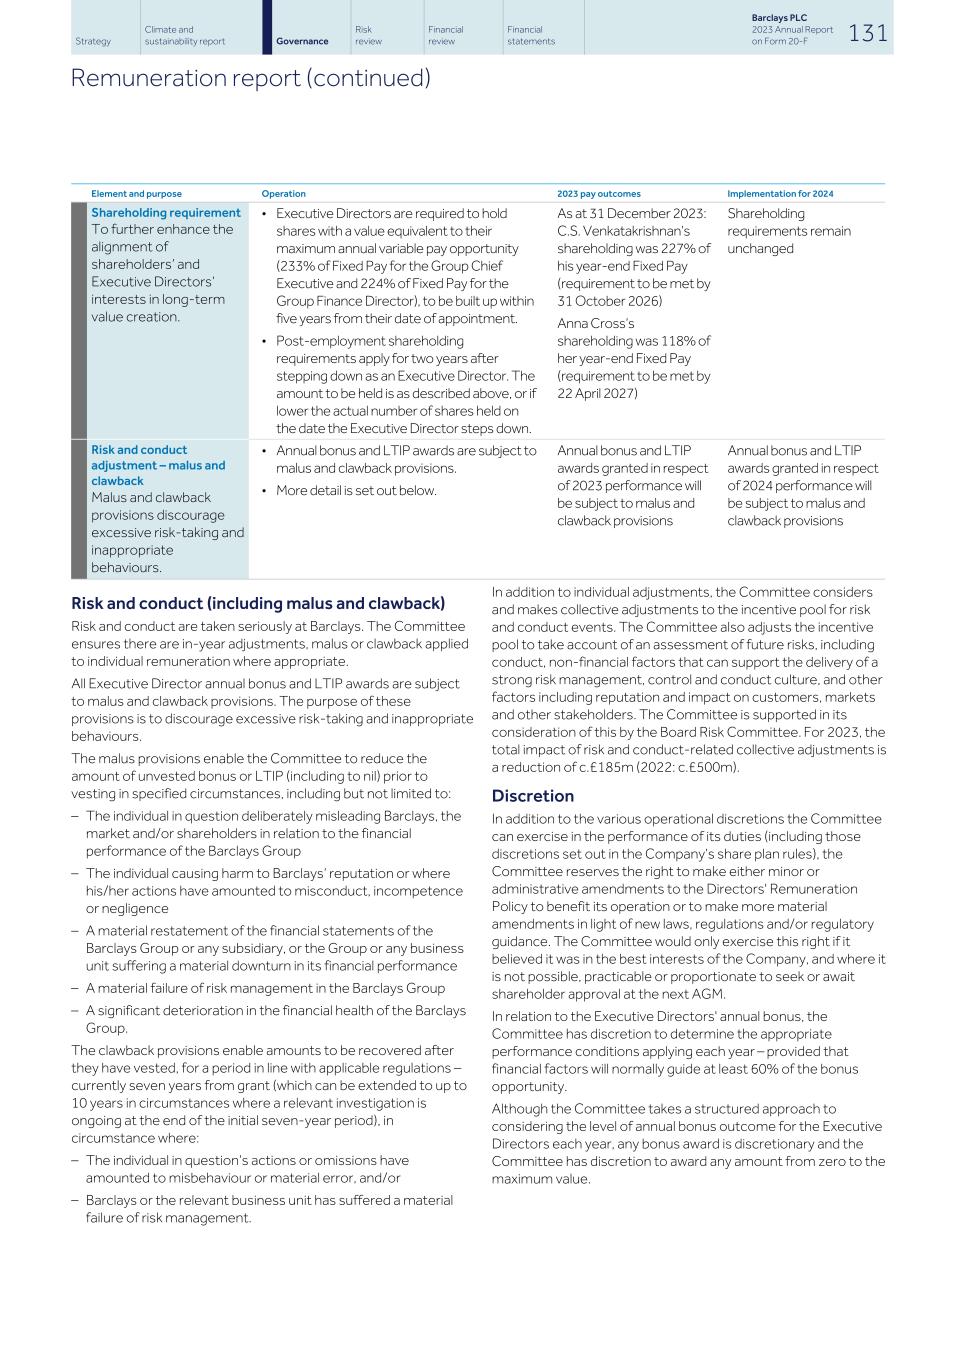
Shareholding requirement To further enhance the alignment of shareholders’ and Executive Directors’ interests in long-term value creation. • Executive Directors are required to hold shares with a value equivalent to their maximum annual variable pay opportunity (233% of Fixed Pay for the Group Chief Executive and 224% of Fixed Pay for the Group Finance Director), to be built up within five years from their date of appointment. • Post-employment shareholding requirements apply for two years after stepping down as an Executive Director. The amount to be held is as described above, or if lower the actual number of shares held on the date the Executive Director steps down. As at 31 December 2023: C.S. Venkatakrishnan’s shareholding was 227% of his year-end Fixed Pay (requirement to be met by 31 October 2026) Anna Cross’s shareholding was 118% of her year-end Fixed Pay (requirement to be met by 22 April 2027) Shareholding requirements remain unchanged Risk and conduct adjustment – malus and clawback Malus and clawback provisions discourage excessive risk-taking and inappropriate behaviours. • Annual bonus and LTIP awards are subject to malus and clawback provisions. • More detail is set out below. Annual bonus and LTIP awards granted in respect of 2023 performance will be subject to malus and clawback provisions Annual bonus and LTIP awards granted in respect of 2024 performance will be subject to malus and clawback provisions Element and purpose Operation 2023 pay outcomes Implementation for 2024 Risk and conduct (including malus and clawback) Risk and conduct are taken seriously at Barclays. The Committee ensures there are in-year adjustments, malus or clawback applied to individual remuneration where appropriate. All Executive Director annual bonus and LTIP awards are subject to malus and clawback provisions. The purpose of these provisions is to discourage excessive risk-taking and inappropriate behaviours. The malus provisions enable the Committee to reduce the amount of unvested bonus or LTIP (including to nil) prior to vesting in specified circumstances, including but not limited to: – The individual in question deliberately misleading Barclays, the market and/or shareholders in relation to the financial performance of the Barclays Group – The individual causing harm to Barclays’ reputation or where his/her actions have amounted to misconduct, incompetence or negligence – A material restatement of the financial statements of the Barclays Group or any subsidiary, or the Group or any business unit suffering a material downturn in its financial performance – A material failure of risk management in the Barclays Group – A significant deterioration in the financial health of the Barclays Group. The clawback provisions enable amounts to be recovered after they have vested, for a period in line with applicable regulations – currently seven years from grant (which can be extended to up to 10 years in circumstances where a relevant investigation is ongoing at the end of the initial seven-year period), in circumstance where: – The individual in question’s actions or omissions have amounted to misbehaviour or material error, and/or – Barclays or the relevant business unit has suffered a material failure of risk management. In addition to individual adjustments, the Committee considers and makes collective adjustments to the incentive pool for risk and conduct events. The Committee also adjusts the incentive pool to take account of an assessment of future risks, including conduct, non-financial factors that can support the delivery of a strong risk management, control and conduct culture, and other factors including reputation and impact on customers, markets and other stakeholders. The Committee is supported in its consideration of this by the Board Risk Committee. For 2023, the total impact of risk and conduct-related collective adjustments is a reduction of c.£185m (2022: c.£500m). Discretion In addition to the various operational discretions the Committee can exercise in the performance of its duties (including those discretions set out in the Company’s share plan rules), the Committee reserves the right to make either minor or administrative amendments to the Directors' Remuneration Policy to benefit its operation or to make more material amendments in light of new laws, regulations and/or regulatory guidance. The Committee would only exercise this right if it believed it was in the best interests of the Company, and where it is not possible, practicable or proportionate to seek or await shareholder approval at the next AGM. In relation to the Executive Directors' annual bonus, the Committee has discretion to determine the appropriate performance conditions applying each year – provided that financial factors will normally guide at least 60% of the bonus opportunity. Although the Committee takes a structured approach to considering the level of annual bonus outcome for the Executive Directors each year, any bonus award is discretionary and the Committee has discretion to award any amount from zero to the maximum value. Strategy Climate and sustainability report Risk review Financial review Financial statements Barclays PLC 2023 Annual Report on Form 20-F 131Governance Remuneration report (continued)
In relation to the LTIP, the Committee again has discretion to determine the appropriate performance conditions – provided that financial measures will normally be at least 70% of the total opportunity. In exceptional circumstances the Committee has discretion to amend performance targets, measures or the number of shares under awards, if circumstances occur that cause the Committee to consider such adjustment to be reasonable. The Committee also has the discretion to reduce the vesting of any award, including to nil, if it deems the outcome inconsistent with the performance delivered. For 2023, the Committee did not exercise discretion to adjust the variable pay outcomes as outlined on page 137. Performance measures and targets Measures The performance measures and targets are set annually by the Committee to align with our strategic priorities, ensuring the measures support delivery of the Group’s strategy. The Committee selects financial performance measures that are fundamental to delivery against the Group’s strategy and are considered to be the most important financial measures used by the Executive Directors and the Board to oversee the direction of the business. The non-financial performance measures are chosen to represent key indicators of the success of our strategy, and to provide a balanced view of our performance during the period, which are robustly monitored and reported on to the management team and the Board. Targets Targets for both the annual bonus and LTIP are calibrated to be stretching but achievable, and are aligned with creating value for shareholders and other stakeholders. In respect of the annual bonus, the financial measures and weightings are disclosed at the start of the relevant performance year. The Committee considers the specific annual bonus targets to be commercially sensitive, and that it would be detrimental to disclose the targets at the start of the relevant performance year. On that basis, the targets and performance against those targets are disclosed at the end of the relevant performance year, in that year’s Annual Report on Directors’ remuneration, provided that commercial sensitivity is no longer an issue at that time. In respect of the LTIP, the financial measures, weightings and targets are disclosed in the Remuneration report published immediately before the awards are granted – which is shortly after at the start of the relevant performance period. The Committee selects non-financial performance measures that support the delivery of our strategy and reflect our priorities over the next year or over a multi-year period. ESG and remuneration The Committee reviews the Executive Directors' incentive measures each year to ensure they continue to support the delivery of our strategic priorities, including ESG priorities. The Executive Directors' annual bonus and LTIP have included Climate & sustainability measures for over a decade. The Committee aligns these measures each year with the Group's evolving climate and sustainability ambitions, metrics and targets. Most of our climate-related measures and targets are longer term, including those relating to financing the transition and financed emissions, and progress towards these targets is expected to be variable and non-linear. This is reflected in a higher weighting of Climate & sustainability measures in the LTIP, compared to the annual bonus, as follows: – For the 2024-2026 LTIP, 15% of the total opportunity will be determined based on performance measures relating to Climate & sustainability, measuring progress against each of the three pillars of our climate strategy – including our ambition to be a net zero bank by 2050 and our commitment to align our financing with the goals and timelines of the Paris Climate Agreement. – For the 2024 annual bonus, 5% of the total opportunity will be determined based on Climate & sustainability measures. A further 5% of each of the 2024 bonus and the 2024-2026 LTIP will be determined on Colleagues measures, including diversity, inclusion and engagement. Risk & operational excellence measures are weighted at 10% in the 2024 bonus and 5% in the 2024-2026 LTIP, as the management of risk underpins delivery against our strategy and is a key part of the governance of the Group. Outcomes will be determined based on an assessment of performance against a range of measures of our risk culture, operational precision and controls. In recent years, the weighting of the Climate & sustainability category in both the LTIP and annual bonus was equal, at 10%. As described earlier, for this year's forward-looking incentives the Committee increased the weighting to 15% in the 2024-2026 LTIP and decreased it to 5% in the 2024 annual bonus. Given the higher maximum opportunity under the LTIP compared to the annual bonus, these changes equate to an increase in the total value of remuneration that will be determined based on climate- related measures. Strategy Climate and sustainability report Risk review Financial review Financial statements Barclays PLC 2023 Annual Report on Form 20-F 132Governance Remuneration report (continued)
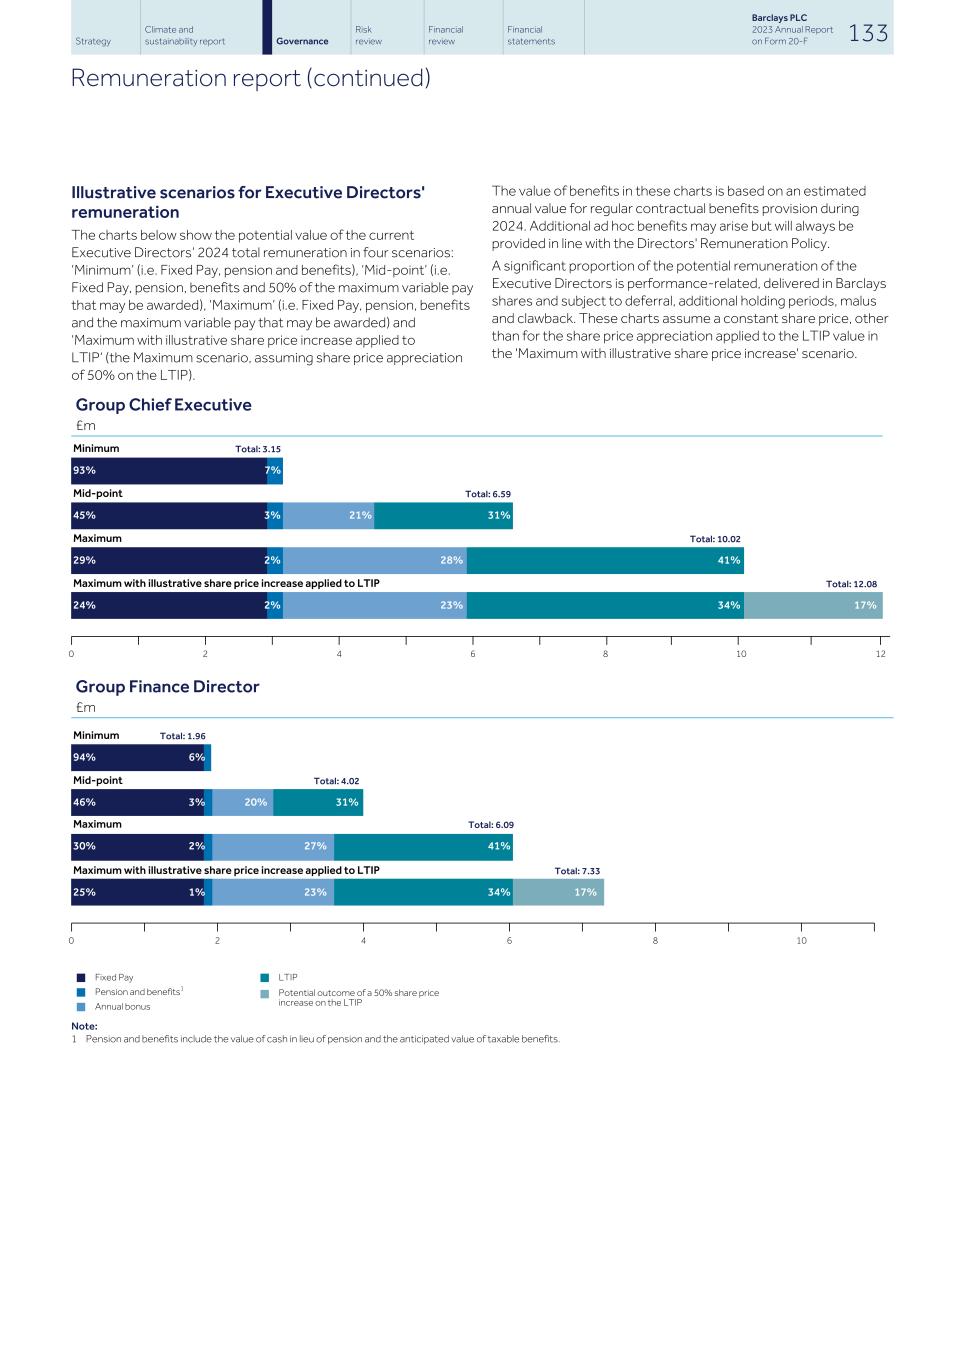
Illustrative scenarios for Executive Directors' remuneration The charts below show the potential value of the current Executive Directors’ 2024 total remuneration in four scenarios: ‘Minimum’ (i.e. Fixed Pay, pension and benefits), ‘Mid-point’ (i.e. Fixed Pay, pension, benefits and 50% of the maximum variable pay that may be awarded), ‘Maximum’ (i.e. Fixed Pay, pension, benefits and the maximum variable pay that may be awarded) and ‘Maximum with illustrative share price increase applied to LTIP’ (the Maximum scenario, assuming share price appreciation of 50% on the LTIP). The value of benefits in these charts is based on an estimated annual value for regular contractual benefits provision during 2024. Additional ad hoc benefits may arise but will always be provided in line with the Directors' Remuneration Policy. A significant proportion of the potential remuneration of the Executive Directors is performance-related, delivered in Barclays shares and subject to deferral, additional holding periods, malus and clawback. These charts assume a constant share price, other than for the share price appreciation applied to the LTIP value in the 'Maximum with illustrative share price increase' scenario. Group Chief Executive £m 0 2 4 6 8 10 12 Group Finance Director £m 0 2 4 6 8 10 n Fixed Pay n LTIP n Pension and benefits1 n Potential outcome of a 50% share price increase on the LTIPn Annual bonus Note: 1 Pension and benefits include the value of cash in lieu of pension and the anticipated value of taxable benefits. Strategy Climate and sustainability report Risk review Financial review Financial statements Barclays PLC 2023 Annual Report on Form 20-F 133Governance Remuneration report (continued) Minimum Total: 3.15 93% 7% Mid-point Total: 6.59 45% 3% 21% 31% Maximum Total: 10.02 29% 2% 28% 41% Maximum with illustrative share price increase applied to LTIP Total: 12.08 24% 2% 23% 34% 17% Minimum Total: 1.96 94% 6% Mid-point Total: 4.02 46% 3% 20% 31% Maximum Total: 6.09 30% 2% 27% 41% Maximum with illustrative share price increase applied to LTIP Total: 7.33 25% 1% 23% 34% 17%
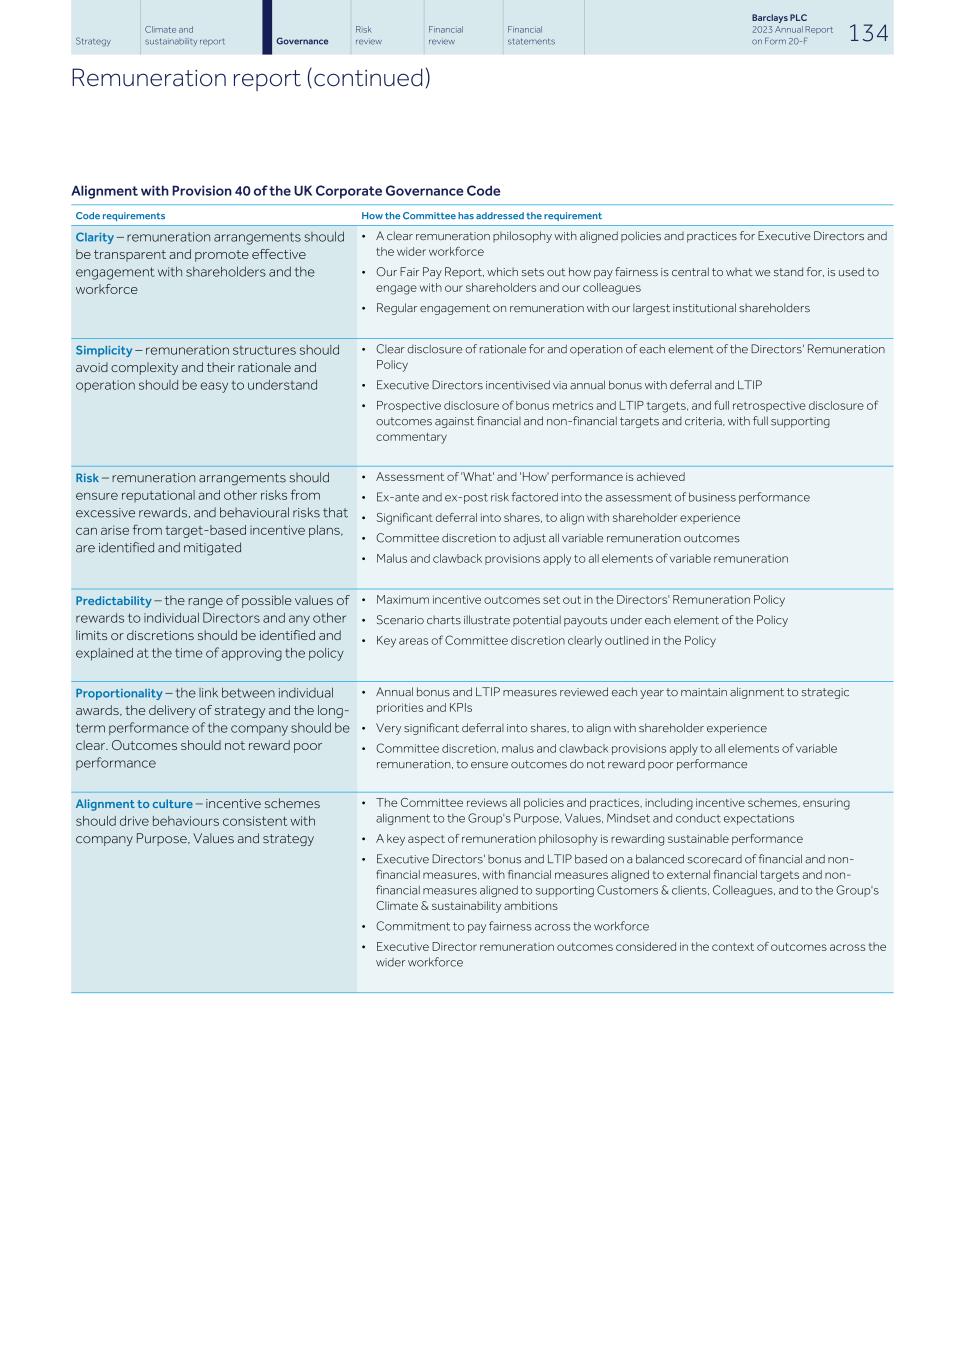
Alignment with Provision 40 of the UK Corporate Governance Code Code requirements How the Committee has addressed the requirement Clarity – remuneration arrangements should be transparent and promote effective engagement with shareholders and the workforce • A clear remuneration philosophy with aligned policies and practices for Executive Directors and the wider workforce • Our Fair Pay Report, which sets out how pay fairness is central to what we stand for, is used to engage with our shareholders and our colleagues • Regular engagement on remuneration with our largest institutional shareholders Simplicity – remuneration structures should avoid complexity and their rationale and operation should be easy to understand • Clear disclosure of rationale for and operation of each element of the Directors' Remuneration Policy • Executive Directors incentivised via annual bonus with deferral and LTIP • Prospective disclosure of bonus metrics and LTIP targets, and full retrospective disclosure of outcomes against financial and non-financial targets and criteria, with full supporting commentary Risk – remuneration arrangements should ensure reputational and other risks from excessive rewards, and behavioural risks that can arise from target-based incentive plans, are identified and mitigated • Assessment of 'What' and 'How' performance is achieved • Ex-ante and ex-post risk factored into the assessment of business performance • Significant deferral into shares, to align with shareholder experience • Committee discretion to adjust all variable remuneration outcomes • Malus and clawback provisions apply to all elements of variable remuneration Predictability – the range of possible values of rewards to individual Directors and any other limits or discretions should be identified and explained at the time of approving the policy • Maximum incentive outcomes set out in the Directors' Remuneration Policy • Scenario charts illustrate potential payouts under each element of the Policy • Key areas of Committee discretion clearly outlined in the Policy Proportionality – the link between individual awards, the delivery of strategy and the long- term performance of the company should be clear. Outcomes should not reward poor performance • Annual bonus and LTIP measures reviewed each year to maintain alignment to strategic priorities and KPIs • Very significant deferral into shares, to align with shareholder experience • Committee discretion, malus and clawback provisions apply to all elements of variable remuneration, to ensure outcomes do not reward poor performance Alignment to culture – incentive schemes should drive behaviours consistent with company Purpose, Values and strategy • The Committee reviews all policies and practices, including incentive schemes, ensuring alignment to the Group's Purpose, Values, Mindset and conduct expectations • A key aspect of remuneration philosophy is rewarding sustainable performance • Executive Directors' bonus and LTIP based on a balanced scorecard of financial and non- financial measures, with financial measures aligned to external financial targets and non- financial measures aligned to supporting Customers & clients, Colleagues, and to the Group's Climate & sustainability ambitions • Commitment to pay fairness across the workforce • Executive Director remuneration outcomes considered in the context of outcomes across the wider workforce Strategy Climate and sustainability report Risk review Financial review Financial statements Barclays PLC 2023 Annual Report on Form 20-F 134Governance Remuneration report (continued)
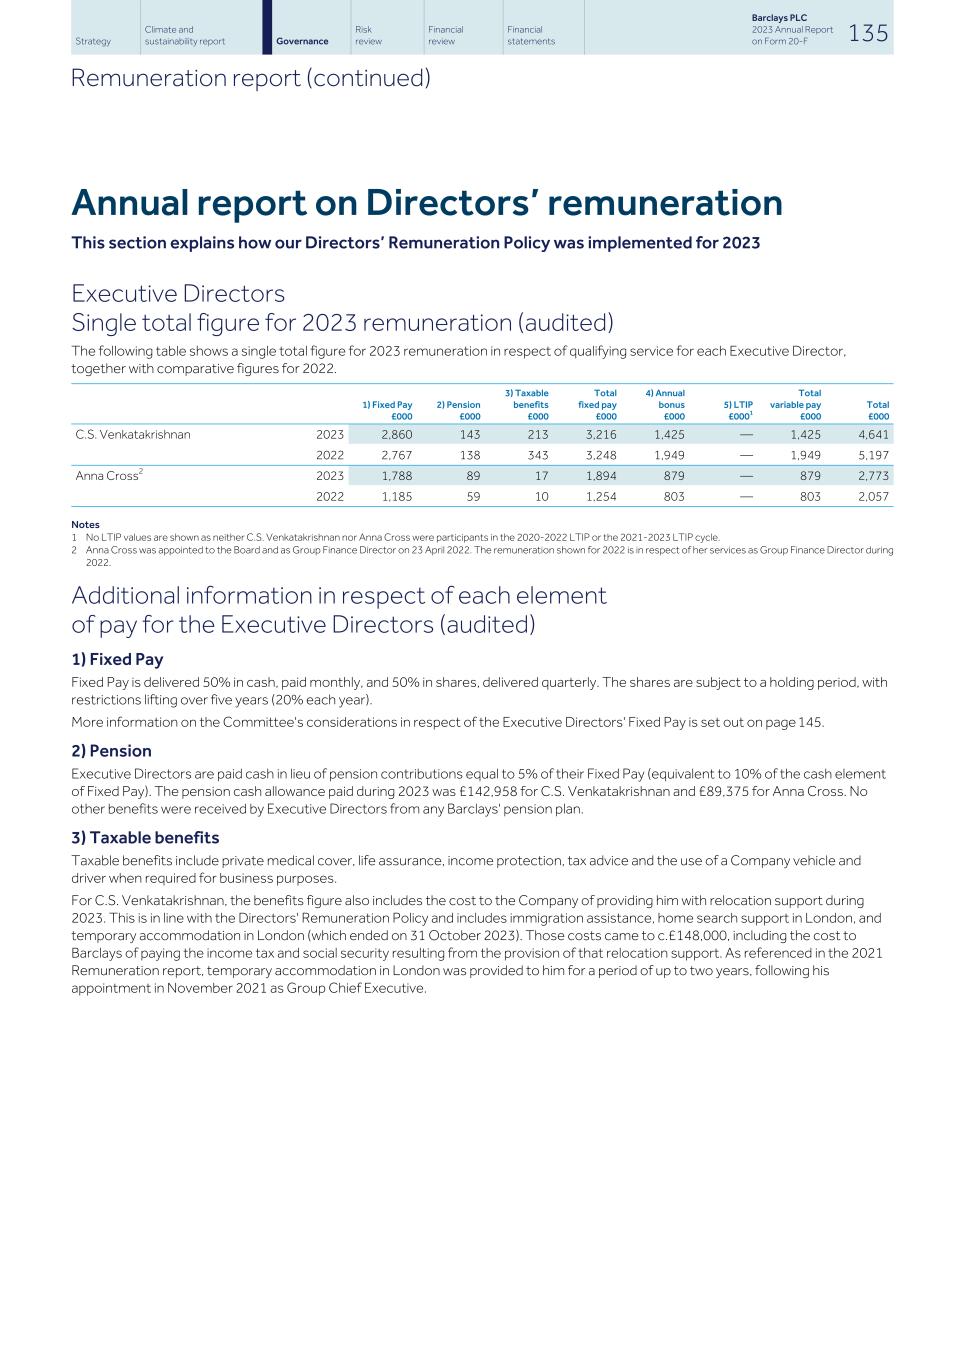
Annual report on Directors’ remuneration This section explains how our Directors’ Remuneration Policy was implemented for 2023 Executive Directors Single total figure for 2023 remuneration (audited) The following table shows a single total figure for 2023 remuneration in respect of qualifying service for each Executive Director, together with comparative figures for 2022. 1) Fixed Pay £000 2) Pension £000 3) Taxable benefits £000 Total fixed pay £000 4) Annual bonus £000 5) LTIP £0001 Total variable pay £000 Total £000 C.S. Venkatakrishnan 2023 2,860 143 213 3,216 1,425 — 1,425 4,641 2022 2,767 138 343 3,248 1,949 — 1,949 5,197 Anna Cross2 2023 1,788 89 17 1,894 879 — 879 2,773 2022 1,185 59 10 1,254 803 — 803 2,057 Notes 1 No LTIP values are shown as neither C.S. Venkatakrishnan nor Anna Cross were participants in the 2020-2022 LTIP or the 2021-2023 LTIP cycle. 2 Anna Cross was appointed to the Board and as Group Finance Director on 23 April 2022. The remuneration shown for 2022 is in respect of her services as Group Finance Director during 2022. Additional information in respect of each element of pay for the Executive Directors (audited) 1) Fixed Pay Fixed Pay is delivered 50% in cash, paid monthly, and 50% in shares, delivered quarterly. The shares are subject to a holding period, with restrictions lifting over five years (20% each year). More information on the Committee's considerations in respect of the Executive Directors' Fixed Pay is set out on page 145. 2) Pension Executive Directors are paid cash in lieu of pension contributions equal to 5% of their Fixed Pay (equivalent to 10% of the cash element of Fixed Pay). The pension cash allowance paid during 2023 was £142,958 for C.S. Venkatakrishnan and £89,375 for Anna Cross. No other benefits were received by Executive Directors from any Barclays' pension plan. 3) Taxable benefits Taxable benefits include private medical cover, life assurance, income protection, tax advice and the use of a Company vehicle and driver when required for business purposes. For C.S. Venkatakrishnan, the benefits figure also includes the cost to the Company of providing him with relocation support during 2023. This is in line with the Directors' Remuneration Policy and includes immigration assistance, home search support in London, and temporary accommodation in London (which ended on 31 October 2023). Those costs came to c.£148,000, including the cost to Barclays of paying the income tax and social security resulting from the provision of that relocation support. As referenced in the 2021 Remuneration report, temporary accommodation in London was provided to him for a period of up to two years, following his appointment in November 2021 as Group Chief Executive. Strategy Climate and sustainability report Risk review Financial review Financial statements Barclays PLC 2023 Annual Report on Form 20-F 135Governance Remuneration report (continued)
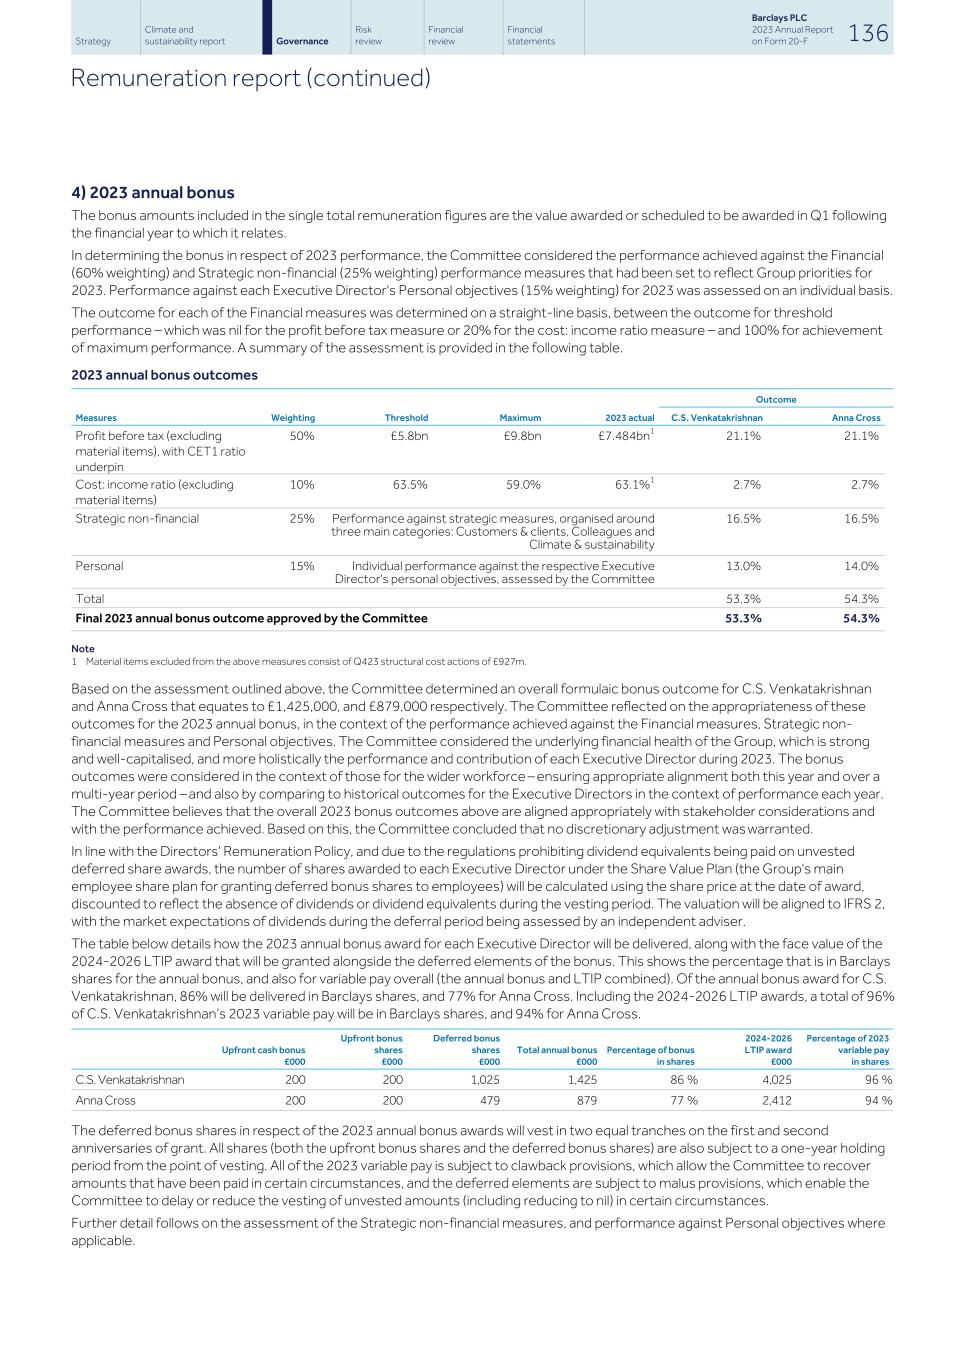
4) 2023 annual bonus The bonus amounts included in the single total remuneration figures are the value awarded or scheduled to be awarded in Q1 following the financial year to which it relates. In determining the bonus in respect of 2023 performance, the Committee considered the performance achieved against the Financial (60% weighting) and Strategic non-financial (25% weighting) performance measures that had been set to reflect Group priorities for 2023. Performance against each Executive Director's Personal objectives (15% weighting) for 2023 was assessed on an individual basis. The outcome for each of the Financial measures was determined on a straight-line basis, between the outcome for threshold performance – which was nil for the profit before tax measure or 20% for the cost: income ratio measure – and 100% for achievement of maximum performance. A summary of the assessment is provided in the following table. 2023 annual bonus outcomes Measures Weighting Threshold Maximum 2023 actual Outcome C.S. Venkatakrishnan Anna Cross Profit before tax (excluding material items), with CET1 ratio underpin 50% £5.8bn £9.8bn £7.484bn1 21.1% 21.1% Cost: income ratio (excluding material items) 10% 63.5% 59.0% 63.1%1 2.7% 2.7% Strategic non-financial 25% Performance against strategic measures, organised around three main categories: Customers & clients, Colleagues and Climate & sustainability 16.5% 16.5% Personal 15% Individual performance against the respective Executive Director's personal objectives, assessed by the Committee 13.0% 14.0% Total 53.3% 54.3% Final 2023 annual bonus outcome approved by the Committee 53.3% 54.3% Note 1 Material items excluded from the above measures consist of Q423 structural cost actions of £927m. Based on the assessment outlined above, the Committee determined an overall formulaic bonus outcome for C.S. Venkatakrishnan and Anna Cross that equates to £1,425,000, and £879,000 respectively. The Committee reflected on the appropriateness of these outcomes for the 2023 annual bonus, in the context of the performance achieved against the Financial measures, Strategic non- financial measures and Personal objectives. The Committee considered the underlying financial health of the Group, which is strong and well-capitalised, and more holistically the performance and contribution of each Executive Director during 2023. The bonus outcomes were considered in the context of those for the wider workforce – ensuring appropriate alignment both this year and over a multi-year period – and also by comparing to historical outcomes for the Executive Directors in the context of performance each year. The Committee believes that the overall 2023 bonus outcomes above are aligned appropriately with stakeholder considerations and with the performance achieved. Based on this, the Committee concluded that no discretionary adjustment was warranted. In line with the Directors' Remuneration Policy, and due to the regulations prohibiting dividend equivalents being paid on unvested deferred share awards, the number of shares awarded to each Executive Director under the Share Value Plan (the Group's main employee share plan for granting deferred bonus shares to employees) will be calculated using the share price at the date of award, discounted to reflect the absence of dividends or dividend equivalents during the vesting period. The valuation will be aligned to IFRS 2, with the market expectations of dividends during the deferral period being assessed by an independent adviser. The table below details how the 2023 annual bonus award for each Executive Director will be delivered, along with the face value of the 2024-2026 LTIP award that will be granted alongside the deferred elements of the bonus. This shows the percentage that is in Barclays shares for the annual bonus, and also for variable pay overall (the annual bonus and LTIP combined). Of the annual bonus award for C.S. Venkatakrishnan, 86% will be delivered in Barclays shares, and 77% for Anna Cross. Including the 2024-2026 LTIP awards, a total of 96% of C.S. Venkatakrishnan’s 2023 variable pay will be in Barclays shares, and 94% for Anna Cross. Upfront cash bonus £000 Upfront bonus shares £000 Deferred bonus shares £000 Total annual bonus £000 Percentage of bonus in shares 2024-2026 LTIP award £000 Percentage of 2023 variable pay in shares C.S. Venkatakrishnan 200 200 1,025 1,425 86 % 4,025 96 % Anna Cross 200 200 479 879 77 % 2,412 94 % The deferred bonus shares in respect of the 2023 annual bonus awards will vest in two equal tranches on the first and second anniversaries of grant. All shares (both the upfront bonus shares and the deferred bonus shares) are also subject to a one-year holding period from the point of vesting. All of the 2023 variable pay is subject to clawback provisions, which allow the Committee to recover amounts that have been paid in certain circumstances, and the deferred elements are subject to malus provisions, which enable the Committee to delay or reduce the vesting of unvested amounts (including reducing to nil) in certain circumstances. Further detail follows on the assessment of the Strategic non-financial measures, and performance against Personal objectives where applicable. Strategy Climate and sustainability report Risk review Financial review Financial statements Barclays PLC 2023 Annual Report on Form 20-F 136Governance Remuneration report (continued)
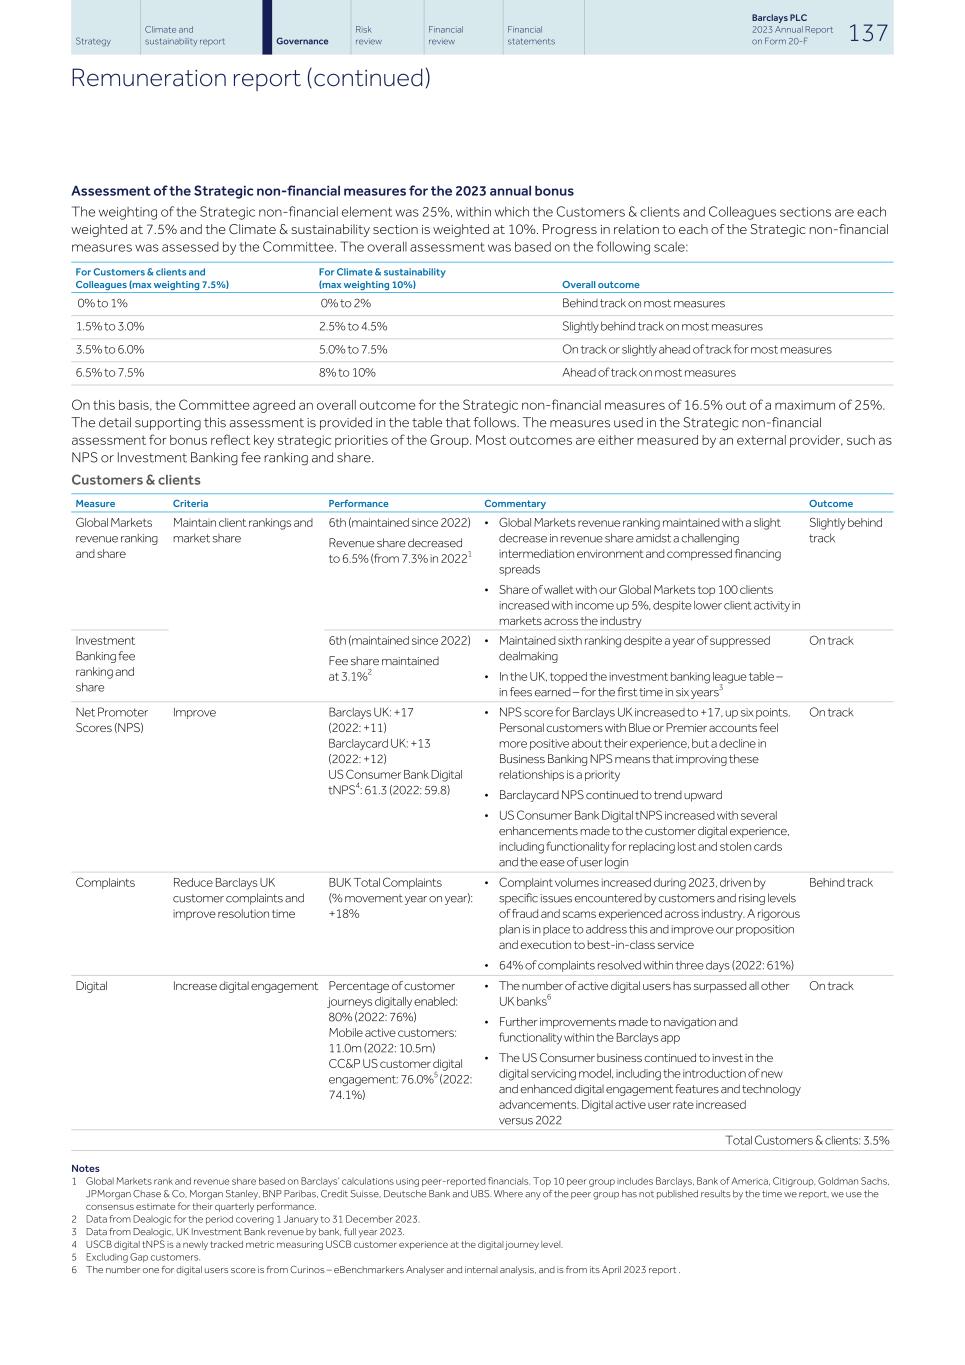
Assessment of the Strategic non-financial measures for the 2023 annual bonus The weighting of the Strategic non-financial element was 25%, within which the Customers & clients and Colleagues sections are each weighted at 7.5% and the Climate & sustainability section is weighted at 10%. Progress in relation to each of the Strategic non-financial measures was assessed by the Committee. The overall assessment was based on the following scale: For Customers & clients and Colleagues (max weighting 7.5%) For Climate & sustainability (max weighting 10%) Overall outcome 0% to 1% 0% to 2% Behind track on most measures 1.5% to 3.0% 2.5% to 4.5% Slightly behind track on most measures 3.5% to 6.0% 5.0% to 7.5% On track or slightly ahead of track for most measures 6.5% to 7.5% 8% to 10% Ahead of track on most measures On this basis, the Committee agreed an overall outcome for the Strategic non-financial measures of 16.5% out of a maximum of 25%. The detail supporting this assessment is provided in the table that follows. The measures used in the Strategic non-financial assessment for bonus reflect key strategic priorities of the Group. Most outcomes are either measured by an external provider, such as NPS or Investment Banking fee ranking and share. Customers & clients Global Markets revenue ranking and share Maintain client rankings and market share 6th (maintained since 2022) Revenue share decreased to 6.5% (from 7.3% in 20221 • Global Markets revenue ranking maintained with a slight decrease in revenue share amidst a challenging intermediation environment and compressed financing spreads • Share of wallet with our Global Markets top 100 clients increased with income up 5%, despite lower client activity in markets across the industry Slightly behind track Investment Banking fee ranking and share 6th (maintained since 2022) Fee share maintained at 3.1%2 • Maintained sixth ranking despite a year of suppressed dealmaking • In the UK, topped the investment banking league table – in fees earned – for the first time in six years3 On track Net Promoter Scores (NPS) Improve Barclays UK: +17 (2022: +11) Barclaycard UK: +13 (2022: +12) US Consumer Bank Digital tNPS4: 61.3 (2022: 59.8) • NPS score for Barclays UK increased to +17, up six points. Personal customers with Blue or Premier accounts feel more positive about their experience, but a decline in Business Banking NPS means that improving these relationships is a priority • Barclaycard NPS continued to trend upward • US Consumer Bank Digital tNPS increased with several enhancements made to the customer digital experience, including functionality for replacing lost and stolen cards and the ease of user login On track Complaints Reduce Barclays UK customer complaints and improve resolution time BUK Total Complaints (% movement year on year): +18% • Complaint volumes increased during 2023, driven by specific issues encountered by customers and rising levels of fraud and scams experienced across industry. A rigorous plan is in place to address this and improve our proposition and execution to best-in-class service • 64% of complaints resolved within three days (2022: 61%) Behind track Digital Increase digital engagement Percentage of customer journeys digitally enabled: 80% (2022: 76%) Mobile active customers: 11.0m (2022: 10.5m) CC&P US customer digital engagement: 76.0%5 (2022: 74.1%) • The number of active digital users has surpassed all other UK banks6 • Further improvements made to navigation and functionality within the Barclays app • The US Consumer business continued to invest in the digital servicing model, including the introduction of new and enhanced digital engagement features and technology advancements. Digital active user rate increased versus 2022 On track Total Customers & clients: 3.5% Measure Criteria Performance Commentary Outcome Notes 1 Global Markets rank and revenue share based on Barclays’ calculations using peer-reported financials. Top 10 peer group includes Barclays, Bank of America, Citigroup, Goldman Sachs, JPMorgan Chase & Co, Morgan Stanley, BNP Paribas, Credit Suisse, Deutsche Bank and UBS. Where any of the peer group has not published results by the time we report, we use the consensus estimate for their quarterly performance. 2 Data from Dealogic for the period covering 1 January to 31 December 2023. 3 Data from Dealogic, UK Investment Bank revenue by bank, full year 2023. 4 USCB digital tNPS is a newly tracked metric measuring USCB customer experience at the digital journey level. 5 Excluding Gap customers. 6 The number one for digital users score is from Curinos – eBenchmarkers Analyser and internal analysis, and is from its April 2023 report . Strategy Climate and sustainability report Risk review Financial review Financial statements Barclays PLC 2023 Annual Report on Form 20-F 137Governance Remuneration report (continued)
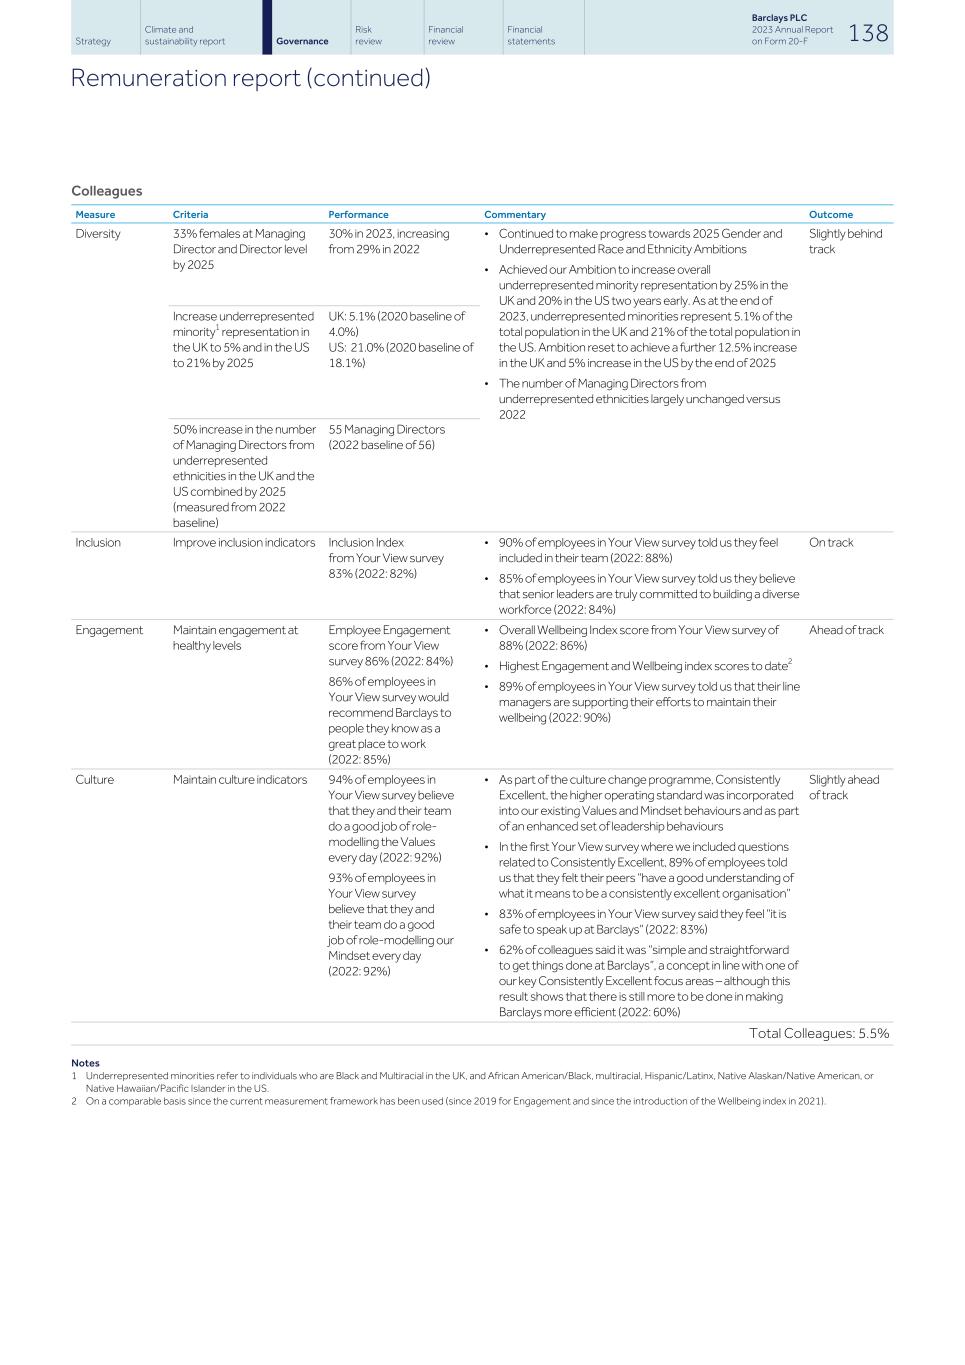
Colleagues Diversity 33% females at Managing Director and Director level by 2025 30% in 2023, increasing from 29% in 2022 • Continued to make progress towards 2025 Gender and Underrepresented Race and Ethnicity Ambitions • Achieved our Ambition to increase overall underrepresented minority representation by 25% in the UK and 20% in the US two years early. As at the end of 2023, underrepresented minorities represent 5.1% of the total population in the UK and 21% of the total population in the US. Ambition reset to achieve a further 12.5% increase in the UK and 5% increase in the US by the end of 2025 • The number of Managing Directors from underrepresented ethnicities largely unchanged versus 2022 Slightly behind track Increase underrepresented minority1 representation in the UK to 5% and in the US to 21% by 2025 UK: 5.1% (2020 baseline of 4.0%) US: 21.0% (2020 baseline of 18.1%) 50% increase in the number of Managing Directors from underrepresented ethnicities in the UK and the US combined by 2025 (measured from 2022 baseline) 55 Managing Directors (2022 baseline of 56) Inclusion Improve inclusion indicators Inclusion Index from Your View survey 83% (2022: 82%) • 90% of employees in Your View survey told us they feel included in their team (2022: 88%) • 85% of employees in Your View survey told us they believe that senior leaders are truly committed to building a diverse workforce (2022: 84%) On track Engagement Maintain engagement at healthy levels Employee Engagement score from Your View survey 86% (2022: 84%) 86% of employees in Your View survey would recommend Barclays to people they know as a great place to work (2022: 85%) • Overall Wellbeing Index score from Your View survey of 88% (2022: 86%) • Highest Engagement and Wellbeing index scores to date2 • 89% of employees in Your View survey told us that their line managers are supporting their efforts to maintain their wellbeing (2022: 90%) Ahead of track Culture Maintain culture indicators 94% of employees in Your View survey believe that they and their team do a good job of role- modelling the Values every day (2022: 92%) 93% of employees in Your View survey believe that they and their team do a good job of role-modelling our Mindset every day (2022: 92%) • As part of the culture change programme, Consistently Excellent, the higher operating standard was incorporated into our existing Values and Mindset behaviours and as part of an enhanced set of leadership behaviours • In the first Your View survey where we included questions related to Consistently Excellent, 89% of employees told us that they felt their peers “have a good understanding of what it means to be a consistently excellent organisation” • 83% of employees in Your View survey said they feel “it is safe to speak up at Barclays” (2022: 83%) • 62% of colleagues said it was “simple and straightforward to get things done at Barclays”, a concept in line with one of our key Consistently Excellent focus areas – although this result shows that there is still more to be done in making Barclays more efficient (2022: 60%) Slightly ahead of track Total Colleagues: 5.5% Measure Criteria Performance Commentary Outcome Notes 1 Underrepresented minorities refer to individuals who are Black and Multiracial in the UK, and African American/Black, multiracial, Hispanic/Latinx, Native Alaskan/Native American, or Native Hawaiian/Pacific Islander in the US. 2 On a comparable basis since the current measurement framework has been used (since 2019 for Engagement and since the introduction of the Wellbeing index in 2021). Strategy Climate and sustainability report Risk review Financial review Financial statements Barclays PLC 2023 Annual Report on Form 20-F 138Governance Remuneration report (continued)
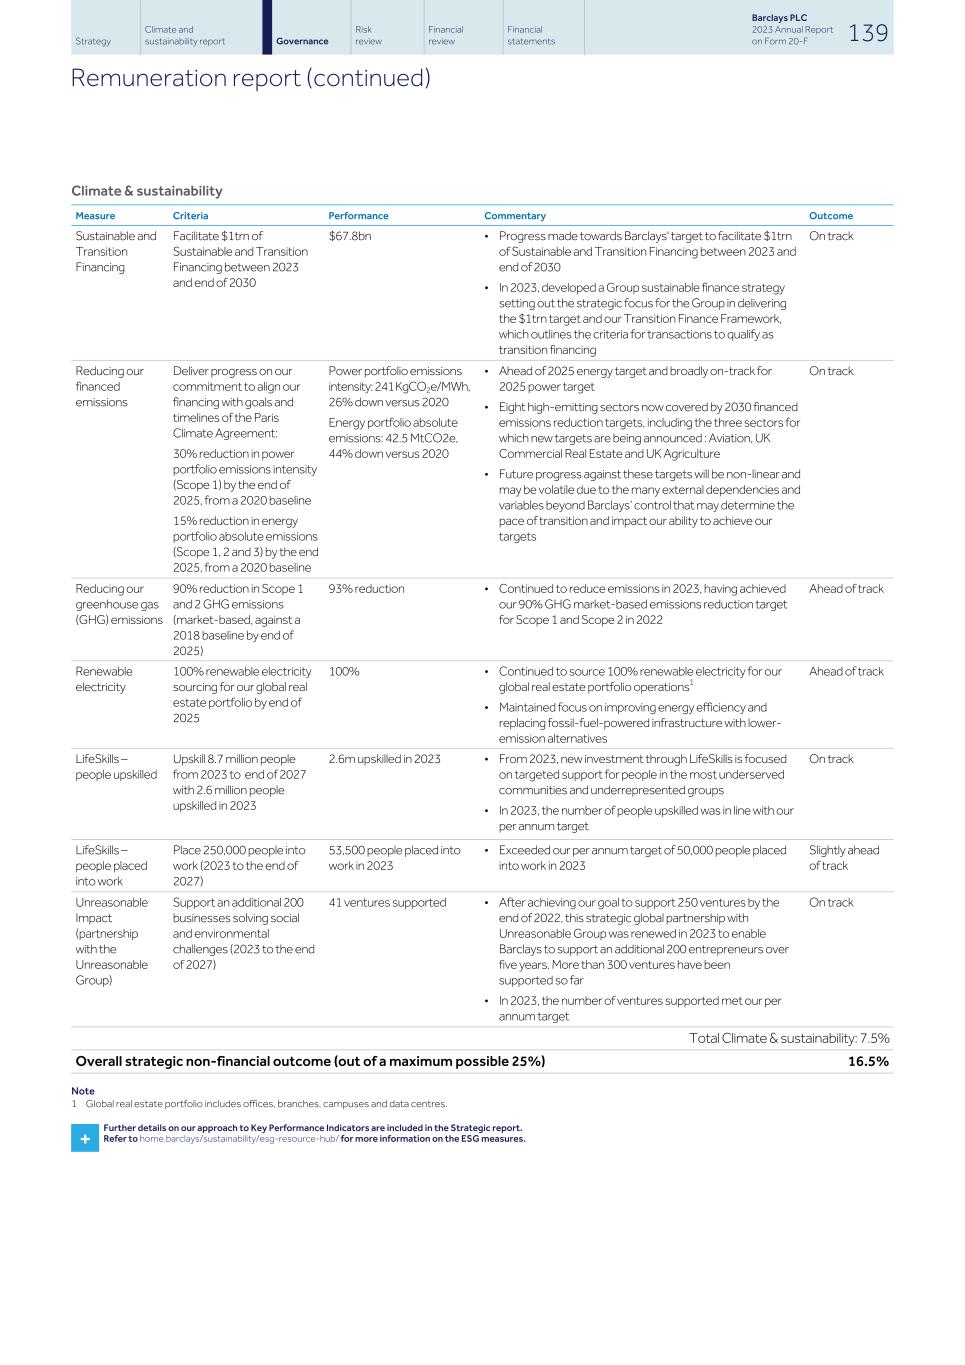
Climate & sustainability Sustainable and Transition Financing Facilitate $1trn of Sustainable and Transition Financing between 2023 and end of 2030 $67.8bn • Progress made towards Barclays' target to facilitate $1trn of Sustainable and Transition Financing between 2023 and end of 2030 • In 2023, developed a Group sustainable finance strategy setting out the strategic focus for the Group in delivering the $1trn target and our Transition Finance Framework, which outlines the criteria for transactions to qualify as transition financing On track Reducing our financed emissions Deliver progress on our commitment to align our financing with goals and timelines of the Paris Climate Agreement: 30% reduction in power portfolio emissions intensity (Scope 1) by the end of 2025, from a 2020 baseline 15% reduction in energy portfolio absolute emissions (Scope 1, 2 and 3) by the end 2025, from a 2020 baseline Power portfolio emissions intensity: 241 KgCO2e/MWh, 26% down versus 2020 Energy portfolio absolute emissions: 42.5 MtCO2e, 44% down versus 2020 • Ahead of 2025 energy target and broadly on-track for 2025 power target • Eight high-emitting sectors now covered by 2030 financed emissions reduction targets, including the three sectors for which new targets are being announced : Aviation, UK Commercial Real Estate and UK Agriculture • Future progress against these targets will be non-linear and may be volatile due to the many external dependencies and variables beyond Barclays’ control that may determine the pace of transition and impact our ability to achieve our targets On track Reducing our greenhouse gas (GHG) emissions 90% reduction in Scope 1 and 2 GHG emissions (market-based, against a 2018 baseline by end of 2025) 93% reduction • Continued to reduce emissions in 2023, having achieved our 90% GHG market-based emissions reduction target for Scope 1 and Scope 2 in 2022 Ahead of track Renewable electricity 100% renewable electricity sourcing for our global real estate portfolio by end of 2025 100% • Continued to source 100% renewable electricity for our global real estate portfolio operations1 • Maintained focus on improving energy efficiency and replacing fossil-fuel-powered infrastructure with lower- emission alternatives Ahead of track LifeSkills – people upskilled Upskill 8.7 million people from 2023 to end of 2027 with 2.6 million people upskilled in 2023 2.6m upskilled in 2023 • From 2023, new investment through LifeSkills is focused on targeted support for people in the most underserved communities and underrepresented groups • In 2023, the number of people upskilled was in line with our per annum target On track LifeSkills – people placed into work Place 250,000 people into work (2023 to the end of 2027) 53,500 people placed into work in 2023 • Exceeded our per annum target of 50,000 people placed into work in 2023 Slightly ahead of track Unreasonable Impact (partnership with the Unreasonable Group) Support an additional 200 businesses solving social and environmental challenges (2023 to the end of 2027) 41 ventures supported • After achieving our goal to support 250 ventures by the end of 2022, this strategic global partnership with Unreasonable Group was renewed in 2023 to enable Barclays to support an additional 200 entrepreneurs over five years. More than 300 ventures have been supported so far • In 2023, the number of ventures supported met our per annum target On track Total Climate & sustainability: 7.5% Overall strategic non-financial outcome (out of a maximum possible 25%) 16.5% Measure Criteria Performance Commentary Outcome Note 1 Global real estate portfolio includes offices, branches, campuses and data centres. + Further details on our approach to Key Performance Indicators are included in the Strategic report. Refer to home.barclays/sustainability/esg-resource-hub/ for more information on the ESG measures. Strategy Climate and sustainability report Risk review Financial review Financial statements Barclays PLC 2023 Annual Report on Form 20-F 139Governance Remuneration report (continued)
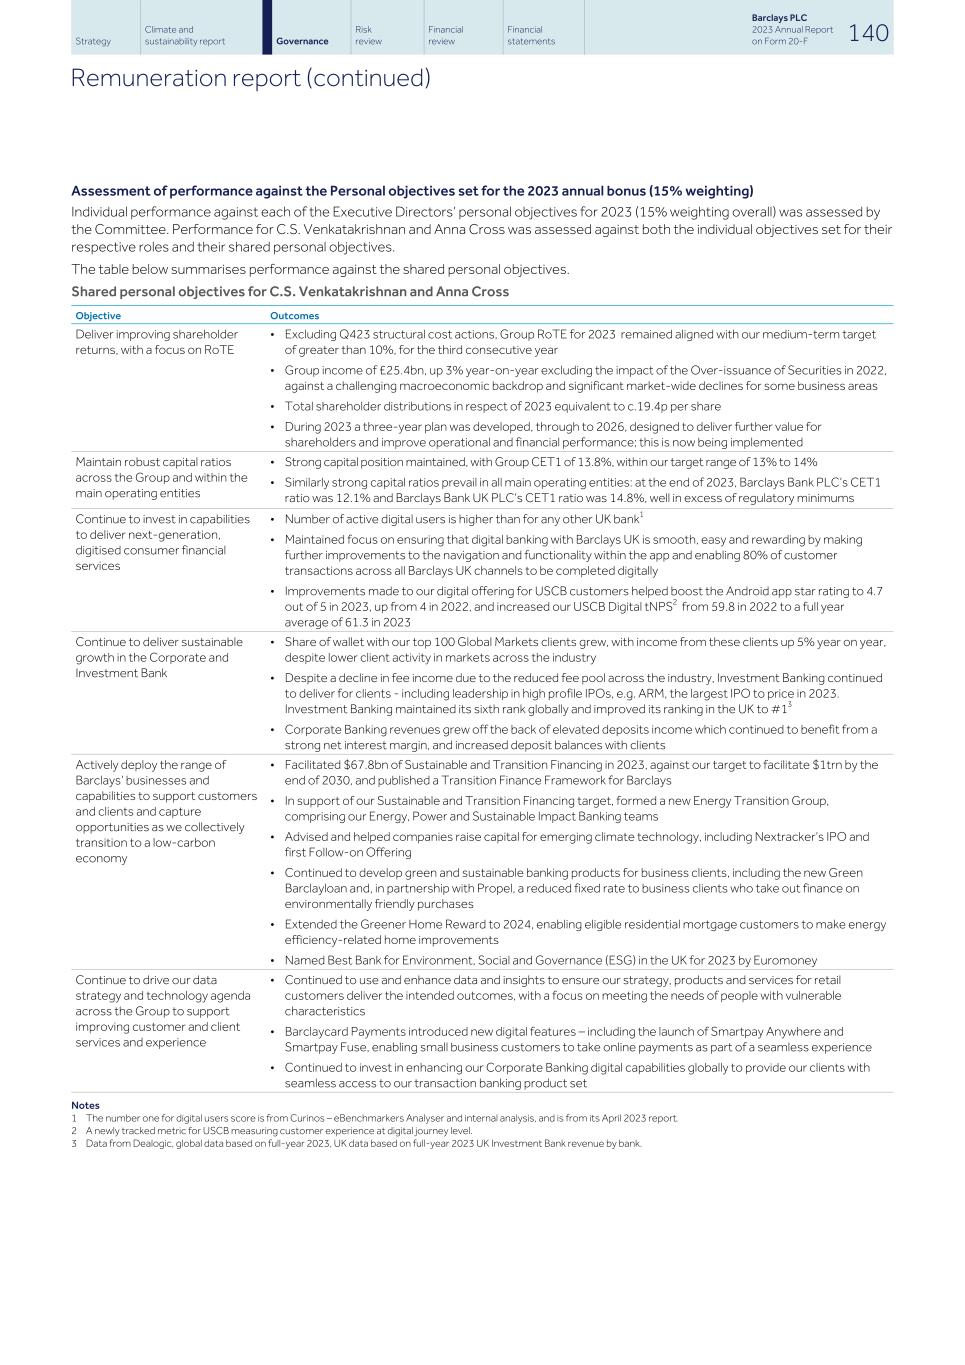
Assessment of performance against the Personal objectives set for the 2023 annual bonus (15% weighting) Individual performance against each of the Executive Directors’ personal objectives for 2023 (15% weighting overall) was assessed by the Committee. Performance for C.S. Venkatakrishnan and Anna Cross was assessed against both the individual objectives set for their respective roles and their shared personal objectives. The table below summarises performance against the shared personal objectives. Shared personal objectives for C.S. Venkatakrishnan and Anna Cross Deliver improving shareholder returns, with a focus on RoTE • Excluding Q423 structural cost actions, Group RoTE for 2023 remained aligned with our medium-term target of greater than 10%, for the third consecutive year • Group income of £25.4bn, up 3% year-on-year excluding the impact of the Over-issuance of Securities in 2022, against a challenging macroeconomic backdrop and significant market-wide declines for some business areas • Total shareholder distributions in respect of 2023 equivalent to c.19.4p per share • During 2023 a three-year plan was developed, through to 2026, designed to deliver further value for shareholders and improve operational and financial performance; this is now being implemented Maintain robust capital ratios across the Group and within the main operating entities • Strong capital position maintained, with Group CET1 of 13.8%, within our target range of 13% to 14% • Similarly strong capital ratios prevail in all main operating entities: at the end of 2023, Barclays Bank PLC’s CET1 ratio was 12.1% and Barclays Bank UK PLC’s CET1 ratio was 14.8%, well in excess of regulatory minimums Continue to invest in capabilities to deliver next-generation, digitised consumer financial services • Number of active digital users is higher than for any other UK bank1 • Maintained focus on ensuring that digital banking with Barclays UK is smooth, easy and rewarding by making further improvements to the navigation and functionality within the app and enabling 80% of customer transactions across all Barclays UK channels to be completed digitally • Improvements made to our digital offering for USCB customers helped boost the Android app star rating to 4.7 out of 5 in 2023, up from 4 in 2022, and increased our USCB Digital tNPS2 from 59.8 in 2022 to a full year average of 61.3 in 2023 Continue to deliver sustainable growth in the Corporate and Investment Bank • Share of wallet with our top 100 Global Markets clients grew, with income from these clients up 5% year on year, despite lower client activity in markets across the industry • Despite a decline in fee income due to the reduced fee pool across the industry, Investment Banking continued to deliver for clients - including leadership in high profile IPOs, e.g. ARM, the largest IPO to price in 2023. Investment Banking maintained its sixth rank globally and improved its ranking in the UK to #13 • Corporate Banking revenues grew off the back of elevated deposits income which continued to benefit from a strong net interest margin, and increased deposit balances with clients Actively deploy the range of Barclays’ businesses and capabilities to support customers and clients and capture opportunities as we collectively transition to a low-carbon economy • Facilitated $67.8bn of Sustainable and Transition Financing in 2023, against our target to facilitate $1trn by the end of 2030, and published a Transition Finance Framework for Barclays • In support of our Sustainable and Transition Financing target, formed a new Energy Transition Group, comprising our Energy, Power and Sustainable Impact Banking teams • Advised and helped companies raise capital for emerging climate technology, including Nextracker’s IPO and first Follow-on Offering • Continued to develop green and sustainable banking products for business clients, including the new Green Barclayloan and, in partnership with Propel, a reduced fixed rate to business clients who take out finance on environmentally friendly purchases • Extended the Greener Home Reward to 2024, enabling eligible residential mortgage customers to make energy efficiency-related home improvements • Named Best Bank for Environment, Social and Governance (ESG) in the UK for 2023 by Euromoney Continue to drive our data strategy and technology agenda across the Group to support improving customer and client services and experience • Continued to use and enhance data and insights to ensure our strategy, products and services for retail customers deliver the intended outcomes, with a focus on meeting the needs of people with vulnerable characteristics • Barclaycard Payments introduced new digital features – including the launch of Smartpay Anywhere and Smartpay Fuse, enabling small business customers to take online payments as part of a seamless experience • Continued to invest in enhancing our Corporate Banking digital capabilities globally to provide our clients with seamless access to our transaction banking product set Objective Outcomes Notes 1 The number one for digital users score is from Curinos – eBenchmarkers Analyser and internal analysis, and is from its April 2023 report. 2 A newly tracked metric for USCB measuring customer experience at digital journey level. 3 Data from Dealogic, global data based on full-year 2023, UK data based on full-year 2023 UK Investment Bank revenue by bank. Strategy Climate and sustainability report Risk review Financial review Financial statements Barclays PLC 2023 Annual Report on Form 20-F 140Governance Remuneration report (continued)
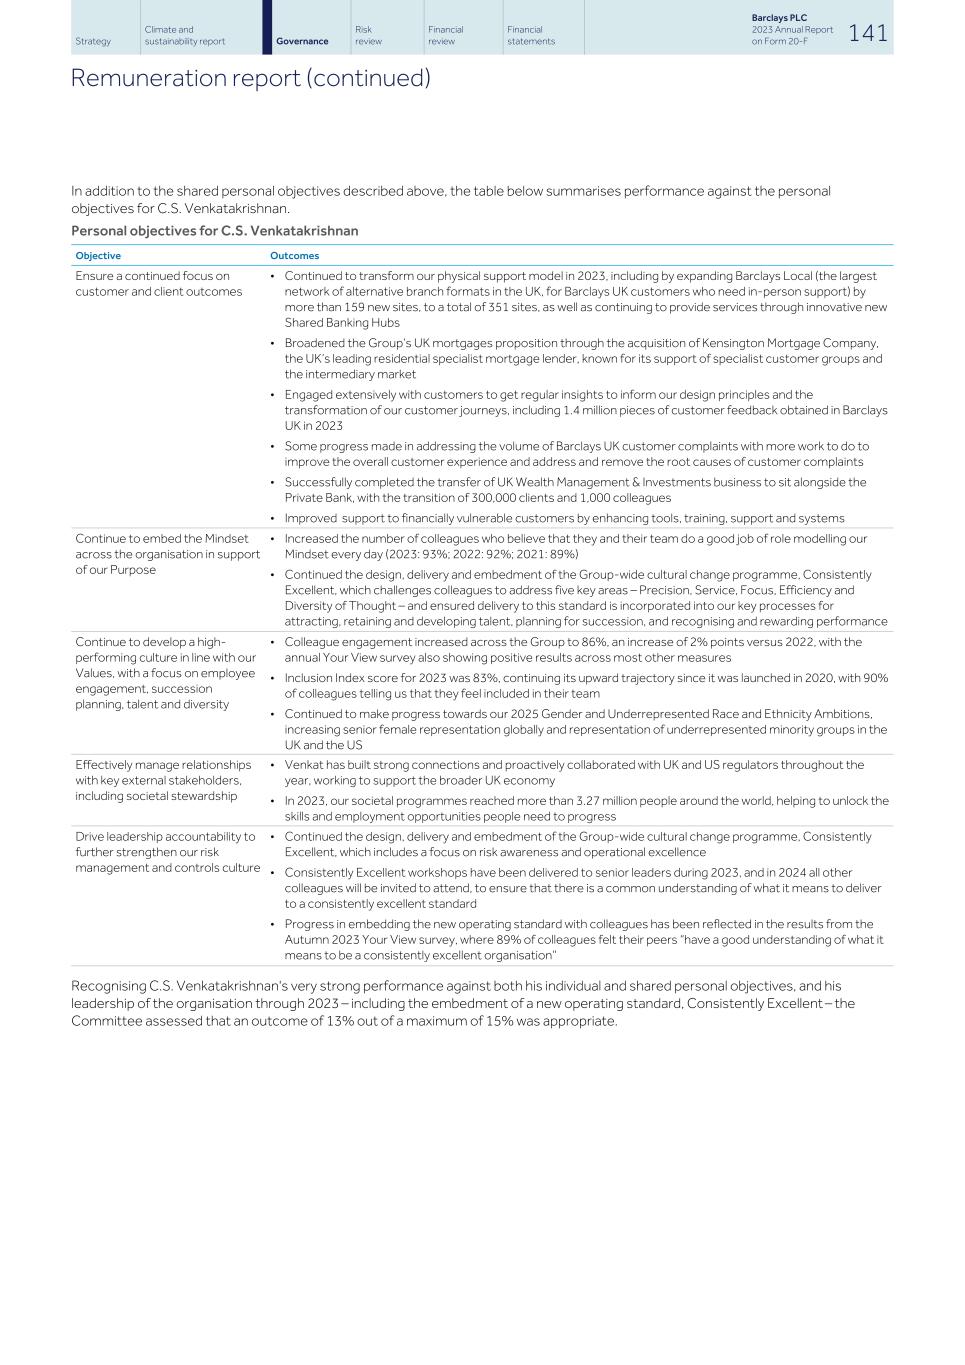
In addition to the shared personal objectives described above, the table below summarises performance against the personal objectives for C.S. Venkatakrishnan. Personal objectives for C.S. Venkatakrishnan Objective Outcomes Ensure a continued focus on customer and client outcomes • Continued to transform our physical support model in 2023, including by expanding Barclays Local (the largest network of alternative branch formats in the UK, for Barclays UK customers who need in-person support) by more than 159 new sites, to a total of 351 sites, as well as continuing to provide services through innovative new Shared Banking Hubs • Broadened the Group’s UK mortgages proposition through the acquisition of Kensington Mortgage Company, the UK’s leading residential specialist mortgage lender, known for its support of specialist customer groups and the intermediary market • Engaged extensively with customers to get regular insights to inform our design principles and the transformation of our customer journeys, including 1.4 million pieces of customer feedback obtained in Barclays UK in 2023 • Some progress made in addressing the volume of Barclays UK customer complaints with more work to do to improve the overall customer experience and address and remove the root causes of customer complaints • Successfully completed the transfer of UK Wealth Management & Investments business to sit alongside the Private Bank, with the transition of 300,000 clients and 1,000 colleagues • Improved support to financially vulnerable customers by enhancing tools, training, support and systems Continue to embed the Mindset across the organisation in support of our Purpose • Increased the number of colleagues who believe that they and their team do a good job of role modelling our Mindset every day (2023: 93%; 2022: 92%; 2021: 89%) • Continued the design, delivery and embedment of the Group-wide cultural change programme, Consistently Excellent, which challenges colleagues to address five key areas – Precision, Service, Focus, Efficiency and Diversity of Thought – and ensured delivery to this standard is incorporated into our key processes for attracting, retaining and developing talent, planning for succession, and recognising and rewarding performance Continue to develop a high- performing culture in line with our Values, with a focus on employee engagement, succession planning, talent and diversity • Colleague engagement increased across the Group to 86%, an increase of 2% points versus 2022, with the annual Your View survey also showing positive results across most other measures • Inclusion Index score for 2023 was 83%, continuing its upward trajectory since it was launched in 2020, with 90% of colleagues telling us that they feel included in their team • Continued to make progress towards our 2025 Gender and Underrepresented Race and Ethnicity Ambitions, increasing senior female representation globally and representation of underrepresented minority groups in the UK and the US Effectively manage relationships with key external stakeholders, including societal stewardship • Venkat has built strong connections and proactively collaborated with UK and US regulators throughout the year, working to support the broader UK economy • In 2023, our societal programmes reached more than 3.27 million people around the world, helping to unlock the skills and employment opportunities people need to progress Drive leadership accountability to further strengthen our risk management and controls culture • Continued the design, delivery and embedment of the Group-wide cultural change programme, Consistently Excellent, which includes a focus on risk awareness and operational excellence • Consistently Excellent workshops have been delivered to senior leaders during 2023, and in 2024 all other colleagues will be invited to attend, to ensure that there is a common understanding of what it means to deliver to a consistently excellent standard • Progress in embedding the new operating standard with colleagues has been reflected in the results from the Autumn 2023 Your View survey, where 89% of colleagues felt their peers “have a good understanding of what it means to be a consistently excellent organisation” Recognising C.S. Venkatakrishnan's very strong performance against both his individual and shared personal objectives, and his leadership of the organisation through 2023 – including the embedment of a new operating standard, Consistently Excellent – the Committee assessed that an outcome of 13% out of a maximum of 15% was appropriate. Strategy Climate and sustainability report Risk review Financial review Financial statements Barclays PLC 2023 Annual Report on Form 20-F 141Governance Remuneration report (continued)
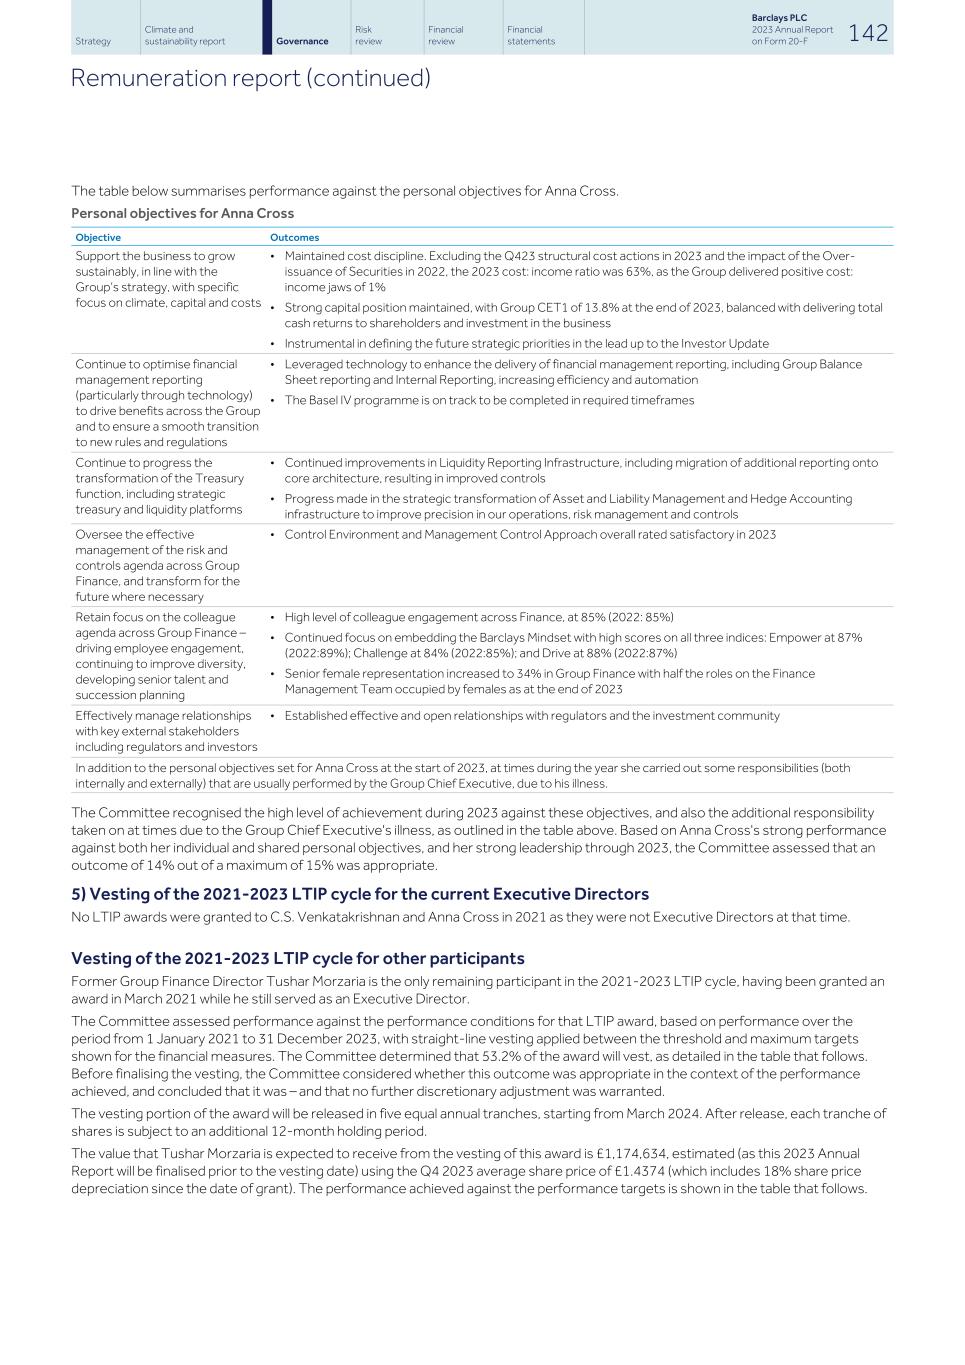
The table below summarises performance against the personal objectives for Anna Cross. Personal objectives for Anna Cross Objective Outcomes Support the business to grow sustainably, in line with the Group’s strategy, with specific focus on climate, capital and costs • Maintained cost discipline. Excluding the Q423 structural cost actions in 2023 and the impact of the Over- issuance of Securities in 2022, the 2023 cost: income ratio was 63%, as the Group delivered positive cost: income jaws of 1% • Strong capital position maintained, with Group CET1 of 13.8% at the end of 2023, balanced with delivering total cash returns to shareholders and investment in the business • Instrumental in defining the future strategic priorities in the lead up to the Investor Update Continue to optimise financial management reporting (particularly through technology) to drive benefits across the Group and to ensure a smooth transition to new rules and regulations • Leveraged technology to enhance the delivery of financial management reporting, including Group Balance Sheet reporting and Internal Reporting, increasing efficiency and automation • The Basel IV programme is on track to be completed in required timeframes Continue to progress the transformation of the Treasury function, including strategic treasury and liquidity platforms • Continued improvements in Liquidity Reporting Infrastructure, including migration of additional reporting onto core architecture, resulting in improved controls • Progress made in the strategic transformation of Asset and Liability Management and Hedge Accounting infrastructure to improve precision in our operations, risk management and controls Oversee the effective management of the risk and controls agenda across Group Finance, and transform for the future where necessary • Control Environment and Management Control Approach overall rated satisfactory in 2023 Retain focus on the colleague agenda across Group Finance – driving employee engagement, continuing to improve diversity, developing senior talent and succession planning • High level of colleague engagement across Finance, at 85% (2022: 85%) • Continued focus on embedding the Barclays Mindset with high scores on all three indices: Empower at 87% (2022:89%); Challenge at 84% (2022:85%); and Drive at 88% (2022:87%) • Senior female representation increased to 34% in Group Finance with half the roles on the Finance Management Team occupied by females as at the end of 2023 Effectively manage relationships with key external stakeholders including regulators and investors • Established effective and open relationships with regulators and the investment community In addition to the personal objectives set for Anna Cross at the start of 2023, at times during the year she carried out some responsibilities (both internally and externally) that are usually performed by the Group Chief Executive, due to his illness. The Committee recognised the high level of achievement during 2023 against these objectives, and also the additional responsibility taken on at times due to the Group Chief Executive's illness, as outlined in the table above. Based on Anna Cross's strong performance against both her individual and shared personal objectives, and her strong leadership through 2023, the Committee assessed that an outcome of 14% out of a maximum of 15% was appropriate. 5) Vesting of the 2021-2023 LTIP cycle for the current Executive Directors No LTIP awards were granted to C.S. Venkatakrishnan and Anna Cross in 2021 as they were not Executive Directors at that time. Vesting of the 2021-2023 LTIP cycle for other participants Former Group Finance Director Tushar Morzaria is the only remaining participant in the 2021-2023 LTIP cycle, having been granted an award in March 2021 while he still served as an Executive Director. The Committee assessed performance against the performance conditions for that LTIP award, based on performance over the period from 1 January 2021 to 31 December 2023, with straight-line vesting applied between the threshold and maximum targets shown for the financial measures. The Committee determined that 53.2% of the award will vest, as detailed in the table that follows. Before finalising the vesting, the Committee considered whether this outcome was appropriate in the context of the performance achieved, and concluded that it was – and that no further discretionary adjustment was warranted. The vesting portion of the award will be released in five equal annual tranches, starting from March 2024. After release, each tranche of shares is subject to an additional 12-month holding period. The value that Tushar Morzaria is expected to receive from the vesting of this award is £1,174,634, estimated (as this 2023 Annual Report will be finalised prior to the vesting date) using the Q4 2023 average share price of £1.4374 (which includes 18% share price depreciation since the date of grant). The performance achieved against the performance targets is shown in the table that follows. Strategy Climate and sustainability report Risk review Financial review Financial statements Barclays PLC 2023 Annual Report on Form 20-F 142Governance Remuneration report (continued)
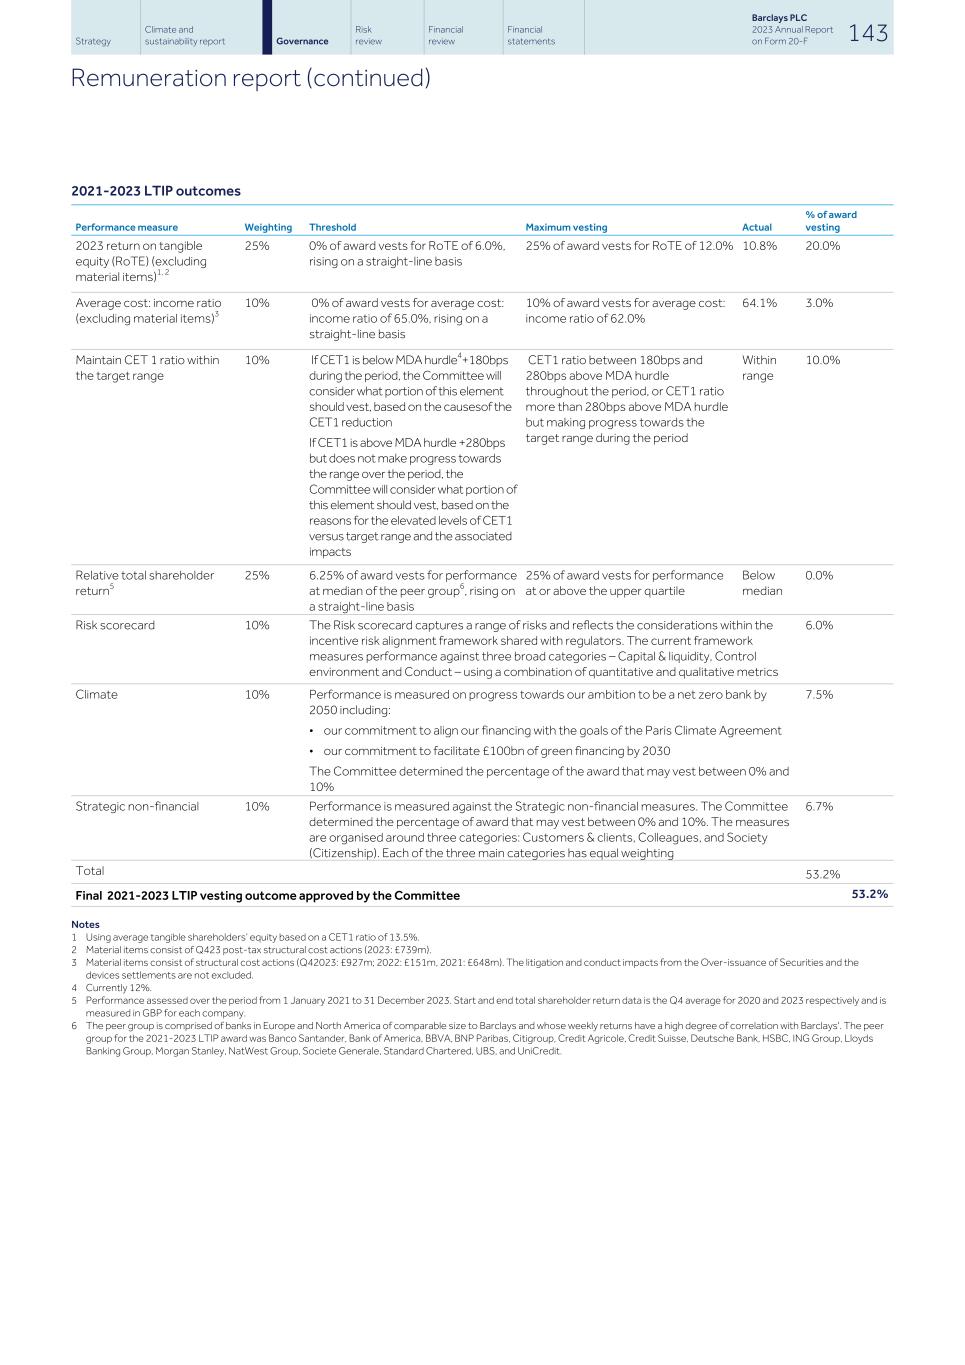
2021-2023 LTIP outcomes 2023 return on tangible equity (RoTE) (excluding material items)1, 2 25% 0% of award vests for RoTE of 6.0%, rising on a straight-line basis 25% of award vests for RoTE of 12.0% 10.8% 20.0% Average cost: income ratio (excluding material items)3 10% 0% of award vests for average cost: income ratio of 65.0%, rising on a straight-line basis 10% of award vests for average cost: income ratio of 62.0% 64.1% 3.0% Maintain CET 1 ratio within the target range 10% If CET1 is below MDA hurdle4+180bps during the period, the Committee will consider what portion of this element should vest, based on the causesof the CET1 reduction If CET1 is above MDA hurdle +280bps but does not make progress towards the range over the period, the Committee will consider what portion of this element should vest, based on the reasons for the elevated levels of CET1 versus target range and the associated impacts CET1 ratio between 180bps and 280bps above MDA hurdle throughout the period, or CET1 ratio more than 280bps above MDA hurdle but making progress towards the target range during the period Within range 10.0% Relative total shareholder return5 25% 6.25% of award vests for performance at median of the peer group6, rising on a straight-line basis 25% of award vests for performance at or above the upper quartile Below median 0.0% Risk scorecard 10% The Risk scorecard captures a range of risks and reflects the considerations within the incentive risk alignment framework shared with regulators. The current framework measures performance against three broad categories – Capital & liquidity, Control environment and Conduct – using a combination of quantitative and qualitative metrics 6.0% Climate 10% Performance is measured on progress towards our ambition to be a net zero bank by 2050 including: • our commitment to align our financing with the goals of the Paris Climate Agreement • our commitment to facilitate £100bn of green financing by 2030 The Committee determined the percentage of the award that may vest between 0% and 10% 7.5% Strategic non-financial 10% Performance is measured against the Strategic non-financial measures. The Committee determined the percentage of award that may vest between 0% and 10%. The measures are organised around three categories: Customers & clients, Colleagues, and Society (Citizenship). Each of the three main categories has equal weighting 6.7% Total 53.2% Final 2021-2023 LTIP vesting outcome approved by the Committee 53.2% Performance measure Weighting Threshold Maximum vesting Actual % of award vesting Notes 1 Using average tangible shareholders’ equity based on a CET1 ratio of 13.5%. 2 Material items consist of Q423 post-tax structural cost actions (2023: £739m). 3 Material items consist of structural cost actions (Q42023: £927m; 2022: £151m, 2021: £648m). The litigation and conduct impacts from the Over-issuance of Securities and the devices settlements are not excluded. 4 Currently 12%. 5 Performance assessed over the period from 1 January 2021 to 31 December 2023. Start and end total shareholder return data is the Q4 average for 2020 and 2023 respectively and is measured in GBP for each company. 6 The peer group is comprised of banks in Europe and North America of comparable size to Barclays and whose weekly returns have a high degree of correlation with Barclays'. The peer group for the 2021-2023 LTIP award was Banco Santander, Bank of America, BBVA, BNP Paribas, Citigroup, Credit Agricole, Credit Suisse, Deutsche Bank, HSBC, ING Group, Lloyds Banking Group, Morgan Stanley, NatWest Group, Societe Generale, Standard Chartered, UBS, and UniCredit. Strategy Climate and sustainability report Risk review Financial review Financial statements Barclays PLC 2023 Annual Report on Form 20-F 143Governance Remuneration report (continued)
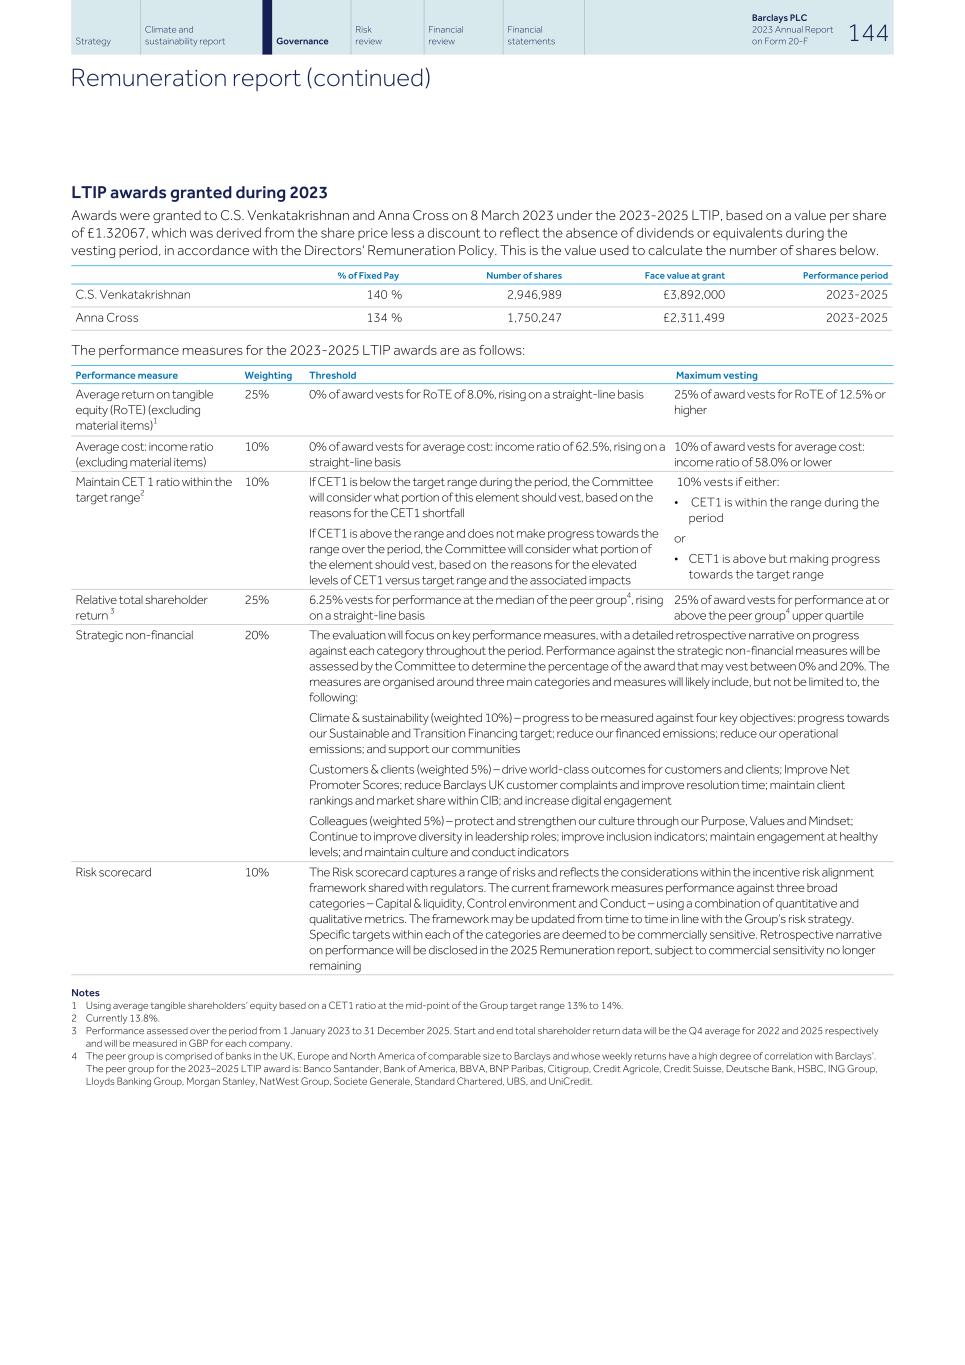
LTIP awards granted during 2023 Awards were granted to C.S. Venkatakrishnan and Anna Cross on 8 March 2023 under the 2023-2025 LTIP, based on a value per share of £1.32067, which was derived from the share price less a discount to reflect the absence of dividends or equivalents during the vesting period, in accordance with the Directors' Remuneration Policy. This is the value used to calculate the number of shares below. % of Fixed Pay Number of shares Face value at grant Performance period C.S. Venkatakrishnan 140 % 2,946,989 £3,892,000 2023-2025 Anna Cross 134 % 1,750,247 £2,311,499 2023-2025 The performance measures for the 2023-2025 LTIP awards are as follows: Performance measure Weighting Threshold Maximum vesting Average return on tangible equity (RoTE) (excluding material items)1 25% 0% of award vests for RoTE of 8.0%, rising on a straight-line basis 25% of award vests for RoTE of 12.5% or higher Average cost: income ratio (excluding material items) 10% 0% of award vests for average cost: income ratio of 62.5%, rising on a straight-line basis 10% of award vests for average cost: income ratio of 58.0% or lower Maintain CET 1 ratio within the target range2 10% If CET1 is below the target range during the period, the Committee will consider what portion of this element should vest, based on the reasons for the CET1 shortfall If CET1 is above the range and does not make progress towards the range over the period, the Committee will consider what portion of the element should vest, based on the reasons for the elevated levels of CET1 versus target range and the associated impacts 10% vests if either: • CET1 is within the range during the period or • CET1 is above but making progress towards the target range Relative total shareholder return 3 25% 6.25% vests for performance at the median of the peer group4, rising on a straight-line basis 25% of award vests for performance at or above the peer group4 upper quartile Strategic non-financial 20% The evaluation will focus on key performance measures, with a detailed retrospective narrative on progress against each category throughout the period. Performance against the strategic non-financial measures will be assessed by the Committee to determine the percentage of the award that may vest between 0% and 20%. The measures are organised around three main categories and measures will likely include, but not be limited to, the following: Climate & sustainability (weighted 10%) – progress to be measured against four key objectives: progress towards our Sustainable and Transition Financing target; reduce our financed emissions; reduce our operational emissions; and support our communities Customers & clients (weighted 5%) – drive world-class outcomes for customers and clients; Improve Net Promoter Scores; reduce Barclays UK customer complaints and improve resolution time; maintain client rankings and market share within CIB; and increase digital engagement Colleagues (weighted 5%) – protect and strengthen our culture through our Purpose, Values and Mindset; Continue to improve diversity in leadership roles; improve inclusion indicators; maintain engagement at healthy levels; and maintain culture and conduct indicators Risk scorecard 10% The Risk scorecard captures a range of risks and reflects the considerations within the incentive risk alignment framework shared with regulators. The current framework measures performance against three broad categories – Capital & liquidity, Control environment and Conduct – using a combination of quantitative and qualitative metrics. The framework may be updated from time to time in line with the Group’s risk strategy. Specific targets within each of the categories are deemed to be commercially sensitive. Retrospective narrative on performance will be disclosed in the 2025 Remuneration report, subject to commercial sensitivity no longer remaining Notes 1 Using average tangible shareholders’ equity based on a CET1 ratio at the mid-point of the Group target range 13% to 14%. 2 Currently 13.8%. 3 Performance assessed over the period from 1 January 2023 to 31 December 2025. Start and end total shareholder return data will be the Q4 average for 2022 and 2025 respectively and will be measured in GBP for each company. 4 The peer group is comprised of banks in the UK, Europe and North America of comparable size to Barclays and whose weekly returns have a high degree of correlation with Barclays’. The peer group for the 2023–2025 LTIP award is: Banco Santander, Bank of America, BBVA, BNP Paribas, Citigroup, Credit Agricole, Credit Suisse, Deutsche Bank, HSBC, ING Group, Lloyds Banking Group, Morgan Stanley, NatWest Group, Societe Generale, Standard Chartered, UBS, and UniCredit. Strategy Climate and sustainability report Risk review Financial review Financial statements Barclays PLC 2023 Annual Report on Form 20-F 144Governance Remuneration report (continued)
Executive Directors: Statement of implementation of remuneration policy in 2024 An overview of how the Directors' Remuneration Policy will be implemented in 2024 is provided alongside the summary of the policy on page 129. 2024 Fixed Pay and market competitiveness of the Executive Directors’ total compensation opportunity Pay benchmarking data is used as a reference point to ensure that the total compensation opportunity provided to the Executive Directors is appropriately positioned compared to other similar large and complex international banks. Comparing the Executive Directors' pay solely with other UK-listed banks would not recognise the Group's global footprint and diversified universal banking model, which includes significant corporate banking, investment banking and global markets businesses. The international banking peer group used by the Committee when considering the Executive Directors' pay therefore includes other large universal banks from continental Europe, and the large US universal and investment banks. Around half of the peer group are US- based, as these are among the most relevant comparators given their business mix and also form part of the peer group used internally when comparing the Group's performance. Barclays actively competes with those US-based peers for talent, which is reflected in several current and former Executive Directors having been recruited into Barclays from those firms. The Committee also recognises that some of those peers are larger than Barclays, and that market pay levels for executive directors of US companies are often higher than those of UK companies. To help maintain balance, the international banking peer group also includes the larger UK-listed banks most comparable to Barclays. An annual review of the Executive Directors' Fixed Pay, in the same way and at the same time as for the wider workforce, is a feature of the Directors' Remuneration Policy approved by shareholders in 2023. In February 2024 the Committee reviewed the Fixed Pay for each Executive Director as part of the year-end pay review process for colleagues across the Group. The Committee considered the maximum total compensation opportunity of each Executive Director, driven by their respective levels of Fixed Pay, and noted that in each case the total compensation opportunity is materially less than the median of that offered for comparable roles in our international banking peer group. The Committee considered this relative market positioning in the context of the robust performance and significant personal contribution made by each of the Executive Directors, and determined that Fixed Pay would be increased by 2.5% for both C.S. Venkatakrishnan and Anna Cross – to £2,947,000 and £1,845,000 respectively, effective 1 March 2024. The Committee noted that these are lower percentage increases than the average fixed pay increase for the wider workforce, and in particular for UK employees within the scope of the 2024 UK pay deal with the union Unite – with a 5.55% budget for salary increases for junior UK employees and a 3.75% budget for other union-recognised employees. To align the Executive Directors' interests with those of shareholders, half of Fixed Pay for each Executive Director is delivered in shares, which are granted quarterly and released in instalments over five years. The other half of their Fixed Pay is delivered in cash, paid monthly via payroll in the same way as salary for other employees. The following charts compare each Executive Director's maximum total compensation opportunity for 2024 against the equivalent opportunity across international banking peers. This shows that, even after these Fixed Pay increases, the maximum total compensation opportunity is significantly behind international banking peers, falling between the market lower quartile and median for C.S. Venkatakrishnan and slightly below lower quartile for Anna Cross. The charts also show a comparison of the maximum total compensation opportunity of each Executive Director with the equivalent roles at the companies that make up the FTSE 30 (i.e. the 30 largest FTSE 100 constituents by market capitalisation). This shows that the Executive Directors’ maximum total compensation opportunity is more competitive, but not inappropriate, compared to the FTSE 30 group. The Committee noted that it would be unlikely for the Group to fill either of the Executive Director roles by recruiting from the other FTSE 30 companies, recognising the necessity for candidates for these roles to have the right breadth and depth of banking knowledge and experience – particularly given Barclays’ mix of businesses, as outlined above. However, this comparison is provided alongside the international banking peer group to provide additional UK context. Strategy Climate and sustainability report Risk review Financial review Financial statements Barclays PLC 2023 Annual Report on Form 20-F 145Governance Remuneration report (continued)
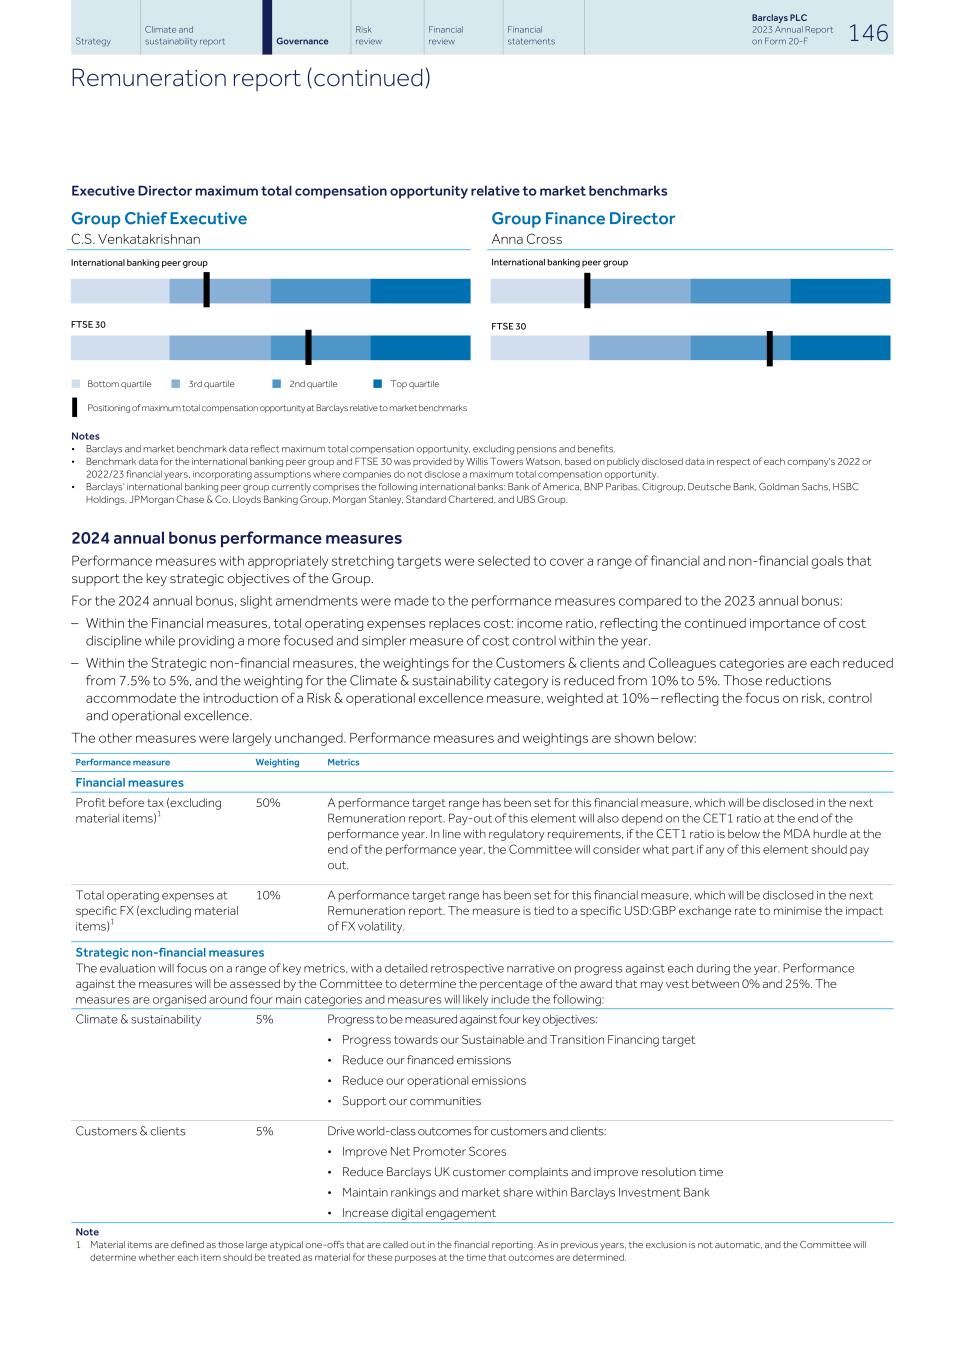
Executive Director maximum total compensation opportunity relative to market benchmarks Group Chief Executive C.S. Venkatakrishnan International banking peer group FTSE 30 n Bottom quartile n 3rd quartile n 2nd quartile n Top quartile Positioning of maximum total compensation opportunity at Barclays relative to market benchmarks Group Finance Director Anna Cross International banking peer group FTSE 30 Notes • Barclays and market benchmark data reflect maximum total compensation opportunity, excluding pensions and benefits. • Benchmark data for the international banking peer group and FTSE 30 was provided by Willis Towers Watson, based on publicly disclosed data in respect of each company's 2022 or 2022/23 financial years, incorporating assumptions where companies do not disclose a maximum total compensation opportunity. • Barclays’ international banking peer group currently comprises the following international banks: Bank of America, BNP Paribas, Citigroup, Deutsche Bank, Goldman Sachs, HSBC Holdings, JPMorgan Chase & Co, Lloyds Banking Group, Morgan Stanley, Standard Chartered, and UBS Group. 2024 annual bonus performance measures Performance measures with appropriately stretching targets were selected to cover a range of financial and non-financial goals that support the key strategic objectives of the Group. For the 2024 annual bonus, slight amendments were made to the performance measures compared to the 2023 annual bonus: – Within the Financial measures, total operating expenses replaces cost: income ratio, reflecting the continued importance of cost discipline while providing a more focused and simpler measure of cost control within the year. – Within the Strategic non-financial measures, the weightings for the Customers & clients and Colleagues categories are each reduced from 7.5% to 5%, and the weighting for the Climate & sustainability category is reduced from 10% to 5%. Those reductions accommodate the introduction of a Risk & operational excellence measure, weighted at 10% – reflecting the focus on risk, control and operational excellence. The other measures were largely unchanged. Performance measures and weightings are shown below: Financial measures Profit before tax (excluding material items)1 50% A performance target range has been set for this financial measure, which will be disclosed in the next Remuneration report. Pay-out of this element will also depend on the CET1 ratio at the end of the performance year. In line with regulatory requirements, if the CET1 ratio is below the MDA hurdle at the end of the performance year, the Committee will consider what part if any of this element should pay out. Total operating expenses at specific FX (excluding material items)1 10% A performance target range has been set for this financial measure, which will be disclosed in the next Remuneration report. The measure is tied to a specific USD:GBP exchange rate to minimise the impact of FX volatility. Strategic non-financial measures The evaluation will focus on a range of key metrics, with a detailed retrospective narrative on progress against each during the year. Performance against the measures will be assessed by the Committee to determine the percentage of the award that may vest between 0% and 25%. The measures are organised around four main categories and measures will likely include the following: Climate & sustainability 5% Progress to be measured against four key objectives: • Progress towards our Sustainable and Transition Financing target • Reduce our financed emissions • Reduce our operational emissions • Support our communities Customers & clients 5% Drive world-class outcomes for customers and clients: • Improve Net Promoter Scores • Reduce Barclays UK customer complaints and improve resolution time • Maintain rankings and market share within Barclays Investment Bank • Increase digital engagement Note 1 Material items are defined as those large atypical one-offs that are called out in the financial reporting. As in previous years, the exclusion is not automatic, and the Committee will determine whether each item should be treated as material for these purposes at the time that outcomes are determined. Performance measure Weighting Metrics Strategy Climate and sustainability report Risk review Financial review Financial statements Barclays PLC 2023 Annual Report on Form 20-F 146Governance Remuneration report (continued)
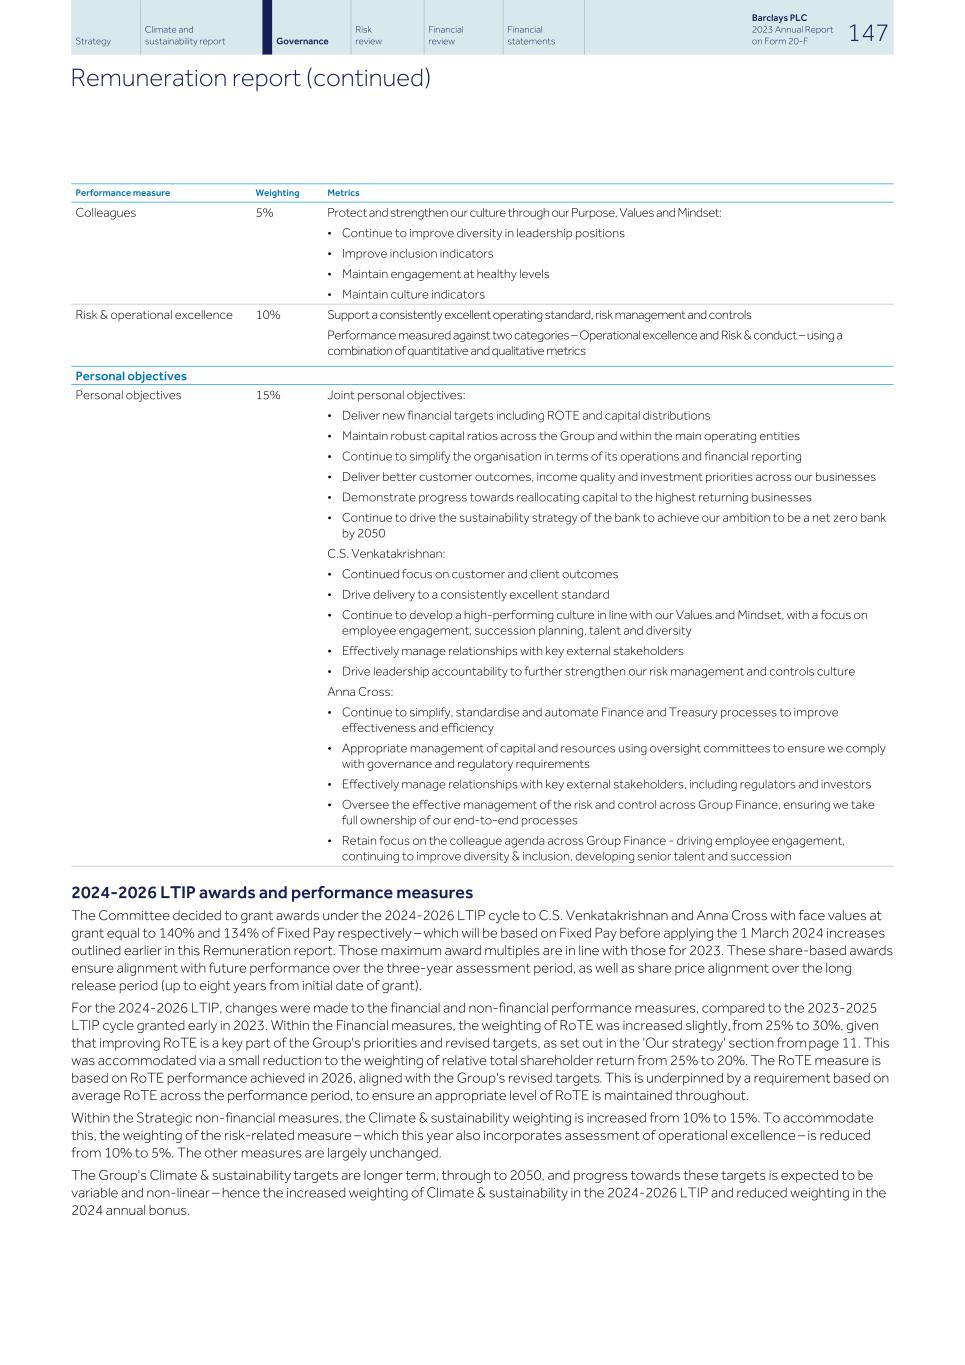
Colleagues 5% Protect and strengthen our culture through our Purpose, Values and Mindset: • Continue to improve diversity in leadership positions • Improve inclusion indicators • Maintain engagement at healthy levels • Maintain culture indicators Risk & operational excellence 10% Support a consistently excellent operating standard, risk management and controls Performance measured against two categories – Operational excellence and Risk & conduct – using a combination of quantitative and qualitative metrics Personal objectives Personal objectives 15% Joint personal objectives: • Deliver new financial targets including ROTE and capital distributions • Maintain robust capital ratios across the Group and within the main operating entities • Continue to simplify the organisation in terms of its operations and financial reporting • Deliver better customer outcomes, income quality and investment priorities across our businesses • Demonstrate progress towards reallocating capital to the highest returning businesses • Continue to drive the sustainability strategy of the bank to achieve our ambition to be a net zero bank by 2050 C.S. Venkatakrishnan: • Continued focus on customer and client outcomes • Drive delivery to a consistently excellent standard • Continue to develop a high-performing culture in line with our Values and Mindset, with a focus on employee engagement, succession planning, talent and diversity • Effectively manage relationships with key external stakeholders • Drive leadership accountability to further strengthen our risk management and controls culture Anna Cross: • Continue to simplify, standardise and automate Finance and Treasury processes to improve effectiveness and efficiency • Appropriate management of capital and resources using oversight committees to ensure we comply with governance and regulatory requirements • Effectively manage relationships with key external stakeholders, including regulators and investors • Oversee the effective management of the risk and control across Group Finance, ensuring we take full ownership of our end-to-end processes • Retain focus on the colleague agenda across Group Finance - driving employee engagement, continuing to improve diversity & inclusion, developing senior talent and succession Performance measure Weighting Metrics 2024-2026 LTIP awards and performance measures The Committee decided to grant awards under the 2024-2026 LTIP cycle to C.S. Venkatakrishnan and Anna Cross with face values at grant equal to 140% and 134% of Fixed Pay respectively – which will be based on Fixed Pay before applying the 1 March 2024 increases outlined earlier in this Remuneration report. Those maximum award multiples are in line with those for 2023. These share-based awards ensure alignment with future performance over the three-year assessment period, as well as share price alignment over the long release period (up to eight years from initial date of grant). For the 2024-2026 LTIP, changes were made to the financial and non-financial performance measures, compared to the 2023-2025 LTIP cycle granted early in 2023. Within the Financial measures, the weighting of RoTE was increased slightly, from 25% to 30%, given that improving RoTE is a key part of the Group's priorities and revised targets, as set out in the 'Our strategy' section from page 11. This was accommodated via a small reduction to the weighting of relative total shareholder return from 25% to 20%. The RoTE measure is based on RoTE performance achieved in 2026, aligned with the Group's revised targets. This is underpinned by a requirement based on average RoTE across the performance period, to ensure an appropriate level of RoTE is maintained throughout. Within the Strategic non-financial measures, the Climate & sustainability weighting is increased from 10% to 15%. To accommodate this, the weighting of the risk-related measure – which this year also incorporates assessment of operational excellence – is reduced from 10% to 5%. The other measures are largely unchanged. The Group's Climate & sustainability targets are longer term, through to 2050, and progress towards these targets is expected to be variable and non-linear – hence the increased weighting of Climate & sustainability in the 2024-2026 LTIP and reduced weighting in the 2024 annual bonus. Strategy Climate and sustainability report Risk review Financial review Financial statements Barclays PLC 2023 Annual Report on Form 20-F 147Governance Remuneration report (continued)
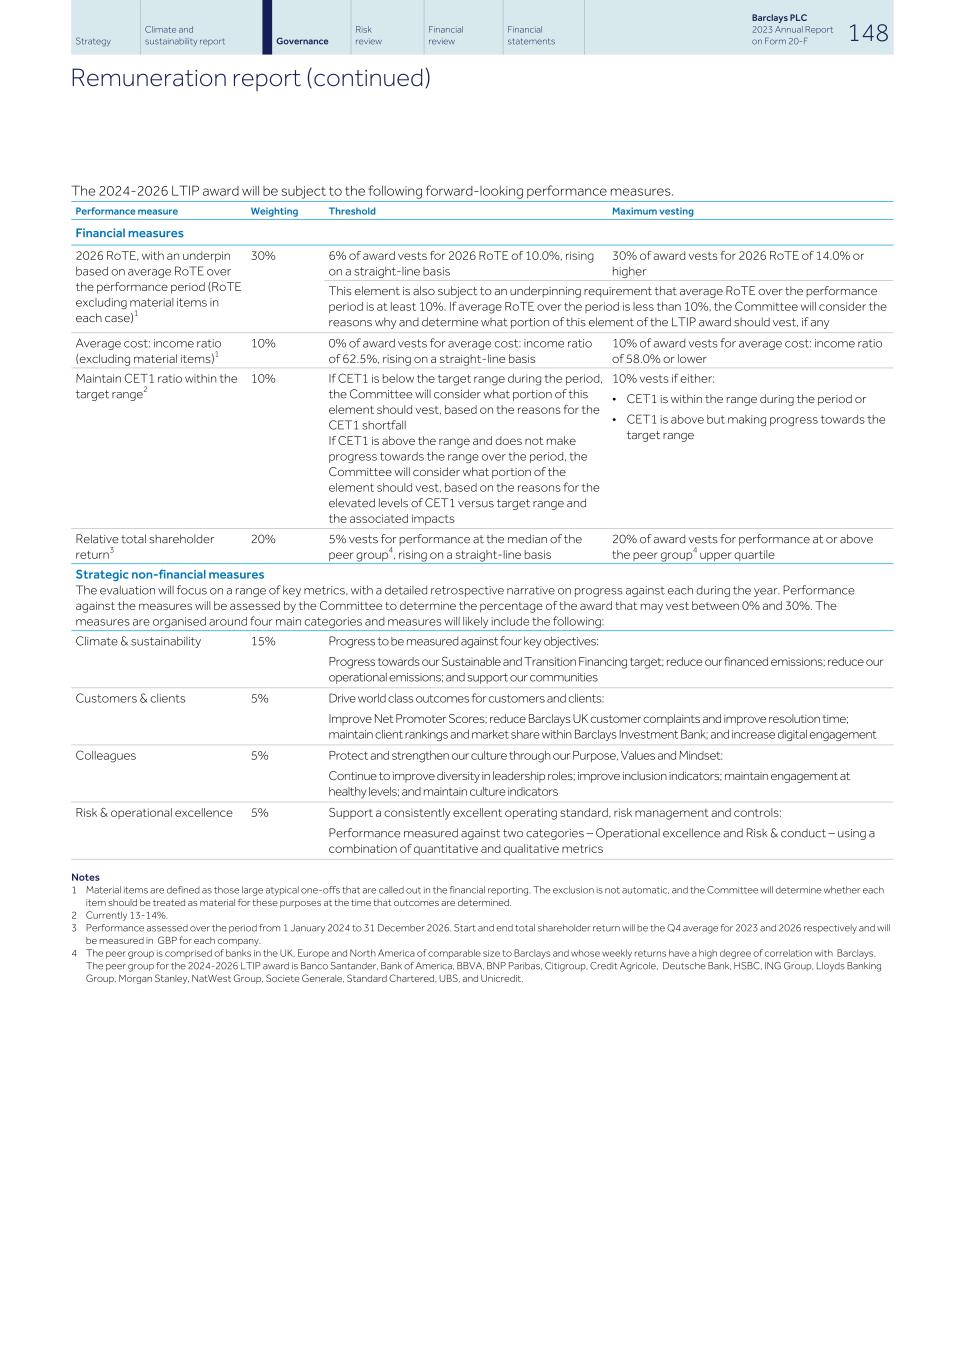
The 2024-2026 LTIP award will be subject to the following forward-looking performance measures. Financial measures 2026 RoTE, with an underpin based on average RoTE over the performance period (RoTE excluding material items in each case)1 30% 6% of award vests for 2026 RoTE of 10.0%, rising on a straight-line basis 30% of award vests for 2026 RoTE of 14.0% or higher This element is also subject to an underpinning requirement that average RoTE over the performance period is at least 10%. If average RoTE over the period is less than 10%, the Committee will consider the reasons why and determine what portion of this element of the LTIP award should vest, if any Average cost: income ratio (excluding material items)1 10% 0% of award vests for average cost: income ratio of 62.5%, rising on a straight-line basis 10% of award vests for average cost: income ratio of 58.0% or lower Maintain CET1 ratio within the target range2 10% If CET1 is below the target range during the period, the Committee will consider what portion of this element should vest, based on the reasons for the CET1 shortfall If CET1 is above the range and does not make progress towards the range over the period, the Committee will consider what portion of the element should vest, based on the reasons for the elevated levels of CET1 versus target range and the associated impacts 10% vests if either: • CET1 is within the range during the period or • CET1 is above but making progress towards the target range Relative total shareholder return3 20% 5% vests for performance at the median of the peer group4, rising on a straight-line basis 20% of award vests for performance at or above the peer group4 upper quartile Strategic non-financial measures The evaluation will focus on a range of key metrics, with a detailed retrospective narrative on progress against each during the year. Performance against the measures will be assessed by the Committee to determine the percentage of the award that may vest between 0% and 30%. The measures are organised around four main categories and measures will likely include the following: Climate & sustainability 15% Progress to be measured against four key objectives: Progress towards our Sustainable and Transition Financing target; reduce our financed emissions; reduce our operational emissions; and support our communities Customers & clients 5% Drive world class outcomes for customers and clients: Improve Net Promoter Scores; reduce Barclays UK customer complaints and improve resolution time; maintain client rankings and market share within Barclays Investment Bank; and increase digital engagement Colleagues 5% Protect and strengthen our culture through our Purpose, Values and Mindset: Continue to improve diversity in leadership roles; improve inclusion indicators; maintain engagement at healthy levels; and maintain culture indicators Risk & operational excellence 5% Support a consistently excellent operating standard, risk management and controls: Performance measured against two categories – Operational excellence and Risk & conduct – using a combination of quantitative and qualitative metrics Performance measure Weighting Threshold Maximum vesting Notes 1 Material items are defined as those large atypical one-offs that are called out in the financial reporting. The exclusion is not automatic, and the Committee will determine whether each item should be treated as material for these purposes at the time that outcomes are determined. 2 Currently 13-14%. 3 Performance assessed over the period from 1 January 2024 to 31 December 2026. Start and end total shareholder return will be the Q4 average for 2023 and 2026 respectively and will be measured in GBP for each company. 4 The peer group is comprised of banks in the UK, Europe and North America of comparable size to Barclays and whose weekly returns have a high degree of correlation with Barclays. The peer group for the 2024-2026 LTIP award is Banco Santander, Bank of America, BBVA, BNP Paribas, Citigroup, Credit Agricole, Deutsche Bank, HSBC, ING Group, Lloyds Banking Group, Morgan Stanley, NatWest Group, Societe Generale, Standard Chartered, UBS, and Unicredit. Strategy Climate and sustainability report Risk review Financial review Financial statements Barclays PLC 2023 Annual Report on Form 20-F 148Governance Remuneration report (continued)
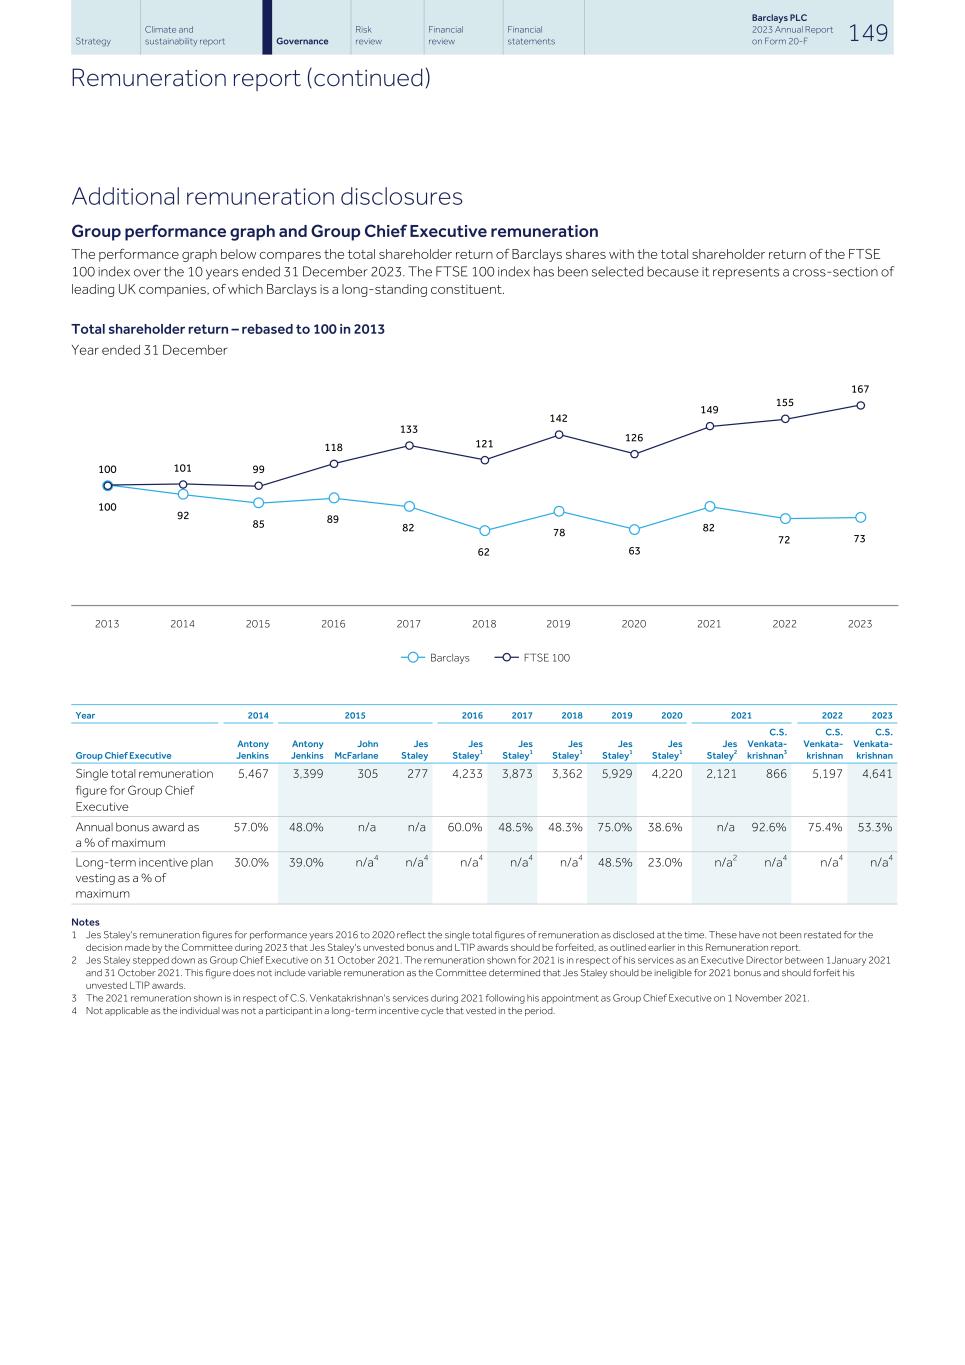
Additional remuneration disclosures Group performance graph and Group Chief Executive remuneration The performance graph below compares the total shareholder return of Barclays shares with the total shareholder return of the FTSE 100 index over the 10 years ended 31 December 2023. The FTSE 100 index has been selected because it represents a cross-section of leading UK companies, of which Barclays is a long-standing constituent. Total shareholder return – rebased to 100 in 2013 Year ended 31 December 100 92 85 89 82 62 78 63 82 72 73 100 101 99 118 133 121 142 126 149 155 167 Barclays FTSE 100 2013 2014 2015 2016 2017 2018 2019 2020 2021 2022 2023 Year 2014 2015 2016 2017 2018 2019 2020 2021 2022 2023 Group Chief Executive Antony Jenkins Antony Jenkins John McFarlane Jes Staley Jes Staley1 Jes Staley1 Jes Staley1 Jes Staley1 Jes Staley1 Jes Staley2 C.S. Venkata- krishnan3 C.S. Venkata- krishnan C.S. Venkata- krishnan Single total remuneration figure for Group Chief Executive 5,467 3,399 305 277 4,233 3,873 3,362 5,929 4,220 2,121 866 5,197 4,641 Annual bonus award as a % of maximum 57.0% 48.0% n/a n/a 60.0% 48.5% 48.3% 75.0% 38.6% n/a 92.6% 75.4% 53.3% Long-term incentive plan vesting as a % of maximum 30.0% 39.0% n/a4 n/a4 n/a4 n/a4 n/a4 48.5% 23.0% n/a2 n/a4 n/a4 n/a4 Notes 1 Jes Staley's remuneration figures for performance years 2016 to 2020 reflect the single total figures of remuneration as disclosed at the time. These have not been restated for the decision made by the Committee during 2023 that Jes Staley's unvested bonus and LTIP awards should be forfeited, as outlined earlier in this Remuneration report. 2 Jes Staley stepped down as Group Chief Executive on 31 October 2021. The remuneration shown for 2021 is in respect of his services as an Executive Director between 1January 2021 and 31 October 2021. This figure does not include variable remuneration as the Committee determined that Jes Staley should be ineligible for 2021 bonus and should forfeit his unvested LTIP awards. 3 The 2021 remuneration shown is in respect of C.S. Venkatakrishnan's services during 2021 following his appointment as Group Chief Executive on 1 November 2021. 4 Not applicable as the individual was not a participant in a long-term incentive cycle that vested in the period. Strategy Climate and sustainability report Risk review Financial review Financial statements Barclays PLC 2023 Annual Report on Form 20-F 149Governance Remuneration report (continued)
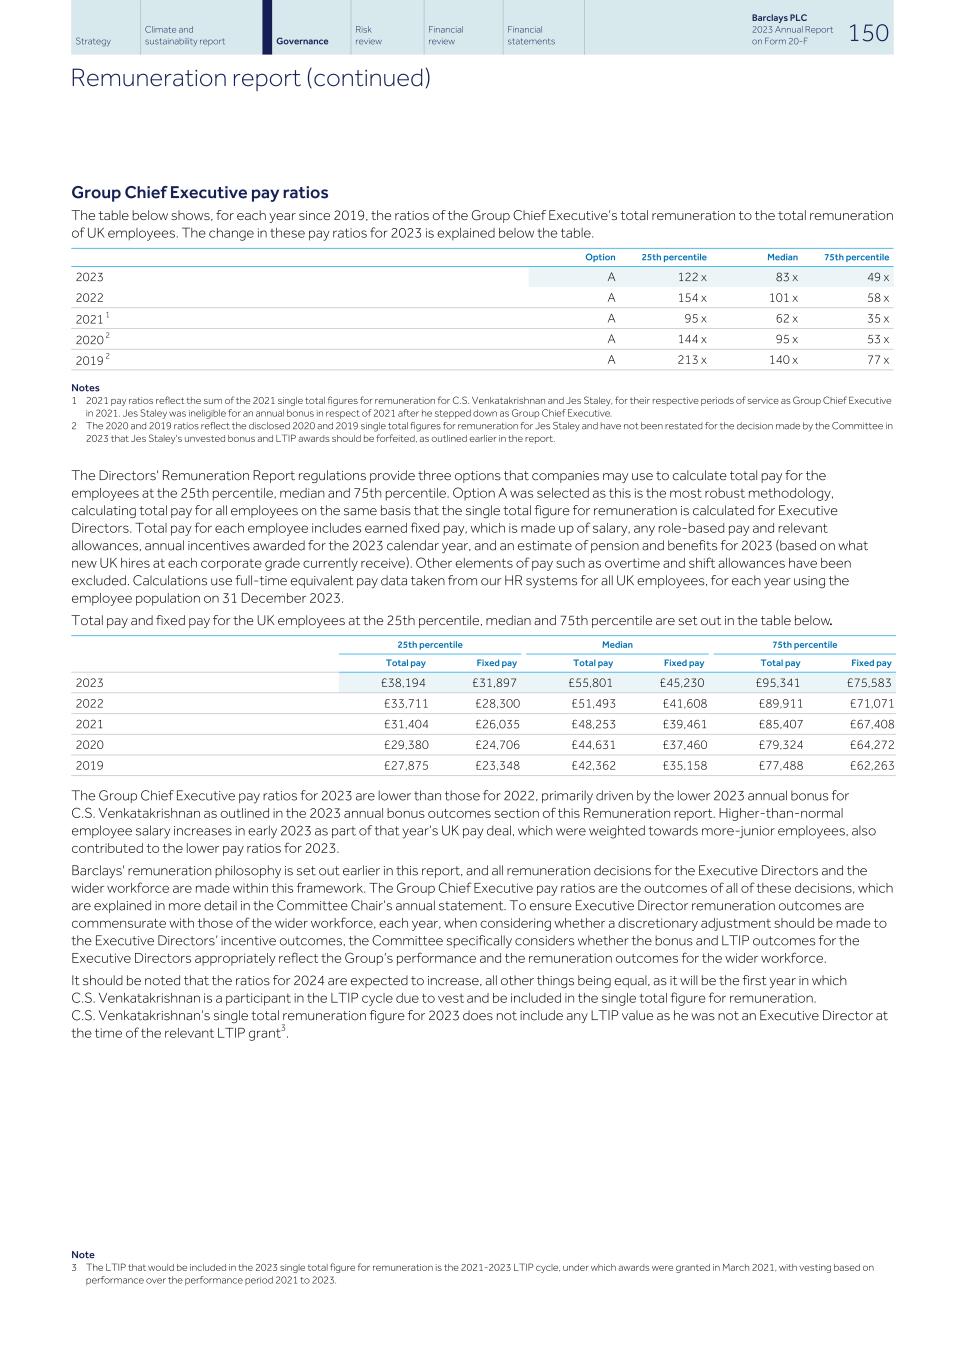
Group Chief Executive pay ratios The table below shows, for each year since 2019, the ratios of the Group Chief Executive’s total remuneration to the total remuneration of UK employees. The change in these pay ratios for 2023 is explained below the table. Option 25th percentile Median 75th percentile 2023 A 122 x 83 x 49 x 2022 A 154 x 101 x 58 x 2021 1 A 95 x 62 x 35 x 2020 2 A 144 x 95 x 53 x 2019 2 A 213 x 140 x 77 x Notes 1 2021 pay ratios reflect the sum of the 2021 single total figures for remuneration for C.S. Venkatakrishnan and Jes Staley, for their respective periods of service as Group Chief Executive in 2021. Jes Staley was ineligible for an annual bonus in respect of 2021 after he stepped down as Group Chief Executive. 2 The 2020 and 2019 ratios reflect the disclosed 2020 and 2019 single total figures for remuneration for Jes Staley and have not been restated for the decision made by the Committee in 2023 that Jes Staley's unvested bonus and LTIP awards should be forfeited, as outlined earlier in the report. The Directors' Remuneration Report regulations provide three options that companies may use to calculate total pay for the employees at the 25th percentile, median and 75th percentile. Option A was selected as this is the most robust methodology, calculating total pay for all employees on the same basis that the single total figure for remuneration is calculated for Executive Directors. Total pay for each employee includes earned fixed pay, which is made up of salary, any role-based pay and relevant allowances, annual incentives awarded for the 2023 calendar year, and an estimate of pension and benefits for 2023 (based on what new UK hires at each corporate grade currently receive). Other elements of pay such as overtime and shift allowances have been excluded. Calculations use full-time equivalent pay data taken from our HR systems for all UK employees, for each year using the employee population on 31 December 2023. Total pay and fixed pay for the UK employees at the 25th percentile, median and 75th percentile are set out in the table below. 25th percentile Median 75th percentile Total pay Fixed pay Total pay Fixed pay Total pay Fixed pay 2023 £38,194 £31,897 £55,801 £45,230 £95,341 £75,583 2022 £33,711 £28,300 £51,493 £41,608 £89,911 £71,071 2021 £31,404 £26,035 £48,253 £39,461 £85,407 £67,408 2020 £29,380 £24,706 £44,631 £37,460 £79,324 £64,272 2019 £27,875 £23,348 £42,362 £35,158 £77,488 £62,263 The Group Chief Executive pay ratios for 2023 are lower than those for 2022, primarily driven by the lower 2023 annual bonus for C.S. Venkatakrishnan as outlined in the 2023 annual bonus outcomes section of this Remuneration report. Higher-than-normal employee salary increases in early 2023 as part of that year’s UK pay deal, which were weighted towards more-junior employees, also contributed to the lower pay ratios for 2023. Barclays' remuneration philosophy is set out earlier in this report, and all remuneration decisions for the Executive Directors and the wider workforce are made within this framework. The Group Chief Executive pay ratios are the outcomes of all of these decisions, which are explained in more detail in the Committee Chair’s annual statement. To ensure Executive Director remuneration outcomes are commensurate with those of the wider workforce, each year, when considering whether a discretionary adjustment should be made to the Executive Directors’ incentive outcomes, the Committee specifically considers whether the bonus and LTIP outcomes for the Executive Directors appropriately reflect the Group’s performance and the remuneration outcomes for the wider workforce. It should be noted that the ratios for 2024 are expected to increase, all other things being equal, as it will be the first year in which C.S. Venkatakrishnan is a participant in the LTIP cycle due to vest and be included in the single total figure for remuneration. C.S. Venkatakrishnan’s single total remuneration figure for 2023 does not include any LTIP value as he was not an Executive Director at the time of the relevant LTIP grant3. Note 3 The LTIP that would be included in the 2023 single total figure for remuneration is the 2021-2023 LTIP cycle, under which awards were granted in March 2021, with vesting based on performance over the performance period 2021 to 2023. Strategy Climate and sustainability report Risk review Financial review Financial statements Barclays PLC 2023 Annual Report on Form 20-F 150Governance Remuneration report (continued)
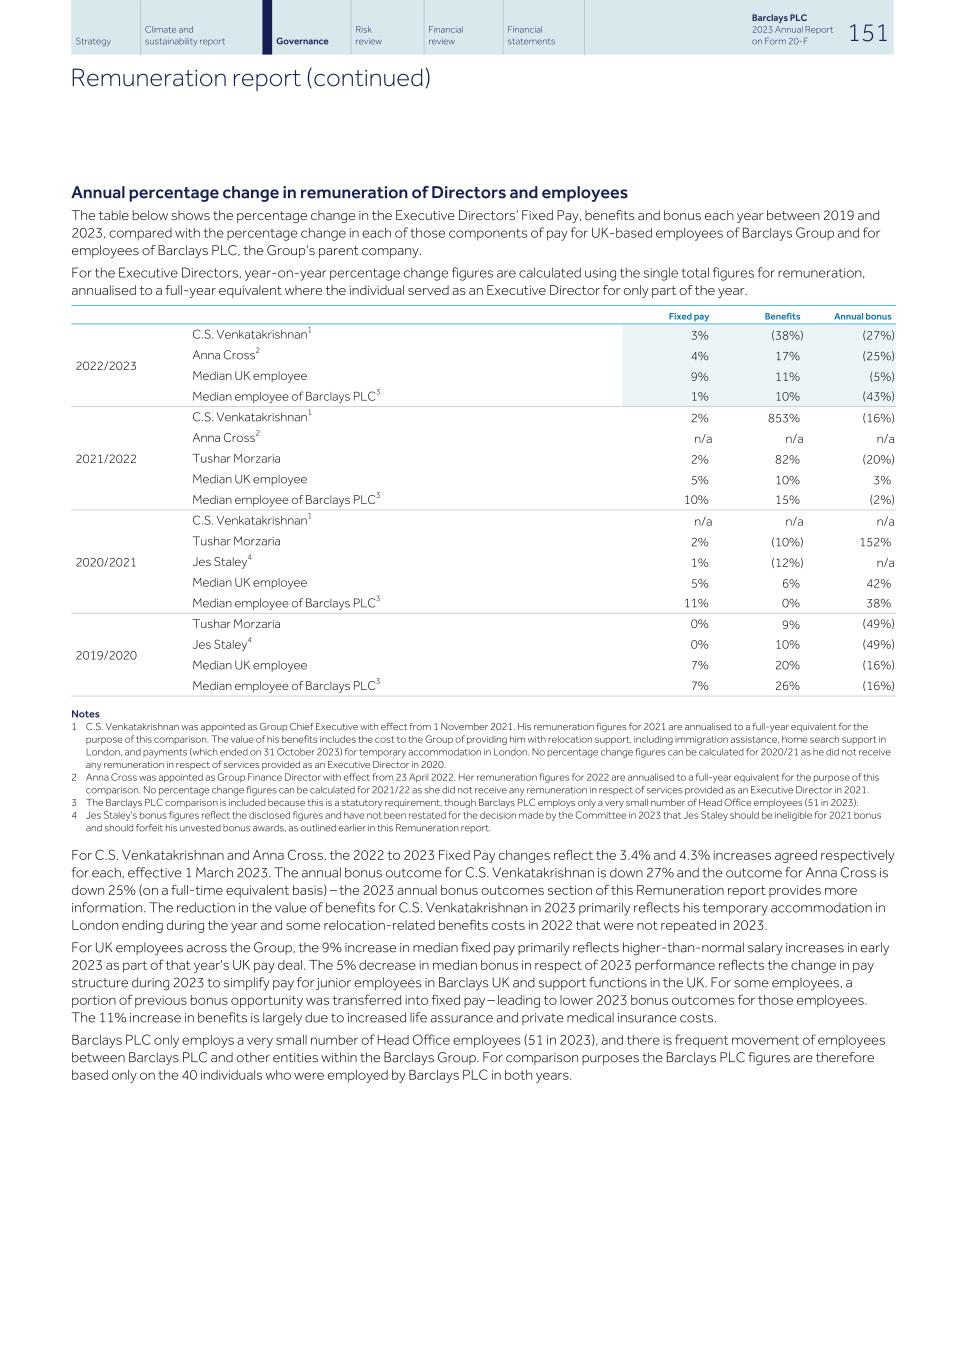
Annual percentage change in remuneration of Directors and employees The table below shows the percentage change in the Executive Directors’ Fixed Pay, benefits and bonus each year between 2019 and 2023, compared with the percentage change in each of those components of pay for UK-based employees of Barclays Group and for employees of Barclays PLC, the Group’s parent company. For the Executive Directors, year-on-year percentage change figures are calculated using the single total figures for remuneration, annualised to a full-year equivalent where the individual served as an Executive Director for only part of the year. Fixed pay Benefits Annual bonus 2022/2023 C.S. Venkatakrishnan1 3% (38%) (27%) Anna Cross2 4% 17% (25%) Median UK employee 9% 11% (5%) Median employee of Barclays PLC3 1% 10% (43%) 2021/2022 C.S. Venkatakrishnan1 2% 853% (16%) Anna Cross2 n/a n/a n/a Tushar Morzaria 2% 82% (20%) Median UK employee 5% 10% 3% Median employee of Barclays PLC3 10% 15% (2%) 2020/2021 C.S. Venkatakrishnan1 n/a n/a n/a Tushar Morzaria 2% (10%) 152% Jes Staley4 1% (12%) n/a Median UK employee 5% 6% 42% Median employee of Barclays PLC3 11% 0% 38% 2019/2020 Tushar Morzaria 0% 9% (49%) Jes Staley4 0% 10% (49%) Median UK employee 7% 20% (16%) Median employee of Barclays PLC3 7% 26% (16%) Notes 1 C.S. Venkatakrishnan was appointed as Group Chief Executive with effect from 1 November 2021. His remuneration figures for 2021 are annualised to a full-year equivalent for the purpose of this comparison. The value of his benefits includes the cost to the Group of providing him with relocation support, including immigration assistance, home search support in London, and payments (which ended on 31 October 2023) for temporary accommodation in London. No percentage change figures can be calculated for 2020/21 as he did not receive any remuneration in respect of services provided as an Executive Director in 2020. 2 Anna Cross was appointed as Group Finance Director with effect from 23 April 2022. Her remuneration figures for 2022 are annualised to a full-year equivalent for the purpose of this comparison. No percentage change figures can be calculated for 2021/22 as she did not receive any remuneration in respect of services provided as an Executive Director in 2021. 3 The Barclays PLC comparison is included because this is a statutory requirement, though Barclays PLC employs only a very small number of Head Office employees (51 in 2023). 4 Jes Staley's bonus figures reflect the disclosed figures and have not been restated for the decision made by the Committee in 2023 that Jes Staley should be ineligible for 2021 bonus and should forfeit his unvested bonus awards, as outlined earlier in this Remuneration report. For C.S. Venkatakrishnan and Anna Cross, the 2022 to 2023 Fixed Pay changes reflect the 3.4% and 4.3% increases agreed respectively for each, effective 1 March 2023. The annual bonus outcome for C.S. Venkatakrishnan is down 27% and the outcome for Anna Cross is down 25% (on a full-time equivalent basis) – the 2023 annual bonus outcomes section of this Remuneration report provides more information. The reduction in the value of benefits for C.S. Venkatakrishnan in 2023 primarily reflects his temporary accommodation in London ending during the year and some relocation-related benefits costs in 2022 that were not repeated in 2023. For UK employees across the Group, the 9% increase in median fixed pay primarily reflects higher-than-normal salary increases in early 2023 as part of that year's UK pay deal. The 5% decrease in median bonus in respect of 2023 performance reflects the change in pay structure during 2023 to simplify pay for junior employees in Barclays UK and support functions in the UK. For some employees, a portion of previous bonus opportunity was transferred into fixed pay – leading to lower 2023 bonus outcomes for those employees. The 11% increase in benefits is largely due to increased life assurance and private medical insurance costs. Barclays PLC only employs a very small number of Head Office employees (51 in 2023), and there is frequent movement of employees between Barclays PLC and other entities within the Barclays Group. For comparison purposes the Barclays PLC figures are therefore based only on the 40 individuals who were employed by Barclays PLC in both years. Strategy Climate and sustainability report Risk review Financial review Financial statements Barclays PLC 2023 Annual Report on Form 20-F 151Governance Remuneration report (continued)
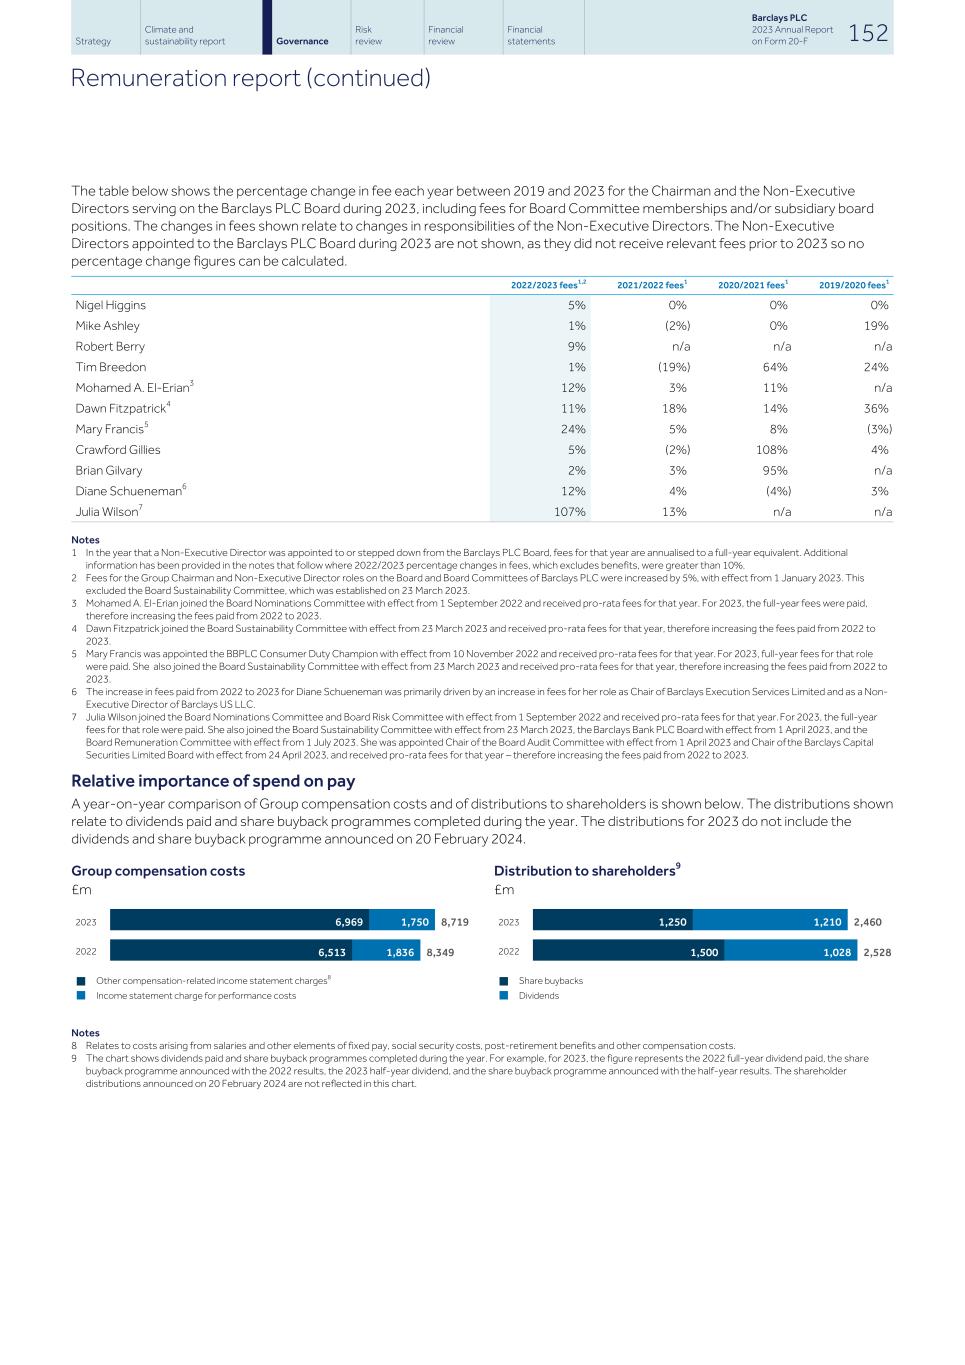
The table below shows the percentage change in fee each year between 2019 and 2023 for the Chairman and the Non-Executive Directors serving on the Barclays PLC Board during 2023, including fees for Board Committee memberships and/or subsidiary board positions. The changes in fees shown relate to changes in responsibilities of the Non-Executive Directors. The Non-Executive Directors appointed to the Barclays PLC Board during 2023 are not shown, as they did not receive relevant fees prior to 2023 so no percentage change figures can be calculated. 2022/2023 fees1,2 2021/2022 fees1 2020/2021 fees1 2019/2020 fees1 Nigel Higgins 5% 0% 0% 0% Mike Ashley 1% (2%) 0% 19% Robert Berry 9% n/a n/a n/a Tim Breedon 1% (19%) 64% 24% Mohamed A. El-Erian3 12% 3% 11% n/a Dawn Fitzpatrick4 11% 18% 14% 36% Mary Francis5 24% 5% 8% (3%) Crawford Gillies 5% (2%) 108% 4% Brian Gilvary 2% 3% 95% n/a Diane Schueneman6 12% 4% (4%) 3% Julia Wilson7 107% 13% n/a n/a Notes 1 In the year that a Non-Executive Director was appointed to or stepped down from the Barclays PLC Board, fees for that year are annualised to a full-year equivalent. Additional information has been provided in the notes that follow where 2022/2023 percentage changes in fees, which excludes benefits, were greater than 10%. 2 Fees for the Group Chairman and Non-Executive Director roles on the Board and Board Committees of Barclays PLC were increased by 5%, with effect from 1 January 2023. This excluded the Board Sustainability Committee, which was established on 23 March 2023. 3 Mohamed A. El-Erian joined the Board Nominations Committee with effect from 1 September 2022 and received pro-rata fees for that year. For 2023, the full-year fees were paid, therefore increasing the fees paid from 2022 to 2023. 4 Dawn Fitzpatrick joined the Board Sustainability Committee with effect from 23 March 2023 and received pro-rata fees for that year, therefore increasing the fees paid from 2022 to 2023. 5 Mary Francis was appointed the BBPLC Consumer Duty Champion with effect from 10 November 2022 and received pro-rata fees for that year. For 2023, full-year fees for that role were paid. She also joined the Board Sustainability Committee with effect from 23 March 2023 and received pro-rata fees for that year, therefore increasing the fees paid from 2022 to 2023. 6 The increase in fees paid from 2022 to 2023 for Diane Schueneman was primarily driven by an increase in fees for her role as Chair of Barclays Execution Services Limited and as a Non- Executive Director of Barclays US LLC. 7 Julia Wilson joined the Board Nominations Committee and Board Risk Committee with effect from 1 September 2022 and received pro-rata fees for that year. For 2023, the full-year fees for that role were paid. She also joined the Board Sustainability Committee with effect from 23 March 2023, the Barclays Bank PLC Board with effect from 1 April 2023, and the Board Remuneration Committee with effect from 1 July 2023. She was appointed Chair of the Board Audit Committee with effect from 1 April 2023 and Chair of the Barclays Capital Securities Limited Board with effect from 24 April 2023, and received pro-rata fees for that year – therefore increasing the fees paid from 2022 to 2023. Relative importance of spend on pay A year-on-year comparison of Group compensation costs and of distributions to shareholders is shown below. The distributions shown relate to dividends paid and share buyback programmes completed during the year. The distributions for 2023 do not include the dividends and share buyback programme announced on 20 February 2024. Group compensation costs £m 2023 2022 8,719 8,349 6,969 6,513 1,750 1,836 n Other compensation-related income statement charges8 n Income statement charge for performance costs Distribution to shareholders9 £m 2023 2022 2,460 2,528 1,250 1,500 1,210 1,028 n Share buybacks n Dividends Notes 8 Relates to costs arising from salaries and other elements of fixed pay, social security costs, post-retirement benefits and other compensation costs. 9 The chart shows dividends paid and share buyback programmes completed during the year. For example, for 2023, the figure represents the 2022 full-year dividend paid, the share buyback programme announced with the 2022 results, the 2023 half-year dividend, and the share buyback programme announced with the half-year results. The shareholder distributions announced on 20 February 2024 are not reflected in this chart. Strategy Climate and sustainability report Risk review Financial review Financial statements Barclays PLC 2023 Annual Report on Form 20-F 152Governance Remuneration report (continued)
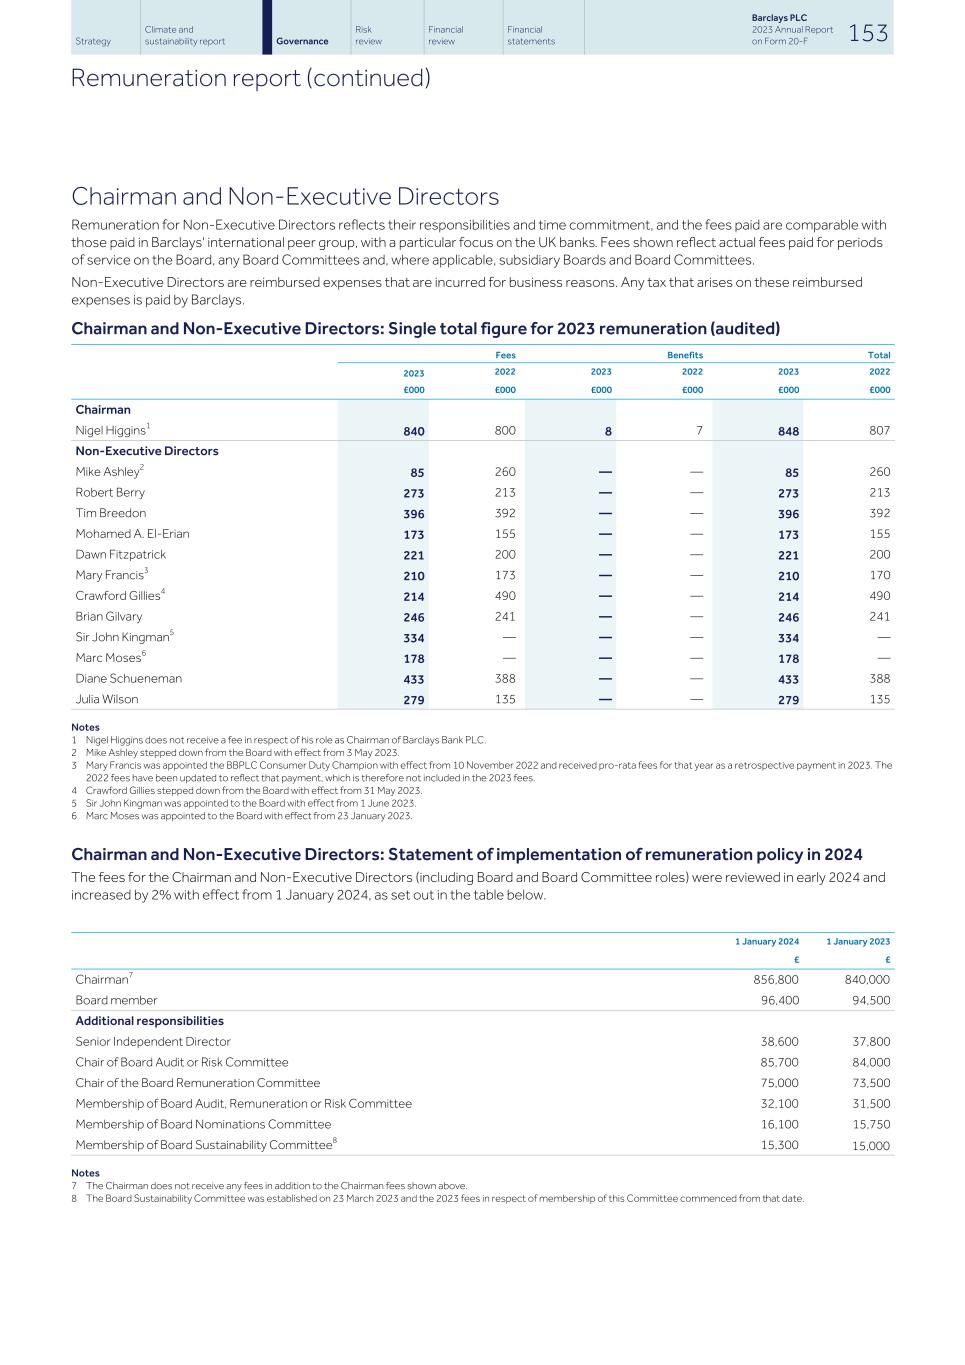
Chairman and Non-Executive Directors Remuneration for Non-Executive Directors reflects their responsibilities and time commitment, and the fees paid are comparable with those paid in Barclays' international peer group, with a particular focus on the UK banks. Fees shown reflect actual fees paid for periods of service on the Board, any Board Committees and, where applicable, subsidiary Boards and Board Committees. Non-Executive Directors are reimbursed expenses that are incurred for business reasons. Any tax that arises on these reimbursed expenses is paid by Barclays. Chairman and Non-Executive Directors: Single total figure for 2023 remuneration (audited) Fees Benefits Total 2023 2022 2023 2022 2023 2022 £000 £000 £000 £000 £000 £000 Chairman Nigel Higgins1 840 800 8 7 848 807 Non-Executive Directors Mike Ashley2 85 260 — — 85 260 Robert Berry 273 213 — — 273 213 Tim Breedon 396 392 — — 396 392 Mohamed A. El-Erian 173 155 — — 173 155 Dawn Fitzpatrick 221 200 — — 221 200 Mary Francis3 210 173 — — 210 170 Crawford Gillies4 214 490 — — 214 490 Brian Gilvary 246 241 — — 246 241 Sir John Kingman5 334 — — — 334 — Marc Moses6 178 — — — 178 — Diane Schueneman 433 388 — — 433 388 Julia Wilson 279 135 — — 279 135 Notes 1 Nigel Higgins does not receive a fee in respect of his role as Chairman of Barclays Bank PLC. 2 Mike Ashley stepped down from the Board with effect from 3 May 2023. 3 Mary Francis was appointed the BBPLC Consumer Duty Champion with effect from 10 November 2022 and received pro-rata fees for that year as a retrospective payment in 2023. The 2022 fees have been updated to reflect that payment, which is therefore not included in the 2023 fees. 4 Crawford Gillies stepped down from the Board with effect from 31 May 2023. 5 Sir John Kingman was appointed to the Board with effect from 1 June 2023. 6 Marc Moses was appointed to the Board with effect from 23 January 2023. Chairman and Non-Executive Directors: Statement of implementation of remuneration policy in 2024 The fees for the Chairman and Non-Executive Directors (including Board and Board Committee roles) were reviewed in early 2024 and increased by 2% with effect from 1 January 2024, as set out in the table below. 1 January 2024 1 January 2023 £ £ Chairman7 856,800 840,000 Board member 96,400 94,500 Additional responsibilities Senior Independent Director 38,600 37,800 Chair of Board Audit or Risk Committee 85,700 84,000 Chair of the Board Remuneration Committee 75,000 73,500 Membership of Board Audit, Remuneration or Risk Committee 32,100 31,500 Membership of Board Nominations Committee 16,100 15,750 Membership of Board Sustainability Committee8 15,300 15,000 Notes 7 The Chairman does not receive any fees in addition to the Chairman fees shown above. 8 The Board Sustainability Committee was established on 23 March 2023 and the 2023 fees in respect of membership of this Committee commenced from that date. Strategy Climate and sustainability report Risk review Financial review Financial statements Barclays PLC 2023 Annual Report on Form 20-F 153Governance Remuneration report (continued)
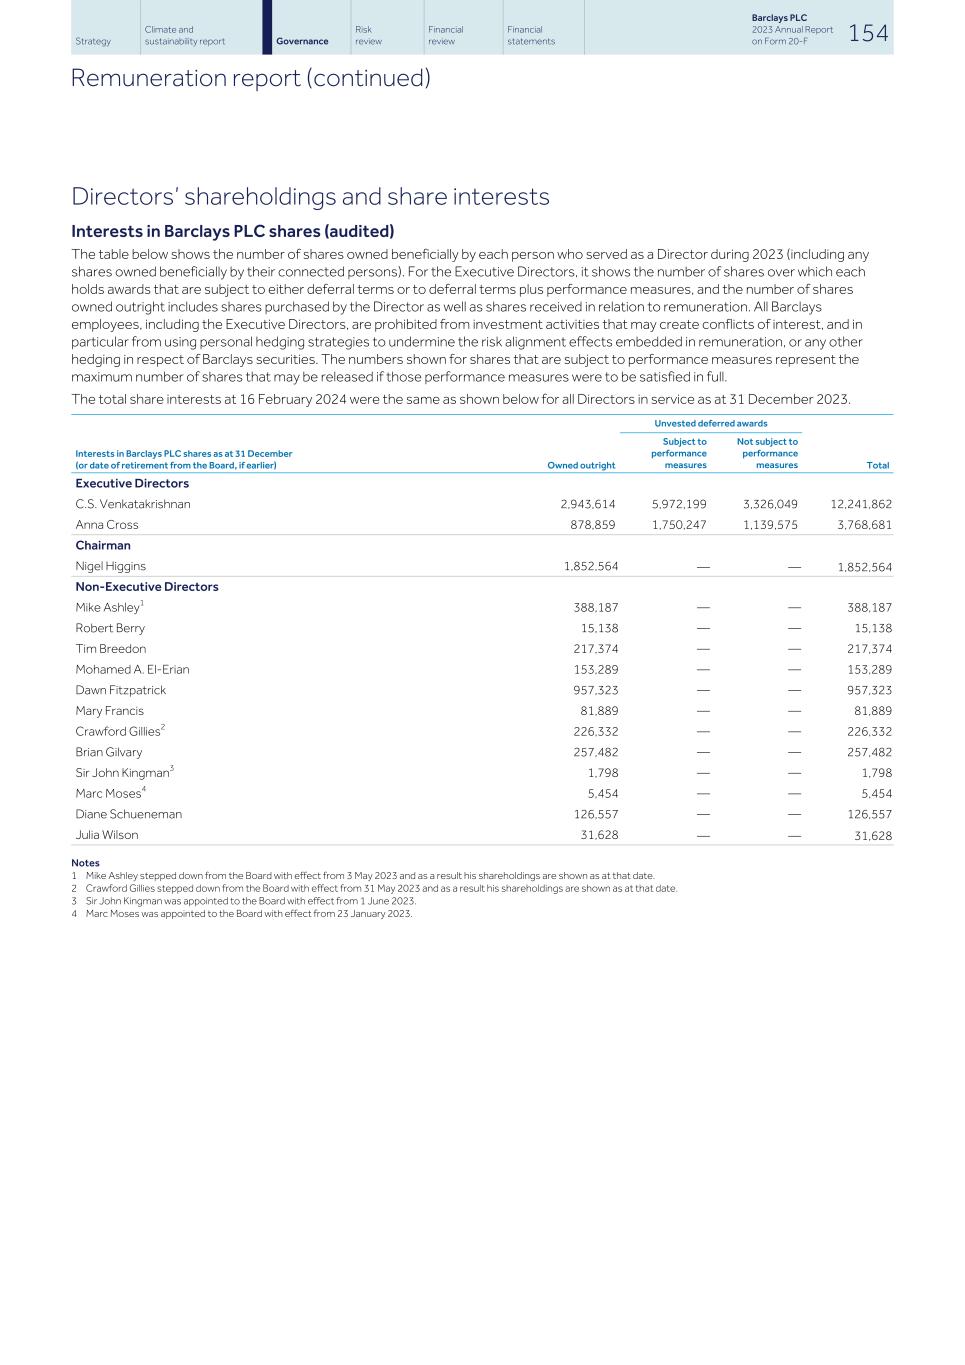
Directors’ shareholdings and share interests Interests in Barclays PLC shares (audited) The table below shows the number of shares owned beneficially by each person who served as a Director during 2023 (including any shares owned beneficially by their connected persons). For the Executive Directors, it shows the number of shares over which each holds awards that are subject to either deferral terms or to deferral terms plus performance measures, and the number of shares owned outright includes shares purchased by the Director as well as shares received in relation to remuneration. All Barclays employees, including the Executive Directors, are prohibited from investment activities that may create conflicts of interest, and in particular from using personal hedging strategies to undermine the risk alignment effects embedded in remuneration, or any other hedging in respect of Barclays securities. The numbers shown for shares that are subject to performance measures represent the maximum number of shares that may be released if those performance measures were to be satisfied in full. The total share interests at 16 February 2024 were the same as shown below for all Directors in service as at 31 December 2023. Interests in Barclays PLC shares as at 31 December (or date of retirement from the Board, if earlier) Owned outright Unvested deferred awards Total Subject to performance measures Not subject to performance measures Executive Directors C.S. Venkatakrishnan 2,943,614 5,972,199 3,326,049 12,241,862 Anna Cross 878,859 1,750,247 1,139,575 3,768,681 Chairman Nigel Higgins 1,852,564 — — 1,852,564 Non-Executive Directors Mike Ashley1 388,187 — — 388,187 Robert Berry 15,138 — — 15,138 Tim Breedon 217,374 — — 217,374 Mohamed A. El-Erian 153,289 — — 153,289 Dawn Fitzpatrick 957,323 — — 957,323 Mary Francis 81,889 — — 81,889 Crawford Gillies2 226,332 — — 226,332 Brian Gilvary 257,482 — — 257,482 Sir John Kingman3 1,798 — — 1,798 Marc Moses4 5,454 — — 5,454 Diane Schueneman 126,557 — — 126,557 Julia Wilson 31,628 — — 31,628 Notes 1 Mike Ashley stepped down from the Board with effect from 3 May 2023 and as a result his shareholdings are shown as at that date. 2 Crawford Gillies stepped down from the Board with effect from 31 May 2023 and as a result his shareholdings are shown as at that date. 3 Sir John Kingman was appointed to the Board with effect from 1 June 2023. 4 Marc Moses was appointed to the Board with effect from 23 January 2023. Strategy Climate and sustainability report Risk review Financial review Financial statements Barclays PLC 2023 Annual Report on Form 20-F 154Governance Remuneration report (continued)
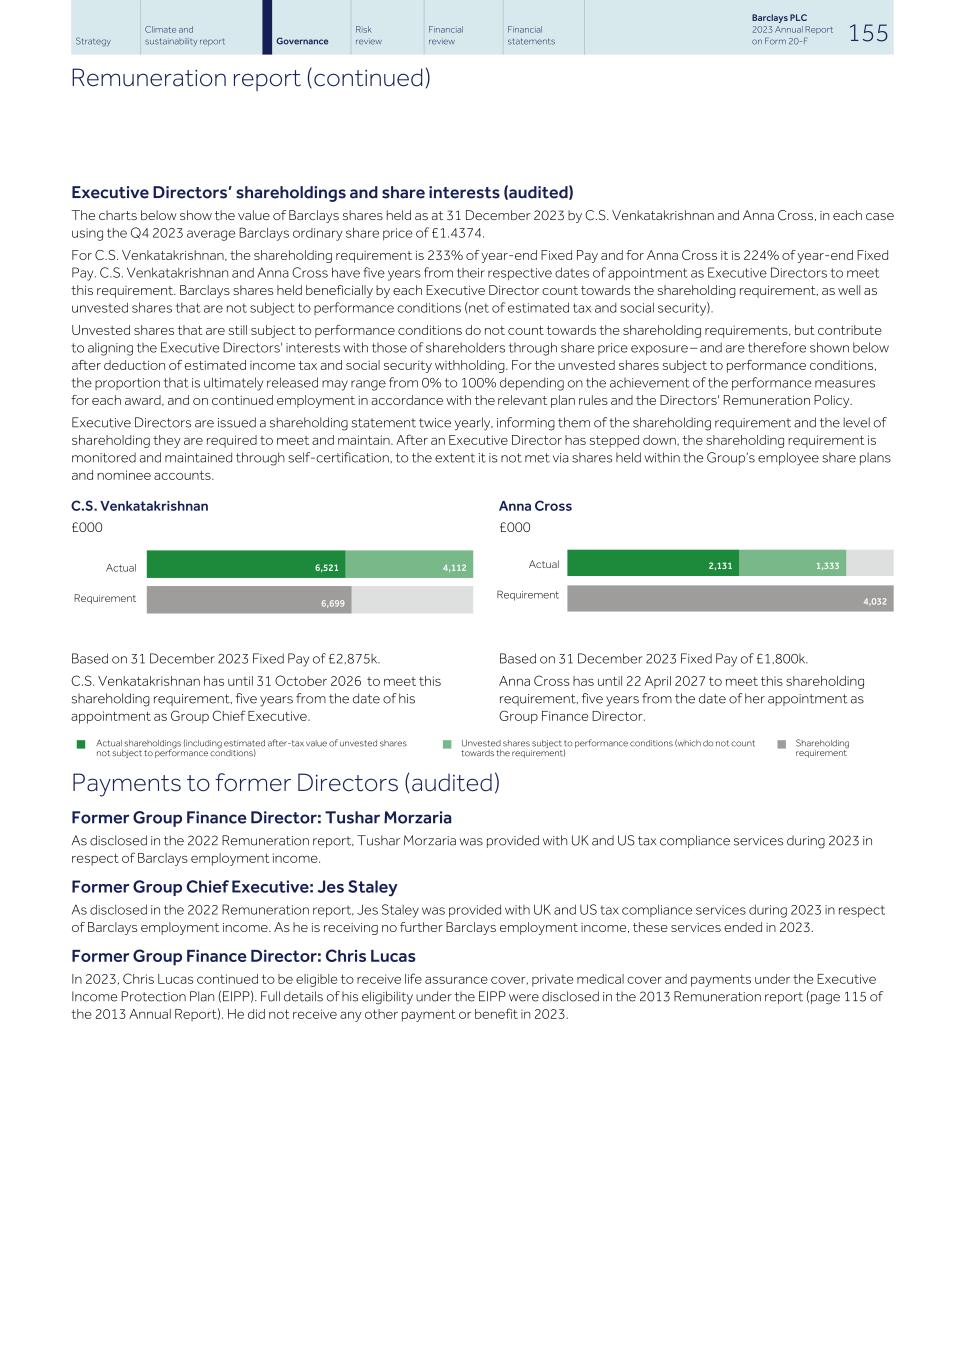
Executive Directors’ shareholdings and share interests (audited) The charts below show the value of Barclays shares held as at 31 December 2023 by C.S. Venkatakrishnan and Anna Cross, in each case using the Q4 2023 average Barclays ordinary share price of £1.4374. For C.S. Venkatakrishnan, the shareholding requirement is 233% of year-end Fixed Pay and for Anna Cross it is 224% of year-end Fixed Pay. C.S. Venkatakrishnan and Anna Cross have five years from their respective dates of appointment as Executive Directors to meet this requirement. Barclays shares held beneficially by each Executive Director count towards the shareholding requirement, as well as unvested shares that are not subject to performance conditions (net of estimated tax and social security). Unvested shares that are still subject to performance conditions do not count towards the shareholding requirements, but contribute to aligning the Executive Directors' interests with those of shareholders through share price exposure – and are therefore shown below after deduction of estimated income tax and social security withholding. For the unvested shares subject to performance conditions, the proportion that is ultimately released may range from 0% to 100% depending on the achievement of the performance measures for each award, and on continued employment in accordance with the relevant plan rules and the Directors' Remuneration Policy. Executive Directors are issued a shareholding statement twice yearly, informing them of the shareholding requirement and the level of shareholding they are required to meet and maintain. After an Executive Director has stepped down, the shareholding requirement is monitored and maintained through self-certification, to the extent it is not met via shares held within the Group’s employee share plans and nominee accounts. C.S. Venkatakrishnan Anna Cross £000 £000 6,521 4,112 6,699 2,131 1,333 4,032 Based on 31 December 2023 Fixed Pay of £2,875k. C.S. Venkatakrishnan has until 31 October 2026 to meet this shareholding requirement, five years from the date of his appointment as Group Chief Executive. Based on 31 December 2023 Fixed Pay of £1,800k. Anna Cross has until 22 April 2027 to meet this shareholding requirement, five years from the date of her appointment as Group Finance Director. n Actual shareholdings (including estimated after-tax value of unvested shares not subject to performance conditions) n Unvested shares subject to performance conditions (which do not count towards the requirement) n Shareholding requirement Payments to former Directors (audited) Former Group Finance Director: Tushar Morzaria As disclosed in the 2022 Remuneration report, Tushar Morzaria was provided with UK and US tax compliance services during 2023 in respect of Barclays employment income. Former Group Chief Executive: Jes Staley As disclosed in the 2022 Remuneration report, Jes Staley was provided with UK and US tax compliance services during 2023 in respect of Barclays employment income. As he is receiving no further Barclays employment income, these services ended in 2023. Former Group Finance Director: Chris Lucas In 2023, Chris Lucas continued to be eligible to receive life assurance cover, private medical cover and payments under the Executive Income Protection Plan (EIPP). Full details of his eligibility under the EIPP were disclosed in the 2013 Remuneration report (page 115 of the 2013 Annual Report). He did not receive any other payment or benefit in 2023. Strategy Climate and sustainability report Risk review Financial review Financial statements Barclays PLC 2023 Annual Report on Form 20-F 155Governance Remuneration report (continued) Actual Requirement Actual Requirement
Previous AGM voting outcomes The table below shows the shareholder voting result in respect of our 2022 Remuneration report and Directors’ Remuneration Policy (approved by shareholders at the AGM held on 3 May 2023). For (% of votes cast and total number) Against (% of votes cast and total number) Withheld (total number) Vote on the 2022 Remuneration report at the 2023 AGM 87.76 % 12.24 % 8,531,247,575 1,189,880,467 19,393,115 Vote on the Directors’ Remuneration Policy at the 2023 AGM 96.69 % 3.31 % 9,402,353,401 322,148,965 16,010,604 Barclays Board Remuneration Committee Committee responsibilities The Board Remuneration Committee is responsible for overseeing Barclays’ remuneration. The role of the Committee, as set out in the Terms of Reference, is to: • Set the overarching principles and parameters of remuneration policy across the Group • Consider and approve the remuneration arrangements of (i) the Group Chair, (ii) the Executive Directors, (iii) members of the Barclays Group Executive Committee and any other senior executives specified by the Committee from time to time, and (iv) all other Group employees whose total annual compensation is equal to or exceeds an amount determined by the Committee from time to time • Exercise oversight of remuneration issues (including retirement benefits). Advisers to the Committee The Committee appointed PricewaterhouseCoopers (PwC) as its independent adviser in October 2017. The Committee considered the advice provided by PwC to the Committee during the year and was satisfied that the advice is independent and objective. PwC is a signatory to the voluntary code of conduct in relation to executive remuneration consulting in the UK. PwC was paid £142,000 (excluding VAT) in fees for its advice to the Committee in 2023 relating to the remuneration of the Directors (either exclusively or along with other employees within the Committee’s Terms of Reference). In addition to advising the Committee, PwC provided unrelated consulting advice to the Group in respect of strategic advice on business, regulation, risk and controls, operational models and cost, taxation, technology, pensions, HR and sustainability issues. Throughout 2023, Willis Towers Watson (WTW) provided the Committee with market data on compensation, as context when considering incentive levels and remuneration packages. WTW was paid £78,500 (excluding VAT) in fees for these services. In addition to the services provided to the Committee, WTW also provides market data on compensation for other roles below Board level, pensions and benefits advice and brokerage services to the Barclays Group, and administration services to a number of the Group's pension funds. In the course of its deliberations, the Committee also considered the views of the Group Chairman, the Group Chief Executive, the Group Human Resources Director and the Group Reward and Performance Director. The Group Finance Director and the Group Chief Risk Officer provided regular updates on Group and business financial performance and risk profiles respectively. The Head of Corporate Communications attended when requested, to advise on reward communications and disclosures. The Group General, Counsel or other representatives from the Legal function, and the Company Secretary advised on legal and governance-related matters. No Barclays employee or Director participated in decisions of the Committee relating to his or her own remuneration. No other advisers provided services to the Committee in the year. Committee effectiveness in 2023 The results of the Committee effectiveness review for 2023 confirm the Committee is operating effectively. It is considered to be well constituted and chaired, providing an effective and appropriate level of constructive challenge and oversight of the areas within its remit, including in respect of areas of judgement and discretion. The review highlights that the Committee is considered to have the right level of skills and experience, and is of an appropriate size, having benefited from the addition of new members during the year. Feedback indicates that the Committee is considered to operate at the right level of debate, and confirms that the allocation of time between agenda items in Committee meetings is appropriate, with sufficient time for discussion and challenge. The Committee’s interaction with the Board, Board Committees and senior management is considered effective, noting the strong level of support provided to the Committee by senior management, and that sufficient time is allocated at Board meetings for the Chair to report to the Board on the work of the Committee. The Committee’s interaction with the BBPLC and BBUKPLC Board Remuneration Committees was also considered effective, and operates in line with regulatory requirements. + More information on the 2023 Committee effectiveness review process can be found in the Board Nominations Committee report Strategy Climate and sustainability report Risk review Financial review Financial statements Barclays PLC 2023 Annual Report on Form 20-F 156Governance Remuneration report (continued) + The Committee’s terms of reference are available at home.barclays/ who-we-are/our-governance/board-committees
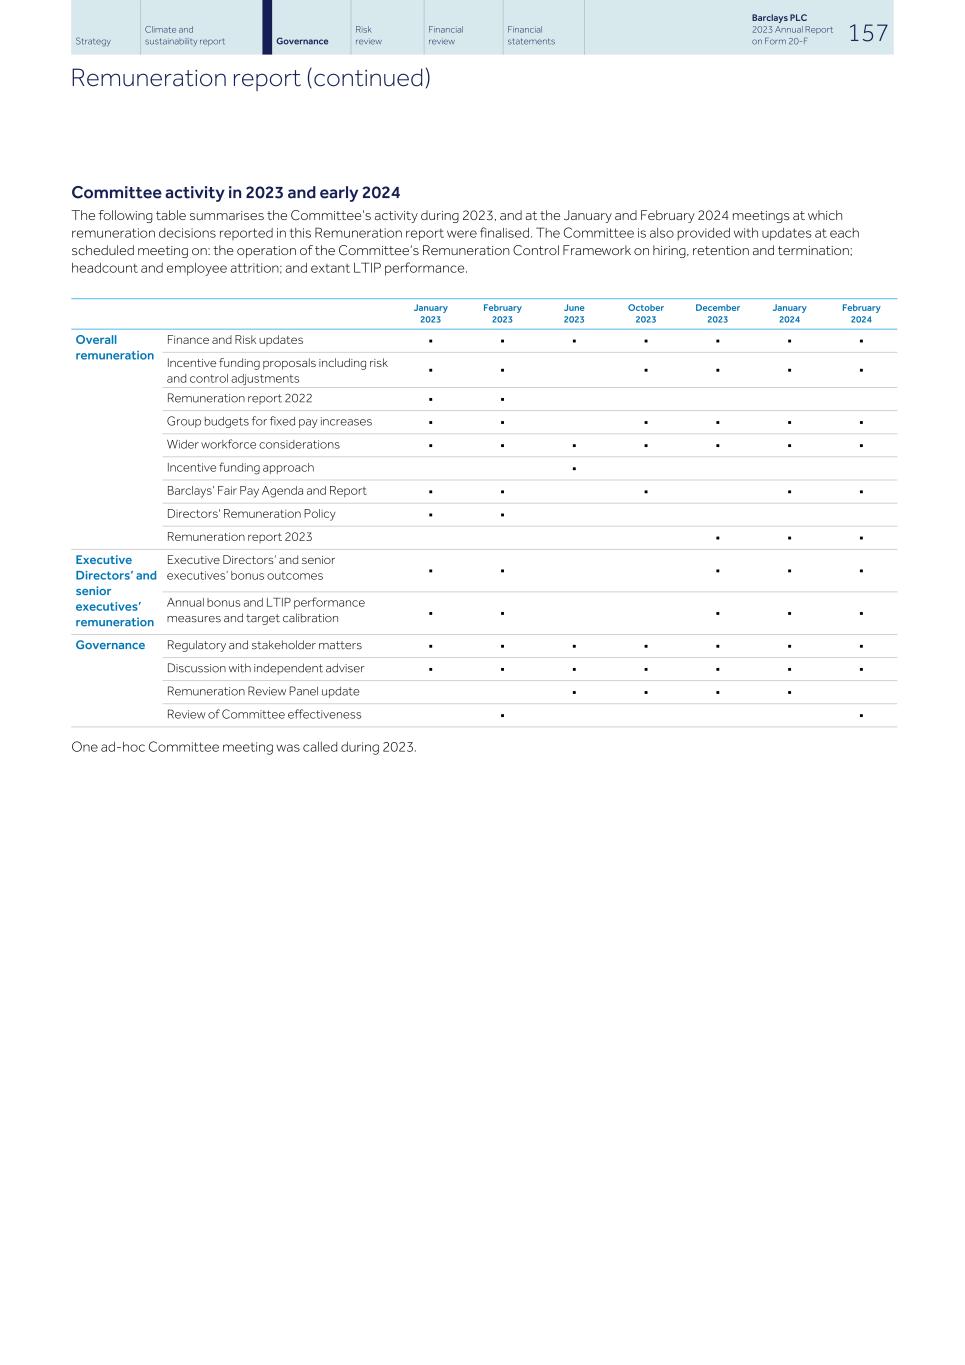
Committee activity in 2023 and early 2024 The following table summarises the Committee’s activity during 2023, and at the January and February 2024 meetings at which remuneration decisions reported in this Remuneration report were finalised. The Committee is also provided with updates at each scheduled meeting on: the operation of the Committee’s Remuneration Control Framework on hiring, retention and termination; headcount and employee attrition; and extant LTIP performance. January 2023 February 2023 June 2023 October 2023 December 2023 January 2024 February 2024 Overall remuneration Finance and Risk updates ▪ ▪ ▪ ▪ ▪ ▪ ▪ Incentive funding proposals including risk and control adjustments ▪ ▪ ▪ ▪ ▪ ▪ Remuneration report 2022 ▪ ▪ Group budgets for fixed pay increases ▪ ▪ ▪ ▪ ▪ ▪ Wider workforce considerations ▪ ▪ ▪ ▪ ▪ ▪ ▪ Incentive funding approach ▪ Barclays’ Fair Pay Agenda and Report ▪ ▪ ▪ ▪ ▪ Directors' Remuneration Policy ▪ ▪ Remuneration report 2023 ▪ ▪ ▪ Executive Directors’ and senior executives’ remuneration Executive Directors’ and senior executives’ bonus outcomes ▪ ▪ ▪ ▪ ▪ Annual bonus and LTIP performance measures and target calibration ▪ ▪ ▪ ▪ ▪ Governance Regulatory and stakeholder matters ▪ ▪ ▪ ▪ ▪ ▪ ▪ Discussion with independent adviser ▪ ▪ ▪ ▪ ▪ ▪ ▪ Remuneration Review Panel update ▪ ▪ ▪ ▪ Review of Committee effectiveness ▪ ▪ One ad-hoc Committee meeting was called during 2023. Strategy Climate and sustainability report Risk review Financial review Financial statements Barclays PLC 2023 Annual Report on Form 20-F 157Governance Remuneration report (continued)
Other Governance This section aims to provide an overview of certain governance matters of particular relevance to ESG ratings agencies and investors across a range of ESG matters. It covers topics such as our Code of Conduct, Whistleblowing, Tax, Financial crime, Health and Safety and how we manage our Data privacy and Security as well as Resilience. This section also includes our approach to managing social and environmental impacts as well as our Governance disclosures as part of the TCFD recommendations. This section does not discuss general corporate governance matters. Refer to the Board Governance report from page 71 in the Annual Report for information relating to the Board, ExCo and Board Committees, our Board governance framework and how we complied with the requirements of the 2018 UK Corporate Governance Code during 2023. Climate and sustainability governance 159 Managing impacts in lending and financing 164 Our supply chain 166 Human rights / Modern slavery 167 Supporting our customers 170 The Barclays Way 173 Whistleblowing 174 Tax 175 Financial crime 177 Health and safety 178 Managing data privacy, security and resilience 179 Strategy Climate and sustainability report Risk review Financial review Financial statements Barclays PLC 2023 Annual Report on Form 20-F 158Governance
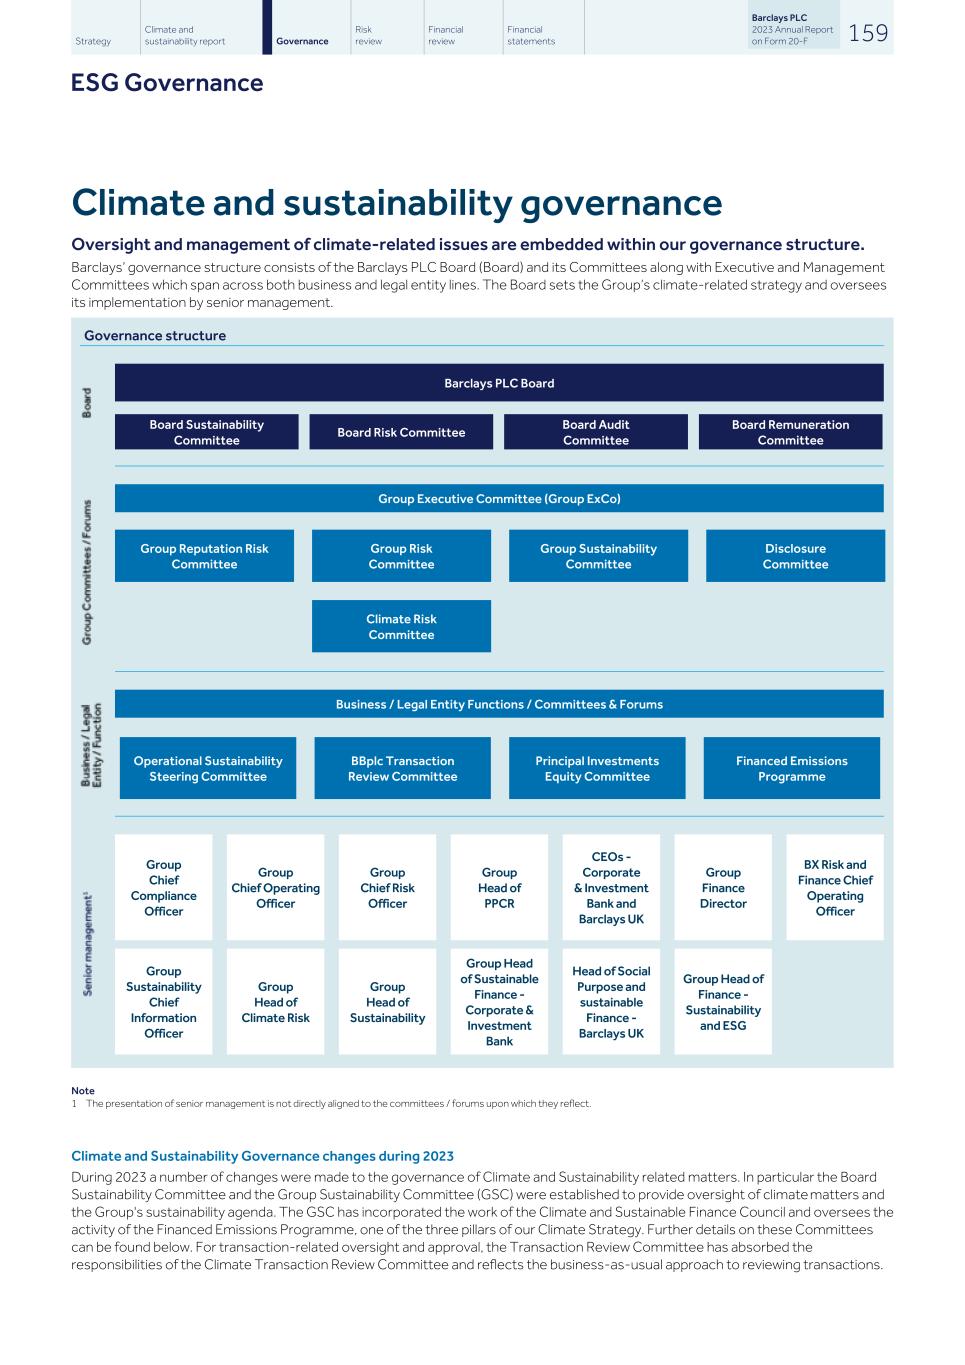
Climate and sustainability governance Oversight and management of climate-related issues are embedded within our governance structure. Barclays’ governance structure consists of the Barclays PLC Board (Board) and its Committees along with Executive and Management Committees which span across both business and legal entity lines. The Board sets the Group’s climate-related strategy and oversees its implementation by senior management. Governance structure Barclays PLC Board Group Executive Committee (Group ExCo) Business / Legal Entity Functions / Committees & Forums Group Chief Compliance Officer Group Chief Operating Officer Group Chief Risk Officer Group Head of PPCR CEOs - Corporate & Investment Bank and Barclays UK Group Finance Director BX Risk and Finance Chief Operating Officer Group Sustainability Chief Information Officer Group Head of Climate Risk Group Head of Sustainability Group Head of Sustainable Finance - Corporate & Investment Bank Head of Social Purpose and sustainable Finance - Barclays UK Group Head of Finance - Sustainability and ESG Note 1 The presentation of senior management is not directly aligned to the committees / forums upon which they reflect. Climate and Sustainability Governance changes during 2023 During 2023 a number of changes were made to the governance of Climate and Sustainability related matters. In particular the Board Sustainability Committee and the Group Sustainability Committee (GSC) were established to provide oversight of climate matters and the Group's sustainability agenda. The GSC has incorporated the work of the Climate and Sustainable Finance Council and oversees the activity of the Financed Emissions Programme, one of the three pillars of our Climate Strategy. Further details on these Committees can be found below. For transaction-related oversight and approval, the Transaction Review Committee has absorbed the responsibilities of the Climate Transaction Review Committee and reflects the business-as-usual approach to reviewing transactions. Strategy Climate and sustainability report Risk review Financial review Financial statements Barclays PLC 2023 Annual Report on Form 20-F 159Governance ESG Governance Board Sustainability Committee Board Risk Committee Board Audit Committee Board Remuneration Committee Operational Sustainability Steering Committee BBplc Transaction Review Committee Principal Investments Equity Committee Financed Emissions Programme Group Reputation Risk Committee Group Risk Committee Group Sustainability Committee Disclosure Committee Climate Risk Committee
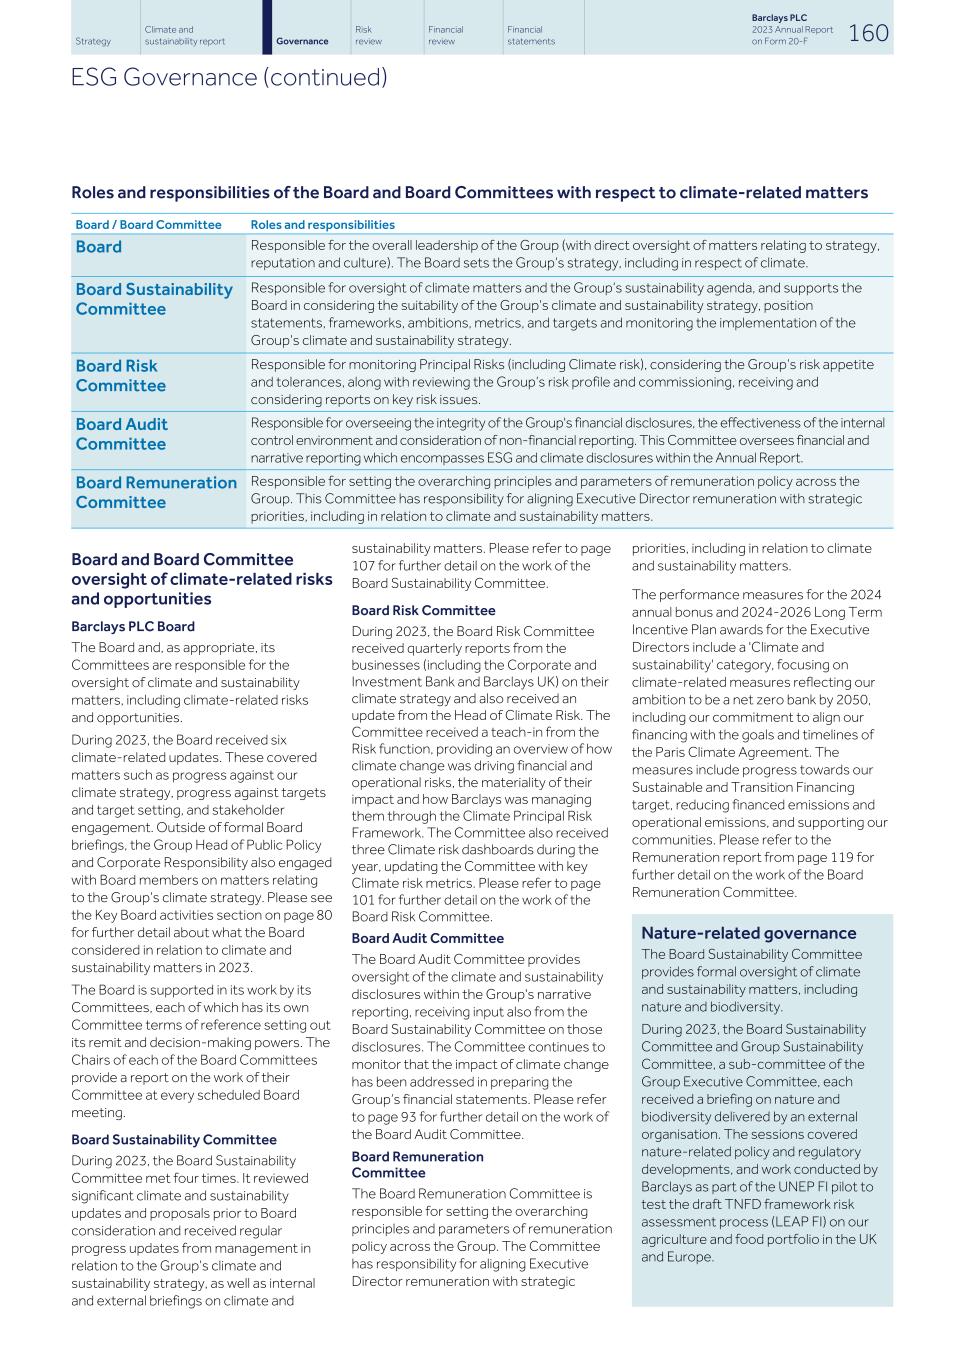
Roles and responsibilities of the Board and Board Committees with respect to climate-related matters Board / Board Committee Roles and responsibilities Board Responsible for the overall leadership of the Group (with direct oversight of matters relating to strategy, reputation and culture). The Board sets the Group’s strategy, including in respect of climate. Board Sustainability Committee Responsible for oversight of climate matters and the Group’s sustainability agenda, and supports the Board in considering the suitability of the Group’s climate and sustainability strategy, position statements, frameworks, ambitions, metrics, and targets and monitoring the implementation of the Group’s climate and sustainability strategy. Board Risk Committee Responsible for monitoring Principal Risks (including Climate risk), considering the Group’s risk appetite and tolerances, along with reviewing the Group’s risk profile and commissioning, receiving and considering reports on key risk issues. Board Audit Committee Responsible for overseeing the integrity of the Group's financial disclosures, the effectiveness of the internal control environment and consideration of non-financial reporting. This Committee oversees financial and narrative reporting which encompasses ESG and climate disclosures within the Annual Report. Board Remuneration Committee Responsible for setting the overarching principles and parameters of remuneration policy across the Group. This Committee has responsibility for aligning Executive Director remuneration with strategic priorities, including in relation to climate and sustainability matters. Board and Board Committee oversight of climate-related risks and opportunities Barclays PLC Board The Board and, as appropriate, its Committees are responsible for the oversight of climate and sustainability matters, including climate-related risks and opportunities. During 2023, the Board received six climate-related updates. These covered matters such as progress against our climate strategy, progress against targets and target setting, and stakeholder engagement. Outside of formal Board briefings, the Group Head of Public Policy and Corporate Responsibility also engaged with Board members on matters relating to the Group’s climate strategy. Please see the Key Board activities section on page 80 for further detail about what the Board considered in relation to climate and sustainability matters in 2023. The Board is supported in its work by its Committees, each of which has its own Committee terms of reference setting out its remit and decision-making powers. The Chairs of each of the Board Committees provide a report on the work of their Committee at every scheduled Board meeting. Board Sustainability Committee During 2023, the Board Sustainability Committee met four times. It reviewed significant climate and sustainability updates and proposals prior to Board consideration and received regular progress updates from management in relation to the Group’s climate and sustainability strategy, as well as internal and external briefings on climate and sustainability matters. Please refer to page 107 for further detail on the work of the Board Sustainability Committee. Board Risk Committee During 2023, the Board Risk Committee received quarterly reports from the businesses (including the Corporate and Investment Bank and Barclays UK) on their climate strategy and also received an update from the Head of Climate Risk. The Committee received a teach-in from the Risk function, providing an overview of how climate change was driving financial and operational risks, the materiality of their impact and how Barclays was managing them through the Climate Principal Risk Framework. The Committee also received three Climate risk dashboards during the year, updating the Committee with key Climate risk metrics. Please refer to page 101 for further detail on the work of the Board Risk Committee. Board Audit Committee The Board Audit Committee provides oversight of the climate and sustainability disclosures within the Group's narrative reporting, receiving input also from the Board Sustainability Committee on those disclosures. The Committee continues to monitor that the impact of climate change has been addressed in preparing the Group’s financial statements. Please refer to page 93 for further detail on the work of the Board Audit Committee. Board Remuneration Committee The Board Remuneration Committee is responsible for setting the overarching principles and parameters of remuneration policy across the Group. The Committee has responsibility for aligning Executive Director remuneration with strategic priorities, including in relation to climate and sustainability matters. The performance measures for the 2024 annual bonus and 2024-2026 Long Term Incentive Plan awards for the Executive Directors include a 'Climate and sustainability' category, focusing on climate-related measures reflecting our ambition to be a net zero bank by 2050, including our commitment to align our financing with the goals and timelines of the Paris Climate Agreement. The measures include progress towards our Sustainable and Transition Financing target, reducing financed emissions and operational emissions, and supporting our communities. Please refer to the Remuneration report from page 119 for further detail on the work of the Board Remuneration Committee. Nature-related governance The Board Sustainability Committee provides formal oversight of climate and sustainability matters, including nature and biodiversity. During 2023, the Board Sustainability Committee and Group Sustainability Committee, a sub-committee of the Group Executive Committee, each received a briefing on nature and biodiversity delivered by an external organisation. The sessions covered nature-related policy and regulatory developments, and work conducted by Barclays as part of the UNEP FI pilot to test the draft TNFD framework risk assessment process (LEAP FI) on our agriculture and food portfolio in the UK and Europe. Strategy Climate and sustainability report Risk review Financial review Financial statements Barclays PLC 2023 Annual Report on Form 20-F 160Governance ESG Governance (continued)
Management's role in assessing and managing climate-related risks and opportunities Oversight and management of Barclays' climate strategy is increasingly embedded in business-as-usual management structures, including a number of executive committees. These committees are mandated and form part of Barclays’ formal governance architecture. They are convened to oversee a specific attribute of the Barclays control framework. Each committee is itself governed by Terms of Reference that lay out the duties, decision-making authority and escalation route of any material issues. The executive management committees receive regular briefings on matters including climate change. Both risks and opportunities are considered by management. Climate-related risks are assessed and escalated as appropriate through the various risk forums. In 2023 the Group Sustainability Committee was established as a dedicated forum to identify and discuss climate-related matters across the Group with a specific mandate to review and propose amendments to the Group Climate strategy prior to consideration by Group ExCo. Group Executive Committee (Group ExCo) Throughout 2023 Group ExCo has been provided with regular updates on our climate strategy, including progress on our commitments, stakeholder engagement and expectations, and target-setting. The Group Head of PPCR is a member of Group ExCo and is accountable for ensuring the Group’s societal purpose is present in strategic decision-making at the highest levels in the organisation. The Group Head of PPCR, and their team, regularly updates Group ExCo on a range of Public Policy and Corporate Responsibility matters, covering key government and regulatory policy, regulator engagement and ESG matters, including climate. In particular, the Group Head of PPCR provided updates on the Climate strategy including proposed amendments to the oil and gas policy and the establishment of new targets for aviation, agriculture and commercial real estate. Updates were also provided on a range of other matters, such as greenwashing, deforestation and biodiversity. The Chief Risk Officer is a member of Group ExCo and is accountable for the approach to managing climate-related financial and operational risks to Barclays; this is implemented within the Group's	 Enterprise Risk Management Framework (ERMF). During 2023, Group ExCo established the Group Sustainability Committee to advise and provide recommendations on a broad range of sustainability issues as further described in the Climate and Sustainability Governance section of this report. Group ExCo was presented with updates on the proposed policy for upstream oil & gas financing. Capturing the opportunity as we transition towards a low-carbon economy was identified as a key strategic growth pillar for Barclays in 2022 and informed the setting of a $1trn Sustainable and Transition Financing target by the end of 2030. In 2023, a Group sustainable finance strategy was developed by the new CIB Global Head of Sustainable Finance and the BUK Head of Social Purpose & Sustainable Finance, setting out areas of strategic focus for the group in delivering the $1trn target. The strategy was presented to Group ExCo and Group Board. All submissions to the Barclays PLC Board on Climate Strategy and climate-related matters are reviewed either by Group ExCo or the relevant Group ExCo member in advance. Executive Remuneration Annual bonus outcomes and Long Term Incentive Plan (LTIP) award outcomes for the Executive Directors of Barclays PLC are assessed against a framework of measures set by the Remuneration Committee at the start of the performance period for each award. A proportion of both annual bonus and LTIP is driven by non- financial performance measures, including measures relating to climate and sustainability. The weighting of the Climate and sustainability category is 15% in the 2024-2026 LTIP and 5% in the 2024 annual bonus. The climate-related measures reflect our ambition to be a net zero bank by 2050, including our commitment to align our financing with the goals and timelines of the Paris Climate Agreement. The measures include progress towards our Sustainable and Transition Financing target, reducing financed emissions and operational emissions, and supporting our communities. + Further details can be found in our Remuneration report from page 119. Group Sustainability Committee (GSC) The Group Sustainability Committee (GSC), a sub-committee of Group ExCo, is chaired by the Group Head of PPCR with senior representation from the Group Head of Sustainability, Head of Sustainable Finance for CIB and Head of Social Purpose and Sustainable Finance for Barclays UK, as well as members representing key functions across the Group. The GSC is responsible for recommending the overall Group sustainability strategy for approval by Group ExCo, and ensuring alignment of business unit climate strategies to the overall strategy. The GSC is also responsible for determining, agreeing or recommending position statements, frameworks, targets, relevant disclosures and advocacy areas necessary to support strategy delivery and agreeing the strategic change priorities to support overall sustainability strategy. Group Risk Committee (GRC) The GRC is the designated forum to review and recommend, where necessary, submissions to the BRC. The GRC is the most senior risk executive body, and it monitors Principal Risks and key topics material to Barclays such as climate change. In 2023, in relation to climate, the GRC reviewed: • key regulatory, global policy and geopolitical themes and management action proposed and taken • physical and transition risk metrics, including portfolio alignment progress against net zero sector targets and mitigation plans • the Climate Risk Framework and Climate Risk Appetite constraints • scenario theme, severity and results of the climate stress test and internal stress test, including implications on stress loss limits In relation to Principal Risks, the GRC undertakes the following: • review and monitor the risk profile of material nature for each Principal Risk • approve for consideration by Barclays PLC Board and BBPLC Board Risk Committee the Risk Appetite Statement for each Principal Risk • annually review and approve the Principal Risk Framework for consideration by the Barclays PLC Board and BBPLC Board Risk Committee. The GRC receives escalations from the Climate Risk Committee, noting none were received in 2023 Strategy Climate and sustainability report Risk review Financial review Financial statements Barclays PLC 2023 Annual Report on Form 20-F 161Governance ESG Governance (continued)
Climate Risk Committee (CRC) To support the oversight of Barclays' climate risk profile, the CRC was established in 2021 as a sub-committee of GRC. The authority of the CRC is delegated by the GRC, and the Group Head of Climate Risk is the Chair of CRC. The CRC has reviewed and approved a range of updates including the climate risk appetite and plans for embedding climate risk into business activities. Additionally, quantitative and qualitative metrics, emerging climate risk trends and progress against targets are presented and discussed at the CRC. Disclosure Committee (DisCom) DisCom, which is chaired by the Group Finance Director, has been set up as a sub- committee of the Group ExCo. DisCom is convened to review and monitor the integrity of the Group’s financial and narrative statements and other information provided to stakeholders, whether by means of announcement or otherwise. In addition to reporting to the Group ExCo, DisCom also reports to the BAC. DisCom is convened to undertake a number of specific duties, including: • financial reporting: to review and monitor the integrity of the Group’s financial statements, interim management statements, preliminary announcements (if prepared), and any other formal announcements relating to the Group’s financial performance. • narrative reporting: to review and monitor the integrity of the Group’s narrative statements, including but not limited to the Country Snapshot, ESG disclosures, the TCFD disclosures and the Modern Slavery Statement. Group Reputation Risk Committee (GRRC) The Group Reputation Risk Committee (GRRC) is a sub-committee of the Group ExCo which reviews and challenges, and directs as appropriate, the management and mitigation of Reputation Risk matters in the Barclays Group as they are brought to the attention of the Committee via relevant Reputation Risk assessment and escalation processes. This includes Reputation Risk associated with climate- related matters. The GRRC is chaired by the Group Chief Compliance Officer, as the Principal Risk owner for Reputation Risk in the Bank, and members include the Group CRO and Group Head of PPCR. In 2023 the GRRC considered certain transactions in scope of the bank's Sustainability Standards to evaluate their alignment with the bank's climate change and sustainability strategy. Group Chief Executive Officer (Group CEO) The Group CEO is responsible for driving Barclays’ focus on external societal and environmental stewardship, and overseeing progress towards Barclays’ ambition to be a net zero bank by 2050. The Group CEO is Chair of Group ExCo. The Group CEO is closely involved in identifying, accelerating and promoting the development of Barclays’ climate and sustainable finance growth opportunities as we transition towards a low-carbon economy. The Group CEO has been an active member of the Sustainable Markets Initiative's Financial Services Taskforce and both attended and spoke at the Autumn CEO Summit during New York Climate Week in September 2023. In 2023, the Group CEO co-led the Nature-based Solutions (NbS) workstream which published the Coastal NbS Practitioners Guide in November 2023. The Group CEO has also been a Leadership Council member of the United Nations Environment Programme Finance Initiative (UNEP FI) since 2022 and attended the annual council meeting in December 2023. The Group CEO also participated in London Climate Action week, hosting a roundtable discussion with company CEOs from Barclays' Sustainable Impact Capital Portfolio. Chief Risk Officer (CRO) The Group CRO is accountable for the approach to managing climate-related financial and operational risks to Barclays. This encompasses the measurement, monitoring and limit setting for Climate risk and the supporting governance. Group Head of PPCR The Group Head of PPCR leads the Group’s overall sustainability and citizenship agendas. Specifically, the role is responsible for leading Barclays’ efforts in tackling climate change, and for integrating our ambition to help embed the transition towards a low-carbon economy into the business. Group Head of Sustainability The Group Head of Sustainability leads the Sustainability and ESG team, and the strategic direction and execution of Barclays’ policies and practices across a broad range of sustainability and ESG matters, including climate change. The role also oversees the development of standards and metrics to advance green and sustainable finance and support innovation in sustainable product development. This role is responsible for Reputation risk issues arising from climate change, although the Board has overall responsibility for reputation matters generally. The Group Head of Sustainability reports directly to the Group Head of PPCR. Group Head of Climate Risk The Group Head of Climate Risk is the Climate Principal Risk owner accountable for the management and oversight of the climate risk profile. The Group Head of Climate Risk reports directly to the Group CRO and is the Chair of CRC. The Group Head of Climate Risk is responsible for the development and implementation of climate risk governance, including ownership of Barclays’ Climate Risk Framework and Policy. The Group Head of Climate Risk is also responsible for integrating climate risk considerations into existing risk management processes and overseeing climate risk management activities, including identifying, assessing, and monitoring climate risk drivers and proposing climate risk appetite, limits and controls. The Group Head of Climate Risk also leads the development of climate risk methodologies and Barclays’ approach to carbon modelling, including the BlueTrack™ methodology. Group Sustainability Chief Information Officer Created in 2023, the Group Sustainability Chief Information Officer (CIO) brings together technology, data and change execution expertise. The Group Sustainability CIO works in partnership with the business and functions to deliver new capabilities that enable and accelerate delivery against the Group's sustainability strategy. Group Head of Finance - Sustainability and ESG The Group Head of Finance - Sustainability and ESG was appointed in January 2022. The role encompasses leading Barclays' global external, internal and regulatory reporting capabilities relating to sustainability and ESG, and tracking progress made across our businesses to meet our climate targets, which is fundamental to support our ambition to be a net zero bank by 2050. This includes embedding climate-related disclosures such as the TCFD into our framework of disclosure procedures, governance and Strategy Climate and sustainability report Risk review Financial review Financial statements Barclays PLC 2023 Annual Report on Form 20-F 162Governance ESG Governance (continued)
controls supporting the creation, review and approval of the Group’s financial statements. Further responsibilities include embedding climate-related risks and opportunities into financial planning. Global Head of Sustainable Finance - Corporate & Investment Bank The Global Head of Sustainable Finance for the Corporate and Investment Bank (CIB) is a member of the CIB Management Team, reporting to the Global Head of the CIB and the Group Head of PPCR. The role was created in 2022 to develop a centre of excellence for sustainable finance to support Barclays’ clients navigate the opportunities and challenges of transitioning towards a low-carbon economy.The Group Head of Sustainable Finance for CIB is also a member of the Barclays Sustainable Impact Capital portfolio Investment Committee, which has a mandate to invest up to £500m in global climate technology companies by the end of 2027. The role partners closely with Barclays’ Sustainability & ESG team on our net zero ambition and environmental and social risk management and with the Head of Social Purpose and Sustainable Finance for Barclays UK to deliver change across the Group. Head of Social Purpose and Sustainable Finance - Barclays UK The role of Head of Social Purpose and Sustainable Finance for Barclays UK was created in 2022 with responsibility for the strategic direction and execution of the Barclays UK sustainability strategy. The role oversees the development and delivery of Barclays UK products and propositions to enable our retail and small business customers to adopt more sustainable practices – covering finance, tools, education and partnerships. The role also partners closely with the Barclays UK Government Relations team to develop advocacy positions, as well as Legal, Risk and Compliance functions to embed sustainability into processes and frameworks. Implementation - business working level committees, forums and reports Business / Legal Entity committees / forums Oversight and management of climate- related risks and opportunities occur at a number of levels in the organisation and across business lines and legal entities. Barclays operates through a combination of formal mandated committees and governance bodies/forums. The mandated committee structure operates on a legal entity basis and will oversee climate-related issues relevant to that entity. These are supported by Subcommittees/ other governance bodies/forums which can operate on a legal entity basis or across the Group and oversee climate- related issues, risks and opportunities within their remit and escalate material issues as appropriate. These committees and forums follow the established escalation process for climate-related items, bringing updates first to the relevant Group ExCo member, then the Group ExCo, and ultimately to the Board. Operational Sustainability Steering Committee (OSSCo) Barclays’ Operational Sustainability Steering Committee (OSSCo) is responsible for the development and implementation of the Group’s net zero operations strategy. OSSCo is chaired by the Barclays Execution Services (BX) Chief Operating Officer and comprises leadership from Corporate Real Estate Solutions (CRES) & Location Strategy, Barclays UK, Procurement and Sourcing, Group Technology Infrastructure Services (GTIS), Corporate Communications, Group Sustainability & ESG, and Legal. OSSCo reviews and approves environmental operational targets, reviews operational sustainability programmes and mitigates risks to the delivery of the net zero operations strategy. OSSCo also facilitates coordination and alignment across the functions responsible for implementing the net zero operations strategy. OSSCo provides updates to the GSC every quarter, which then reports to the Barclays PLC Board twice a year. BBplc Transaction Review Committee The BBplc Transaction Review Committee (’TRC) is convened for senior management to review all BBplc Transactions that contain material Reputation Risk and escalates directly to the Group Reputation Risk Committee. The TRC has responsibility to ensure alignment with local entity and regulatory expectations and requirements when making decisions that impact the various subsidiaries of BBplc, including Barclays Bank Ireland PLC (“Barclays Europe”) and the US Intermediate Holding Company. Transactions reviewed include transactions, relationships, agreements, strategies and other business activities. Principal Investments Equity Committee The Principal Investments Equity Committee (the “Committee”) undertakes the senior approval responsibilities relating to the execution and management of all principal strategic equity and workout equity transactions managed on behalf of Barclays PLC and all other Barclays Group entities. The formation and authority of this Committee comes from the Group CEO, acting through the Group ExCo. The Committee consists of senior stakeholders who meet on a regular basis which, when considering the ‘Sustainable Impact Capital’ portfolio, includes the Global Head of Sustainable Finance and Group Head of Sustainability for CIB. Financed Emissions Programme The Group change programme on climate (“the programme”) is focused on driving the execution of one of the three pillars of our Climate Strategy, ‘Reducing our Financed Emissions’, within which Barclays is committed to aligning its financing with the goals and timelines of the Paris Agreement, consistent with scenarios limiting the increase in global temperatures to 1.5°C. The programme is set up in line with the Barclays Change Delivery Management standard, with established governance and regular reporting at the GSC. The overall Accountable Executive of the programme is the Group Head of Sustainability, also the chair of its governance body represented by key businesses and functions across the Group, such as Sustainability & ESG, Risk, Business (Corporate and Investment Bank and Barclays UK), Finance and Technology. Key focus areas of the programme since its inception include setting targets for some of our highest emitting sectors, establishing Climate risk as a new Principal Risk (as part of the Enterprise Risk Management Framework), embedding required processes and frameworks within the business to implement and manage sector targets, evaluating absolute emissions across the in-scope balance sheet, and delivering to a technology roadmap to meet climate data requirements. Strategy Climate and sustainability report Risk review Financial review Financial statements Barclays PLC 2023 Annual Report on Form 20-F 163Governance ESG Governance (continued)
Managing impacts in lending and financing Appropriate management of environmental and social impacts helps to ensure the longevity of our business and our ability to serve our clients. At Barclays, we recognise the importance of risk identification and management in the provision of financial services to our customers and clients. Our assessment of environmental and social risks informs our wholesale credit risk management and helps safeguard our reputation. This supports the longevity of our business and also enhances our ability to serve our clients and support them in improving their own sustainability practices and disclosures. Managing environmental and social risks Environmental and social risks are governed and managed through our Enterprise Risk Management Framework (ERMF), setting our strategic approach for risk management by defining standards, objectives and responsibilities for all areas of Barclays. The ERMF is complemented by a number of other frameworks, policies and standards, all of which are aligned to individual Principal Risks. Our Climate Change Statement sets out our current restrictions on business appetite and includes restrictions in respect of certain sensitive energy subsectors (thermal coal mining, coal-fired power generation, mountain-top coal removal, upstream oil & gas and unconventional oil & gas including oil sands, Arctic oil & gas, hydraulic fracturing ('fracking'), Amazon oil & gas, ultra-deep water and extra heavy oil). as well as referencing new enhanced due diligence requirements for biomass which will be introduced during 2024.   We have also established positions on Forestry and Agricultural Commodities, World Heritage and Ramsar Wetlands and on the Defence and Security sector. In addition, we have developed internal standards for each of these which reflect these positions in more detail. These standards, which sit under the management of Reputation risk in the ERMF, determine our approach to climate change and relevant sensitive sectors and are considered as part of our existing transaction origination, review and approval process. Enhanced Due Diligence Our standards currently include an enhanced due diligence approach for certain clients operating in the following energy sub-sectors covered by our Climate Change Statement: thermal coal mining, coal-fired power generation, mountain-top coal removal, oil sands, Arctic oil & gas and hydraulic fracturing ('fracking') and clients in-scope of our Forestry and Agricultural Commodities, World Heritage Sites and Ramsar Wetlands and Defence and Security standards where a similar approach is taken. This approach will be extended to cover the additional sectors brought into scope of the updated Climate Change Statement. All clients in-scope of the above mentioned standards must be assessed annually via a detailed Sustainability enhanced due diligence questionnaire, which is used to evaluate their performance on a range of environmental and social issues and may be supplemented by a review of client policies / procedures, further client engagement and adverse media checks as appropriate. This annual review either generates an Environmental and Social Impact (ESI) risk rating (low, medium, high), or in the case of Defence and Security an assessment against risk appetite, which in turn determines whether further review and client engagement may be required throughout the year. High and certain medium ESI rated clients would require further risk assessment prior to execution of transactions with those clients. We undertook 593 (2022:597) reviews in 2023 , being a combination of Sustainability annual due diligence reviews and individual transaction reviews . Environmental risk reviews are captured within the business-as-usual credit process and are therefore no longer included within this number. Monitoring As part of our management of environmental and social risks, we may require further client engagement in relation to the specific environmental and social risks that we have identified as part of our enhanced due diligence process. We have used this engagement as an opportunity to gain a more detailed understanding of the risks and challenges that the client is facing and to better understand any climate transition plan that they may have. Escalation and decision-making Where client relationships or transactions are assessed as higher-risk (high or medium ESI rating) or outside appetite (in the case of Defence and Security) following a Sustainability enhanced due diligence review, they are then considered for escalation to the appropriate business unit review committee (e.g. BBplc Transaction Review Committee) for consideration and a decision on whether to proceed if transaction related. Business unit review committees comprise of Business management and representatives from the control functions, including Reputation risk. Should the front office business team or the Sustainability and ESG team believe the issues are sufficiently material, these clients/relationships would be escalated to the Group Reputation Risk Committee (GRRC) for more senior consideration and decision. GRRC includes representation from the Group Executive Committee. These Committees may make the following determinations: • approve the transaction or relationship • reject the transaction or relationship • approve the transaction or relationship, subject to prescribed modifications • escalate the review of the transaction or relationship to the Barclays Group CEO. Strategy Climate and sustainability report Risk review Financial review Financial statements Barclays PLC 2023 Annual Report on Form 20-F 164Governance ESG Governance (continued)
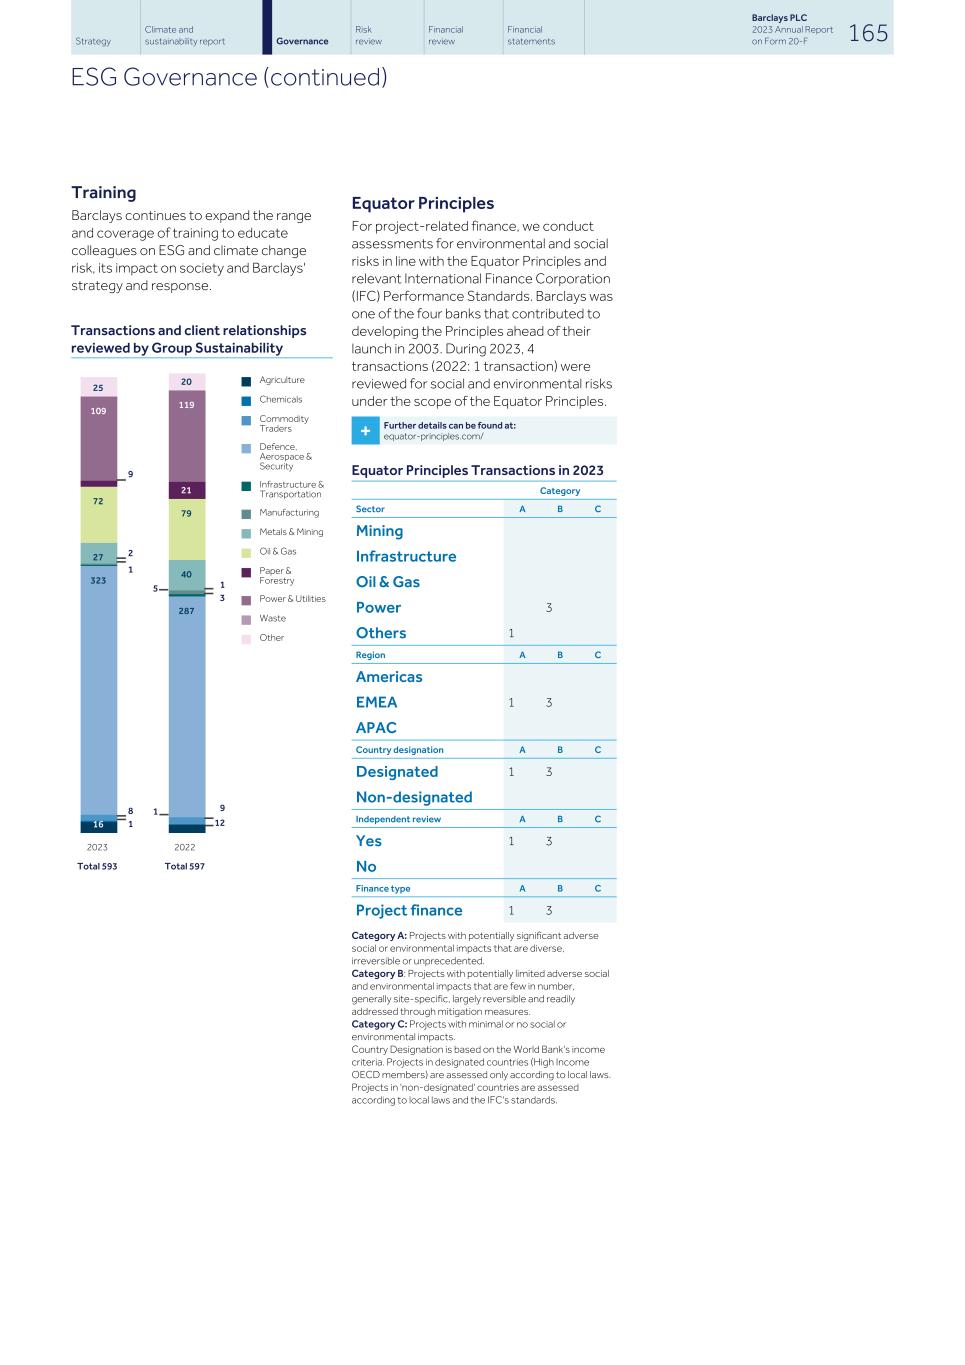
Training Barclays continues to expand the range and coverage of training to educate colleagues on ESG and climate change risk, its impact on society and Barclays' strategy and response. Transactions and client relationships reviewed by Group Sustainability 16 323 27 72 109 25 287 40 79 21 119 20 n Agriculture n Chemicals n Commodity Traders n Defence, Aerospace & Security n Infrastructure & Transportation n Manufacturing n Metals & Mining n Oil & Gas n Paper & Forestry n Power & Utilities n Waste n Other 2023 Total 593 2022 Total 597 Equator Principles For project-related finance, we conduct assessments for environmental and social risks in line with the Equator Principles and relevant International Finance Corporation (IFC) Performance Standards. Barclays was one of the four banks that contributed to developing the Principles ahead of their launch in 2003. During 2023, 4 transactions (2022: 1 transaction) were reviewed for social and environmental risks under the scope of the Equator Principles. + Further details can be found at: equator-principles.com/ Equator Principles Transactions in 2023 Category Sector A B C Mining Infrastructure Oil & Gas Power 3 Others 1 Region A B C Americas EMEA 1 3 APAC Country designation A B C Designated 1 3 Non-designated Independent review A B C Yes 1 3 No Finance type A B C Project finance 1 3 Category A: Projects with potentially significant adverse social or environmental impacts that are diverse, irreversible or unprecedented. Category B: Projects with potentially limited adverse social and environmental impacts that are few in number, generally site-specific, largely reversible and readily addressed through mitigation measures. Category C: Projects with minimal or no social or environmental impacts. Country Designation is based on the World Bank's income criteria. Projects in designated countries (High Income OECD members) are assessed only according to local laws. Projects in 'non-designated' countries are assessed according to local laws and the IFC's standards. Strategy Climate and sustainability report Risk review Financial review Financial statements Barclays PLC 2023 Annual Report on Form 20-F 165Governance ESG Governance (continued) 9 2 1 8 1 1 3 9 12 5 1
Supporting our supply chain With nearly 9,0001 companies coming from 29 countries supplying us, our supply chain helps our businesses deliver for our customers, clients and colleagues. Though our businesses are geographically diverse, more than 92%2 of our third-party spending is concentrated in the UK and the US with many of them having their own extensive supply chains. Our supply base is diverse across scale, ownership type and structure from privately-held start-ups to publicly-listed multinational corporations. Over the past several years, Barclays has sought to reduce the size of its supply chain while at the same time creating opportunities for diverse suppliers3 which encompass micro, small or medium-sized enterprises and diverse-owned4 businesses. + Please see further details on our requirements of external suppliers at: home.barclays/who-we-are/ our-suppliers/our-requirements-of-external- suppliers/ Highlights 8.5% Global spend with micro, small and medium-sized enterprises and diverse-owned suppliers (2022: 8.5%) 93% Prompt payment rate (2022: 93%) Third party operational and reputational risk management Barclays Directors, via management, must effectively manage, monitor and mitigate risks in our supply chain. We expect our Third Party Service Providers (TPSP) to make responsible decisions that, where relevant, take our stakeholders` needs into account in both the short and long term. Barclays expects the TPSPs to comply with applicable laws, regulations and standards within the geographies in which they operate. Barclays` standard approach5 to new TPSP on-boarding and renewal begins by assessing the services that are being provided and ascertaining the level of risk. TPSPs that are assessed as being above a low risk of exposure from a business risk perspective (at the point of onboarding and on an ongoing basis) are subject to Barclays` Supplier Control obligations (SCOs). TPSPs to whom the SCOs apply become managed TPSPs and are subject to ongoing management and controls assurance during the term of service. Prior to contractual agreement and service go live, these TPSPs are required to complete a pre-contractual questionnaire which captures their adherence to the SCOs and Barclays` TPSP Code of Conduct (TPSP CoC). The TPSP CoC encourages our TPSPs to adopt our approach to doing business and details our expectations for matters including environmental management, human rights, diversity and inclusion and also for living the Barclays Values. Managed TPSPs are subject to controls assurance on an annual basis to assess whether the controls required of them under the SCOs are maintained and operating effectively. They are also asked to complete an annual self-certification against the individual topics contained within the TPSP CoC. Where TPSPs are unable to meet our expectations under the TPSP CoC and SCOs, the issue will be escalated and we will look for options to manage the risk, which may include additional oversight, heightened Barclays controls or electing not to do business with the TPSP. The TPSP CoC and SCOs are published on the Barclays public website for all new and existing suppliers to view and are refreshed periodically. Notes 1 Includes non-addressable spend and One Time Vendors (OTV). 2 92% by invoice value 3 Spending between Barclays and diverse suppliers is considered first-tier spending. Spending between Barclays’ first-tier suppliers that can trace subcontracted spend with diverse suppliers on Barclays-specific work is considered second-tier direct spending. 4 For Barclays, diverse suppliers are defined as either size diverse (small and medium sized enterprises) or ownership diverse (majority owned, controlled and operated by protected class groups, such as women, ethnic minorities, LGBT+, persons with disabilities, military veterans and for-profit social enterprises) 5 We do have relationships with financial institutions and market counterparties which, because of the nature of the services being provided (such as international account holding services), are not subject to our usual TPSP on-boarding procedures and which are therefore not subject to the TPSP CoC. + Please see further details on our climate change initiatives in our supply chain within our Achieving net zero operations section from page 29 within the Climate and Sustainability report. Payment on time Prompt payment is critical to the cash flow of every business, and especially to smaller businesses within the supply chain as cash flow issues are a major contributor to business failure. We aim to pay our TPSPs within clearly defined terms, and to help ensure there is a proper process for dealing with any issues that may arise. We measure prompt payment globally by calculating the percentage of TPSP spend paid within 45 days following invoice date. The measurement applies against all invoices by value over a three-month rolling average period for all entities where invoices are managed centrally. At the end of 2023, we achieved 93% on-time payment to our TPSPs compared to 93% at the end of 2022, exceeding our public commitment to pay 85% of TPSPs on time (by invoice value). The need to promptly pay our diverse TPSPs became even more important during the COVID-19 pandemic. Barclays established a process to expedite the payments for diverse TPSPs at this critical time. This process remained in place during 2023. Barclays is proud to be a signatory of the Prompt Payment Code in the UK and we also work closely with the Small Business Commissioner and other organisations, including Good Business Pays, to educate the public on late payments and the impact they can have on businesses and business owners, and to raise the social conscience of larger businesses who do not pay on time. Diversity, Equity and Inclusion in our supply chain Barclays believes that diversity across our supply chain expands our ability to attract and harness innovative solutions in the market that complement our own capabilities, while simultaneously creating value for customers and clients, and economic opportunities for wider, under- represented segments of society. This is why we launched our first Global Supplier Diversity (GSD) initiative, now celebrating 10 years of impact since 2013. The GSD initiative aims to position Barclays as a leader in providing inclusive procurement opportunities and driving economic impact to diverse businesses – diverse in size, ownership make-up or mission. As part of our GSD initiative in 2023, 8.5% of our global addressable spend1 was placed with small and medium-sized enterprises and diverse-owned businesses as measured by first- and second-tier direct spending. First-tier suppliers are contracted directly by Barclays and second-tier direct suppliers are subcontractors to first-tier suppliers on Barclays-specific work. Ownership- diverse businesses are majority owned, controlled and operated by protected class groups, such as women, ethnic minorities, LGBT+, persons with disabilities, military veterans and for-profit social enterprises. In 2023, we added a new Strategy Climate and sustainability report Risk review Financial review Financial statements Barclays PLC 2023 Annual Report on Form 20-F 166Governance ESG Governance (continued)
diverse supplier category of mission- diverse, also known as social enterprises. Though a small segment of our diverse supplier spend, we will recognize and account for spend with businesses that are driven primarily by a social mission where they do not already qualify as small or ownership-diverse. In support of the GSD initiative, Barclays is a corporate member of, and plays an important role with, several of the most prominent domestic and international diverse supplier certification organisations including National Minority Supplier Development Council (nmsdc.org), Minority Supplier Development UK (msduk.org.uk), Women’s Business Enterprise National Council (wbenc.org), WeConnect International (weconnectinternational.org), National LGBTQ Chamber of Commerce (nglcc.org), OutBritain (outbritain.co.uk), National Veteran Owned Businesses Association (NaVoba.org) and Disability:IN (disabilityIn.org). In 2021, we pledged to double our spend with Black and women-owned businesses by 2025, with 2020 as the baseline year, and to grow overall spend with SMEs and diverse-owned businesses to 10% of Barclays annual global addressable spend. As of 2023, we are tracking to plan to double spend with Black and women- owned businesses by 2025 and to meet the overall 10% diverse supplier spend goal. As we institutionalize DEI across our supply chain, the aim is for service providers, which make up 70% of our addressable spend to have a diversity and inclusion policy or standard in place by 2025. We are continuing to engage and assess our suppliers and will report against our progress in the future. Note 1 Addressable spend is defined as external costs incurred by Barclays in the normal course of business where Procurement has influence over where the spend is placed. It excludes costs such as regulatory fines or charges, exchange fees, taxation, employee expenses or litigation costs, property rent. Modern slavery in our supply chain Barclays is committed to trying to identify and seeking to address modern slavery risks in our supply chain. Regardless of the industry or geography in which our Third Party Service Providers (TPSP) operate, we require them to comply with applicable laws and regulations. We describe our standard process of TPSP onboarding and renewal in the "Third Party operational and reputational risk management" section above. TPSPs that are assessed as being above a low risk of exposure from a business risk perspective become managed TPSPs and are requested to complete an annual self- attestation against topics contained within our TPSP Code of Conduct (TPSP CoC). The TPSP CoC identifies our expectations with regards to respecting human rights through areas such as occupational health and safety, freely chosen employment, avoidance of child labour and practices which could lead to exploitation of workers, freedom of religion and belief in the workplace, freedom of association and collective bargaining, zero tolerance for discrimination, harassment and abuse, accessible grievance and whistleblowing mechanisms. These expectations (which relate to human rights topics) are an important part of our efforts to meet our responsibility to respect human rights. We continue to strengthen the way we identify and assess modern slavery and we describe the ways we aim to do this in our Modern Slavery Statement. We are continuing to work with our TPSPs to support our ambition that those making up 70% of our Addressable Spend1 will have a modern slavery policy or standard in place by 2025. Note 1 Addressable spend is defined as external costs incurred by Barclays in the normal course of business where Procurement has influence over where the spend is placed. It excludes costs such as regulatory fines or charges, exchange fees, taxation, employee expenses or litigation costs, property rent. Human rights Barclays continues to take action to enhance and further embed our approach to respecting human rights. During 2023 we worked towards two important milestones for our human rights work. We completed a saliency assessment of human rights risks in our Corporate and Investment Bank ("CIB") financing portfolio to guide our next steps in enhancing the CIB approach to managing human rights risks. Insights from the saliency assessment informed updates to Barclays' Statement on Human Rights, which we published alongside this Annual Report. The Statement seeks to reflect our evolving approach to human rights and align with the relevant normative frameworks, in particular the UN Guiding Principles on Business and Human Rights (UNGPs). The Statement reiterates our commitment to respecting human rights as defined in the International Bill of Human Rights and the International Labour Organization’s (ILO) Declaration on Fundamental Principles and Rights at Work (ILO Declaration). Our approach is guided by the UNGPs and the OECD Guidelines for Multinational Enterprises on Responsible Business Conduct. It also incorporates our Focus Areas for Progress, which set out our plans to enhance our approach to respecting human rights. In addition, during 2023 we continued our efforts to monitor issues and developments globally that may present new or elevated human rights risks and worked to evaluate our potential involvement and consider our responsibilities to seek to address, these risks. We also continued to embed human rights considerations into our position statements and related enhanced due diligence approach. For example, in our Forestry and Agricultural Commodities Statement we have introduced a requirement for in-scope clients to have a policy commitment to respect human rights across their operations and supply chain and the expectation that they undertake human rights due diligence across their operations and supply chain. + For further information of our management of environmental and social impacts in our lending please see page 164. Strategy Climate and sustainability report Risk review Financial review Financial statements Barclays PLC 2023 Annual Report on Form 20-F 167Governance ESG Governance (continued)
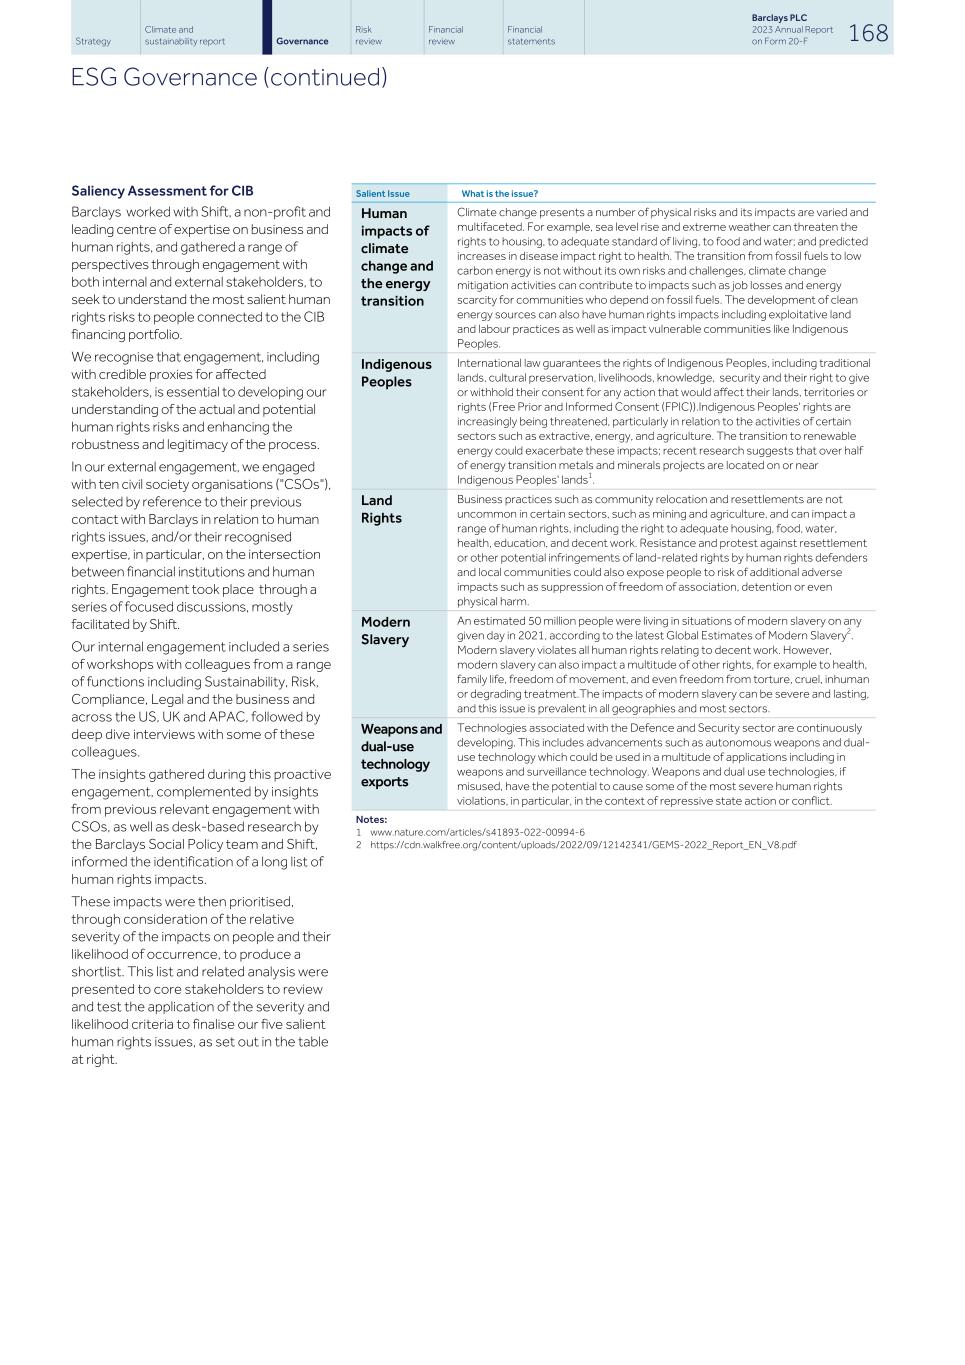
Saliency Assessment for CIB Barclays worked with Shift, a non-profit and leading centre of expertise on business and human rights, and gathered a range of perspectives through engagement with both internal and external stakeholders, to seek to understand the most salient human rights risks to people connected to the CIB financing portfolio. We recognise that engagement, including with credible proxies for affected stakeholders, is essential to developing our understanding of the actual and potential human rights risks and enhancing the robustness and legitimacy of the process. In our external engagement, we engaged with ten civil society organisations ("CSOs"), selected by reference to their previous contact with Barclays in relation to human rights issues, and/or their recognised expertise, in particular, on the intersection between financial institutions and human rights. Engagement took place through a series of focused discussions, mostly facilitated by Shift. Our internal engagement included a series of workshops with colleagues from a range of functions including Sustainability, Risk, Compliance, Legal and the business and across the US, UK and APAC, followed by deep dive interviews with some of these colleagues. The insights gathered during this proactive engagement, complemented by insights from previous relevant engagement with CSOs, as well as desk-based research by the Barclays Social Policy team and Shift, informed the identification of a long list of human rights impacts. These impacts were then prioritised, through consideration of the relative severity of the impacts on people and their likelihood of occurrence, to produce a shortlist. This list and related analysis were presented to core stakeholders to review and test the application of the severity and likelihood criteria to finalise our five salient human rights issues, as set out in the table at right. Salient Issue What is the issue? Human impacts of climate change and the energy transition Climate change presents a number of physical risks and its impacts are varied and multifaceted. For example, sea level rise and extreme weather can threaten the rights to housing, to adequate standard of living, to food and water; and predicted increases in disease impact right to health. The transition from fossil fuels to low carbon energy is not without its own risks and challenges, climate change mitigation activities can contribute to impacts such as job losses and energy scarcity for communities who depend on fossil fuels. The development of clean energy sources can also have human rights impacts including exploitative land and labour practices as well as impact vulnerable communities like Indigenous Peoples. Indigenous Peoples International law guarantees the rights of Indigenous Peoples, including traditional lands, cultural preservation, livelihoods, knowledge, security and their right to give or withhold their consent for any action that would affect their lands, territories or rights (Free Prior and Informed Consent (FPIC)).Indigenous Peoples' rights are increasingly being threatened, particularly in relation to the activities of certain sectors such as extractive, energy, and agriculture. The transition to renewable energy could exacerbate these impacts; recent research suggests that over half of energy transition metals and minerals projects are located on or near Indigenous Peoples' lands1. Land Rights Business practices such as community relocation and resettlements are not uncommon in certain sectors, such as mining and agriculture, and can impact a range of human rights, including the right to adequate housing, food, water, health, education, and decent work. Resistance and protest against resettlement or other potential infringements of land-related rights by human rights defenders and local communities could also expose people to risk of additional adverse impacts such as suppression of freedom of association, detention or even physical harm. Modern Slavery An estimated 50 million people were living in situations of modern slavery on any given day in 2021, according to the latest Global Estimates of Modern Slavery2. Modern slavery violates all human rights relating to decent work. However, modern slavery can also impact a multitude of other rights, for example to health, family life, freedom of movement, and even freedom from torture, cruel, inhuman or degrading treatment.The impacts of modern slavery can be severe and lasting, and this issue is prevalent in all geographies and most sectors. Weapons and dual-use technology exports Technologies associated with the Defence and Security sector are continuously developing. This includes advancements such as autonomous weapons and dual- use technology which could be used in a multitude of applications including in weapons and surveillance technology. Weapons and dual use technologies, if misused, have the potential to cause some of the most severe human rights violations, in particular, in the context of repressive state action or conflict. Notes: 1 www.nature.com/articles/s41893-022-00994-6 2 https://cdn.walkfree.org/content/uploads/2022/09/12142341/GEMS-2022_Report_EN_V8.pdf Strategy Climate and sustainability report Risk review Financial review Financial statements Barclays PLC 2023 Annual Report on Form 20-F 168Governance ESG Governance (continued)
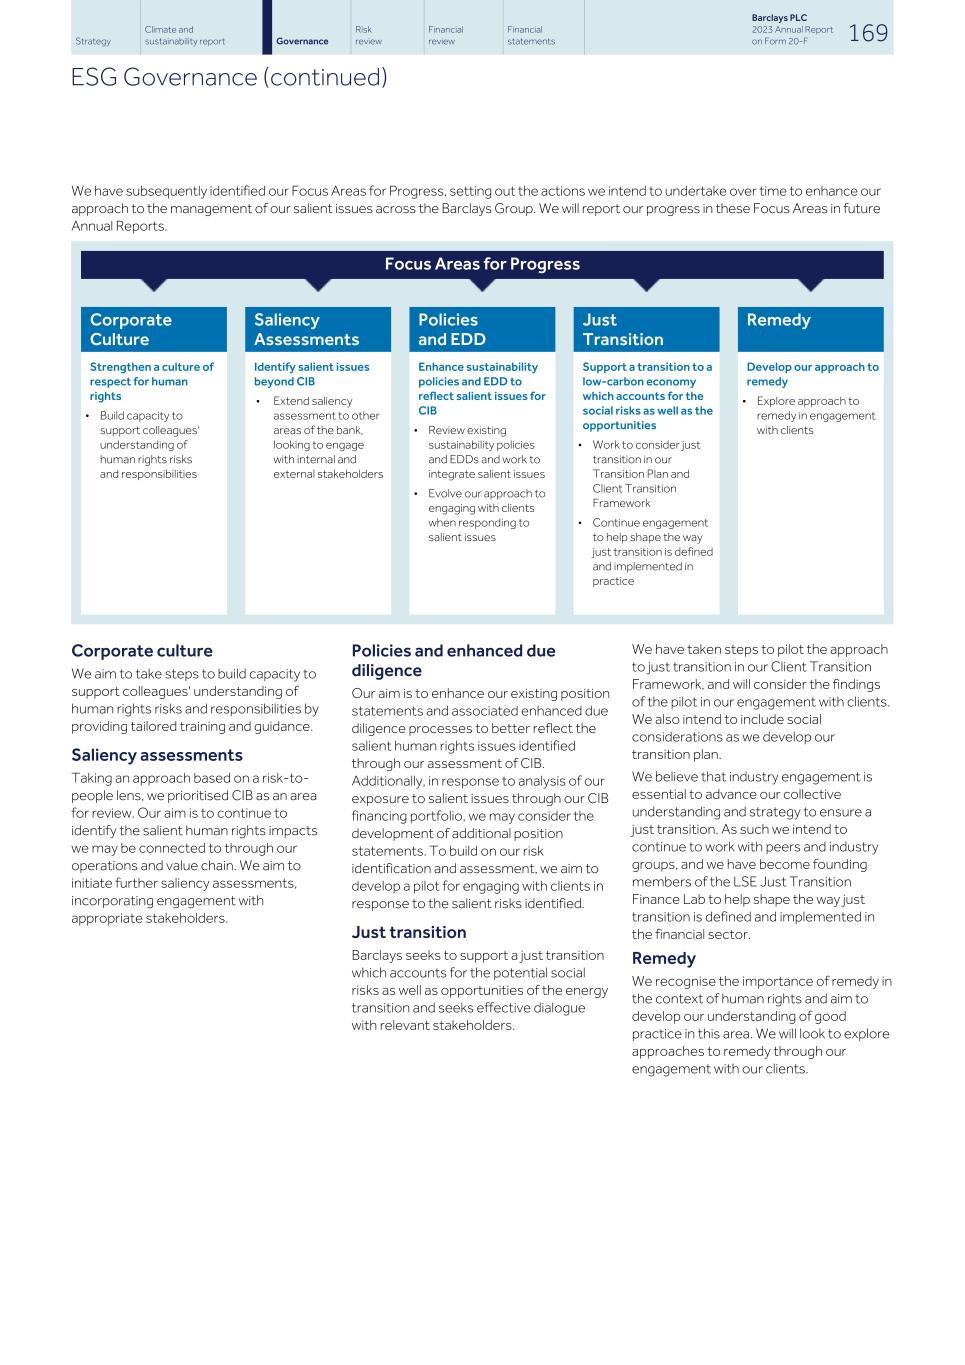
We have subsequently identified our Focus Areas for Progress, setting out the actions we intend to undertake over time to enhance our approach to the management of our salient issues across the Barclays Group. We will report our progress in these Focus Areas in future Annual Reports. Focus Areas for Progress Corporate Culture Saliency Assessments Policies and EDD Just Transition Remedy Strengthen a culture of respect for human rights • Build capacity to support colleagues’ understanding of human rights risks and responsibilities Identify salient issues beyond CIB • Extend saliency assessment to other areas of the bank, looking to engage with internal and external stakeholders Enhance sustainability policies and EDD to reflect salient issues for CIB • Review existing sustainability policies and EDDs and work to integrate salient issues • Evolve our approach to engaging with clients when responding to salient issues Support a transition to a low-carbon economy which accounts for the social risks as well as the opportunities • Work to consider just transition in our Transition Plan and Client Transition Framework • Continue engagement to help shape the way just transition is defined and implemented in practice Develop our approach to remedy • Explore approach to remedy in engagement with clients Corporate culture We aim to take steps to build capacity to support colleagues' understanding of human rights risks and responsibilities by providing tailored training and guidance. Saliency assessments Taking an approach based on a risk-to- people lens, we prioritised CIB as an area for review. Our aim is to continue to identify the salient human rights impacts we may be connected to through our operations and value chain. We aim to initiate further saliency assessments, incorporating engagement with appropriate stakeholders. Policies and enhanced due diligence Our aim is to enhance our existing position statements and associated enhanced due diligence processes to better reflect the salient human rights issues identified through our assessment of CIB. Additionally, in response to analysis of our exposure to salient issues through our CIB financing portfolio, we may consider the development of additional position statements. To build on our risk identification and assessment, we aim to develop a pilot for engaging with clients in response to the salient risks identified. Just transition Barclays seeks to support a just transition which accounts for the potential social risks as well as opportunities of the energy transition and seeks effective dialogue with relevant stakeholders. We have taken steps to pilot the approach to just transition in our Client Transition Framework, and will consider the findings of the pilot in our engagement with clients. We also intend to include social considerations as we develop our transition plan. We believe that industry engagement is essential to advance our collective understanding and strategy to ensure a just transition. As such we intend to continue to work with peers and industry groups, and we have become founding members of the LSE Just Transition Finance Lab to help shape the way just transition is defined and implemented in the financial sector. Remedy We recognise the importance of remedy in the context of human rights and aim to develop our understanding of good practice in this area. We will look to explore approaches to remedy through our engagement with our clients. Strategy Climate and sustainability report Risk review Financial review Financial statements Barclays PLC 2023 Annual Report on Form 20-F 169Governance ESG Governance (continued)
Supporting customers through Barclays UK Barclays has a large retail presence in the UK, offering a wide range of products and services to c.20 million customers through Barclays UK. We recognise that there is a heightened need to help customers who may be experiencing financial vulnerability due to the inflationary pressures on household budgets and increased interest rates. We are endeavouring to support customers during these challenging times, and during 2023 have continued to focus on four key areas: 1.using data analytics to determine which customers are in need of support and the appropriate type of support; 2.engaging those customers impacted to increase awareness of products, tools and support available; 3.understanding customers’ needs and developing solutions to provide greater support; and 4.ensuring colleagues have, and are aware of, the financial health tools to enable them to support customers. To better support financially vulnerable customers, we have enhanced our Barclays' tools, training, support and systems, continuing to improve our ongoing support when customers need us the most. In July 2023 Barclays implemented support measures following the introduction of the Mortgage Charter by HMT. These measures provided residential mortgage customers, who are up to date with their payments, with a range of support options which included: • The ability to apply to extend the term of their mortgage to reduce their monthly payment amount . • Apply to switch their mortgage from repayment to interest only for a period of 6 months to temporarily reduce their monthly payment amount. Barclays continued a nationwide engagement campaign into 2023, providing practical support and guidance to the cost of living crisis. Launching at the end of 2022 and reaching across 254 local and national commercial radio stations; in print across 12 major national dailies and 26 major regional titles. In Q1/Q2 2023, the campaign extended with additional AV campaign across TV, cinema and VOD reaching 99% of our core audience with practical support and guidance. We delivered content targeted to the needs of our most vulnerable audiences with content across video, social media and owned channels. In the second half of the year, we launched new content marketing activity in collaboration with influencers to engage consumers around topics of everyday money management, travel and remortgaging. Guiding people on how to make money work better for them through the rising pressures of inflation, with this activity targeted at both low financial wellbeing and broader audiences. This was supported with marketing across our branches and locals that provided guidance on the benefits of the Barclays app to support with everyday money management and travel. Provided ongoing Cost of living support by proactively contacting over 1.38m customers with proactive SMS offering a conversation to provide support and guidance on managing their finances and offering them help ranging from budgeting to direct financial support, where required guiding them towards dedicated functions such as Barclays Financial Assistance (BFA) or external agencies such as Step Change. Providing knowledge and expertise through our colleagues with the aim to offer our customers more tools and features to educate them on managing their money, including by giving them guidance on how to use our digital platforms via the Digital Eagles, or supporting them in their understanding of financial products, how to build financial plans, and save money through budgeting via our Barclays Money Mentors®. Our early intervention strategies assess all customers who hold a retail product to determine if we think they would benefit from our support. These customer engagement strategies are bank-initiated and largely focused around proactive communications, based on sets of customer behavioural triggers, whilst we also support customers who initiate contact with us. Our primary focus is to support customers whose account behaviours are showing signs of possible early financial difficulty, and look to help customers maintain or regain control of their finances. Access to banking Customers are looking for more convenient, simpler ways to bank that fit their lives, including banking digitally: our mobile app has over 11.0 million active users. We are continuing to help deliver these solutions at pace. Alongside our investment in technology enabling digital customers to access tools and products whenever they need them, we’re aiming to transform the role of physical locations across the UK to ensure non digitally engaged customers can still access banking. We are working with other banks, the Post Office and LINK, to keep Barclays at the heart of the community. We have launched our own initiatives, including a cashback without purchase service and Barclays Local - the largest network of alternative branch formats in the UK, with a presence in over 300 locations. Alongside these changes, we are investing in multi-skilled training for our colleagues so they are better able to serve customers in ways that meet their needs today as well as breaking down internal barriers to enable quicker resolution of customer queries. + Further details on mobile banking vans and how to book an appointment can be found at: events.uk.barclays/barclaysvan/ Economic crime and scams We take our responsibility to protect our customers’ money very seriously and are proud to have one of the lowest scam rates and highest reimbursement rates in the industry. This is due to our continued investment in robust security systems and our established programme to educate customers and prevent them from falling victim to scams. We have a dedicated Fraud and Scams hub on the Barclays website, which hosts a variety of content and resources to help the public learn how to keep themselves safe. Additionally, for each of the 50 million+ payments our UK customers make every month, our fraud detection systems and machine learning models determine in less than a second if it is likely to be a fraudster rather than the customer, or if our customer appears at risk of being scammed. If the transaction seems risky, the customer is presented with additional checks prior to the payment being released. Strategy Climate and sustainability report Risk review Financial review Financial statements Barclays PLC 2023 Annual Report on Form 20-F 170Governance ESG Governance (continued)
We continue to invest in security features that protect against fraud and scams, including ‘App ID’, which allows customers to verify they’re speaking to a Barclays colleague and not an impersonator. We are also part of the ‘Do not originate’ scheme, created in partnership with the telecommunications industry, UK Finance and Ofcom, to prevent our most common inbound helpline phone numbers from being used in a scam. We are proud signatories of the Contingent Reimbursement Model Code, providing measures to help prevent Authorised Push Payments scams taking place and building increased consumer protection standards for customers of signatory firms. We are founding members of Stop Scams UK, a cross-industry group made up of banks, telecoms and tech firms that have come together to seek to put an end to scams by collaborating, sharing best practices and engaging with the government and regulators to make it harder for scammers to operate. We have published a series of policy recommendations to tackle the spread of scams. If you suspect that you have been approached by fraudsters please tell the FCA using the share fraud reporting form at fca.org.uk/scams You can also call the FCA Helpline on 0800 111 6768 or through Action Fraud on 0300 123 2040 + Frontier Economics report on Tacking Fraud and Scams: home.barclays/news/press-releases/2023/08/eight- in-ten-brits-feel-unsafe-on-social-media-due-to- scammers/ Digital accessibility We aim to ensure that our digital services are easy to see, hear, understand and use for all customers, including those with disabilities. Collectively we seek to deliver digital services and workplace tools that promote disability inclusion and meet accessibility requirements set out in the Web Content Accessibility Guidelines (WCAG) 2.2 AA level. + The Barclays Accessibility statement barclays.co.uk/accessibility/statement/ Building financial wellbeing As part of our aim to deliver a world-class money management experience and help money work for our customers, particularly through the cost of living crisis, we are delivering more tools and features to educate them on managing their money. We are providing knowledge and expertise through our colleagues, whether that be helping customers to use our digital platforms via the Digital Eagles, or supporting customers in their understanding of financial products, to build financial plans, and save money through budgeting via our Barclays Money Mentors®. The Barclays Money Management Hub gives us the ability to provide proactive money management information directly to customers, giving them a better grasp on their spending behaviours and steps they can take to improve their financial wellbeing and provide customers greater control over their finances. We also have a range of early intervention strategies which aim to support customers whose account behaviours may be showing signs of lacking financial resilience. These strategies largely focus on pro- active communication with the customer, based on sets of customer behavioural triggers, and look to support customers to help them maintain or regain control of their finances. Where customers engage with these contact strategies, our BFA colleagues provide broad money management advice and, where appropriate, may suggest a range of solutions to manage their financial situation. This suite of solutions includes forbearance and non-forbearance options. Gambling Barclays understands that gambling and financial difficulty can often go hand in hand and that customers may sometimes find it hard to ask for help. We have dedicated training available for colleagues to help them understand and support customers impacted by problematic gambling. Our Specialist Colleagues are available to help customers in complex situations and sign post where needed to external support charities and organisations. + Further details can be found at: barclays.co.uk/gambling-support/ Domestic abuse To support customers impacted by domestic abuse, we have partnered with Refuge, a national charity providing specialist support for women and their children experiencing domestic abuse. This enables us to direct those impacted by domestic abuse to expert advice and assist survivors with the opening of bank accounts and gaining access to banking services in situations where they may not have the requisite documentation. In 2023, the Barclays Refuge Partnership was recognised at the Business Charity Awards for Addressing Economic and Tech Abuse. We are a committed signatory to the revised UK Finance Domestic Abuse Code of Practice, which sets out how participating banks and building societies should support customers who are victims and survivors of economic or financial abuse. Homelessness We continue to support those with limited documentation such as homeless people to open a basic current account. Barclays has partnered with charities to help those most impacted by the current environment through dedicated financial inclusion support. Bereavement We continue to prioritise making this extremely difficult time in people’s lives a little easier. Our programme of work to enhance the customer experience across all of our channels, including physical locations and online remains front of mind. Highlights this year, include: delivery of an automated, online bereavement notification and document upload capability and a new email confirmation, providing real time acknowledgment of the bereavement notification. We’ve also made it easier for colleagues to help customers needing probate support with a referral to Co-op Legal Services, who we have a partnership with. Further enhancements are planned for 2024. + Further details can be found at: barclays.co.uk/what-to-do-when-someone-dies/ notify-us/ Authorised users Since launching Authorised User in 2022, we’ve continued to give customers the ability to effectively manage their finances with support of other trusted persons. In October 2023, we’ve made this even easier by removing the monthly service fee for customers to add someone they trust to spend on their account. + Further details can be found at: barclays.co.uk/ways-to-bank/authorised-users/ manage-account/ Strategy Climate and sustainability report Risk review Financial review Financial statements Barclays PLC 2023 Annual Report on Form 20-F 171Governance ESG Governance (continued)
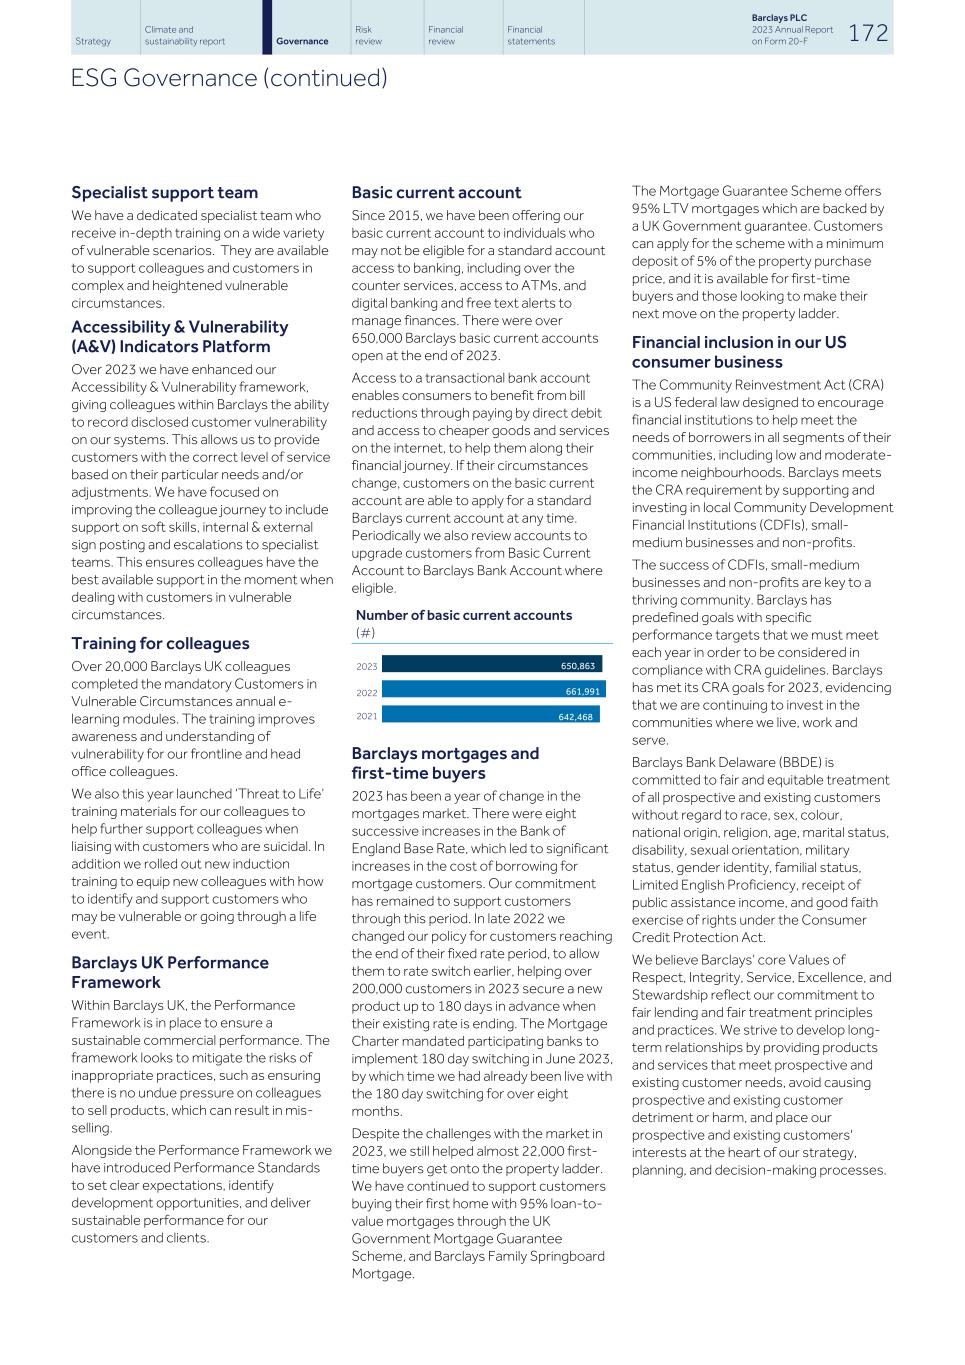
Specialist support team We have a dedicated specialist team who receive in-depth training on a wide variety of vulnerable scenarios. They are available to support colleagues and customers in complex and heightened vulnerable circumstances. Accessibility & Vulnerability (A&V) Indicators Platform Over 2023 we have enhanced our Accessibility & Vulnerability framework, giving colleagues within Barclays the ability to record disclosed customer vulnerability on our systems. This allows us to provide customers with the correct level of service based on their particular needs and/or adjustments. We have focused on improving the colleague journey to include support on soft skills, internal & external sign posting and escalations to specialist teams. This ensures colleagues have the best available support in the moment when dealing with customers in vulnerable circumstances. Training for colleagues Over 20,000 Barclays UK colleagues completed the mandatory Customers in Vulnerable Circumstances annual e- learning modules. The training improves awareness and understanding of vulnerability for our frontline and head office colleagues. We also this year launched ‘Threat to Life’ training materials for our colleagues to help further support colleagues when liaising with customers who are suicidal. In addition we rolled out new induction training to equip new colleagues with how to identify and support customers who may be vulnerable or going through a life event. Barclays UK Performance Framework Within Barclays UK, the Performance Framework is in place to ensure a sustainable commercial performance. The framework looks to mitigate the risks of inappropriate practices, such as ensuring there is no undue pressure on colleagues to sell products, which can result in mis- selling. Alongside the Performance Framework we have introduced Performance Standards to set clear expectations, identify development opportunities, and deliver sustainable performance for our customers and clients. Basic current account Since 2015, we have been offering our basic current account to individuals who may not be eligible for a standard account access to banking, including over the counter services, access to ATMs, and digital banking and free text alerts to manage finances. There were over 650,000 Barclays basic current accounts open at the end of 2023. Access to a transactional bank account enables consumers to benefit from bill reductions through paying by direct debit and access to cheaper goods and services on the internet, to help them along their financial journey. If their circumstances change, customers on the basic current account are able to apply for a standard Barclays current account at any time. Periodically we also review accounts to upgrade customers from Basic Current Account to Barclays Bank Account where eligible. Number of basic current accounts (#) 2023 2022 2021 650,863 661,991 642,468 Barclays mortgages and first-time buyers 2023 has been a year of change in the mortgages market. There were eight successive increases in the Bank of England Base Rate, which led to significant increases in the cost of borrowing for mortgage customers. Our commitment has remained to support customers through this period. In late 2022 we changed our policy for customers reaching the end of their fixed rate period, to allow them to rate switch earlier, helping over 200,000 customers in 2023 secure a new product up to 180 days in advance when their existing rate is ending. The Mortgage Charter mandated participating banks to implement 180 day switching in June 2023, by which time we had already been live with the 180 day switching for over eight months. Despite the challenges with the market in 2023, we still helped almost 22,000 first- time buyers get onto the property ladder. We have continued to support customers buying their first home with 95% loan-to- value mortgages through the UK Government Mortgage Guarantee Scheme, and Barclays Family Springboard Mortgage. The Mortgage Guarantee Scheme offers 95% LTV mortgages which are backed by a UK Government guarantee. Customers can apply for the scheme with a minimum deposit of 5% of the property purchase price, and it is available for first-time buyers and those looking to make their next move on the property ladder. Financial inclusion in our US consumer business The Community Reinvestment Act (CRA) is a US federal law designed to encourage financial institutions to help meet the needs of borrowers in all segments of their communities, including low and moderate- income neighbourhoods. Barclays meets the CRA requirement by supporting and investing in local Community Development Financial Institutions (CDFIs), small- medium businesses and non-profits. The success of CDFIs, small-medium businesses and non-profits are key to a thriving community. Barclays has predefined goals with specific performance targets that we must meet each year in order to be considered in compliance with CRA guidelines. Barclays has met its CRA goals for 2023, evidencing that we are continuing to invest in the communities where we live, work and serve. Barclays Bank Delaware (BBDE) is committed to fair and equitable treatment of all prospective and existing customers without regard to race, sex, colour, national origin, religion, age, marital status, disability, sexual orientation, military status, gender identity, familial status, Limited English Proficiency, receipt of public assistance income, and good faith exercise of rights under the Consumer Credit Protection Act. We believe Barclays’ core Values of Respect, Integrity, Service, Excellence, and Stewardship reflect our commitment to fair lending and fair treatment principles and practices. We strive to develop long- term relationships by providing products and services that meet prospective and existing customer needs, avoid causing prospective and existing customer detriment or harm, and place our prospective and existing customers' interests at the heart of our strategy, planning, and decision-making processes. Strategy Climate and sustainability report Risk review Financial review Financial statements Barclays PLC 2023 Annual Report on Form 20-F 172Governance ESG Governance (continued)
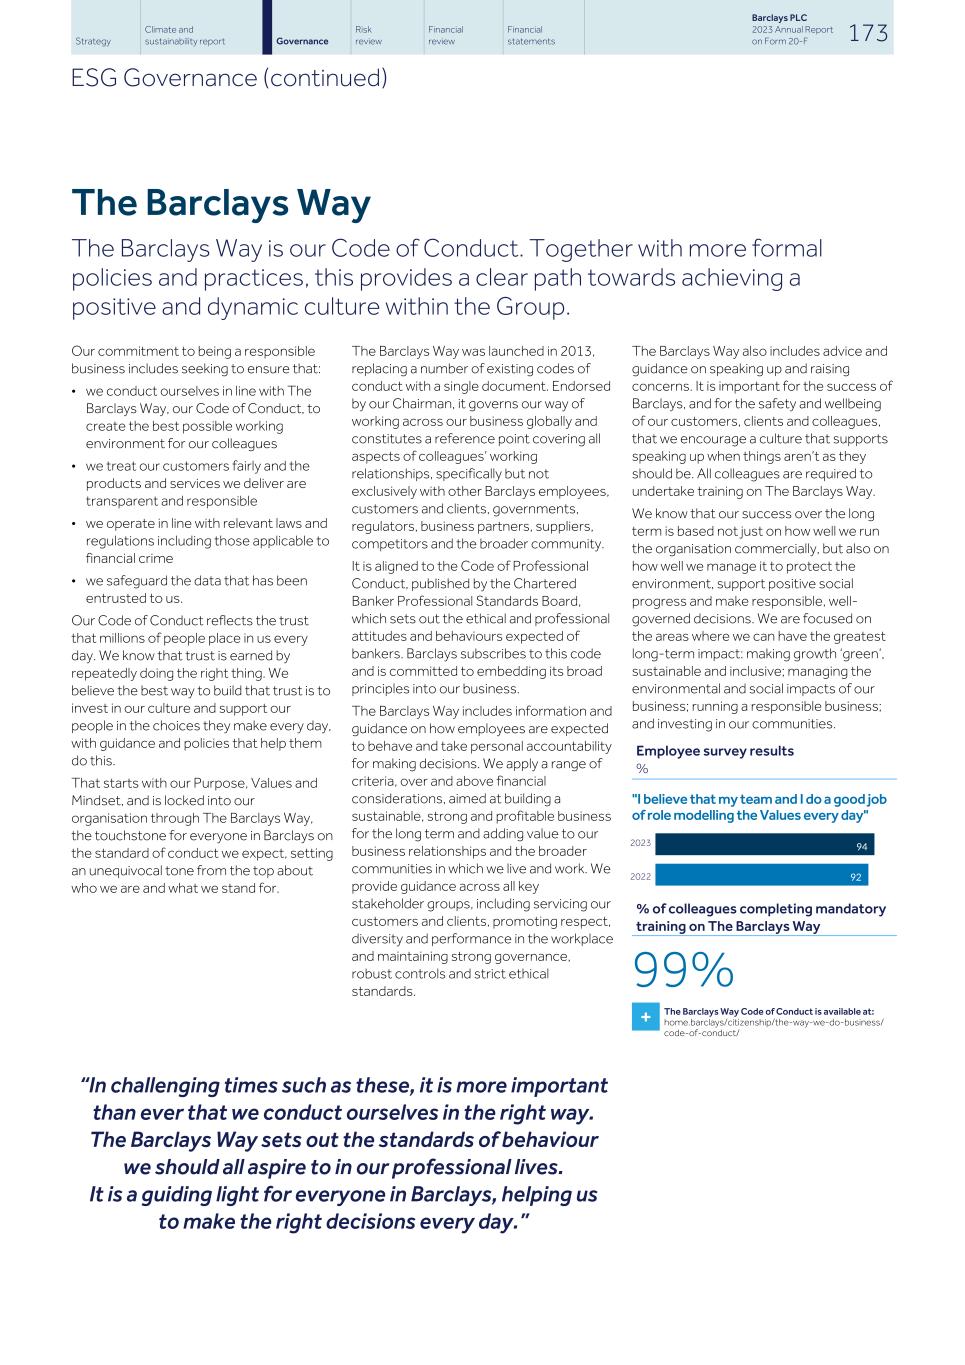
The Barclays Way The Barclays Way is our Code of Conduct. Together with more formal policies and practices, this provides a clear path towards achieving a positive and dynamic culture within the Group. Our commitment to being a responsible business includes seeking to ensure that: • we conduct ourselves in line with The Barclays Way, our Code of Conduct, to create the best possible working environment for our colleagues • we treat our customers fairly and the products and services we deliver are transparent and responsible • we operate in line with relevant laws and regulations including those applicable to financial crime • we safeguard the data that has been entrusted to us. Our Code of Conduct reflects the trust that millions of people place in us every day. We know that trust is earned by repeatedly doing the right thing. We believe the best way to build that trust is to invest in our culture and support our people in the choices they make every day, with guidance and policies that help them do this. That starts with our Purpose, Values and Mindset, and is locked into our organisation through The Barclays Way, the touchstone for everyone in Barclays on the standard of conduct we expect, setting an unequivocal tone from the top about who we are and what we stand for. “In challenging times such as these, it is more important than ever that we conduct ourselves in the right way. The Barclays Way sets out the standards of behaviour we should all aspire to in our professional lives. It is a guiding light for everyone in Barclays, helping us to make the right decisions every day.” The Barclays Way was launched in 2013, replacing a number of existing codes of conduct with a single document. Endorsed by our Chairman, it governs our way of working across our business globally and constitutes a reference point covering all aspects of colleagues’ working relationships, specifically but not exclusively with other Barclays employees, customers and clients, governments, regulators, business partners, suppliers, competitors and the broader community. It is aligned to the Code of Professional Conduct, published by the Chartered Banker Professional Standards Board, which sets out the ethical and professional attitudes and behaviours expected of bankers. Barclays subscribes to this code and is committed to embedding its broad principles into our business. The Barclays Way includes information and guidance on how employees are expected to behave and take personal accountability for making decisions. We apply a range of criteria, over and above financial considerations, aimed at building a sustainable, strong and profitable business for the long term and adding value to our business relationships and the broader communities in which we live and work. We provide guidance across all key stakeholder groups, including servicing our customers and clients, promoting respect, diversity and performance in the workplace and maintaining strong governance, robust controls and strict ethical standards. The Barclays Way also includes advice and guidance on speaking up and raising concerns. It is important for the success of Barclays, and for the safety and wellbeing of our customers, clients and colleagues, that we encourage a culture that supports speaking up when things aren’t as they should be. All colleagues are required to undertake training on The Barclays Way. We know that our success over the long term is based not just on how well we run the organisation commercially, but also on how well we manage it to protect the environment, support positive social progress and make responsible, well- governed decisions. We are focused on the areas where we can have the greatest long-term impact: making growth ‘green’, sustainable and inclusive; managing the environmental and social impacts of our business; running a responsible business; and investing in our communities. Employee survey results % "I believe that my team and I do a good job of role modelling the Values every day" 2023 2022 94 92 % of colleagues completing mandatory training on The Barclays Way 99% + The Barclays Way Code of Conduct is available at: home.barclays/citizenship/the-way-we-do-business/ code-of-conduct/ Strategy Climate and sustainability report Risk review Financial review Financial statements Barclays PLC 2023 Annual Report on Form 20-F 173Governance ESG Governance (continued)
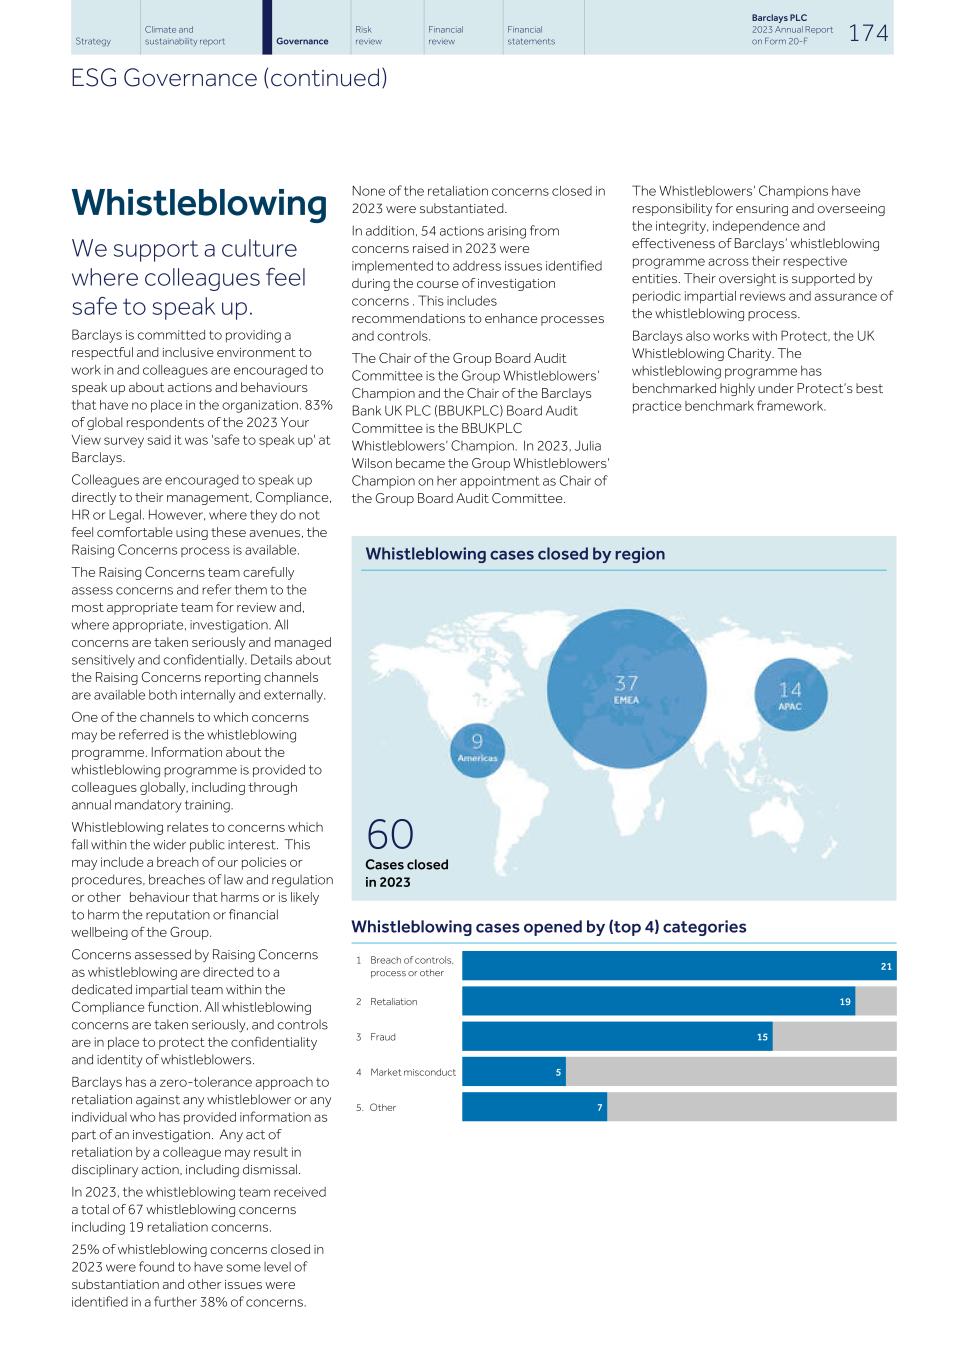
Whistleblowing We support a culture where colleagues feel safe to speak up. Barclays is committed to providing a respectful and inclusive environment to work in and colleagues are encouraged to speak up about actions and behaviours that have no place in the organization. 83% of global respondents of the 2023 Your View survey said it was 'safe to speak up' at Barclays. Colleagues are encouraged to speak up directly to their management, Compliance, HR or Legal. However, where they do not feel comfortable using these avenues, the Raising Concerns process is available. The Raising Concerns team carefully assess concerns and refer them to the most appropriate team for review and, where appropriate, investigation. All concerns are taken seriously and managed sensitively and confidentially. Details about the Raising Concerns reporting channels are available both internally and externally. One of the channels to which concerns may be referred is the whistleblowing programme. Information about the whistleblowing programme is provided to colleagues globally, including through annual mandatory training. Whistleblowing relates to concerns which fall within the wider public interest. This may include a breach of our policies or procedures, breaches of law and regulation or other behaviour that harms or is likely to harm the reputation or financial wellbeing of the Group. Concerns assessed by Raising Concerns as whistleblowing are directed to a dedicated impartial team within the Compliance function. All whistleblowing concerns are taken seriously, and controls are in place to protect the confidentiality and identity of whistleblowers. Barclays has a zero-tolerance approach to retaliation against any whistleblower or any individual who has provided information as part of an investigation. Any act of retaliation by a colleague may result in disciplinary action, including dismissal. In 2023, the whistleblowing team received a total of 67 whistleblowing concerns including 19 retaliation concerns. 25% of whistleblowing concerns closed in 2023 were found to have some level of substantiation and other issues were identified in a further 38% of concerns. None of the retaliation concerns closed in 2023 were substantiated. In addition, 54 actions arising from concerns raised in 2023 were implemented to address issues identified during the course of investigation concerns . This includes recommendations to enhance processes and controls. The Chair of the Group Board Audit Committee is the Group Whistleblowers’ Champion and the Chair of the Barclays Bank UK PLC (BBUKPLC) Board Audit Committee is the BBUKPLC Whistleblowers’ Champion. In 2023, Julia Wilson became the Group Whistleblowers’ Champion on her appointment as Chair of the Group Board Audit Committee. Whistleblowing cases closed by region Whistleblowing cases opened by (top 4) categories 1 Breach of controls, process or other 21 2 Retaliation 19 3 Fraud 15 4 Market misconduct 5 5. Other 7 The Whistleblowers’ Champions have responsibility for ensuring and overseeing the integrity, independence and effectiveness of Barclays’ whistleblowing programme across their respective entities. Their oversight is supported by periodic impartial reviews and assurance of the whistleblowing process. Barclays also works with Protect, the UK Whistleblowing Charity. The whistleblowing programme has benchmarked highly under Protect’s best practice benchmark framework. Strategy Climate and sustainability report Risk review Financial review Financial statements Barclays PLC 2023 Annual Report on Form 20-F 174Governance ESG Governance (continued) 60 Cases closed in 2023
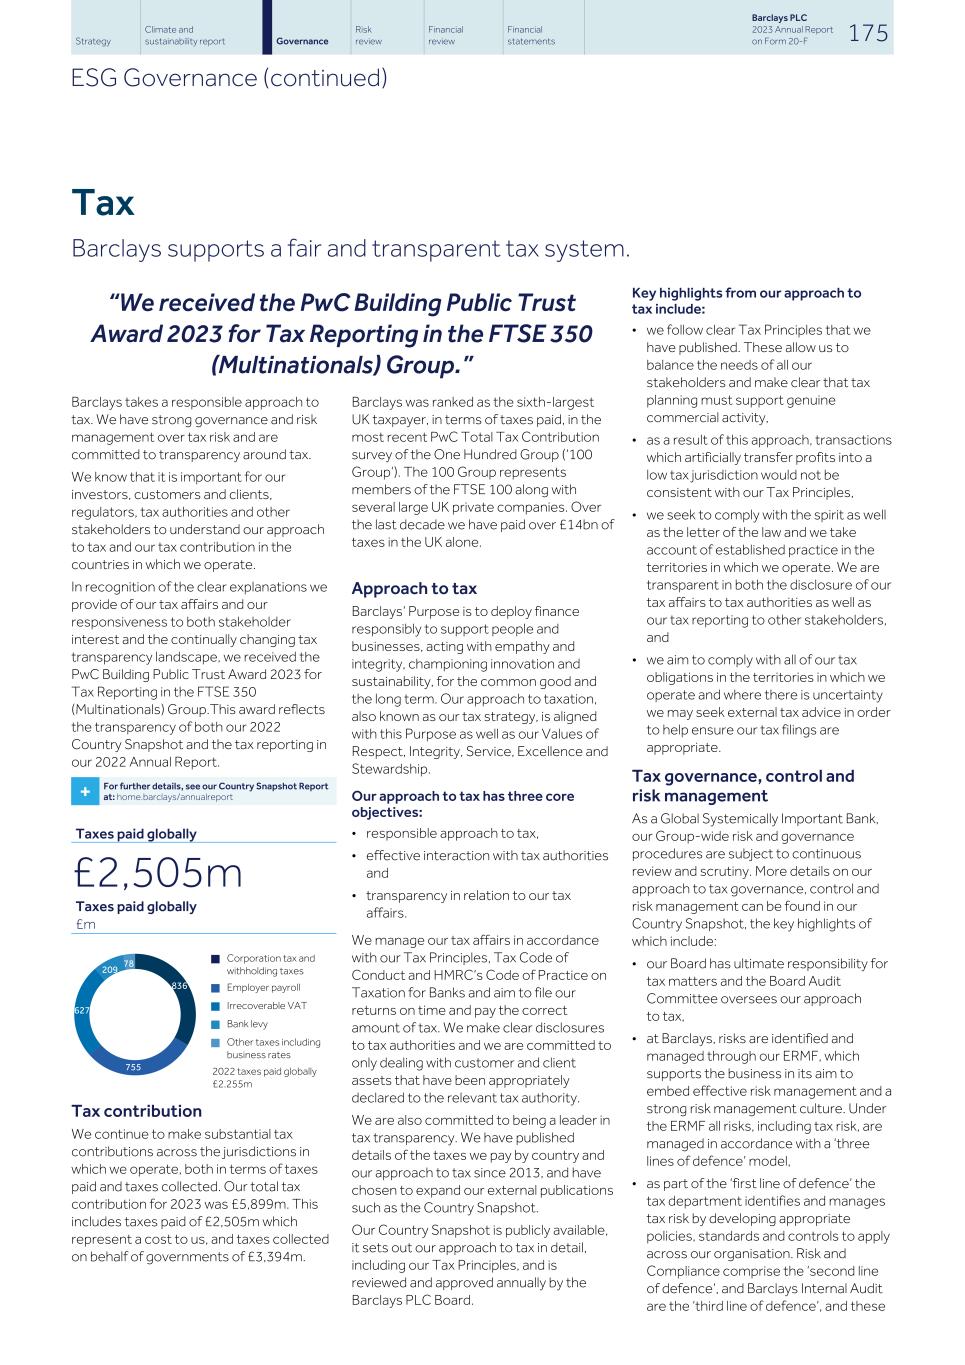
Tax Barclays supports a fair and transparent tax system. “We received the PwC Building Public Trust Award 2023 for Tax Reporting in the FTSE 350 (Multinationals) Group.” Barclays takes a responsible approach to tax. We have strong governance and risk management over tax risk and are committed to transparency around tax. We know that it is important for our investors, customers and clients, regulators, tax authorities and other stakeholders to understand our approach to tax and our tax contribution in the countries in which we operate. In recognition of the clear explanations we provide of our tax affairs and our responsiveness to both stakeholder interest and the continually changing tax transparency landscape, we received the PwC Building Public Trust Award 2023 for Tax Reporting in the FTSE 350 (Multinationals) Group.This award reflects the transparency of both our 2022 Country Snapshot and the tax reporting in our 2022 Annual Report. + For further details, see our Country Snapshot Report at: home.barclays/annualreport Taxes paid globally £2,505m Taxes paid globally £m 836 755 627 209 78 n Corporation tax and withholding taxes n Employer payroll taxes n Irrecoverable VAT n Bank levy n Other taxes including business rates 2022 taxes paid globally £2,255m Tax contribution We continue to make substantial tax contributions across the jurisdictions in which we operate, both in terms of taxes paid and taxes collected. Our total tax contribution for 2023 was £5,899m. This includes taxes paid of £2,505m which represent a cost to us, and taxes collected on behalf of governments of £3,394m. Barclays was ranked as the sixth-largest UK taxpayer, in terms of taxes paid, in the most recent PwC Total Tax Contribution survey of the One Hundred Group (‘100 Group’). The 100 Group represents members of the FTSE 100 along with several large UK private companies. Over the last decade we have paid over £14bn of taxes in the UK alone. Approach to tax Barclays’ Purpose is to deploy finance responsibly to support people and businesses, acting with empathy and integrity, championing innovation and sustainability, for the common good and the long term. Our approach to taxation, also known as our tax strategy, is aligned with this Purpose as well as our Values of Respect, Integrity, Service, Excellence and Stewardship. Our approach to tax has three core objectives: • responsible approach to tax, • effective interaction with tax authorities and • transparency in relation to our tax affairs. We manage our tax affairs in accordance with our Tax Principles, Tax Code of Conduct and HMRC’s Code of Practice on Taxation for Banks and aim to file our returns on time and pay the correct amount of tax. We make clear disclosures to tax authorities and we are committed to only dealing with customer and client assets that have been appropriately declared to the relevant tax authority. We are also committed to being a leader in tax transparency. We have published details of the taxes we pay by country and our approach to tax since 2013, and have chosen to expand our external publications such as the Country Snapshot. Our Country Snapshot is publicly available, it sets out our approach to tax in detail, including our Tax Principles, and is reviewed and approved annually by the Barclays PLC Board. Key highlights from our approach to tax include: • we follow clear Tax Principles that we have published. These allow us to balance the needs of all our stakeholders and make clear that tax planning must support genuine commercial activity, • as a result of this approach, transactions which artificially transfer profits into a low tax jurisdiction would not be consistent with our Tax Principles, • we seek to comply with the spirit as well as the letter of the law and we take account of established practice in the territories in which we operate. We are transparent in both the disclosure of our tax affairs to tax authorities as well as our tax reporting to other stakeholders, and • we aim to comply with all of our tax obligations in the territories in which we operate and where there is uncertainty we may seek external tax advice in order to help ensure our tax filings are appropriate. Tax governance, control and risk management As a Global Systemically Important Bank, our Group-wide risk and governance procedures are subject to continuous review and scrutiny. More details on our approach to tax governance, control and risk management can be found in our Country Snapshot, the key highlights of which include: • our Board has ultimate responsibility for tax matters and the Board Audit Committee oversees our approach to tax, • at Barclays, risks are identified and managed through our ERMF, which supports the business in its aim to embed effective risk management and a strong risk management culture. Under the ERMF all risks, including tax risk, are managed in accordance with a ‘three lines of defence’ model, • as part of the ‘first line of defence’ the tax department identifies and manages tax risk by developing appropriate policies, standards and controls to apply across our organisation. Risk and Compliance comprise the ‘second line of defence’, and Barclays Internal Audit are the ‘third line of defence’, and these Strategy Climate and sustainability report Risk review Financial review Financial statements Barclays PLC 2023 Annual Report on Form 20-F 175Governance ESG Governance (continued)
functions review, challenge and provide assurance to the Board in relation to the effectiveness of governance, risk management and controls including those relating to tax risk, • we are subject to the Sarbanes-Oxley Act control requirements in relation to financial statements disclosures including those related to tax, • our tax department comprises appropriately qualified in-house professionals who are subject to clear standards including that they uphold our Tax Principles and follow our Tax Code of Conduct, which is an integral part of how we operate, • our governance requires that suitably qualified people are involved in decisions related to tax, tax is fully taken into account when making business decisions and tax risk is identified, assessed and kept under review, and • we have no tolerance for tax evasion and have well-established mechanisms for raising concerns about unethical or unlawful behaviour through our ‘Whistleblowing’ policy, which applies equally to tax matters. Stakeholder engagement and management of concerns related to tax: Our reputation is very important to us and we take our external stakeholders’ expectations into account when we make decisions in relation to our tax affairs. More details on our approach to stakeholder engagement and managing stakeholder concerns related to tax can be found in our Country Snapshot, and key highlights include: • we believe that it is important to be transparent in the disclosure of our tax affairs both to tax authorities and stakeholders more broadly, • our dealings with tax authorities are handled proactively, constructively and transparently, in real-time where possible, • we recognise that early resolution of our tax affairs is in everyone’s interest. We have ongoing engagement with tax authorities to discuss their inquiries and material issues in relation to our tax affairs, and we respond to feedback from tax authorities, • where we face significant uncertainty in relation to the application of tax law, we may seek to agree with the tax authority how the tax law should apply, • where relevant we seek to reach agreement with tax authorities using mechanisms available to all taxpayers including Advance Pricing Agreements and Mutual Agreement Procedures to clearly establish in which territories our profits should be taxed, • we engage with governments, tax authorities and NGOs through public consultations and other discussions to assist with the development of tax policy and the improvement of tax systems, and maintain our transparency with these stakeholders, and • we cooperate with tax authorities globally to reduce the scope for individuals and companies to evade tax, and have met all of our 2023 information reporting obligations under the Common Reporting Standard and Foreign Account Tax Compliance Act. + The BPLC Board Audit Committee is responsible for considering the Group's tax strategy and overseeing compliance with the Group's Tax Principles. Please refer to page 96 for details of BPLC Board Audit Committee oversight of tax related matters Strategy Climate and sustainability report Risk review Financial review Financial statements Barclays PLC 2023 Annual Report on Form 20-F 176Governance ESG Governance (continued)
Financial crime Barclays recognises that economic crimes have an adverse effect on individuals and communities wherever they occur. Endemic economic crime can threaten laws, democratic processes and basic human freedoms, impoverishing states and distorting free trade and competition. Barclays recognises that financial crime has an adverse effect on individuals and communities wherever it occurs. Endemic financial crime can threaten laws, democratic processes, and basic human freedoms, impoverishing states and distorting free trade and competition. Barclays is committed to conducting its global activities with integrity and respecting its regulatory, ethical, and social responsibilities to: a. Protect employees, customers, and others with whom we do business, and a. Support governments, regulators, and law enforcement in wider financial crime prevention. Barclays does not tolerate any deliberate breach of financial crime laws and regulations that apply to our business and the transactions we undertake. We have adopted a holistic approach to financial crime risk management and have one group-wide Financial Crime Policy. The Financial Crime Policy applies to all businesses, legal entities and employees. It is designed to ensure that Barclays has adequate systems, procedures, and controls in place to manage the risk of being used to facilitate financial crime and to manage the legal, regulatory, and reputational risks associated with financial crime. Employees are made aware that failure to comply with the Financial Crime Policy may give rise to disciplinary action, up to and including dismissal. The Financial Crime Policy sets control obligations to manage four key risks: anti- bribery & corruption (ABC); anti-money laundering & counter-terrorist financing (AML); anti-tax evasion facilitation (ATEF) and sanctions, including proliferation financing. This combined approach allows us to identify and manage relevant synergies and connections between these risks. Anti-Bribery & Corruption Bribery and corruption constitutes of: a. improperly obtaining or retaining business; and/or b. improperly securing a business or personal advantage; and/or c. inducing another person to perform their role in breach of an expectation of good faith, impartiality or trust. Barclays and its employees are prohibited from engaging in or facilitating any form of bribery and corruption (giving and receiving, directly or indirectly). The Financial Crime Policy contains the minimum risk-based control requirements that all our businesses, legal entities and employees must follow. The Financial Crime Policy is designed to ensure that Barclays’ employees know how to identify and manage the legal, regulatory and reputational risks associated with all forms of bribery and corruption. Anti-Money Laundering Money laundering has been identified as major threats to the international financial services community and therefore to Barclays. The Barclays Financial Crime Policy includes the requirement for Barclays businesses and legal entities to have adequate systems, procedures, and controls in place to manage the risk of Barclays being used to facilitate money laundering. The requirements of UK legislation apply to Barclays globally. As a transatlantic bank, the Financial Crime Policy also takes into account EU and US anti-money laundering requirements, as well as guidance issued by bodies such as the Wolfsberg Group and the European Banking Authority. Anti-Tax Evasion Facilitation Tax evasion is a financial crime and a predicate offence to money laundering in the UK and many other countries in which we operate. Barclays takes a zero- tolerance approach to deliberate facilitation of tax evasion in any country and has procedures in place to prevent it. We also expect the same from our employees and third parties providing services for or on our behalf. Barclays is committed to: a. dealing only with customers who have appropriately declared their assets to the relevant tax authorities; and b. preventing tax evasion facilitation by our employees or third parties acting for or on our behalf. Sanctions Sanctions are restrictions on activity with targeted countries, regions, governments, entities, individuals and industries that are imposed by bodies such as the European Union, the United Nations, groups of countries, or individual countries, such as the United Kingdom and the United States. In order to protect its reputation and other legitimate business interests, in certain circumstances Barclays sanctions risk appetite may be stricter than its legal obligations. The Financial Crime Policy is designed to ensure that Barclays and its employees know how to identify and manage the risks associated with sanctions, including the risk that activity is undertaken through Barclays in breach of sanctions regulations. + For further details of the Barclays approach to Financial Crime compliance and prevention, please see our Financial Crime Compliance Statement in the ESG Resource Hub at home.barclays/esg-resource- hub/reporting-and-disclosures/ Strategy Climate and sustainability report Risk review Financial review Financial statements Barclays PLC 2023 Annual Report on Form 20-F 177Governance ESG Governance (continued)
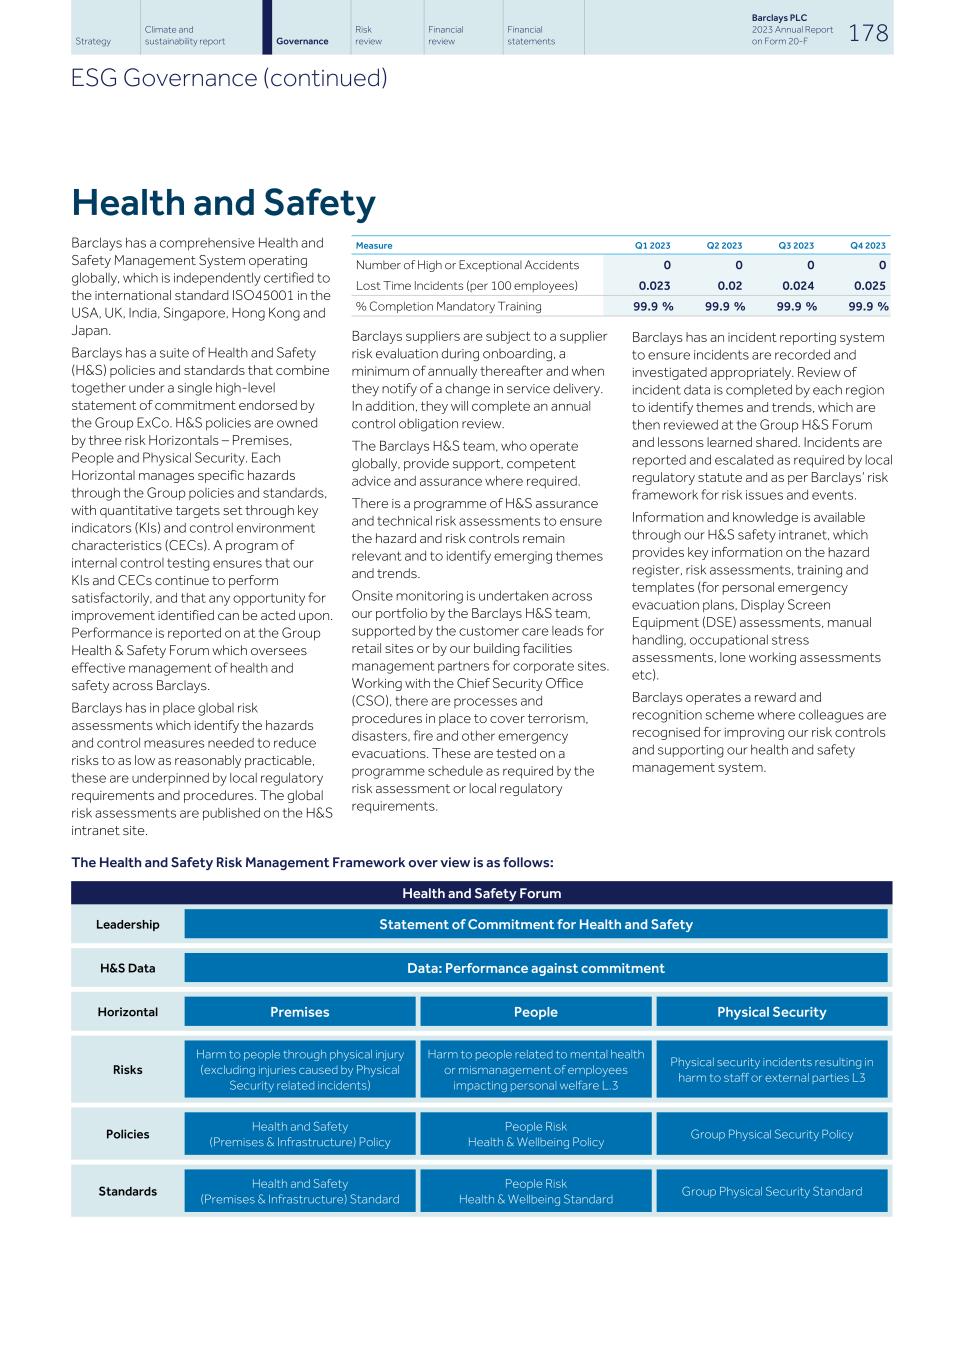
Health and Safety Barclays has a comprehensive Health and Safety Management System operating globally, which is independently certified to the international standard ISO45001 in the USA, UK, India, Singapore, Hong Kong and Japan. Barclays has a suite of Health and Safety (H&S) policies and standards that combine together under a single high-level statement of commitment endorsed by the Group ExCo. H&S policies are owned by three risk Horizontals – Premises, People and Physical Security. Each Horizontal manages specific hazards through the Group policies and standards, with quantitative targets set through key indicators (KIs) and control environment characteristics (CECs). A program of internal control testing ensures that our KIs and CECs continue to perform satisfactorily, and that any opportunity for improvement identified can be acted upon. Performance is reported on at the Group Health & Safety Forum which oversees effective management of health and safety across Barclays. Barclays has in place global risk assessments which identify the hazards and control measures needed to reduce risks to as low as reasonably practicable, these are underpinned by local regulatory requirements and procedures. The global risk assessments are published on the H&S intranet site. Measure Q1 2023 Q2 2023 Q3 2023 Q4 2023 Number of High or Exceptional Accidents 0 0 0 0 Lost Time Incidents (per 100 employees) 0.023 0.02 0.024 0.025 % Completion Mandatory Training 99.9 % 99.9 % 99.9 % 99.9 % Barclays suppliers are subject to a supplier risk evaluation during onboarding, a minimum of annually thereafter and when they notify of a change in service delivery. In addition, they will complete an annual control obligation review. The Barclays H&S team, who operate globally, provide support, competent advice and assurance where required. There is a programme of H&S assurance and technical risk assessments to ensure the hazard and risk controls remain relevant and to identify emerging themes and trends. Onsite monitoring is undertaken across our portfolio by the Barclays H&S team, supported by the customer care leads for retail sites or by our building facilities management partners for corporate sites. Working with the Chief Security Office (CSO), there are processes and procedures in place to cover terrorism, disasters, fire and other emergency evacuations. These are tested on a programme schedule as required by the risk assessment or local regulatory requirements. Barclays has an incident reporting system to ensure incidents are recorded and investigated appropriately. Review of incident data is completed by each region to identify themes and trends, which are then reviewed at the Group H&S Forum and lessons learned shared. Incidents are reported and escalated as required by local regulatory statute and as per Barclays’ risk framework for risk issues and events. Information and knowledge is available through our H&S safety intranet, which provides key information on the hazard register, risk assessments, training and templates (for personal emergency evacuation plans, Display Screen Equipment (DSE) assessments, manual handling, occupational stress assessments, lone working assessments etc). Barclays operates a reward and recognition scheme where colleagues are recognised for improving our risk controls and supporting our health and safety management system. The Health and Safety Risk Management Framework over view is as follows: Health and Safety Forum Leadership Statement of Commitment for Health and Safety H&S Data Data: Performance against commitment Horizontal Premises People Physical Security Risks Harm to people through physical injury (excluding injuries caused by Physical Security related incidents) Harm to people related to mental health or mismanagement of employees impacting personal welfare L.3 Physical security incidents resulting in harm to staff or external parties L3 Policies Health and Safety (Premises & Infrastructure) Policy People Risk Health & Wellbeing Policy Group Physical Security Policy Standards Health and Safety (Premises & Infrastructure) Standard People Risk Health & Wellbeing Standard Group Physical Security Standard Strategy Climate and sustainability report Risk review Financial review Financial statements Barclays PLC 2023 Annual Report on Form 20-F 178Governance ESG Governance (continued)
Managing data privacy, security and resilience We have strict policies to protect privacy and keep data secure. Data privacy Most of the jurisdictions in which Barclays operates have privacy and data protection laws in effect. While these may vary in detail, generally they reflect internationally recognised privacy principles found in the UN’s Universal Declaration of Human Rights, the European Convention on Human Rights and the European Union’s Charter of Fundamental Rights. We strive to operate in accordance with these standards and recognise that respect for privacy rights is a key element of good corporate governance and social responsibility. We strive to be transparent about our use of personal information when delivering our products and services and acknowledge the responsibility we have for safeguarding privacy. As Barclays increasingly adopts digital solutions to deliver next-generation consumer financial services, we appreciate our clients, customers and others may wish to understand how this may impact the use of their personal information. A globally applicable Barclays Data Privacy Standard sets out what is expected of all Barclays businesses and functions when collecting, using and sharing personal information. To promote clear accountability, the Standard includes the requirement for each business to appoint an accountable executive who has ultimate responsibility for the processing of personal data within that business. An agreed assurance programme measures compliance with the Data Privacy Standard. Barclays colleagues must complete annual privacy training which is reviewed and refreshed each year, with additional tailored training provided as necessary. The Group Data Protection Officer (DPO) reports on data privacy issues to the highest level of management. Through customer and employee privacy notices, we endeavour to explain clearly and openly how and why we use personal information and the legal grounds we rely on. When we receive complaints we seek to address them fairly. Several jurisdictions also provide individuals with specific rights, such as the right to have access to or request deletion of their personal information. Barclays provides a public mailbox and secure channels via its website to enable individuals to make their privacy requests and receive responses from a dedicated team. Barclays requires its suppliers to comply with data protection and privacy laws, regulations and standards relevant to the jurisdictions in which they operate and relevant to any transferred personal data. Our requirements are set out and managed through the Barclays Supplier Control Obligations, available online, which look to provide assurance that all new and existing suppliers commit to ensuring personal data shared with them is safeguarded and respected throughout the supply chain. Data security Barclays deploys automated controls to protect its sensitive information and the data that has been entrusted to us by customers and clients, in line with our standards, taking into account findings from internal and external reviews of our controls. As Barclays accelerates the migration of digital services to the cloud, we apply the same design principles that underpin our existing control environment. We have controls and monitoring in place designed to secure cloud-hosted data and maintain its integrity. Barclays seeks to protect the security of data we share with third parties, including by conducting remote and on-site inspections with certain suppliers to review their controls against contractual obligations and industry standards. A Third Party Service Provider Framework is in place which sets out control requirements for business units to manage the operational, reputational, conduct and legal risks to Barclays through its supply chain. As we have transitioned to a more hybrid working model, we have educated colleagues on cybersecurity risks in order to help minimise the risk of data exploitation or leakage. Data resilience Barclays' CSO operates key controls that mitigate cybersecurity-related risks. CSO focuses on understanding internal and external threats and delivering on our capabilities to counteract them. As part of our efforts to continuously review and improve our response and recovery plans in preparation for evolving threats, Barclays works with industry bodies to learn from risk events in other organisations. Our teams use intelligence to create plausible cybersecurity and data compromise scenarios which we simulate to help us focus on continuous improvement. Strategy Climate and sustainability report Risk review Financial review Financial statements Barclays PLC 2023 Annual Report on Form 20-F 179Governance ESG Governance (continued)
Operational resilience Customers and clients have increased expectations for us to be ‘Always On’, and the interconnectivity of the financial sector means the stability and resilience of our systems, workforce and the continued provision of third-party services, all of which have a direct impact on the quality of our service. Resilience and Security is a focus for the board. Barclays continues to invest in a multi-year resilience programme which is focused on our ability to recover from ‘severe but plausible’ scenarios which could cause detriment to our customers and clients and the broader financial market. To enable this, we define Group- wide business services and their interdependencies across the Group, including technology, third-party services and our workforce, and develop the recovery plans and business response plans for disruption events, such as cyber or data integrity disruptions. We review and validate these recovery plans through regular testing which supports our aim to reduce the volume and impact of operational incidents year on year. We also conduct regular assurance on third parties to assess their capability, as defined by our contractual Information & Cyber Security Supplier Control Obligations. Resilience and security is the responsibility of everyone within the Group. All permanent employees are required to complete mandatory training on these topics at regular intervals across the year. + Please refer to pages 105 for details of Barclays PLC Board Risk Committee oversight relating to operational resilience. Please refer to the 'Material existing and emerging risks' section in our Risk review on pages 194 to 195 for further details on cyberattacks, data management and information protection. Please refer to the 'Supervision and regulation' section in our Risk review on pages 297 for further details on our regulatory approach to managing such risks. Chief Security Office Barclays' CSO exists to keep the bank, its customers, clients, and colleagues safe and secure, and to maintain the resilience of our operations. CSO supports Barclays' business to operate in a protected and secure environment, and actively promotes the culture that security is everyone's responsibility. The Chief Security Officer for the Group heads Barclays' CSO and reports up through the Chief Operating Officer, who sits on the Group Executive Committee. The Group CISO reports directly to the Chief Security Officer and is supported by a team of CISOs for individual business units and jurisdictions, as well as other teams of cybersecurity experts and analysts. Barclays' Group Chief Security Officer combines 10 years of law enforcement experience with over 20 years of experience serving in senior leadership roles managing security at global financial institutions. The Group CISO and supporting leadership team collectively have advanced degrees and senior level experience managing security risks in a variety of sectors, including those that represent critical national infrastructure, such as telecommunications and peer financial institutions. They are supported by analysts and subject matter experts in a variety of specialisations, such as intelligence, penetration testing, cyberforensic investigations, security engineering, and vulnerability management. CSO leadership manages Barclays’ cybersecurity activities and is accountable for the day-to-day monitoring of residual risk, identification of gaps, oversight of remedial actions and implementation of strategy. As described below, the Chief Security Officer and CISO for the Group provide updates to the Board and Board Risk Committee about cybersecurity risks facing the Group. Within its oversight of Operational risk as a Principal Risk, the Board Risk Committee is responsible for oversight of risks arising from cybersecurity threats. As part of this oversight, the Board Risk Committee receives periodic updates from Barclays' Chief Security Officer or CISO for the Group on cybersecurity matters. In 2023, such updates addressed topics that included the shifting cybersecurity threat landscape, measurement of Barclays' risk and control posture, cybersecurity incident trends and Barclays' response, Barclays' ability to recover from a material cyberattack scenario, third party control and assurance monitoring, privileged access to Barclays' systems, regulatory developments, and Barclays' technology and resource investment strategy. Barclays assesses its cybersecurity activities against the industry-recognised National Institute of Standards and Technology (NIST) security maturity framework, and we periodically engage external security consultants to conduct independent benchmarking assessments. In 2023, findings from such an assessment conducted in late 2022 were briefed to the Board and Board Risk Committee. Barclays' CSO partners with third-party security providers throughout the Group's cybersecurity activities, including for cyber recovery, penetration testing, software vulnerability scanning, distributed denial of service (DDoS) attack prevention, phishing simulations, third-party risk management, incident response, intelligence, fraud prevention, and industry benchmarking. Strategy Climate and sustainability report Risk review Financial review Financial statements Barclays PLC 2023 Annual Report on Form 20-F 180Governance ESG Governance (continued)
Under Barclays' Enterprise Risk Management Framework, there is an Information and Cyber Security Policy supported by ten Standards which define the minimum requirements for cybersecurity matters across the entire Barclays Group. These Standards cover the following topics: Cryptography, Network Security, Security Configuration, Data Loss Prevention, Vulnerability Management, Data Security, Incident Response & Threat Intelligence, Threat Management, Governance, and Identity & Access Management. An important part of Barclays’ cybersecurity environment is its Joint Operations Centres (JOCs), which operate 24x7x365 from three globally strategic locations, linking CSO’s security professionals and incident response managers with control functions and business unit representatives. The JOCs deliver security responsiveness by uniting core security functions and providing a central information and coordination point for security incident management. To manage security risk related to our third-party suppliers, many of which perform critical services for Barclays and handle sensitive Barclays data, we have a set of contractual Information & Cyber Security Supplier Control Obligations that are based off of the requirements of our internal standards. We conduct assurance over our third and fourth parties against those obligations through a dedicated External Cyber Assurance & Monitoring team (ECAM) and a set of control indicators. This is achieved through our own assurance capabilities and use of a third party assurance utility. Activity is structured on a risk-based approach that prioritizes suppliers that underpin our most important business services. Identified issues are managed formally, but we also engage proactively with third-party suppliers to help them strengthen their security and resilience posture. To recognise the changing risk presented by third-party suppliers, which are increasingly targeted by threat actors, we regularly alert third-party suppliers where we anticipate that they may be more vulnerable and should take preventative action. Notwithstanding such third-party risk management efforts, Barclays does not have direct control over the cybersecurity of the systems of its third parties, limiting the Group’s ability to effectively protect and defend against certain threats. Certifications Barclays holds three ISO27001 certifications (i.e., the international standard on how to manage information security), Cyber Essentials / Cyber Essentials Plus Certification, and has a UK certification for Digital Banking. Reporting phishing CSO performs a number of key activities related to identifying, investigating, responding to and containing phishing / malicious email incidents. CSO has embedded an operational process that provides education and awareness content via email to colleagues who click a malicious link or attachment in a phishing email, with escalating training exercises and management interventions for repeated instances. To report suspected phishing to Barclays' JOC for further investigation, colleagues have a tool integrated into their email account, and colleagues receive feedback on whether the reported email was suspect or genuine. CSO also runs monthly phishing simulations to understand colleagues' susceptibility to real attacks, using the analysis to refine education and training. Training Barclays has adopted a 65-day window for mandatory training completion to allow colleagues sufficient time to complete training. The consequence of non- completion is a breach which can lead to disciplinary action and impact compensation. The 65-day window covers many different colleague situations, including new joiners, returners from sick leave or parental leave and internal movers. Some of these situations are required by law to have a reasonable adjustment time to enable the successful completion of training. This process is managed by Barclays HR and Compliance. Strategy Climate and sustainability report Risk review Financial review Financial statements Barclays PLC 2023 Annual Report on Form 20-F 181Governance ESG Governance (continued)
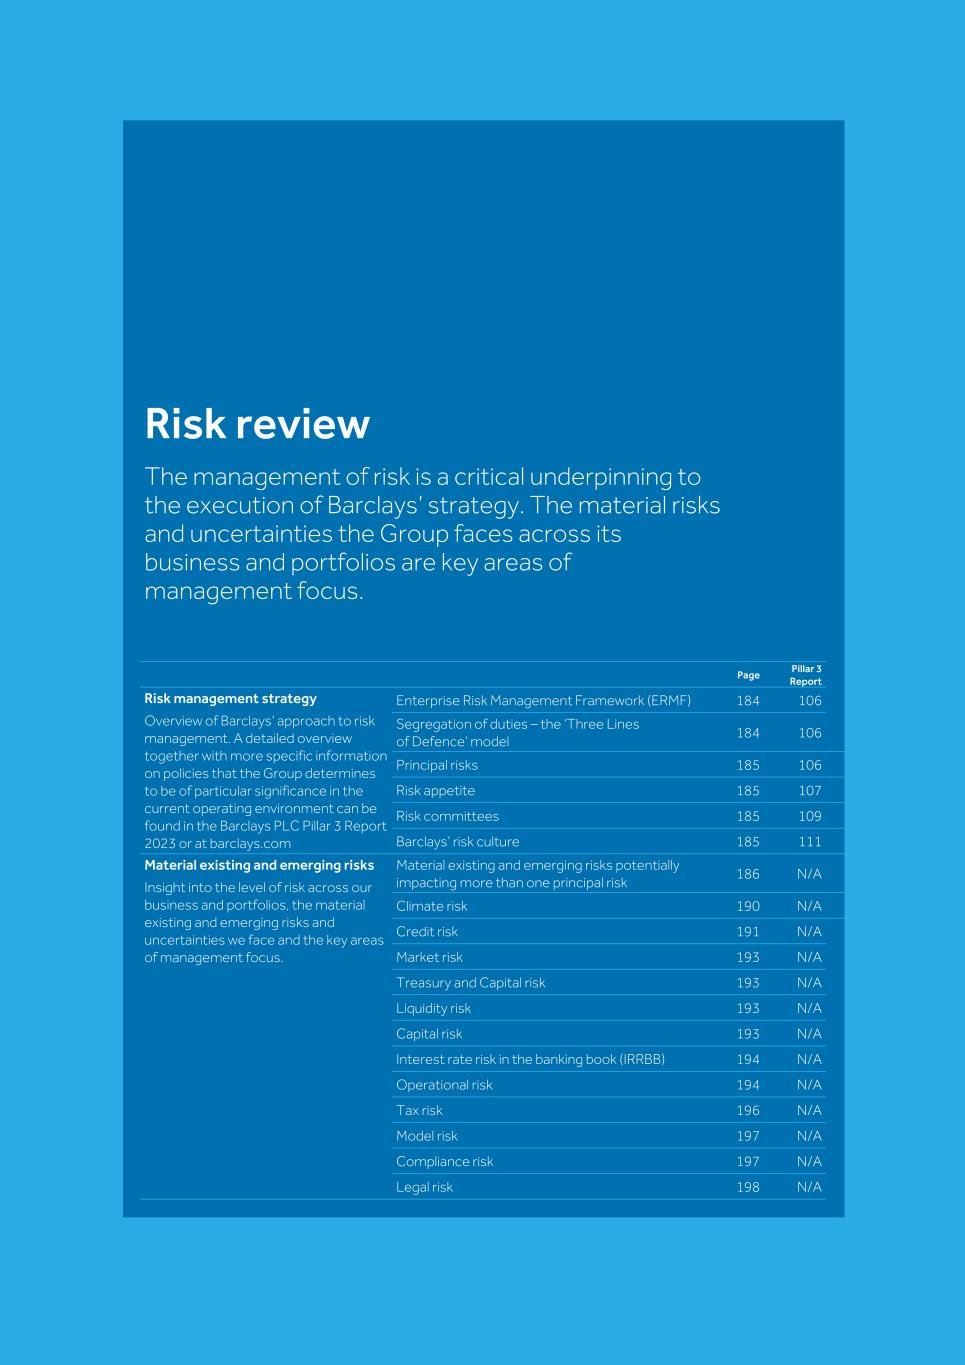
Risk review The management of risk is a critical underpinning to the execution of Barclays’ strategy. The material risks and uncertainties the Group faces across its business and portfolios are key areas of management focus. Page Pillar 3 Report Risk management strategy Overview of Barclays’ approach to risk management. A detailed overview together with more specific information on policies that the Group determines to be of particular significance in the current operating environment can be found in the Barclays PLC Pillar 3 Report 2023 or at barclays.com Enterprise Risk Management Framework (ERMF) 184 106 Segregation of duties – the ‘Three Lines of Defence’ model 184 106 Principal risks 185 106 Risk appetite 185 107 Risk committees 185 109 Barclays’ risk culture 185 111 Material existing and emerging risks Insight into the level of risk across our business and portfolios, the material existing and emerging risks and uncertainties we face and the key areas of management focus. Material existing and emerging risks potentially impacting more than one principal risk 186 N/A Climate risk 190 N/A Credit risk 191 N/A Market risk 193 N/A Treasury and Capital risk 193 N/A Liquidity risk 193 N/A Capital risk 193 N/A Interest rate risk in the banking book (IRRBB) 194 N/A Operational risk 194 N/A Tax risk 196 N/A Model risk 197 N/A Compliance risk 197 N/A Legal risk 198 N/A
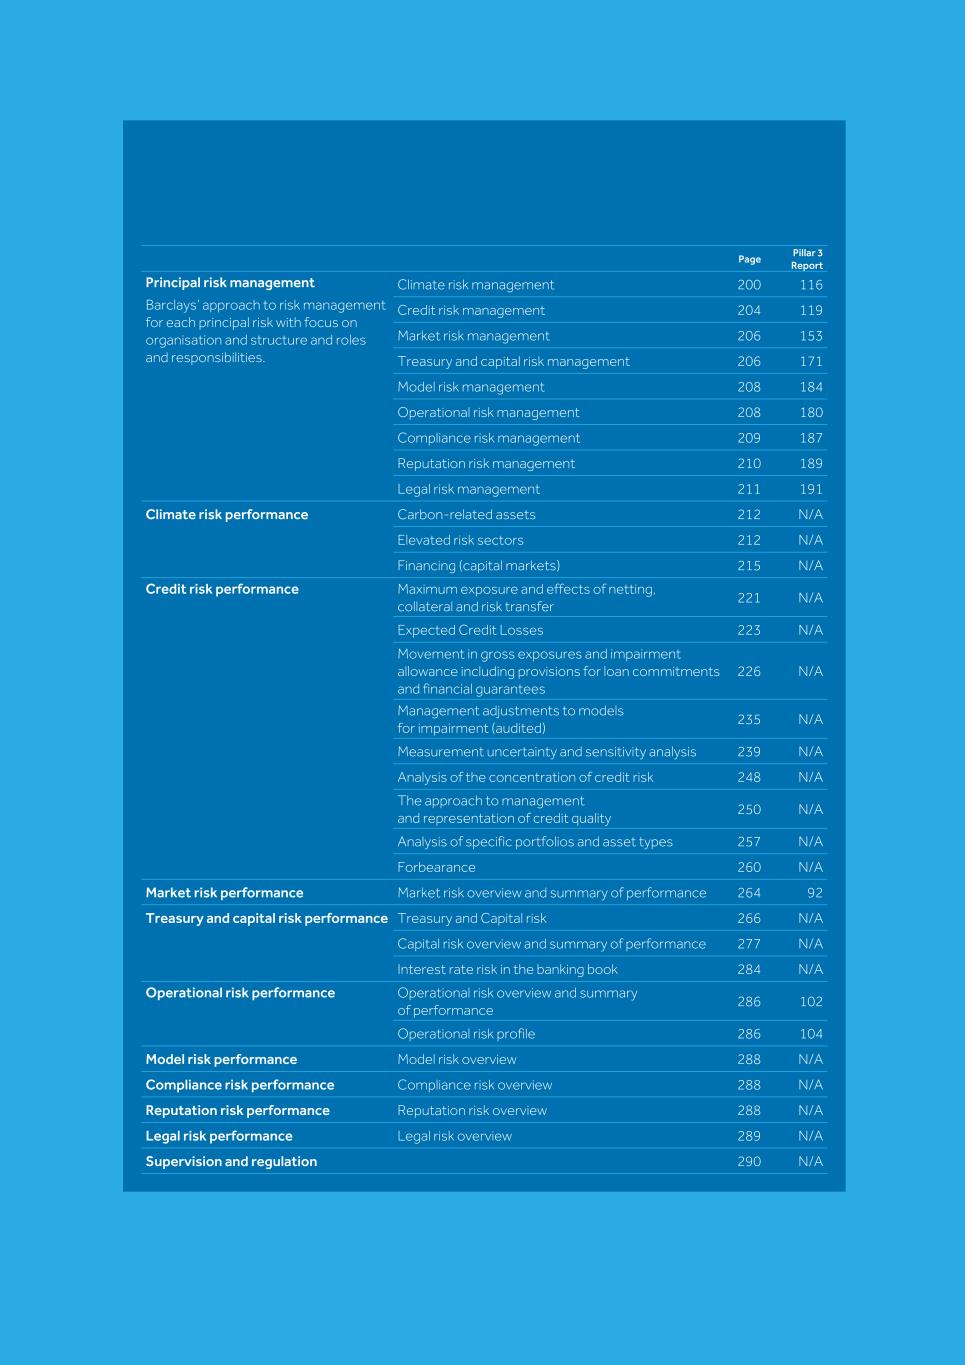
Page Pillar 3 Report Principal risk management Barclays’ approach to risk management for each principal risk with focus on organisation and structure and roles and responsibilities. Climate risk management 200 116 Credit risk management 204 119 Market risk management 206 153 Treasury and capital risk management 206 171 Model risk management 208 184 Operational risk management 208 180 Compliance risk management 209 187 Reputation risk management 210 189 Legal risk management 211 191 Climate risk performance Carbon-related assets 212 N/A Elevated risk sectors 212 N/A Financing (capital markets) 215 N/A Credit risk performance Maximum exposure and effects of netting, collateral and risk transfer 221 N/A Expected Credit Losses 223 N/A Movement in gross exposures and impairment allowance including provisions for loan commitments and financial guarantees 226 N/A Management adjustments to models for impairment (audited) 235 N/A Measurement uncertainty and sensitivity analysis 239 N/A Analysis of the concentration of credit risk 248 N/A The approach to management and representation of credit quality 250 N/A Analysis of specific portfolios and asset types 257 N/A Forbearance 260 N/A Market risk performance Market risk overview and summary of performance 264 92 Treasury and capital risk performance Treasury and Capital risk 266 N/A Capital risk overview and summary of performance 277 N/A Interest rate risk in the banking book 284 N/A Operational risk performance Operational risk overview and summary of performance 286 102 Operational risk profile 286 104 Model risk performance Model risk overview 288 N/A Compliance risk performance Compliance risk overview 288 N/A Reputation risk performance Reputation risk overview 288 N/A Legal risk performance Legal risk overview 289 N/A Supervision and regulation 290 N/A
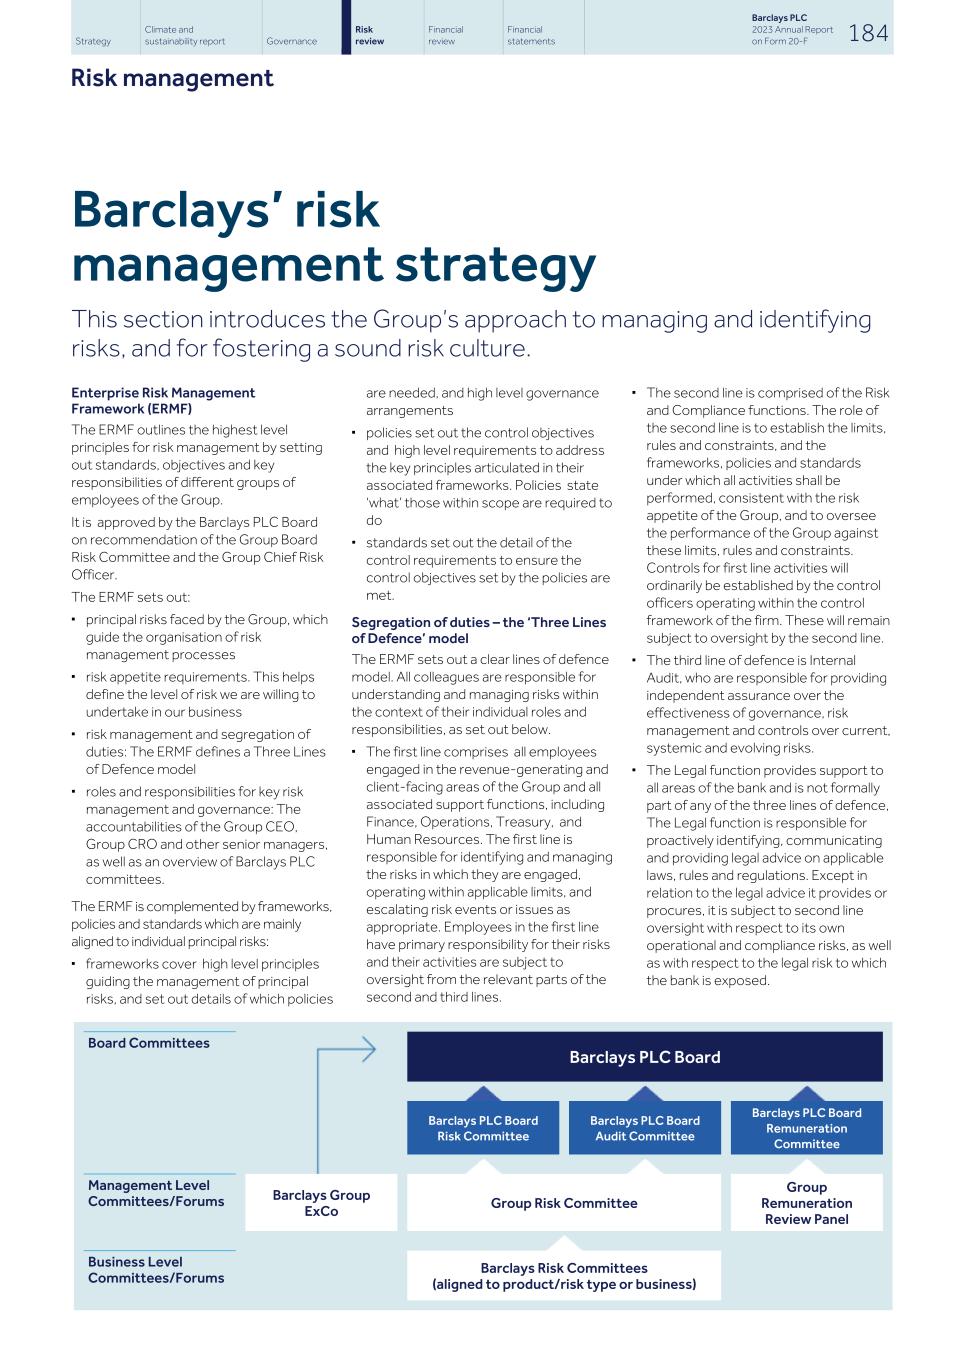
Barclays’ risk management strategy This section introduces the Group’s approach to managing and identifying risks, and for fostering a sound risk culture. Enterprise Risk Management Framework (ERMF) The ERMF outlines the highest level principles for risk management by setting out standards, objectives and key responsibilities of different groups of employees of the Group. It is approved by the Barclays PLC Board on recommendation of the Group Board Risk Committee and the Group Chief Risk Officer. The ERMF sets out: ▪ principal risks faced by the Group, which guide the organisation of risk management processes ▪ risk appetite requirements. This helps define the level of risk we are willing to undertake in our business ▪ risk management and segregation of duties: The ERMF defines a Three Lines of Defence model ▪ roles and responsibilities for key risk management and governance: The accountabilities of the Group CEO, Group CRO and other senior managers, as well as an overview of Barclays PLC committees. The ERMF is complemented by frameworks, policies and standards which are mainly aligned to individual principal risks: ▪ frameworks cover high level principles guiding the management of principal risks, and set out details of which policies are needed, and high level governance arrangements ▪ policies set out the control objectives and high level requirements to address the key principles articulated in their associated frameworks. Policies state ‘what’ those within scope are required to do ▪ standards set out the detail of the control requirements to ensure the control objectives set by the policies are met. Segregation of duties – the ‘Three Lines of Defence’ model The ERMF sets out a clear lines of defence model. All colleagues are responsible for understanding and managing risks within the context of their individual roles and responsibilities, as set out below. ▪ The first line comprises all employees engaged in the revenue-generating and client-facing areas of the Group and all associated support functions, including Finance, Operations, Treasury, and Human Resources. The first line is responsible for identifying and managing the risks in which they are engaged, operating within applicable limits, and escalating risk events or issues as appropriate. Employees in the first line have primary responsibility for their risks and their activities are subject to oversight from the relevant parts of the second and third lines. ▪ The second line is comprised of the Risk and Compliance functions. The role of the second line is to establish the limits, rules and constraints, and the frameworks, policies and standards under which all activities shall be performed, consistent with the risk appetite of the Group, and to oversee the performance of the Group against these limits, rules and constraints. Controls for first line activities will ordinarily be established by the control officers operating within the control framework of the firm. These will remain subject to oversight by the second line. ▪ The third line of defence is Internal Audit, who are responsible for providing independent assurance over the effectiveness of governance, risk management and controls over current, systemic and evolving risks. ▪ The Legal function provides support to all areas of the bank and is not formally part of any of the three lines of defence, The Legal function is responsible for proactively identifying, communicating and providing legal advice on applicable laws, rules and regulations. Except in relation to the legal advice it provides or procures, it is subject to second line oversight with respect to its own operational and compliance risks, as well as with respect to the legal risk to which the bank is exposed. Board Committees Barclays PLC Board Barclays PLC Board Risk Committee Barclays PLC Board Audit Committee Barclays PLC Board Remuneration Committee Management Level Committees/Forums Barclays Group ExCo Group Risk Committee Group Remuneration Review Panel Business Level Committees/Forums Barclays Risk Committees (aligned to product/risk type or business) Strategy Climate and sustainability report Governance Risk review Financial review Financial statements Barclays PLC 2023 Annual Report on Form 20-F 184 Risk management
Principal risks The ERMF identifies nine principal risks namely: credit risk, market risk, treasury and capital risk, climate risk, operational risk, model risk, compliance risk, reputation risk and legal risk. Note that "compliance risk" replaced "conduct risk" in 2023 with an expanded definition. See page 197 for more information. Each of the principal risks is overseen by an accountable executive within the Group who is responsible for overseeing and/or assigning responsibilities for the framework, policies and standards that set out associated responsibilities and expectations and detail the related requirements around risk management. In addition, certain risks span across more than one principal risk. Risk appetite Risk appetite is defined as the level of risk which the Group is prepared to accept in carrying out its activities. It provides a basis for ongoing dialogue between management and Board with respect to the Group’s current and evolving risk profile, allowing strategic and financial decisions to be made on an informed basis. Risk appetite is approved by the Barclays PLC Board in aggregate and disseminated across legal entities and businesses, supported by limits to enable and control specific exposures and activities that have material concentration risk implications. Risk committees Barclays various risk committees consider risk matters relevant to their business, and escalate as required to the Group Risk Committee (GRC), whose Chair, in turn, escalates to the Barclays PLC Board Risk Committees and the Barclays PLC Board. In addition to setting the risk appetite of the Group, the Board is responsible for approving the ERMF, and reviewing reputation risk matters. It receives regular information on the risk profile of the Group, and has ultimate responsibility for risk appetite and capital plans. Further, there are two Board-level committees which oversee the application of the ERMF and implementation of key aspects, the Barclays PLC Board Risk Committee (BRC) and the Barclays PLC Board Audit Committee (BAC). Additionally, the Barclays PLC Board Remuneration Committee oversee pay practices focusing on aligning pay to sustainable performance. • The Barclays PLC Board Risk Committee (BRC): the BRC monitors the Group’s risk profile against the agreed appetite. Where actual performance differs from expectations, the actions taken by management are reviewed to ascertain that the BRC is comfortable with them. The BRC also reviews certain key risk methodologies, the effectiveness of risk management, and the Group’s risk profile, including the material issues affecting each business portfolio and forward risk trends. The committee also commissions in-depth analysis of significant risk topics, which are presented by the Group CRO or senior risk managers. • The Barclays PLC Board Audit Committee (BAC): the BAC receives regular reports on the effectiveness of internal control systems, quarterly reports on material control issues of significance, quarterly papers on accounting judgements (including impairment), and a quarterly review of the adequacy of impairment allowances. • The Barclays PLC Board Remuneration Committee (RemCo): the RemCo receives proposals on ex-ante and ex- post risk adjustments to variable remuneration based on risk management performance including events, issues and the wider risk profile. These inputs are considered in the setting of performance incentives. The terms of reference and additional details on membership and activities for each of the principal Board committees are available from the corporate governance section of the Barclays website at: home.barclays/who-we-are/ our-governance/board-committees/ The GRC is the most senior executive body responsible for reviewing and monitoring the risk profile of the Group. This includes coverage of all principal risks, and any other material risks, to which the Group is exposed. The GRC reviews and recommends the proposed risk appetite and relative limits to the BRC. The committee covers all business units and legal entities of the Group and incorporates specific coverage of Barclays Bank Group. Barclays’ risk culture Risk culture can be defined as the norms, attitudes and behaviours related to risk awareness, risk taking and risk management. This is reflected in how the Group identifies, escalates and manages risk matters. Barclays is committed to maintaining a robust risk culture in which: • management expect, model and reward the right behaviours from a risk and control perspective • colleagues identify, manage and escalate risk and control matters, and meet their responsibilities around risk management. The Group CEO works with the Executive Management to embed a strong risk culture within the firm, with particular regard to the identification, escalation and management of risk matters, in accordance with the ERMF. This is supported by our Purpose, Values and Mindset, as well by as by setting a standard of consistent excellence. Specifically, all employees regardless of their positions, functions or locations must play their part in the Group’s risk management. Employees are required to be familiar with risk management policies which are relevant to their responsibilities, know how to escalate actual or potential risk issues, and have a role-appropriate level of awareness of the risk management process as defined by the ERMF. Our Code of Conduct – the Barclays Way Globally, all colleagues must attest to the ‘Barclays Way’, our Code of Conduct, and comply with all frameworks, policies and standards applicable to their roles. The Code of Conduct outlines the Purpose, Values and Mindset which govern our ‘Barclays Way’ of working across our business globally. It constitutes a reference point covering all aspects of colleagues’ working relationships, and provides guidance on working with other Barclays employees, customers and clients, governments and regulators, business partners, suppliers, competitors and the broader community. See home.barclays/sustainability/esg- resource-hub/statements-and-policy- positions/ for more details. Strategy Climate and sustainability report Governance Risk review Financial review Financial statements Barclays PLC 2023 Annual Report on Form 20-F 185 Risk management (continued)
Material existing and emerging risks to the Group’s future performance The Group has identified a broad range of risks to which its businesses are exposed. Material risks are those to which senior management pay particular attention and which could cause the delivery of the Group’s strategy, results of operations, financial condition and/or prospects to differ materially from expectations. Emerging risks are those which have unknown components, the impact of which could crystallise over a longer time period. In addition, certain other factors beyond the Group’s control, including escalation of global conflicts, acts of terrorism, natural disasters, pandemics and similar events, although not detailed below, could have a similar impact on the Group. Material existing and emerging risks potentially impacting more than one principal risk i) Business conditions, general economy and geopolitical issues The Group’s operations are subject to changes in global and local economic and market conditions, as well as geopolitical developments, which may have a material impact on the Group’s business, results of operations, financial condition and prospects. A deterioration in global or local economic and market conditions may result in (among other things): (i) deteriorating business, consumer or investor confidence and lower levels of investment and productivity growth, which in turn may lead to lower customer and client activity, including lower demand for borrowing; (ii) higher default rates, delinquencies, write- offs and impairment charges as borrowers struggle with their debt commitments; (iii) subdued asset prices, which may impact the value of collateral held by the Group and require the Group and its customers to post additional collateral in order to satisfy margin calls; (iv) mark-to-market losses in trading portfolios resulting from changes in factors such as credit ratings, share prices and solvency of counterparties; and (v) revisions to calculated ECLs leading to increases in impairment allowances. In addition, the Group’s ability to borrow from other financial institutions or raise funding from external investors may be affected by deteriorating economic conditions and market disruption. Geopolitical events can also cause financial instability and affect economic growth. In particular: • Global GDP growth in 2023 was severely hampered by inflationary pressures resulting from: (i) restricted labour markets, industrial disputes, and upward pressure on employment costs; (ii) high energy prices intensified by the conflicts in Ukraine and the Middle East; and (iii) resilient consumer spending, particularly on services, funded by drawing household savings. High inflation has led to the on-going 'cost of living' pressures in much of the world, including in the UK. • In response to persistent inflation, 2023 saw central banks continue to tighten monetary policy through raising interest rates and exercising quantitative tightening. While markets are forecasting that rates are at or near their cycle peak and inflation has begun to ease back (albeit remaining well above central banks' targets), economies in which the Group operates are vulnerable to recession risk in 2024. Such risk is heightened by the turbulent geopolitical outlook and volatile market conditions with these factors acting as a drag on potential global economic growth. Higher mortgage rates, rising taxes, elevated bond yields, depleted household savings, higher corporate insolvencies, and rising unemployment have potentially negative implications for the Group's performance, including increased impairment allowances. • The loss of ‘the presumption of compliance’ is widely reported to have raised costs for UK customers exporting to the European Union (EU) which, together with the risk of regulatory divergence between the UK and the EU, could adversely impact both the Group's EU and UK operations. • Further, any trading disruption between the EU and the UK may have a significant impact on economic activity in the EU and the UK which, in turn, could have a material adverse effect on the Group’s business, results of operations, financial condition and prospects. • Unstable economic conditions could result in (among other things): – a deeper slowdown in the UK and/or one or more member states of the EU in which the Group operates, with lower growth, higher unemployment and a greater fall in property prices, which could lead to increased impairments in relation to a number of the Group’s portfolios (including, but not limited to, the UK mortgage portfolio, unsecured lending portfolio (including credit cards) and commercial real estate exposures). – increased market volatility (in particular in currencies and interest rates), which could impact the Group’s trading book positions and affect the underlying value of assets in the banking book and securities held by the Group for liquidity purposes. In addition, depositor perceptions of banking fragility as seen in certain institutions in 2023 could increase the severity and velocity of deposit outflows, impacting the Group’s liquidity position; – a credit rating downgrade for one or more members of the Group (either directly or indirectly as a result of a downgrade in the UK sovereign credit ratings), which could significantly increase the Group’s cost of funding and/or reduce its access to funding, widen credit spreads and have a material adverse impact on the Group’s interest margins and liquidity position and/or – a market-wide widening of credit spreads or reduced investor appetite for the Group’s debt securities, which could negatively impact the Group’s cost of and/or access to funding. • A significant proportion of the Group’s portfolio is located in the US, including a major credit card portfolio and a range of corporate and investment banking exposures. Political instability and/or increased polarisation ahead of the 2024 elections together with the possibility of significant changes in US policy in certain sectors may negatively impact the Group’s associated portfolios. Stress in the US economy, weakening GDP and associated exchange rate fluctuations, heightened political and/or trade tensions (such as between the US and China), and increased unemployment could lead to higher levels of impairment, which may have a material adverse effect on the Group's results of operations and profitability. • An escalation in geopolitical tensions or increased use of protectionist measures (such as the US and China implementing reciprocal trade tariffs and/or outright export bans on specific products and/or in specific sectors) may have a material adverse effect on the Group’s business in the affected regions. • In China, a significant global economy, the property market slump, shrinking exports, and weakened currency (and resulting capital outflows) have caused Strategy Climate and sustainability report Governance Risk review Financial review Financial statements Barclays PLC 2023 Annual Report on Form 20-F 186 Material existing and emerging risks
an economic slowdown, with deflation a real risk. The high levels of debt, particularly in the property sector, remain a concern given the high leverage multiples, despite government and regulatory action. Any property shock risks contaminating the financial sector and precipitating a wider banking crisis. A shift away from market-based reforms towards state led initiatives to stimulate the economy could damage private-sector confidence and economic growth. • High US interest rates and a potential global slow-down in demand for natural resources, means an economic deterioration in emerging markets still remains a risk. This could have a material adverse effect on the Group's results from operations if these stresses lead to higher impairment charges from a deterioration in sovereign or corporate creditworthiness. • New strains of COVID-19 (or reduced vaccine efficacy) could impact the Group's ability to conduct business in the jurisdictions in which it operates through disruptions to: (i)) infrastructure and supply chains, (ii) business processes and technology services provided by third parties and (iii), the availability of staff due to illness. These interruptions to business may be detrimental to customers (who may seek reimbursement from the Group for costs and losses incurred as a result of such interruptions), and result in potential litigation costs (including regulatory fines, penalties and other sanctions), as well as reputational damage. It may also have the effect of increasing the likelihood and/or magnitude of other risks described herein (with consequential impairment charge volatility) or may pose other risks which are not presently known to the Group or not currently expected to be significant to the Group’s profitability, capital and liquidity. Any and all such events mentioned above could have a material adverse effect on the Group’s business, results of operations, financial condition, prospects, liquidity, capital position and credit ratings (including potential credit rating agency changes of outlooks or ratings), as well as on the Group’s customers, employees and suppliers. ii) The impact of interest rate changes on the Group’s profitability Changes to interest rates are significant for the Group, especially given the uncertainty as to the size and frequency of such changes, particularly in the Group’s main markets of the UK, the US and the EU. Interest rate rises result in higher funding costs either due to higher refinancing costs or due to deposit balance mix changes as customers prefer higher rate deposits. Interest rate rises however could positively impact the Group’s profitability as retail and corporate business net interest income increases due to margin decompression, as observed for the interest rate rises in 2023. However, increases in interest rates, if larger or more frequent than expected, could lead to generally weaker than expected growth, reduced business confidence and higher unemployment. This, combined with the impact interest rate rises may have on the affordability of loan arrangements for borrowers (especially when combined with inflationary pressures), could cause stress in the lending portfolio and underwriting activity of the Group. This could result in higher credit losses driving increased impairment charges which would most notably impact retail unsecured portfolios and wholesale non-investment grade lending and could have a material effect on the Group’s business, results of operations, financial condition and prospects. Interest rate cuts may affect, and put pressure on, the Group’s net interest margins (the difference between its lending income and borrowing costs) and could adversely affect the profitability and prospects of the Group. In addition, changes in interest rates could have an adverse impact on the value of the securities held in the Group’s liquid asset portfolio. Consequently, this could create more volatility than expected through the Group’s fair value through other comprehensive income (FVOCI) reserve and could adversely affect the profitability and prospects of the Group. iii) Competition in the banking and financial services industry The Group operates in a highly competitive environment in which it must evolve and adapt to significant changes as a result of regulatory reform, technological advances, increased public scrutiny, prevailing market environment and changes to economic conditions. The Group expects that competition in the financial services industry will continue to be intense and may have a material adverse effect on the Group’s future business, results of operations, financial condition and prospects. New competitors in the financial services industry continue to emerge. Technological advances and the growth of e-commerce have made it possible for non-banks to offer products and services that traditionally were banking products such as electronic securities trading, payments processing and online automated algorithmic-based investment advice. Furthermore, payments processing and other services could be significantly disrupted by technologies, such as blockchain (used in cryptocurrency systems) and 'buy now pay later' lending, both of which are currently subject to lower levels of regulatory oversight compared to many activities undertaken by banks. Furthermore, the introduction of central bank digital currencies could have significant impact on the banking system and the role of commercial banks by disrupting the current provision of banking products and services. This disruption could allow new competitors, some previously hindered by banking regulation (such as certain FinTechs), to provide customers with access to banking facilities and increase the disintermediation of banking services. New technologies and changing consumer behaviour have previously required, and could continue to require, the Group to incur additional costs to modify or adapt its products or make additional capital investments in its businesses to attract and retain clients and customers or to match products and services offered by its competitors, including technology companies. Ongoing or increased competition and/or disintermediation of banking services may put pressure on the pricing of the Group’s products and services, which could reduce the Group’s revenues and profitability, or may cause the Group to lose market share, particularly with respect to traditional banking products such as deposits, bank accounts and mortgage lending. This competition may be on the basis of the quality and variety of products and services offered, transaction execution, innovation, reputation and/or price. These factors may be exacerbated by further industry wide initiatives to address access to banking. The failure of any of the Group’s businesses to meet the expectations of clients and customers, whether due to general market conditions, underperformance, a decision not to offer a particular product or service, branch closures, changes in client and customer expectations or other factors, could affect the Group’s ability to attract or retain clients and customers. Any such impact could, in turn, reduce the Group’s revenues. Strategy Climate and sustainability report Governance Risk review Financial review Financial statements Barclays PLC 2023 Annual Report on Form 20-F 187 Material existing and emerging risks (continued)
iv) Regulatory change agenda and impact on business model The Group’s businesses are subject to ongoing regulation and associated regulatory risks, including the effects of changes in the laws, regulations, policies, voluntary codes of practice and interpretations of the foregoing in the UK, the US, the EU and the other markets in which it operates. Many regulatory changes that are relevant to the Group’s business may have an effect beyond the country in which they are enacted, either because the Group’s regulators deliberately enact regulation with extra- territorial effect or its global operations mean that the Group gives effect to local laws and regulations on a wider basis. In recent years, regulators and governments have focused on reforming both the prudential regulation of the financial services industry and the ways in which the business of financial services is conducted. Measures taken include enhanced capital, liquidity and funding requirements, the structural separation or prohibition of certain activities by banks, changes in the operation of capital markets activities, the introduction of tax levies and transaction taxes, changes in compensation practices and more detailed requirements on how business is conducted and customers are treated. The governments and regulators in the UK, the US, the EU or elsewhere may intervene further in relation to areas of industry risk already identified, or in new areas, which could adversely affect the Group. Current and anticipated areas of particular focus for the Group’s regulators, where regulatory changes could have a material effect on the Group’s business, financial condition, results of operations, prospects, capital position, and reputation, include, but are not limited to: • the increasing focus by regulators, international bodies, organisations and unions on how institutions conduct business, particularly with regard to the delivery of fair outcomes for customers, promoting effective competition in the interests of consumers and ensuring the orderly and transparent operation of global financial markets, including the new Consumer Duty in the UK and measures resulting from ongoing thematic reviews into the workings of the retail, small and medium enterprises and wholesale banking sectors and the provision of financial advice to consumers; • the implementation of any conduct measures as a result of regulators’ focus on organisational culture, employee behaviour and whistleblowing; • the demise of certain benchmark interest rates and the transition to new risk-free reference rates (as discussed further under ‘v) Impact of benchmark interest rate reforms on the Group’ below); • reviews of regulatory frameworks applicable to the wholesale financial markets, including reforms and other changes to conduct of business, listing, securitisation and derivatives related requirements; • the focus globally on technology adoption and digital delivery, including the use of artificial intelligence (AI), digital assets and digital money (including central bank digital currencies), financial technology risks, payments and related infrastructure, operational resilience, and cybersecurity. This also includes the introduction of new and/or enhanced regulatory standards in these areas, underpinned by customer protection principles; • increasing regulatory expectations of firms around governance and risk management frameworks, particularly for the management of climate change and other ESG risks, enhanced ESG disclosure and reporting obligations, and proposals for a new regulatory framework on diversity and inclusion in the UK; • the continued evolution of the UK’s regulatory framework following the UK's withdrawal from the EU, particularly following the introduction of the Financial Services and Markets Act 2023 (FSMA 2023) which provides for the revocation of retained EU law relating to financial services and the UK financial services regulatory reform agenda announced in December 2022, and similarly regarding the access of UK and other non-EU financial institutions to EU markets; • the implementation of the reforms to the Basel III package, which includes changes to the RWA approaches to credit risk, market risk, counterparty risk, operational risk, and credit valuation adjustments and the application of RWA floors and the leverage ratio; • the implementation of more stringent capital, liquidity and funding requirements; • the incorporation of climate change within the global prudential framework, including the transition risks resulting from a shift to a low-carbon economy and its financial effects; • the increased regulatory focus in the UK on the introduction of potential measures designed to maximise access to cash for consumers (including retention of specific branches) and, separately, regulatory scrutiny of the reasons for refusing to open or decisions to close customer bank accounts; • proposed reforms to the UK ring- fencing regime, which requires the separation of core banking operations for retail and small and medium enterprise depositors from other wholesale and investment banking operations; • the reform of corporate criminal liability in the Economic Crime and Corporate Transparency Act 2023, which includes a failure to prevent fraud offence; • requirements to detail management accountability within the Group (for example, the requirements of the Senior Managers and Certification Regime in the UK and similar regimes elsewhere that are either in effect or under consideration/implementation), as well as requirements relating to executive remuneration; • changes in national or supra-national requirements regarding the ability to offshore or outsource the provision of services and resources or transfer material risk or data to companies located in other countries, which could impact the Group’s ability to implement globally consistent and efficient operating models; • financial crime, fraud and market abuse standards and increasing expectations for related control frameworks, to ensure firms are adapting to new threats and are protecting customers from cyber-enabled crime and in the UK, reforms relating to authorised push payment fraud reimbursements; • the application and enforcement of economic sanctions including those with extra-territorial effect and those arising from geopolitical tensions; • requirements flowing from arrangements for the resolution strategy of the Group and its individual operating entities that may have different effects in different countries; Strategy Climate and sustainability report Governance Risk review Financial review Financial statements Barclays PLC 2023 Annual Report on Form 20-F 188 Material existing and emerging risks (continued)
• the increasing regulatory expectations and requirements relating to various aspects of operational resilience, including an increasing focus on the response of institutions to operational disruptions and reviews of the role of critical third party providers; • continuing regulatory focus on data privacy, including the collection and use of personal data, and protection against loss and unauthorised or improper access; • the regulatory focus on policies and procedures for identifying and managing cybersecurity risks, cybersecurity governance and the corresponding disclosure and reporting obligations; and • continuing regulatory focus on the effectiveness of internal controls and risk management frameworks, as evidenced in regulatory fines and other measures imposed on the Group and other financial institutions. + For further details on the regulatory supervision of, and regulations applicable to, the Group, refer to the Supervision and regulation section on page 290. v) Impact of benchmark interest rate reforms on the Group Global regulators have driven international efforts to reform benchmarks and indices, used to determine the amounts payable under a wide range of transactions to increase reliability and robustness. These reforms have resulted in significant changes to the methodology and operation of certain benchmarks and indices, the adoption of alternative risk- free reference rates (RFRs), the discontinuation of certain benchmarks, and the introduction of implementing legislation and regulations. Specifically, certain London Interbank Offered Rate (LIBOR) tenors either ceased at the end of 2021 or became permanently unrepresentative, with synthetic 3-month GBP LIBOR ceasing to be published at the end March 2024 and synthetic 1-, 3- and 6-month USD LIBOR settings intended to cease being published at the end of September 2024. Notwithstanding these developments, given the unpredictable consequences of benchmark reform, any of these developments could have an adverse impact on market participants, including the Group, in respect of any financial instruments linked to, or referencing, any of these benchmarks. Uncertainty associated with such potential changes, including the availability and/or suitability of alternative RFRs, the participation of customers and third party market participants in the transition process, challenges with respect to required documentation changes, and the impact of legislation to deal with certain legacy contracts that cannot convert into or add fall-back RFRs before cessation of the benchmark they reference, may adversely affect a broad range of transactions (including any securities, loans and derivatives which use an affected benchmark to determine an amount payable which are included in the Group’s financial assets and liabilities) that use these benchmarks and indices, and present a number of risks for the Group, including but not limited to: • Compliance risk: in undertaking actions to transition away from using certain benchmarks to new alternative RFRs, the Group faces conduct risks. These may lead to customer complaints, regulatory sanctions or reputational impact if the Group is considered to be (among other things): (i) undertaking market activities that are manipulative or create a false or misleading impression; (ii) misusing sensitive information or not identifying or appropriately managing and mitigating conflicts of interest; (iii) providing customers with inadequate advice, misleading information, unsuitable products or unacceptable service; (iv) not taking a consistent approach to remediation for customers in similar circumstances; (v) unduly delaying the communication and migration activities in relation to client exposures, leaving them insufficient time to prepare; or (vi) colluding or inappropriately sharing information with competitors. • Litigation risk: members of the Group may face legal proceedings, regulatory investigations and/or other actions or proceedings regarding (among other things): (i) the conduct risks identified above, (ii) the interpretation and enforceability of provisions in contracts and securities linked to a relevant benchmark, and (iii) the Group’s preparation and readiness for the replacement of benchmarks which have ceased or will shortly cease to be published with alternative RFRs. • Financial risk: the valuation of certain of the Group’s financial assets and liabilities may change. Moreover, transitioning to alternative RFRs may impact the ability of members of the Group to calculate and model amounts receivable by them on certain financial assets and determine the amounts payable on certain financial liabilities (such as debt securities issued by them) because certain alternative RFRs (such as the Sterling Overnight Index Average (SONIA) and the Secured Overnight Financing Rate (SOFR)) are look-back rates, which means that the amount of interest payable is only known after the period has finished because it is calculated by reference to observed historical rates. In contrast, forward- looking term rates (such as LIBOR) allow borrowers to calculate at the start of any interest period exactly how much is payable at the end of such interest period. This may have a material adverse effect on the Group’s cash flows. • Pricing risk: changes to existing benchmarks and indices, discontinuation of any benchmarks or index and transition to alternative RFRs may impact the pricing mechanisms used by the Group on certain transactions. • Operational risk: changes to existing benchmarks and indices, the discontinuation of any benchmark or index and transition to alternative RFRs may require changes to the Group’s IT systems, trade reporting infrastructure, operational processes, and controls. In addition, if any benchmark or index is no longer available to calculate amounts payable, the Group may incur expenses in amending documentation for new and existing transactions and/or effecting the transition from the original benchmark or index to a new one. • Accounting risk: an inability to apply hedge accounting in accordance with IAS 39 could lead to increased volatility in the Group’s financial results and performance. Any of these factors may have a material adverse effect on the Group’s business, results of operations, financial condition, prospects and reputation. Strategy Climate and sustainability report Governance Risk review Financial review Financial statements Barclays PLC 2023 Annual Report on Form 20-F 189 Material existing and emerging risks (continued)
vi) Change delivery and execution risks The Group constantly adapts and transforms the way it conducts business in response to changing customer behaviour and needs, technological developments, regulatory expectations, increased competition and cost management initiatives. Accordingly, effective management of transformation projects is required to successfully deliver the Group's strategic priorities, involving delivering both on externally driven programmes, as well as key business initiatives to deliver revenue growth, product enhancement and operational efficiency outcomes. The magnitude, complexity and, at times, concurrent demands of the projects required to meet these priorities can result in heightened execution risk. The ability to execute the Group’s strategy may be limited by operational capacity and the increasing complexity of the regulatory environment in which the Group operates. In addition, whilst the Group continues to pursue cost management initiatives, they may not be as effective as expected and cost saving targets may not be met. The failure to successfully deliver or achieve any of the expected benefits of these strategic initiatives and/or the failure to meet customer and stakeholder expectations could have a material adverse effect on the Group’s business, results of operations, financial condition, customer outcomes, prospects and reputation. vii) Holding company structure of Barclays PLC and its dependency on distributions from its subsidiaries Barclays PLC is a holding company and its principal sources of income are, and are expected to continue to be, distributions (in the form of dividends and interest payments) from operating subsidiaries which also hold the principal assets of the Group. As a separate legal entity, Barclays PLC relies on such distributions in order to be able to meet its obligations as they fall due (including its payment obligations with respect to its debt securities) and to create distributable reserves for capital distributions (such as dividends to ordinary shareholders and share buybacks). The ability of Barclays PLC’s subsidiaries to pay dividends and interest and Barclays PLC’s ability to receive such distributions from its investments in its subsidiaries and other entities will be subject not only to the financial performance of such subsidiaries and entities and prevailing macroeconomic conditions but also to applicable local laws, capital regulations (including internal MREL requirements) and other restrictions (including restrictions imposed by governments and/or regulators, which limit management’s flexibility in managing the business and taking action in relation to capital distributions and capital allocation). These laws and restrictions could limit the payment of dividends and distributions to Barclays PLC by its subsidiaries and any other entities in which it holds an investment from time to time, which could restrict Barclays PLC’s ability to meet its obligations and/or to make capital distributions (such as dividends to ordinary shareholders and share buybacks). viii) Application of resolution measures and stabilisation powers under the UK Banking Act Under the UK Banking Act 2009, as amended (Banking Act), substantial powers are granted to the Bank of England (or, in certain circumstances, HM Treasury), in consultation with the PRA, the FCA and HM Treasury, as appropriate, as part of the UK's special resolution regime (SRR). These powers enable the relevant UK resolution authority to implement resolution measures and stabilisation options with respect to a UK bank or investment firm and certain of its affiliates (currently including Barclays PLC) (each, a relevant entity) in circumstances in which the relevant UK resolution authority is satisfied that the resolution conditions are met. The SRR consists of five stabilisation options: (i) private sector transfer of all or part of the business or shares of the relevant entity; (ii) transfer of all or part of the business of the relevant entity to a ‘bridge bank’ established by the Bank of England; (iii) transfer to an asset management vehicle wholly or partly owned by the Bank of England; (iv) the cancellation, transfer or dilution of the relevant entities’ equity (including Barclays PLC’s ordinary share capital) and write- down or conversion of the relevant entity’s capital instruments and liabilities (the bail- in tool); and (v) temporary public ownership (i.e. nationalisation). In addition, the relevant UK resolution authority may, in certain circumstances, in accordance with the Banking Act require the permanent write-down or conversion into equity of any outstanding Tier 1 capital instruments, Tier 2 capital instruments and internal MREL prior to, or together with, the exercise of any stabilisation option. Any such action could result in the dilution, transfer or cancellation of Barclays PLC’s ordinary share capital, restrict Barclays PLC’s ability to meet its obligations and/or to pay dividends to ordinary shareholders. Shareholders should assume that, in a resolution situation, public financial support will only be available to a relevant entity as a last resort after the relevant UK resolution authorities have assessed and used, to the maximum extent practicable, the resolution tools, including the bail-in tool (the Bank of England’s preferred approach for the resolution of the Group is a bail-in strategy with a single point of entry at Barclays PLC). The exercise of any of such powers under the Banking Act or any suggestion of any such exercise could materially adversely affect the value of Barclays PLC ordinary shares and could lead to shareholders losing some or all of their investment. The ‘no creditor worse off’ safeguard within the Banking Act requires that no shareholder or creditor must be left worse off from the use of resolution powers than they would have been if the relevant entity entered insolvent liquidation. Whilst shareholders may be entitled to compensation where there is determined to have been a shortfall following a valuation, there can be no assurance that shareholders would recover any such compensation promptly or that such compensation will be equivalent to the full losses incurred in resolution. Material existing and emerging risks impacting individual principal risks i) Climate risk Climate risk is the impact on Financial (Credit, Market, Treasury & Capital) and Operational Risks arising from climate change through physical risks and risks associated with transitioning to a lower carbon economy. The effects of climate change may be highly significant in their breadth and magnitude and could affect a large number of firms operating in different sectors and geographies, leading to potential downstream effects to the financial system. Strategy Climate and sustainability report Governance Risk review Financial review Financial statements Barclays PLC 2023 Annual Report on Form 20-F 190 Material existing and emerging risks (continued)
There is potential direct impact on banks and other financial institutions through their operations, as well as indirectly through customers and clients. Given this context and to support the Group’s ambition to be a net zero bank by 2050, Climate Risk is a Principal Risk under Barclays’ ERMF. Scientific research suggests that physical risks arising due to climate change such as acute events (e.g. cyclone, hurricanes and floods) and chronic events (longer term shifts in climate patterns) may occur in increasing frequency and severity, Potential tipping points can cause unprecedented damage to particular geographies. Some regions are expected to be more severely affected than others if they are more exposed and/or more vulnerable to certain events. The potential impact of physical risk events on the economy may include lower GDP growth, higher unemployment, shortage of raw materials and products due to supply chain disruptions and significant changes in asset prices. These factors could subsequently impact business model and profitability of Barclays and its clients. Damage to the properties and operations of the Group's clients could decrease their production capacity, increase operating costs, affect insurability and decrease value of those properties. This in turn would lead to a decline in the creditworthiness of clients, which may result in higher defaults, delinquencies, write-offs and impairment charges in the Group's portfolios. Physical hazards may also impact the creditworthiness of the sovereigns of countries in which they occur. The deterioration in the credit ratings of sovereign bonds could affect their access to capital and their eligibility for inclusion in banks' liquidity buffers. These hazards may also impact the value of investments which the Group holds. A transition to a low-carbon economy requires policy and regulatory changes, new national or regional commitments, new technological innovations and changes to supply and demand systems within industries. The transition to a low- carbon economy may also trigger changes in consumer behaviour and market sentiment. These changes may result in increased costs and reduced demand for the products and services of a company including early retirement and impairment of assets, or decreased revenue and profitability. The Group's clients that are more susceptible and exposed to these changes may face financial difficulties which in turn may impact their creditworthiness. In addition, impacts to the creditworthiness of the group's clients, customers and counterparties (particularly in high carbon sectors), can also arise a result of climate- related legal actions or investigations, where outcomes of such actions have material financial impacts. This in turn can increase credit risk within group portfolios (for further details on credit risk, refer to ii) Credit Risk on page 191). Both transition and physical risk drivers may lead to increased price volatility and repricing of market instruments, which in turn may impact the value of market instruments held by the Group. The Group's own premises may also suffer physical damage due to weather events leading to increased costs for the Group. As the economy transitions to a lower carbon economy, financial institutions also face significant and rapid developments in stakeholder expectations, policy, law and regulation, which could impact lending activities and the risks associated with lending portfolios as well as asset values. Failure to adequately embed climate risk management into the risk framework may have a material and adverse impact on the Barclays' brand, competitiveness, profitability, capital requirements, cost of funding, financial condition and ability to expand its business. In March 2020, the Group announced its ambition to become a net zero bank by 2050 and its commitment to align all of its financing activities with the goals and timelines of the Paris Agreement. In order to reach these ambitions and targets, and any other climate-related ambitions or targets the Group may commit to in future, the Group will continue to incorporate climate considerations into its strategy, business model, the products and services it provides to customers and its financial and non-financial risk management processes. These include processes to measure and manage the various financial and non-financial risks the Group faces as a result of climate change. The Group also needs to ensure that its strategy and business model adapt to changing national and international standards, industry and scientific practices, regulatory requirements and market expectations regarding climate change, which remain under continuous development. There remains a possibility that these standards, practices, requirements and expectations could change in a manner that substantially increases the cost or effort for the Group to achieve such ambitions and targets. In addition, the Group’s ambitions and targets may prove more challenging to achieve due to changing circumstances and external factors which are beyond the Group’s control, including geopolitical issues, energy security, energy poverty and other considerations such as a just transition to a low-carbon economy. This may be exacerbated if the Group chooses or is required to accelerate its climate-related ambitions or targets as a result of (among other things) international regulatory developments or stakeholder expectations in the UK, the US, the EU or other markets. Achieving Barclays’ climate-related ambitions and targets will also depend on a number of factors outside the Group’s control, including reliable forecasts of hazards from the physical climate models and availability of data/models to measure/assess climate impact on clients. The pathway to net zero is uncertain, complex and dependent on progress in various areas such as advances in low- carbon technologies, collective action by clients to meet their own net zero goals, and supportive public policies in markets where Barclays operates. If there is a lack of progress in the aforementioned areas, Barclays may fail to achieve its climate- related ambitions and targets, and this could have a material adverse effect on Barclays’ business, operations, financial condition, prospects and reputation. + For further details on the potential legal risk from failing to achieve our climate-related ambitions and targets, refer to page 198. ii) Credit risk Credit risk is the risk of loss to the Group from the failure of clients, customers or counterparties, including sovereigns, to fully honour their obligations to members of the Group, including the whole and timely payment of principal, interest, collateral, and other receivables. Credit risk is impacted by a number of factors outside the Group’s control, including wider economic conditions. Strategy Climate and sustainability report Governance Risk review Financial review Financial statements Barclays PLC 2023 Annual Report on Form 20-F 191 Material existing and emerging risks (continued)
a) Impairment Impairment is calculated in line with the requirements of IFRS9. Loss allowances, based on ECLs, are measured on a forward-looking basis using a broad range of financial metrics and application of complex judgements. Accordingly, impairment charges are potentially volatile and may not successfully predict actual credit losses, particularly under stressed conditions. Failure by the Group to accurately estimate credit losses through ECLs could have a material adverse effect on the Group's business, results of operations, financial condition, and prospects. + For further details, refer to Note 8. b) Specific portfolios, sectors and concentrations The Group is subject to risks arising from changes in credit quality and recovery rates for loans and advances due from borrowers and counterparties. Additionally, the Group is subject to a concentration of those risks where it has significant exposures to borrowers and counterparties in specific sectors, or to particular types of borrowers and counterparties. Any deterioration in the credit quality of such borrowers and counterparties could lead to lower recoverability from loans and advances, and higher impairment charges. Accordingly, any of the following areas of uncertainty could have a material adverse impact on the Group's business, results of operations, financial condition, and prospects: • Consumer affordability: this remains a key area of focus, particularly in unsecured lending, as cost of living pressures persist. Macroeconomic factors, such as unemployment, high interest rates or broader inflationary pressures, which impact a customer’s ability to service debt payments, could lead to increased arrears in both unsecured and secured products. • UK Retail, Hospitality and Leisure: despite holding up reasonably well during most of 2023, continuing cost of living pressures, falling consumer confidence, or other macroeconomic factors adversely affecting consumers could trigger a contraction in demand which, together with rising business costs and, for UK retail, a structural shift to online shopping, would add pressure to sectors heavily reliant on consumer discretionary spending during 2024. This represents a potential risk in the Group’s UK corporate portfolio as a higher probability of default exists for retailers, hospitality providers and their landlords while these pressures remain. • Real Estate:UK property represents a significant portion of the Group's overall retail and corporate credit exposure, and the Group remains at risk of increased impairment from a material fall in property prices. During 2023 rising mortgage interest rates and increasing economic concerns have reduced both housing market activity and customer borrowing capacity, resulting in modest house price declines year on year. These challenging market conditions are likely to continue in 2024 as the effect of higher interest rates continues to feed through to disposable incomes, especially in London and the South East of the UK where the Group has a high exposure. Additionally, as mortgages roll off existing rates onto new higher rates, there is a risk of increased borrower defaults. This could put further downward pressure on property prices and, in turn, impact the Group’s impairment and capital position. Furthermore, certain segments of the housing market could be subject to specific valuation impacts (for example, certain properties within the Group's residential loan portfolio may be subject to remediation activities relating to fire safety standards). The Group’s corporate exposure is conservatively positioned with low LTVs but remains vulnerable to a deteriorating economic environment, and moderate stress has been experienced in the Group's (predominantly) US office commercial real estate exposure during 2023. As structural shifts in working patterns, such as the normalisation of ‘hybrid’ working, mature, the Group remains exposed to further stress. Landlords serving business tenants whose income is based on discretionary consumer spending are also at risk from reduced rent collection. • Leveraged Finance Underwriting:the Group takes on non-investment grade underwriting exposures, including single name risk, particularly in the US and the UK. The subdued investor appetite in the underwriting market during 2023 exposed the Group to extended underwriting periods and negative movements in marks, which could deteriorate further and result in losses for the Group (and higher capital charges) if market conditions remain challenging during 2024 and exposures remain on book for further extended periods. • Oil & Gas sector: high market energy prices during 2023 have helped restore balance sheet strength to companies operating in this sector. However, in the longer term, costs associated with the transition towards renewable sources of energy may place greater financial demands on oil and gas companies. • Air Travel: the sector returned to profit in 2023 as lower margin (tourist) demand for air travel recovered to pre-pandemic levels. That said, there remains a heightened risk to the revenue streams of the Group’s clients and, consequentially, their ability to service debt obligation. These risks stem from the structural decline in higher margin business travel, consolidation within the European airline market, reputational damage and/or costs associated with the emerging ‘fake parts’ scandal, volatile oil prices, increasingly extreme weather patterns and concerns about the impact of air travel on climate change. • Information Technology sector: while dominated by well-known US firms, many companies struggle to monetise their product offerings and face increasing reputational risk particularly as regulatory scrutiny increases. Given the nature of their activities, the Group’s clients in this sector face heightened risk from data security breaches and ransomware and/or cyber attacks as well as from the malicious use of Artificial Intelligence, all of which could negatively impact their ability to service debt obligations. The Group also has large individual exposures to single name counterparties (such as brokers, central clearing houses, dealers, banks, mutual and hedge funds, and other institutional clients) in both its lending and trading activities, including derivative trades. The default of one such counterparty could cause contagion across clients involved in similar activities and/or adversely impact asset values should margin calls necessitate rapid asset disposals by that counterparty to raise liquidity. In addition, where such counterparty risk has been mitigated by taking collateral, credit risk may remain high if the collateral held cannot be monetised or has to be liquidated at prices which are insufficient to recover the full amount of the loan or derivative exposure. Any such defaults could have a material adverse effect on the Group’s results due to, for example, increased credit losses and higher impairment charges. Impact to the creditworthiness of the Group's clients, customers and Strategy Climate and sustainability report Governance Risk review Financial review Financial statements Barclays PLC 2023 Annual Report on Form 20-F 192 Material existing and emerging risks (continued)
counterparties (particularly in high carbon sectors), can also arise out of climate- related legal actions or investigations commenced against the Group's clients, customers and counterparties (particularly in high carbon sectors), where outcomes of such actions have material financial impacts, which can in turn increase credit risk within Group portfolios. + For further details on the Group’s approach to credit risk, refer to the credit risk management and credit risk performance sections. iii) Market risk Market risk is the risk of loss arising from potential adverse changes in the value of the Group’s assets and liabilities from fluctuation in market variables including, but not limited to, interest rates, foreign exchange rates, equity prices, commodity prices, credit spreads, implied volatilities and asset correlations. Economic and financial market uncertainties remain elevated, driven by elevated inflation and tightening monetary policy, both of which are exacerbated by geopolitical conflicts and idiosyncratic market events. A disruptive adjustment to higher or lower interest rate levels and deteriorating trade and geopolitical tensions could heighten market risks for the Group’s portfolios. In addition, the Group’s trading business could be vulnerable were there to be prolonged period of elevated asset price volatility, particularly if it adversely affects market liquidity. Such a scenario could impact the Group’s ability to execute client trades and may also result in lower client flow-driven income and/or market-based losses on its existing portfolio of assets. These can include higher hedging costs from rebalancing risks that need to be managed dynamically as market levels and their associated volatilities change. Changes in market conditions could have a material adverse effect on the Group’s business, results of operations, financial condition and prospects. + For further details on the Group’s approach to market risk, refer to the market risk management and market risk performance sections. iv) Treasury and capital risk There are three primary types of treasury and capital risk faced by the Group: a) Liquidity risk Liquidity risk is the risk that the Group is unable to meet its contractual or contingent obligations or that it does not have the appropriate amount, tenor and composition of funding and liquidity to support its assets. This could cause the Group to fail to meet regulatory and/or internal liquidity requirements, make repayments of principal or interest as they fall due or to support day-to-day business activities. Key liquidity risks that the Group faces include: • Stability of the Group’s deposit funding profile: deposits which are payable on demand or at short notice could be adversely affected by the Group failing to preserve the current level of customer and investor confidence or as a result of competition in the banking industry. • Ongoing access to wholesale funding: the Group regularly accesses the money and capital markets to provide short- term and long-term unsecured and secured funding to support its operations. A loss of counterparty confidence, or adverse market conditions (such as the recent rises in interest rates) could lead to a reduction in the tenor, or an increase in the costs, of the Group’s unsecured and secured wholesale funding or affect the Group’s access to such funding. • Impacts of market volatility: adverse market conditions, with increased volatility in asset prices could: (i) negatively impact the Group’s liquidity position through increased derivative margin requirements and/or wider haircuts when monetising liquidity pool securities; and (ii) make it more difficult for the Group to execute secured financing transactions. • Intraday liquidity usage: increased collateral requirements for payments and securities settlement systems could negatively impact the Group’s liquidity position, as cash and liquid assets required for intraday purposes are unavailable to meet other outflows. • Off-balance sheet commitments: deterioration in economic and market conditions could cause customers to draw on off-balance sheet commitments provided to them, for example revolving credit facilities, negatively affecting the Group’s liquidity position. • Credit rating changes and impact on funding costs: any reductions in a credit rating (in particular, any downgrade below investment grade) may affect the Group’s access to money or capital markets and/or the terms on which the Group is able to obtain market funding (for example, this could lead to increased costs of funding and wider credit spreads, the triggering of additional collateral or other requirements in derivative contracts and other secured funding arrangements, or limits on the range of counterparties who are willing to enter into transactions with the Group). b) Capital risk Capital risk is the risk that the Group has an insufficient level or composition of capital to support its normal business activities and to meet its regulatory capital requirements under normal operating environments and stressed conditions (both actual and as defined for internal planning or regulatory stress testing purposes). This also includes the risk from the Group’s pension plans. Key capital risks that the Group faces include: • Failure to meet prudential capital requirements: this could lead to the Group being unable to support some or all of its business activities, a failure to pass regulatory stress tests, increased cost of funding due to deterioration in investor appetite or credit ratings and restrictions on distributions (including in respect of its shares and/or additional tier 1 instruments), leading to an inability to comply with the Group's distribution policy and/or the need to take additional measures to strengthen the Group’s capital or leverage position. • Adverse changes in FX rates impacting capital ratios: the Group has capital resources, risk weighted assets and leverage exposures denominated in foreign currencies. Changes in foreign currency exchange rates may adversely impact the sterling equivalent value of these items. As a result, the Group’s regulatory capital ratios are sensitive to foreign currency movements. Failure to appropriately manage the Group’s balance sheet to take account of foreign currency movements could result in an adverse impact on the Group’s regulatory capital and leverage ratios. • Adverse movements in the pension fund: adverse movements in pension assets and liabilities for defined benefit pension schemes could result in deficits on a technical provision and/or IAS 19 accounting basis. This could lead to the Group making substantial additional contributions to its pension plans and/or a deterioration in its capital position. The market value of pension fund assets might decline or investment returns might reduce. Under IAS 19, the liabilities discount rate is derived from the yields of high-quality corporate bonds. Therefore, the valuation of the Group’s defined benefits schemes would be adversely affected by a prolonged fall in the discount rate due to a persistent low interest rate and/or Strategy Climate and sustainability report Governance Risk review Financial review Financial statements Barclays PLC 2023 Annual Report on Form 20-F 193 Material existing and emerging risks (continued)
credit spread environment. Inflation is another significant risk driver to the pension fund as the liabilities are adversely impacted by an increase in long-term inflation expectations. c) Interest rate risk in the banking book Interest rate risk in the banking book is the risk that the Group is exposed to capital or income volatility because of a mismatch between the interest rate exposures of its (non-traded) assets and liabilities. The Group’s hedging programmes for interest rate risk in the banking book rely on behavioural assumptions and, as a result, the effectiveness of the hedging strategy cannot be guaranteed. A potential mismatch in the balance or duration of the hedging assumptions could lead to earnings deterioration if there are interest rate movements which are not adequately hedged. A decline in interest rates may also compress net interest margin on retail and corporate portfolios. In addition, the Group’s liquid asset portfolio is exposed to potential capital and/or income volatility due to movements in market rates and prices which may have a material adverse effect on the capital position of the Group. + For further details on the Group’s approach to treasury and capital risk, refer to the treasury and capital risk management and treasury and capital risk performance sections. v) Operational risk Operational risk is the risk of loss to the Group from inadequate or failed processes or systems, human factors or due to external events where the root cause is not due to credit or market risks. Examples include: a) Operational resilience The Group functions in a highly competitive market, with customers and clients that expect consistent and smooth business processes. The loss of or disruption to business processing is a material inherent risk within the Group and across the financial services industry, whether arising through failures in the Group’s technology systems, cyber and/or data integrity disruptions, unavailability of a Group site, closure of real estate services provided through its retail branch network, or unavailability of personnel or services supplied by third parties, and there are particular challenges with recovering from a major cyberattack. Failure to build resilience and recovery capabilities into business processes, or into the services on which the Group’s business processes depend, may result in significant customer detriment, costs to reimburse losses incurred by the Group’s customers and clients, and reputational damage. b) Cyberattacks Cyberattacks continue to be a global threat inherent across all industries, with the number and severity of attacks continuing to rise. The financial sector remains a primary target for cybercriminals, hostile nation states, opportunists and hacktivists. The Group, like other financial institutions, experiences numerous attempts to compromise its cybersecurity protections. In 2023, cybersecurity incidents experienced by Barclays included distributed denial of service (DDoS), phishing, credential stuffing, and exploitation of software vulnerabilities. The Group cannot provide absolute security against cyberattacks. Malicious actors, who are increasingly sophisticated in their methods, tactics, techniques and procedures, seek to steal money, gain unauthorised access to, destroy or manipulate data, and disrupt operations. Further, some of their attacks may not be recognised or discovered until launched or after initial entry into the environment, such as novel or zero-day attacks that are launched before patches are available and defences can be readied. Other attacks may take advantage of the window during which patching or the deployment of other defences is underway, but not yet complete. Malicious actors are also increasingly developing methods to avoid prevention, detection and alerting capabilities, including employing counter- forensic tactics making response activities more difficult. Cyberattacks can originate from a wide variety of sources and target the Group in numerous ways, including attacks on networks, systems, applications or devices used by the Group or parties such as service providers and other suppliers, counterparties, employees, contractors, customers or clients, presenting the Group with a vast and complex defence perimeter. Moreover, the Group does not have direct control over the cybersecurity of the systems of its clients, customers, counterparties and third-party service providers and suppliers, limiting the Group’s ability to effectively protect and defend against certain threats Some of the Group’s third-party service providers and suppliers have experienced successful attempts to compromise their cybersecurity. These have included ransomware attacks that have disrupted the service providers’ or suppliers’ operations and, in some cases, have had impacts on the Group's operations. Such cyberattacks are likely to continue. A failure in the Group’s adherence to its cybersecurity policies, procedures or controls, employee malfeasance, and human, governance or technological error could also compromise the Group’s ability to successfully prevent and defend against cyberattacks. Furthermore, certain legacy technologies that are at or approaching end-of-life may not be able to maintain acceptable levels of security. The Group has experienced cybersecurity incidents and near-misses in the past, and it is inevitable that additional incidents will occur in the future. Cybersecurity risks are expected to increase, due to factors such as the increasing demand across the industry and customer expectations for continued expansion of services delivered over the Internet; increasing reliance on Internet-based products, applications and data storage; the onset of AI, which may be used to facilitate increasingly sophisticated attacks; and changes in ways of working by the Group’s employees, contractors, and third party service providers and suppliers and their subcontractors as a long-term consequence of the COVID-19 pandemic. Bad actors have taken advantage of remote working practices and modified customer behaviours, exploiting the situation in novel ways that may elude defences. Additionally, geopolitical turmoil may serve to increase the risk of a cyberattack that could impact Barclays directly, or indirectly through its critical suppliers or national infrastructure. In recent years, the Group has faced a heightened risk of cyberattack as a result of the conflicts in Eastern Europe and the Middle East. Common types of cyberattacks include deployment of malware to obtain covert access to systems and data; ransomware attacks that render systems and data unavailable through encryption and attempts to leverage business interruption or stolen data for extortion; novel or zero- day exploits; denial of service and distributed denial of service attacks; infiltration via business email compromise; social engineering, including phishing, vishing and smishing; automated attacks using botnets; third-party customer, vendor, service provider and supplier account takeover; malicious activity facilitated by an insider; and credential validation or stuffing attacks using login and password pairs from unrelated breaches. A successful cyberattack of any type has the potential to cause serious harm to the Group or its clients and customers, including exposure to potential contractual liability, claims, litigation, regulatory or other government action, loss of existing or potential customers, damage to the Group’s brand and reputation, and other financial loss. The Strategy Climate and sustainability report Governance Risk review Financial review Financial statements Barclays PLC 2023 Annual Report on Form 20-F 194 Material existing and emerging risks (continued)
impact of a successful cyberattack is also likely to include operational consequences (such as unavailability of services, networks, systems, devices or data), remediation of which could come at significant cost. Regulators worldwide continue to recognise cybersecurity as a systemic risk to the financial sector and have highlighted the need for financial institutions to improve their monitoring and control of, and resilience to, cyberattacks. A successful cyberattack may, therefore, result in significant regulatory fines on the Group. In addition, any new regulatory measures introduced to mitigate these risks are likely to result in increased technology and compliance costs for the Group. + For further details on the Group’s approach to cyberattacks, see the operational risk performance section. For further details on cybersecurity regulation applicable to the Group, refer to the Supervision and regulation section. c) New and emergent technology Technology is fundamental to the Group’s business and the financial services industry. Technological advancements present opportunities to develop new and innovative ways of doing business across the Group, with new solutions being developed both in-house and in association with third party companies. For example, payment services and securities, futures and options trading are increasingly occurring electronically, both on the Group’s own systems and through other alternative systems, and becoming automated. Whilst increased use of electronic payment and trading systems and direct electronic access to trading markets could significantly reduce the Group’s cost base, it may, conversely, reduce the commissions, fees and margins made by the Group on these transactions which could have a material adverse effect on the Group’s business, results of operations, financial condition and prospects. The rapid development in AI is another area the Group is monitoring closely. This includes the identification of potential use cases for responsible adoption of AI in the Group's own operations as well as managing the threats third party usage of AI may pose, including with respect to cybersecurity and fraud. Introducing new forms of technology, however, has the potential to increase inherent risk. Failure to evaluate, actively manage and closely monitor risk during all phases of business development and implementation could introduce new vulnerabilities and security flaws and have a material adverse effect on the Group’s business, results of operations, financial condition and prospects. d) External fraud The nature of fraud is wide-ranging and continues to evolve, as criminals seek opportunities to target the Group’s business activities and exploit changes in customer behaviour and product and channel use (such as the increased use of digital products and enhanced online services) or exploit new products. Fraud attacks can be very sophisticated and are often orchestrated by organised crime groups who use various techniques to target customers and clients directly to obtain confidential or personal information that can be used to commit fraud. The UK market has also seen significant growth in ‘scams’ where the Group takes increased levels of liability as part of a voluntary code to provide additional safeguards to customers and clients who are tricked into making payments to fraudsters. The impact from fraud can lead to customer detriment, financial losses (including the reimbursement of losses incurred by customers), loss of business, missed business opportunities and reputational damage, all of which could have a material adverse impact on the Group’s business, results of operations, financial condition and prospects. e) Data management and information protection The Group holds and processes large volumes of data, including personal information, financial data and other confidential information, and the Group’s businesses are subject to complex and evolving laws and regulations governing the privacy and protection of data, including Regulation (EU) 2016/679 (the General Data Protection Regulation as it applies in the EU and the UK). This data could relate to: (i) the Group’s clients, customers, prospective clients and customers and their employees; (ii) clients and customers of the Group’s clients and customers and their employees;(iii) the Group’s suppliers, counterparties and other external parties, and their employees; and (iv) the Group’s employees and prospective employees. The international nature of both the Group’s business and its IT infrastructure also means that data and personal information may be available in countries other than those from where the information originated. Accordingly, the Group must ensure that its collection, use, transfer and storage of data, including personal information, complies with all applicable laws and regulations in all relevant jurisdictions, which could: (i) increase the Group’s compliance and operating costs; (ii) impact the development of new products or services or the offering of existing products or services; (iii) affect how products and services are offered to clients and customers; (iv) demand significant oversight by the Group’s management; and (v) require the Group to review some elements of the structure of its businesses, operations and systems in less efficient ways. Concerns regarding the effectiveness of the Group’s measures to safeguard data, including personal information, or even the perception that those measures are inadequate, could expose the Group to the risk of loss or unavailability of data or data integrity issues and/or cause the Group to lose existing or potential clients and customers, and thereby reduce the Group’s revenues. Furthermore, any failure or perceived failure by the Group to comply with applicable privacy or data protection laws and regulations may subject it to potential contractual liability, claims, litigation, regulatory or other government action (including significant regulatory fines) and require changes to certain operations or practices which could also inhibit the Group’s development or marketing of certain products or services, or increase the costs of offering them to customers. Any of these events could damage the Group’s reputation, subject the Group to material fines or other monetary penalties, make the Group liable for the payment of compensatory damages, divert management's time and attention, lead to enhanced regulatory oversight and otherwise materially adversely affect its business, results of operations, financial condition and prospects. + For further details on data protection regulation applicable to the Group, refer to the supervision and regulation section. f) Algorithmic trading In some areas of the investment banking business, trading algorithms are used to price and risk manage client and principal transactions. An algorithmic error could result in erroneous or duplicated transactions, a system outage, or impact the Group’s pricing abilities, which could have a material adverse effect on the Group’s business, results of operations, financial condition, prospects and reputation. g) Processing errors The Group’s businesses are highly dependent on its ability to process and monitor, on a daily basis, a very large number of transactions, many of which are Strategy Climate and sustainability report Governance Risk review Financial review Financial statements Barclays PLC 2023 Annual Report on Form 20-F 195 Material existing and emerging risks (continued)
highly complex and occur at high volumes and frequencies, across numerous and diverse markets in many currencies. As the Group’s customer base and geographical reach expand and the volume, speed, frequency and complexity of transactions, especially electronic transactions (as well as the requirements to report such transactions on a real-time basis to clients, regulators and exchanges) increase, developing, maintaining and upgrading operational systems and infrastructure becomes more challenging. The risk of systems or human error in connection with such transactions increases with these developments, as well as the potential consequences of such errors due to the speed and volume of transactions involved and the potential difficulty associated with discovering errors quickly enough to limit the resulting consequences. Furthermore, events that are wholly or partially beyond the Group’s control, such as a spike in transaction volume, could adversely affect the Group’s ability to process transactions or provide banking and payment services. Processing errors could result in the Group, among other things: (i) failing to provide information, services and liquidity to clients and counterparties in a timely manner; (ii) failing to settle and/or confirm transactions; (iii) causing funds transfers, capital markets trades and/or other transactions to be executed erroneously, illegally or with unintended consequences; and (iv) adversely affecting financial, trading or currency markets. Any of these events could materially disadvantage the Group’s customers, clients and counterparties (including them suffering financial loss) and/or result in a loss of confidence in the Group which, in turn, could have a material adverse effect on the Group’s business, results of operations, financial condition and prospects. Any of these events could also lead to breaches of laws, rules or regulations and, hence, regulatory enforcement actions, which could result in significant financial loss, imposition of additional capital requirements, enhanced regulatory supervision and reputational damage. h) Supplier exposure The Group depends on suppliers for the provision of many of its services and the development of technology. Whilst the Group depends on suppliers, it remains fully accountable to its customers and clients for risks arising from the actions of suppliers and may not be able to recover from its suppliers any amounts paid to customers and clients for losses suffered by them. The dependency on suppliers and sub-contracting of outsourced services introduces concentration risk where the failure of specific suppliers could have an impact on the Group’s ability to continue to provide material services to its customers. Failure to adequately manage supplier risk could have a material adverse effect on the Group’s business, results of operations, financial condition and prospects. i) Estimates and judgements relating to critical accounting policies and regulatory disclosures The preparation of financial statements requires the application of accounting policies and judgements to be made in accordance with IFRS. Regulatory returns and capital disclosures are prepared in accordance with the relevant capital reporting requirements and also require assumptions and estimates to be made. The key areas involving a higher degree of judgement or complexity, or areas where assumptions are significant to the consolidated and individual financial statements and regulatory returns and disclosures, include credit impairment provisions, taxes, fair value of financial instruments, goodwill and intangible assets, pensions and post-retirement benefits, the calculation of RWAs and capital, and provisions including conduct and legal, competition and regulatory matters (please refer to the notes to the audited financial statements for further details). There is a risk that if the judgement exercised, or the estimates or assumptions used, subsequently turn out to be incorrect or are altered as a result of subsequent feedback from the Group's regulators, this could result in material losses to the Group, beyond what was anticipated or provided for, including as a result of changes to treatments in regulatory returns and capital disclosures. If capital requirements are not met as the result of changes in interpretation, compliance with the Group's distribution policy could be impacted and/or additional measures may be required to strengthen the Group's capital or leverage position, which may also lead to the Group's inability to achieve stated targets. Further development of accounting standards and regulatory interpretations could also materially impact the Group’s results of operations, financial condition and prospects. j) Tax risk The Group is required to comply with the domestic and international tax laws and practice of all countries in which it has business operations. There is a risk that the Group could suffer losses due to additional tax charges, other financial costs or reputational damage as a result of failing to comply with such laws and practice (including where the Group’s interpretation of such laws differs from the interpretation of tax authorities), or by failing to manage its tax affairs in an appropriate manner, with much of this risk attributable to the international structure of the Group. In addition, the introduction of new international tax regimes, increasing tax authority focus on reporting and disclosure requirements around the world as well as the digitisation of the administration of tax have the potential to increase the Group’s tax compliance obligations further. In 2023, the UK Government enacted legislation on the OECD Inclusive Framework on Base Erosion and Profit Shifting Pillar Two Framework introducing a global minimum tax rate of 15%. The UK’s Pillar Two rules apply for accounting periods beginning on or after 31 December 2023 which will increase the Group's tax compliance obligations. In the USA, the corporate alternative minimum tax on adjusted financial statements income introduced by the Inflation Reduction Act became effective on 1 January 2023. These new tax regimes require systems and process changes that introduce potential additional operational risks. k) Ability to hire and retain appropriately qualified employees As a regulated financial institution, the Group requires diversified and specialist skilled colleagues. The Group’s ability to attract, develop and retain a diverse mix of talent is key to the delivery of its core business activity and strategy. This is impacted by a range of external and internal factors, such as macroeconomic factors, labour and immigration policy in the jurisdictions in which the Group operates, industry-wide headcount reductions in particular sectors, regulatory limits on compensation for senior executives and the potential effects on employee engagement and wellbeing from long-term periods of working remotely. Failure to attract or prevent the departure of appropriately qualified and skilled employees could have a material adverse effect on the Group’s business, results of operations, financial condition and prospects. Additionally, this may result in Strategy Climate and sustainability report Governance Risk review Financial review Financial statements Barclays PLC 2023 Annual Report on Form 20-F 196 Material existing and emerging risks (continued)
disruption to service which could in turn lead to customer detriment and reputational damage. + For further details on the Group’s approach to operational risk, refer to the operational risk management and operational risk performance sections. vi) Model risk Model risk is the potential for adverse consequences from decisions based on incorrect or misused model outputs and reports. The Group relies on models to support a broad range of business and risk management activities, including informing business decisions and strategies, measuring and limiting risk, valuing exposures (including the calculation of impairment), conducting stress testing, calculating RWAs and assessing capital adequacy, supporting new business acceptance, risk and reward evaluation, managing client assets, and meeting reporting requirements. Models are, by their nature, imperfect representations of reality and have some degree of uncertainty because they rely on assumptions and inputs, and so are subject to intrinsic uncertainty, errors and inappropriate use affecting the accuracy of their outputs. This may be exacerbated when dealing with unprecedented scenarios, as was the case during the COVID-19 pandemic, due to the lack of reliable historical reference points and data. For instance, the quality of the data used in models across the Group has a material impact on the accuracy and completeness of its risk and financial metrics. Model uncertainty, errors and inappropriate use may result in (among other things) the Group making inappropriate business decisions and/or inaccuracies or errors in the Group’s risk management and regulatory reporting processes. This could result in significant financial loss, imposition of additional capital requirements, enhanced regulatory supervision and reputational damage, all of which could have a material adverse effect on the Group’s business, results of operations, financial condition and prospects. + For further details on the Group’s approach to model risk, refer to the model risk management and model risk performance sections. vii) Compliance risk Compliance risk is the risk of poor outcomes for, or harm to, customers, clients and markets, arising from the delivery of the Group's products and services (conduct risk) and the risk to Barclays, its clients, customers or markets from a failure to comply with the laws, rules and regulations (LRR) applicable to the firm. This risk could manifest itself in a variety of ways, including: a) Market conduct The Group’s businesses are exposed to risk from potential non-compliance with its policies and standards (which incorporates regulatory requirements set by law and our regulators) and instances of wilful and negligent misconduct by employees, all of which could result in potential customer and client detriment, enforcement action (including regulatory fines and/or sanctions), increased operation and compliance costs, redress or remediation or reputational damage which in turn could have a material adverse effect on the Group’s business, financial condition and prospects. Examples of employee misconduct which could have a material adverse effect on the Group’s business include: (i) improperly selling or marketing the Group’s products and services; (ii) engaging in insider trading, market manipulation or unauthorised trading; or (iii) misappropriating confidential or proprietary information belonging to the Group, its customers or third parties. These risks may be exacerbated in circumstances where the Group is unable to rely on physical oversight and supervision of employees, noting the move to a hybrid working model for many colleagues. b) Customer protection The Group must ensure that its customers, particularly those that are vulnerable, are able to make well-informed decisions on how best to use the Group’s financial services and understand the protection available to them if something goes wrong. Poor customer outcomes can result from the failure to: (i) communicate fairly and clearly with customers; (ii) provide services in a timely and fair manner; (iii) handle and protect customer data appropriately; and (iv) undertake appropriate activity to address customer detriment, including the adherence to regulatory and legal requirements on complaint handling. The Group is at risk of financial loss and reputational damage as a result also a risk of regulatory censure or enforcement action. In July 2023, the FCA’s new Consumer Duty came into force for new and existing products or services that are open to sale or renewal. It will apply to closed products and services from 31 July 2024. The duty sets higher expectations for the standard of care that firms provide to retail customers and impacts all aspects of Barclays’ retail businesses, including every retail customer journey, product and service as well as our relationships with partners, suppliers and third parties. This has resulted in significant implementation costs and there will also be higher ongoing costs for the industry as a result of extensive monitoring and evidential requirements. c) Product design and review risk Products and services must meet the needs of clients, customers, markets and the Group throughout their life cycle, However, there is a risk that the design and review of the Group’s products and services fail to reasonably consider and address potential or actual negative outcomes for customers, which may result in customer detriment, enforcement action (including regulatory fines and/or sanctions), redress and remediation and reputational damage. Both the design and review of products and services are a key area of focus for regulators and the Group. d) Financial crime The Group may be adversely affected if it fails to effectively mitigate the risk that third parties or its employees facilitate, or that its products and services are used to facilitate, financial crime (money laundering, terrorist financing, breaches of economic and financial sanctions, bribery and corruption, and the facilitation of tax evasion). UK and US regulations covering financial institutions continue to focus on combating financial crime. Failure to comply may lead to enforcement or other action by the Group’s regulators, including severe penalties, which may have a material adverse effect on the Group’s business, financial condition, prospects and reputation. e) Conflicts of interest Identifying and managing conflicts of interest is fundamental to the conduct of the Group's business, relationships with customers and clients, and the markets in which the Group operates. Understanding the Conflicts of Interest that impact or potentially impact the Group enables them to be identified, managed and mitigated appropriately. Even if there is no evidence of improper actions, a conflict of interest can create an appearance of impropriety that undermines confidence in the Group and its employees. If the Group does not identify and manage conflicts of interest (business or personal) appropriately, it could have an adverse effect on the Group’s business, customers and the markets within which it operates. f) Regulatory focus on culture and accountability Regulators around the world continue to emphasise the importance of culture and personal accountability and enforce the adoption of adequate internal reporting and whistleblowing procedures to help to Strategy Climate and sustainability report Governance Risk review Financial review Financial statements Barclays PLC 2023 Annual Report on Form 20-F 197 Material existing and emerging risks (continued)
promote appropriate conduct and drive positive outcomes for customers, colleagues, clients and markets. The requirements and expectations of the UK Senior Managers Regime, Certification Regime and Conduct Rules reinforce additional accountabilities for individuals across the Group, with an increased focus on governance and rigour, with similar requirements also introduced in other jurisdictions globally. Failure to meet these requirements and expectations may lead to regulatory sanctions, both for the individuals and the Group. g) Laws, rules and regulations Barclays is subject to range of laws, rules and regulations across the world. A failure to comply with these may have an adverse effect on the Barclays Bank Group’s business, customers and the markets within which it operates and could result in reputational damage, penalties, damages or fines. + For further details on the Group’s approach to compliance risk, refer to the compliance risk management and compliance risk performance sections. viii) Reputation risk Reputation risk is the risk that an action, transaction, investment, event, decision or business relationship will reduce trust in the Group’s integrity and/or competence. Any material lapse in standards of integrity, compliance, customer service or operating efficiency may represent a potential reputation risk. Stakeholder expectations constantly evolve, and so reputation risk is dynamic and varies between geographical regions, groups and individuals. A risk arising in one business area can have an adverse effect upon the Group’s overall reputation and any one transaction, investment or event (in the perception of key stakeholders) can reduce trust in the Group’s integrity and competence. The Group’s association with sensitive topics and sectors has been, and in some instances continues to be, an area of concern for stakeholders, including: (i) the financing of, and investments in, businesses which operate in sectors that are sensitive because of their relative carbon intensity or local environmental impact; (ii) potential association with human rights violations (including combating modern slavery) in the Group’s operations or supply chain and by clients and customers; and (iii) the financing of businesses which manufacture and export military and riot control goods and services. Reputation risk could also arise from negative public opinion about the actual, or perceived, manner in which the Group (including its employees, clients and other associations) conducts its business activities, or the Group’s financial performance, as well as actual or perceived practices in banking and the financial services industry generally. Modern technologies, in particular, online social media channels and other broadcast tools that facilitate communication with large audiences in short time frames and with minimal costs, may significantly enhance and accelerate the distribution and effect of damaging information and allegations. Negative public opinion may adversely affect the Group’s ability to retain and attract customers, in particular, corporate and retail depositors, and to retain and motivate staff, and could have a material adverse effect on the Group’s business, results of operations, financial condition and prospects. Claims of potential greenwashing arising from sustainability-related statements made by Barclays may also give rise to reputation risk. In addition to the above, reputation risk has the potential to arise from operational issues or conduct matters which cause detriment to customers, clients, market integrity, effective competition or the Group (refer to ‘v) Operational risk’ above). + For further details on the Group’s approach to reputation risk, refer to the reputation risk management and reputation risk performance sections. ix) Legal risk and legal, competition and regulatory matters The Group conducts activities in a highly regulated global market which exposes it and its employees to legal risk arising from: (i) the multitude of laws, rules and regulations that apply to the businesses it operates, which are highly dynamic, may vary between jurisdictions and/or conflict, and may be unclear in their application to particular circumstances especially in new and emerging areas; and (ii) the diversified and evolving nature of the Group’s businesses and business practices. In each case, this exposes the Group and its employees to the risk of loss or the imposition of penalties, damages or fines from the failure of members of the Group to meet applicable laws, rules, regulations or contractual requirements or to assert or defend their intellectual property rights. Legal risk may arise in relation to any number of the material existing and emerging risks identified above. A breach of applicable laws, rules and/or regulations by the Group or its employees could result in criminal prosecution, regulatory censure, potentially significant fines and other sanctions in the jurisdictions in which the Group operates. Where clients, customers or other third parties are harmed by the Group’s conduct, this may also give rise to civil legal proceedings, including class actions. Other legal disputes may also arise between the Group and third parties relating to matters such as breaches or enforcement of legal rights or obligations arising under contracts, statutes or common law. Adverse findings in any such matters may result in the Group being liable to third parties or may result in the Group’s rights not being enforced or not being enforced in the manner intended or desired by the Group. Details of legal, competition and regulatory matters to which the Group is currently exposed are set out in Note 25. In addition to matters specifically described in Note 25, the Group is engaged in various other legal proceedings which arise in the ordinary course of business. The Group is also subject to requests for information, investigations and other reviews (including skilled person reviews) by regulators, governmental and other public bodies. These may be in connection with business activities in which the Group is, or has been, engaged, or areas of particular regulatory focus, such as financial crime, money laundering or terrorist financing. The Group may also (from time to time) be subject to claims and/or legal proceedings and other investigations relating to financial and non- financial disclosures made by members of the Group (including, but not limited to, regulatory capital and liquidity reporting and ESG disclosures). Additionally, due to the increasing number of new climate and sustainability-related laws and regulations, growing demand from investors and customers for sustainable products and services, and regulatory and NGO scrutiny, financial institutions, including the Group, may through their business activities face increasing litigation, conduct, enforcement and contract liability risks related to climate change, environmental degradation and other social, governance and sustainability-related issues, including greenwashing risk. Strategy Climate and sustainability report Governance Risk review Financial review Financial statements Barclays PLC 2023 Annual Report on Form 20-F 198 Material existing and emerging risks (continued)
This may include laws and regulatory processes and policies seeking to restrict or prohibit doing certain business with entities identified as "boycotting" or "discriminating" against particular industries or considering ESG factors in their investment processes, including to protect the energy and other high carbon sectors from any risks of divestment or challenges in accessing finance. Furthermore, there is a risk that shareholders, campaign groups, customers and other interest groups could seek to take legal action (including under "soft law" mechanisms) against the Group for financing or contributing to climate change and environmental degradation or because the Group's response to climate change or other ESG factors is perceived to be ineffective, insufficient or inappropriate. The outcome of legal, competition and regulatory matters, both those to which the Group is currently exposed and any others which may arise in the future, is difficult to predict (and any provision made in the Group’s financial statements relating to those matters may not be sufficient to cover actual losses). In connection with such matters, the Group may incur significant expense, regardless of the ultimate outcome, and any such matters could expose the Group to any of the following outcomes: substantial monetary damages, settlements and/or fines; remediation of affected customers and clients; other penalties and injunctive relief; additional litigation; criminal prosecution; the loss of any existing agreed protection from prosecution; regulatory restrictions on the Group’s business operations including the withdrawal of authorisations; increased regulatory compliance requirements or changes to laws or regulations; suspension of operations; public reprimands or censure; loss of significant assets or business; a negative effect on the Group’s reputation; loss of confidence by investors, counterparties, clients and/or customers; risk of credit rating agency downgrades; potential negative impact on the availability and/or cost of funding and liquidity; and/or dismissal or resignation of key individuals. In light of the uncertainties involved in legal, competition and regulatory matters, there can be no assurance that the outcome of a particular matter or matters (including formerly active matters or those arising after the date of this Annual Report) will not have a material adverse effect on the Group’s business, results of operations, financial condition and prospects. Strategy Climate and sustainability report Governance Risk review Financial review Financial statements Barclays PLC 2023 Annual Report on Form 20-F 199 Material existing and emerging risks (continued)
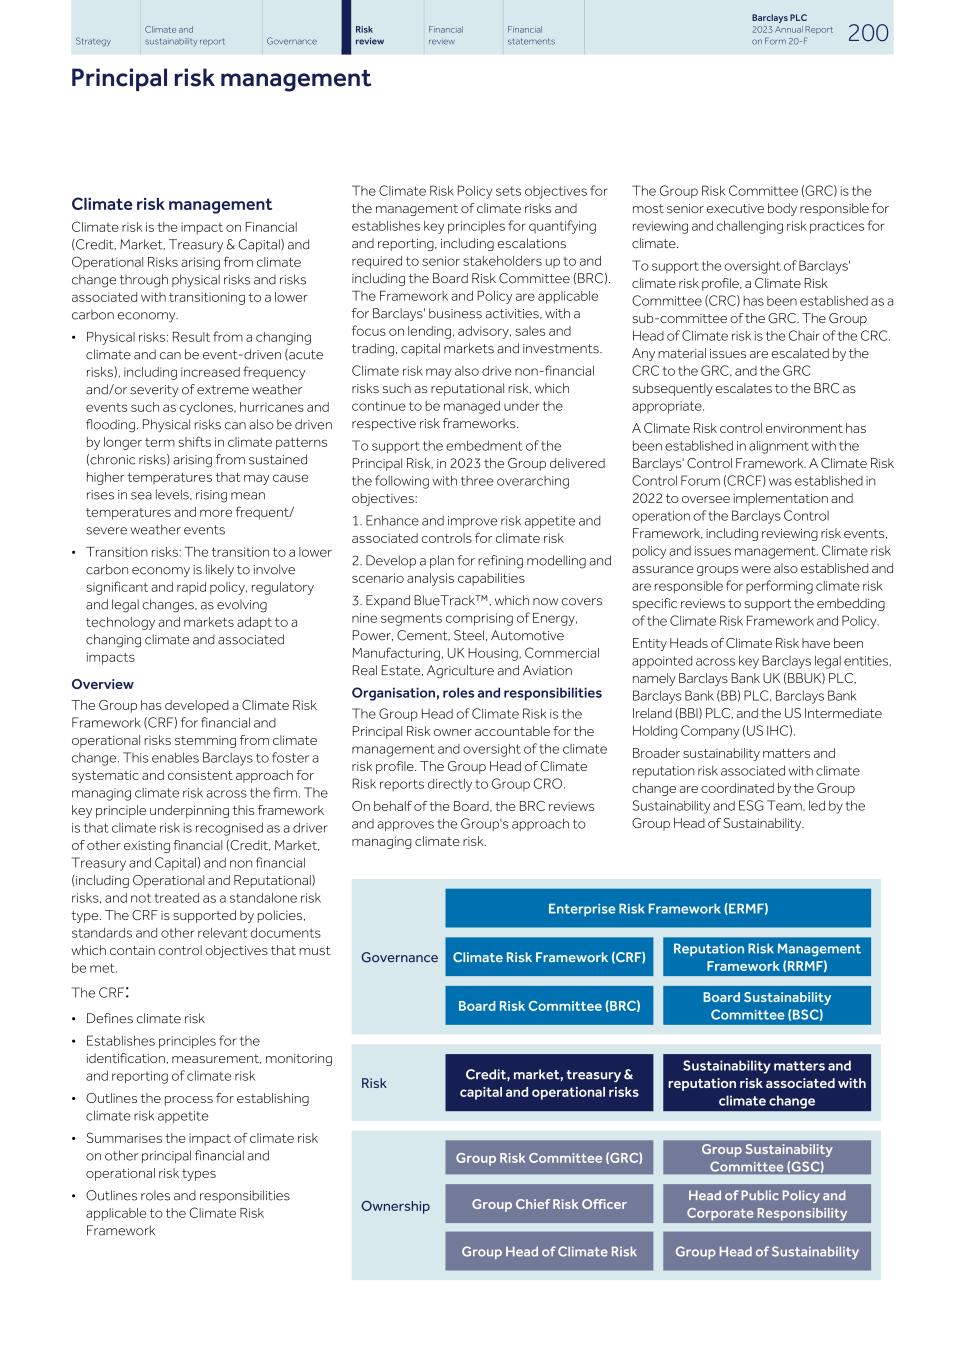
Climate risk management Climate risk is the impact on Financial (Credit, Market, Treasury & Capital) and Operational Risks arising from climate change through physical risks and risks associated with transitioning to a lower carbon economy. • Physical risks: Result from a changing climate and can be event-driven (acute risks), including increased frequency and/or severity of extreme weather events such as cyclones, hurricanes and flooding. Physical risks can also be driven by longer term shifts in climate patterns (chronic risks) arising from sustained higher temperatures that may cause rises in sea levels, rising mean temperatures and more frequent/ severe weather events • Transition risks: The transition to a lower carbon economy is likely to involve significant and rapid policy, regulatory and legal changes, as evolving technology and markets adapt to a changing climate and associated impacts Overview The Group has developed a Climate Risk Framework (CRF) for financial and operational risks stemming from climate change. This enables Barclays to foster a systematic and consistent approach for managing climate risk across the firm. The key principle underpinning this framework is that climate risk is recognised as a driver of other existing financial (Credit, Market, Treasury and Capital) and non financial (including Operational and Reputational) risks, and not treated as a standalone risk type. The CRF is supported by policies, standards and other relevant documents which contain control objectives that must be met. The CRF: • Defines climate risk • Establishes principles for the identification, measurement, monitoring and reporting of climate risk • Outlines the process for establishing climate risk appetite • Summarises the impact of climate risk on other principal financial and operational risk types • Outlines roles and responsibilities applicable to the Climate Risk Framework The Climate Risk Policy sets objectives for the management of climate risks and establishes key principles for quantifying and reporting, including escalations required to senior stakeholders up to and including the Board Risk Committee (BRC). The Framework and Policy are applicable for Barclays' business activities, with a focus on lending, advisory, sales and trading, capital markets and investments. Climate risk may also drive non-financial risks such as reputational risk, which continue to be managed under the respective risk frameworks. To support the embedment of the Principal Risk, in 2023 the Group delivered the following with three overarching objectives: 1. Enhance and improve risk appetite and associated controls for climate risk 2. Develop a plan for refining modelling and scenario analysis capabilities 3. Expand BlueTrack™, which now covers nine segments comprising of Energy, Power, Cement, Steel, Automotive Manufacturing, UK Housing, Commercial Real Estate, Agriculture and Aviation Organisation, roles and responsibilities The Group Head of Climate Risk is the Principal Risk owner accountable for the management and oversight of the climate risk profile. The Group Head of Climate Risk reports directly to Group CRO. On behalf of the Board, the BRC reviews and approves the Group's approach to managing climate risk. Governance Enterprise Risk Framework (ERMF) Climate Risk Framework (CRF) Reputation Risk Management Framework (RRMF) Board Risk Committee (BRC) Board Sustainability Committee (BSC) Risk Credit, market, treasury & capital and operational risks Sustainability matters and reputation risk associated with climate change Ownership Group Risk Committee (GRC) Group Sustainability Committee (GSC) Group Chief Risk Officer Head of Public Policy and Corporate Responsibility Group Head of Climate Risk Group Head of Sustainability The Group Risk Committee (GRC) is the most senior executive body responsible for reviewing and challenging risk practices for climate. To support the oversight of Barclays' climate risk profile, a Climate Risk Committee (CRC) has been established as a sub-committee of the GRC. The Group Head of Climate risk is the Chair of the CRC. Any material issues are escalated by the CRC to the GRC, and the GRC subsequently escalates to the BRC as appropriate. A Climate Risk control environment has been established in alignment with the Barclays' Control Framework. A Climate Risk Control Forum (CRCF) was established in 2022 to oversee implementation and operation of the Barclays Control Framework, including reviewing risk events, policy and issues management. Climate risk assurance groups were also established and are responsible for performing climate risk specific reviews to support the embedding of the Climate Risk Framework and Policy. Entity Heads of Climate Risk have been appointed across key Barclays legal entities, namely Barclays Bank UK (BBUK) PLC, Barclays Bank (BB) PLC, Barclays Bank Ireland (BBI) PLC, and the US Intermediate Holding Company (US IHC). Broader sustainability matters and reputation risk associated with climate change are coordinated by the Group Sustainability and ESG Team, led by the Group Head of Sustainability. Strategy Climate and sustainability report Governance Risk review Financial review Financial statements Barclays PLC 2023 Annual Report on Form 20-F 200 Principal risk management
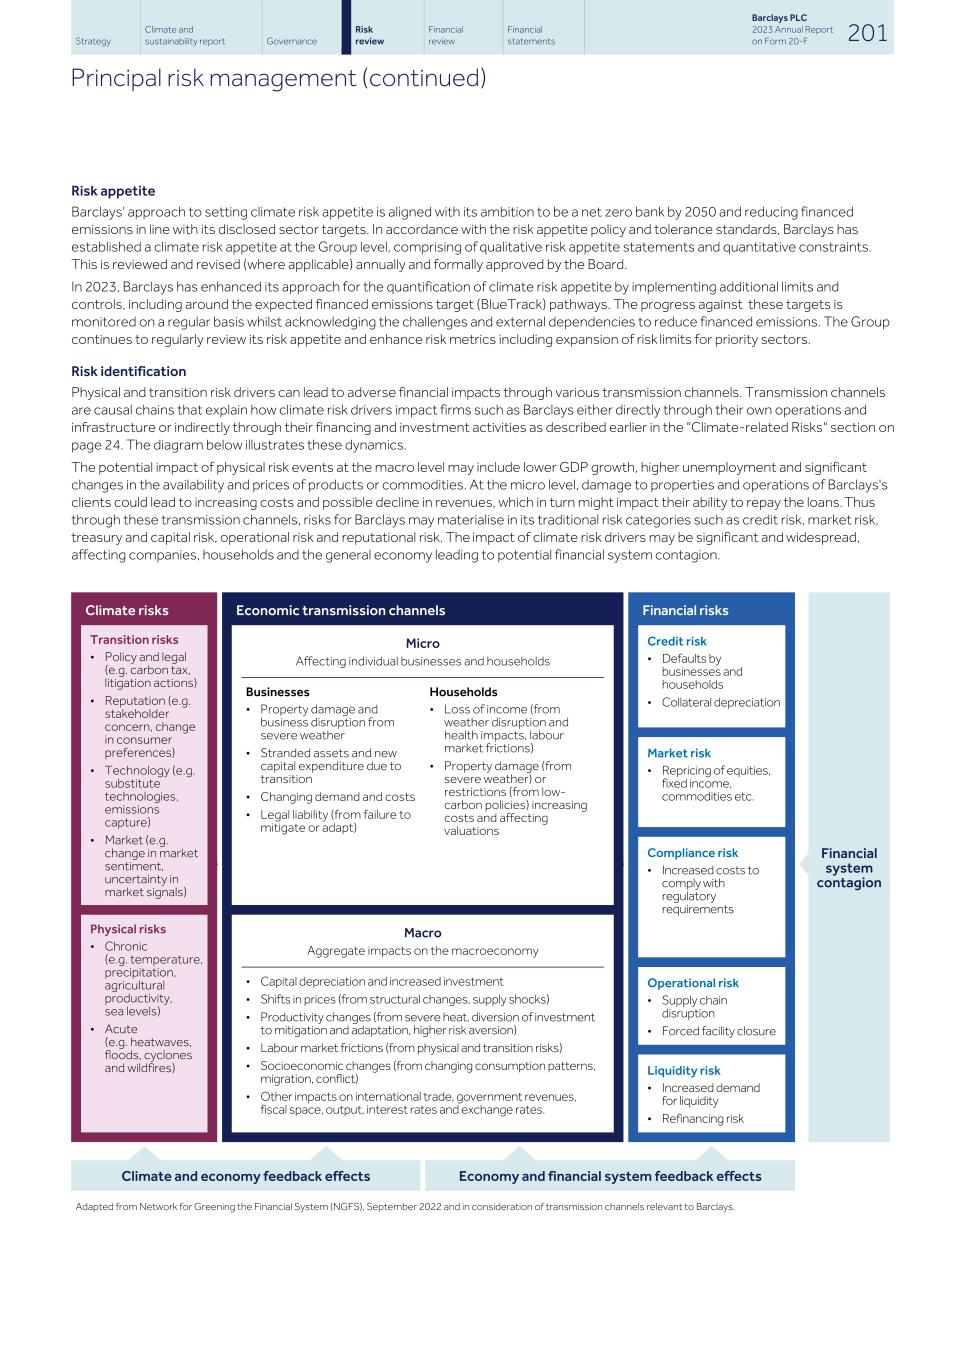
Risk appetite Barclays' approach to setting climate risk appetite is aligned with its ambition to be a net zero bank by 2050 and reducing financed emissions in line with its disclosed sector targets. In accordance with the risk appetite policy and tolerance standards, Barclays has established a climate risk appetite at the Group level, comprising of qualitative risk appetite statements and quantitative constraints. This is reviewed and revised (where applicable) annually and formally approved by the Board. In 2023, Barclays has enhanced its approach for the quantification of climate risk appetite by implementing additional limits and controls, including around the expected financed emissions target (BlueTrack) pathways. The progress against these targets is monitored on a regular basis whilst acknowledging the challenges and external dependencies to reduce financed emissions. The Group continues to regularly review its risk appetite and enhance risk metrics including expansion of risk limits for priority sectors. Risk identification Physical and transition risk drivers can lead to adverse financial impacts through various transmission channels. Transmission channels are causal chains that explain how climate risk drivers impact firms such as Barclays either directly through their own operations and infrastructure or indirectly through their financing and investment activities as described earlier in the "Climate-related Risks" section on page 24. The diagram below illustrates these dynamics. The potential impact of physical risk events at the macro level may include lower GDP growth, higher unemployment and significant changes in the availability and prices of products or commodities. At the micro level, damage to properties and operations of Barclays's clients could lead to increasing costs and possible decline in revenues, which in turn might impact their ability to repay the loans. Thus through these transmission channels, risks for Barclays may materialise in its traditional risk categories such as credit risk, market risk, treasury and capital risk, operational risk and reputational risk. The impact of climate risk drivers may be significant and widespread, affecting companies, households and the general economy leading to potential financial system contagion. Financial system contagion Climate risks Economic transmission channels Financial risks Transition risks • Policy and legal (e.g. carbon tax, litigation actions) • Reputation (e.g. stakeholder concern, change in consumer preferences) • Technology (e.g. substitute technologies, emissions capture) • Market (e.g. change in market sentiment, uncertainty in market signals) Micro Affecting individual businesses and households Credit risk • Defaults by businesses and households • Collateral depreciation Businesses • Property damage and business disruption from severe weather • Stranded assets and new capital expenditure due to transition • Changing demand and costs • Legal liability (from failure to mitigate or adapt) Households • Loss of income (from weather disruption and health impacts, labour market frictions) • Property damage (from severe weather) or restrictions (from low- carbon policies) increasing costs and affecting valuations Market risk • Repricing of equities, fixed income, commodities etc. Compliance risk • Increased costs to comply with regulatory requirements Physical risks • Chronic (e.g. temperature, precipitation, agricultural productivity, sea levels) • Acute (e.g. heatwaves, floods, cyclones and wildfires) Macro Aggregate impacts on the macroeconomy • Capital depreciation and increased investment • Shifts in prices (from structural changes, supply shocks) • Productivity changes (from severe heat, diversion of investment to mitigation and adaptation, higher risk aversion) • Labour market frictions (from physical and transition risks) • Socioeconomic changes (from changing consumption patterns, migration, conflict) • Other impacts on international trade, government revenues, fiscal space, output, interest rates and exchange rates. Operational risk • Supply chain disruption • Forced facility closure Liquidity risk • Increased demand for liquidity • Refinancing risk Climate and economy feedback effects Economy and financial system feedback effects Adapted from Network for Greening the Financial System (NGFS), September 2022 and in consideration of transmission channels relevant to Barclays. Strategy Climate and sustainability report Governance Risk review Financial review Financial statements Barclays PLC 2023 Annual Report on Form 20-F 201 Principal risk management (continued)
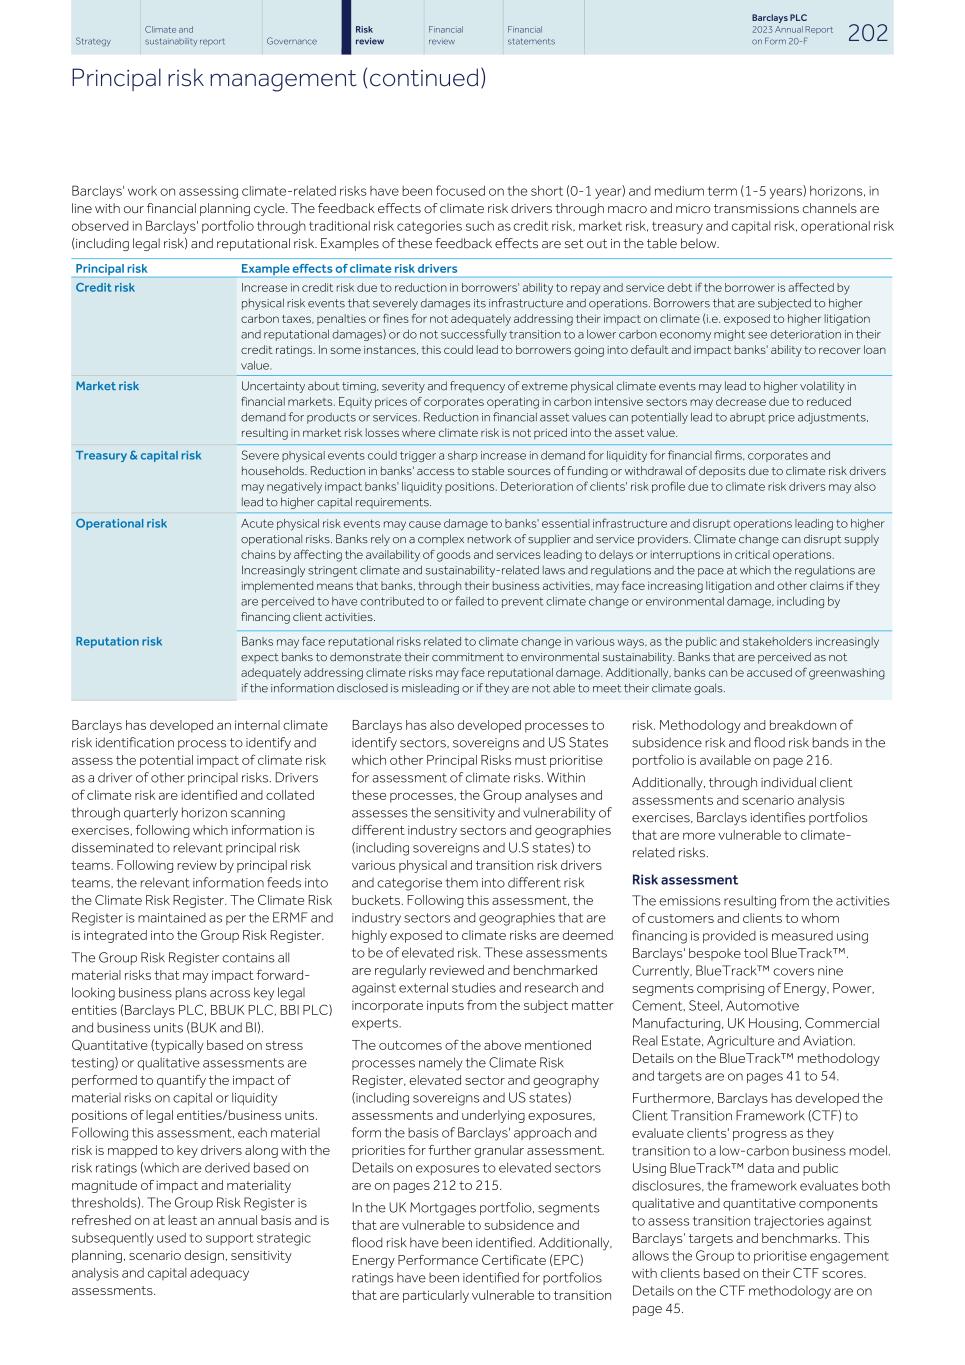
Barclays' work on assessing climate-related risks have been focused on the short (0-1 year) and medium term (1-5 years) horizons, in line with our financial planning cycle. The feedback effects of climate risk drivers through macro and micro transmissions channels are observed in Barclays' portfolio through traditional risk categories such as credit risk, market risk, treasury and capital risk, operational risk (including legal risk) and reputational risk. Examples of these feedback effects are set out in the table below. Principal risk Example effects of climate risk drivers Credit risk Increase in credit risk due to reduction in borrowers' ability to repay and service debt if the borrower is affected by physical risk events that severely damages its infrastructure and operations. Borrowers that are subjected to higher carbon taxes, penalties or fines for not adequately addressing their impact on climate (i.e. exposed to higher litigation and reputational damages) or do not successfully transition to a lower carbon economy might see deterioration in their credit ratings. In some instances, this could lead to borrowers going into default and impact banks' ability to recover loan value. Market risk Uncertainty about timing, severity and frequency of extreme physical climate events may lead to higher volatility in financial markets. Equity prices of corporates operating in carbon intensive sectors may decrease due to reduced demand for products or services. Reduction in financial asset values can potentially lead to abrupt price adjustments, resulting in market risk losses where climate risk is not priced into the asset value. Treasury & capital risk Severe physical events could trigger a sharp increase in demand for liquidity for financial firms, corporates and households. Reduction in banks' access to stable sources of funding or withdrawal of deposits due to climate risk drivers may negatively impact banks' liquidity positions. Deterioration of clients' risk profile due to climate risk drivers may also lead to higher capital requirements. Operational risk Acute physical risk events may cause damage to banks' essential infrastructure and disrupt operations leading to higher operational risks. Banks rely on a complex network of supplier and service providers. Climate change can disrupt supply chains by affecting the availability of goods and services leading to delays or interruptions in critical operations. Increasingly stringent climate and sustainability-related laws and regulations and the pace at which the regulations are implemented means that banks, through their business activities, may face increasing litigation and other claims if they are perceived to have contributed to or failed to prevent climate change or environmental damage, including by financing client activities. Reputation risk Banks may face reputational risks related to climate change in various ways, as the public and stakeholders increasingly expect banks to demonstrate their commitment to environmental sustainability. Banks that are perceived as not adequately addressing climate risks may face reputational damage. Additionally, banks can be accused of greenwashing if the information disclosed is misleading or if they are not able to meet their climate goals. Barclays has developed an internal climate risk identification process to identify and assess the potential impact of climate risk as a driver of other principal risks. Drivers of climate risk are identified and collated through quarterly horizon scanning exercises, following which information is disseminated to relevant principal risk teams. Following review by principal risk teams, the relevant information feeds into the Climate Risk Register. The Climate Risk Register is maintained as per the ERMF and is integrated into the Group Risk Register. The Group Risk Register contains all material risks that may impact forward- looking business plans across key legal entities (Barclays PLC, BBUK PLC, BBI PLC) and business units (BUK and BI). Quantitative (typically based on stress testing) or qualitative assessments are performed to quantify the impact of material risks on capital or liquidity positions of legal entities/business units. Following this assessment, each material risk is mapped to key drivers along with the risk ratings (which are derived based on magnitude of impact and materiality thresholds). The Group Risk Register is refreshed on at least an annual basis and is subsequently used to support strategic planning, scenario design, sensitivity analysis and capital adequacy assessments. Barclays has also developed processes to identify sectors, sovereigns and US States which other Principal Risks must prioritise for assessment of climate risks. Within these processes, the Group analyses and assesses the sensitivity and vulnerability of different industry sectors and geographies (including sovereigns and U.S states) to various physical and transition risk drivers and categorise them into different risk buckets. Following this assessment, the industry sectors and geographies that are highly exposed to climate risks are deemed to be of elevated risk. These assessments are regularly reviewed and benchmarked against external studies and research and incorporate inputs from the subject matter experts. The outcomes of the above mentioned processes namely the Climate Risk Register, elevated sector and geography (including sovereigns and US states) assessments and underlying exposures, form the basis of Barclays' approach and priorities for further granular assessment. Details on exposures to elevated sectors are on pages 212 to 215. In the UK Mortgages portfolio, segments that are vulnerable to subsidence and flood risk have been identified. Additionally, Energy Performance Certificate (EPC) ratings have been identified for portfolios that are particularly vulnerable to transition risk. Methodology and breakdown of subsidence risk and flood risk bands in the portfolio is available on page 216. Additionally, through individual client assessments and scenario analysis exercises, Barclays identifies portfolios that are more vulnerable to climate- related risks. Risk assessment The emissions resulting from the activities of customers and clients to whom financing is provided is measured using Barclays' bespoke tool BlueTrack™. Currently, BlueTrack™ covers nine segments comprising of Energy, Power, Cement, Steel, Automotive Manufacturing, UK Housing, Commercial Real Estate, Agriculture and Aviation. Details on the BlueTrack™ methodology and targets are on pages 41 to 54. Furthermore, Barclays has developed the Client Transition Framework (CTF) to evaluate clients' progress as they transition to a low-carbon business model. Using BlueTrack™ data and public disclosures, the framework evaluates both qualitative and quantitative components to assess transition trajectories against Barclays’ targets and benchmarks. This allows the Group to prioritise engagement with clients based on their CTF scores. Details on the CTF methodology are on page 45. Strategy Climate and sustainability report Governance Risk review Financial review Financial statements Barclays PLC 2023 Annual Report on Form 20-F 202 Principal risk management (continued)
During 2023, Barclays conducted industry- specific deep dives to identify risk factors and characteristics for those sectors. For example, the power sector review incorporated analysis of carbon intensity, transition plans and the results of a bespoke power utilities scenario analysis (such as the effect of carbon pricing on client financial performance). Furthermore, Barclays has industry- specific risk management processes where appropriate. Granular asset-level assessment is performed in the oil and gas portfolio, prioritising the assessment of clients that are non-investment grade and operating in the upstream and midstream sub-sectors. Taking into account factors such as breakeven costs, geological concerns, infrastructure constraints and regulatory/geopolitical uncertainty, Barclays has subsequently classified clients and their assets into tiers from 1 to 3, with tier 3 considered the riskiest. Asset tiering and assessment for these clients are reviewed at least annually. For Credit Risk, Barclays continues to embed climate risk assessment into credit assessment, annual review and transaction approval processes to ensure that climate-related risks are considered for Wholesale Credit and Retail customers in elevated risk sectors. At a client level, the Climate Lens questionnaire is used to evaluate physical, transition and environmental risks associated with firms operating in elevated risk sectors. Each question is rated as Low, Moderate or High based on the client’s exposure and vulnerability to various climate and environmental risk factors. Climate Lens is currently being re- developed with the aim of making it more quantitative and improving its integration within the credit processes. For Market Risk, the impact of climate change is measured by applying stress scenarios that stress the core risks susceptible to climate change over long and short-term horizons to individual risk factors.This process is conducted every quarter. The pattern of stress losses arising from the stress scenario is used to estimate and set ongoing limits, consistent with the Board-approved maximum stress loss capacity for Market risk, under which Barclays monitors and controls Market risk arising from climate change. For Treasury and Capital Risk, Barclays’ conducts Group-wide climate stress tests to understand and assess the potential impact on Barclays' capital position. Climate risk considerations have also been incorporated into the Internal Capital Adequacy Assessment Process (ICAAP). For Liquidity Risk, Barclays identifies and assesses potential vulnerabilities of certain industries and asset classes that may deteriorate under a climate stress scenario, and subsequently impact funding and liquidity ratios. Climate risk considerations have also been incorporated into the Internal Liquidity Adequacy Assessment Process (ILAAP). For Pension Risk, key risk indicators based on the impact of physical and transition risk drivers on the pension fund have been defined. These are reviewed and monitored on a quarterly basis. For operational risk, climate-related risks continue to be assessed as part of existing business-as-usual operational risk processes. This includes working with Premises and Operational Recovery Planning teams to evaluate and respond to climate-related impacts and regulatory requirements Climate factors have been integrated into Structured Scenario Assessments, which capture extreme but plausible operational tail risks. As part of the assessment in 2023, climate risk has been included in the building destruction scenario (physical risks) and greenwashing-related scenarios (transition risks). For reputational risk, the primary responsibility for identifying and managing reputation risk and adherence sits with the front line business and support functions where the risk arises. The Enhanced Due Diligence process and other relevant processes in these business units facilitate the assessment of climate-related reputational risk - details on this are on page 164, while details on oversight and management are embedded with the Barclays governance framework on pages 159 to 160. Across Barclays' portfolios, scenario analysis continues to form a key part of the Group’s approach to assessing and quantifying the impact of climate change. Details on the progress and outcomes of our scenario analysis and stress testing exercises are available on pages 63 to 68. Risk monitoring and reporting In addition to the climate risk appetite, Barclays has integrated climate risk considerations into policies, standards and lending guidelines. Consistent with our net zero ambition and taking into account considerations of all relevant business factors, policies have been introduced to progressively curtail or prohibit financing of certain activities in sensitive sectors, including upstream oil and gas, thermal coal mining and coal-fired power generation, Arctic oil and gas, oil sands, hydraulic fracturing (fracking), Amazon oil and gas, extra heavy oil and ultra-deep water. These policies are reviewed regularly and updated with respect to external developments. Details on restrictive policies are on page 55. Mandate and scale (M&S) exposure controls translate risk appetite into a detailed series of limits to control day-to- day risk taking. Barclays has implemented climate-aware limits and controls for priority sectors, including based on, BlueTrack™ measures of emissions intensity and the Client Transition Framework. For the UK retail portfolio, physical and transition risk mandates are in place for the UK Mortgages and Business Banking Agriculture portfolios. Quantitative and qualitative information are presented and reviewed at the CRC. A Group-level climate risk dashboard is presented to BRC on a quarterly basis, which is used to inform progress against sector targets, current exposure to portfolios with high physical and transition risks, concentrations and climate risk trends. The climate dashboard periodically includes outputs and learnings from internal stress test and regulatory exercises and external developments based on horizon scanning. Legal entity specific climate risk dashboards for monitoring and reviewing climate-sensitive exposures have been developed and presented to appropriate committees. Where Climate Risk limits are subject to ongoing monitoring, they will be reported at the appropriate Principal Risk Committees and CRC. Barclays continues to enhance and sophisticate our risk management capabilities with our increased knowledge and ability to quantify and manage climate- related risks. Strategy Climate and sustainability report Governance Risk review Financial review Financial statements Barclays PLC 2023 Annual Report on Form 20-F 203 Principal risk management (continued)
| | |
| | |
| | |
| | |
| In 2022-23, Barclays participated in a TNFD pilot with UNEP FI, alongside other financial institutions, focused on UK and European agriculture and fisheries, which in the Barclays context means agriculture and food sectors. As part of the pilot programme, we worked with an external expert to test the draft TNFD framework, including the proposed risk assessment process (LEAP FI), on our agriculture and food portfolio in Europe, with a focus on UK farming. As reported last year, this involved assessing our clients’ locations in terms of production and sales and applying a number of different 2030 scenarios to the portfolio. During 2023, we used the results of the pilot to inform the management of nature- related risks identified during the assessment. For example, the results informed the development of new questions for the Client Transition Tool (CTT) for UK farmers, which are due to be incorporated in 2024. This will help identify clients that may need support in managing their nature- related risks alongside decarbonisation actions, and to inform our client engagement proposition. See page 49 for more details on our work with the UK farming sector. Further, in recognition of nature- related impacts identified in the agricultural value chain, we updated our Forestry and Agricultural Commodities Statement, which included strengthening our existing restrictions and introducing additional new restrictions on clients operating in agricultural commodity sectors exposed to significant deforestation risk. See page 55 for details. | |
| | |
Credit risk management
(audited)
The risk of loss to the Group from the
failure of clients, customers or
counterparties, including sovereigns, to
fully honour their obligations to the Group,
including the whole and timely payment of
principal, interest, collateral and other
receivables.
Overview
The credit risk that the Group faces arises
from wholesale and retail loans and
advances together with the counterparty
credit risk arising from derivative contracts
with clients; trading activities, including:
•debt securities, settlement balances
with market counterparties, fair value
through other comprehensive income
(FVOCI) assets and reverse repurchase
loans.
Credit risk management objectives are to:
•maintain a framework of controls to
oversee credit risk
•identify, assess and measure credit risk
clearly and accurately across the Group
and within each separate business, from
the level of individual facilities up to the
total portfolio
•control and plan credit risk taking in line
with external stakeholder expectations,
including risk return objectives, and
avoiding undesirable concentrations
•monitor credit risk and adherence to
agreed controls.
Organisation, roles and responsibilities
The first line of defence has primary
responsibility for managing credit risk
within the risk appetite and limits set by the
Risk function, supported by a defined set
of policies, standards and controls. In the
entities, business risk committees
(attended by the first line) monitor and
review the credit risk profile of each
business unit where the most material
issues are escalated to the Retail Credit
Risk Management Committee, Wholesale
Credit Risk Management Committee and
Group Risk Committee.
Wholesale and retail portfolios are
managed separately to reflect the differing
nature of the assets; wholesale balances
tend to be larger and are managed on an
individual basis, while retail balances are
greater in number but lesser in value and
are, therefore, managed in aggregated
segments.
The responsibilities of the credit risk
management teams in the businesses, the
sanctioning team and other shared
services include: sanctioning new credit
agreements (principally wholesale); setting
strategies for approval of transactions
(principally retail); setting risk appetite;
monitoring risk against limits and other
parameters; maintaining robust
processes, data gathering, quality, storage
and reporting methods for effective credit
risk management; performing effective
turnaround and workout scenarios for
wholesale portfolios via dedicated
restructuring and recoveries teams;
maintaining robust collections and
recovery processes/units for retail
portfolios; and review and validation of
credit risk measurement models.
The credit risk management teams in each
legal entity are accountable to the relevant
Legal Entity CRO, who reports to the
Group CRO.
For wholesale portfolios, credit risk
managers are organised in sanctioning
teams by geography, industry and/or
product. In wholesale portfolios, credit risk
approval is undertaken by experienced
credit risk professionals operating within a
clearly defined delegated authority
framework, with only the most senior
credit officers assigned the higher levels of
delegated authority. The largest credit
exposures, which are outside the Risk
Sanctioning Unit or Risk Distribution
Committee authority, require the support
of a legal entity Senior Credit Officer. For
exposures in excess of the legal entity
Senior Credit Officer’s authority, approval
by Group Senior Credit Officer/Board Risk
Committee is also required. The Group
Credit Risk Committee, attended by legal
entity Senior Credit Officers, provides a
formal mechanism for the Group Senior
Credit Officer to exercise the highest level
of credit authority over the most material
Group single name exposures.
Credit risk mitigation
The Group employs a range of techniques
and strategies to actively mitigate credit
risks. These can broadly be divided into
three types:
•netting and set-off
•collateral
•risk transfer.
Netting and set-off
Credit risk exposures can be reduced by
applying netting and set-off. For derivative
transactions, the Group’s normal practice
is, on a legal entity basis, to enter into
standard master agreements with
counterparties (e.g. ISDAs). These master
agreements typically allow for netting of
credit risk exposure to a counterparty
resulting from derivative transactions
against the obligations to the counterparty
in the event of default, and so produce a
lower net credit exposure. These
agreements may also reduce settlement
exposure (e.g. for foreign exchange
transactions) by allowing payments on the
same day in the same currency to be set-
off against one another.
| | | | | | | | | |
| Climate and sustainability report | | | | | | | Barclays PLC 2023 Annual Report on Form 20-F | |
| |
| | | | | | | | | |
Principal risk management (continued) |
Collateral
The Group has the ability to call on
collateral in the event of default of the
counterparty, comprising:
•home loans: a fixed charge over
residential property in the form of
houses, flats and other dwellings
•wholesale lending: a fixed charge over
commercial property and other physical
assets, in various forms
•other retail lending: includes charges
over other physical assets; second lien
charges over residential property; and
finance lease receivables
•derivatives: the Group also often seeks
to enter into a margin agreement (e.g.
Credit Support Annex) with
counterparties with which the Group has
master netting agreements in place.
These annexes to master agreements
provide a mechanism for further
reducing credit risk, whereby collateral
(margin) is posted on a regular basis
(typically daily) to collateralise the mark
to market exposure of a derivative
portfolio measured on a net basis
•reverse repurchase agreements:
collateral typically comprises highly liquid
securities which have been legally
transferred to the Group subject to an
agreement to return them for a fixed
price
•financial guarantees and similar off-
balance sheet commitments: cash
collateral may be held against these
arrangements.
Risk transfer
A range of instruments including
guarantees, credit insurance, credit
derivatives and securitisation can be used
to transfer credit risk from one
counterparty to another. These mitigate
credit risk in three main ways:
•if the risk is transferred to a
counterparty which is more
creditworthy than the original
counterparty, then overall credit risk is
reduced
•where recourse to the first counterparty
remains, both counterparties must
default before a loss materialises. This is
less likely than the default of either
counterparty individually so credit risk is
reduced.
•first loss exposures across pools of
credit risk can be hedged via synthetic
securitisation structures, typically via
CLN (credit lending notes) issuance. As
these are fully funded upfront they
provide for a direct reduction in credit
risk exposure on referenced pools.
| |
| Detailed policies are in place to appropriately recognise and record credit risk mitigation. For more information, refer to pages 131 to 134 of the Barclays PLC Pillar 3 Report 2023 (unaudited). |
|
Governance and oversight of ECLs under
IFRS 9
The Group’s organisational structure and
internal governance processes oversee
the estimation of ECL across several
areas, including: i) setting requirements in
policy, including key assumptions and the
application of key judgements; ii) the
design and execution of models; and iii)
review of ECL results.
i) Impairment policy requirements are set
and reviewed regularly, at a minimum
annually, to maintain adherence to
accounting standards. Key judgements
inherent in policy, including the estimated
life of revolving credit facilities and the
quantitative criteria for assessing the
significant increase in credit risk (SICR), are
separately supported by analytical study. In
particular, the quantitative thresholds used
for assessing SICR are subject to a number
of internal validation criteria, particularly in
retail portfolios where thresholds decrease
as the origination Probability of Default
(PD) of each facility increases. Key policy
requirements are also aligned to the
Group’s credit risk management strategy
and practices, for example, wholesale
customers that are risk managed on an
individual basis are assessed for ECL on an
individual basis upon entering Stage 3;
furthermore, key internal risk management
indicators of high risk are used to set SICR
policy, for example, retail customers
identified as high risk account
management are automatically deemed to
have met the SICR criteria.
ii) ECL is estimated in line with internal
policy requirements using models which
are validated by a qualified independent
party to the model development area, the
Independent Validation Unit (IVU), before
first use and on a regular basis, at a
minimum every three years. Each model is
designated an owner who is responsible
for:
•model maintenance: monitoring of
model performance including
backtesting by comparing predicted
ECL versus flow into stage 3 and
coverage ratios; proposing material
changes for independent IVU approval;
and recalibrating model parameters on
more timely data
•proposing post-model adjustments
(PMA) to address model weaknesses or
to account for situations where known
or expected risk factors and information
have not been considered in the
modelling process. All PMAs relating to
model deficiencies, regardless of value
are approved by IVU for a set time
period. PMAs representing Expert
Judgement are validated by Risk, as the
second line of defence and approved for
a set time period. The most material
PMAs are also approved by the CRO.
Models must also assess ECL across a
range of future economic conditions.
These economic scenarios are generated
via an independent model and ultimately
set by the Senior Scenario Review
Committee. Economic scenarios are
regenerated at a minimum twice annually
but more frequently if deemed
appropriate, and also to align with the
Group’s medium term planning exercise.
Each model used in the estimation of ECL,
including key inputs, are governed by a
series of internal controls, which include
the validation of completeness and
accuracy of data in golden source
systems, documented data
transformations and documented lineage
of data transfers between systems.
iii) The Group Impairment Committee,
formed of members from both Finance
and Risk and attended by both the Group
Finance Director and the Group CRO, is
responsible for overseeing impairment
policy and practice across the Group and
will approve impairment results. Reported
results and key messages are
communicated to the BAC, which has an
oversight role and provides challenge of
key assumptions, including the basis of the
scenarios adopted. Impairment results are
then factored into management decision
making, including but not limited to,
business planning, risk appetite setting and
portfolio management.
| | | | | | | | | |
| Climate and sustainability report | | | | | | | Barclays PLC 2023 Annual Report on Form 20-F | |
| |
| | | | | | | | | |
Principal risk management (continued) |
Market risk management
(audited)
The risk of loss arising from potential
adverse changes in the value of the
Group’s assets and liabilities from
fluctuation in market variables including,
but not limited to, interest rates, foreign
exchange, equity prices, commodity
prices, credit spreads, implied volatilities
and asset correlations.
Overview
Market risk arises primarily as a result of
client facilitation in wholesale markets,
involving market-making activities, risk
management solutions and execution of
syndications. Upon execution of a trade
with a client, the Group will look to hedge
against the risk of the trade moving in an
adverse direction. Mismatches between
client transactions and hedges result in
market risk due to changes in asset prices,
volatility or correlations.
Organisation, roles and responsibilities
Market risk in the businesses resides
primarily in Barclays International and
Treasury. These businesses have the
mandate to assume market risk. The front
office and Treasury trading desks are
responsible for managing market risk on a
day-to-day basis, where they are required
to understand and adhere to all limits
applicable to their businesses. The Market
Risk team supports the trading desks with
the day-to-day limit management of
market risk exposures through
governance processes which are outlined
in supporting market risk policies and
standards.
Market risk oversight and challenge is
provided by business committees and
Group committees, including the Market
Risk Committee (MRC).
The objectives of market risk management
are to:
•identify, understand and control market
risk by robust measurement, limit
setting, reporting and oversight
•facilitate business growth within a
controlled and transparent risk
management framework
•control market risk in the businesses
according to the allocated appetite.
To meet the above objectives, a
governance structure is in place to
manage these risks consistent with the
ERMF.
The BRC recommends market risk
appetite to the Board for their approval.
The Market Risk Principal Risk Lead (PR
Lead) is responsible for the Market Risk
Control Framework and, under delegated
authority from the Group CRO, agrees
with the business CROs a limit framework
within the context of the approved market
risk appetite.
The Market Risk Committee (MRC) reviews
and makes recommendations concerning
the group-wide market risk profile. This
includes overseeing the operation of the
Market Risk Framework and associated
policies and standards, monitoring market
and regulatory changes, and reviewing limit
utilisation levels. The committee is chaired
by the PR Lead and attendees include the
business heads of market risk and business
aligned market risk managers.
In addition to MRC, the Corporate and
Investment Bank Risk Committee (‘CIBRC’)
is the main forum in which market risk
exposures are discussed and reviewed
with senior business heads. The
Committee is chaired by the CRO of
Barclays International and meets weekly,
covering current market events, notable
market risk exposures, and key risk topics.
New business initiatives are generally
socialised at CIBRC before any changes to
risk appetite or associated limits are
considered in other governance
committees.
The head of each business is accountable
for all market risks associated with its
activities, while the head of the market risk
team covering each business is
responsible for implementing the risk
control framework for market risk.
For more information on market risk
management, refer to the Barclays PLC
Pillar 3 Report 2023 (unaudited).
Management value at risk (VaR)
VaR is an estimate of the potential loss
arising from unfavourable market
movements if the current positions were
to be held unchanged for one business
day. For internal market risk management
purposes, a historical simulation
methodology with a one-year equally
weighted historical period, at the 95%
confidence level is used for all trading
books and some banking books.
Limits are applied at the total level as well
as by risk factor type, which are then
cascaded down to particular trading desks
and businesses by the market risk
management function.
| |
| review of management VaR. |
|
Treasury and capital risk
management
This comprises:
Liquidity risk: The risk that the Group is
unable to meet its contractual or
contingent obligations or that it does not
have the appropriate amount, tenor and
composition of funding and liquidity to
support its assets.
Capital risk: The risk that the Group has an
insufficient level or composition of capital
to support its normal business activities
and to meet its regulatory capital
requirements under normal operating
environments and stressed conditions
(both actual and as defined for internal
planning or regulatory testing purposes).
This also includes the risk from the Group’s
pension plans.
Interest rate risk in the banking book: The
risk that the Group is exposed to capital or
income volatility because of a mismatch
between the interest rate exposures of its
(non-traded) assets and liabilities.
The Treasury function manages treasury
and capital risk exposure on a day-to-day
basis with the Group Treasury Committee
acting as the principal management body.
The Treasury and Capital Risk function is
responsible for oversight and provides
insight into key capital, liquidity, interest
rate risk in the banking book (IRRBB) and
pension risk management activities.
Liquidity risk management
(audited)
Overview
The efficient management of liquidity is
essential to the Group in order to retain
the confidence of the financial markets
and maintain the sustainability of the
business. Treasury and Capital Risk have
created a framework to manage all liquidity
risk exposures under both normal and
stressed conditions. The framework is
designed to maintain liquidity resources
that are sufficient in amount, quality and
funding tenor profile to remain within the
liquidity risk appetite as expressed by the
Barclays PLC Board. The liquidity risk
appetite is monitored against both internal
and regulatory liquidity metrics.
| | | | | | | | | | |
| Climate and sustainability report | | | | | | | | Barclays PLC 2023 Annual Report on Form 20-F | |
| | |
| | | | | | | | | | |
Principal risk management (continued) |
Organisation, roles and responsibilities
Treasury has the primary responsibility for
managing liquidity risk within the set risk
appetite. Both Risk and Treasury
contribute to the production of the
Internal Liquidity Adequacy Assessment
Process (ILAAP). The Treasury and Capital
Risk function is responsible for the
management and governance of the
liquidity risk mandate, as defined by the
Board.
The framework established by Treasury
and Capital Risk is designed to deliver the
appropriate term and structure of funding,
consistent with the liquidity risk appetite
set by the Board. The framework
incorporates a range of ongoing business
management tools to monitor, limit and
stress test the Group’s balance sheet,
contingent liabilities and the recovery plan.
Limit setting and transfer pricing are tools
designed to control the level of liquidity risk
taken and drive the appropriate mix of
funds. Adherence to limits reduces the
likelihood that a liquidity stress event could
lead to an inability to meet Group’s
obligations as they fall due.
The Board approves the Group funding
plan, internal stress tests, regulatory stress
test results, recovery plan and liquidity risk
appetite. The Group Treasury Committee
is responsible for monitoring and
managing liquidity risk in line with the
Group’s funding management objectives,
funding plan and risk appetite. The
Treasury and Capital Risk Committee
monitors and reviews the liquidity risk
profile and control environment, providing
second line oversight of the management
of liquidity risk. The BRC reviews the risk
profile, and reviews liquidity risk appetite at
least annually and the impact of stress
scenarios on the Group funding plan/
forecast in order to agree the Group’s
projected funding abilities.
Capital risk management
(audited)
Overview
Capital risk is managed through ongoing
monitoring and management of the capital
and leverage position, regular stress
testing and a robust capital governance
framework. The objectives of the
framework are to maintain adequate
capital for the Group and legal entities to
withstand the impact of the risks that may
arise under normal and stressed
conditions, and maintain adequate capital
to cover current and forecast business
needs and associated risks to provide a
viable and sustainable business offering.
The Group aims to prudently manage its
overall leverage position (including risk of
excessive leverage) by utilising plausible
stress scenarios, reviewing and deploying
management actions in response to
deteriorating economic and commercial
positions. In order to manage contingent
leverage risk, the Group considers the
context from which the business
consumption arises, the impact of client
utilisation on leverage and the available
actions to manage.
Organisation, roles and responsibilities
Treasury has the primary responsibility for
managing and monitoring capital
adequacy. The Treasury and Capital Risk
function provides oversight of capital risk.
Production of the Barclays PLC Internal
Capital Adequacy Assessment Process
(ICAAP) is the responsibility of Treasury.
Capital risk management is underpinned by
a control framework and policy. The capital
management strategy, outlined in the
Group and legal entity capital plans, is
developed in alignment with the control
framework and policy for capital risk, and is
implemented consistently in order to
deliver on the Group’s objectives.
The Board approves the Group capital
plan, internal stress tests and results of
regulatory stress tests, and the Group
recovery plan. The Group Treasury
Committee is responsible for monitoring
and managing capital risk in line with the
Group’s capital management objectives,
capital plan and risk frameworks. The
Treasury and Capital Risk Committee
monitors and reviews the capital risk profile
and control environment, providing
second line oversight of the management
of capital risk. The BRC reviews the risk
profile, and reviews risk appetite at least
annually and the impact of stress scenarios
on the Group capital plan/forecast in order
to agree the Group’s projected capital
adequacy.
Local management assures compliance
with an entity’s minimum regulatory capital
requirements by reporting to local Asset
and Liability Committees (ALCOs) with
oversight by the Group Treasury
Committee, as required. In 2023, Barclays
complied with all regulatory minimum
capital requirements. Contingent leverage
risk is managed by; i) setting
comprehensive leverage (and RWA)
targets for each business as part of the
Treasury capital management process,
taking into account adherence to early
warning indicators and maintain a healthy
leverage ratio, and; ii) Monitoring execution
of actions taken to course-correct as
necessary.
The Group maintains a number of defined
benefit pension schemes for past and
current employees. The ability of schemes
to meet pension payments is achieved
with investments and contributions.
Pension risk arises because the market
value of pension fund assets might decline;
investment returns might reduce; or the
estimated value of pension liabilities might
increase. The Group monitors the pension
risks arising from its defined benefit
pension schemes and works with the
relevant pension fund’s trustees to
address shortfalls. In these circumstances,
the Group could be required or might
choose to make extra contributions to the
pension fund. The Group’s main defined
benefit scheme was closed to new
entrants in 2012.
Interest rate risk in the banking
book management (IRRBB)
Overview
Interest rate risk in the banking book is
driven by customer deposit taking and
lending activities, investments in the liquid
asset portfolio and funding activities. As
per the Group’s policy to remain within the
defined risk appetite, hedging strategies
are executed to mitigate the various IRRBB
risks that result from these activities.
However, the Group remains susceptible
to interest rate risk and other non-traded
market risks from the following key
sources:
•Interest rate and repricing risk: the risk
that net interest income could be
adversely impacted by a change in
interest rates, differences in the timing
of interest rate changes between assets
and liabilities, and other constraints on
interest rate changes as per product
terms and conditions.
•Customer behavioural risk: the risk that
net interest income could be adversely
impacted by the discretion that
customers and counterparties may have
in respect of being able to vary from
their contractual obligations with
Barclays. This risk is often referred to by
industry regulators as ‘embedded option
risk’.
•Investment risks in the liquid asset
portfolio: the risk that the fair value of
assets held in the liquid asset portfolio
and associated risk management
portfolios could be adversely impacted
by market volatility, creating volatility in
capital directly.
| | | | | | | | | |
| Climate and sustainability report | | | | | | | Barclays PLC 2023 Annual Report on Form 20-F | |
| |
| | | | | | | | | |
Principal risk management (continued) |
Organisation, roles and responsibilities
The entity ALCOs and/or treasury
committees, together with the Group
Treasury Committee, are responsible for
monitoring and managing IRRBB risk in line
with the Group’s management objectives
and risk frameworks. The GRC and
Treasury and Capital Risk Committee
monitors and reviews the IRRBB risk profile
and control environment, providing
second line oversight of the management
of IRRBB. The BRC reviews the interest
rate risk profile, including review of the risk
appetite at least annually and the impact of
stress scenarios on the interest rate risk of
the Group’s banking books.
In addition, the Group’s IRRBB policy sets
out the processes and key controls
required to identify all IRRBB risks arising
from banking book operations, to monitor
the risk exposures via a set of metrics with
a frequency in line with the risk
management horizon, and to manage
these risks within agreed risk appetite and
limits.
Model risk management
The potential for adverse consequences
from decisions based on incorrect or
misused model outputs and reports.
Overview
The Bank uses models to support a broad
range of activities, including informing
business decisions and strategies,
measuring and limiting risk, valuing
exposures, conducting stress testing,
assessing capital adequacy, managing
client assets, and meeting reporting
requirements.
Organisation, roles and responsibilities
The Barclays Group has a dedicated Model
Risk Management (‘MRM’) function that
consists of six teams:
(i) Independent Validation Unit (‘IVU’),
responsible for model validation and
approval;
(ii) Group Model Risk Governance,
responsible for model risk governance,
controls and reporting, as well as providing
oversight for compliance of the Model
Owner community with the Model Risk
Framework;
(iii) Framework team, responsible for the
Model Risk Policy and associated
standards;
(iv) Infrastructure Delivery and Oversight,
responsible for the delivery of model
inventory including associated data quality
& reporting and oversight of Quantitative
Processes;
(v) COO, responsible for strategy,
communications and business
management; and
(vi) Model Risk Measurement and
Quantification (‘MRMQ’), responsible for
the design of the framework and
methodology to measure and, where
possible, quantify model risk. It is also
responsible for the strategic Validation
Centre of Excellence (‘VCoE’), which is an
independent quality assurance function
within MRM with the mandate to review
and challenge validation outcomes. VCoE
is aligned to the Group Model Risk
Governance team.
The Group Model Risk Committee is
MRM’s primary risk committee and a
subcommittee of the Group Risk
Committee. It is convened with senior
executives in the first and second line of
defence to oversee the model risk profile
and risk appetite.
The Model Risk Framework is defined and
implemented through Model Risk Policy
and Standards that prescribe the Barclays
Group-wide, end-to-end requirements for
the identification, measurement and
management of model risk, covering
model documentation, development,
testing, monitoring, annual review,
independent validation and approval,
change and reporting processes.
The function reports to the Barclays Group
CRO and operates a global framework.
Implementation of best practice standards
is a central objective of the Barclays Group.
The key model risk management activities
include:
•Correctly identifying models across all
relevant areas of the Bank and recording
models in the Barclays Group Models
Database (‘GMD’), the Barclays Group-
wide model inventory.
•Enforcing that every model has a model
owner who is accountable for the model.
The model owner must sign off models
prior to submission to the Independent
Validation Unit (IVU) for validation and
ensure that the model presented to IVU
is and remains fit for purpose.
•Overseeing that every model is subject
to validation and approval by IVU, prior
to use and on a continual basis.
•Defining the model risk appetite in terms
of risk tolerance, and qualitative metrics
which are used to track and report on
model risk.
Operational risk management
The risk of loss to the Group from
inadequate or failed processes or systems,
human factors or due to external events
(for example, fraud) where the root cause
is not due to credit or market risks.
Overview
The management of operational risk has
three key objectives:
•deliver and oversee an operational risk
capability owned and used by business
leaders to enable sound risk decisions
over the long term
•provide the frameworks, policies and
standards to enable management to
meet their risk management
responsibilities while the second line of
defence provides robust, independent,
and effective oversight and challenge
•deliver a consistent and aggregated
measurement of operational risk that
will provide clear and relevant insights,
so that the right management actions
can be taken to keep the operational risk
profile consistent with the Group’s
strategy, the stated risk appetite and
stakeholder needs.
The Group operates within a system of
internal controls that enables business to
be transacted and risk taken without
exposing it to unacceptable potential
losses or reputational damages.
Organisation, roles and responsibilities
The prime responsibility for the
management of operational risk and the
compliance with control requirements
rests within the business and functional
units where the risk arises. The operational
risk profile and control environment is
reviewed by management through
business risk committees and control
committees. Operational risk issues
escalated from these meetings are
considered through the second line of
defence review meetings. Depending on
their nature, the outputs of these
meetings are presented to the Operational
Risk Profile Forum, the Operational Risk
Committee, the BRC or the BAC. In
addition, specific reports are prepared by
Operational Risk on a regular basis for the
GRC and the BRC.
| | | | | | | | | |
| Climate and sustainability report | | | | | | | Barclays PLC 2023 Annual Report on Form 20-F | |
| |
| | | | | | | | | |
Principal risk management (continued) |
Legal entities, businesses and functions
are required to report their operational
risks on both a regular and an event-driven
basis. The reports include a profile of the
material risks that may threaten the
achievement of their objectives and the
effectiveness of key controls, operational
risk events and a review of scenarios.
The Group Head of Operational Risk is
responsible for establishing, owning and
maintaining an appropriate group-wide
Operational Risk Framework and for
overseeing the portfolio of operational risk
across the Group.
The Operational Risk function acts in a
second line of defence capacity, and is
responsible for defining and overseeing
the implementation of the framework and
monitoring the Group’s operational risk
profile, including risk-based review and
challenge. The Operational Risk function
alerts management when risk levels
exceed acceptable tolerance in order to
drive timely decision- making and actions
by the first line of defence.
Operational risk categories
Operational risks are grouped into risk
categories to support effective risk
management, measurement and
reporting. These comprise: Data
Management Risk; Financial Reporting
Risk; Fraud Risk; Information Security Risk;
Operational Recovery Planning Risk;
Payments Process Risk; People Risk;
Premises Risk; Physical Security Risk;
Change Delivery Management Risk;
Supplier Risk; Tax Risk; Technology Risk;
and Transaction Operations Risk.
In addition to the above, operational risk
encompasses risks associated with
compliance with Group Resolution
Planning Prudential regulatory
requirements.
| |
| For definitions of the Group’s Operational Risk Categories and connected risks, refer to the management of operational risk section in the Barclays PLC Pillar 3 Report 2023. |
|
Compliance Risk management
The risk of poor outcomes for, or harm to,
customers, clients and markets, arising
from the delivery of the Group’s products
and services (conduct risk), and the risk to
Barclays, its clients, customers or markets
from a failure to comply with the laws, rules
and regulations (LRR) applicable to the
firm.
Overview
Compliance risk incorporates market
integrity, customer protection, financial
crime, product design and review, and the
newly created laws, rules and regulation
risks. Barclays has no appetite to operate
its business other than in full accordance
with all applicable laws, rules and
regulations, in order to deliver good
outcomes for / avoid harm to customers,
clients and markets. Barclays will act in
good faith; seeking to avoid causing
foreseeable harm and to enable and
support customers to pursue their
financial objectives.
Organisation, roles and responsibilities
The Compliance Risk Management
Framework (CRMF) outlines how the
Group manages and measures its conduct
risk profile. The Group Chief Compliance
Officer is accountable for developing,
maintaining and overseeing the CRMF.
This includes defining and owning the
relevant compliance risk policies which
detail the control objectives, principles and
other core requirements for the activities
of the Group. It is the responsibility of the
first line of defence to establish conduct
related controls to manage its
performance and assess conformance to
these policies and controls.The
responsibility for LRR risk management
sits across various functions and business
units, including Legal, Chief Controls
Office, Risk and Compliance.
Senior managers are accountable within
their areas of responsibility for owning and
managing compliance risk in accordance
with the CRMF, as defined within their
regulatory Statement of Responsibilities,
and a dedicated team has been
established in Compliance to oversee LRR
risk management.
Compliance as an independent second line
function oversees that compliance risks
are effectively identified, managed,
monitored and escalated, and has a key
role in helping Barclays achieve the right
conduct outcomes and evolve a
compliance-focused culture.
The governance of Compliance risk within
the Group is fulfilled through management
committees and forums operated by the
first and second lines of defence with clear
escalation and reporting lines to the Board.
The Barclays Group and Barclays Bank
Group Risk Committee and the Barclays
Bank UK Group Risk Committee are the
primary second line governance
committees for the oversight of the
Compliance Risk Profile. The risk
committees’ responsibilities include the
identification and discussion of any
emerging compliance risk exposures in the
Barclays Group and Barclays Bank Group. A
new sub-committee of the Group Risk
Committee was established in August
2023 to provide oversight on LRR risk. This
committee is chaired by the Group Chief
Compliance Officer.
Compliance Risk
By effectively managing Compliance risks,
we can continue to strengthen the culture
of Barclays.
Culture and conduct
We believe the stronger our culture, the
better the choices our people will make;
and the stronger our business will be for all
our stakeholders. While our culture helps
us reduce the impact of poor conduct on
our customers, we also do not intend to
repeat the errors of the past.
Our most senior leaders spend significant
time setting the right tone at Barclays and
our Purpose and Values are now deeply
embedded in their messages. The Barclays
Way sets out the standards and behaviour
all employees must demonstrate and
guides the execution of our business. We
also strengthen our culture with clear and
effective controls. We continue investing
to enhance our controls to support our
commitment to conducting all activities
with integrity.
| |
| For details of the Board's role in embedding our Culture, Purpose, Values and Mindset, please refer to page 81 of the Directors' Report. |
|
| | | | | | | | | |
| Climate and sustainability report | | | | | | | Barclays PLC 2023 Annual Report on Form 20-F | |
| |
| | | | | | | | | |
Principal risk management (continued) |
The Barclays Mindset
Our Mindset acts as an operating manual
for how to get things done at Barclays. It
focuses on three key elements that are
core to our success – Empower, Challenge
and Drive. Our research shows that when
we demonstrate behaviours aligned to
these three elements, outcomes are
better, colleagues are more engaged and
they are more likely to stay longer to build
their career at Barclays.
Managing Compliance risks
| |
| See page 106 in the Directors' report in addition to pages 197 and 288 in the risk review section for more information on how the Group defines, manages and mitigates Compliance risks. |
|
Product design and review risk
It is important that the design of our
products and services meets the needs of
clients, customers and markets as well as
being aligned with Barclays' policies. We do
this by operating two processes, which
together form our product design and
review risk framework.
We have a process that supports the
Group in the approval and implementation
of New and Amended Products and
Approval process (known as the NAPA
Process, set out in the Barclays NAPA
Policy and Standards).
This process outlines the requirements
and risk assessment standards that must
be met to help ensure that new and
amended products and services are
appropriately designed prior to their
launch.
In addition we have a complementary
process that reviews the existing portfolio
of products and services throughout their
lifecycle (known as the Product Review
Process, set out in the Barclays Product
Review Policy and Standard). This process
considers information about the
performance and operation of the product
or service through a conduct lens.
Wherever a product or service is found to
be outside appetite, the product or service
owner must seek to ensure actions are
taken to address it. These actions are
validated by functional areas, including
Legal and Compliance.
Areas of Barclays that undertake
Investment activity also operate additional
product governance processes and
controls, reflecting the higher risk of these
more complex products and the
importance of products and services
meeting the needs of our Clients.
| |
| The BPLC, BBPLC and BBUKPLC Board Risk Committees review, on behalf of their respective Boards, the management of Compliance risk and the Compliance risk profile for their respective entities. Please refer to the report of the BPLC Board Risk Committee on pages 101 and 106 and the reports of the BBPLC and BBUKPLC Board Risk Committees within the BBPLC and BBUKPLC 2023 Annual Reports available at home.barclays/investor-relations/reports- and-events/annual-reports/ for more information. |
|
Customer communications
It is important that our engagement with
our customers is open and honest and that
we treat them fairly to avoid foreseeable
harm and to make sure they are not
exploited or misled. Barclays continues to
take steps to ensure that our customers’
needs and priorities are understood before
making recommendations and that the
communications we provide allow
informed decisions to be made. We work
to achieve this through a number of
controls which focus on ensuring our
customers receive clear information in
order to understand the risks and benefits
of the products we offer. For example:
•communications are sufficient, targeted
and distributed to recipients whom
Barclays knows or reasonably believes
may stand to benefit from the
communication, and are communicated
in a manner and style that will be
understood by the average recipient (or
likely recipient),
•communications are withdrawn from
further circulation when they are no
longer accurate or fit for purpose, and
•customers do not receive inadequate
advice, misleading information,
unsuitable products or unacceptable
service.
Our processes include a review of relevant
communications which are supported by
the Compliance and Legal functions to
help ensure we meet both internal
customer engagement standards and we
are compliant with external regulations.
Furthermore annual mandatory training is
completed by marketing colleagues. The
training covers key customer and brand
standards along with the role and key
policies set by external regulators e.g.
regulatory requirements may require
communications to be provided that are
accessible to customers, or provide
customers with the option to 'opt out'.
Remediation and redress
Barclays recognises that customer
detriment may occur as a result of our
error, actions or inactions, and that we
must undertake appropriate activity
designed to ensure our customers are put
back in the position they would have been
in had the issue not occurred.
Remediation can be proactive, where we
have identified the issue ourselves (for
example through identifying a pattern in
customer complaints), or reactive, where
identified by a third party such as a
regulator of Barclays.
Where it is appropriate, Barclays works to
ensure the operation of consistent
principles for remediation which includes
timely notification to the relevant
regulatory bodies.
Reputation Risk management
The risk that an action, transaction,
investment, event, decision, or business
relationship will reduce trust in the Group’s
integrity and/or competence.
Overview
A reduction of trust in the Group’s integrity
and competence may reduce the
attractiveness of the Group to
stakeholders and could lead to negative
publicity, loss of revenue, regulatory or
legislative action, loss of existing and
potential client business, reduced
workforce morale and difficulties in
recruiting talent. Ultimately it may destroy
shareholder value.
| | | | | | | | | |
| Climate and sustainability report | | | | | | | Barclays PLC 2023 Annual Report on Form 20-F | |
| |
| | | | | | | | | |
Principal risk management (continued) |
Organisation, roles and responsibilities
Barclays PLC Board is the most senior
body responsible for reviewing and
monitoring the effectiveness of the
Group’s management of reputation risk.
The Group Chief Compliance Officer is
accountable for developing a Reputation
Risk Management Framework (RRMF), and
the Head of Public Policy and Corporate
Responsibility is responsible for the
publication of appropriate Reputation Risk
policies and associated standards,
including tolerances against which data is
monitored, reported on and escalated, as
required. The RRMF sets out what is
required to manage reputation risk across
the Group.
The primary responsibility for identifying
and managing reputation risk and
adherence to the control requirements
sits with the business and support
functions where the risk arises.
Barclays Bank Group and Barclays Bank UK
Group are required to operate within
established reputation risk appetite, and
their component businesses prepare
reports highlighting their most significant
current and potential reputation risks and
issues and how they are being managed.
These reports are a key internal source of
information for the quarterly reputation
risk reports which are prepared for
Barclays Group ExCo and reviewed by the
Group Board twice-yearly.
The Group Reputation Risk Committee is a
sub-committee of the Group Executive
Committee, authorised to manage
material reputation risks and issues as they
are brought to the attention of the
committee via relevant reputation risk
assessment and escalation processes.
Legal Risk management
The risk of loss or imposition of penalties,
damages or fines from the failure of the
firm to meet applicable laws, rules,
regulations or contractual requirements
or assert or defend its intellectual property
rights.
Overview
The multitude of laws and regulations
across the globe are highly dynamic and
their application to particular
circumstances is often unclear. This
results in a high level of inherent legal risk
which the Group seeks to mitigate through
the operation of a Group-wide legal risk
management framework. This seeks to
mitigate legal risk, including through the
implementation of Group-wide legal risk
policies requiring engagement of legal
professionals in situations that have the
potential for legal risk, identification and
management of legal risks by those
professionals, and escalation of legal risk
as necessary. Legal Risk is also mitigated
by the complementary requirements of
the compliance risk management
framework, including the responsibility of
legal professionals to proactively identify,
communicate and provide legal advice on
applicable laws, rules and regulations.
Notwithstanding these mitigating actions,
the Group operates with a level of residual
legal risk, for which the Group has limited
tolerance.
Organisation, roles and responsibilities
The Group's businesses and functions
have responsibility for identifying and
escalating to the Legal Function legal risk in
their areas, as well as responsibility for
adherence to control requirements.
The Legal Function organisation and
coverage model aligns legal expertise to
businesses, functions, products, activities
and geographic locations so that the
Group receives legal advice and support
from appropriate legal professionals,
working in partnership proactively to
identify, manage and escalate legal risks as
necessary.
The senior management of the Legal
Function oversees, challenges and
monitors the legal risk profile and
effectiveness of the legal risk control
environment across the Group. The Legal
Function provides support to all areas of
the bank and is not formally part of any of
the three lines of defence. Except in
relation to the legal advice it provides or
procures, the Legal Function is subject to
oversight from the second line of defence
with respect to its own operational and
compliance risks, as well as with respect to
the legal risk to which the bank is exposed.
The Group General Counsel is responsible
for developing and maintaining a Group-
wide legal risk management framework.
This includes defining the relevant legal risk
policies, producing the Group-wide risk
appetite statement for legal risk, and
oversight of the implementation of controls
to manage and escalate legal risk.
The legal risk profile and control
environment is reviewed by management
through business risk committees and
control committees. The Group Risk
Committee is the most senior executive
body responsible for reviewing and
monitoring the effectiveness of risk
management across the Group. Escalation
paths from this committee exist to the
Barclays PLC Board Risk Committee.
| | | | | | | | | | |
| Climate and sustainability report | | | | | | | | Barclays PLC 2023 Annual Report on Form 20-F | |
| | |
| | | | | | | | | | |
Principal risk management (continued) |
Climate risk performance
Carbon-related assets
According to TCFD, certain industry segments are more likely to be financially impacted than others due to their exposure to certain
transition and physical risks around greenhouse gas (GHG) emissions, energy, or water dependencies associated with their operations
and products. These non-financial industries are grouped into four key areas: Energy; Transportation; Materials and Buildings; and
Agriculture, Food, and Forest Products. Barclays’ exposures to the industries within these groups are reported as carbon-related assets
and can be found in the table on the following page.
Elevated risk sectors
Based on portfolio level assessments (including for industry sectors) on climate risk, Barclays identifies and categorises sectors with
heightened risk to climate change as elevated sectors. However, in each sector there are a range of vulnerabilities, meaning not all of
our clients in these sectors have high emissions, and accordingly should not be interpreted as an indicator of relative carbon intensity.
Residential Real Estate exposures are also included in this table. Barclays recognises Residential Real Estate portfolio as elevated risk,
therefore on that basis they have been included in the table. The sectors highlighted blue in the table represent the sectors considered
as elevated at the Group level.
| |
|
| |
| More stringent air emission and carbon regulations, requiring high levels of capital investment and Research & Development (R&D) expenditure. Vulnerable to shift in consumer preferences. |
| Policy pressure to cut emissions to meet emission requirements, requiring high levels of capital investment and R&D expenditure. Phase out of fossil fuel vehicles and introduction of low emission zones in city centres. |
| Being one of the hard to abate sectors, policy pressure to cut emissions requires high levels of capital investment and R&D expenditure. |
Coal Mining and Coal Terminals | Reduction in demand of thermal coal, as utilities transition away from fossil fuel. More stringent air emissions regulation, resulting in higher levels of capital investment. |
| Technological advances in low-carbon and sustainable alternatives along with new and more stringent environmental regulations, including carbon tax. The increasing efforts to eliminate single-use plastics and improve recycling to prevent marine pollution could also impact demand for products used in plastic manufacture. |
Mining (including diversified miners) | Rising costs as a result of tighter environmental regulations and increasing water stress, vulnerable to litigation cases and reputational damage. |
| Policy pressure to cut emissions, exposure to carbon taxes and overall increasing environmental regulation of operations and restrictions on access to new resources. Over time, falling demand for fossil fuels. |
| Policy pressure to cut emissions and move to renewable sources of energy, leading to increased capital expenditure costs, plus potential exposure to carbon taxes. |
| Evolving taxation on emissions may impact production methods, supply chain and farm viability. Reduced demand for meat and dairy as a consequence of shifts in consumer behaviour. Volatile weather conditions and extreme weather events may impact farm credit quality |
| Evolving minimum energy efficiency requirements and increasing physical risks from flood, subsidence and coastal erosion have the potential to impact house prices and homeowner affordability. |
| More stringent carbon tax regulations and policy pressure to cut emissions and adopt low-emission fuels, requiring higher levels of R&D expenditure and capital investment. |
| Being an energy-intensive sector, the sector is exposed to the policy pressure to cut emissions and evolving air pollution regulation . |
| Policy pressure to cut emissions, requiring high levels of capital investment. |
| | | | | | | | | |
| Climate and sustainability report | | | | | | | Barclays PLC 2023 Annual Report on Form 20-F | |
| |
| | | | | | | | | |
Risk performance - Climate risk |
| | | | | | | |
Carbon-related assets (Incl. sub-sector breakdown)1,2 |
| | | |
| | |
| | | | | | |
Agriculture, Food and Forest Products (logging) | | | | | | | |
| | | | | | | |
| | | | | | | |
| | | | | | | |
Metals (waste & recycling) | | | | | | | |
| | | | | | | |
| | | | | | | |
| | | | | | | |
| | | | | | | |
| | | | | | | |
| | | | | | | |
| | | | | | | |
| | | | | | | |
Packaging Manufacturers: Metal, Glass and Plastics | | | | | | | |
Paper and Forest Products (excluding logging) | | | | | | | |
| | | | | | | |
| | | | | | | |
Construction and Materials | | | | | | | |
Homebuilding and Property Development | | | | | | | |
Real Estate Management and Development | | | | | | | |
| | | | | | | |
Mining (incl. diversified miners)5 | | | | | | | |
| | | | | | | |
| | | | | | | |
| | | | | | | |
| | | | | | | |
| | | | | | | |
| | | | | | | |
| | | | | | | |
| | | | | | | |
Wholesale and Retail Distribution and Leisure | | | | | | | |
| | | | | | | |
| | | | | | | |
Other Financial Institutions | | | | | | | |
Real Estate Management and Development (REITs) | | | | | | | |
| | | | | | | |
| | | | | | | |
Subtotal (Elevated risk sectors) | | | | | | | |
Carbon-related assets Grand total | | | | | | | |
| | | | | | | |
Total Loans & Advances & Loan Commitments | | | | | | | |
| | | | | | | |
Carbon-related assets / Total Loans & Advances and Loan Commitments | | | | | | | |
| | | | | | | |
Sub-total of sectors spanning in multiple industries | | | | | | | |
| | | | | | | |
Notes
1The sectors have been represented based on the standard nomenclature of economic activities (NACE codes) this year. These sector headings are consistent across our disclosures
on credit risk concentration by industry for contractual maturity, staging and geography (page 248). The prior year comparatives have been represented in line with the updated sector headings.
2As industries decarbonize, sectors will increasingly include both carbon and non-carbon related activities e.g. Power Utilities will also include, in part, their generation capacity from
renewable energy sources.
3Loans & advances includes debt securities at amortized cost amounting to £56,789m (2022: £45,487m) of which carbon related assets are £2,906m (2022: £3,482m). These carbon
related assets comprises £2,643m (2022: £3,406m) in Material & Buildings, £238m (2022: £74m) in Transport and storage and £25m (2022: £2m) in Energy and water.
4Loan commitments excludes the fair value exposures of £15,203m in 2023 (2022: £13,471m).
5Diversified miners with minority interests in thermal coal mining are included in this category.
| | | | | | | | | |
| Climate and sustainability report | | | | | | | Barclays PLC 2023 Annual Report on Form 20-F | |
| |
| | | | | | | | | |
Risk performance - Climate risk (continued) |
Credit exposure to nature priority sectors
For the first time we disclose credit exposure to sectors defined by TNFD in its Additional Guidance for Financial Institutions as “Nature
priority sectors” which we note is a core TNFD metric for banks under the TNFD disclosure framework published in September 2023. As
part of our efforts to calculate and disclose this metric, we have mapped the industry codes provided by TNFD to Barclays Industry
classifications. The monitoring and reporting of our exposures to these TNFD identified nature priority sectors will continue to evolve in
line with approaches taken to nature-related risk management and as the list of priority sectors set out in the TNFD Guidance for
Financial Institutions is updated and as such, are subject to change in future. Nature-related risks within a sector may vary substantially
according to company and project.
| | | | | | | |
Credit exposures to nature priority sectors 1, 2 | | | | | | |
| | | |
| | | |
| | | | | | | |
| | | | | | | |
| | | | | | | |
Paper and Forest Products | | | | | | | |
| | | | | | | |
| | | | | | | |
| | | | | | | |
| | | | | | | |
| | | | | | | |
Homebuilding and Property Development | | | | | | | |
Manufacturing - Personal Care Products | | | | | | | |
Manufacturing - Semiconductors and Semiconductor Equipments | | | | | | | |
Manufacturing - Textiles, Apparel and Luxury Goods | | | | | | | |
| | | | | | | |
Mining (incl. diversified miners)5 | | | | | | | |
Packaging manufacturers: Metal, Glass and Plastics | | | | | | | |
| | | | | | | |
| | | | | | | |
| | | | | | | |
| | | | | | | |
| | | | | | | |
| | | | | | | |
| | | | | | | |
| | | | | | | |
Sewerage, Waste Collection, Treatment and Disposal | | | | | | | |
Power Utilities - Renewable | | | | | | | |
| | | | | | | |
Nature Priority Sector Assets Grand Total | | | | | | | |
| | | | | | | |
Total Loans & Advances and Loan Commitments | | | | | | | |
| | | | | | | |
Nature priority sectors assets / Total loans & advances and loan commitments | | | | | | | |
Notes
1As industries decarbonize, sectors will increasingly include both carbon and non-carbon related activities e.g. Power Utilities will also include, in part, their generation capacity from
renewable energy sources.
2The TNFD highlights real estate development as a high-priority sector for nature. Barclays has £29,919m (2022: £32,597m) of Loans & Advances and Loan Commitments to Real
Estate Management and Development, of which the majority is from real estate investment activity. As a result, this has been excluded from the Priority sector assets for Nature.
3Loans & advances includes debt securities at amortized cost amounting to £56,789m (2022: £45,487m) of which nature priority sector assets are £2,906m (2022: £3,482m). These
nature priority sector assets comprises £2,643m (2022: £3,406m) in Material & Buildings, £238m (2022: £74m) in Transport and storage and £25m (2022: £2m) in Energy and water.
4Loan commitments excludes the fair value exposures of £15,203m in 2023 (2022: £13,471m).
5Diversified miners with minority interests in thermal coal mining are included in this category.
| | | | | | | | | |
| Climate and sustainability report | | | | | | | Barclays PLC 2023 Annual Report on Form 20-F | |
| |
| | | | | | | | | |
Risk performance - Climate risk (continued) |
Financing
To facilitate greater understanding and transparency of our capital markets financing, we disclose the total capital raised for clients
across all sectors using data sourced from Dealogic. We have provided the breakdown of our 2022 and 2023 financing below. We have
constructed this table based on the mapping of issuers’ industry assignment in Dealogic data and Barclays’ internal industry taxonomy
called Barclays Industry Classification (BIC). Financing volumes are reported on a manager-proceeds basis including bonds, equities,
loans and securitised bonds and no modifications have been made by Barclays. This data represents a third party view of our financing
and is subject to Dealogic’s league table methodology, which pro-rates volume across lead-managers. We are presenting the data in
this format to support transparency and comparability but it should be noted that this data is subject to further analysis and
methodological enhancements, before it is included in BlueTrack™.
| | | |
Carbon-related sectors in wholesale credit (Dealogic Industry Classification)1, 2, 3 |
| | | |
| | | |
| | | |
| | | |
| | | |
| | | |
| | | |
| | | |
| | | |
| | | |
| | | |
Packaging Manufacturers: Metal, Glass and Plastics | | | |
Paper and Forest Products | | | |
| | | |
| | | |
Construction and Materials | | | |
Homebuilding and Property Development | | | |
Real Estate Management and Development | | | |
| | | |
Mining (Incl. diversified miners)4 | | | |
| | | |
| | | |
| | | |
| | | |
| | | |
| | | |
| | | |
Wholesale and retail distribution and leisure | | | |
| | | |
| | | |
Other Financial Institutions | | | |
Real Estate Management and Development (REITs) | | | |
Carbon-related Assets Grand Total | | | |
| | | |
Capital Market Financing Total | | | |
| | | |
Financing to Carbon-related Sector / Total Capital Market Financing | | | |
| | | |
Sub-total of sectors spanning in multiple industries | | | |
| | | |
Notes
1The sectors have been represented based on the standard nomenclature of economic activities (NACE codes) this year. These sector headings are consistent across our disclosures
on credit risk concentration by industry for contractual maturity, staging and geography (page 248). The prior year comparatives have been represented in line with the updated sector headings.
2As industries decarbonize, sectors will increasingly include both carbon and non-carbon related activities e.g. the clients present within the sector exposure reported under Power
Utilities will also have part of their generation capacity from renewable energy sources, which represents a non-carbon related activity.
3In 2022, this table was presented in USD. As it is now presented in GBP, the comparative figures have been represented.
4Diversified miners with minority interests in thermal coal mining are included in this category.
| | | | | | | | | |
| Climate and sustainability report | | | | | | | Barclays PLC 2023 Annual Report on Form 20-F | |
| |
| | | | | | | | | |
Risk performance - Climate risk (continued) |
Subsidence: Total Volume of stock (as % of total UK
Mortgages portfolio) per risk band
Subsidence is driven by the interplay of precipitation, temperature
and soil type factors, which result in volumetric changes to the
soil. Increased volatility in weather conditions, as a result of
climate change, contributes to the acceleration of subsidence
impacts. Some areas, particularly those with high concentrations
of clay soil (i.e. London), are more susceptible to subsidence. This
shrink-swell impact can cause localised property level impacts,
resulting in impacts to the valuation of a property, or impacts to
affordability through remediation costs and high insurance
premiums.
Barclays works with a third-party climate data provider to support
climate risk data enhancements within the UK Mortgages
portfolio. This includes the ability to map subsidence risk at a
property level granularity. The subsidence risk scoring is based on
soil properties, in particular the extent to which the soil will shrink
under hot and dry weather conditions, as well as the predicted
temperature and probability of extreme rainfall. These variables
are combined with subsidence claims per postcode to generate a
pseudo-quantitative score, where a property in class 9 is around
nine times as likely as a property in class 1 to make a subsidence
claim. A small proportion of the UK Mortgage portfolio is not
mapped to a subsidence risk score (c.5.2%). This is due either to a
lack of data coverage (i.e. the property is not covered by
underlying maps), or a lack of certainty in address matching.
Note
Data collected from 3rd party source based on one quarter lag. 30 September 2023 closest
available dataset.
Flood: Total Volume of stock (as % of total UK Mortgages
portfolio) per risk band
Flooding in the UK is forecast to increase over time, with the
potential for this increase to accelerate if greenhouse gas
emissions are not reduced. The increased risk of flooding has the
potential to impact the valuation of properties directly, as well as
indirectly where a particular area becomes high risk and property
demand falls. Remediation costs, high insurance premiums or
potential lack of insurance coverage have the potential to impact
affordability.
Barclays works with a third-party climate data provider to support
climate risk data enhancements within the UK Mortgages
portfolio. This has enabled Barclays to move from postcode level
to property level flood data granularity. Flood Risk bands are based
on average annual loss, generated using flood hazard frequency
and flood depth from tidal, surface, pluvial and fluvial flooding and
accounting for the mitigating impact of flood defences where
these are present. Properties in the Moderate and High Risk bands
are expected to face above average insurance costs given their
elevated exposure to flood risk. Those within the Very High band
are considered likely to be eligible for Flood Re (a subsidised flood
insurance scheme).
Note
Data collected from 3rd party source based on one quarter lag. 30 September 2023 closest
available dataset.
| | | | | | | | | |
| Climate and sustainability report | | | | | | | Barclays PLC 2023 Annual Report on Form 20-F | |
| |
| | | | | | | | | |
Risk performance - Climate risk (continued) |
Flood: Very High & High Flood Risk Exposure per region (as % of Total Regional Exposure)
The map below represents the proportion of properties within the UK Mortgages portfolio at High and Very High risk of flood per region
as a percentage of the total regional exposure (excluding Kensington Mortgage Company originated properties). The flood metrics are
presented on present day risk levels and are based on average annual loss, generated using flood hazard frequency and flood depth
from tidal, surface, pluvial and fluvial flooding and accounting for the mitigating impact of flood defences where these are present. The
mapping covers c.95% of the UK Mortgages portfolio on a total exposure basis - the remaining c.5% of properties are not currently
mapped to flood risk ratings on a property level basis as a result of a lack of data coverage (i.e. the property is not covered by underlying
maps), or a lack of certainty in address matching.
Note
Data collected from third party source based on one quarter lag. 30 September 2023 closest available dataset.
Business Banking - Dairy & Cattle Exposure
The transition risk in the Business Banking portfolio is assessed via the percentage Dairy & Cattle lending of the Business Banking
Agriculture portfolio. Given methane’s global warming potential the Dairy & Cattle sector is a significant contributor to the UK’s
emissions footprint and is therefore susceptible to the transition risks of climate change, namely consumer preference changes and
potential emissions taxation.
Barclays utilises exposure data to identify what proportion of the Business Banking Agriculture portfolio consists of lending to Dairy &
Cattle clients.
.
| | | | | | | | | |
| Climate and sustainability report | | | | | | | Barclays PLC 2023 Annual Report on Form 20-F | |
| |
| | | | | | | | | |
Risk performance - Climate risk (continued) |
EPC: Total Volume of stock (as % of total UK Mortgages
portfolio) per EPC rating
The transition risk in the UK Mortgages portfolio is assessed via the distribution of EPC ratings across the portfolio. One of the levers to
decarbonise the UK housing stock for the UK Government is to tighten energy efficiency requirements. It is anticipated that any
tightening of minimum energy efficiency standards (MEES) will focus initially on buy-to-let properties. Buy-to-Let properties which are
privately rented are currently required to have a minimum EPC rating of E. The transition risk identified has the potential to impact the
valuation of properties directly, alongside impacting affordability as properties which fall under MEES may no longer be able to be rented
out or the landlord may need to pay for retrofitting to be brought up to standard.
EPC ratings range from A (most efficient) to G (least efficient). EPC ratings are used as the basis for assessing expected energy costs
but do not give a precise picture of emission intensity. The UK Mortgages portfolio is mapped to the Government EPC Register.
Properties may not feature on the Government EPC Register as some properties may have never been required to have an EPC rating
(not been sold or rented out since 2007), their EPC rating may have expired (EPC ratings are valid for 10 years) or the property may be in
Scotland or Northern Ireland (which use separate databases). Whilst Barclays’ proportion of ‘missing EPC ratings’ has declined year on
year, the issue of missing EPC ratings is prevalent across the industry.
EPC: Residential & Buy-to-let balances and volumes per EPC rating as at September 2023
| | | | | | |
| Residential Balances (£m) | Balance as % of Residential Mortgages portfolio | Volume as % of Residential Mortgages portfolio | | Balance as % of Buy-to- Let Mortgages portfolio | Volume as % of Buy-to- Let Mortgages portfolio |
| | | | | | |
| | | | | | |
| | | | | | |
| | | | | | |
| | | | | | |
| | | | | | |
| | | | | | |
| | | | | | |
| | | | | | |
| | | | | | |
Note
1Data matching provided by 3rd party source based on one quarter lag, 30 September 2023 closest available dataset - EPC monitoring based on Sept-23 portfolio and Sept-23
Government EPC Register. If no valid EPC is mapped, the expired EPC (where available) is included as a proxy.
EPC: Residential & Buy-to-let balances and volumes per EPC rating as at September 2022
| | | | | | |
| Residential Balances (£m) | Balance as % of Residential Mortgages portfolio | Volume as % of Residential Mortgages portfolio | | Balance as % of Buy-to- Let Mortgages portfolio | Volume as % of Buy-to- Let Mortgages portfolio |
| | | | | | |
| | | | | | |
| | | | | | |
| | | | | | |
| | | | | | |
| | | | | | |
| | | | | | |
| | | | | | |
| | | | | | |
| | | | | | |
Note
1Data matching provided by 3rd party source based on one quarter lag, 30 September 2022 closest available dataset - EPC monitoring based on Sept-22 portfolio and Sept-22
Government EPC Register. If no valid EPC is mapped, the expired EPC (where available) is included as a proxy.
| | | | | | | | | |
| Climate and sustainability report | | | | | | | Barclays PLC 2023 Annual Report on Form 20-F | |
| |
| | | | | | | | | |
Risk performance - Climate risk (continued) |
Credit risk
Credit risk: summary of contents
| | |
| | |
Credit risk represents a significant risk and mainly arises from exposure to loans and advances together with the counterparty credit risk arising from derivative contracts entered into with clients. | Credit risk overview and summary of performance | |
Maximum exposure and effects of netting, collateral and risk transfer | |
This section outlines the expected credit loss allowances, the movements in allowances during the period, material management adjustments to model output and measurement uncertainty and sensitivity analysis. | | |
–Loans and advances at amortised cost by geography | |
–Loans and advances at amortised cost by product | |
–Movement in gross exposure and impairment allowance including provisions for loan commitments and financial guarantees | |
| |
| |
Management adjustments to models for impairment | |
Measurement uncertainty and sensitivity analysis | |
The Group reviews and monitors risk concentrations in a variety of ways. This section outlines performance against key concentration risks. | Analysis of the concentration of credit risk | |
–Credit risk concentration by Industry for contractual maturity, staging and geography | |
Approach to management and representation of credit quality | |
| |
| |
–Balance sheet credit quality | |
–Credit exposures by internal PD grade | |
Credit risk monitors exposure performance across a range of significant portfolios. | Analysis of specific portfolios and asset types | |
| |
–Retail Credit cards and Retail Other | |
The Group monitors exposures to assets where there is a heightened likelihood of default and assets where an actual default has occurred. From time to time, suspension of certain aspects of client credit agreements are agreed, generally during temporary periods of financial difficulties where the Group is confident that the client will be able to remedy the suspension. This section outlines the current exposure to assets with this treatment. | | |
–Retail forbearance programmes | |
–Wholesale forbearance programmes | |
|
|
|
This section provides an analysis of credit risk on debt securities and derivatives. | Analysis of debt securities | |
| |
| | | | | | | | | |
| Climate and sustainability report | | | | | | | Barclays PLC 2023 Annual Report on Form 20-F | |
| |
| | | | | | | | | |
Risk performance - Credit risk |
Credit risk
All disclosures in this section are unaudited
unless otherwise stated.
Overview
Credit risk represents a significant risk to
the Group and mainly arises from exposure
to loans and advances together with the
counterparty credit risk arising from
derivative contracts entered with clients.
Credit risk disclosures exclude other
financial assets not subject to credit risk,
mainly equity securities. For off-balance
sheet exposures certain contingent
liabilities not subject to credit risk such as
performance guarantees are excluded.
Task force on Disclosure about Expected
Credit Losses (DECL)
Credit risk disclosures have been enhanced
to include DECL III recommendations for
minimum product grouping and
geographical breakdown for this period and
prior period comparatives have been
aligned.
Summary of performance in the
period
Gross exposure
Gross loans and advances at amortised
cost to customers and banks have
remained broadly stable at £405bn, which
includes increase in debt securities driven
by Treasury investments and strategic
acquisitions in Home Finance. This is offset
by a reduction due to the German
consumer finance business classified as
assets held for sale and foreign exchange
movements in Corporate & Investment
Bank (CIB) and US Cards portfolio.
Maximum exposure
The Group’s net exposure to credit risk is
broadly stable at £1,030bn (2022:
£1,033bn). Overall, the extent to which the
mitigation is held against its total exposure
has decreased to 42% (2022: 44%)
primarily due to decrease in derivative
financial instruments (£46bn) and reverse
repurchase agreements (£14bn), both of
which are highly secured instruments.
Credit quality
Delinquencies are broadly stable across the
group with an increase observed in US
cards, which was anticipated. A range of
activities are in place to protect our existing
defensive positioning against current
macroeconomic headwinds.
Corporate loans portfolio benefited from
high-quality exposure and credit
protection.
| |
| Further analysis on the credit quality of assets is presented in the approach to management and representation of credit quality section. |
|
Stage Decomposition
A net decrease of £3.2bn is observed in
Stage 2 gross exposure driven by an
improved GDP forecast and higher
repayments in Corporate loans partially
offset by an increase in retail lending
following resumption of more regular spend
activity and higher interest rates.
Stage 3 balances have increased to £7.2bn
(2022: £7.1bn) driven by higher
delinquencies in US cards partially offset by
repayments in Business Banking.
| |
| Refer to pages 233 to 234 for further details. |
| |
Scenario
Economic uncertainty continues, linked to
higher interest rates and ongoing
inflationary pressures in major economies.
For Q423, macroeconomic scenarios have
been refreshed and are designed around a
broad range of economic outcomes. The
Downside 2 (DS2) scenario has been
aligned to Barclays 2023 Internal Stress
Test (IST23) which is less severe in terms of
GDP deterioration, resulting in increased
DS2 weights.
ECL
Impairment allowances on loans and
advances at amortised cost including off-
balance sheet has increased to £6,252m
(2022:£6,175m) predominantly driven by
increase in US cards partially offset by a
reduction due to the German consumer
finance business classified as assets held
for sale. On-balance sheet coverage has
remained strong and stable at 1.4%.
Charge
Credit impairment charges were £1,881m
(2022: £1,220m), reflecting an increase in
delinquencies in US cards, which was
anticipated, and led to higher coverage in
CC&P.
Management Adjustments
Economic uncertainty adjustments have
decreased to £198m (2022: £317m). The
reduction is informed by the rebuild of
certain impairment models which better
capture the macroeconomic outlook.
Furthermore, adjustments have been
reassessed to capture affordability
headwinds in UK retail lending.
| |
| Refer to the Management adjustment to models for impairment section on page 235 for further details. |
|
Climate
Barclays has performed a credit risk
assessment of physical and transition risk
due to climate change. This was delivered
through a combination of a scenario
approach and targeted reviews on specific
portfolios identified as more susceptible to
climate risk. The analysis did not result in a
separately identifiable impairment charge
for year end 2023 reporting.
| |
| Further detail can be found in the Financial statements section in Note 8 Credit impairment charges/(releases). Description of terminology can be found in the glossary, available at home.barclays/annualreport. |
|
| |
| details of governance, policies and procedures. |
|
| | | | | | | | | |
| Climate and sustainability report | | | | | | | Barclays PLC 2023 Annual Report on Form 20-F | |
| |
| | | | | | | | | |
Risk performance - Credit risk (continued) |
Maximum exposure and effects of netting, collateral and risk transfer
The following tables present a reconciliation between the Group's maximum exposure and its net exposure to credit risk, reflecting the
financial effects of risk mitigation reducing the Group's exposure.
The Group mitigates the credit risk to which it is exposed through netting and set-off, collateral and risk transfer. Further detail on the
Group’s policies to each of these forms of credit enhancement is presented on pages 131 to 134 of the Barclays PLC Pillar 3 Report
2023 (unaudited).
Collateral obtained
Where collateral has been obtained in the event of default, the Group does not, ordinarily, use such assets for its own operations and
they are usually sold on a timely basis. The carrying value of assets held by the Group as at 31 December 2023, as a result of the
enforcement of collateral, was £6m (2022: £31m).
| | | | | | |
Maximum exposure and effects of netting, collateral and risk transfer (audited) | | | |
| | | | | | Exposure net of risk mitigation |
| | | | | | |
| | | | | | |
Cash and balances at central banks | | | | | | |
Cash collateral and settlement balances | | | | | | |
Loans and advances at amortised cost: | | | | | | |
| | | | | | |
| | | | | | |
| | | | | | |
| | | | | | |
Total loans and advances at amortised cost | | | | | | |
Of which credit-impaired (Stage 3): | | | | | | |
| | | | | | |
| | | | | | |
| | | | | | |
| | | | | | |
Total credit-impaired loans and advances at amortised cost | | | | | | |
Debt securities at amortised cost | | | | | | |
Reverse repurchase agreements and other similar secured lending | | | | | | |
Trading portfolio assets: | | | | | | |
| | | | | | |
| | | | | | |
Total trading portfolio assets | | | | | | |
Financial assets at fair value through the income statement: | | | | | | |
| | | | | | |
| | | | | | |
Reverse repurchase agreements | | | | | | |
| | | | | | |
Total financial assets at fair value through the income statement | | | | | | |
Derivative financial instruments | | | | | | |
Financial assets at fair value through other comprehensive income | | | | | | |
| | | | | | |
| | | | | | |
| | | | | | |
| | | | | | |
| | | | | | |
| | | | | | |
| | | | | | |
| | | | | | |
| | | | | | |
| | | | | | |
Off-balance sheet exposures are shown gross of provisions of £504m (2022: £583m). See Note 24 for further details. In addition to the
above, the Group holds forward starting reverse repos with notional contract amounts of £54.3bn (2022: £48.4bn). These balances are
fully collateralised. Corporate loans at amortised cost include £5.3bn (2022: £8bn) of BBLS, CBILS and CLBILS supported by UK
government guarantees of £5.1bn (2022: £7.6bn), which are included within the Risk transfer column in the table. For further
information on credit risk mitigation techniques, refer to the Credit risk management section. Loan commitments reported also include
exposures relating to financial assets classified as assets held for sale.
| | | | | | | | | |
| Climate and sustainability report | | | | | | | Barclays PLC 2023 Annual Report on Form 20-F | |
| |
| | | | | | | | | |
Risk performance - Credit risk (continued) |
| | | | | | |
Maximum exposure and effects of netting, collateral and risk transfer (audited) | | | |
| | | | | | Exposure net of risk mitigation |
| | | | | | |
| | | | | | |
Cash and balances at central banks | | | | | | |
Cash collateral and settlement balances | | | | | | |
Loans and advances at amortised cost: | | | | | | |
| | | | | | |
| | | | | | |
| | | | | | |
| | | | | | |
Total loans and advances at amortised cost | | | | | | |
Of which credit-impaired (Stage 3): | | | | | | |
| | | | | | |
| | | | | | |
| | | | | | |
| | | | | | |
Total credit-impaired loans and advances at amortised cost | | | | | | |
Debt securities at amortised cost | | | | | | |
Reverse repurchase agreements and other similar secured lending | | | | | | |
Trading portfolio assets: | | | | | | |
| | | | | | |
| | | | | | |
Total trading portfolio assets | | | | | | |
Financial assets at fair value through the income statement: | | | | | | |
| | | | | | |
| | | | | | |
Reverse repurchase agreements | | | | | | |
| | | | | | |
Total financial assets at fair value through the income statement | | | | | | |
Derivative financial instruments | | | | | | |
Financial assets at fair value through other comprehensive income | | | | | | |
| | | | | | |
| | | | | | |
| | | | | | |
| | | | | | |
| | | | | | |
| | | | | | |
| | | | | | |
| | | | | | |
| | | | | | |
| | | | | | |
| | | | | | | | | |
| Climate and sustainability report | | | | | | | Barclays PLC 2023 Annual Report on Form 20-F | |
| |
| | | | | | | | | |
Risk performance - Credit risk (continued) |
Expected Credit Losses
Loans and advances at amortised cost by geography
Total loans and advances at amortised cost in the credit risk performance section includes loans and advances at amortised cost to
banks and loans and advances at amortised cost to customers.
The table below presents a product and geographical breakdown by stages of loans and advances at amortised cost. Also included are
stage allocation of debt securities and off-balance sheet loan commitments and financial guarantee contracts by gross exposure,
impairment allowance and coverage ratio as at 31 December 2023.
Impairment allowance under IFRS 9 considers both the drawn and the undrawn counterparty exposure. For retail portfolios, the total
impairment allowance is allocated to gross loans and advances to the extent allowance does not exceed the drawn exposure and any
excess is reported on the liabilities side of the balance sheet as a provision. For corporate portfolios, impairment allowance on undrawn
exposure is reported on the liability side of the balance sheet as a provision.
| | | | | | | | | |
Loans and advances at amortised cost by geography (audited) |
| | | |
| | | | | | | | | |
| | | | | | | | | |
| | | | | | | | | |
| | | | | | | | | |
| | | | | | | | | |
| | | | | | | | | |
| | | | | | | | | |
| | | | | | | | | |
| | | | | | | | | |
| | | | | | | | | |
| | | | | | | | | |
| | | | | | | | | |
Total loans and advances at amortised cost | | | | | | | | | |
Debt securities at amortised cost | | | | | | | | | |
Total loans and advances at amortised cost including debt securities | | | | | | | | | |
Off-balance sheet loan commitments and financial guarantee contracts2 | | | | | | | | | |
| | | | | | | | | |
| | | | | | | | | |
| | | |
| | | | | | | | | |
| | | | | | | | | |
| | | | | | | | | |
| | | | | | | | | |
| | | | | | | | | |
| | | | | | | | | |
| | | | | | | | | |
| | | | | | | | | |
| | | | | | | | | |
| | | | | | | | | |
| | | | | | | | | |
| | | | | | | | | |
Total loans and advances at amortised cost | | | | | | | | | |
Debt securities at amortised cost | | | | | | | | | |
Total loans and advances at amortised cost including debt securities | | | | | | | | | |
Off-balance sheet loan commitments and financial guarantee contracts2 | | | | | | | | | |
| | | | | | | | | |
Notes
1Includes Business Banking, which has a gross exposure of £15.2bn and an impairment allowance of £431m. This comprises £99m impairment allowance on £9.8bn Stage 1 exposure,
£81m on £4.1bn Stage 2 exposure and £251m on £1.3bn Stage 3 exposure. Excluding this, total coverage for corporate loans in UK is 0.6%.
2Excludes loan commitments and financial guarantees of £16.5bn carried at fair value and includes exposures relating to financial assets classified as assets held for sale.
3Other financial assets subject to impairment not included in the table above include cash collateral and settlement balances, financial assets at fair value through other comprehensive
income and other assets. These have a total gross exposure of £183.6bn and impairment allowance of £151m. This comprises £16m ECL on £182.8bn Stage 1 exposure, £2m on
£0.6bn Stage 2 exposure and £133m on £140m Stage 3 exposure.
4The annualised loan loss rate is 46bps after applying the total impairment charge of £1,881m.
| | | | | | | | | |
| Climate and sustainability report | | | | | | | Barclays PLC 2023 Annual Report on Form 20-F | |
| |
| | | | | | | | | |
Risk performance - Credit risk (continued) |
Assets held for sale
During 2023, gross loans and advances and related impairment allowances for the German consumer finance business were
reclassified from loans and advances to customers to assets held for sale in the balance sheet. Disclosures relating to assets held for
sale are provided in the credit risk tables, primarily where the disclosure is relevant to the measurement of these financial assets.
For further details on assets held for sale, see Note 40 to the financial statements.
| | | | | | | | | | | | | | | |
Loans and advances to customers classified as assets held for sale |
| | | | | | | |
| | | | | | | | | | | | | | | |
| | | | | | | | | | | | | | | |
| | | | | | | | | | | | | | | |
| | | | | | | | | | | | | | | |
| | | | | | | | | | | | | | | |
Note
1In 2022, total gross exposure of £4.3bn and impairment allowance of £296m was included in loans and advances at amortised cost which has now been classified as assets held for sale.
This comprises £37m ECL on £3.1bn Stage 1 exposure, £141m on £1.0bn Stage 2 exposure and £118m on £153m Stage 3 exposure.
| | | | | | | | | |
Loans and advances at amortised cost by geography (audited) |
| | | |
| | | | | | | | | |
| | | | | | | | | |
| | | | | | | | | |
| | | | | | | | | |
| | | | | | | | | |
| | | | | | | | | |
| | | | | | | | | |
| | | | | | | | | |
| | | | | | | | | |
| | | | | | | | | |
| | | | | | | | | |
| | | | | | | | | |
Total loans and advances at amortised cost | | | | | | | | | |
Debt securities at amortised cost | | | | | | | | | |
Total loans and advances at amortised cost including debt securities | | | | | | | | | |
Off-balance sheet loan commitments and financial guarantee contracts2 | | | | | | | | | |
| | | | | | | | | |
| | | | | | | | | |
| | | |
| | | | | | | | | |
| | | | | | | | | |
| | | | | | | | | |
| | | | | | | | | |
| | | | | | | | | |
| | | | | | | | | |
| | | | | | | | | |
| | | | | | | | | |
| | | | | | | | | |
| | | | | | | | | |
| | | | | | | | | |
| | | | | | | | | |
Total loans and advances at amortised cost | | | | | | | | | |
Debt securities at amortised cost | | | | | | | | | |
Total loans and advances at amortised cost including debt securities | | | | | | | | | |
Off-balance sheet loan commitments and financial guarantee contracts2 | | | | | | | | | |
| | | | | | | | | |
Notes
1Includes Business Banking, which has a gross exposure of £18.1bn and an impairment allowance of £519m. This comprises £149m impairment allowance on £10.5bn Stage 1 exposure,
£121m on £6.0bn Stage 2 exposure and £249m on £1.6bn Stage 3 exposure. Excluding this, total coverage for corporate loans in UK is 0.8%.
2Excludes loan commitments and financial guarantees of £14.9bn carried at fair value.
3Other financial assets subject to impairment not included in the table above include cash collateral and settlement balances, financial assets at fair value through other comprehensive
income and other assets. These have a total gross exposure of £180.1bn and impairment allowance of £163m. This comprises £10m ECL on £178.4bn Stage 1 exposure, £9m on
£1.5bn Stage 2 exposure and £144m on £149m Stage 3 exposure.
4The annualised loan loss rate is 30bps after applying the total impairment charge of £1,220m.
| | | | | | | | | |
| Climate and sustainability report | | | | | | | Barclays PLC 2023 Annual Report on Form 20-F | |
| |
| | | | | | | | | |
Risk performance - Credit risk (continued) |
Loans and advances at amortised cost by product (audited)
The table below presents a product breakdown by stages of loans and advances at amortised cost. Also included is a breakdown of
Stage 2 past due balances.
| | | | | | | |
Loans and advances at amortised cost by product (audited) |
| | | | |
| | | | | | | |
| | | | | | | |
| | | | | | | |
| | | | | | | |
| | | | | | | |
| | | | | | | |
| | | | | | | |
| | | | | | | |
| | | | | | | |
| | | | | | | |
| | | | | | | |
| | | | | | | |
| | | | | | | |
| | | | | | | |
| | | | | | | |
| | | | | | | |
| | | | | | | |
| | | | | | | |
| | | | | | | |
| | | | | | | |
| | | | | | | |
| | | | | | | |
| | | | | | | |
| | | | | | | |
| | | | | | | |
| | | | | | | |
| | | | | | | |
| | | | | | | |
| | | | | | | |
| | | | | | | |
| | | | | | | |
| | | | | | | |
| | | | | | | |
| | | | | | | |
| | | | | | | |
| | | | | | | |
| | | | | | | |
| | | | | | | |
| | | | | | | |
| | | | | | | |
| | | | | | | |
| | | | | | | |
| | | | | | | |
| | | | | | | |
| | | | | | | |
| | | | | | | |
| | | | | | | |
| | | | | | | |
| | | | | | | |
| | | | | | | |
| | | | | | | |
| | | | | | | |
| | | | | | | |
| | | | | | | |
| | | | | | | |
| | | | | | | |
| | | | | | | |
| | | | | | | | | |
| Climate and sustainability report | | | | | | | Barclays PLC 2023 Annual Report on Form 20-F | |
| |
| | | | | | | | | |
Risk performance - Credit risk (continued) |
Movement in gross exposures and impairment allowance including provisions for loan commitments and
financial guarantees
The following tables present a reconciliation of the opening to the closing balance of the exposure and impairment allowance.
Transfers between stages in the tables have been reflected as if they had taken place at the beginning of the year. 'Net drawdowns,
repayments, net-remeasurement and movements due to exposure and risk parameter changes' includes additional drawdowns and
partial repayments from existing facilities. Additionally, the below tables do not include other financial assets subject to impairment such
as debt securities at amortised cost, cash collateral and settlement balances, financial assets at fair value through other comprehensive
income and other assets.
The movements are measured over a 12-month period.
| | | | | | | | | |
| Climate and sustainability report | | | | | | | Barclays PLC 2023 Annual Report on Form 20-F | |
| |
| | | | | | | | | |
Risk performance - Credit risk (continued) |
| | | | | | | | |
Loans and advances at amortised cost (audited) |
| | | | |
| | | | | | | | |
| | | | | | | | |
| | | | | | | | |
| | | | | | | | |
Transfers from Stage 1 to Stage 2 | | | | | | | | |
Transfers from Stage 2 to Stage 1 | | | | | | | | |
| | | | | | | | |
| | | | | | | | |
Business activity in the year1 | | | | | | | | |
Refinements to models used for calculation | | | | | | | | |
Net drawdowns, repayments, net re-measurement and movements due to exposure and risk parameter changes | | | | | | | | |
| | | | | | | | |
| | | | | | | | |
| | | | | | | | |
| | | | | | | | |
| | | | | | | | |
| | | | | | | | |
Transfers from Stage 1 to Stage 2 | | | | | | | | |
Transfers from Stage 2 to Stage 1 | | | | | | | | |
| | | | | | | | |
| | | | | | | | |
Business activity in the year | | | | | | | | |
Refinements to models used for calculation3 | | | | | | | | |
Net drawdowns, repayments, net re-measurement and movements due to exposure and risk parameter changes | | | | | | | | |
| | | | | | | | |
Transfers to assets held for sale4 | | | | | | | | |
| | | | | | | | |
| | | | | | | | |
| | | | | | | | |
| | | | | | | | |
| | | | | | | | |
Transfers from Stage 1 to Stage 2 | | | | | | | | |
Transfers from Stage 2 to Stage 1 | | | | | | | | |
| | | | | | | | |
| | | | | | | | |
Business activity in the year | | | | | | | | |
Refinements to models used for calculation | | | | | | | | |
Net drawdowns, repayments, net re-measurement and movements due to exposure and risk parameter changes | | | | | | | | |
| | | | | | | | |
Transfers to assets held for sale4 | | | | | | | | |
| | | | | | | | |
| | | | | | | | |
| | | | | | | | |
Notes
1Business activity in the year reported within Retail mortgages includes an acquisition of Kensington Mortgage Company in UK Mortgages of £2.4bn.
2The £531m of disposals reported within Retail mortgages relate to transfer of facilities to a non-consolidated special purpose vehicle for the purpose of securitisation. The £186m of
disposals reported within Retail credit cards include debt sales undertaken during the year. The £134m of disposals reported within Retail other include £64m part sale of Wealth
portfolio in Italy and £70m of debt sales undertaken during the year.
3Refinements to models used for calculation reported within Retail credit cards include a £88m movement in UK Cards, £43m movement in US Cards and £(111)m movement in the
German consumer finance business. These reflect model enhancements made during the year. Barclays continually reviews the output of models to determine accuracy of the ECL
calculation including review of model monitoring, external benchmarking and experience of model operation over an extended period of time. This helps to ensure that the models used
continue to reflect the risks inherent across the businesses.
4Transfers to assets held for sale reported within Retail credit cards and Retail other relate to the German consumer finance business.
| | | | | | | | | |
| Climate and sustainability report | | | | | | | Barclays PLC 2023 Annual Report on Form 20-F | |
| |
| | | | | | | | | |
Risk performance - Credit risk (continued) |
| | | | | | | | |
Loans and advances at amortised cost (audited) |
| | | | |
| | | | | | | | |
| | | | | | | | |
| | | | | | | | |
| | | | | | | | |
Transfers from Stage 1 to Stage 2 | | | | | | | | |
Transfers from Stage 2 to Stage 1 | | | | | | | | |
| | | | | | | | |
| | | | | | | | |
Business activity in the year | | | | | | | | |
Refinements to models used for calculation1 | | | | | | | | |
Net drawdowns, repayments, net re-measurement and movements due to exposure and risk parameter changes2 | | | | | | | | |
| | | | | | | | |
| | | | | | | | |
| | | | | | | | |
| | | | | | | | |
| | | | | | | | |
Reconciliation of ECL movement to credit impairment charge/(release) for the period | | | | | | | | |
| | | | | | | | |
| | | | | | | | |
| | | | | | | | |
| | | | | | | | |
| | | | | | | | |
| | | | | | | | |
ECL movements excluding assets held for sale, disposals and write-offs4 | | | | | | | | |
ECL movement on loan commitments and other financial guarantees | | | | | | | | |
ECL movement on other financial assets | | | | | | | | |
ECL movement on debt securities at amortised cost | | | | | | | | |
Recoveries and reimbursements5 | | | | | | | | |
Total exchange and other adjustments | | | | | | | | |
Total credit impairment charge for the year | | | | | | | | |
Notes
1Refinements to models used for calculation reported within Corporate loans include a £93m movement in Corporate and Investment Bank and £20m movement in Barclaycard
Payments. These reflect model enhancements made during the year. Barclays continually reviews the output of models to determine accuracy of the ECL calculation including review of
model monitoring, external benchmarking and experience of model operation over an extended period of time. This helps to ensure that the models used continue to reflect the risks
inherent across the businesses.
2'Net drawdowns, repayments, net re-measurement and movements due to exposure and risk parameter changes' reported within Corporate loans also include assets of £0.8bn
derecognised due to payment received on defaulted loans from government guarantees issued under government’s Bounce Back Loans Scheme.
3The £608m of disposals reported within Corporate loans relate to debt sales undertaken during the year.
4In 2023, gross write-offs amounted to £1,168m (2022: £1,620m) and post write-off recoveries amounted to £44m (2022: £64m). Net write-offs represent gross write-offs less post
write-off recoveries and amounted to £1,124m (2022: £1,556m).
5Recoveries and reimbursements include £29m for reimbursements expected to be received under the arrangement where Group has entered into financial guarantee contracts which
provide credit protection over certain assets with third parties and cash recoveries of previously written off amounts of £44m.
| | | | | | | | | |
| Climate and sustainability report | | | | | | | Barclays PLC 2023 Annual Report on Form 20-F | |
| |
| | | | | | | | | |
Risk performance - Credit risk (continued) |
| | | | | | | | |
Loan commitments and financial guarantees (audited) |
| | | | |
| | | | | | | | |
| | | | | | | | |
| | | | | | | | |
| | | | | | | | |
Net transfers between stages | | | | | | | | |
Business activity in the year | | | | | | | | |
Net drawdowns, repayments, net re- measurement and movement due to exposure and risk parameter changes | | | | | | | | |
Limit management and final repayments | | | | | | | | |
| | | | | | | | |
| | | | | | | | |
| | | | | | | | |
| | | | | | | | |
Net transfers between stages | | | | | | | | |
Business activity in the year | | | | | | | | |
Net drawdowns, repayments, net re- measurement and movement due to exposure and risk parameter changes | | | | | | | | |
Limit management and final repayments | | | | | | | | |
| | | | | | | | |
Note
1Loan commitments reported within Retail credit cards and Retail other also include financial assets classified as held for sale.
| | | | | | | | | |
| Climate and sustainability report | | | | | | | Barclays PLC 2023 Annual Report on Form 20-F | |
| |
| | | | | | | | | |
Risk performance - Credit risk (continued) |
| | | | | | | | |
Loans and advances at amortised cost (audited) |
| | | | |
| | | | | | | | |
| | | | | | | | |
| | | | | | | | |
| | | | | | | | |
Transfers from Stage 1 to Stage 2 | | | | | | | | |
Transfers from Stage 2 to Stage 1 | | | | | | | | |
| | | | | | | | |
| | | | | | | | |
Business activity in the year | | | | | | | | |
Refinements to models used for calculation | | | | | | | | |
Net drawdowns, repayments, net re- measurement and movements due to exposure and risk parameter changes | | | | | | | | |
| | | | | | | | |
| | | | | | | | |
| | | | | | | | |
| | | | | | | | |
| | | | | | | | |
| | | | | | | | |
| | | | | | | | |
Transfers from Stage 1 to Stage 2 | | | | | | | | |
Transfers from Stage 2 to Stage 1 | | | | | | | | |
| | | | | | | | |
| | | | | | | | |
Business activity in the year | | | | | | | | |
Refinements to models used for calculation1 | | | | | | | | |
Net drawdowns, repayments, net re- measurement and movements due to exposure and risk parameter changes | | | | | | | | |
| | | | | | | | |
| | | | | | | | |
| | | | | | | | |
| | | | | | | | |
Notes
1Refinements to models used for calculation reported within Retail credit cards include a £0.3bn movement in US Cards and £(0.2)bn in UK Cards. These reflect model enhancements
made during the year. Barclays continually reviews the output of models to determine accuracy of the ECL calculation including review of model monitoring, external benchmarking and
experience of model operation over an extended period of time. This helps to ensure that the models used continue to reflect the risks inherent across the businesses.
2The £0.4bn of disposals reported within Retail credit cards include a £0.2bn sale of NFL portfolio within US Cards and £0.2bn of debt sales undertaken during the year. The £0.1bn
disposals reported within Retail other include debt sales undertaken during the year.
| | | | | | | | | |
| Climate and sustainability report | | | | | | | Barclays PLC 2023 Annual Report on Form 20-F | |
| |
| | | | | | | | | |
Risk performance - Credit risk (continued) |
| | | | | | | | |
Loans and advances at amortised cost (audited) |
| | | | | | | | |
| | | | | | | | |
| | | | | | | | |
| | | | | | | | |
Transfers from Stage 1 to Stage 2 | | | | | | | | |
Transfers from Stage 2 to Stage 1 | | | | | | | | |
| | | | | | | | |
| | | | | | | | |
Business activity in the year | | | | | | | | |
Refinements to models used for calculation1 | | | | | | | | |
Net drawdowns, repayments, net re- measurement and movements due to exposure and risk parameter changes2 | | | | | | | | |
| | | | | | | | |
| | | | | | | | |
| | | | | | | | |
| | | | | | | | |
| | | | |
Reconciliation of ECL movement to credit impairment charge/(release) for the period | | | | |
| | | | |
| | | | |
| | | | |
| | | | |
| | | | |
ECL movement derecognised due to disposals and write-offs4 | | | | |
ECL movement on loan commitments and financial guarantees | | | | |
ECL movement on other financial assets | | | | |
ECL movement on debt securities at amortised cost | | | | |
Recoveries and reimbursements5 | | | | |
Total exchange and other adjustments | | | | |
Total credit impairment charge for the year | | | | |
Notes
1Refinements to model used for calculation reported within Corporate loans include a £(0.5)bn movement in Business Banking. These reflect model enhancements made during the
year. Barclays continually review the output of models to determine accuracy of the ECL calculation including review of model monitoring, external benchmarking and experience of
model operation over an extended period of time. This ensures that the models used continue to reflect the risks inherent across the businesses.
2'Net drawdowns, repayments, net re-measurement and movements due to exposure and risk parameter changes' reported within Corporate loans also include assets of £1.3bn
derecognised due to payment received on defaulted loans from government guarantees issued under government’s Bounce Back Loans Scheme.
3The £80m of disposals reported within Corporate loans relate to debt sales undertaken during the year.
4In 2022, gross write-offs amounted to £1,620m. In Q422, £329m of balances with de minimis recovery expectations were written-off in line with policy in UK Cards and Unsecured
Loans. Post write-off recoveries amounted to £64m. Net write-offs represent gross write-offs less post write-off recoveries and amounted to £1,556m.
5Recoveries and reimbursements include £199m for reimbursements expected to be received under the arrangement where Group has entered into financial guarantees contracts
which provide credit protection over certain assets with third parties and cash recoveries of previously written off amounts of £64m.
| | | | | | | | | |
| Climate and sustainability report | | | | | | | Barclays PLC 2023 Annual Report on Form 20-F | |
| |
| | | | | | | | | |
Risk performance - Credit risk (continued) |
| | | | | | | | |
Loan commitments and financial guarantees (audited) |
| | | | |
| | | | | | | | |
| | | | | | | | |
| | | | | | | | |
| | | | | | | | |
Net transfers between stages | | | | | | | | |
Business activity in the year | | | | | | | | |
Net drawdowns, repayments, net re- measurement and movement due to exposure and risk parameter changes | | | | | | | | |
Limit management and final repayments | | | | | | | | |
| | | | | | | | |
| | | | | | | | |
| | | | | | | | |
| | | | | | | | |
Net transfers between stages | | | | | | | | |
Business activity in the year | | | | | | | | |
Net drawdowns, repayments, net re- measurement and movement due to exposure and risk parameter changes | | | | | | | | |
Limit management and final repayments | | | | | | | | |
| | | | | | | | |
| | | | | | | | |
| | | | | | | | |
| | | | | | | | |
Net transfers between stages | | | | | | | | |
Business activity in the year | | | | | | | | |
Net drawdowns, repayments, net re- measurement and movement due to exposure and risk parameter changes | | | | | | | | |
Limit management and final repayments | | | | | | | | |
| | | | | | | | |
| | | | | | | | |
| | | | | | | | |
| | | | | | | | |
Net transfers between stages | | | | | | | | |
Business activity in the year | | | | | | | | |
Net drawdowns, repayments, net re- measurement and movement due to exposure and risk parameter changes | | | | | | | | |
Limit management and final repayments | | | | | | | | |
| | | | | | | | |
| | | | | | | | | |
| Climate and sustainability report | | | | | | | Barclays PLC 2023 Annual Report on Form 20-F | |
| |
| | | | | | | | | |
Risk performance - Credit risk (continued) |
Stage 2 decomposition
Stage 2 exposures are predominantly identified using quantitative tests where the lifetime PD has deteriorated more than a pre-
determined amount since origination during the year. This is augmented by inclusion of accounts meeting the designated high risk
criteria (including watchlist) for the portfolio under the qualitative test.
A small number of other accounts (1.5% of impairment allowance and 2.2% of gross exposure) are included in Stage 2. These accounts
are not otherwise identified by the quantitative or qualitative tests but are more than 30 days past due. The percentage triggered by
these backstop criteria is a measure of the effectiveness of the Stage 2 criteria in identifying deterioration prior to delinquency. These
balances include items in the Corporate and Investment Bank for reasons such as outstanding interest and fees rather than principal
balances.
| | | | | | | | | |
Loans and advances at amortised cost1 | | | | | | | |
| | | |
| | | 30 days past due backstop | | | | | 30 days past due backstop | |
| | | | | | | | | |
| | | | | | | | | |
| | | | | | | | | |
| | | | | | | | | |
| | | | | | | | | |
| | | | | | | | | |
| | | | | | | | | |
| | | | | | | | | |
| | | | | | | | | |
| | | | | | | | | |
| | | | | | | | | |
| | | | | | | | | |
| | | | | | | | | |
| | | | | | | | | |
| | | | | | | | | |
| | | | | | | | | |
Notes
1Where balances satisfy more than one of the above three criteria for determining a significant increase in credit risk, the corresponding gross exposure and impairment allowance has
been assigned in order of categories presented.
2Exposures reported within Retail credit cards and Retail other exclude the German consumer finance business which has now been classified as assets held for sale.
| | | | | | | | | |
| Climate and sustainability report | | | | | | | Barclays PLC 2023 Annual Report on Form 20-F | |
| |
| | | | | | | | | |
Risk performance - Credit risk (continued) |
Stage 3 decomposition
Stage 3 is comprised of exposures that are considered to be credit impaired. An asset is considered credit impaired when one or more
events occur that have a detrimental impact on the estimated future cash flows of the financial asset. This comprises assets defined as
defaulted and other individually assessed exposures where imminent default or actual loss is identified.
| | | | | | | |
Loans and advances at amortised cost | | | | | | | |
| | | |
| Exposures not charged-off | Exposures individually assessed or in recovery book | | | Exposures not charged-off | Exposures individually assessed or in recovery book | |
| | | | | | | |
| | | | | | | |
| | | | | | | |
| | | | | | | |
| | | | | | | |
| | | | | | | |
| | | | | | | |
| | | | | | | |
| | | | | | | |
| | | | | | | |
| | | | | | | |
| | | | | | | |
| | | | | | | |
| | | | | | | |
| | | | | | | |
| | | | | | | |
Note
1Exposures reported within Retail credit cards and Retail other exclude the German consumer finance business which has now been classified as assets held for sale.
| | | | | | | | | |
| Climate and sustainability report | | | | | | | Barclays PLC 2023 Annual Report on Form 20-F | |
| |
| | | | | | | | | |
Risk performance - Credit risk (continued) |
Management adjustments to models for impairment (audited)
Management adjustments to impairment models are applied in order to factor in certain conditions or changes in policy that are not fully
incorporated into the impairment models, or to reflect additional facts and circumstances at the period end. Management adjustments
are reviewed and incorporated into future model development where applicable.
Management adjustments are captured through “Economic uncertainty” and “Other” adjustments, and are presented by product and
geography below:
| | | | | | |
Management adjustments to models for impairment allowance presented by product and geography (audited)1 |
| Impairment allowance pre management adjustments2 | Economic uncertainty adjustments (a) | | Management adjustments (a+b) | Total impairment allowance3 | Proportion of Management adjustments to total impairment allowance |
|
| | | | | | |
| | | | | | |
| | | | | | |
| | | | | | |
| | | | | | |
| | | | | | |
| | | | | | |
| | | | | | |
| | | | | | |
| | | | | | |
| | | | | | |
| | | | | | |
Debt securities at amortised cost | | | | | | |
Total including debt securities at amortised cost | | | | | | |
| | | | | | |
| | | | | | |
| | | | | | |
| | | | | | |
| | | | | | |
| | | | | | |
| | | | | | |
| | | | | | |
| | | | | | |
| | | | | | |
| | | | | | |
| | | | | | |
| | | | | | |
Debt securities at amortised cost | | | | | | |
Total including debt securities at amortised cost | | | | | | |
| | | | | | | | | |
| Climate and sustainability report | | | | | | | Barclays PLC 2023 Annual Report on Form 20-F | |
| |
| | | | | | | | | |
Risk performance - Credit risk (continued) |
| | | | |
Economic uncertainty adjustments presented by stage (audited) |
| | | | |
| | | | |
| | | | |
| | | | |
| | | | |
| | | | |
| | | | |
| | | | |
| | | | |
| | | | |
| | | | |
| | | | |
| | | | |
Notes
1Positive values reflect an increase in impairment allowance and negative values reflect a reduction in the impairment allowance.
2Includes £5.2bn (2022: £4.8bn) of modelled ECL, £0.4bn (2022: £0.4bn) of individually assessed impairments and £0.3bn (2022: £0.5bn) ECL from non-modelled exposures and debt
securities.
3Total impairment allowance consists of ECL stock on drawn and undrawn exposure.
Economic uncertainty adjustments
Models have been developed with data from non-inflationary periods establishing a relationship between input variables and customer
delinquency based on past behaviour. As such there is a risk that the modelled output fails to capture the appropriate response to
changes in macroeconomic variables including higher interest rates and continuing inflationary stress with modelled impairment
provisions impacted by uncertainty.
This uncertainty continues to be captured in two ways. Firstly, customer uncertainty: the identification of customers and clients who
may be more vulnerable to economic instability; and secondly, model uncertainty: to capture the impact from model limitations and
sensitivities to specific macroeconomic parameters which are applied at a portfolio level.
Economic uncertainty adjustments have decreased from last year following the re-build of UK cards and certain CIB impairment models
which better capture the macroeconomic outlook. Furthermore, adjustments have been reassessed to capture affordability headwinds
in UK retail lending.
The balance as at 31 December 2023 is £198m (2022: £317m) and includes:
Customer and client uncertainty provisions of £166m (2022: £423m):
UK retail lending includes adjustments applied to customers considered most vulnerable to affordability pressures.
•Retail mortgages (UK) £25m (2022: £4m): The increase primarily reflects the risk of borrowers refinancing onto higher rates in the
medium term.
•Retail credit cards (UK) £45m (2022: £93m): The reduction reflects the re-build of UK cards impairment models which better
capture sensitivity to movements in interest rates and inflation.
•Retail other (UK) £9m (2022: £23m): The reduction reflects customer resilience to affordability headwinds.
Corporate loans £87m (2022: £301m): This includes an adjustment of £71m in UK to reflect possible cross default risk on Barclays’
lending in respect of clients who have taken bounce back loans and £16m in Rest of the World (ROW) to provide for downside
uncertainties on European Corporates reflecting recent changes in the macroeconomic outlook.
The reduction of £(214)m in UK and ROW is informed by retirement of an adjustment for high risk sectors following a granular credit risk
assessment, and re-build of certain CIB impairment models which more appropriately capture downside risk.
| | | | | | | | | |
| Climate and sustainability report | | | | | | | Barclays PLC 2023 Annual Report on Form 20-F | |
| |
| | | | | | | | | |
Risk performance - Credit risk (continued) |
Model uncertainty provisions of £32m (2022: £(106)m):
Retail mortgages (UK) £32m (2022: nil ): This includes an adjustment to correct for higher recovery expectations impacted by model
oversensitivity to certain macroeconomic variables.
Corporate loans £nil (2022: £(106)m): The adjustment held in the previous year to correct for model oversensitivity has been retired
following the re-build of certain CIB impairment models which more appropriately capture the macroeconomic outlook.
Other adjustments
Other adjustments are operational in nature and are expected to remain in place until they can be reflected in the underlying models.
These adjustments result from data limitations and model performance related issues identified through model monitoring and other
established governance processes.
Other adjustments of £179m (2022: £208m) includes:
Adjustments for definition of default (DOD) under the Capital Requirements Regulation and model monitoring in Retail mortgages,
Retail other and Corporate loans.
Retail mortgages (UK) £121m (2022: £85m): The increase reflects re-sizing of an adjustment for DOD and an ECL provision for
Kensington Mortgages which was acquired during the year.
Retail credit cards:
•UK £(9)m (2022: £32m): The reduction is informed by retirement of operational adjustments following the re-build of UK cards
impairment models.
•ROW £8m (2022: £55m): The reduction is informed by retirement of an adjustment in US cards for high-risk account management
(HRAM) accounts following model remediation during the year.
Retail other:
•UK £62m (2022: £80m): The underlying adjustments were re-sized and remain broadly in line with the previous year.
•ROW £(6)m (2022: £19m): The reduction is informed by the German consumer finance business classified as assets held for sale.
Corporate loans:
•UK £10m (2022: £166m): The reduction is informed by retirement of model monitoring adjustments in CIB following the re-build of
certain impairment models. Further, operational adjustments have been introduced during the year to remediate conservative
modelled recovery expectations in the ESHLA portfolio.
•ROW £(4)m (2022: £(229)m): The previously held adjustments linked to model monitoring and ECL sensitivity to the macroeconomic
variable for Federal Tax Receipts have been retired following the re-build of certain CIB impairment models.
| | | | | | | | | |
| Climate and sustainability report | | | | | | | Barclays PLC 2023 Annual Report on Form 20-F | |
| |
| | | | | | | | | |
Risk performance - Credit risk (continued) |
Climate Risk ECL assessment
Barclays performed a credit risk assessment of physical and transition risk due to climate change. This was delivered through a
combination of a scenario approach and targeted reviews on specific portfolios identified as more susceptible to climate risk. The
analysis did not result in a separately identifiable impairment charge for year end 2023 reporting.
Scenario Approach: The climate stress test macroeconomic scenario was used in lieu of the production Downside 2 scenario to
determine impact on the weighted average ECL output. The output of this analysis was not significant to warrant an additional climate-
related impairment charge.
Specific Approach: The approach reviewed portfolios previously identified from both internal and external stress tests as more
susceptible to climate risks. In particular, the UK Mortgage portfolio was reviewed to determine the impact of a plausible change in
regulation requiring landlords to upgrade properties to minimum EPC rating of C in the buy-to-let portfolio. In addition, within the
Wholesale portfolio, certain elevated risk sectors (predominantly Oil & Gas, Automotive and Power sectors) were subject to a review
that considered probability of default impact at a counterparty level determined by individual susceptibility to transition climate risks.
The output of this review did not provide variances in ECL deemed sufficiently certain to warrant raising an additional climate-related
charge in 2023.
Barclays acknowledges that impairment could increase over time as risks become more tangible and impact consumers and clients
through physical risks or via impacts from the transition to a low carbon economy. Therefore, Barclays continues to review credit risk
outputs to determine if any additional physical or transition climate risks are identified that are not sufficiently captured via model
output.
Refer to the Barclays resilience to climate scenarios on page 64 for further details.
| | | | | | | | | |
| Climate and sustainability report | | | | | | | Barclays PLC 2023 Annual Report on Form 20-F | |
| |
| | | | | | | | | |
Risk performance - Credit risk (continued) |
Measurement uncertainty and sensitivity analysis
The measurement of modelled ECL involves complexity and judgement, including estimation of probabilities of default (PD), loss given
default (LGD), a range of unbiased future economic scenarios, estimation of expected lives, estimation of exposures at default (EAD)
and assessing significant increases in credit risk. The Group uses a five-scenario model to calculate ECL. An external consensus
forecast is assembled from key sources, including HM Treasury (short and medium term forecasts) and Bloomberg (based on median
of economic forecasts) which forms the Baseline scenario. In addition, two adverse scenarios (Downside 1 and Downside 2) and two
favourable scenarios (Upside 1 and Upside 2) are derived, with associated probability weightings. The adverse scenarios are calibrated
to a broadly similar severity to the Group's internal stress tests and stress scenarios provided by regulators whilst also considering IFRS
9 specific sensitivities and non-linearity. The favourable scenarios are designed to reflect plausible upside risks to the Baseline scenario
which are broadly consistent with the economic narrative approved by the Senior Scenario Review Committee. All scenarios are
regenerated at a minimum semi-annually. The scenarios include key economic variables, (including GDP, unemployment, House Price
Index (HPI) and base rates in both the UK and US markets), and expanded variables using statistical models based on historical
correlations. The upside and downside shocks are designed to evolve over a five-year stress horizon, with all five scenarios converging
to a steady state after approximately seven years.
Scenarios used to calculate the Group’s ECL charge were refreshed in Q423 with the Baseline scenario reflecting the latest consensus
macroeconomic forecasts available at the time of the scenario refresh. In the Baseline scenario, whilst UK and US economies avoid a
recession, GDP growth remains weak in the coming quarters and beyond as restrictive monetary policies, which impact economies with
a lag, continue to restrain growth. Having peaked in 2022, consumer price inflation in key regions continues to ease over 2023 and 2024.
The UK and US unemployment rates rise to 4.8% and 4.4% respectively over 2024 and then stabilise. With the significant decline in
inflationary pressures, major central banks refrain from further interest rate increases. UK house prices continue to decline in 2024
before stabilising and resuming the upward trend from 2025. The housing market in the US remains more resilient, with house prices
continuing to grow.
In the Downside 2 scenario, inflationary pressures are assumed to intensify again, mainly driven by strong wage growth. Central banks
raise rates further, with the UK bank rate and the US federal fund rate each reaching 8.5% in Q324. High interest rates suddenly bring
stress into the financial and non-financial system, causing joblessness to spike and triggering a housing markets crisis and central banks
are forced cut interest rates aggressively. Falling demand reduces UK and US GDP and headline inflation drops to close to zero. In the
Upside 2 scenario, tighter and more productive labour markets help to accelerate economic growth whilst keeping inflationary
pressures under control. With inflation quickly returning to target, central banks lower interest rates, further stimulating aggregate
demand and GDP growth.
The methodology for estimating scenario probability weights involves simulating a range of future paths for UK and US GDP using
historical data with the five scenarios mapped against the distribution of these future paths. The median is centred around the Baseline
with scenarios further from the Baseline attracting a lower weighting before the five weights are normalised to total 100%. The same
scenarios used in the estimation of expected credit losses are also used to inform Barclays' internal planning. The impacts across the
portfolios are different because of the sensitivities of each of the portfolios to specific macroeconomic variables, for example,
mortgages are highly sensitive to house prices, credit cards and unsecured consumer loans are highly sensitive to unemployment. The
increases in the Downside scenario weightings reflected a reduction in GDP stress severity in the Downside scenarios which brought
the GDP of these scenarios closer to the Baseline. The increases in the Upside scenario weightings were driven by the improvement in
actual GDP and the Baseline scenario, bringing the Baseline scenario closer to the Upside scenarios. For further details see page 242. The economic uncertainty adjustments of £0.2bn (2022: £0.3bn) have been applied as overlays to the modelled ECL output. These
adjustments consist of a customer and client uncertainty provision of £0.2bn (2022: £0.4bn) which has been applied to customers and
clients considered most vulnerable to affordability pressures, and a model uncertainty adjustment of £0.0bn (2022: £(0.1)bn). For
further details see pages 235 to 237. The tables below show the key macroeconomic variables used in the five scenarios (5 year annual paths), the probability weights applied
to each scenario and the macroeconomic variables by scenario using ‘specific bases’ i.e. the most extreme position of each variable in
the context of the scenario, for example, the highest unemployment for downside scenarios and the lowest unemployment for upside
scenarios. 5-year average tables and movement over time graphs provide additional transparency. Annual paths show quarterly
averages for the year (unemployment and base rate) or change in the year (GDP and HPI).
| | | | | | | | | |
| Climate and sustainability report | | | | | | | Barclays PLC 2023 Annual Report on Form 20-F | |
| |
| | | | | | | | | |
Risk performance - Credit risk (continued) |
Notes
1Average Real GDP seasonally adjusted change in year.
2Average UK unemployment rate 16-year+.
3Change in year end UK HPI = Halifax All Houses, All Buyers index, relative to prior year end.
4Average US civilian unemployment rate 16-year+.
5Change in year end US HPI = FHFA house price index, relative to prior year end.
| | | | | | | | | |
| Climate and sustainability report | | | | | | | Barclays PLC 2023 Annual Report on Form 20-F | |
| |
| | | | | | | | | |
Risk performance - Credit risk (continued) |
| | | | | |
Scenario probability weighting (audited)1 |
| | | | | |
| | | | | |
| | | | | |
Scenario probability weighting | | | | | |
| | | | | |
Scenario probability weighting | | | | | |
Note
1For further details on changes to scenario weights see page 239. Specific bases shows the most extreme position of each variable in the context of the downside/upside scenarios, for example, the
highest unemployment for downside scenarios, average unemployment for baseline scenarios and lowest unemployment for upside
scenarios. GDP and HPI downside and upside scenario data represents the lowest and highest cumulative position relative to the start
point, in the 20 quarter period.
| | | | | |
Macroeconomic variables (specific bases) (audited)1 |
| | | | | |
| | | | | |
| | | | | |
| | | | | |
| | | | | |
| | | | | |
| | | | | |
| | | | | |
| | | | | |
| | | | | |
| | | | | |
| | | | | |
| | | | | |
| | | | | |
| | | | | |
| | | | | |
| | | | | |
| | | | | |
| | | | | |
Average basis represents the average quarterly value of variables in the 20 quarter period with GDP and HPI based on yearly average
and quarterly CAGRs respectively.
| | | | | |
Macroeconomic variables (5 year averages) (audited)1 |
| | | | | |
| | | | | |
| | | | | |
| | | | | |
| | | | | |
| | | | | |
| | | | | |
| | | | | |
| | | | | |
| | | | | |
| | | | | |
| | | | | |
| | | | | |
| | | | | |
| | | | | |
| | | | | |
| | | | | |
| | | | | |
| | | | | |
Notes
1UK GDP = Real GDP growth seasonally adjusted; UK unemployment = UK unemployment rate 16-year+; UK HPI = Halifax All Houses, All Buyers Index; US GDP = Real GDP growth
seasonally adjusted; US unemployment = US civilian unemployment rate 16-year+; US HPI = FHFA house price index. 20 quarter period starts from Q123 (2022: Q122).
2Maximum growth relative to Q422 (2022: Q421), based on 20 quarter period in Upside scenarios; 5-year yearly average CAGR in Baseline; minimum growth relative to Q422 (2022:
Q421), based on 20 quarter period in Downside scenarios.
3Lowest quarter in Upside scenarios; 5-year average in Baseline; highest quarter in Downside scenarios. Period based on 20 quarters from Q123 (2022: Q122).
4Maximum growth relative to Q422 (2022: Q421), based on 20 quarter period in Upside scenarios; 5-year quarter end CAGR in Baseline; minimum growth relative to Q422 (2022: Q421),
based on 20 quarter period in Downside scenarios.
55-year yearly average CAGR, starting 2022 (2022: 2021).
65-year average, Period based on 20 quarters from Q123 (2022: Q122).
75-year quarter end CAGR, starting Q422 (2022: Q421).
| | | | | | | | | |
| Climate and sustainability report | | | | | | | Barclays PLC 2023 Annual Report on Form 20-F | |
| |
| | | | | | | | | |
Risk performance - Credit risk (continued) |
The graphs below plot the historical data for GDP growth rate and unemployment rate in the UK and US as well as the forecasted data
under each of the five scenarios.
GDP growth based on year on year growth each quarter (Q/(Q-4)).
| | | | | | | | | |
| Climate and sustainability report | | | | | | | Barclays PLC 2023 Annual Report on Form 20-F | |
| |
| | | | | | | | | |
Risk performance - Credit risk (continued) |
ECL under 100% weighted scenarios for modelled portfolios (audited)
The table below shows the modelled ECL assuming each of the five modelled scenarios are 100% weighted with the dispersion of
results around the Baseline, highlighting the impact on exposure and ECL across the scenarios.
Model exposure uses exposure at default (EAD) values and is not directly comparable to gross exposure used in prior disclosures.
| | | | | | |
| |
| | | | | | |
Stage 1 Model exposure (£m) | | | | | | |
| | | | | | |
| | | | | | |
| | | | | | |
| | | | | | |
| | | | | | |
| | | | | | |
| | | | | | |
| | | | | | |
| | | | | | |
| | | | | | |
| | | | | | |
| | | | | | |
| | | | | | |
| | | | | | |
Stage 2 Model exposure (£m) | | | | | | |
| | | | | | |
| | | | | | |
| | | | | | |
| | | | | | |
| | | | | | |
| | | | | | |
| | | | | | |
| | | | | | |
| | | | | | |
| | | | | | |
| | | | | | |
| | | | | | |
| | | | | | |
| | | | | | |
Stage 3 Model exposure (£m)3 | | | | | | |
| | | | | | |
| | | | | | |
| | | | | | |
| | | | | | |
| | | | | | |
| | | | | | |
| | | | | | |
| | | | | | |
| | | | | | |
| | | | | | |
| | | | | | |
| | | | | | |
| | | | | | |
| | | | | | |
| | | | | | |
| | | | | | |
| | | | | | |
| | | | | | |
| | | | | | |
| | | | | | |
| | | | | | | | | |
| Climate and sustainability report | | | | | | | Barclays PLC 2023 Annual Report on Form 20-F | |
| |
| | | | | | | | | |
Risk performance - Credit risk (continued) |
| |
Reconciliation to total ECL | |
| |
ECL from individually assessed exposures4 | |
ECL from non-modelled exposures and others | |
ECL from debt securities at amortised cost | |
ECL from post model management adjustments | |
Of which: ECL from economic uncertainty adjustments | |
| |
Notes
1Model exposures are allocated to a stage based on an individual scenario rather than a probability-weighted approach, as required for Barclays reported impairment allowances. As a result, it is not
possible to back solve the final reported weighted ECL from individual scenarios given balances may be assigned to a different stage dependent on the scenario.
2Model exposures and ECL reported within Retail credit cards and Retail other excludes the German consumer finance business which has now been classified as assets held for sale.
3Model exposures allocated to Stage 3 does not change in any of the scenarios as the transition criteria relies only on an observable evidence of default as at 31 December 2023 and not on
macroeconomic scenario.
4Material corporate loan defaults are individually assessed across different recovery strategies. As a result, ECL of £401m is reported as an individually assessed impairment in the reconciliation table.
The use of five scenarios with associated weighting results in a total weighted ECL uplift from the Baseline ECL of 1.5%.
Retail mortgages: Total weighted ECL of £383m represents a 4.6% increase over the Baseline ECL (£366m) with coverage ratios
remaining steady across the Upside scenarios, Baseline and Downside 1 scenario. Under the Downside 2 scenario, total ECL increases
to £538m driven by a significant fall in UK HPI.
Retail credit cards: Total weighted ECL of £3,561m is broadly aligned to the Baseline ECL (£3,542m). Total ECL increases to £3,893m
under the Downside 2 scenario, driven by an increase in UK and US unemployment rate.
Retail other: Total weighted ECL of £212m is aligned to the Baseline ECL (£211m). Total ECL increases to £233m under the Downside
2 scenario, largely driven by an increase in UK unemployment rate.
Corporate loans: Total weighted ECL of £1,015m represents a 3.8% increase over the Baseline ECL (£978m). Total ECL increases to
£1,438m under the Downside 2 scenario, driven by a decrease in UK and US GDP.
| | | | | | | | | |
| Climate and sustainability report | | | | | | | Barclays PLC 2023 Annual Report on Form 20-F | |
| |
| | | | | | | | | |
Risk performance - Credit risk (continued) |
| | | | | | |
| |
| | | | | | |
Stage 1 Model exposure (£m) | | | | | | |
| | | | | | |
| | | | | | |
| | | | | | |
| | | | | | |
| | | | | | |
| | | | | | |
| | | | | | |
| | | | | | |
| | | | | | |
| | | | | | |
| | | | | | |
| | | | | | |
| | | | | | |
| | | | | | |
Stage 2 Model exposure (£m) | | | | | | |
| | | | | | |
| | | | | | |
| | | | | | |
| | | | | | |
| | | | | | |
| | | | | | |
| | | | | | |
| | | | | | |
| | | | | | |
| | | | | | |
| | | | | | |
| | | | | | |
| | | | | | |
| | | | | | |
Stage 3 Model exposure (£m)2 | | | | | | |
| | | | | | |
| | | | | | |
| | | | | | |
| | | | | | |
| | | | | | |
| | | | | | |
| | | | | | |
| | | | | | |
| | | | | | |
| | | | | | |
| | | | | | |
| | | | | | |
| | | | | | |
| | | | | | |
| | | | | | |
| | | | | | |
| | | | | | |
| | | | | | |
| | | | | | |
| | | | | | |
| | | | | | | | | |
| Climate and sustainability report | | | | | | | Barclays PLC 2023 Annual Report on Form 20-F | |
| |
| | | | | | | | | |
Risk performance - Credit risk (continued) |
| |
Reconciliation to total ECL | |
| |
ECL from individually assessed exposures3 | |
ECL from non-modelled exposures and others | |
ECL from debt securities at amortised cost | |
ECL from post model management adjustments | |
Of which: ECL from economic uncertainty adjustments | |
| |
Notes
1Model exposures are allocated to a stage based on an individual scenario rather than a probability-weighted approach, as required for Barclays reported impairment allowances. As a result, it is not
possible to back solve the final reported weighted ECL from individual scenarios given balances may be assigned to a different stage dependent on the scenario.
2Model exposures allocated to Stage 3 does not change in any of the scenarios as the transition criteria relies only on an observable evidence of default as at 31 December 2022 and not on
macroeconomic scenario.
3Material corporate loan defaults are individually assessed across different recovery strategies. As a result, ECL of £434m is reported as an individually assessed impairment in the reconciliation table.
| | | | | | | | | |
| Climate and sustainability report | | | | | | | Barclays PLC 2023 Annual Report on Form 20-F | |
| |
| | | | | | | | | |
Risk performance - Credit risk (continued) |
Analysis of the concentration of credit risk
A concentration of credit risk exists when a number of counterparties are located in a common geographical region or are engaged in
similar activities and have similar economic characteristics that would cause their ability to meet contractual obligations to be similarly
affected by changes in economic or other conditions. The Group implements limits on concentrations in order to mitigate the risk.
The table below presents an industry credit risk concentration analysis of loans and advances at amortised cost net of impairment
allowance including breakdown by geographical location of the counterparty or customers, impairment stage, maturity and an indicator
of inclusion in carbon-related sectors. A further table is included with geography, impairment stage and maturity allocation of debt
securities at amortised cost, off- balance sheet commitments and financial guarantees and contingent liabilities at amortised cost.
Further detail on the Group policies with regard to managing concentration risk is presented in the Barclays PLC Pillar 3 Report 2023
(unaudited).
Credit risk concentration by Industry for contractual maturity, staging and geography
| | | | | | | | | | | | | | |
Loans and advances at amortised cost net of impairment allowance |
| | | | |
| | | | | | | | | | | | |
| | | | | | | | | | | | | | |
Agriculture, Food and Forest Products | | | | | | | | | | | | | | |
| | | | | | | | | | | | | | |
| | | | | | | | | | | | | | |
Government and central bank | | | | | | | | | | | | | | |
| | | | | | | | | | | | | | |
| | | | | | | | | | | | | | |
| | | | | | | | | | | | | | |
Wholesale and retail distribution and leisure | | | | | | | | | | | | | | |
| | | | | | | | | | | | | | |
| | | | | | | | | | | | | | |
Business and other services | | | | | | | | | | | | | | |
Other Financial Institutions | | | | | | | | | | | | | | |
Cards, unsecured loans and other personal lending | | | | | | | | | | | | | | |
Total loans and advances at amortised cost | | | | | | | | | | | | | | |
Debt securities at amortised cost³ | | | | | | | | | | | | | | |
Total loans and advances at amortised cost including debt securities | | | | | | | | | | | | | | |
| | | | | | | | | | | | | | |
| | | | | | | | | | | | | | |
| | | | | | | | | | | | | | |
| | | | | | | | | |
| Climate and sustainability report | | | | | | | Barclays PLC 2023 Annual Report on Form 20-F | |
| |
| | | | | | | | | |
Risk performance - Credit risk (continued) |
| | | | | | | | | | | | | | |
Loans and advances at amortised cost net of impairment allowance |
| | | | |
| | | | | | | | | | | | |
| | | | | | | | | | | | | | |
Agriculture, Food and Forest Products | | | | | | | | | | | | | | |
| | | | | | | | | | | | | | |
| | | | | | | | | | | | | | |
Government and central bank | | | | | | | | | | | | | | |
| | | | | | | | | | | | | | |
| | | | | | | | | | | | | | |
| | | | | | | | | | | | | | |
Wholesale and retail distribution and leisure | | | | | | | | | | | | | | |
| | | | | | | | | | | | | | |
| | | | | | | | | | | | | | |
Business and other services | | | | | | | | | | | | | | |
Other Financial Institutions | | | | | | | | | | | | | | |
Cards, unsecured loans and other personal lending | | | | | | | | | | | | | | |
Total loans and advances at amortised cost | | | | | | | | | | | | | | |
Debt securities at amortised cost³ | | | | | | | | | | | | | | |
Total loans and advances at amortised cost including debt securities | | | | | | | | | | | | | | |
| | | | | | | | | | | | | | |
| | | | | | | | | | | | | | |
| | | | | | | | | | | | | | |
Notes
1Refer to Carbon related assets table on page 213 for more details on the "Exposures towards sectors that highly contribute to carbon related assets" under the respective Industry sectors.
2The Off-balance sheet contingent liabilities and loan commitments excludes the fair value balance of £16,469m in 2023 (2022: £14,894m) and includes exposures relating to financial
assets classified as assets held for sale.
3Debt securities at amortized cost primarily includes £34,237m (2022: £27,233m) in Government and central bank, £16,265m (2022: £11,579m) in other financial institutions, £2,854m
(2022: £3,457m) in materials & building and £1,516m (2022: £1,816m) in Banks.
- For analysis of Debt securities by issuer, refer to "Analysis of Debt Securities" on page 262. | | | | | | | | | |
| Climate and sustainability report | | | | | | | Barclays PLC 2023 Annual Report on Form 20-F | |
| |
| | | | | | | | | |
Risk performance - Credit risk (continued) |
The approach to management and representation of credit quality
Asset credit quality
The credit quality distribution is based on the IFRS 9 12-month probability of default (PD) at the reporting date to ensure comparability
with other ECL disclosures in the Expected Credit Losses section.
The following internal measures are used to determine credit quality for loans:
| | | | | | | |
| Internal Default Grade Band | | Credit Quality description | | |
| | |
| | | | | | | |
| | | | | |
| | | | | |
| | | | | |
| | | | | |
| | | | | | | |
| | | | | |
| | | | | | | |
| | | | | |
| | | | | |
| | | | | | | |
| | | | | | |
| | | | | | | |
| | | | | |
| | | | | |
| | | | | |
| | | | | | | |
| | | | | |
| | | | | |
| | | | | |
| | | | | |
| | | | | | | |
| | | | | | |
| | | | | | |
| | | | | | | |
|
For retail clients, a range of analytical tools is used to derive the probability of default of clients at inception and on an ongoing basis.
For loans that are not past due, these descriptions can be summarised as follows:
Strong: there is a very high likelihood of the asset being recovered in full.
Satisfactory: while there is a high likelihood that the asset will be recovered and therefore, of no cause for concern to the Group, the
asset may not be collateralised, or may relate to unsecured retail facilities. At the lower end of this grade there are customers that are
being more carefully monitored, for example, corporate customers which are indicating some evidence of deterioration, home loans
with a high loan to value, and unsecured retail loans operating outside normal product guidelines.
Higher risk: there is concern over the obligor’s ability to make payments when due. However, these have not yet converted to actual
delinquency. There may also be doubts over the value of collateral or security provided. However, the borrower or counterparty is
continuing to make payments when due and is expected to settle all outstanding amounts of principal and interest.
Loans that are past due are monitored closely, with impairment allowances raised as appropriate and in line with the Group’s
impairment policies.
Debt securities
For assets held at fair value, the carrying value on the balance sheet will include, among other things, the credit risk of the issuer. Most
listed and some unlisted securities are rated by external rating agencies. The Group mainly uses external credit ratings provided by
Standard & Poor’s, Fitch or Moody’s. Where such ratings are not available or are not current, the Group will use its own internal ratings
for the securities.
| | | | | | | | | |
| Climate and sustainability report | | | | | | | Barclays PLC 2023 Annual Report on Form 20-F | |
| |
| | | | | | | | | |
Risk performance - Credit risk (continued) |
Balance sheet credit quality
The following tables present the credit quality of the Group’s assets exposed to credit risk.
Overview
As at 31 December 2023, the ratio of the Group’s on-balance sheet assets classified as strong (0.0 to <0.60%) remained stable at 87%
(2022: 87%) of total assets exposed to credit risk. Further analysis of debt securities by issuer and issuer type and netting and collateral
arrangements on derivative financial instruments is presented in the Analysis of debt securities section and Analysis of derivatives
section.
| | | | | | | | |
Balance sheet credit quality (audited) | | | | | |
| | | | |
| | | | | | |
| | | | | | | | |
| | | | | | | | |
Cash and balances at central banks | | | | | | | | |
Cash collateral and settlement balances | | | | | | | | |
Loans and advances at amortised cost: | | | | | | | | |
| | | | | | | | |
| | | | | | | | |
| | | | | | | | |
| | | | | | | | |
Total loans and advances at amortised cost | | | | | | | | |
Debt securities at amortised cost | | | | | | | | |
Reverse repurchase agreements and other similar secured lending | | | | | | | | |
Trading portfolio assets: | | | | | | | | |
| | | | | | | | |
| | | | | | | | |
Total trading portfolio assets | | | | | | | | |
Financial assets at fair value through the income statement: | | | | | | | | |
| | | | | | | | |
| | | | | | | | |
Reverse repurchase agreements | | | | | | | | |
| | | | | | | | |
Total financial assets at fair value through the income statement | | | | | | | | |
Derivative financial instruments | | | | | | | | |
Financial assets at fair value through other comprehensive income | | | | | | | | |
| | | | | | | | |
| | | | | | | | |
| | | | | | | | |
| | | | | | | | | |
| Climate and sustainability report | | | | | | | Barclays PLC 2023 Annual Report on Form 20-F | |
| |
| | | | | | | | | |
Risk performance - Credit risk (continued) |
| | | | | | | | |
Balance sheet credit quality (audited) | | | | | |
| | | | |
| | | | | | |
| | | | | | | | |
| | | | | | | | |
Cash and balances at central banks | | | | | | | | |
Cash collateral and settlement balances | | | | | | | | |
Loans and advances at amortised cost: | | | | | | | | |
| | | | | | | | |
| | | | | | | | |
| | | | | | | | |
| | | | | | | | |
Total loans and advances at amortised cost | | | | | | | | |
Debt securities at amortised cost | | | | | | | | |
Reverse repurchase agreements and other similar secured lending | | | | | | | | |
Trading portfolio assets: | | | | | | | | |
| | | | | | | | |
| | | | | | | | |
Total trading portfolio assets | | | | | | | | |
Financial assets at fair value through the income statement: | | | | | | | | |
| | | | | | | | |
| | | | | | | | |
Reverse repurchase agreements | | | | | | | | |
| | | | | | | | |
Total financial assets at fair value through the income statement | | | | | | | | |
Derivative financial instruments | | | | | | | | |
Financial assets at fair value through other comprehensive income | | | | | | | | |
| | | | | | | | |
| | | | | | | | |
| | | | | | | | |
| | | | | | | | | |
| Climate and sustainability report | | | | | | | Barclays PLC 2023 Annual Report on Form 20-F | |
| |
| | | | | | | | | |
Risk performance - Credit risk (continued) |
Credit exposures by internal PD grade
The below tables represent credit risk profiles by PD grade for loans and advances at amortised cost, contingent liabilities and loan
commitments.
Stage 1 higher risk assets, presented gross of associated collateral held, are of weaker credit quality but have not significantly
deteriorated since origination.
IFRS 9 Stage 1 and Stage 2 classification is not dependent solely on the absolute probability of default but on elements that determine a
Significant Increase in Credit Risk, including relative movement in probability of default since initial recognition. There is therefore no
direct relationship between credit quality and IFRS 9 stage classification.
| | | | | | | | | | | | |
Credit risk profile by internal PD grade for retail mortgages (audited) |
| | | | |
| | Credit quality description | | | | | | | | |
| | | | | | | | | | |
| | | | | | | | | | |
| | | | | | | | | | | | |
| | | | | | | | | | | | |
| | | | | | | | | | | | |
| | | | | | | | | | | | |
| | | | | | | | | | | | |
| | | | | | | | | | | | |
| | | | | | | | | | | | |
| | | | | | | | | | | | |
| | | | | | | | | | | | |
| | | | | | | | | | | | |
Credit risk profile by internal PD grade for retail credit cards (audited)4 |
| | | | |
| | Credit quality description | | | | | | | | |
| | | | | | | | | | |
| | | | | | | | | | |
| | | | | | | | | | | | |
| | | | | | | | | | | | |
| | | | | | | | | | | | |
| | | | | | | | | | | | |
| | | | | | | | | | | | |
| | | | | | | | | | | | |
| | | | | | | | | | | | |
| | | | | | | | | | | | |
| | | | | | | | | | | | |
| | | | | | | | | | | | |
Credit risk profile by internal PD grade for retail other (audited)4 |
| | | | |
| | Credit quality description | | | | | | | | |
| | | | | | | | | | |
| | | | | | | | | | |
| | | | | | | | | | | | |
| | | | | | | | | | | | |
| | | | | | | | | | | | |
| | | | | | | | | | | | |
| | | | | | | | | | | | |
| | | | | | | | | | | | |
| | | | | | | | | | | | |
| | | | | | | | | | | | |
| | | | | | | | | | | | |
| | | | | | | | | |
| Climate and sustainability report | | | | | | | Barclays PLC 2023 Annual Report on Form 20-F | |
| |
| | | | | | | | | |
Risk performance - Credit risk (continued) |
| | | | | | | | | | | | |
Credit risk profile by internal PD grade for corporate loans (audited) |
| | | | |
| | Credit quality description | | | | | | | | |
| | | | | | | | | | |
| | | | | | | | | | |
| | | | | | | | | | | | |
| | | | | | | | | | | | |
| | | | | | | | | | | | |
| | | | | | | | | | | | |
| | | | | | | | | | | | |
| | | | | | | | | | | | |
| | | | | | | | | | | | |
| | | | | | | | | | | | |
| | | | | | | | | | | | |
| | | | | | | | | | | | |
Credit risk profile by internal PD grade for loans and advances at amortised cost (audited)4 |
| | | | |
| | Credit quality description | | | | | | | | |
| | | | | | | | | | |
| | | | | | | | | | |
| | | | | | | | | | | | |
| | | | | | | | | | | | |
| | | | | | | | | | | | |
| | | | | | | | | | | | |
| | | | | | | | | | | | |
| | | | | | | | | | | | |
| | | | | | | | | | | | |
| | | | | | | | | | | | |
| | | | | | | | | | | | |
| | | | | | | | | | | | |
Credit risk profile by internal PD grade for retail mortgages (audited) |
| | | | |
| | Credit quality description | | | | | | | | |
| | | | | | | | | | |
| | | | | | | | | | |
| | | | | | | | | | | | |
| | | | | | | | | | | | |
| | | | | | | | | | | | |
| | | | | | | | | | | | |
| | | | | | | | | | | | |
| | | | | | | | | | | | |
| | | | | | | | | | | | |
| | | | | | | | | | | | |
| | | | | | | | | | | | |
| | | | | | | | | | | | |
Credit risk profile by internal PD grade for retail credit cards (audited) |
| | | | |
| | Credit quality description | | | | | | | | |
| | | | | | | | | | |
| | | | | | | | | | |
| | | | | | | | | | | | |
| | | | | | | | | | | | |
| | | | | | | | | | | | |
| | | | | | | | | | | | |
| | | | | | | | | | | | |
| | | | | | | | | | | | |
| | | | | | | | | | | | |
| | | | | | | | | | | | |
| | | | | | | | | | | | |
| | | | | | | | | |
| Climate and sustainability report | | | | | | | Barclays PLC 2023 Annual Report on Form 20-F | |
| |
| | | | | | | | | |
Risk performance - Credit risk (continued) |
| | | | | | | | | | | | |
Credit risk profile by internal PD grade for retail other (audited) |
| | | | |
| | Credit quality description | | | | | | | | |
| | | | | | | | | | |
| | | | | | | | | | |
| | | | | | | | | | | | |
| | | | | | | | | | | | |
| | | | | | | | | | | | |
| | | | | | | | | | | | |
| | | | | | | | | | | | |
| | | | | | | | | | | | |
| | | | | | | | | | | | |
| | | | | | | | | | | | |
| | | | | | | | | | | | |
| | | | | | | | | | | | |
Credit risk profile by internal PD grade for corporate loans (audited) |
| | | | |
| | Credit quality description | | | | | | | | |
| | | | | | | | | | |
| | | | | | | | | | |
| | | | | | | | | | | | |
| | | | | | | | | | | | |
| | | | | | | | | | | | |
| | | | | | | | | | | | |
| | | | | | | | | | | | |
| | | | | | | | | | | | |
| | | | | | | | | | | | |
| | | | | | | | | | | | |
| | | | | | | | | | | | |
| | | | | | | | | | | | |
Credit risk profile by internal PD grade for loans and advances at amortised cost (audited) |
| | | | |
| | Credit quality description | | | | | | | | |
| | | | | | | | | | |
| | | | | | | | | | |
| | | | | | | | | | | | |
| | | | | | | | | | | | |
| | | | | | | | | | | | |
| | | | | | | | | | | | |
| | | | | | | | | | | | |
| | | | | | | | | | | | |
| | | | | | | | | | | | |
| | | | | | | | | | | | |
| | | | | | | | | | | | |
| | | | | | | | | |
| Climate and sustainability report | | | | | | | Barclays PLC 2023 Annual Report on Form 20-F | |
| |
| | | | | | | | | |
Risk performance - Credit risk (continued) |
| | | | | | | | | | | | |
Credit risk profile by internal PD grade for contingent liabilities (audited)1 |
| | | | |
| | Credit quality description | | | | | | | | |
| | | | | | | | | | |
| | | | | | | | | | |
| | | | | | | | | | | | |
| | | | | | | | | | | | |
| | | | | | | | | | | | |
| | | | | | | | | | | | |
| | | | | | | | | | | | |
| | | | | | | | | | | | |
| | | | | | | | | | | | |
| | | | | | | | | | | | |
| | | | | | | | | | | | |
| | | | | | | | | | | | |
| | | | | | | | | | |
| | | | | | | | | | | | |
| | | | | | | | | | | | |
| | | | | | | | | | | | |
| | | | | | | | | | | | |
| | | | | | | | | | | | |
| | | | | | | | | | | | |
| | | | | | | | | | | | |
| | | | | | | | | | | | |
| | | | | | | | | | | | |
| | | | | | | | | | | | |
Credit risk profile by internal PD grade for loan commitments (audited)1 |
| | | | |
| | Credit quality description | | | | | | | | |
| | | | | | | | | | |
| | | | | | | | | | |
| | | | | | | | | | | | |
| | | | | | | | | | | | |
| | | | | | | | | | | | |
| | | | | | | | | | | | |
| | | | | | | | | | | | |
| | | | | | | | | | | | |
| | | | | | | | | | | | |
| | | | | | | | | | | | |
| | | | | | | | | | | | |
| | | | | | | | | | | | |
| | | | | | | | | | |
| | | | | | | | | | | | |
| | | | | | | | | | | | |
| | | | | | | | | | | | |
| | | | | | | | | | | | |
| | | | | | | | | | | | |
| | | | | | | | | | | | |
| | | | | | | | | | | | |
| | | | | | | | | | | | |
| | | | | | | | | | | | |
Notes
1 Excludes loan commitments and financial guarantees of £16.5bn (2022: £14.9bn) carried at fair value.
2 PD bandings 2.15% to <10% and 10% to <11.35% have been merged for an enhanced presentation. The prior period comparative has been aligned accordingly.
3 Loan commitments reported also include exposures relating to financial assets classified as assets held for sale.
4 Exposures reported within Retail credit cards and Retail other does not include the German consumer finance business which is classified as assets held for sale.
| | | | | | | | | |
| Climate and sustainability report | | | | | | | Barclays PLC 2023 Annual Report on Form 20-F | |
| |
| | | | | | | | | |
Risk performance - Credit risk (continued) |
Analysis of specific portfolios and asset types
This section provides an analysis of principal portfolios and businesses, in particular, home loans, credit cards, unsecured loans and
other retail lending.
Secured home loans
The UK home loans portfolio comprises first lien home loans and accounts for 95% (2022: 93%) of the Group’s total home loan
balances.
| | |
Home loans principal portfolios |
| |
| | |
Gross loans and advances (£m) | | |
>90 day arrears, excluding recovery book (%) | | |
Annualised gross charge-off rates (%) | | |
Recovery book proportion of outstanding balances (%) | | |
Recovery book impairment coverage ratio (%)1 | | |
Note
1Recovery Book Impairment Coverage Ratio excludes KMC.
Within the UK home loans portfolio:
•Gross loans and advances increased by £1.3bn (0.8%) following an increase in Residential (1.2%), and a decrease in Buy to Let (BTL)
(2.1%).
•Owner-occupied interest-only home loans comprised 17% (2022: 17%) of total balances. The average balance weighted LTV on
owner occupied loans increased to 53.1% (2022: 50.0%).
•BTL home loans comprised 12.3% (2022: 12.7%) of total balances. In BTL, the average balance weighted LTV increased to 56.9%
(2022: 53.2%).
| | | | | | | | | | | | |
Home loans principal portfolios - distribution of balances by LTV1 |
| | Distribution of impairment allowance | |
| | | | | | | | | | | | |
| | | | | | | | | | | | |
| | | | | | | | | | | | |
| | | | | | | | | | | | |
| | | | | | | | | | | | |
| | | | | | | | | | | | |
| | | | | | | | | | | | |
| | | | | | | | | | | | |
| | | | | | | | | | | | |
| | | | | | | | | | | | |
| | | | | | | | | | | | |
| | | | | | | | | | | | |
Note
1 Portfolio marked to market based on the most updated valuation including recovery book balances. Updated valuations reflect the application of the latest HPI available as at
31 December 2023.
| | | | | | | | | |
| Climate and sustainability report | | | | | | | Barclays PLC 2023 Annual Report on Form 20-F | |
| |
| | | | | | | | | |
Risk performance - Credit risk (continued) |
| | |
Home loans principal portfolios – average LTV | | |
| |
| | |
Overall portfolio LTV (%): | | |
| | |
| | |
| | |
| | |
Marked to market collateral £m | | |
Average LTV: Balance weighted % | | |
Average LTV: Valuation weighted % | | |
% of Balances in Recoveries | | |
| | |
Home loans principal portfolios - new lending | | |
| |
| | |
New Home loan bookings (£m) | | |
New home loan proportion above 90% LTV (%) | | |
Average LTV on new home loan: balance weighted (%) | | |
Average LTV on new home loan: valuation weighted (%) | | |
New home loans bookings in 2023 decreased 25% to £22.7bn (2022: 30.3bn) and the 90 day arrears rate increased to 0.2% (2022:
0.1%), mainly driven by economic conditions that resulted in general mortgage market suppression, including higher mortgage
payments as rates continued to rise and increased cost of living factors in line with inflation in 2023.
Head Office: Italian home loans and advances at amortised cost reduced to £3.6bn (2022: £4.5bn) and continue to run-off since new
bookings ceased in 2016. The portfolio is secured on residential property with an average balance weighted mark to market LTV of
55.6% (2022: 58.8%). 90-day arrears increased to 2.4% (2022: 1.2%) due to deterioration caused by affordability stress related to rising
inflation and interest rates. The gross charge-off rate was broadly stable at 0.7% (2022: 0.6%).
| | | | | | | | | |
| Climate and sustainability report | | | | | | | Barclays PLC 2023 Annual Report on Form 20-F | |
| |
| | | | | | | | | |
Risk performance - Credit risk (continued) |
Retail Credit Cards and Retail Other
The principal portfolios listed below accounted for 91% (2022: 87%) of the Group’s total retail credit cards and retail other.
| | | | | |
Retail Credit Cards and Retail Other |
| | 30 day arrears rate, excluding recoveries book | 90 day arrears rate, excluding recoveries book | Annualised gross write-off rates | Annualised net write-off rates |
| | | | | |
| | | | | |
| | | | | |
| | | | | |
| | | | | |
| | | | | |
| | | | | |
| | | | | |
| | | | | |
| | | | | |
| | | | | |
| | | | | |
| | | | | |
| | | | | |
| | | | | |
German consumer finance business | | | | | |
| | | | | |
Retail Credit Cards and Retail Other held for sale |
| | 30 day arrears rate, excluding recoveries book | 90 day arrears rate, excluding recoveries book | Annualised gross write-off rates | Annualised net write-off rates |
| | | | | |
| | | | | |
German consumer finance business | | | | | |
UK cards: 30 day and 90 day arrears rates remained stable at 0.9% (2022: 0.9%) and 0.2% (2022: 0.2%) respectively. Total exposure
increased from £9.9bn to £10.4bn due to growth in spend and promotional balances. Both the gross and net write off rates decreased
by 2.3% driven by the impact of a strategy change in 2022 to align the point of charge off and write off in that year and lower charge off
rates in 2023.
UK personal loans: 30 and 90 day arrears rates have remained broadly stable at 1.5% (2022: 1.4%) and 0.6% (2022: 0.6%) respectively.
Both the gross and net write off rates decreased by 2.8%, driven by the impact of a strategy change in 2022 to align the point of charge
off and write off in that year and by the impact of large bulk sales in 2022 which reduced the flow to write off in 2023.
Barclays Partner Finance: 30 and 90 day arrears rates increased marginally to 0.6% (2022: 0.5%) and 0.3% (2022: 0.2%) respectively as
the weighting of lower risk customers with larger balances reduced. Total exposure fell to £2.3bn (2022: £2.6bn) due to a strategic
decision to reduce the number of active partner businesses. Annualised gross and net write off rates remained stable.
US cards: 30 and 90 day arrears rates increased to 2.9% (2022: 2.2%) and 1.5% (2022: 1.2%) respectively due to an anticipated higher
flow into and through delinquency, as rates returned to pre-pandemic levels. Write off rates remained broadly stable at 2.3%.
German consumer finance business: Gross exposure decreased 4% following business reprioritisation and discontinuation of Open
Market loans originations. 30 and 90 day arrears rates remained stable and write-off rates increased due to the impact of accepting
higher loan amount applications during 2022, which has since been discontinued.
| | | | | | | | | |
| Climate and sustainability report | | | | | | | Barclays PLC 2023 Annual Report on Form 20-F | |
| |
| | | | | | | | | |
Risk performance - Credit risk (continued) |
Forbearance
Forbearance measures consist of concessions towards a debtor that is experiencing or about to experience difficulties in meeting their
financial commitments ('financial difficulties')
| | | | | | | | |
Analysis of forbearance programmes |
| | |
| | | | | | | | |
| | | | | | | | |
| | | | | | | | |
| | | | | | | | |
| | | | | | | | |
| | | | | | | | |
| | | | | | | | |
| | | | | | | | |
| | | | | | | | |
| | | | | | | | |
| | | | | | | | |
| | | | | | | | |
| | | | | | | | |
| | | | | | | | |
| | | | | | | | |
| | | | | | | | |
| | | | | | | | |
| | | | | | | | |
| | | | | | | | |
| | | | | | | | |
| | | | | | | | |
| | | | | | | | |
| | | | | | | | |
Retail balances on forbearance reflected increases in UK Home Finance and US cards.
Wholesale balances subject to forbearance increased to £2.7bn (2022: £2.5bn) with increases in exposure in Corporate Bank and
Investment Bank of £107m and £155m respectively. Impairment allowances increased to £210m (2022: £192m) with a range of new
cases, partially offset by write offs. Barclays International accounted for 68% of wholesale forbearance with corporate cases
representing 87% of these balances.
Notes
1Following a review of forbearance programmes across Barclays UK in 2023 which resulted in the identification of a segment of written off balances inflating the forbearance stock, UK
cards 2022 balances have been updated to reflect a decrease of £74m with a corresponding decrease in ECL of £2m.
2Following a review of forbearance programmes across Barclays UK in 2023 which resulted in 'Breathing Space', a 1–2-month cessation of interest and customer contact to allow
businesses to talk to all creditors now being included within Business Banking for the first time, UK Business Banking 2022 balances have been updated to reflect an increase of £222m
with a corresponding increase in ECL of £11m.
| | | | | | | | | |
| Climate and sustainability report | | | | | | | Barclays PLC 2023 Annual Report on Form 20-F | |
| |
| | | | | | | | | |
Risk performance - Credit risk (continued) |
Retail forbearance programmes
Forbearance on the Group’s principal retail portfolios is presented below. The principal portfolios account for 99% (2022: 99%) of total
retail forbearance balances.
| | | | | | |
Analysis of Key Portfolios in Forbearance Programmes |
| Balances on Forbearance Programmes | Marked to market LTV of forbearance balances: balance weighted | Marked to market LTV of forbearance balances: valuation weighted | Impairment allowances marked against balances on forbearance programmes | Total balances on forbearance programmes coverage ratio |
| | % of gross retail loans and advances |
|
| | | | | | |
| | | | | | |
| | | | | | |
| | | | | | |
| | | | | | |
| | | | | | |
| | | | | | |
| | | | | | |
| | | | | | |
| | | | | | |
| | | | | | |
| | | | | | |
| | | | | | |
| | | | | | |
| | | | | | |
| | | | | | |
| | | | | | |
| | | | | | |
| | | | | | |
| | | | | | |
German consumer finance business | | | | | | |
| | | | | | |
| | | | | | |
| | | | | | |
Analysis of Portfolios- held for sale in Forbearance Programmes |
| Balances on Forbearance Programmes | Marked to market LTV of forbearance balances: balance weighted | Marked to market LTV of forbearance balances: valuation weighted | Impairment allowances marked against balances on forbearance programmes | Total balances on forbearance programmes coverage ratio |
| | % of gross retail loans and advances |
|
| | | | | | |
| | | | | | |
| | | | | | |
German consumer finance business | | | | | | |
Note
1Following a review of forbearance programmes across Barclays UK in 2023 which resulted in the identification of a segment of written off balances inflating the forbearance stock, UK
cards 2022 balances have been updated to reflect a decrease of £74m with a corresponding decrease in ECL of £2m.
UK home loans: Forbearance balances rose to £366m (2022: £263m) due to an increase in less-than-interest-only payment
arrangements and concessionary interest rates given to support customers facing rising mortgage interest rates and increased
affordability stress.
UK cards: Balances on forbearance decreased to £215m (2022: £265m) due to increased outflow, against a stable forbearance inflow
across 2023.
UK personal loans: Balances on forbearance programmes decreased to £46m (2022: £59m), as inflow steadily reduced across 2023,
flattening in Q423, and outflow remained stable.
Barclays Partner Finance: Balances on forbearance remained stable and aligned to the total delinquent stock.
US cards: Forbearance balances increased to £290m (2022: £206m) reflecting an increase in new enrolments in 2023 in line with
increased delinquency trends as more customers required assistance.
German consumer finance business: Forbearance balances decreased to £32m (2022: £40m) due to lower customer demand and
increased operational focus on early delinquency stages.
| | | | | | | | | |
| Climate and sustainability report | | | | | | | Barclays PLC 2023 Annual Report on Form 20-F | |
| |
| | | | | | | | | |
Risk performance - Credit risk (continued) |
Italian home loans: Forbearance balances decreased to £119m (2022: £151m) due to the continued availability of COVID-related
government schemes, which are not classified as forbearance, and exits from pre-COVID forbearance schemes.
Wholesale forbearance programmes
The table below details balance information for wholesale forbearance cases.
| | | | |
Analysis of wholesale balances in forbearance programmes |
| Balances on forbearance programmes | Impairment allowances marked against balances on forbearance programmes | Total balances on forbearance programmes coverage ratio |
| | % of gross wholesale loans and advances |
|
| | | |
| | | | |
| | | | |
| | | | |
| | | | |
| | | | |
| | | | |
| | | | |
| | | | |
| | | | |
Note
1Following a review of forbearance programmes across Barclays UK in 2023 which resulted in 'Breathing Space', a 1–2-month cessation of interest and customer contact to allow
businesses to talk to all creditors now being included within Business Banking for the first time, UK Business Banking 2022 balances have been updated to reflect an increase of £222m
with a corresponding increase in ECL of £11m.
Analysis of debt securities
Debt securities include government securities held as part of the Group’s treasury management portfolio for liquidity and regulatory
purposes, and are for use on a continuing basis in the activities of the Group.
The following tables provide an analysis of debt securities held by the Group for trading and investment purposes by issuer type. Further
information on the credit quality of debt securities is presented in the Balance sheet credit quality section.
| | | | |
|
| | |
| | | | |
| | | | |
Governments and other public bodies | | | | |
Corporate and other issuers | | | | |
| | | | |
Mortgage and asset backed securities | | | | |
| | | | |
| | | | | | | | | |
| Climate and sustainability report | | | | | | | Barclays PLC 2023 Annual Report on Form 20-F | |
| |
| | | | | | | | | |
Risk performance - Credit risk (continued) |
Analysis of derivatives
The tables below set out the fair values of the derivative assets together with the value of those assets subject to enforceable
counterparty netting arrangements for which the Group holds offsetting liabilities and eligible collateral.
| | | | | | |
Derivative assets (audited) |
| | |
| | | | | | |
| | | | | | |
| | | | | | |
| | | | | | |
| | | | | | |
| | | | | | |
| | | | | | |
| | | | | | |
| | | | | | |
Net exposure less collateral | | | | | | |
Derivative asset exposures would be £230bn (2022: £273bn) lower than reported under IFRS if netting were permitted for assets and
liabilities with the same counterparty or for which the Group holds cash collateral. Similarly, derivative liabilities would be £(223)bn (2022:
£(264)bn) lower reflecting counterparty netting and collateral placed. In addition, non-cash collateral of £10bn (2022: £11bn) was held in
respect of derivative assets. The Group received collateral from clients in support of over the counter derivative transactions. These
transactions are generally undertaken under International Swaps and Derivative Association (ISDA) agreements governed by either UK
or New York law.
The table below sets out the fair value and notional amounts of OTC derivative instruments by type of collateral arrangement.
| | | | | | |
Derivatives by collateral arrangement |
| | |
| | | | |
| | | | |
| | | | | | |
Unilateral in favour of Barclays | | | | | | |
| | | | | | |
| | | | | | |
| | | | | | |
| | | | | | |
Total unilateral in favour of Barclays | | | | | | |
Unilateral in favour of counterparty | | | | | | |
| | | | | | |
| | | | | | |
| | | | | | |
| | | | | | |
Total unilateral in favour of counterparty | | | | | | |
| | | | | | |
| | | | | | |
| | | | | | |
| | | | | | |
| | | | | | |
| | | | | | |
Total bilateral arrangement | | | | | | |
Uncollateralised derivatives | | | | | | |
| | | | | | |
| | | | | | |
| | | | | | |
| | | | | | |
| | | | | | |
Total uncollateralised derivatives | | | | | | |
Total OTC derivative assets/(liabilities) | | | | | | |
| | | | | | | | | |
| Climate and sustainability report | | | | | | | Barclays PLC 2023 Annual Report on Form 20-F | |
| |
| | | | | | | | | |
Risk performance - Credit risk (continued) |
Market risk
Summary of contents
| | |
| | |
Outlines key measures used to summarise the market risk profile of the bank such as value at risk (VaR). | Market risk overview and summary of performance | |
The Group discloses details on management measures of market risk. Total management VaR includes all trading positions and is presented on a diversified basis by risk factor. This section also outlines the macroeconomic conditions modelled as part of the Group’s risk management framework. | | |
Review of management measures | |
–The daily average, maximum and minimum values of management | |
| |
Market risk
All disclosures in this section are unaudited
unless otherwise stated.
Overview
This section contains key statistics
describing the market risk profile of the
Group. The market risk management
section provides a description of
management VaR.
Measures of market risk in the
Group and accounting measures
Traded market risk measures such as VaR
and balance sheet exposure measures
have fundamental differences:
•balance sheet measures show accruals-
based balances or marked to market
values as at the reporting date;
•VaR measures also take account of
current marked to market values, but in
addition hedging effects between
positions are considered;
•market risk measures are expressed in
terms of changes in value or volatilities
as opposed to static values.
For these reasons, it is not possible to
present direct reconciliations of traded
market risk and accounting measures.
Summary of performance in the
period
Average management VaR increased 17%
to £42m (2022: £36m) and the range
narrowed. The increase was driven by the
impact of funded, fair value leverage loan
exposure in Investment Banking since Q4
2022, partially offset by lower market
volatility and credit spread levels in 2023 as
geopolitical tensions eased, relative to
2022, inflation declined and the pace of
interest rate rises moderated.
Management VaR declined in 2023 from a
high of £73m in November 2022, driven by
a reduction in the size of the funded, fair
value leverage loan exposure in
Investment Banking.
Traded market risk review
Review of management measures
The following disclosures provide details
on management measures of market risk.
Refer to the market risk management
section of the Barclays PLC Pillar 3 Report
2023 (unaudited) for more detail on
management measures and the
differences when compared to regulatory
measures.
The table below shows the total
management VaR on a diversified basis by
risk factor. Total management VaR
includes all trading positions in CIB and
Treasury and it is calculated with a one-day
holding period, measured to a confidence
level of 95%.
Limits are applied against each risk factor
VaR as well as total management VaR,
which are then cascaded further by risk
managers to each business.
| | | | | | | | | |
| Climate and sustainability report | | | | | | | Barclays PLC 2023 Annual Report on Form 20-F | |
| |
| | | | | | | | | |
Risk performance - Market risk |
The daily average, high and low values of management VaR
| | | | | | |
Management VaR (95%, one day) (audited) |
| | |
| | | | | | |
For the year ended 31 December | | | | | | |
| | | | | | |
| | | | | | |
| | | | | | |
| | | | | | |
| | | | | | |
| | | | | | |
| | | | | | |
| | | | | | |
| | | | | | |
| | | | | | |
Note
1Diversification effects recognise that forecast losses from different assets or businesses are unlikely to occur concurrently, hence the expected aggregate loss is lower than the sum of
the expected losses from each area. Historical correlations between losses are taken into account in making these assessments. The high and low VaR figures reported for each
category did not necessarily occur on the same day as the high and low VaR reported as a whole. Consequently, a diversification effect balance for the high and low VaR figures would not
be meaningful and is therefore omitted from the above table.
| | | | | | | | | |
| Climate and sustainability report | | | | | | | Barclays PLC 2023 Annual Report on Form 20-F | |
| |
| | | | | | | | | |
Risk performance - Market risk (continued) |
Treasury and Capital risk
Treasury and Capital risk: summary of contents
| | |
| |
Liquidity risk performance | | |
The risk that the firm is unable to meet its contractual or contingent obligations or that it does not have the appropriate amount, tenor and composition of funding and liquidity to support its assets. This section provides an overview of the Group’s liquidity risk. | Liquidity overview and summary of performance | |
Liquidity risk stress testing | |
–Internal Liquidity Stress Tests | |
| |
–Liquidity coverage ratio | |
–Net stable funding ratio | |
The liquidity pool is held unencumbered and is intended to offset stress outflows. | | |
–Composition of the liquidity pool | |
–Liquidity pool by currency | |
–Management of the liquidity pool | |
| |
The basis for sound liquidity risk management is a funding structure that reduces the probability of a liquidity stress leading to an inability to meet funding obligations as they fall due. | Funding structure and funding relationships | |
| |
| |
Provides details on the contractual maturity of all financial instruments and other assets and liabilities. | Contractual maturity of financial assets and liabilities | |
| | |
Capital risk is the risk that the firm has an insufficient level or composition of capital to support its normal business activities and to meet its regulatory capital requirements under normal operating environments or stressed conditions (both actual and as defined for internal planning or regulatory testing purposes). This also includes the risk from the firm’s pension plans. This section details the Group’s capital position providing information on both capital resources and capital requirements. It also provides details of the leverage ratios and exposures. | Capital risk overview and summary of performance | |
Regulatory minimum capital, leverage and MREL requirements | |
| |
| |
|
|
|
This section outlines the Group’s capital ratios, capital composition, and provides information on significant movements in CET1 capital during the year. | Analysis of capital resources | |
| |
| |
–Movement in CET1 capital | |
This section outlines risk weighted assets by risk type, business and macro drivers. | Analysis of risk weighted assets | |
–Risk weighted assets by risk type and business | |
–Movement analysis of risk weighted assets | |
This section outlines the Group’s leverage ratios, leverage exposure composition, and provides information on significant movements in the IFRS and leverage balance sheet. | Analysis of leverage ratios and exposures | |
–Leverage ratios and exposures | |
The Group discloses the two sources of foreign exchange risk that it is exposed to. | | |
–Transactional foreign currency exposure | |
–Translational foreign exchange exposure | |
–Functional currency of operations | |
A review focusing on the UK retirement fund, which represents the majority of the Group’s total retirement benefit obligation. | | |
| |
| |
| |
| | |
| | | | | | | | | |
| Climate and sustainability report | | | | | | | Barclays PLC 2023 Annual Report on Form 20-F | |
| |
| | | | | | | | | |
Risk performance - Treasury and Capital risk |
| | |
| |
Interest rate risk in the banking book performance |
A description of the non-traded market risk framework is provided. The Group discloses a sensitivity analysis on pre-tax net interest income for non- trading financial assets and liabilities. The analysis is carried out by business unit and currency. The Group measures some non-traded market risks, in particular prepayment, recruitment, and residual risk using an economic capital methodology. The Group discloses the overall impact of a parallel shift in interest rates on other comprehensive income and cash flow hedges. The Group measures the volatility of the value of the FVOCI instruments in the liquidity pool through non-traded market risk VaR. | Net interest income sensitivity | |
| |
| |
Analysis of equity sensitivity | |
Volatility of the FVOCI portfolio in the liquidity pool | |
|
|
|
|
Liquidity risk
All disclosures in this section are
unaudited unless otherwise stated.
Overview
The Group Liquidity Risk is managed within
Treasury and Capital Risk framework and
is designed to maintain liquidity resources
that are sufficient in amount and quality,
and a funding profile that is appropriate to
meet the Group’s Liquidity Risk Appetite
and PRA Regulatory requirements. The
liquidity risk framework is delivered via a
combination of policy formation, review
and governance, analysis, stress testing,
limit setting and monitoring.
This section provides an analysis of the
Group’s: (i) summary of performance, (ii)
liquidity risk stress testing, iii) liquidity
regulation, iv) liquidity pool, (v) funding
structure and funding relationships, (vi)
credit ratings, and (vii) contractual
maturity of financial assets and liabilities.
For further detail on liquidity risk
governance and framework, refer to
pages 172 to 174 of the Barclays PLC Pillar
3 Report 2023 (unaudited).
Key metrics
Liquidity Coverage Ratio1
161%
Net Stable Funding Ratio2
138%
1LCR represents average of the last 12 spot month end
ratios.
2NSFR represents average of the last four spot quarter
end ratios.
Summary of performance
The liquidity pool at £298bn (December
2022: £318bn) reflects the Group’s
prudent approach to liquidity
management. The Average Liquidity
Coverage Ratio (LCR) remained well above
the 100% regulatory requirement at 161%
(December 2022: 156%), equivalent to a
surplus of 118bn (December 2022:
£114bn).
The decrease in the liquidity pool over the
year was driven by a decrease in wholesale
funding, a slight reduction in net deposits
where a decrease in Barclays UK deposits
is largely offset by a growth in Corporate
Bank deposits, and changes in business
funding consumption. A decrease in net
stress outflows led by an increase in the
proportion of corporate deposits treated
as operational led to an increase in the
LCR ratio. The Net Stable Funding Ratio
(average of last four quarter ends) was
138%, which represents a surplus of
£167bn above the 100% regulatory
requirement.
During the year, the Group issued £14.1bn
of minimum requirement for own funds
and eligible liabilities (MREL) instruments in
a range of tenors and currencies.
Barclays Bank PLC continued to issue in
the shorter-term and medium-term
markets and Barclays Bank UK PLC
continued to issue in the shorter-term
markets and maintain active secured
funding programmes. This funding
capacity enables the respective entities to
maintain their stable and diversified
funding bases.
The Group’s reliance on short-term
wholesale funding, as measured by the
proportion of wholesale funding maturing
in less than one year decreased year-on-
year to 33% (December 2022: 39%).
Liquidity risk stress testing
Barclays’ Liquidity Risk is managed within
the Principal Risk: Treasury and Capital
Risk Framework. Under this framework,
the Group has established a liquidity risk
appetite together with the appropriate
limits for the management of the liquidity
risk. This is the level of liquidity risk the
Group chooses to take in pursuit of its
business objectives and in meeting its
regulatory obligations. The Group sets its
internal liquidity risk appetite based on
internal liquidity risk stress tests and,
external regulatory requirements namely
the Liquidity Coverage Ratio (LCR) and
Net Stable Funding Ratio (NSFR).
Internal Liquidity Stress Tests (ILST
formally known as LRA)
The Internal Liquidity Risk Stress Test
measures the potential contractual and
contingent stress outflows under a range
of internally defined stress scenarios,
which are then used to determine the size
of the liquidity pool that is immediately
available to meet anticipated outflows
should a stress occur.
As part of the ILST, the Group runs four
liquidity stress scenarios, aligned to the
PRA’s prescribed stresses:
•90 days market-wide stress event
•30 days Barclays-specific stress event
•30 days combined market-wide and
Barclays-specific stress event
•12 months market wide stress
| | | | | | | | | |
| Climate and sustainability report | | | | | | | Barclays PLC 2023 Annual Report on Form 20-F | |
| |
| | | | | | | | | |
Risk performance - Treasury and Capital risk (continued) |
Key ILST assumptions
For the year ended 31 December 2023
| |
Drivers of Liquidity Risk | ILST Combined stress – key assumptions |
Wholesale Secured and Unsecured Funding Risk | Zero rollover of maturing wholesale unsecured funding |
Partial loss of repo capacity on non-extremely liquid repos at contractual maturity date |
Roll of repo for extremely liquid repo at wider haircut at contractual maturity date |
Withdrawal of contractual buyback obligations, excess client futures margin, Prime Brokerage (PB) client cash and overlifts |
| Haircuts applied to the market value of marketable assets held in the liquidity buffer |
Retail and Corporate Funding Risk | Retail and Corporate deposit outflows as counterparties seek to diversify their deposit balances |
| Liquidity held to meet increased intraday liquidity usage due to payment and receipts volatility, loss of unsecured credit lines and haircuts applied to collateral values used to back secured credit lines, in a stress |
Intra-Group Liquidity Risk | Liquidity support for material subsidiaries. Surplus liquidity held within certain subsidiaries is not taken as a benefit to the wider Group |
Cross-Currency Liquidity Risk | Deterioration in FX market capacity that may result in restriction in net currency positions (managed as a separate framework) |
Off-Balance Sheet Liquidity Risk | Drawdown on committed facilities based on facility and counterparty type |
| Collateral outflows due to a two-notch credit rating downgrade |
| Increase in the Group's initial margin requirement across all major exchanges |
| Variation margin outflows from collateralised risk positions |
| Outflow of collateral owing but not called |
| Loss of internal sources of funding within the PB synthetics business |
| Liquidity held to enable the firm to meet select non-contractual obligations to ensure market confidence in the firm is maintained, including debt buy-backs, swap tear-ups and increased prime brokerage margin debits |
Funding Concentration Risk | Funding from counterparties providing greater than 1% of total funding |
As at 31 December 2023, the Group held eligible liquid assets well in excess of 100% of net stress outflows of the 30 days combined
scenario, which has the highest net outflows of the three short-term liquidity stress scenarios and the 12 month market-wide scenario.
Liquidity regulation
Barclays Group monitors its position against both the LCR and NSFR according to the PRA regulatory requirements which include
certain Basel III standards that were retained in the UK regulatory framework from 1 January 2022 as part of the UK's withdrawal from
the EU. The LCR requirement takes into account the relative stability of different sources of funding and potential incremental funding
requirements in a stress. The LCR is designed to promote short-term resilience of a bank's liquidity risk profile by holding sufficient High
Quality Liquid Assets (HQLA) to survive an acute stress scenario lasting for 30 days. The NSFR has been developed to promote a
sustainable and stable structure of assets and liabilities.
| | | | | | | | | |
| Climate and sustainability report | | | | | | | Barclays PLC 2023 Annual Report on Form 20-F | |
| |
| | | | | | | | | |
Risk performance - Treasury and Capital risk (continued) |
Liquidity coverage ratio
The external LCR requirement is designed to promote short-term resilience of a bank’s liquidity risk profile by holding sufficient High
Quality Liquid Assets (HQLA) to survive an acute stress scenario lasting for 30 days.
| | |
Liquidity Coverage Ratio (LCR)1 | | |
| | |
LCR Eligible High Quality Liquid Assets (HQLA) | | |
| | |
| | |
| | |
Note
1 Liquidity Coverage Ratio is now shown on an average basis, based on the average of the last 12 spot month end ratios. The HQLA, Net Stress outflow, and Surplus balances in the table
above are average month end balances for the past 12 months. Prior period HQLA, Net Stress Outflows, Surplus & LCR comparatives have been updated for consistency.
Net Stable Funding Ratio (NSFR)
The external NSFR metric requires banks to maintain a stable funding profile taking into account both on and certain off balance sheet
exposures over a medium to long term period. The ratio is defined as the Available Stable Funding (capital and certain liabilities which are
defined as stable sources of funding) relative to the Required Stable Funding (a measure of assets on the balance sheet and certain off
balance sheet exposures which may require longer term funding). The NSFR was 138% at December 2023 ( December 2022: 137%)
(average of last four quarter ends) equivalent to a surplus of £167bn (2022: £155bn) above the regulatory requirement and
demonstrates Barclays’ stable balance sheet funding profile.
| | |
| | |
Net Stable Funding Ratio (NSFR)1 | | |
Total Available Stable Funding | | |
Total Required Stable Funding | | |
| | |
| | |
Note
1Average represents the last four spot quarter end ratios.
As part of the liquidity risk appetite, Barclays establishes minimum LCR, NSFR and internal liquidity stress test limits. The Group plans to
maintain its surplus to the internal and regulatory requirements at an efficient level. Risks to market funding conditions, the Group’s
liquidity position and funding profile are assessed continuously, and actions are taken to manage the size of the liquidity pool and the
funding profile as appropriate.
Liquidity pool
The Group liquidity pool as at 31 December 2023 was £298bn (2022: £318bn). In 2023, the month-end liquidity pool ranged from
£298bn to £342bn (2022: £309bn to £359bn), and the month-end average balance was £328bn (2022: £331bn). The liquidity pool is
held unencumbered and is intended to offset stress outflows. It comprises the following cash and unencumbered assets.
| | | | | | | | |
Composition of the Group liquidity pool as at 31 December 2023 |
| LCR eligible High Quality Liquid Assets (HQLA)1 | | |
| | | | | | | | |
| | | | | | | | |
Cash and deposits with central banks2 | | | | | | | | |
| | | | | | | | |
| | | | | | | | |
| | | | | | | | |
| | | | | | | | |
| | | | | | | | |
| | | | | | | | |
| | | | | | | | |
| | | | | | | | |
Government guaranteed issuers, PSEs and GSEs | | | | | | | | |
International organisations and MDBs | | | | | | | | |
| | | | | | | | |
| | | | | | | | |
| | | | | | | | |
| | | | | | | | |
Total as at 31 December 2023 | | | | | | | | |
Total as at 31 December 2022 | | | | | | | | |
Notes
1The LCR eligible HQLA is adjusted for operational restrictions upon consolidation under Article 8 of the Liquidity Coverage Ratio section of the PRA rulebook (CRR) such as trapped
liquidity within Barclays subsidiaries. It also reflects differences in eligibility of assets between the LCR and Barclays’ Liquidity Pool.
2Includes cash held at central banks and surplus cash at central banks related to payment schemes. Of which over 99% (2022: over 99%) was placed with the Bank of England, US Federal
Reserve, European Central Bank, Bank of Japan and Swiss National Bank.
3Of which over 80% (2022: over 79%) comprised UK, US, French, German, Japanese, Swiss and Dutch securities.
| | | | | | | | | |
| Climate and sustainability report | | | | | | | Barclays PLC 2023 Annual Report on Form 20-F | |
| |
| | | | | | | | | |
Risk performance - Treasury and Capital risk (continued) |
The Group liquidity pool is well diversified by major currency and the Group monitors ILST stress scenarios for major currencies.
| | | | | |
Liquidity pool by currency | | | | | |
| | | | | |
| | | | | |
Liquidity pool as at 31 December 2023 | | | | | |
Liquidity pool as at 31 December 2022 | | | | | |
Management of the liquidity pool
The composition of the liquidity pool is subject to limits set by the Board and the independent liquidity risk, credit risk and market risk
functions. In addition, the investment of the liquidity pool is monitored for concentration risk by issuer, currency and asset type. Given
the returns generated by these highly liquid assets, the risk and reward profile is continuously managed.
As at 31 December 2023, 59% (2022: 60%) of the liquidity pool was located in Barclays Bank PLC, 22% (2022: 25%) in Barclays Bank UK
PLC and 11% (2022: 9%) in Barclays Bank Ireland PLC. The residual portion of the liquidity pool is held outside of these entities,
predominantly in the US subsidiaries, to meet entity-specific stress outflows and local regulatory requirements. To the extent the use
of this portion of the liquidity pool is restricted due to local regulatory requirements, it is assumed to be unavailable to the rest of the
Group in calculating the LCR.
Contingent liquidity
In addition to the Group liquidity pool, the Group has access to other unencumbered assets which provide a source of contingent
liquidity. While these are not relied on in the Group’s ILST, a portion of these assets may be monetised in a stress to generate liquidity
through their use as collateral for secured funding or through outright sale.
In a Barclays-specific, market-wide or combined liquidity stress, liquidity available via market sources could be severely disrupted. In
circumstances where market liquidity is unavailable or available only at significantly elevated prices, the Group could generate liquidity
via central bank facilities. To this end, as at 31 December 2023, the Group had £72.5bn (December 2022: £83.3bn) of assets positioned
at various central banks.
For more detail on the Group’s other unencumbered assets, see pages 197 to 201 of the Barclays PLC Pillar 3 Report 2023 (unaudited).
Funding structure and funding relationships
The basis for sound liquidity risk management is a funding structure that reduces the probability of a liquidity stress leading to an inability
to meet funding obligations as they fall due. The Group’s overall funding strategy is to develop a diversified funding base (geographically,
by type and by counterparty) and maintain access to a variety of alternative funding sources, to provide protection against unexpected
fluctuations, while minimising the cost of funding.
Within this, the Group aims to align the sources and uses of funding. As such, retail and corporate loans and advances are largely funded
by deposits in the relevant entities, with the surplus primarily funding the liquidity pool. The majority of reverse repurchase agreements
are matched by repurchase agreements. Derivative liabilities and assets are largely matched. A substantial proportion of balance sheet
derivative positions qualify for counterparty netting and the remaining portions are largely offset when netted against cash collateral
received and paid. Wholesale debt and equity is used to fund residual assets.
These funding relationships are summarised below:
| | | | | | |
| | | | | | |
| | | | | | |
Loans and advances at amortised cost1 | | | | Deposits at amortised cost | | |
| | | | <1 Year wholesale funding | | |
| | | | >1 Year wholesale funding | | |
Reverse repurchase agreements, trading portfolio assets, cash collateral and settlement balances | | | | Repurchase agreements, trading portfolio liabilities, cash collateral and settlement balances | | |
Derivative financial instruments | | | | Derivative financial instruments | | |
| | | | | | |
| | | | | | |
| | | | | | |
Notes
1Adjusted for liquidity pool debt securities reported at amortised costs of £18bn (December 2022: £14bn).
2Other assets include fair value assets that are not part of reverse repurchase agreements or trading portfolio assets, and other asset categories.
| | | | | | | | | |
| Climate and sustainability report | | | | | | | Barclays PLC 2023 Annual Report on Form 20-F | |
| |
| | | | | | | | | |
Risk performance - Treasury and Capital risk (continued) |
Deposit funding
| | | | |
| | |
Funding of loans and advances | Loans and advances,debt securities at amortised cost | Deposits at amortised cost | | |
| | | | |
| | | | |
| | | | |
| | | | |
| | | | |
Note
1The loan: deposit ratio is calculated as loans and advances at amortised cost and debt securities at amortised cost divided by deposits at amortised cost.
As at 31 December 2023, £224bn (2022: £224bn) of total customer deposits were insured through the UK Financial Services
Compensation Scheme (FSCS) and other similar schemes. In addition to these customer deposits £5.6bn (2022: £5.7bn) of other
liabilities are insured by other governments.
Contractually current accounts are repayable on demand and savings accounts at short notice. In practice, their observed maturity is
typically longer than their contractual maturity. Similarly, repayment profiles of certain types of assets e.g. mortgages, overdrafts and
credit card lending, differ from their contractual profiles. The Group therefore assesses the behavioural maturity of both customer
assets and liabilities to identify structural balance sheet funding gaps. In doing so, it applies quantitative modelling and qualitative
assessments which take into account historical experience, current customer composition, and macroeconomic projections.
The Group’s broad base of customers, numerically and by depositor type, helps protect against unexpected fluctuations in balances
and hence provides a stable funding base for the Group’s operations and liquidity needs.
Wholesale funding
Barclays Bank Group and Barclays Bank UK Group maintain access to a variety of sources of wholesale funds in major currencies,
including those available from term investors across a variety of distribution channels and geographies, short-term funding markets and
repo markets.
Barclays Bank Group has direct access to US, European and Asian capital markets through its global investment banking operations and
to long-term investors through its clients worldwide. Key sources of wholesale funding include money markets, certificates of deposit,
commercial paper, medium term issuances (including structured notes) and securitisations.
Key sources of wholesale funding for Barclays Bank UK Group include money markets, certificates of deposit, commercial paper,
covered bonds and other securitisations.
The Group expects to continue issuing public wholesale debt from Barclays PLC (the Parent company), in order to maintain compliance
with indicative MREL requirements and maintain a stable and diverse funding base by type, currency and market. During the year, the
Group issued £14.1bn of MREL instruments from Barclays PLC in a range of different currencies and tenors.
Barclays Bank PLC continued to issue in the shorter-term markets and maintain active medium-term notes programmes. Barclays
Bank UK PLC continued to issue in the shorter-term markets and maintain active secured funding programmes. This funding capacity
enables the respective entities to maintain their stable and diversified funding bases.
As at 31 December 2023, the Group’s total wholesale funding outstanding (excluding repurchase agreements) was £176.8bn (2022:
£184.0bn), of which £19.0bn (2022: £19.2bn) was secured funding and £157.8bn (2022: £164.8bn) unsecured funding. Unsecured
funding includes £69.2bn (2022: £59.7bn) of privately placed senior unsecured notes issued through a variety of distribution channels
including intermediaries and private banks.
Wholesale funding of £58.6bn (2022: £72.5bn) matures in less than one year, representing 33% (December 2022: 39%) of total
wholesale funding outstanding. This includes £18.7bn (2022: £15.0bn) related to term funding2. Although not a requirement, the
liquidity pool exceeded the wholesale funding maturing in less than one year by £239bn (2022: £246bn).
Barclays Bank Group and Barclays Bank UK Group also support various central bank monetary initiatives, such as the Bank of England’s
Term Funding Scheme with additional incentives for SMEs (TFSME), and the European Central Bank’s Targeted Long-Term Refinancing
Operations (TLTRO). These are reported under ‘repurchase agreements and other similar secured borrowing’ on the balance sheet.
In 2023, Barclays repaid £0.9bn of its TLTRO drawings, reducing its outstanding balance to £0.5bn as at 31 December 2023. In addition,
the total outstanding principal amount of TFSME remained at £21.9bn at year end.
| | | | | | | | | |
| Climate and sustainability report | | | | | | | Barclays PLC 2023 Annual Report on Form 20-F | |
| |
| | | | | | | | | |
Risk performance - Treasury and Capital risk (continued) |
| | | | | | | | | | | |
Maturity profile of wholesale funding1,2 | | | | | | | | | | |
| | | | | | | | | | | |
| | | | | | | | | | | |
Barclays PLC (the Parent company) | | | | | | | | | | | |
Senior unsecured (Public benchmark) | | | | | | | | | | | |
Senior unsecured (Privately placed) | | | | | | | | | | | |
| | | | | | | | | | | |
Barclays Bank PLC (including subsidiaries) | | | | | | | | | | | |
Certificates of deposit and commercial paper | | | | | | | | | | | |
Asset backed commercial paper | | | | | | | | | | | |
Senior unsecured (Public benchmark) | | | | | | | | | | | |
Senior unsecured (Privately placed)3 | | | | | | | | | | | |
| | | | | | | | | | | |
| | | | | | | | | | | |
Barclays Bank UK PLC (including subsidiaries) | | | | | | | | | | | |
Certificates of deposit and commercial paper | | | | | | | | | | | |
Senior unsecured (Public benchmark) | | | | | | | | | | | |
| | | | | | | | | | | |
Total as at 31 December 23 | | | | | | | | | | | |
| | | | | | | | | | | |
| | | | | | | | | | | |
Total as at 31 December 22 | | | | | | | | | | | |
| | | | | | | | | | | |
| | | | | | | | | | | |
Notes
1The composition of wholesale funds comprises the balance sheet reported financial liabilities at fair value, debt securities in issue and subordinated liabilities. It does not include
participation in the central bank facilities reported within repurchase agreements and other similar secured borrowing.
2Term funding comprises public benchmark and privately placed senior unsecured notes, covered bonds, asset-backed securities and subordinated debt where the original maturity of
the instrument was more than one year.
3Includes structured notes of £54.7bn, of which £11.5bn matures within one year.
Currency composition of wholesale debt
As at 31 December 2023, the proportion of wholesale funding by major currencies was as follows:
| | | | |
Currency composition of wholesale funding | | | | |
| | | | |
| | | | |
Certificates of deposit and commercial paper | | | | |
Asset backed commercial paper | | | | |
Senior unsecured (Public benchmark) | | | | |
Senior unsecured (Privately placed) | | | | |
Covered bonds / Asset backed securities | | | | |
| | | | |
Total as 31 December 2023 | | | | |
Total as 31 December 2022 | | | | |
To manage cross currency refinancing risk, the Group manages to currency mismatch limits, which limit risk at specific maturities.
| | | | | | | | | |
| Climate and sustainability report | | | | | | | Barclays PLC 2023 Annual Report on Form 20-F | |
| |
| | | | | | | | | |
Risk performance - Treasury and Capital risk (continued) |
Contractual maturity of financial assets and liabilities
The table below provides detail on the contractual maturity of all financial instruments and other assets and liabilities. Derivatives (other
than those designated in a hedging relationship) and trading portfolio assets and liabilities are included in the ‘not more than one month'
column at their fair value. Liquidity risk on these items is not managed on the basis of contractual maturity since they are not held for
settlement according to such maturity and will frequently be settled before contractual maturity at fair value. Derivatives designated in a
hedging relationship are included according to their contractual maturity.
| | | | | | | | |
Contractual maturity of financial assets and liabilities (audited) |
| | Over one month but not more than three months | Over three months but not more than six months | Over six months but not more than one year | Over one year but not more than three years | Over three years but not more than five years | | |
| | | | | | | |
| | | | | | | | |
Cash and balances at central banks | | | | | | | | |
Cash collateral and settlement balances | | | | | | | | |
Loans and advances at amortised cost to banks and customers | | | | | | | | |
Debt securities at amortised cost | | | | | | | | |
Reverse repurchase agreements and other similar secured lending | | | | | | | | |
| | | | | | | | |
Financial assets at fair value through the income statement | | | | | | | | |
Derivative financial instruments | | | | | | | | |
Financial assets at fair value through other comprehensive income | | | | | | | | |
| | | | | | | | |
| | | | | | | | |
| | | | | | | | |
| | | | | | | | |
| | | | | | | | |
Deposits at amortised cost from banks and customers | | | | | | | | |
Cash collateral and settlement balances | | | | | | | | |
Repurchase agreements and other similar secured borrowing | | | | | | | | |
| | | | | | | | |
| | | | | | | | |
Trading portfolio liabilities | | | | | | | | |
Financial liabilities designated at fair value | | | | | | | | |
Derivative financial instruments | | | | | | | | |
Other financial liabilities | | | | | | | | |
Total financial liabilities | | | | | | | | |
| | | | | | | | |
| | | | | | | | |
| | | | | | | | | |
| Climate and sustainability report | | | | | | | Barclays PLC 2023 Annual Report on Form 20-F | |
| |
| | | | | | | | | |
Risk performance - Treasury and Capital risk (continued) |
| | | | | | | | |
Contractual maturity of financial assets and liabilities (audited) |
| | Over one month but not more than three months | Over three months but not more than six months | Over six months but not more than one year | Over one year but not more than three years | Over three years but not more than five years | | |
| | | | | | | |
| | | | | | | | |
Cash and balances at central banks | | | | | | | | |
Cash collateral and settlement balances | | | | | | | | |
Loans and advances at amortised cost to banks and customers | | | | | | | | |
Debt securities at amortised cost | | | | | | | | |
Reverse repurchase agreements and other similar secured lending | | | | | | | | |
| | | | | | | | |
Financial assets at fair value through the income statement | | | | | | | | |
Derivative financial instruments | | | | | | | | |
Financial assets at fair value through other comprehensive income | | | | | | | | |
| | | | | | | | |
| | | | | | | | |
| | | | | | | | |
| | | | | | | | |
| | | | | | | | |
Deposits at amortised cost from banks and customers | | | | | | | | |
Cash collateral and settlement balances | | | | | | | | |
Repurchase agreements and other similar secured borrowing | | | | | | | | |
| | | | | | | | |
| | | | | | | | |
Trading portfolio liabilities | | | | | | | | |
Financial liabilities designated at fair value | | | | | | | | |
Derivative financial instruments | | | | | | | | |
Other financial liabilities | | | | | | | | |
Total financial liabilities | | | | | | | | |
| | | | | | | | |
| | | | | | | | |
Expected maturity date may differ from the contractual dates, to account for:
•trading portfolio assets and liabilities and derivative financial instruments, which may not be held to maturity as part of the Group’s trading
strategies
•corporate and retail deposits, reported under deposits at amortised cost, are repayable on demand or at short notice on a contractual basis.
In practice, their behavioural maturity is typically longer than their contractual maturity, and therefore these deposits provide stable funding
for the Group’s operations and liquidity needs because of the broad base of customers, both numerically and by depositor type
•loans to corporate and retail customers, which are included within loans and advances at amortised cost and financial assets at fair value, may
be repaid earlier in line with terms and conditions of the contract
•debt securities in issue, subordinated liabilities, and financial liabilities designated at fair value, may include early redemption features.
| | | | | | | | | |
| Climate and sustainability report | | | | | | | Barclays PLC 2023 Annual Report on Form 20-F | |
| |
| | | | | | | | | |
Risk performance - Treasury and Capital risk (continued) |
Contractual maturity of financial liabilities on an undiscounted basis
The table below presents the cash flows payable by the Group under financial liabilities by remaining contractual maturities at the
balance sheet date. The amounts disclosed in the table are the contractual undiscounted cash flows of all financial liabilities (i.e. nominal
values).
The balances in the below table do not agree directly to the balances in the consolidated balance sheet as the table incorporates all
cash flows, on an undiscounted basis, related to both principal as well as those associated with all future coupon payments.
Derivative financial instruments held for trading and trading portfolio liabilities are included in the 'not more than one month' column at
their fair value.
| | | | | | | | |
Contractual maturity of financial liabilities - undiscounted (audited) |
| | Over one month but not more than three months | Over three months but not more than six months | Over six months but not more than one year | Over one year but not more than three years | Over three years but not more than five years | | |
| | | | | | | | |
| | | | | | | | |
Deposits at amortised cost from banks and customers | | | | | | | | |
Cash collateral and settlement balances | | | | | | | | |
Repurchase agreements and other similar secured borrowing | | | | | | | | |
| | | | | | | | |
| | | | | | | | |
Trading portfolio liabilities | | | | | | | | |
Financial liabilities designated at fair value | | | | | | | | |
Derivative financial instruments | | | | | | | | |
Other financial liabilities | | | | | | | | |
Total financial liabilities | | | | | | | | |
| | | | | | | | |
Deposits at amortised cost from banks and customers | | | | | | | | |
Cash collateral and settlement balances | | | | | | | | |
Repurchase agreements and other similar secured borrowing | | | | | | | | |
| | | | | | | | |
| | | | | | | | |
Trading portfolio liabilities | | | | | | | | |
Financial liabilities designated at fair value | | | | | | | | |
Derivative financial instruments | | | | | | | | |
Other financial liabilities | | | | | | | | |
Total financial liabilities | | | | | | | | |
| | | | | | | | | |
| Climate and sustainability report | | | | | | | Barclays PLC 2023 Annual Report on Form 20-F | |
| |
| | | | | | | | | |
Risk performance - Treasury and Capital risk (continued) |
Maturity of off-balance sheet commitments given
The table below presents the maturity split of the Group’s off-balance sheet commitments given at the balance sheet date. The
amounts disclosed in the table are the undiscounted cash flows (i.e. nominal values) on the basis of earliest opportunity at which they
are available.
| | | | | | | | |
Maturity analysis of off-balance sheet commitments given (audited) |
| | Over one month but not more than three months | Over three months but not more than six months | Over six months but not more than one year | Over one year but not more than three years | Over three years but not more than five years | | |
| | | | | | | | |
| | | | | | | | |
Contingent liabilities and financial guarantees | | | | | | | | |
Documentary credits and other short- term trade related transactions | | | | | | | | |
Standby facilities, credit lines and other commitments | | | | | | | | |
Total off-balance sheet commitments given | | | | | | | | |
| | | | | | | | |
| | | | | | | | |
Contingent liabilities and financial guarantees | | | | | | | | |
Documentary credits and other short- term trade related transactions | | | | | | | | |
Standby facilities, credit lines and other commitments | | | | | | | | |
Total off-balance sheet commitments given | | | | | | | | |
| | | | | | | | | |
| Climate and sustainability report | | | | | | | Barclays PLC 2023 Annual Report on Form 20-F | |
| |
| | | | | | | | | |
Risk performance - Treasury and Capital risk (continued) |
Capital risk
All disclosures in this section are unaudited
unless otherwise stated.
Overview
The CET1 ratio, among other metrics, is a
measure of the capital strength and
resilience of Barclays. Maintenance of our
capital resources is vital in order to meet
the overall regulatory capital requirement,
to withstand the impact of the risks that
may arise under normal and stressed
conditions, and maintain adequate capital
to cover current and forecast business
needs and associated risks to provide a
viable and sustainable business offering.
This section provides an overview of the
Group’s: (i) CET1 capital, leverage and own
funds and eligible liabilities requirements;
(ii) capital resources; (iii) risk weighted
assets (RWAs); (iv) leverage ratios and
exposures; and (v) own funds and eligible
liabilities.
More details on monitoring and managing
capital risk may be found in the risk
management sections of the Barclays PLC
Pillar 3 Report 2023 (unaudited).
Key metrics
Common Equity Tier 1 ratio
13.8%
UK leverage ratio
5.2%
Own funds and eligible liabilities ratio as a
percentage of RWAs
33.6%
Summary of performance in the
period
The Group continues to be in excess of
overall capital, leverage and MREL
regulatory requirements.
The CET1 ratio decreased to 13.8%
(December 2022: 13.9%) as RWAs
increased by £6.2bn to £342.7bn
partially offset by an increase in CET1
capital of £0.4bn to £47.3bn
▪c.125bps increase from 2023
attributable profit, including the c.25bps
negative impact of structural cost
actions, of which c.10bps are offset in
other capital movements
▪c.70bps decrease driven by returns to
shareholders including the 8p per share
total dividend and £1.25bn of share
buybacks announced with FY22 and
H123 results
▪c.10bps decrease from other capital
movements, including the impact of
regulatory change on 1 January 2023
relating to IFRS 9 transitional relief, the
impact of the KMC acquisition, and
movements in other regulatory capital
deductions
▪c.50bps decrease as a result of a
£13.2bn increase in RWAs excluding the
impact of foreign exchange
movements, primarily driven by higher
CIB and CC&P RWAs
▪An £8.2bn decrease in RWAs as a result
of foreign exchange movements was
offset by a £1.1bn decrease in CET1
capital due to a decrease in the currency
translation reserve
The UK leverage ratio decreased to 5.2%
(December 2022: 5.3%) primarily due to a
£38.3bn increase in leverage exposure to
£1,168.3bn, largely driven by an increase in
trading portfolio assets within Global
Markets
Minimum capital requirements
The Group’s Overall Capital Requirement
for CET1 increased to 12.0%, following the
latest PRA Individual Capital Requirement
(ICR) notice and comprises a 4.5% Pillar 1
minimum, a 2.5% Capital Conservation
Buffer (CCB), a 1.5% Global Systemically
Important Institution (G-SII) buffer, a 2.6%
Pillar 2A requirement and a 0.9%
Countercyclical Capital Buffer (CCyB).
The Group’s CCyB is based on the buffer
rate applicable for each jurisdiction in which
the Group has exposures. Following the
Financial Policy Committee (FPC)
announcement on 5 July 2022, the UK
CCyB increased from 1% to 2% with effect
from 5 July 2023. The buffer rates set by
other national authorities for non-UK
exposures are not currently material.
The Group’s updated Pillar 2A requirement
increased by 25bps to 4.6% of which at
least 56.25% needs to be met with CET1
capital, equating to 2.6% of RWAs. The
Pillar 2A requirement, based on a point in
time assessment, has been set as a
proportion of RWAs and is subject to at
least annual review.
The Group’s CET1 target ratio of 13-14%
takes into account headroom above
requirements which includes a confidential
institution-specific PRA buffer. The Group
remains above its minimum capital
regulatory requirements including the PRA
buffer.
Minimum leverage requirements
The Group is subject to a UK leverage ratio
requirement of 4.1% as at 31 December
2023. This comprises the 3.25% minimum
requirement, a G-SII additional leverage
ratio buffer (G-SII ALRB) of 0.53% and a
countercyclical leverage ratio buffer
(CCLB) of 0.3%.
The Group is also required to disclose an
average UK leverage ratio which is based
on capital on the last day of each month in
the quarter and an exposure measure for
each day in the quarter.
Minimum requirements for own
funds and eligible liabilities
The Group is required to meet the higher
of: (i) two times the sum of 8% Pillar 1 and
4.6% Pillar 2A equating to 25.2% of RWAs;
and (ii) 6.75% of leverage exposures. In
addition, the higher of regulatory capital
and leverage buffers apply. CET1 capital
cannot be counted towards both MREL
and the buffers, meaning that the buffers,
including the above mentioned
confidential institution-specific PRA buffer,
will effectively be applied above MREL
requirements.
| | | | | | | | | |
| Climate and sustainability report | | | | | | | Barclays PLC 2023 Annual Report on Form 20-F | |
| |
| | | | | | | | | |
Risk performance - Treasury and Capital risk (continued) |
Capital resources
| | |
| | |
| | |
| | |
| | |
| | |
MREL ratio as a percentage of total RWAs | | |
| | |
Own funds and eligible liabilities (audited) | | |
| | |
| | |
Total equity excluding non-controlling interests per the balance sheet | | |
Less: other equity instruments (recognised as AT1 capital) | | |
Adjustment to retained earnings for foreseeable ordinary share dividends | | |
Adjustment to retained earnings for foreseeable other equity coupons | | |
| | |
Other regulatory adjustments and deductions | | |
Additional value adjustments (PVA) | | |
Goodwill and intangible assets | | |
Deferred tax assets that rely on future profitability excluding temporary differences | | |
Fair value reserves related to gains or losses on cash flow hedges | | |
Excess of expected losses over impairment | | |
Gains or losses on liabilities at fair value resulting from own credit | | |
Defined benefit pension fund assets | | |
Direct and indirect holdings by an institution of own CET1 instruments | | |
Adjustment under IFRS 9 transitional arrangements | | |
Other regulatory adjustments | | |
| | |
| | |
| | |
Capital instruments and related share premium accounts | | |
Other regulatory adjustments and deductions | | |
| | |
| | |
| | |
| | |
| | |
Capital instruments and related share premium accounts | | |
Qualifying T2 capital (including minority interests) issued by subsidiaries | | |
Credit risk adjustments (excess of impairment over expected losses) | | |
Other regulatory adjustments and deductions | | |
| | |
| | |
Less : Ineligible T2 capital (including minority interests) issued by subsidiaries | | |
| | |
| | |
Total own funds and eligible liabilities3 | | |
| | |
| | |
Notes
1CET1, T1 and T2 capital, and RWAs are calculated applying the transitional arrangements of the CRR as amended by CRR II. This includes IFRS 9 transitional arrangements and the
grandfathering of CRR II non-compliant capital instruments.
2The fully loaded CET1 ratio, as is relevant for assessing against the conversion trigger in Barclays PLC AT1 securities, was 13.7%, with £47.0bn of CET1 capital and £342.7bn of RWAs
calculated without applying the transitional arrangements of the CRR as amended by CRR II.
3As at 31 December 2023, the Group's MREL requirement, excluding the PRA buffer, was to hold £103.0bn of own funds and eligible liabilities equating to 30.1% of RWAs. The Group
remains above its MREL regulatory requirement including the PRA buffer.
| | | | | | | | | |
| Climate and sustainability report | | | | | | | Barclays PLC 2023 Annual Report on Form 20-F | |
| |
| | | | | | | | | |
Risk performance - Treasury and Capital risk (continued) |
| |
| |
| |
| |
Opening balance as at 1 January | |
| |
Profit for the period attributable to equity holders | |
Own credit relating to derivative liabilities | |
Ordinary share dividends paid and foreseen | |
Purchased and foreseeable share repurchase | |
Other equity coupons paid and foreseen | |
Increase in retained regulatory capital generated from earnings | |
| |
Net impact of share schemes | |
Fair value through other comprehensive income reserve | |
Currency translation reserve | |
| |
Decrease in other qualifying reserves | |
| |
Pension remeasurements within reserves | |
Defined benefit pension fund asset deduction | |
| |
| |
Additional value adjustments (PVA) | |
Goodwill and intangible assets | |
Deferred tax assets that rely on future profitability excluding those arising from temporary differences | |
Excess of expected loss over impairment | |
Adjustment under IFRS 9 transitional arrangements | |
Other regulatory adjustments | |
Decrease in regulatory capital due to adjustments and deductions | |
| |
Closing balance as at 31 December | |
CET1 capital increased £0.4bn to £47.3bn (December 2022: £46.9bn).
£5.3bn of capital generated from profit, including the impacts of structural cost actions, was partially offset by distributions of £3.5bn
comprising:
•£1.25bn of share buybacks announced with FY22 and H123 results
•£1.2bn of ordinary share dividend paid and foreseen reflecting £0.4bn interim dividend paid and a £0.8bn accrual towards the FY23
dividend
•£1.0bn of equity coupons paid and foreseen
Other significant movements in the period were:
•£1.1bn decrease in the currency translation reserve driven by the strengthening of GBP against USD
•£0.4bn decrease in IFRS 9 transitional relief primarily due to the relief applied to the pre-2020 impairment charge reducing to 0% in
2023 from 25% in 2022 and the relief applied to the post-2020 impairment charge reducing to 50% in 2023 from 75% in 2022
•£0.2bn increase in PVA, which includes an increase for price uncertainty within corporate loans, including the leveraged finance loan
portfolio
•£0.4bn increase primarily driven by intangible impairment structural cost actions. The impact of this was capital neutral with the
offsetting decrease within attributable profit.
| | | | | | | | | |
| Climate and sustainability report | | | | | | | Barclays PLC 2023 Annual Report on Form 20-F | |
| |
| | | | | | | | | |
Risk performance - Treasury and Capital risk (continued) |
Risk weighted assets
| | | | | | | | | | | | | |
Risk weighted assets (RWAs) by risk type and business |
| | | | | | | | |
| | | | | | | | | | | | | |
| | | | | | | | | | | | | |
| | | | | | | | | | | | | |
Corporate and Investment Bank | | | | | | | | | | | | | |
Consumer, Cards and Payments | | | | | | | | | | | | | |
| | | | | | | | | | | | | |
| | | | | | | | | | | | | |
| | | | | | | | | | | | | |
| | | | | | | | | | | | | |
| | | | | | | | | | | | | |
| | | | | | | | | | | | | |
Corporate and Investment Bank | | | | | | | | | | | | | |
Consumer, Cards and Payments | | | | | | | | | | | | | |
| | | | | | | | | | | | | |
| | | | | | | | | | | | | |
| | | | | | | | | | | | | |
Note
1In Q323 credit risk RWAs of £9.8bn relating to deferred tax assets were reclassified from IRB to STD with no impact to total RWAs.
| | | | | |
Movement analysis of risk weighted assets |
| | | | | |
| | | | | |
| | | | | |
| | | | | |
Acquisitions and disposals | | | | | |
| | | | | |
| | | | | |
| | | | | |
Foreign exchange movement1 | | | | | |
| | | | | |
| | | | | |
Note
1Foreign exchange movements does not include impact of foreign exchange for modelled market risk or operational risk.
Overall RWAs increased £6.2bn to £342.7bn (December 2022: £336.5bn).
Credit risk RWAs decreased £2.2bn:
•A £1.3bn decrease in book size within CIB and mortgages within Barclays UK, partially offset by higher credit card balances within
CC&P
•A £1.5bn increase in book quality RWAs primarily driven by changes in risk parameters and HPI refresh within Barclays
UK
•A £2.6bn decrease in model updates primarily driven by capital LGD model update for the mortgage portfolio to reflect the significant
decrease in repossession volume during and post the COVID pandemic
•A £5.2bn increase in methodology and policy primarily driven by the recalibration of the post model adjustment (PMA) introduced to
address the IRB roadmap changes and a change in treatment of non-credit obligation exposures
•A £5.7bn decrease as a result of foreign exchange movements primarily due to the strengthening of GBP against USD
Counterparty Credit risk RWAs increased £2.8bn:
•A £2.1bn increase in book size primarily due to increased trading activity within CIB
•A £2.7bn increase in methodology and policy due to a recalibration of the PMA introduced to address the IRB roadmap changes and a
change in treatment of certain securities financing transactions collateral
•A £1.9bn decrease as a result of foreign exchange movements primarily due to the strengthening of GBP against USD
Market risk RWAs increased £3.9bn:
•A £3.3bn increase in book size primarily due to increased trading activity within CIB
•A £1.2bn increase in model updates to capture incremental risk arising from Stressed Value at Risk (SVaR), measured on a 10-day
basis
Operational risk RWAs increase £1.7bn:
•A £1.7bn increase in book size primarily driven by the inclusion of higher 2023 CC&P and Barclays UK income compared to 2020
| | | | | | | | | |
| Climate and sustainability report | | | | | | | Barclays PLC 2023 Annual Report on Form 20-F | |
| |
| | | | | | | | | |
Risk performance - Treasury and Capital risk (continued) |
Leverage ratios and exposures
The Group is required to disclose a UK leverage ratio based on capital and exposure on the last day of the quarter. The Group is also
required to disclose an average UK leverage ratio which is based on capital on the last day of each month in the quarter and an exposure
measure for each day in the quarter.
| | |
| | |
| | |
| | |
| | |
| | |
| | |
Average UK leverage ratio | | |
| | |
Average UK leverage exposure | | |
Notes
1Capital and leverage measures are calculated applying the transitional arrangements of the CRR as amended by CRR II.
2 Fully loaded UK leverage ratio was 5.2%, with £60.2bn of T1 capital and £1,168.0bn of leverage exposure. Fully loaded average UK leverage ratio was 4.7% with £60.0bn of T1 capital and
£1,266.6bn of leverage exposure. Fully loaded UK leverage ratios are calculated without applying the transitional arrangements of the CRR as amended by CRR II.
3Although the leverage ratio is expressed in terms of T1 capital, the leverage ratio buffers and 75% of the minimum requirement must be covered solely with CET1 capital. The CET1
capital held against the 0.53% G-SII ALRB was £6.1bn and against the 0.3% CCLB was £3.5bn
The UK leverage ratio decreased to 5.2% (December 2022: 5.3%) primarily due to a £38.3bn increase in leverage exposure to
£1,168.3bn, largely driven by an increase in trading portfolio assets within Global Markets.
| | | | | | | | | |
| Climate and sustainability report | | | | | | | Barclays PLC 2023 Annual Report on Form 20-F | |
| |
| | | | | | | | | |
Risk performance - Treasury and Capital risk (continued) |
Foreign exchange risk (audited)
The Group is exposed to two sources of foreign exchange risk.
a) Transactional foreign currency exposure
Transactional foreign currency exposures represent exposure on banking assets and liabilities, denominated in currencies other than
the functional currency of the transacting entity.
The Group’s risk management policies are designed to prevent the holding of significant open positions in foreign currencies outside
the trading portfolio managed by Barclays International which is monitored through VaR.
Banking book transactional foreign exchange risk outside of Barclays International is monitored on a daily basis by the market risk
function and minimised by the businesses.
b) Translational foreign exchange exposure
The Group’s investments in overseas subsidiaries and branches create capital resources denominated in foreign currencies, principally
USD and EUR. Changes in the GBP value of the net investments due to foreign currency movements are captured in the currency
translation reserve, resulting in a movement in CET1 capital.
The Group’s strategy is to minimise the volatility of the capital ratios caused by foreign exchange movements, by matching the CET1
capital movements to the revaluation of the Group’s foreign currency RWA exposures.
| | | | | | |
Functional currency of operations (audited) |
| Foreign currency net investments | Borrowings which hedge the net investments | Derivatives which hedge the net investments | Structural currency exposures pre- economic hedges | | Remaining structural currency exposures |
| | | | | | |
| | | | | | |
| | | | | | |
| | | | | | |
| | | | | | |
| | | | | | |
| | | | | | |
| | | | | | |
| | | | | | |
| | | | | | |
| | | | | | |
| | | | | | |
| | | | | | |
| | | | | | |
Economic hedges relate to exposures arising on foreign currency denominated preference share and AT1 instruments. These are
accounted for at historical cost under IFRS and do not qualify as hedges for accounting purposes. The gain or loss arising from changes
in the GBP value of these instruments is recognised on redemption in retained earnings.
During 2023, total structural currency exposure net of hedging instruments increased by £0.2bn to £15.4bn (2022: £15.2bn). Foreign
currency net investments decreased by £0.8bn to £40.4bn (2022: £41.2bn) driven predominantly by a £0.9bn decrease in USD, offset
by £0.1bn increase in EUR. The hedges (excluding economic hedges) associated with these investments increased by £0.1bn to
£16.9bn (2022: £16.8bn).
Pension risk review
The UK Retirement Fund (UKRF) represents approximately 96% (2022: 96%) of the Group’s total retirement benefit obligations globally.
As such this risk review section focuses exclusively on the UKRF. The UKRF is closed to new entrants and there is no new final salary
benefit being accrued. Existing active members accrue a combination of a cash balance benefit and a defined contribution element.
Pension risk arises as the market value of the pension fund assets may decline, investment returns may reduce or the estimated value
of the pension liabilities may increase.
Refer to the Management of pension risk section in the Barclays PLC Pillar 3 Report 2023 (unaudited) for more information on how
pension risk is managed.
Assets
The Trustee Board of the UKRF defines its overall long-term investment strategy with investments across a broad range of asset
classes. This results in a diversified mix of return seeking assets as well as liability matching assets to better match future pension
obligations. The two largest risks within the asset portfolio are credit spread and growth assets. The split of scheme assets is shown
within Note 32 to the financial statements. The fair value of the UKRF assets was £24.2bn as at 31 December 2023 (2022: £24.7bn).
| | | | | | | | | |
| Climate and sustainability report | | | | | | | Barclays PLC 2023 Annual Report on Form 20-F | |
| |
| | | | | | | | | |
Risk performance - Treasury and Capital risk (continued) |
Liabilities
The UKRF retirement benefit obligations are a series of future cash flows with relatively long duration. On an IAS 19 basis these cash
flows are sensitive to changes in the expected long-term price inflation rate (RPI) and the discount rate (GBP AA corporate bond yield):
•An increase in long-term expected inflation corresponds to an increase in liabilities;
•A decrease in the discount rate corresponds to an increase in liabilities.
Pension risk is generated through the Group’s defined benefit schemes and this risk is set to reduce over time as the main defined
benefit scheme is closed to new entrants. The chart below outlines the shape of the UKRF’s liability cash flow profile as at 31 December
2023 that takes account of the future inflation indexing of payments to beneficiaries. The majority of the cash flows (approximately
96%) fall between 0 and 40 years, peaking between 11 and 20 years and reducing thereafter. The shape may vary depending on
changes to inflation and longevity expectations and any members who elect to transfer out. Transfers out will bring forward the liability
cash flows.
For more detail on the UKRF’s financial and demographic assumptions, see Note 32 to the financial statements.
|
Proportion of liability cash flows (%) |
The graph above shows the evolution of the UKRF’s net IAS 19 position over the last two years. During 2023 the decrease in the UKRF
surplus was driven by assets underperforming the discount rate and lower corporate bond yields.
Refer to Note 32 to the financial statements for the sensitivity of the UKRF to changes in key assumptions.
Risk measurement
In line with Barclays’ risk management framework the assets and liabilities of the UKRF are modelled within a VaR framework to show the
volatility of the pension position at a total portfolio level. This enables the risks, diversification and liability matching characteristics of the
UKRF obligations and investments to be adequately captured. VaR is measured and monitored on a monthly basis. Risks are reviewed
and reported regularly at the Pensions Executive Board. The VaR model takes into account the valuation of the liabilities on an IAS 19
basis (see Note 32 to the financial statements). The Trustee receives quarterly VaR measures on a funding basis.
The pension liability is also sensitive to post-retirement mortality assumptions which are reviewed regularly (See Note 32 to the
financial statements). To mitigate part of this risk the UKRF has entered into longevity reinsurance contracts approximately three
quarters of current pensioner liabilities.
In addition, the impact of pension risk to the Group is taken into account as part of the stress testing process. Stress testing is
performed internally on at least an annual basis. The UKRF exposure is also included as part of regulatory stress tests.
Barclays defined benefit pension schemes affects capital in two ways:
•An IAS 19 deficit is treated as a liability on the Group’s balance sheet. Movement in a deficit due to remeasurements, including
actuarial losses, are recognised immediately through Other Comprehensive Income and as such reduces shareholders’ equity and
CET1 capital. An IAS 19 surplus is treated as an asset on the balance sheet and increases shareholders’ equity; however, it is
deducted for the purposes of determining CET1 capital.
•In the Group’s statutory balance sheet an IAS 19 surplus or deficit is partially offset by a deferred tax liability or asset respectively.
These may or may not be recognised for calculating CET1 capital depending on the overall deferred tax position of the Group at the
particular time.
Pension risk is taken into account in the Pillar 2A capital assessment undertaken by the PRA at least annually. The Pillar 2A requirement
forms part of the overall capital requirement for the Group.
| | | | | | | | | |
| Climate and sustainability report | | | | | | | Barclays PLC 2023 Annual Report on Form 20-F | |
| |
| | | | | | | | | |
Risk performance - Treasury and Capital risk (continued) |
Interest rate risk in the banking
book
All disclosures in this section are unaudited
unless otherwise stated.
Overview
The treasury and capital risk framework
covers interest rate sensitive exposures
held in the banking book, mostly relating to
accrual accounted and FVOCI
instruments. The potential volatility of net
interest income is measured by an Annual
Earnings at Risk (AEaR) metric which is
monitored regularly and reported to senior
management and the Barclays PLC Board
Risk Committee as part of the limit
monitoring framework.
For further detail on the interest rate risk in
the banking book governance and
framework refer to page 177 of the
Barclays PLC Pillar 3 Report 2023
(unaudited).
Key metrics
AEaR
-£57m
AEaR across the Group from a -25bps
Shock to forward interest rate curves.
Summary of performance in the
period
NII sensitivity to interest rate shocks has
decreased year on year due to changes in
the customer banking book's composition.
NII sensitivity asymmetry is due to the
timing impact of customer rate changes
following a rate shock and is also impacted
by changes in balance sheet composition.
Net interest income sensitivity
The table below shows a sensitivity
analysis on pre-tax net interest income for
non-traded financial assets and liabilities,
including the effect of any hedging. This
analysis is not a forward guidance on NII
and is intended as a quantification of risk
exposure utilising the Net Interest Income
(NII) metric as described on page 177 of
the Barclays PLC Pillar 3 Report 2023
(unaudited), which includes
documentation of the main model
assumptions.
| | | | |
Net interest income sensitivity (AEaR) by business unit (audited) | | | | |
| | | | |
| | | | |
| | | | |
| | | | |
| | | | |
| | | | |
| | | | |
| | | | |
| | | | |
Note
The Group’s customer banking book hedging activity is risk reducing from an NII sensitivity perspective. The hedges in place remove interest rate risk and smooth income over the medium
term. The NII sensitivity for the Group at 31 December 2023 without hedging in place for +/-25bp rate shocks would be £184m/£(220)m respectively.
| | | | | | | | | |
| Climate and sustainability report | | | | | | | Barclays PLC 2023 Annual Report on Form 20-F | |
| |
| | | | | | | | | |
Risk performance - Treasury and Capital risk (continued) |
| | | | |
Net interest income sensitivity (AEaR) by currency (audited) |
| | |
| | | |
| | | |
| | | | |
| | | | |
| | | | |
| | | | |
| | | | |
Analysis of equity sensitivity
Equity sensitivity measures the overall impact of a +/-25bps movement in interest rates on retained earnings, FVOCI, cash flow hedge
reserves and pensions. For non-NII items a DV01 metric is used, which is an indicator of the shift in value for a 1bp movement in the
yield curve.
| | | | |
Analysis of equity sensitivity (audited) | | |
| | |
| | | | |
| | | | |
| | | | |
Taxation effects on the above | | | | |
Effect on profit for the year | | | | |
As percentage of net profit after tax | | | | |
| | | | |
Effect on profit for the year (per above) | | | | |
Fair value through other comprehensive income reserve | | | | |
| | | | |
Taxation effects on the above | | | | |
| | | | |
| | | | |
Movements in the FVOCI reserve impact CET1 capital. However, movements in the cash flow hedge reserve and pensions
remeasurement reserve recognised in FVOCI do not affect CET1 capital.
Volatility of the FVOCI portfolio in the liquidity pool
Changes in value of FVOCI exposures flow directly through capital via the FVOCI reserve. The volatility of the value of the FVOCI
investments in the liquidity pool is captured and managed through a value measure rather than an earning measure, i.e. non-traded
market risk VaR.
Although the underlying methodology to calculate the non-traded VaR is identical to the one used in traded management VaR, the two
measures are not directly comparable. The non-traded VaR represents the volatility to capital driven by the FVOCI exposures. These
exposures are in the banking book and do not meet the criteria for trading book treatment.
| | | | | | |
Analysis of volatility of the FVOCI portfolio in the liquidity pool |
| | |
| | | | | | |
For the year ended 31 December | | | | | | |
Non-traded market value at risk (daily, 95%) | | | | | | |
Daily Value at Risk has trended upwards in H1 2023 due to increase in time series volatility and addition in interest rate risk positioning.
Daily Value at Risk reduced towards the end of H2 2023 as time series volatility subsided.
| | | | | | | | | |
| Climate and sustainability report | | | | | | | Barclays PLC 2023 Annual Report on Form 20-F | |
| |
| | | | | | | | | |
Risk performance - Treasury and Capital risk (continued) |
Operational risk
All disclosures in this section are unaudited unless otherwise stated.
Overview
Operational risks are inherent in the
Group’s business activities and it is not
cost effective or possible to attempt to
eliminate all operational risks. The
Operational Risk Framework is therefore
focused on identifying operational risks,
assessing them and managing them within
the Group’s approved risk appetite.
The Operational Risk principal risk
comprises the following risks: Change
Delivery Management Risk; Data
Management Risk; Financial Reporting
Risk; Fraud Risk; Information Security Risk;
Operational Recovery Planning Risk;
Payments Process Risk; People Risk;
Physical Security Risk; Premises Risk; Risk
Reporting; Supplier Risk; Tax Risk;
Technology Risk and Transaction
Operations Risk. The operational risk
profile is also informed by a number of
connected risks: Cybersecurity, Data, and
Resilience. These themes represent
threats to the Group that extend across
multiple risk types, and therefore require
an integrated risk management approach.
For definitions of these risks refer to pages
181 to 183 of the Barclays PLC Pillar 3
Report 2023. To provide complete
coverage of the potential adverse impacts
on the Group arising from operational risk,
the operational risk taxonomy extends
beyond the risks listed above to cover
operational risks associated with other
principal risks too.
This section provides an analysis of the
Group’s operational risk profile, including
events above the Group’s reportable
threshold, which have had a financial
impact in 2023. The Group’s operational
risk profile is informed by bottom-up risk
assessments undertaken by each business
unit and top-down qualitative review for
each risk type. Fraud, Transaction
Operations, Information Security and
Technology continue to be highlighted as
key operational risk exposures.
For information on compliance risk events,
see the compliance risk section.
Key metrics
83%
of the Group’s net reportable operational
risk events had a loss value of £50,000 or
less
85%
of events by number are due to External
Fraud
56%
of losses are from events aligned to
External Fraud
40%
of losses are from events aligned to
Execution, Delivery and Process
Management
Summary of performance in the
period
During 2023, total operational risk losses1
reduced to £141m (2022: £161m) while
the number of recorded events for 2023
(2,914) remained broadly in line with the
level for 2022 (2,964). The total
operational risk losses for the year were
mainly driven by events falling within the
Execution, Delivery & Process
Management and External Fraud
categories, which tend to be high volume
but low impact events.
Operational risk profile
Within operational risk, there are a large
number of smaller value risk events. In
2023, 83% (2022: 84%) of the Group’s
reportable operational risk events by
volume had a value of less than £50,000
each. Cumulatively, events under this
£50,000 threshold accounted for only 33%
(2022: 32%) of the Group’s total net
operational risk losses. A small proportion
of operational risk events have a material
impact on the financial results of the
Group.
| | | | | | | | | |
| Climate and sustainability report | | | | | | | Barclays PLC 2023 Annual Report on Form 20-F | |
| |
| | | | | | | | | |
Risk performance - Operational risk |
| | | | |
| The analysis below presents the Group’s operational risk events by Basel event category: | |
| Operational risk events by BASEL event category1 | |
| | | | |
| % of total risk events by count | | % of total risk events by value | |
| | | | |
|
Execution delivery and process management |
|
Employment practices and workplace safety |
|
Damage to physical assets |
|
Clients, products and business practices |
|
Business disruption and system failures |
| |
| Note 1The data disclosed includes operational risk losses for reportable events impacting the Barclays Group business areas, having impact of > £10,000 and excludes events that are compliance or legal risk, aggregate and boundary events. A boundary event is an operational risk event that results in a credit risk impact. Due to the nature of risk events that keep evolving, prior year losses are updated. |
|
Execution delivery and process management |
|
Employment practices and workplace safety |
|
Damage to physical assets |
|
Clients, products and business practices |
|
Business disruption and system failures |
•External Fraud remains the category with
the highest frequency of events at 85% of
total events in 2023 (2022: 86%). Impacts
from events arising from External Fraud
increased slightly in 2023 to £79m (2022:
£76m) and accounted for 56% of total
2023 losses (2022: 47%). In this category,
high volume, low value events are driven
by transactional fraud often related to
debit and credit card usage. Note: total
External Fraud losses in 2023 including
those from events with impact <£10,000
amounted to £183m (2022: £190m).
•Execution, Delivery and Process
Management impacts decreased to £56m
(2022: £83m) and accounted for 40%
(2022: 52%) of total operational risk
losses. The events in this category are
typical of the banking industry as a whole
where high volumes of transactions are
processed on a daily basis, mapping mainly
to Barclays Transaction Operations risk
type. The overall frequency of events in
this category remained stable at 14% of
total events by volume (2022: 14%).
Investment continues to be made in
improving the control environment across
the Group. Specific areas of focus include
new and enhanced fraud prevention
systems and tools to combat the
increasing level of fraud attempts being
made whilst minimising disruption to
genuine transactions. Fraud remains an
industry wide threat and the Group
continues to work closely with external
partners on various prevention initiatives.
Additionally, the Group continues to invest
in its processing infrastructure to manage
the risk of processing errors as well as
ensuring scalability of operations.
Operational Resilience remains a key area
of focus for the Group, having been
reinforced in recent years due to potential
operational disruption from the COVID-19
pandemic. The Group continues to
strengthen its resilience approach across
its most important business services to
improve recoverability and assurance
thereof by reviewing scenarios based on
current global climates.
Operational risk associated with
cybersecurity remains a top focus for the
Group. The sophistication of threat actors
continues to grow as noted by multiple
external risk events observed throughout
the year. Ransomware attacks across the
global Barclays supplier base were
observed and we worked closely with the
affected suppliers to manage potential
impacts to the Group and its clients and
customers. The Group’s cybersecurity
events were managed within its risk
tolerances, and cybersecurity incidents did
not materially impact the Group's business
strategy, results of operations, or financial
condition. For further information, refer to the | | | | | | | | | |
| Climate and sustainability report | | | | | | | Barclays PLC 2023 Annual Report on Form 20-F | |
| |
| | | | | | | | | |
Risk performance - Operational risk (continued) |
Model risk, Compliance risk, Reputation risk and Legal risk
All disclosures in this section are unaudited unless otherwise stated.
Model risk
Barclays is committed to continuously
improving model risk management and
made a number of enhancements in 2023,
including:
•Continued improvements to the
transparency and oversight of model
risk through further upgrades to model
risk governance structure.
•Continued enhancements to model risk
policy and standards to ensure
comprehensiveness, consistency and
cohesiveness of the model risk
framework.
•Continued focus on improving the
model risk control framework .
•Enhanced the Group Model Risk
Appetite Statement, incorporating
model quality and uncertainty around a
model’s output.
•Continued strengthening of validation
practices through expansion of model-
level validation procedures, use of an
on-going validation training program
and further embedment of a validation
quality assurance process.
•Executed on hiring strategy by
expanding the model risk team to
support a wider range of model
validation demand, newly emerging
model risks, and an enhanced focus on
regulatory models .
•Progressed model inception validation
by bringing more models into
compliance with the model risk
management framework, including our
first algorithmic trading models
Compliance risk
Barclays is committed to continuing to
drive the right culture throughout all levels
of the organisation. The Group will
continue to enhance effective
management of Compliance risk and
appropriately consider the relevant tools,
governance and management information
in decision-making processes. Focus on
management of Compliance risk is
ongoing and, alongside other relevant
business and control management
information, the Trading Entity Conduct
Risk Dashboard is a key component of this.
The Group continues to review the role
and impact of Compliance risk events and
issues in remuneration decisions at both
the individual and business level.
In 2023, the Group maintained focus on
new and heightened inherent Compliance
risks, including those relating to the cost of
living crisis, the evolving threat landscape
as related to financial crime, and
challenges in ensuring customer and client
data is handled appropriately. These risks
continue to be monitored on an ongoing
basis.
A key area of focus has been the
implementation and embedment of the
FCA’s new Consumer Duty, with rules for
open products and services taking effect
at the end July 2023.
Businesses have continued to assess the
potential customer, client and market
impacts of strategic change. As part of the
2023 medium-term planning process,
material Compliance risks associated with
strategic and financial plans were
assessed.
Throughout 2023, Compliance risks were
raised by each business area for
consideration by relevant Board level
committees. These committees reviewed
the risks raised and whether
management’s proposed actions were
appropriate to mitigate the risks
effectively.
During 2023, laws, rules and regulation risk
(LRR risk) was created as a new risk under
the Compliance Principal Risk. LRR is
intended to mitigate the risk of failing to
identify applicable LRRs, and ensure
appropriate steps are in place to monitor
and oversee LRRs. Work is underway to
implement processes to support the
management and oversight of LRR Risk.
The Group continued to incur costs in
relation to litigation and conduct matters,
refer to Note 25 Legal, competition and
regulatory matters and Note 23 Provisions
for further details. Costs include customer
redress and remediation, as well as fines
and settlements. Resolution of these
matters remains a necessary and
important part of delivering the Group’s
strategy and an ongoing commitment to
improve oversight of culture and conduct.
Trading Entity Conduct Risk Dashboards,
setting out key indicators in relation to
conduct and financial crime risk, are
provided to the respective Board Risk
Committees and senior management.
These continue to be evolved and
enhanced to allow effective oversight and
decision-making. Work is ongoing to
enhance the Compliance Risk Control
Environment in a timely and effective
manner to ensure the Group operates
within Risk Appetite. The tolerance
adherence is assessed by the business
areas through key indicators and reported
to the relevant Trading Entity Board
Committees as part of the Conduct Risk
Dashboard governance process.
The Group remains focused on the
continuous improvements being made to
manage risk effectively with an emphasis
on enhancing governance and
management information to identify risk at
earlier stages.
| | | | | | | | | |
| Climate and sustainability report | | | | | | | Barclays PLC 2023 Annual Report on Form 20-F | |
| |
| | | | | | | | | |
Risk performance - Model risk, Compliance risk, Reputation risk and Legal risk |
Reputation risk
Barclays is committed to identifying
reputation risks and issues as early as
possible and managing them appropriately.
At a Group level throughout 2023,
reputation risks and issues were overseen
by the Board which reviews the processes
and policies which Barclays identifies and
manages reputation risk. Within the
Barclays Bank UK Group and the Barclays
Bank Group reputation risks and issues
were overseen by the respective risk and
Board risk committees. The top live and
emerging reputation risks and issues within
the Barclays Bank UK Group and the
Barclays Bank Group are included within an
over-arching quarterly report at the
respective Board level.
The Board reviewed risks escalated by the
businesses and considered whether
management’s proposed actions, for
example attaching conditions to proposed
client transactions or increased
engagement with impacted stakeholders,
were appropriate to mitigate the risks
effectively. The Board also received regular
updates with regard to key reputation risks
and issues, including: Barclays' response to
global conflicts; Barclays’ association with
sensitive sectors; access to banking;
lending practices and the resilience of key
Barclays systems and processes.
The Group continued to incur costs in
relation to litigation and conduct matters,
refer to Note 25 Legal, competition and
regulatory matters and Note 23 Provisions
for further details. Costs include customer
redress and remediation, as well as fines
and settlements. Resolution of these
matters remains an ongoing commitment
to improve oversight of culture and
conduct and management of reputation
risks.
As part of Barclays 2023 Medium Term
Planning process, material reputation risks
associated with strategic and financial
plans were also assessed.
Legal risk
The Group remains committed to
continuous improvements in managing
legal risk effectively. During 2023, the
Group-wide legal risk management
framework was updated to complement
and accommodate the introduction of
changes to the compliance risk
management framework, which includes
the responsibility of the Legal Function to
proactively identify, communicate and
provide legal advice on applicable laws,
rules and regulations.
Other improvements during 2023 included
a review and update of the supporting legal
risk policies, standards and mandatory
training, reinforced by ongoing
engagement with and education of the
Group’s businesses and functions by Legal
Function colleagues. Legal risk tolerances
and legal risk appetite have also been
reviewed.
Tolerances adherence is assessed
through key indicators, which are also used
to evaluate the legal risk profile and are
reviewed, at least annually, through the
relevant risk and control committees.
Mandatory controls to manage legal risks
are set out in the legal risk standards and
are subject to ongoing monitoring. The
implementation of changes to the
compliance risk management framework
referred to above (and described in more
detail on page 288) also mitigate legal risk. | | | | | | | | | |
| Climate and sustainability report | | | | | | | Barclays PLC 2023 Annual Report on Form 20-F | |
| |
| | | | | | | | | |
Risk performance - Model risk, Compliance risk, Reputation risk and Legal risk (continued) |
Supervision of the Group
The Group’s operations, including its
overseas branches, subsidiaries and
associates, are subject to a large number
of rules and regulations applicable to the
conduct of banking and financial services
business in each of the jurisdictions in
which the Group operates. These apply to
business operations, impact financial
returns and include capital, leverage and
liquidity requirements, authorisation,
registration and reporting requirements,
restrictions on certain activities, and
conduct of business regulations, amongst
other applicable regulatory requirements.
Regulatory developments in one or more
jurisdictions may impact the Group
globally. We focus particularly on UK, US
and EU regulation in this Report due to the
location of the Group’s principal areas of
business. Regulations elsewhere may also
have a significant impact on the Group due
to the location of its branches, subsidiaries
and, in some cases, clients. For more
information on the risks related to the
supervision and regulation of the Group,
including regulatory change, see the
material existing and emerging risk entitled
‘Regulatory Change agenda and impact on
Business Model’ in the Material existing and
emerging risks section.
Supervision in the UK
In the UK, day-to-day regulation and
supervision of the Group is divided
between the Prudential Regulation
Authority (PRA) (a division of the Bank of
England (BoE)) and the Financial Conduct
Authority (FCA). In addition, the Financial
Policy Committee (FPC) of the BoE has
influence on the prudential requirements
that may be imposed on the banking
system through its powers of direction and
recommendation. Certain members of the
Group are also subject to regulatory
initiatives undertaken by the UK Payment
Systems Regulator (PSR), as a participant
in payment systems regulated by the PSR.
Barclays Bank PLC and Barclays Bank UK
PLC are both authorised with permission
to accept deposits, amongst other things,
and are subject to prudential supervision
by the PRA and to conduct regulation and
supervision by the FCA. The Barclays Bank
Group is subject to prudential supervision
on a solo-consolidated basis and the
Barclays Bank UK Group is subject to
prudential supervision on a group sub-
consolidated basis and on an individual
basis. The Group as a whole is also subject
to prudential supervision by the PRA on a
group consolidated basis. Barclays PLC
has been approved by the PRA as a
financial holding company.
Barclays Capital Securities Limited (BCSL)
is authorised and subject to prudential
supervision by the PRA as a PRA-
designated investment firm and subject to
conduct regulation and supervision by the
FCA. Barclays Execution Services Limited
is an appointed representative of Barclays
Bank PLC, Barclays Bank UK PLC and
Clydesdale Financial Services Limited.
The PRA’s supervision of the Group is
conducted through a variety of regulatory
tools, including the collection of
information by way of prudential returns or
cross-firm reviews, reports obtained from
skilled persons, information gathering,
regular supervisory visits and regular
meetings with the Group’s management
and directors to discuss issues such as
strategy, governance, financial resilience,
operational resilience, risk management,
and recovery and resolution.
Further, the BoE, as the UK resolution
authority, informs prudential requirements
and sets requirements for the Group
relating to resolution preparedness.
The FCA’s supervision of the UK firms in
the Group is carried out through a
combination of proactive engagement
meetings, regular supervisory visits,
information gathering and regular
meetings with management and directors
to discuss issues such as customer
strategy, fair treatment of customers, and
financial crime controls, as well as cross-
sectoral reviews which analyse the
different areas of the market and the risks
that may lie ahead.
The FCA and the PRA also apply the Senior
Managers and Certification Regime (the
SMCR) which imposes a regulatory
approval, individual accountability and
fitness and propriety framework in respect
of senior individuals within relevant firms.
FCA supervision has focused on conduct
risk and customer/client outcomes
through implementation of the Consumer
Duty (including product design and fair
value), fraud and anti-money laundering
controls, market operations, access to
cash, fair treatment of vulnerable
customers and payment account access
and closures.
PRA supervision has focused on financial
and operational resilience, controls, credit
risk management, systems and controls,
climate risk and resolvability, where
resolvability is reviewed in conjunction with
the Resolution Directorate (a division of
the BoE).
Both the PRA and the FCA apply standards
that generally either anticipate or go
beyond requirements established by global
or EU standards, whether in relation to
capital, leverage and liquidity, resolvability
and resolution or matters of conduct. The
UK is in the process of reviewing and
revising the EU legislation that was
onshored into English law following the
UK's departure from the EU. This process
is ongoing, but based on current
indications, potential areas of divergence
in approach between the UK and the EU in
existing areas of regulation appear
moderate and are not expected to result in
materially different standards of
regulation. Divergence might become
more marked in new areas of regulation,
such as ESG and Digital. The Financial
Services and Markets Act 2023 (FSMA
2023) established a framework for the
revocation of retained EU law relating to
financial services, with HM Treasury
intending to repeal retained EU legislative
provisions subject to the transfer of its
provisions to the UK regulators’ rules
where appropriate. The Government is not
expected to revoke retained EU law
relating to financial services unless the
FCA and/or PRA have drafted and
consulted on rules in the relevant areas,
where it is appropriate that the provisions
are replaced. However, HM Treasury may
specify parts of retained EU law where the
regulators are exempt from such
requirements, for example where they are
restating retained EU law revoked through
FSMA 2023 in their rulebooks without
material changes or where they are
replacing revoked retained EU law with
material changes but the only material
effect is to reduce a regulatory burden.
Where changes also have other material
effects, which may include impacts on the
regulators’ objectives, for example, the
Government has indicated that it is
appropriate to require the regulators to
consult. The medium term outlook for the
costs and impact of operating under the
post-Brexit UK regime remains unclear as
the regulatory landscape continues to
develop. There is potential for an increase
in regulatory implementation costs in the
near term to adapt systems and controls.
Supervision in the EU
The Group’s operations in Europe are
authorised and regulated by a combination
of its home regulators and host regulators
in the European countries where the
Group operates.
| | | | | | | | | |
| Climate and sustainability report | | | | | | | Barclays PLC 2023 Annual Report on Form 20-F | |
| |
| | | | | | | | | |
Supervision and regulation |
Barclays Bank Ireland PLC is licensed as a
credit institution by the Central Bank of
Ireland (CBI) and is designated as a
significant institution falling under direct
supervision on a solo basis by the
European Central Bank (ECB) for
prudential purposes. Barclays Bank Ireland
PLC’s EU branches are supervised by the
ECB and are also subject to direct
supervision for local conduct purposes by
national supervisory authorities in the EU
jurisdictions where they are established.
Barclays Bank Ireland PLC is subject to the
requirements set by the Single Resolution
Board (SRB) as the resolution authority of
Barclays Bank Ireland PLC. Barclays Bank
Ireland PLC is also subject to supervision
by the CBI as home state or competent
authority under various EU financial
services directives and regulations.
The Group provides the majority of its
cross-border banking and investment
services to EEA clients via Barclays Bank
Ireland PLC. Additionally, Barclays Bank
PLC and BCSL are authorised in certain
EEA Member States to enable them to
continue to conduct a limited range of
activities without a presence, including
accessing EEA trading venues and
interdealer trading. Barclays Bank PLC also
has a branch in Paris (to facilitate access to
Target 2), which is regulated by the ACPR.
Supervision in the US
Barclays PLC, Barclays Bank PLC and its
New York branch, and Barclays Bank PLC’s
US subsidiaries are subject to a
comprehensive regulatory framework
involving numerous statutes, rules and
regulations in the US. For example, the
Group’s US activities and operations are
subject to supervision and regulation by
the Board of Governors of the Federal
Reserve System (FRB), as well as additional
supervision, requirements and restrictions
imposed by other federal and state
regulators and self-regulatory
organisations (SROs). In some cases, US
requirements may impose restrictions on
the Group’s global activities, in addition to
its activities in the US.
Barclays PLC, Barclays Bank PLC, Barclays
US Holdings Limited (BUSHL), Barclays US
LLC (BUSL), and Barclays Group US Inc.
(BGUS) are regulated as bank holding
companies (BHCs) by the FRB.
BUSL is the Group’s ultimate US holding
company that holds substantially all of the
Group’s US subsidiaries (including Barclays
Capital Inc. (BCI) and Barclays Bank
Delaware). BUSL is subject to
requirements in respect of capital
adequacy, capital planning and stress
testing, risk management and governance,
liquidity, leverage limits, large exposure
limits, restrictions on activities and financial
regulatory reporting. Barclays Bank PLC’s
New York branch is also subject to
enhanced prudential standards relating to,
among other things, liquidity and risk
management.
Barclays PLC, Barclays Bank PLC, BUSHL
and BUSL have financial holding company
(FHC) status under the Bank Holding
Company Act of 1956. FHC status allows
these entities to engage in a variety of
financial and related activities, directly or
through subsidiaries, including
underwriting, dealing and market making in
securities. Failure to maintain FHC status
could result in increasingly stringent
penalties and, ultimately, in the closure or
cessation of certain operations in the US.
In addition to oversight by the FRB,
Barclays Bank PLC’s New York branch and
many of the Group’s subsidiaries are
regulated by additional US authorities
based on the location or activities of those
entities. The New York branch of Barclays
Bank PLC is subject to supervision and
regulation by the New York State
Department of Financial Services
(NYSDFS). Barclays Bank Delaware, a
Delaware chartered bank, is subject to
supervision and regulation by the Delaware
Office of the State Bank Commissioner,
the Federal Deposit Insurance Corporation
(FDIC), the FRB and the Consumer
Financial Protection Bureau (CFPB). The
deposits of Barclays Bank Delaware are
insured by the FDIC, up to applicable limits.
Barclays PLC, Barclays Bank PLC, BUSHL,
BUSL, and BGUS are required to act as a
source of strength for Barclays Bank
Delaware. This could, among other things,
require these entities to provide capital
support to Barclays Bank Delaware if it fails
to meet applicable regulatory capital
requirements.
The Group’s US securities broker/dealer
and investment banking operations are
conducted primarily through BCI, and are
also subject to ongoing supervision and
regulation by the Securities and Exchange
Commission (SEC), the Financial Industry
Regulatory Authority (FINRA) and other
government agencies and SROs under US
federal and state securities laws. BCI is also
registered as a Futures Commission
Merchant with the Commodity Futures
Trading Commission (CFTC), through
which the Group conducts its US futures
and options on futures business, including
client clearing operations, which are
subject to ongoing supervision and
regulation by the CFTC, the National
Futures Association and other SROs.
Under the US framework for regulating
swaps and security-based swaps
established under Title VII of the Dodd-
Frank Act, the CFTC has regulatory
authority over swaps, the SEC has
regulatory authority over security-based
swaps, and the CFTC and SEC jointly
regulate mixed swaps (as such terms are
defined in the relevant legislation).
Accordingly, the Group’s activities related
to US swaps and security-based swaps are
principally conducted by Barclays Bank
PLC and are subject to ongoing
supervision and regulation by the CFTC
and the SEC, respectively. Barclays Bank
PLC is provisionally registered as a swap
dealer with the CFTC and conditionally
registered as a security-based swap dealer
with the SEC. Barclays Bank PLC is also
subject to the FRB swaps rules with
respect to margin and capital
requirements. In addition, Barclays Bank
Ireland PLC is provisionally registered as a
swap dealer with the CFTC and is subject
to the FRB swaps rules with respect to
margin and capital.
Supervision in Asia Pacific
The Group’s operations in Asia Pacific are
supervised and regulated by a broad range
of national banking and financial services
regulators.
Prudential regulation
Certain Basel III standards were
implemented in EU law through the Capital
Requirements Regulation (CRR) and the
Capital Requirements Directive IV (CRD
IV), as amended by CRR II and CRD V.
These standards were retained in the UK
regulatory framework via a series of
onshoring instruments when the UK
withdrew from the European Union.
Beyond the minimum standards required
by CRR, the PRA has expected the Group,
in common with other major UK banks and
building societies, to meet a 7% Common
Equity Tier 1 (CET1) ratio at the level of the
consolidated group since 1 January 2016.
The 7% CET1 ratio is made up of a Pillar 1
minimum capital requirement of 4.5%
CET1 and a capital conservation buffer
which must be met entirely with CET1
capital.
Global systemically important banks (G-
SIBs), such as the Barclays Group, are
subject to a number of additional
prudential requirements, including the
requirement to hold additional loss-
absorbing capacity and additional capital
buffers above the level required by Basel III
standards.
| | | | | | | | | |
| Climate and sustainability report | | | | | | | Barclays PLC 2023 Annual Report on Form 20-F | |
| |
| | | | | | | | | |
Supervision and regulation (continued) |
The level of the G-SIB buffer is set by the
Financial Stability Board (FSB) according to
a bank’s systemic importance and can
range from 1% to 3.5% of risk-weighted
assets (RWAs). The G-SIB buffer must be
met with CET1 capital. In November 2023,
the FSB published an update to its list of G-
SIBs, maintaining the 1.5% G-SIB buffer
that applies to the Group.
The Group is subject to a ‘combined buffer
requirement’ consisting of (i) a capital
conservation buffer of 2.5% of RWAs, and
(ii) a countercyclical capital buffer (CCyB).
The CCyB is based on rates determined by
the regulatory authorities in each
jurisdiction in which the Group maintains
exposures. In the UK, the CCyB rate is set
by the FPC and is currently 2%.
The PRA requires UK firms to hold
additional capital to cover risks which the
PRA assesses are not fully captured by the
Pillar 1 capital requirement. The PRA sets
this additional capital requirement (Pillar
2A) at least annually, derived from each
firm’s individual capital guidance. Under
current PRA rules, the Pillar 2A
requirement must be met with at least
56.25% CET1 capital and no more than
25% tier 2 capital. In addition, the capital
that firms use to meet their minimum
requirements (Pillar 1 and Pillar 2A) cannot
be counted towards meeting the
combined buffer requirement.
The PRA may also impose a confidential
'PRA buffer' to cover risks over a forward
looking planning horizon, including with
regard to firm-specific stresses or
management and governance
weaknesses. The PRA buffer must be met
separately to the combined buffer
requirement, and must be met fully with
CET1 capital.
As part of its approach to ring fencing, the
FPC established a framework to apply a
firm-specific systemic risk buffer (SRB).
The purpose of the SRB was to increase
the capacity of ring-fenced bodies, such as
Barclays Bank UK PLC, to absorb stress.
With the implementation of CRD V, the
Other Systemically Important Institutions
Buffer (O-SII buffer) replaced the SRB. The
O-SII buffer can be set between 0% and
3% and has to be met solely with CET1
capital. The O-SII buffer rate applicable to
Barclays Bank UK PLC is currently set by
the PRA at 1%.
Previously, total assets were used as the
metric to determine O-SII buffer rates but
the FPC announced in 2022 that this would
change to the UK leverage exposure
measure and that it would recalibrate the
thresholds used to determine O-SII buffer
rates to prevent an overall tightening or
loosening of the framework relative to its
pre-Covid level. The PRA’s 2023 review of
the O-SII buffer was based on end-2022
leverage exposure measures and
maintained the O-SII buffer rate applicable
to Barclays Bank UK PLC at 1% (applicable
from January 2025). For future reviews,
the average of firms’ quarter-end leverage
exposure measure over the year will be
used to determine O-SII buffer rates,
rather than the year-end value. In addition,
Barclays Bank Ireland PLC is identified as a
O-SII by the CBI, which has imposed an O-
SII buffer on Barclays Bank Ireland PLC of
1%.
On 30 November 2022, the PRA published
a consultation paper concerning the
implementation of the remaining Basel III
standards, which include a revised
standardised approach for credit risk, the
elimination of modelled approaches for
certain credit risk exposure categories, a
new standardised approach for operational
risk, a new market risk approach and the
implementation of an output floor
requiring reported RWAs calculated under
standardised and modelled approaches to
be a minimum of 72.5% of fully
standardised calculations. In December
2023 the PRA published its first collection
of near-final policy proposals for
implementing these measures, including
those for market risk, operational risk and
the Credit Valuation Adjustment (CVA) and
counterparty credit risk. A further
collection of policies, including those for
credit risk and credit risk mitigation, are
expected to be published by the PRA in Q2
2024. The implementation date for these
standards has been extended to 1 July
2025. In June 2023, the EU reached a
provisional agreement on the
implementation of the remaining parts of
the Basel III reforms. In December 2023,
the preparatory bodies of the Council and
Parliament endorsed this banking package.
It consists of a legislative act to amend the
Capital Requirements Directive (Directive
2013/36/EU), and a legislative act to
amend the Capital Requirements
Regulation (Regulation No (EU)2013/575)
(referred to as CRR III and CRD VI,
respectively). The relevant measures are
scheduled to apply from January 2025 and
mid-2025 respectively.
In the US, the Barclays Bank Group
(including BUSL) is subject to prudential
requirements for large domestic US
banking organisations, foreign banking
organisations and their intermediate
holding companies (IHCs) set by the FRB
and other US regulatory agencies. BUSL is
a “Category III” IHC. BUSL (and Barclays
Bank Delaware) is subject to reduced
(calibrated at 85%) standardised liquidity
requirements, including the liquidity
coverage ratio and NSFR.
BUSL is also subject to the FRB’s rules
regarding single counterparty credit limits
(SCCL). The SCCL apply to the largest US
BHCs and foreign banks’ (including the
Group’s) US operations. The SCCL creates
two separate limits for foreign banks, the
first on combined US operations (CUSO)
and the second on the US IHC (BUSL). The
SCCL for BUSL, as a US BHC, requires that
exposure to an unaffiliated counterparty of
BUSL not exceed 25% of BUSL’s tier 1
capital. With respect to the CUSO, the
SCCL rule allows certification to the FRB
that a foreign bank complies with
comparable home country regulation.
Barclays Bank PLC has complied with the
CUSO requirement since 1 January 2022,
with the first certification applicable for its
Q1 2022 results. To date, Barclays Bank
PLC has not relied on home country
certification.
In July 2023, the FRB and other US
regulatory agencies proposed changes to
the regulatory capital rules applicable to US
banks, BHCs and IHCs with total
consolidated assets of $100 billion or more
(Large Banking Organizations). These
changes are intended to be broadly
consistent with revisions to Basel III
finalised by the Basel Committee on
Banking Supervision in 2017. The US
proposal would end the use of internal
models for credit risk, credit valuation
adjustments, and operational risk, create
an expanded risk-based credit capital
approach in addition to retaining a
modified version of the current
standardised approach, and make changes
to the modelling requirements for market
risk. A Large Banking Organization would
be required to calculate its risk-based
capital ratios under both the expanded
risk-based approach and the current
standardised approach and would use the
lower of the two. All capital buffer
requirements would apply regardless of
whether the expanded risk-based
approach or the existing standardised
approach produces the lower ratio. The
proposal was subject to a public comment
period which ended on 16 January 2024,
and would not be effective until 1 July
| | | | | | | | | |
| Climate and sustainability report | | | | | | | Barclays PLC 2023 Annual Report on Form 20-F | |
| |
| | | | | | | | | |
Supervision and regulation (continued) |
2025. Certain aspects of the proposal
would be subject to a three-year phase-in
period. We are analysing the potential
effects of the proposed changes, including
the timing of implementation.
Stress testing
The Group and certain of its members are
subject to supervisory stress testing
exercises in a number of jurisdictions,
designed to assess the resilience of banks
to adverse economic or financial
developments and ensure that they have
robust, forward-looking capital planning
processes that account for the risks
associated with their business profile.
Assessment by regulators is on both a
quantitative and qualitative basis, the latter
focusing on such elements as data
provision and stress testing capability,
including model risk management and
internal management processes and
controls.
Recovery and Resolution
Stabilisation and resolution framework
The current UK framework for recovery
and resolution was established by the
Banking Act 2009, as amended. The EU
framework was established by the 2014
Bank Recovery and Resolution Directive
(BRRD), as amended by BRRD II.
The BoE, as the UK resolution authority,
has the power to resolve a UK financial
institution that is failing or likely to fail by
exercising certain stabilisation tools,
including (i) bail-in: the cancellation,
transfer or dilution of a relevant entity’s
equity and write-down or conversion of
the claims of a relevant entity's unsecured
creditors (including holders of capital
instruments) and conversion of those
claims into equity as necessary to restore
solvency; (ii) the transfer of all or part of a
relevant entity's business to a private
sector purchaser; and (iii) the transfer of all
or part of a relevant entity's business to a
“bridge bank” controlled by the BoE. When
exercising any of its stabilisation powers,
the BoE must generally provide that
shareholders bear first losses, followed by
creditors in accordance with the priority of
their claims in insolvency.
In order to enable the exercise of its
stabilisation powers, the BoE may impose
a temporary stay on the rights of creditors
to terminate, accelerate or close out
contracts, or override events of default or
termination rights that might otherwise be
invoked as a result of a resolution action
and modify contractual arrangements in
certain circumstances (including a
variation of the terms of any securities).
HM Treasury may also amend the law for
the purpose of enabling it to use its powers
under this regime effectively, potentially
with retrospective effect.
In addition and distinct from bail-in, the
BoE has the power to permanently write-
down, or convert into equity, tier 1 capital
instruments, tier 2 capital instruments and
internal eligible liabilities at the point of
non-viability of an institution pursuant to
broader resolution powers under the
Banking Act.
The BoE’s preferred approach for the
resolution of the Group is a bail-in strategy
with a single point of entry at Barclays PLC.
Under such a strategy, Barclays PLC’s
subsidiaries would remain operational while
Barclays PLC’s capital instruments and
eligible liabilities would be written down or
converted to equity in order to recapitalise
the Group and allow for the continued
provision of services and operations
throughout the resolution. The order in
which the bail-in tool is applied reflects the
hierarchy of capital instruments under
applicable UK legislation and rules, and
otherwise respecting the hierarchy of
claims in an ordinary insolvency.
Accordingly, the more subordinated the
claim, the more likely losses will be suffered
by owners of the claim.
The PRA has made rules that require
authorised firms to draw up recovery plans
and resolution packs. Recovery plans are
designed to outline credible actions that
authorised firms could implement in the
event of severe stress in order to restore
their business to a stable and sustainable
condition. The submission of resolution
packs was suspended by the PRA in 2018
until further notice and replaced by annual
resolution reporting. It continues to be
suspended pending PRA assessment of
areas of potential duplication between
different reporting expectations. The
Barclays Group, however, is required to
provide the PRA with a recovery plan
biennially, although the Group maintains
and refreshes this on an annual basis.
Removal of potential impediments to an
orderly resolution of a banking group or
one or more of its subsidiaries is
considered as part of the BoE’s resolution
planning for each firm, and the BoE can
require firms to make significant changes
in order to enhance their resolvability.
Under the BOE’s Resolvability Assessment
Framework (RAF) firms are required to
have in place capabilities covering three
resolvability outcomes: (i) adequate
financial resources; (ii) being able to
continue to do business through
resolution and restructuring; and (iii) being
able to communicate and co-ordinate
within the firm and with authorities.
Barclays Group’s second self-assessment
report on resolvability under the RAF was
submitted to the PRA/BoE in 2023 and
public disclosures by both Barclays Group
and the PRA/BoE on the most recent
report are due in June 2024. Updated
reports and disclosures are required every
two years. The BoE’s assessment on the
2021 report, published in June 2022,
concluded that there were no
shortcomings, deficiencies or substantive
impediments identified in the Group’s
resolution capabilities that could impede
its ability to execute the preferred
resolution strategy. In future, should any
such issues be identified, the PRA/BoE
could exercise its various powers to direct
the Group to address the relevant issues.
While regulators in many jurisdictions have
indicated a preference for single point of
entry resolution for the Group, additional
resolution or bankruptcy provisions may
apply to certain non-UK Group entities or
branches.
In the US, BUSL is subject to the Orderly
Liquidation Authority established by Title II
of the Dodd-Frank Act (DFA), a regime for
the orderly liquidation of systemically
important financial institutions by the
FDIC, as an alternative to proceedings
under the US Bankruptcy Code. In addition,
the licensing authorities of Barclays Bank
PLC New York branch and of Barclays Bank
Delaware have the authority to take
possession of the business and property
of the applicable branch or entity they
license and/or to revoke or suspend such
licence.
In the US, Title I of the DFA, as amended,
and the implementing regulations issued
by the FRB and the FDIC require each bank
holding company with assets of $250bn or
more, including those within the Group, to
prepare and submit a plan for the orderly
resolution of subsidiaries and operations in
the event of future material financial
distress or failure. The Group submitted a
“targeted plan” in December 2021. The
agencies did not identify any shortcomings
or deficiencies with the Group’s 2021 US
Resolution Plan. In August 2023, the FRB
and FDIC proposed new guidance for
triennial full filers (such as the Group) that
would affect the content required to be
included in the US Resolution Plan. The
proposal generally represents an
expansion of the current 165(d) resolution
planning guidance the Group is subject to
as a “specified foreign banking
organization.” The Group’s next
submission of the US Resolution Plan in
respect of its US operations will be a “full
plan” due 31 March 2025, unless the FRB
and FDIC provide a further extension.
| | | | | | | | | |
| Climate and sustainability report | | | | | | | Barclays PLC 2023 Annual Report on Form 20-F | |
| |
| | | | | | | | | |
Supervision and regulation (continued) |
Barclays Bank Ireland PLC is required by
the ECB to submit a standalone BRRD
compliant recovery plan on an annual
basis. As a Significant Institution under
direct ECB supervision, Barclays Bank
Ireland PLC falls within the remit of the
Single Resolution Board (SRB), as the
resolution authority for the European
Banking Union. Under the provisions of the
BRRD and EU Single Resolution
Mechanism Regulation (SRMR), the SRB is
required to determine the optimal
resolution strategy for Barclays Bank
Ireland PLC and, also, to prepare a
resolution plan for the bank. The SRB
undertakes this work within the context of
the BoE’s preferred resolution strategy of
single point of entry with bail in at Barclays
PLC. In order to carry out its mandate, the
SRB collects detailed structural and other
information from Barclays Bank Ireland
PLC on a regular basis, as well as engaging
with the bank to identify and address
impediments to resolution. This work is
done in coordination with the BoE, as the
Group resolution authority. Barclays Bank
Ireland PLC is required to meet the SRB’s
requirements for resolution as set out in
the SRB’s ‘Expectations for Banks’
document by 31 July 2024 (this deadline
was extended by the SRB in October 2023
from the original deadline of 31 December
2023).
In April 2023, the EU Commission
proposed certain reforms to strengthen
the EU’s bank crisis management and
deposit insurance (CMDI) framework,
including extending depositor protection
to public entities and client money
deposited in certain types of client funds.
The EU legislative process remains
ongoing. Provisional agreement was
reached in December 2023 between the
Council and the European Parliament on
the treatment of internal MREL in bank
resolution groups, referred to as the ‘Daisy
Chains’ proposal (a confined part of the
CMDI proposals). This treatment is
expected to apply from the second half of
2024.
TLAC and MREL
The Group is under the supervision of the
BoE, as the UK resolution authority, and is
subject to a Minimum Requirement for
Own Funds and Eligible Liabilities (MREL),
which includes a component reflecting the
FSB’s standards on total loss absorbency
capacity (TLAC).
Since 1 January 2022, G-SIBs with
resolution entities incorporated in the UK
have been required to meet an MREL
equivalent to the higher of: (i) two times
the sum of their Pillar 1 and Pillar 2A
requirements; or (ii) the higher of two
times their leverage ratio requirement or
6.75% of leverage exposures. Internal
MREL for operating subsidiaries is subject
to a scalar in the 75-90% range of the
external requirement that would apply to
the subsidiary if it were a resolution entity.
The starting point for the scalar is 90% for
ring-fenced bank sub-groups.
Barclays Bank Ireland PLC is subject to the
SRB’s MREL policy, as issued in May 2023,
in respect of the internal MREL that it will
be required to issue to the Group. The
SRB’s current calibration of internal MREL
for non-resolution entities is expressed as
two ratios that have to be met in parallel:
(a) two times the sum of: (i) the firm’s Pillar
1 requirement; and (ii) its Pillar 2
requirement; and (b) two times the
leverage ratio requirement. The SRB’s
policy does not apply any scalar in respect
of the internal MREL requirement. Under
the SRB MREL policy, a bank specific
adjustment can be applied by the SRB to
MREL requirements. From 1 January 2024,
a revised deduction regime will apply for
the indirect subscription of instruments
eligible for internal MREL to avoid the
double-counting of MREL elements at the
level of intermediate entities within a
resolution group.
In the US, the FRB’s TLAC rule includes
provisions that require BUSL to have: (i) a
specified outstanding amount of eligible
long-term debt; (ii) a specified outstanding
amount of TLAC (consisting of common
and preferred equity regulatory capital plus
eligible long-term debt); and (iii) a specified
common equity buffer. In addition, the
FRB’s TLAC rule prohibits BUSL, for so
long as the Group’s overall resolution plan
treats BUSL as a non-resolution entity,
from issuing TLAC to entities other than
those within the Group.
Bank Levy and FSCS
The BRRD established a requirement for
EU member states to set up a pre-funded
resolution financing arrangement with
funding equal to 1% of covered deposits
by 31 December 2024 to cover the costs
of bank resolutions. The UK implemented
this requirement by way of a tax on the
balance sheets of banks known as the
‘Bank Levy’, which remains in place.
In addition, the UK has a statutory
compensation fund called the Financial
Services Compensation Scheme (FSCS),
which is funded by way of annual levies on
most authorised financial services firms.
Structural reform
In the UK, the Financial Services (Banking
Reform) Act 2013 put in place a framework
for ring-fencing certain operations of large
banks. Ring-fencing requires, among other
things, the separation of the retail and
smaller deposit-taking business activities
of UK banks into a legally distinct,
operationally separate and economically
independent entity (a ‘ring-fenced bank’),
which is not permitted to undertake a
range of activities. In 2023, HM Treasury
issued a public call for evidence on aligning
the ring-fencing and resolution regimes,
amongst other things, and a consultation
on reforms to the ring-fencing regime,
including amendments to the thresholds
above which the regime applies, permitting
ring-fenced banks to establish branches
and subsidiaries outside the UK or the EEA
and the introduction of a transitional
period for compliance with the ring-
fencing regime following mergers or
acquisitions. HM Treasury plans to
introduce legislation to implement these
reforms in early 2024. The PRA consulted
on complementary reforms to HM
Treasury's proposals in 2023 and,
separately, conducted a review of its ring-
fencing rules in compliance with its
statutory duty under FSMA to do so every
five years. The PRA announced in early
2024 that it intends to consult on targeted
reforms to its ring-fencing rules as a result
of its review, although the overall
conclusion was that most of those rules
are performing satisfactorily.
US regulation places further substantive
limits on the activities that may be
conducted by banks and holding
companies, including foreign banking
organisations such as the Group. The
‘Volcker Rule’, which was part of the DFA
and which came into effect in the US in
2015, prohibits banking entities from
undertaking certain proprietary trading
activities and limits such entities’ ability to
sponsor or invest in certain private equity
funds and hedge funds (in each case
broadly defined). As required by the rule,
the Group has developed and
implemented an extensive compliance and
monitoring programme addressing
proprietary trading and covered fund
activities (both inside and outside of the
US).
Market infrastructure regulation
In recent years, regulators as well as
global-standard setting bodies such as the
International Organization of Securities
Commissions (IOSCO) have focused on
improving transparency and reducing risk
in markets, particularly risks related to
over-the-counter (OTC) derivative
transactions. This focus has resulted in a
variety of new regulations across the G20
countries and beyond that require or
| | | | | | | | | |
| Climate and sustainability report | | | | | | | Barclays PLC 2023 Annual Report on Form 20-F | |
| |
| | | | | | | | | |
Supervision and regulation (continued) |
encourage on-venue trading, clearing,
posting of margin and disclosure of pre-
trade and post-trade information.
In particular, the Markets in Financial
Instruments Directive and Markets in
Financial Instruments Regulation
(collectively referred to as MiFID II) have
affected many of the markets in which the
Group operates, the instruments in which
it trades and the way it transacts with
market counterparties and other
customers. MiFID II is currently undergoing
a review process in the EU as part of the
EU’s ongoing focus on the development of
a stronger Capital Markets Union. In the
UK, FSMA 2023 introduced reforms to
remove certain requirements which were
previously applicable to trading in
wholesale markets and to promote
investment in line with the Wholesale
Markets Review. Other changes proposed
by the review are being progressed by way
of amendments to regulatory rules and
guidance.
Regulation of benchmarks
The EU and UK Benchmarks Regulation
apply to the administration, contribution
and use of benchmarks within the EU and
the UK, respectively. Financial institutions
within the EU or the UK, as applicable, are
prohibited from using benchmarks unless
their administrators are authorised,
registered or otherwise recognised in the
EU or the UK, respectively. This prohibition
does not currently apply in respect of third
country benchmark administrators, as the
prohibition on usage of such benchmarks
will take effect from the end of 2025 (EU)
and 2030 (UK). The FCA has also been
working to phase out use of LIBOR, with all
LIBOR panels now having ended. Synthetic
versions of GBP and USD LIBOR have been
made available only for a limited period of
time for holders of legacy contracts. Global
regulators in conjunction with the industry
have developed and are continuing to
develop alternative benchmarks and risk-
free rate fallback arrangements, including
updates to existing, as well as new,
applicable legislation.
Regulation of the derivatives market
The European Market Infrastructure
Regulation (EMIR) introduced
requirements designed to improve
transparency and reduce the risks
associated with the derivatives market.
EMIR has operational and financial impacts
on the Group, including by imposing
collateral requirements and a requirement
to centrally clear certain OTC derivatives
contracts on a broad range of market
participants. Access to the clearing
services of certain Central Counterparties
(CCPs) used by Group entities is currently
permitted under temporary equivalence
and recognition regimes and decisions in
the UK and EU. If not extended or made
permanent, the EU’s equivalence decision
for UK Central Counterparties (CCPs), and
exemption for certain intragroup
transactions from the EMIR derivatives
clearing and margin obligations, both due
to expire at the end of June 2025, could
also have operational and financial impacts
on the Group, as could the removal of
temporary recognition of non-UK CCPs by
the UK. The EU has introduced two
legislative proposals to amend EMIR which
introduce, inter alia, changes to the
intragroup transactions exemption making
it easier to rely on the exemption, as well as
aiming to reduce the concentration of
exposures to systemically important third-
country central counterparties (in
particular, UK Central Counterparties). The
legislative process is ongoing.
US regulators have imposed similar rules
as in the EU with respect to the mandatory
on-venue trading and clearing of certain
derivatives, and post-trade transparency,
as well as in relation to the margining of
OTC derivatives. In December 2017, the
CFTC and the European Commission
recognised the trading venues of each
other’s jurisdiction to allow market
participants to comply with mandatory on-
venue trading requirements while trading
on certain venues recognised by the other
jurisdiction. In December 2022, the CFTC
extended temporary relief that would
permit trading venues and market
participants located in the UK to continue
to rely on this mutual recognition
framework following the withdrawal of the
UK from the EU.
Certain participants in US swap markets
are required to register with the CFTC as
‘swap dealers’ or ‘major swap participants’
and/or, with the SEC as ‘security-based
swap dealers’ or ‘major security-based
swap participants’. Such registrants are
subject to CFTC and/or SEC regulation
and oversight. Barclays Bank PLC is
provisionally registered with the CFTC as a
swap dealer and conditionally registered
with the SEC as a security-based swap
dealer. In addition, Barclays Bank Ireland
PLC is provisionally registered as a Swap
Dealer with the CFTC.
Accordingly, Barclays Bank PLC and
Barclays Bank Ireland PLC are both subject
to CFTC rules on business conduct,
record-keeping and reporting, and
Barclays Bank PLC is subject to SEC rules
on business conduct, record-keeping and
reporting. However, since Barclays Bank
PLC and Barclays Bank Ireland PLC are
non-US swap dealers, they are only subject
to certain of the CFTC’s requirements in
respect of swap transactions with US
persons and certain persons guaranteed
by or affiliated with US persons. In addition,
since Barclays Bank PLC is a non-US
security-based swap dealer, it is only
subject to certain of the SEC’s
requirements in respect of security-based
swap transactions with US persons or
which are arranged, negotiated, or
executed by US personnel. Additionally,
Barclays Bank PLC and Barclays Bank
Ireland PLC have elected to comply with
certain CFTC/SEC requirements, as
applicable, through ‘substituted
compliance’ with EU/UK requirements
pursuant to relevant determinations and
related relief issued by the SEC and the
CFTC, as applicable.
Barclays Bank PLC and Barclays Bank
Ireland PLC are subject to FRB rules on
capital and margin.
In 2022, the SEC proposed new rules that
would require any person with a security-
based swap position (aggregated across all
affiliated persons) that exceeds any of the
thresholds specified by the SEC to
promptly report certain information by the
next business day, including the identity of
the reporting person and the security-
based swap position, as well as the
ownership of securities positions related
to the security-based swap position. Such
reports would be available publicly. If
adopted as proposed, this rule could
increase the burden and cost to Barclays
Bank PLC of utilising security-based
swaps.
Other regulatory developments in the
US
In 2023, the SEC finalised amendments to
shorten the standard settlement cycle for
most broker-dealer transactions in
securities from two business days after the
trade (T+2) to one business day after the
trade (T+1), which requires significant
changes to BCI’s settlement procedures
and practices, and introduced new rules
requiring market-wide improvements in
the rate of same-day affirmations and on
central matching service providers.
On 13 October 2023, the SEC adopted
new rules to establish broad reporting
requirements of the terms of securities
loans to FINRA for public dissemination,
and requiring FINRA to make publicly
available certain information it receives
regarding those lending transactions.
On 13 October 2023, the SEC adopted
new rules requiring a wide range of firms to
file monthly reports with the SEC for large
short positions in equity securities on a
| | | | | | | | | |
| Climate and sustainability report | | | | | | | Barclays PLC 2023 Annual Report on Form 20-F | |
| |
| | | | | | | | | |
Supervision and regulation (continued) |
new Form SHO, and amendments to the
National Market System plan governing
the Consolidated Audit Trail, which adds an
additional reporting requirement for CAT-
reporting firms relying on the bona fide
market maker exception to Reg SHO’s
locate requirement.
On 30 October 2023, the SEC issued
exemptive relief, which exempts broker-
dealers from their review obligations
concerning the issuer of an over-the-
counter security prior to publication or
submission of a quotation in that security
with respect to a fixed-income security to
be sold in compliance with the safe harbor
in Rule 144A under the Securities Act of
1933.
On 13 December 2023, the SEC adopted
rule amendments under the Exchange Act
that, among other things, will mandate
central clearing of certain US Treasury
securities transactions and amend the
broker-dealer customer protection rule as
it applies to margin posted for transactions
in US Treasury securities. These rule
amendments could impose additional
costs on the Group’s Treasury securities
trading activity.
The SEC has also put forth a number of
other recent proposals that, if adopted,
could have a significant impact on the
Group’s business and operations, including
a series of market structure proposals
which would have a significant impact on
securities trading activity by BCI and other
Group entities, as the SEC proposals would
(a) impose a new SEC best execution
obligation on securities broker-dealers,
including BCI, (b) require that certain
individual investor orders be exposed to
auctions before they could be executed
internally by certain trading centres, and (c)
amend certain rules under Regulation NMS
(National Market System) to adopt variable
minimum pricing increments, reduce
access fee caps for protected quotations,
require that the amount of exchange fees
and rebates be determinable at the time of
execution, and update and expand to
certain broker-dealers the disclosures
required for order executions in NMS
stocks, among other changes.
Other regulation
Consumer protection, culture, and
diversity and inclusion
In July 2023, the FCA’s new Consumer
Duty came into force for new and existing
products or services that are open to sale
or renewal. It will apply to closed products
and services from 31 July 2024. The duty
sets higher expectations for the standard
of care that firms provide to retail
customers and impacts all aspects of
Barclays' retail businesses, including every
retail customer journey, product and
service as well as our relationships with
partners, suppliers and third parties. This
has resulted in significant implementation
costs and there will also be higher ongoing
costs for the industry as a result of
extensive monitoring and evidential
requirements.
Our regulators have enhanced their focus
on the promotion of cultural values as a
key area for banks. The UK regulators have
also begun focusing on diversity and
inclusion in financial services firms, with the
PRA and FCA having published a
consultation on the introduction of a new
regulatory framework on diversity and
inclusion in September 2023. The UK
regulators expect to publish final rules on
this issue in 2024.
FSMA 2023 contains provisions mandating
that the Payment Systems Regulator
(PSR) require the reimbursement of
authorised push payment scams by
payment service providers, including
Barclays. This reimbursement requirement
will be split 50:50 between the sending and
receiving firms. Changes to the rules of the
Faster Payments Scheme and a new
Specific Direction issued by the PSR to
require reimbursement will take effect in
October 2024.
Data protection
Most jurisdictions where the Group
operates have adopted or are considering
comprehensive laws concerning data
protection and privacy. Regulations
regarding data protection are increasing in
number, as well as levels of enforcement,
as manifested in increased amounts of
fines and the severity of other penalties.
We expect that personal privacy and data
protection will continue to receive
attention and focus from regulators, as
well as public scrutiny and attention.
The EU’s General Data Protection
Regulation (GDPR) and the UK’s General
Data Protection Regulation (UK GDPR)
provide a framework of rights and duties
designed to safeguard personal data and
apply to the activities conducted from an
establishment in the EU or the UK,
respectively. The extraterritorial effect of
the GDPR and the UK GDPR means
entities established outside the EU or the
UK may fall within the GDPR or the UK
GDPR’s ambit when offering goods or
services to EU/UK based customers or
clients or conducting behavioural
monitoring of individuals in the EU/UK. The
Data Protection and Digital Information
(No.2) Bill was introduced to the UK
Parliament in March 2023, which if enacted
will bring some divergence between the EU
GDPR and UK GDPR. The UK government
has indicated that it expects the Bill to
become law in mid-2024, although there is
still some uncertainty on timing and
content.
The data regime in China is likely to
continue to evolve, governing the
collection, processing and cross-border
transfers of China-based individuals'
personal data and related restricted data
(e.g., macro/derived characteristics data
which, if tampered with, divulged or
destroyed, may endanger China's
economic operation, social stability,
national security - among other things -
having regard to the volume and
granularity of the data). In India, the Digital
Personal Data Protection Act, 2023, may
be implemented in phases during 2024 and
beyond. Except under certain exemptions,
its scope would include the processing of
personal data in India and would extend to
the profiling of, and offering goods and
services to, India-based individuals outside
of India. As the global data protection
regulatory landscape develops, non-
compliance with any such requirements
and rules could lead to regulatory fines and
other penalties.
In the US, Barclays Bank Delaware is
subject to the US Federal Gramm-Leach-
Bliley Act (GLBA) and the California Privacy
Rights Act of 2020, which amended the
California Consumer Privacy Act of 2018
and came into effect on 1 January 2023
(CPRA). The GLBA limits the use and
disclosure of non-public personal
information to non-affiliated third parties,
and requires financial institutions to
provide written notice of their privacy
policies and practices and implement
certain information security policies and
practices. Any violations of the GLBA could
subject Barclays Bank Delaware to
additional reporting requirements or
regulatory investigation or audits by the
financial regulators. More broadly, the
Group's US operations are subject to the
CPRA which applies to personal
information that is not collected,
processed, sold or disclosed subject to the
GLBA. The CPRA requires applicable
members of the Group to both provide
California residents with additional
disclosures regarding the collection, use
and sharing of personal information and
grant California residents access, deletion,
correction and other rights, including the
right to opt-out of certain sales or
transfers of personal information and the
right to limit the processing of sensitive
personal information to certain purposes.
Any violations of the CPRA may be subject
| | | | | | | | | |
| Climate and sustainability report | | | | | | | Barclays PLC 2023 Annual Report on Form 20-F | |
| |
| | | | | | | | | |
Supervision and regulation (continued) |
to enforcement by the California Privacy
Protection Agency and the California
Attorney General and the imposition of
monetary penalties, as well as potential
lawsuits arising from the private right of
action provided to California residents in
the case of certain data breaches. Bills
proposed in the United States Congress
and in the legislatures of various US states,
if enacted, may have further impact on the
data privacy practices of Barclays’ US
operations. In addition, all 50 states have
laws including obligations to provide
notification of security breaches of
computer databases that contain personal
information to affected individuals, state
officers and others.
Cybersecurity and operational resilience
Regulators globally continue to focus on
cybersecurity risk management,
organisational operational resilience and
overall soundness across all financial
services firms, with customer and market
expectations of uninterrupted access to
financial services remaining at an all-time
high.
The regulatory focus has been further
heightened by the increasing number of
high-profile ransomware and other supply
chain attacks seen across the industry in
recent years and the growing reliance of
financial services on Cloud and other third
party service providers. This is evidenced
by the continuing introduction of new laws
and regulatory frameworks directed at
enhancing resilience of both firms and
their critical third party providers. A new UK
framework introduced in March 2021
requires firms to be able to remain within
impact tolerances set for their important
business services, in severe but plausible
disruption scenarios such as a cyber
attack, by no later than 31 March 2025.
FSMA 2023 introduced a new regime for
designated critical third party providers,
and in 2023 the FCA and PRA issued a
consultation on proposed rules and
guidance for supervising the resilience of
critical third party providers.
The EU’s Digital Operational Resilience Act
(DORA) entered into force in January 2023
and will apply in early 2025 (after a two-
year implementation period), introducing
comprehensive and sector specific
regulation on Information Communication
Technologies (ICT) incident reporting,
testing and third party risk management,
and providing for direct oversight of critical
third party providers servicing the EU
financial services sector. The existing and
anticipated requirements for increased
controls will serve to improve industry
standardisation and resilience capabilities,
enhancing our ability to deliver services
during periods of potential disruption.
However, such measures are likely to
result in increased technology and
compliance costs for the Group.
In 2023, the SEC finalised disclosure rules
regarding cybersecurity risk management,
governance and incident reporting by US-
listed companies, including foreign private
issuers such as Barclays PLC and Barclays
Bank PLC. The new rules require foreign
private issuers to annually disclose the
policies and procedures relied upon to
identify and manage cybersecurity risks,
including risk management strategy and
whether any risks from cybersecurity
threats, including as a result of any
previous cybersecurity incidents, have
materially affected or are reasonably likely
to materially affect the issuer, its business
strategy, results of operations or financial
condition. In addition, Barclays PLC and
Barclays Bank PLC must annually describe
Barclays’ board of directors’ oversight of
risks from cybersecurity threats, the board
committee responsible for the oversight
of such risks, and the processes by which
the board or such committee is informed
thereof; and details of management’s
expertise and role in assessing and
managing material risks from
cybersecurity threats. If Barclays PLC or
Barclays Bank PLC are required or
determine to disclose material
cybersecurity incidents under home
country or stock exchange rules, they are
required to also furnish this information
with the SEC on the SEC's website, in
accordance with their obligations as
foreign private issuers.
Similarly, NYDFS amended its
cybersecurity regulation applying to the
New York Branch of Barclays Bank PLC.
The NYDFS's amended cybersecurity
regulation contains significant updates,
including enhanced notification
requirements, cybersecurity governance
obligations, and requirements applicable to
cybersecurity policies and procedures
(e.g., encryption and multi-factor
authentication, business continuity and
incident response plans, and vulnerability
management).
Regulatory initiatives on ESG disclosure
The EU Regulation on Sustainable Finance
Disclosures Regulation (SFDR) and related
Delegated Regulations require financial
market participants (FMPs) to disclose how
they integrate environmental, social and
governance factors in their investment
decisions for certain financial products and
to publish principal adverse impact
statements. The SFDR applies to entities
established in the EU and in-scope
products marketed in the EU, regardless of
the location of the entity. The SFDR is
currently under review by the Commission.
In addition, the EU Taxonomy Regulation
provides for a general framework for the
development of an EU-wide classification
system for environmentally sustainable
economic activities. It sets mandatory
entity-level disclosure requirements for
companies which fall under the scope of
the EU Accounting Directive, in relation to
eligibility and alignment of their business
activities with the EU Taxonomy
Regulation. The EU Taxonomy Regulation
also imposes product level disclosure
obligations for FMPs on the extent to
which their financial products are
Taxonomy aligned or not. The taxonomy,
and with it the Taxonomy Regulation, is
under review to include further sectors
and, for example, social elements.
The EU Corporate Sustainability Reporting
Directive will introduce sustainability
related reporting obligations for various
entities, including EU banks and certain
non-EU companies and banks (by virtue of
having EU listings or significant business in
the EU), with reporting to commence on a
phased basis from the financial year 2024.
Related technical sustainability reporting
standards have been developed by the
European Financial Reporting Advisory
Group.
The second EU Capital Requirements
Regulation established, for certain large
financial institutions, a Pillar 3 disclosure
framework for information on
environmental, social and governance
risks, including physical risks and transition
risks. Amendments proposed by the CRR
III and CRD VI banking package will extend
the scope of these disclosures and the
emphasis on ESG. The ECB has made, and
continues to regard, the supervision of the
approach of institutions to ESG risk a
priority.
In December 2023, the European Council
and Parliament institutions reached
political agreement on the Directive on
Corporate Sustainability Due Diligence,
which will require EU firms, and certain
non-EU firms, including financial
institutions, to carry out due diligence with
regard to their own operations and
companies in their upstream value chain, in
order to identify and prevent, bring to an
end or mitigate the adverse impact of their
activities on human rights and the
environment. Firms will also be required to
establish a climate change transition plan.
These obligations are expected to come
into force on a phased basis from the
second half of 2027, at the earliest.
| | | | | | | | | |
| Climate and sustainability report | | | | | | | Barclays PLC 2023 Annual Report on Form 20-F | |
| |
| | | | | | | | | |
Supervision and regulation (continued) |
In the UK, the FCA published final rules on
the UK Sustainability Disclosure
Requirements regime in November 2023
which set out new requirements to
prepare sustainability-related product and
entity level disclosures for certain firms, as
well as a new sustainable investment
labelling regime and anti-greenwashing
rule applicable to all authorised firms.
Currently, the new anti-greenwashing rule
(and associated guidance) is due to apply
from 31 May 2024, whilst the rest of the
changes will take effect on a phased basis,
beginning in the second half of 2024. The
UK Government has expressed its
intention to consider how best to
incorporate the Taskforce on Nature-
related Financial Disclosures framework
for nature-related risk management and
disclosures into UK legislation and to
consult on introducing Transition Plan
Taskforce Disclosure Framework (TPT
Framework) related requirements for the
UK’s largest companies. The Government
is also progressing plans to endorse UK
Sustainability Disclosure Standards based
on the International Sustainability
Standards Board (ISSB) sustainability
reporting standards (IFRS S1 on general
requirements for sustainability disclosures
and IFRS S2 on climate disclosures) for use
in the UK by July 2024. The FCA plans to
consult in 2024 on incorporating
provisions relating to the ISSB standards
and TPT Framework into its Handbook.
Additionally, TCFD-aligned reporting
requirements apply to UK publicly quoted
companies, large private companies and
LLPs (in addition to existing TCFD-related
reporting requirements under the Listing
Rules).
In the UK, the UK Government has
confirmed its intention to develop a UK
Green Taxonomy, and the Green
Technical Advisory Group continues to
publish advice and reports on the
development of a Green Taxonomy.
Reporting against the Taxonomy will form
part of the UK’s new Sustainability
Disclosure Requirements (SDR). Certain
companies will be required to disclose
which portion of their activities are
Taxonomy-aligned. The structure of the
Taxonomy is expected to draw on the EU
approach and has six environmental
objectives (climate change mitigation,
climate change adaptation, sustainable
use and protection of water and marine
resources, transition to a circular
economy, pollution prevention and control
and protection and restoration of
biodiversity).
In March 2022, the SEC proposed climate
related-disclosure requirements for US-
listed companies (which would include
Barclays PLC and Barclays Bank PLC) that
would, among other things, require
disclosure of direct and indirect
greenhouse gas emissions, with certain
emissions disclosures subject to third-
party attestation requirements; climate-
related scenario analysis (if the issuer
conducts scenario analysis), together with
qualitative and quantitative information
about the hypothetical future climate
scenarios used in its analysis; climate
transition plans or climate-related targets
or goals, along with disclosure of progress
against any such plans, targets or goals;
climate-related risks over the short-,
medium- and long-term; qualitative and
quantitative information regarding
climate-related risks and historical impacts
in audited financial statements; corporate
governance of climate-related risks; and
climate-related risk-management
processes. In addition, bills proposed or
adopted by the legislatures of certain US
states may impose additional or stricter
climate related-disclosure requirements
on businesses operating in such US states.
For example, in October 2023, California
adopted the Climate Corporate Data
Accountability Act (SB-253) and the
Greenhouse Gases: Climate-Related
Financial Risk bill (SB-261) which are
expected to apply commencing in 2026.
Barclays is monitoring such legislative
developments and their impact on
Barclays’ US operations and reporting
obligations.
Sanctions and financial crime
The UK Bribery Act 2010 introduced a new
form of corporate criminal liability focused
broadly on a company’s failure to prevent
bribery on its behalf. The Criminal Finances
Act 2017 introduced new corporate
criminal offences of failing to prevent the
facilitation of UK and overseas tax evasion.
In 2023, the Economic Crime and
Corporate Transparency Act 2023
became law. This creates a new offence of
failing to prevent a person associated with
the Group from committing fraud for the
benefit of the Group. These pieces of
legislation have broad application and in
certain circumstances may have
extraterritorial impact on entities, persons
or activities located outside the UK,
including Barclays PLC’s subsidiaries
outside the UK.
The UK Bribery Act requires the Group to
have adequate procedures to prevent
bribery which, due to the extraterritorial
nature of the Act, makes this both
complex and costly. Additionally, the
Criminal Finances Act requires the Group
to have reasonable procedures in place to
prevent the criminal facilitation of tax
evasion by persons acting for, or on behalf
of, the Group. The Economic Crime and
Corporate Transparency Act similarly
requires the Group to have reasonable
procedures in place to prevent a person
associated with the Group from
committing fraud.
The Sanctions and Anti-Money Laundering
Act 2018 (the Sanctions Act) became law
in the UK in 2018. Following the UK’s
withdrawal from the EU, the Sanctions Act
allowed for the adoption of an
autonomous UK sanctions regime which
came into force in 2021, as well as a more
flexible licensing regime post-Brexit. This
regime applies within the UK and in relation
to the conduct of all UK persons wherever
they are in the world; it also applies to
overseas branches of UK companies
(including the Barclays Bank PLC New York
branch).
Within the EU, there is a system of
autonomous sanctions by which the
European Council adopts a decision made
by the EU’s Common Foreign and Security
Policy. The measures stated in the Council
decision are either implemented at the EU
level, by way of Regulation, or at a national
level in Member States. Regulations are
binding and directly effective throughout
the EU. Each measure will specify the
territorial scope of the relevant sanctions
but these can apply broadly within the
territory of any EU Member States and to
EU nationals wherever they are located as
well as to third country branches of EU
companies. The EU enforces its anti-
money laundering regime through the
Fourth Anti-Money Laundering Directive
(EU) 2015/849 and the Fifth Anti-Money
Laundering Directive (EU) 2018/849 with
further changes being proposed through
the Sixth Anti-Money Laundering Directive
and a package of further reforms currently
under discussion.
| | | | | | | | | |
| Climate and sustainability report | | | | | | | Barclays PLC 2023 Annual Report on Form 20-F | |
| |
| | | | | | | | | |
Supervision and regulation (continued) |
In the US, the Bank Secrecy Act, the USA
PATRIOT Act 2001, the Anti-Money
Laundering Act of 2020 and regulations
thereunder contain numerous anti-money
laundering and anti-terrorist financing
requirements for financial institutions. In
addition, the Group is subject to the US
Foreign Corrupt Practices Act, which
prohibits, among other things, corrupt
payments to foreign government officials.
It is also subject to various economic
sanctions laws, regulations and executive
orders administered by the US
government, which prohibit or restrict
some or all business activities and other
dealings with or involving certain
individuals, entities, groups, countries and
territories.
In some cases, US state and federal
regulations addressing sanctions, money
laundering and other financial crimes may
impact entities, persons or activities
located or undertaken outside the US,
including Barclays PLC and its subsidiaries.
US government authorities have
aggressively enforced these laws against
financial institutions in recent years.
As a result of the conflict in Ukraine, there
has been an increased regulatory focus on
sanctions compliance in various
jurisdictions, including the US, UK and EU.
Failure of a financial institution to ensure
compliance with such laws could have
serious legal, financial and reputational
consequences for the institution.
| | | | | | | | | |
| Climate and sustainability report | | | | | | | Barclays PLC 2023 Annual Report on Form 20-F | |
| |
| | | | | | | | | |
Supervision and regulation (continued) |
| | | | | | |
| | | | | | |
| | | | | | |
| | | |
| A review of the Group’s performance, including the key performance indicators, and the contribution of each of our businesses to the overall performance of the Group. | |
| | | | | | |
| | | | | | |
| | | |
| | | |
| | | |
| | | |
| | | |
| | | |
| | | |
| | | | | | |
In assessing the financial performance of the Group, management uses a range of KPIs which focus on the Group’s financial strength,
the delivery of sustainable returns and cost management. KPIs reflect the targets and ambitions followed during 2023. On 20 February
2024, the Investor Update set out refreshed targets and ambitions which future progress will be measured against.
Non-IFRS performance measures
The Group’s management believes that the non-IFRS performance measures included in this document provide valuable information
to the readers of the financial statements as they enable the reader to identify a more consistent basis for comparing the businesses’
performance between financial periods, and provide more detail concerning the elements of performance which the managers of these
businesses are most directly able to influence or are relevant for an assessment of the Group.
They also reflect an important aspect of the way in which operating targets are defined and performance is monitored by management.
However, any non-IFRS performance measures in this document are not a substitute for IFRS measures and readers should consider
the IFRS measures as well. Refer to the non-IFRS performance measures section for further information and calculations of non-IFRS
performance measures included throughout this section and the most directly comparable IFRS measures.
| | |
| Why is it important and how the Group performed | |
Common Equity Tier 1 (CET1) ratio Capital requirements are part of the regulatory framework governing how banks and depository institutions are supervised. Capital ratios express a bank’s capital as a percentage of its Risk Weighted Assets (RWAs) as defined by the PRA. CET1 ratio is a measure of capital as defined within the Definition of Capital section of the PRA's Prudential and Resolution Policy - Banking Index. | The Group’s capital management objective is to maximise shareholder value by prudently managing the level and mix of its capital to: ensure the Group and all of its subsidiaries are appropriately capitalised relative to their regulatory minimum and stressed capital requirements, support the Group’s risk appetite, growth and strategic options, while seeking to maintain a robust credit proposition for the Group and its subsidiaries. The CET1 ratio decreased to 13.8% (2022: 13.9%) as £4.3bn of attributable profit, including the negative impact of structural cost actions, was more than offset by returns to shareholders, impacts of regulatory change from 1 January 2023, the impact of KMC acquisition and movements in other capital deductions, as well as an increase in RWAs excluding the impact of foreign exchange movements, primarily driven by higher CIB and CC&P RWAs. An £8.2bn decrease in RWAs driven by foreign exchange movements was offset by a £1.1bn decrease in CET1 capital due to a decrease in the currency translation reserve within CET1. Group target: a CET1 ratio in the range of 13-14%. | CET1 ratio 13.8% 2022: 13.9% 2021: 15.1% |
Return on average shareholders’ equity RoE is calculated as profit after tax attributable to ordinary shareholders, as a proportion of average shareholders’ equity excluding non-controlling interests and other equity instruments. | This measure indicates the return generated by the management of the business based on shareholders' equity. RoE for the Group was 7.6% (2022: 8.9%). | Group RoE 7.6% 2022: 8.9% 2021: 11.2% |
Return on average tangible shareholders’ equity (RoTE) RoTE is calculated as Group attributable profit, as a proportion of average tangible shareholders’ equity | This measure indicates the return generated by the management of the business based on ordinary shareholders’ tangible equity. Achieving a target RoTE demonstrates the organisation’s ability to execute its strategy and align management’s interests with the shareholders’. RoTE lies at the heart of the Group’s capital allocation and performance management process. Statutory RoTE was 9.0% (2022: 10.4%) including £0.9bn of structural cost actions in Q423. Excluding Q423 structural cost actions, RoTE was 10.6%.. Group target: RoTE of greater than 10%. Management does not assess forward-looking “return on equity” (target RoE) as a performance indicator of the business, and therefore a reconciliation of the forward- looking non-IFRS measure “return on tangible equity” (target RoTE) to an equivalent IFRS measure is not available without unreasonable efforts. | Group RoTE 9.0% 2022: 10.4% 2021: 13.1% |
| | | | | | | | | |
| Climate and sustainability report | | | | | | | Barclays PLC 2023 Annual Report on Form 20-F | |
| |
| | | | | | | | | |
Key performance indicators |
| | |
| Why is it important and how the Group performed | |
| Barclays views total operating expenses as a key strategic area for banks; those who actively manage costs and control them effectively will gain a strong competitive advantage. Group operating expenses increased to £16.9bn (2022: £16.7bn) reflecting £0.9bn of structural cost actions in Q423,bringing total structural cost actions for FY23 to £1.0bn (2022: £0.2bn), business growth and investments in resilience and controls partially offset by lower litigation and conduct charges. The prior year included £1.0bn of litigation and conduct charges related to the Over-issuance of Securities. | Total operating expenses £16.9bn 2022: £16.7bn 2021: £14.7bn |
Cost: income ratio Total operating expenses divided by total income. | This is a measure management uses to assess the productivity of the business operations. Managing the cost base is a key execution priority for management and includes a review of all categories of discretionary spending and an analysis of how we can run the business to ensure that costs increase at a slower rate than income. The Group cost: income ratio was 67% (2022: 67%). Excluding Q423 structural cost actions, Group cost: income ratio was 63% driven by increased income. Group target: a cost: income ratio below 60%. | Cost: income ratio 67% 2022: 67% 2021: 67% |
| | | | | | | | | |
| Climate and sustainability report | | | | | | | Barclays PLC 2023 Annual Report on Form 20-F | |
| |
| | | | | | | | | |
Key performance indicators (continued) |
| | | | | |
| | | | | |
For the year ended 31 December | | | | | |
| | | | | |
| | | | | |
| | | | | |
Fee and commission income | | | | | |
Fee and commission expense | | | | | |
Net fee and commission income | | | | | |
| | | | | |
| | | | | |
| | | | | |
| | | | | |
| | | | | |
| | | | | |
| | | | | |
| | | | | |
| | | | | |
| | | | | |
Credit impairment (charges)/releases | | | | | |
| | | | | |
| | | | | |
| | | | | |
Non-controlling interests | | | | | |
Other equity instrument holders | | | | | |
| | | | | |
| | | | | |
Selected financial statistics | | | | | |
| | | | | |
Diluted earnings per share | | | | | |
Return on average shareholders’ equity | | | | | |
Return on average tangible shareholders’ equity | | | | | |
| | | | | |
The financial information above is extracted from the published accounts. This information should be read together with the
information included in the accompanying consolidated financial statements.
| | | | | | | | | |
| Climate and sustainability report | | | | | | | Barclays PLC 2023 Annual Report on Form 20-F | |
| |
| | | | | | | | | |
Consolidated summary income statement |
2023 compared to 2022
Barclays delivered a profit before tax of £6,557m (2022: £7,012m), RoE of 7.6% (2022: 8.9%), RoTE of 9.0% (2022: 10.4%) and EPS of
27.7p (2022: 30.8p).
Group income increased 2% to £25,378m primarily driven by the net benefit from the higher interest rate environment, including
continued structural hedge income, and higher balances in US cards, partially offset by the non-repeat of the prior year income from
hedging arrangements related to the Over-issuance of Securities and lower income in Global Markets and Investment Banking,
Group total operating expenses increased to £16,931m (2022: £16,730m). Litigation and conduct charges decreased to £37m (2022:
£1,597m). Prior year charges included £966m of costs related to the Over-issuance of Securities, £282m of customer remediation
costs relating to legacy loan portfolios in CC&P and £165m related to the Devices Settlements1.
Group operating expenses excluding litigation and conduct charges increased to £16,894m (2022: £15,133m) driven by:
•£927m of structural cost actions2 in Q423 supporting the Group’s structural transformation and updated strategic priorities,
bringing total structural cost actions for FY23 to £1,046m (2022: £151m)
•the impact of business growth and the Kensington Mortgage Company (KMC) acquisition in Barclays UK, as well as investments in
resilience and controls;
•the impact of inflation on the Group was more than offset by efficiency savings.
Credit impairment charges were £1,881m (2022: £1,220m), driven by higher delinquencies in US cards, which was anticipated and led to
higher coverage ratios. Total coverage ratio remains strong at 1.4% (December 2022: 1.4%).
The effective tax rate (ETR) was 18.8% (2022: 14.8%). The 2023 ETR includes tax relief on payments made under Additional Tier 1
(AT1) instruments and on holdings of inflation-linked government bonds.
Attributable profit was £4,274m (2022: £5,023m).
Please refer to the Financial review section in the Annual Report on Form 20-F for the year ended 31 December 2022 for a comparative
discussion of the 2022 financial results compared to 2021.
Notes
1Refers to the settlements with the SEC and Commodity Futures Trading Commission (CFTC) in connection with their investigations of the use of unauthorised devices for business
communications.
2To help drive future returns, Barclays has taken £0.9bn of structural cost actions in Q423. Structural cost actions include initiatives across people, property and infrastructure.
| | | | | | | | | |
| Climate and sustainability report | | | | | | | Barclays PLC 2023 Annual Report on Form 20-F | |
| |
| | | | | | | | | |
Income statement commentary |
| | | | | |
| | | | | |
| | | | | |
| | | | | |
Cash and balances at central banks | | | | | |
Cash collateral and settlement balances | | | | | |
Debt securities at amortised cost | | | | | |
Loans and advances at amortised cost to banks | | | | | |
Loans and advances at amortised cost to customers | | | | | |
Reverse repurchase agreements and other similar secured lending at amortised cost | | | | | |
| | | | | |
Financial assets at fair value through the income statement | | | | | |
Derivative financial instruments | | | | | |
Financial assets at fair value through other comprehensive income | | | | | |
| | | | | |
| | | | | |
| | | | | |
Deposits at amortised cost from banks | | | | | |
Deposits at amortised cost from customers | | | | | |
Cash collateral and settlement balances | | | | | |
Repurchase agreements and other similar secured borrowings at amortised cost | | | | | |
| | | | | |
| | | | | |
Trading portfolio liabilities | | | | | |
Financial liabilities designated at fair value | | | | | |
Derivative financial instruments | | | | | |
| | | | | |
| | | | | |
| | | | | |
Called up share capital and share premium | | | | | |
| | | | | |
| | | | | |
| | | | | |
Total equity excluding non-controlling interests | | | | | |
Non-controlling interests | | | | | |
| | | | | |
Total liabilities and equity | | | | | |
| | | | | |
Net asset value per ordinary share | | | | | |
Tangible net asset value per share | | | | | |
Number of ordinary shares of Barclays PLC (in millions) | | | | | |
| | | | | |
Year-end USD exchange rate | | | | | |
Year-end EUR exchange rate | | | | | |
| | | | | | | | | |
| Climate and sustainability report | | | | | | | Barclays PLC 2023 Annual Report on Form 20-F | |
| |
| | | | | | | | | |
Consolidated summary balance sheet |
Total assets
Total assets decreased £36.2bn to £1,477.5bn.
Cash and balances at central banks decreased by £31.7bn to £224.6bn driven by lower customer deposits in Barclays UK reflecting the
broader market trends.
Debt securities at amortised cost increased by £11.3bn to £56.7bn and Financial assets at fair value through other comprehensive
income increased £6.8bn to £71.8bn driven by increased investment in debt securities in Barclays International.
Loans and advances at amortised cost to banks and customers decreased £10.5bn to £342.7bn driven by loan repayments across
Barclays International and Barclays UK.
Trading portfolio assets increased £40.8bn to £174.6bn driven by an increase in debt and equity securities as we facilitate client demand
in Barclays International.
Derivative financial instrument assets decreased £45.5bn to £256.8bn, driven by lower market volatility and a decrease in the forward
interest rates. Cash collateral and settlement balances decreased by £3.7bn to £108.9bn.
Financial assets at fair value through the income statement decreased £6.9bn to £206.7bn driven by increased secured lending being
more than offset by trade optimisations.
Total liabilities
Total liabilities decreased £38.8bn to £1,405.6bn.
Deposits at amortised cost to banks and customers decreased £7.0bn to £538.8bn driven by a reduction in customer deposits
reflecting broader market trends in Barclays UK, partially offset by an increase in short-term money market deposits and growth in
customer deposits in Barclays International.
Repurchase agreements and other similar secured borrowing at amortised cost increased £14.5bn to £41.6bn driven by increased
secured borrowing.
Debt securities in issue decreased £16.1bn to £96.8bn driven by maturities.
Derivative financial instrument liabilities decreased £39.6bn to £250.0bn driven by lower market volatility. Cash collateral and settlement
balances decreased by £2.8bn to £94.1bn.
Trading portfolio liabilities decreased £14.3bn to £58.7bn driven by decreases in equity securities as clients repositioned their demand.
Financial liabilities designated at fair value increased £25.9bn to £297.5bn driven by increased repurchase agreements and prime
brokerage deposits.
Total shareholders’ equity
Total shareholders’ equity increased £2.6bn to £71.9bn.
Other equity instruments remained at £13.3bn as the issuance of three AT1 instruments (£1.50bn, $1.8bn and SGD400m) was offset
by two redemptions (£1.3bn and $2.5bn). AT1 securities are perpetual subordinated contingent convertible securities structured to
qualify as AT1 instruments under prevailing capital rules applicable as at the relevant issue date.
Other reserves increased by £2.1bn, mainly due to an increase in the cash flow hedging reserve of £3.5bn to £3.7bn debit, as a result of
fair value movements on interest rate swaps held for hedging purposes due to an decrease in major interest rate curves. This was
partially offset by an decrease in the currency translation reserve of £1.1bn to £3.7bn, driven by the appreciation of GBP against USD.
Retained earnings increased £0.9bn to £53.7bn, mainly due to profits of £4.3bn, offset by share repurchases of £1.3bn and dividends of
£1.2bn.
Net asset value per share increased to 382p (December 2022: 347p).
Tangible net asset value per share increased to 331p (December 2022: 295p) including: EPS of 27.7p, positive cash flow hedge reserve
movements of 22p, and 8p from the reduction in share count following share buybacks of £1.25bn completed in 2023. This was partially
offset by an 8p reduction from dividends paid during 2023 and net negative other reserve movements.
| | | | | | | | | |
| Climate and sustainability report | | | | | | | Barclays PLC 2023 Annual Report on Form 20-F | |
| |
| | | | | | | | | |
|
Barclays UK
| | | |
| | | |
| | | |
Income statement information | | | |
| | | |
Net fee, commission and other income | | | |
| | | |
| | | |
| | | |
| | | |
| | | |
| | | |
| | | |
Credit impairment (charges)/releases | | | |
| | | |
| | | |
| | | |
Balance sheet information | | | |
Loans and advances to customers at amortised cost | | | |
| | | |
Customer deposits at amortised cost | | | |
| | | |
| | | |
| | | |
| | | |
| | | |
Mortgage gross lending flow | | | |
Average LTV of mortgage portfolio1 | | | |
Average LTV of new mortgage lending1 | | | |
| | | |
Mobile banking active customers | | | |
30 day arrears rate - Barclaycard Consumer UK | | | |
Number of employees (full time equivalent) | | | |
| | | |
| | | |
Return on average allocated equity | | | |
Return on average allocated tangible equity | | | |
| | | |
Average allocated tangible equity | | | |
| | | |
| | | |
| | | |
Note
1Average loan to value (LTV) of mortgages is balance weighted and reflects both residential and buy-to-let (BTL) mortgage portfolios within the Home Loans portfolio.
| | | | | | | | | |
| Climate and sustainability report | | | | | | | Barclays PLC 2023 Annual Report on Form 20-F | |
| |
| | | | | | | | | |
Analysis of results by business |
Analysis of Barclays UK
| | | |
| | | |
| | | |
| | | |
| | | |
| | | |
| | | |
| | | |
| | | |
Analysis of credit impairment (charges)/releases | | | |
| | | |
| | | |
| | | |
Total credit impairment (charges)/releases | | | |
| | | |
Analysis of loans and advances to customers at amortised cost | | | |
| | | |
| | | |
| | | |
Total loans and advances to customers at amortised cost | | | |
| | | |
Analysis of customer deposits at amortised cost | | | |
| | | |
| | | |
| | | |
Total customer deposits at amortised cost | | | |
2023 compared to 2022
Profit before tax increased 8% to £2,868m with a RoE of 14.0% (2022: 13.8%) and with a RoTE of 19.2% (2022: 18.7%).
Total income increased 5% to £7,587m. Net interest income increased 9% to £6,431m with a net interest margin of 3.13% (2022:
2.86%), as higher interest rates and associated structural hedge benefit outweighed mortgage margin pressure and adverse deposit
dynamics reflecting wider market trends. Net fee, commission and other income decreased 15% to £1,156m including the impact of
the transfer of WM&I to CC&P.
•Personal Banking income increased 4% to £4,729m, driven by higher interest rates, partially offset by mortgage margin compression
and movements in deposit volumes and mix resulting from cost of living pressures and customers searching for yield.
•Barclaycard Consumer UK income decreased 12% to £964m as higher customer spend volumes were more than offset by lower
interest earning lending balances following repayments and ongoing prudent risk management.
•Business Banking income increased 16% to £1,894m driven by higher interest rates, partially offset by lower government scheme
lending as repayments continue and lower deposit volumes.
Total operating expenses increased 2% to £4,415m, including £168m impact from Q423 structural cost actions. Excluding the impact
of Q423 structural cost actions, operating expenses decreased 2%, driven by the transfer of WM&I to CC&P partially offset by the
impact of inflation and the acquisition of KMC. Ongoing efficiency savings continue to be reinvested, including in our transformation
programme to support sustainable improvement to the cost: income ratio over the longer term.
Credit impairment charges increased to £304m (2022: £286m), consistent with low delinquencies in UK cards and a high quality
mortgage lending portfolio. UK cards 30 and 90 day arrears remained low at 0.9% (Q422: 0.9%) and 0.2% (Q422: 0.2%) respectively.
The UK cards total coverage ratio was 6.8% (December 2022: 7.6%).
Loans and advances to customers at amortised cost decreased by 1% to £202.8bn (December 2022: £205.1bn), primarily reflecting
continued repayment of government scheme lending in Business Banking, subdued mortgage lending amid lower market demand,
partially offset by the acquisition of KMC.
Customer deposits at amortised cost decreased 7% to £241.1bn (December 2022: £258.0bn). Primarily driven by reduced current
account balances in Personal and Business Banking, reflecting broader market trends. The loan: deposit ratio increased to 92%
(December 2022: 87%).
RWAs increased to £73.5bn (December 2022: £73.1bn), primarily due to the acquisition of KMC, broadly offset by reduction across
lending portfolios.
Please refer to the Financial review section in the Annual Report on Form 20-F for the year ended 31 December 2022 for a comparative
discussion of the 2022 financial results compared to 2021.
| | | | | | | | | |
| Climate and sustainability report | | | | | | | Barclays PLC 2023 Annual Report on Form 20-F | |
| |
| | | | | | | | | |
Analysis of results by business (continued) |
Barclays International
| | | |
| | | |
| | | |
Income statement information | | | |
| | | |
| | | |
Net fee, commission and other income | | | |
| | | |
| | | |
| | | |
| | | |
| | | |
Other net (expenses)/income | | | |
| | | |
Credit impairment (charges)/releases | | | |
| | | |
| | | |
| | | |
Balance sheet information | | | |
Loans and advances to customers at amortised cost | | | |
Loans and advances to banks at amortised cost | | | |
Debt securities at amortised cost | | | |
Loans and advances at amortised cost | | | |
| | | |
Derivative financial instrument assets | | | |
Financial assets at fair value through the income statement | | | |
Cash collateral and settlement balances | | | |
| | | |
| | | |
Deposits at amortised cost | | | |
Derivative financial instrument liabilities | | | |
| | | |
| | | |
| | | |
| | | |
Number of employees (full time equivalent) | | | |
| | | |
| | | |
Return on average allocated equity | | | |
Return on average allocated tangible equity | | | |
| | | |
Average allocated tangible equity | | | |
| | | |
| | | |
| | | |
| | | | | | | | | |
| Climate and sustainability report | | | | | | | Barclays PLC 2023 Annual Report on Form 20-F | |
| |
| | | | | | | | | |
Analysis of results by business (continued) |
Analysis of Barclays International
| | | |
| | | |
Corporate and Investment Bank | | | |
Income statement information | | | |
| | | |
| | | |
Net fee, commission and other income | | | |
| | | |
| | | |
| | | |
| | | |
| | | |
Other net (expenses)/income | | | |
| | | |
Credit impairment (charges)/releases | | | |
| | | |
| | | |
| | | |
Balance sheet information | | | |
Loans and advances to customers at amortised cost | | | |
Loans and advances to banks at amortised cost | | | |
Debt securities at amortised cost | | | |
Loans and advances at amortised cost | | | |
| | | |
Derivative financial instrument assets | | | |
Financial assets at fair value through the income statement | | | |
Cash collateral and settlement balances | | | |
| | | |
| | | |
Deposits at amortised cost | | | |
Derivative financial instrument liabilities | | | |
| | | |
| | | |
| | | |
Return on average allocated equity | | | |
Return on average allocated tangible equity | | | |
| | | |
Average allocated tangible equity | | | |
| | | |
| | | |
| | | |
| | | |
| | | |
| | | |
| | | |
| | | |
| | | |
| | | |
| | | |
| | | |
| | | |
| | | |
| | | |
| | | | | | | | | |
| Climate and sustainability report | | | | | | | Barclays PLC 2023 Annual Report on Form 20-F | |
| |
| | | | | | | | | |
Analysis of results by business (continued) |
Analysis of Barclays International continued
| | | |
| | | |
Consumer, Cards and Payments | | | |
Income statement information | | | |
| | | |
Net fee, commission, trading and other income | | | |
| | | |
| | | |
| | | |
| | | |
| | | |
| | | |
| | | |
Credit impairment charges | | | |
| | | |
| | | |
| | | |
Balance sheet information | | | |
Loans and advances to customers at amortised cost | | | |
| | | |
Deposits at amortised cost | | | |
| | | |
| | | |
| | | |
US cards 30 day arrears rate | | | |
US cards customer FICO score distribution | | | |
| | | |
| | | |
Total number of payments clients | | | |
Value of payments processed1 | | | |
| | | |
| | | |
Return on average allocated equity | | | |
Return on average allocated tangible equity | | | |
| | | |
Average allocated tangible equity | | | |
| | | |
| | | |
| | | |
| | | |
International Cards and Consumer Bank | | | |
| | | |
| | | |
| | | |
Note
1Includes £311bn (2022: £296bn; 2021: £270bn) of merchant acquiring payments.
| | | | | | | | | |
| Climate and sustainability report | | | | | | | Barclays PLC 2023 Annual Report on Form 20-F | |
| |
| | | | | | | | | |
Analysis of results by business (continued) |
2023 compared to 2022
Barclays International RoE was 8.0% (2022: 10.0%) and RoTE was 8.2% (2022: 10.2%) with a profit before tax of £4,607m (2022:
£4,965m) including £306m (CIB: £188m, CC&P: £118m) of Q423 structural cost actions. CIB delivered a RoE of 8.4% (2022: 10.3%) and
a RoTE of 8.4% (2022: 10.2%) and CC&P delivered a RoE of 5.9% (2022: 8.4%) and a RoTE of 6.7% (2022: 10.0%)
Total income was broadly flat at £17,918m, prior year included a £292m income impact from hedging arrangements related to the
Over-issuance of securities
Total operating expenses decreased 2% to £11,761m including £306m of structural cost actions in Q423. Prior year included £966m of
litigation and conduct charges relating to the Over-issuance of securities
CIB income was £12,610m (2022: £13,368m)
•Global Markets income was £7,218m (2022: £8,844m). FICC income was £4,845m (2022: £5,695m). Equities income was £2,373m
(2022: £3,149m).
•Investment Banking fees were £1,960m (2022: £2,215m). Advisory was £593m (2022: £768m). Debt capital markets were £1,148m
(2022: £1,281m).
•Transaction banking income was £2,957m (2022: £2,540m). Corporate lending income was £475m (2022: £(231)m).
CC&P income was £5,308m (2022: £4,499m)
•International Cards and Consumer Bank income was £3,569m (2022: £2,913m)
•Private Bank income was £1,190m (2022: £1,014m)
•Payments income was £549m (2022: £572m)
CIB total operating expenses were £8,458m (2022: £8,945m)
CC&P total operating expenses were £3,303m (2022: £3,052m)
Excluding the impact of Q423 structural cost actions and the Over-issuance of Securities in the prior year1:
–Total income increased to £17,918m (2022: £17,575m)
–CIB income decreased 4% to £12,610m (2022: £13,076m)
•Global Markets income decreased 16% to £7,218m against a record prior year comparative2. FICC income decreased 15% to
£4,845m, reflecting lower market volatility and client activity. Equities income decreased 17% to £2,373m, driven by a decline in
derivatives income reflecting less volatile equity market conditions.
•Investment Banking fees decreased 12% to £1,960m due to the reduced fee pool across the industry3. Advisory decreased 23% and
Debt capital markets decreased 10%, while Equity capital markets increased 32%
•Within Corporate, Transaction banking income increased 16% to £2,957m driven by improved deposit margins in the higher interest
rate environment with stable deposit balances. Corporate lending income increased to £475m (2022: £231m loss) mainly driven by
lower costs of hedging and lower fair value losses on leverage finance lending net of mark to market gains on related hedges.
–CC&P income increased 18% to £5,308m.
•International Cards and Consumer Bank income increased 23% to £3,569m reflecting higher cards balances and improved margins,
including the Gap Inc. portfolio acquisition in Q222.
•Private Bank income increased 17% to £1,190m, due to the transfer of WM&I from Barclays UK, client balance growth and improved
deposits margin in the higher rate environment.
•Payments income decreased 4% to £549m driven by margin compression.
Total operating expenses increased 4% to £11,455m
•CIB total operating expenses increased 4% to £8,270m, reflecting investment in talent and technology, and the impact of inflation,
partially offset by the non-repeat of prior year litigation and conduct charges mainly relating to Device Settlements4 and efficiency
savings
•CC&P total operating expenses increased 4% to £3,185m, driven by higher investment spend to support growth, mainly in marketing
and partnership costs, the transfer of WM&I from Barclays UK, and the impact of inflation, partially offset by the non-repeat of prior
year litigation and conduct charges mainly relating to customer remediation costs and efficiency savings
Credit impairment charges were £1,548m (2022: £933m).
•CIB credit impairment charges were £23m (2022: £119m), driven by single name charges, partially offset by the benefit of credit
protection.
•CC&P credit impairment charges increased to £1,525m (2022: £814m), driven by higher delinquencies in US cards, which was
anticipated and led to higher coverage ratios. 30 and 90 day arrears at 2.9% (Q422: 2.2%) and 1.5% (Q422: 1.2%) respectively. The
US cards total coverage ratio was 10.2% (December 2022: 8.1%).
Notes
1The Over-issuance of Securities in the prior year impacted Equities within Global markets, CIB and Barclays International only.
2Period covering 2014-2023. Pre 2014 data was not restated following re-segmentation in 2016.
3Data source: Dealogic for the period covering 1 January to 31 December 2023.
4Refers to the settlements with the SEC and CFTC in connection with their investigations of the use of unauthorised devices for business communications.
| | | | | | | | | |
| Climate and sustainability report | | | | | | | Barclays PLC 2023 Annual Report on Form 20-F | |
| |
| | | | | | | | | |
Analysis of results by business (continued) |
Loans and advances at amortised cost increased £4.6bn to £174.2bn driven by increased investment in debt securities in Treasury. In
addition, there has been balance growth in CC&P which was offset by net loan repayments in CIB and transfer to held for sale of the
German consumer finance business.
•Trading portfolio assets increased £40.8bn to £174.6bn driven by an increase in debt and equity securities as we facilitate client
demand in Global Markets.
•Derivative assets and liabilities decreased £46.5bn and £39.1bn to £255.2bn and £249.8bn respectively reflecting lower market
volatility and a decrease in the forward interest rates.
•Financial assets at fair value through the income statement decreased £6.8bn to £203.7bn driven by increased secured lending which
was more than offset by trade optimisations.
•Deposits at amortised cost increased £10.1bn to £297.7bn driven by increased deposits in CIB.
RWAs increased to £259.1bn (December 2022: £254.8bn) driven by higher CC&P RWAs.
Please refer to the Financial review section in the Annual Report on Form 20-F for the year ended 31 December 2022 for a comparative
discussion of the 2022 financial results compared to 2021.
| | | | | | | | | |
| Climate and sustainability report | | | | | | | Barclays PLC 2023 Annual Report on Form 20-F | |
| |
| | | | | | | | | |
Analysis of results by business (continued) |
Head Office
| | | |
| | | |
| | | |
Income statement information | | | |
| | | |
Net fee, commission and other income | | | |
| | | |
| | | |
| | | |
| | | |
| | | |
Other net (expenses)/income | | | |
| | | |
Credit impairment charges | | | |
| | | |
| | | |
| | | |
Balance sheet information | | | |
| | | |
| | | |
| | | |
| | | |
Number of employees (full time equivalent)1, 2 | | | |
| | | |
| | | |
| | | |
Average allocated tangible equity | | | |
Notes
1Head Office includes employees in Barclays Execution Services.
2Barclays Execution Services Employees are reported within the Head Office Segment. Barclays UK transformed its business in 2021 and consolidated all Customer Care employees,
who directly serve customers, into Barclays Execution Services to improve customer service and experience. Costs are recharged, while FTEs are reported within Head Office, as at 31
December 2021 10,700 FTEs were impacted by the move from Barclays UK to Head Office.
2023 compared to 2022
Loss before tax was £918m (2022: £599m), including £453m Q423 structural cost actions.
Total income was an expense of £127m (2022: £170m) primarily reflecting hedge accounting and treasury items.
Total operating expenses increased to £755m (2022: £406m) primarily driven by £453m of Q423 structural cost actions partially offset
by lower litigation and conduct charges.
•Head Office structural cost actions principally include the software intangibles impairment related to the merchant acquiring
business (c.£260m), and the Canary Wharf office lease exit (c.£140m).
RWAs were £10.2bn (December 2022: £8.6bn) primarily driven by methodology and policy updates, and increases in non-customer
assets.
Please refer to the Financial review section in the Annual Report on Form 20-F for the year ended 31 December 2022 for a comparative
discussion of the 2022 financial results compared to 2021.
| | | | | | | | | |
| Climate and sustainability report | | | | | | | Barclays PLC 2023 Annual Report on Form 20-F | |
| |
| | | | | | | | | |
Analysis of results by business (continued) |
The Group’s management believes that the non-IFRS performance measures included in this document provide valuable information
to the readers of the financial statements as they enable the reader to identify a more consistent basis for comparing the businesses’
performance between financial periods, and provide more detail concerning the elements of performance which the managers of these
businesses are most directly able to influence or are relevant for an assessment of the Group.
They also reflect an important aspect of the way in which operating targets are defined and performance is monitored by management.
However, any non-IFRS performance measures in this document are not a substitute for IFRS measures and readers should consider
the IFRS measures as well.
Margins analysis
| | | | | | | | | |
For the year ended 31 December | | | |
| | | | | | | | |
| | | | | | | | |
| | | | | | | | | |
Corporate and Investment Bank | | | | | | | | | |
Consumer, Cards and Payments | | | | | | | | | |
| | | | | | | | | |
| | | | | | | | | |
| | | | | | | | | |
Total Barclays Group net interest income | | | | | | | | | |
Note
1Other comprises net interest income from Markets within Barclays International and Head Office including hedge accounting.
The Barclays Group NIM has increased 44bps from 3.54% to 3.98% in 2023, driven by the higher interest rate environment and
continued structural hedge income momentum across the Group as well as higher balances in CC&P including the Gap Inc. portfolio
acquisition, partially offset by product dynamics in deposits and mortgages.
The Group’s combined product and equity structural hedge notional as at 31 December 2023 was £246bn (December 2022: £263bn),
with an average duration of close to 2.5 years. Gross structural hedge contributions of £3,623m (2022: £2,196m) and net structural
hedge contributions of £(8,209)m (2022: £(1,544)m) are included in Group net interest income. Gross structural hedge contributions
represent the absolute interest income earned from the fixed receipts on the swaps in the structural hedge, while the net structural
hedge contributions represent the net interest earned on the difference between the structural hedge rate and prevailing floating rates.
| | | | | | | | | |
| Climate and sustainability report | | | | | | | Barclays PLC 2023 Annual Report on Form 20-F | |
| |
| | | | | | | | | |
Non-IFRS performance measures |
Returns
| | | | | | |
| For the year ended 31 December 2023 |
Return on average tangible equity | | Corporate and Investment Bank | Consumer, Cards and Payments | | | |
| | | | | |
Attributable profit/(loss) | | | | | | |
| | | | | | |
| | | | | | |
Average goodwill and intangibles | | | | | | |
| | | | | | |
| | | | | | |
Return on average tangible equity | | | | | | |
| | | | | | |
Barclays Group average tangible shareholder's equity based on a CET1 ratio of 13.5% | | | | | | |
| | | | | | |
| For the year ended 31 December 2022 |
Return on average tangible equity | | Corporate and Investment Bank | Consumer, Cards and Payments | | | |
| | | | | |
Attributable profit/(loss) | | | | | | |
| | | | | | |
| | | | | | |
Average goodwill and intangibles | | | | | | |
| | | | | | |
| | | | | | |
Return on average tangible equity | | | | | | |
| | | | | | |
| For the year ended 31 December 2021 |
Return on average tangible equity | | Corporate and Investment Bank | Consumer, Cards and Payments | | | |
| | | | | |
Attributable profit/(loss) | | | | | | |
| | | | | | |
| | | | | | |
Average goodwill and intangibles | | | | | | |
| | | | | | |
| | | | | | |
Return on average tangible equity | | | | | | |
| | | | | | | | | |
| Climate and sustainability report | | | | | | | Barclays PLC 2023 Annual Report on Form 20-F | |
| |
| | | | | | | | | |
Non-IFRS performance measures (continued) |
Performance measures excluding the impact of Q423 structural cost actions
| | | | | | |
| For the year ended 31 December 2023 |
| | Corporate and Investment Bank | Consumer, Cards and Payments | | | |
| | | | | |
| | | | | | |
Q423 structural cost actions | | | | | | |
Total operating expenses excluding Q423 structural cost actions | | | | | | |
| | | | | | |
| | | | | | |
| | | | | | |
Cost: income ratio excluding Q423 structural cost actions | | | | | | |
| | | | | | |
| | | | | | |
Pre-tax impact of Q423 structural cost actions | | | | | | |
Profit/(loss) before tax excluding Q423 structural cost actions | | | | | | |
| | | | | | |
Attributable profit/(loss) | | | | | | |
Post-tax impact of Q423 structural cost actions | | | | | | |
Attributable profit/(loss) excluding the impact of Q423 structural cost actions | | | | | | |
| | | | | | |
| | | | | | |
| | | | | | |
Return on average tangible equity excluding Q423 structural cost actions | | | | | | |
Performance measures excluding the impact of the Over-issuance of Securities1
| | | |
| For the year ended 31 December 2022 |
| | Impact of the Over-issuance of Securities | Excluding the impact of the Over-issuance of Securities |
| | | |
| | | |
Corporate and Investment Bank | | | |
Consumer, Cards and Payments | | | |
| | | |
| | | |
| | | |
| | | |
Corporate and Investment Bank | | | |
Consumer, Cards and Payments | | | |
| | | |
| | | |
| | | |
| | | |
| | | |
| | | |
| | | |
| | | |
Average tangible shareholders' equity | | | |
Return on average tangible shareholders' equity | | | |
| | | |
Note
1Denotes the Over-issuance of Securities under Barclays Bank PLC's US shelf registration statements on Form F-3 filed with the SEC in 2018 and 2019. The Over-issuance of Securities
in 2022 impacts Equities within Global markets, CIB and Barclays International only
| | | | | | | | | |
| Climate and sustainability report | | | | | | | Barclays PLC 2023 Annual Report on Form 20-F | |
| |
| | | | | | | | | |
Non-IFRS performance measures (continued) |
Group operating expenses excluding litigation and conduct charges
| | |
| | |
| | |
Total operating expenses excluding litigation and conduct charges | | |
| | |
| | |
Reconciliation of financial results excluding adjusting items1
| | | | | | | | | |
| For the year ended 31 December 2023 | | For the year ended 31 December 2022 | | |
| | | Excluding adjusting items | | | | Excluding adjusting items | | |
| | | | | | | | | |
| | | | | | | | | |
Corporate and Investment Bank | | | | | | | | | |
| | | | | | | | | |
| | | | | | | | | |
| | | | | | | | | |
| | | | | | | | | |
Consumer, Cards and Payments | | | | | | | | | |
| | | | | | | | | |
| | | | | | | | | |
| | | | | | | | | |
Corporate and Investment Bank | | | | | | | | | |
Consumer, Cards and Payments | | | | | | | | | |
| | | | | | | | | |
Note
1Adjusting items: Q423 structural cost actions in 2023 and impact of Over-issuance of Securities in 2022.
Tangible net asset value per share
| | | |
| | | |
| | | |
Total equity excluding non-controlling interests | | | |
| | | |
Shareholders' equity attributable to ordinary shareholders of the parent | | | |
| | | |
Tangible shareholders’ equity attributable to ordinary shareholders of the parent | | | |
| | | |
| | | |
| | | |
Net asset value per share | | | |
Tangible net asset value per share | | | |
| | | | | | | | | |
| Climate and sustainability report | | | | | | | Barclays PLC 2023 Annual Report on Form 20-F | |
| |
| | | | | | | | | |
Non-IFRS performance measures (continued) |
Return on equity
| | | |
| Profit/(loss) attributable to ordinary equity holders of the parent | | |
| | | |
For the year ended 31 December 2023 | | | |
| | | |
Corporate and Investment Bank | | | |
Consumer, Cards and Payments | | | |
| | | |
| | | |
| | | |
| | | |
For the year ended 31 December 2022 | | | |
| | | |
Corporate and Investment Bank | | | |
Consumer, Cards and Payments | | | |
| | | |
| | | |
| | | |
| | | |
For the year ended 31 December 2021 | | | |
| | | |
Corporate and Investment Bank | | | |
Consumer, Cards and Payments | | | |
| | | |
| | | |
| | | |
| | | | | | | | | |
| Climate and sustainability report | | | | | | | Barclays PLC 2023 Annual Report on Form 20-F | |
| |
| | | | | | | | | |
Non-IFRS performance measures (continued) |
| | | | | |
| | | | | |
| | | | | |
| | | | |
| Detailed analysis of our statutory accounts, independently audited and providing in-depth disclosure on the financial performance of the Group. | | | |
| Barclays has adopted the British Bankers’ Association (BBA) Code for Financial Reporting Disclosure as adopted by UK Finance in 2017 and has prepared the 2023 Annual Report in compliance with the BBA Code. Barclays is committed to continuously reflect the objectives of reporting set out in the BBA Code. | | | |
| | | | | |
| | | | | |
| Consolidated financial statements | | | | |
| | | | | |
| | | | | |
| | | | | |
| | | | | |
| | | | | |
| | | | | |
| Notes to the financial statements | | | | |
| Financial performance and returns | | | | |
| | | | | |
| | | | | |
| | | | | |
| | | | | |
| | | | | |
| | | | | |
| | | | | |
| | | | | |
| | | | | |
| Assets and liabilities held at fair value | | | | |
| | | | | |
| | | | | |
| | | | | |
| | |
| | | | | |
| | | | | |
| | | | | |
| | | | | |
| | | | | | | | | |
| Climate and sustainability report | | | | | | | Barclays PLC 2023 Annual Report on Form 20-F | |
| |
| | | | | | | | | |
Independent Auditor's Report (continued) |
| | | | | |
| | | | | |
| Assets at amortised cost and other investments | | | | |
| | | | | |
| | | | |
| | | | | |
| Accruals, provisions, contingent liabilities and legal proceedings | | | | |
| | | | |
| | | | | |
| | | | | |
| Capital instruments, equity and reserves | | | | |
| | | | |
| | | | | |
| | | | | |
| | | | | |
| | | | | |
| | | | | |
| | | | | |
| | | | | |
| | | | | |
| | | | | |
| | | | | |
| | | | | |
| | | | | |
| | Assets and liabilities included in disposal group classified as held for sale | | | |
| | | | | |
| | | | | |
| | | | | |
| | | | | |
| | | | | | | | | |
| Climate and sustainability report | | | | | | | Barclays PLC 2023 Annual Report on Form 20-F | |
| |
| | | | | | | | | |
Independent Auditor's Report (continued) |
Report of Independent Registered Public Accounting Firm
To the Shareholders and Board of Directors Barclays PLC:
Opinions on the Consolidated Financial Statements and Internal Control Over Financial Reporting
We have audited the accompanying consolidated balance sheets of Barclays PLC and subsidiaries (the Company) as of December 31,
2023 and 2022, the related consolidated income statements, consolidated statements of comprehensive income, consolidated
statements of changes in equity, and consolidated cash flow statements for each of the years in the three-year period ended
December 31, 2023, and the related notes and specific disclosures described in Note 1 of the consolidated financial statements as
being part of the consolidated financial statements (collectively, the consolidated financial statements). We also have audited the
Company’s internal control over financial reporting as of December 31, 2023, based on criteria established in Internal Control –
Integrated Framework (2013) issued by the Committee of Sponsoring Organizations of the Treadway Commission.
In our opinion, the consolidated financial statements referred to above present fairly, in all material respects, the financial position of the
Company as of December 31, 2023 and 2022, and the results of its operations and its cash flows for each of the years in the three-year
period ended December 31, 2023, in conformity with International Financial Reporting Standards, as issued by the International
Accounting Standards Board. Also in our opinion, the Company maintained, in all material respects, effective internal control over
financial reporting as of December 31, 2023 based on criteria established in Internal Control – Integrated Framework (2013) issued by
the Committee of Sponsoring Organizations of the Treadway Commission.
Basis for Opinions
The Company’s management is responsible for these consolidated financial statements, for maintaining effective internal control over
financial reporting, and for its assessment of the effectiveness of internal control over financial reporting, included in the accompanying
Management’s report on internal control over financial reporting. Our responsibility is to express an opinion on the Company’s
consolidated financial statements and an opinion on the Company’s internal control over financial reporting based on our audits. We are
a public accounting firm registered with the Public Company Accounting Oversight Board (United States) (PCAOB) and are required to
be independent with respect to the Company in accordance with the U.S. federal securities laws and the applicable rules and regulations
of the Securities and Exchange Commission and the PCAOB.
We conducted our audits in accordance with the standards of the PCAOB. Those standards require that we plan and perform the audits
to obtain reasonable assurance about whether the consolidated financial statements are free of material misstatement, whether due
to error or fraud, and whether effective internal control over financial reporting was maintained in all material respects.
Our audits of the consolidated financial statements included performing procedures to assess the risks of material misstatement of the
consolidated financial statements, whether due to error or fraud, and performing procedures that respond to those risks. Such
procedures included examining, on a test basis, evidence regarding the amounts and disclosures in the consolidated financial
statements. Our audits also included evaluating the accounting principles used and significant estimates made by management, as well
as evaluating the overall presentation of the consolidated financial statements. Our audit of internal control over financial reporting
included obtaining an understanding of internal control over financial reporting, assessing the risk that a material weakness exists, and
testing and evaluating the design and operating effectiveness of internal control based on the assessed risk. Our audits also included
performing such other procedures as we considered necessary in the circumstances. We believe that our audits provide a reasonable
basis for our opinions.
Definition and Limitations of Internal Control Over Financial Reporting
A company’s internal control over financial reporting is a process designed to provide reasonable assurance regarding the reliability of
financial reporting and the preparation of financial statements for external purposes in accordance with generally accepted accounting
principles. A company’s internal control over financial reporting includes those policies and procedures that (1) pertain to the
maintenance of records that, in reasonable detail, accurately and fairly reflect the transactions and dispositions of the assets of the
company; (2) provide reasonable assurance that transactions are recorded as necessary to permit preparation of financial statements
in accordance with generally accepted accounting principles, and that receipts and expenditures of the company are being made only in
accordance with authorizations of management and directors of the company; and (3) provide reasonable assurance regarding
prevention or timely detection of unauthorized acquisition, use, or disposition of the company’s assets that could have a material effect
on the financial statements.
Because of its inherent limitations, internal control over financial reporting may not prevent or detect misstatements. Also, projections
of any evaluation of effectiveness to future periods are subject to the risk that controls may become inadequate because of changes in
conditions, or that the degree of compliance with the policies or procedures may deteriorate.
Critical Audit Matters
The critical audit matters communicated below are matters arising from the current period audit of the consolidated financial
statements that were communicated or required to be communicated to the audit committee and that: (1) relate to accounts or
disclosures that are material to the consolidated financial statements and (2) involved our especially challenging, subjective, or complex
judgements. The communication of critical audit matters does not alter in any way our opinion on the consolidated financial
statements, taken as a whole, and we are not, by communicating the critical audit matters below, providing separate opinions on the
critical audit matters or on the accounts or disclosures to which they relate.
| | | | | | | | | |
| Climate and sustainability report | | | | | | | Barclays PLC 2023 Annual Report on Form 20-F | |
| |
| | | | | | | | | |
Independent Auditor's Report |
Impairment allowance for loans and advances at amortized cost, including off-balance sheet elements of the allowance
As discussed in note 8 to the consolidated financial statements, and in the Credit risk management (audited) disclosures on pages 219 to 263, the Company’s impairment allowance for loans and advances, including off-balance sheet elements at amortised cost was £6,252m as at 31 December 2023.
We identified the assessment of impairment allowance for loans and advances at amortised cost, including off balance sheet elements
as a critical audit matter. A high degree of audit effort, including specialised skills and knowledge was required because it involved
significant measurement uncertainty. Complex and subjective auditor judgement was required to assess the following:
•Model estimations – Complex and subjective auditor judgement was applied in assessing the Company’s modelled estimations of
Expected Credit Losses (“ECL”) due to the inherently judgemental nature of the underlying models, namely the IFRS 9 Probability of
Default (“PD”) models, the Loss Given Default (“LGD”) models and the Exposure at Default (“EAD”) models, and the associated model
assumptions. Certain IFRS 9 models and model assumptions are the key drivers of complexity and uncertainty, and minor changes to
those models and model assumptions could have a significant effect on the Company’s calculation of the ECL estimate.
•Economic scenarios – Complex and subjective auditor judgement was applied in assessing the forward-looking economic scenarios
used by the Company as an input to calculate ECL, the probability weightings applied to them and the complexity of models used to
derive the probability weightings.
•Qualitative adjustments – Complex and subjective auditor judgement was applied in assessing certain qualitative adjustments to the
model-driven impairment allowance due to the inherent estimation uncertainty associated with these adjustments.
The following are the primary procedures we performed to address this critical audit matter.
•We evaluated the design and tested the operating effectiveness of certain internal controls over the Company’s process for
estimating the impairment allowance for loans and advances at amortised cost, including off-balance sheet elements. This included
controls relating to the (1) application of the staging criteria, (2) model validation, implementation and monitoring, (3) authorisation
and calculation of qualitative adjustments and management overlays, (4) selection and implementation of economic variables and
the controls over the economic scenario selection and probabilities, and (5) credit reviews that determine customer risk ratings used
in the models for a population of wholesale customers.
•We involved credit risk modelling professionals with specialised skills and knowledge, who assisted in the following:
–evaluating the Company’s impairment methodologies for compliance with IFRS 9;
–inspecting model code for the calculation of certain components of the ECL model to assess its consistency with the Company’s
modelling methodology;
–evaluating model changes (including the updated model code) for a selection of models which were changed or updated during the
year as to whether they were appropriate by assessing the updated model methodology against the applicable accounting
standard;
–reperforming the calculation of certain adjustments to assess consistency with the qualitative adjustment methodologies;
–evaluating the model output for a selection of models by inspecting the corresponding model functionality and independently
implementing the model by rebuilding the model code and comparing our independent output with management’s output; and
–reperforming and assessing, for a selection of models, the reasonableness of the model predictions by comparing them against
actual results and evaluating the resulting differences.
•In addition, we involved economic professionals with specialised skills and knowledge, who assisted in:
–assessing the reasonableness of the Company’s methodology and models used for determining the economic scenarios used and
the probability weightings applied to them;
–assessing key economic variables which included comparing a selection of economic variables to external sources; and
–assessing the overall reasonableness of the economic forecasts by comparing the Company’s forecasts to our own modelled
forecasts.
We evaluated the collective results of the procedures performed to assess the sufficiency of the audit evidence obtained related to the
Company’s impairment allowance for loans and advances at amortised cost, including off-balance sheet elements of the allowance.
Valuation of certain Level 3 and Level 2 financial instruments recorded at fair value
As discussed in Note 17 to the Company’s consolidated financial statements, the total balance of financial assets and liabilities
recorded at fair value as at December 31, 2023 was £709,930m and £(606,252)m, respectively. This includes Level 3 assets of
£19,378m and liabilities of £(6,243)m respectively. The Company has Level 2 financial assets at fair value of £559,709m and financial
liabilities at fair value of £(570,537)m. The Company is required to apply valuation techniques which often involve the exercise of
significant judgement and the use of assumptions and valuation models over certain Level 3 and Level 2 financial assets and liabilities.
We identified the valuation of certain Level 3 and Level 2 financial instruments recorded at fair value as a critical audit matter. This is
because there was significant measurement uncertainty associated with the fair value estimates of these instruments and subjective
auditor judgement, including specialised skills and knowledge was required to evaluate pricing data inputs, valuation models and fair
value adjustments (FVA), including portfolio-level FVAs related to credit, collateralisation and funding (commonly referred to as XVAs).
The following are the primary procedures we performed to address this critical audit matter.
•We evaluated the design and tested the operating effectiveness of certain internal controls over the Company’s process to measure
fair value of these portfolios. This included controls related to (1) the independent price verification (IPV) of certain pricing data inputs,
(2) the determination or calculation of FVAs, including exit price adjustments (to mark the portfolio to bid or offer prices), model
| | | | | | | | | |
| Climate and sustainability report | | | | | | | Barclays PLC 2023 Annual Report on Form 20-F | |
| |
| | | | | | | | | |
Independent Auditor's Report (continued) |
shortcoming reserves to address model limitations and XVAs and (3) the validation, completeness, implementation and usage of
valuation models including assessment of the impact of model limitations and assumptions.
•For a selection of collateral disputes identified by management, we challenged management’s valuation where significant fair value
differences were observable through comparison with the market participant’s valuation on the other side of the trade. We also
utilised collateral dispute data to identify fair value financial instruments with significant fair value differences against market
counterparties and selected these to independently reprice.
•We performed a retrospective review by inspecting significant gains and losses on a selection of new fair value instruments, historical
exit prices on similar instruments and restructurings throughout the audit period and evaluated whether these data points indicated
elements of fair value not incorporated into the current valuation methodologies. We also inspected movements in unobservable
inputs throughout the period to challenge whether any gain or loss generated was appropriate.
•We involved valuation professionals with specialised skills and knowledge, who assisted in the following:
–independently re-pricing a selection of fair value financial instruments and challenging management on the valuations where they
were outside our tolerance; and
–challenging the appropriateness of significant models and methodologies used in calculating fair values, risk exposures and in
calculating FVAs and XVAs, including comparison to industry practice.
•We inspected trading revenue arising on level 3 positions to assess whether material gains or losses generated were in line with the
accounting standards.
UK Pension Scheme – Defined Benefit Obligation (DBO) assumptions
As discussed in note 32 to the consolidated financial statements, the total fair value of the Company’s defined benefit obligation as at
31 December 2023 was £21,513m, of which £20,618m was related to the UK Retirement Fund (UKRF). The determination of the
Company’s defined benefit pension obligation with respect to these plans is dependent on certain actuarial assumptions, including the
discount rate, inflation rate (or retail price index) and mortality assumptions.
We identified the valuation of the defined benefit pension obligation in respect of UKRF as a critical audit matter. Subjective and
complex auditor judgement, including specialized skills and knowledge, was required in evaluating the discount rates, retail price index
(RPI) and mortality assumptions used, as small changes would have a significant impact on the measurement of the defined benefit
pension obligation.
The following are the primary procedures we performed to address this critical audit matter:
•we evaluated the design and tested the operating effectiveness of certain internal controls over the Company’s defined benefit
obligation process; this included controls related to management’s review of IAS 19 assumptions including discount rate, RPI and
mortality assumptions, and
•we involved actuarial professionals with specialized skills and knowledge who assisted in assessing the Company’s discount rate, RPI
and mortality assumptions by evaluating those assumptions against expectations derived from external sources.
/s/ KPMG LLP
We have served as the Company’s auditor since 2017.
London, United Kingdom
February 19, 2024
| | | | | | | | | |
| Climate and sustainability report | | | | | | | Barclays PLC 2023 Annual Report on Form 20-F | |
| |
| | | | | | | | | |
Independent Auditor's Report (continued) |
Consolidated income statement
| | | | |
| | | | |
For the year ended 31 December | | | | |
Interest and similar income | | | | |
Interest and similar expense | | | | |
| | | | |
Fee and commission income | | | | |
Fee and commission expense | | | | |
Net fee and commission income | | | | |
| | | | |
Net investment income/(expense) | | | | |
| | | | |
| | | | |
| | | | |
| | | | |
Administration and general expenses | | | | |
| | | | |
| | | | |
Share of post-tax results of associates and joint ventures | | | | |
| | | | |
Credit impairment (charges)/releases | | | | |
| | | | |
| | | | |
| | | | |
| | | | |
| | | | |
Equity holders of the parent | | | | |
Other equity instrument holders | | | | |
Total equity holders of the parent | | | | |
Non-controlling interests | | | | |
| | | | |
| | | | |
| | | | |
Basic earnings per ordinary share | | | | |
Diluted earnings per share | | | | |
| | | | | | | | | |
| Climate and sustainability report | | | | | | | Barclays PLC 2023 Annual Report on Form 20-F | |
| |
| | | | | | | | | |
Consolidated financial statements |
Consolidated statement of comprehensive income
| | | |
| | | |
For the year ended 31 December | | | |
| | | |
| | | |
Other comprehensive income/(loss) that may be recycled to profit or loss: | | | |
Currency translation reserve | | | |
Currency translation differences1 | | | |
| | | |
Fair value through other comprehensive income reserve movements relating to debt securities | | | |
Net gains/(losses) from changes in fair value | | | |
Net (gains)/losses transferred to net profit on disposal | | | |
Net (gains)/losses relating to (releases of) impairment | | | |
Net (losses)/gains due to fair value hedging | | | |
| | | |
Cash flow hedging reserve | | | |
Net gains/(losses) from changes in fair value | | | |
Net losses/(gains) transferred to net profit | | | |
| | | |
Other comprehensive income/(loss) that may be recycled to profit or loss | | | |
| | | |
Other comprehensive income/(loss) not recycled to profit or loss: | | | |
Retirement benefit remeasurements | | | |
Fair value through other comprehensive income reserve movements relating to equity instruments | | | |
| | | |
| | | |
Other comprehensive (loss)/income not recycled to profit or loss | | | |
| | | |
Other comprehensive income/(loss) for the year | | | |
| | | |
Total comprehensive income for the year | | | |
| | | |
| | | |
Equity holders of the parent | | | |
Non-controlling interests | | | |
Total comprehensive income for the year | | | |
Note
1Includes nil gain (2022: £1m gain; 2021: £26m loss ) on recycling of currency translation differences to net profit.
| | | | | | | | | |
| Climate and sustainability report | | | | | | | Barclays PLC 2023 Annual Report on Form 20-F | |
| |
| | | | | | | | | |
Consolidated financial statements (continued) |
Consolidated balance sheet
| | | |
| | | |
| | | |
| | | |
Cash and balances at central banks | | | |
Cash collateral and settlement balances | | | |
Debt securities at amortised cost | | | |
Loans and advances at amortised cost to banks | | | |
Loans and advances at amortised cost to customers | | | |
Reverse repurchase agreements and other similar secured lending at amortised cost | | | |
| | | |
Financial assets at fair value through the income statement | | | |
Derivative financial instruments | | | |
Financial assets at fair value through other comprehensive income | | | |
Investments in associates and joint ventures | | | |
Goodwill and intangible assets | | | |
Property, plant and equipment | | | |
| | | |
| | | |
Retirement benefit assets | | | |
Assets included in disposal group classified as held for sale | | | |
| | | |
| | | |
| | | |
Deposits at amortised cost from banks | | | |
Deposits at amortised cost from customers | | | |
Cash collateral and settlement balances | | | |
Repurchase agreements and other similar secured borrowing at amortised cost | | | |
| | | |
| | | |
Trading portfolio liabilities | | | |
Financial liabilities designated at fair value | | | |
Derivative financial instruments | | | |
| | | |
| | | |
Retirement benefit liabilities | | | |
| | | |
Liabilities included in disposal group classified as held for sale | | | |
| | | |
| | | |
| | | |
Called up share capital and share premium | | | |
| | | |
| | | |
| | | |
Total equity excluding non-controlling interests | | | |
Non-controlling interests | | | |
| | | |
Total liabilities and equity | | | |
The Board of Directors approved the financial statements on pages 325 to 420 on 19 February 2024. Nigel Higgins
Group Chairman
C.S. Venkatakrishnan
Group Chief Executive
Anna Cross
Group Finance Director
| | | | | | | | | |
| Climate and sustainability report | | | | | | | Barclays PLC 2023 Annual Report on Form 20-F | |
| |
| | | | | | | | | |
Consolidated financial statements (continued) |
Consolidated statement of changes in equity
| | | | | | | |
| Called up share capital and share premium1 | Other equity instruments1 | | | Total equity excluding non- controlling interests | Non-controlling interests | |
| | | | | | | |
Balance as at 1 January 2023 | | | | | | | |
| | | | | | | |
Currency translation movements | | | | | | | |
Fair value through other comprehensive income reserve | | | | | | | |
| | | | | | | |
Retirement benefit remeasurements | | | | | | | |
| | | | | | | |
Total comprehensive income for the year | | | | | | | |
Employee share schemes and hedging thereof | | | | | | | |
Issue and redemption of other equity instruments | | | | | | | |
Other equity instruments coupons paid | | | | | | | |
Increase in treasury shares | | | | | | | |
Vesting of shares under employee share schemes | | | | | | | |
| | | | | | | |
| | | | | | | |
| | | | | | | |
Balance as at 31 December 2023 | | | | | | | |
| | | | | | | |
Balance as at 1 January 2022 | | | | | | | |
| | | | | | | |
Currency translation movements | | | | | | | |
Fair value through other comprehensive income reserve | | | | | | | |
| | | | | | | |
Retirement benefit remeasurements | | | | | | | |
| | | | | | | |
Total comprehensive income for the year | | | | | | | |
Employee share schemes and hedging thereof | | | | | | | |
Issue and redemption of other equity instruments | | | | | | | |
Other equity instruments coupons paid | | | | | | | |
| | | | | | | |
Increase in treasury shares | | | | | | | |
Vesting of shares under employee share schemes | | | | | | | |
| | | | | | | |
| | | | | | | |
| | | | | | | |
| | | | | | | |
Balance as at 31 December 2022 | | | | | | | |
Notes
1For further details refer to Note 27.
2For further details refer to Note 28.
| | | | | | | | | |
| Climate and sustainability report | | | | | | | Barclays PLC 2023 Annual Report on Form 20-F | |
| |
| | | | | | | | | |
Consolidated financial statements (continued) |
| | | | | | | |
| Called up share capital and share premium1 | Other equity instruments1 | | | Total equity excluding non- controlling interests | Non-controlling interests | |
| | | | | | | |
Balance as at 1 January 2021 | | | | | | | |
| | | | | | | |
Currency translation movements | | | | | | | |
Fair value through other comprehensive income reserve | | | | | | | |
| | | | | | | |
Retirement benefit remeasurements | | | | | | | |
| | | | | | | |
Total comprehensive income for the year | | | | | | | |
Employee share schemes and hedging thereof | | | | | | | |
Issue and exchange of other equity instruments | | | | | | | |
Other equity instruments coupons paid | | | | | | | |
Increase in treasury shares | | | | | | | |
Vesting of shares under employee share schemes | | | | | | | |
| | | | | | | |
| | | | | | | |
| | | | | | | |
Balance as at 31 December 2021 | | | | | | | |
Notes
1For further details refer to Note 28.
2For further details refer to Note 29.
| | | | | | | | | |
| Climate and sustainability report | | | | | | | Barclays PLC 2023 Annual Report on Form 20-F | |
| |
| | | | | | | | | |
Consolidated financial statements (continued) |
Consolidated cash flow statement
| | | | |
| | | | |
For the year ended 31 December | | | | |
Reconciliation of profit before tax to net cash flows from operating activities: | | | | |
| | | | |
Adjustment for non-cash items: | | | | |
Credit impairment charges/(releases) | | | | |
Depreciation, amortisation and impairment of property, plant, equipment and intangibles | | | | |
Other provisions, including pensions | | | | |
Net loss on disposal of investments and property, plant and equipment | | | | |
Other non-cash movements including exchange rate movements | | | | |
Changes in operating assets and liabilities | | | | |
Net decrease/(increase) in cash collateral and settlement balances | | | | |
Net decrease/(increase) in loans and advances at amortised cost | | | | |
Net (increase)/decrease in reverse repurchase agreements and other similar secured lending | | | | |
Net (decrease)/increase in deposits at amortised cost | | | | |
Net (decrease)/increase in debt securities in issue | | | | |
Net increase/(decrease) in repurchase agreements and other similar secured borrowing | | | | |
Net decrease/(increase) in derivative financial instruments | | | | |
Net (increase)/decrease in trading portfolio assets | | | | |
Net (decrease)/increase in trading portfolio liabilities | | | | |
Net (decrease)/increase in financial assets and liabilities at fair value through the income statement | | | | |
Net increase in other assets | | | | |
Net (decrease)/increase in other liabilities | | | | |
Corporate income tax paid | | | | |
Net cash from operating activities | | | | |
Purchase of debt securities at amortised cost | | | | |
Proceeds from redemption or sale of debt securities at amortised cost | | | | |
Purchase of financial assets at fair value through other comprehensive income | | | | |
Proceeds from sale or redemption of financial assets at fair value through other comprehensive income | | | | |
Purchase of property, plant and equipment and intangibles | | | | |
(Acquisition of business)/Disposal of subsidiary net of cash disposed | | | | |
Other cash flows associated with investing activities | | | | |
Net cash from investing activities | | | | |
Dividends paid and other coupon payments on equity instruments | | | | |
Issuance of subordinated liabilities | | | | |
Redemption of subordinated liabilities | | | | |
Issue of shares and other equity instruments | | | | |
Repurchase of shares and other equity instruments | | | | |
Issuance of debt securities1 | | | | |
Redemption of debt securities1 | | | | |
Net purchase of treasury shares | | | | |
Net cash from financing activities | | | | |
Effect of exchange rates on cash and cash equivalents | | | | |
Net (decrease)/increase in cash and cash equivalents | | | | |
Cash and cash equivalents at beginning of year | | | | |
Cash and cash equivalents at end of year | | | | |
Cash and cash equivalents comprise: | | | | |
Cash and balances at central banks | | | | |
Loans and advances to banks with original maturity less than three months | | | | |
Cash collateral balances with central banks with original maturity less than three months | | | | |
Treasury and other eligible bills with original maturity less than three months | | | | |
Cash and cash equivalents at end of year | | | | |
Note
1Issuance of debt securities and Redemption of debt securities included in financing activities relate to instruments that qualify as eligible liabilities and satisfy regulatory requirements for
MREL instruments which came into effect during 2019. Refer to Note 1, paragraph 4(vi), for further details.
Interest received was £62,298m (2022: £40,975m; 2021: £17,194m) and interest paid was £48,246m (2022: £28,709m; 2021: £8,063m). These amounts include interest paid and received
arising from trading activities. Dividends received were £0m (2022: £31m; 2021: £20m). The Group is required to maintain balances with central banks and other regulatory authorities.
These amounted to £3,758m (2022: £3,457m; 2021: £4,750m) and are included within the Cash and cash equivalents. For the purposes of the cash flow statement, cash comprises cash on
hand and demand deposits and cash equivalents comprise highly liquid investments that are convertible into cash with an insignificant risk of changes in value with original maturities of
three months or less. Repurchase and reverse repurchase agreements are not considered to be part of cash equivalents.
| | | | | | | | | |
| Climate and sustainability report | | | | | | | Barclays PLC 2023 Annual Report on Form 20-F | |
| |
| | | | | | | | | |
Consolidated financial statements (continued) |
| | | | |
Statement of comprehensive income | | | | |
| | | | |
For the year ended 31 December | | | | |
Dividend received from subsidiaries | | | | |
| | | | |
| | | | |
Impairment reversal of investment in subsidiary | | | | |
| | | | |
| | | | |
| | | | |
| | | | |
Other comprehensive income | | | | |
Total comprehensive income | | | | |
Profit after tax attributable to: | | | | |
| | | | |
Other equity instrument holders | | | | |
| | | | |
Total comprehensive income attributable to: | | | | |
| | | | |
Other equity instrument holders | | | | |
Total comprehensive income | | | | |
For the year ended 31 December 2023, profit after tax was £3,766m (2022: £2,163m, 2021: £4,343m) and total comprehensive income
was £3,766m (2022: £2,163m, 2021: £4,343m). The Company has 61 members of staff (2022: 61, 2021: 65).
| | | |
| | | |
| | | |
| | | |
| | | |
Investment in subsidiaries | | | |
Loans and advances to subsidiaries | | | |
Financial assets at fair value through the income statement | | | |
Derivative financial instruments | | | |
| | | |
| | | |
| | | |
Deposits at amortised cost | | | |
| | | |
| | | |
Financial liabilities designated at fair value | | | |
Derivative financial instruments | | | |
| | | |
| | | |
| | | |
| | | |
| | | |
| | | |
| | | |
| | | |
| | | |
Total liabilities and equity | | | |
The financial statements on pages 331 to 333 and the accompanying note on page 416 were approved by the Board of Directors on 19 February 2024 and signed on its behalf by:
Nigel Higgins
Group Chairman
C.S.Venkatakrishnan
Group Chief Executive
Anna Cross
Group Finance Director
| | | | | | | | | |
| Climate and sustainability report | | | | | | | Barclays PLC 2023 Annual Report on Form 20-F | |
| |
| | | | | | | | | |
|
| | | | | |
Statement of changes in equity | | | | | |
| Called up share capital and share premium | | | | |
| | | | | |
Balance as at 1 January 2023 | | | | | |
Profit after tax and other comprehensive income | | | | | |
Issue of shares under employee share schemes | | | | | |
Issue and exchange of other equity instruments | | | | | |
Vesting of shares under employee share schemes | | | | | |
| | | | | |
Other equity instruments coupons paid | | | | | |
| | | | | |
Balance as at 31 December 2023 | | | | | |
Balance as at 1 January 2022 | | | | | |
Profit after tax and other comprehensive income | | | | | |
Issue of shares under employee share schemes | | | | | |
Issue and exchange of other equity instruments | | | | | |
Vesting of shares under employee share schemes | | | | | |
| | | | | |
Other equity instruments coupons paid | | | | | |
| | | | | |
Balance as at 31 December 2022 | | | | | |
| | | | | | |
Statement of changes in equity | | | | | | |
| | Called up share capital and share premium | | | | |
| | | | | | |
Balance as at 1 January 2021 | | | | | | |
Profit after tax and other comprehensive income | | | | | | |
Issue of shares under employee share schemes | | | | | | |
Issue and exchange of other equity instruments | | | | | | |
Vesting of shares under employee share schemes | | | | | | |
| | | | | | |
Other equity instruments coupons paid | | | | | | |
| | | | | | |
| | | | | | |
Balance as at 31 December 2021 | | | | | | |
| | | | | | | | | |
| Climate and sustainability report | | | | | | | Barclays PLC 2023 Annual Report on Form 20-F | |
| |
| | | | | | | | | |
Parent company accounts (continued) |
| | | |
| | | |
| | | |
For the year ended 31 December | | | |
Reconciliation of profit before tax to net cash flows from operating activities: | | | |
| | | |
Adjustment for non-cash items: | | | |
Reversal of impairment of subsidiary | | | |
| | | |
Changes in operating assets and liabilities | | | |
Net cash generated from operating activities | | | |
Net increase in loans and advances to subsidiaries of the parent1 | | | |
Capital contribution to and investment in subsidiary | | | |
Net cash used in investing activities | | | |
Issue of shares and other equity instruments | | | |
Redemption of other equity instruments | | | |
Net increase in debt securities in issue2 | | | |
Proceeds of borrowings and issuance of subordinated debt | | | |
| | | |
| | | |
Coupons paid on other equity instruments | | | |
Net cash (used in)/generated from financing activities | | | |
Net increase in cash equivalents | | | |
Cash equivalents at beginning of year | | | |
Cash equivalents at end of year3 | | | |
| | | |
Net cash generated from operating activities includes: | | | |
| | | |
| | | |
Notes
1Includes financial assets at fair value through the income statement.
2Includes financial liabilities designated at fair value.
3Cash equivalents comprise loans and advances to banks with original maturity of three months or less, contained within loans and advances to subsidiaries.
The Parent company’s principal activity is to hold the investment in its wholly-owned subsidiaries, Barclays Bank PLC, Barclays Bank UK
PLC, Barclays Execution Services Limited and Barclays Principal Investments Limited. Dividends received are treated as operating
income.
| | | | | | | | | |
| Climate and sustainability report | | | | | | | Barclays PLC 2023 Annual Report on Form 20-F | |
| |
| | | | | | | | | |
Parent company accounts (continued) |
This section describes the Group’s material policies and critical accounting estimates that relate to the financial statements and notes
as a whole. If an accounting policy or a critical accounting estimate relates to a particular note, the accounting policy and/or critical
accounting estimate is contained with the relevant note.
1 Material accounting policies
1. Reporting entity
Barclays PLC is a public company limited by shares registered in England under company number 48839, having its registered office at 1
Churchill Place, London, E14 5HP.
These financial statements are prepared for Barclays PLC and its subsidiaries (the Group) under Section 399 of the Companies Act
2006. The Group is a major global financial services provider engaged in retail banking, credit cards, wholesale banking, investment
banking, wealth management and investment management services. In addition, separate financial statements have been presented
for the holding company.
2. Compliance with International Financial Reporting Standards
The consolidated financial statements of the Group, and the separate financial statements of Barclays PLC, have been prepared in
accordance with UK-adopted international accounting standards.
The consolidated financial statements of the Group, and the separate financial statements of Barclays PLC, have also been prepared in
accordance with International Financial Reporting Standards (IFRS) as issued by the International Accounting Standards Board (IASB),
including interpretations issued by the IFRS Interpretations Committee, as there are no applicable differences from IFRS as issued by
the IASB for the periods presented.
The principal accounting policies applied in the preparation of the consolidated and separate financial statements are set out below, and
in the relevant notes to the financial statements. These policies have been consistently applied, with the exception of International Tax
Reform-Pillar Two Model Rules (Amendments to IAS 12), which is effective from 1 January 2023 and applies retrospectively; and the
Disclosure of Accounting Policies (Amendments to IAS 1 and IFRS Practice Statement 2), and Definition of an Accounting Estimate
(Amendments to IAS 8) which were applied from 1 January 2023.
3. Basis of preparation
The consolidated and separate financial statements have been prepared under the historical cost convention modified to include the
fair valuation of investment property, and particular financial instruments, to the extent required or permitted under IFRS as set out in
the relevant accounting policies. These financial statements are stated in millions of Pounds Sterling (£m), the functional currency of
Barclays PLC.
The financial statements have been prepared for Barclays PLC and its subsidiaries (the Group) under Section 399 of the Companies Act
2006 as applicable to companies using IFRS. The financial statements are prepared on a going concern basis, as the Board is satisfied
that the Group and the parent company have the resources to continue in business for a period of at least 12 months from approval of
the financial statements.
In making this assessment, the Board has considered a wide range of information relating to present and future conditions and includes
a review of a working capital report (WCR). The WCR is used by the Board to assess the future performance of the Group and that it has
the resources in place that are required to meet its ongoing regulatory requirements. The assessment is based upon business plans
which contain future projections of profitability taken from the Group’s medium-term plan as well as projections of regulatory capital
requirements and business funding needs. The WCR also includes an assessment of the impact of internally generated stress testing
scenarios on the liquidity and capital requirement forecasts. The stress tests used were based upon an assessment of reasonably
possible downside economic scenarios that the Group could experience.
The WCR showed that the Group had sufficient capital and liquidity in place to support its future business requirements and remained
above its regulatory minimum requirements in the stress scenarios. Accordingly, the Directors concluded that there was a reasonable
expectation that the Group and parent company has adequate resources to continue as a going concern for a period of at least 12
months from the date of approval of the financial statements.
4. Accounting policies
The Group prepares financial statements in accordance with IFRS. The Group’s material accounting policies relating to specific financial
statement items, together with a description of the accounting estimates and judgements that were critical to preparing those items,
are set out under the relevant notes. Accounting policies that affect the financial statements as a whole are set out below.
(i) Consolidation
The consolidated financial statements combine the financial statements of Barclays PLC and all its subsidiaries. Subsidiaries are entities
over which Barclays PLC has control. The Group has control over another entity when the Group has all of the following:
1)power over the relevant activities of the investee, for example through voting or other rights
2)exposure to, or rights to, variable returns from its involvement with the investee, and
3)the ability to affect those returns through its power over the investee.
As the consolidated financial statements include partnerships where the Group member is a partner, advantage has been taken of the
exemption under Regulation 7 of the Partnership (Accounts) Regulations 2008 with regard to preparing and filing of individual
partnership financial statements.
Details of the principal subsidiaries are given in Note 33.
| | | | | | | | | |
| Climate and sustainability report | | | | | | | Barclays PLC 2023 Annual Report on Form 20-F | |
| |
| | | | | | | | | |
Notes to the financial statements |
For the year ended 31 December 2023 |
(ii) Foreign currency translation
Transactions in foreign currencies are translated into Sterling at the rate ruling on the date of the transaction. Foreign currency
monetary balances are translated into Sterling at the period end exchange rates. Exchange gains and losses on such balances are taken
to the income statement.
The Group’s foreign operations (including subsidiaries, joint ventures, associates and branches) based mainly outside the UK may have
different functional currencies. The functional currency of an operation is the currency of the main economy to which it is exposed.
Prior to consolidation (or equity accounting) the assets and liabilities of non-Sterling operations are translated at the period end
exchange rate and items of income, expense and other comprehensive income are translated into Sterling at the rate on the date of
the transactions. Exchange differences arising on the translation of foreign operations are included in currency translation reserves
within equity. These are transferred to the income statement when the Group disposes of the entire interest in a foreign operation,
when partial disposal results in the loss of control of an interest in a subsidiary, when an investment previously accounted for using the
equity method is accounted for as a financial asset, or on the disposal of a foreign operation within a branch.
(iii) Financial assets and liabilities
Recognition
The Group recognises financial assets and liabilities when it becomes a party to the terms of the contract. Trade date or settlement
date accounting is applied depending on the classification of the financial asset.
Classification and measurement
Financial assets are classified on the basis of two criteria:
i)the business model within which financial assets are managed, and
ii)their contractual cash flow characteristics (whether the cash flows represent ‘solely payments of principal and interest’ (SPPI)).
The Group assesses the business model criteria at a portfolio level. Information that is considered in determining the applicable
business model includes (i) policies and objectives for the relevant portfolio, (ii) how the performance and risks of the portfolio are
managed, evaluated and reported to management, and (iii) the frequency, volume and timing of sales in prior periods, sales expectation
for future periods, and the reasons for such sales.
The contractual cash flow characteristics of financial assets are assessed with reference to whether the cash flows represent SPPI.
Terms that could change the contractual cash flows so that it would not meet the condition for SPPI are considered, including: (i)
contingent and leverage features, (ii) non-recourse arrangements, (iii) features that could modify the time value of money, and (iv)
Social, Environmental and Sustainability-linked features. Terms with de-minimis impact do not preclude cash flows from representing
SPPI.
The accounting policy for each type of financial asset or liability is included within the relevant note for the item. The Group’s policies for
determining the fair values of the assets and liabilities are set out in Note 17.
Derecognition
The Group derecognises a financial asset, or a portion of a financial asset, from its balance sheet where (i) the contractual rights to cash
flows from the asset have expired, or (ii) the contractual rights to cash flows from the asset have been transferred (usually by sale) and
with them either (a) substantially all the risks and rewards of the asset have been transferred, or (b) where neither substantially all the
risks and reward have been transferred or retained, where control over the asset has been lost.
Financial liabilities are derecognised when the liability has been settled, has expired or has been extinguished. An exchange of an existing
financial liability for a new liability with the same lender on substantially different terms – generally a difference of 10% or more in the
present value of the cash flows or a substantive qualitative amendment – is accounted for as an extinguishment of the original financial
liability and the recognition of a new financial liability.
It may not be obvious whether substantially all of the risks and rewards of a transferred asset, or portion of an asset, have been
transferred. It is often necessary to perform a quantitative analysis that compares the Group's exposure to variability in asset cash flows
before the transfer with its retained exposure after the transfer. A cash flow analysis of this nature may require judgement. In particular,
it is necessary to estimate the asset’s expected future cash flows as well as potential variability around this expectation. The method of
estimating expected future cash flows depends on the nature of the asset, with market and market-implied data used to the greatest
extent possible. The potential variability around this expectation is typically determined by stressing underlying parameters to create
reasonable alternative upside and downside scenarios. Probabilities are then assigned to each scenario. Stressed parameters may
include default rates, loss severity, or prepayment rates.
Accounting for reverse repurchase and repurchase agreements including other similar lending and borrowing
Reverse repurchase agreements (and stock borrowing or similar transactions) are a form of secured lending whereby the Group
provides a loan or cash collateral in exchange for the transfer of collateral, generally in the form of marketable securities subject to an
agreement to transfer the securities back at a fixed price in the future. Repurchase agreements are where the Group obtains such loans
or cash collateral, in exchange for the transfer of collateral.
The Group purchases (a reverse repurchase agreement) or borrows securities subject to a commitment to resell or return them. The
securities are not included in the balance sheet as the Group does not acquire the risks and rewards of ownership. Consideration paid
(or cash collateral provided) is accounted for as a loan asset at amortised cost, unless it is designated or mandatorily at fair value
through profit and loss.
The Group may also sell (a repurchase agreement) or lend securities subject to a commitment to repurchase or redeem them. The
securities are retained on the balance sheet as the Group retains substantially all the risks and rewards of ownership. Consideration
| | | | | | | | | |
| Climate and sustainability report | | | | | | | Barclays PLC 2023 Annual Report on Form 20-F | |
| |
| | | | | | | | | |
Notes to the financial statements (continued) |
For the year ended 31 December 2023 |
received (or cash collateral provided) is accounted for as a financial liability at amortised cost, unless it is designated at fair value through
profit and loss.
(iv) Issued debt and equity instruments
Issued financial instruments or their components are classified as liabilities if the contractual arrangement results in the Group having an
obligation to either deliver cash or another financial asset, or a variable number of equity shares, to the holder of the instrument. If this is
not the case, the instrument is generally an equity instrument and the proceeds included in equity, net of transaction costs. Dividends
and other returns to equity holders are recognised when paid or declared by the members at the Annual General Meeting and treated
as a deduction from equity.
Where issued financial instruments contain both liability and equity components, these are accounted for separately. The fair value of
the debt is estimated first and the balance of the proceeds is included within equity.
(v) Cash flow statement
Cash comprises cash on hand and balances at central banks. Cash equivalents comprise loans and advances to banks, cash collateral
balances with central banks related to payment schemes and treasury and other eligible bills, all with original maturities of three months
or less.
Investments in debt securities at amortised cost, presented within loans and advances on the balance sheet, are deemed to be
investing activities for the purposes of the cash flow statement, except those instruments considered to be cash equivalents.
Debt securities issued and redeemed are considered to be operating activities, except qualifying eligible liabilities that satisfy regulatory
requirements for MREL instruments (or have previously satisfied these requirements since 2019 when they came into effect), which are
considered to be financing activities.
5. New and amended standards and interpretations
The accounting policies adopted have been consistently applied, with the exception of the following:
International Tax Reform—Pillar Two Model Rules (Amendments to IAS 12)
On 23 May 2023, the IASB issued amendments to IAS 12 to provide a mandatory temporary exemption to the requirements to account
for deferred taxes assets and liabilities related to Pillar Two income taxes, as published by the Organisation for Economic Co-operation
and Development (OECD).
The amendments are effective for accounting periods beginning on or after 1 January 2023 and the mandatory temporary exemption
is applied retrospectively to prior periods.
Disclosures related to the amendments are made in note 9 on page 347. Disclosure of Accounting Policies (Amendments to IAS 1 and IFRS Practice Statement 2)
The amendments require entities to disclose their material rather than their significant accounting policies. The Group adopted the
amendments effective 1 January 2023. Whilst these amendments do not change the Group’s accounting policies, the Group has
reviewed the accounting policy information disclosed in these financial statements against the new requirements.
Under the amendments, accounting policy information is material if, when considered together with other information included in an
entity’s financial statements, it can reasonably be expected to influence decisions that the primary users of general purpose financial
statements make on the basis of those financial statements.
Definition of an Accounting Estimate (Amendments to IAS 8)
Under the new definition, accounting estimates are clarified as monetary amounts in financial statements that are subject to
measurement uncertainty. Where an entity's accounting policy requires an item to be measured at monetary amounts that cannot be
observed directly, it should develop an accounting estimate to achieve this objective. The amendments are effective 1 January 2023
and were adopted on this date.
IFRS 17 – Insurance contracts
In May 2017, the IASB issued IFRS 17 Insurance Contracts, a comprehensive new accounting standard for insurance contracts covering
recognition and measurement, presentation and disclosure. IFRS 17 has replaced IFRS 4 Insurance Contracts that was issued in 2005.
In June 2020, the IASB published amendments to IFRS 17, to include scope exclusion for certain credit card contracts and similar
contracts that provide insurance coverage, the optional scope exclusion for loan contracts that transfer significant insurance risk, and
the clarification that only financial guarantees issued are in scope of IFRS 9.
IFRS 17 applies to all types of insurance contracts (i.e. life, non-life, direct insurance and reinsurance), regardless of the type of entities
that issue them, as well as to certain guarantees and financial instruments with discretionary participation features. A few scope
exceptions apply.
IFRS 17 was effective for accounting periods beginning on or after 1 January 2023 but the impact to the Group is not material.
| | | | | | | | | |
| Climate and sustainability report | | | | | | | Barclays PLC 2023 Annual Report on Form 20-F | |
| |
| | | | | | | | | |
Notes to the financial statements (continued) |
For the year ended 31 December 2023 |
Future accounting developments
The following accounting standards have been issued by the IASB but are not yet effective:
Classification of Liabilities as Current or Non-current (Amendments to IAS 1)
In January 2020 the IASB issued amendments to IAS 1 to clarify the presentation of liabilities in the balance sheet, with an effective date
of 1 January 2024.
The amendments clarify that a liability should be classified as non-current only if the entity has the right to defer settlement of the
liability for at least 12 months after the reporting period, and that (i) the right to defer settlement must exist at the end of the reporting
period and (ii) management’s intentions or expectations about whether it will exercise its right to defer settlement does not affect the
classification. Further clarifications include how lending conditions affect classification and classification of liabilities the entity will or
may settle by issuing its own equity instruments.
In October 2022, the IASB also issued further amendments to IAS 1 to improve the information an entity provides when its right to
defer settlement of a liability for at least 12 months is subject to compliance with covenants, and to respond to stakeholders’ concerns
about the classification of such a liability as current or non-current.
6. Critical accounting estimates and judgements
The preparation of financial statements in accordance with IFRS requires the use of estimates. It also requires management to exercise
judgement in applying the accounting policies. The key areas involving a higher degree of judgement or complexity or areas where
assumptions are significant to the consolidated and individual financial statements are highlighted under the relevant note. Critical
accounting estimates and judgements are disclosed in:
▪Credit impairment charges on page 344 ▪Fair value of financial instruments on page 362 ▪Goodwill and intangible assets on page 379 ▪Pensions and post-retirement benefit obligations on page 398 ▪Provisions including conduct and legal, competition and regulatory matters on page 381. 7. Other disclosures
To improve transparency and ease of reference, by concentrating related information in one place, certain disclosures required under
IFRS have been included within the Risk review section as follows:
▪Treasury and Capital risk – liquidity on page 206 and 267 to 276 ▪Treasury and Capital risk – capital on page 207 and 277 to 283. These disclosures are covered by the Audit opinion (included on pages 322 to 324) where referenced as audited. The information within the Directors Remuneration Report on pages 135 to 155 is also covered by the Audit opinion where referenced
as audited.
| | | | | | | | | |
| Climate and sustainability report | | | | | | | Barclays PLC 2023 Annual Report on Form 20-F | |
| |
| | | | | | | | | |
Notes to the financial statements (continued) |
For the year ended 31 December 2023 |
Financial performance and returns
The notes included in this section focus on the results and performance of the Group. Information on the income generated,
expenditure incurred, segmental performance, tax, earnings per share and dividends are included here. For further detail on
performance, see income statement commentary within Financial Review (unaudited).
2 Segmental reporting
Presentation of segmental reporting
Operating segments are reported in a manner consistent with the internal reporting provided to the Executive Committee, which is
responsible for allocating resources and assessing performance of the operating segments, and has been identified as the chief
operating decision maker. All transactions between business segments are conducted on an arm’s-length basis, with intra-segment
revenue and costs being eliminated in Head Office. Income and expenses directly associated with each segment are included in
determining business segment performance.
The Group is a British universal bank diversified by business, geography and income type, serving consumer and wholesale customers
and clients globally and for segmental reporting purposes it defines its two operating divisions as Barclays UK and Barclays International.
▪Barclays UK consists of our UK Personal Banking, UK Business Banking and Barclaycard Consumer UK businesses. These businesses
are carried on by our UK ring-fenced bank (Barclays Bank UK PLC) and certain other entities within the Group.
▪Barclays International consists of our Corporate and Investment Bank and Consumer, Cards and Payments businesses. These
businesses are carried on by our non ring-fenced bank (Barclays Bank PLC) and its subsidiaries, and certain other entities within the
Group.
The below table also includes Head Office which comprises head office and legacy businesses, as well as the FTEs employed by Barclays
Execution Services.
| | | | | |
Analysis of results by business | |
| | | | | |
| | | | | |
For the year ended 31 December 2023 | | | | | |
| | | | | |
| | | | | |
| | | | | |
| | | | | |
| | | | | |
Other net income/(expenses)1 | | | | | |
Profit/(loss) before impairment | | | | | |
Credit impairment charges | | | | | |
| | | | | |
| | | | | |
| | | | | |
Number of employees (full time equivalent) | | | | | |
Average number of employees (full time equivalent) | | | | | |
Average number of employees (headcount) | | | | | |
Note
1Other net income/(expenses) represents the share of post-tax results of associates and joint ventures, profit on disposal of subsidiaries, associates and joint ventures, and gains on
acquisitions.
| | | | | | | | | |
| Climate and sustainability report | | | | | | | Barclays PLC 2023 Annual Report on Form 20-F | |
| |
| | | | | | | | | |
Notes to the financial statements (continued) |
For the year ended 31 December 2023 |
| | | | |
| | | | |
| | | | |
For the year ended 31 December 2022 | | | | |
| | | | |
| | | | |
| | | | |
| | | | |
| | | | |
Other net income/(expenses)1 | | | | |
Profit/(loss) before impairment | | | | |
Credit impairment charges | | | | |
| | | | |
| | | | |
| | | | |
Number of employees (full time equivalent) | | | | |
Average number of employees (full time equivalent) | | | | |
Average number of employees (headcount) | | | | |
Note
1Other net income represents the share of post-tax results of associates and joint ventures, profit on disposal of subsidiaries, associates and joint ventures, and gains on acquisitions.
| | | | |
| | | | |
| | | | |
For the year ended 31 December 2021 | | | | |
| | | | |
| | | | |
| | | | |
| | | | |
| | | | |
| | | | |
Profit/(loss) before impairment | | | | |
Credit impairment releases | | | | |
| | | | |
| | | | |
| | | | |
Number of employees (full time equivalent)2 | | | | |
Average number of employees (full time equivalent) | | | | |
Average number of employees (headcount) | | | | |
Notes
1Other net income/(expenses) represents the share of post-tax results of associates and joint ventures, profit (or loss) on disposal of subsidiaries, associates and joint ventures, and
gains on acquisitions.
2Barclays Execution Services Employees are reported within the Head Office Segment. Barclays UK transformed its business in 2021 and consolidated all Customer Care employees,
who directly serve customers, into Barclays Execution Services to improve customer service and experience. Costs are recharged, while FTEs are reported within Head Office, as at 31
December 2021 10,700 FTEs were impacted by the move from Barclays UK to Head Office.
Barclays PLC has changed the way that its businesses are being managed and will publish comparative financial information reflecting
these changes to its segmental reporting which are effective from January 2024.
From Q124, the Group will present its financial disclosures through the following new segments:
•Barclays UK
•Barclays UK Corporate Bank
•Barclays Private Bank and Wealth Management
•Barclays Investment Bank
•Barclays US Consumer Bank
The previously reported Head office will additionally include the held for sale German consumer finance business and the merchant
acquiring component on the Payments business both previously reported within Barclays International as part of CC&P.
Considering the revised segmentation in January 2024, our assessment has not led to any further financial impacts. These changes do
not affect legal entities nor do they impact the Group’s previously reported consolidated financials. A copy of the resegmentation
document is available at home.barclays/investor-relations/reports-and-events/financial-results/
| | | | | | | | | |
| Climate and sustainability report | | | | | | | Barclays PLC 2023 Annual Report on Form 20-F | |
| |
| | | | | | | | | |
Notes to the financial statements (continued) |
For the year ended 31 December 2023 |
| | | |
Income by geographic region1 |
| | | |
For the year ended 31 December | | | |
| | | |
| | | |
| | | |
| | | |
| | | |
| | | |
| | | |
Income from individual countries which represent more than 5% of total income1 |
| | | |
For the year ended 31 December | | | |
| | | |
| | | |
Note
1The geographical analysis is based on the location of the office where the transactions are recorded.
3 Net interest income
Accounting for interest income and expenses
Interest income on loans and advances at amortised cost and financial assets at fair value through other comprehensive income, and
interest expense on financial liabilities held at amortised cost, are calculated using the effective interest method which allocates
interest, and direct and incremental fees and costs, over the expected lives of the assets and liabilities.
The effective interest method requires the Group to estimate future cash flows, in some cases based on its experience of customers’
behaviour, considering all contractual terms of the financial instrument, as well as the expected lives of the assets and liabilities.
The Group incurs certain costs to originate credit card balances with the most significant being co-brand partner fees. To the extent
these costs are attributed to customers that continuously carry an outstanding balance (revolvers) and incremental to the origination
of credit card balances, they are capitalised and subsequently included within the calculation of the effective interest rate. They are
amortised to interest income over the period of expected repayment of the originated balance. Costs attributed to customers that
settle their outstanding balances each period (transactors) are deferred on the balance sheet as a cost of obtaining a contract and
amortised to fee and commission expense over the life of the customer relationship (refer to Note 4). There are no other individual
estimates involved in the calculation of effective interest rates that are material to the results or financial position.
| | | |
| | | |
| | | |
Cash and balances at central banks | | | |
Debt securities at amortised cost | | | |
Loans and advances at amortised cost | | | |
Fair value through other comprehensive income | | | |
Negative interest on liabilities | | | |
| | | |
Interest and similar income | | | |
Deposits at amortised cost | | | |
| | | |
| | | |
Negative interest on assets | | | |
| | | |
Interest and similar expense | | | |
| | | |
Notes
1Other interest and similar income includes interest income from cash collaterals and reverse repurchase agreements and other similar secured lending at amortised cost.
2Other interest and similar expense includes interest expense from cash collaterals and repurchase agreements and other similar secured borrowing at amortised cost.
Interest and similar income presented above represents interest revenue calculated using the effective interest method. Costs to
originate credit card balances of £935m (2022: £786m; 2021: £652m) have been amortised to interest and similar income during the
year.
| | | | | | | | | |
| Climate and sustainability report | | | | | | | Barclays PLC 2023 Annual Report on Form 20-F | |
| |
| | | | | | | | | |
Notes to the financial statements (continued) |
For the year ended 31 December 2023 |
4 Net fee and commission income
Accounting for net fee and commission income
The Group recognises fee and commission income charged for services provided by the Group as and when performance obligations
are satisfied, for example, on completion of the underlying transaction. Incremental costs are reported within fee and commission
expense if they are directly attributable to generating identifiable fee and commission income. Where the contractual arrangements
also result in the Group recognising financial instruments in scope of IFRS 9, such financial instruments are initially recognised at fair
value in accordance with IFRS 9 before applying the provisions of IFRS 15.
Fee and commission income is disaggregated below by fee types that reflect the nature of the services offered across the Group and
operating segments, in accordance with IFRS 15. The below table includes a total for fees in scope of IFRS 15. Refer to Note 2 for more
detailed information about operating segments.
| | | | |
| |
| | | | |
| | | | |
| | | | |
| | | | |
| | | | |
| | | | |
Underwriting and syndication | | | | |
| | | | |
Total revenue from contracts with customers | | | | |
Other non-contract fee income | | | | |
Fee and commission income | | | | |
Fee and commission expense | | | | |
Net fee and commission income | | | | |
| | | | |
| |
| | | | |
| | | | |
| | | | |
| | | | |
| | | | |
| | | | |
Underwriting and syndication | | | | |
| | | | |
Total revenue from contracts with customers | | | | |
Other non-contract fee income | | | | |
Fee and commission income | | | | |
Fee and commission expense | | | | |
Net fee and commission income | | | | |
| | | | | | | | | |
| Climate and sustainability report | | | | | | | Barclays PLC 2023 Annual Report on Form 20-F | |
| |
| | | | | | | | | |
Notes to the financial statements (continued) |
For the year ended 31 December 2023 |
Fee types
Transactional
Transactional fees are service charges on deposit accounts, cash management services fees and transactional processing fees. These
include interchange and merchant fee income generated from credit and bank card usage. Transaction and processing fees are
recognised at the point in time the transaction occurs or service is performed. Interchange and merchant fees are recognised upon
settlement of the card transaction payment.
The Group incurs certain card-related costs including those related to cardholder reward programmes and payments to co-brand
partners. Cardholder reward programme costs related to customers that settle their outstanding balance each period (transactors) are
expensed when incurred and presented in fee and commission expense, while costs related to customers that continuously carry an
outstanding balance (revolvers) are included in the effective interest rate of the receivable (refer to Note 3). Payments to partners for
new cardholder account originations related to transactor accounts are deferred as costs to obtain a contract under IFRS 15, while
costs related to revolver accounts are included in the effective interest rate of the receivable (refer to Note 3). Those costs deferred
under IFRS 15 are capitalised and amortised over the estimated life of the customer relationship. Payments to co-brand partners based
on revenue sharing to the extent the revenue share relates to "revolvers" are included in the effective interest rate of the receivable and
to the extent revenue share relates to “transactors” it must be presented in fee and commission expense. Payments based on
profitability are presented in fee and commission expense.
Advisory
Advisory fees are generated from wealth management services and investment banking advisory services related to mergers,
acquisitions and financial restructurings. Wealth management advisory fees are earned over the period the services are provided and
are generally recognised quarterly when the market value of client assets is determined. Investment banking advisory fees are
recognised at the point in time when the services related to the transaction have been completed under the terms of the engagement.
Investment banking advisory costs are recognised as incurred in fee and commission expense if direct and incremental to the advisory
services or are otherwise recognised in operating expenses.
Brokerage and execution
Brokerage and execution fees are earned for executing client transactions with various exchanges and over-the-counter markets and
assisting clients in clearing transactions and facilitating foreign exchange transactions for spot/forward contracts. Brokerage and
execution fees are recognised at the point in time the associated service has been completed which is generally the trade date of the
transaction.
Underwriting and syndication
Underwriting and syndication fees are earned for the distribution of client equity or debt securities and the arrangement and
administration of a loan syndication. This includes commitment fees to provide loan financing. Underwriting fees are generally
recognised on trade date if there is no remaining contingency, such as the transaction being conditional on the closing of an acquisition
or another transaction. Underwriting costs are deferred and recognised in fee and commission expense when the associated
underwriting fees are recorded. Syndication fees are earned for arranging and administering a loan syndication; however, the associated
fee may be subject to variability until the loan has been syndicated to other syndicate members or until other contingencies have been
resolved and therefore the fee revenue is deferred until the uncertainty is resolved.
Included in the underwriting and syndication fees are loan commitment fees, when the drawdown is not probable. Such commitment
fees are recognised over time through to the contractual maturity of the commitment.
Contract assets and contract liabilities
The Group had no material contract assets or contract liabilities as at 31 December 2023 (2022: £nil; 2021: £nil).
Impairment of fee receivables and contract assets
During 2023, there have been no material impairments recognised in relation to fees receivable and contract assets (2022: £nil; 2021:
£nil). Fees in relation to transactional business can be added to outstanding customer balances. These amounts may be subsequently
impaired as part of the overall loans and advances balance.
Remaining performance obligations
The Group applies the practical expedient of IFRS 15 and does not disclose information about remaining performance obligations that
have original expected durations of one year or less or because the Group has a right to consideration that corresponds directly with
the value of the service provided to the client or customer.
Costs incurred in obtaining or fulfilling a contract
The Group expects that incremental costs of obtaining a contract such as success fee and commission fees paid are recoverable and
therefore capitalise such contract costs. Capitalised contract costs net of amortisation as at 31 December 2023 are £217m (2022:
£198m; 2021: £154m).
Capitalised contract costs are amortised over the customer relationship period depending on the transfer of services to which the
asset pertains. In 2023, the amount of amortisation was £55m (2022: £47m; 2021: £36m) and there was no impairment loss recognised
in connection with the capitalised contract costs (2022: £nil; 2021: £nil).
| | | | | | | | | |
| Climate and sustainability report | | | | | | | Barclays PLC 2023 Annual Report on Form 20-F | |
| |
| | | | | | | | | |
Notes to the financial statements (continued) |
For the year ended 31 December 2023 |
5 Net trading income
Accounting for net trading income
Trading positions are held at fair value, and the resulting gains and losses are included in net trading income, together with interest and
dividends arising from long and short positions and funding costs relating to trading activities. Incremental costs are reported within net
trading income if they are directly attributable to generating identifiable trading income.
Income arises from both the sale and purchase of trading positions, margins which are achieved through market-making and customer
business and from changes in fair value caused by movements in interest and exchange rates, equity prices and other market variables.
Gains or losses on non-trading financial instruments designated or mandatorily at fair value with changes in fair value recognised in the
income statement are included in net trading income.
| | | |
| | | |
| | | |
Net gains on financial instruments held for trading | | | |
Net gains on financial instruments designated at fair value | | | |
Net gains on financial instruments mandatorily at fair value | | | |
| | | |
6 Net investment income/(expense)
Accounting for net investment income/(expense)
Dividends are recognised when the right to receive the dividend has been established. Incremental costs are reported within net
investment income if they are directly attributable to generating identifiable investment income. Other accounting policies relating to
net investment income are set out in Note 13 and Note 15.
| | | |
| | | |
| | | |
Net gains/(losses) from financial instruments mandatorily at fair value | | | |
Net gains/(losses) from disposal of debt instruments at fair value through other comprehensive income | | | |
Net (losses)/gains from disposal of financial assets and liabilities measured at amortised cost | | | |
| | | |
Net losses on other investments1 | | | |
Net investment income/(expense) | | | |
Note
1Included within the 2022 balance are losses of £74m on sale arising from disposal of Barclays’ equity stake in Absa Group Limited (Absa) in April 2022 and September 2022.
| | | | | | | | | |
| Climate and sustainability report | | | | | | | Barclays PLC 2023 Annual Report on Form 20-F | |
| |
| | | | | | | | | |
Notes to the financial statements (continued) |
For the year ended 31 December 2023 |
7 Operating expenses
| | | |
| | | |
| | | |
| | | |
| | | |
Depreciation and amortisation | | | |
Impairment of property, equipment and intangible assets1 | | | |
Total infrastructure costs | | | |
Administration and general expenses | | | |
Consultancy, legal and professional fees | | | |
Marketing and advertising | | | |
| | | |
Other administration and general expenses | | | |
Total administration and general expenses | | | |
| | | |
| | | |
| | | |
Notes
1Infrastructure costs & Staff costs included £927m relating to structural cost actions taken in Q4 2023 and £266m taken as a part of real estate review in 2021.
2Includes costs related to the Over-issuance of securities (2022: £966m; 2021: £220m).
For further details on staff costs including accounting policies, refer to Note 30.
8 Credit impairment charges/(releases)
Accounting for the impairment of financial assets
Impairment
The Group is required to recognise expected credit losses (ECLs) based on unbiased forward-looking information for all financial assets
at amortised cost, lease receivables, debt financial assets at fair value through other comprehensive income, loan commitments and
financial guarantee contracts.
At the reporting date, an allowance (or provision for loan commitments and financial guarantees) is required for the 12 month (Stage 1)
ECLs. If the credit risk has significantly increased since initial recognition (Stage 2), or if the financial instrument is credit impaired (Stage
3), an allowance (or provision) should be recognised for the lifetime ECLs.
The measurement of ECL is calculated using three main components: (i) probability of default (PD) (ii) loss given default (LGD) and (iii)
the exposure at default (EAD).
The 12 month and lifetime ECLs are calculated by multiplying the respective PD, LGD and the EAD. The 12 month and lifetime PDs
represent the PD occurring over the next 12 months and the remaining maturity of the instrument respectively. The EAD represents
the expected balance at default, taking into account the repayment of principal and interest from the balance sheet date to the default
event together with any expected drawdowns of committed facilities. The LGD represents expected losses on the EAD given the event
of default, taking into account, among other attributes, the mitigating effect of collateral value at the time it is expected to be realised
and the time value of money.
Expected credit loss measurement is based on the ability of borrowers to make payments as they fall due. The Group also considers
sector-specific risks and whether additional adjustments are required in the measurement of ECL. Credit risk may be impacted by
climate considerations for certain sectors, such as oil and gas.
Determining a significant increase in credit risk since initial recognition:
The Group assesses when a significant increase in credit risk has occurred based on quantitative and qualitative assessments. The
credit risk of an exposure is considered to have significantly increased when:
i) Quantitative test
The annualised lifetime PD has increased by more than an agreed threshold relative to the equivalent at origination.
PD deterioration thresholds are defined as percentage increases, and are set at an origination score band and segment level to ensure
the test appropriately captures significant increases in credit risk at all risk levels. Generally, thresholds are inversely correlated to the
origination PD, i.e. as the origination PD increases, the threshold value reduces.
The assessment of the point at which a PD increase is deemed ‘significant’, is based upon analysis of the portfolio’s risk profile against a
common set of principles and performance metrics (consistent across both retail and wholesale businesses), incorporating expert
credit judgement where appropriate. Application of quantitative PD floors does not represent the use of the low credit risk exemption
as exposures can separately move into Stage 2 via the qualitative route described below.
Wholesale assets apply a 100% increase in PD and 0.2% PD floor to determine a significant increase in credit risk.
Retail assets apply bespoke relative increase and absolute PD thresholds based on product type and origination PD. Thresholds are
subject to maximums defined by Group policy and typically apply minimum relative thresholds of 50-100% and a maximum relative
threshold of 400%.
| | | | | | | | | |
| Climate and sustainability report | | | | | | | Barclays PLC 2023 Annual Report on Form 20-F | |
| |
| | | | | | | | | |
Notes to the financial statements (continued) |
For the year ended 31 December 2023 |
For existing/historical exposures where origination point scores or data are no longer available or do not represent a comparable
estimate of lifetime PD, a proxy origination score is defined, based upon:
•back-population of the approved lifetime PD score either to origination date or, where this is not feasible, as far back as possible
(subject to a data start point no later than 1 January 2015); or
•use of available historical account performance data and other customer information, to derive a comparable ‘proxy’ estimation of
origination PD.
ii) Qualitative test
This is relevant for accounts that meet the portfolio’s ‘high risk’ criteria and are subject to closer credit monitoring.
High risk customers may not be in arrears but either through an event or an observed behaviour exhibit credit distress. The definition
and assessment of high risk includes as wide a range of information as reasonably available, such as industry and Group-wide customer
level data, including but not limited to bureau scores and high consumer indebtedness index, wherever possible or relevant.
Whilst the high risk populations applied for IFRS 9 impairment purposes are aligned with risk management processes, they are also
regularly reviewed and validated to ensure that they capture any incremental segments where there is evidence of credit deterioration.
iii) Backstop criteria
This is relevant for accounts that are more than 30 calendar days past due. The 30 days past due criteria is a backstop rather than a
primary driver of moving exposures into Stage 2.
The criteria for determining a significant increase in credit risk for assets with bullet repayments follows the same principle as all other
assets, i.e. quantitative, qualitative and backstop tests are all applied.
Exposures will move back to Stage 1 once they no longer meet the criteria for a significant increase in credit risk. This means that, at a
minimum all payments must be up-to-date, the PD deterioration test is no longer met, the account is no longer classified as high risk,
and the customer has evidenced an ability to maintain future payments.
Exposures are only removed from Stage 3 and reassigned to Stage 2 once the original default trigger event no longer applies.
Exposures being removed from Stage 3 must no longer qualify as credit impaired, and:
a)the obligor will also have demonstrated consistently good payment behaviour over a 12-month period, by making all consecutive
contractual payments due and, for forborne exposures, the relevant EBA defined probationary period has also been successfully
completed or;
b)(for non-forborne exposures) the performance conditions are defined and approved within an appropriately sanctioned restructure
plan, including 12 months’ payment history have been met.
Management overlays and other exceptions to model outputs are applied only if consistent with the objective of identifying significant
increases in credit risk.
Forward-looking information
The measurement of ECL involves complexity and judgement, including estimation of PD, LGD, a range of unbiased future economic
scenarios, estimation of expected lives (where contractual life is not appropriate), and estimation of EAD and assessing significant
increases in credit risk.
Credit losses are the expected cash shortfalls from what is contractually due over the expected life of the financial instrument,
discounted at the original effective interest rate (EIR). ECLs are the unbiased probability-weighted credit losses determined by
evaluating a range of possible outcomes and considering future economic conditions.
Refer to the Measurement uncertainty and sensitivity analysis section on page 239 for further details. Definition of default, credit impaired assets, write-offs, and interest income recognition
The definition of default for the purpose of determining ECLs, and for internal credit risk management purposes, has been aligned to
the Regulatory Capital CRR Article 178 definition of default, to maintain a consistent approach with IFRS 9 and associated regulatory
guidance. The Regulatory Capital CRR Article 178 definition of default considers indicators that the debtor is unlikely to pay, includes
exposures in forbearance and is no later than when the exposure is more than 90 days past due. When exposures are identified as credit
impaired at the time when they are purchased or originated, interest income is calculated on the carrying value net of the impairment
allowance.
An asset is considered credit impaired when one or more events occur that have a detrimental impact on the estimated future cash
flows of the financial asset. This comprises assets defined as defaulted and other individually assessed exposures where imminent
default or actual loss is identified.
Uncollectable loans are written off against the related allowance for loan impairment on completion of the Group’s internal processes
and when all reasonably expected recoverable amounts have been collected. Subsequent recoveries of amounts previously written off
are credited to the income statement. The timing and extent of write-offs may involve some element of subjective judgement.
Nevertheless, a write-off will often be prompted by a specific event, such as the inception of insolvency proceedings or other formal
recovery action, which makes it possible to establish that some or the entire advance is beyond realistic prospect of recovery.
Accounting for purchased financial guarantee contracts
The Group may enter into a financial guarantee contract which requires the issuer of such contract to reimburse the Group for a loss it
incurs because a specified debtor fails to make payment when due in accordance with the terms of a debt instrument. For these
separate financial guarantee contracts, the Group recognises a reimbursement asset aligned with the recognition of the underlying
| | | | | | | | | |
| Climate and sustainability report | | | | | | | Barclays PLC 2023 Annual Report on Form 20-F | |
| |
| | | | | | | | | |
Notes to the financial statements (continued) |
For the year ended 31 December 2023 |
ECLs, if it is considered virtually certain that a reimbursement would be received if the specified debtor fails to make payment when due
in accordance with the terms of the debt instrument.
Loan modifications and renegotiations that are not credit-impaired
When modification of a loan agreement occurs as a result of commercial restructuring activity rather than due to the credit risk of the
borrower, an assessment must be performed to determine whether the terms of the new agreement are substantially different from
the terms of the existing agreement. This assessment considers both the change in cash flows arising from the modified terms as well
as the change in overall instrument risk profile. In respect of payment holidays granted to borrowers which are not due to forbearance, if
the revised cash flows on a present value basis (based on the original EIR) are not substantially different from the original cash flows, the
loan is not considered to be substantially modified.
Where terms are substantially different, the existing loan will be derecognised and a new loan will be recognised at fair value, with any
difference in valuation recognised immediately within the income statement, subject to observability criteria.
Where terms are not substantially different, the loan carrying value will be adjusted to reflect the present value of modified cash flows
discounted at the original EIR, with any resulting gain or loss recognised immediately within the income statement as a modification gain
or loss.
Expected life
Lifetime ECLs must be measured over the expected life. This is restricted to the maximum contractual life and takes into account
expected prepayment, extension, call and similar options. The exceptions are certain revolving financial instruments, such as credit
cards and bank overdrafts, that include both a drawn and an undrawn component where the entity’s contractual ability to demand
repayment and cancel the undrawn commitment does not limit the entity’s exposure to credit losses to the contractual notice period.
For revolving facilities, expected life is analytically derived to reflect the behavioural life of the asset, i.e. the full period over which the
business expects to be exposed to credit risk. Behavioural life is typically based upon historical analysis of the average time to default,
closure or withdrawal of facility. Where data is insufficient or analysis inconclusive, an additional ‘maturity factor’ may be incorporated to
reflect the full estimated life of the exposures, based upon experienced judgement and/or peer analysis. Potential future modifications
of contracts are not taken into account when determining the expected life or EAD until they occur.
Discounting
ECLs are discounted at the EIR at initial recognition or an approximation thereof and consistent with income recognition. For loan
commitments the EIR is the rate that is expected to apply when the loan is drawn down and a financial asset is recognised. Issued
financial guarantee contracts are discounted at the risk free rate. Lease receivables are discounted at the rate implicit in the lease. For
variable/floating rate financial assets, the spot rate at the reporting date is used and projections of changes in the variable rate over the
expected life are not made to estimate future interest cash flows or for discounting.
Modelling techniques
Currently, Internal Ratings- Based models are leveraged to calculate the point-in-time PD and LGD, which serve as key inputs to the
IFRS 9 models. Thereafter, these inputs are extrapolated by the IFRS 9 models to create macroeconomic sensitive forecast of PDs,
LGDs and in turn ECL.
Forbearance
A financial asset is subject to forbearance when it is modified due to the credit distress of the borrower. A modification made to the
terms of an asset due to forbearance will typically be assessed as a non-substantial modification that does not result in derecognition of
the original loan, except in circumstances where debt is exchanged for equity.
Both performing and non-performing forbearance assets are classified as Stage 3 except where it is established that the concession
granted has not resulted in diminished financial obligation and that no other regulatory definition of default criteria have been triggered,
in which case the asset is classified as Stage 2. The minimum probationary period for non-performing forbearance is 12 months and for
performing forbearance, 24 months. Hence, a minimum of 36 months is required for non-performing forbearance to move out of a
forborne state.
No financial instrument in forbearance can transfer back to Stage 1 until all of the Stage 2 thresholds are no longer met and can only
move out of Stage 3 when no longer credit impaired.
Critical accounting estimates and judgements
IFRS 9 impairment involves several important areas of judgement, including estimating forward-looking modelled parameters (PD, LGD
and EAD), developing a range of unbiased future economic scenarios, estimating expected lives and assessing significant increases in
credit risk, based on the Group’s experience of managing credit risk. The determination of expected life is most material for Barclays'
credit card portfolios which is obtained via behavioural life analysis to materially capture the risk of these facilities.
Within the retail and small businesses portfolios, which comprise large numbers of small homogenous assets with similar risk characteristics
where credit scoring techniques are generally used, the impairment allowance is calculated using forward-looking modelled parameters which
are typically run at account level. There are many models in use, each tailored to a product, line of business or customer category. Judgement
and knowledge is needed in selecting the statistical methods to use when the models are developed or revised. Management adjustments to
impairment models, which contain an element of subjectivity, are applied in order to factor in certain conditions or changes in policy that are not
fully incorporated into the impairment models, or to reflect additional facts and circumstances at the period end. Management adjustments are
reviewed and incorporated into future model development where appropriate.
| | | | | | | | | |
| Climate and sustainability report | | | | | | | Barclays PLC 2023 Annual Report on Form 20-F | |
| |
| | | | | | | | | |
Notes to the financial statements (continued) |
For the year ended 31 December 2023 |
For individually significant assets in Stage 3, impairment allowances are calculated on an individual basis and all relevant considerations that have
a bearing on the expected future cash flows across a range of economic scenarios are taken into account. These considerations can be
particularly subjective and can include the business prospects for the customer, the realisable value of collateral, the Group’s position relative to
other claimants, the reliability of customer information and the likely cost and duration of the work-out process. The level of the impairment
allowance is the difference between the value of the discounted expected future cash flows (discounted at the loan’s original effective interest
rate), and its carrying amount. Furthermore, judgements change with time as new information becomes available or as work-out strategies
evolve, resulting in frequent revisions to the impairment allowance as individual decisions are taken. Changes in these estimates would result in a
change in the allowances and have a direct impact on the impairment charge.
Further information on impairment allowances, impairment charges, management adjustments to models for impairment, measurement
uncertainty, sensitivity analysis and related credit information is set out within the Credit risk performance section.
Temporary adjustments to calculated IFRS9 impairment allowances may be applied in limited circumstances to account for situations where
known or expected risk factors or information have not been considered in the ECL assessment or modelling process. For further information
please see page 235 in the Credit risk performance section. Information about the potential impact of the physical and transition risks of climate change on borrowers is considered, taking into account
reasonable and supportable information to make accounting judgements and estimates. Climate change is inherently of a long-term nature,
with significant levels of uncertainty, and consequently requires judgement in determining the possible impact in the next financial year, if any.
| | | | | | | | | |
| | | |
| Impairment charges / (releases) | Recoveries and reimbursements1 | | Impairment charges / (releases) | Recoveries and reimbursements1 | | Impairment charges / (releases) | Recoveries and reimbursements1 | |
| | | | | | | | | |
Loans and advances at amortised cost3 | | | | | | | | | |
Off-balance sheet loan commitments and financial guarantee contracts | | | | | | | | | |
| | | | | | | | | |
Cash collateral and settlement balances | | | | | | | | | |
Financial instruments at fair value through other comprehensive income | | | | | | | | | |
Other financial asset measured at cost | | | | | | | | | |
Credit impairment charges /(releases) | | | | | | | | | |
Notes
1Recoveries and reimbursements includes £29m (2022: £199m, 2021: £(306)m) for reimbursements expected to be received under the arrangement where Group has entered into
financial guarantee contracts which provide credit protection over certain assets with third parties and cash recoveries of previously written off amounts of £44m (2022: £64m, 2021:
£66m).
2Includes net impairment charges of £19m relating to the German consumer finance portfolio classified as assets held for sale during the year.
3Includes Debt securities at amortised cost.
Write-offs that can be subjected to enforcement activity
The contractual amount outstanding on financial assets that were written off during the year and that can still be subjected to
enforcement activity is £597m (2022: £949m). This is lower than the write-offs presented in the movement in gross exposures and
impairment allowance table due to assets sold during the year post write-offs and post write-off recoveries.
Modification of financial assets
Financial assets of £2,690m (2022: £2,412m, 2021: £3,446m), with a loss allowance measured at an amount equal to lifetime ECL, were
subject to non-substantial modification during the year, with a resulting loss of £4m (2022: £4m, 2021: £11m). The gross carrying
amount of financial assets subject to non-substantial modification for which the loss allowance has changed to a 12 month ECL during
the year amounts to £149m (2022: £1,077m, 2021: £419m).
9 Tax
Accounting for income taxes
The Group applies IAS 12 Income Taxes in accounting for taxes on income. Income tax payable on taxable profits (current tax) is
recognised as an expense in the periods in which the profits arise. Withholding taxes are also treated as income taxes. Income tax
recoverable on tax allowable losses is recognised as a current tax asset only to the extent that it is regarded as recoverable by offsetting
against taxable profits arising in the current or prior periods. Current tax is measured using tax rates and tax laws that have been
enacted or substantively enacted at the balance sheet date.
Deferred tax assets are recognised to the extent that it is probable that taxable profit will be available against which the deductible
temporary differences, and the carry forward of unused tax credits and unused tax losses can be utilised. Deferred tax liabilities are
recognised for all taxable temporary differences except for the initial recognition of goodwill. Deferred tax is not recognised where the
temporary difference arises from the initial recognition of an asset or liability in a transaction that is not a business combination and, at
the time of the transaction, affects neither the accounting profit nor taxable profit or loss. Deferred tax is determined using tax rates
and legislation enacted or substantively enacted by the balance sheet date which are expected to apply when the deferred tax asset is
| | | | | | | | | |
| Climate and sustainability report | | | | | | | Barclays PLC 2023 Annual Report on Form 20-F | |
| |
| | | | | | | | | |
Notes to the financial statements (continued) |
For the year ended 31 December 2023 |
realised or the deferred tax liability is settled. Deferred tax assets and liabilities are only offset when there is both a legal right to set-off
and an intention to settle on a net basis.
The Group considers an uncertain tax position to exist when it considers that ultimately, in the future, the amount of profit subject to
tax may be greater than the amount initially reflected in the Group’s tax returns. The Group accounts for provisions in respect of
uncertain tax positions in two different ways.
A current tax provision is recognised when it is considered probable that the outcome of a review by a tax authority of an uncertain tax
position will alter the amount of cash tax due to, or from, a tax authority in the future. From recognition, the current tax provision is then
measured at the amount the Group ultimately expects to pay the tax authority to resolve the position. The accrual of interest and
penalty amounts in respect of uncertain income tax positions is recognised as an expense within profit before tax.
Deferred tax provisions are adjustments made to the carrying value of deferred tax assets in respect of uncertain tax positions. A
deferred tax provision is recognised when it is considered probable that the outcome of a review by a tax authority of an uncertain tax
position will result in a reduction in the carrying value of the deferred tax asset. From recognition of a provision, measurement of the
underlying deferred tax asset is adjusted to take into account the expected impact of resolving the uncertain tax position on the loss or
temporary difference giving rise to the deferred tax asset.
The approach taken to measurement takes account of whether the uncertain tax position is a discrete position that will be reviewed by
the tax authority in isolation from any other position, or one of a number of issues which are expected to be reviewed together
concurrently and resolved simultaneously with a tax authority. The Group’s measurement of provisions is based upon its best estimate
of the additional profit that will become subject to tax. For a discrete position, consideration is given only to the merits of that position.
Where a number of issues are expected to be reviewed and resolved together, the Group will take into account not only the merits of its
position in respect of each particular issue but also the overall level of provision relative to the aggregate of the uncertain tax positions
across all the issues that are expected to be resolved at the same time. In addition, in assessing provision levels, it is assumed that tax
authorities will review uncertain tax positions and that all facts will be fully and transparently disclosed.
Critical accounting estimates and judgements
There are two key areas of judgement that impact the reported tax position. Firstly, the level of provisioning for uncertain tax positions;
and secondly, the recognition and measurement of deferred tax assets.
The Group does not consider there to be a significant risk of a material adjustment to the carrying amount of current and deferred tax
balances, including provisions for uncertain tax positions in the next financial year. The provisions for uncertain tax positions cover a
diverse range of issues and reflect advice from external counsel where relevant. It should be noted that only a proportion of the total
uncertain tax positions will be under audit at any point in time, and could therefore be subject to challenge by a tax authority over the
next year.
Deferred tax assets have been recognised based on business profit forecasts which included consideration for the current view of
climate impacts. Details on the recognition of deferred tax assets are provided in this note.
| | | |
| | | |
| | | |
Current tax charge/(credit) | | | |
| | | |
Adjustments in respect of prior years | | | |
| | | |
Deferred tax (credit)/charge | | | |
| | | |
Adjustments in respect of prior years | | | |
| | | |
| | | |
| | | | | | | | | |
| Climate and sustainability report | | | | | | | Barclays PLC 2023 Annual Report on Form 20-F | |
| |
| | | | | | | | | |
Notes to the financial statements (continued) |
For the year ended 31 December 2023 |
The table below shows the reconciliation between the actual tax charge and the tax charge that would result from applying the standard
UK corporation tax rate to the Group’s profit before tax.
| | | | | | |
| | | | | | |
| | | | | | |
| | | | | | |
Tax charge based on the applicable UK corporation tax rate of 23.5% (2022: 19%; 2021: 19% ) | | | | | | |
Impact of profits/losses earned in territories with different statutory rates to the UK (weighted average tax rate is 23.6% (2022: 21.4%; 2021: 22.4% )) | | | | | | |
| | | | | | |
| | | | | | |
Non-creditable taxes including withholding taxes | | | | | | |
| | | | | | |
Impact of UK bank levy being non-deductible | | | | | | |
Banking surcharge1 and other items | | | | | | |
Impact of Barclays Bank PLC's overseas branches being taxed both locally and in the UK | | | | | | |
Tax adjustments in respect of share-based payments | | | | | | |
Adjustments in respect of prior years | | | | | | |
Changes in recognition of deferred tax and effect of unrecognised tax losses | | | | | | |
Non-taxable gains and income | | | | | | |
Tax relief on holdings of inflation-linked government bonds | | | | | | |
Tax relief on payments made under AT1 instruments | | | | | | |
| | | | | | |
| | | | | | |
Remeasurement of UK deferred tax assets due to tax rate changes | | | | | | |
Non-deductible provisions for investigations and litigation | | | | | | |
Non-deductible provisions for UK customer redress | | | | | | |
| | | | | | |
Note
1Banking surcharge includes the impact of the 4.25% UK banking surcharge rate on profits/losses and tax adjustments relating to UK banking entities.
| | | | | | | | | |
| Climate and sustainability report | | | | | | | Barclays PLC 2023 Annual Report on Form 20-F | |
| |
| | | | | | | | | |
Notes to the financial statements (continued) |
For the year ended 31 December 2023 |
Factors influencing the effective tax rate
As a result of the increase in the UK corporation tax rate from 19% to 25% from 1 April 2023, the applicable UK corporation tax rate for
the year ended 31 December 2023 is 23.5%. In addition, the banking surcharge rate reduced from 8% to 3% from 1 April 2023 resulting
in a total tax rate applicable to banks’ UK profits of 27.75% for the year ended 31 December 2023.
The effective tax rate of 18.8% is lower than the applicable UK corporation tax rate of 23.5% primarily due to tax relief on payments
made under AT1 instruments and tax relief on holdings of inflation-linked government bonds. These factors, which have each
decreased the effective tax rate, are partially offset by non-creditable taxes including withholding taxes.
Factors that may influence the effective tax rate in future periods
The Group’s future tax charge will be sensitive to the geographic mix of profits earned, the tax rates in force and changes to the tax
rules in the jurisdictions that the Group operates in.
Tax law is, at times, complex, and it is the role of courts and tribunals to act as the final authority on the correct interpretation of tax law.
In October 2023, a First-tier Tax Tribunal hearing took place between Barclays Bank PLC and HM Revenue & Customs in respect of the
UK corporation tax treatment of an element of the finance costs associated with reserve capital instruments issued as part of the
capital raising announced by Barclays in October 2008, which have since been redeemed. The maximum additional tax liability that could
arise under the dispute is £215m and a provision of £106m is carried in respect of this uncertainty. The judgement is expected to be
received in early 2024.
The OECD and G20 Inclusive Framework on Base Erosion and Profit Shifting announced plans under the Pillar Two Framework to
introduce a global minimum tax rate of 15% and the OECD issued model rules in 2021. Further OECD guidance has been released
during 2022 and 2023 and the UK Government enacted legislation on 11 July 2023 to implement the global minimum tax rules and a UK
domestic minimum tax. The UK’s Pillar Two rules apply for accounting periods beginning on or after 31 December 2023 and will apply in
respect of profits for every jurisdiction where the Group operates.
Additionally, the Group may be subject to Qualifying Domestic Minimum Top-up Taxes (QDMTTs) under the Pillar Two rules
implemented in its operating jurisdictions. The application of QDMTT rules should not affect the overall impact of any additional taxes
resulting from the Pillar Two regime on the Group’s tax charge, as any taxes paid under a local QDMTT would be expected to result in a
reduction in any top-up tax being payable in the UK.
The Group has adopted the International Tax Reform - Pillar Two Model Rules amendments to IAS 12, which were issued on 23 May
2023 and approved by the UK Endorsement Board on 19 July 2023, and has applied the exception set out in paragraph 4A in respect of
recognising and disclosing information about deferred tax assets and liabilities related to Pillar Two income taxes.
The Group has reviewed the published UK legislation alongside the OECD model rules and guidance and has performed an assessment
of the expected impact of the new regime. Additional taxes resulting from the implementation of Pillar Two are expected to arise from 1
January 2024 in respect of a limited number of jurisdictions in which the Group operates, principally in the Isle of Man, Jersey, Guernsey,
and Ireland, by virtue of their low statutory tax rates. However, these additional taxes are not expected to significantly increase the
Group's future tax charge based on an estimated impact of c.£20m per annum, with actual future liabilities being dependent on levels of
profits in particular jurisdictions. The Group will continue to review further guidance due to be released by the OECD and governments
implementing this new tax regime to assess the potential impact.
In the USA, the corporate alternative minimum tax on adjusted financial statements income introduced by the Inflation Reduction Act
became effective on 1 January 2023. The Group will continue to review the regulations and guidance as they are issued. However, the
Group’s tax liability was not increased as a result of the corporate alternative minimum tax in 2023 and it is not expected that it will
materially increase the Group’s future effective tax rate.
Tax in the consolidated statement of comprehensive income
The tax relating to each component of other comprehensive income can be found in the consolidated statement of comprehensive
income.
Tax included directly in equity
Tax included directly in equity comprises a £9m credit (2022: £1m) relating to share-based payments and deductible costs on issuing
other equity instruments.
Deferred tax assets and liabilities
The deferred tax amounts on the balance sheet were as follows:
| | |
| | |
| | |
| | |
US Intermediate Holding Company Tax Group ('IHC Tax Group') | | |
Barclays Bank PLC's US Branch Tax Group | | |
Other (outside the UK and US tax groups) | | |
| | |
| | |
| | |
| | | | | | | | | |
| Climate and sustainability report | | | | | | | Barclays PLC 2023 Annual Report on Form 20-F | |
| |
| | | | | | | | | |
Notes to the financial statements (continued) |
For the year ended 31 December 2023 |
US deferred tax assets in the IHC and US Branch Tax Groups
The deferred tax asset in the IHC Tax Group of £973m (2022: £1,094m) includes £35m (2022: £21m) relating to tax losses, with the
balance relating to temporary differences. The deferred tax asset in Barclays Bank PLC’s US Branch Tax Group of £386m (2022:
£482m) relates entirely to temporary differences.
In relation to the IHC Tax Group, these temporary differences include £387m (2022: £434m) arising from New York State and City prior
net operating loss conversion which can be carried forward and will expire in 2034. Business profit forecasts indicate that all of the New
York State attributable amounts will be utilised prior to expiry and that £38m of the New York City attributable amounts previously
recognised will not be utilised prior to expiry. Accordingly, in the current period the deferred tax asset recognised has been reduced by
£38m.
UK Tax Group deferred tax asset
The deferred tax asset in the UK Tax Group of £4,081m (2022: £4,925m) includes £1,566m (2022: £1,535m) relating to tax losses, with
the balance relating to temporary differences. There is no time limit on utilisation of UK tax losses and business profit forecasts indicate
that these losses will be fully recovered.
Other deferred tax assets (outside the UK and US tax groups)
The deferred tax asset of £520m (2022: £490m) in other entities within the Group includes £147m (2022: £90m) relating to tax losses.
These deferred tax assets relate to a number of different territories and their recognition is based on profit forecasts or local country
law which indicate that it is probable that those deferred tax assets will be fully recovered.
Of the deferred tax asset of £520m (2022: £490m), an amount of £20m (2022: £33m) relates to entities which have suffered a loss in
either the current or prior year and for which the utilisation of the deferred tax is dependent on future taxable profits. This has been
taken into account in reaching the above conclusion that these deferred tax assets will be fully recovered in the future.
The table below shows movements on deferred tax assets and liabilities during the year. The amounts are different from those
disclosed on the balance sheet and in the preceding table as they are presented before offsetting asset and liability balances where
there is a legal right to set-off and an intention to settle on a net basis.
| | | | | | | | | | |
| Fixed asset timing differences | Fair value through other comprehensive income | | Retirement benefit obligations | Loan impairment allowance | | Share-based payments and deferred compensation | Other temporary differences | Tax losses carried forward | |
| | | | | | | | | | |
| | | | | | | | | | |
| | | | | | | | | | |
| | | | | | | | | | |
| | | | | | | | | | |
Other comprehensive income and reserves | | | | | | | | | | |
| | | | | | | | | | |
| | | | | | | | | | |
| | | | | | | | | | |
| | | | | | | | | | |
| | | | | | | | | | |
| | | | | | | | | | |
| | | | | | | | | | |
| | | | | | | | | | |
| | | | | | | | | | |
| | | | | | | | | | |
Other comprehensive income and reserves | | | | | | | | | | |
| | | | | | | | | | |
| | | | | | | | | | |
| | | | | | | | | | |
| | | | | | | | | | |
| | | | | | | | | | |
Other movements include the impact of changes in foreign exchange rates as well as deferred tax amounts relating to acquisitions and
disposals.
The amount of deferred tax assets expected to be recovered after more than 12 months is £5,325m (2022: £8,155m). The amount of
deferred tax liability expected to be settled after more than 12 months is £1,173m (2022: £1,864m). These amounts are before
offsetting asset and liability balances where there is a legal right to set-off and an intention to settle on a net basis.
| | | | | | | | | |
| Climate and sustainability report | | | | | | | Barclays PLC 2023 Annual Report on Form 20-F | |
| |
| | | | | | | | | |
Notes to the financial statements (continued) |
For the year ended 31 December 2023 |
Unrecognised deferred tax
Tax losses and temporary differences
Deferred tax assets have not been recognised in respect of gross deductible temporary differences of £527m (2022: £111m), unused
tax credits of £381m (2022: £323m), and gross tax losses of £21,681m (2022: £22,537m). The tax losses include capital losses of
£3,965m (2022: £3,935m). Of these tax losses, £79m (2022: £149m) expire within five years, £13m (2022: £401m) expire within six to
ten years, £10,504m (2022: £10,393m) expire within eleven to twenty years and £11,085m (2022: £11,594m) can be carried forward
indefinitely. Deferred tax assets have not been recognised in respect of these items because it is not probable that future taxable
profits and gains will be available against which they can be utilised.
Group investments in subsidiaries, branches and associates
Deferred tax is not recognised in respect of the value of the Group's investments in subsidiaries, branches and associates where the
Group is able to control the timing of the reversal of the temporary differences and it is probable that such differences will not reverse in
the foreseeable future. The aggregate amount of these temporary differences for which deferred tax liabilities have not been
recognised was £873m (2022: £852m).
10 Earnings per share
| | | |
| | | |
| | | |
Profit attributable to ordinary equity holders of the parent | | | |
| | | |
| | | |
| | | |
Basic weighted average number of shares in issue | | | |
Number of potential ordinary shares | | | |
Diluted weighted average number of shares | | | |
| | | | | | |
| | Diluted earnings per share |
| | | | | | |
| | | | | | |
Earnings per ordinary share | | | | | | |
The calculation of basic earnings per share is based on the profit attributable to equity holders of the parent and the basic weighted
average number of shares excluding treasury shares held in employee benefit trusts or held for trading. When calculating the diluted
earnings per share, the weighted average number of shares in issue is adjusted for the effects of all expected dilutive potential ordinary
shares held in respect of Barclays PLC, totalling 450m (2022: 534m, 2021: 435m) shares. The number of share options outstanding,
under schemes that were considered to be potentially dilutive was 750m (2022: 789m, 2021: 688m) in total. These options have strike
prices ranging from £0.83 to £1.51.
Of the total number of employee share options and share awards at 31 December 2023, 39m (2022: 27m, 2021: 5m) were anti-dilutive.
The 888m decrease (2022: 652m decrease, 2021: 315m decrease) in the basic weighted average number of shares is primarily due to
the impact of the share buy-back programmes completed each year.
11 Dividends on ordinary shares
The Directors have approved a total dividend in respect of 2023 of 8.00p per ordinary share of 25p each. The full year dividend for 2023
of 5.30p per ordinary share will be paid on 3 April 2024 to shareholders on the Share Register on 1 March 2024. On 31 December 2023,
there were 15,155m ordinary shares in issue. The financial statements for the year ended 31 December 2023 do not reflect this
dividend, which will be accounted for in shareholders’ equity as an appropriation of retained profits in the year ending 31 December
2024.
The Directors have confirmed their intention to initiate a share buyback of up to £1bn after the balance sheet date. The proposed
share buyback is expected to commence in the first quarter of 2024. The financial statements for the year ended 31 December 2023
do not reflect the impact of the proposed share buyback, which will be accounted for as and when shares are repurchased by the
Company.
The 2023 financial statements include the 2023 interim dividend of £417m (2022: £364m, 2021: £339m); a full year dividend declared in
relation to 2022 of £793m (2021: £664m, 2020: £173m) and two share buyback programmes totalling £1,250m (2022: £1,500m, 2021:
£1,200m). Dividends and share buybacks are funded out of distributable reserves.
| | | | | | | | | |
| Climate and sustainability report | | | | | | | Barclays PLC 2023 Annual Report on Form 20-F | |
| |
| | | | | | | | | |
Notes to the financial statements (continued) |
For the year ended 31 December 2023 |
Assets and liabilities held at fair value
The notes included in this section focus on assets and liabilities the Group holds and recognises at fair value. Detail regarding the
Group’s approach to managing market risk can be found in the Market risk management section.
12 Trading portfolio
Accounting for trading portfolio assets and liabilities
All assets and liabilities held for trading purposes are held at fair value with gains and losses in the changes in fair value taken to the
income statement in net trading income (Note 5).
| | | | |
| | Trading portfolio liabilities |
| | | | |
| | | | |
Debt securities and other eligible bills | | | | |
| | | | |
| | | | |
| | | | |
Trading portfolio assets/(liabilities) | | | | |
13 Financial assets at fair value through the income statement
Accounting for financial assets designated at fair value
Financial assets, other than those held for trading, are classified in this category if they are so irrevocably designated at inception and
the use of the designation removes or significantly reduces an accounting mismatch.
Subsequent changes in fair value for these instruments are recognised in the income statement in net investment income, except if
reporting it in trading income reduces an accounting mismatch.
The details on how the fair value amounts are derived for financial assets at fair value are described in Note 17.
Accounting for financial assets mandatorily at fair value
Financial assets that are held for trading are recognised at fair value through profit or loss. In addition, financial assets are held at fair
value through profit or loss if they do not contain contractual terms that give rise on specified dates to cash flows that are SPPI, or if the
financial asset is not held in a business model that is either (i) a business model to collect the contractual cash flows or (ii) a business
model that is achieved by both collecting contractual cash flows and selling.
| | | | | | |
| | Mandatorily at fair value | |
| | | | | | |
| | | | | | |
| | | | | | |
| | | | | | |
| | | | | | |
Reverse repurchase agreements and other similar secured lending | | | | | | |
| | | | | | |
Financial assets at fair value through the income statement | | | | | | |
Credit risk of financial assets designated at fair value and related credit derivatives
The following table shows the maximum exposure to credit risk, the changes in fair value attributable to changes in credit risk, and the
cumulative changes in fair value since initial recognition for loans and advances. The table does not include debt securities designated at
fair value as they have minimal exposure to credit risk due to limited gross exposure.
| | | | | | |
| Maximum exposure as at 31 December | Changes in fair value during the year ended | Cumulative changes in fair value from inception |
| | | | | | |
| | | | | | |
Loans and advances designated at fair value, attributable to credit risk | | | | | | |
Value mitigated by related credit derivatives | | | | | | |
| | | | | | | | | |
| Climate and sustainability report | | | | | | | Barclays PLC 2023 Annual Report on Form 20-F | |
| |
| | | | | | | | | |
Notes to the financial statements (continued) |
Assets and liabilities held at fair value |
14 Derivative financial instruments
Accounting for derivatives
Derivative instruments are contracts whose value is derived from one or more underlying financial instruments or indices defined in the
contract. They include swaps, forward-rate agreements, futures, options and combinations of these instruments and primarily affect
the Group’s net interest income, net trading income and derivative assets and liabilities. Notional amounts of the contracts are not
recorded on the balance sheet. Derivatives are used to hedge interest rate, credit risk, inflation risk, exchange rate, commodity equity
exposures, and exposures to certain indices such as house price indices and retail price indices related to non-trading positions.
All derivative instruments are held at fair value through profit or loss, except for derivatives that are in a designated cash flow or net
investment hedge accounting relationship. Derivatives are classified as assets when their fair value is positive or as liabilities when their
fair value is negative.
Hedge accounting
The Group applies the requirements of IAS 39 Financial Instruments: Recognition and Measurement for hedge accounting purposes.
The Group applies hedge accounting to represent the economic effects of its interest rate, currency and contractually-linked inflation
risk management strategies. Where derivatives are held for risk management purposes, and when transactions meet the required
criteria for documentation and hedge effectiveness, the Group applies fair value hedge accounting, cash flow hedge accounting, or
hedging of a net investment in a foreign operation, as appropriate to the risks being hedged.
Fair value hedge accounting
Changes in fair value of derivatives that qualify and are designated as fair value hedges are recorded in the income statement, together
with changes in the fair value of the hedged asset or liability that are attributable to the hedged risk. The fair value changes adjust the
carrying value of the hedged asset or liability held at amortised cost.
If hedge relationships no longer meet the criteria for hedge accounting, hedge accounting is discontinued. For fair value hedges of
interest rate risk, the fair value adjustment to the hedged item is amortised to the income statement over the period to maturity of the
previously designated hedge relationship using the effective interest method. If the hedged item is sold or repaid, the unamortised fair
value adjustment is recognised immediately in the income statement. For items classified as fair value through other comprehensive
income, the hedge accounting adjustment is included in other comprehensive income.
Cash flow hedge accounting
For qualifying cash flow hedges, the fair value gain or loss associated with the effective portion of the cash flow hedge is recognised
initially in other comprehensive income, and then recycled to the income statement in the periods when the hedged item will affect
profit or loss. Any ineffective portion of the gain or loss on the hedging instrument is recognised in the income statement immediately.
When a hedging instrument expires or is sold, or when a hedge no longer meets the criteria for hedge accounting, any cumulative gain
or loss existing in equity at that time remains in equity and is recognised when the hedged item is ultimately recognised in the income
statement. When a forecast transaction is no longer expected to occur, the cumulative gain or loss that was recognised in equity is
immediately transferred to the income statement.
Hedges of net investments
The Group’s net investments in foreign operations, including monetary items accounted for as part of the net investment, are hedged
for foreign currency risks using both derivatives and foreign currency borrowings. Hedges of net investments are accounted for
similarly to cash flow hedges; the effective portion of the gain or loss on the hedging instrument is being recognised directly in other
comprehensive income and the ineffective portion being recognised immediately in the income statement. The cumulative gain or loss
recognised in other comprehensive income is recognised in the income statement on the disposal or partial disposal of the foreign
operation, or other reductions in the Group’s investment in the operation.
| | | | | | |
| |
| | |
| | | | |
| | | |
| | | | | | |
Total derivative assets/(liabilities) held for trading | | | | | | |
Total derivative assets/(liabilities) held for risk management | | | | | | |
Derivative assets/(liabilities) | | | | | | |
Further information on netting arrangements of derivative financial instruments can be found within Note 18.
The fair values and notional amounts of derivative instruments held for trading and held for risk management are set out in the following
table:
| | | | | | | | | |
| Climate and sustainability report | | | | | | | Barclays PLC 2023 Annual Report on Form 20-F | |
| |
| | | | | | | | | |
Notes to the financial statements (continued) |
Assets and liabilities held at fair value |
| | | | | | |
Derivatives held for trading and held for risk management | | | | | |
| | |
| | | | |
| | | | |
| | | | | | |
Derivatives held for trading | | | | | | |
Foreign exchange derivatives | | | | | | |
| | | | | | |
Derivatives cleared by central counterparty | | | | | | |
Exchange traded derivatives | | | | | | |
Foreign exchange derivatives | | | | | | |
Interest rate derivatives | | | | | | |
| | | | | | |
Derivatives cleared by central counterparty | | | | | | |
Exchange traded derivatives | | | | | | |
Interest rate derivatives | | | | | | |
| | | | | | |
| | | | | | |
Derivatives cleared by central counterparty | | | | | | |
| | | | | | |
Equity and stock index derivatives | | | | | | |
| | | | | | |
Exchange traded derivatives | | | | | | |
Equity and stock index derivatives | | | | | | |
| | | | | | |
| | | | | | |
Exchange traded derivatives | | | | | | |
| | | | | | |
Derivative assets/(liabilities) held for trading | | | | | | |
| | | | | | |
Total derivatives cleared by central counterparty | | | | | | |
Total exchange traded derivatives | | | | | | |
Derivative assets/(liabilities) held for trading | | | | | | |
Derivatives held for risk management | | | | | | |
Derivatives designated as cash flow hedges | | | | | | |
OTC foreign exchange derivatives | | | | | | |
OTC interest rate derivatives | | | | | | |
Interest rate derivatives cleared by central counterparty | | | | | | |
Derivatives designated as cash flow hedges | | | | | | |
Derivatives designated as fair value hedges | | | | | | |
OTC interest rate derivatives | | | | | | |
Interest rate derivatives cleared by central counterparty | | | | | | |
Derivatives designated as fair value hedges | | | | | | |
Derivatives designated as hedges of net investments | | | | | | |
OTC foreign exchange derivatives | | | | | | |
Derivatives designated as hedges of net investments | | | | | | |
Derivative assets/(liabilities) held for risk management | | | | | | |
| | | | | | |
Total derivatives cleared by central counterparty | | | | | | |
Derivative assets/(liabilities) held for risk management | | | | | | |
| | | | | | | | | |
| Climate and sustainability report | | | | | | | Barclays PLC 2023 Annual Report on Form 20-F | |
| |
| | | | | | | | | |
Notes to the financial statements (continued) |
Assets and liabilities held at fair value |
Hedge accounting
Hedge accounting is applied predominantly for the following risks:
▪Interest rate risk – arises due to a mismatch between fixed interest rates and floating interest rates. Interest rate risk also includes
exposure to inflation risk for certain types of investments.
▪Currency risk – arises due to assets or liabilities being denominated in different currencies than the functional currency of the relevant
entity. At a consolidated level, currency risk also arises when the functional currency of subsidiaries are different from the parent.
▪Contractually linked inflation risk – arises from financial instruments within contractually specified inflation risk. The Group does not
hedge inflation risk that arises from other activities.
In order to hedge these risks, the Group uses the following hedging instruments:
▪Interest rate derivatives to swap interest rate exposures into either fixed or variable rates.
▪Currency derivatives to swap foreign currency exposures into the entity’s functional currency, and net investment exposure to local
currency.
▪Inflation derivatives to swap inflation exposure into either fixed or variable interest rates.
In some cases, certain items which are economically hedged may be ineligible hedged items for the purposes of IAS 39, such as core
deposits and equity. In these instances, a proxy hedging solution can be utilised whereby portfolios of floating rate assets are
designated as eligible hedged items in cash flow hedges.
In some hedging relationships, the Group designates risk components of hedged items as follows:
▪Benchmark interest rate risk as a component of interest rate risk, such as the Risk Free Rate (RFR) component.
▪Inflation risk as a contractually specified component of a debt instrument.
▪Spot exchange rate risk for foreign currency financial assets or financial liabilities.
▪Components of cash flows of hedged items, for example certain interest payments for part of the life of an instrument.
Using the benchmark interest rate risk results in other risks, such as credit risk and liquidity risk, being excluded from the hedge
accounting relationship.
In respect of many of the Group’s hedge accounting relationships, the hedged item and hedging instrument change frequently due to
the dynamic nature of the risk management and hedge accounting strategy. The Group applies hedge accounting to dynamic
scenarios, predominantly in relation to interest rate risk, with a combination of hedged items in order for its financial statements to
reflect as closely as possible the economic risk management undertaken. In some cases, if the hedge accounting objective changes,
the relevant hedge accounting relationship is de-designated and is replaced with a different hedge accounting relationship.
Changes in the GBP value of net investments due to foreign currency movements are captured in the currency translation reserve,
resulting in a movement in CET1 capital. The Group mitigates this by matching the CET1 capital movements to the revaluation of the
foreign currency RWA exposures. Net investment hedges are designated where necessary to reduce the exposure to movement in a
particular exchange rate to within limits mandated by Risk. As far as possible, existing external currency liabilities are designated as the
hedging instruments.
The hedging instruments share the same risk exposures as the hedged items. Hedge effectiveness is determined with reference to
quantitative tests, predominantly regression testing, but to the extent hedging instruments are exposed to different risks than the
hedged items, this could result in hedge ineffectiveness or hedge accounting failures.
Sources of ineffectiveness include the following:
▪Mismatches between the contractual terms of the hedged item and hedging instrument, including basis differences.
▪Changes in credit risk of the hedging instruments.
▪If a hedging relationship becomes over-hedged, for example in hedges of net investments if the net asset value designated at the
start of the period falls below the amount of the hedging instrument.
▪Cash flow hedges using external swaps with non-zero fair values.
| | | | | | | | | |
| Climate and sustainability report | | | | | | | Barclays PLC 2023 Annual Report on Form 20-F | |
| |
| | | | | | | | | |
Notes to the financial statements (continued) |
Assets and liabilities held at fair value |
| | | | | |
Hedged items in fair value hedges | | | | | |
| | Accumulated fair value adjustment included in carrying amount | | |
Hedged item statement of financial position classification and risk category | | | Of which: Accumulated fair value adjustment on items no longer in a hedge relationship | Change in fair value used as a basis to determine ineffectiveness | Hedge ineffectiveness recognised in the income statements1 |
| | | | |
| | | | | |
| | | | | |
Loans and advances at amortised cost | | | | | |
| | | | | |
| | | | | |
Debt securities classified at amortised cost | | | | | |
| | | | | |
| | | | | |
Financial assets at fair value through other comprehensive income | | | | | |
| | | | | |
| | | | | |
| | | | | |
| | | | | |
| | | | | |
| | | | | |
| | | | | |
| | | | | |
| | | | | |
| | | | | |
| | | | | |
Loans and advances at amortised cost | | | | | |
| | | | | |
| | | | | |
Debt securities classified at amortised cost | | | | | |
| | | | | |
| | | | | |
Financial assets at fair value through other comprehensive income | | | | | |
| | | | | |
| | | | | |
| | | | | |
| | | | | |
| | | | | |
| | | | | |
| | | | | |
| | | | | |
Note
1Hedge ineffectiveness is recognised in net interest income.
For items classified as fair value through other comprehensive income, the hedge accounting adjustment is not included in the carrying
amount, but rather adjusts other comprehensive income.
| | | | | | | | | |
| Climate and sustainability report | | | | | | | Barclays PLC 2023 Annual Report on Form 20-F | |
| |
| | | | | | | | | |
Notes to the financial statements (continued) |
Assets and liabilities held at fair value |
The following table shows the fair value hedging instruments which are carried on the Group’s balance sheet:
| | | | | | |
| | | | Change in fair value used as a basis to determine ineffectiveness |
| | | | |
| | | | | | |
| | | | | | |
| | | | | | |
| | | | | | |
| | | | | | |
| | | | | | |
| | | | | | |
| | | | | | |
| | | | | | |
| | | | | | |
The following table profiles the expected notional values of current hedging instruments in future years:
| | | | | | | |
| | | | | | | |
| | | | | | | |
| | | | | | | |
Interest rate risk (outstanding notional amount) | | | | | | | |
Inflation risk (outstanding notional amount) | | | | | | | |
There are 1,996 (2022: 1,796) interest rate risk fair value hedges with an average fixed rate of 1.64% (2022: 1.97%) across the
relationships and 136 (2022: 94) inflation risk fair value hedges with an average rate of 0.85% (2022: 0.54%) across the relationships.
| | | | | | | | | |
| Climate and sustainability report | | | | | | | Barclays PLC 2023 Annual Report on Form 20-F | |
| |
| | | | | | | | | |
Notes to the financial statements (continued) |
Assets and liabilities held at fair value |
| | | | | | | |
Hedged items in cash flow hedges and hedges of net investments in foreign operations |
Description of hedge relationship and hedged risk | Change in value of hedged item used as the basis for recognising ineffectiveness | Balance in cash flow hedging reserve for continuing hedges | Balance in currency translation reserve for continuing hedges | Balances remaining in cash flow hedging reserve for which hedge accounting is no longer applied | Balances remaining in currency translation reserve for which hedge accounting is no longer applied | Hedging (gains) or losses recognised in other comprehensive income | Hedge ineffectiveness recognised in the income statement1 |
| | | | | | |
| | | | | | | |
| | | | | | | |
| | | | | | | |
Loans and advances at amortised cost | | | | | | | |
Cash and balances at Central Banks | | | | | | | |
| | | | | | | |
Loans and advances at amortised cost | | | | | | | |
Debt securities classified at amortised cost | | | | | | | |
| | | | | | | |
Debt securities classified at amortised cost | | | | | | | |
| | | | | | | |
Hedge of net investment in foreign operations | | | | | | | |
| | | | | | | |
| | | | | | | |
| | | | | | | |
| | | | | | | |
| | | | | | | |
| | | | | | | |
| | | | | | | |
| | | | | | | |
Loans and advances at amortised cost | | | | | | | |
Cash and balances at Central Banks | | | | | | | |
| | | | | | | |
Loans and advances at amortised cost | | | | | | | |
Debt securities classified at amortised cost | | | | | | | |
| | | | | | | |
Debt securities classified at amortised cost | | | | | | | |
| | | | | | | |
Hedge of net investment in foreign operations | | | | | | | |
| | | | | | | |
| | | | | | | |
| | | | | | | |
| | | | | | | |
Note
1Hedge ineffectiveness is recognised in net interest income.
| | | | | | | | | |
| Climate and sustainability report | | | | | | | Barclays PLC 2023 Annual Report on Form 20-F | |
| |
| | | | | | | | | |
Notes to the financial statements (continued) |
Assets and liabilities held at fair value |
The following table shows the cash flow and net investment hedging instruments which are carried on the Group’s balance sheet:
| | | | | | |
| | | | Change in fair value used as a basis to determine ineffectiveness |
| | | | |
| | | | | | |
| | | | | | |
| | | | | | |
| | | | | | |
| | | | | | |
| | | | | | |
| | | | | | |
| | | | | | |
| | | | | | |
| | | | | | |
| | | | | | |
| | | | | | |
| | | | | | |
| | | | | | |
There are 50 (2022: 58) foreign exchange risk cash flow hedges with an average foreign exchange rate of 147.94 JPY:1 GBP (2022:
148.00 JPY:1 GBP) across the relationships and 8 (2022: nil) foreign exchange risk cash flow hedges with an average foreign exchange
rate of 1.25 USD:1 GBP (2022: nil) across the relationships.
The effect on the income statement and other comprehensive income of recycling amounts in respect of cash flow hedges and net
investment hedges of foreign operations is set out in the following table:
| | | | |
| | |
| Amount recycled from other comprehensive income due to hedged item affecting income statement | Amount recycled from other comprehensive income due to sale of investment, or cash flows no longer expected to occur | Amount recycled from other comprehensive income due to hedged item affecting income statement | Amount recycled from other comprehensive income due to sale of investment, or cash flows no longer expected to occur |
Description of hedge relationship and hedged risk | | | | |
Cash flow hedge of interest rate risk | | | | |
Recycled to net interest income | | | | |
Cash flow hedge of foreign exchange risk | | | | |
Recycled to trading income | | | | |
Hedge of net investment in foreign operations | | | | |
Recycled to trading income | | | | |
A detailed reconciliation of the movements of the cash flow hedging reserve and the currency translation reserve is as follows:
| | | | |
| | |
| Cash flow hedging reserve | Currency translation reserve | Cash flow hedging reserve | Currency translation reserve |
| | | | |
| | | | |
Currency translation movements | | | | |
Hedging gains/(losses) for the year | | | | |
Amounts reclassified in relation to cash flows affecting profit or loss | | | | |
| | | | |
| | | | |
| | | | | | | | | |
| Climate and sustainability report | | | | | | | Barclays PLC 2023 Annual Report on Form 20-F | |
| |
| | | | | | | | | |
Notes to the financial statements (continued) |
Assets and liabilities held at fair value |
15 Financial assets at fair value through other comprehensive income
Accounting for financial assets at fair value through other comprehensive income (FVOCI)
Financial assets that are debt instruments held in a business model that is achieved by both collecting contractual cash flows and selling
and that contain contractual terms that give rise on specified dates to cash flows that are SPPI are measured at FVOCI. They are
subsequently remeasured at fair value and changes therein (except for those relating to impairment, interest income and foreign
currency exchange gains and losses) are recognised in other comprehensive income until the assets are sold. Interest (calculated using
the effective interest method) is recognised in the income statement in net interest income (Note 3). Upon disposal, the cumulative
gain or loss recognised in other comprehensive income is included in net investment income (Note 6).
In determining whether the business model is achieved by both collecting contractual cash flows and selling financial assets, it is
determined that both collecting contractual cash flows and selling financial assets are integral to achieving the objective of the business
model. The Group will consider past sales and expectations about future sales to establish if the business model is achieved.
For equity securities that are not held for trading, the Group may make an irrevocable election on initial recognition to present
subsequent changes in the fair value of the instrument in other comprehensive income (except for dividend income which is recognised
in profit or loss).
| | |
| | |
| | |
Debt securities and other eligible bills | | |
| | |
| | |
Financial assets at fair value through other comprehensive income | | |
16 Financial liabilities designated at fair value
Accounting for liabilities designated at fair value through profit and loss
In accordance with IFRS 9, financial liabilities may be designated at fair value, with gains and losses taken to the income statement within
net trading income (Note 5) and net investment income (Note 6). Movements in own credit are reported through other comprehensive
income, unless the effects of changes in the liability's credit risk would create or enlarge an accounting mismatch in P&L. In these
scenarios, all gains and losses on that liability (including the effects of changes in the credit risk of the liability) are presented in P&L. On
derecognition of the financial liability no amount relating to own credit risk is recycled to the income statement. The Group has the
ability to make the fair value designation when holding the instruments at fair value reduces an accounting mismatch (caused by an
offsetting liability or asset being held at fair value), or is managed by the Group on the basis of its fair value, or includes terms that have
substantive derivative characteristics (Note 14).
The details on how the fair value amounts are arrived at for financial liabilities designated at fair value are described in Note 17.
| | | | |
| | |
| | Contractual amount due on maturity | | Contractual amount due on maturity |
| | | | |
| | | | |
| | | | |
Repurchase agreements and other similar secured borrowing | | | | |
Other financial liabilities | | | | |
Financial liabilities designated at fair value | | | | |
The cumulative own credit net loss recognised is £307m (2022: £674m gain).
| | | | | | | | | |
| Climate and sustainability report | | | | | | | Barclays PLC 2023 Annual Report on Form 20-F | |
| |
| | | | | | | | | |
Notes to the financial statements (continued) |
Assets and liabilities held at fair value |
17 Fair value of financial instruments
Accounting for financial assets and liabilities – fair values
Financial instruments that are held for trading are recognised at fair value through profit or loss. In addition, financial assets are held at
fair value through profit or loss if they do not contain contractual terms that give rise on specified dates to cash flows that are SPPI, or if
the financial asset is not held in a business model that is either (i) a business model to collect the contractual cash flows or (ii) a business
model that is achieved by both collecting contractual cash flows and selling. Subsequent changes in fair value for these instruments are
recognised in the income statement in net investment income, except if reporting it in trading income reduces an accounting
mismatch.
Wherever possible, fair value is determined by reference to a quoted market price for that instrument. For many of the Group’s financial
assets and liabilities, especially derivatives, quoted prices are not available and valuation models are used to estimate fair value. The
models calculate the expected cash flows under the terms of each specific contract and then discount these values back to a present
value. These models use as their basis independently sourced market inputs including, for example, interest rate yield curves, equities
and commodities prices, option volatilities and currency rates.
For financial liabilities measured at fair value, the carrying amount reflects the effect on fair value of changes in own credit spreads
derived from observable market data such as in primary issuance and redemption activity for structured notes.
On initial recognition, it is presumed that the transaction price is the fair value unless there is observable information available in an
active market to the contrary.
For valuations that have made use of unobservable inputs, the difference between the model valuation and the initial transaction price
(Day one profit) is recognised in profit or loss either: on a straight-line basis over the term of the transaction; or over the period until all
inputs will become observable where appropriate; or released in full when previously unobservable inputs become observable.
Various factors influence the availability of observable inputs and these may vary from product to product and change over time.
Factors include the depth of activity in the relevant market, the type of product, whether the product is new and not widely traded in the
marketplace, the maturity of market modelling and the nature of the transaction (bespoke or generic). To the extent that valuation is
based on models or inputs that are not observable in the market, the determination of fair value can be more subjective, dependent on
the significance of the unobservable input to the overall valuation. Unobservable inputs are determined based on the best information
available, for example by reference to similar assets, similar maturities or other analytical techniques.
The sensitivity of valuations used in the financial statements to possible changes in significant unobservable inputs is shown on page
Critical accounting estimates and judgements
The valuation of financial instruments often involves a significant degree of judgement and complexity, in particular where valuation
models make use of unobservable inputs (‘Level 3’ assets and liabilities). This note provides information on these instruments, including
the related unrealised gains and losses recognised in the period, a description of significant valuation techniques and unobservable
inputs, and a sensitivity analysis.
Climate-related risks are assumed to be included in the fair values of assets and liabilities traded in active markets. Within less active
markets, for counterparties and instruments identified as being more susceptible to climate change risk, an impact assessment was
performed through increasing their probability of default. The change in valuation of the assets and liabilities from this assessment was
sufficiently immaterial to necessitate any amendment to the reported year end valuations.
Valuation
Assets and liabilities according to a hierarchy that reflects the observability of significant market inputs. The three levels of the fair value
hierarchy are defined below with judgement applied in determining the boundary between Level 2 and 3 classification.
Quoted market prices – Level 1
Assets and liabilities are classified as Level 1 if their value is observable in an active market. Such instruments are valued by reference to
unadjusted quoted prices for identical assets or liabilities in active markets where the quoted price is readily available, and the price
represents actual and regularly occurring market transactions. An active market is one in which transactions occur with sufficient
volume and frequency to provide pricing information on an ongoing basis.
Valuation technique using observable inputs – Level 2
Assets and liabilities classified as Level 2 have been valued using models whose inputs are observable either directly or indirectly.
Valuations based on observable inputs include assets and liabilities such as swaps and forwards which are valued using market standard
pricing techniques, and options that are commonly traded in markets where all the inputs to the market standard pricing models are
observable. For certain instruments that derive a fair value using unobservable inputs that are not considered significant, then the asset
or liability may be classified as Level 2.
Valuation technique using significant unobservable inputs – Level 3
Assets and liabilities are classified as Level 3 if their valuation incorporates significant inputs that are not based on observable market
data (unobservable inputs). A valuation input is considered observable if it can be directly observed from transactions in an active
market, or if there is compelling external evidence demonstrating an executable exit price. Unobservable input levels are generally
determined via reference to observable inputs, historical observations or using other analytical techniques.
The following table shows the Group’s assets and liabilities that are held at fair value disaggregated by valuation technique (fair value
hierarchy) and balance sheet classification:
| | | | | | | | | |
| Climate and sustainability report | | | | | | | Barclays PLC 2023 Annual Report on Form 20-F | |
| |
| | | | | | | | | |
Notes to the financial statements (continued) |
Assets and liabilities held at fair value |
| | | | | | | | |
Assets and liabilities held at fair value | |
| | |
| Valuation technique using | Valuation technique using |
| | | | | | | | |
| | | | | | | | |
| | | | | | | | |
Financial assets at fair value through the income statement | | | | | | | | |
Derivative financial assets | | | | | | | | |
Financial assets at fair value through other comprehensive income | | | | | | | | |
| | | | | | | | |
| | | | | | | | |
| | | | | | | | |
Trading portfolio liabilities | | | | | | | | |
Financial liabilities designated at fair value | | | | | | | | |
Derivative financial liabilities | | | | | | | | |
| | | | | | | | |
The following table shows the Group’s Level 3 assets and liabilities that are held at fair value disaggregated by product type:
| | | | |
Level 3 assets and liabilities held at fair value by product type | |
| | |
| | | | |
| | | | |
Interest rate derivatives | | | | |
Foreign exchange derivatives | | | | |
| | | | |
| | | | |
| | | | |
Reverse repurchase and repurchase agreements | | | | |
| | | | |
Private equity investments | | | | |
| | | | |
| | | | |
Note
1Other includes funds and fund-linked products, issued debt, government and government sponsored debt, asset backed securities, equity cash products and investment property.
Valuation techniques and sensitivity analysis
Sensitivity analysis is performed on products with significant unobservable inputs (Level 3) to generate a range of reasonably possible
alternative valuations. The sensitivity methodologies applied take account of the nature of the valuation techniques used, as well as the
availability and reliability of observable proxy and historical data and the impact of using alternative models.
Sensitivities are dynamically calculated on a monthly basis. The calculation is based on range or spread data of a reliable reference
source or a scenario based on relevant market analysis alongside the impact of using alternative models. Sensitivities are calculated
without reflecting the impact of any diversification in the portfolio.
The valuation techniques used, observability and sensitivity analysis for material products within Level 3, are described below.
Interest rate derivatives
Description: Derivatives linked to interest rates or inflation indices. The category includes futures, interest rate and inflation swaps,
swaptions, caps, floors, inflation options, balance guaranteed swaps and other exotic interest rate derivatives.
Valuation: Interest rate and inflation derivatives are generally valued using curves of forward rates constructed from market data to
project and discount the expected future cash flows of trades. Instruments with optionality are valued using volatilities implied from
market inputs, and use industry standard or bespoke models depending on the product type.
Observability: In general, inputs are considered observable up to liquid maturities which are determined separately for each input and
underlying. Unobservable inputs are generally set by referencing liquid market instruments and applying extrapolation techniques or
inferred via another reasonable method.
Foreign exchange derivatives
Description: Derivatives linked to the foreign exchange (FX) market. The category includes FX forward contracts, FX swaps and FX
options. The majority are traded as over the counter (OTC) derivatives.
| | | | | | | | | |
| Climate and sustainability report | | | | | | | Barclays PLC 2023 Annual Report on Form 20-F | |
| |
| | | | | | | | | |
Notes to the financial statements (continued) |
Assets and liabilities held at fair value |
Valuation: FX derivatives are valued using industry standard and bespoke models depending on the product type. Valuation inputs
include FX rates, interest rates, FX volatilities, interest rate volatilities, FX interest rate correlations and others as appropriate.
Observability: FX correlations, forwards and volatilities are generally observable up to liquid maturities which are determined separately
for each input and underlying. Unobservable inputs are set by referencing liquid market instruments and applying extrapolation
techniques, or inferred via another reasonable method.
Credit derivatives
Description: Derivatives linked to the credit spread of a referenced entity, index or basket of referenced entities or a pool of referenced
assets (e.g. a securitised product). The category includes single name and index credit default swaps (CDS) and total return swaps
(TRS).
Valuation: CDS are valued on industry standard models using curves of credit spreads as the principal input. Credit spreads are observed
directly from broker data, third party vendors or priced to proxies.
Observability: CDS contracts referencing entities that are actively traded are generally considered observable. Other valuation inputs
are considered observable if products with significant sensitivity to the inputs are actively traded in a liquid market. Unobservable
valuation inputs are generally determined with reference to recent transactions or inferred from observable trades of the same issuer
or similar entities.
Equity derivatives
Description: Exchange traded or OTC derivatives linked to equity indices and single names. The category includes vanilla and exotic
equity products.
Valuation: Equity derivatives are valued using industry standard models. Valuation inputs include stock prices, dividends, volatilities,
interest rates, equity repurchase curves and, for multi-asset products, correlations.
Observability: In general, valuation inputs are observable up to liquid maturities which are determined separately for each input and
underlying. Unobservable inputs are set by referencing liquid market instruments and applying extrapolation techniques, or inferred via
another reasonable method.
Corporate debt
Description: Primarily corporate bonds.
Valuation: Corporate bonds are valued using observable market prices sourced from broker quotes, inter-dealer prices or other reliable
pricing sources.
Observability: Prices for actively traded bonds are considered observable. Unobservable bonds prices are generally determined by
reference to bond yields or CDS spreads for actively traded instruments issued by or referencing the same (or a similar) issuer.
Reverse repurchase and repurchase agreements
Description: Includes securities purchased under resale agreements, securities sold under repurchase agreements, and other similar
secured lending agreements. The agreements are primarily short-term in nature.
Valuation: Repurchase and reverse repurchase agreements are generally valued by discounting the expected future cash flows using
industry standard models that incorporate market interest rates and repurchase rates, based on the specific details of the transaction.
Observability: Inputs are deemed observable up to liquid maturities or for consensus pricing with low pricing-range and are determined
based on the specific features of the transaction. Unobservable inputs are generally set by referencing liquid market instruments and
applying extrapolation techniques, or inferred via another reasonable method.
Loans
Description: A drawn lending facility issued to corporate clients and customers.
Valuation: Loans are valued either using a price-based approach, or through models that discount expected future cash flows based
on interest rates and loan spreads.
Observability: Within this loan population, the price or loan spread may be generally unobservable.
Private equity investments
Description: Includes investments in equity holdings in operating companies not quoted on a public exchange.
Valuation: Private equity investments are valued in accordance with the ‘International Private Equity and Venture Capital Valuation
Guidelines’ which require the use of a number of individual pricing benchmarks such as the prices of recent transactions in the same or
similar entities, discounted cash flow analysis and comparison with the earnings or revenue multiples of listed companies. While the
valuation of unquoted equity instruments is subjective by nature, the relevant methodologies are commonly applied by other market
participants and have been consistently applied over time.
Observability: Inputs are considered observable if there is active trading in a liquid market of products with significant sensitivity to the
inputs. Unobservable inputs include earnings or revenue estimates, multiples of comparative companies, marketability discounts and
discount rates.
Other
Description: Other includes funds and fund-linked products, issued debt, government sponsored debt, asset backed securities, equity
cash products and investment property.
Assets and liabilities reclassified between Level 1 and Level 2
| | | | | | | | | |
| Climate and sustainability report | | | | | | | Barclays PLC 2023 Annual Report on Form 20-F | |
| |
| | | | | | | | | |
Notes to the financial statements (continued) |
Assets and liabilities held at fair value |
During the period, there were no material transfers between Level 1 and Level 2 (2022: there were no material transfers between Level
1 and Level 2).
Level 3 movement analysis
The following table summarises the movements in the Level 3 balances during the period. Transfers have been reflected as if they had
taken place at the beginning of the year.
Asset and liability transfers between Level 2 and Level 3 are primarily due to i) an increase or decrease in observable market activity
related to an input or ii) a change in the significance of the unobservable input, with assets and liabilities classified as Level 3 if an
unobservable input is deemed significant.
| | | | | | | | | | | |
Analysis of movements in Level 3 assets and liabilities | | | | | | |
| | | | | | Total gains and (losses) in the period recognised in the income statement | Total gains or (losses) recognised in OCI | | |
| | | | | | | | |
| | | | | | | | | | | |
| | | | | | | | | | | |
| | | | | | | | | | | |
| | | | | | | | | | | |
| | | | | | | | | | | |
| | | | | | | | | | | |
| | | | | | | | | | | |
| | | | | | | | | | | |
Private equity investments | | | | | | | | | | | |
Reverse repurchase and repurchase agreements | | | | | | | | | | | |
| | | | | | | | | | | |
Financial assets at fair value through the income statement | | | | | | | | | | | |
| | | | | | | | | | | |
| | | | | | | | | | | |
| | | | | | | | | | | |
Private equity investments | | | | | | | | | | | |
| | | | | | | | | | | |
Assets at fair value through other comprehensive income | | | | | | | | | | | |
| | | | | | | | | | | |
| | | | | | | | | | | |
| | | | | | | | | | | |
Trading portfolio liabilities | | | | | | | | | | | |
| | | | | | | | | | | |
Financial liabilities designated at fair value | | | | | | | | | | | |
| | | | | | | | | | | |
Interest rate derivatives | | | | | | | | | | | |
Foreign exchange derivatives | | | | | | | | | | | |
| | | | | | | | | | | |
| | | | | | | | | | | |
Net derivative financial instruments1 | | | | | | | | | | | |
| | | | | | | | | | | |
| | | | | | | | | | | |
| | | | | | | | | |
| Climate and sustainability report | | | | | | | Barclays PLC 2023 Annual Report on Form 20-F | |
| |
| | | | | | | | | |
Notes to the financial statements (continued) |
Assets and liabilities held at fair value |
| | | | | | | | | | | |
Analysis of movements in Level 3 assets and liabilities | | | | | | |
| | | | | | Total gains and (losses) in the period recognised in the income statement | Total gains or (losses) recognised in OCI | | |
| | | | | | | | |
| | | | | | | | | | | |
| | | | | | | | | | | |
| | | | | | | | | | | |
| | | | | | | | | | | |
| | | | | | | | | | | |
| | | | | | | | | | | |
| | | | | | | | | | | |
| | | | | | | | | | | |
Private equity investments | | | | | | | | | | | |
Reverse repurchase and repurchase agreements | | | | | | | | | | | |
| | | | | | | | | | | |
Financial assets at fair value through the income statement | | | | | | | | | | | |
| | | | | | | | | | | |
Private equity investments | | | | | | | | | | | |
| | | | | | | | | | | |
Assets at fair value through other comprehensive income | | | | | | | | | | | |
| | | | | | | | | | | |
| | | | | | | | | | | |
| | | | | | | | | | | |
Trading portfolio liabilities | | | | | | | | | | | |
| | | | | | | | | | | |
Financial liabilities designated at fair value | | | | | | | | | | | |
| | | | | | | | | | | |
Interest rate derivatives | | | | | | | | | | | |
Foreign exchange derivatives | | | | | | | | | | | |
| | | | | | | | | | | |
| | | | | | | | | | | |
Net derivative financial instruments1 | | | | | | | | | | | |
| | | | | | | | | | | |
| | | | | | | | | | | |
Notes
1The derivative financial instruments are represented on a net basis. On a gross basis, derivative financial assets are £3,540m (2022: £5,174m) and derivative financial liabilities are
£4,653m (2022: £6,363m).
2 Trading income represents gains and (losses) on level 3 financial instruments which in the majority are offset by losses and gains on financial instruments disclosed in level 2.
| | | | | | | | | |
| Climate and sustainability report | | | | | | | Barclays PLC 2023 Annual Report on Form 20-F | |
| |
| | | | | | | | | |
Notes to the financial statements (continued) |
Assets and liabilities held at fair value |
Unrealised gains and losses on Level 3 financial assets and liabilities
The following table discloses the unrealised gains and losses recognised in the year arising on Level 3 financial assets and liabilities held
at year end.
| | | | | | | | |
Unrealised gains and (losses) recognised during the period on Level 3 assets and liabilities held at year end |
| | |
| | Other compre- hensive income | | | Other compre- hensive income | |
| | | | |
| | | | | | | | |
| | | | | | | | |
Financial assets at fair value through the income statement | | | | | | | | |
Fair value through other comprehensive income | | | | | | | | |
| | | | | | | | |
Trading portfolio liabilities | | | | | | | | |
Financial liabilities designated at fair value | | | | | | | | |
Net derivative financial instruments | | | | | | | | |
| | | | | | | | |
Note
1Trading income represents gains and (losses) on level 3 financial instruments which in the majority are offset by losses and gains on financial instruments disclosed in level 2.
Significant unobservable inputs
The following table discloses the valuation techniques and significant unobservable inputs for material products recognised at fair value
and classified as Level 3 along with the range of values used for those significant unobservable inputs:
| | | | | | | |
| | Significant unobservable inputs | | | |
| | | | | |
Derivative financial instruments3 | | | | | | | |
Interest rate derivatives | | | | | | | |
| | | | | | | |
| | | | | | | |
| | | | | | | |
| | | | | | | |
| | | | | | | |
| | | | | | | |
| | | | | | | |
| | | | | | | |
| | | | | | | |
| | | | | | | |
| | | | | | | |
| | Equity - equity correlation | | | | | |
| | | | | | | |
Non-derivative financial instruments | | | | | | | |
| | | | | | | |
| | | | | | | |
| | | | | | | |
| | | | | | | |
Private equity investments | | | | | | | |
| | | | | | | |
| | | | | | | |
| | | | | | | |
| | | | | | | |
| | | | | | | |
Reverse repurchase and repurchase agreements | | | | | | | |
Notes
1A range has not been provided for Net Asset Value as there would be a wide range reflecting the diverse nature of the positions.
2The units used to disclose ranges for significant unobservable inputs are percentages, points and basis points. Points are a percentage of par; for example, 100 points equals 100% of
par. A basis point equals 1/100th of 1%; for example, 150 basis points equals 1.5%.
3Certain derivative instruments are classified as Level 3 due to a significant unobservable credit spread input into the calculation of the Credit Valuation Adjustment for the instruments.
The range of significant unobservable credit spreads is between 29-1,672bps (2022: 17-2,159bps).
| | | | | | | | | |
| Climate and sustainability report | | | | | | | Barclays PLC 2023 Annual Report on Form 20-F | |
| |
| | | | | | | | | |
Notes to the financial statements (continued) |
Assets and liabilities held at fair value |
The following section describes the significant unobservable inputs identified in the table above, and the sensitivity of fair value
measurement of the instruments categorised as Level 3 assets or liabilities to increases in significant unobservable inputs. Where
sensitivities are described, the inverse relationship will also generally apply.
Where reliable interrelationships can be identified between significant unobservable inputs used in fair value measurement, a
description of those interrelationships is included below.
Forwards
A price or rate that is applicable to a financial transaction that will take place in the future.
In general, a significant increase in a forward in isolation will result in a fair value increase for the contracted receiver of the underlying
(currency, bond, commodity, etc.), but the sensitivity is dependent on the specific terms of the instrument.
Credit spread
Credit spreads typically represent the difference in yield between an instrument and a benchmark security or reference rate. Credit
spreads reflect the additional yield that a market participant demands for taking on exposure to the credit risk of an instrument and
form part of the yield used in a discounted cash flow calculation.
In general, a significant increase in credit spread in isolation will result in a movement in a fair value decrease for a cash asset.
For a derivative instrument, a significant increase in credit spread in isolation can result in a fair value increase or decrease depending on
the specific terms of the instrument.
Volatility
Volatility is a measure of the variability or uncertainty in return for a given derivative underlying. It is an estimate of how much a particular
underlying instrument input or index will change in value over time. In general, volatilities are implied from observed option prices. For
unobservable options the implied volatility may reflect additional assumptions about the nature of the underlying risk, and the strike/
maturity profile of a specific contract.
In general a significant increase in volatility in isolation will result in a fair value increase for the holder of a simple option, but the
sensitivity is dependent on the specific terms of the instrument.
There may be interrelationships between unobservable volatilities and other unobservable inputs (e.g. when equity prices fall, implied
equity volatilities generally rise) but these are generally specific to individual markets and may vary over time.
Correlation
Correlation is a measure of the relationship between the movements of two variables. Correlation can be a significant input into
valuation of derivative contracts with more than one underlying instrument. Credit correlation generally refers to the correlation
between default processes for the separate names that make up the reference pool of a CDO structure.
A significant increase in correlation in isolation can result in a fair value increase or decrease depending on the specific terms of the
instrument.
Comparable price
Comparable instrument prices are used in valuation by calculating an implied yield (or spread over a liquid benchmark) from the price of a
comparable observable instrument, then adjusting that yield (or spread) to account for relevant differences such as maturity or credit
quality. Alternatively, a price-to-price basis can be assumed between the comparable and unobservable instruments in order to
establish a value.
Loans includes a portfolio of loans extended to clients within the Group’s leveraged finance business. Leveraged finance loans are
originated where Barclays provide financing commitments to clients to facilitate strategic transactions such as leverage buyouts and
acquisitions. The sensitivity of the portfolio to unobservable inputs is judgmental reflecting their illiquid nature and the significance of
unobservable price inputs to the valuation.
In general, a significant increase in comparable price in isolation will result in an increase in the price of the unobservable instrument. For
derivatives, a change in the comparable price in isolation can result in a fair value increase or decrease depending on the specific terms
of the instrument.
Loan spread
Loan spreads typically represent the difference in yield between an instrument and a benchmark security or reference rate. Loan
spreads typically reflect credit quality, the level of comparable assets such as gilts and other factors, and form part of the yield used in a
discounted cash flow calculation.
Loans containing unobservable input Loan Spreads into their valuation primarily consist of long-dated fixed rate loans extended to
counterparties in the UK Education, Social Housing and Local Authority sectors (ESHLA). The loans are categorised as Level 3 in the fair
value hierarchy due to their illiquid nature and the significance of unobservable loan spreads to the valuation. Valuation uncertainty
arises from the long-dated nature of the portfolio, the lack of secondary market in the loans and the lack of observable loan spreads.
The majority of ESHLA loans are to borrowers in heavily regulated sectors that are considered extremely low credit risk, and have a
history of near zero defaults since inception. While the overall loan spread range is from 40bps to 307bps (2022: 50bps to 589bps), the
vast majority of spreads are concentrated towards the bottom end of this range, with 98% of the loan notional being valued with
spreads less than 200bps for the current period.
In general, a significant increase in loan spreads in isolation will result in a fair value decrease for a loan.
| | | | | | | | | |
| Climate and sustainability report | | | | | | | Barclays PLC 2023 Annual Report on Form 20-F | |
| |
| | | | | | | | | |
Notes to the financial statements (continued) |
Assets and liabilities held at fair value |
EBITDA multiple
EBITDA multiple is the ratio of the valuation of the investment to the earnings before interest, taxes, depreciation and amortisation.
In general, a significant increase in the multiple will result in a fair value increase for an investment.
Earnings multiple
Earnings or Revenue multiple is the ratio of the valuation of the investment to the earnings or revenue. In general, a significant increase
in the multiple will result in a fair value increase for an investment.
| | | | | | | | |
Sensitivity analysis of valuations using unobservable inputs |
| | |
| | | | |
| | | | | | | | |
| | | | | | | | |
Interest rate derivatives | | | | | | | | |
Foreign exchange derivatives | | | | | | | | |
| | | | | | | | |
| | | | | | | | |
| | | | | | | | |
| | | | | | | | |
Private equity investments | | | | | | | | |
| | | | | | | | |
| | | | | | | | |
Note
1Other includes, Equity Cash Products, Fund and Fund Linked, Government and Government Sponsored Debt, Asset backed securities.
The effect of stressing unobservable inputs to a range of reasonably possible alternatives, alongside considering the impact of using
alternative models, would be to increase fair values by up to £1,290m (2022: £1,076m) or to decrease fair values by up to £1,633m
(2022: £1,328m) with substantially all the potential effect impacting profit and loss. Unfavourable changes shown in the table above are
partly provided for through the capital and prudential valuation adjustment framework.
Fair value adjustments
Key balance sheet valuation adjustments are quantified below:
| | |
| | |
| | |
Exit price adjustments derived from market bid-offer spreads | | |
Uncollateralised derivative funding | | |
Derivative credit valuation adjustments | | |
Derivative debit valuation adjustments | | |
Exit price adjustments derived from market bid-offer spreads
The Group uses mid-market pricing where it is a market maker and has the ability to transact at, or better than, mid price (which is the
case for certain equity, bond and vanilla derivative markets). For other financial assets and liabilities, bid-offer adjustments are recorded
to reflect the exit level for the expected close out strategy. The methodology for determining the bid-offer adjustment for a derivative
portfolio involves calculating the net risk exposure by offsetting long and short positions by strike and term in accordance with the risk
management and hedging strategy.
Bid-offer levels are generally derived from market quotes such as broker data. Less liquid instruments may not have a directly
observable bid-offer level. In such instances, an exit price adjustment may be derived from an observable bid-offer level for a
comparable liquid instrument, or determined by calibrating to derivative prices, or by scenario or historical analysis.
Exit price adjustments derived from market bid-offer spreads have decreased by £8m to £(569)m.
Discounting approaches for derivative instruments
Collateralised
In line with market practice, the methodology for discounting collateralised derivatives takes into account the nature and currency of
the collateral that can be posted within the relevant credit support annex (CSA). The CSA aware discounting approach recognises the
‘cheapest to deliver’ option that reflects the ability of the party posting collateral to change the currency of the collateral.
Uncollateralised
A fair value adjustment of £(4)m is applied to account for the impact of incorporating the cost of funding into the valuation of
uncollateralised and partially collateralised derivative portfolios and collateralised derivatives where the terms of the agreement do not
allow the rehypothecation of collateral received. The derivative funding adjustment has decreased by £7m to £(4)m .
| | | | | | | | | |
| Climate and sustainability report | | | | | | | Barclays PLC 2023 Annual Report on Form 20-F | |
| |
| | | | | | | | | |
Notes to the financial statements (continued) |
Assets and liabilities held at fair value |
Derivative credit and debit valuation adjustments
Derivative credit valuation adjustments and Derivative debit valuation adjustments are incorporated into derivative valuations to reflect
the impact on fair value of counterparty credit risk and Barclays’ own credit quality respectively. These adjustments are calculated for
uncollateralised and partially collateralised derivatives across all asset classes. Derivative credit valuation adjustments and Derivative
debit valuation adjustments are calculated using estimates of exposure at default, probability of default and recovery rates, at a
counterparty level. Counterparties include (but are not limited to) corporates, sovereigns and sovereign agencies and supranationals.
Exposure at default is generally estimated through the simulation of underlying risk factors through approximating with a more vanilla
structure, or by using current or scenario-based mark to market as an estimate of future exposure.
Probability of default and recovery rate information is generally sourced from the CDS markets. Where this information is not available,
or considered unreliable, alternative approaches are taken based on mapping internal counterparty ratings onto historical or market-
based default and recovery information.
Derivative credit valuation adjustments decreased by £110m to £(209)m as a result of tightening input counterparty credit spreads.
Derivative debit valuation adjustments decreased by £64m to £144m as a result of tightening input Barclays Bank PLC credit spreads .
Correlation between counterparty credit and underlying derivative risk factors, termed ‘wrong-way,’ or ‘right-way’ risk, is not
systematically incorporated into the derivative credit valuation adjustments calculation but is adjusted where the underlying exposure is
directly related to the counterparty.
Barclays continues to monitor market practices and activity to ensure the approach to uncollateralised derivative valuation remains
appropriate.
Portfolio exemptions
The Group uses the portfolio exemption in IFRS 13 Fair Value Measurement to measure the fair value of groups of financial assets and
liabilities. Instruments are measured using the price that would be received to sell a net long position (i.e. an asset) for a particular risk
exposure or to transfer a net short position (i.e. a liability) for a particular risk exposure in an orderly transaction between market
participants at the balance sheet date under current market conditions. Accordingly, the Group measures the fair value of the group of
financial assets and liabilities consistently with how market participants would price the net risk exposure at the measurement date.
Unrecognised gains as a result of the use of valuation models using unobservable inputs
The amount that has yet to be recognised in income that relates to the difference between the transaction price (the fair value at initial
recognition) and the amount that would have arisen had valuation models using unobservable inputs been used on initial recognition,
less amounts subsequently recognised, is £205m (2022: £126m) for financial instruments measured at fair value and £192m (2022:
£216m) for financial instruments carried at amortised cost. There are additions and FX loss of £136m (2022: £59m additions and FX
gains), and amortisation and releases of £57m (2022: £66m) for financial instruments measured at fair value and additions of £0m
(2022: £0m) and amortisation and releases of £24m (2022: £14m) for financial instruments measured at amortised cost.
Third-party credit enhancements
Structured and brokered certificates of deposit issued by Barclays are insured up to $250,000 per depositor by the Federal Deposit
Insurance Corporation (FDIC) in the US. The FDIC is funded by premiums that Barclays and other banks pay for deposit insurance
coverage. The carrying value of these issued certificates of deposit that are designated under the IFRS 9 fair value option includes this
third party credit enhancement. The on-balance sheet value of these brokered certificates of deposit amounted to £5,162m (2022:
£5,197m).
| | | | | | | | | |
| Climate and sustainability report | | | | | | | Barclays PLC 2023 Annual Report on Form 20-F | |
| |
| | | | | | | | | |
Notes to the financial statements (continued) |
Assets and liabilities held at fair value |
Comparison of carrying amounts and fair values for assets and liabilities not held at fair value
The following table summarises the fair value of financial assets and liabilities measured at amortised cost on the Group’s balance
sheet:
| | | | | | | | | | |
| | |
| | | | | | | | | | |
| | | | | | | | | | |
| | | | | | | | | | |
Debt securities at amortised cost | | | | | | | | | | |
Loans and advances at amortised cost | | | | | | | | | | |
Reverse repurchase agreements and other similar secured lending | | | | | | | | | | |
Assets included in disposal groups classified as held for sale | | | | | | | | | | |
| | | | | | | | | | |
| | | | | | | | | | |
Deposits at amortised cost | | | | | | | | | | |
Repurchase agreements and other similar secured borrowing | | | | | | | | | | |
| | | | | | | | | | |
| | | | | | | | | | |
Liabilities included in disposal groups classified as held for sale | | | | | | | | | | |
The fair value is an estimate of the price that would be received to sell an asset or paid to transfer a liability in an orderly transaction
between market participants at the measurement date. As a wide range of valuation techniques are available, it may not be appropriate
to directly compare this fair value information to independent market sources or other financial institutions. Different valuation
methodologies and assumptions can have a significant impact on fair values which are based on unobservable inputs.
Financial assets
Loans and advances at amortised cost
The fair value of loans and advances, for the purpose of this disclosure, is derived from discounting expected cash flows in a way that
reflects the current market price for lending to issuers of similar credit quality. Where market data or credit information on the
underlying borrowers is unavailable, a number of proxy/extrapolation techniques are employed to determine the appropriate discount
rates. For 2023, the fair value is lower than carrying value mainly on fixed rate products driven by rising interest rates. The majority will be
part of a wider portfolio which includes fair valued instruments that are not presented in this table.
Reverse repurchase agreements and other similar secured borrowing
The fair value of reverse repurchase agreements approximates carrying amount as these balances are generally short dated and fully
collateralised.
Financial liabilities
Deposits at amortised cost
In many cases, the fair value disclosed approximates carrying value because the instruments are short term in nature or have interest
rates that reprice frequently, such as customer accounts and other deposits and short-term debt securities.
The fair value for deposits with longer-term maturities, mainly time deposits, are estimated using discounted cash flows applying either
market rates or current rates for deposits of similar remaining maturities. Consequently, the fair value discount is minimal.
Repurchase agreements and other similar secured borrowing
The fair value of repurchase agreements approximates carrying amounts as these balances are generally short dated.
Debt securities in issue
Fair values of other debt securities in issue are based on quoted prices where available, or where the instruments are short dated,
carrying amount approximates fair value.
Subordinated liabilities
Fair values for dated and undated convertible and non-convertible loan capital are based on quoted market rates for the issuer
concerned or issuers with similar terms and conditions.
| | | | | | | | | |
| Climate and sustainability report | | | | | | | Barclays PLC 2023 Annual Report on Form 20-F | |
| |
| | | | | | | | | |
Notes to the financial statements (continued) |
Assets and liabilities held at fair value |
18 Offsetting financial assets and financial liabilities
The Group reports financial assets and financial liabilities on a net basis on the balance sheet only if there is a legally enforceable right to
set-off the recognised amounts and there is intention to settle on a net basis, or to realise the asset and settle the liability
simultaneously. The following table shows the impact of netting arrangements on:
▪all financial assets and liabilities that are reported net on the balance sheet
▪all derivative financial instruments and reverse repurchase and repurchase agreements and other similar secured lending and
borrowing agreements that are subject to enforceable master netting arrangements or similar agreements, but do not qualify for
balance sheet netting.
The ‘Net amounts’ presented are not intended to represent the Group’s actual exposure to credit risk, as a variety of credit mitigation
strategies are employed in addition to netting and collateral arrangements.
| | | | | | | | |
| Amounts subject to enforceable netting arrangements | Amounts not subject to enforceable netting arrangements3 | |
| Effects of offsetting on-balance sheet | Related amounts not offset |
| | | Net amounts reported on the balance sheet | | | |
| | | | | | | | |
| | | | | | | | |
Derivative financial assets | | | | | | | | |
Reverse repurchase agreements and other similar secured lending5 | | | | | | | | |
| | | | | | | | |
Derivative financial liabilities | | | | | | | | |
Repurchase agreements and other similar secured borrowing5 | | | | | | | | |
| | | | | | | | |
| | | | | | | | |
| | | | | | | | |
Derivative financial assets | | | | | | | | |
Reverse repurchase agreements and other similar secured lending5 | | | | | | | | |
| | | | | | | | |
Derivative financial liabilities | | | | | | | | |
Repurchase agreements and other similar secured borrowing5 | | | | | | | | |
| | | | | | | | |
Notes
1Amounts offset for derivative financial assets additionally includes cash collateral netted of £7,527m (2022: £15,199m). Amounts offset for derivative financial liabilities additionally
includes cash collateral netted of £9,067m (2022: £15,098m). Settlements assets and liabilities have been offset amounting to £29,297m (2022: £24,250m).
2Financial collateral of £41,247m (2022: £45,981m) was received in respect of derivative assets, including £31,211m (2022: £34,547m) of cash collateral and £10,036m (2022: £11,434m)
of non-cash collateral. Financial collateral of £27,978m (2022: £26,639m) was placed in respect of derivative liabilities, including £24,260m (2022: £25,222m) of cash collateral and
£3,718m (2022: £1,417m) of non-cash collateral. The collateral amounts are limited to net balance sheet exposure so as to not include overcollateralisation.
3This column includes contractual rights of set-off that are subject to uncertainty under the laws of the relevant jurisdiction.
4The balance sheet total is the sum of ‘Net amounts reported on the balance sheet’ that are subject to enforceable netting arrangements and ‘Amounts not subject to enforceable
netting arrangements’.
5Reverse repurchase agreements and other similar secured lending of £151,725m (2022: £165,457m) is split by fair value £149,131m (2022: £164,681m) and amortised cost £2,594m
(2022: £776m). Repurchase agreements and other similar secured borrowing of £227,316m (2022: £199,798m) is split by fair value £185,715m (2022: £172,746m) and amortised cost
£41,601m (2022: £27,052m).
Derivative assets and liabilities
The ‘Financial instruments’ column identifies financial assets and liabilities that are subject to set-off under netting agreements, such as
the ISDA Master Agreement or derivative exchange or clearing counterparty agreements, whereby all outstanding transactions with
the same counterparty can be offset and close-out netting applied across all outstanding transactions covered by the agreements if an
event of default or other predetermined events occur.
Financial collateral refers to cash and non-cash collateral obtained, typically daily or weekly, to cover the net exposure between
counterparties by enabling the collateral to be realised in an event of default or if other predetermined events occur.
Repurchase and reverse repurchase agreements and other similar secured lending and borrowing
The ‘Financial instruments’ column identifies financial assets and liabilities that are subject to set-off under netting agreements, such as
Global Master Repurchase Agreements and Global Master Securities Lending Agreements, whereby all outstanding transactions with
the same counterparty can be offset and close-out netting applied across all outstanding transactions covered by the agreements if an
event of default or other predetermined events occur.
Financial collateral typically comprises highly liquid securities which are legally transferred and can be liquidated in the event of
counterparty default.
These offsetting and collateral arrangements and other credit risk mitigation strategies used by the Group are further explained in the
Credit risk management section.
| | | | | | | | | |
| Climate and sustainability report | | | | | | | Barclays PLC 2023 Annual Report on Form 20-F | |
| |
| | | | | | | | | |
Notes to the financial statements (continued) |
Assets and liabilities held at fair value |
Assets at amortised cost and other investments
The notes included in this section focus on the Group’s property, plant and equipment, leases and goodwill and intangible assets.
Details regarding the Group’s liquidity and capital position can be found in the Treasury and Capital risk section.
19 Property, plant and equipment
Accounting for property, plant and equipment
Property, plant and equipment is stated at cost, which includes direct and incremental acquisition costs less accumulated depreciation
and provisions for impairment, if required. Subsequent costs are capitalised if these result in enhancement of the asset.
Depreciation is provided on the depreciable amount of items of property, plant and equipment on a straight-line basis over their
estimated useful economic lives. Depreciation rates, methods and the residual values underlying the calculation of depreciation of
items of property, plant and equipment are kept under review to take account of any change in circumstances including consideration
on future Climate and Sustainability investments.
The Group uses the following annual rates in calculating depreciation:
| |
Annual rates in calculating depreciation | |
| |
| |
| Over the remaining life of the lease |
Costs of adaptation of freehold and leasehold property | |
Equipment installed in freehold and leasehold property | |
Computers and similar equipment | |
Fixtures and fittings and other equipment | |
Costs of adaptation and installed equipment are depreciated over the shorter of the life of the lease or the depreciation rates noted in
the table above.
Investment property
The Group initially recognises investment property at cost, and subsequently at fair value at each balance sheet date, reflecting market
conditions at the reporting date. Gains and losses on remeasurement are included in the income statement.
| | | | | | | | | |
| Climate and sustainability report | | | | | | | Barclays PLC 2023 Annual Report on Form 20-F | |
| |
| | | | | | | | | |
Notes to the financial statements (continued) |
Assets at amortised cost and other investments |
| | | | | |
| | | | | |
| | | | | |
| | | | | |
| | | | | |
| | | | | |
| | | | | |
Exchange and other movements | | | | | |
| | | | | |
Accumulated depreciation and impairment | | | | | |
| | | | | |
| | | | | |
| | | | | |
| | | | | |
Exchange and other movements | | | | | |
| | | | | |
| | | | | |
| | | | | |
| | | | | |
| | | | | |
| | | | | |
Exchange and other movements | | | | | |
| | | | | |
Accumulated depreciation and impairment | | | | | |
| | | | | |
| | | | | |
| | | | | |
| | | | | |
Exchange and other movements | | | | | |
| | | | | |
| | | | | |
Notes
1Right of use (ROU) asset balances relate to property leases under IFRS 16. Refer to Note 20 for further details.
2Disposals primarily pertain to fully depreciated assets which are not in use.
Property rentals of £12m (2022: £10m) have been included in other income.
The fair value of investment property is determined by reference to current market prices for similar properties, adjusted as necessary
for condition and location, or by reference to recent transactions updated to reflect current economic conditions. Discounted cash
flow techniques may be employed to calculate fair value where there have been no recent transactions, using current external market
inputs such as market rents and interest rates. Valuations are carried out by management with the support of appropriately qualified
independent valuers.
20 Leases
Accounting for leases
When the Group is the lessee, it is required to recognise both:
▪A lease liability, measured at the present value of remaining cash flows on the lease, and
▪A right of use (ROU) asset, measured at the amount of the initial measurement of the lease liability, plus any lease payments made
prior to commencement date, initial direct costs, and estimated costs of restoring the underlying asset to the condition required by
the lease, less any lease incentives received.
Subsequently the lease liability will increase for the accrual of interest, resulting in a constant rate of return throughout the life of the
lease, and reduce when payments are made. The right of use asset will amortise to the income statement over the life of the lease.
When the lease liability is remeasured, a corresponding adjustment is made to the carrying amount of the ROU asset, or is recorded in
the income statement if the carrying amount of the ROU asset has been reduced to nil.
On the balance sheet, the ROU assets are included within property, plant and equipment and the lease liabilities are included within
other liabilities.
The Group applies the recognition exemption in IFRS 16 for leases with a term not exceeding 12 months. For these leases the lease
payments are recognised as an expense on a straight line basis over the lease term unless another systematic basis is more
appropriate.
| | | | | | | | | |
| Climate and sustainability report | | | | | | | Barclays PLC 2023 Annual Report on Form 20-F | |
| |
| | | | | | | | | |
Notes to the financial statements (continued) |
Assets at amortised cost and other investments |
When the Group is the lessor, the lease must be classified as either a finance lease or an operating lease. A finance lease is a lease which
confers substantially all the risks and rewards of the leased assets on the lessee. An operating lease is a lease where substantially all of
the risks and rewards of the leased asset remain with the lessor.
As a Lessor
Finance lease receivables are included within loans and advances at amortised cost.
The following table sets out a maturity analysis of lease receivables, showing the lease payments to be received after the reporting
date.
| | | | | | | | |
| | |
| Gross investment in finance lease receivables | | Present value of minimum lease payments receivable | Unguaranteed residual values | Gross investment in finance lease receivables | | Present value of minimum lease payments receivable | Unguaranteed residual values |
| | | | | | | | |
| | | | | | | | |
| | | | | | | | |
| | | | | | | | |
| | | | | | | | |
| | | | | | | | |
| | | | | | | | |
| | | | | | | | |
Barclays Asset Finance provided leasing and other asset finance facilities across a broad range of asset types to business and individual
customers. There is no significant impairment allowance for finance lease receivables in current and previous year.
The Group does not have any material operating leases as a lessor.
Finance lease income
Finance lease income is included within interest income. The following table shows amounts recognised in the income statement
during the year.
| | |
| | |
| | |
Finance income from net investment in lease | | |
| | |
As a Lessee
The Group leases various offices, branches and other premises under non-cancellable lease arrangements to meet its operational
business requirements. In some instances, Barclays will sublease property to third parties when it is no longer needed to meet business
requirements. Currently, Barclays does not have any material subleasing arrangements.
ROU asset balances relate to property leases only. Refer to Note 19 for the carrying amount of ROU assets.
The total expenses recognised during the year for short term leases were £2m (2022: £1m). The portfolio of short term leases to which
Barclays is exposed at the end of the year is not dissimilar to the expenses recognised in the year.
| | |
| | |
| | |
| | |
| | |
| | |
| | |
| | |
| | |
Exchange and other movements | | |
As at 31 December (see Note 22) | | |
Note
1Cash payments include one time lease liability payment of £182m related to structural cost action in relation to the real estate review.
| | | | | | | | | |
| Climate and sustainability report | | | | | | | Barclays PLC 2023 Annual Report on Form 20-F | |
| |
| | | | | | | | | |
Notes to the financial statements (continued) |
Assets at amortised cost and other investments |
The below table sets out a maturity analysis of undiscounted lease liabilities, showing the lease payments after the reporting date.
| | |
Undiscounted lease liabilities maturity analysis | | |
| | |
| | |
| | |
| | |
| | |
| | |
| | |
| | |
| | |
Total undiscounted lease liabilities as at 31 December | | |
In addition to the cash flows identified above, Group is exposed to:
▪Variable lease payments: This variability will typically arise from either inflation index instruments or market-based pricing
adjustments. Currently, Barclays has 517 (2022: 401) leases out of the total 756 (2022: 896) leases which have variable lease payment
terms based on market-based pricing adjustments. Of the gross cash flows identified above £1,062m (2022: £1,087m) is attributable
to leases with some degree of variability predominately linked to market-based pricing adjustments.
▪Extension and termination options: The table above represents Barclays' best estimate of future cash outflows for leases, including
assumptions regarding the exercising of contractual extension and termination options. The above gross cash flows have been
reduced by £441m (2022: £516m) for leases where Barclays is highly expected to exercise an early termination option. However,
there is no significant impact where Barclays is expected to exercise an extension option.
In 2023, Group does not have any sale and leaseback transaction (2022: £88m).
The Group does not have any restrictions or covenants imposed by the lessor on its property leases which restrict its businesses.
| | | | | | | | | |
| Climate and sustainability report | | | | | | | Barclays PLC 2023 Annual Report on Form 20-F | |
| |
| | | | | | | | | |
Notes to the financial statements (continued) |
Assets at amortised cost and other investments |
21 Goodwill and intangible assets
Accounting for goodwill and intangible assets
Goodwill
Goodwill arising on the acquisition of subsidiaries represents the excess of the fair value of the purchase consideration over the fair
value of the Group’s share of the assets acquired and the liabilities and contingent liabilities assumed on the date of the acquisition.
Goodwill is reviewed annually for impairment, or more frequently when there are indications that impairment may have occurred. The
test involves comparing the carrying value of a cash generating unit (CGU) including goodwill with the present value of the pre-tax cash
flows, discounted at a rate of interest that reflects the inherent risks, of the CGU to which the goodwill relates, or the CGU's fair value if
this is higher.
Intangible assets
Intangible assets are initially recognised when they are separable or arise from contractual or other legal rights, the cost can be
measured reliably and, in the case of intangible assets not acquired in a business combination, where it is probable that future economic
benefits attributable to the assets will flow from their use.
For internally generated intangible assets, only costs incurred during the development phase are capitalised. Expenditure in the
research phase is expensed when it is incurred.
Intangible assets are stated at cost (which is, in the case of assets acquired in a business combination, the acquisition date fair value)
less accumulated amortisation and impairment, if any, and are amortised over their useful lives in a manner that reflects the pattern to
which they contribute to future cash flows, generally using the amortisation periods set out below:
| |
Annual rates in calculating amortisation | |
| |
Internally generated software1 | |
| |
| |
| |
Note
1Exceptions to the above rate relate to useful lives of certain core banking platforms that are assessed individually and, if appropriate, amortised over longer periods ranging from 10
to 15 years.
Intangible assets are reviewed for impairment when there are indications that impairment may have occurred. Intangible assets not yet
available for use are reviewed annually for impairment.
| | | | | | | | | |
| Climate and sustainability report | | | | | | | Barclays PLC 2023 Annual Report on Form 20-F | |
| |
| | | | | | | | | |
Notes to the financial statements (continued) |
Assets at amortised cost and other investments |
| | | | | | | |
| | | |
| | Internally generated software | | | | | |
| | | | | | | |
| | | | | | | |
| | | | | | | |
| | | | | | | |
| | | | | | | |
| | | | | | | |
Exchange and other movements2 | | | | | | | |
| | | | | | | |
Accumulated amortisation and impairment | | | | | | | |
| | | | | | | |
| | | | | | | |
| | | | | | | |
| | | | | | | |
Exchange and other movements2 | | | | | | | |
| | | | | | | |
| | | | | | | |
| | | | | | | |
| | | | | | | |
| | | | | | | |
| | | | | | | |
Exchange and other movements | | | | | | | |
| | | | | | | |
Accumulated amortisation and impairment | | | | | | | |
| | | | | | | |
| | | | | | | |
| | | | | | | |
| | | | | | | |
Exchange and other movements | | | | | | | |
| | | | | | | |
| | | | | | | |
Notes
1Disposals pertain to fully amortised assets which are not in use.
2In the current year the group has reclassified assets with a total net book value of £412m recognised on balance sheet relating to sign-on bonus payments made to co-brand credit card
partners from Intangible Assets (Licenses and other) to Other Assets. This change in classification has been made to more appropriately reflect the nature of the assets.
The German consumer finance business moved to assets held for sale during the year and this resulted in an impairment of Intangible
assets of £32m.
Goodwill
Goodwill and Intangible assets are allocated to business operations according to business segments as follows:
| | | | | | | | | |
| Climate and sustainability report | | | | | | | Barclays PLC 2023 Annual Report on Form 20-F | |
| |
| | | | | | | | | |
Notes to the financial statements (continued) |
Assets at amortised cost and other investments |
Critical accounting estimates and judgements
Goodwill
Testing goodwill for impairment involves a significant amount of judgement. Goodwill is allocated to CGUs for the purpose of
impairment testing. The review of goodwill for impairment involves calculating a value in use (VIU) valuation which is compared to the
carrying value of a CGU associated with the goodwill to determine whether any impairment has occurred. This includes the
identification of independent CGUs across the organisation and the allocation of goodwill to those CGUs.
The calculation of a value in use contains a high degree of uncertainty in estimating the future cash flows and the rates used to discount
them. Key judgements include determining the carrying value of the CGU, the cash flows and discount rates used in the calculation.
▪The cash flow forecasts used by management involve judgement and are based upon a view of the prospects of the business and
market conditions at the point in time the assessment is prepared, including the potential effect of climate change. The estimation of
cash flows is sensitive to the periods for which detailed forecasts are available and to assumptions regarding long-term sustainable
cash flows.
▪The discount rates applied to the future cash flows also involve judgement as they can have a significant impact on the valuation.
The discount rates used are compared to market participants to ensure that they are appropriate and based on an estimated cost of
equity for each CGU.
▪The choice of a terminal growth rate used to determine the present value of the future cash flows of the CGUs is also a judgement
that can impact the outcome of the assessment. The terminal growth rate and discount rates used may vary due to external market
rates and economic conditions that are beyond management’s control, including the potential effect of climate change.
Further details of some of the key judgements are set out below.
2023 impairment review
The 2023 impairment review was performed during Q4 2023, with the approach and analysis set out below.
Determining the carrying value of CGUs
The carrying value for each CGU is the sum of the tangible equity, goodwill and intangible asset balances associated with that CGU.
The Group manages the assets and liabilities of its CGUs with reference to the tangible equity of the respective businesses. That
tangible equity is derived from the level of risk weighted assets (RWAs) and capital required to be deployed in the CGU and therefore
reflects its relative risk, as well as the level of capital that management consider a market participant would be required to hold and
retain to support business growth.
Goodwill is initially allocated to CGUs or groups of CGUs that are expected to benefit from the synergies of the acquisition that
generated it. Goodwill is only reallocated if there is a change in its use or when reporting structures are altered in a way that changes the
composition of one or more cash-generating units to which goodwill has been allocated. During the year, the Merchant Acquiring
business was split from the Cards & Payments business and was identified as a CGU.
Cash flows
The five-year cash flows used in the calculation are based on the formally agreed medium-term plans approved by the Board. These are
prepared using macroeconomic assumptions which management consider reasonable and supportable, and reflect business agreed
initiatives for the forecast period. The macroeconomic assumptions underpinning the medium term plan were determined during 2023
and management has considered whether there are subsequent significant changes in those assumptions which would adversely
impact the results of the impairment review.
As required by IAS 36, estimates of future cash flows exclude cash inflows or outflows that are expected to arise from restructuring
initiatives where a constructive obligation to carry out the plan does not yet exist.
In line with prior year treatment, the Education, Social Housing and Local Authority (ESHLA) portfolio has been excluded from the
Business Banking CGU cash flows. This is a legacy loan portfolio which was previously within the Non-Core bank and was not part of the
business to which the goodwill relates. As such, the cash flows relating to this portfolio have been excluded from the Business Banking
VIU calculation.
Discount rates
IAS 36 requires that the discount rate used in a value in use calculation reflects the pre-tax rate an investor would require if they were to
choose an investment that would generate similar cash flows to those that the entity expects to generate from the asset. In
determining the discount rate, management identified the cost of equity associated with market participants that closely resemble the
Group's CGUs. The cost of equity has been used as the discount rate in the impairment assessment and applied to the post tax cash
flows of the CGU. This post-tax method incorporates the impact of changing tax rates on the cash flows and is expected to produce
the same VIU result as a pre-tax method adjusted for varying tax rates. Using the resultant VIU the equivalent pre-tax discount rate has
been calculated. The cost of equity rate used for all CGUs in this year’s calculation has been increased to the reflect the relative volatility
of Barclays PLC’s stock price versus the average of our peers. The range of equivalent pre-tax discount rates applicable across the
CGUs range from 14.7% to 18.5% (2022: 14.1% to 16.5%).
Terminal growth rate
The terminal growth rate is used to estimate the effect of projecting cash flows to the end of an asset’s useful economic life. It is
management’s judgement that the cash flows associated with the CGUs will grow in line with the major economies in which the Group
operates. Inflation rates are used as an approximation of future growth rates and form the basis of the terminal growth rates applied.
The terminal growth rate used is 2.0% (2022: 2.0%).
| | | | | | | | | |
| Climate and sustainability report | | | | | | | Barclays PLC 2023 Annual Report on Form 20-F | |
| |
| | | | | | | | | |
Notes to the financial statements (continued) |
Assets at amortised cost and other investments |
Outcome of goodwill and intangibles review
The Personal Banking and Business Banking CGUs carry the majority of the Group’s goodwill balance, predominantly as a consequence
of the Woolwich acquisition. The goodwill within Personal Banking was £3,064m ( 2022: £2,752m), of which £2,501m (2022: £2,501m)
was attributable to Woolwich, and within Business Banking was £629m (2022: £629m), fully attributable to Woolwich.
The largest portion of the Group's intangible assets sits within the Investment Bank CGU, part of Barclays International with an
allocation of £1,043m (2022: £919m).
The recoverable amount for both Personal Banking and Business Banking have decreased in comparison to the 2022 impairment
review, reflective of changes in the interest rate and macroeconomic outlook.
An impairment of £33m of goodwill and £257m of intangible assets has been identified and recognised for the year, fully impairing the
goodwill and intangibles of the Merchant Acquiring CGU. In all other CGUs, the value in use exceeds the carrying value and no
impairment has been identified.
The outcome of the impairment review for Personal Banking, Business Banking, Barclaycard UK and Cards and Payments are set out
below:
| | | | | | | |
| | | | | | Value in use exceeding carrying value | Value in use exceeding carrying value 2022 |
| | | | | | | |
| | | | | | | |
| | | | | | | |
| | | | | | | |
| | | | | | | |
| | | | | | | |
All CGUs showed a reduction in value in use in the period which is mainly attributable to the increase in the discount rates used in the
assessment as a result of increases in interest rates as well as the introduction of the Barclays share price volatility premium.
The value in use for Barclaycard UK has reduced to a level that an adverse movement in any of the key judgement areas would result in
an impairment.
Sensitivity of key judgements
The CGUs are sensitive to possible adverse changes in the key assumptions that support the recoverable amount:
Cash flows: The medium-term plans used to determine the cash flows used in the VIU calculation rely on macroeconomic forecasts,
including interest rates, GDP and unemployment, and forecast levels of market and client activity. Interest rate assumptions impact
planned cash flows from both customer income and structural hedge contributions and therefore cash flow expectations are highly
sensitive to movements in the yield curve. The cash flows also contain assumptions with regard to the prudential and financial conduct
regulatory environment which may be subject to change. Given the current level of economic uncertainty, a 10% reduction in cash
flows has been provided to show the sensitivity of the outcome to a change in these key assumptions.
Discount rate: The discount rate should reflect the market risk-free rate adjusted for the inherent risks of the business it is applied to.
Management have identified discount rates for comparable businesses and consider these to be a reasonable estimate of a suitable
market rate for the profile of the business unit being tested. The risk that these discount rates may not be appropriate is quantified
below and shows the impact of a 100bps change in the discount rate.
Terminal growth rate: The terminal growth rate is used to estimate the cash flows into perpetuity based on the expected longevity of
the CGU's businesses. The terminal growth rate is sensitive to uncertainties in the macroeconomic environment. The risk that using
inflation data may not be appropriate for its determination is quantified below and shows the impact of 100bps change in the terminal
growth rate.
Allocated capital rate: Tangible equity is allocated based on the level of risk weighted assets (RWAs) and capital required to be
deployed in the CGU which is dependent on the relative risk of businesses. The capital ratio used in determining the level of tangible
equity allocated to the CGU and its capital cash flows could move over time. The impact of a 50bps increase in capital ratio is quantified
below.
The sensitivity of the value in use to key judgements in the calculations for certain CGUs holding goodwill balances is set out below:
| | | | | | | | | | | | | |
| | | Value in use exceeding carrying value | | | | Change required to reduce headroom to zero |
100 bps increase in the discount rate | 100 bps decrease in terminal growth rate | 50 bps increase to allocated capital rate | 10% reduction in forecasted cash flows | | | | |
| | | | | | | | | | | | | |
| | | | | | | | | | | | | |
| | | | | | | | | | | | | |
| | | | | | | | | | | | | |
| | | | | | | | | |
| Climate and sustainability report | | | | | | | Barclays PLC 2023 Annual Report on Form 20-F | |
| |
| | | | | | | | | |
Notes to the financial statements (continued) |
Assets at amortised cost and other investments |
Accruals, provisions, contingent liabilities and legal proceedings
The notes included in this section focus on the Group’s accruals, provisions and contingent liabilities. Provisions are recognised for
present obligations arising as consequences of past events where it is probable that a transfer of economic benefit will be necessary to
settle the obligation, and it can be reliably estimated. Contingent liabilities reflect potential liabilities that are not recognised on the
balance sheet.
22 Other liabilities
| | |
| | |
| | |
Accruals and deferred income | | |
| | |
Items in the course of collection due to other banks | | |
Lease liabilities (refer to Note 20) | | |
| | |
23 Provisions
Accounting for provisions
Provisions are recognised for present obligations arising as consequences of past events where it is more likely than not that a transfer
of economic benefit will be necessary to settle the obligation, which can be reliably estimated.
Critical accounting estimates and judgements
The financial reporting of provisions involves a significant degree of judgement and is complex. Identifying whether a present obligation
exists and estimating the probability, timing, nature and quantum of the outflows that may arise from past events requires judgements
to be made based on the specific facts and circumstances relating to individual events and often requires specialist professional advice.
When matters are at an early stage, accounting judgements and estimates can be difficult because of the high degree of uncertainty
involved. Management continues to monitor matters as they develop to re-evaluate on an ongoing basis whether provisions should be
recognised, however there can remain a wide range of possible outcomes and uncertainties, particularly in relation to legal, competition
and regulatory matters, and as a result it is often not practicable to make meaningful estimates even when matters are at a more
advanced stage.
The amount that is recognised as a provision can also be very sensitive to the assumptions made in calculating it. This gives rise to a
large range of potential outcomes which require judgement in determining an appropriate provision level. See Note 25 for more detail of
legal, competition and regulatory matters.
| | | | | |
| | | Legal, competition and regulatory matters | | |
| Redundancy and restructuring | | |
| | | | | |
| | | | | |
| | | | | |
| | | | | |
| | | | | |
Exchange and other movements | | | | | |
| | | | | |
Undrawn contractually committed facilities and guarantees1 | | | | | |
| | | | | |
Net change in expected credit loss provision and other movements | | | | | |
| | | | | |
| | | | | |
| | | | | |
| | | | | |
Note
1Undrawn contractually committed facilities and guarantees provisions are accounted for under IFRS 9. Further analysis of the movement in the expected credit loss provision is
disclosed within the 'Movement in gross exposures and impairment allowance including provisions for loan commitments and financial guarantees' table on page 226. Provisions expected to be recovered or settled within no more than 12 months after 31 December 2023 were £1,357m (2022:
£1,348m).
| | | | | | | | | |
| Climate and sustainability report | | | | | | | Barclays PLC 2023 Annual Report on Form 20-F | |
| |
| | | | | | | | | |
Notes to the financial statements (continued) |
Accruals, provisions, contingent liabilities and legal proceedings |
Redundancy and restructuring
These provisions comprise the estimated cost of restructuring, including redundancy costs where an obligation exists. For example,
when the Group has a detailed formal plan for restructuring a business and has raised valid expectations in those affected by the
restructuring by announcing its main features or starting to implement the plan.
Customer redress
Customer redress provisions comprise the estimated cost of making redress payments to customers, clients and counterparties for
losses or damages associated with inappropriate judgement in the execution of the Group’s business activities.
Legal, competition and regulatory matters
The Group is engaged in various legal proceedings, both in the UK and a number of other overseas jurisdictions, including the US. For
further information in relation to legal proceedings and discussion of the associated uncertainties, refer to Note 25.
Sundry provisions
This category includes provisions that do not fit into any of the other categories, such as fraud losses and dilapidation provisions.
Undrawn contractually committed facilities and guarantees
Impairment allowance under IFRS 9 considers both the drawn and the undrawn counterparty exposure. For retail portfolios, the total
impairment allowance is allocated to the drawn exposure to the extent that the allowance does not exceed the exposure as ECL is not
reported separately. Any excess is reported on the liability side of the balance sheet as a provision. For wholesale portfolios, the
impairment allowance on the undrawn exposure is reported on the liability side of the balance sheet as a provision. For further
information, refer to the Credit risk section for loan commitments and financial guarantees on page 226. 24 Contingent liabilities and commitments
Accounting for contingent liabilities
Contingent liabilities are possible obligations whose existence will be confirmed only by uncertain future events and present obligations
where the transfer of economic resources is uncertain or cannot be reliably measured. Contingent liabilities are not recognised on the
balance sheet but are disclosed unless the likelihood of an outflow of economic resources is remote.
The following table summarises the nominal principal amount of contingent liabilities and commitments which are not recorded on-
balance sheet:
| | |
| | |
| | |
Guarantees and letters of credit pledged as collateral security | | |
Performance guarantees, acceptances and endorsements | | |
Total contingent liabilities and financial guarantees | | |
Of which: Financial guarantees and letters of credit carried at fair value | | |
| | |
Documentary credits and other short-term trade related transactions | | |
Standby facilities, credit lines and other commitments | | |
| | |
Of which: Loan commitments carried at fair value | | |
Provisions for expected credit losses held against contingent liabilities and commitments equal £504m (2022: £583m) and are reported
in Note 23. Further details on contingent liabilities relating to legal and competition and regulatory matters can be found in Note 25.
| | | | | | | | | |
| Climate and sustainability report | | | | | | | Barclays PLC 2023 Annual Report on Form 20-F | |
| |
| | | | | | | | | |
Notes to the financial statements (continued) |
Accruals, provisions, contingent liabilities and legal proceedings |
25 Legal, competition and regulatory matters
The Group faces legal, competition and regulatory challenges, many of which are beyond our control. The extent of the impact of these
matters cannot always be predicted but may materially impact our operations, financial results, condition and prospects. Matters arising
from a set of similar circumstances can give rise to either a contingent liability or a provision, or both, depending on the relevant facts
and circumstances.
The recognition of provisions in relation to such matters involves critical accounting estimates and judgments in accordance with the
relevant accounting policies applicable to Note 24, Provisions. We have not disclosed an estimate of the potential financial impact or
effect on the Group of contingent liabilities where it is not currently practicable to do so. Various matters detailed in this note seek
damages of an unspecified amount. While certain matters specify the damages claimed, such claimed amounts do not necessarily
reflect the Group’s potential financial exposure in respect of those matters.
Matters are ordered under headings corresponding to the financial statements in which they are disclosed.
1. Barclays PLC and Barclays Bank PLC
Investigations into certain advisory services agreements and other proceedings
FCA proceedings
In 2008, Barclays Bank PLC and Qatar Holdings LLC entered into two advisory service agreements (the Agreements). The Financial
Conduct Authority (FCA) conducted an investigation into whether the Agreements may have related to Barclays PLC’s capital raisings
in June and November 2008 (the Capital Raisings) and therefore should have been disclosed in the announcements or public
documents relating to the Capital Raisings. In 2013, the FCA issued warning notices (the Warning Notices) finding that Barclays PLC and
Barclays Bank PLC acted recklessly and in breach of certain disclosure-related listing rules, and that Barclays PLC was also in breach of
Listing Principle 3. The financial penalty provided in the Warning Notices was £50m. Barclays PLC and Barclays Bank PLC contested the
findings. In September 2022, the FCA’s Regulatory Decisions Committee (RDC) issued Decision Notices finding that Barclays PLC and
Barclays Bank PLC breached certain disclosure-related listing rules. The RDC also found that in relation to the disclosures made in the
Capital Raising of November 2008, Barclays PLC and Barclays Bank PLC acted recklessly, and that Barclays PLC breached Listing
Principle 3. The RDC upheld the combined penalty of £50m on Barclays PLC and Barclays Bank PLC, the same penalty as in the Warning
Notices. Barclays PLC and Barclays Bank PLC have referred the RDC’s findings to the Upper Tribunal for reconsideration.
Other proceedings
In November 2023, Barclays received requests for arbitration from two Jersey special purpose vehicles connected to PCP International
Finance Limited asserting claims in relation to the October 2008 capital raising. Barclays is defending these claims.
Investigations into LIBOR and other benchmarks and related civil actions
Regulators and law enforcement agencies, including certain competition authorities, from a number of governments have conducted
investigations relating to Barclays Bank PLC’s involvement in allegedly manipulating certain financial benchmarks, such as LIBOR.
Various individuals and corporates in a range of jurisdictions have threatened or brought civil actions against the Group and other banks
in relation to the alleged manipulation of LIBOR and/or other benchmarks.
USD LIBOR civil actions
The majority of the USD LIBOR cases, which have been filed in various US jurisdictions, have been consolidated for pre-trial purposes in
the US District Court in the Southern District of New York (SDNY). The complaints are substantially similar and allege, among other
things, that Barclays PLC, Barclays Bank PLC, Barclays Capital Inc. (BCI) and other financial institutions individually and collectively
violated provisions of the US Sherman Antitrust Act (Antitrust Act), the US Commodity Exchange Act (CEA), the US Racketeer
Influenced and Corrupt Organizations Act (RICO), the US Securities Exchange Act of 1934 and various state laws by manipulating USD
LIBOR rates.
Putative class actions and individual actions seek unspecified damages with the exception of one lawsuit, in which the plaintiffs are
seeking no less than $100m in actual damages and additional punitive damages against all defendants, including Barclays Bank PLC.
Some of the lawsuits also seek trebling of damages under the Antitrust Act and RICO.
Sterling LIBOR civil actions
In 2016, two putative class actions filed in the SDNY against Barclays Bank PLC, BCI and other Sterling LIBOR panel banks alleging,
among other things, that the defendants manipulated the Sterling LIBOR rate in violation of the Antitrust Act, CEA and RICO, were
consolidated. The defendants’ motion to dismiss the claims was granted in 2018. The plaintiffs have appealed the dismissal.
Japanese Yen LIBOR civil actions
In 2012, a putative class action was filed in the SDNY against Barclays Bank PLC and other Japanese Yen LIBOR panel banks by a lead
plaintiff involved in exchange-traded derivatives and members of the Japanese Bankers Association’s Euroyen Tokyo Interbank
Offered Rate (Euroyen TIBOR) panel. The complaint alleges, among other things, manipulation of the Euroyen TIBOR and Yen LIBOR
rates and breaches of the CEA and the Antitrust Act. In 2014, the court dismissed the plaintiff’s antitrust claims, and, in 2020, the court
dismissed the plaintiff’s remaining CEA claims.
In 2015, a second putative class action, making similar allegations to the above class action, was filed in the SDNY against Barclays PLC,
Barclays Bank PLC and BCI. Barclays and the plaintiffs reached a settlement of $17.75m for both actions, which received final court
approval in March 2023. This matter is now concluded.
ICE LIBOR civil action
In August 2020, an action related to the LIBOR benchmark administered by the Intercontinental Exchange Inc. and certain of its
affiliates (ICE) was filed by a group of individual plaintiffs in the US District Court for the Northern District of California on behalf of
| | | | | | | | | |
| Climate and sustainability report | | | | | | | Barclays PLC 2023 Annual Report on Form 20-F | |
| |
| | | | | | | | | |
Notes to the financial statements (continued) |
Accruals, provisions, contingent liabilities and legal proceedings |
individual borrowers and consumers of loans and credit cards with variable interest rates linked to USD ICE LIBOR. The plaintiffs’ motion
seeking, among other things, preliminary and permanent injunctions to enjoin the defendants from continuing to set LIBOR or enforce
any financial instrument that relies in whole or in part on USD LIBOR was denied. The defendants’ motion to dismiss the case was
granted in September 2022. The plaintiffs filed an amended complaint, which was dismissed in October 2023. The plaintiffs are
appealing the dismissal.
Non-US benchmarks civil actions
There remains one claim, issued in 2017, against Barclays Bank PLC and other banks in the UK in connection with alleged manipulation
of LIBOR. Proceedings have also been brought in a number of other jurisdictions in Europe, Argentina and Israel relating to alleged
manipulation of LIBOR and EURIBOR. Additional proceedings in other jurisdictions may be brought in the future.
Foreign Exchange investigations and related civil actions
The Group has been the subject of investigations in various jurisdictions in relation to certain sales and trading practices in the Foreign
Exchange market. Settlements were reached in various jurisdictions in connection with these investigations, including the EU and US.
The financial impact of any remaining ongoing investigations is not expected to be material to the Group’s operating results, cash flows
or financial position. Various individuals and corporates in a range of jurisdictions have threatened or brought civil actions against the
Group and other banks in relation to alleged manipulation of Foreign Exchange markets.
US FX opt out civil action
In 2018, Barclays Bank PLC and BCI settled a consolidated action filed in the SDNY, alleging manipulation of Foreign Exchange markets
(Consolidated FX Action), for a total amount of $384m. Also in 2018, a group of plaintiffs, who opted out of the Consolidated FX Action,
filed a complaint in the SDNY against Barclays PLC, Barclays Bank PLC, BCI and other defendants. Some of the plaintiffs’ claims were
dismissed in 2020. Barclays PLC, Barclays Bank PLC, and BCI have reached a settlement of all claims against them in the matter. A
settlement payment was made in April 2023 and the matter is now concluded. The financial impact of this settlement is not material to
the Group’s operating results, cash flows or financial position.
US retail basis civil action
In 2015, a putative class action was filed against several international banks, including Barclays PLC and BCI, on behalf of a proposed
class of individuals who exchanged currencies on a retail basis at bank branches (Retail Basis Claims). The SDNY has ruled that the Retail
Basis Claims are not covered by the settlement agreement in the Consolidated FX Action. The Court subsequently dismissed all Retail
Basis Claims against the Group and all other defendants. The plaintiffs filed an amended complaint. The defendants’ motion for
summary judgment was granted in March 2023, dismissing the plaintiffs’ remaining claims. The plaintiffs have appealed the decision.
Non-US FX civil actions
Legal proceedings have been brought or are threatened against Barclays PLC, Barclays Bank PLC, BCI and Barclays Execution Services
Limited (BX) in connection with alleged manipulation of Foreign Exchange in the UK, a number of other jurisdictions in Europe, Israel,
Brazil and Australia. Additional proceedings may be brought in the future.
The above-mentioned proceedings include two purported class actions filed against Barclays PLC, Barclays Bank PLC, BX, BCI and
other financial institutions in the UK Competition Appeal Tribunal (CAT) in 2019. The CAT refused to certify these claims in the first
quarter of 2022. In July 2023 (as amended in November 2023), the Court of Appeal overturned the CAT’s decision and found that the
claims should be certified on an opt out basis. The Court of Appeal upheld the CAT’s determination as to which of the two purported
class representatives should be chosen to bring the claim. Subject to any further appeal, only the claim brought by the chosen class
representative will now proceed in the CAT. Also in 2019, a separate claim was filed in the UK in the High Court of Justice (High Court),
and subsequently transferred to the CAT, by various banks and asset management firms against Barclays Bank PLC and other financial
institutions alleging breaches of European and UK competition laws related to FX trading. This claim has been settled as part of the
settlement payment referred to under the US FX opt out civil action above and the matter is now concluded.
Metals-related civil actions
A US civil complaint alleging manipulation of the price of silver in violation of the CEA, the Antitrust Act and state antitrust and consumer
protection laws was brought by a proposed class of plaintiffs against a number of banks, including Barclays Bank PLC, BCI and BX, and
transferred to the SDNY. The complaint was dismissed against these Barclays entities and certain other defendants in 2018, and
against the remaining defendants in May 2023. The plaintiffs have appealed the dismissal of the complaint against all defendants.
Civil actions have also been filed in Canadian courts against Barclays PLC, Barclays Bank PLC, Barclays Capital Canada Inc. and BCI on
behalf of proposed classes of plaintiffs alleging manipulation of gold and silver prices.
US residential mortgage related civil actions
There are two US Residential Mortgage-Backed Securities (RMBS) related civil actions arising from unresolved repurchase requests
submitted by Trustees for certain RMBS, alleging breaches of various loan-level representations and warranties (R&Ws) made by
Barclays Bank PLC and/or a subsidiary acquired in 2007. In one action, the parties have agreed to settle the litigation. The financial
impact of the settlement is not material to the Group’s operating results, cash flows or financial position. Barclays’ motion to dismiss
the other repurchase action was denied in October 2023. Barclays is appealing the decision.
Government and agency securities civil actions
Treasury auction securities civil actions
Consolidated putative class action complaints filed in US federal court against Barclays Bank PLC, BCI and other financial institutions
under the Antitrust Act and state common law allege that the defendants (i) conspired to manipulate the US Treasury securities market
and/or (ii) conspired to prevent the creation of certain platforms by boycotting or threatening to boycott such trading platforms. The
court dismissed the consolidated action in March 2021.The plaintiffs filed an amended complaint. The defendants’ motion to dismiss
| | | | | | | | | |
| Climate and sustainability report | | | | | | | Barclays PLC 2023 Annual Report on Form 20-F | |
| |
| | | | | | | | | |
Notes to the financial statements (continued) |
Accruals, provisions, contingent liabilities and legal proceedings |
the amended complaint was granted in March 2022. The plaintiffs appealed this decision, and in February 2024 the appellate court
affirmed the dismissal.
In addition, certain plaintiffs have filed a related, direct action against BCI and certain other financial institutions, alleging that defendants
conspired to fix and manipulate the US Treasury securities market in violation of the Antitrust Act, the CEA and state common law. This
action remains stayed.
Supranational, Sovereign and Agency bonds civil actions
Civil antitrust actions have been filed in the SDNY and Federal Court of Canada in Toronto against Barclays Bank PLC, BCI, BX, Barclays
Capital Securities Limited and, with respect to the civil action filed in Canada only, Barclays Capital Canada, Inc. and other financial
institutions alleging that the defendants conspired to fix prices and restrain competition in the market for US dollar-denominated
Supranational, Sovereign and Agency bonds. The SDNY actions were dismissed and these matters are now concluded.
In the Federal Court of Canada action, the parties have reached a settlement in principle, which will require court approval. The financial
impact of the settlement is not expected to be material to the Group’s operating results, cash flows or financial position.
Variable Rate Demand Obligations civil actions
Civil actions have been filed against Barclays Bank PLC and BCI and other financial institutions alleging the defendants conspired or
colluded to artificially inflate interest rates set for Variable Rate Demand Obligations (VRDOs). VRDOs are municipal bonds with interest
rates that reset on a periodic basis, most commonly weekly. Two actions in state court have been filed by private plaintiffs on behalf of
the states of Illinois and California. Three putative class action complaints have been consolidated in the SDNY. In the consolidated
SDNY class action, certain of the plaintiffs’ claims were dismissed in November 2020 and June 2022 and the plaintiffs’ motion for class
certification was granted in September 2023, which means the case may proceed as a class action. The defendants are appealing this
decision. In the California action, the California appeals court reversed the dismissal of the plaintiffs’ claims in April 2023. In the Illinois
action, the defendants reached a settlement with the Attorney General for the State of Illinois to resolve the litigation. The court
approved the settlement in October 2023 and dismissed the matter. The financial impact of the settlement is not material to the
Group’s operating results, cash flows or financial position. This matter is now concluded.
Odd-lot corporate bonds antitrust class action
In 2020, BCI, together with other financial institutions, were named as defendants in a putative class action. The complaint alleges a
conspiracy to boycott developing electronic trading platforms for odd-lots and price fixing. The plaintiffs demand unspecified money
damages. The defendants’ motion to dismiss was granted in 2021 and the plaintiffs have appealed the dismissal.
Credit Default Swap civil action
A putative antitrust class action is pending in New Mexico federal court against Barclays Bank PLC, BCI and various other financial
institutions. The plaintiffs, the New Mexico State Investment Council and certain New Mexico pension funds, allege that the defendants
conspired to manipulate the benchmark price used to value Credit Default Swap (CDS) contracts at settlement (i.e. the CDS final
auction price). The plaintiffs allege violations of US antitrust laws and the CEA, and unjust enrichment under state law. The defendants’
motion to dismiss was denied in June 2023.
Interest rate swap and credit default swap US civil actions
Barclays PLC, Barclays Bank PLC and BCI, together with other financial institutions that act as market makers for interest rate swaps
(IRS), are named as defendants in several antitrust actions, including one putative class action and individual actions brought by certain
swap execution facilities, which are consolidated in the SDNY. The complaints allege the defendants conspired to prevent the
development of exchanges for IRS and demand unspecified money damages. The plaintiffs’ motion for class certification was denied in
December 2023, meaning the case cannot proceed as a class action. The plaintiffs have sought the court’s leave to appeal that
decision.
In 2017, Tera Group Inc. (Tera) filed a separate civil antitrust action in the SDNY claiming that certain conduct alleged in the IRS cases
also caused Tera to suffer harm with respect to the Credit Default Swaps market. In 2019, the court dismissed Tera’s claims for unjust
enrichment and tortious interference but denied motions to dismiss the antitrust claims. Tera filed an amended complaint in January
2020. Barclays’ motion to dismiss all claims was granted in August 2023. Tera has filed a Notice of Appeal.
BDC Finance L.L.C.
In 2008, BDC Finance L.L.C. (BDC) filed a complaint in the Supreme Court of the State of New York (NY Supreme Court), demanding
damages of $298m, alleging that Barclays Bank PLC had breached a contract in connection with a portfolio of total return swaps
governed by an ISDA Master Agreement (the Master Agreement). Following a trial, the court ruled in 2018 that Barclays Bank PLC was
not a defaulting party, which was affirmed on appeal. In April 2021, the trial court entered judgment in favour of Barclays Bank PLC for
$3.3m and as yet to be determined legal fees and costs. BDC appealed. In January 2022, the appellate court reversed the trial court’s
summary judgment decision in favour of Barclays Bank PLC and remanded the case to the lower court for further proceedings. The
parties filed cross-motions on the scope of trial. In January 2024, the court ruled in Barclays’ favour. BDC is appealing, and the trial is
adjourned until the appeal is decided.
In 2011, BDC’s investment advisor, BDCM Fund Adviser, LLC and its parent company, Black Diamond Capital Holdings, LLC, also sued
Barclays Bank PLC and BCI in Connecticut State Court for unspecified damages allegedly resulting from Barclays Bank PLC’s conduct
relating to the Master Agreement, asserting claims for violation of the Connecticut Unfair Trade Practices Act and tortious interference
with business and prospective business relations. This case has been withdrawn.
| | | | | | | | | |
| Climate and sustainability report | | | | | | | Barclays PLC 2023 Annual Report on Form 20-F | |
| |
| | | | | | | | | |
Notes to the financial statements (continued) |
Accruals, provisions, contingent liabilities and legal proceedings |
Civil actions in respect of the US Anti-Terrorism Act
Eight civil actions, on behalf of more than 4,000 plaintiffs, were filed in US federal courts in the US District Court in the Eastern District of
New York (EDNY) and SDNY against Barclays Bank PLC and a number of other banks. The complaints generally allege that Barclays Bank
PLC and those banks engaged in a conspiracy to facilitate US dollar-denominated transactions for the Iranian Government and various
Iranian banks, which in turn funded acts of terrorism that injured or killed the plaintiffs or the plaintiffs’ family members. The plaintiffs
seek to recover damages for pain, suffering and mental anguish under the provisions of the US Anti-Terrorism Act, which allow for the
trebling of any proven damages.
The court granted the defendants’ motions to dismiss three out of the six actions in the EDNY. The plaintiffs appealed in one action and
the dismissal was affirmed, and judgment was entered, in January 2023. The court has given the plaintiffs until February 2024 to make a
motion to vacate the judgment. The other two dismissed actions in the EDNY were consolidated into one action. The plaintiffs in that
action, and in one other action in the EDNY, filed amended complaints in December 2023. The two other actions in the EDNY are
currently stayed. Out of the two actions in the SDNY, the court granted the defendants’ motion to dismiss the first action. That action is
stayed, and the second SDNY action is stayed pending any appeal on the dismissal of the first.
Shareholder derivative action
In November 2020, a purported Barclays shareholder filed a putative derivative action in New York state court against BCI and a number
of current and former members of the Board of Directors of Barclays PLC and senior executives or employees of the Group. The
shareholder filed the claim on behalf of nominal defendant Barclays PLC, alleging that the individual defendants harmed the company
through breaches of their duties, including under the Companies Act 2006. The plaintiff seeks damages on behalf of Barclays PLC for
the losses that Barclays PLC allegedly suffered as a result of these alleged breaches. An amended complaint was filed in April 2021,
which BCI and certain other defendants moved to dismiss. The motion to dismiss was granted in April 2022. The plaintiff appealed the
decision, and the dismissal was unanimously affirmed in June 2023 by the First Judicial Department in New York. The plaintiff has sought
leave to appeal the First Judicial Department’s decision to the New York Court of Appeals.
Derivative transactions civil action
In 2021, Vestia, a Dutch housing association, brought a claim against Barclays Bank PLC in the UK in the High Court in relation to a series
of derivative transactions entered into with Barclays Bank PLC between 2008 and 2011, seeking damages of £329m. Barclays Bank PLC
is defending the claim and has made a counterclaim.
Skilled person review in relation to historic timeshare loans and associated matters
Clydesdale Financial Services Limited (CFS), which trades as Barclays Partner Finance and houses Barclays’ point-of-sale finance
business, was required by the FCA to undertake a skilled person review in 2020 following concerns about historic affordability
assessments for certain loans to customers in connection with timeshare purchases. The skilled person review was concluded in 2021.
CFS complied fully with the skilled person review requirements, including carrying out certain remediation measures. CFS was not
required to conduct a full back book review. Instead, CFS reviewed limited historic lending to ascertain whether its practices caused
customer harm and is remediating any examples of harm. This work was substantially completed during 2023, utilising provisions
booked to account for any remediations.
Motor finance commission arrangements
In January 2024, the FCA announced that it was appointing a skilled person to undertake a review of the historical use of discretionary
commission arrangements and sales in the motor finance market across several firms. This follows two final decisions by the UK
Financial Ombudsman Service (FOS), including one upholding a complaint against CFS in relation to commission arrangements and
disclosure in the sale of motor finance products and a number of complaints and court claims, including some against CFS. Barclays will
co-operate fully with the FCA’s skilled person review, the outcome of which is unknown, including any potential financial impact. The
FCA plans to set out next steps on this matter by the end of September 2024. Barclays ceased operating in the motor finance market in
late 2019.
Over-issuance of securities in the US
In March 2022, executive management became aware that Barclays Bank PLC had issued securities materially in excess of the set
amount under its US shelf registration statements. As a result, Barclays Bank PLC commenced a rescission offer on 1 August 2022, by
which Barclays Bank PLC offered to repurchase relevant affected securities from certain holders, which expired on 12 September 2022.
Further, in September 2022, the SEC announced the resolution of its investigation of Barclays PLC and Barclays Bank PLC relating to
such over-issuance of securities.
In September 2022, a purported class action claim was filed in the US District Court in Manhattan seeking to hold Barclays PLC, Barclays
Bank PLC and former and current executives responsible for declines in the price of Barclays PLC’s American depositary receipts, which
the plaintiffs claim occurred as a result of alleged misstatements and omissions in its public disclosures. The defendants have moved to
dismiss the case. In addition, holders of a series of ETNs have brought claims against Barclays PLC, Barclays Bank PLC, and former and
current executives and board members in the US alleging, among other things, that Barclays’ failure to disclose that these ETNs were
unregistered securities misled investors and that, as a result, Barclays is liable for the holders’ alleged losses following the suspension of
further sales and issuances of such series of ETNs. Two such actions are purported class actions that have been consolidated into a
single action in federal court in New York. Barclays has moved to dismiss the complaint.
Any liabilities, claims or actions in connection with the over-issuance of securities under Barclays Bank PLC’s US shelf registration
statements could have an adverse effect on the Group’s business, financial condition, results of operations and reputation as a
frequent issuer in the securities markets.
| | | | | | | | | |
| Climate and sustainability report | | | | | | | Barclays PLC 2023 Annual Report on Form 20-F | |
| |
| | | | | | | | | |
Notes to the financial statements (continued) |
Accruals, provisions, contingent liabilities and legal proceedings |
2. Barclays PLC, Barclays Bank PLC and Barclays Bank UK PLC
HM Revenue & Customs (HMRC) assessments concerning UK Value Added Tax
In 2018, HMRC issued notices that have the effect of either removing certain Barclays overseas subsidiaries that have operations in the
UK from Barclays’ UK VAT group or preventing them from joining it. Supplies between members of a UK VAT group are generally free
from VAT. The notices had both retrospective and prospective effect. Barclays has appealed HMRC’s decisions to the First Tier
Tribunal (Tax Chamber) in relation to both the retrospective VAT assessments and the on-going VAT payments made since 2018.
£181m of VAT (inclusive of interest) was assessed retrospectively by HMRC covering the periods 2014 to 2018, of which approximately
£128m is expected to be attributed to Barclays Bank UK PLC and £53m to Barclays Bank PLC. This retrospectively assessed VAT was
paid in 2018 and an asset, adjusted to reflect expected eventual recovery, is recognised. Since 2018 Barclays has paid, and recognised
as an expense, VAT on intra-group supplies from the relevant subsidiaries to the members of the VAT group.
FCA investigation into transaction monitoring
The FCA has been investigating Barclays’ compliance with UK money laundering regulations and the FCA’s rules and Principles for
Businesses in an enforcement investigation which is focussed on aspects of Barclays’ transaction monitoring in relation to certain
business lines now in Barclays Bank UK PLC. The FCA has informed Barclays that it is closing the enforcement investigation into this
matter.
3. Barclays PLC
Civil action in respect of Barclays’ statements regarding the relationship between its former CEO and Jeffrey Epstein
In November 2023, a purported class action was filed in federal court in California against Barclays PLC and a number of current and
former members of the Board of Directors of Barclays PLC. The complaint seeks to hold the defendants responsible for declines in the
price of Barclays PLC’s American depositary receipts, which the plaintiffs claim occurred as a result of alleged misstatements and
omissions in Barclays’ public disclosures relating to its former CEO’s relationship with Jeffrey Epstein.
Alternative trading systems
In 2020, a claim was brought against Barclays PLC in the UK in the High Court by various shareholders regarding Barclays PLC’s share
price based on the allegations contained within a complaint by the New York State Attorney General (NYAG) in 2014. Such claim was
settled in 2016, as previously disclosed. The more recent claim seeks unquantified damages and Barclays is defending the claim. The
NYAG complaint was filed against Barclays PLC and BCI in the NY Supreme Court alleging, among other things, that Barclays PLC and
BCI engaged in fraud and deceptive practices in connection with LX, BCI’s SEC-registered alternative trading system.
General
The Group is engaged in various other legal, competition and regulatory matters in the UK, the US and a number of other overseas
jurisdictions. It is subject to legal proceedings brought by and against the Group which arise in the ordinary course of business from time
to time, including (but not limited to) disputes in relation to contracts, securities, guarantees, debt collection, consumer credit, fraud,
trusts, client assets, competition, data management and protection, intellectual property, money laundering, financial crime,
employment, environmental and other statutory and common law issues.
The Group is also subject to enquiries and examinations, requests for information, audits, investigations and legal and other
proceedings by regulators, governmental and other public bodies in connection with (but not limited to) consumer protection
measures, measures to combat money laundering and financial crime, compliance with legislation and regulation, wholesale trading
activity and other areas of banking and business activities in which the Group is or has been engaged. The Group is cooperating with the
relevant authorities and keeping all relevant agencies briefed as appropriate in relation to these matters and others described in this
note on an ongoing basis.
At the present time, Barclays PLC does not expect the ultimate resolution of any of these other matters to have a material adverse
effect on the Group’s financial position. However, in light of the uncertainties involved in such matters and the matters specifically
described in this note, there can be no assurance that the outcome of a particular matter or matters (including formerly active matters
or those matters arising after the date of this note) will not be material to Barclays PLC’s results, operations or cash flows for a particular
period, depending on, among other things, the amount of the loss resulting from the matter(s) and the amount of profit otherwise
reported for the reporting period.
| | | | | | | | | |
| Climate and sustainability report | | | | | | | Barclays PLC 2023 Annual Report on Form 20-F | |
| |
| | | | | | | | | |
Notes to the financial statements (continued) |
Accruals, provisions, contingent liabilities and legal proceedings |
Capital instruments, equity and reserves
The notes included in this section focus on the Group’s loan capital and shareholders’ equity including issued share capital, retained
earnings, other equity balances and interests of minority shareholders in our subsidiary entities (non-controlling interests). For more
information on capital management and how the Group maintains sufficient capital to meet our regulatory requirements refer to the
Capital risk management section.
26 Subordinated liabilities
Accounting for subordinated liabilities
Subordinated liabilities are measured at amortised cost using the effective interest method under IFRS 9.
Issuances of £1,523m comprise £1,180m USD 7.119% Fixed-to-Floating Rate Subordinated Callable Notes, issued externally by
Barclays PLC, £315m USD Floating Rate Notes, and £28m JPY Floating Rate Notes issued externally by Barclays subsidiaries.
Redemptions of £2,239m comprise £1,345m EUR 2% Fixed Rate Subordinated Notes and £599m partial repurchase of USD 4.375%
Fixed Rate Subordinated Notes issued externally by Barclays PLC, £194m USD Floating Rate Notes and £28m JPY Floating Rate Notes
issued externally by Barclays subsidiaries, £43m EUR Subordinated Floating Rate Notes and £30m USD Junior Undated Floating Rate
Notes issued externally by Barclays Bank PLC.
Other movements predominantly comprise foreign exchange movements and fair value hedge adjustments.
Subordinated liabilities include accrued interest and comprise undated and dated subordinated liabilities as follows:
| | |
| | |
| | |
Undated subordinated liabilities | | |
Dated subordinated liabilities | | |
Total subordinated liabilities | | |
None of the Group’s subordinated liabilities are secured.
| | | |
Undated subordinated liabilities1 | | | |
| | | |
| | | |
| | | |
| | | |
Junior Undated Floating Rate Notes (USD 38m) | Any interest payment date | | |
Total undated subordinated liabilities | | | |
Note
1Instrument values are disclosed to the nearest million.
| | | | | | | | | |
| Climate and sustainability report | | | | | | | Barclays PLC 2023 Annual Report on Form 20-F | |
| |
| | | | | | | | | |
Notes to the financial statements (continued) |
Capital instruments, equity and reserves |
| | | | |
Dated subordinated liabilities1 | | | | |
| | | | |
| | | | |
| | | | |
2% Fixed Rate Subordinated Callable Notes (EUR 1,500m) | | | | |
4.375% Fixed Rate Subordinated Notes (USD 1,250m) | | | | |
3.75% Fixed Rate Resetting Subordinated Callable Notes (GBP 500m) | | | | |
3.75% Fixed Rate Resetting Subordinated Callable Notes (SGD 200m) | | | | |
5.20% Fixed Rate Subordinated Notes (USD 2,050m) | | | | |
1.125% Fixed Rate Resetting Subordinated Callable Notes (EUR 1,000m) | | | | |
4.836% Fixed Rate Subordinated Callable Notes (USD 2,000m) | | | | |
8.407% Fixed Rate Resetting Subordinated Callable Notes (GBP 1,000m) | | | | |
5.088% Fixed-to-Floating Rate Subordinated Callable Notes (USD 1,500m) | | | | |
3.564% Fixed Rate Resetting Subordinated Callable Notes (USD 1,000m) | | | | |
7.119% Fixed-to-Floating Rate Subordinated Callable Notes (USD 1,500m) | | | | |
3.811% Fixed Rate Resetting Subordinated Callable Notes (USD 1,000m) | | | | |
| | | | |
Subordinated Floating Rate Notes (EUR 50m) | | | | |
5.75% Fixed Rate Subordinated Notes | | | | |
5.4% Reverse Dual Currency Subordinated Loan (JPY 15,000m) | | | | |
| | | | |
Subordinated Floating Rate Notes (EUR 68m) | | | | |
External issuances by other subsidiaries | | | | |
Total dated subordinated liabilities | | | | |
Note
1Instrument values are disclosed to the nearest million.
Dated subordinated liabilities
Dated subordinated liabilities are issued by Barclays PLC, Barclays Bank PLC and its subsidiaries for the development and expansion of
their businesses and to strengthen their respective capital bases. The principal terms of the dated subordinated liabilities are described
below:
Subordination
Dated subordinated liabilities issued by Barclays PLC ranks behind the claims against Barclays PLC of unsecured unsubordinated
creditors but before the claims of the holders of its equity.
All dated subordinated liabilities externally issued by Barclays Bank PLC rank behind the claims against Barclays Bank PLC of depositors
and other unsecured unsubordinated creditors but before the claims of the holders of its equity. The dated subordinated liabilities
externally issued by other subsidiaries are similarly subordinated as the external subordinated liabilities issued by Barclays Bank PLC.
Interest
Interest on the Floating Rate Notes is fixed periodically in advance, based on the related market rates.
Interest on Fixed Rate Notes is set by reference to market rates at the time of issuance and fixed until maturity.
Interest on the 4.836% USD Fixed Rate Subordinated Callable Notes, 3.75% SGD Fixed Rate Resetting Subordinated Callable Notes,
3.75% GBP Fixed Rate Resetting Subordinated Callable Notes, 3.811% USD Fixed Rate Resetting Subordinated Callable notes, 1.125%
EUR Fixed Rate Resetting Subordinated Callable Notes, 3.564% USD Fixed Rate Resetting Subordinated Callable Notes, and the
8.407% GBP Fixed Rate Resetting Subordinated Callable Notes are fixed until the call date. After the respective call dates, in the event
that they are not redeemed, the interest rates will be reset and fixed until maturity based on a market rate. Interest on the 5.088% USD
Fixed-to-Floating Rate Subordinated Callable Notes and 7.119% USD Fixed-to-Floating Rate Subordinated Callable Notes are fixed
until the call date. After the call date, in the event that they are not redeemed, the interest rate will reset periodically in advance based
on market rates.
Repayment
Those subordinated liabilities with a call date are repayable at the option of the issuer on such call date in accordance with the
conditions governing the respective debt obligations, some in whole or in part, and some only in whole. The remaining dated
subordinated liabilities outstanding at 31 December 2023 are redeemable only on maturity, subject in particular cases to provisions
allowing an early redemption in the event of certain changes in tax law, or to certain changes in legislation or regulations.
Any repayments prior to maturity require, in the case of Barclays PLC and Barclays Bank PLC, the prior consent of the PRA, or in the
case of the overseas issues, the approval of the local regulator for that jurisdiction and of the PRA in certain circumstances.
There are no committed facilities in existence at the balance sheet date which permit the refinancing of debt beyond the date of
maturity.
| | | | | | | | | |
| Climate and sustainability report | | | | | | | Barclays PLC 2023 Annual Report on Form 20-F | |
| |
| | | | | | | | | |
Notes to the financial statements (continued) |
Capital instruments, equity and reserves |
27 Ordinary shares, share premium, and other equity
| | | | | |
Called up share capital, allotted and fully paid | | | | | |
| | | | Total share capital and share premium | |
| | | | | |
| | | | | |
Issued to staff under share incentive plans | | | | | |
| | | | | |
AT1 securities redemption | | | | | |
| | | | | |
| | | | | |
| | | | | |
| | | | | |
| | | | | |
Issued to staff under share incentive plans | | | | | |
| | | | | |
AT1 securities redemption | | | | | |
| | | | | |
| | | | | |
| | | | | |
Called up share capital
Called up share capital comprises 15,155m (2022: 15,871m) ordinary shares of 25p each.
Share repurchase
At the 2023 AGM on 3 May 2023, Barclays PLC was authorised to repurchase up to an aggregate of 1,587m of its ordinary shares of
25p. The authorisation is effective until the AGM in 2024 or the close of business on 30 June 2024, whichever is the earlier. During 2023,
837m shares were repurchased with a total nominal value of £209m (2022: 931m shares with a nominal value of £233m).
Other equity instruments
Other equity instruments of £13,259m (2022: £13,284m) include AT1 securities issued by Barclays PLC. The AT1 securities are
perpetual securities with no fixed maturity and are structured to qualify as AT1 instruments under prevailing capital rules applicable as at
the relevant issue date.
In 2023, there were three issuances of AT1 instruments, in the form of Fixed Rate Resetting Perpetual Subordinated Contingent
Convertible Securities, for £3,140m (2022: three issuances for £3,158m) which includes issuance costs of £10m (2022: £9m). There
were two redemptions in 2023 totalling £3,170m (2022: two redemptions totalling £2,126m).
| | | |
| | | |
| | | |
| | | |
AT1 equity instruments - Barclays PLC | | | |
7.25% Perpetual Subordinated Contingent Convertible Securities1 | | | |
7.75% Perpetual Subordinated Contingent Convertible Securities (USD 2,500m) | | | |
5.875% Perpetual Subordinated Contingent Convertible Securities1 | | | |
8% Perpetual Subordinated Contingent Convertible Securities (USD 2,000m) | | | |
7.125% Perpetual Subordinated Contingent Convertible Securities1 | | | |
6.375% Perpetual Subordinated Contingent Convertible Securities | | | |
6.125% Perpetual Subordinated Contingent Convertible Securities (USD 1,500m) | | | |
8.300% Perpetual Subordinated Contingent Convertible Securities (SGD 450m) | | | |
8.875% Perpetual Subordinated Contingent Convertible Securities | | | |
4.375% Perpetual Subordinated Contingent Convertible Securities (USD 1,500m)1 | | | |
9.250% Perpetual Subordinated Contingent Convertible Securities | | | |
7.300% Perpetual Subordinated Contingent Convertible Securities (SGD 400m) | | | |
8.000% Perpetual Subordinated Contingent Convertible Securities (USD 2,000m)1 | | | |
9.625% Perpetual Subordinated Contingent Convertible Securities (USD 1,750m) | | | |
Total AT1 equity instruments | | | |
Note
1Reported net of securities held by the Group.
| | | | | | | | | |
| Climate and sustainability report | | | | | | | Barclays PLC 2023 Annual Report on Form 20-F | |
| |
| | | | | | | | | |
Notes to the financial statements (continued) |
Capital instruments, equity and reserves |
The principal terms of the AT1 securities are described below:
▪AT1 securities rank behind the claims against Barclays PLC of i) unsubordinated creditors; ii) claims which are expressed to be
subordinated to the claims of unsubordinated creditors of Barclays PLC but not further or otherwise; or iii) claims which are, or are
expressed to be, junior to the claims of other creditors of Barclays PLC, whether subordinated or unsubordinated, other than claims
which rank, or are expressed to rank, pari passu with, or junior to, the claims of holders of the AT1 securities.
▪AT1 securities are undated and are redeemable, at the option of Barclays PLC, in whole on (i) the initial reset date, or on any fifth
anniversary after the initial reset date or (ii) any day falling in a named period ending on the initial reset date, or on any fifth anniversary
after the initial reset date. In addition, the AT1 securities are redeemable, at the option of Barclays PLC, in whole in the event of
certain changes in the tax or regulatory treatment of the securities. Any redemptions require the prior consent of the PRA.
▪Interest on the AT1 securities will be due and payable only at the sole discretion of Barclays PLC, and Barclays PLC has sole and
absolute discretion at all times and for any reason to cancel (in whole or in part) any interest payment that would otherwise be payable
on any interest payment date.
28 Reserves
Currency translation reserve
The currency translation reserve represents the cumulative gains and losses on the retranslation of the Group’s net investment in
foreign operations, net of the effects of hedging.
Fair value through other comprehensive income reserve
The fair value through other comprehensive income reserve represents the changes in the fair value of financial instruments accounted
for at fair value through other comprehensive income investments since initial recognition.
Cash flow hedging reserve
The cash flow hedging reserve represents the cumulative gains and losses on effective cash flow hedging instruments that will be
recycled to profit or loss when the hedged transactions affect profit or loss.
Own credit reserve
The own credit reserve reflects the cumulative own credit gains and losses on financial liabilities at fair value. Amounts in the own credit
reserve are not recycled to profit or loss in future periods.
Other reserves and treasury shares
Other reserves relate to redeemed ordinary and preference shares issued by the Group.
Treasury shares relate to Barclays PLC shares held in relation to the Group’s various share schemes. These schemes are described in
Note 31. Treasury shares are deducted from shareholders’ equity within other reserves. A transfer is made to retained earnings in line
with the vesting of treasury shares held for the purposes of share-based payments.
| | |
| | |
| | |
Currency translation reserve | | |
Fair value through other comprehensive income reserve | | |
Cash flow hedging reserve | | |
| | |
Other reserves and treasury shares | | |
| | |
| | | | | | | | | |
| Climate and sustainability report | | | | | | | Barclays PLC 2023 Annual Report on Form 20-F | |
| |
| | | | | | | | | |
Notes to the financial statements (continued) |
Capital instruments, equity and reserves |
29 Non-controlling interests
| | | | | | |
| Profit attributable to non-controlling interest | Equity attributable to non-controlling interest | Dividends paid to non-controlling interest |
| | | | | | |
| | | | | | |
Barclays Bank PLC issued: | | | | | | |
| | | | | | |
– Upper Tier 2 instruments | | | | | | |
Other non-controlling interests | | | | | | |
| | | | | | |
In 2023, there were no issuances (2022: none) and three redemptions of £312m (2022: £20m) relating to the Undated Floating Rate
Primary Capital Notes Series 1 (£93m) and Series 2 (£179m) and 9% Permanent Interest Bearing Capital Bonds (£40m)
Barclays Bank PLC and protective rights of non-controlling interests
Barclays PLC holds 100% of the voting rights of Barclays Bank PLC. As at 31 December 2023, Barclays Bank PLC has in issue preference
shares and Upper Tier 2 instruments. These are non-controlling interests to the Group.
A fixed coupon rate is attached to all Upper Tier 2 instruments until the initial call date.
After the initial call date, in the event they are not redeemed, coupon payments in relation to the 6.125% Undated Notes are fixed
periodically in advance for five-year periods based on market rates. Coupon payments for all other Upper Tier 2 instruments are at rates
fixed periodically in advance based on market rates.
The payment of preference share dividends and Upper Tier 2 coupons are typically at the discretion of Barclays Bank PLC, except for
coupon payments that become compulsory where Barclays PLC has declared or paid a dividend on ordinary shares, or in certain cases,
any class of preference shares, in the preceding six-month period. Coupons not paid become payable in each case if such a dividend is
subsequently paid or in certain other circumstances. No dividend or coupon payments may be made unless Barclays Bank PLC satisfies
a specified solvency test. Under the terms of these instruments, Barclays PLC may not pay dividends on ordinary shares until a dividend
or coupon is next paid on these instruments or the instruments are redeemed or purchased by Barclays Bank PLC. There are no
restrictions on Barclays Bank PLC’s ability to remit capital to the Parent as a result of these issued instruments.
Preference share redemptions are typically at the discretion of Barclays Bank PLC and are redeemable in whole, but not in part, at the
initial call date and on any dividend payment date after the initial call date, pursuant to their respective terms. Upper Tier 2 instruments
are repayable, at the option of Barclays Bank PLC in whole at the initial call date and on any fifth anniversary after the initial call date. In
addition, each issue of Upper Tier 2 instruments is repayable, at the option of Barclays Bank PLC, in whole for certain tax reasons, either
at any time, or on an interest payment date. There are no events of default except non-payment of principal or mandatory interest. Any
repayments or redemptions require the prior consent of the PRA, and in respect of the preference shares, any such redemption will be
subject to the Companies Act 2006 and the Articles of Barclays Bank PLC.
| | |
| | |
| | |
| | |
US Dollar Preference Shares | | |
| | |
Total Barclays Bank PLC Preference Shares | | |
| | |
Upper Tier 2 Instruments: | | |
Undated Floating Rate Primary Capital Notes Series 1 | | |
Undated Floating Rate Primary Capital Notes Series 2 | | |
5.03% Undated Reverse Dual Currency Subordinated Loan (JPY8bn) | | |
5.0% Reverse Dual Currency Undated Subordinated Loan (JPY12bn) | | |
9% Permanent Interest Bearing Capital Bonds (£100m) | | |
6.125% Undated Subordinated Notes (£550m) | | |
Total Upper Tier 2 Instruments | | |
| | | | | | | | | |
| Climate and sustainability report | | | | | | | Barclays PLC 2023 Annual Report on Form 20-F | |
| |
| | | | | | | | | |
Notes to the financial statements (continued) |
Capital instruments, equity and reserves |
Employee benefits
The notes included in this section focus on the costs and commitments associated with employing our staff.
30 Staff costs
Accounting for staff costs
Deferred cash and share awards are made to employees to incentivise performance over the period employees provide services. To
receive payment under an award, employees must provide service over the vesting period. The period over which the expense for
deferred cash and share awards is recognised is based upon the period employees consider their services contribute to the awards. For
past awards, the Group considers that it is appropriate to recognise the awards over the period from the date of grant to the date that
the awards vest. In relation to awards granted from 2017, the Group, taking into account the changing employee understanding
surrounding those awards, considered it appropriate for expense to be recognised over the vesting period including the financial year
prior to the grant date.
The accounting policies for share-based payments, and pensions and other post-retirement benefits are included in Note 31 and Note
32 respectively.
| | | |
| | | |
| | | |
Incentive awards granted: | | | |
| | | |
| | | |
Total incentive awards granted | | | |
| | | |
Reconciliation of incentive awards granted to income statement charge: | | | |
Less: deferred bonuses granted but not charged in current year | | | |
Add: current year charges for deferred bonuses from previous years | | | |
Other differences between incentive awards granted and income statement charge | | | |
Income statement charge for performance costs | | | |
| | | |
Other income statement charges: | | | |
| | | |
| | | |
Post-retirement benefits1 | | | |
| | | |
Total compensation costs2 | | | |
| | | |
| | | |
| | | |
Redundancy and restructuring3 | | | |
| | | |
| | | |
Total other resourcing costs | | | |
| | | |
| | | |
Notes
1Post-retirement benefits charge includes £371m (2022: £313m; 2021: £289m) in respect of defined contribution schemes and £168m (2022: £250m; 2021: £250m) in respect of
defined benefit schemes.
2£860m (2022: £604m; 2021: £484m) of Group compensation cost was capitalised as internally generated software and excluded from the Staff cost disclosed above .
3 Redundancy and restructuring cost included £340m relating to structural cost actions taken in Q4 2023.
| | | | | | | | | |
| Climate and sustainability report | | | | | | | Barclays PLC 2023 Annual Report on Form 20-F | |
| |
| | | | | | | | | |
Notes to the financial statements (continued) |
|
31 Share-based payments
Accounting for share-based payments
Employee incentives include awards in the form of shares and share options, as well as offering employees the opportunity to purchase
shares on favourable terms. The cost of the employee services received in respect of the shares or share options granted is recognised
in the income statement over the period that employees provide services. The overall cost of the award is calculated using the number
of shares and options expected to vest and the fair value of the shares or options at the date of grant.
The number of shares and options expected to vest takes into account the likelihood that performance and service conditions included
in the terms of the awards will be met. For other share-based payment schemes such as Sharesave and Sharepurchase, there are non-
vesting conditions which must be met. Failure to meet the non-vesting condition is treated as a cancellation, resulting in an acceleration
of recognition of the cost of the employee services.
The fair value of shares is the market price ruling on the grant date, in some cases adjusted to reflect restrictions on transferability. The
fair value of options granted is determined using the Black Scholes model to estimate the numbers of shares likely to vest. The model
takes into account the exercise price of the option, the current share price, the risk-free interest rate, the expected volatility of the
share price over the life of the option and other relevant factors. Market conditions that must be met in order for the award to vest are
also reflected in the fair value of the award, as are any other non-vesting conditions – such as continuing to make payments into a
share-based savings scheme.
The charge for the year arising from share-based payment schemes was as follows:
| | | |
| |
| | | |
| | | |
Deferred Share Value Plan and Share Value Plan | | | |
| | | |
| | | |
| | | |
Total share-based payments | | | |
The terms of the main current plans are as follows:
Share Value Plan (SVP)
SVP awards have been granted to participants in the form of a conditional right to receive Barclays PLC shares or provisional allocations
of Barclays PLC shares which vest or are considered for release over a period of three, four, five or seven years. Participants do not pay
to receive an award or to receive a release of shares. For awards granted before December 2017, the grantor may also make a dividend
equivalent payment to participants on release of a SVP award. SVP awards are also made to eligible employees for recruitment
purposes. All awards are subject to potential forfeiture in certain leaver scenarios.
Deferred Share Value Plan (DSVP)
The terms of the DSVP are materially the same as the terms of the SVP as described above, save that Executive Directors are not
eligible to participate in the DSVP and the DSVP operates over market purchase shares only.
Other schemes
In addition to the SVP and DSVP, the Barclays PLC Group operates a number of other schemes settled in Barclays PLC Shares including
Sharesave (both UK and Ireland), Sharepurchase (both UK and overseas), and the Barclays PLC Group Long Term Incentive Plan. A
delivery of upfront shares to ‘Material Risk Takers’ can be made as a Share Incentive Award (Holding Period) under the SVP.
Share option and award plans
The weighted average fair value per award granted, weighted average share price at the date of exercise/release of shares during the
year, weighted average contractual remaining life and number of options and awards outstanding (including those exercisable) at the
balance sheet date were as follows:
| | | | | | | | |
| | |
| Weighted average fair value per award granted in year | Weighted average share price at exercise/ release during year | Weighted average remaining contractual life | Number of options/ awards outstanding | Weighted average fair value per award granted in year | Weighted average share price at exercise/ release during year | Weighted average remaining contractual life | Number of options/ awards outstanding |
| | | | | | | | |
| | | | | | | | |
| | | | | | | | |
| | | | | | | | | |
| Climate and sustainability report | | | | | | | Barclays PLC 2023 Annual Report on Form 20-F | |
| |
| | | | | | | | | |
Notes to the financial statements (continued) |
|
SVP and DSVP are nil cost awards on which the performance conditions are substantially completed at the date of grant. Consequently,
the fair value of these awards is based on the market value at that date.
Sharesave has a contractual life of 3 years and 5 years, the expected volatility is 34.10% for 3 years and 33.12% for 5 years. The risk free
interest rates used for valuations are 4.60% and 4.36% for 3 years and 5 years respectively. The pure dividend yield rates used for
valuations are 5.27% and 5.02% for 3 years and 5 years respectively. The repo rates used for valuations are (0.50)% and (0.57)% for
3 years and 5 years respectively. The inputs into the model such as risk free interest rate, expected volatility, pure dividend yield rates
and repo rates are derived from market data.
Movements in options and awards
The movement in the number of options and awards for the major schemes and the weighted average exercise price of options was:
| | | | | | |
| | |
| | | Weighted average ex. price (£) |
| | | | | | |
Outstanding at beginning of year/acquisition date | | | | | | |
| | | | | | |
Exercised/released in the year | | | | | | |
Less: forfeited in the year | | | | | | |
Less: expired in the year | | | | | | |
Outstanding at end of year | | | | | | |
| | | | | | |
Notes
1Options/award granted over Barclays PLC shares.
2Weighted average exercise price is not applicable for SVP and DSVP awards as these are not share option schemes.
3The number of awards within Others at the end of the year principally relates to Sharesave (number of awards exercisable at end of year was 44,109,518). The weighted average
exercise price relates to Sharesave.
Awards and options granted under the Group’s share plans may be satisfied using new issue shares, treasury shares and market
purchase shares. Awards granted under the DSVP may be satisfied using market purchase shares only.
There were no significant modifications to the share-based payments arrangements in 2023 and 2022.
As at 31 December 2023, the total liability arising from cash-settled share-based payments transactions was £5m (2022: £5m).
Holdings of Barclays PLC shares and hedges
Various employee benefit trusts established by the Group hold shares in Barclays PLC to meet obligations under the Barclays share-
based payment schemes. The total number of Barclays shares held in these employee benefit trusts at 31 December 2023 was 19m
(2022: 14m). Dividend rights have been waived on all these shares. The total market value of the shares held in trust based on the year
end share price of £1.54 (2022: £1.59) was £29m (2022: £22m). For accounting of treasury shares, see Note 28.
The Group has entered into physically settled forward contracts to hedge the settlement of certain share-based payment schemes.
The fixed forward price to be paid under these contracts is £481m and has been recorded in retained earnings.
| | | | | | | | | |
| Climate and sustainability report | | | | | | | Barclays PLC 2023 Annual Report on Form 20-F | |
| |
| | | | | | | | | |
Notes to the financial statements (continued) |
|
32 Pensions and post-retirement benefits
Accounting for pensions and post-retirement benefits
The Group operates a number of pension schemes and post-employment benefit schemes.
Defined contribution schemes – the Group recognises contributions due in respect of the accounting period in the income statement.
Any contributions unpaid at the balance sheet date are included as a liability.
Defined benefit schemes – the Group recognises its obligations to members of each scheme at the period end, less the fair value of the
scheme assets after applying the asset ceiling test.
Each scheme’s obligations are calculated using the projected unit credit method. Scheme assets are stated at fair value as at the period
end.
Changes in pension scheme liabilities or assets (remeasurements) that do not arise from regular pension cost, net interest on net
defined benefit liabilities or assets, past service costs, settlements or contributions to the scheme, are recognised in other
comprehensive income. Remeasurements comprise experience adjustments (differences between previous actuarial assumptions
and what has actually occurred), the effects of changes in actuarial assumptions, return on scheme assets (excluding amounts included
in the interest on the assets) and any changes in the effect of the asset ceiling restriction (excluding amounts included in the interest on
the restriction).
Post-employment benefit schemes – the cost of providing healthcare benefits to retired employees is accrued as a liability in the financial
statements over the period that the employees provide services to the Group, using a methodology similar to that for defined benefit
pension schemes.
Pension schemes
UK Retirement Fund (UKRF)
The UKRF is the Group’s main scheme, representing 96% (2022: 96%) of the Group’s total retirement benefit obligations. Barclays Bank
PLC is the principal employer of the UKRF. The UKRF was closed to new entrants on 1 October 2012, and comprises 10 sections, the
two most significant of which are:
▪Afterwork, which comprises a contributory cash balance defined benefit element, and a voluntary defined contribution element. The
cash balance element is accrued each year and revalued until Normal Retirement Age in line with the increase in Retail Price Index
(RPI) (up to a maximum of 5% p.a.). The main risks that Barclays runs in relation to Afterwork are limited although additional
contributions are required if pre-retirement investment returns are not sufficient to provide for the benefits.
▪The 1964 Pension Scheme. Most employees recruited before July 1997 built up benefits in this non-contributory defined benefit
scheme in respect of service up to 31 March 2010. Pensions were calculated by reference to service and pensionable salary. From
1 April 2010, members became eligible to accrue future service benefits in either Afterwork or the Pension Investment Plan, a historic
defined contribution section which is now closed to future contributions. The risks that Barclays runs in relation to the 1964 section
are typical of final salary pension schemes, principally that investment returns fall short of expectations, that inflation exceeds
expectations, and that retirees live longer than expected.
Barclays Pension Savings Plan (BPSP)
The BPSP is a defined contribution scheme providing benefits for all new UK hires from 1 October 2012. BPSP is not subject to the
same investment return, inflation or life expectancy risks for Barclays that defined benefit schemes are. Members’ benefits reflect
contributions paid and the level of investment returns achieved.
Other
Apart from the UKRF and the BPSP, Barclays operates a number of smaller pension and long-term employee benefits and post-
retirement healthcare plans globally, the largest of which are the US defined benefit and defined contribution schemes. Many of the
schemes are funded, with assets backing the obligations held in separate legal vehicles such as trusts. Others are operated on an
unfunded basis. The benefits provided, the approach to funding, and the legal basis of the schemes, reflect local environments.
Governance
The UKRF operates under trust law and is managed and administered on behalf of the members in accordance with the terms of the
Trust Deed and Rules and all relevant legislation. The Corporate Trustee is Barclays Pension Funds Trustees Limited, a private limited
company and a wholly owned subsidiary of Barclays Bank PLC. The Trustee is the legal owner of the assets of the UKRF which are held
separately from the assets of the Group.
The Trustee Board comprises six Management Directors selected by Barclays, of whom three are independent Directors with no
relationship with Barclays (and who are not members of the UKRF), plus three Member Nominated Directors selected from eligible
active, deferred or pensioner members who apply for the role.
The BPSP is a Group Personal Pension arrangement which operates as a collection of personal pension plans. Each personal pension
plan is a direct contract between the employee and the BPSP provider (Legal & General Assurance Society Limited), and is regulated by
the FCA.
Similar principles of pension governance apply to the Group’s other pension schemes, depending on local legislation.
| | | | | | | | | |
| Climate and sustainability report | | | | | | | Barclays PLC 2023 Annual Report on Form 20-F | |
| |
| | | | | | | | | |
Notes to the financial statements (continued) |
|
Amounts recognised
The following tables include amounts recognised in the income statement and an analysis of benefit obligations and scheme assets for
all Group defined benefit schemes. The net position is reconciled to the assets and liabilities recognised on the balance sheet. The
tables include funded and unfunded post-retirement benefits. The income statement charge with respect to Defined contribution
schemes is disclosed as part of footnotes to Note 30 Staff costs.
| | | |
Income statement (credit)/charge | | | |
| | | |
| | | |
| | | |
Net finance (income)/cost | | | |
| | | |
| | | |
| | | |
| | | | |
Balance sheet reconciliation | | | |
| | |
| | | | |
| | | | |
Benefit obligation at beginning of the year | | | | |
| | | | |
Interest costs on scheme liabilities | | | | |
| | | | |
Remeasurement (loss)/gain – financial | | | | |
Remeasurement (loss)/gain – demographic | | | | |
Remeasurement (loss)/gain – experience | | | | |
| | | | |
| | | | |
Exchange and other movements | | | | |
Benefit obligation at end of the year | | | | |
Fair value of scheme assets at beginning of the year | | | | |
Interest income on scheme assets | | | | |
| | | | |
Remeasurement – return on scheme assets (less)/greater than discount rate | | | | |
| | | | |
| | | | |
Exchange and other movements | | | | |
Fair value of scheme assets at end of the year | | | | |
| | | | |
Retirement benefit assets | | | | |
Retirement benefit liabilities | | | | |
Net retirement benefit assets | | | | |
Included within the benefit obligation is £694m (2022: £690m) relating to overseas pensions and £201m (2022: £201m) relating to other
post-employment benefits.
As at 31 December 2023, the UKRF’s scheme assets were in surplus versus IAS 19 obligations by £3,616m (2022: £4,690m). The
decrease in the UKRF surplus during the year was driven by lower corporate bond yields and the assets underperforming the discount
rate.
The weighted average duration of the benefit payments reflected in the defined benefit obligation for the UKRF is 12 years (2022: 13
years). The UKRF expected benefits promised to date are projected to be paid out for in excess of 50 years, although 30% of the
benefits are expected to be paid in the next 10 years; 35% in years 11 to 20 and 20% in years 21 to 30. The remainder of the benefits are
expected to be paid beyond 30 years.
Of the £1,075m (2022: £1,299m) UKRF benefits paid out, £122m (2022: £390m) related to transfers out of the fund.
| | | | | | | | | |
| Climate and sustainability report | | | | | | | Barclays PLC 2023 Annual Report on Form 20-F | |
| |
| | | | | | | | | |
Notes to the financial statements (continued) |
|
Where a scheme’s assets exceed its obligation, an asset is recognised to the extent that it does not exceed the present value of future
contribution holidays or refunds of contributions (the asset ceiling). In the case of the UKRF the asset ceiling is not applied as, in certain
specified circumstances such as wind-up, the Group expects to be able to recover any surplus. Similarly, a liability in respect of future
minimum funding requirements is not recognised. The Trustee does not have a substantive right to augment benefits, nor do they have
the right to wind up the plan except in the dissolution of the Group or termination of contributions by the Group. The application of the
asset ceiling to other plans and recognition of additional liabilities in respect of future minimum funding requirements are considered on
an individual plan basis.
Critical accounting estimates and judgements
Actuarial valuation of the scheme's obligation is dependent upon a series of assumptions. Below is a summary of the main financial and
demographic assumptions adopted for the UKRF.
| | |
| | |
Key UKRF financial assumptions | | |
| | |
| | |
The UKRF discount rate assumption for 2023 was based on a standard WTW RATE Link model. The RPI inflation assumption for 2023
was set by reference to the Bank of England’s implied inflation curve. The inflation assumption incorporates a deduction of 20 basis
points as an allowance for an inflation risk premium. The methodology used to derive the discount rate and inflation assumptions is
consistent with that used at the prior year end.
The UKRF’s post-retirement mortality assumptions are based on best estimates derived from an analysis in 2022 of the UKRF’s own
post-retirement mortality experience and taking account of recent evidence from published mortality surveys. An allowance has been
made for future mortality improvements based on the 2022 core projection model published by the Continuous Mortality Investigation
Bureau subject to a long-term trend of 1.25% per annum in future improvements (2022: 1.25% per annum). The table below shows
how the assumed life expectancy at 60, for members of the UKRF, has varied over the past three years:
| | | |
| | | |
Life expectancy at 60 for current pensioners (years) | | | |
| | | |
| | | |
Life expectancy at 60 for future pensioners currently aged 40 (years) | | | |
| | | |
| | | |
Through transactions in 2020 and 2022 approximately three-quarters of the longevity risk for current pensioners has been reinsured,
and the transactions will provide income to the UKRF if pensions are paid out for longer than expected. The contracts form part of the
UKRF’s investment portfolio.
Sensitivity analysis on actuarial assumptions
The sensitivity analysis has been calculated by valuing the UKRF liabilities using the amended assumptions shown in the table below and
keeping the remaining assumptions the same as disclosed in the table above, except in the case of the inflation sensitivity where other
assumptions that depend on assumed inflation have also been amended correspondingly. The difference between the recalculated
liability figure and that stated in the balance sheet reconciliation table above is the figure shown. The selection of these movements to
illustrate the sensitivity of the defined benefit obligation to key assumptions should not be interpreted as Barclays expressing any
specific view of the probability of such movements happening.
| | | | | | | | | |
| Climate and sustainability report | | | | | | | Barclays PLC 2023 Annual Report on Form 20-F | |
| |
| | | | | | | | | |
Notes to the financial statements (continued) |
|
| | |
Change in key assumptions | | |
| | |
| (Decrease)/ Increase in UKRF defined benefit obligation | (Decrease)/ Increase in UKRF defined benefit obligation |
| | |
| | |
| | |
| | |
| | |
| | |
| | |
| | |
| | |
| | |
| | |
| | |
| | |
| | |
Assets
A long-term investment strategy has been set for the UKRF, with its asset allocation comprising a mixture of equities, bonds, property
and other appropriate assets. This recognises that different asset classes are likely to produce different long-term returns and some
asset classes may be more volatile than others. The long-term investment strategy ensures, among other aims, that investments are
adequately diversified.
| | | | | | | | | |
| Climate and sustainability report | | | | | | | Barclays PLC 2023 Annual Report on Form 20-F | |
| |
| | | | | | | | | |
Notes to the financial statements (continued) |
|
The value of the assets of the schemes and their percentage in relation to total scheme assets were as follows:
| | | | | | | | |
Analysis of scheme assets | | | | | | | | |
| | |
| | | | % of total fair value of scheme assets % | | | | % of total fair value of scheme assets % |
| | | | | | | | |
| | | | | | | | |
| | | | | | | | |
| | | | | | | | |
Bonds - index-linked government | | | | | | | | |
Bonds - corporate and other | | | | | | | | |
| | | | | | | | |
| | | | | | | | |
| | | | | | | | |
| | | | | | | | |
Longevity reinsurance contracts | | | | | | | | |
| | | | | | | | |
| | | | | | | | |
| | | | | | | | |
Fair value of scheme assets | | | | | | | | |
| | | | | | | | |
| | | | | | | | |
| | | | | | | | |
| | | | | | | | |
| | | | | | | | |
Bonds - index-linked government | | | | | | | | |
Bonds - corporate and other | | | | | | | | |
| | | | | | | | |
| | | | | | | | |
| | | | | | | | |
| | | | | | | | |
Longevity reinsurance contract | | | | | | | | |
| | | | | | | | |
| | | | | | | | |
| | | | | | | | |
Fair value of scheme assets | | | | | | | | |
Notes
1Valuation of unquoted assets is provided by the underlying managers or qualified independent valuers. The valuation for some of the unquoted assets, in particular private equities, is
based on valuations as at 30 September 2023 adjusted by cash flows, these being the latest available valuations as at the point of publication. All valuations are determined in
accordance with relevant industry guidance. Barclays does not believe these valuations will differ materially from the fair value, in the context of the overall UKRF asset size.
2Cash and liquid assets for the UKRF consists of £354m (2022: £521m) Cash, £91m (2022: £80m) Receivables/payables, £3,036m (2022:£3,286m) Pooled cash funds and £(1,588)m
(2022: £(2,390)m) Repurchase agreements.
Included within the fair value of UKRF scheme assets was nil (2022: nil) relating to shares in Barclays PLC and nil (2022: nil) relating to
bonds issued by Barclays PLC. The UKRF also invests in pooled investment vehicles which may hold shares or debt issued by Barclays
PLC.
During 2023, the Trustee undertook a review of the investment strategy to reflect updated liabilities and market assumptions. The
Trustee agreed to continue their existing de-risking plan and make no fundamental changes to the investment strategy.
At 31 December 2023, 39% of the UKRF assets were invested in liability-driven investment strategies; primarily UK gilts as well as
interest rate and inflation swaps. These swaps are used to better match the assets to its liabilities. The swaps are used to reduce the
scheme’s inflation and duration risks against its liabilities.
The UKRF employs derivative instruments, where appropriate, to match assets more closely to liabilities, or to achieve a desired
exposure or return. The value of assets shown reflects the assets held by the UKRF, with any derivative holdings reflected on a fair value
basis. The UKRF uses repurchase agreements and reverse repurchase agreements to achieve the Trustee’s liability hedging objective.
Investment managers are allowed to undertake repo transactions on the UKRF’s existing gilt holdings to raise cash with which to buy
additional gilts for efficient portfolio management; and reverse repo transactions to receive gilts and be paid a fee for providing cash.
| | | | | | | | | |
| Climate and sustainability report | | | | | | | Barclays PLC 2023 Annual Report on Form 20-F | |
| |
| | | | | | | | | |
Notes to the financial statements (continued) |
|
The UKRF has a comprehensive and robust liquidity framework in place. The aim of the liquidity framework is to ensure that pension
payments and other liquidity outflows are paid in due course, sufficient liquidity and collateral is maintained to achieve strategic
allocation targets and that all liquidity outflows/collateral needs are covered without forced sale or strategic asset allocation changes.
The UKRF holds two longevity reinsurance contracts covering c75% of the current pensioner liabilities. The contracts provide income
to the UKRF if pensions are paid out for longer than expected. At 31 December 2023, the combined value of the contracts was £(131)m
(2022: £(123)m). The negative value reflects the estimated impact of changes in the reinsurance market, demographic assumptions
and risk premia since the contracts were entered into by the UKRF.
For information on the UKRF Trustee’s approach to Responsible Investment and Climate Risk, in the context of managing the UKRF,
please refer to the UKRF Trustee website at https://epa.towerswatson.com/accounts/barclays/public/barclays-bank-responsible-
investment-policy/.
Triennial valuation
The UKRF annual funding update as at 30 September 2023 showed a funding surplus of £2.03bn compared to £1.97bn at 30
September 2022 triennial actuarial valuation. The improvement was mainly due to asset returns outperforming the change in liabilities.
The main differences between the funding and accounting assumptions are a different approach to setting the discount rate and a
more conservative longevity assumption for funding.
As part of the 2022 triennial valuation, the Trustee and Barclays Bank PLC agreed an annual adequacy test on a basis more prudent than
the IAS 19 or funding bases. Should the UKRF be sufficiently funded on this basis, the regular employer contributions to the UKRF to
fund future Afterwork accrual will not be required in the following calendar year. The test will be reviewed at the 2025 triennial valuation.
The test was passed in September, so no regular employer contributions are required for 2024.
The next funding valuation of the UKRF is due to be completed in 2026 with an effective date of 30 September 2025.
Other support measures agreed which remain in place
Collateral – Barclays Bank PLC has entered into an agreement with the UKRF Trustee to provide collateral to cover at least 100% of any
funding deficit with an overall cap of £9bn, to provide security if the UKRF is in a funding deficit. The collateral pool is currently zero,
reflecting the surplus funding position. The arrangement provides the UKRF Trustee with dedicated access to the pool of assets in the
event of Barclays Bank PLC not paying any required deficit reduction contribution to the UKRF or in the event of Barclays Bank PLC’s
insolvency.
Participation – As permitted under the Financial Services and Markets Act 2000 (Banking Reform) (Pensions) Regulations 2016, Barclays
Bank UK PLC is a participating employer in the UKRF and will remain so during a transitional phase until September 2025 as set out in a
deed of participation. In the event of Barclays Bank PLC’s insolvency during this period provision has been made to require Barclays
Bank UK PLC to become the principal employer of the UKRF. Barclays Bank PLC’s Section 75 debt would be triggered by the insolvency
(the debt would be calculated after allowing for the payment to the UKRF of any collateral above).
Defined benefit contributions paid with respect to the UKRF were as follows:
There were nil (2022: nil) Section 75 contributions included within the Group’s contributions paid as no participating employers left the
UKRF in 2023.
The Group’s expected contribution to the UKRF in respect of defined benefits in 2024 is £22m. In addition, the expected contributions
to UK defined contribution schemes in 2024 is £32m to the UKRF and £293m to the BPSP.
| | | | | | | | | |
| Climate and sustainability report | | | | | | | Barclays PLC 2023 Annual Report on Form 20-F | |
| |
| | | | | | | | | |
Notes to the financial statements (continued) |
|
Scope of consolidation
The notes included in this section present information on the Group’s investments in subsidiaries, joint ventures and associates and its
interests in structured entities. Detail is also given on securitisation transactions the Group has entered into and arrangements that are
held off-balance sheet.
33 Principal subsidiaries
The significant judgements used in applying this policy are set out below.
Accounting for investment in subsidiaries
In the individual financial statements of Barclays PLC, investments in subsidiaries are stated at cost less impairment.
Principal subsidiaries for the Group are set out below. This includes those subsidiaries that are most significant in the context of the
Group’s business, results or financial position.
| | | | | |
| Principal place of business or incorporation | | Percentage of voting rights held | Non-controlling interests - proportion of ownership interests | Non-controlling interests - proportion of voting interests |
| | | | |
| | | | | |
| | | | | |
Barclays Bank Ireland PLC | | | | | |
Barclays Execution Services Limited | | | | | |
| | | | | |
Barclays Capital Securities Limited | | | | | |
Barclays Securities Japan Limited | | | | | |
| | | | | |
| | | | | |
The country of registration or incorporation is also the principal area of operation of each of the above subsidiaries.
Ownership interests are in some cases different to voting interests due to the existence of non-voting equity interests, such as
preference shares. Refer to Note 29 for more information.
Determining whether the Group has control of an entity is generally straightforward based on ownership of the majority of the voting
capital. However, in certain instances, this determination will involve judgement, particularly in the case of structured entities where
voting rights are often not the determining factor in decisions over the relevant activities. This judgement will involve assessing the
purpose and design of the entity. It will also often be necessary to consider whether the Group, or another involved party with power
over the relevant activities, is acting as a principal in its own right or as an agent on behalf of others.
There is also often considerable judgement involved in the ongoing assessment of control over structured entities. In this regard, where
market conditions have deteriorated such that the other investors’ exposures to the structure’s variable returns have been
substantively eliminated, the Group may conclude that the managers of the structured entity are acting as its agent and therefore will
consolidate the structured entity.
| | | | | | | | | |
| Climate and sustainability report | | | | | | | Barclays PLC 2023 Annual Report on Form 20-F | |
| |
| | | | | | | | | |
Notes to the financial statements (continued) |
|
An interest in equity voting rights exceeding 50% would typically indicate that the Group has control of an entity. However, the entity set
out below is excluded from consolidation because the Group does not have exposure to its variable returns.
| | | | |
| | Percentage of voting rights held | Equity shareholders' funds | Retained profit for the year |
| Country of registration or incorporation | | | |
| | | | |
This entity is managed by an external counterparty and consequently is not controlled by the Group. Interests relating to this entity are
included in Note 34.
Significant restrictions
As is typical for a group of its size and international scope, there are restrictions on the ability of Barclays PLC to obtain distributions of
capital, access the assets or repay the liabilities of members of its Group due to the statutory, regulatory and contractual requirements
of its subsidiaries and due to the protective rights of non-controlling interests. These are considered below.
Regulatory requirements
Barclays’ principal subsidiary companies have assets and liabilities before intercompany eliminations of £2,022bn (2022: £1,962bn) and
£1,927bn (2022: £1,869bn) respectively. Certain of these assets and liabilities are subject to prudential regulation and regulatory capital
requirements in the countries in which they are regulated. These require entities to maintain minimum capital levels which cannot be
returned to the parent company, Barclays PLC, on a going concern basis.
In order to meet capital requirements, subsidiaries may issue certain equity-accounted and debt-accounted financial instruments and
non-equity instruments such as Tier 1 and Tier 2 capital instruments and other forms of subordinated liabilities. Refer to Note 26 and
Note 27 for particulars of these instruments. These instruments may be subject to cancellation clauses or preference share
restrictions that would limit the ability of the entity to repatriate the capital on a timely basis.
Liquidity requirements
Regulated subsidiaries of the Group are required to meet applicable PRA or local regulatory requirements pertaining to liquidity. The
regulated subsidiaries include Barclays Bank PLC and Barclays Capital Securities Limited (which are regulated on a combined basis
under a Domestic Liquidity Sub-Group (DoLSub) arrangement), Barclays Bank UK PLC, Barclays Bank Ireland PLC, Barclays Capital Inc.
and Barclays Bank Delaware. Refer to the Liquidity risk section for further details of liquidity requirements, including those of the Group’s
significant subsidiaries.
Statutory requirements
The Group’s subsidiaries are subject to statutory requirements not to make distributions of capital and unrealised profits and generally
to maintain solvency. These requirements restrict the ability of subsidiaries to make remittances of dividends to Barclays PLC, the
ultimate parent, except in the event of a legal capital reduction or liquidation. In most cases, the regulatory restrictions referred to
above exceed the statutory restrictions.
Asset encumbrance
The Group uses its financial assets to raise finance in the form of securitisations and through the liquidity schemes of central banks, as
well as to provide security to the UK Retirement Fund. Once encumbered, the assets are not available for transfer around the Group.
The assets typically affected are disclosed in Note 37.
Other restrictions
The Group is required to maintain balances with central banks and other regulatory authorities, and these amounted to £3,758m (2022:
£3,457m).
| | | | | | | | | |
| Climate and sustainability report | | | | | | | Barclays PLC 2023 Annual Report on Form 20-F | |
| |
| | | | | | | | | |
Notes to the financial statements (continued) |
|
34 Structured entities
A structured entity is an entity in which voting or similar rights are not the dominant factor in deciding who controls the entity. Voting
rights may relate to administrative tasks only, with the relevant activities of the entity being directed by means of contractual
arrangements. Structured entities are generally created to achieve a narrow and well-defined objective with restrictions around their
ongoing activities.
Depending on the Group’s power over the activities of the entity and its exposure to and ability to influence its own returns, it may
consolidate the entity. In other cases, it may sponsor or have exposure to such an entity but not consolidate it.
Consolidated structured entities
The Group has contractual arrangements which may require it to provide financial support to the following types of consolidated
structured entities:
•Securitisation vehicles: The Group uses securitisation as a source of financing and a means of risk transfer. Where entities are
controlled by the Group, they are consolidated. Refer to Note 36 for further detail.
▪Commercial Paper (CP) conduits: These entities issue CP and use the proceeds to lend to clients as part of the Group's multi-seller
conduit programme. The Group has provided £22.4bn (2022: £20.8bn) in contractual liquidity facilities to the CP conduits that the
Group consolidates. These amounts represent the maximum the conduits can lend externally. The amounts of CP conduit lending
(drawn and undrawn) to unconsolidated structured entities can be seen in Other interests in unconsolidated structured entities
under multi-seller conduit programme in the Nature of interest table.
▪Employee benefit trusts: The Group provides capital contributions to employee benefit trusts to enable them to meet obligations to
employees in relation to share-based remuneration arrangements.
▪Tender Option Bond (TOB) trusts: During 2023, the Group provided undrawn liquidity facilities of £3.7bn (2022: £3.8bn) to
consolidated TOB trusts. These trusts invest in fixed income instruments issued by state, local or other municipalities in the United
States, funded by long-term senior floating-rate notes and junior residual securities.
Unconsolidated structured entities
The term ‘unconsolidated structured entities’ refers to structured entities not controlled by Barclays, and are established either by
Barclays or a third party. An interest in a structured entity is any form of contractual or non-contractual involvement which creates
variability in returns arising from the performance of the entity for the Group. Such interests include holdings of debt or equity
securities, derivatives that transfer financial risks from the entity to the Group, lending, loan commitments, financial guarantees and
investment management agreements.
The Group enters into transactions with unconsolidated structured entities in the normal course of business to facilitate customer
transactions, to provide risk management services and for specific investment opportunities. This is predominantly within the CIB
business. Structured entities may take the form of funds, trusts, securitisation vehicles, and private investment companies. The largest
transactions for Barclays include loans and derivatives with hedge fund structures and special purpose entities, multi-seller conduit
lending, holding notes issued by securitisation vehicles, and facilitating customer requirements through funds.
The nature and extent of the Group’s interests in structured entities is summarised below:
| | | | | | | | | |
| Climate and sustainability report | | | | | | | Barclays PLC 2023 Annual Report on Form 20-F | |
| |
| | | | | | | | | |
Notes to the financial statements (continued) |
|
| | | | | |
Summary of interests in unconsolidated structured entities |
| | Short-term traded interests | | | |
| | | | | |
| | | | | |
| | | | | |
| | | | | |
Financial assets at fair value through the income statement | | | | | |
Derivative financial instruments | | | | | |
Financial assets at fair value through other comprehensive income | | | | | |
Loans and advances at amortised cost | | | | | |
Debt securities at amortised cost | | | | | |
Reverse repurchase agreements and other similar secured lending | | | | | |
| | | | | |
| | | | | |
| | | | | |
Derivative financial instruments | | | | | |
| | | | | |
| | | | | |
| | | | | |
| | | | | |
Financial assets at fair value through the income statement | | | | | |
Derivative financial instruments | | | | | |
Financial assets at fair value through other comprehensive income | | | | | |
Loans and advances at amortised cost | | | | | |
Debt securities at amortised cost | | | | | |
Reverse repurchase agreements and other similar secured lending | | | | | |
| | | | | |
| | | | | |
| | | | | |
Derivative financial instruments | | | | | |
Secured financing arrangements, short-term traded interests and traded derivatives are typically managed under Market risk
management policies described in the Market risk management section which includes an indication of the change of risk measures
compared to last year. For this reason, the total assets of these entities are not considered meaningful for the purposes of
understanding the related risks and so have not been presented. Other interests include conduits and lending where the interest is
driven by normal customer demand. As at 31 December 2023, Barclays entered into transactions with approximately 6,000 (2022:
6,000) structured entities.
Secured financing
The Group routinely enters into reverse repurchase contracts, margin lending, stock borrowing and similar arrangements on normal
commercial terms where the counterparty to the arrangement is a structured entity. Due to the nature of these arrangements,
especially the transfer of collateral and ongoing margining, the Group is able to manage its variable exposure to the performance of the
structured entity counterparty. The counterparties included in secured financing mainly include hedge fund limited structures,
investment companies and special purpose entities.
Short-term traded interests
As part of its market making activities, the Group buys and sells interests in structured vehicles, which are predominantly debt securities
issued by asset securitisation vehicles. Such interests are typically held individually or as part of a larger portfolio for no more than 90
days. In such cases, the Group typically has no other involvement with the structured entity other than the securities it holds as part of
trading activities and its maximum exposure to loss is restricted to the carrying value of the asset.
Traded derivatives
The Group enters into a variety of derivative contracts with structured entities which reference market risk variables such as interest
rates, equities, foreign exchange rates and credit indices among other things. The main derivative types which are considered interests
in structured entities include equity options, index-based and entity-specific credit default swaps, and total return swaps. Interest rate
swaps and foreign exchange derivatives that are not complex and which expose the Group to insignificant credit risk by being senior in
| | | | | | | | | |
| Climate and sustainability report | | | | | | | Barclays PLC 2023 Annual Report on Form 20-F | |
| |
| | | | | | | | | |
Notes to the financial statements (continued) |
|
the payment waterfall of a securitisation and derivatives that are determined to introduce risk or variability to a structured entity are not
considered to be an interest in an entity and have been excluded from the disclosures.
A description of the types of derivatives and the risk management practices are detailed in Note 14. The risk of loss may be mitigated
through ongoing margining requirements as well as a right to cash flows from the structured entity which are senior in the payment
waterfall. Such margining requirements are consistent with market practice for many derivative arrangements and in line with the
Group’s normal credit policies.
Derivative transactions require the counterparty to provide cash or other collateral under margining agreements to mitigate
counterparty credit risk. The Group is mainly exposed to settlement risk on these derivatives which is mitigated through daily margining.
Total notional contract amounts were £335,552m (2022: £244,780m).
Except for credit default swaps where the maximum exposure to loss is the swap notional amount, it is not possible to estimate the
maximum exposure to loss in respect of derivative positions as the fair value of derivatives is subject to changes in market rates of
interest, exchange rates and credit indices which by their nature are uncertain. In addition, the Group’s losses would be subject to
mitigating action under its traded market risk and credit risk policies that require the counterparty to provide collateral in cash or other
assets in most cases.
Other interests in unconsolidated structured entities
The Group’s interests in structured entities not held for the purposes of short-term trading activities are set out below, summarised by
the nature of the interest and limited to significant categories, based on maximum exposure to loss.
| | | | | |
| | | | | |
| Multi-seller conduit programme | | | | Of which: Barclays owned, not consolidated entities1 |
| | | | | |
| | | | | |
Financial assets at fair value through the income statement | | | | | |
Financial assets at fair value through other comprehensive income | | | | | |
Loans and advances at amortised cost | | | | | |
Debt securities at amortised cost | | | | | |
| | | | | |
Total on-balance sheet exposures | | | | | |
Total off-balance sheet notional amounts | | | | | |
| | | | | |
Total assets of the entity | | | | | |
| | | | | |
| | | | | |
Financial assets at fair value through the income statement | | | | | |
Financial assets at fair value through other comprehensive income | | | | | |
Loans and advances at amortised cost | | | | | |
Debt securities at amortised cost | | | | | |
| | | | | |
Total on-balance sheet exposures | | | | | |
Total off-balance sheet notional amounts | | | | | |
| | | | | |
Total assets of the entity | | | | | |
Note
1Comprises of Barclays owned, not consolidated structured entities per IFRS 10 Consolidated Financial Statements, and Barclays sponsored entities, Refer to Note 33 Principal
subsidiaries for more details on consolidation.
Maximum exposure to loss
Unless specified otherwise below, the Group’s maximum exposure to loss is the total of its on-balance sheet positions and its off-
balance sheet arrangements, being loan commitments and financial guarantees. Exposure to loss is mitigated through collateral,
financial guarantees, the availability of netting and credit protection held.
Multi-seller conduit programme
Barclays' multi-seller conduit programme engages in providing financing to various clients and holds whole or partial interests in pools of
receivables or similar obligations. These instruments are protected from loss through over-collateralisation, seller guarantees, or other
credit enhancements provided to the conduit entities. The Group’s off-balance sheet exposure included in the table above represents
liquidity facilities that are provided to the conduit for the benefit of the holders of the commercial paper issued by the conduit and will
| | | | | | | | | |
| Climate and sustainability report | | | | | | | Barclays PLC 2023 Annual Report on Form 20-F | |
| |
| | | | | | | | | |
Notes to the financial statements (continued) |
|
only be drawn where the conduit is unable to access the commercial paper market. If these liquidity facilities are drawn, the Group is
protected from loss through over-collateralisation, seller guarantees, or other credit enhancements provided to the conduit.
Lending
The portfolio includes lending provided by the Group to unconsolidated structured entities in the normal course of its lending business
to earn income in the form of interest and lending fees and includes loans to structured entities that are generally collateralised by
property, equipment or other assets. All loans are subject to the Group’s credit sanctioning process. Collateral arrangements are
specific to the circumstances of each loan with additional guarantees and collateral sought from the sponsor of the structured entity
for certain arrangements. During the period the Group incurred immaterial impairment against such facilities.
Other
This includes fair value loans with structured entities where the market risk is materially hedged with corresponding derivative contracts,
interests in debt securities issued by securitisation vehicles and drawn and undrawn loan facilities to these entities. In addition, other
includes investment funds with interests restricted to management fees based on performance of the fund and trusts held on behalf of
beneficiaries with interests restricted to unpaid fees.
Assets transferred to sponsored unconsolidated structured entities
Barclays is considered to sponsor another entity if: it had a key role in establishing that entity, it transferred assets to the entity, the
Barclays name appears in the name of the entity or it provides guarantees on the entity’s performance. As at 31 December 2023,
assets transferred to sponsored unconsolidated structured entities were £1,420m (2022: £1,665m).
| | | | | | | | | |
| Climate and sustainability report | | | | | | | Barclays PLC 2023 Annual Report on Form 20-F | |
| |
| | | | | | | | | |
Notes to the financial statements (continued) |
|
35 Investments in associates and joint ventures
Accounting for associates and joint ventures
The equity accounted associates include the Group's investment in the Business Growth Fund £648m (2022: £669m) which has
decreased due to a fair value loss in its investments by £(10)m (2022: £(21)m).
| | | | | | |
| | |
| | | | | | |
| | | | | | |
| | | | | | |
Held at fair value through profit or loss | | | | | | |
| | | | | | |
Summarised financial information for the Group’s equity accounted associates and joint ventures is set out below. The amounts shown
are the Group’s share of the net income of the investees for the year ended 31 December 2023, with the exception of certain
undertakings for which the amounts are based on accounts made up to dates not earlier than three months before the balance sheet
date.
| | | | | | |
| | |
| | | | | | |
| | | | | | |
Profit/(loss) from continuing operations | | | | | | |
Other comprehensive income/(loss) | | | | | | |
Total comprehensive income/(loss) from continuing operations | | | | | | |
Unrecognised shares of the losses of individually immaterial associates and joint ventures were £nil (2022: £nil).
The Group has provided £nil (2022: £nil) to its joint ventures and associates. The Barclays drawn commitments to finance or otherwise
provide resources to its joint ventures and associates are £474m (2022: £474m) The Barclays share of the associates and joint
ventures unutilised credit facilities commitments amounted to £1,695m (2022: £1,796m).
36 Securitisations
Accounting for securitisations
The Group uses securitisations as a source of finance and a means of risk transfer. Such transactions generally result in the transfer of
contractual cash flows from portfolios of financial assets to holders of issued debt securities.
Securitisations may, depending on the individual arrangement, result in continued recognition of the securitised assets and the
recognition of the debt securities issued in the transaction; lead to partial continued recognition of the assets to the extent of the
Group’s continuing involvement in those assets or lead to derecognition of the assets and the separate recognition, as assets or
liabilities, of any rights and obligations created or retained in the transfer. Full derecognition only occurs when the Group transfers both
its contractual right to receive cash flows from the financial assets, or retains the contractual rights to receive the cash flows, but
assumes a contractual obligation to pay the cash flows to another party without material delay or reinvestment, and also transfers
substantially all the risks and rewards of ownership, including credit risk, prepayment risk and interest rate risk.
In the course of its normal banking activities, the Group makes transfers of financial assets, either where legal rights to the cash flows
from the asset are passed to the counterparty or beneficially, where the Group retains the rights to the cash flows but assumes a
responsibility to transfer them to the counterparty. Depending on the nature of the transaction, this may result in derecognition of the
assets in their entirety, partial derecognition or no derecognition of the assets subject to the transfer.
A summary of the main transactions, and the assets and liabilities and the financial risks arising from these transactions, is set out below:
Transfers of financial assets that do not result in derecognition
Securitisations
The Group was party to securitisation transactions involving its credit card balances and other personal lending. In these transactions,
the assets, interests in the assets, or beneficial interests in the cash flows arising from the assets, are transferred to a special purpose
entity, which then issues interest bearing debt securities to third party investors.
Securitisations may, depending on the individual arrangement, result in continued recognition of the securitised assets and the
recognition of the debt securities issued in the transaction. Partial continued recognition of the assets to the extent of the Group’s
| | | | | | | | | |
| Climate and sustainability report | | | | | | | Barclays PLC 2023 Annual Report on Form 20-F | |
| |
| | | | | | | | | |
Notes to the financial statements (continued) |
|
continuing involvement in those assets can also occur or derecognition of the assets and the separate recognition, as assets or
liabilities, of any rights and obligations created or retained in the transfer.
The following table shows the carrying amount of securitised assets that have not resulted in full derecognition, together with the
associated liabilities, for each category of asset on the balance sheet:
| | | | | | | | |
| | |
| | | | |
| | | | | | | | |
| | | | | | | | |
Loans and advances at amortised cost | | | | | | | | |
Credit cards, unsecured and other retail lending | | | | | | | | |
| | | | | | | | |
Financial assets at FVTPL | | | | | | | | |
| | | | | | | | |
| | | | | | | | |
Balances included within loans and advances at amortised cost represent securitisations where substantially all the risks and rewards of
the asset have been retained by the Group and balances included within Financial assets at FVTPL represent securitisations where the
risks and rewards are neither substantially transferred nor retained.
The relationship between the transferred assets and the associated liabilities is that holders of notes may only look to cash flows from
the securitised assets for payments of principal and interest due to them under the terms of their notes, although the contractual
terms of their notes may be different to the maturity and interest of the transferred assets.
If Barclays transfers a financial asset but does not transfer or retain substantially all the risk and rewards of the asset and retains control
over it, the transferred assets is recognised to the extent of Barclays’ continuing involvement. Total Financial assets of £3,353m (2022:
£828m) were transferred in this manner and the carrying value of the asset representing continued involvement is included in the table
above.
For transfers of assets in relation to repurchase agreements, refer to Note 37.
Continuing involvement in financial assets that have been derecognised
In some cases, the Group may have transferred a financial asset in its entirety but may have continuing involvement in it. This arises in
asset securitisations where loans and asset backed securities were derecognised as a result of the Group’s involvement with asset
backed securities, residential mortgage backed securities and commercial mortgage backed securities. Continuing involvement largely
arises from providing financing into these structures in the form of retained notes, which do not bear first losses.
The table below shows the potential financial implications of such continuing involvement:
| | | | | | |
| | | Gain from continuing involvement |
| | | | | | Cumulative to 31 December |
| | | | | | |
| | | | | | |
| | | | | | |
Residential mortgage backed securities | | | | | | |
Commercial mortgage backed securities | | | | | | |
| | | | | | |
| | | | | | |
| | | | | | |
| | | | | | |
Residential mortgage backed securities | | | | | | |
Commercial mortgage backed securities | | | | | | |
| | | | | | |
Note
1Assets which represent the Group’s continuing involvement in derecognised assets are recorded in Loans and advances at amortised cost and Debt securities at FVTPL.
| | | | | | | | | |
| Climate and sustainability report | | | | | | | Barclays PLC 2023 Annual Report on Form 20-F | |
| |
| | | | | | | | | |
Notes to the financial statements (continued) |
|
37 Assets pledged, collateral received and assets transferred
Assets are pledged or transferred as collateral to secure liabilities under repurchase agreements, securitisations and stock lending
agreements or as security deposits relating to derivatives. Assets transferred are non-cash assets transferred to a third party that do
not qualify for derecognition from the Group balance sheet, for example because Barclays retains substantially all the exposure to those
assets under an agreement to repurchase them in the future for a fixed price.
Assets pledged or transferred as collateral include all assets categorised as encumbered in the disclosure on pages 197 to 201 of the
Barclays PLC Pillar 3 Report 2023 (unaudited), other than those held in commercial paper conduits. In these transactions, the Group will
be required to step in to provide financing itself under a liquidity facility if the vehicle cannot access the commercial paper market.
Where non-cash assets are pledged or transferred as collateral for cash received, the asset continues to be recognised in full, and a
related liability is also recognised on the balance sheet. Where non-cash assets are pledged or transferred as collateral in an exchange
for non-cash assets, the transferred asset continues to be recognised in full, and there is no associated liability as the non-cash
collateral received is not recognised on the balance sheet. The Group is unable to use, sell or pledge the transferred assets for the
duration of the transaction and remains exposed to interest rate risk and credit risk on these pledged assets. Unless stated, the
counterparty's recourse is not limited to the transferred assets.
Collateralised transactions, such as securities lending and borrowing, repurchase and derivative transactions are conducted in
accordance with standard terms which are customary in the market.
The following table summarises the nature and carrying amount of the assets pledged as security:
| | |
| | |
| | |
Cash collateral and settlements | | |
Loans and advances at amortised cost | | |
| | |
Financial assets at fair value through the income statement | | |
Financial assets at fair value through other comprehensive income | | |
| | |
The following table summarises the transferred financial assets and the associated liabilities. The transferred assets represent the
gross carrying value of the assets pledged and the associated liabilities represent the IFRS balance sheet value of the related liability
recorded on the balance sheet:
| | |
| | |
| | |
| | |
| | |
| | |
Securities lending arrangements | | |
| | |
| | |
| | |
| | |
| | |
| | |
Securities lending arrangements | | |
| | |
| | |
For repurchase agreements the difference between transferred assets and the associated liabilities is predominantly due to IFRS
netting. Included within Other are agreements where a counterparty's recourse is limited to the transferred assets. The relationship
between the gross transferred assets and the associated liabilities is that holders of notes may only look to cash flows from the
securitised assets for payments of principal and interest due to them under the terms of their notes.
| | | | | |
| | |
| | | | | |
| | | | | |
| | | | | |
Recourse to transferred assets only | | | | | |
| | | | | |
Recourse to transferred assets only | | | | | |
| | | | | | | | | |
| Climate and sustainability report | | | | | | | Barclays PLC 2023 Annual Report on Form 20-F | |
| |
| | | | | | | | | |
Notes to the financial statements (continued) |
|
The Group has an additional £6.4bn (2022: £5.3bn) of loans and advances within its asset backed funding programmes that can readily
be used to raise additional secured funding and are available to support future issuances.
Collateral held as security for assets
Under certain transactions, including reverse repurchase agreements and stock borrowing transactions, the Group is allowed to resell
or re-pledge the collateral held. Collateralised transactions, such as securities lending and borrowing, repurchase and derivative
transactions are conducted in accordance with standard terms which are customary in the market.
The fair value at the balance sheet date of collateral accepted and re-pledged or transferred to others was as follows:
| | |
| | |
| | |
Fair value of securities accepted as collateral | | |
Of which fair value of securities re-pledged/transferred to others | | |
| | | | | | | | | |
| Climate and sustainability report | | | | | | | Barclays PLC 2023 Annual Report on Form 20-F | |
| |
| | | | | | | | | |
Notes to the financial statements (continued) |
|
Other disclosure matters
The notes included in this section focus on related party transactions, Auditor's remuneration, Barclays PLC (the Parent Company)
disclosure, Directors’ remuneration and Transition disclosures. Related parties include any subsidiaries, associates, joint ventures and
Key Management Personnel.
38 Related party transactions and Directors’ remuneration
Related party transactions
Parties are considered to be related if one party has the ability to control the other party or exercise significant influence over the other
party in making financial or operational decisions, or one other party controls both.
Subsidiaries
Transactions between Barclays PLC and its subsidiaries meet the definition of related party transactions. Where these are eliminated
on consolidation, they are not disclosed in the Group’s financial statements. Transactions between Barclays PLC and its subsidiaries are
fully disclosed in Barclays PLC’s financial statements. A list of the Group’s principal subsidiaries is shown in Note 33.
Associates, joint ventures and other entities
The Group provides banking services to its associates, joint ventures and the Group pension funds (principally the UK Retirement Fund),
providing loans, overdrafts, interest and non-interest bearing deposits and current accounts to these entities as well as other services.
Group companies also provide investment management and custodian services to the Group pension schemes. All of these
transactions are conducted on the same terms as third party transactions. Summarised financial information for the Group’s
investments in associates and joint ventures is set out in Note 35.
Amounts included in the Group’s financial statements, in aggregate, by category of related party entity are as follows:
| | | |
| | | |
| | | |
For the year ended and as at 31 December 2023 | | | |
| | | |
Credit impairment charges | | | |
| | | |
| | | |
| | | |
For the year ended and as at 31 December 2022 | | | |
| | | |
Credit impairment charges | | | |
| | | |
| | | |
| | | |
For the year ended and as at 31 December 2021 | | | |
| | | |
Credit impairment charges | | | |
| | | |
Total liabilities includes derivatives transacted on behalf of the pension funds of £77m (2022: £110m).
Key Management Personnel
Key Management Personnel are defined as those persons having authority and responsibility for planning, directing and controlling the
activities of Barclays PLC (directly or indirectly) and comprise the Directors and Officers of Barclays PLC, certain direct reports of the
Group Chief Executive and the heads of major business units and functions.
The Group provides banking services to Key Management Personnel and persons connected to them. Transactions during the year and
the balances outstanding were as follows:
| | |
| | |
| | |
| | |
| | |
Loans issued during the year1 | | |
Loan repayments during the year2 | | |
| | |
Notes
1Includes loans issued to existing Key Management Personnel and new or existing loans issued to newly appointed Key Management Personnel.
2Includes loan repayments by existing Key Management Personnel and loans to former Key Management Personnel.
| | | | | | | | | |
| Climate and sustainability report | | | | | | | Barclays PLC 2023 Annual Report on Form 20-F | |
| |
| | | | | | | | | |
Notes to the financial statements (continued) |
|
No allowances for impairment were recognised in respect of loans to Key Management Personnel (or any connected person).
| | |
| | |
| | |
| | |
| | |
Deposits received during the year1 | | |
Deposits repaid during the year2 | | |
| | |
Notes
1Includes deposits received from existing Key Management Personnel and new or existing deposits received from newly appointed Key Management Personnel.
2Includes deposits repaid by existing Key Management Personnel and deposits of former Key Management Personnel.
Total commitments outstanding
Total commitments outstanding refers to the total of any undrawn amounts on credit cards and/or overdraft facilities provided to Key
Management Personnel. Total commitments outstanding as at 31 December 2023 were £0.5m (2022: £0.5m).
All loans to Key Management Personnel (and persons connected to them) were made in the ordinary course of business; were made on
substantially the same terms, including interest rates and collateral, as those prevailing at the same time for comparable transactions
with other persons; and did not involve more than a normal risk of collectability or present other unfavourable features.
Remuneration of Key Management Personnel
Total remuneration awarded to Key Management Personnel below represents salaries, short term benefits and pensions contributions
received during the year and awards made as part of the latest remuneration decisions in relation to the year. Costs recognised in the
income statement reflect the accounting charge for the year included within operating expenses. The difference between the values
awarded and the recognised income statement charge principally relates to the recognition of costs for deferred awards. Figures are
provided for the period that individuals met the definition of Key Management Personnel.
| | | |
| | | |
| | | |
Salaries and other short-term benefits | | | |
| | | |
| | | |
| | | |
Employer social security charges on emoluments | | | |
Costs recognised for accounting purposes | | | |
Employer social security charges on emoluments | | | |
Other long-term benefits – difference between awards granted and costs recognised | | | |
Share-based payments – difference between awards granted and costs recognised | | | |
Total remuneration awarded | | | |
Disclosure required by the Companies Act 2006
The following information regarding the Barclays PLC Board of Directors is presented in accordance with the Companies Act 2006:
| | | |
| | | |
| | | |
| | | |
Amounts paid under LTIPs2 | | | |
| | | |
Notes
1The aggregate emoluments include amounts paid for the 2023 year. In addition, deferred share awards for 2023 with a total value at grant of £1.5m (2022: £2.3m, 2021: £1.4m) will be
made to Directors which will only vest subject to meeting certain conditions.
2The figure above for "Amounts paid under LTIPs" relates to LTIP awards that were released to Directors during the year. Dividend shares released on the awards are excluded (where
applicable). The LTIP figure in the single total figure table for Executive Directors' 2023 remuneration in the Directors' Remuneration report relates to awards that are scheduled to be
released in 2024 in respect of the 2021-2023 LTIP cycle.
There were no pension contributions paid to defined contribution schemes on behalf of Directors (2022: £nil, 2021: £nil). There were no
notional pension contributions to defined contribution schemes.
As at 31 December 2023, there were no Directors accruing benefits under a defined benefit scheme (2022: £nil, 2021: £nil).
Directors’ and Officers’ shareholdings and options
The beneficial ownership of ordinary share capital of Barclays PLC by all Directors and Officers of Barclays PLC (involving 26 persons) at
31 December 2023 amounted to 14,833,002 (2022: 15,944,986) ordinary shares of 25p each (0.10% of the ordinary share capital
outstanding).
As at 31 December 2023, Executive Directors and Officers of Barclays PLC (involving 16 persons) held options to purchase a total of
67,319 (2022: 62,268) Barclays PLC ordinary shares of 25p each at a weighted average price of 92p under Sharesave.
| | | | | | | | | |
| Climate and sustainability report | | | | | | | Barclays PLC 2023 Annual Report on Form 20-F | |
| |
| | | | | | | | | |
Notes to the financial statements (continued) |
|
Advances and credit to Directors and guarantees on behalf of Directors
In accordance with Section 413 of the Companies Act 2006, the total amount of advances and credits made available in 2023 to
persons who served as Directors during the year was £0.3m (2022: £0.2m). The total value of guarantees entered into on behalf of
Directors during 2023 was £nil (2022: £nil).
39 Auditor’s remuneration
Auditor’s remuneration is included within consultancy, legal and professional fees in administration and general expenses and
comprises:
| | | |
| | | |
| | | |
Audit of the Barclays Group's annual accounts | | | |
| | | |
Audit of the Company's subsidiaries1 | | | |
Other audit related fees2 | | | |
| | | |
Total Auditor's remuneration | | | |
Notes
1Comprises the fees for the statutory audit of subsidiaries both inside and outside the UK and fees for work performed by associates of KPMG in respect of the consolidated financial
statements of the Company.
2Comprises services in relation to statutory and regulatory filings. These include audit services for the review of the interim financial information under the Listing Rules of the UK listing
authority.
Audit scope changes are finalised following the completion of the audit and recognised when agreed. The 2023 audit fee includes £1m
(2022: £2m, 2021: £3m ) relating to the previous year’s audit.
| | | |
| | | |
Barclays associated pension schemes | | | |
| | | |
Under SEC regulations the remuneration of our auditors is required to be presented as follows: audit fees £70m (2022: £64m, 2021:
£55m), audit-related fees £6m (2022: £6m, 2021: £6m), tax fees £nil (2022: £nil, 2021: £nil), and all other fees £2m (2022: £1m, 2021:
£1m).
| | | | | | | | | |
| Climate and sustainability report | | | | | | | Barclays PLC 2023 Annual Report on Form 20-F | |
| |
| | | | | | | | | |
Notes to the financial statements (continued) |
|
40 Assets and liabilities included in disposal group classified as held for sale
Accounting for non-current assets held for sale and associated liabilities
The Group applies IFRS 5 Non-current Assets Held for Sale and Discontinued Operations. Non-current assets (or disposal groups) are
classified as held for sale when their carrying amount is to be recovered principally through a sale transaction rather than continuing use.
In order to be classified as held for sale, the asset must be available for immediate sale in its present condition subject only to terms that
are usual and customary, and the sale must be highly probable. Non-current assets (or disposal groups) held for sale are measured at
the lower of carrying amount and fair value less cost to sell. Assets and liabilities classified as held for sale are presented separately in
the consolidated balance sheet.
Management accounting estimates and judgements
Management judgement is required in determining whether the IFRS 5 held for sale classification criteria are met, in particular whether
the sale is highly probable and expected to qualify for recognition as a completed sale within 12 months of classification. This
assessment requires consideration of how committed management is to the sales plan, the likelihood of obtaining regulatory or other
external approvals which is often required for sales of banking operations and how committed the buyer is to complete the sales
transaction within the agreed timelines.
Barclays is currently engaged in a process to sell its German consumer finance business (comprising credit cards, unsecured personal
loans and deposits), currently within CC&P, as part of our ambition to simplify Barclays and support our focus on growing our key
businesses. A sale is expected to complete in 2024.
The perimeter of the disposal group has been accounted for in line with the requirements of IFRS5 as at 31 December 2023. A detailed
analysis of the disposal group is presented below:
| |
| |
| |
Assets included in disposal groups classified as held for sale | |
Loans and advances to customers | |
| |
Property, plant and equipment | |
| |
Total assets classified as held for sale | |
| |
Liabilities included in disposal groups classified as held for sale | |
| |
| |
| |
Total liabilities classified as held for sale | |
| |
Net assets classified as held for sale | |
41 Subsequent events
Barclays announced on 9 February 2024 that Barclays Bank UK PLC has entered into an agreement with Tesco Personal Finance plc
(operating using the trading name “Tesco Bank”) to acquire its retail banking business, which includes credit cards, unsecured personal
loans, deposits and the operating infrastructure. Additionally upon completion, Barclays Bank UK PLC will enter into a long-term,
exclusive strategic partnership with Tesco Stores Limited for an initial period of 10 years to market and distribute credit cards,
unsecured personal loans and deposits using the Tesco brand, as well as explore other opportunities to offer financial services to Tesco
customers. The transaction involves the acquisition of approximately £8.3bn of unsecured lending balances, including approximately
£4.2bn of gross credit card receivables and £4.1bn of gross unsecured personal loans, together with approximately £6.7bn in customer
deposits. The acquisition is expected to to occur in H2 2024, subject to court sanction and regulatory approvals.
| | | | | | | | | |
| Climate and sustainability report | | | | | | | Barclays PLC 2023 Annual Report on Form 20-F | |
| |
| | | | | | | | | |
Notes to the financial statements (continued) |
|
42 Barclays PLC (the Parent company)
Total income
Dividend received from subsidiaries
Dividends received from subsidiaries of £2,818m (2022: £2,797m, 2021: £1,356m) relates to dividends received from Barclays
Execution Services Limited £165m, Barclays Bank UK PLC £1,305m and Barclays Bank PLC £1,348m.
Other income
Other income of £1,174m (2022: £(654)m expense, 2021: £659m income) includes fair value and foreign exchange gains of £50m
(2022: £1,673m, 2021: £250m) on positions with subsidiaries and £985m (2022: £905m, 2021: £804m) of income received from gross
coupon payments on Barclays Bank PLC and Barclays Bank UK PLC-issued AT1 securities.
Total assets and liabilities
Investment in subsidiaries
The investment in subsidiaries of £64,461m (2022: £64,544m) predominantly relates to investments in the ordinary shares of Barclays
Bank PLC of £36,340m (2022: £36,340m) and their AT1 securities of £10,757m (2022: £10,760m), as well as investments in the
ordinary shares of Barclays Bank UK PLC of £14,245m (2022: 14,245m) and their AT1 securities of £2,439m (2022: £2,570m). The
decrease of £83m during the year resulted from a capital injection of £50m to Barclays Principal Investments Limited offset by a
decrease in the AT1 holdings and associated fair value which totalled £133m.
Impairment in subsidiaries
At the end of each reporting period an impairment review is undertaken in respect of investment in the ordinary shares of subsidiaries.
Where impairment may be indicated a test of the carrying value against the recoverable value is performed; impairment being indicated
where the investment exceeds the recoverable amount. The recoverable amount is calculated as a value in use (VIU) which is derived
from the present value of future cash flows expected to be received from the investment. The VIU calculations use forecast profits
based on financial budgets approved by management, covering a five year period as an approximation of future cash flows discounted
using a pre-tax discount rate appropriate to the subsidiary being tested. A terminal growth rate has then been applied to the cash flows
thereafter which is based upon expectations of future inflation rates. The 2023 review identified the value in use calculated was higher
than the carrying value for all subsidiaries.
Loans and advances to subsidiaries
During the year loans and advances to subsidiaries decreased by £4,702m to £18,926m (2022: £23,628m). The decrease was largely
driven due to maturities of £4,982m intra-group loans to Barclays PLC subsidiaries and foreign exchange impact of £1,049m due to the
appreciation of GBP largely against USD. This was partially offset by the new issuances of intra-group loans to Barclays PLC subsidiaries
of £1,260m.
Subordinated liabilities and debt securities in issue
During the year, Barclays PLC issued USD1,500m of Fixed-to-Floating Rate Resetting Subordinated Callable Notes, which are included
within the subordinated liabilities balance of £10,018m (2022: £11,230m). Debt securities in issue of £18,308m (2022: £24,086m) have
reduced during the year primarily due to maturities of £4,931m senior issuances and the foreign exchange impact of £847m due to the
appreciation of GBP largely against USD.
Financial assets and liabilities designated at fair value
Financial liabilities designated at fair value of £31,832mm (2022: £22,971m) primarily included new issuances during the year of
EUR1,250m Fixed Rate Resetting Senior Callable Notes, £2,000m Fixed Rate Resetting Senior Callable Notes, USD8,200m Fixed-to-
Floating Rate Senior Callable Notes and USD300m Floating Rate Senior Notes . The proceeds raised through these transactions were
used to invest in subsidiaries of Barclays PLC and are included within the financial assets designated at fair value through the income
statement balance of £35,787m (2022: £28,930m). The effect of changes in the liabilities fair value, including those due to credit risk, is
expected to offset the changes in the fair value of the related financial asset in the income statement. The difference between the
financial liabilities carrying amount and the contractual amount on maturity is £1,838m (2022: £2,100m).
Derivative financial instruments
During the year derivative financial liabilities decreased by £195m to £711m (2022: £906m). This is primarily driven by the gain in
derivatives due to a decreasing rate environment.
Total equity
Called up share capital and share premium
Called up share capital and share premium of Barclays PLC is £4,288m (2022: £4,373m). The decrease in the year is primarily due to
837m shares repurchased with a total nominal value of £209m. This decrease was offset by shares issued under employee share
schemes.
Other equity instruments
Other equity instruments of £13,198m (2022: £13,250m) comprises AT1 securities issued by Barclays PLC. The AT1 securities are
perpetual securities with no fixed maturity and are structured to qualify as AT1 instruments under prevailing capital rules applicable as at
the relevant issue date. During the year there were three issuances with principal amounts totalling £1,500m, USD1,750m and
SGD400m and redemptions with principal amounts totalling £1,250m and USD2,500m. For further details, please refer to Note 27.
The Parent company financials on pages 331 to 333 form part of this note. | | | | | | | | | |
| Climate and sustainability report | | | | | | | Barclays PLC 2023 Annual Report on Form 20-F | |
| |
| | | | | | | | | |
Notes to the financial statements (continued) |
|
43 Related undertakings
The Group’s corporate structure consists
of a number of related undertakings,
comprising subsidiary undertakings, joint
ventures, associated undertakings and
significant holdings. A full list of these
related undertakings is set out below,
together with the country of incorporation,
registered office (or principal place of
business) and the identity and percentage
of each share class held by the Group. The
information is provided as at 31 December
2023.
The entities are grouped by the countries
in which they are incorporated. The profits
earned by the activities of these entities
are in some cases taxed in countries other
than the country of incorporation, for
example where the entity carries on
business through a branch in a territory
outside of its country of incorporation .
Barclays PLC Country Snapshot provides
details of where the Group carries on its
business, where its profits are subject to
tax and the taxes it pays in each country it
operates in.
Wholly owned subsidiaries
Unless otherwise stated the undertakings
below are wholly owned and included in the
consolidation and the share capital held by
the Group comprises ordinary and/or
common shares, which are held by
subsidiaries of Barclays PLC. Unless
otherwise stated, the Group holds 100%
of the nominal value of each share class.
| | | |
| | | |
| | |
| | Directly held by Barclays PLC | |
| | | |
| | | |
| | | |
| | | |
| | | |
| | | |
| | Ordinary/Common Shares in addition to other shares | |
| | | |
| | | |
| | | |
| | | |
| | First Preference Shares, Second Preference shares | |
| | Registered Address not in country of incorporation | |
| | Core Shares, Insurance (Classified) Shares | |
| | Class B, C, D (100%), E, F, G, H, I (94.36%), J (95.32%) and K (100%) | |
| | Non-Redeemable Ordinary Shares | |
| | | |
| | | |
| | | |
| | |
| | | |
| | Class A and Class B Shares | |
| | | |
| | Not Consolidated (see Note 33 Principal Subsidiaries) | |
| | USD Linked Ordinary Shares | |
| | Redeemable Class B Shares | |
| | Capital Contribution Shares | |
| | Class A Redeemable Preference Shares | |
| | Class B Redeemable Preference Shares | |
| | First Class Common Shares, Second Class Common Shares | |
| | Tracker 1 GBP, USD, Euro Shares; Tracker 2 USD Shares, Tracker 3 USD Shares | |
| | Non-Voting Redeemable Preference Shares | |
| | | |
| |
Wholly owned subsidiaries | |
| |
1 Churchill Place, London, E14 5HP | |
Aequor Investments Limited | |
Alynore Investments Limited Partnership | |
Ardencroft Investments Limited | |
B D & B Investments Limited | |
B.P.B. (Holdings) Limited | |
| |
Barclays Aldersgate Investments Limited | |
Barclays Asset Management Limited | |
| |
| |
Barclays Capital Asia Holdings Limited | |
Barclays Capital Nominees (No.2) Limited | |
Barclays Capital Nominees (No.3) Limited | |
Barclays Capital Nominees Limited | |
Barclays Capital Securities Client Nominee Limited | |
Barclays Capital Securities Limited | |
| |
Barclays Converted Investments (No.2) Limited | |
Barclays Direct Investing Nominees Limited | |
Barclays Directors Limited | |
Barclays Equity Holdings Limited | |
Barclays Execution Services Limited | |
Barclays Executive Schemes Trustees Limited | |
Barclays Financial Planning Nominee Company Limited | |
Barclays Funds Investments Limited | |
Barclays Group Holdings Limited | |
Barclays Industrial Development Limited | |
Barclays Industrial Investments Limited | |
Barclays Insurance Services Company Limited | |
Barclays International Holdings Limited | |
Barclays Investment Management Limited | |
Barclays Investment Solutions Limited | |
Barclays Leasing (No.9) Limited | |
Barclays Long Island Limited | |
Barclays Nominees (George Yard) Limited | |
Barclays OCIO Services Limited | |
Barclays Pension Funds Trustees Limited | |
Barclays Principal Investments Limited | |
| |
| |
Wholly owned subsidiaries | |
| |
Barclays Security Trustee Limited | |
Barclays Services (Japan) Limited | |
| |
Barclays Term Funding Limited Liability Partnership | |
Barclays UK Investments Limited | |
Barclays Unquoted Investments Limited | |
Barclays Unquoted Property Investments Limited | |
Barclays Wealth Nominees Limited | |
Barclayshare Nominees Limited | |
| |
| |
BB Client Nominees Limited | |
| |
BNRI ENG 2014 Limited Partnership | |
| |
BNRI England 2010 Limited Partnership | |
BNRI England 2012 Limited Partnership | |
Carnegie Holdings Limited | |
Chapelcrest Investments Limited | |
Clydesdale Financial Services Limited | |
Cornwall Home Loans Limited | |
CPIA England 2009 Limited Partnership | |
CPIA England No.2 Limited Partnership | |
Dorset Home Loans Limited | |
Durlacher Nominees Limited | |
Eagle Financial and Leasing Services (UK) Limited | |
| |
FIRSTPLUS Financial Group Limited | |
Foltus Investments Limited | |
Global Dynasty Natural Resource Private Equity Limited Partnership | |
| |
| |
| |
Isle of Wight Home Loans Limited | |
| |
Kirsche Investments Limited | |
| |
Long Island Assets Limited | |
Maloney Investments Limited | |
Menlo Investments Limited | |
Mercantile Credit Company Limited | |
Mercantile Leasing Company (No.132) Limited | |
| |
Naxos Investments Limited | |
North Colonnade Investments Limited | |
Northwharf Investments Limited | |
Northwharf Nominees Limited | |
Oak Pension Asset Management Limited | |
Radbroke Mortgages UK Limited | |
Real Estate Participation Management Limited | |
Real Estate Participation Services Limited | |
Relative Value Investments UK Limited Liability Partnership | |
Relative Value Trading Limited | |
Roder Investments No. 1 Limited | |
Roder Investments No. 2 Limited | |
| |
| |
| | | | | | | | | |
| Climate and sustainability report | | | | | | | Barclays PLC 2023 Annual Report on Form 20-F | |
| |
| | | | | | | | | |
Notes to the financial statements (continued) |
|
| |
Wholly owned subsidiaries | |
Sustainable Impact Capital Limited | |
Swan Lane Investments Limited | |
US Real Estate Holdings No.1 Limited | |
US Real Estate Holdings No.2 Limited | |
US Real Estate Holdings No.3 Limited | |
US Real Estate Holdings No.4 Limited | |
US Real Estate Holdings No.5 Limited | |
US Real Estate Holdings No.6 Limited | |
Water Street Investments Limited | |
Wedd Jefferson (Nominees) Limited | |
Westferry Investments Limited | |
| |
Woolwich Qualifying Employee Share Ownership Trustee Limited | |
| |
| |
C/O Teneo Financial Advisory Limited, 3rd Floor, The Colmore Building, 20 Colmore Circus Queensway, Birmingham, West Midlands, B4 6AT | |
Barclays Capital Finance Limited (In Liquidation) | |
Barclays Capital Japan Securities Holdings Limited (In Liquidation) | |
Barclays Global Shareplans Nominee Limited (In Liquidation) | |
Barclays Nominees (Branches) Limited (In Liquidation) | |
Barclays Singapore Global Shareplans Nominee Limited (In Liquidation) | |
Cobalt Investments Limited (In Liquidation) | |
DMW Realty Limited (In Liquidation) | |
Solution Personal Finance Limited (In Liquidation) | |
| |
Ascot House, Maidenhead Office Park, Maidenhead, SL6 3QQ | |
Kensington Mortgage Company Limited | |
Kensington Mortgage Services Limited | |
| |
1-4, Clyde Place Lane, Glasgow, G5 8DP | |
R.C. Greig Nominees Limited | |
| |
50 Lothian Road, Festival Square, Edinburgh, EH3 9WJ | |
| |
| |
| |
| |
Logic House, Waterfront Business Park, Park, Fleet Road, Fleet, GU51 3SB | |
The Logic Group Enterprises Limited | |
The Logic Group Holdings Limited | |
| |
9, allée Scheffer, L-2520, Luxembourg | |
Barclays Claudas Investments Partnership | |
Barclays Pelleas Investments Limited Partnership | |
Barclays Blossom Finance Limited Partnership | |
| |
| |
| |
| |
Wholly owned subsidiaries | |
| |
855 Leandro N.Alem Avenue, 8th Floor, Buenos Aires | |
| |
| |
Marval, O’Farrell & Mairal, Av. Leandro N. Alem 882, Buenos Aires, C1001AAQ | |
Compañia Regional del Sur S.A. | |
| |
| |
Av. Brigadeiro Faria Lima, No.4.440, 12th Floor, Bairro Itaim Bibi, Sao Paulo, CEP, 04538-132 | |
Barclays Brasil Assessoria Financeira Ltda | |
BNC Brazil Consultoria Empresarial Ltda | |
| |
| |
333 Bay Street, Suite 4910, Toronto ON M5H 2R2 | |
Barclays Capital Canada Inc. | |
| |
Stikeman Elliot LLP, 199 Bay Street, 5300 Commerce Court West, Toronto ON M5L 1B9 | |
Barclays Corporation Limited | |
| |
1 Churchill Place, London, E14 5HP | |
| |
| |
| |
PO Box 309, Ugland House, George Town, Grand Cayman, KY1-1104 | |
Alymere Investments Limited | |
Analytical Trade UK Limited | |
Barclays Capital (Cayman) Limited | |
Barclays Securities Financing Limited | |
Barclays US Holdings Limited | |
Braven Investments No.1 Limited | |
Calthorpe Investments Limited | |
Capton Investments Limited | |
Claudas Investments Limited | |
Claudas Investments Two Limited | |
CPIA Investments No.2 Limited | |
Gallen Investments Limited | |
Hurley Investments No.1 Limited (In Liquidation) | |
Mintaka Investments No. 4 Limited | |
| |
Pelleas Investments Limited | |
Pippin Island Investments Limited | |
Razzoli Investments Limited | |
| |
Wessex Investments Limited (In Liquidation) | |
| |
| |
Walkers Corporate Limited, Cayman Corporate Centre, 27 Hospital Road, George Town, KY1- 9008 | |
Long Island Holding B Limited (In Liquidation) | |
| |
| |
Wholly owned subsidiaries | |
| |
34-36 avenue de Friedland, 75008, Paris | |
| |
| |
| |
Stuttgarter Straße 55-57, 73033 Göppingen | |
Holding Stuttgarter Straße GmbH (In Liquidation) | |
| |
| |
P.O. Box 33, Dorey Court, Admiral Park, St. Peter Port, GY1 4AT | |
Barclays Insurance Guernsey PCC Limited | |
Barclays UKRF No.1 IC Limited | |
Barclays UKRF ICC Limited | |
Barclays UKRF No.2 IC Ltd | |
| |
| |
42nd floor Citibank Tower, Citibank Plaza, 3 Garden Road | |
Barclays Bank (Hong Kong Nominees) Limited (In Liquidation) | |
Barclays Capital Asia Nominees Limited (In Liquidation) | |
| |
Level 41, Cheung Kong Center, 2 Queen's Road, Central | |
Barclays Capital Asia Limited | |
| |
| |
208 Ceejay House, Shivsagar Estate, Dr A Beasant Road, Worli, Mumbai, 400 018 | |
Barclays Securities (India) Private Limited | |
Barclays Wealth Trustees (India) Private Limited | |
| |
5th to 12th Floor (Part), Building G2, Gera Commerzone SEZ, Survey No.65, Kharadi, Pune, 411014 | |
Barclays Global Service Centre Private Limited | |
| |
Nirlon Knowledge Park, Level 9, Block B-6, Off Western Express Highway, Goregaon (East), Mumbai, 400063 | |
Barclays Investments & Loans (India) Private Limited | |
| |
| |
One Molesworth Street, Dublin 2, D02RF29 | |
Barclaycard International Payments Limited | |
Barclays Bank Ireland Public Limited Company | |
Barclays Europe Client Nominees Designated Activity Company | |
Barclays Europe Firm Nominees Designated Activity Company | |
Barclays Europe Nominees Designated Activity Company | |
| |
25-28 North Wall Quay, Dublin1, D01H104 | |
Erimon Home Loans Ireland Limited | |
| |
70 Sir John Rogerson’s Quay, Dublin 2 | |
Barclays Finance Ireland Limited | |
| |
| | | | | | | | | |
| Climate and sustainability report | | | | | | | Barclays PLC 2023 Annual Report on Form 20-F | |
| |
| | | | | | | | | |
Notes to the financial statements (continued) |
|
| |
Wholly owned subsidiaries | |
Corporation Service Company, 251 Little Falls Drive, Wilmington, DE 19808 | |
Barclays Ireland Investments LP | |
| |
| |
Eagle Court, Circular Road, Douglas, IM1 1AD | |
Barclays Nominees (Manx) Limited | |
Barclays Private Clients International Limited | |
| |
2nd Floor, St Georges Court, Upper Church Street, Douglas, IM1 1EE | |
Barclays Holdings (Isle of Man) Limited (In Liquidation) | |
| |
| |
10-1, Roppongi 6-chome, Minato-ku, Tokyo | |
Barclays Funds and Advisory Japan Limited | |
Barclays Securities Japan Limited | |
Barclays Wealth Services Limited | |
| |
| |
Gaspé House, 66-72 Esplanade, St. Helier, JE1 1GH | |
Barclays Services Jersey Limited | |
| |
5 Espalanade, St Helier, JE2 3QA | |
Barclays Wealth Management Jersey Limited | |
| |
13 Library Place, St Helier, JE4 8NE | |
Barclays Nominees (Jersey) Limited | |
Barclaytrust Channel Islands Limited | |
| |
Estera Trust (Jersey) Limited, 13-14 Esplanade, St Helier, JE1 1EE, Jersey | |
| |
| |
| |
9, allée Scheffer, L-2520 | |
Barclays Bedivere Investments S.à r.l. | |
Barclays Cantal Investments S.à r.l. | |
Barclays Capital Luxembourg S.à r.l. | |
Barclays Capital Trading Luxembourg S.à r.l. | |
Barclays Claudas Investments S.à r.l. | |
Barclays Equity Index Investments S.à r.l. | |
Barclays International Luxembourg Dollar Holdings S.à r.l. | |
Barclays Luxembourg EUR Holdings S.à r.l | |
Barclays Luxembourg GBP Holdings S.à r.l. | |
Barclays Luxembourg Global Funding S.à r.l. | |
Barclays Luxembourg Holdings S.à r.l. | |
Barclays Luxembourg Holdings SSC | |
BNRI Limehouse No.1 S.à r.l. | |
| |
68-70 Boulevard de la Petrusse, L-2320 | |
| |
| |
10 rue du Cha'teau d'Eau, Leudelange, Grand Duchy of Luxembourg L-3364 | |
| |
| |
| |
| |
Wholly owned subsidiaries | |
C/O Rogers Capital Corporate Services Limited, 3rd Floor, Rogers House, No.5 President John Kennedy Street, Port Louis | |
Barclays Capital Mauritius Limited (In Liquidation) | |
Barclays Capital Securities Mauritius Limited | |
| |
Fifth Floor Ebene Esplanade, 24 Bank Street, Cybercity 72201 Ebene | |
Barclays Mauritius Overseas Holdings Limited | |
| |
| |
Paseo de la Reforma 505, 41 Floor, Torre Mayor, Col. Cuauhtemoc, CP 06500 | |
Barclays Bank Mexico, S.A. | |
Barclays Capital Casa de Bolsa, S.A. de C.V. | |
Grupo Financiero Barclays Mexico, S.A. de C.V. | |
Servicios Barclays, S.A. de C.V. (In Liquidation) | |
| |
| |
31 Avenue de la Costa, Monte Carlo BP 339 | |
Barclays Private Asset Management (Monaco) S.A.M | |
| |
| |
3rd Floor Al Dahna Center, 114 Al-Ahsa Street, PO Box 1454, Riyadh 11431 | |
Barclays Saudi Arabia (In Liquidation) | |
| |
| |
10 Marina Boulevard, #25-01 Marina Bay Financial Centre, Tower 2, 018983 | |
Barclays Merchant Bank (Singapore) Ltd. | |
| |
| |
Calle Jose, Abascal 51, 28003, Madrid | |
Barclays Tenedora De Inmuebles SL. | |
BVP Galvani Global, S.A.U. | |
| |
| |
Chemin de Grange Canal 18-20, PO Box 3941, 1211, Geneva | |
Barclays Bank (Suisse) SA | |
Barclays Switzerland Services SA | |
| |
| |
| |
19F-1, No. 7, Xinyi Road, Sec. 5, Taipei,A322, Taiwan | |
Barclays Securities Taiwan Limited | |
| |
| |
Corporation Service Company, 251 Little Falls Drive, Wilmington, DE 19808 | |
Analytical Trade Holdings LLC | |
Barclays Asset Backed Depositor LLC | |
| |
Barclays Capital Derivatives Funding LLC | |
Barclays Capital Energy Inc. | |
| |
Wholly owned subsidiaries | |
Barclays Capital Equities Trading GP | |
Barclays Capital Holdings Inc. | |
Barclays Capital Real Estate Finance Inc. | |
Barclays Capital Real Estate Holdings Inc. | |
Barclays Capital Real Estate Inc. | |
Barclays Commercial Mortgage Securities LLC | |
Barclays Dryrock Funding LLC | |
| |
| |
Barclays Oversight Management Inc. | |
| |
Barclays Services Corporation | |
| |
Barclays US CCP Funding LLC | |
Barclays US Investments Inc. | |
| |
| |
Gracechurch Services Corporation | |
| |
Long Island Holding A LLC | |
| |
| |
Procella Investments No.2 LLC | |
Procella Investments No.3 LLC | |
Relative Value Holdings, LLC | |
Surrey Funding Corporation | |
Sussex Purchasing Corporation | |
| |
US Secured Investments LLC | |
| |
Wilmington Riverfront LLC | |
| |
100 Bank Street, Suite 630, Burlington, Vermont 05401 | |
Barclays Insurance U.S. Inc. | |
| |
Corporation Service Company, 80 State Street, Albany, NY, 12207-2543 | |
Barclays Equity Holdings Inc. | |
| |
Corporation Service Company. Goodwin Square, 225 Asylum Street, 20th Floor Hartford CT 06103 | |
| |
| |
Corporation Service Company, 2626, Glenwood Ave, Suite 550, Raleigh, NC, 27608 | |
| |
Equifirst Corporation (In Liquidation, Dissolved with State of North Carolina) | |
| |
125 S West Street, Wilmington, DE 19801 | |
| |
Barclays Dryrock Issuance Trust | |
| | | | | | | | | |
| Climate and sustainability report | | | | | | | Barclays PLC 2023 Annual Report on Form 20-F | |
| |
| | | | | | | | | |
Notes to the financial statements (continued) |
|
Other Related Undertakings
Unless otherwise stated, the undertakings
below are included in the consolidation and
the share capital held by the Group
comprises ordinary and/or common
shares, which are held by subsidiaries of
Barclays PLC. The percentage of the
nominal value of each share class held by
the Group is provided below.
| | |
Other Related Undertakings | | |
| | |
1 Churchill Place, London, E14 5HP | | |
| | |
| | |
PSA Credit Company Limited (In Liquidation) | | |
| | |
| | |
Barclays Covered Bonds Limited Liability Partnership | | |
Barclays Secured Funding (LM) Limited | | |
| | |
St Helen’s, 1 Undershaft, London, EC3P 3DQ | | |
Igloo Regeneration (General Partner) Limited | | |
| | |
3-5 London Road, Rainham, Kent, ME8 7RG | | |
| | |
| | |
50 Lothian Road, Festival Square, Edinburgh, EH3 9WJ | | |
Equistone Founder Partner II L.P. | | |
Equistone Founder Partner III L.P. | | |
| | |
Enigma, Wavendon Business Park Milton Keynes, MK178LX | | |
Intelligent Processing Solutions Limited | | |
| | |
C/O Azets Holdings Limited 5th Floor, 98 King Street, Manchester, M2 4WU | | |
Full House Holdings Limited (In Liquidation) | | |
| | |
13-15 York Buildings, London, WC2N 6JU | | |
| | |
| | |
Unit 9 Westbrook Court, Sharrowvale Road, Sheffield, S11 8YZ | | |
Palms Row Healthcare Holdings Limited | | |
| | |
5th Floor, 44 Great Marlborough Street,London,W1F 7JL | | |
| | |
| | |
41 Luke Street, London, EC2A 4DP | | |
Fintech for International Development Limited (In Liquidation) | | |
| | |
| | |
Other Related Undertakings | | |
3rd Floor, 25 Soho Square,London,W1D 3QR, | | |
| | |
| | |
1 America Square, Crosswall, London, EC3N 2SG | | |
| | |
| | |
C/O Cooley (Uk) Llp, 22 Bishopsgate, London, EC2N 4BQ | | |
Barclays Black Formation Investments I LP | | |
Barclays Black Formation Investments II LP | | |
| | |
1-4 Clyde Place, Glasgow, G5 8DP | | |
Buchanan Wharf (Glasgow) Management Limited | | |
| | |
| | |
Klipperstraat 15 2030 Antwerp | | |
Euphony Benelux NV (In Liquidation) | | |
| | |
| | |
Maples Corporate Services Limited, PO Box 309GT, Ugland House, South Church Street, Grand Cayman, KY1-1104 | | |
Cupric Canyon Capital GP Limited | | |
| | |
Newman Holdings Limited (In Liquidation) | | |
| | |
| | |
| | |
| | |
18th Floor, Daishin Finance Centre, 343, Samil-daero, Jung-go, Seoul | | |
Woori BC Pegasus Securitization Specialty Co. Ltd | | |
| | |
| | |
9, allee Scheffer, L-2520 | | |
Barclays Alzin Investments S.à r.l. | | |
Barclays Bordang Investments S.à r.l. | | |
Barclays Lamorak Investments S.à r.l. | | |
Preferred Funding S.à r.l. | | |
Preferred Investments S.à r.l. | | |
| | |
| | |
RS2 Buildings, Fort Road, Mosta MST 1859 | | |
| | |
| | |
| | |
Alexanderstraat 18, The Hague, 2514 JM, Zuid-Holland | | |
| | |
| | |
| | |
Other Related Undertakings | | |
| | |
| | |
c/o ForeningsSparbanken AB 105 34 Stockholm | | |
| | |
| | |
| | |
Corporation Services Company, 251 Little Falls, Drive Wilmington, DE 19808 | | |
| | |
| | |
Corporation Trust Company, Corporation Trust Centre, 1209 Orange Street, Wilmington DE 19801 | | |
| | |
| | |
| | |
1415 Louisiana Street, Suite 1600, TX 77002-0000 | | |
Sabine Oil & Gas Holdings, Inc.(In Liquidation) | | |
Joint Ventures
The related undertaking below is dealt with
as a Joint Venture in accordance with s.
18, Schedule 4, The Large and Medium-
sized Companies and Groups (Accounts
and Reports) Regulations 2008 and is
proportionally consolidated. The
proportion of the capital of the related
undertaking held by the Group is stated
below.
Joint management factors
The Board of Directors of the above Joint
Venture comprises two Barclays
representative Directors, two JV partner
Directors and three non-JV partner
Directors. The Board of Directors are
responsible for setting the Company
strategy and budgets.
The last financial year of the above JV
ended on 6 October 2023 and the average
number of monthly employees reported in
the accounts was 1,216.
| | | | | | | | | |
| Climate and sustainability report | | | | | | | Barclays PLC 2023 Annual Report on Form 20-F | |
| |
| | | | | | | | | |
Notes to the financial statements (continued) |
|
Shareholder information
Annual General Meeting (AGM)
The Barclays PLC 2024 AGM will be held on Thursday 9 May 2024 at 11:00 (UK time) at SEC (Scottish Event Campus) Armadillo,
Exhibition Way, Glasgow G3 8YW and electronically on an online platform as described in the Notice of Meeting, to be published on the
Company's website (home.barclays/agm).
Keep your personal details up to date
Please remember to tell Equiniti if:
▪you move
▪you need to update your bank or building society details.
If you are a Shareview member, you can update your bank or building society account or address details online. If you are not a
Shareview member you can update details quickly and easily over the telephone using the Equiniti contact details on the next page.
Key dates
3 April 2024
Full year dividend payment date
25 April 2024
Q1 Results Announcement
9 May 2024
Annual General Meeting at 11.00am
Dividends
The Barclays PLC 2023 full year dividend for the year ended 31 December 2023 will be 5.3pper share, making the 2023 total dividend
8.0p per share.
Dividend Reinvestment Plan
Barclays offers a share alternative in the form of a dividend reinvestment plan (DRIP) for those shareholders who wish to elect to use
their dividend payments to purchase additional ordinary shares, rather than receive a cash payment. The DRIP is provided and
administered by Barclays’ registrar, Equiniti.
Share Price
Share price Information on the Barclays share price and other share price tools are available at: home.barclays/investorrelations
Further details regarding the DRIP can be found at home.barclays/dividends and www.shareview.co.uk/info/drip.
Donations To Charity
We launched a Share Dealing Service in October 2017 aimed at shareholders with relatively small shareholdings for whom it might
otherwise be uneconomical to deal. One option open to shareholders was to donate their sale proceeds to ShareGift. As a result of this
initiative, £75,452.72 was donated in 2023, taking the total donated since 2017 to over £336,200.
Shareholder security
Shareholders should be wary of any cold calls with an offer to buy or sell shares. Fraudsters use persuasive and high pressure techniques
to lure shareholders into high-risk investments or scams. You should treat any unsolicited calls with caution.
Please keep in mind that firms authorised by the Financial Conduct Authority (FCA) are unlikely to contact you out of the blue. You
should consider getting independent financial or professional advice from someone unconnected to the respective firm before you
hand over any money.
Report a scam
If you suspect that you have been approached by fraudsters please tell the FCA using the share fraud reporting form at fca.org.uk/
scams. You can also call the FCA Helpline on 0800 111 6768 or through Action Fraud on 0300 123 2040.
| | | | | | | | |
| Climate and sustainability report | | | | | | Barclays PLC 2023 Annual Report on Form 20-F | |
|
| | | | | | | | |
Additional unaudited information - Shareholder information |
Managing your shares online
Shareview
Barclays shareholders can go online to manage their shareholding and find out about Barclays performance by joining Shareview.
Through Shareview, you:
▪will receive the latest updates from Barclays direct to your email;
▪can update your address and bank details online;
▪can vote in advance of general meetings.
To join Shareview, please follow these two easy steps:
Step 1 Go to portfolio.shareview.co.uk
Step 2 Register for electronic communications by following the instructions on screen
Returning funds to shareholders
Over 60,000 shareholders did not cash their Shares Not Taken Up (SNTU) cheque following the Rights Issue in September 2013. In
2023, we continued the tracing process to reunite these shareholders with their SNTU monies and any unclaimed dividends and by the
end of the year, we had returned approximately £32,000 to our shareholders, in addition to the approximately £5.0m returned since
2015.
Useful contact details
Equiniti
The Barclays share register is maintained by Equiniti. If you have any questions about your Barclays shares, please contact Equiniti by
visiting shareview.co.uk
+44 (0)371 384 2055a
(UK & International telephone number)
+44 (0)371 384 2255a
(for the hearing impaired in the UK & International)
Aspect House, Spencer Road, Lancing, West Sussex BN99 6DA
To find out more, contact Equiniti or visit: home.barclays/dividends
American Depositary Receipts (ADRs)
ADRs represent the ownership of Barclays PLC shares which are traded on the New York Stock Exchange. ADRs carry prices, and pay
dividends, in US dollars.
If you have any questions about ADRs, please contact Shareowner Services:
StockTransfer@equiniti.com or visit adr.com
+1 800 990 1135
(toll free in the US and Canada)
+1 651 453 2128
(outside the US and Canada)
Shareowner Services, PO Box 64504, St Paul, MN 55164-0504, USA
Delivery of ADR certificates and overnight mail
Shareowner Services, 1110 Centre Point Curve, Suite 101, Mendota Heights, MN 55120-4100, USA
Qualifying US and Canadian resident ADR holders should contact Shareowner Services for further details regarding the DRIP.
Shareholder Relations
To give us your feedback or if you have any questions, please contact:
privateshareholderrelations@barclays.com
Shareholder Relations, Barclays PLC, 1 Churchill Place, London E14 5HP
Alternative formats
Shareholder documents can be provided in large print, audio CD or Braille free of charge by calling Equiniti.
+44 (0)371 384 2055a
(UK & International telephone number)
Note
aLines open 8.30am to 5.30pm (UK time) Monday to Friday, excluding public holidays.
| | | | | | | | |
| Climate and sustainability report | | | | | | Barclays PLC 2023 Annual Report on Form 20-F | |
|
| | | | | | | | |
Additional unaudited information - Shareholder information |
Additional unaudited information
Additional shareholder information
Articles of Association
Barclays PLC (the “Company”) is a public limited company registered in England and Wales under company number 48839. Barclays,
originally named Barclay & Company Limited, was incorporated in England and Wales on 20 July 1896 under the Companies Acts 1862
to 1890 as a company limited by shares. The company name was changed to Barclays Bank Limited on 17 February 1917 and it was
registered on 15 February 1982 as a public limited company under the Companies Acts 1948 to 1980. On 1 January 1985, the company
changed its name to Barclays PLC. The Objects of the Company are unrestricted.
The current Articles of Association were adopted at the Company’s Annual General Meeting (“AGM”) on 5 May 2021, in substitution for
and to the exclusion of Articles adopted on 30 April 2010 and amended on 25 April 2013.
The following is a summary and explanation of the current Articles of Association, which are available for inspection.
Directors
(i)The minimum number of Directors (excluding alternate Directors) is five. There is no maximum limit. There is no age limit for
Directors.
(ii)Excluding executive remuneration and any other entitlement to remuneration for extra services (including service on board
committees) under the Articles, a Director is entitled to a fee at a rate determined by the Board but the aggregate fees paid to all
Directors shall not exceed £2,000,000 per annum or such higher amount as may be approved by an ordinary resolution of the
Company. Each Director is entitled to reimbursement for all reasonable travelling, hotel and other expenses properly incurred by
him/her in or about the performance of his/her duties.
(iii)No Director may act (either himself/herself or through his/her firm) as an auditor of the Company. A Director may hold any other
office of the Company on such terms as the Board shall determine.
(iv)At each AGM of the Company, one third of the Directors (rounded down) are required under the Articles of Association to retire
from office by rotation and may offer themselves for re-election. The Directors so retiring are first, those who wish to retire and
not offer themselves for re-election, and, second those who have been longest in office (and in the case of equality of service
length are selected by lot). Other than a retiring Director, no person shall (unless recommended by the Board) be eligible for
election unless a member notifies the Company Secretary in advance of his/her intention to propose a person for election. It is
Barclays’ practice that all Directors offer themselves for re-election annually in accordance with the UK Corporate Governance
Code.
(v)The Board has the power to appoint additional Directors or to fill a casual vacancy amongst the Directors. Any Director so
appointed holds office until the next AGM, when he/she may offer himself/herself for reappointment. He/she is not taken into
account in determining the number of Directors retiring by rotation.
(vi)The Board may appoint any Director to any executive position or employment in the Company on such terms as they determine.
(vii)The Company may by ordinary resolution remove a Director before the expiry of his/her period of office (without prejudice to a
claim for damages for breach of contract or otherwise) and may by ordinary resolution appoint another person who is willing to act
to be a Director in his/her place.
(viii)A Director may appoint either another Director or some other person approved by the Board to act as his/her alternate with power
to attend Board meetings and generally to exercise the functions of the appointing Director in his/her absence (other than the
power to appoint an alternate).
(ix)The Board may authorise any matter in relation to which a Director has, or can have, a direct interest that conflicts, or possibly may
conflict with, the Company’s interests. Only Directors who have no interest in the matter being considered will be able to authorise
the relevant matter and they may impose limits or conditions when giving authorisation if they think this is appropriate.
(x)A Director may hold positions with or be interested in other companies and, subject to legislation applicable to the Company and
the FCA’s requirements, may contract with the Company or any other company in which the Company is interested. A Director
may not vote or count towards the quorum on any resolution concerning any proposal in which he/she (or any person connected
with him/her) has a material interest (other than by virtue of his/her interest in securities of the Company) or if he/she has a duty
which conflicts or may conflict with the interests of the Company, unless the resolution relates to any proposal:
(a)to indemnify a Director or provide him/her with a guarantee or security in respect of money lent by him/her to, or any
obligation incurred by him/her or any other person for the benefit of (or at the request of), the Company (or any other
member of the Group);
(b)to indemnify or give security or a guarantee to a third party in respect of a debt or obligation of the Company (or any other
member of the Group) for which the Director has personally assumed responsibility;
(c)to obtain insurance for the benefit of Directors;
(d)involving the acquisition by a Director of any securities of the Company (or any other member of the Group) pursuant to an
offer to existing holders of securities or to the public;
(e)that the Director underwrite any issue of securities of the Company (or any other member of the Group);
| | | | | | | | |
| Climate and sustainability report | | | | | | Barclays PLC 2023 Annual Report on Form 20-F | |
|
| | | | | | | | |
Additional unaudited information |
(f)concerning any other company in which the Director is interested as an officer or creditor or Shareholder but, broadly, only if
he/she (together with his/her connected persons) is directly or indirectly interested in less than 1% of either any class of the
issued equity share capital or of the voting rights of that company; and
(g)concerning any other arrangement for the benefit of employees of the Company (or any other member of the Group) under
which the Director benefits or stands to benefit in a similar manner to the employees concerned and which does not give the
Director any advantage which the employees to whom the arrangement relates would not receive.
(i)A Director may not vote or be counted in the quorum on any resolution which concerns his/her own employment or appointment
to any office of the Company or any other company in which the Company is interested.
(ii)Subject to applicable legislation, the provisions described in sub-paragraphs (x) and (xi) may be relaxed or suspended by an ordinary
resolution of the members of the Company or any applicable governmental or other regulatory body.
(iii)The Board may exercise all of the powers of the Company to borrow money, to mortgage or charge its undertaking, property and
uncalled capital and to issue debentures and other securities.
Classes of Shares
The Company only has Ordinary Shares in issue. The Articles of Association also provide for pound sterling preference shares of £100
each, US dollar preference shares of US$100 each, US dollar preference shares of $0.25 each, euro preference shares of €100 each
and yen preference shares of ¥10,000 each (together, the “Preference Shares”). In accordance with the authority granted at the AGM
on 5 May 2021, Preference Shares may be issued by the Board from time to time in one or more series with such rights and subject to
such restrictions and limitations as the Board may determine. No Preference Shares have been issued to date.
Dividends
Subject to the provisions of the Articles and applicable legislation, the Company in general meeting may declare dividends on the
Ordinary Shares by ordinary resolution, but any such dividend may not exceed the amount recommended by the Board. The Board may
also pay interim or final dividends if it appears they are justified by the Company’s financial position.
Each Preference Share confers the right to a preferential dividend (“Preference Dividend”) payable in such currency at such rates
(whether fixed or calculated by reference to or in accordance with a specified procedure or mechanism), on such dates and on such
other terms as may be determined by the Board prior to allotment thereof.
The Preference Shares rank in regard to payment of dividends in priority to the holders of Ordinary Shares and any other class of shares
in the Company ranking junior to the Preference Shares.
Dividends may be paid on the Preference Shares if, in the opinion of the Board, the Company has sufficient distributable profits, after
payment in full or the setting aside of a sum to provide for all dividends payable on (or in the case of shares carrying a cumulative right to
dividends, before) the relevant dividend payment date on any class of shares in the Company ranking pari passu with or in priority to the
relevant series of Preference Shares as regards participation in the profits of the Company.
If the Board considers that the distributable profits of the Company available for distribution are insufficient to cover the payment in full
of Preference Dividends, Preference Dividends shall be paid to the extent of the distributable profits on a pro rata basis.
Notwithstanding the above, the Board may, at its absolute discretion, determine that any Preference Dividend which would otherwise
be payable may either not be payable at all or only payable in part.
If any Preference Dividend on a series of Preference Shares is not paid, or is only paid in part, for the reasons described above, holders of
Preference Shares will not have a claim in respect of such non-payment.
If any dividend on a series of Preference Shares is not paid in full on the relevant dividend payment date, a dividend restriction shall apply.
The dividend restriction means that, subject to certain exceptions, neither the Company nor Barclays Bank may (a) pay a dividend on, or
(b) redeem, purchase, reduce or otherwise acquire, any of their respective ordinary shares, other preference shares or other share
capital ranking equal or junior to the relevant series of Preference Shares until the earlier of such time as the Company next pays in full a
dividend on the relevant series of Preference Shares or the date on which all of the relevant series of Preference Shares are redeemed.
All unclaimed dividends payable in respect of any share may be invested or otherwise made use of by the Board for the benefit of the
Company until claimed. If a dividend is not claimed after 12 years of it becoming payable, it is forfeited and reverts to the Company. The
Company shall hold the net proceeds from the sale of shares owned by untraced Shareholders for a period of six years after which the
proceeds shall belong to the Company.
The Board may, with the approval of an ordinary resolution of the Company, offer Shareholders the right to choose to receive an
allotment of additional fully paid Ordinary Shares instead of cash in respect of all or part of any dividend. The Company currently
provides a dividend reinvestment programme but has the option to provide a scrip dividend programme pursuant to an authority
renewed at the AGM on 1 May 2018.
Redemption and Purchase
Subject to applicable legislation and the rights of the other shareholders, any share may be issued on terms that it is, at the option of the
Company or the holder of such share, redeemable. The Directors are authorised to determine the terms, conditions and manner of
redemption of any such shares under the Articles of Association.
Calls on capital
The Directors may make calls upon the members in respect of any monies unpaid on their shares. A person upon whom a call is made
remains liable even if the shares in respect of which the call is made have been transferred. Interest will be chargeable on any unpaid
amount called at a rate determined by the Board (of not more than 20% per annum).
| | | | | | | | |
| Climate and sustainability report | | | | | | Barclays PLC 2023 Annual Report on Form 20-F | |
|
| | | | | | | | |
Additional unaudited information |
If a member fails to pay any call in full (following notice from the Board that such failure will result in forfeiture of the relevant shares),
such shares (including any dividends declared but not paid) may be forfeited by a resolution of the Board, and will become the property
of the Company. Forfeiture shall not absolve a previous member for amounts payable by him/her (which may continue to accrue
interest).
The Company also has a lien over all partly paid shares of the Company for all monies payable or called on that share and over the debts
and liabilities of a member to the Company. If any monies which are the subject of the lien remain unpaid after a notice from the Board
demanding payment, the Company may sell such shares.
Annual and other general meetings
The Company is required to hold an AGM in addition to such other general meetings as the Directors think fit. The type of the meeting
will be specified in the notice calling it. Under the Companies Act 2006, the AGM must be held within six months of the financial year end.
A general meeting may be convened by the Board on requisition in accordance with the applicable legislation.
In the case of an AGM, a minimum of 21 clear days’ notice is required. The notice must be in writing and must specify the place, the day
and the hour of the meeting, and the general nature of the business to be transacted. A notice convening a meeting to pass a special
resolution shall specify the intention to propose the resolution as such. The accidental failure to give notice of a general meeting or the
non-receipt of such notice will not invalidate the proceedings at such meeting.
Subject as noted above, all Shareholders are entitled to attend and vote at general meetings. The Articles do, however, provide that
arrangements may be made for simultaneous attendance at a satellite meeting place or, if the meeting place is inadequate to
accommodate all members and proxies entitled to attend, another meeting place may be arranged to accommodate such persons
other than that specified in the notice of meeting, in which case Shareholders may be excluded from the principal place. The Articles
also allow for a hybrid meeting, whereby Shareholders may attend by electronic means or physically.
Holders of Preference Shares have no right to receive notice of, attend or vote at, any general meetings of the Company as a result of
holding Preference Shares.
Notices
A document or information may be sent by the Company in hard copy form, electronic form, by being made available on a website, or by
another means agreed with the recipient, in accordance with the provisions set out in the Companies Act 2006. Accordingly, a
document or information may only be sent in electronic form to a person who has agreed to receive it in that form or, in the case of a
company, who has been deemed to have so agreed pursuant to applicable legislation. A document or information may only be sent by
being made available on a website if the recipient has agreed to receive it in that form or has been deemed to have so agreed pursuant
to applicable legislation, and has not revoked that agreement.
In respect of joint holdings, documents or information shall be sent to the joint holder whose name stands first in the register.
A member who (having no registered address within the UK) has not supplied an address in the UK at which documents or information
may be sent in hard copy form, or an address to which notices, documents or information may be sent or supplied by electronic means,
is not entitled to have documents or information sent to him/her.
In addition, the Company may cease to send notices to any member who has been sent documents on two consecutive occasions over
a period of at least 12 months and when each of those documents is returned undelivered or notification is received that they have not
been delivered.
Capitalisation of profits
The Company may, by ordinary resolution, upon the recommendation of the Board capitalise all or any part of an amount standing to
the credit of a reserve or fund to be set free for distribution provided that amounts from the share premium account, capital
redemption reserve or any profits not available for distribution should be applied only in paying up unissued shares to be allotted to
members credited as fully paid and no unrealised profits shall be applied in paying up debentures of the Company or any amount unpaid
on any share in the capital of the Company.
Indemnity
Subject to applicable legislation, every current and former Director or other officer of the Company (other than any person engaged by
the company as auditor) shall be indemnified by the Company against any liability in relation to the Company, other than (broadly) any
liability to the Company or a member of the Group, or any criminal or regulatory fine.
Dividends on the ordinary shares of Barclays PLC
The dividends declared for each of the last five years were:
| | | | | |
Pence per 25p ordinary share |
| | | | | |
| | | | | |
| | | | | |
| | | | | |
| | | | | |
US Dollars per 25p ordinary share |
| | | | | |
| | | | | |
| | | | | |
| | | | | |
| | | | | | | | |
| Climate and sustainability report | | | | | | Barclays PLC 2023 Annual Report on Form 20-F | |
|
| | | | | | | | |
Additional unaudited information |
The gross dividends applicable to an American Depositary Share (ADS) representing four ordinary shares, before deduction of
withholding tax, are as follows:
| | | | | |
US Dollars per American Depositary Share |
| | | | | |
| | | | | |
| | | | | |
| | | | | |
The final dividends shown above are expressed in Dollars translated at the closing spot rate for Pounds Sterling as determined by
Bloomberg at 5pm in New York City (the ‘Closing Spot Rate’) on the latest practicable date for inclusion in this report. No representation
is made that Pounds Sterling amounts have been, or could have been, or could be, converted into Dollars at these rates.
Trading market for ordinary shares of Barclays PLC
The principal trading market for Barclays PLC ordinary shares is the London Stock Exchange. At the close of business on 31 December
2023, there were 15,154,554,000 ordinary shares in issue.
Ordinary share listings were also obtained on the New York Stock Exchange (NYSE) with effect from 9 September 1986. Trading on the
NYSE is in the form of ADSs under the symbol ‘BCS’. Each ADS represents four ordinary shares and is evidenced by an American
Depositary Receipt (ADR). The ADR depositary is JP Morgan Chase Bank, N.A. Details of trading activity are published in the stock tables
of leading daily newspapers in the US.
There were 381 ADR holders and 1,619 recorded holders of ordinary shares with US addresses at 31 December 2023, whose
shareholdings represented approximately 4.92% of total outstanding ordinary shares on that date. Since a certain number of the
ordinary shares and ADRs were held by brokers or other nominees, the number of recorded holders in the US may not be
representative of the number of beneficial holders or of their country of residence.
| | | | |
Shareholdings at 31 December 20231 | | | | |
| | | | |
| | | | |
Classification of shareholders | | | | |
| | | | |
| | | | |
| | | | |
| | | | |
| | | | |
| | | | |
| | | | |
| | | | |
| | | | |
| | | | |
| | | | |
| | | | |
| | | | |
| | | | |
| | | | |
| | | | |
| | | | |
| | | | |
Note
1These figures do not include Barclays Sharestore members.
| | | | | | | | |
| Climate and sustainability report | | | | | | Barclays PLC 2023 Annual Report on Form 20-F | |
|
| | | | | | | | |
Additional unaudited information |
Taxation of UK holders
The following is a summary of certain UK tax issues which are likely to be material to the holding and disposal of Ordinary Shares of
Barclays PLC or ADSs representing such Ordinary Shares (the "Shares").
It is based on the current laws of England and Wales, UK tax law and the practice of His Majesty’s Revenue and Customs ("HMRC"), each
of which may be subject to change, possibly with retrospective effect. It is a general guide for information purposes and should be
treated with appropriate caution. It is not intended as tax advice and it does not purport to describe all of the tax considerations that
may be relevant to a prospective purchaser, holder or disposer of Shares. In particular, save where expressly stated to the contrary, this
summary deals with shareholders who are resident and, in the case of individuals, domiciled in (and only in) the UK for UK tax purposes,
who hold their Shares as investments (other than under an individual savings account) and who are the absolute beneficial owners of
their Shares and any dividends paid on them.
The statements are not addressed to: (i) shareholders who own (or are deemed to own) 10% or more of the voting power of Barclays
PLC; (ii) shareholders who hold Shares as part of hedging transactions; (iii) investors who have (or are deemed to have) acquired their
Shares by virtue of an office or employment; and (iv) shareholders who hold Shares in connection with a trade, profession or vocation
carried on in the UK (whether through a branch or agency or, in the case of a corporate shareholder, through a permanent
establishment, or otherwise). It does not discuss the tax treatment of classes of shareholder subject to special rules, such as dealers in
securities.
Persons who are in any doubt as to their tax position should consult their professional advisers. Persons who may be liable to taxation in
jurisdictions other than the UK in respect of their acquisition, holding or disposal of Shares are particularly advised to consult their
professional advisers as to whether they are so liable.
i.Taxation of dividends
In accordance with UK law, Barclays PLC pays dividends on the Shares without any deduction or withholding for or on account of any
taxes imposed by the UK government or any UK taxing authority.
The total dividends (including any dividends paid by Barclays PLC) paid to a UK resident individual shareholder in a tax year (the "Total
Dividend Income") will generally form part of that shareholder’s total income for UK income tax purposes, and will be subject to UK
income tax at the rates discussed below.
For dividends paid on or after 6 April 2016, the rate of UK income tax applicable to the Total Dividend Income will depend on the amount
of the Total Dividend Income and the UK income tax band(s) that the Total Dividend Income falls within when included as part of the
shareholder’s total income for UK income tax purposes for that tax year.
For the tax year from 6 April 2023 to 5 April 2024 (inclusive), a nil rate of UK income tax applies to the first £1,000 of Total Dividend
Income received by an individual shareholder in that tax year (the "Nil Rate Amount"). For the 2018-2019, 2019-2020, 2020-2021,
2021-2022 and 2022-2023 tax years, the Nil Rate Amount was £2,000. For the 2016-2017 and 2017-2018 tax years, the Nil Rate
Amount was £5,000.
Where the Total Dividend Income received by an individual shareholder in a tax year exceeds the relevant Nil Rate Amount for that tax
year, the excess amount (the "Remaining Dividend Income") will, at the date hereof, be subject to UK income tax at the following current
rates:
(a) at the rate of 8.75% on any portion of the Remaining Dividend Income that falls within the basic tax band;
(b) at the rate of 33.75% on any portion of the Remaining Dividend Income that falls within the higher tax band; and
(c) at the rate of 39.35% on any portion of the Remaining Dividend Income that falls within the additional tax band.
In determining the tax band the Remaining Dividend Income falls within for a tax year, the individual shareholder’s Total Dividend Income
for the tax year in question (including the portion comprising the Nil Rate Amount) will be treated as the top slice of the shareholder’s
total income for UK income tax purposes.
Subject to special rules for small companies, UK resident shareholders within the charge to UK corporation tax will not generally be
subject to UK corporation tax on the dividends paid on the Shares, provided the dividend falls within an exempt class and certain
conditions are met.
ii.Taxation of shares under the Dividend Re-Investment Plan
Where a shareholder elects to purchase Shares using their cash dividend as part of the Dividend Re-Investment Plan, such shareholder
will generally be liable for UK tax on the amount of the dividend as described in (i) Taxation of dividends above, in the same way as the
shareholder would have been on the receipt of a cash dividend. For capital gains purposes, the base cost of Shares purchased under the
Dividend Re-Investment Plan will be the amount of the cash dividend used to purchase such Shares.
iii.Taxation of capital gains
The disposal of Shares (including, for the avoidance of doubt, any shares purchased as part of the Dividend Re-Investment Plan or
previously purchased as part of the Scrip Dividend Programme) may, depending on the shareholder’s circumstances, give rise to a
liability to UK tax on chargeable capital gains.
Where Shares are sold, a liability to UK tax may result if the proceeds from that sale exceed the sum of the base cost of the Shares sold
and any other allowable deductions such as share dealing costs and, in certain circumstances, indexation relief (discussed further
below). To arrive at the total base cost of any Barclays PLC shares held, in appropriate cases the amount subscribed for rights taken up
in 1985, 1988 and 2013 must be added to the cost of all such shares held. For this purpose, current legislation permits the market
valuation at 31 March 1982 to be substituted for the original cost of shares purchased before that date, subject to certain exceptions
for shareholders within the charge to UK corporation tax. Shareholders other than those within the charge to UK corporation tax should
| | | | | | | | |
| Climate and sustainability report | | | | | | Barclays PLC 2023 Annual Report on Form 20-F | |
|
| | | | | | | | |
Additional unaudited information |
note that, following the Finance Act 2008, no indexation allowance will be available. Following the Finance Act 2018, shareholders within
the charge to UK corporation tax may be eligible for indexation allowance for the period of ownership of their Shares up to December
2017, but no indexation allowance will be available in respect of the period of ownership starting on or after 1 January 2018.
Chargeable capital gains may also arise from the gifting of Shares to connected parties such as relatives (although not spouses or civil
partners) and family trusts.
The calculations required to compute chargeable capital gains may be complex. Shareholders are advised to consult their personal
financial adviser for further information regarding a possible tax liability in respect of their holdings of shares.
iv.Stamp duty and stamp duty reserve tax
Dealings in Shares (including, for the avoidance of doubt, any Shares purchased as part of the Dividend Re-Investment Plan or
previously purchased as part of the Scrip Dividend Programme) will generally be subject to UK stamp duty or stamp duty reserve tax
(although see the comments below as regards ADSs in the section ‘Taxation of US holders – UK stamp duty and stamp duty reserve
tax’). Any document effecting the transfer on sale of Shares will generally be liable to stamp duty at 0.5% of the consideration paid for
that transfer (rounded up to the next £5). An unconditional agreement to transfer Shares, or any interest therein, will generally be
subject to stamp duty reserve tax at 0.5% of the consideration given. Such liability to stamp duty reserve tax will be cancelled, or a right
to a repayment (generally with interest) in respect of the stamp duty reserve tax liability will arise, if the agreement is completed by a
duly stamped transfer within six years of the agreement having become unconditional. Both stamp duty and stamp duty reserve tax are
normally the liability of the transferee.
Paperless transfers of Shares within CREST are liable to stamp duty reserve tax rather than stamp duty.
Stamp duty reserve tax on transactions settled within the CREST system or reported through it for regulatory purposes will be collected
by CREST.
Special rules apply to certain categories of person, including intermediaries, market makers, brokers, dealers and persons connected
with depositary arrangements and clearance services.
v.Inheritance tax
An individual may be liable to inheritance tax on the transfer of Shares (including, for the avoidance of doubt, any Shares purchased as
part of the Dividend Re-Investment Plan or previously purchased as part of the Scrip Dividend Programme). Where an individual is so
liable, inheritance tax may be charged on the amount by which the value of his or her estate is reduced as a result of any transfer by way
of gift or other gratuitous transaction made by them or treated as made by them.
Taxation of US Holders
The following is a summary of certain US federal income tax considerations and certain UK tax considerations to the purchase,
ownership and disposition of Ordinary Shares of Barclays PLC or ADSs representing such Ordinary Shares (the "Shares") that are likely
to be relevant for US Holders (as defined below) who own the Shares as capital assets for tax purposes. This discussion is not a
comprehensive analysis of all the potential US or UK tax consequences that may be relevant to US Holders and does not discuss
particular tax consequences that may be applicable to US Holders who may be subject to special tax rules, such as banks, brokers or
dealers in securities or currencies, traders in securities that elect to use a mark-to-market method of accounting for securities
holdings, financial institutions, tax-exempt organisations, regulated investment companies, life insurance companies, entities or
arrangements that are treated as partnerships for US federal income tax purposes (or partners therein), holders that own or are treated
as owning 10% or more of the stock of Barclays PLC measured either by voting power or value, holders that hold Shares as part of a
straddle or a hedging or conversion transaction, holders that purchase or sell Shares as part of a wash sale, holders whose functional
currency is not the US Dollar, or holders who are resident, or who are carrying on a trade, in the UK. The summary also does not address
state or local taxes or any aspect of US federal taxation other than US federal income taxation (such as the estate and gift tax, any
alternative minimum tax or the Medicare tax on net investment income). Investors are advised to consult their tax advisers regarding
the tax implications of their particular holdings, including the consequences under applicable state and local law, and in particular
whether they are eligible for the benefits of the Treaty (as defined below).
This discussion is based on the Internal Revenue Code of 1986, as amended (the "IRC"), its legislative history, existing and proposed
regulations, published rulings and court decisions, and on the Double Taxation Convention between the UK and the US as entered into
force in March 2003 (the "Treaty"), and, in respect of UK tax, the Estate and Gift Tax Convention between the UK and the US as entered
into force on 11 November 1979 (the "Estate and Gift Tax Convention"), the current UK tax law and the practice of HMRC, all of which
are subject to change, possibly on a retroactive basis. This discussion is based in part upon the representations of the ADR Depositary
and the assumption that each obligation of the Deposit Agreement and any related agreement will be performed in accordance with its
terms.
A "US Holder" is a beneficial owner of Shares that is a citizen or resident of the United States or a US domestic corporation or that
otherwise is subject to US federal income taxation on a net income basis in respect of such Shares and that is fully eligible for benefits
under the Treaty.
In general, the holders of ADRs evidencing ADSs will be treated as owners of the underlying Ordinary Shares for the purposes of the
Treaty, the Estate and Gift Tax Convention, and the IRC. Generally, exchanges of shares for ADRs and ADRs for shares will not be
subject to US federal income tax or to UK capital gains tax.
Taxation of dividends
Subject to the PFIC rules discussed below, the gross amount of any distribution of cash or property with respect to the Shares
(including any amount withheld in respect of UK taxes) that is paid out of Barclays PLC’s current or accumulated earnings and profits (as
determined for US federal income tax purposes) will be includible in a US Holder’s taxable income as ordinary dividend income on the
| | | | | | | | |
| Climate and sustainability report | | | | | | Barclays PLC 2023 Annual Report on Form 20-F | |
|
| | | | | | | | |
Additional unaudited information |
day such US Holder receives the dividend, in the case of Ordinary Shares, or the date the Depositary receives the dividends, in the case
of ADRs, and will not be eligible for the dividends-received deduction allowed to corporations under the IRC.
Dividends paid by Barclays PLC to an individual with respect to the Shares will generally be subject to taxation at a preferential rate if the
dividends are "qualified dividend income". Subject to certain exceptions for short-term positions, dividends paid on the Shares will be
treated as qualified dividend income if (i) the Shares are readily tradable on an established securities market in the United States or
Barclays PLC is eligible for the benefits of a comprehensive tax treaty with the United States that the US Treasury determines is
satisfactory for purposes of this provision and that includes an exchange of information program, and (ii) Barclays PLC was not a PFIC
(as defined below) in the year of the distribution or the immediately preceding taxable year. The ADRs are listed on the New York Stock
Exchange, and will qualify as readily tradable on an established securities market so long as they are so listed. In addition, the US
Treasury has determined that the Treaty meets the requirements for reduced rates of taxation, and Barclays PLC believes that it is
eligible for the benefits of the Treaty. Based on its audited financial statements and relevant market and shareholder data, Barclays PLC
believes that it was not treated as a PFIC for US federal income tax purposes with respect to its 2022 or 2023 taxable years. In addition,
based on its audited financial statements and current expectations regarding the value and nature of its assets, the sources and nature
of its income, and relevant market and shareholder data, Barclays PLC does not anticipate becoming a PFIC for its current taxable year
or in the foreseeable future.
Dividends paid by Barclays PLC to a US Holder with respect to the Shares will not be subject to UK withholding tax. For foreign tax credit
purposes, dividends will generally be income from sources outside the US and will generally be "passive" income for purposes of
computing the foreign tax credit allowable to a US Holder.
The amount of the dividend distribution includable in income will be the US Dollar value of the distribution, determined at the spot
Pound Sterling/US Dollar rate on the date the dividend distribution is includable in income, regardless of whether the payment is in fact
converted into US Dollars. Generally, any gain or loss resulting from currency exchange fluctuations during the period from the date the
dividend payment is includable in income to the date the payment is converted into US Dollars will be treated as ordinary income or loss
and, for foreign tax credit limitation purposes, from sources within the US, and will not be eligible for the special tax rates applicable to
qualified dividend income.
Distributions in excess of current or accumulated earnings and profits, as determined for US federal income tax purposes, will be
treated as a return of capital to the extent of the US Holder’s basis in the Shares and thereafter as capital gain. Because Barclays PLC
does not currently maintain calculations of earnings and profits for US federal income tax purposes, US Holders should expect that
distributions with respect to the Shares will generally be treated as dividends.
US Holders that receive a distribution of additional shares or rights to subscribe for additional shares as part of a pro rata distribution to
all our shareholders generally will not be subject to US federal income tax in respect of the distribution, unless the US Holder has the
right to receive cash or property, in which case the US Holder will be treated as if it received cash equal to the fair market value of the
distribution.
Taxable sale or other disposition of Shares
Subject to the PFIC rules discussed below, upon a sale or other taxable disposition of the Shares, US Holders generally will not be
subject to UK tax, but will realise gain or loss for US federal income tax purposes in an amount equal to the difference between the US
Dollar value of the amount realised on the disposition and the US Holder’s adjusted tax basis in the Shares, as determined in US Dollars.
Such gain or loss will be capital gain or loss, and will generally be long-term capital gain or loss if the Shares have been held for more than
one year. Long-term capital gain of a noncorporate US Holder is generally taxed at preferential rates. The gain or loss will generally be
income or loss from sources within the United States for foreign tax credit limitation purposes. The deductibility of capital losses is
subject to limitations.
Taxation of passive foreign investment companies (PFICs)
Based on its audited financial statements and relevant market and shareholder data, Barclays PLC believes that it was not treated as a
PFIC for US federal income tax purposes with respect to its 2022 or 2023 taxable years. In addition, based on its audited financial
statements and current expectations regarding the value and nature of its assets, the sources and nature of its income, and relevant
market and shareholder data, Barclays PLC does not anticipate becoming a PFIC for its current taxable year or in the foreseeable future.
This conclusion is a factual determination that is made annually and thus may be subject to change. In general, Barclays PLC will be a
PFIC with respect to a US Holder if, for any taxable year in which a US Holder holds the Shares, either (i) at least 75% of the gross income
of Barclays PLC for the taxable year is passive income, or (ii) at least 50% of the value, generally determined on the basis of a quarterly
average, of Barclays PLC’s assets is attributable to assets that produce or are held for the production of passive income (including
cash). With certain exceptions, a US Holder’s Shares will be treated as stock of a PFIC if Barclays PLC was a PFIC at any time during such
holder’s holding period in its Shares.
If Barclays PLC were to be treated as a PFIC with respect to a US Holder, unless such US Holder elected to be taxed annually on a mark-
to-market basis with respect to its Shares, gain and certain "excess distributions" would be treated as having been realised ratably over
a US Holder’s holding period for the Shares and generally would be taxed at the highest tax rate in effect for each such year to which the
gain was allocated, together with an interest charge in respect of the tax attributable to each such year.
UK stamp duty and stamp duty reserve tax
No obligation to pay UK stamp duty will arise on the transfer on sale of an ADS, provided that any instrument of transfer is not executed
in, and remains at all times outside, the UK. No UK stamp duty reserve tax is payable in respect of an agreement to transfer an ADS. For
the UK stamp duty and stamp duty reserve tax implications of dealings in Ordinary Shares, see the section ‘Taxation of UK holders – (iv)
Stamp duty and stamp duty reserve tax’ above.
| | | | | | | | |
| Climate and sustainability report | | | | | | Barclays PLC 2023 Annual Report on Form 20-F | |
|
| | | | | | | | |
Additional unaudited information |
UK estate and gift tax
Under the Estate and Gift Tax Convention, Shares held by an individual US holder who is US domiciled for the purposes of the Estate
and Gift Tax Convention and who is not for such purposes a UK national generally will not, provided any US federal estate or gift tax
chargeable has been paid, be subject to UK inheritance tax on the individual’s death or on a lifetime transfer of Shares, except in certain
cases where the Shares are comprised in a settlement (unless the settlor was US domiciled and not a UK national at the time of the
settlement), are part of the business property of a UK permanent establishment of an enterprise, or pertain to a UK fixed base of an
individual used for the performance of independent personal services. In cases where the Shares are subject to both UK inheritance tax
and US federal estate or gift tax, the Estate and Gift Tax Convention generally provides a credit against US federal tax liability for the
amount of any inheritance tax paid in the UK.
Foreign Financial Asset Reporting
Certain US Holders that own "specified foreign financial assets" with an aggregate value in excess of US$50,000 on the last day of the
taxable year or US$75,000 at any time during the taxable year are generally required to file an information statement along with their tax
returns, currently on Form 8938, with respect to such assets. "Specified foreign financial assets" include any financial accounts held at a
non-US financial institution, as well as securities issued by a non-US issuer that are not held in accounts maintained by financial
institutions. The understatement of income attributable to "specified foreign financial assets" in excess of US$5,000 extends the
statute of limitations with respect to the tax return to six years after the return was filed. US Holders who fail to report the required
information could be subject to substantial penalties. US Holders are encouraged to consult with their own tax advisors regarding the
possible application of these rules, including the application of the rules to their particular circumstances.
Backup Withholding and Information Reporting
Dividends paid on, and proceeds from the sale or other disposition of, the Shares to a US Holder generally may be subject to the
information reporting requirements of the IRC and may be subject to backup withholding unless the US Holder provides an accurate
taxpayer identification number and makes any other required certification or otherwise establishes an exemption. Backup withholding is
not an additional tax. The amount of any backup withholding from a payment to a US Holder will be allowed as a refund or credit against
the US Holder’s US federal income tax liability, provided the required information is furnished to the US Internal Revenue Service ("IRS")
in a timely manner.
A holder that is not a US Holder may be required to comply with certification and identification procedures in order to establish its
exemption from information reporting and backup withholding.
FATCA Risk Factor
In certain circumstances, payments on shares or ADSs may be subject to US withholding taxes on "passthru payments", starting on the
date that is two years after the date on which final regulations defining this concept are adopted in the United States. Under the
"Foreign Account Tax Compliance Act" (or "FATCA"), as well as intergovernmental agreements between the United States and other
countries and implementing laws in respect of the foregoing, certain US-source payments (including dividends and interest) and certain
payments made by, and financial accounts held with, entities that are classified as financial institutions under FATCA are subject to a
special information reporting and withholding tax regime. Regulations implementing withholding in respect of "passthru payments"
under FATCA have not yet been adopted or proposed. The United States has entered into an intergovernmental agreement regarding
the implementation of FATCA with the UK (the "UK IGA"). Under the UK IGA, as currently drafted, it is not expected that Barclays PLC
will be required to withhold tax under FATCA on payments made with respect to the shares or ADSs. However, significant aspects of
when and how FATCA will apply remain unclear, and no assurance can be given that withholding under FATCA will not become relevant
with respect to payments made on or with respect to the shares or ADSs in the future. Holders should consult their own tax advisers
regarding the potential impact of FATCA.
The Barclays Group has registered with the Internal Revenue Service ("IRS") for FATCA. The Global Intermediary Identification Number
(GIIN) for Barclays PLC in the United Kingdom is E1QAZN.00000.LE.826 and it is a Reporting Model 1 FFI. The GIINs for other parts of
the Barclays Group or Barclays branches outside of the UK may be obtained from your usual Barclays contact on request. The IRS list of
registered Foreign Financial Institutions is publicly available on the IRS website.
Exchange controls and other limitations affecting security holders
Other than certain economic sanctions which may be in force from time to time, there are currently no UK laws, decrees or regulations
which would affect the transfer of capital or remittance of dividends, interest and other payments to holders of Barclays securities who
are not residents of the UK. There are also no restrictions under the Articles of Association of Barclays PLC, or (subject to the effect of
any such economic sanctions) under current UK laws, which relate only to non-residents of the UK, and which limit the right of such
non-residents to hold Barclays securities or, when entitled to vote, to do so.
Documents on display
It is possible to read and copy documents that have been filed by Barclays PLC with the US Securities and Exchange Commission via
commercial document retrieval services, and from the website maintained by the US Securities and Exchange Commission at
www.sec.gov.
| | | | | | | | |
| Climate and sustainability report | | | | | | Barclays PLC 2023 Annual Report on Form 20-F | |
|
| | | | | | | | |
Additional unaudited information |
Fees and charges payable by a holder of ADSs
The ADR depositary collects fees for delivery and surrender of ADSs directly from investors depositing ordinary shares or surrendering
ADSs for the purpose of withdrawal or from intermediaries acting for them.
The charges of the ADR depositary payable by investors are as follows:
| | |
| | |
ADR depositary or substituting the underlying shares | Issuance of ADSs against the deposit of ordinary shares, including deposits and issuances in respect of: –Share distributions, stock splits, rights issues, mergers –Exchange of securities or other transactions or event or other distribution affecting the ADSs or deposited securities | $5.00 or less per 100 ADSs (or portion thereof) evidenced by the new ADSs delivered |
Receiving or distributing cash dividends | Distribution of cash dividends | |
Selling or exercising rights | Distribution or sale of securities, the fee being in an amount equal to the fee for the execution and delivery of ADSs which would have been charged as a result of the deposit of such securities | $5.00 or less per each 100 ADSs (or portion thereof) |
Withdrawing an underlying ordinary share | Acceptance of ADSs surrendered for withdrawal of deposited ordinary shares | $5.00 or less for each 100 ADSs (or portion thereof) |
General depositary services, particularly those charged on an annual basis | Other services performed by the ADR depositary in administering the ADS program | |
Expenses of the ADR depositary | Expenses incurred on behalf of Holders in connection with: –Expenses of the ADR depositary in connection with the conversion of foreign currency into US dollars (which are paid out of such foreign currency) –Taxes and other governmental charges –Cable, telex and facsimile transmission/delivery –Transfer or registration fees, if applicable, for the registration of transfers or underlying ordinary shares –Any other charge payable by ADR depositary or its agents | Expenses payable at the sole discretion of the ADR depositary by billing Holders or by deducting charges from one or more cash dividends or other cash distributions |
Note
1The fee in relation to the distribution of cash dividends was 0.0099087 per ADS in respect of dividends paid in the year ended 31 December 2023.
Fees and payments made by the ADR depositary to Barclays
The ADR depositary has agreed to provide Barclays with an amount based on any cash dividend, issuance and cancellations fees
charged during each twelve-month period for expenses incurred by Barclays in connection with the ADS program. Barclays is entitled to
$1,574,383.48 for the year ended 31 December 2023, though such amount has not yet been paid to Barclays by the ADR depositary.
Under certain circumstances, including non-routine corporate actions, removal of the ADR depositary or termination of the ADS
program by Barclays, Barclays may be charged by the ADR depositary certain fees (including in connection with depositary services,
certain expenses paid on behalf of Barclays, an administrative fee, fees for non-routine services and corporate actions and any other
reasonable fees/expenses incurred by the ADR depositary).
| | | | | | | | |
| Climate and sustainability report | | | | | | Barclays PLC 2023 Annual Report on Form 20-F | |
|
| | | | | | | | |
Additional unaudited information |
NYSE Corporate Governance Statement
As our main listing is on the London Stock Exchange, we follow the UK Corporate Governance Code. However, as Barclays also has
American Depositary Receipts listed on the New York Stock Exchange (NYSE), we are also subject to the NYSE’s Corporate
Governance Rules (NYSE Rules). We are exempt from most of the NYSE Rules, which US domestic companies must follow, because we
are a non-US company listed on the NYSE. However, we are required to provide annual and interim written affirmations to the NYSE of
our compliance with the applicable NYSE Rules and must also disclose any significant differences between our corporate governance
practices and those followed by domestic US companies listed on the NYSE. Key differences between the Code and NYSE Rules are set
out here:
Director Independence
NYSE Rules require the majority of the Board to be independent. The Code requires at least half of the Board (excluding the Chairman)
to be independent. The NYSE Rules contain different tests from the Code for determining whether a Director is independent. We follow
the Code’s recommendations as well as developing best practices among other UK public companies. The independence of our non-
executive Directors is reviewed by the Board on an annual basis and it takes into account the guidance in the Code and the criteria we
have established for determining independence, which are described in the Directors’ Report.
Board Committees
We have a Board Nominations Committee and a Board Remuneration Committee, both of which are broadly similar in purpose and
constitution to the Committees required by the NYSE Rules and whose terms of reference comply with the Code’s requirements. The
NYSE Rules state that both Committees must be composed entirely of independent Directors. As the Group Chairman was
independent on appointment, the Code permits him to chair the Board Nominations Committee. Except for this appointment, both
Committees are composed solely of non-executive Directors, whom the Board has determined to be independent. We comply with the
NYSE Rules requirement that we have a Board Audit Committee comprised solely of independent non-executive Directors as defined in
Rule 10A-3 of the Exchange Act. However, we follow the Code recommendations, rather than the NYSE Rules, regarding the
responsibilities of the Board Audit Committee (except for applicable mandatory responsibilities under the Sarbanes-Oxley Act),
although both are broadly comparable. Although the NYSE Rules state that the Board Audit Committee is to take responsibility for risk
oversight, Barclays has an additional Board Committee which addresses different areas of risk management. To enhance Board
governance of risk, Barclays has the Board Risk Committee. A full description of the Board Risk Committee can be found in the
Directors’ Report.
Corporate Governance Guidelines
The NYSE Rules require domestic US companies to adopt and disclose corporate governance guidelines. There is no equivalent
recommendation in the Code but the Board Nominations Committee has developed corporate governance guidelines, ‘Corporate
Governance in Barclays’, which have been approved and adopted by the Board.
Code of Ethics
The NYSE Rules require that domestic US companies adopt and disclose a code of business conduct and ethics for Directors, officers
and employees. The Barclays Way was introduced in 2013, this is a Code of Conduct which outlines the Values and Behaviours which
govern our way of working across our business globally. The Barclays Way has been adopted on a Group-wide basis by all Directors,
Officers and employees. The Barclays Way is available to view on the Barclays website at https://home.barclays/content/dam/home-
barclays/documents/citizenship/the-way-we-do-business/The_Barclays_Way.pdf
Shareholder Approval of Equity-compensation Plans
The NYSE listing standards require that shareholders must be given the opportunity to vote on all equity-compensation plans and
material revisions to those plans. We comply with UK requirements, which are similar to the NYSE standards. However, the Board does
not explicitly take into consideration the NYSE’s detailed definition of what are considered ‘material revisions’.
| | | | | | | | |
| Climate and sustainability report | | | | | | Barclays PLC 2023 Annual Report on Form 20-F | |
|
| | | | | | | | |
Additional unaudited information |
Major shareholders
Major shareholders do not have different voting rights from those of other shareholders. Information provided to the Company by
substantial shareholders pursuant to the FCA’s Disclosure Guidance and Transparency Rules are published via a Regulatory Information
Service and is available on the Company’s website.
Refer to the Directors’ report, Other statutory information section for a breakdown of major shareholders as at 31 December 2023.
Comparatives for 2022 and 2021 are presented below.
As at 31 December 2022, the Company had been notified under Rule 5 of the Disclosure and Transparency Rules of the UKLA of the
following holdings of voting rights in its shares:
| | |
| | |
| Number of Barclays Shares | % of total voting rights attaching to issued share capital1 |
| | |
| | |
Notes
1The percentage of voting rights detailed above was calculated at the time of the relevant disclosures made in accordance with Rule 5 of the DTRs.
2Total shown includes 6,687,206 contracts for difference to which voting rights are attached. Part of the holding is held as American Depositary Receipts. On 7 February 2023, BlackRock,
Inc. disclosed by way of a Schedule 13G filed with the SEC beneficial ownership of 1,383,730,106 ordinary shares of the Company as at 31 December 2022, representing 8.7% of that
class of shares.
3Qatar Holding LLC is wholly owned by Qatar Investment Authority. On 16 January 2023, Qatar Investment Authority disclosed by way of a Schedule 13G filed with the SEC beneficial
ownership of 800,120,690 ordinary shares of the Company as at 31 December 2022, representing 5.04% of that class of shares.
As at 31 December 2021, the Company had been notified under Rule 5 of the Disclosure and Transparency Rules of the UKLA of the
following holdings of voting rights in its shares:
| | |
| | |
| Number of Barclays shares | % of total voting rights attached to issued share capital1 |
| | |
| | |
Notes
1The percentage of voting rights detailed above was calculated at the time of the relevant disclosures made in accordance with Rule 5 of the DTRs.
2Total shown includes 6,687,206 contracts for difference to which voting rights are attached. Part of the holding is held as American Depositary Receipts. On 8 February 2022,
BlackRock, Inc. disclosed by way of a Schedule 13G filed with the SEC beneficial ownership of 1,401,752,691 ordinary shares of the Company as at 31 December 2021, representing
8.4% of that class of shares.
3Qatar Holding LLC is wholly owned by Qatar Investment Authority. On 2 February 2022, Qatar Investment Authority disclosed by way of a Schedule 13G filed with the SEC beneficial
ownership of 847,620,690 ordinary shares of the Company as at 31 December 2021, representing 5.06% of that class of shares.
Disclosure controls and procedures
The Chief Executive, C.S. Venkatakrishnan, and the Group Finance Director, Anna Cross, conducted with Group Management an
evaluation of the effectiveness of the design and operation of the Group’s disclosure controls and procedures of Barclays PLC as at 31
December 2023, which are defined as those controls and procedures designed to ensure that information required to be disclosed in
reports filed or submitted under the US Securities Exchange Act of 1934 is recorded, processed, summarised and reported within the
time periods specified in the US Securities and Exchange Commission’s rules and forms. As of the date of the evaluation, the Chief
Executive and Group Finance Director concluded that the design and operation of these disclosure controls and procedures were
effective.
| | | | | | | | |
| Climate and sustainability report | | | | | | Barclays PLC 2023 Annual Report on Form 20-F | |
|
| | | | | | | | |
Additional unaudited information |
Board of Directors
See the Directors’ report for biographies.
| | |
Group Executive Committee | | |
| | Date of Appointment as Officer |
| | |
| | |
| Global Head of the Corporate & Investment Bank and President of Barclays Bank PLC (BBPLC) | |
| Group Chief Operating Officer, Chief Executive Officer, BX | |
| Group Chief Compliance Officer | |
| | |
| Global Head of Consumer Banking and Payments | |
| | |
| | |
| Group General Counsel and Company Secretary | |
| Group Head of Public Policy and Corporate Responsibility | |
C.S. Venkatakrishnan, Group Chief Executive, Executive Director
See the Directors’ report for biography.
Anna Cross, Group Finance Director, Executive Director
See the Directors’ report for biography.
Paul Compton, Global Head of the Corporate & Investment Bank and President of Barclays Bank PLC
Paul Compton is Global Head of Corporate & Investment Bank, and President of Barclays Bank PLC (BBPLC), and a member of the
Group Executive Committee of Barclays, based in New York. Paul leads the provision of funding, financing, strategic and risk
management for money managers, financial institutions, governments, supranational organisations and corporate clients, and is
responsible for overseeing the Corporate and Investment Bank, which comprises our global Banking, Markets and Corporate Banking
businesses. Prior to his appointment as Global Head of Corporate and Investment Bank & President of Barclays Bank PLC in November
2021, Paul served as Global Head of Investment Banking and Co-President of BBPLC and previously as Barclays Group Chief Operating
Officer, and as Chief Executive Officer of Barclays Execution Services (BX), delivering operations and technology services to Barclays
businesses globally. Before joining Barclays in 2016, Paul served for nearly two decades in a variety of senior roles at JPMorgan Chase,
including Group Chief Administrative Officer, and Chief Financial Officer and Chief Administrative Officer of the Investment Bank.
Prior to JPMorgan, Paul spent 10 years as a Principal at Ernst & Young in the Brisbane, Australia and New York offices.
Alistair Currie, Group Chief Operating Officer and Chief Executive of Barclays Execution Services (BX)
As Group Chief Operating Officer Alistair is responsible for leading an organisation of 60,000 colleagues in delivering excellent customer
outcomes by providing world-class operations and technology services. Alistair joined Barclays in August 2017 as Chief Operating
Officer & Head of Product for Corporate Banking. In October 2017 he became Co-Head of Corporate Banking and in September 2018
was appointed Head of Corporate Banking. In November 2021 Alistair was appointed Global Head of Consumer Banking and Payments
(CB&P). In this role he led the ongoing transformation of the CB&P business as they become more digitally focussed, efficient and
returns driven, whilst delivering excellent customer service. Prior to joining Barclays, Alistair was at the ANZ Banking Group in Australia
where he most recently held the role of Group Chief Operating Officer, responsible for technology, shared services, operations and
property, and played a key role in the ANZ’s digital transformation. Before taking up this role in 2011, he had previously joined ANZ in
2008 as Managing Director, Transaction Banking. Before ANZ, Alistair spent 18 years at HSBC in a variety of international banking roles
in the UK, Middle East and Asia including President and CEO of HSBC, Taiwan, between 2007 and 2008. As Regional Head of Trade
Services, HSBC Asia Office in Hong Kong from 2004 to 2007, Alistair further developed HSBC’s market-leading trade finance position in
the region and from 2001 to 2004, he was COO, Wells Fargo HSBC Trade Bank NA, San Francisco. With more than 30 years as a banking
professional, Alistair has a wealth of experience in institutional, large corporate, mid-corporate and consumer client segments as well as
transaction banking, trade finance, cash management and technology, and a track record in delivering business transformation and high
quality customer outcomes.
Kirsty Everett, Group Chief Compliance Officer
Kirsty joined Barclays in July 2023 as the Group Chief Compliance Officer and a member of the Group Executive Committee,
responsible for the oversight of Compliance and Reputation Risk and providing strategic and functional leadership to the Compliance
function. Before joining Barclays, Kirsty was at HSBC for four years with her final appointment being the Group Head of Compliance.
During her time at HSBC, Kirsty held several senior Compliance roles including Compliance Chief Operating Officer and Compliance
Chief of Staff. She has extensive in-house experience across the Compliance landscape, including seven years at UBS in a range of
roles, latterly as the designated Chief Compliance Officer. Kirsty began her career at Arthur Andersen and Deloitte, where she qualified
as a Chartered Accountant and progressed through audit into advisory projects, with a focus on financial crime, regulatory
investigations, and compliance and risk transformation programmes.
Matt Hammerstein, CEO, Barclays UK
Matt Hammerstein is the CEO for Barclays Bank UK, covering Retail Banking, Investments and Wealth UK, Business Banking and
Barclaycard UK. Prior to becoming CEO, Matt was Head of Retail Lending covering both the secured and unsecured lending businesses.
Matt joined Barclays in 2004 as Director of Group Strategy, later progressing to become the Group Chief of Staff; a key strategic role in
which he provided vital support to the Group CEO during the financial crisis. Matt went on to manage Barclays Group Corporate
| | | | | | | | |
| Climate and sustainability report | | | | | | Barclays PLC 2023 Annual Report on Form 20-F | |
|
| | | | | | | | |
Additional unaudited information |
Strategy and Corporate Relations, Barclays Customer and Client Experience in Retail and Business Banking and Barclays UK Retail
Products and Segments. Before Joining Barclays, Matt was a Senior Management Consultant at Marakon Associates where he worked
for 12 years in the financial services, consumer products and energy sectors within the Americas and Europe. Matt is also a member of
the BBUK Board, UK Finance Board, Charities Aid Foundation America Board and sits on the Money and Pensions Service Adult Advisory
Group. Matt is also Chair of the FCA Practitioner Panel and active ambassador in Barclays for inclusion, wellbeing and anything that
makes the workplace more fun.
Vim Maru, Global Head of Consumer Banking and Payments
Vim Maru is Global Head of Consumer Banking and Payments, leading the transformation and growth agenda for a business portfolio
which includes UK Corporate Banking and Transaction Banking, and Consumer Cards and Payments (comprised of the US Consumer
Bank, Barclaycard Payments, Private Bank and Consumer Bank Europe). Vim joined Barclays on 1 February 2023 and has worked in
financial services for over 20 years. Prior to joining Barclays, he spent 11 years at Lloyds Banking Group, latterly as the Group Director
for Retail and 12 years at Santander UK in a range of roles. Vim is a Chartered Accountant, and has previously served on the FCA’s
Practitioner Panel, HM Treasury’s Financial Inclusion Policy Forum and the Money and Pensions Service Advisory Group.
Tristram Roberts, Group HR Director
Tristram is the Group Human Resources Director and a member of the Group Executive Committee. Tristram joined Barclays in July
2013 as HR Director for the Investment Bank. His remit was expanded in May 2014 to include HR responsibilities for Barclays Non-Core,
and he became the Group HR Director in December 2015. Prior to Barclays, Tristram was Head of Human Resources for Global
Functions and Operations & Technology at HSBC, as well as Group Head of Performance and Reward. Previously, he was Group Reward
and Policy Director for Vodafone Group plc. Tristram began his career in consulting. He became a partner with Arthur Andersen in 2001
and was subsequently a partner with both Deloitte and KPMG.
Taalib Shaah, Group Chief Risk Officer
Taalib Shaah is Group Chief Risk Officer for Barclays, based in London. He is responsible for helping to define, set and manage the risk
profile of the bank and leads the risk management organisation across the group. He is a member of the Group Executive Committee.
Taalib joined Barclays in late 2014 as Chief Risk Officer for the Investment Bank and in 2017 assumed the role of Chief Risk Officer for
Barclays International (BBPLC), responsible for the Corporate and Investment Bank, the Private Bank and the Cards & Payments
business. He assumed his current role in October 2020. Prior to Barclays, Taalib spent four years at Citigroup where he was most
recently Chief Risk Officer for Market Risk, Real Estate Credit, Treasury, Private Equity and Head of Model Validation. Previously, Taalib
spent 17 years at Credit Suisse, working in various areas, including risk and the front office. He began his career at Ernst and Young.
Stephen Shapiro, Group General Counsel
Stephen is an experienced lawyer and company secretary with a deep understanding of legal, corporate governance and regulatory
matters. Holding the combined role of Group General Counsel, he oversees Barclays’ global Legal function. Stephen is also a member
of the Group Executive Committee (ExCo). Stephen previously served as the Group Company Secretary and Deputy General Counsel
of SABMiller plc. Prior to this, he practised law as a partner in a law firm in South Africa, and subsequently in corporate law and M&A at
Hogan Lovells in the UK. He was appointed as Group Company Secretary of Barclays in November 2017 and was subsequently
appointed Group General Counsel in August 2020, Stephen is an active industry contributor and serves as a member of the GC100
Executive Committee, the association of General Counsel and Company Secretaries working in FTSE 100 companies, and as its Vice
Chair.
Sasha Wiggins, Group Head of Public Policy and Corporate Responsibility
Sasha Wiggins is the Group Head of Public Policy and Corporate Responsibility at Barclays, based in London. She is a member of the
Group Executive Committee. Sasha leads a multi-disciplined team who support the delivery of the bank’s strategy and are focused on
helping Barclays act responsibly for the common good and the long term. She is responsible for the Public Policy agenda, working
closely with governments, regulators, the media and key policymakers to deliver for Barclays customers, clients and stakeholders.
Sasha is also accountable for the overall Sustainability agenda, including the bank’s commitment to aligning all its financing to the goals
of the Paris Agreement, on the way to achieving the ambition to be a net zero bank by 2050. Sasha joined Barclays in 2002, progressing
through a number of roles in the Private Bank. In 2015 she was appointed CEO of Barclays Bank Ireland and subsequently became
Group Chief of Staff in 2018. She assumed her current role in May 2020. Sasha is a Fellow of the Chartered Institute of Securities &
Investment. She is also Vice Chair of the Royal Marsden's Cancer Charity Corporate Partnerships Board and trustee on the Board of
Grief Encounter, a national charity supporting bereaved children and young people.
| | | | | | | | |
| Climate and sustainability report | | | | | | Barclays PLC 2023 Annual Report on Form 20-F | |
|
| | | | | | | | |
Additional unaudited information |
Service contracts and letters of appointment
Each Executive Director has a service contract, whereas the Chairman and Non-Executive Directors each have a letter of appointment.
Copies of the service contracts and letters of appointment are available for inspection at the Company’s registered office. The
effective dates of the current Directors’ appointments disclosed in their service contracts or letters of appointment are shown in the
table below.
As stated in the letters of appointment, the Chairman and Non-Executive Directors are appointed for an initial term of three years and
are subject to annual re-election by shareholders. On expiry of the initial term and subject to the needs of the Board, Non-Executive
Directors may be invited to serve a further three years. Non-Executive Directors appointed beyond six years will be at the discretion of
the Board Nominations Committee.
The effective dates of appointment of those Directors that stepped down from the Board in 2023 are also shown.
| |
| Effective date of appointment |
| |
| 1 March 2019 (as a Non-Executive Director) 2 May 2019 (as Chairman) |
| |
| |
| |
| |
| |
| |
| |
| |
| |
| |
| |
| |
| |
| |
Former Non-Executive Directors | |
| |
| |
Notes
1Mike Ashley stepped down from the Board with effect from 3 May 2023.
2Crawford Gillies stepped down from the Board with effect from 31 May 2023.
| | | | | | | | |
| Climate and sustainability report | | | | | | Barclays PLC 2023 Annual Report on Form 20-F | |
|
| | | | | | | | |
Additional unaudited information |
Executive Directors’ policy on payment for loss of office (including following a takeover)
The Committee’s approach to payments in the event of termination is to take account of the individual circumstances including the
reason for termination, individual performance, contractual obligations and the terms of the deferred bonus plans and LTIPs in which
the Executive Director participates.
| | | | |
| | | | |
| | Notice period in Executive Directors' service contracts | | Notice from the Company and from the Executive Director will normally be 6 months. Executive Directors may be required to work during the notice period or may be placed on garden leave or, if not required to work the full notice period, may be provided with pay in lieu of notice. For C.S. Venkatakrishnan, the contractual notice period is 12 months’ notice from the Company and six months’ notice from the Executive Director, as his existing notice period prior to his appointment to the Board was honoured when he was promoted to the Board. For Anna Cross, the contractual notice period is six months’ notice from the Company and six months’ notice from the Executive Director (she did not have any pre-existing contractual commitment to a longer period). |
| | Pay during notice period or payment in lieu of notice per service contracts | | Fixed Pay delivered in cash and pension allowance will continue to be paid monthly, and other contractual benefits provided, through the notice period. Fixed Pay delivered in shares will also continue to be delivered quarterly for the notice period and the final quarterly award will be pro-rated for the number of days from the start of the relevant quarter to the termination date. Where Barclays elects to terminate employment with immediate effect by making a payment in lieu of notice, the Executive Director will receive Fixed Pay delivered in cash as a lump sum or in instalments but will not receive any Fixed Pay shares that would otherwise have been payable during the period for which the payment in lieu is made (unless required otherwise by regulations or local law). Any payments whether in instalments or as a lump sum may be subject to mitigation as relevant. In the event of termination for gross misconduct neither notice nor payment in lieu of notice is given. |
| | Eligibility for annual bonus and LTIP awards | | There is no automatic entitlement to be granted a bonus or LTIP award for the year of termination, but eligibility for either or both may be considered at the Committee’s discretion, pro-rated for service, and subject to performance measures being met. No annual bonus or LTIP award would be granted in the case of gross misconduct or resignation. |
| | Treatment of unvested deferred bonus and LTIP awards | | The treatment of unvested deferred bonus or LTIP awards will be in accordance with the relevant plan rules. Unvested deferred bonus and LTIP awards normally lapse if the Executive Director leaves by reason of resignation prior to fifth anniversary of the date of grant, is terminated for gross misconduct or cause, or is otherwise not an ‘eligible leaver’. ‘Eligible leaver’ is defined as leaving due to injury, disability or ill health, retirement, redundancy, the business or company which employs the Executive Director ceasing to be part of the Group, or otherwise at the discretion of the Committee. The Committee will normally apply its discretion to apply eligible leaver status in the event of resignation after the fifth anniversary of grant, or in the case of deferred bonuses if it is the employer that terminates employment (other than in circumstances that amount to gross misconduct or dismissal for cause). Where ‘eligible leaver’ treatment applies, deferred bonus and LTIP awards will normally continue to vest, on the scheduled vesting dates and subject to the rules of the relevant plan, unless the Committee determines otherwise in exceptional circumstances. On death, deferred bonus and LTIP awards are accelerated and deferred bonus awards are released in full. In an ‘eligible leaver’ situation and in the case of death, LTIP awards are pro-rated for time (over the whole performance period, including the assessment period prior to grant) and with the proportion that vests remaining subject to performance against the performance conditions, subject to the Committee’s discretion to determine otherwise, in accordance with the plan rules, as amended from time to time. After release, the shares are subject to an additional holding period to the extent required by regulations (currently a minimum 12 month holding period applies). Unvested awards that continue beyond termination remain subject to malus provisions, which enable the Committee to reduce the vesting level of deferred bonuses and LTIP awards (including to nil), and after vesting awards remain subject to clawback provisions (as described in the main policy). In the event of a takeover or other major corporate event, the Committee has absolute discretion to determine whether all outstanding awards would vest early (subject to achievement of any performance conditions for the LTIP and applicable regulation) or whether they should continue in the same or revised form following the change of control. The Committee may also determine that participants may exchange existing awards for awards over shares in an acquiring company with the agreement of that company. In the event of an internal reorganisation, the Committee may determine that outstanding awards will be exchanged for equivalent awards in another company. |
| | | | | | | | |
| Climate and sustainability report | | | | | | Barclays PLC 2023 Annual Report on Form 20-F | |
|
| | | | | | | | |
Additional unaudited information |
| | | | |
| | | | |
| | | | Except in the case of gross misconduct or resignation, where an Executive Director has been relocated at the commencement of or during their employment, the Company may pay for the Executive Director’s repatriation costs in line with Barclays’ general employee mobility policy including temporary accommodation, payment of removal costs and relocation flights for the Executive Director, spouse and children. The Company will pay the Executive Director’s tax on the relocation costs but will not tax equalise and will also not pay tax on his or her other income relating to the termination of employment. |
| | | | Except in the case of gross misconduct or resignation, the Company may pay for the Executive Director’s legal fees and tax advice relating to the termination of employment and provide outplacement services and any other reasonable costs. The Company may pay the Executive Director’s tax on these particular costs. |
| | | | | | | | |
| Climate and sustainability report | | | | | | Barclays PLC 2023 Annual Report on Form 20-F | |
|
| | | | | | | | |
Additional unaudited information |
Remuneration policy – Non-Executive Directors
| | | | | |
| | | | | |
| | Fees Reflect individual responsibilities and membership of Board Committees and are set to attract Non-Executive Directors who have relevant skills and experience to oversee the implementation of our strategy Fees are set at a level which reflects the role, responsibilities and time commitment which are expected from the Chair and Non-Executive Directors | | The Chair is paid an all-inclusive fee for all Board responsibilities. The Chair has a time commitment equivalent of up to 80% of a full-time role. The other Non- Executive Directors receive a basic Board fee, with additional fees payable where individuals take on additional roles or responsibilities, including, but not limited to, serving as a member or Chair of a Committee of the Board or as a Senior Independent Director. Fees are periodically reviewed by the Board. Non-Executive Directors may also receive fees where they serve as directors of subsidiary companies of Barclays PLC. In the case of certain subsidiary appointments, such additional remuneration is approved by the Barclays PLC Board Remuneration Committee. No variable pay is provided, enabling the Chair and Non- Executive Directors to maintain appropriate independence, focus on long-term decision-making and constructively review and challenge the performance of the Executive Directors. | Fees are reviewed against those for Non- Executive Directors in banks and other companies of similar size and complexity. Other than in exceptional circumstances, fees will not increase by more than 20% above the current fee levels during this policy period. Additional fees may be paid for new Committees of the Board and / or where a Non-Executive Director takes on additional responsibilities and / or performs an additional role, provided these are not greater than fees payable for the existing roles on the Committees of the Board as detailed in the Annual report on Directors' remuneration. Any increases to such additional fees over the period of the policy will be made in accordance with the principles set out above for current fees. |
| | Benefits To provide a competitive and cost effective benefits package appropriate to the role and location | | The Chair is provided with private medical cover subject to the terms of the Barclays’ scheme rules from time to time, and is provided with the use of a Company vehicle and driver when required for business purposes (including settlement of any tax liabilities that may arise from this benefit). Benefits which are minor in nature and in any event do not exceed a cost of £500 may be provided to Non-Executive Directors. Non-Executive Directors are not eligible to join Barclays’ pension plans. |
| |
| | | | The Chair and Non-Executive Directors are reimbursed for any reasonable and appropriate expenses incurred for business reasons. Any tax that arises on these reimbursed expenses is paid by Barclays. |
| | | | The Chair may be invited to participate in Sharesave, an HMRC employee tax advantaged share scheme, due to the level of their time commitment to the role. The Chair is not eligible to participate in any other Barclays’ cash, share or long-term incentive plans. All other Non-Executive Directors are not eligible to participate in Barclays’ cash, share or long-term incentive plans. |
| | Shareholding requirements | | An element of the basic fee before deduction of tax and other statutory deductions, equal to £100,000 for the Chair and £30,000 for each Non-Executive Director, is used to purchase Barclays’ shares which are retained on the Non-Executive Director’s behalf until they retire from the Board. |
| | Notice and termination provisions | | Instead of service contracts, the Chair and the Non-Executive Directors each have a letter of appointment that reflect their responsibilities and time commitments. Non-Executive Directors are entitled to notice under their letters of appointment but, other than in respect of the Chair, no compensation is due in the event of termination, other than standard payments for the period served up to the termination date. Each Director’s appointment is for an initial three-year term, renewable at Barclays’ discretion for a further term of three years thereafter and subject to annual re-election by shareholders. Non- Executive Directors appointed beyond six years will be at the discretion of the Board Nominations Committee. Notice period Chair: Six months from the Company, six months from the Chair. Termination payment policy The Chair’s appointment may be terminated by Barclays on six months’ notice or immediately in which case six months’ fees are payable in instalments at the times they would have been received had the appointment continued, but subject to mitigation if they were to obtain alternative employment. No continuing payments of fees (or benefits) are due if a Non-Executive Director is not re-elected by shareholders at the Barclays PLC AGM. |
In accordance with the policy table above, any new Chair would be paid an all-inclusive fee only and any new Non-Executive Director
would be paid a basic fee for their appointment as a Non-Executive Director, plus fees for their participation on and/or
chairing of any Board committees and for taking on additional responsibilities and/ or performing an additional role, time apportioned in
the first year as necessary. No sign-on payments are offered to Non-Executive Directors.
| | | | | | | | |
| Climate and sustainability report | | | | | | Barclays PLC 2023 Annual Report on Form 20-F | |
|
| | | | | | | | |
Additional unaudited information |
Interests in Barclays PLC shares – additional information
The shares owned beneficially by each person who served as a Director during 2023 (including any shares owned beneficially by their
connected persons) are Barclays PLC ordinary shares of 25p and such shares carry no additional or different voting rights to those of
other holders of Barclays PLC ordinary shares of 25p.The rights attaching to the Barclays PLC shares are set out on page 115 of the
Barclays PLC 2023 Annual Report on Form 20-F. Each current Director’s individual shareholding constitutes less than 1% of the issued
share capital of Barclays PLC as at both 31 December 2023 and 16 February 2024, being the latest practicable date for inclusion in this
report.
The Executive Directors and Non-Executive Directors of Barclays PLC do not currently participate in any share option plans operated
by Barclays.
| | | | | | | | |
| Climate and sustainability report | | | | | | Barclays PLC 2023 Annual Report on Form 20-F | |
|
| | | | | | | | |
Additional unaudited information |
Repurchase of shares
| | | | | | |
| | | Average Price Paid Per Share (pence) | Total Number of Shares Purchased as Part of Publicly Announced Plans or Programs | Maximum Number (or Approximate GBP Value) of Shares that May Yet be Purchased Under the Plans or Programs | Announcement in the month |
| | | | | | |
| | | | | | |
| | | | | | |
| | | | | | |
| | | | | | |
| | | | | | |
| | | | | | |
| | | | | | |
| | | | | | |
| | | | | | |
| | | | | | |
| | | | | | |
| | | | | | | | |
| Climate and sustainability report | | | | | | Barclays PLC 2023 Annual Report on Form 20-F | |
|
| | | | | | | | |
Additional unaudited information |
Number of employees split by grade
Senior - Managing Director and Director
Middle - Assistant Vice President and Vice President
Junior - Business Analyst grades
Number of employees split by region (full time equivalent)
| | | | | | | | |
| Climate and sustainability report | | | | | | Barclays PLC 2023 Annual Report on Form 20-F | |
|
| | | | | | | | |
Additional unaudited information |
Section 13(r) to the U.S. Securities Exchange Act of 1934 (Iran sanctions and related disclosure)
Section 13(r) of the U.S. Securities Exchange Act of 1934 as amended (the “Exchange Act”) requires each SEC reporting issuer to
disclose in its annual and, if applicable, quarterly reports whether it or any of its affiliates have knowingly engaged in certain activities,
transactions or dealings relating to Iran or with the Government of Iran or certain designated natural persons or entities involved in
terrorism or the proliferation of weapons of mass destruction during the period covered by the report. The requirement includes
disclosure of activities not prohibited by U.S. or other law, even if conducted outside the U.S. by non-U.S. companies or affiliates in
compliance with local law. Pursuant to Section 13(r) of the Exchange Act, we note the following in relation to activity that occurred in
2023, the reporting period covered by this annual report. For completeness, we also include activity that we became aware of in 2023,
even if such activity occurred prior to the reporting period. Except as noted below, Barclays intends to continue the activities described.
Barclays does not allocate profits at the level of these activities, which in any event would not be significant, and we therefore report
only gross revenue where measurable. Barclays attributed revenue of approximately GBP 350,970 in relation to the activities disclosed
below.
Legacy Guarantees
Between 1992 and 2006, Barclays entered into several guarantees for the benefit of Iranian banks in connection with the supply of
goods and services by Barclays customers to Iranian buyers (the “Iranian guarantees”). These were counter guarantees issued to Iranian
banks to support guarantees issued by these banks to the Iranian buyers. The Iranian banks and a number of the Iranian buyers were
either subsequently designated as Specially Designated Nationals and Blocked Persons (“SDNs”) by the U.S. Department of the
Treasury’s Office of Foreign Assets Control (“OFAC”), or are owned by the Government of Iran. In addition, between 1993 and 2005,
Barclays entered into similar guarantees for the benefit of a Syrian bank that was subsequently designated pursuant to the Weapons of
Mass Destruction Proliferators Sanctions Regulations (“WMDPSR”) in August 2011 (the “WMDPSR guarantees”).
These guarantees were issued either on:
a.an “extend or pay” basis, which means that, although the guarantee is of limited duration on its face, until there is full performance
under the contract to provide goods and services, the terms of the guarantee require Barclays to maintain the guarantee or pay the
beneficiary bank the full amount of the guarantee; or
b.the basis that Barclays’ obligations can be discharged only with the consent of the beneficiary counterparty.
Barclays is not able to exit its obligations under the above guarantees unilaterally, and thus it maintains a limited legacy portfolio of these
guarantees, which complied with applicable laws and regulations at the time they were entered into. Barclays intends to terminate the
guarantees where an agreement can be reached with the counterparty, in accordance with applicable laws and regulations. Barclays
attributed no revenue in 2023 in relation to the Iranian guarantees and revenue of approximately GBP 20,700 in 2023 in relation to the
WMDPSR guarantees.
Lease Payments
Barclays is party to a long-term lease, entered in 1979, with the National Iranian Oil Company (“NIOC”), pursuant to which Barclays rents
part of NIOC House in London. The lease is for 60 years, contains no early termination clause, and has 16 years remaining. Barclays
makes lease payments in GBP to the bank account of a solicitor that represents an entity owned by the Government of Iran. The
payments are made in accordance with applicable laws and regulations. Barclays attributed no revenue in 2023 in relation to this activity.
Local Clearing Systems
Banks based in the United Arab Emirates (“UAE”), including certain Iranian banks designated pursuant to the Global Terrorism Sanctions
Regulations (“GTSR”) and/or Government of Iran-owned banks, participate in the various banking payment and settlement systems
used in the UAE (the “UAE Clearing Systems”). Barclays, by virtue of its banking activities in the UAE, participates in the UAE Clearing
Systems, in accordance with applicable laws and regulations. To mitigate the risk of engaging in transactions in which participant Iranian
SDN and/or Government of Iran-owned banks may be involved, Barclays has implemented restrictions relating to its involvement in the
UAE Clearing Systems. Barclays attributed no revenue in 2023 in relation to this activity.
Other Activity
Barclays maintains several customer relationships with UK-incorporated medical manufacturing companies. In 2023, Barclays
processed several payments, for the benefit of our customers, relating to the export of medical devices to privately-owned entities in
Iran and Turkey. The end users of these medical devices include hospitals, medical universities, or clinics that may be owned or
controlled by, or affiliated with, the Government of Iran. The payments were made in accordance with applicable laws and regulations,
and all payments were received from the privately-owned entities in Iran and Turkey, or their affiliates; no payments were received
directly from any SDN or entity owned or controlled by, or affiliated with, the Government of Iran. Although OFAC has issued general
licenses relating to the sale of medical devices to Iran, including the Government of Iran, these licenses do not apply to sales of non-U.S.
origin items by non-U.S. persons. Barclays attributed revenue of approximately GBP 35 in 2023 in relation to this activity.
Barclays maintains a customer relationship with a UK-incorporated charity that works in the areas of blood cancer and stem cell
transplantation. In 2023, Barclays processed one payment, on behalf of our customer, where the ultimate beneficiary of the payment
was a medical organization affiliated with the Government of Iran. The payment was for the procurement of a blood sample from an
individual in Iran who is a potential donor. The payment was processed in accordance with applicable laws and regulations. Barclays
attributed revenue of approximately GBP 10 in 2023 in relation to this activity.
In 2023, Barclays acted as a correspondent bank in one-off payments involving certain banks that were designated pursuant to
Executive Orders 13224 and 13902. The payments relate to humanitarian activities and were made at the request of and with specific
authorization from the U.S. Federal Government. The payments did not involve U.S. dollars or the clearing services of U.S. banks and
| | | | | | | | |
| Climate and sustainability report | | | | | | Barclays PLC 2023 Annual Report on Form 20-F | |
|
| | | | | | | | |
Additional unaudited information |
were processed in accordance with applicable laws and regulations. When the payments passed through the correspondent bank,
Barclays received interest of approximately GBP 330,000 from a G20 central bank.
Barclays maintains a customer relationship with a UK-incorporated law firm. In 2023, Barclays processed one payment, on behalf of our
customer, where the remitter of the payment was a law firm in Germany. The German law firm was representing an Iranian SDN airline,
ultimately owned by the Government of Iran, in arbitration proceedings in France. The payment was for legal advice provided by our
customer to the German law firm in relation to the arbitration proceedings. The payment was processed in accordance with applicable
laws and regulations. Barclays attributed revenue of approximately GBP 10 in 2023 in relation to this activity.
In 2023, Barclays processed several payments to consulates and embassies of the Government of Iran in Europe in relation to persons
paying fees for renewing or replacing passports, visa applications, and other administrative matters. The payments were processed in
accordance with applicable laws and regulations. Barclays attributed revenue of approximately GBP 5 in 2023 in relation to this activity.
In 2023, on behalf of certain customers in the UK, Barclays processed indirect payments from various UK-based offices of Iranian SDNs,
Government of Iran-owned entities, and SDGT SDNs (the “entities”). The payments were for general business expenses, including rent,
salary payments, tax payments, office maintenance, utility payments, and business travel expenses. A UK accounting firm remitted the
payments on behalf of the entities, and all the payments were processed in accordance with applicable laws and regulations. Barclays
attributed revenue of approximately GBP 195 in 2023 in relation to this activity.
Barclays holds accounts for several individuals employed by a UK-based SDN entity that is ultimately owned by the Government of Iran.
Payments are received in GBP from a UK-based payment services company and are credited to the customers’ accounts with Barclays.
The payments are processed in accordance with applicable laws and regulations. No payments are received directly from any entity
owned by the Government of Iran or any SDN. Barclays attributed no revenue in 2023 in relation to this activity.
In 2023, a Barclays customer in the UK was designated as an SDN pursuant to the GTSR. The customer had two accounts and a
personal credit card with Barclays. Barclays exited the relationship with the customer, cancelled the credit card, and placed the
remaining funds in an internal sundry account in compliance with applicable laws and regulations. The credit card had no outstanding
debt and was not used in 2023. A small number of domestic payments were remitted from the accounts after the customer was
designated, but before Barclays had confirmed the match. Barclays attributed no revenue in 2023 in relation to this activity.
In 2023, a Barclays customer in the UK was designated as an SDN pursuant to the GTSR. The customer had a personal credit card with
an outstanding debit balance with Barclays. The credit card was blocked to prevent any further spending. Barclays is attempting to
receive repayment from this customer in accordance with applicable laws and regulations. Barclays attributed revenue of approximately
GBP 15 in 2023 in relation to this activity.
Frozen Accounts
Barclays, and several Barclays customers, continue to hold funds belonging to various SDNs and Government of Iran-owned entities in
internal blocked and sundry accounts, some of which are interest bearing. These accounts are held in accordance with applicable laws
and regulations. Barclays attributed no revenue in 2023 in relation to this activity.
| | | | | | | | |
| Climate and sustainability report | | | | | | Barclays PLC 2023 Annual Report on Form 20-F | |
|
| | | | | | | | |
Additional unaudited information |
Summary of Barclays Group share and cash plans and long-term incentive plans
Barclays operates a number of share, cash and long-term incentive plans. The principal plans used for awards made in or, in respect of,
the 2023 performance year are shown in the table below. Awards are granted by the Barclays PLC Board Remuneration Committee or a
delegated sub-committee (the “Committee”), and are subject to the applicable plan rules (as amended from time to time). Share
awards are granted over ordinary shares in Barclays PLC (“Shares”). Barclays has a number of employee benefit trusts which operate in
conjunction with these plans. In some cases the trustee purchases Shares in the market to satisfy awards; in others, new issue or
treasury Shares may be used to satisfy awards where the appropriate shareholder approval has been obtained.
| | | | |
Summary of principal share and cash plans and long-term incentive plans |
| | Executive Directors eligible | | |
| All employees (including executive Directors of Barclays PLC) | | Deferred Share awards, typically released in instalments over a three, four, five or seven year period, dependent on future service and subject to malus provisions | –The SVP typically used for mandatory deferral of a proportion of bonus into Shares where bonus is above a threshold (set annually by the Committee). –This plan typically works in tandem with the CVP (below). –SVP awards vest over three, four, five or seven years dependent on future service. –Vesting is subject to malus terms, suspension provisions and the other provisions of the rules of the SVP. –For awards granted before 2018, dividend equivalents may be released based on the number of Shares under award that are released. –On cessation of employment, eligible leavers (as set out in the rules of the SVP) normally remain eligible for release (on the scheduled release dates) subject to the Committee and/or trustee discretion. For other leavers, awards will normally lapse if the employee resigns before the third anniversary of grant. –On change of control, awards may vest at the Committee’s and/or trustee’s discretion. –For DSVP awards made to Material Risk Takers (“MRTs”), a holding period of either 6 or 12 months will apply to Shares (after tax) on release. |
Deferred Share Value Plan (SVP) | All employees (excluding executive Directors of Barclays PLC) | | Deferred Share awards, typically released in instalments over a three, four, five or seven year period, dependent on future service and subject to malus provisions | –The DSVP is in all material respects the same as the SVP described above. The principle difference is that the DSVP has not been approved by Barclays Shareholders and therefore the Executive Directors of Barclays PLC are not eligible to participate. |
| All employees (including executive Directors of Barclays PLC) | | Deferred cash award typically released in instalments over a three, four, five or seven year period, dependent on future service and subject to malus provisions | –The CVP is typically used for mandatory deferral of a proportion of bonus where bonus is above a threshold (set annually by the Committee. –This plan typically works in tandem with the SVP. –CVP awards vest over three, four, five or seven years dependent on future service. –Vesting is subject to malus terms, suspension provisions and the other provisions of the rules of the CVP. –Change of control and leaver provisions are as for DSVP. |
| | | | | | | | |
| Climate and sustainability report | | | | | | Barclays PLC 2023 Annual Report on Form 20-F | |
|
| | | | | | | | |
Additional unaudited information |
| | | | |
Barclays Long Term Incentive Plan (LTIP) | Selected employees (including executive Directors of Barclays PLC) | | Awards over Shares subject to risk-adjusted performance conditions and malus provisions | –Awarded on a discretionary basis with participation reviewed by the Committee. –Awards only vest if the forward looking performance conditions are satisfied over a three year period. –LTIP awards vest over seven years dependent on future service. –Vesting is subject to malus terms, suspension provisions and the other provisions of the rules of the LTIP. –Any Shares released under the LTIP award (after payment of tax) will be subject to an additional holding period of no less than the minimum regulatory requirements (currently 12 months). –On cessation of employment, eligible leavers (as set out in the rules of the LTIP) normally remain eligible for release (on the scheduled release dates) pro-rated for time and performance. For other leavers, awards will normally lapse. –On change of control, awards may vest at the Committee’s discretion. |
| All employees in the UK and Ireland (including executive Directors of Barclays PLC) | | Options over Shares at a discount of 20%, with Shares delivered or cash value of savings returned after three or five years | –HMRC tax advantaged plan in the UK and approved by the Revenue Commissioners in Ireland. –Opportunity to purchase Shares at a discount price (currently a 20% discount) set on award date with savings made over three or five year term. –Maximum individual savings of £300 per month or the Euro equivalent in Ireland. –On cessation of employment, eligible leavers may exercise options and acquire Shares to the extent of their savings for six months. –On change of control, participants may exercise options and acquire Shares to the extent of their savings for six months. |
| All employees in the UK (including executive Directors of Barclays PLC) | | Shares purchased from gross salary deductions and Dividend/Matching Shares are held in trust for three to five years | –HMRC tax advantaged plan in the UK. –Participants may purchase up to £1,800 of Shares each tax year (“Partnership Shares”). –Barclays matches the first £600 of Partnership Shares on a one for one basis for each tax year (“Matching Shares”). –Dividends received are awarded as Dividend Shares. –Partnership Shares may be withdrawn at any time (though if removed prior to three years from award, the corresponding Matching Shares are forfeited). –Depending on reason for and timing of leaving, Matching Shares may be forfeited. –On change of control, participants are able to instruct the Sharepurchase trustee how to act or vote on their behalf in relation to their Shares. |
| Employees in certain jurisdictions other than the UK ((including executive Directors of Barclays PLC) | | Shares purchased from net salary deductions and Dividend/Matching Shares are held in trust for three to five years | –Global Sharepurchase is an extension of the Sharepurchase plan (above). –Operates in substantially the same way as Sharepurchase but without the tax advantages. |
| | | | | | | | |
| Climate and sustainability report | | | | | | Barclays PLC 2023 Annual Report on Form 20-F | |
|
| | | | | | | | |
Additional unaudited information |
Deposits
Average deposits at amortised cost, Average interest rate paid - split by type and UK vs Non-UK
The following tables present average deposits at amortised cost and their associated interest expense by deposit type split into UK &
Non-UK
| | | |
| Average deposits at amortised cost | | |
For the year ended 31 December 2023 | | | |
| | | |
Current and demand accounts | | | |
| | | |
| | | |
| | | |
| | | |
| | | |
| | | |
| | | |
Current and demand accounts | | | |
| | | |
| | | |
| | | |
| | | |
| | | |
Total Deposits at Amortised Cost | | | |
| | | |
| Average deposits at amortised cost | | |
For the year ended 31 December 2022 | | | |
| | | |
Current and demand accounts | | | |
| | | |
| | | |
| | | |
| | | |
| | | |
| | | |
| | | |
Current and demand accounts | | | |
| | | |
| | | |
| | | |
| | | |
| | | |
Total Deposits at Amortised Cost | | | |
| | | |
| Average deposits at amortised cost | | |
For the year ended 31 December 2021 | | | |
| | | |
Current and demand accounts | | | |
| | | |
| | | |
| | | |
| | | |
| | | |
| | | |
| | | |
Current and demand accounts | | | |
| | | |
| | | |
| | | |
| | | |
| | | |
Total Deposits at Amortised Cost | | | |
Note
1 The country analysis in the table above is based on the location of the counterparty with which the deposits at amortised cost are recorded.
Deposits at amortised cost in offices in the United Kingdom received from non-residents amounted to £49,806m (2022: £43,130m).
| | | | | | | | |
| Climate and sustainability report | | | | | | Barclays PLC 2023 Annual Report on Form 20-F | |
|
| | | | | | | | |
Additional unaudited information |
Uninsured other time deposits
As at 31 December 2023, £1,134m (2022: £382m) of U.S. time deposits were in excess of the Federal Deposit Insurance Corporation
insurance limit.
Of the total deposits at amortised cost, there are uninsured deposits of £315,144m (2022: £325,782m) which are not insured through
the UK Financial Services Compensation Scheme (FSCS) or other similar deposits schemes.
| | | | | | | | |
| Climate and sustainability report | | | | | | Barclays PLC 2023 Annual Report on Form 20-F | |
|
| | | | | | | | |
Additional unaudited information |
Commitments and contractual obligations
Commercial commitments include guarantees, contingent liabilities and standby facilities.
| | | | | |
| |
| Amount of commitment expiration per period |
| | Between one to three years | Between three to five years | | |
| | | | | |
| | | | | |
Guarantees and letters of credit pledged as collateral security | | | | | |
Performance guarantees, acceptances and endorsements | | | | | |
Documentary credits and other short-term trade related transactions | | | | | |
Standby facilities, credit lines and other commitments | | | | | |
| | | | | |
| | | | | |
Guarantees and letters of credit pledged as collateral security | | | | | |
Performance guarantees, acceptances and endorsements | | | | | |
Documentary credits and other short-term trade related transactions | | | | | |
Standby facilities, credit lines and other commitments | | | | | |
Contractual obligations include debt securities and purchase obligations.
| | | | | |
| |
| |
| | Between one to three years | Between three to five years | | |
| | | | | |
| | | | | |
| | | | | |
| | | | | |
| | | | | |
| | | | | |
| | | | | |
| | | | | |
| | | | | |
| | | | | |
Note
1Long-term debt has been prepared to reflect cash flows on an undiscounted basis, which includes interest payments.
Net cash flows from derivatives used to hedge long-term debt amount to £(2.7)bn (2022: £(4.6)bn).
Further information on the contractual maturity of the Group’s assets and liabilities is given in the Liquidity risk section.
Securities
Investment securities include securities reported within debt securities at amortised cost and financial assets at fair value through other
comprehensive income.
Investment debt securities include government securities held as part of the Group’s treasury management portfolio for asset and
liability, liquidity and regulatory purposes and are for use on a continuing basis in the activities of the Group. In addition, the Group holds
as investments listed and unlisted corporate securities.
| | | | | | | | | | |
Maturities and yield of investment debt securities | | | | | | | | | |
| | | | | | | | | | |
| | Maturing after one but within five years | Maturing after five but within ten years | | |
| | | | | | | | | | |
| | | | | | | | | | |
Debt securities at amortised cost | | | | | | | | | | |
Financial assets at fair value through other comprehensive income | | | | | | | | | | |
| | | | | | | | | | |
The above table is only for debt securities held at the reporting date and does not include associated hedges.
| | | | | | | | |
| Climate and sustainability report | | | | | | Barclays PLC 2023 Annual Report on Form 20-F | |
|
| | | | | | | | |
Additional unaudited information |
Average balance sheet
Average balances are based upon monthly averages. UK and Non-UK is based on the location of the office where the transactions are
recorded.
| | | | | | |
| | |
| | | | | | |
| | | | | | |
Cash and balances at central banks | | | | | | |
Cash and balances at central banks | | | | | | |
Cash and balances at central banks | | | | | | |
Loans and advances at amortised cost | | | | | | |
Loans and advances at amortised cost | | | | | | |
Loans and advances at amortised cost2 | | | | | | |
| | | | | | |
| | | | | | |
| | | | | | |
Reverse repurchase agreements | | | | | | |
Reverse repurchase agreements | | | | | | |
Reverse repurchase agreements | | | | | | |
Interest earning assets at fair value through other comprehensive income | | | | | | |
Interest earning assets at fair value through other comprehensive income | | | | | | |
Interest earning assets at fair value through other comprehensive income | | | | | | |
Other interest and similar income3 | | | | | | |
Total interest earning assets not at fair value through income statement | | | | | | |
Less: interest and similar expense | | | | | | |
| | | | | | |
Financial assets at fair value through income statement | | | | | | |
Financial assets at fair value through income statement | | | | | | |
Financial assets at fair value through income statement | | | | | | |
Total interest earning assets | | | | | | |
| | | | | | |
Non-interest earning assets | | | | | | |
| | | | | | |
Percentage of total average interest earning assets in offices outside the UK | | | | | | |
Notes
1Negative interest earned on assets (which is presented within interest and similar expense in the statutory accounts) is included in determining the total net interest figure. This
presentation is deemed appropriate to represent the return associated with each asset class in the table.
2Loans and advances at amortised cost include credit-impaired loans. Interest receivable on such lending has been included to the extent to which either cash payments have been
received or interest has been accrued in accordance with the income recognition policy of the Barclays Group.
3Other interest and similar income principally includes interest income relating to hedging activity.
| | | | | | | | |
| Climate and sustainability report | | | | | | Barclays PLC 2023 Annual Report on Form 20-F | |
|
| | | | | | | | |
Additional unaudited information |
| | | | | | |
| | |
| | | | | | |
| | | | | | |
Deposits at amortised cost | | | | | | |
Deposits at amortised cost | | | | | | |
Deposits at amortised cost | | | | | | |
| | | | | | |
| | | | | | |
| | | | | | |
| | | | | | |
| | | | | | |
| | | | | | |
| | | | | | |
| | | | | | |
| | | | | | |
| | | | | | |
| | | | | | |
| | | | | | |
| | | | | | |
| | | | | | |
| | | | | | |
| | | | | | |
| | | | | | |
| | | | | | |
Other interest and similar expense2 | | | | | | |
Total interest bearing liabilities not at fair value through P&L | | | | | | |
Interest bearing liabilities at fair value through P&L | | | | | | |
Interest bearing liabilities at fair value through P&L | | | | | | |
Interest bearing liabilities at fair value through P&L | | | | | | |
Total interest bearing liabilities | | | | | | |
Interest free customer deposits | | | | | | |
Interest free customer deposits | | | | | | |
Interest free customer deposits | | | | | | |
Other non-interest bearing liabilities | | | | | | |
| | | | | | |
| | | | | | |
Percentage of total average interest bearing liabilities in offices outside the UK | | | | | | |
Notes
1Negative interest earned on liabilities (which is presented within interest and similar income in the statutory accounts) is included in determining the total net interest figure. This
presentation is deemed appropriate to represent the return associated with each asset class in the table.
2Other interest and similar expense principally includes interest expense relating to hedging activity.
| | | | | | | | |
| Climate and sustainability report | | | | | | Barclays PLC 2023 Annual Report on Form 20-F | |
|
| | | | | | | | |
Additional unaudited information |
| | | | | | |
| | |
| | | | | | |
| | | | | | |
Deposits at amortised cost | | | | | | |
Deposits at amortised cost | | | | | | |
Deposits at amortised cost | | | | | | |
| | | | | | |
| | | | | | |
| | | | | | |
| | | | | | |
| | | | | | |
| | | | | | |
| | | | | | |
| | | | | | |
| | | | | | |
| | | | | | |
| | | | | | |
| | | | | | |
| | | | | | |
| | | | | | |
| | | | | | |
| | | | | | |
| | | | | | |
| | | | | | |
Other interest and similar expense2 | | | | | | |
Total interest bearing liabilities not at fair value through income statement | | | | | | |
Interest bearing liabilities at fair value through income statement | | | | | | |
Interest bearing liabilities at fair value through income statement | | | | | | |
Interest bearing liabilities at fair value through income statement | | | | | | |
Total interest bearing liabilities | | | | | | |
Interest free customer deposits | | | | | | |
Interest free customer deposits | | | | | | |
Interest free customer deposits | | | | | | |
Other non-interest bearing liabilities | | | | | | |
| | | | | | |
| | | | | | |
Percentage of total average interest earning liabilities in offices outside the UK | | | | | | |
Notes
1 Negative interest earned on liabilities (which is presented within interest and similar income in the statutory accounts) is included in determining the total net interest figure. This
presentation is deemed appropriate to represent the return associated with each asset class in the table.
2Other interest and similar expense principally includes interest expense relating to hedging activity.
| | | | | | | | |
| Climate and sustainability report | | | | | | Barclays PLC 2023 Annual Report on Form 20-F | |
|
| | | | | | | | |
Additional unaudited information |
| | | | | | |
| | |
| | | | | | |
| | | | | | |
Deposits at amortised cost | | | | | | |
Deposits at amortised cost | | | | | | |
Deposits at amortised cost | | | | | | |
| | | | | | |
| | | | | | |
| | | | | | |
| | | | | | |
| | | | | | |
| | | | | | |
| | | | | | |
| | | | | | |
| | | | | | |
| | | | | | |
| | | | | | |
| | | | | | |
| | | | | | |
| | | | | | |
| | | | | | |
| | | | | | |
| | | | | | |
| | | | | | |
Other interest and similar expense2 | | | | | | |
Total interest bearing liabilities not at fair value through income statement | | | | | | |
Interest bearing liabilities at fair value through income statement | | | | | | |
Interest bearing liabilities at fair value through income statement | | | | | | |
Interest bearing liabilities at fair value through income statement | | | | | | |
Total interest bearing liabilities | | | | | | |
Interest free customer deposits | | | | | | |
Interest free customer deposits | | | | | | |
Interest free customer deposits | | | | | | |
Other non-interest bearing liabilities | | | | | | |
| | | | | | |
| | | | | | |
Percentage of total average interest earning liabilities in offices outside the UK | | | | | | |
Notes
1Negative interest earned on liabilities (which is presented within interest and similar income in the statutory accounts) is included in determining the total net interest figure. This
presentation is deemed appropriate to represent the return associated with each asset class in the table.
2Other interest and similar expense principally includes interest expense relating to hedging activity.
| | | | | | | | |
| Climate and sustainability report | | | | | | Barclays PLC 2023 Annual Report on Form 20-F | |
|
| | | | | | | | |
Additional unaudited information |
Changes in total interest – volume and rate analysis
The following tables allocate changes in interest between changes in volume and changes in interest rates for the last two years.
Volume and rate variances have been calculated on the movement in the average balances and the change in the interest rates on
average interest earning assets and average interest bearing liabilities. Where variances have arisen from changes in both volumes and
interest rates, these have been allocated proportionately between the two.
| | | | | | | |
| | | |
| | 2023/2022 Change due to increase/(decrease) in: | 2022/2021 Change due to increase/(decrease) in: |
| | | | | | | |
| | | | | | | |
Cash and balances at central banks | | | | | | | |
Cash and balances at central banks | | | | | | | |
Cash and balances at central banks | | | | | | | |
Loans and advances at amortised cost | | | | | | | |
Loans and advances at amortised cost | | | | | | | |
Loans and advances at amortised cost | | | | | | | |
| | | | | | | |
| | | | | | | |
| | | | | | | |
Reverse repurchase agreements | | | | | | | |
Reverse repurchase agreements | | | | | | | |
Reverse repurchase agreements | | | | | | | |
Interest earning assets at fair value through other comprehensive income | | | | | | | |
Interest earning assets at fair value through other comprehensive income | | | | | | | |
Interest earning assets at fair value through other comprehensive income | | | | | | | |
Other interest and similar income | | | | | | | |
Total interest receivable | | | | | | | |
| | | | | | | | |
| Climate and sustainability report | | | | | | Barclays PLC 2023 Annual Report on Form 20-F | |
|
| | | | | | | | |
Additional unaudited information |
| | | | | | | |
| | | |
| | 2023/2022 Change due to increase/(decrease) in: | 2022/2021 Change due to increase/(decrease) in: |
| | | | | | | |
| | | | | | | |
Deposits at amortised cost | | | | | | | |
Deposits at amortised cost | | | | | | | |
Deposits at amortised cost | | | | | | | |
| | | | | | | |
| | | | | | | |
| | | | | | | |
| | | | | | | |
| | | | | | | |
| | | | | | | |
| | | | | | | |
| | | | | | | |
| | | | | | | |
| | | | | | | |
| | | | | | | |
| | | | | | | |
| | | | | | | |
| | | | | | | |
| | | | | | | |
| | | | | | | |
| | | | | | | |
| | | | | | | |
Other interest and similar expense | | | | | | | |
| | | | | | | |
| | | | | | | | |
| Climate and sustainability report | | | | | | Barclays PLC 2023 Annual Report on Form 20-F | |
|
| | | | | | | | |
Additional unaudited information |
Credit risk additional disclosure
This section of the report contains supplementary information that is more detailed or contains longer histories than the data
presented in the Risk review section.
| | | |
Interest forgone on risk elements in loans and advances at amortised cost | | | |
| | | |
| | | |
Interest income that would have been recognised under the original contractual terms | | | |
Potential problem loans
Potential problem loans are those loans for which serious doubt exists as to the ability of the borrower to continue to comply with
repayment terms in the near future.
The loans and advances at amortised cost by product disclosure in the credit risk section includes gross exposure and associated
impairment allowance for assets classified as Stage 2, but not past due i.e. assets satisfying the criteria for a Significant Increase in
Credit Risk, but which are still complying with repayment terms.
A financial asset is subject to forbearance when it is modified due to the credit distress of the borrower. A modification made to the
terms of an asset due to forbearance will typically be assessed as a non-substantial modification that does not result in derecognition of
the original loan, except in circumstances where debt is exchanged for equity. Both performing and non-performing forbearance assets
are classified as Stage 3 except where it is established that the concession granted has not resulted in diminished financial obligation
and that no other regulatory definition of default criteria has been triggered, in which case the asset is classified as Stage 2. The
minimum probationary period for non-performing forbearance is 12 months and for performing forbearance, 24 months. Hence, a
minimum of 36 months is required for non-performing forbearance to move out of a forborne state. Further details can be found in the
credit risk section.
In order to assess asset credit quality, 12-month PDs are used to map assets into strong, satisfactory, higher risk or credit impaired. A
credit risk profile by internal PD grade for gross loans and advances at amortised cost and allowance for ECL is shown in the credit risk
section, analysing each of these categories by stage.
Wholesale accounts that are deemed to contain heightened levels of risk are recorded on graded watchlists comprising four categories,
graded in line with the perceived severity of the risk attached to the lending, and its probability of default. Where a counterparty’s
financial health gives grounds for concern, it is immediately placed into the appropriate category. Once an account has been placed on a
watchlist, the exposure is monitored and, where appropriate, exposure reductions are effected. Further information on monitoring
weaknesses in portfolios can be found in the Barclays PLC Pillar 3 Report 2023 (unaudited).
| | | | | | | | |
| Climate and sustainability report | | | | | | Barclays PLC 2023 Annual Report on Form 20-F | |
|
| | | | | | | | |
Additional unaudited information |
Impairment
| | | | |
Allocation of the allowance for credit losses |
Balance at end of period applicable to: | | % of loans in each category to total loans |
| | | | |
| | | | |
Loans and Advances at amortised cost to Banks | | | | |
Loans and Advances at amortised cost to Customers | | | | |
| | | | |
| | | | |
| | | |
Net Charge offs during the period to average loans outstanding |
Balance at end of period applicable to: | |
| | | |
| | | |
Loans and Advances at amortised cost to Banks | | | |
| | | |
| | | |
| | | |
Loans and Advances at amortised cost to Customers | | | |
| | | |
| | | |
| | | |
| | | |
| | | |
| | | |
| | | |
| | |
|
Allowance for credit losses to total loans outstanding during | |
| | |
| | |
Allowance for credit losses | | |
| | |
| | |
Note
1 Excludes balance relating to the German consumer finance business classified as assets held for sale during the year.
| | | | | | | | |
| Climate and sustainability report | | | | | | Barclays PLC 2023 Annual Report on Form 20-F | |
|
| | | | | | | | |
Additional unaudited information |
Maturity analysis of gross loans and advances
| | | | | |
20 F-Maturity analysis of gross loans and advances |
| | | | | |
| | | | | |
Loans and advances at amortised cost to banks | | | | | |
Loans and advances at amortised cost to customers | | | | | |
| | | | | |
Loans and advances at fair value through profit and loss | | | | | |
| | | | | |
Total gross loans and advances | | | | | |
| | | | | |
| | | | | |
Loans and advances at amortised cost to banks | | | | | |
Loans and advances at amortised cost to customers | | | | | |
| | | | | |
Loans and advances at fair value through profit and loss | | | | | |
| | | | | |
Total gross loans and advances | | | | | |
| | | | | | |
Interest rate sensitivity of gross loans and advances. Maturity > 1 year | | | |
| | |
| | | | | | |
| | | | | | |
Loans and advances at amortised cost to banks | | | | | | |
Loans and advances at amortised cost to customers | | | | | | |
Financial assets at fair value through other comprehensive income | | | | | | |
Loans and advances at fair value through profit and loss | | | | | | |
| | | | | | |
| | |
Notional principal amounts of credit derivatives | | |
| | |
| | |
Credit derivatives held or issued for trading purposes | | |
Note
1Includes credit derivatives held as economic hedges which are not designated as hedges for accounting purposes.
Related party transactions additional disclosure
For US disclosure purposes, the aggregate emoluments of all Directors and Officers of Barclays PLC who held office during the year
(2023: 29 persons, 2022: 25 persons, 2021: 26 persons) for the year ended 31 December 2023 amounted to £57m (2022: £56.7m,
2021: £65.7m). In addition, the aggregate amount set aside for the year ended 31 December 2023, to provide pension benefits for the
Directors and Officers amounted to £nil (2022: £nil, 2021: £nil).
The expiry dates of the 67,319 options held by Executive Directors and Officers of Barclays PLC as at 31 December 2023 are as follows:
•30 April 2024: 14,912 shares
•30 April 2025: 15,126 shares
•30 April 2026: 21,428 shares
•30 April 2027: 15,853 shares.
| | | | | | | | |
| Climate and sustainability report | | | | | | Barclays PLC 2023 Annual Report on Form 20-F | |
|
| | | | | | | | |
Additional unaudited information |
‘Advanced Internal Ratings Based (A-IRB)’ See ‘Internal Ratings Based (IRB)’.
‘Acceptances and endorsements’ An acceptance is an undertaking by a bank to pay a bill of exchange drawn on a customer, for which
reimbursement by the customer is normally immediate. Endorsements are to change the payee of a bill of exchange but with no change to
the bank’s liability.
‘Additional Tier 1 (AT1) capital’ A type of capital as defined in the CRR largely comprising eligible non-common equity capital securities and
any related share premium.
‘Additional Tier 1 (AT1) securities’ Non-common equity securities that are eligible as AT1 capital.
‘Advanced Measurement Approach (AMA)’ An approach used to quantify required capital for operational risk. Under the AMA, banks are
allowed to develop their own empirical model to quantify required capital for operational risk. Banks can only use this approach subject to
approval from their local applicable regulators.
‘Agency Bonds’ Bonds issued by state and / or government agencies or government-sponsored entities.
‘Agency Mortgage-Backed Securities’ Mortgage-Backed Securities issued by government-sponsored entities.
‘All price risk (APR)’ An estimate of all the material market risks, including rating migration and default, for the correlation trading portfolio.
‘American Depository Receipts (ADR)’ A negotiable certificate that represents the ownership of depository shares in a non-US company
(e.g. Barclays) trading on US financial markets.
‘Americas’ Geographic segment comprising the US, Canada and countries where Barclays operates within Latin America.
‘Annual Earnings at Risk (AEaR)’ A measure of the potential change in Net Interest Income (NII) due to an interest rate movement over a
one-year period.
‘Annualised cumulative weighted average lifetime PD’ The Probability of Default (PD) over the remaining life of the asset, expressed as an
annual rate, reflecting a range of possible economic scenarios.
‘Application scorecards’ Algorithm based decision-making tools used to aid business decisions and manage credit risk based on available
customer data at the point of application for a product.
‘Arrears’ Customers are said to be in arrears when they are behind in fulfilling their obligations with the result that an outstanding loan is
unpaid or overdue. Such customers are also said to be in a state of delinquency. When a customer is in arrears, their entire outstanding
balance is said to be delinquent, meaning that delinquent balances are the total outstanding loans on which payments are overdue.
‘Asia’ Geographic segment comprising countries where Barclays operates within Asia and the Middle East.
‘Asset Backed Commercial Paper (ABCP)’ Typically short-term notes secured on specified assets issued by consolidated special purpose
entities for funding purposes.
‘Asset Backed Securities (ABS)’ Securities that represent an interest in an underlying pool of referenced assets. The referenced pool can
comprise any assets which attract a set of associated cash flows but are commonly pools of residential or commercial mortgages and, in
the case of a Collateralised Debt Obligation (CDO), the referenced pool may be ABS or other classes of assets.
‘Attributable profit’ Profit after tax that is attributable to ordinary equity holders of Barclays adjusted for the after tax amounts of capital
securities classified as equity.
‘Average allocated tangible equity’ (for businesses) Calculated as the average of the previous month’s period end allocated tangible equity
and the current month’s period end allocated tangible equity. The average allocated tangible equity for the period is the average of the
monthly averages within that period.
‘Average tangible shareholders’ equity’ (for Barclays Group) Calculated as the average of the previous month’s period end tangible
shareholders’ equity and the current month’s period end tangible shareholders’ equity. The average tangible shareholders’ equity for the
period is the average of the monthly averages within that period.
‘Average UK leverage ratio’ As per the PRA rulebook, calculated as the average capital measure based on the last day of each month in the
quarter divided by the average exposure measure for the quarter, where the average exposure is based on each day in the quarter.
‘Back testing’ Includes a number of techniques that assess the continued statistical validity of a model by simulating how the model would
have predicted recent experience.
‘Bank of England (BoE)’ The central bank of the United Kingdom with devolved responsibility for managing monetary policy and to oversee
regulation of the UK’s financial sector. Through the Prudential Regulation Committee, the BoE exercises control over the PRA.
‘Barclays Africa’ or ‘Absa’ or ‘Absa Group Limited’ Absa Group Limited (formerly Barclays Africa Group Limited), which was previously a
subsidiary of the Barclays Group. As a consequence of its disposals of shares in April 2022 and September 2022, the Barclays Group has
now exited its shareholding in Absa Group Limited.
‘Balance weighted Loan to Value (LTV) ratio’ In the context of the credit risk disclosures on secured home loans, a means of calculating
marked to market LTVs derived by calculating individual LTVs at account level and weighting it by the balances to arrive at the average
position. Balance weighted Loan to Value (LTV) ratio is calculated using the following formula: LTV = ((loan 1 balance x Marked to market
(MTM) LTV% for loan 1) + (loan 2 balance x Marked to market (MTM) LTV% for loan 2) + ...) / total outstanding balances in portfolio.
‘Barclaycard Consumer UK’ The UK Barclaycard business.
| | | | | | | | | |
| Climate and sustainability report | | | | | | | Barclays PLC 2023 Annual Report on Form 20-F | |
| |
| | | | | | | | | |
|
‘Barclays’ or ’Barclays Group’ or 'Group' Barclays PLC, together with its subsidiaries.
‘Barclays Bank Group’ Barclays Bank PLC, together with its subsidiaries.
‘Barclays Bank UK Group’ Barclays Bank UK PLC, together with its subsidiaries.
‘Barclays Operating Businesses’ The core Barclays businesses operated by Barclays UK (which consists of the UK Personal Banking; UK
Business Banking and the Barclaycard Consumer UK businesses) and Barclays International (which consists of the Corporate and
Investment Bank and Consumer, Cards and Payments businesses).
‘Barclays Execution Services’ or ‘BX’ or ‘Group Service Company’ Barclays Execution Services Limited, the Group-wide service company
providing technology, operations and functional services to businesses across the Group.
‘Barclays International’ The segment of Barclays with the majority of businesses held by Barclays Bank PLC. The division consists of the
Corporate and Investment Bank and Consumer, Cards and Payments businesses.
‘Barclays UK’ The segment of Barclays with the majority of businesses held by Barclays Bank UK PLC. The division includes the UK Personal
Banking; UK Business Banking and the Barclaycard Consumer UK businesses.
‘Basel 3’ or ‘Basel III’ The third of the Basel Accords, setting minimum requirements and standards that apply to internationally active
banks. Basel 3 is a set of measures developed by the Basel Committee on Banking Supervision aiming to strengthen the regulation,
supervision and risk management of banks.
‘Basel Committee on Banking Supervision (BCBS)’ or ‘The Basel Committee’ A forum for regular cooperation on banking supervisory
matters which develops global supervisory standards for the banking industry. Its 45 members are officials from central banks or prudential
supervisors from 28 jurisdictions.
‘Basic Indicator Approach (BIA)’ An approach used to quantify required capital for operational risk. Under the BIA, banks are required to
hold regulatory capital for operational risk equal to 15% of the annual average, calculated over a rolling three-year period, of the relevant
income indicator for the bank as whole.
‘Basis point(s)’ or ‘bp(s)’ One hundredth of a per cent (0.01%); 100 basis points is 1%. The measure is used for quoting movements in
interest rates, yields on securities and for other purposes.
‘Basis risk’ Index/tenor risk that arises when floating rate products are linked to different interest rate indices, which are imperfectly
correlated, especially under stressed market conditions.
‘Behavioural scorecards’ Algorithm-based decision tools used to aid business decisions and manage credit risk based on existing
customer data derived from account usage.
‘Book quality’ In the context of the Capital Risk section of the Barclays PLC Annual Report (or equivalent section in quarterly or half yearly
results), changes in RWAs caused by factors such as underlying customer behaviour or demographics leading to changes in risk profile.
‘Book size’ In the context of the Capital Risk section of the Barclays PLC Annual Report (or equivalent section in quarterly or half yearly
results), changes in RWAs driven by business activity, including net originations or repayments.
‘Bounce Back Loan Scheme (BBLS)’ A UK Government (British Business Bank) backed loan scheme which allowed SMEs to borrow
between £2,000 and £50,000. The UK Government guarantees 100% of the loan and pays the first 12 months of interest on behalf of the
borrowers, subject to terms and conditions. The scheme closed on 31 March 2021.
‘Business Banking’ Serves business clients, from high growth start-ups to small and medium-sized businesses, with specialist advice for
their business banking needs.
‘Business Growth Fund (BGF)’ An independent company established by the UK’s largest banks, including Barclays, to help young fast-
growing businesses by providing long-term growth capital. Barclays holds an associate interest in BGF.
‘Business scenario stresses’ Multi-asset scenario analysis of extreme, but plausible, events that may impact the market risk exposures of
the Investment Bank.
‘Buy to let mortgage’ A mortgage whereby the intention of the customer is to let the property at origination.
‘Capital Conservation Buffer (CCB)’ A capital buffer of 2.5% of a bank’s total exposures that needs to be met with an additional amount of
Common Equity Tier 1 capital above the 4.5% minimum requirement for Common Equity Tier 1 set out in CRR. Its objective is to conserve a
bank’s capital by ensuring that banks build up surplus capital outside periods of stress which can be drawn down if losses are incurred.
‘Capital ratios’ Key financial ratios measuring the bank's capital adequacy or financial strength expressed as a percentage of RWAs.
‘Capital Requirements Directive (CRD)’ Directive 2013/36/EU, a component of the CRD IV package which accompanies the Capital
Requirements Regulation and sets out macroprudential standards including the Countercyclical Capital Buffer and capital buffers for
systemically important institutions. Directive (EU) 2019/878, published as part of the EU Risk Reduction Measure package, amends the
CRD. These amendments entered into force from 27 June 2019, with EU member states required to adopt the measures within Directive
(EU) 2019/878 by 28 December 2020. CRD forms part of UK law by virtue of the European Union (Withdrawal) Act 2018, as amended.
‘Capital Requirements Regulation (CRR)’ Regulation (EU) No 575/2013, as amended by Regulation (EU) 2019/876 (CRR II), a component
of the CRD IV package which accompanies the Capital Requirements Directive and sets out detailed rules for capital eligibility, the
calculation of RWAs, the measurement of leverage, the management of large exposures and minimum standards for liquidity. Between 27
June 2019 and 28 June 2023, CRR will be amended in line with the requirements of amending Regulation (EU) 2019/876 (CRR II). CRR, as
amended by CRR II, forms part of UK law by virtue of the European Union (Withdrawal) Act 2018, as amended.
| | | | | | | | | |
| Climate and sustainability report | | | | | | | Barclays PLC 2023 Annual Report on Form 20-F | |
| |
| | | | | | | | | |
|
‘Capital Requirements Regulation II (CRR II)’ Regulation (EU) 2019/876, amending Regulation (EU) No 575/2013 (CRR). This is a
component of the EU Risk Reduction Measure package. The requirements set out in CRR II were introduced between 27 June 2019 and 28
June 2023. Following a consultation process in 2021, the PRA finalised their implementation of the CRR II package through Policy Statement
22/21. The finalised requirements were implemented in the UK through the PRA Rulebook with effect from 1 January 2022.
‘Capital requirements on the underlying exposures (KIRB)’ An approach available to banks when calculating RWAs for securitisation
exposures. This is based upon the RWA amounts that would be calculated under the IRB approach for the underlying pool of securitised
exposures in the programme, had such exposures not been securitised.
‘Capital resources’ Common Equity Tier 1, Additional Tier 1 capital and Tier 2 capital that are eligible to satisfy capital requirements under
CRD. Referred to as ‘own funds’ within EU and UK regulatory texts.
‘Capital risk’ The risk that the Barclays Group has an insufficient level or composition of capital to support its normal business activities and
to meet its regulatory capital requirements under normal operating environments or stressed conditions (both actual and as defined for
internal planning or regulatory testing purposes). This includes the risk from the Barclays Group’s pension plans.
‘Central Counterparty’ or ‘Central Clearing Counterparties (CCPs)’ A clearing house mediating between the buyer and the seller in a
financial transaction, such as a derivative contract or repurchase agreement (Repo). Where a Central Counterparty is used, a single bi-lateral
contract between the buyer and seller is replaced with two contracts, one between the buyer and the CCP and one between the CCP and
the seller. The use of CCPs allows for greater oversight and improved credit risk mitigation in over-the-counter (OTC) markets.
‘Charge-off’ In the retail segment this refers to the point in time when collections activity changes from the collection of arrears to the
recovery of the full balance. This is normally when six payments are in arrears.
‘Client Assets’ Assets managed or administered by the Barclays Group on behalf of its clients including assets under management (AUM),
custody assets, assets under administration and client deposits.
‘Climate risk’ The impact on Financial and Operational Risks arising from climate change through physical risks, risks associated with
transitioning to a lower carbon economy and connected risks arising as a result of second order impacts of these two drivers on portfolios.
•Physical risks: Physical risks resulting from a changing climate can be event driven (acute risks), including increased severity of extreme
weather events such as cyclones, hurricanes and floods. Longer term shifts in climate patterns (chronic risks) arise from sustained higher
temperatures that may cause rises in sea levels, rising mean temperatures and more severe weather events. These changes are likely to
lead to risks for sovereigns, business models and supply chains.
•Transition risks: The transition to a lower carbon economy will involve significant rapid policy, regulatory and legal changes, as evolving
technology and markets adapt to a changing climate and associated impacts. These changes will lead to risks for sovereigns, business
models and supply chains.
•Connected risks: The second-order risks arising from physical or transition risk impacts. Connected risk is diverse, impacting customer
and wholesale portfolios.
‘CLOs and Other insured assets’ Highly-rated CLO positions wrapped by monolines, non-CLOs wrapped by monolines and other assets
wrapped with Credit Support Annex (CSA) protection.
‘Collateralised Debt Obligation (CDO)’ A security issued by a third party which references Asset Backed Securities and/or certain other
related assets purchased by the issuer. CDOs may feature exposure to sub-prime mortgage assets through the underlying assets.
‘Collateralised Loan Obligation (CLO)’ A security backed by repayments from a pool of commercial loans.
‘Collateralised Mortgage Obligation (CMO)’ A security backed by mortgages. A special purpose entity receives income from the
mortgages and passes them on to investors in the security.
‘Combined Buffer Requirement (CBR)’ In the context of the CRD capital obligations, the total Common Equity Tier 1 capital required to
meet the combined requirements of the Capital Conservation Buffer, the GSII Buffer, the counter-cyclical buffer, and the O-SII buffer if
applicable to a firm.
‘Commercial paper (CP)’ Typically short-term notes issued by entities, including banks, for funding purposes.
‘Commercial real estate (CRE)’ Commercial real estate includes office buildings, medical centres, hotels, retail stores, shopping centres,
farm land, multifamily housing buildings, warehouses, garages, industrial properties and other similar properties. Commercial real estate
loans are loans backed by a package of commercial real estate. Note: for the purposes of the Credit Risk section, the UK CRE portfolio
includes property investment, development, trading and housebuilders but excludes social housing contractors.
‘Commissions and other incentives’ Includes commission-based arrangements, guaranteed incentives and Long Term Incentive Plan
awards.
‘Committee of Sponsoring Organizations of the Treadway Commission Framework (COSO)’ A joint initiative of five private sector
organisations dedicated to the development of frameworks and providing guidance on enterprise risk management, internal control and
fraud deterrence.
‘Commodity derivatives’ Exchange traded and over-the-counter (OTC) derivatives based on an underlying commodity (e.g. metals,
precious metals, oil and oil related products, power and natural gas).
‘Commodity risk’ Measures the impact of changes in commodity prices and volatilities, including the basis between related commodities
(e.g. Brent vs. WTI crude prices).
| | | | | | | | | |
| Climate and sustainability report | | | | | | | Barclays PLC 2023 Annual Report on Form 20-F | |
| |
| | | | | | | | | |
|
‘Common Equity Tier 1 (CET1) capital’ The highest quality form of regulatory capital under CRR that comprises common shares issued
and related share premium, retained earnings and other reserves, less specified regulatory adjustments.
‘Common Equity Tier 1 (CET1) ratio’ A measure of Common Equity Tier 1 capital expressed as a percentage of RWAs.
‘Compensation: income ratio’ The ratio of compensation expense over total income. Compensation represents total staff costs less non-
compensation items consisting of outsourcing, staff training, redundancy costs and retirement costs.
‘Compliance Risk’ The risk of poor outcomes for, or harm to, customers, clients and markets, arising from the delivery of the firm’s
products and services (also known as 'Conduct Risk') and the risk to Barclays, its clients, customers or markets from a failure to comply with
the laws, rules and regulations applicable to the firm (also known as Laws, Rules and Regulations Risk 'LRR Risk’).
‘Comprehensive Capital Analysis and Review (CCAR)’ An annual exercise, required by and evaluated by the Federal Reserve, through
which the largest bank holding companies operating in the US assess whether they have sufficient capital to continue operations through
periods of economic and financial stress and have robust capital-planning processes that account for their unique risks.
‘Comprehensive Risk Capital Charge (CRCC)’ An estimate of all the material market risks, including rating migration and default, for the
correlation trading portfolio.
‘Comprehensive Risk Measure (CRM)’ An estimate of all the material market risks, including rating migration and default, for the correlation
trading portfolio. Also referred to as All Price Risk (APR) and Comprehensive Risk Capital Charge (CRCC).
‘Constant Currency Basis’ Excluding the impact of foreign currency conversion to GBP when comparing financial results in two different
financial periods.
‘Consumer, Cards and Payments (CC&P)’ Comprises the International Cards and Consumer Bank (including Barclays US Consumer Bank
and Barclaycard Germany), Payments (including merchant acquiring and commercial payments) and Private Bank businesses.
‘Coronavirus Business Interruption Loan Scheme (CBILS)’ A loan scheme by the British Business Bank (BBB) to support UK based small
and medium-sized businesses (turnover of up to £45 million) adversely impacted by COVID-19. The CBILS scheme provided loans of up to
£5 million which are backed by an 80% UK Government (BBB) guarantee. The UK Government will pay interest and fees for the first 12
months on behalf of the borrowers, subject to terms and conditions. This scheme ended on 31 March 2021.
‘Coronavirus Large Business Interruption Loan Scheme (CLBILS)’ A loan scheme by the British Business Bank (BBB) to support UK based
medium-sized businesses (turnover above £45 million, but with no access to Covid Corporate Finance Facility (CCFF)) adversely impacted
by COVID-19. The CLBILS scheme provided loans of up to £200 million which are backed by an 80% UK Government (BBB) guarantee. This
scheme ended on 31 March 2021.
‘Corporate and Investment Bank (CIB)’ The Investment Banking, Corporate Banking and Global Markets businesses which form part of
Barclays International.
‘Correlation risk’ Refers to the change in marked to market value of a security when the correlation between the underlying assets changes
over time.
‘Cost of Equity’ The rate of return targeted by the equity holders of a company.
‘Cost: income jaws’ Relationship of the percentage change movement in operating expenses relative to total income.
‘Cost: income ratio’ Total operating expenses divided by total income.
‘Countercyclical Capital Buffer (CCyB)’ An additional buffer introduced as part of the CRD IV package that requires banks to have an
additional cushion of CET 1 capital with which to absorb potential losses, enhancing their resilience and contributing to a stable financial
system.
‘Countercyclical leverage ratio buffer (CCLB)’ A macroprudential buffer that has applied to specific PRA regulated institutions since 2018
and is calculated at 35% of any risk weighted countercyclical capital buffer set by the Financial Policy Committee (FPC). The CCLB applies in
addition to the minimum of 3.25% and any G-SII additional leverage ratio buffer that applies.
‘Counterparty credit risk (CCR)’ The risk that a counterparty to a transaction could default before the final settlement of a transaction’s
cash flows. In the context of RWAs, a component of RWAs that represents the risk of loss from derivatives, repurchase agreements and
similar transactions as a result of the default of the counterparty.
‘Coverage ratio’ This represents the percentage of impairment allowance reserve against the gross exposure.
‘Covered bonds’ Debt securities backed by a portfolio of mortgages that are segregated from the issuer’s other assets solely for the
benefit of the holders of the covered bonds.
‘Covid Corporate Financing Facility (CCFF)’ Bank of England (BOE) scheme to support liquidity among larger investment grade firms
which make a material UK contribution, helping to bridge COVID-19 disruption to their cash flows. The Bank of England provided liquidity by
purchasing short-term debt in the form of commercial paper from corporates. Barclays acted as dealer. This scheme closed for new
purchases of commercial paper with effect from 23 March 2021.
‘CRD IV’ The Fourth Capital Requirements Directive, comprising an EU Directive and an accompanying Regulation (CRR) that together
prescribe EU capital adequacy and liquidity requirements, and which implements Basel 3 in the European Union.
| | | | | | | | | |
| Climate and sustainability report | | | | | | | Barclays PLC 2023 Annual Report on Form 20-F | |
| |
| | | | | | | | | |
|
‘CRD V’ The Fifth Capital Requirements Directive, comprising an EU amending Directive and an accompanying amending Regulation (CRR
II) that together prescribe EU capital adequacy and liquidity requirements, and which implements enhanced Basel 3 proposals in the
European Union.
‘Credit conversion factor (CCF)’ A factor used to estimate the risk from off-balance sheet commitments for the purpose of calculating the
total Exposure at Default (EAD) used to calculate RWAs.
‘Credit default swaps (CDS)’ A contract under which the protection seller receives premiums or interest-related payments in return for
contracting to make payments to the protection buyer in the event of a defined credit event. Credit events normally include bankruptcy,
payment default on a reference asset or assets, or downgrades by a rating agency.
‘Credit derivatives (CDs)’ An arrangement whereby the credit risk of an asset (the reference asset) is transferred from the buyer to the
seller of the protection.
‘Credit impairment charges’ Impairment charges on loans and advances to customers and banks and impairment charges on fair value
through other comprehensive income assets and reverse repurchase agreements.
‘Credit market exposures’ Assets and other instruments relating to commercial real estate and leveraged finance businesses that have
been significantly impacted by the deterioration in the global credit markets. The exposures include positions subject to fair value
movements in the Income Statement, positions that are classified as loans and advances, and available for sale and other assets.
‘Credit quality step’ An indicator of credit risk. In the context of the Standardised Approach to calculating credit risk RWAs, a “credit quality
assessment scale” maps the credit assessments of a recognised credit rating agency or export credit agency to certain “credit quality
steps” that determine the risk weight to be applied to an exposure.
‘Credit rating’ An evaluation of the creditworthiness of an entity seeking to enter into a credit agreement.
‘Credit risk’ The risk of loss to Barclays from the failure of clients, customers or counterparties, including sovereigns, to fully honour their
obligations to Barclays, including the whole and timely payment of principal, interest, collateral and other receivables. In the context of
RWAs, it is the component of RWAs that represents the risk of loss in loans and advances and similar transactions resulting from the default
of the counterparty.
‘Credit risk mitigation’ A range of techniques and strategies used to actively mitigate credit risks to which the bank is exposed. These can
be broadly divided into three types: collateral, netting and set-off, and risk transfer.
‘Credit spread’ The premium over the benchmark or risk-free rate required by the market to accept a lower credit quality.
‘Credit Valuation Adjustment (CVA)’ The difference between the risk-free value of a portfolio of trades and the market value which takes
into account the counterparty’s risk of default. The CVA therefore represents an estimate of the adjustment to fair value that a market
participant would make to incorporate the credit risk of the counterparty due to any failure to perform contractual agreements.
‘Customer assets’ Represents loans and advances to customers. Average balances are calculated as the sum of all daily balances for the
year to date divided by number of days in the year to date.
‘Customer deposits’ In the context of the Liquidity Risk section, money deposited by all individuals and companies that are not credit
institutions. Such funds are recorded as liabilities in the Barclays Group’s balance sheet under “deposits at amortised cost”. (Customer
liabilities).
‘Customer liabilities’ See ‘Customer deposits’.
‘Daily Value at Risk (DVaR)’ An estimate of the potential loss which might arise from market movements under normal market conditions if
the current positions were to be held unchanged for one business day, measured to a specified confidence level.
‘DBRS’ DBRS Morningstar, a credit rating agency.
‘Debit Valuation Adjustment (DVA)’ The opposite of Credit Valuation Adjustment (CVA). It is the difference between the risk-free value of
a portfolio of trades and the market value which takes into account the Barclays Group’s risk of default. The DVA, therefore, represents an
estimate of the adjustment to fair value that a market participant would make to incorporate the credit risk of the Barclays Group due to any
failure to perform contractual obligations. The DVA decreases the value of a liability to take into account a reduction in the remaining
balance that would be settled should the Barclays Group default or not perform any contractual obligations.
‘Debt buybacks’ Purchases of the Barclays Group’s issued debt securities, including equity accounted instruments, leading to their de-
recognition from the balance sheet.
‘Debt securities in issue’ Transferable securities evidencing indebtedness of the Barclays Group. These are liabilities of the Barclays Group
and include certificates of deposit and commercial paper.
‘Default grades’ The Barclays Group classifies ranges of default probabilities into a set of 21 intervals called default grades, in order to
distinguish differences in the PD risk.
‘Default fund contributions’ The contribution made by members of a Central Counterparty (CCP). All members are required to contribute
to this fund in advance of using a CCP. The default fund can be used by the CCP to cover losses incurred by the CCP where losses are
greater than the margins provided by a defaulting member.
‘Delinquency’ See ‘Arrears’.
| | | | | | | | | |
| Climate and sustainability report | | | | | | | Barclays PLC 2023 Annual Report on Form 20-F | |
| |
| | | | | | | | | |
|
‘Derivatives netting’ Adjustments applied across asset and liability marked to market derivative positions pursuant to legally enforceable
bilateral netting agreements and eligible cash collateral received in derivative transactions that meet the requirements of BCBS 270 (Basel III
leverage ratio framework and disclosure requirements).
‘Diversification effect’ Reflects the fact that the risk of a diversified portfolio is smaller than the sum of the risks of its constituent parts. It is
measured as the sum of the individual asset class Daily Value at Risk (DVaR) estimates less the total DVaR.
‘Dodd-Frank Act (DFA)’ The US Dodd-Frank Wall Street Reform and Consumer Protection Act of 2010, as amended.
‘Domestic Liquidity Sub-Group Arrangement (DoLSub)’ An intra-group capital and liquidity support agreement that secures certain
regulatory permissions authorised by the Prudential Regulation Authority (PRA).
‘Economic Value of Equity (EVE)’ A measure of the potential change in value of expected future cash flows due to an adverse interest rate
movement, based on existing balance sheet run-off profile.
'Effective Expected Positive Exposure (EEPE)' The weighted average over time of effective expected exposure. The weights are the
proportion that an individual exposure represents of the entire exposure horizon time interval.
‘Effective interest rate (EIR)’ As defined in IFRS 9 Financial Instruments, effective interest rate is the rate that exactly discounts estimated
future cash payments or receipts through the expected life of the financial asset or financial liability to the gross carrying amount of a
financial asset or to the amortised cost of a financial liability.
‘Eligible liabilities’ Liabilities and capital instruments that are eligible to meet MREL that do not already qualify as own funds.
‘Encumbrance’ The use of assets to secure liabilities, such as by way of a lien or charge.
‘Enterprise Risk Management Framework (ERMF)’ The Barclays Group’s risk management responsibilities are laid out in the Enterprise
Risk Management Framework, which describes how Barclays identifies and manages risk. The framework identifies the principal risks faced
by the Barclays Group, sets out risk appetite requirements, sets out roles and responsibilities for risk management, and sets out risk
committee structure.
‘Equities’ Trading businesses encompassing Cash Equities, Equity Derivatives & Equity Financing, part of CIB.
‘Equity and stock index derivatives’ Derivatives whose value is derived from equity securities. This category includes equity and stock
index swaps and options (including warrants, which are equity options listed on an exchange). The Barclays Group also enters into fund-
linked derivatives, being swaps and options whose underlyings include mutual funds, hedge funds, indices and multi-asset portfolios. An
equity swap is an agreement between two parties to exchange periodic payments, based upon a notional principal amount, with one side
paying fixed or floating interest and the other side paying based on the actual return of the stock or stock index. An equity option provides
the buyer with the right, but not the obligation, either to purchase or sell a specified stock, basket of stocks or stock index at a specified price
or level on or before a specified date.
‘Equity risk’ In the context of trading book capital requirements, the risk of change in market value of an equity investment.
‘Equity structural hedge’ An interest rate hedge in place to reduce earnings volatility of the overnight / short-term equity investment and
to smooth the income over a medium/long term.
‘EU Risk Reduction Measure package’ A collection of amending Regulations and Directives that update core EU regulatory texts and which
came into force on 27 June 2019.
‘Euro Interbank Offered Rate (EURIBOR)’ A benchmark interest rate at which banks can borrow funds from other banks in the European
interbank market.
‘Europe’ Geographic segment comprising countries in which Barclays operates within the EU (excluding the UK), Northern Continental and
Eastern Europe.
‘European Banking Authority (EBA)’ The EBA is an independent EU Authority which works to ensure effective and consistent prudential
regulation and supervision across the European banking sector. Its overall objectives are to maintain financial stability in the EU and to
safeguard the integrity, stability, efficiency and orderly functioning of the banking sector.
‘European Securities and Markets Authority (ESMA)’ An independent European Supervisory Authority with the remit of enhancing the
protection of investors and reinforcing stable and well-functioning financial markets in the European Union.
‘Eurozone’ Represents the 20 European Union countries that have adopted the Euro as their common currency. The 20 countries are
Austria, Belgium, Croatia, Cyprus, Estonia, Finland, France, Germany, Greece, Ireland, Italy, Latvia, Lithuania, Luxembourg, Malta,
Netherlands, Portugal, Slovakia, Slovenia and Spain.
‘Expected Credit Losses (ECL)’ A present value measure of the credit losses expected to result from default events that may occur during
a specified period of time. ECLs must reflect the present value of cash shortfalls, and the unbiased and probability weighted assessment of a
range of outcomes.
‘Expected Losses’ A regulatory measure of anticipated losses for exposures captured under an Internal Ratings Based credit risk approach
for capital adequacy calculations. It is measured as the Barclays Group's modelled view of anticipated losses based on Probability of Default
(PD), Loss Given Default (LGD) and Exposure at Default (EAD), with a one-year time horizon.
’Expert lender models’ Models of risk measures that are used for parts of the portfolio where the risk drivers are specific to a particular
counterparty, but where there is insufficient data to support the construction of a statistical model. These models utilise the knowledge of
credit experts that have in depth experience of the specific customer type being modelled.
| | | | | | | | | |
| Climate and sustainability report | | | | | | | Barclays PLC 2023 Annual Report on Form 20-F | |
| |
| | | | | | | | | |
|
‘Exposure’ Generally refers to positions or actions taken by a bank, or consequences thereof, that may put a certain amount of a bank’s
resources at risk.
‘Exposure at Default (EAD)’ The estimation of the extent to which the Barclays Group may be exposed to a customer or counterparty in
the event of, and at the time of, that customer’s or counterparty’s default. At default, the customer may not have drawn the loan fully or
may already have repaid some of the principal, so that exposure may be less than the approved loan limit.
‘External Credit Assessment Institutions (ECAI)’ Institutions whose credit assessments may be used by credit institutions for the
determination of risk weight exposures according to CRR.
‘External ratings based approach / internal assessment approach (SEC-ERBA / IAA)’ This is a method to calculate risk-weighted
exposure amounts for securitisation positions. Under the SEC-ERBA approach, regulatory capital is assigned to securitisation tranches on
the basis of their external credit rating. The SEC-ERBA approach can also be used for unrated ABCP exposures where the institution has the
regulatory permission to use the Internal Assessment Approach (IAA) to assign a credit rating to the unrated ABCP exposure.
‘Exchange-traded notes (ETNs)’ Unsecured debt securities that track an underlying index of securities and trade on a stock exchange.
‘FVOCI’ Fair value through other comprehensive income.
‘Federal Housing Finance Agency (FHFA)’ An independent federal agency in the United States that oversees the secondary mortgage
market and regulates Fannie Mae and Freddie Mac, as well as 11 Federal Home Loan banks. The FHFA also sets the Housing Price Index
(HPI) in the United States.
‘Federal Reserve Board (FRB)’ The Board of Governors of the Federal Reserve System, commonly known as the Federal Reserve Board, is
responsible for – amongst other things – setting monetary policy in the US.
'FICC' Represents Macro (including rates and currency), Credit and Securitised products, part of CIB.
'Financial Policy Committee (FPC)' The Bank of England’s Financial Policy Committee identifies, monitors and takes action to remove or
reduce systemic risks with a view to protecting and enhancing the resilience of the UK financial system. The FPC also has a secondary
objective to support the economic policy of the UK Government.
‘Financial Conduct Authority (FCA)’ The statutory body responsible for conduct of business regulation and supervision of UK authorised
firms. The FCA also has responsibility for the prudential regulation of firms that do not fall within the PRA’s scope.
‘Financial Services Compensation Scheme (FSCS)’ The UK’s fund for compensation of customers of authorised financial services firms
that are unable to pay claims.
‘Financial collateral comprehensive method (FCCM)’ A counterparty credit risk exposure calculation approach which applies volatility
adjustments to the market value of exposure and collateral when calculating RWA values.
‘Financial Stability Board (FSB)’ An international body that monitors and makes recommendations about the global financial system. It
promotes international financial stability by coordinating national financial authorities and international standard-setting bodies as they work
toward developing strong regulatory, supervisory and other financial sector policies. It fosters a level playing field by encouraging coherent
implementation of these policies across sectors and jurisdictions.
‘Fitch’ A credit rating agency, including Fitch Ratings Inc. and its affiliated entities.
‘Forbearance Programmes’ Forbearance programmes assist customers in financial difficulty through agreements to accept less than
contractual amounts due where financial distress would otherwise prevent satisfactory repayment within the original terms and conditions
of the contract. These agreements may be initiated by the customer, Barclays or a third party and include approved debt counselling plans,
minimum due reductions, interest rate concessions and switches from capital and interest repayments to interest-only payments.
‘Foreclosures in Progress’ The process by which a bank initiates legal action against a customer with the intention of terminating a loan
agreement whereby the bank may repossess the property used as collateral for the loan subject to applicable law and recover amounts it is
owed.
‘Foreign exchange derivatives’ The Barclays Group’s principal exchange rate-related contracts are forward foreign exchange contracts,
currency swaps and currency options. Forward foreign exchange contracts are agreements to buy or sell a specified quantity of foreign
currency, usually on a specified future date at an agreed rate. Currency swaps generally involve the exchange, or notional exchange, of
equivalent amounts of two currencies and a commitment to exchange interest periodically until the principal amounts are re-exchanged on
a future date. Currency options provide the buyer with the right, but not the obligation, either to purchase or sell a fixed amount of a
currency at a specified exchange rate on or before a future date. As compensation for assuming the option risk, the option writer generally
receives a premium at the start of the option period.
‘Foreign exchange risk’ In the context of DVaR, the impact of changes in foreign exchange rates and volatilities.
'Foundation Internal Ratings Based (F-IRB)’ See ‘Internal Ratings Based (IRB)’.
‘Full time equivalent (FTE)’ Full time equivalent units are the on-job hours paid for employee services divided by the number of ordinary-
time hours normally paid for a full-time staff member when on the job (or contract employees where applicable).
‘Fully loaded’ When a measure is presented or described as being on a fully loaded basis, it is calculated without applying the transitional
provisions set out in Part Ten of CRR.
| | | | | | | | | |
| Climate and sustainability report | | | | | | | Barclays PLC 2023 Annual Report on Form 20-F | |
| |
| | | | | | | | | |
|
‘Funded credit protection’ A technique of credit risk mitigation where the reduction of the credit risk on the exposure of an institution
derives from the right of that institution, in the event of the default of the counterparty or on the occurrence of other specified credit events
relating to the counterparty, to liquidate, or to obtain transfer or appropriation of, or to retain certain assets or amounts, or to reduce the
amount of the exposure to, or to replace it with the amount of the difference between the amount of the exposure and the amount of a
claim on the institution.
‘Gains on acquisitions’ The amount by which an acquirer’s interest in the net fair value of the identifiable assets, liabilities and contingent
liabilities, recognised in a business combination, exceeds the cost of the combination.
‘General Data Protection Regulation (GDPR)’ GDPR (Regulation (EU) 2016/679) is a regulation intended to strengthen and unify data
protection for all individuals within the European Union. GDPR forms part of UK law pursuant to the European Union (Withdrawal) Act 2018,
as amended.
‘General market risk’ The risk of a price change in a financial instrument due to a change in the level of interest rates or owing to a broad
equity market movement unrelated to any specific attributes of individual securities.
‘Global Systemically Important Banks (G-SIBs or G-SIIs)’ Global financial institutions whose size, complexity and systemic
interconnectedness, mean that their distress or failure would cause significant disruption to the wider financial system and economic
activity. The Financial Stability Board and the Basel Committee on Banking Supervision publish a list of global systemically important banks.
‘G-SII additional leverage ratio buffer (G-SII ALRB)’ A macroprudential buffer that applies to G-SIBs and other major domestic UK banks
and building societies, including banks that are subject to ring-fencing requirements. The G-SII ALRB will be calibrated as 35% (on a phased
basis) of the combined buffers that apply to the bank.
‘G-SII Buffer’ Common Equity Tier 1 capital required to be held under CRD to ensure that G-SIBs build up surplus capital to compensate for
the systemic risk that such institutions represent to the financial system.
’Grandfathering’ In the context of capital resources, the phasing in of the application of instrument eligibility rules which allows CRR and
CRR II non-compliant capital instruments to be included in regulatory capital subject to certain thresholds which decrease over the
transitional period.
‘Gross charge-off rates’ Represents the balances charged-off to recoveries in the reporting period, expressed as a percentage of average
outstanding balances excluding balances in recoveries. Charge-off to recoveries generally occurs when the collections focus switches from
the collection of arrears to the recovery of the entire outstanding balance, and represents a fundamental change in the relationship
between the bank and the customer. This is a measure of the proportion of customers that have gone into default during the period.
‘Gross Domestic Product (GDP)’ Measures the total value of goods and services produced in a country within a specific time period.
‘Gross write-off rates’ Expressed as a percentage and represent balances written off in the reporting period divided by gross loans and
advances held at amortised cost at the balance sheet date.
‘Gross new lending’ New lending advanced to customers during the period.
‘Guarantee’ Unless otherwise described, an undertaking by a third party to pay a creditor should a debtor fail to do so. It is a form of credit
substitution.
‘Head Office’ Comprises head office central support, central treasury operations, Barclays Execution Services assets and legacy
businesses.
‘High-Net-Worth’ Businesses within Barclays UK and Barclays International that provide banking and other services to high-net worth
customers.
‘High-quality liquid assets (HQLA)’ HQLA comprise eligible and unencumbered cash or assets that can be converted into cash at little or
no loss of value in private markets, to meet liquidity needs arising from a liquidity stress scenario or event. Please refer to ‘Level 1 assets’ and
‘Level 2 assets’.
‘High Risk’ In retail banking, ‘High Risk’ is defined as the subset of up-to-date customers who, either through an event or observed
behaviour, exhibit potential financial difficulty. Where appropriate, these customers are proactively contacted to assess whether assistance
is required.
‘Home loan’ A loan to purchase a residential property. The property is then used as collateral to guarantee repayment of the loan. The
borrower gives the lender a lien against the property and the lender can foreclose on the property if the borrower does not repay the loan
per the agreed terms. Also known as a residential mortgage.
‘IHC’ or ‘US IHC’ Barclays US LLC, the intermediate holding company established by Barclays in July 2016, which holds most of Barclays’
subsidiaries and assets in the US.
'Internal Model Approach (IMA)’ In the context of RWAs, a method for calculating RWAs where the exposure amount has been derived via
the use of a PRA approved internal market risk model.
'Internal Model Method (IMM)’ In the context of RWAs, a method for calculating RWAs where the exposure amount has been derived via
the use of a PRA approved internal counterparty credit risk model.
‘Identified Impairment (II)’ Specific impairment allowances for financial assets, estimated individually.
‘IFRS’ International Financial Reporting Standards.
| | | | | | | | | |
| Climate and sustainability report | | | | | | | Barclays PLC 2023 Annual Report on Form 20-F | |
| |
| | | | | | | | | |
|
‘IFRS 9 transitional arrangements’ Following the application of IFRS 9 as of 1 January 2018, transitional arrangements under which Article
473a of CRR permits institutions to phase-in the impact on capital and leverage ratios of the impairment requirements under the new
accounting standard.
‘Impairment Allowances’ A provision held on the balance sheet as a result of the raising of a charge against profit for expected losses in the
lending book. An impairment allowance may either be identified or unidentified, and individual or collective.
‘Income’ Total income, unless otherwise specified.
‘Incremental Risk Charge (IRC)’ An estimate of the incremental risk arising from rating migrations and defaults for traded debt instruments
beyond what is already captured in specific market risk VaR for the non-correlation trading portfolio.
‘Independent Validation Unit (IVU)’ The function within Barclays responsible for independent review, challenge and approval of all models.
‘Individual liquidity guidance (ILG)’ Guidance given to a bank about the amount, quality and funding profile of liquidity resources that the
PRA has asked the bank to maintain.
‘Inflation risk’ In the context of DVaR, the impact of changes in inflation rates and volatilities on cash instruments and derivatives.
‘Insurance Risk’ The risk of the Barclays Group’s aggregate insurance premiums received from policyholders under a portfolio of insurance
contracts being inadequate to cover the claims arising from those policies.
‘Interchange’ Income paid to a credit card issuer for the clearing and settlement of a sale or cash advance transaction.
‘Interest-only home loans’ Under the terms of these loans, the customer makes payments of interest only for the entire term of the
mortgage, although customers may make early repayments of the principal within the terms of their agreement. The customer is
responsible for repaying the entire outstanding principal on maturity, which may require the sale of the mortgaged property.
‘Interest rate derivatives’ Derivatives linked to interest rates. This category includes interest rate swaps, collars, floors options and
swaptions. An interest rate swap is an agreement between two parties to exchange fixed rate and floating rate interest by means of periodic
payments based upon a notional principal amount and the interest rates defined in the contract. Certain agreements combine interest rate
and foreign currency swap transactions, which may or may not include the exchange of principal amounts. A basis swap is a form of interest
rate swap, in which both parties exchange interest payments based on floating rates, where the floating rates are based upon different
underlying reference indices. In a forward rate agreement, two parties agree a future settlement of the difference between an agreed rate
and a future interest rate, applied to a notional principal amount. The settlement, which generally occurs at the start of the contract period,
is the discounted present value of the payment that would otherwise be made at the end of that period.
‘Interest rate risk’ The risk of interest rate volatility adversely impacting the Barclays Group’s Net Interest Margin. In the context of the
calculation of market risk DVaR, measures the impact of changes in interest (swap) rates and volatilities on cash instruments and
derivatives.
‘Interest rate risk in the banking book (IRRBB)’ The risk that the Barclays Group is exposed to capital or income volatility because of a
mismatch between the interest rate exposures of its (non-traded) assets and liabilities.
‘Internal Assessment Approach (IAA)’ One of three types of calculation that a bank with permission to use the Internal Ratings Based (IRB)
approach may apply to securitisation exposures. It consists of mapping a bank's internal rating methodology for credit exposures to those
of an External Credit Assessment Institution (ECAI) to determine the appropriate risk weight based on the ratings based approach. Its
applicability is limited to ABCP programmes related to liquidity facilities and credit enhancement.
‘Internal Capital Adequacy Assessment Process (ICAAP)’ It describes how the Group identifies, manages and qualifies the risks to which it
is exposed, in pursuit of its business strategy. It assesses whether the quality and quantity of capital is available to absorb capital losses for
the risks the firm undertakes. The capital adequacy is assessed on a point of time basis and on a forward looking basis taking into account
baseline and stressed economic capital conditions.
‘Internal Ratings Based (IRB)’ An approach under the CRR framework that relies on the bank’s internal models to derive the risk weights.
The IRB approach is divided into two alternative applications, Advanced and Foundation:
•Advanced Internal Ratings Based (A-IRB): the bank uses its own estimates of Probability of Default (PD), Loss Given Default (LGD) and
credit conversion factor to model a given risk exposure.
•Foundation Internal Ratings Based (F-IRB): the bank applies its own PD as for A-IRB, but it uses standard parameters for the LGD and the
credit conversion factor. The Foundation IRB approach is specifically designed for wholesale credit exposures. Hence retail, equity,
securitisation positions and non-credit obligations asset exposures are treated under standardised or A-IRB.
‘Internal Ratings Based approach (SEC-IRBA)’ This is a method to calculate risk-weighted exposure amounts for securitisation positions.
Under this method, an institution must be able to model regulatory capital requirements for underlying exposures in the securitisation as if
these had not been securitised (‘KIRB’), subject to certain other inputs and criteria.
‘IPO’ Initial Public Offering.
‘IRB Roadmap’ Contains several EBA technical standards and sets of guidelines developed with the intent to reduce unwarranted variability
across firms in IRB Risk-Weighted Assets for Credit Risk. PRA required UK firms to implement these changes from 1 January 2022.
‘Investment Bank’ The Barclays Group’s investment bank which consists of origination led and returns focused Global Markets and
Investment Banking businesses, which forms part of the Corporate and Investment Bank segment of Barclays International.
| | | | | | | | | |
| Climate and sustainability report | | | | | | | Barclays PLC 2023 Annual Report on Form 20-F | |
| |
| | | | | | | | | |
|
‘Investment Banking Fees’ In the context of Investment Bank analysis of Total Income, fees generated from origination activity businesses
– including financial advisory, debt and equity underwriting.
‘Investment grade’ A debt security, treasury bill or similar instrument with a credit rating of AAA to BBB as measured by external credit
rating agencies.
‘ISDA Master Agreement’ The most commonly used master contract for OTC derivative transactions internationally. It is part of a
framework of documents, designed to enable OTC derivatives to be documented fully and flexibly. The framework consists of a master
agreement, a schedule, confirmations, definitions booklets, and a credit support annex. The ISDA Master Agreement is published by the
International Swaps and Derivatives Association (ISDA).
‘Key Risk Scenarios (KRS)’ Key Risk Scenarios are a summary of the extreme potential risk exposure for each key risk in each business and
function, including an assessment of the potential frequency of risk events, the average size of losses and three extreme scenarios. The Key
Risk Scenario assessments are a key input to the Advanced Measurement Approach (AMA) calculation of regulatory and economic capital
requirements.
‘Large exposure’ A large exposure is defined as the total exposure of a bank to a counterparty or group of connected clients, whether in the
banking book or trading book or both, which in aggregate equals or exceeds 10% of the bank's eligible capital.
‘Legal risk’ The risk of loss or imposition of penalties, damages or fines from the failure of the firm to meet applicable laws, rules and
regulations or contractual requirements or to assert or defend its intellectual property rights.
‘Lending’ In the context of Investment Bank analysis of Total Income, lending income includes Net Interest Income (NII), gains or losses on
loan sale activity, and risk management activity relating to the loan portfolio.
‘Letters of credit’ A letter typically used for the purposes of international trade guaranteeing that a debtor’s payment to a creditor will be
made on time and in full. In the event that the debtor is unable to make payment, the bank will be required to cover the full or remaining
amount of the purchase.
‘Level 1 assets’ High-quality liquid assets (HQLA) under the Basel Committee’s Liquidity Coverage Ratio (LCR), including cash, central bank
reserves and higher quality government securities.
‘Level 2 assets’ High-quality liquid assets (HQLA) under the Basel Committee’s Liquidity Coverage Ratio (LCR), comprising Level 2A assets,
including, e.g. lower quality government securities, Covered Bonds and corporate debt securities, and Level 2B assets, including, e.g. lower
rated corporate bonds, Residential Mortgage-Backed Securities and equities that meet certain conditions.
‘Lifetime expected credit losses’ An assessment of expected losses associated with default events that may occur during the life of an
exposure, reflecting the present value of cash shortfalls over the remaining expected life of the asset.
‘Lifetime Probability’ The likelihood of accounts entering default during the expected remaining life of the asset.
‘Liquidity Coverage Ratio (LCR)’ The ratio of the stock of high quality liquid assets (HQLA) to expected net cash outflows over the next 30
days. HQLA should be unencumbered, liquid in markets during a time of stress and, ideally, be central bank eligible. These include cash and
claims on central governments and central banks.
‘Liquidity Pool’ The Barclays Group liquidity pool comprises cash at central banks and highly liquid collateral specifically held by the Barclays
Group as a contingency to enable the bank to meet cash outflows in the event of stressed market conditions.
‘Liquidity Risk’ The risk that the Barclays Group is unable to meet its contractual or contingent obligations, or that it does not have the
appropriate amount, tenor and composition of funding and liquidity to support its assets.
‘Liquidity risk appetite (LRA)’ The level of liquidity risk that the Barclays Group chooses to take in pursuit of its business objectives and in
meeting its regulatory obligations.
‘Liquidity Risk Management Framework (the Liquidity Framework)’ The Liquidity Risk Management Framework, which is sanctioned by
the Board Risk Committee, incorporates liquidity policies, systems and controls that the Barclays Group has implemented to manage
liquidity risk within tolerances approved by the Board and regulatory agencies.
‘Litigation and conduct charges’ or ‘Litigation and conduct’ Litigation and conduct charges include regulatory fines, litigation settlements
and conduct-related customer redress.
‘Loan loss rate (LLR)’ Quoted in basis points and represents total impairment charges divided by gross loans and advances held at
amortised cost at the balance sheet date.
‘Loan to deposit ratio’ or ‘Loan: deposit ratio’ Loans and advances at amortised costs divided by deposits at amortised cost.
‘Loan to value (LTV) ratio’ Expresses the amount borrowed against an asset (i.e. a mortgage) as a percentage of the appraised value of the
asset. The ratios are used in determining the appropriate level of risk for the loan and are generally reported as an average for new
mortgages or an entire portfolio. Also see ‘Marked to market (MTM) LTV ratio’.
‘London Interbank Offered Rate (LIBOR)’ A benchmark interest rate at which banks can borrow funds from other banks in the London
interbank market, currently phased out.
‘Loss Given Default (LGD)’ The percentage of Exposure at Default (EAD) that will not be recovered following default. LGD comprises the
actual loss (the part that is not expected to be recovered), together with the economic costs associated with the recovery process.
| | | | | | | | | |
| Climate and sustainability report | | | | | | | Barclays PLC 2023 Annual Report on Form 20-F | |
| |
| | | | | | | | | |
|
‘Management VaR’ A measure of the potential loss of value arising from unfavourable market movements at a specific confidence level, if
current positions were to be held unchanged for a predefined period. Corporate and Investment Bank uses Management VaR with a two-
year equally weighted historical period, at a 95% confidence level, with a one day holding period.
‘Mandatory break clause’ In the context of counterparty credit risk, a contract clause that means a trade will be ended on a particular date.
‘Marked to market approach’ A counterparty credit risk exposure calculation approach which uses the current marked to market value of
derivative positions as well as a potential future exposure add-on to calculate an exposure to which a risk weight can be applied. This is also
known as the Current Exposure Method.
‘Marked to market (MTM) LTV ratio’ The loan amount as a percentage of the current value of the asset used to secure the loan. Also see
‘Balance weighted Loan to Value (LTV) ratio’ and ‘Valuation weighted Loan to Value (LTV) ratio’.
‘Market risk’ The risk of loss arising from potential adverse changes in the value of the Barclays Group’s assets and liabilities from
fluctuations in market variables including, but not limited to, interest rates, foreign exchange, equity prices, commodity prices, credit
spreads, implied volatilities and asset correlations.
‘Master netting agreement’ An agreement that provides for a single net settlement of all financial instruments and collateral covered by
the agreement in the event of the counterparty’s default, bankruptcy or insolvency, resulting in a reduced exposure.
‘Master trust securitisation programme’ A securitisation structure where a trust is set up for the purpose of acquiring a pool of
receivables. The trust issues multiple series of securities backed by these receivables.
‘Material Risk Takers (MRTs)’ Categories of staff whose professional activities have or are deemed to have a material impact on Barclays’
risk profile, as determined in accordance with the European Banking Authority regulatory technical standard on the identification of such
staff.
‘Maximum Distributable Amount (MDA)’ The MDA is a factor representing the available distributable profit of an institution whilst
remaining in excess of its Combined Buffer Requirement (CBR). CRD IV places restrictions on a bank’s dividend, AT1 securities coupon and
variable compensation decisions depending on its proximity to meeting the buffer.
‘Medium-Term Notes (MTNs)’ Corporate notes (or debt securities) continuously offered by a company to investors through a dealer.
Investors can choose from differing maturities, ranging from under 1 year to 30 years. They can be issued on a fixed or floating coupon basis
or with an exotic coupon; with a fixed maturity date (non-callable) or with embedded call or put options or early repayment triggers. MTNs
are most generally issued as senior, unsecured debt.
‘Methodology and policy’ In the context of the Capital Risk section of the Barclays PLC Annual Report (or equivalent section in quarterly or
half yearly results), the effect on RWAs of methodology changes driven by regulatory policy changes.
‘MiFID II’ Refers to either the Markets in Financial Instruments Directive 2014/65/EC and the Markets in Financial Instruments Regulation
600/2014 (as amended), which together are European Union laws that provide harmonised regulation for investment services across the
member states of the European Economic Area, or these rules and regulations as they form part of UK law pursuant to the European Union
(Withdrawal) Act 2018 (as amended), as applicable.
‘Minimum requirement for own funds and eligible liabilities (MREL)’ A European Union-wide requirement under the Bank Recovery and
Resolution Directive for all European banks and investment banks to hold a minimum level of equity and/or loss absorbing eligible liabilities to
ensure the operation of the bail-in tool to absorb losses and recapitalise an institution in resolution or these rules and regulations as they
form part of UK law pursuant to the European Union (Withdrawal) Act 2018 (as amended), as applicable. An institution’s MREL requirement
is set by its resolution authority. Amendments in the EU Risk Reduction Measure package are designed to align MREL and TLAC for EU G-
SIBs.
‘Model risk’ The risk of the potential adverse consequences from financial assessments or decisions based on incorrect or misused model
outputs and reports.
‘Model updates’ In the context of the Capital Risk section of the Barclays PLC Annual Report (or equivalent section in quarterly or half yearly
results), changes in RWAs caused by model implementation, changes in model scope or any changes required to address model
malfunctions.
‘Model validation’ Process through which models are independently challenged, tested and verified to prove that they have been built,
implemented and used correctly, and that they continue to be fit-for-purpose.
‘Modelled VaR’ In the context of RWAs, market risk calculated using Value at Risk models laid down by the CRR and supervised by the PRA.
‘Money market funds’ Investment funds typically invested in short-term debt securities.
‘Monoline derivatives’ Derivatives with a monoline insurer such as credit default swaps referencing the underlying exposures held.
‘Moody’s’ A credit rating agency, including Moody’s Investors Service, Inc. and its affiliated entities.
‘Mortgage Servicing Rights (MSR)’ A contractual agreement in which the right to service an existing mortgage is sold by the original lender
to another party that specialises in the various functions involved with servicing mortgages.
‘Multilateral development banks’ Financial institutions created for the purposes of development, where membership transcends national
boundaries.
‘National discretion’ Discretions in CRD given to EU member states to allow the local regulator additional powers in the application of
certain CRD rules in its jurisdiction.
| | | | | | | | | |
| Climate and sustainability report | | | | | | | Barclays PLC 2023 Annual Report on Form 20-F | |
| |
| | | | | | | | | |
|
‘Net asset value per share’ Calculated by dividing shareholders’ equity, excluding non-controlling interests and other equity instruments,
by the number of issued ordinary shares.
‘Net Interest Income (NII)’ The difference between interest income on assets and interest expense on liabilities.
‘Net Interest Margin (NIM)’ Annualised Net Interest Income (NII) divided by the sum of average customer assets.
‘Net investment income’ Changes in the fair value of financial instruments designated at fair value, dividend income and the net result on
disposal of available for sale assets.
‘Net Stable Funding Ratio (NSFR)’ The ratio of available stable funding to required stable funding over a one-year time horizon, assuming a
stressed scenario. The ratio is required to be over 100%. Available stable funding would include items such as equity capital, preferred stock
with a maturity of over one year, or liabilities with a maturity of over one year. The required amount of stable funding is calculated as the sum
of the value of the assets held and funded by the institution, multiplied by a specific required stable funding factor assigned to each
particular asset type, added to the amount of potential liquidity exposure multiplied by its associated required stable funding factor.
‘Net trading income’ Gains and losses arising from trading positions which are held at fair value, in respect of both market-making and
customer business, together with interest, dividends and funding costs relating to trading activities.
‘Net write-off rate’ Expressed as a percentage and represents balances written off in the reporting period less any post write-off
recoveries divided by gross loans and advances held at amortised cost at the balance sheet date.
‘Net written credit protection’ In the context of leverage exposure, the net notional value of credit derivatives protection sold and credit
derivatives protection bought.
‘New bookings’ The total of the original balance on accounts opened in the reporting period, including any applicable fees and charges
included in the loan amount.
‘Non-asset backed debt instruments’ Debt instruments not backed by collateral, including government bonds, US agency bonds,
corporate bonds, commercial paper, certificates of deposit, convertible bonds, corporate bonds and issued notes.
‘Non-Model Method (NMM)’ In the context of RWAs, a method for calculating RWAs where the exposure amount has been derived through
the use of CRR norms, as opposed to an internal model.
‘Non-Traded Market Risk’ The risk that the current or future exposure in the banking book (i.e. non-traded book) will impact the bank's
capital and/or earnings due to adverse movements in Interest or foreign exchange rates.
‘Non-Traded VaR’ Reflects the volatility in the value of the fair value through other comprehensive income (FVOCI) investments in the
liquidity pool which flow directly through capital via the FVOCI reserve. The underlying methodology to calculate non-traded VaR is similar to
Traded Management VaR, but the two measures are not directly comparable. The Non-Traded VaR represents the volatility to capital
driven by the FVOCI exposures. These exposures are in the banking book and do not meet the criteria for trading book treatment.
‘Notch’ A single unit of measurement in a credit rating scale.
‘Notional amount’ The nominal or face amount of a financial instrument, such as a loan or a derivative, that is used to calculate payments
made on that instrument.
‘Open Banking’ The Payment Services Directive (PSD2) and the Open API standards and data sharing remedy imposed by the UK
Competition and Markets Authority following its Retail Banking Market Investigation Order.
‘Operating leverage’ Operating expenses compared to total income less credit impairment charges and other provisions.
‘Operational risk’ The risk of loss to the Barclays Group from inadequate or failed processes or systems, human factors or due to external
events (e.g. fraud) where the root cause is not due to credit or market risks.
‘Operational Riskdata eXchange Association (ORX)’ The Operational Riskdata eXchange Association (ORX) is a not-for-profit industry
association dedicated to advancing the measurement and management of operational risk in the global financial services industry. Barclays
is a member of ORX.
‘Origination led’ Focus on high-margin, low-capital fee-based activities and related hedging opportunities.
‘O-SII Buffer’ Common Equity Tier 1 capital required to be held under CRD to ensure that Other Systemically Important Institutions (O-SIIs)
build up surplus capital to compensate for the systemic risk that such institutions represent to the financial system. As part of the
implementation of CRD V requirements in the UK, the Other Systemically Important Institutions (O-SII) Buffer replaced the CRD IV
Systemic Risk Buffer.
‘Other systemically important institutions (O-SII)’ Other systemically important institutions are institutions that are deemed to create
risk to financial stability due to their systemic importance.
‘Over-issuance of Securities’ Over-issuance of securities under Barclays Bank PLC’s US shelf registration statements on Form F-3 filed
with the US Securities and Exchange Commission in 2018 and 2019.
‘Over-the-counter (OTC) derivatives’ Derivative contracts that are traded (and privately negotiated) directly between two parties. They
offer flexibility because, unlike standardised exchange-traded products, they can be tailored to fit specific needs.
‘Overall capital requirement’ The overall capital requirement is the sum of capital required to meet the total of a Pillar 1 requirement, a
Pillar 2A requirement, a Global Systemically Important Institution (G-SII) buffer, a Capital Conservation Buffer (CCB) and a Countercyclical
Capital Buffer (CCyB).
| | | | | | | | | |
| Climate and sustainability report | | | | | | | Barclays PLC 2023 Annual Report on Form 20-F | |
| |
| | | | | | | | | |
|
‘Own credit’ The effect of changes in the Barclays Group’s own credit standing on the fair value of financial liabilities.
‘Owner occupied mortgage’ A mortgage where the intention of the customer was to occupy the property at origination.
‘Own funds’ The sum of Tier 1 and Tier 2 capital.
‘Own funds and eligible liabilities ratio’ A risk-based ratio representing the own funds and eligible liabilities of the institution expressed as a
percentage of total RWAs.
‘Past due items’ Refers to loans where the borrower has failed to make a payment when due under the terms of the loan contract.
‘Payment Protection Insurance (PPI) redress’ Provision for the settlement of PPI mis-selling claims and related claims management costs.
‘Pension Risk’ The risk of the Barclays Group’s earnings and capital being adversely impacted by the Barclays Group’s defined benefit
obligations increasing or the value of the assets backing these defined benefit obligations decreasing due to changes in both the level and
volatility of prices.
‘Performance costs’ The accounting charge recognised in the period for performance awards. For deferred incentives and long-term
incentives, the accounting charge is spread over the relevant periods in which the employee delivers service.
‘Personal Banking’ The business within the UK that offers retail solutions to help customers with their day-to-day banking needs.
‘Period end allocated tangible equity’ Allocated tangible equity is calculated as 13.5% (2022: 13.5%) of RWAs for each business, adjusted
for capital deductions, excluding goodwill and intangible assets, reflecting assumptions the Barclays Group uses for capital planning
purposes. Head Office allocated tangible equity represents the difference between the Barclays Group’s tangible shareholders’ equity and
the amounts allocated to businesses.
‘Period end tangible shareholder’s equity’ Shareholders' equity attributable to ordinary shareholders of the parent, adjusted for the
deduction of intangible assets and goodwill.
‘Pillar 1 requirements’ The minimum regulatory capital requirements to meet the sum of credit (including counterparty credit), market risk
and operational risk.
‘Pillar 2A requirements’ The additional regulatory capital requirement to meet risks not captured under Pillar 1 requirements. These
requirements are the outcome of the bank’s Internal Capital Adequacy Assessment Process (ICAAP) and the complementary supervisory
review and evaluation carried out by the PRA.
‘Post-Model Adjustment (PMA)’ In the context of Basel models, a PMA is a short-term increase in regulatory capital applied at portfolio
level to account for model input data deficiencies, inadequate model performance or changes to regulatory definitions (e.g. definition of
default) to ensure the model output is accurate, complete and appropriate.
‘Potential Future Exposure (PFE) on derivatives’ A regulatory calculation in respect of the Barclays Group’s potential future credit
exposure on both exchange traded and OTC derivatives, calculated by assigning a standardised percentage (based on the underlying risk
category and residual trade maturity) to the gross notional value of each contract.
‘PRA waivers’ PRA approvals that specifically give permission to the bank to either modify or waive existing rules. Waivers are specific to an
organisation and require applications being submitted to and approved by the PRA.
‘Primary securitisations’ The issuance of securities (bonds and commercial papers) for fund-raising.
‘Primary Stress Tests’ In the context of Traded Market Risk, Stress Testing provides an estimate of potentially significant future losses that
might arise from extreme market moves or scenarios. Primary Stress Tests apply stress moves to key liquidity risk factors for each of the
major trading asset classes.
‘Prime Services’ Involves financing of fixed income and equity positions using Repo and stock lending facilities. The Prime Services business
also provides brokerage facilitation services for hedge fund clients offering execution and clearance facilities for a variety of asset classes.
‘Principal’ In the context of a loan, the amount borrowed, or the part of the amount borrowed which remains unpaid (excluding interest).
‘Private equity investments’ Investments in equity securities in operating companies not quoted on a public exchange. Investment in
private equity often involves the investment of capital in private companies or the acquisition of a public company that results in the delisting
of public equity. Capital for private equity investment is raised by retail or institutional investors and used to fund investment strategies such
as leveraged buyouts, venture capital, growth capital, distressed investments and mezzanine capital.
‘Principal Risks’ The principal risks affecting the Barclays Group, as described in the Risk Review section of the Barclays PLC Annual Report.
‘Pro-cyclicality’ Movements in financial variables (including capital requirements) following natural fluctuations in the economic cycle,
where the subsequent impact on lending or other market behaviours acts as an amplification of the economic cycle by the financial sector.
‘Probability of Default (PD)’ The likelihood that a loan will not be repaid and will fall into default. PD may be calculated for each client who has
a loan (normally applicable to wholesale customers/clients) or for a portfolio of clients with similar attributes (normally applicable to retail
customers). To calculate PD, Barclays assesses the credit quality of borrowers and other counterparties and assigns them an internal risk
rating. Multiple rating methodologies may be used to inform the rating decision on individual large credits, such as internal and external
models, rating agency ratings, and for wholesale assets, market information such as credit spreads. For smaller credits, a single source may
suffice such as the result from an internal rating model.
‘Product structural hedge’ An interest rate hedge put in place to reduce earnings volatility on product balances with instant access (such as
non-interest bearing current accounts and managed rate deposits) and to smoothen the income over a medium/long term.
| | | | | | | | | |
| Climate and sustainability report | | | | | | | Barclays PLC 2023 Annual Report on Form 20-F | |
| |
| | | | | | | | | |
|
‘Profit before impairment’ Calculated by excluding credit impairment charges or releases from profit before tax.
‘Properties in Possession held as ‘Loans and Advances to Customers’’ Properties in the UK and Italy where the customer continues to
retain legal title but where the bank has enforced the possession order as part of the foreclosure process to allow for the disposal of the
asset or the court has ordered the auction of the property.
‘Properties in Possession held as ‘Other Real Estate Owned’’ Properties in South Africa where the bank has taken legal ownership of the
title as a result of purchase at an auction or similar and treated as ‘Other Real Estate Owned’ within other assets on the bank’s balance
sheet.
‘Proprietary trading’ When a bank, brokerage or other financial institution trades on its own account, at its own risk, rather than on behalf of
customers, so as to make a profit for itself.
‘Prudential Regulation Authority (PRA)’ The statutory body responsible for the prudential supervision of banks, building societies, insurers
and a small number of significant investment banks in the UK. The PRA is a subsidiary of the Bank of England.
‘Prudential Valuation Adjustment (PVA)’ A calculation which adjusts the accounting values of positions held on the balance sheet at fair
value to comply with regulatory valuation standards, which place greater emphasis on the inherent uncertainty around the value at which a
trading book position could be exited.
‘Public benchmark’ Unsecured medium-term notes issued in public syndicated transactions.
‘Qualifying central bank claims’ An amount calculated in line with the PRA policy statement allowing banks to exclude claims on the central
bank from the calculation of the leverage exposure measure, as long as these are matched by liabilities denominated in the same currency
and of identical or longer maturity. Prior to 1 January 2022, banks were only permitted to exclude claims on the central bank which were
matched by deposits (rather than liabilities).
‘Qualifying Revolving Retail Exposure (QRRE)’ In the context of the IRB approach to credit risk RWA calculations, an exposure meeting the
criteria set out in CRR Article 154.4. It includes most types of credit card exposure.
‘Rates’ In the context of Investment Bank income analysis, trading revenue relating to government bonds and interest rate derivatives.
‘Re-aging’ The returning of a delinquent account to up-to-date status without collecting the full arrears (principal, interest and fees).
‘Real Estate Mortgage Investment Conduits (REMICs)’ An entity that holds a fixed pool of mortgages and that is separated into multiple
classes of interests for issuance to investors.
‘Recovery book’ Represents the total amount of exposure which has been transferred to recovery units who set and implement strategies
to recover the Group’s exposure.
‘Recovery book Impairment Coverage Ratio’ Impairment allowance held against recoveries balances expressed as a percentage of
balance in recoveries.
‘Recovery book proportion of outstanding balances’ Represents the amount of recoveries (gross month-end customer balances of all
accounts that have charged-off) as at the period end compared to total outstanding balances. The size of the recovery book would
ultimately have an impact on the overall impairment requirement on the portfolio. Balances in recovery will decrease if assets are written-
off, amounts are collected, or assets are sold to a third party (i.e. debt sale).
‘Regulatory capital’ The amount of capital that a bank holds to satisfy regulatory requirements.
‘Renegotiated loans’ Loans are generally renegotiated either as part of an ongoing customer relationship or in response to an adverse
change in the circumstances of the borrower. In the latter case, renegotiation can result in an extension of the due date of payment or
repayment plans under which the Barclays Group offers a concessionary rate of interest to genuinely distressed borrowers. This will result in
the asset continuing to be overdue, and individually impaired if the renegotiated payments of interest and principal will not recover the
original carrying amount of the asset. In other cases, renegotiation will lead to a new agreement, which is treated as a new loan.
‘Repurchase agreement (Repo)’ or ‘Reverse repurchase agreement (Reverse repo)’ Arrangements that allow counterparties to use
financial securities as collateral for an interest bearing cash loan. The borrower agrees to sell a security to the lender subject to a
commitment to repurchase the asset at a specified price on a given date. For the party selling the security (and agreeing to repurchase it in
the future), it is a Repurchase agreement or Repo; for the counterparty to the transaction (buying the security and agreeing to sell in the
future), it is a Reverse repurchase agreement or Reverse repo.
‘Reputation risk’ The risk that an action, transaction, investment or event will reduce trust in the Barclays Group’s integrity and
competence by clients, counterparties, investors, regulators, employees or the public.
‘Reserve Capital Instruments (RCIs)’ Hybrid issued capital securities which may be debt or equity accounted, depending on their terms.
‘Residential Mortgage-Backed Securities (RMBS)’ Securities that represent interests in a group of residential mortgages. Investors in
these securities have the right to cash received from future mortgage payments (interest and/or principal).
‘Residual maturity’ The remaining contractual term of a credit obligation associated with a credit exposure.
‘Restructured loans’ Comprises loans where, for economic or legal reasons related to the debtor’s financial difficulties, a concession has
been granted to the debtor that would not otherwise be considered. Where the concession results in the expected cash flows discounted at
the original effective interest rate being less than the loan’s carrying value, an impairment allowance will be raised.
| | | | | | | | | |
| Climate and sustainability report | | | | | | | Barclays PLC 2023 Annual Report on Form 20-F | |
| |
| | | | | | | | | |
|
‘Retail Loans’ Loans to individuals or small and medium sized enterprises rather than to financial institutions and larger businesses. It
includes both secured and unsecured loans such as mortgages and credit card balances, as well as loans to certain smaller business
customers, typically with exposures up to £3m or with a turnover of up to £5m.
‘Return on average Risk Weighted Assets (RWA)’ Statutory profit after tax as a proportion of average RWAs.
‘Return on average tangible shareholders’ equity (RoTE)’ (for Barclays Group) Annualised Group attributable profit, as a proportion of
average shareholders’ tangible equity.
‘Return on average tangible shareholders’ equity (RoTE)’ (for businesses) Annualised business attributable profit, as a proportion of that
business's average allocated tangible equity.
‘Risk appetite’ The level of risk that Barclays is prepared to accept whilst pursuing its business strategy, recognising a range of possible
outcomes as business plans are implemented.
‘Risk weighted assets (RWAs) / Risk weighted exposure amounts (RWEAs)’ A measure of a bank’s assets adjusted for their associated
risks. Risk weightings are established in accordance with the Basel rules as implemented by CRR and local regulators.
‘Risks not in VaR (RNIVS)’ Refers to all the key market risks which are not captured or not well captured within the VaR model framework.
‘RWA Flow / movements in RWAs’
Book size/Asset size
Credit risk and counterparty risk (including CVA)
This represents RWA movements driven by changes in the size and composition of underlying positions, measured using EAD values for
existing portfolios over the period. This includes, but is not exclusive to:
•new business and maturing loans
•changes in product mix and exposure growth for existing portfolios
•book size reductions owing to risk mitigation and write-offs.
Market risk
This represents RWA movements owing to the changes in risk level i.e. trading positions and volumes driven by business activity.
Book quality/Asset quality
Credit risk and counterparty risk (including CVA)
This represents RWA movements driven by changes in the underlying credit quality and recoverability of portfolios and reflected through
model calibrations or realignments where applicable. This includes, but is not exclusive to:
•PD migration and LGD changes driven by economic conditions
•ratings migration for standardised exposures
Market risk
This is the movement in RWAs owing to changing risk levels in the trading book caused by fluctuations in market conditions.
Model updates
Credit risk and counterparty risk (including CVA)
This is the movement in RWAs as a result of both internal and external model updates. This includes, but is not exclusive to:
•updates to existing model inputs driven by both internal and external review
•model enhancements to improve models performance
Market risk
This is the movement in RWAs reflecting change in model scope, changes to market data levels, volatilities, correlations, liquidity and ratings
used as input for the internal modelled RWA calculations.
Methodology and policy
Credit risk and counterparty risk (including CVA)
This is the movement in RWAs as a result of both internal and external methodology, policy and regulatory changes. This includes, but is not
exclusive to:
•updates to RWA calculation methodology, communicated by the regulator
•the implementation of credit risk mitigation to a wider scope of portfolios
Market risk
This is the movement in RWAs as a result of both internal and external methodology, policy and regulatory changes for market risk.
Acquisitions and disposals
This is the movement in RWAs as a result of the disposal or acquisition of business operations impacting the size of banking and trading
portfolios.
| | | | | | | | | |
| Climate and sustainability report | | | | | | | Barclays PLC 2023 Annual Report on Form 20-F | |
| |
| | | | | | | | | |
|
Foreign exchange movements
This is the movement in RWAs as a result of changes in the exchange rate between the functional currency of the Barclays business area or
portfolio and our presentational currency for consolidated reporting. It should be noted that foreign exchange movements shown in RWA
flow or movements in RWAs tables do not include the impact of foreign exchange for the counterparty credit risk or market risk RWAs.
Other
This is the movement in RWAs driven by items that cannot be reasonably assigned to the other driver categories. In relation to market risk
RWAs, this includes changes in measurement that are not driven by methodology, policy or model updates.
‘Sarbanes-Oxley requirements’ The Sarbanes-Oxley Act 2002 (SOX), which was introduced by the US Government to safeguard against
corporate governance scandals.
‘Second Lien’ Debt that is issued against the same collateral as higher lien debt but that is subordinate to such higher lien debt. In the case
of default, compensation for this debt will only be received after the first lien has been repaid and thus represents a riskier investment than
the first lien.
‘Secondary Stress Tests’ Secondary stress tests are used in measuring potential losses arising from illiquid market risks that cannot be
hedged or reduced within the time period covered in Primary Stress Tests.
‘Secured Overnight Financing Rate (SOFR)’ A broad measure of the cost of borrowing cash overnight collateralised by US Treasury
securities in the repurchase agreement (Repo) market.
‘Securities Financing Transactions (SFT)’ In the context of RWAs, any of the following transactions: a repurchase transaction, a securities
or commodities lending or borrowing transaction, or a margin lending transaction whereby cash collateral is received or paid in respect of
the transfer of a related asset.
‘Securities Financing Transactions adjustments’ In the context of leverage ratio, a regulatory add-on calculated as exposure less
collateral, taking into account master netting agreements.
‘Securities lending arrangements’ Arrangements whereby securities are legally transferred to a third party subject to an agreement to
return them at a future date. The counterparty generally provides collateral against non-performance in the form of cash or other assets.
‘Securitisation’ Typically, a process by which debt instruments, such as mortgage loans or credit card balances, are aggregated into a pool,
which is used to back new securities. A company sells these pools of assets to a special purpose vehicle (SPV) which then issues securities
backed by the assets. This allows the credit quality of the assets to be separated from the credit rating of the original borrower.
‘Set-off clauses’ In the context of Counterparty credit risk, contract clauses that allow Barclays to set off amounts owed to us by a
counterparty against amounts owed by us to the counterparty.
‘Settlement balances’ Receivables or payables recorded between the date (the trade date) a financial instrument (such as a bond) is sold,
purchased or otherwise closed out, and the date the asset is delivered by or to the entity (the settlement date) and cash is received or paid.
‘Settlement Netting’ Netting approach used in the calculation of the leverage exposure measure whereby firms may calculate their
exposure value of regular way purchases and sales awaiting settlement in accordance with Article 429g of CRR, as amended by CRR II.
‘Settlement risk’ The risk that settlement in a transfer system will not take place as expected, usually owing to a party defaulting on one or
more settlement obligations.
‘Significant Increase in Credit Risk (SICR)’ Barclays assesses when a significant increase in credit risk has occurred based on quantitative
and qualitative assessments.
‘Slotting’ Slotting is internal Barclays terminology for what is known as “Specialised Lending” in the IRB approach as described in CRR Article
147.8. A standard set of rules is required to be used in credit risk RWA calculations, based upon an assessment of factors such as the
financial strength of the counterparty. The requirements for the application of the Specialised Lending approach are detailed in CRR Article
153.5.
‘Small and Medium-Sized Enterprises (SME)’ An enterprise which employs fewer than 250 persons and which has an annual turnover
which does not exceed EUR 50 million, and / or an annual balance sheet total not exceeding EUR 43 million. Within the SME category, a small
enterprise is defined as an enterprise which employs fewer than 50 persons and whose annual turnover and/or annual balance sheet total
does not exceed EUR 10 million. This is defined in accordance with Commission Recommendation 2003/361/EC of 6 May 2003 concerning
the definition of micro, small and medium sized enterprises.
‘Software intangibles benefit’ A benefit introduced as part of the EU response package to the COVID-19 pandemic and subsequently
reversed as part of the UK implementation of CRR II from 1 January 2022. Since 1 January 2022, software assets are fully deducted from
CET 1 capital.
‘Sovereign exposure(s)’ Exposures to central governments, including holdings in government bonds and local government bonds.
‘Special purpose entity’ A subsidiary created by a parent company to isolate financial risk. Its legal status as a separate company makes its
obligations secure even if the parent company goes bankrupt.
‘Specific market risk’ A risk that is due to the individual nature of an asset and can potentially be diversified or the risk of a price change in an
investment due to factors related to the issuer or, in the case of a derivative, the issuer of the underlying investment.
‘Spread risk’ Measures the impact of changes to the swap spread, i.e. the difference between swap rates and government bond yields.
| | | | | | | | | |
| Climate and sustainability report | | | | | | | Barclays PLC 2023 Annual Report on Form 20-F | |
| |
| | | | | | | | | |
|
‘Stage 1’ This represents financial instruments where the credit risk of the financial instrument has not increased significantly since initial
recognition. Stage 1 financial instruments are required to recognise a 12 month expected credit loss allowance.
‘Stage 2’ This represents financial instruments where the credit risk of the financial instrument has increased significantly since initial
recognition. Stage 2 financial instruments are required to recognise a lifetime expected credit loss allowance.
‘Stage 3’ This represents financial instruments where the financial instrument is considered impaired. Stage 3 financial instruments are
required to recognise a lifetime expected credit loss allowance.
‘Standard & Poor’s’ A credit rating agency, including S&P Global Inc. and its affiliated entities.
'Standardised Approach for Counterparty Credit Risk (SA-CCR)' The approach for the calculation of Exposure at Default for derivative
and long-settlement transactions introduced in the UK under CRR II from 1 January 2022. This is a more risk sensitive approach that
replaces the Current Exposure Method (CEM) and Standardised Method (SM) applicable under CRR.
‘Standardised Approach (SEC-SA)’ This is a method to calculate risk-weighted exposure amounts for securitisation positions. Under this
method, an institution must be able to calculate regulatory capital requirements per standardised approach for underlying exposures in the
securitisation as if these had not been securitised (‘KSA’), subject to certain other inputs and criteria.
‘Standby facilities, credit lines and other commitments’ Agreements to lend to a customer in the future, subject to certain conditions.
Such commitments are either made for a fixed period, or have no specific maturity but are cancellable by the lender subject to notice
requirements.
‘Statutory’ Line items of income, expense, profit or loss, assets, liabilities or equity stated in accordance with the requirements of the UK
Companies Act 2006 and the requirements of IFRS.
‘Statutory return on average shareholders’ equity’ Statutory profit after tax attributable to ordinary shareholders as a proportion of
average shareholders’ equity.
‘STD’ / ‘Standardised Approach’ A method of calculating RWAs that relies on a mandatory framework set by the regulator to derive risk
weights based on counterparty type and a credit rating provided by an External Credit Assessment Institute.
‘Sterling Over Night Index Average (SONIA)’ Reflects bank and building societies’ wholesale overnight funding rates in the sterling
unsecured market administrated and calculated by the Bank of England.
‘Stress Testing’ A process which involves identifying possible future adverse events or changes in economic conditions that could have
unfavourable effects on the Barclays Group (either financial or non-financial), assessing the Barclays Group’s ability to withstand such
changes, and identifying management actions to mitigate the impact.
‘Stressed Value at Risk (SVaR)’ An estimate of the potential loss arising from a 12-month period of significant financial stress calibrated to
99% confidence level over a 10-day holding period.
‘Structural cost actions (SCA)’ Cost actions taken to improve future financial performance.
‘Structural FX’ Foreign currency positions taken to hedge against the adverse effect of exchange rates on capital ratios. Under Article
352(2) of the CRR the PRA may permit banks to exclude such Structural FX positions from the calculation of its market risk RWAs. On 15
December 2021 the PRA issued Barclays this permission, taking effect from 31 December 2021. Any long FX positions that are in excess of
what is required to hedge the adverse effects of exchange rates on the bank’s capital ratio are not in scope of this exemption and will
therefore be captured under the standardised market risk approach.
‘Structural hedge’ or ‘hedging’ An interest rate hedge in place to reduce earnings volatility and to smooth the income over a medium/long
term on positions that exist within the balance sheet and do not re-price in line with market rates. See also ‘Equity structural hedge’ and
‘Product structural hedge’.
‘Structural model of default’ A model based on the assumption that an obligor will default when its assets are insufficient to cover its
liabilities.
‘Structured credit’ Includes the legacy structured credit portfolio primarily comprising derivative exposures and financing exposures to
structured credit vehicles.
‘Structured entity’ An entity in which voting or similar rights are not the dominant factor in deciding control. Structured entities are
generally created to achieve a narrow and well defined objective with restrictions around their ongoing activities.
‘Structured finance or structured notes’ A structured note is an investment tool that pays a return linked to the value or level of a specified
asset or index and sometimes offers capital protection if the value declines. Structured notes can be linked to equities, interest rates, funds,
commodities and foreign currency.
‘Sub-prime’ Sub-prime is defined as loans to borrowers typically having weakened credit histories that include payment delinquencies and
potentially more severe problems such as court judgments and bankruptcies. They may also display reduced repayment capacity as
measured by credit scores, high debt-to-income ratios, or other criteria indicating heightened risk of default.
‘Subordinated liabilities’ Liabilities which, in the event of insolvency or liquidation of the issuer, are subordinated to the claims of depositors
and other creditors of the issuer.
‘Supranational bonds’ Bonds issued by an international organisation, where membership transcends national boundaries (e.g. the
European Union or World Trade Organisation).
‘Synthetic Securitisation Transactions’ Securitisation transactions effected through the use of derivatives.
| | | | | | | | | |
| Climate and sustainability report | | | | | | | Barclays PLC 2023 Annual Report on Form 20-F | |
| |
| | | | | | | | | |
|
‘Tangible Net Asset Value (TNAV)’ Shareholders’ equity excluding non-controlling interests adjusted for the deduction of intangible assets
and goodwill.
‘Tangible Net Asset Value per share’ Calculated by dividing shareholders’ equity, excluding non-controlling interests and other equity
instruments, less goodwill and intangible assets, by the number of issued ordinary shares.
‘Tangible shareholders’ equity’ Shareholders’ equity excluding non-controlling interests and other equity instruments adjusted for the
deduction of intangible assets and goodwill.
‘Term premium’ Additional interest required by investors to hold assets with a longer period to maturity.
‘The Fundamental Review of the Trading Book (FRTB)’ A comprehensive suite of capital rules developed by the Basel Committee on
Banking Supervision as part of Basel III and applicable to banks’ wholesale trading activities.
‘The Standardised Approach (TSA)’ An approach used to quantify required capital for operational risk. Under TSA, banks are required to
hold regulatory capital for operational risk equal to the annual average, calculated over a rolling three-year period, of the relevant income
indicator (across all business lines), multiplied by a supervisory defined percentage factor by business lines.
‘The three lines of defence’ The three lines of defence operating model enables Barclays to separate risk management activities between
those client facing areas of the Barclays Group and associated support functions responsible for identifying risk, operating within applicable
limits and escalating risk events (first line); colleagues in Risk and Compliance who establish the limits, rules and constraints under which the
first line operates and monitor their performance against those limits and constraints (second line); and, colleagues in Internal Audit who
provide assurance to the Board and Executive Management over the effectiveness of governance, risk management and control over risks
(third line). The Legal function does not sit in any of the three lines, but supports them all. The Legal function is, however, subject to
oversight from Risk and Compliance with respect to its own Operational and Compliance Risks, as well as with respect to the Legal Risk to
which Barclays is exposed.
‘Through-the-cycle’ A long-run average through a full economic cycle.
‘Tier 1 capital’ The sum of the Common Equity Tier 1 capital and Additional Tier 1 capital.
‘Tier 1 capital ratio’ The ratio which expresses Tier 1 capital as a percentage of RWAs under CRR.
‘Tier 2 (T2) capital’ A type of capital as defined in the CRR principally composed of capital instruments, subordinated loans and share
premium accounts where qualifying conditions have been met.
‘Tier 2 (T2) securities’ Securities that are treated as Tier 2 (T2) capital for the purposes of CRR.
‘Total balances on forbearance programmes coverage ratio’ Impairment allowance held against forbearance balances expressed as a
percentage of balance in forbearance.
‘Total capital ratio’ Total regulatory capital as a percentage of RWAs.
‘Total Loss Absorbing Capacity (TLAC)’ A standard published by the FSB which is applicable to G-SIBs and requires a G-SIB to hold a
prescriptive minimum level of instruments and liabilities that should be readily available for bail-in within resolution to absorb losses and
recapitalise the institution. See also ‘Minimum requirement for own funds and eligible liabilities (MREL)’.
‘Total outstanding balance’ In retail banking, total outstanding balance is defined as the gross month-end customer balances on all
accounts, including accounts charged off to recoveries.
‘Total return swap’ An instrument whereby the seller of protection receives the full return of the asset, including both the income and
change in the capital value of the asset. The buyer of the protection in return receives a predetermined amount.
‘Traded Market Risk’ The risk of a reduction to earnings or capital due to volatility of trading book positions.
‘Trading book’ All positions in financial instruments and commodities held by an institution either with trading intent, or in order to hedge
positions held with trading intent.
‘Traditional Securitisation Transactions’ Securitisation transactions in which an underlying pool of assets generates cash flows to service
payments to investors.
‘Transitional’ When a measure is presented or described as being on a transitional basis, it is calculated in accordance with the transitional
provisions set out in Part Ten of CRR.
‘Treasury and Capital Risk’ This comprises of Liquidity Risk, Capital Risk and Interest Rate Risk in the banking book.
‘Twelve month expected credit losses’ The portion of the lifetime ECL arising if default occurs within 12 months of the reporting date (or
shorter period if the expected life is less than 12 months), weighted by the probability of said default occurring.
‘Twelve month PD’ The likelihood of accounts entering default within 12 months of the reporting date.
‘Unencumbered’ Assets not used to secure liabilities or not otherwise pledged.
‘United Kingdom (UK)’ Geographic segment where Barclays operates comprising the UK. Also see ‘Europe’.
‘UK Bank Levy’ A levy that applies to UK banks, building societies and the UK operations of foreign banks. The levy is payable based on a
portion of the UK chargeable equity and liabilities of the bank on its balance sheet date.
| | | | | | | | | |
| Climate and sustainability report | | | | | | | Barclays PLC 2023 Annual Report on Form 20-F | |
| |
| | | | | | | | | |
|
‘UK leverage exposure’ Calculated as per the PRA rulebook, where the exposure calculation also includes the FPC’s recommendation to
allow banks to exclude claims on the central bank from the calculation of the leverage exposure measure, as long as these are matched by
liabilities denominated in the same currency and of identical or longer maturity. Prior to 1 January 2022, banks were only permitted to
exclude claims on the central bank which were matched by deposits (rather than liabilities).
‘UK leverage ratio’ As per the PRA rulebook, means a bank’s Tier 1 capital divided by its total exposure measure, with this ratio expressed as
a percentage. From 1 January 2022, UK banks are subject to a single UK leverage ratio requirement.
‘Unfunded credit protection’ A technique of credit risk mitigation where the reduction of the credit risk on the exposure of an institution
derives from the obligation of a third party to pay an amount in the event of the default of the borrower or the occurrence of other specified
credit events.
‘US Partner Portfolio’ Barclays co-branded credit card programmes with companies across various sectors including but not limited to
travel, entertainment and retail.
‘US Residential Mortgage-Backed Securities’ Securities that represent interests in a group of US residential mortgages.
‘Valuation weighted Loan to Value (LTV) ratio’ In the context of credit risk disclosures on secured home loans, a means of calculating
marked to market LTVs derived by comparing total outstanding balance and the value of total collateral we hold against these balances.
Valuation weighted Loan to Value ratio is calculated using the following formula: LTV = total outstandings in portfolio/total property values
of total outstandings in portfolio.
‘Value at Risk (VaR)’ A measure of the potential loss of value arising from unfavourable market movements at a specific confidence level
and within a specific timeframe.
‘Weighted off balance sheet commitments’ Regulatory add-ons to the leverage exposure measure based on credit conversion factors
used in the Standardised Approach to credit risk.
‘Wholesale loans’ or ‘wholesale lending’ Lending to larger businesses, financial institutions and sovereign entities.
‘WM&I’ The Wealth Management & Investments business, which was transferred from Barclays UK to CC&P on 1 May 2023.
‘Working Group on Sterling Risk-Free Reference Rates (RFRWG)’ A group mandated with catalysing a broad-based transition to using
‘Sterling Overnight Index Average (SONIA)’ as the primary sterling interest rate benchmark in bond, loan and derivatives markets.
‘Write-off (gross)’ The point where it is determined that an asset is irrecoverable, or it is no longer considered economically viable to try to
recover the asset or it is deemed immaterial or full and final settlement is reached and the shortfall written off. In the event of write-off, the
customer balance is removed from the balance sheet and the impairment allowance held against the asset is released. Net write-offs
represent gross write-offs less post write-off recoveries.
‘Wrong-way risk’ Arises in a trading exposure when there is significant correlation between the underlying asset and the counterparty,
which in an event of default would lead to a significant mark to market loss. When assessing the credit exposure of a wrong-way trade,
analysts take into account the correlation between the counterparty and the underlying asset as part of the sanctioning process.
| | | | | | | | | |
| Climate and sustainability report | | | | | | | Barclays PLC 2023 Annual Report on Form 20-F | |
| |
| | | | | | | | | |
|
EXHIBIT INDEX
| |
| |
| |
| Long Term Debt Instruments: Barclays PLC is not party to any single instrument relating to long-term debt pursuant to which a total amount of securities exceeding 10% of its total assets (on a consolidated basis) is authorised to be issued. Barclays PLC hereby agrees to furnish to the Securities and Exchange Commission (the “Commission”), upon its request, a copy of any instrument defining the rights of holders of its long-term debt or the rights of holders of the long-term debt of any of its subsidiaries for which consolidated or unconsolidated financial statements are required to be filed with the Commission. |
| |
| |
| |
| |
| |
| |
| |
| |
| |
| |
| |
| |
| |
| |
| |
| |
| |
| |
| |
| |
| |
| |
| |
| |
| |
| XBRL Taxonomy Extension Schema |
| XBRL Taxonomy Extension Schema Calculation Linkbase |
| XBRL Taxonomy Extension Schema Definition Linkbase |
| XBRL Taxonomy Extension Schema Label Linkbase |
| XBRL Taxonomy Extension Schema Presentation Linkbase |
Signatures
The registrant hereby certifies that it meets all of the requirements for filing on Form 20-F and that it has duly caused and authorised
the undersigned to sign this annual report on its behalf.
| | |
| |
| | |
| | |
| | Anna Cross, Group Finance Director |