UNITED STATES
SECURITIES AND EXCHANGE COMMISSION
Washington, D.C. 20549
FORM
(Mark One)
For the fiscal year ended
OR
For the transition period from ____ to ____.
Commission file number
(Exact name of registrant as specified in its charter)
(State or other jurisdiction of | (I.R.S. Employer |
( | |||||
(Address of principal | (Zip Code) | Registrant’s telephone number, |
Securities registered pursuant to Section 12(b) of the Act:
Title of each class |
| Trading symbol | Name of each exchange on which registered | |
Securities registered pursuant to Section 12(g) of the Act: None
Indicate by check mark if the registrant is a well-known seasoned issuer, as defined in Rule 405 of the Securities Act. Yes ☐
Indicate by check mark if the registrant is not required to file reports pursuant to Section 13 or Section 15(d) of the Act. Yes ☐
Indicate by check mark whether the registrant (1) has filed all reports required to be filed by Section 13 or 15 (d) of the Securities Exchange Act of 1934 during the preceding 12 months (or for such shorter period that the registrant was required to file such reports), and (2) has been subject to such filing requirements for the past 90 days.
Indicate by check mark whether the registrant has submitted electronically every Interactive Data File required to be submitted pursuant to Rule 405 of Regulation S-T (§232.405 of this chapter) during the preceding 12 months (or for such shorter period that the registrant was required to submit and post such files).
Indicate by check mark whether the registrant is a large accelerated filer, an accelerated filer, a non-accelerated filer, a smaller reporting company, or emerging growth company. See the definitions of “large accelerated filer,” “accelerated filer,” “smaller reporting company,” and “emerging growth company” in Rule 12b-2 of the Exchange Act.
Accelerated filer ☐ | ||
Non-accelerated filer ☐ | Smaller reporting company | |
Emerging growth company |
If an emerging growth company, indicate by check mark if the registrant has elected not to use the extended transition period for complying with any new or revised financial accounting standards provided pursuant to Section 13(a) of the Exchange Act. ☐
Indicate by check mark whether the registrant has filed a report on and attestation to its management's assessment of the effectiveness of its internal control over financial reporting under Section 404(b) of the Sarbanes-Oxley Act (15 U.S.C. 7262(b)) by the registered public accounting firm that prepared or issued its audit report.
If securities are registered pursuant to Section 12(b) of the Act, indicate by check mark whether the financial statements of the registrant included in the filing reflect the correction of an error to previously issued financial statements.
Indicate by check mark whether any of those error corrections are restatements that required a recovery analysis of incentive-based compensation received by any of the registrant’s executive officers during the relevant recovery period pursuant to §240.10D-1(b). ☐
Indicate by check mark whether the registrant is a shell company (as defined in Rule 12b-2 of the Exchange Act). Yes
As of June 30, 2023, the last business day of the Registrant’s most recently completed second fiscal quarter, the aggregate market value of the Registrant’s common stock held by non-affiliates of the registrant was $
As of February 29, 2024,
DOCUMENTS INCORPORATED BY REFERENCE
Portions of the information required by Part III of this Annual Report are incorporated by reference from the Registrant’s definitive Proxy Statement for the 2024 annual meeting of shareholders to be filed with Securities and Exchange Commission pursuant to Regulation 14A not later than 120 days after the end of the fiscal year covered by this Annual Report.
BANK FIRST CORPORATION
TABLE OF CONTENTS
2
In this Annual Report on Form 10-K (this “Annual Report”), references to “we,” “our,” “us,” “Bank First” or “the Company” refer to Bank First Corporation, a Wisconsin corporation, and our wholly-owned banking subsidiary, Bank First, N.A., a national banking association, unless otherwise indicated or the context otherwise requires. References to “Bank” refer to Bank First, N.A., our wholly-owned banking subsidiary.
Cautionary Note Regarding Forward-Looking Statements
Certain statements contained in this Annual Report are forward-looking statements within the meaning of Section 27A of the Securities Act of 1933, as amended (the “Securities Act”), and Section 21E of the Securities Exchange Act of 1934, as amended (the “Exchange Act”). These forward-looking statements include statements relating to our projected growth, anticipated future financial performance, financial condition, credit quality and management’s long-term performance goals, as well as statements relating to the anticipated effects on our business, financial condition and results of operations from expected developments or events, our business, growth and strategies. These statements, which are based on certain assumptions and estimates and describe our future plans, results, strategies and expectations, can generally be identified by the use of the words and phrases “may,” “will,” “should,” “could,” “would,” “goal,” “plan,” “potential,” “estimate,” “project,” “believe,” “intend,” “anticipate,” “expect,” “target,” “aim,” “predict,” “continue,” “seek,” “projection” and other variations of such words and phrases and similar expressions.
These forward-looking statements are not historical facts, and are based upon current expectations, estimates and projections about our industry, management’s beliefs and certain assumptions made by management, many of which, by their nature, are inherently uncertain and beyond our control. The inclusion of these forward-looking statements should not be regarded as a representation by us or any other person that such expectations, estimates and projections will be achieved. Accordingly, we caution you that any such forward-looking statements are not guarantees of future performance and are subject to risks, assumptions and uncertainties that are difficult to predict and that are beyond our control. Although we believe that the expectations reflected in these forward-looking statements are reasonable as of the date of this Annual Report, actual results may prove to be materially different from the results expressed or implied by the forward-looking statements. There are or will be important factors that could cause our actual results to differ materially from those indicated in these forward-looking statements, including, but not limited to, the following:
| ● | the impact of current and future economic and market conditions generally (including seasonality) and in the financial services industry, nationally and within our primary market areas (particularly Wisconsin), including the effects of inflationary pressures, changes in interest rates, slowdowns in economic growth, and the potential for high unemployment rates, as well as the financial stress on borrowers and changes to customer and client behavior (including the velocity and levels of deposit withdrawals and loan repayment) and credit risk as a result of the foregoing; |
| ● | the risks of changes in interest rates on the level and composition of deposits (as well as the cost of, and competition for, deposits), loan demand, liquidity and the values of loan collateral, securities and market fluctuations, and interest rate sensitive assets and liabilities; |
| ● | the risk that our cost of funding could increase in the event we are unable to continue to attract stable and cost-efficient deposits; |
| ● | prolonged periods of high inflation and their effects on our business, profitability, and our stock price; |
| ● | concentration of our loan portfolio in real estate loans and changes in the prices, values and sales volumes of commercial and residential real estate; |
| ● | weakness in the real estate market, including the secondary residential mortgage market, which can affect, among other things, the value of collateral securing mortgage loans, mortgage loan originations and delinquencies, profits on sales of mortgage loans, and the value of mortgage servicing rights; |
| ● | the concentration of our business within our geographic areas of operation in Wisconsin; |
| ● | governmental monetary and fiscal policies, including interest rate policies of the Board of Governors of the Federal Reserve, as well as legislative, tax and regulatory changes, including those that impact the money supply and inflation and the possibility that the U.S. could default on its debt obligations; |
3
| ● | the risk that a future economic downturn and contraction could have a material adverse effect on our capital, financial condition, credit quality, results of operations and future growth; |
| ● | the credit risks of lending activities, including our ability to estimate credit losses and the allowance for credit losses, as well as the effects of changes in the level of, and trends in, loan delinquencies and write-offs; |
| ● | the risk that our asset quality may deteriorate or that our allowance for credit losses may prove to be inadequate or may be negatively affected by credit risk exposures; |
| ● | disruptions to the credit and financial markets, either nationally or globally; |
| ● | increased competition in the banking and mortgage banking industry, nationally, regionally or locally, including competition from nontraditional banking institutions such as Fintechs; |
| ● | our ability to realize the expected benefits from our strategic initiatives or other operational and execution goals in the time period expected, which could negatively affect our future profitability; |
| ● | our ability to maintain our operating efficiency; |
| ● | failure to keep pace with technological change or difficulties when implementing new technologies; |
| ● | our ability to attract and maintain business banking relationships with well-qualified businesses, real estate developers and investors with proven track records in our market areas; |
| ● | our ability to attract sufficient loans that meet prudent credit standards, including in our commercial and industrial and owner-occupied commercial real estate loan categories; |
| ● | our ability to comply with applicable capital and liquidity requirements, including our ability to generate liquidity internally or raise capital on favorable terms, including continued access to the debt and equity capital markets; |
| ● | our inability to receive dividends from our bank subsidiary and to service debt, pay dividends to our common shareholders, repurchase our shares of common stock and satisfy obligations as they become due; |
| ● | restrictions or limitations on access to funds from historical and alternative sources of liquidity could adversely affect our overall liquidity, which could restrict our ability to make payments on our obligations and our ability to support asset growth and sustain our operations and the operations of the Bank; |
| ● | inability of our risk management framework to effectively mitigate credit risk, interest rate risk, liquidity risk, price risk, compliance risk, cybersecurity risk, operational risk, strategic risk and reputational risk, including by virtue of our relationships with third-party business partners and other service providers; |
| ● | our business relationships with, and reliance upon, third parties that have strategic partnerships with us or that provide key components of our business infrastructure, including the costs of services and products provided to us by third parties, and disruptions in service or financial difficulties with a third-party vendor or business relationship; |
| ● | our ability to oversee the performance of third-party service providers that provide material services to our business; |
| ● | our ability to maintain expenses in line with current projections; |
| ● | our dependence on our management team and our ability to motivate and retain our management team; |
| ● | our ability to attract and retain qualified employees; |
| ● | we may not be able to identify suitable bank and non-bank acquisition opportunities as part of our growth strategy and even if we are able to identify attractive acquisition opportunities, we may not be able to complete such transactions on favorable terms or realize the anticipated benefits from such acquisitions; |
| ● | the risk that the regulatory environment may not be conducive to, or may prohibit the consummation of, future mergers and/or business combinations, may increase the length of time and amount of resources required to consummate such transactions, and the potential to reduce anticipated benefits from such mergers or combinations; |
| ● | system failures, data security breaches, including as a result of cyberattacks, or failures to prevent breaches of our network security; |
4
| ● | data processing system failures and errors; |
| ● | fraudulent and negligent acts by our clients, employees or vendors; |
| ● | our financial reporting controls and procedures’ ability to prevent or detect all errors or fraud; |
| ● | our ability to identify and address potential cybersecurity risks, including data security breaches, credential stuffing, malware, “denial-of-service” attacks, “hacking” and identify theft, a failure of which could disrupt our business and result in the disclosure of and/or misuse or misappropriation of confidential or proprietary information, disruption or damage to our systems, increased costs, losses, or adverse effects to our reputation; |
| ● | our current and future information technology system enhancements and operational initiatives may not be successfully implemented, which could negatively impact our operations; |
| ● | we may be required to make substantial expenditures to keep pace with regulatory initiatives and the rapid technological changes in the financial services industry; |
| ● | fluctuations in the market value and its impact on our stock price and the securities held in our securities portfolio; |
| ● | the adequacy of our reserves and the appropriateness of our methodology for calculating such reserves; |
| ● | increased credit losses or impairment of goodwill and other intangibles; |
| ● | the makeup of our asset mix and investments; |
| ● | our focus on small and mid-sized businesses; |
| ● | the institution and outcome of litigation and other legal proceeding against us or to which we become subject; |
| ● | changes in our accounting standards; |
| ● | the impact of recent and future legislative and regulatory changes; |
| ● | examinations by our regulatory authorities; |
| ● | changes in the scope and cost of Federal Deposit Insurance Corporation (“FDIC”) insurance and other coverage; |
| ● | political instability, acts of God, or of war or terrorism, natural disasters, including in the Company’s footprint, health emergencies, epidemics or pandemics, or other catastrophic events that may affect general economic conditions; |
| ● | risks related to environmental, social and governance (“ESG”) strategies and initiatives, the scope and pace of which could alter Bank First’s reputation and shareholder, associate, customer and third-party affiliations; |
| ● | the impact of recent adverse developments in the banking industry, highlighted by high-profile bank failures, on customer confidence, liquidity and regulatory responses to these developments (including increases in the cost of our deposit insurance assessments and increased regulatory scrutiny), the Company's ability to effectively manage its liquidity risk and any growth plans, and the availability of capital and funding; and |
| ● | other factors and risks described under the “Risk Factors” and “Management’s Discussion and Analysis of Financial Condition and Results of Operations” sections herein. |
The foregoing factors should not be construed as exhaustive and should be read in conjunction with the sections entitled “Risk Factors” and “Management’s Discussion and Analysis of Financial Condition and Results of Operations” included in this Annual Report. If one or more events related to these or other risks or uncertainties materialize, or if our underlying assumptions prove to be incorrect, actual results may differ materially from our forward-looking statements. Accordingly, you should not place undue reliance on any such forward-looking statements. Any forward-looking statement speaks only as of the date of this Annual Report, and we do not undertake any obligation to publicly update or review any forward-looking statement, whether as a result of new information, future developments or otherwise, except as required by law. New risks and uncertainties may emerge from time to time, and it is not possible for us to predict their occurrence or how they will affect us.
5
PART I
ITEM 1. BUSINESS
General Overview
Bank First Corporation is a Wisconsin corporation that was organized in April 1982 to serve as the holding company for Bank First, N.A., a national banking association founded in 1894. The Bank is a wholly-owned subsidiary of the Company. The Company and the Bank are headquartered in Manitowoc, Wisconsin, and the Bank is a member of the Board of Governors of the Federal Reserve System (the “Federal Reserve”) and regulated by the Office of the Comptroller of the Currency (the “OCC”). The Bank has twenty-six (26) offices, including its headquarters, in Brown, Columbia, Dane, Fond du Lac, Jefferson, Manitowoc, Monroe, Outagamie, Ozaukee, Shawano, Sheboygan, Waupaca, Waushara, and Winnebago counties in the State of Wisconsin. We serve businesses, professionals and consumers with a wide variety of financial services, including retail and commercial banking. Some of the products that we offer include checking accounts, savings accounts, money market accounts, cash management accounts, certificates of deposit, commercial and industrial loans, commercial real estate loans, construction and development loans, residential mortgages, consumer loans, credit cards, online banking, telephone banking and mobile banking.
The Bank has three subsidiaries: Bank First Investments, Inc., TVG Holdings, Inc. (“TVG”) and BFC Title, LLC. Bank First Investments, Inc. is a Wisconsin corporation organized in 2011, and is wholly-owned by the Bank. Bank First Investments, Inc.’s purpose is to provide investment and safekeeping services to the Bank. TVG is a Wisconsin corporation organized in 2009. It is a wholly-owned subsidiary of the Bank, and its purpose is to hold the Bank’s 40% ownership interest in Ansay & Associates, LLC (“Ansay”). Ansay is one of the nation’s largest independent insurance providers, and the Bank’s minority ownership of Ansay allows the Bank to provide diversified services to our customers without the risk and expense of an in-house insurance department. BFC Title, LLC is a Wisconsin limited liability company organized in 2020. It is a wholly-owned subsidiary of the Bank, and its purpose is to hold the Bank’s 5.88% ownership interest in Generations Title, LLC, a Wisconsin title company.
As of December 31, 2023, we had total consolidated assets of $4.22 billion, total loans of $3.34 billion, total deposits of $3.43 billion and total stockholders’ equity of $619.8 million. The Bank employed approximately 379 full-time equivalent employees (“FTE”), and had an average assets-to-FTE ratio of approximately $10.7 million for the year ended December 31, 2023. For more information, see the Bank’s website at www.bankfirst.com.
Recent acquisition
Hometown Bancorp, Ltd.
On February 10, 2023, the Company completed a merger with Hometown Bancorp, Ltd. ("Hometown"), a bank holding company headquartered in Fond du Lac, Wisconsin, pursuant to the Agreement and Plan of Bank Merger, dated as of July 25, 2022, by and between the Company and Hometown, whereby Hometown merged with and into the Company, and Hometown Bank, Hometown's wholly-owned banking subsidiary, merged with and into the Bank. Hometown's principal activity was the ownership and operation of Hometown Bank, a state-chartered banking institution that operated ten (10) branches in Wisconsin at the time of closing. The merger consideration totaled approximately $130.5 million.
Pursuant to the terms of the merger agreement, Hometown shareholders could elect to receive either 0.3962 of a share of the Company's common stock or $29.16 in cash for each outstanding share of Hometown common stock, subject to a maximum of 30% cash consideration in total, and cash in lieu of any remaining fractional share. Company stock issued totaled 1,450,272 shares valued at approximately $115.1 million, with cash of $15.4 million comprising the remainder of merger consideration.
The Company accounts for these transactions under the acquisition method of accounting, and thus, the financial position and results of operations of acquired institutions prior to the consummation date are not included in the accompanying consolidated financial statements. The acquisition method of accounting requires assets purchased and liabilities assumed to be recorded at their respective fair values at the date of acquisition. The Company determines the fair value of core
6
deposit intangibles, securities, premises and equipment, loans, other assets and liabilities, deposits and borrowings with the assistance of third-party valuations, appraisals, and third-party advisors. The estimated fair values are subject to refinement for up to one year after deal consummation as additional information becomes available relative to the closing date fair values.
Strategic Plan
The Bank is a relationship-based community bank focused on providing innovative solutions that are value driven to the communities we serve. The Bank’s culture celebrates diversity, creativity, and responsiveness, with the highest ethical standards. Employees are supported and encouraged to develop their careers. They are empowered with the tools to be successful and are held accountable for the results they deliver to our customers and shareholders. We maintain a strong credit culture as a foundation of sound asset quality. The Bank’s vision is to sustain its independence by remaining a top-performing provider of financial services in Wisconsin. The Bank focuses on creating value for its customers and shareholders by forging strong relationships and offering personalized and innovative solutions. Bank First is focused on building a culture which encourages, supports and celebrates diversity and inclusion for our employees, customers and communities. This collaboration fuels a stronger foundation for innovation and connects us to our communities.
Our strategic priorities are organized around the CAMELS ratings, including Capital, Asset Quality, Management, Earnings, Liquidity, and Sensitivity to Market Risk. We have also added a sixth category to prioritize our strategic goals surrounding Information Technology. Under the heading of Capital, our priorities include (i) growing capital through strong earnings, and (ii) assessing and monitoring short and long-term capital goals. Under the heading of Asset Quality, our top priority is maintaining a strong credit culture. Under the heading of Management, our priorities are (i) to review and reassess our organizational structure, and (ii) to sustain and build upon employee engagement. Under the Earnings heading, our priorities include (i) growing and strengthening relationships, (ii) exploring and evaluating current and alternative revenue sources, and (iii) evaluating and pursuing prudent acquisitions. Under the Liquidity heading, our priorities are to (i) ensure that liquidity levels are adequate for anticipated needs, and (ii) maintain a relationship-centric customer portfolio. Under the heading of Sensitivity to Market Risk, our priorities include (i) minimizing optionality, and (ii) maintaining rate neutrality. Finally, under the heading of Information Technology, our strategic priorities include (i) advancing our digital strategy to match internal and external customer expectations, (ii) enhancing the flexibility in our core environment, (iii) monitoring the current cybersecurity environment, and (iii) training employees on cybersecurity risk and prudent responses.
Market Area
Bank First is a full-service community bank, offering business and retail products and services in communities throughout Wisconsin. Our branches are located in Brown, Jefferson, Manitowoc, Monroe, Outagamie, Ozaukee, Shawano, Sheboygan, Waupaca, and Winnebago counties. With the closing of the merger with Hometown on February 10, 2023, we also entered Columbia, Dane, Fond du Lac, and Waushara counties. Our main office is located at 402 N. 8th Street, Manitowoc, Wisconsin. Based on the deposit market share reports published by the FDIC on June 30, 2023, Bank First ranked in the top three of market share in six of the fourteen counties in which its branches are located.
The fourteen counties in which the Bank has offices have an estimated aggregate population of 1,894,606, based on 2020 U.S. Census data, and total deposits of approximately $60.4 billion as of June 30, 2023, according to the most recent data published by the FDIC.
Competition
The banking business is highly competitive, and we face competition in our market areas from many other local, regional, and national financial institutions. Competition among financial institutions is based on interest rates offered on deposit accounts, interest rates charged on loans, other credit and service charges relating to loans, the quality and scope of the services rendered, the convenience of banking facilities, and, in the case of loans to commercial borrowers, relative lending limits. We compete with commercial banks, credit unions, savings institutions, mortgage banking firms, consumer finance companies, securities brokerage firms, insurance companies, money market funds and other mutual funds, fintech companies, as well as regional and national financial institutions that operate offices in our market areas and elsewhere. The competing major commercial banks have greater resources that may provide them a competitive advantage by enabling
7
them to maintain numerous branch offices, mount extensive advertising campaigns and invest in new technologies. The increasingly competitive environment is the result of changes in regulation, changes in technology and product delivery systems, additional financial service providers, and the accelerating pace of consolidation among financial services providers.
The financial services industry could become even more competitive as a result of legislative, regulatory and technological changes and continued consolidation. Banks, securities firms and insurance companies can merge under the umbrella of a financial holding company, which can offer virtually any type of financial service, including banking, securities underwriting, insurance (both agency and underwriting) and merchant banking. Also, technology has lowered barriers to entry and made it possible for non-banks to offer products and services traditionally provided by banks, such as automatic transfer and automatic payment systems.
Some of our non-banking competitors have fewer regulatory constraints and may have lower cost structures. In addition, some of our competitors have assets, capital and lending limits greater than that of the Bank, have greater access to capital markets and offer a broader range of products and services than the Bank. These institutions may have the ability to finance wide-ranging advertising campaigns and may also be able to offer lower rates on loans and higher rates on deposits than we can offer. Some of these institutions offer services, such as international banking, which we do not directly offer, except for a limited suite of services such as international wires and currency exchange.
We compete with these institutions by focusing on our position as an independent, community bank and rely upon local promotional activities, personal relationships established by our officers, directors, and employees with our customers, and specialized services tailored to meet the needs of the communities served. We provide innovative products to our customers that are value-driven. We actively cultivate relationships with our customers that extend beyond a single loan to a full suite of products that serve the needs of our retail and commercial customers. Our goal is to develop long-standing connections with our customers and the communities that we serve. While our position varies by market, our management believes that it can compete effectively as a result of local market knowledge, local decision making, and awareness of customer needs.
Our Business
General
We emphasize a range of lending services, including commercial and residential real estate loans, construction and development loans, commercial and industrial loans, and consumer loans. Our customers are generally individuals, small to medium-sized businesses and professional firms that are located in or conduct a substantial portion of their business in our market areas. At December 31, 2023, we had total loans receivable of $3.34 billion, representing approximately 79.3% of our total assets. As of December 31, 2023, we had 26 nonaccrual loans totaling approximately $5.7 million, or 0.2% of total loans. For additional discussion related to nonperforming loans, see the “Management’s Discussion and Analysis of Financial Condition and Results of Operations” section as well as the notes to the consolidated financial statements.
Loan Approval
Certain credit risks are inherent in making loans. These include prepayment risks, risks resulting from uncertainties in the future value of collateral, risks resulting from changes in economic and industry conditions, and risks inherent in dealing with individual borrowers. We attempt to mitigate repayment risks by adhering to our comprehensive and robust internal credit policies and procedures. These policies and procedures include officer and customer lending limits, with approval process for larger loans, documentation examination, and follow-up procedures for any exceptions to credit policies. Our loan approval policies provide for various levels of officer lending authority. The Bank currently employs both a signature process through the line of business as well as credit administration and a committee process which involves the Bank’s board of directors each month. Both approvals and reviews of the credit actions are underwritten by an independent set of credit analysts who report to credit administration. For our loan commitments, a serial sign-off process is utilized up to $25,000,000, requiring multiple signatures for a loan approval. This process ensures that the necessary parties at all authority levels are aware of and approve the commitment. The Bank’s board of directors is involved in credits above this level after they have been through the serial sign-off process. We do not make any loans to any director, executive officer
8
of the Bank, or the related interests of each, unless the loan is approved by the full board of directors of the Bank and is on terms not more favorable than would be available to a person not affiliated with the Bank.
Credit Administration and Loan Review
Our loan review consists of both commercial and retail review where loan files are reviewed and risk ratings are validated. Both are fully outsourced to a firm that specializes in file review and risk rating. Our policy for reviewing commercial credit files consisted of selecting a percentage of specific files on an annual basis as defined in our loan review plan, and reviewing them for risk rating and policy compliance. Our goal is to review every commercial relationship of $500,000 or more at least once in a five-year period. Our retail review consists of selecting a percentage of specific files on an annual basis, and reviewing them for policy compliance. Results of completed loan reviews are disclosed in writing, along with management responses, to the Directors Loan Committee.
Lending Limits
Our lending activities are subject to a variety of lending limits imposed by federal law. In general, the Bank is subject to a base legal limit on loans to a single borrower equal to 15% of the Bank’s capital and unimpaired surplus, plus an additional 10 percent of the Bank’s capital and surplus, if the amount that exceeds the 15 percent general limit is fully secured by readily marketable collateral. This legal lending limit will increase or decrease as the Bank’s level of capital increases or decreases. In addition to the legal lending, management and the board of directors have established a more conservative, internal lending limit. The Bank’s legal and internal lending limits are a safety and soundness measure intended to prevent one person or a relatively small and economically related group of persons from borrowing an unduly large amount of the Bank’s funds. It is also intended to safeguard the Bank’s depositors by diversifying the risk of credit losses among a relatively large number of creditworthy borrowers engaged in various types of businesses. Based upon the capitalization of the Bank at December 31, 2023, the Bank’s base legal lending limit was $66.9 million and the Bank’s internal lending limit was $53.6 million. Our board of directors will adjust the internal lending limit as deemed necessary to continue to mitigate risk and serve the Bank’s clients. We are also able to sell participations in our larger loans to other financial institutions, which allows us to manage the risk involved in these loans and to meet the lending needs of our clients requiring extensions of credit in excess of these limits.
Real Estate Loans
The principal component of our loan portfolio is loans secured by real estate. Real estate loans are subject to the same general risks as other loans and are particularly sensitive to fluctuations in the value of real estate. Fluctuations in the value of real estate and rising interest rates, as well as other factors arising after a loan has been made, could negatively affect a borrower’s cash flow, creditworthiness, and ability to repay the loan. We obtain a security interest in real estate whenever possible, in addition to any other available collateral, in order to increase the likelihood of the ultimate repayment of the loan.
As of December 31, 2023, loans secured by real estate made up approximately $2.59 billion, or 77.4%, of our loan portfolio. These loans generally will fall into one of two categories:
| ● | Commercial Real Estate. Commercial real estate loans generally have terms of 10 years or less, although payments may be structured on a longer amortization basis. We evaluate each borrower on an individual basis and attempt to determine their business risks and credit profile. We attempt to reduce credit risk in the commercial real estate portfolio by emphasizing loans on owner-occupied industrial, office, and retail buildings where the loan-to-value ratio, established by independent appraisals, does not generally exceed 85% of cost or appraised value. We also generally require that a borrower’s cash flow exceed 110% of monthly debt service obligations. In order to ensure secondary sources of payment and liquidity to support a loan request, we typically review all of the personal financial statements of the principal owners and require their personal guaranties. Commercial real estate loans are generally viewed as having more risk of default than residential real estate loans. They are also typically larger than residential real estate loans and consumer loans and depend on cash flows from the owner’s business or the property to service the debt. Because our loan portfolio contains a number of commercial real estate loans with relatively large balances, the deterioration of one or a few of these loans could cause a significant increase in our levels of nonperforming assets. |
9
| As of December 31, 2023, commercial real estate loans made up approximately $1.70 billion or 50.8% of our loan portfolio. |
| ● | Residential Mortgage Loans and Home Equity Loans. We originate and hold short-term and long-term first mortgages and traditional second mortgage residential real estate loans. Generally, we limit the loan-to-value ratio on our residential real estate loans to 90%. We offer fixed and adjustable rate residential real estate loans with terms of up to 30 years. We also offer a variety of lot loan options to consumers to purchase the lot on which they intend build their home. We also offer traditional home equity loans and lines of credit. Our underwriting criteria for, and the risks associated with, home equity loans and lines of credit are generally the same as those for first mortgage loans. Home equity loans typically have terms of 20 years or less. We generally limit the extension of credit to 90% of the available equity of each property. As of December 31, 2023, residential mortgage loans and home equity loans made up approximately $888.6 million or 26.6% of our loan portfolio. |
Commercial and Industrial Loans
We have significant expertise in small to middle market commercial and industrial lending. Our success is the result of our product and market expertise, and our focus on delivering high-quality, customized and quick turnaround service for our clients due to our focus on maintaining an appropriate balance between prudent, disciplined underwriting, on the one hand, and flexibility in our decision making and responsiveness to our clients, on the other hand, which has allowed us to grow our commercial and industrial loan portfolio while maintaining strong asset quality. As of December 31, 2023, commercial and industrial loans made up approximately $487.9 million or 14.6% of our loan portfolio.
We provide a mix of variable and fixed rate commercial and industrial loans. The loans are typically made to small- and medium-sized businesses involved in professional services, accommodation and food services, health care, wholesale trade, financial institutions, manufacturing, distribution, retailing and non-profits. We extend commercial business loans for working capital, accounts receivable and inventory financing and other business purposes. Generally, short-term loans have maturities ranging from 3 months to 1 year, and “term loans” have maturities ranging from 3 to 20 years. Lines of credit are generally intended to finance current transactions and typically provide for periodic principal payments, with interest payable monthly. Term loans generally provide for floating and fixed interest rates, with monthly payments of both principal and interest.
Construction and Development Loans
We offer fixed and adjustable rate residential and commercial construction loan financing to builders and developers and to consumers who wish to build their own home. The term of construction and development loans generally is limited to 9 to 24 months, although payments may be structured on a longer amortization basis. Most loans will mature and require payment in full upon completion and either the sale of the property or refinance into a permanent loan. We believe that construction and development loans generally carry a higher degree of risk than long-term financing of stabilized, rented, and owner-occupied properties because repayment depends on the ultimate completion of the project and usually on the subsequent sale of the property. Specific risks include:
| ● | cost overruns; |
| ● | mismanaged construction; |
| ● | inferior or improper construction techniques; |
| ● | economic changes or downturns during construction; |
| ● | a downturn in the real estate market; |
| ● | rising interest rates which may prevent sale of the property; and |
| ● | failure to sell or stabilize completed projects in a timely manner. |
We attempt to reduce risk associated with construction and development loans by obtaining personal guaranties and by keeping the maximum loan-to-value ratio at or below 85% of the lesser of cost or appraised value, depending on the project type. Generally, we do not have interest reserves built into loan commitments but require periodic cash payments for interest
10
from the borrower’s cash flow. As of December 31, 2023, construction and development loans made up approximately $200.8 million or 6.0% of our loan portfolio.
Consumer Loans
We make a variety of loans to individuals for personal and household purposes, including secured and unsecured installment loans and revolving lines of credit. Consumer loans are underwritten based on the borrower’s income, current debt level, past credit history, and the availability and value of collateral. Consumer rates are both fixed and variable, with negotiable terms. Our installment loans typically amortize over periods up to seven years. Although we typically require monthly principal and interest payments on our loan products, we will offer consumer loans at interest only with a single maturity date when a specific source of repayment is available. Consumer loans are generally considered to have greater risk than first or second mortgages on real estate because they may be unsecured, or, if they are secured, the value of the collateral may be difficult to assess and more likely to decrease in value than real estate. As of December 31, 2023, consumer loans made up approximately $51.0 million or 1.5% of our loan portfolio.
Mortgage Banking Activities
Our mortgage banking operations include correspondent or secondary market lending, and in-house mortgage lending (included in residential mortgage and home equity loan totals above). We conduct secondary market lending through Fannie Mae, Federal Home Loan Bank of Chicago, U.S. Dept. of Agriculture, the Federal Housing Administration, and the Wisconsin Housing and Economic Development Authority. We also offer a number of in-house mortgage products, including adjustable rate mortgages at one, three, five, seven, ten, and fifteen years, and fixed rate mortgages at up to thirty years. We also offer an eleven-month construction loan, a construction to permanent loan, and a twelve-month bridge loan.
Deposit Products
We offer a full range of traditional deposit services through our branch network in our market areas that are typically available in most banks and savings institutions, including checking accounts, commercial accounts, savings accounts and other time deposits of various types, ranging from money market accounts to long-term certificates of deposit. Transaction accounts and time deposits are tailored to and offered at rates competitive to those offered in our primary market areas. We also offer retirement accounts and health savings accounts. Our customers include individuals, businesses, associations, organizations and governmental authorities. We believe that our branch infrastructure will assist us in obtaining deposits from local customers in the future. Our deposits are insured by the FDIC up to statutory limits.
Securities
We manage our securities portfolio and cash to maintain adequate liquidity and to ensure the safety and preservation of invested principal, with a secondary focus on yield and returns. Specific goals of our investment portfolio are as follows:
| ● | provide a ready source of balance sheet liquidity, ensuring adequate availability of funds to meet fluctuations in loan demand, deposit balances and other changes in balance sheet volumes and composition; |
| ● | serve as a means for diversification of our assets with respect to credit quality, maturity and other attributes; |
| ● | serve as a tool for modifying our interest rate risk profile pursuant to our established policies; and |
| ● | provide collateral to secure municipal and business deposits. |
Our investment portfolio is comprised primarily of U.S. government securities, mortgage-backed securities backed by government-sponsored entities, and taxable and tax-exempt municipal securities.
Our investment policy is reviewed annually by our board of directors. Overall investment goals are established by our board, CEO, and members of our Asset Liability Management Committee (“ALCO”). Our board of directors has delegated the responsibility of monitoring our investment activities to our ALCO. Day-to-day activities pertaining to the securities portfolio
11
are conducted under the supervision of our CEO and CFO. We actively monitor our investments on an ongoing basis to identify any material changes in the securities. We also review our securities for potential credit deterioration at least quarterly.
Human Capital Resources
Our Company culture emphasizes our longstanding dedication to being respectful to others and having a workforce that is representative of the communities we serve. Diversity, equity and inclusion (“DEI”) are fundamental to our culture. We believe in attracting, retaining and promoting quality talent and recognize that diversity makes us stronger as a Company. Our talent acquisition teams partner with hiring managers in sourcing and presenting a diverse slate of qualified candidates to strengthen our organization.
We believe employees to be our greatest asset and that our future success depends on our ability to attract, retain and develop employees. Professional development is a key priority, which is facilitated through our many corporate development initiatives including extensive training programs, corporate mentoring, leadership programs, and educational reimbursement.
As part of our effort to attract and retain employees, we offer a broad range of benefits, including health, dental and vision insurance, life and disability insurance, cell phone and health club reimbursement, an employee assistance program, educational tuition reimbursement, annual clothing allowance, an employee referral program, 401(k) retirement plan, profit sharing, a flex spending cafeteria plan, and generous paid time off. We believe our compensation package and benefits are competitive with others in our industry. For additional information regarding our employee benefit plans, see “Note 17 – Employee Benefit Plans” to our consolidated financial statements included in this report.
Bank First currently has approximately 379 FTEs. As of December 31, 2023, approximately 73% of our employees self-identified as female and approximately 5% self-identified as people of color. Twenty-seven percent (27%) of our Board members and 46% of our Senior Management team identify as female. One of our strategic goals is to increase the diversity of our Board in the coming year. None of our employees are represented by any collective bargaining unit or is a party to a collective bargaining agreement. We consider our relationship with our employees to be good and have not experienced interruptions of operations due to labor disagreements.
General Corporate Information
Our principal executive offices are located at 402 N. 8th Street, Manitowoc, Wisconsin 54220, and our telephone number at that address is (920) 652-3100. Additional information can be found on our website: www.bankfirst.com. The information contained on our website is not incorporated in this document by reference.
Public Information
Persons interested in obtaining information on the Company may read and copy any materials that we file with the U.S. Securities and Exchange Commission ("SEC"). The Commission maintains an Internet site that contains reports, proxy and information statements, and other information regarding issuers that file electronically with the SEC at www.sec.gov. We make available, free of charge, on or through our website, www.bankfirst.com, our Annual Reports on Form 10-K, Quarterly Reports on Form 10-Q, Current Reports on Form 8-K, and other filings pursuant to Section 13(a) or 15(d) of the Securities Exchange Act of 1934, and amendments to such filings, as soon as reasonably practicable after each is electronically filed with, or furnished to, the SEC.
12
Supervision and Regulation
We are extensively regulated under federal and state law. The following is a brief summary that does not purport to be a complete description of all regulations that affect us or all aspects of those regulations. This discussion is qualified in its entirety by reference to the particular statutory and regulatory provisions described below and is not intended to be an exhaustive description of the statutes or regulations applicable to the Company’s and the Bank’s business. In addition, proposals to change the laws and regulations governing the banking industry are frequently raised at both the state and federal levels. The likelihood and timing of any changes in these laws and regulations, and the impact such changes may have on us and the Bank, are difficult to predict. In addition, bank regulatory agencies may issue enforcement actions, policy statements, interpretive letters and similar written guidance applicable to us or the Bank. Changes in applicable laws, regulations or regulatory guidance, or their interpretation by regulatory agencies or courts may have a material adverse effect on our and the Bank’s business, operations, and earnings. Supervision and regulation of banks, their holding companies and affiliates is intended primarily for the protection of depositors and customers, the Deposit Insurance Fund (“DIF”) of the FDIC, and the U.S. banking and financial system rather than holders of our capital stock.
Regulation of the Company
We are registered as a bank holding company with the Federal Reserve under the Bank Holding Company Act of 1956, as amended (the “BHC Act”). As such, we are subject to comprehensive supervision and regulation by the Federal Reserve and are subject to its regulatory reporting requirements. Federal law subjects bank holding companies, such as the Company, to particular restrictions on the types of activities in which they may engage, and to a range of supervisory requirements and activities, including regulatory enforcement actions for violations of laws and regulations. Violations of laws and regulations, or other unsafe and unsound practices, may result in regulatory agencies imposing fines or penalties, cease-and-desist orders, or taking other enforcement actions. Under certain circumstances, these agencies may enforce these remedies directly against officers, directors, employees and other parties participating in the affairs of a bank or bank holding company.
Activity Limitations. Bank holding companies are generally restricted to engaging in the business of banking, managing or controlling banks and certain other activities determined by the Federal Reserve to be closely related to banking. In addition, the Federal Reserve has the power to order a bank holding company or its subsidiaries to terminate any nonbanking activity or terminate its ownership or control of any nonbank subsidiary, when it has reasonable cause to believe that continuation of such activity or such ownership or control constitutes a serious risk to the financial safety, soundness, or stability of any bank subsidiary of that bank holding company.
Source of Strength Obligations. A bank holding company is required to act as a source of financial and managerial strength to its subsidiary bank and to maintain resources adequate to support its bank. The term “source of financial strength” means the ability of a company, such as us, that directly or indirectly owns or controls an insured depository institution, such as the Bank, to provide financial assistance to such insured depository institution in the event of financial distress. The appropriate federal banking agency for the depository institution (in the case of the Bank, this agency is the OCC) may require reports from us to assess our ability to serve as a source of strength and to enforce compliance with the source of strength requirements by requiring us to provide financial assistance to the Bank in the event of financial distress. If we were to enter bankruptcy or become subject to the orderly liquidation process established by the Dodd-Frank Act, any commitment by us to a federal bank regulatory agency to maintain the capital of the Bank would be assumed by the bankruptcy trustee or the FDIC, as appropriate, and entitled to a priority of payment.
13
Acquisitions. The BHC Act permits acquisitions of banks by bank holding companies, such that we and any other bank holding company, whether located in Wisconsin or elsewhere, may acquire a bank located in any other state, subject to certain deposit-percentage, age of bank charter requirements, and other restrictions. The BHC Act requires that a bank holding company obtain the prior approval of the Federal Reserve before (i) acquiring direct or indirect ownership or control of more than 5% of the voting shares of any additional bank or bank holding company, (ii) taking any action that causes an additional bank or bank holding company to become a subsidiary of the bank holding company, or (iii) merging or consolidating with any other bank holding company. The Federal Reserve may not approve any such transaction that would result in a monopoly or would be in furtherance of any combination or conspiracy to monopolize or attempt to monopolize the business of banking in any section of the United States, or the effect of which may be substantially to lessen competition or to tend to create a monopoly in any section of the country, or that in any other manner would be in restraint of trade, unless the anticompetitive effects of the proposed transaction are clearly outweighed by the public interest in meeting the convenience and needs of the community to be served. The Federal Reserve is also required to consider: (1) the financial and managerial resources of the companies involved, including pro forma capital ratios; (2) the risk to the stability of the United States banking or financial system; (3) the convenience and needs of the communities to be served, including performance under the Community Reinvestment Act ("CRA"); and (4) the effectiveness of the companies in combatting money laundering.
Change in Control. Federal law restricts the amount of voting stock of a bank holding company or a bank that a person may acquire without the prior approval of banking regulators. Under the Change in Bank Control Act and the regulations thereunder, a person or group must give advance notice to the Federal Reserve before acquiring control of any bank holding company, such as the Company, and the OCC before acquiring control of any national bank, such as the Bank. Upon receipt of such notice, the bank regulatory agencies may approve or disapprove the acquisition. The Change in Bank Control Act creates a rebuttable presumption of control if a person or group acquires the power to vote 10% or more of our outstanding common stock. The overall effect of such laws is to make it more difficult to acquire a bank holding company and a bank by tender offer or similar means than it might be to acquire control of another type of corporation. Consequently, shareholders of the Company may be less likely to benefit from the rapid increases in stock prices that may result from tender offers or similar efforts to acquire control of other companies. Investors should be aware of these requirements when acquiring shares of our stock.
Governance and Financial Reporting Obligations. We are required to comply with various corporate governance and financial reporting requirements under the Sarbanes-Oxley Act of 2002, as well as rules and regulations adopted by the SEC, the Public Company Accounting Oversight Board (“PCAOB”), and Nasdaq. In particular, we are required to include management and independent registered public accounting firm reports on internal controls as part of our Annual Report on Form 10- K in order to comply with Section 404 of the Sarbanes-Oxley Act. We have evaluated our controls, including compliance with the SEC rules on internal controls, and have and expect to continue to spend significant amounts of time and money on compliance with these rules. Our failure to comply with these internal control rules may materially adversely affect our reputation, ability to obtain the necessary certifications to financial statements, and the values of our securities. The assessments of our financial reporting controls as of December 31, 2023 are included in this report under “Item 9A. Controls and Procedures.”
Corporate Governance. The Dodd-Frank Act addresses many investor protections, corporate governance, and executive compensation matters that will affect most U.S. publicly traded companies. The Dodd-Frank Act (1) grants shareholders of U.S. publicly traded companies an advisory vote on executive compensation; (2) enhances independence requirements for Compensation Committee members; and (3) requires companies listed on national securities exchanges to adopt incentive-based compensation claw-back policies for executive officers.
14
Incentive Compensation. The Dodd-Frank Act required the banking agencies and the SEC to establish joint rules or guidelines for financial institutions with more than $1 billion in assets, such as us and the Bank, which prohibit incentive compensation arrangements that the agencies determine to encourage inappropriate risks by the institution. The banking agencies issued proposed rules in 2011 and previously issued guidance on sound incentive compensation policies. In 2016, the Federal Reserve and the OCC also proposed rules that would, depending upon the assets of the institution, directly regulate incentive compensation arrangements and would require enhanced oversight and recordkeeping. As of December 31, 2023, these rules have not been implemented. We and the Bank have undertaken efforts to ensure that our incentive compensation plans do not encourage inappropriate risks, consistent with three key principles— that incentive compensation arrangements should appropriately balance risk and financial rewards, be compatible with effective controls and risk management, and be supported by strong corporate governance.
Shareholder Say-On-Pay Votes. The Dodd-Frank Act requires public companies to take shareholders’ votes on proposals addressing compensation (known as say-on-pay), the frequency of a say-on-pay vote, and the golden parachutes available to executives in connection with change-in-control transactions. Public companies must give shareholders the opportunity to vote on the compensation at least every three years and the opportunity to vote on frequency at least every six years, indicating whether the say-on-pay vote should be held annually, biennially, or triennially. The say-on-pay, the say-on-parachute and the say-on-frequency votes are explicitly nonbinding and cannot override a decision of our board of directors.
Other Regulatory Matters. We and our subsidiaries are subject to oversight by the SEC, the Financial Industry Regulatory Authority, (“FINRA”), the PCAOB, Nasdaq and various state securities regulators. We and our subsidiaries have from time to time received requests for information from regulatory authorities in various states, including state attorneys general, securities regulators and other regulatory authorities, concerning our business practices. Such requests are considered incidental to the normal conduct of business.
Capital Requirements
The Company and Bank are required under federal law to maintain certain minimum capital levels based on ratios of capital to total assets and capital to risk-weighted assets. The required capital ratios are minimums, and the federal banking agencies may determine that a banking organization, based on its size, complexity or risk profile, must maintain a higher level of capital in order to operate in a safe and sound manner. Risks such as concentration of credit risks and the risks arising from non-traditional activities, as well as the institution’s exposure to a decline in the economic value of its capital due to changes in interest rates, and an institution’s ability to manage those risks are important factors that are to be taken into account by the federal banking agencies in assessing an institution’s overall capital adequacy. The following is a brief description of the relevant provisions of these capital rules and their potential impact on our capital levels.
The Company and Bank are subject to the following risk-based capital ratios: a common equity Tier 1 (“CET1”) risk-based capital ratio, a Tier 1 risk-based capital ratio, which includes CET1 and additional Tier 1 capital, and a total capital ratio, which includes Tier 1 and Tier 2 capital. CET1 is primarily comprised of the sum of common stock instruments and related surplus net of treasury stock, retained earnings, and certain qualifying minority interests, less certain adjustments and deductions, including with respect to goodwill, intangible assets, mortgage servicing assets and deferred tax assets subject to temporary timing differences. Additional Tier 1 capital is primarily comprised of noncumulative perpetual preferred stock, tier 1 minority interests and grandfathered trust preferred securities. Tier 2 capital consists of instruments disqualified from Tier 1 capital, including qualifying subordinated debt, other preferred stock and certain hybrid capital instruments, and a limited amount of loan loss reserves up to a maximum of 1.25% of risk-weighted assets, subject to certain eligibility criteria. The capital rules also define the risk-weights assigned to assets and off-balance sheet items to determine the risk-weighted asset components of the risk-based capital rules, including, for example, certain “high volatility” commercial real estate, past due assets, structured securities and equity holdings.
The leverage capital ratio, which serves as a minimum capital standard, is the ratio of Tier 1 capital to quarterly average assets net of goodwill, certain other intangible assets, and certain required deduction items. The required minimum leverage ratio for all banks is 4.0%.
15
In addition, the capital rules require a capital conservation buffer of CET1 of 2.5% above each of the minimum capital ratio requirements (CET1, Tier 1, and total risk-based capital), which is designed to absorb losses during periods of economic stress. These buffer requirements must be met for a bank to be able to pay dividends, engage in share buybacks or make discretionary bonus payments to executive management without restriction.
The Federal Deposit Insurance Corporation Improvement Act of 1991 (“FDICIA”), among other things, requires the federal bank regulatory agencies to take “prompt corrective action” regarding depository institutions that do not meet minimum capital requirements. FDICIA establishes five regulatory capital tiers: “well capitalized”, “adequately capitalized”, “undercapitalized”, “significantly undercapitalized”, and “critically undercapitalized”. A depository institution’s capital tier will depend upon how its capital levels compare to various relevant capital measures and certain other factors, as established by regulation. FDICIA generally prohibits a depository institution from making any capital distribution (including payment of a dividend) or paying any management fee to its holding company if the depository institution would thereafter be undercapitalized.
To be well-capitalized, the Company and Bank must maintain at least the following capital ratios:
| ● | 6.5% CET1 to risk-weighted assets; |
| ● | 8.0% Tier 1 capital to risk-weighted assets; |
| ● | 10.0% Total capital to risk-weighted assets; and |
| ● | 5.0% leverage ratio. |
Failure to be well-capitalized or to meet minimum capital requirements could result in certain mandatory and possible additional discretionary actions by regulators that, if undertaken, could have an adverse material effect on our operations or financial condition. For example, only a well-capitalized depository institution may accept brokered deposits without prior regulatory approval. Failure to be well-capitalized or to meet minimum capital requirements could also result in restrictions on the Bank’s ability to pay dividends or otherwise distribute capital or to receive regulatory approval of applications or other restrictions on its growth. The Bank was well capitalized at December 31, 2023, and brokered deposits are not restricted.
In 2023, the Company and Bank’s regulatory capital ratios were above the applicable well-capitalized standards and met the then-applicable capital conservation buffer. Based on current estimates, we believe that the Company and Bank will continue to exceed all applicable well-capitalized regulatory capital requirements and the capital conservation buffer in 2024.
The Economic Growth, Regulatory Relief, and Consumer Protection Act (the “Economic Growth Act”) signed into law in May 2018 scaled back certain requirements of the Dodd-Frank Act and provided other regulatory relief. Among the provisions of the Economic Growth Act was a requirement that the Federal Reserve raise the asset threshold for those bank holding companies subject to the Federal Reserve’s Small Bank Holding Company Policy Statement (“Policy Statement”) to $3 billion. As a result, as of the effective date of that change in 2018, the Company was no longer required to comply with the risk-based capital rules applicable to the Bank. The Company crossed above the $3 billion threshold during the third quarter of 2022 and is now required to adhere to these capital rules.
As a result of the Economic Growth Act, the federal banking agencies were also required to develop a “Community Bank Leverage Ratio” (the ratio of a bank’s Tier 1 capital to average total consolidated assets) for financial institutions with assets of less than $10 billion. A “qualifying community bank” that exceeds this ratio will be deemed to be in compliance with all other capital and leverage requirements, including the capital requirements to be considered “well capitalized” under prompt corrective action statutes. The federal banking agencies may consider a financial institutions risk profile when evaluation whether it qualifies as a community bank for purposes of the capital ratio requirement. The federal banking agencies set the minimum capital for the new Community Bank Leverage Ratio at 9%. The Bank does not intend to opt into the Community Bank Leverage Ratio Framework.
On December 21, 2018, federal banking agencies issued a joint final rule to revise their regulatory capital rules to (i) address the upcoming implementation of the “current expected credit losses” (“CECL”) accounting standard under GAAP; (ii) provide
16
an optional three-year phase-in period for the day-one adverse regulatory capital effects that banking organizations are expected to experience upon adopting CECL; and (iii) require the use of CECL in stress tests beginning with the 2020 capital planning and stress testing cycle for certain banking organizations. For more information regarding Accounting Standards Update No. 2016-13, which introduced CECL as the methodology to replace the current “incurred loss” methodology for financial assets measured at amortized cost, and changed the approaches for recognizing and recording credit losses on available-for-sale debt securities and purchased credit impaired financial assets, including the required implementation date for the Company, see the notes to the Company’s consolidated financial statements for the year ended December 31, 2023.
Payment of Dividends
We are a legal entity separate and distinct from the Bank and our other subsidiaries. Our primary source of cash, other than securities offerings, is dividends from the Bank. The prior approval of the OCC is required if the total of all dividends declared by a national bank (such as the Bank) in any calendar year will exceed the sum of such bank’s net profits for that year and its retained net profits for the preceding two calendar years, less any required transfers to surplus. Federal law also prohibits any national bank from paying dividends that would be greater than such bank’s undivided profits after deducting statutory bad debts in excess of such bank’s allowance for possible credit losses.
In addition, we and the Bank are subject to various general regulatory policies and requirements relating to the payment of dividends, including requirements to maintain adequate capital above regulatory minimums. The appropriate federal bank regulatory authority may prohibit the payment of dividends where it has determined that the payment of dividends would be an unsafe or unsound practice and to prohibit payment thereof. The OCC and the Federal Reserve have indicated that paying dividends that deplete a bank’s capital base to an inadequate level would be an unsound and unsafe banking practice. The OCC and the Federal Reserve have each indicated that depository institutions and their holding companies should generally pay dividends only out of current operating earnings.
Under a Federal Reserve policy adopted in 2009, the board of directors of a bank holding company must consider different factors to ensure that its dividend level is prudent relative to maintaining a strong financial position, and is not based on overly optimistic earnings scenarios, such as potential events that could affect its ability to pay, while still maintaining a strong financial position. As a general matter, the Federal Reserve has indicated that the board of directors of a bank holding company should consult with the Federal Reserve and eliminate, defer or significantly reduce the bank holding company’s dividends if:
| ● | its net income available to shareholders for the past four quarters, net of dividends previously paid during that period, is not sufficient to fully fund the dividends; |
| ● | its prospective rate of earnings retention is not consistent with its capital needs and overall current and prospective financial condition; or |
| ● | it will not meet, or is in danger of not meeting, its minimum regulatory capital adequacy ratios. |
Prior approval by the OCC is required if the total of all dividends declared by a national bank in any calendar year exceeds the bank’s profits for that year combined with its retained net profits for the preceding two calendar years.
Regulation of the Bank
As a national bank, our primary bank subsidiary, Bank First, N.A., is subject to comprehensive supervision and regulation by the OCC and is subject to its regulatory reporting requirements. The deposits of the Bank are insured by the FDIC up to applicable limits and, accordingly, the Bank is also subject to certain FDIC regulations and the FDIC has backup examination authority and some enforcement powers over the Bank. The Bank also is subject to certain Federal Reserve regulations.
In addition, as discussed in more detail below, the Bank and any other of our subsidiaries that offer consumer financial products and services are subject to regulation and potential supervision by the Consumer Financial Protection Bureau (“CFPB”). Authority to supervise and examine the Company and the Bank for compliance with federal consumer laws
17
remains largely with the Federal Reserve and the OCC, respectively. However, the CFPB may participate in examinations on a “sampling basis” and may refer potential enforcement actions against such institutions to their primary regulators. The CFPB also may participate in examinations of our other direct or indirect subsidiaries that offer consumer financial products or services. In addition, the Dodd-Frank Act permits states to adopt consumer protection laws and regulations that are stricter than those regulations promulgated by the CFPB, and state attorneys general are permitted to enforce certain federal consumer financial protection rules adopted by the CFPB. As the Company and the Bank each had less than $10 billion in consolidated assets in 2023, they are not subject to the routine supervision of the CFPB, but this may change in the future as the Company and the Bank grow.
Broadly, regulations applicable to the Bank include limitations on loans to a single borrower and to its directors, officers and employees; restrictions on the opening and closing of branch offices; the maintenance of required capital and liquidity ratios; the granting of credit under equal and fair conditions; the disclosure of the costs and terms of such credit; requirements to maintain reserves against deposits and loans; limitations on the types of investment that may be made by the Bank; and requirements governing risk management practices. The Bank is permitted under federal law to branch on a de novo basis across state lines where the laws of that state would permit a bank chartered by that state to open a de novo branch.
Transactions with Affiliates and Insiders. The Bank is subject to restrictions on extensions of credit and certain other transactions between the Bank and the Company or any nonbank affiliate. Generally, these covered transactions with either the Company or any affiliate are limited to 10% of the Bank’s capital and surplus, and all such transactions between the Bank and the Company and all of its nonbank affiliates combined are limited to 20% of the Bank’s capital and surplus. Loans and other extensions of credit from the Bank to the Company or any affiliate generally are required to be secured by eligible collateral in specified amounts. In addition, any transaction between the Bank and the Company or any affiliate are required to be on an arm’s length basis. Federal banking laws also place similar restrictions on certain extensions of credit by insured banks, such as the Bank, to their directors, executive officers and principal shareholders.
Reserves. Historically, Federal Reserve rules required depository institutions, such as the Bank, to maintain reserves against their transaction accounts, primarily interest bearing and noninterest-bearing checking accounts. The Federal Reserve announced that reserve requirement ratios were reduced to zero percent effective March 26, 2020. This action eliminated reserve requirements for all depository institutions.
FDIC Insurance Assessments and Depositor Preference. The Bank’s deposits are insured by the FDIC’s DIF up to the limits under applicable law, which currently are set at $250,000 per depositor, per insured bank, for each account ownership category. The Bank is subject to FDIC assessments for its deposit insurance. The FDIC calculates quarterly deposit insurance assessments based on an institution’s average total consolidated assets less its average tangible equity, and applies one of four risk categories determined by reference to its capital levels, supervisory ratings, and certain other factors. The assessment rate schedule can change from time to time, at the discretion of the FDIC, subject to certain limits.
Insurance of deposits may be terminated by the FDIC upon a finding that the institution has engaged in unsafe and unsound practices, is in an unsafe or unsound condition to continue operations, or has violated any applicable law, regulation, rule, order or condition imposed by a bank’s federal regulatory agency. In addition, the Federal Deposit Insurance Act provides that, in the event of the liquidation or other resolution of an insured depository institution, the claims of depositors of the institution, including the claims of the FDIC as subrogee of insured depositors, and certain claims for administrative expenses of the FDIC as a receiver, will have priority over other general unsecured claims against the institution, including those of the parent bank holding company.
In October of 2022, the FDIC adopted a final rule to increase the initial base deposit insurance assessment rate by 2 basis points, applicable to all insured depository institutions, which began with the first quarterly assessment period in 2023 and will remain in effect until the level of the DIF reserve ratios to insured deposits meets the FDIC's long-term goals.
Standards for Safety and Soundness. The Federal Deposit Insurance Act requires the federal bank regulatory agencies to prescribe, by regulation or guideline, operational and managerial standards for all insured depository institutions relating to: (1) internal controls; (2) information systems and audit systems; (3) loan documentation; (4) credit underwriting; (5) interest rate risk exposure; and (6) asset quality. The federal banking agencies have adopted regulations and Interagency Guidelines Establishing Standards for Safety and Soundness to implement these required standards. These guidelines set
18
forth the safety and soundness standards used to identify and address problems at insured depository institutions before capital becomes impaired. Under the regulations, if a regulator determines that a bank fails to meet any standards prescribed by the guidelines, the regulator may require the bank to submit an acceptable plan to achieve compliance, consistent with deadlines for the submission and review of such safety and soundness compliance plans.
Anti-Money Laundering. A continued focus of governmental policy relating to financial institutions in recent years has been combating money laundering and terrorist financing. The USA PATRIOT Act broadened the application of anti-money laundering regulations to apply to additional types of financial institutions such as broker-dealers, investment advisors and insurance companies, and strengthened the ability of the U.S. government to help prevent, detect and prosecute international money laundering and the financing of terrorism. The principal provisions of Title III of the USA PATRIOT Act require that regulated financial institutions: (i) establish an anti-money laundering program that includes training and audit components; (ii) comply with regulations regarding the verification of the identity of any person seeking to open an account; (iii) take additional required precautions with non-U.S. owned accounts; and (iv) perform certain verification and certification of money laundering risk for their foreign correspondent banking relationships. Failure of a financial institution to comply with the USA PATRIOT Act's requirements could have serious legal and reputational consequences for the institution. The Bank has augmented its systems and procedures to meet the requirements of these regulations and will continue to revise and update its policies, procedures and controls to reflect changes required by law.
FinCEN has adopted rules that require financial institutions to obtain beneficial ownership information with respect to legal entities with which such institutions conduct business, subject to certain exclusions and exemptions. Bank regulators are focusing their examinations on anti-money laundering compliance, and we continue to monitor and augment, where necessary, our anti-money laundering compliance programs.
Banking regulators will consider compliance with the Act's money laundering provisions in acting upon merger and acquisition proposals.
Bank regulators routinely examine institutions for compliance with these anti-money laundering obligations and recently have been active in imposing “cease-and-desist” and other regulatory orders and money penalty sanctions against institutions found to be in violation of these requirements. Sanctions for violations of the Act can be imposed in an amount equal to twice the sum involved in the violating transaction, up to $1 million. On January 1, 2021, Congress passed federal legislation that made sweeping changes to federal anti-money laundering laws, subject to pending implementation by regulatory rulemaking. Most recently, on June 30, 2021, FinCEN published the first set of “national AML priorities,” as required by the Bank Secrecy Act, which include, but are not limited to, cybercrime, terrorist financing, fraud, and drug/human trafficking. FinCEN is required to implement regulations to specify how covered financial institutions, such as the Company, should incorporate these national priorities into their AML programs. As of December 31, 2023, no such regulations have been proposed.
Economic Sanctions. The Office of Foreign Assets Control (“OFAC”) is responsible for helping to ensure that U.S. entities do not engage in transactions with certain prohibited parties, as defined by various Executive Orders and acts of Congress. OFAC publishes, and routinely updates, lists of names of persons and organizations suspected of aiding, harboring or engaging in terrorist acts, including the Specially Designated Nationals and Blocked Persons List. If we find a name on any transaction, account or wire transfer that is on an OFAC list, we must undertake certain specified activities, which could include blocking or freezing the account or transaction requested, and we must notify the appropriate authorities.
Concentrations in Lending. During 2006, the federal bank regulatory agencies released guidance on “Concentrations in Commercial Real Estate Lending” (the “Guidance”) and advised financial institutions of the risks posed by commercial real estate (“CRE”) lending concentrations. The Guidance requires that appropriate processes be in place to identify, monitor and control risks associated with real estate lending concentrations. Higher allowances for credit losses and capital levels may also be required. The Guidance is triggered when CRE loan concentrations exceed either:
| ● | Total reported loans for construction, land development, and other land of 100% or more of a bank’s total risk-based capital; or |
| ● | Total reported loans secured by multifamily and nonfarm nonresidential properties and loans for construction, land development, and other land of 300% or more of a bank’s total risk-based capital. |
19
The Guidance also applies when a bank has a sharp increase in CRE loans or has significant concentrations of CRE secured by a particular property type. See Item 1A. Risk Factors -- We are subject to lending concentration risk, which could cause our regulators to restrict our ability to grow – for a discussion of our risks regarding CRE exposure.
Community Reinvestment Act. The Bank is subject to the provisions of the CRA, which imposes a continuing and affirmative obligation, consistent with their safe and sound operation, to help meet the credit needs of entire communities where the Bank accepts deposits, including low- and moderate-income neighborhoods. The OCC’s assessment of the Bank’s CRA record is made available to the public. Further, a less than satisfactory CRA rating will slow, if not preclude, expansion of banking activities. Following the enactment of the Gramm-Leach-Bliley Act (“GLB”), CRA agreements with private parties must be disclosed and annual CRA reports must be made to a bank’s primary federal regulator. Federal CRA regulations require, among other things, that evidence of discrimination against applicants on a prohibited basis, and illegal or abusive lending practices be considered in the CRA evaluation. In May 2020, the OCC issued new final regulations meant to strengthen and modernize the CRA regulations, with an effective date of October 1, 2020. However, on December 14, 2021, the OCC issued a final rule rescinding its 2020 CRA Rule and replacing it with a rule based largely on the prior rules adopted jointly by the federal banking agencies in 1995. The Bank had a rating of “Outstanding” in its most recent CRA evaluation.
On May 5, 2022, the OCC, FRB, and FDIC issued a notice of proposed rulemaking to provide for a coordinated approach to modernize their respective CRA regulations, such that all banks will be subject to the same set of CRA rules. Key elements are expected to include (i) expanding access to credit, investment, and basic banking services in low- and moderate-income communities; (ii) updating CRA assessment areas by including activities associated with online and mobile banking, branchless banking, and hybrid models; and (iii) better tailoring CRA evaluations and data collection requirements by bank size and type. The final rule was released on October 24, 2023, and will take effect on April 1, 2024, with staggered compliance dates of January 1, 2026 and January 1, 2027.
Privacy and Data Security. The GLB generally prohibits disclosure of consumer information to non-affiliated third parties unless the consumer has been given the opportunity to object and has not objected to such disclosure. Financial institutions are further required to disclose their privacy policies to customers annually. Financial institutions, however, will be required to comply with state law if it is more protective of consumer privacy than the GLB. The GLB also directed federal regulators, including the FDIC and the OCC, to prescribe standards for the security of consumer information. The Bank is subject to such standards, as well as standards for notifying customers in the event of a security breach. Under federal law, the Bank must disclose its privacy policy to consumers, permit customers to opt out of having nonpublic customer information disclosed to third parties in certain circumstances, and allow customers to opt out of receiving marketing solicitations based on information about the customer received from another subsidiary. States may adopt more extensive privacy protections. We are similarly required to have an information security program to safeguard the confidentiality and security of customer information and to ensure proper disposal. Customers must be notified when unauthorized disclosure involves sensitive customer information that may be misused. On November 18, 2021, the federal banking agencies issued a new rule effective in 2022 that requires banks to notify their regulators within 36 hours of a “computer-security incident” that rises to the level of a “notification incident.” On July 26, 2023 the SEC adopted rules requiring registrants such as the Bank to disclose material cybersecurity incidents they experience and to disclose on an annual basis material information regarding their cybersecurity risk management, strategy and governance. See Item 1C for further discussion of the Bank’s processes for assessing, identifying and managing materials risks from cybersecurity threats.
Furthermore, the federal banking regulators regularly issue guidance regarding cybersecurity intended to enhance cyber risk management. A financial institution is expected to implement multiple lines of defense against cyberattacks and ensure that their risk management procedures address the risk posed by potential cyber threats. A financial institution is further expected to maintain procedures to effectively respond to a cyberattack and resume operations following any such attack. The Company has adopted and implemented an Information Security Program to comply with the regulatory cybersecurity guidance.
Consumer Regulation. Activities of the Bank are subject to a variety of statutes and regulations designed to protect consumers. These laws and regulations include, among numerous other things, provisions that:
| ● | limit the interest and other charges collected or contracted for by the Bank, including new rules respecting the terms of credit cards and of debit card overdrafts; |
20
| ● | govern the Bank’s disclosures of credit terms to consumer borrowers; |
| ● | require the Bank to provide information to enable the public and public officials to determine whether it is fulfilling its obligation to help meet the housing needs of the community it serves; |
| ● | prohibit the Bank from discriminating on the basis of race, creed or other prohibited factors when it makes decisions to extend credit; |
| ● | govern the manner in which the Bank may collect consumer debts; and |
| ● | prohibit unfair, deceptive or abusive acts or practices in the provision of consumer financial products and services. |
Mortgage Regulation. The CFPB adopted a rule that implements the ability-to-repay and qualified mortgage provisions of the Dodd-Frank Act (the “ATR/QM rule”), which requires lenders to consider, among other things, income, employment status, assets, payment amounts, and credit history before approving a mortgage, and provides a compliance “safe harbor” for lenders that issue certain “qualified mortgages.” The ATR/QM rule defines a “qualified mortgage” to have certain specified characteristics, and generally prohibit loans with negative amortization, interest-only payments, balloon payments, or terms exceeding 30 years from being qualified mortgages. The rule also establishes general underwriting criteria for qualified mortgages, including that monthly payments be calculated based on the highest payment that will apply in the first five years of the loan and that the borrower has a total debt-to-income ratio that is less than or equal to 43%. While “qualified mortgages” will generally be afforded safe harbor status, a rebuttable presumption of compliance with the ability-to-repay requirements will attach to “qualified mortgages” that are “higher priced mortgages” (which are generally subprime loans). In addition, the securitizer of asset-backed securities must retain not less than 5 percent of the credit risk of the assets collateralizing the asset-backed securities, unless subject to an exemption for asset-backed securities that are collateralized exclusively by residential mortgages that qualify as “qualified residential mortgages.”
The CFPB has also issued rules to implement requirements of the Dodd-Frank Act pertaining to mortgage loan origination (including with respect to loan originator compensation and loan originator qualifications) as well as integrated mortgage disclosure rules. In addition, the CFPB has issued rules that require servicers to comply with new standards and practices with regard to: error correction; information disclosure; force-placement of insurance; information management policies and procedures; requiring information about mortgage loss mitigation options be provided to delinquent borrowers; providing delinquent borrowers access to servicer personnel with continuity of contact about the borrower’s mortgage loan account; and evaluating borrowers’ applications for available loss mitigation options. These rules also address initial rate adjustment notices for adjustable-rate mortgages (ARMs), periodic statements for residential mortgage loans, and prompt crediting of mortgage payments and response to requests for payoff amounts.
In 2020, the CARES Act granted certain forbearance rights and protection against foreclosure to borrowers with a "federally backed mortgage loan," including certain first or subordinate lien loans designed principally for the occupancy of one to four families. These consumer protections under the CARES Act continued during the COVID 19 pandemic emergency, and while most of these protections expired in 2022, on January 18, 2023, in its revised Mortgage Servicing Examination Procedures, the CFPB stated it expected servicers to continue to utilize these safeguards, regardless of their expiration.
Non-Discrimination Policies. The Bank is also subject to, among other things, the provisions of the Equal Credit Opportunity Act (“ECOA”) and the Fair Housing Act (“FHA”), both of which prohibit discrimination based on race or color, religion, national origin, sex, and familial status in any aspect of a consumer or commercial credit or residential real estate transaction. The Department of Justice (“DOJ”), and the federal bank regulatory agencies have issued an Interagency Policy Statement on Discrimination in Lending that provides guidance to financial institutions in determining whether discrimination exists, how the agencies will respond to lending discrimination, and what steps lenders might take to prevent discriminatory lending practices. The DOJ has increased its efforts to prosecute what it regards as violations of the ECOA and FHA.
LIBOR: On March 15, 2022, Congress enacted the Adjustable Interest Rate (LIBOR) Act (the “LIBOR Act”) to address references to LIBOR in contracts that (i) are governed by U.S. law; (ii) will not mature before June 30, 2023; and (iii) lack fallback provisions providing for a clearly defined and practicable replacement for LIBOR. On December 16, 2022, the FRB adopted a final rule to implement the LIBOR Act by identifying benchmark rates based on SOFR (Secured Overnight Financing
21
Rate) that replaced LIBOR in certain financial contracts after June 30, 2023. The final rule identifies replacement benchmark rates based on SOFR to replace overnight, one-month, three-month, six-month, and 12-month LIBOR in contracts subject to the LIBOR Act.
ITEM 1A. RISK FACTORS
In addition to the other information contained in this Form 10-K, you should carefully consider the risks described below, as well as the risk factors and uncertainties discussed in our other public filings with the SEC under the caption "Risk Factors" in evaluating us and our business and making or continuing an investment in our stock. Our operations and financial results are subject to various risks and uncertainties, including, but not limited, to the material risks described below. Many of these risks are beyond our control although efforts are made to manage those risks while simultaneously optimizing operational and financial results. The occurrence of any of the following risks, as well as risks of which we are currently unaware or currently deem immaterial, could materially and adversely affect our assets, business, cash flows, condition (financial or otherwise), liquidity, prospects, results of operations and the trading price of our common stock. It is impossible to predict or identify all such factors and, as a result, you should not consider the following factors to be a complete discussion of the risks, uncertainties and assumptions that could materially and adversely affect our assets, business, cash flows, condition (financial or otherwise), liquidity, prospects, results of operations and the trading price of our common stock.
In addition, certain statements in the following risk factors constitute forward-looking statements. Please refer to the section entitled “Cautionary Note Regarding Forward-Looking Statements” beginning on page 1 of this Annual Report on Form 10- K.
Risks related to our business
Difficult or volatile conditions in the national financial markets, and the U.S. economy generally, may adversely affect our lending activity or other businesses, as well as our financial condition.
We are operating in an uncertain economic environment. Our business and financial performance are vulnerable to weak economic conditions in the financial markets generally and specifically in the state of Wisconsin, the principal market in which we conduct business. A deterioration in economic conditions in the global and financial markets as well as our primary market areas caused by inflation, recession, pandemics, outbreaks of hostilities or other international or domestic occurrences, unemployment, plant or business closings or downsizing, changes in securities markets or other factors could result in the following consequences, any of which could materially and adversely affect our business: increased loan delinquencies; problem assets and foreclosures; significant write-downs of asset values; lower demand for our products and services; reduced low cost or noninterest-bearing deposits; intangible asset impairment; and collateral for loans made by us, especially real estate, may decline in value, in turn reducing our customers’ ability to repay outstanding loans, and reducing the value of assets and collateral associated with our existing loans. In addition, regulatory scrutiny of the industry has increased and could continue to increase, leading to increased regulation of the industry that could lead to a higher cost of compliance, limit our ability to pursue business opportunities and increase our exposure to litigation or fines.
Additionally, we conduct our banking operations primarily in Wisconsin. As of December 31, 2023, approximately 95.74% of our loans and approximately 97.81% of our deposits were made to borrowers or received from depositors who live and/or primarily conduct business in Wisconsin. Therefore, our success will depend in large part upon the general economic conditions in this area, which we cannot predict with certainty. This geographic concentration imposes risks from lack of geographic diversification, as adverse economic developments in Wisconsin, among other things, could affect the volume of loan originations, increase the level of nonperforming assets, increase the rate of foreclosure losses on loans and reduce the value of our loans and loan servicing portfolio. Any regional or local economic downturn that affects Wisconsin or existing or prospective borrowers or property values in such areas may affect us and our profitability more significantly and adversely than our competitors whose operations are less geographically concentrated.
Moreover, the financial markets and the global economy may also be adversely affected by the current or anticipated impact of military conflict, including the current conflicts between Russia and Ukraine and between Israel and Hamas, which are
22
increasing volatility in commodity and energy prices, creating supply chain issues and causing instability in financial markets. Sanctions imposed by the United States and other countries in response to such conflict could further adversely impact the financial markets and the global economy, and any economic countermeasures by the affected countries or others could exacerbate market and economic instability.
Changes in interest rates may have an adverse effect on our net interest income.
Net interest income, which is the difference between the interest income that we earn on interest-earning assets and the interest expense that we pay on interest-bearing liabilities, is a major component of our income and our primary source of revenue from our operations. Narrowing of interest rate spreads could adversely affect our earnings and financial condition. We cannot control or predict with certainty changes in interest rates. Regional and local economic conditions, competitive pressures, and the policies of regulatory authorities, including monetary policies of the Federal Reserve Board (“FRB”), affect interest income and interest expense.
Beginning in early 2022, in response to growing signs of inflation, the FRB increased interest rates rapidly and made a number of adjustments to monetary policy and liquidity, including quantitative tightening and other balance sheet actions. Further, the FRB has increased the benchmark rapidly and has announced an intention to take further actions to mitigate rising inflationary pressures. Rising interest rates can have a negative impact on our business by reducing the amount of money our clients borrow or by adversely affecting their ability to repay outstanding loan balances that may increase due to adjustments in their variable rates. In addition, as interest rates rise, we may have to offer more attractive interest rates to depositors to compete for deposits, or pursue other sources of liquidity, such as wholesale funds.
On the other hand, decreasing interest rates reduce our yield on our variable rate loans and on our new loans, which reduces our net interest income. In addition, lower interest rates may reduce our realized yields on investment securities which would reduce our net interest income and cause downward pressure on net interest margin in future periods. A significant reduction in our net interest income could have a material adverse impact on our capital, financial condition and results of operations.
Although the FRB increased the target federal funds rate in 2023 to combat inflationary trends, the FRB held the federal funds rate steady in December 2023 for the third consecutive quarter and indicated that the rate is likely to be decreased in 2024 and beyond. We are unable to predict changes in interest rates, which are affected by factors beyond our control, including inflation, deflation, recession, unemployment, money supply, and other changes in financial markets. We have ongoing policies and procedures designed to manage the risks associated with changes in market interest rates and actively manage these risks through hedging and other risk mitigation strategies. However, if our assumptions are wrong or overall economic conditions are significantly different than anticipated, our risk mitigation techniques may be ineffective or costly.
Changes in interest rates may change the value of our mortgage servicing rights portfolio, which may increase the volatility of our earnings.
A mortgage servicing right is the right to service a mortgage loan - collect principal, interest and escrow amounts - for a fee. We measure and carry our residential mortgage servicing rights using the fair value measurement method. Fair value is determined as the present value of estimated future net servicing income, calculated based on a number of variables, including assumptions about the likelihood of prepayment by borrowers. The primary risk associated with mortgage servicing rights is that in a declining interest rate environment, they will likely lose a substantial portion of their value as a result of higher than anticipated prepayments. Moreover, if prepayments are greater than expected, the cash we receive over the life of the mortgage loans would be reduced. Conversely, these assets generally increase in value in a rising interest rate environment to the extent that prepayments are slower than previously estimated. An increase in the size of our mortgage servicing rights portfolio may increase our interest rate risk. Depending on the interest rate environment, it is possible that the fair value of our mortgage servicing rights may be reduced in the future. If such changes in fair value significantly reduce the carrying value of our mortgage servicing rights, our business, financial condition and results of operations could be adversely affected.
23
Inflation could negatively impact our business, our profitability and our stock price.
Inflation continued rising in 2023, and inflationary pressures may remain elevated into 2024. Prolonged periods of inflation may impact our profitability by negatively impacting our fixed costs and expenses, including increasing funding costs and expense related to talent acquisition and retention, and negatively impacting the demand for our products and services. Additionally, inflation may lead to a decrease in consumer and clients’ purchasing power and negatively affect the need or demand for our products and services. If significant inflation continues, our business could be negatively affected by, among other things, increased default rates leading to credit losses which could decrease our appetite for new credit extensions. These inflationary pressures could result in missed earnings and budgetary projections causing our stock price to suffer.
Changes in the cost and availability of funding due to changes in the deposit market and credit market may adversely affect our capital resources, liquidity, and financial results.
In managing our consolidated balance sheets, we depend on access to a variety of sources of funding to provide us with sufficient capital resources and liquidity to meet our commitments and business needs, and to accommodate the transaction and cash management needs of our clients. In addition to core deposits, sources of funding available to us and upon which we rely as regular components of our liquidity and funding management strategy, include borrowings from the Federal Home Loan Bank (“FHLB”) and brokered deposits. In general, the amount, type, and cost of our funding, including from other financial institutions, the capital markets, and deposits, directly impacts our costs of operating our business and growing our assets and can therefore positively or negatively affect our financial results. A number of factors could make funding more difficult, more expensive, or unavailable on any terms, including, but not limited to, a downgrade in our credit ratings, financial results, changes within our organization, specific events that adversely impact our reputation, disruptions in the capital markets, specific events that adversely impact the financial services industry, counterparty availability, recently proposed changes to the FHLB system, changes affecting our assets, the corporate and regulatory structure, interest rate fluctuations, general economic conditions, and the legal, regulatory, accounting and tax environments governing our funding transactions. Also, we compete for funding with other banks and similar companies, many of which are substantially larger, and have more capital and other resources.
In addition to bank level liquidity management, we must manage liquidity at holding company for various needs including potential capital infusions into subsidiaries, the servicing of debt, the payment of dividends on our common stock, and share repurchases. The primary source of liquidity for us consists of dividends from the Bank which are governed by certain rules and regulations of our supervising agencies. Bank First’s ability to receive dividends from the Bank in future periods will depend on a number of factors, including, without limitation, the Bank's future profits, asset quality, liquidity, and overall condition. If Bank First does not receive dividends from the Bank as needed, its liquidity could be adversely affected, and it may not be able to continue to execute its current capital plan to return capital to its shareholders. In addition to dividends from the Bank, we have historically had access to a number of alternative sources of liquidity, including the capital markets, but there is no assurance that we will be able to obtain such liquidity on terms that are favorable to us, or at all. If our access to these traditional and alternative sources of liquidity is diminished or only available on unfavorable terms, then our overall liquidity and financial condition will be adversely affected.
If the Bank loses or is unable to grow and retain its deposits, it may be subject to liquidity risk and higher funding costs.
The total amount that we pay for funding costs is dependent, in part, on the Bank’s ability to grow and retain its deposits. If the Bank is unable to sufficiently grow and retain its deposits at competitive rates to meet liquidity needs, it may be subject to paying higher funding costs to meet these liquidity needs.
The Bank competes with banks and other financial services companies for deposits. As a result of monetary policy and the broader market for interest rates and funding, we were required to raise rates on our deposits to keep pace with our competition. Furthermore, if the Bank were to lose deposits, it must rely on more expensive sources of funding. This could result in a failure to maintain adequate liquidity and higher funding costs, reducing our net interest margin and net interest income. In addition, our access to deposits may be affected by the liquidity needs of our depositors. In particular, a substantial majority of our liabilities in 2023 were checking accounts and other liquid deposits, which are payable on demand or upon several days' notice, while by comparison, a substantial majority of our assets were loans, which cannot be called
24
or sold in the same time frame. Moreover, our clients could withdraw their deposits in favor of alternative investments. While we have historically been able to replace maturing deposits and advances as necessary, we may not be able to replace such funds in the future, especially if a large number of our depositors seek to withdraw their accounts, regardless of the reason.
Our provision and allowance for credit losses may not be adequate to cover actual credit losses.
We make various assumptions and judgments about the collectability of our loan and lease portfolio and utilize these assumptions and judgments when determining the provision and allowance for credit losses. The determination of the appropriate level of the provision for credit losses inherently involves a high degree of subjectivity and requires us to make significant estimates of current credit risks and future trends, all of which may undergo material changes, as we have experienced. Deterioration in economic conditions affecting borrowers, new information regarding existing loans, identification of additional problem loans and other factors, both within and outside of our control, may require an increase in the amount reserved in the allowance for credit losses. Due to the declining economic conditions, our customers may not be able to repay their loans according to the original terms, and the collateral securing the payment of those loans may be insufficient to pay any remaining loan balance. While we maintain our allowance to provide for loan defaults and non-performance, losses may exceed the value of the collateral securing the loans and the allowance may not fully cover any excess loss. In addition, bank regulatory agencies periodically review our provision and the total allowance for credit losses and may require an increase in the allowance for credit losses or future provisions for credit losses, based on judgments different than those of management. Any increases in the provision or allowance for credit losses will result in a decrease in our net income and, potentially, capital, and may have a material adverse effect on our financial condition or results of operations. In addition, we expect that the allowance for credit losses under the CECL standard to be more volatile and as such could have an impact on our results of operations. For a discussion of changes in accounting standards and regulatory capital implications, see “Business—Supervision and Regulation—Capital Requirements.”
If we do not effectively manage our asset quality and credit risk, we could experience credit losses.
Making any loan involves various risks, including risks inherent in dealing with individual borrowers, risks of nonpayment, risks resulting from uncertainties as to the future value of collateral and cash flows available to service debt, and risks resulting from changes in economic and market conditions. Our credit risk approval and monitoring procedures may fail to identify or reduce these credit risks, as some of these risks are outside of our control, and they cannot completely eliminate all credit risks related to our loan portfolio. If the overall economic climate, including employment rates, real estate markets, interest rates and general economic growth, in the United States, generally, or Wisconsin, specifically, experiences material disruption, our borrowers may experience difficulties in repaying their loans, the collateral we hold may decrease in value or become illiquid, and the levels of nonperforming loans, charge-offs and delinquencies could rise and require additional provisions for credit losses, which would cause our net income and return on equity to decrease. The future effects of the continued elevated inflationary and interest rate environment on economic activity could negatively affect the collateral values associated with our existing loans, the ability to liquidate the real estate collateral securing our residential and commercial real estate loans, our ability to maintain loan origination volume and to obtain additional financing, the future demand for or profitability of our lending and services, and the financial condition and credit risk of our customers. Further, in the event of delinquencies, regulatory changes and policies designed to protect borrowers may slow or prevent us from making our business decisions or may result in a delay in our taking certain remediation actions, such as foreclosure. If borrowers fail to repay their loans, our financial condition and results of operations would be adversely affected.
We face strong competition from financial services companies and other companies that offer banking services.
We conduct our banking operations primarily in Wisconsin. Many of our competitors offer the same, or a wider variety of, banking services within our market areas, and we compete with them for the same customers. These competitors include banks with nationwide operations, regional banks and community banks. In many instances these national and regional banks have greater resources than we do, and the smaller community banks may have stronger ties in local markets than we do, which may put us at a competitive disadvantage. We also face competition from many other types of financial institutions, including fintech companies, thrift institutions, finance companies, brokerage firms, insurance companies, credit unions, mortgage banks and other financial intermediaries. In addition, a number of out-of-state financial institutions have opened offices and solicit deposits in our market areas. Increased competition in our markets may result in reduced loans
25
and deposits, as well as reduced net interest margin and profitability. We compete with many forms of payments offered by both bank and non-bank providers, including a variety of new and evolving alternative payment mechanisms, systems and products, such as aggregators and web-based and wireless payment platforms or technologies, digital or “crypto” currencies, prepaid systems and payment services targeting users of social networks, communications platforms and online gaming. Our future success may depend, in part, on our ability to use technology competitively to offer products and services that provide convenience to customers and create additional efficiencies in our operations. If we are unable to attract and retain banking clients, we may be unable to continue to grow our loan and deposit portfolios, and our business, financial condition and results of operations may be adversely affected. Furthermore, the financial services industry could become even more competitive as a result of legislative, regulatory and technological changes and continued consolidation.
Because a significant portion of our loan portfolio is comprised of real estate loans, negative changes in the economy affecting real estate values and liquidity could impair the value of collateral securing our real estate loans and result in loan and other losses.
As of December 31, 2023, approximately 77.4% of our loan portfolio was comprised of loans with real estate as a primary or secondary component of collateral. This includes collateral consisting of income producing and residential construction properties, which properties tend to be more sensitive to general economic conditions and downturns in real estate markets. As a result, adverse developments affecting real estate values in our market areas could increase the credit risk associated with our real estate loan portfolio. The market value of real estate can fluctuate significantly in a short period of time as a result of market conditions in the area in which the real estate is located. Adverse changes affecting real estate values and the liquidity of real estate in one or more of our markets could increase the credit risk associated with our loan portfolio, and could result in losses that would adversely affect credit quality, financial condition, and results of operation. Negative changes in the economy affecting real estate values and liquidity in our market areas could significantly impair the value of property pledged as collateral on loans and affect our ability to sell the collateral upon foreclosure without a loss or additional losses. Collateral may have to be sold for less than the outstanding balance of the loan, which could result in losses on such loans. Such declines and losses could have a material adverse impact on our business, results of operations and growth prospects. If real estate values decline, it is also more likely that we would be required to increase our ACL-Loans, which could adversely affect our financial condition, results of operations and cash flows.
Our future success is largely dependent upon our ability to successfully execute our business strategy.
Our future success, including our ability to achieve our growth and profitability goals, is dependent on the ability of our management team to execute on our long-term business strategy, which requires them to, among other things:
maintain and enhance our reputation; attract and retain experienced and talented bankers in each of our markets; maintain adequate funding sources, including by continuing to attract stable, low-cost deposits; enhance our market penetration in our metropolitan markets and maintain our leadership position in our community markets; improve our operating efficiency; implement new technologies to enhance the client experience and keep pace with our competitors; identify attractive acquisition targets, close on such acquisitions on favorable terms and successfully integrate acquired businesses; attract and maintain commercial banking relationships with well-qualified businesses, real estate developers and investors with proven track records in our market areas; attract sufficient loans that meet prudent credit standards; originate conforming residential mortgage loans for resale into secondary market to provide mortgage banking income; maintain adequate liquidity and regulatory capital and comply with applicable federal and state banking regulations; manage our credit, interest rate and liquidity risks; develop new, and grow our existing, streams of noninterest income; oversee the performance of third-party service providers that provide material services to our business; and control expenses in line with current projections.
Failure to achieve these strategic goals could adversely affect our ability to successfully implement our business strategies and could negatively impact our business, growth prospects, financial condition and results of operations. Further, if we do not manage our growth effectively, our business, financial condition, results of operations and future prospects could be negatively affected, and we may not be able to continue to implement our business strategy and successfully conduct our operations. Furthermore, our strategic initiatives may result in an increase in expense, divert management attention, take away from other opportunities that may have proved more successful, negatively impact operational effectiveness or impact
26
employee morale. Additionally, there can be no assurance that we will ultimately realize the anticipated benefits of these strategic initiatives, or that these strategic initiatives will positively impact our organization.
We depend on our executive officers and other key individuals to continue the implementation of our long-term business strategy and could be harmed by the loss of their services and our inability to make up for such loss with qualified replacements.
We believe that our continued growth and future success will depend in large part on the skills of our management team and our ability to motivate and retain these individuals and other key individuals. The loss of any of their service could reduce our ability to successfully implement our long-term business strategy, our business could suffer and the value of our common stock could be materially adversely affected.
The success of our operating model depends on our ability to attract and retain talented bankers and associates in each of our markets.
We strive to attract and retain these bankers in each of our markets by fostering an entrepreneurial environment, empowering them with local decision-making authority and providing them with sufficient infrastructure and resources to support their growth while also providing management with appropriate oversight. However, the competition for bankers in each of our markets is intense. We compete for talent with both smaller banks that may be able to offer bankers with more responsibility and autonomy and larger banks that may be able to offer bankers with higher compensation, resources and support. As a result, we may not be able to effectively compete for talent across our markets. Further, our bankers may leave us to work for our competitors and, in some instances, may take important banking and lending relationships with them to our competitors. If we are unable to attract and retain talented bankers in our markets, our business, growth prospects and financial results could be materially and adversely affected.
Acquisitions may disrupt our business and dilute stockholder value, and integrating acquired companies may be more difficult, costly, or time-consuming than we expect.
While we continue to focus on organic growth opportunities, we may pursue attractive bank or non-bank acquisition and consolidation opportunities that arise in our core markets and beyond. The number of financial institutions headquartered in Wisconsin, the Midwest United States, and across the country continues to decline through merger and other consolidation activity. In the event that attractive acquisition opportunities arise, we would likely face competition for such acquisitions from other banking and financial companies, many of which have significantly greater resources and may have more attractive valuations. This competition could either prevent us from being able to complete attractive acquisition opportunities or increase prices for potential acquisitions which could reduce our potential returns and reduce the attractiveness of these opportunities. Furthermore, our pursuit of acquisitions may disrupt our business, and any equity that we issue as merger consideration may have the effect of diluting the value of your investment. In addition, we may fail to realize some or all of the anticipated benefits of completed acquisitions. We anticipate that the integration of businesses that we may acquire in the future will be a time-consuming and expensive process, even if the integration process is effectively planned and implemented.
In addition, our acquisition activities could be material to our business and involve a number of significant risks, including the following:
incurring time and expense associated with identifying and evaluating potential acquisitions and negotiating potential transactions, resulting in our attention being diverted from the operating of our existing business; using inaccurate estimates and judgments to evaluate credit, operations, management, and market risks with respect to the target company or the assets and liabilities that we seek to acquire; exposure to potential asset quality issues of the target company; intense competition from other banking organizations and other potential acquirers, many of which have substantially greater resources than we do; potential exposure to unknown or contingent liabilities of banks and businesses we acquire, including, without limitation, liabilities for regulatory and compliance issues; inability to realize the expected revenue increases, cost savings, increases in geographic or product presence, and other projected benefits of the acquisition; incurring time and expense required to integrate the operations and personnel of the combined businesses; inconsistencies in standards, procedures, and policies that would adversely affect our ability to maintain relationships with customers and employees;
27
experiencing higher operating expenses relative to operating income from the new operations; creating an adverse short-term effect on our results of operations; losing key employees and customers; significant problems related to the conversion of the financial and customer data of the entity; integration of acquired customers into our financial and customer product systems; potential changes in banking or tax laws or regulations that may affect the target company; or risks of impairment to goodwill or litigation risk.
If difficulties arise with respect to the integration process, the economic benefits expected to result from acquisitions might not occur. As with any merger of financial institutions, there also may be business disruptions that cause us to lose customers or cause customers to move their business to other financial institutions. Failure to successfully integrate businesses that we acquire could have an adverse effect on our profitability, return on equity, return on assets, or our ability to implement our strategy, any of which in turn could have a material adverse effect on our business, financial condition, and results of operations.
The fair value of our investment securities may decline.
As of December 31, 2023, the fair value of our available for sale securities portfolio was approximately $142.2 million. Factors beyond our control can significantly influence the fair value of our securities and can cause adverse changes to the fair value of these securities. These factors include rating agency actions, defaults by or other adverse events affecting the issuer, lack of liquidity, changes in market interest rates, and continued instability in the capital markets. A prolonged decline in the fair value of our securities could result in an established allowance for credit losses, which would affect our results of operations.
The financial services industry is undergoing rapid technological changes and we may not have the resources to implement new technology to stay current with these changes.
The financial services industry is undergoing rapid technological changes with frequent introductions of new technology-driven products and services (including those related to or involving artificial intelligence, machine learning, blockchain and other distributed ledger technologies) and a growing demand for mobile and other phone and computer banking applications. In addition to better serving clients, the effective use of technology increases efficiency and enables financial institutions to reduce costs. Our future success will depend in part upon our ability to address the needs of our clients by using technology to provide products and services that will satisfy client demands for convenience as well as to provide secure electronic environments and create additional efficiencies in our operations as we continue to grow and expand our market area. Many of our larger competitors have substantially greater resources to invest in technological improvements and have invested significantly more than us in technological improvements. As a result, they may be able to offer additional or more convenient products compared to those that we will be able to provide, which would put us at a competitive disadvantage. Some of these competitors consist of financial technology providers who are beginning to offer more traditional banking products and may either acquire a bank charter or obtain a bank-like charter, such as the Fintech charter provided by the OCC. Accordingly, we may not be able to effectively implement new technology-driven products and services or be successful in marketing such products and services to our clients, which could impair our growth and profitability. In addition, some of our competitors are subject to less regulation and/or more favorable tax treatment, which may put us at a competitive disadvantage.
We may not be able to successfully implement current or future information technology system enhancements and operational initiatives, which could adversely affect our business operations and profitability.
We continue to invest significant resources in our core information technology systems in order to provide functionality and security at an appropriate level, and to improve our operating efficiency and to streamline our client experience. These initiatives significantly increase the complexity of our relationships with third-party service providers and such relationships may be difficult to unwind. We may not be able to successfully implement and integrate such system enhancements and initiatives, which could adversely impact our ability to comply with a number of legal and regulatory requirements, which could result in sanctions from regulatory authorities. In addition, these projects could have higher than expected costs and/or result in operating inefficiencies, which could increase the costs associated with the implementation as well as ongoing operations. Failure to properly utilize system enhancements that are implemented in the future could result in impairment charges that adversely impact our financial condition and results of operations, could
28
result in significant costs to remediate or replace the defective components, and could impact our ability to compete. In addition, we may incur significant training, licensing, maintenance, consulting, and amortization expense during and after implementation, and any such costs may continue for an extended period of time. As such, we cannot guarantee that the anticipated long-term benefits of these system enhancements and operational initiatives will be realized.
We rely extensively on information technology systems to operate our business and an interruption or security breach may disrupt our business operations, result in reputational harm, and have an adverse effect on our operations.
As a complex financial institution, we rely extensively on our information technology systems to operate our business, including to process, record, and monitor a large number of client transactions on a continuous basis. As client, public, and regulatory expectations regarding operational and information security have increased, our operational systems and infrastructure must continue to be safeguarded and monitored for potential failures, disruptions, and breakdowns. Our business, financial, accounting, data processing systems, or other operating systems and facilities may stop operating properly or become disabled or damaged as a result of a number of factors including events that are wholly or partially beyond our control. For example, there could be sudden increases in client transaction volume; electrical or telecommunications outages; natural disasters such as earthquakes, tornadoes, and hurricanes; disease pandemics; events arising from local or larger scale political or social matters, including terrorist acts; and, as described below, cyber-attacks. While we have policies, procedures, and systems designed to prevent or limit the effect of possible failures, interruptions, or breaches in security of information systems and business continuity programs designed to provide services in the case of such events, there is no guarantee that these safeguards or programs will address all of the threats that continue to evolve.
System failure or breaches of our network security, or the security of our third-party data processing partner, including as a result of cyberattacks or data security breaches, could subject us to increased operating costs as well as litigation and other liabilities.
The computer systems and network infrastructure we use may be vulnerable to physical theft, fire, power loss, telecommunications failure or a similar catastrophic event, as well as security breaches, denial of service attacks, viruses, worms and other disruptive problems caused by hackers. Any damage or failure that causes breakdowns or disruptions in our client relationship management, general ledger, deposit, loan and other systems could damage our reputation, result in a loss of client business, subject us to additional regulatory scrutiny, or expose us to civil litigation and possible financial liability, any of which could have a material adverse effect on us.
Computer break-ins, phishing and other disruptions could also jeopardize the security of information stored in and transmitted through our computer systems and network infrastructure. Information security risks have generally increased in recent years in part because of the proliferation of new technologies, the use of the Internet and telecommunications technologies to conduct financial transactions, and the increased sophistication and activities of organized crime, hackers, terrorists, activists, and other external parties. Our operations rely on the secure processing, transmission and storage of confidential information in our computer systems and networks. Although we believe we have robust information security procedures and controls, our technologies, systems, networks, and our clients’ devices may become the target of cyberattacks or information security breaches that could result in the unauthorized release, gathering, monitoring, misuse, loss or destruction of our or our clients’ confidential, proprietary and other information, or otherwise disrupt our or our clients’ business operations. As cyber threats continue to evolve, we may be required to expend significant additional resources to continue to modify or enhance our protective measures or to investigate and remediate any information security vulnerabilities. In addition, as the regulatory environment related to information security, data collection and use, and privacy becomes increasingly rigorous, with new and constantly changing requirements applicable to our business, compliance with those requirements could also result in additional costs.
We are under continuous threat of loss due to hacking and cyberattacks especially as we continue to expand client capabilities to utilize internet and other remote channels to transact business. While we are not aware of any successful hacking or cyberattacks into our computer or other information technology systems, there can be no assurance that we will not be the victim of successful hacking or cyberattacks in the future that could cause us to suffer material losses. The occurrence of any cyberattack or information security breach could result in potential liability to clients, reputational damage,
29
disclosure obligations, the disruption of our operations, and regulatory concerns, all of which could adversely affect our business, financial condition or results of operations.
We are subject to certain operational risks, including, but not limited to, client or employee fraud and data processing system failures and errors.
Employee errors and employee and client misconduct could subject us to financial losses or regulatory sanctions and seriously harm our reputation. Misconduct by our employees could include hiding unauthorized activities from us, improper or unauthorized activities on behalf of our clients or improper use of confidential information. It is not always possible to prevent employee errors and misconduct, and the precautions we take to prevent and detect this activity may not be effective in all cases. Employee errors could also subject us to financial claims for negligence. We maintain a system of internal controls and insurance coverage to mitigate against operational risks. If our internal controls fail to prevent or detect an occurrence, or if any resulting loss is not insured or exceeds applicable insurance limits, it could have a material adverse effect on our business, financial condition and results of operations.
In addition, we rely heavily upon information supplied by third parties, including the information contained in credit applications, property appraisals, title information, equipment pricing and valuation and employment and income documentation, in deciding which loans we will originate, as well as the terms of those loans. If any of the information upon which we rely is misrepresented, either fraudulently or inadvertently, and the misrepresentation is not detected prior to asset funding, the value of the asset may be significantly lower than expected, or we may fund a loan that we would not have funded or on terms we would not have extended.
Fraud is an increasing risk for us and for all banks, and as such, we may experience increased losses due to fraud.
In recent years, fraud risk increased significantly for us and for all banks. Deposit fraud (check kiting, wire fraud, etc.) and card fraud continue to be significant sources of fraud attempts and losses in our consumer banking business. Moreover, our commercial clients have experienced increased levels of financial fraud risk as well, often requiring our involvement and assistance because of our banking relationship with these clients. The methods used to perpetrate and combat fraud continue to evolve as technology changes and more tools for access to financial services emerge, such as real-time payments. In addition to cybersecurity risks, new techniques have made it easier for bad actors to obtain and use client personal information, mimic signatures, and otherwise create false documents that look genuine. Fraud schemes are broad and can include debit card/credit card fraud, check fraud, NSF fraud, mechanical devices attached to ATM machines, social engineering and phishing attacks to obtain personal information, impersonation of our clients through the use of falsified or stolen credentials, employee fraud, information fraud, and other malfeasance. Criminals are turning to new sources to steal personally identifiable information in order to impersonate our clients to commit fraud. Our anti-fraud actions are both preventative (anticipating lines of attack, educating employees and clients, making operational changes) and responsive (remediating actual attacks). We have established policies, processes, and procedures to identify, measure, monitor, mitigate, report, and analyze these risks. We continue to invest in systems, resources, and controls to detect and prevent fraud. There are inherent limitations, however, to our risk management strategies, systems, and controls as they may exist, or develop in the future. We may not appropriately anticipate, monitor, or identify these risks. If our risk management framework proves ineffective, we could suffer unexpected losses, we may have to expend resources detecting and correcting the failure in our systems, and we may be subject to potential claims from third parties and government agencies. We may also suffer reputational damage. Any of these consequences could adversely affect our business, financial condition, or results of operations.
Our regulators require us to report fraud promptly, and regulators often advise banks of new schemes to enable the entire industry to adapt as quickly as possible. However, some level of fraud loss is unavoidable, and the risk of loss cannot be eliminated.
If our enterprise risk management framework is not effective at mitigating risk and loss to us, we could suffer unexpected losses and our results of operations could be materially adversely affected.
Our enterprise risk management framework seeks to achieve an appropriate balance between risk and return, which is critical to optimizing shareholder value. We have established processes and procedures intended to identify, measure,
30
monitor, report, and analyze the types of risk to which we are subject, including strategic, market, credit, liquidity, capital, cybersecurity, operational, regulatory compliance, litigation, and reputational. However, as with any risk management framework, there are inherent limitations to our risk management strategies as there may exist, or develop in the future, risks that we have not appropriately anticipated or identified. For example, the financial and credit crisis and resulting regulatory reform highlighted both the importance and some of the limitations of managing unanticipated risks. If our risk management framework proves ineffective, we could suffer unexpected losses and our business and results of operations could be materially adversely affected.
Our ability to maintain our reputation is critical to the success of our business, and the failure to do so may materially adversely affect our performance.
Our reputation is one of the most valuable components of our business. As such, we strive to conduct our business in a manner that enhances our reputation. This is done, in part, by recruiting, hiring, and retaining and providing growth opportunities for employees who share our core values of being an integral part of the communities we serve, delivering superior service to our clients, caring about our clients and employees, and investing in our information technology and other systems. If our reputation is negatively affected by the actions of our employees or otherwise, including as a result of operational errors, clerical or record-keeping errors, or those resulting from faulty or disabled computer or telecommunications systems or a successful cyberattack against us or other unauthorized release or loss of client information, our reputation, business, and our operating results may be materially adversely affected. Damage to our reputation could also negatively impact our credit ratings and impede our access to the capital markets.
We rely on other companies to provide key components of our business infrastructure.
Third parties provide key components of our business operations such as our core technology infrastructure, cloud-based operations, data processing, recording and monitoring transactions, online banking interfaces and services, internet connections, and network access. We have selected these third-party vendors carefully and have conducted the due diligence consistent with regulatory guidance and best practices. While we have ongoing programs to review third party vendors and assess risk, we do not control their actions. Any problems caused by these third parties, including those resulting from disruptions in communication services provided by a vendor, issues at a third-party vendor of a vendor, failure of a vendor to handle current or higher volumes, cyber-attacks and security breaches at a vendor, failure of a vendor to provide services for any reason, or poor performance of services, could adversely affect our ability to deliver products and services to our clients and otherwise conduct our business. Financial or operational difficulties of a third-party vendor could also hurt our operations if those difficulties interfere with the vendor's ability to serve us. Furthermore, our vendors could also be sources of operational and information security risk to us, including from breakdowns or failures of their own systems or capacity constraints. Replacing these third-party vendors could also create significant delay and expense. Accordingly, use of such third parties creates an unavoidable inherent risk to our business operations. Our digital services growth initiatives, core technology upgrades, and digital asset initiatives constitute specific increases in third-party risk as such initiatives are distinctly dependent on the performance of our third-party partners.
We may need to raise additional capital in the future.
We are required to meet certain regulatory capital requirements and maintain sufficient liquidity. We may need to raise additional capital in the future to provide us with sufficient capital resources and liquidity to meet our commitments and business needs, which could include the possibility of financing acquisitions. Our ability to raise additional capital depends on conditions in the capital markets, economic conditions and a number of other factors, including investor perceptions regarding the banking industry, market conditions and governmental activities, and on our financial condition and performance. Accordingly, we may be unable to raise additional capital if needed or on terms acceptable to us. Further, such additional capital could result in dilution to our existing shareholders. If we or the Bank fail to maintain capital to meet regulatory requirements, our financial condition, liquidity and results of operations, as well as our ability to maintain compliance with regulatory capital requirements, would be materially and adversely affected.
31
The costs and effects of litigation, investigations or similar matters involving us or other financial institutions or counterparties, or related adverse facts and developments, could materially affect our business, operating results and financial condition.
We may be involved from time to time in a variety of litigation, investigations, inquiries, or similar matters arising out of our business. Furthermore, litigation against banks tend to increase during economic downturns and periods of credit deterioration, which may occur or worsen as a result of current economic uncertainty. Most recently there has been an increase in class action lawsuits filed claiming deceptive practices or violations of account terms in connection with non-sufficient fees or overdraft charges. We manage these risks through internal controls, personnel training, insurance, litigation management, our compliance and ethics processes, and other means. However, the commencement, outcome, and magnitude of litigation cannot be predicted or controlled with any certainty.
We establish reserves for legal claims when payments associated with the claims become probable and the losses can be reasonably estimated. However, our insurance may not cover all claims that may be asserted against us and indemnification rights to which we are entitled may not be honored, and any claims asserted against us, regardless of merit or eventual outcome, may harm our reputation. Should the ultimate judgments or settlements in any litigation or investigation significantly exceed our insurance coverage, they could have a material adverse effect on our business, financial condition, and results of operations. In addition, premiums for insurance covering the financial and banking sectors are rising. We may not be able to obtain appropriate types or levels of insurance in the future, nor may we be able to obtain adequate replacement policies with acceptable terms or at historic rates, if at all.
Changes in accounting standards could materially impact our financial statements.
From time to time, FASB or the SEC may change the financial accounting and reporting standards that govern the preparation of our financial statements. Such changes may result in us being subject to new or changing accounting and reporting standards. In addition, the bodies that interpret the accounting standards (such as banking regulators or outside auditors) may change their interpretations or positions on how these standards should be applied. These changes may be beyond our control, can be hard to predict and can materially impact how we record and report our financial condition and results of operations. In some cases, we could be required to apply a new or revised standard retrospectively, or apply an existing standard differently, also retrospectively, in each case resulting in our needing to revise or restate prior period financial statements.
Risks related to the business environment and our industry
The Company is subject to extensive government regulation and supervision, which may interfere with our ability to conduct our business and may negatively impact our financial results.
The Company, primarily through the Bank and certain non-bank subsidiaries, are subject to extensive federal and state regulation and supervision. Banking regulations are primarily intended to protect depositors’ funds and the safety and soundness of the banking system as a whole, and not shareholders. These regulations affect the Bank’s lending practices, capital structure, investment practices, dividend policy and growth, among other things. Congress and federal regulatory agencies continually review banking laws, regulations and policies for possible changes. Changes to statutes, regulations or regulatory policies, including changes in interpretation or implementation of statutes, regulations or policies, could affect the Company and/or the Bank in substantial and unpredictable ways. Such changes could subject the Company and/or the Bank to additional costs, limit the types of financial services and products the Company and/or the Bank may offer, and/or limit the pricing the Company and/or the Bank may charge on certain banking services, among other things. Compliance personnel and resources may increase our costs of operations and adversely impact our earnings.
Failure to comply with laws, regulations or policies could result in sanctions by regulatory agencies, civil money penalties and/or reputation damage, which could have a material adverse effect on our business, financial condition and results of operations. While the Company has policies and procedures designed to prevent any such violations, there can be no assurance that such violations will not occur. See “Business - Supervision and Regulation”.
32
Federal regulatory agencies, including the Federal Reserve and the OCC, periodically conduct examinations of our business, including for compliance with laws and regulations, and our failure to comply with any supervisory actions to which we are or become subject as a result of such examinations may adversely affect our business.
Federal regulatory agencies, including the Federal Reserve and the OCC, periodically conduct examinations of our business, including our compliance with laws and regulations. If, as a result of an examination, an agency was to determine that the financial, capital resources, asset quality, earnings prospects, management, liquidity, or other aspects of any of our operations had become unsatisfactory, or violates any law or regulation, such agency may take certain remedial or enforcement actions it deems appropriate to correct any deficiency. Remedial or enforcement actions include the power to enjoin “unsafe or unsound” practices, to require affirmative actions to correct any conditions resulting from any violation or practice, to issue an administrative order that can be judicially enforced against a bank, to direct an increase in the bank’s capital, to restrict the bank’s growth, to assess civil monetary penalties against a bank’s officers or directors, and to remove officers and directors. The CFPB also has authority to take enforcement actions, including cease-and-desist orders or civil monetary penalties, if it finds that we offer consumer financial products and services in violation of federal consumer financial protection laws.
If we were unable to comply with future regulatory directives, or if we were unable to comply with the terms of any future supervisory requirements to which we may become subject, then we could become subject to a variety of supervisory actions and orders, including cease-and-desist orders, prompt corrective actions, memoranda of understanding and other regulatory enforcement actions. Such supervisory actions could, among other things, impose greater restrictions on our business, as well as our ability to develop any new business. We could also be required to raise additional capital, dispose of certain assets and liabilities within a prescribed time period, or both. Failure to implement remedial measures as required by financial regulatory agencies could result in additional orders or penalties from federal and state regulators, which could trigger one or more of the remedial actions described above. The terms of any supervisory action and associated consequences with any failure to comply with any supervisory action could have a material negative effect on our business, operating flexibility and overall financial condition.
Further, bank failures, such as the ones occurring in 2023, have and may in the future diminish public confidence in small and regional banks’ abilities to safeguard deposits in excess of federally insured limits, which could prompt customers to maintain their deposits with larger financial institutions. Concerns over rapid, large-scale deposit movement have and could in the future heighten regulatory scrutiny surrounding liquidity and increase competition for deposits and the resulting cost of funding, which could create pressure on net interest margin and results of operations. In addition, bank failures have and could in the future prompt the FDIC to increase deposit insurance costs. Increases in funding, deposit insurance or other costs as a result of these types of events have and could in the future materially adversely affect our financial condition and results of operations. Further, the disruption following these types of events have and could in the future generate significant market trading volatility among publicly traded bank holding companies and, in particular, regional banks like the Company.
We are subject to lending concentration risk, which could cause our regulators to restrict our ability to grow.
A substantial portion of our loan portfolio is secured by real estate. In weak economies, or in areas where real estate market conditions are distressed, we may experience a higher than normal level of nonperforming real estate loans. The collateral value of the portfolio and the revenue stream from those loans could come under stress, and additional provisions for the allowance for credit losses could be necessitated. Our ability to dispose of foreclosed real estate at prices at or above the respective carrying values could also be impaired, causing additional losses.
Commercial real estate (“CRE”) is cyclical and poses risks of loss to us due to our concentration levels and risk of the asset, especially during a difficult economy, including the current stressed economy. As of December 31, 2023, 50.8% of our loan portfolio was comprised of loans secured by commercial real estate. The banking regulators continue to give CRE lending greater scrutiny, and banks with higher levels of CRE loans are expected to implement improved underwriting, internal controls, risk management policies and portfolio stress testing, as well as higher levels of allowances for possible losses and capital levels as a result of CRE lending growth and exposures.
Although we are actively working to manage our CRE concentration and believe that our underwriting policies, management information systems, independent credit administration process, and monitoring of real estate loan concentrations are currently sufficient to address the CRE Concentration Guidance, the OCC or other federal regulators could become
33
concerned about our CRE loan concentrations, and they could limit our ability to grow by, among other things, restricting their approvals for the establishment or acquisition of branches, or approvals of mergers or other acquisition opportunities. Our loan portfolio contains several industry and collateral concentrations including, but not limited to, commercial and residential real estate. Due to the exposure in these concentrations, disruptions in markets, economic conditions, changes in laws or regulations or other events could cause a significant impact on the ability of borrowers to repay and may have a material adverse effect on our business, financial condition and results of operations.
The Federal Reserve may require us to commit capital resources to support the Bank.
The Federal Reserve, which examines us and the Bank, requires a bank holding company to act as a source of financial and managerial strength to a subsidiary bank and to commit resources to support such subsidiary bank. Under the “source of strength” doctrine, the Federal Reserve may require a bank holding company to make capital injections into a troubled subsidiary bank and may charge the bank holding company with engaging in unsafe and unsound practices for failure to commit resources to such a subsidiary bank. In addition, the Dodd-Frank Act directs the federal bank regulators to require that all companies that directly or indirectly control an insured depository institution serve as a source of strength for the institution. Under these requirements, in the future, we could be required to provide financial assistance to the Bank if it experiences financial distress.
A capital injection may be required at times when we do not have the resources to provide it, and therefore we may be required to borrow the funds. In the event of a bank holding company’s bankruptcy, the bankruptcy trustee will assume any commitment by the holding company to a federal bank regulatory agency to maintain the capital of a subsidiary bank. Moreover, bankruptcy law provides that claims based on any such commitment will be entitled to a priority of payment over the claims of the holding company’s general unsecured creditors, including the holders of its note obligations. Thus, any borrowing that must be done by the holding company in order to make the required capital injection becomes more difficult and expensive and will adversely impact the holding company’s cash flows, financial condition, results of operations and prospects.
The Company may be subject to more stringent capital requirements.
The Bank is subject to capital adequacy guidelines and other regulatory requirements specifying minimum amounts and types of capital which the Bank must maintain. From time to time, the regulators implement changes to these regulatory capital adequacy guidelines. If the Bank fails to meet these minimum capital guidelines and other regulatory requirements, our financial condition would be materially and adversely affected. We may also be required to satisfy additional capital adequacy standards as determined by the Federal Reserve. These requirements, and any other new regulations, could adversely affect our ability to pay dividends, or could require us to reduce business levels or to raise capital, including in ways that may adversely affect our financial condition or results of operations.
Monetary policies and regulations of the Federal Reserve could adversely affect our business, financial condition and results of operations.
In addition to being affected by general economic conditions, our earnings and growth are affected by the policies of the Federal Reserve. An important function of the Federal Reserve is to regulate the money supply and credit conditions. Among the instruments used by the Federal Reserve to implement these objectives are open market operations in U.S. government securities, adjustments of the discount rate and changes in reserve requirements against bank deposits. These instruments are used in varying combinations to influence overall economic growth and the distribution of credit, bank loans, investments and deposits. Their use also affects interest rates charged on loans or paid on deposits. The monetary policies and regulations of the Federal Reserve have had a significant effect on the operating results of commercial banks in the past and are expected to continue to do so in the future. The effects of such policies upon our business, financial condition and results of operations cannot be predicted.
ESG risks could adversely affect our reputation and shareholder, employee, client and third-party relationships and may negatively affect our stock price.
34
Our business faces increasing public scrutiny related to environmental, social and governance (“ESG”) activities. We risk damage to our brand and reputation if we fail to act responsibly in a number of areas, such as diversity, equity, inclusion, environmental stewardship, human capital management, support for our local communities, corporate governance and transparency, or fail to consider ESG factors in our business operations.
Furthermore, as a result of our diverse base of clients and business partners, we may face potential negative publicity based on the identity of our clients or business partners and the public’s (or certain segments of the public’s) view of those entities. Such publicity may arise from traditional media sources or from social media and may increase rapidly in size and scope. If our client or business partner relationships were to become intertwined in such negative publicity, our ability to attract and retain clients, business partners, and employees may be negatively impacted, and our stock price may also be negatively impacted. Additionally, we may face pressure to not do business in certain industries that are viewed as harmful to the environment or are otherwise negatively perceived, which could impact our growth. Additionally, investors and shareholder advocates are placing ever increasing emphasis on how corporations address ESG issues in their business strategy when making investment decisions and when developing their investment theses and proxy recommendations. We may incur meaningful costs with respect to our ESG efforts and if such efforts are negatively perceived, our reputation and stock price may suffer. In addition, ongoing legislative or regulatory uncertainties and changes regarding climate risk management and practices may result in higher regulatory, compliance, credit and reputational risks and costs.
Our deposit insurance premiums could be substantially higher in the future, which could have a material adverse effect on our future earnings.
The FDIC insures deposits at FDIC-insured depository institutions, such as the Bank, up to applicable limits. The amount of a particular institution’s deposit insurance assessment is based on that institution’s risk classification under an FDIC risk-based assessment system. An institution’s risk classification is assigned based on its capital levels and the level of supervisory concern the institution poses to its regulators. We are generally unable to control the amount of premiums that we are required to pay for FDIC insurance. Any future additional assessments, increases or required prepayments in FDIC insurance premiums could reduce our profitability, may limit our ability to pursue certain business opportunities or otherwise negatively impact our operations.
We are subject to federal and state fair lending laws, and failure to comply with these laws could lead to material penalties.
Federal and state fair lending laws and regulations, such as the Equal Credit Opportunity Act and the Fair Housing Act, impose nondiscriminatory lending requirements on financial institutions. The Department of Justice, CFPB and other federal and state agencies are responsible for enforcing these laws and regulations. Private parties may also have the ability to challenge an institution’s performance under fair lending laws in private class action litigation. A successful challenge to our performance under the fair lending laws and regulations could adversely impact our rating under the Community Reinvestment Act and result in a wide variety of sanctions, including the required payment of damages and civil money penalties, injunctive relief, imposition of restrictions on merger and acquisition activity and restrictions on expansion activity, which could negatively impact our reputation, business, financial condition and results of operations.
We could face a risk of noncompliance and enforcement action with the Bank Secrecy Act and other anti-money laundering statutes and regulations.
The Bank Secrecy Act of 1970, the USA PATRIOT Act and other laws and regulations require financial institutions, among other duties, to institute and maintain effective anti-money laundering programs and file suspicious activity and currency transaction reports as appropriate. FinCEN, established by the U.S. Department of the Treasury to administer the Bank Secrecy Act, is authorized to impose significant civil money penalties for violations of those requirements and engages in coordinated enforcement efforts with the individual federal banking regulators, as well as the U.S. Department of Justice, Drug Enforcement Administration and IRS. There is also increased scrutiny of compliance with the rules enforced by OFAC related to U.S. sanctions regimes. If our policies, procedures and systems are deemed deficient or the policies, procedures and systems of the financial institutions that we have already acquired or may acquire in the future are deficient, we would be subject to liability, including fines and regulatory actions such as restrictions on our ability to pay dividends and the necessity to obtain regulatory approvals to proceed with certain aspects of our business plan, including our acquisition
35
plans, which would negatively impact our business, financial condition and results of operations. Failure to maintain and implement adequate programs to combat money laundering and terrorist financing could also have serious reputational consequences for us. See “Business-Supervision and Regulation.”
Recent negative developments affecting the banking industry, and resulting media coverage, have eroded customer confidence in the banking system.
The closures of Silicon Valley Bank and Signature Bank in March 2023 and First Republic Bank in May 2023, and concerns about similar future events, have generated significant market volatility among publicly traded bank holding companies and, in particular, regional banks like the Company. These market developments have negatively impacted customer confidence in the safety and soundness of regional banks. As a result, customers may choose to maintain deposits with larger financial institutions or invest in higher yielding short-term fixed income securities, all of which could materially adversely impact the Company’s liquidity, loan funding capacity, net interest margin, capital and results of operations. While the Department of the Treasury, the Federal Reserve, and the FDIC took action to ensure that depositors of these failed banks had access to their deposits, including uninsured deposit accounts, there is no guarantee that such actions will be successful in restoring customer confidence in regional banks and the banking system more broadly.
We also anticipate increased regulatory scrutiny – in the course of routine examinations and otherwise – and new regulations directed towards banks of similar size to the Bank, designed to address the recent negative developments in the banking industry, all of which may increase our costs of doing business and reduce our profitability. Among other things, there may be an increased focus by both regulators and investors on deposit composition, the level of uninsured deposits, the level of unrealized losses in either available-for-sale or held-to-maturity securities portfolios, contingent liquidity, CRE loan composition and concentration, capital position, and general oversight and internal control structures regarding the foregoing. This could impact our ability to achieve our strategic objectives and may result in changes to our balance sheet position which could, in turn, negatively impact our profitability.
Risks related to our common stock
Applicable laws and regulations restrict both the ability of the Bank to pay dividends to the Company and the ability of the Company to pay dividends to our shareholders.
Both the Company and the Bank are subject to various regulatory restrictions relating to the payment of dividends. In addition, the Federal Reserve has the authority to prohibit bank holding companies from engaging in unsafe or unsound practices in conducting their business. These federal and state laws, regulations and policies are described in greater detail in “Business— Supervision and Regulation—Payment of Dividends,” but generally look to factors such as previous results and net income, capital needs, asset quality, existence of enforcement or remediation proceedings, and overall financial condition.
For the foreseeable future, the majority, if not all, of the Company’s revenue will be from any dividends paid to the Company by the Bank. Accordingly, our ability to pay dividends also depends on the ability of the Bank to pay dividends to us. Furthermore, the present and future dividend policy of the Bank is subject to the discretion of its board of directors.
We cannot guarantee that the Company or the Bank will be permitted by financial condition or applicable regulatory restrictions to pay dividends, that the board of directors of the Bank will elect to pay dividends to us, nor can we guarantee the timing or amount of any dividend actually paid.
Our securities are not FDIC insured.
Securities that we issue, including our common stock, are not savings or deposit accounts or other obligations of any bank, insured by the FDIC, any other governmental agency or instrumentality, or any private insurer, and are subject to investment risk, including the possible loss of our shareholders’ investments.
36
ITEM 1C. CYBERSECURITY
Cybersecurity Risk Management and Strategy
Assessing, identifying and managing material risks from cybersecurity threats is critical for maintaining the security of the Company’s data and information systems, and is integrated into our enterprise risk management systems and processes. The Bank’s approach to cybersecurity risk management and strategy is based on the FFIEC Cybersecurity Assessment Tool (“CAT”), which provides a repeatable and measurable process for evaluating cybersecurity preparedness and assessing, identifying, and managing material risks from cybersecurity threats. The CAT incorporates cybersecurity-related principles from the FFIEC Information Technology Examination Handbook and regulatory guidance, and concepts from other industry standards, including the National Institute of Standards and Technology Cybersecurity Framework.
The CAT consists of two parts: Cybersecurity Inherent Risk Profile and Cybersecurity Maturity. Completion of both parts of the CAT allow management and the Board to evaluate whether the Company’s cybersecurity risk and preparedness are aligned. The Cybersecurity Inherent Risk Profile is the level of risk posed to the Company by technologies and connection types, delivery channels, online/mobile products and technology services, organizational characteristics and external threats. Cybersecurity Maturity is designed to help management measure the Company’s level of risk and corresponding controls under the following five domains: (i) Cyber Risk Management and Oversight; (ii) Threat Intelligence and Collaboration; (iii) Cybersecurity Controls; (iv) External Dependency Management; and (v) Cyber Incident Management and Resilience.
The Information Security Officer (“ISO”) and the Company’s Information Technology Committee conduct and review the CAT annually to identify changes to the Company’s inherent risk profile; when new threats arise or when considering changes to the business strategy, such as expanding operations, offering new products and services, or entering into new third-party relationships that support critical activities. Consequently, management can determine whether additional risk management practices or controls are needed to maintain or augment the Company’s cybersecurity maturity.
In an effort to continually share threat intelligence and increase awareness of cybersecurity trends, the Company has also implemented a Cybersecurity Education and Awareness Program. This program includes the following components:
| ● | Mandatory annual cybersecurity employee training; |
| ● | Training specifically targeted to Senior Management and Information Technology staff; |
| ● | Bimonthly review of emerging security trends by the Information Technology Committee; |
| ● | Mandatory annual cybersecurity Board training; |
| ● | Periodic communication to employees highlighting internal control requirements and information about common threats or fraud schemes; and |
| ● | Periodic communication to the Bank’s customers highlighting emerging threats and good cybersecurity hygiene. |
To date, we have not experienced a cybersecurity incident that has materially impacted our business strategy, results of operations, or financial condition. Despite our efforts, there can be no assurance that our cybersecurity risk management processes and measures described will be fully implemented, complied with, or effective in protecting our systems and information. We face risks from certain cybersecurity threats that, if realized, are reasonably likely to materially affect our business strategy, result of operations or financial condition. Please see Part I, Item 1A. Risk Factors for further discussion of the risks associated with an interruption or breach in our information systems or infrastructure.
Board and Management Governance
The Company’s Board of Directors recognizes the importance of maintaining the trust and confidence of our customers, employees, and shareholders. The Board of Directors’ responsibilities for cybersecurity risk management and strategy include the following:
38
| ● | Engaging management in establishing the Bank’s vision, risk appetite, and overall strategic direction; |
| ● | Approving plans to ensure the use of the CAT; |
| ● | Reviewing management’s analysis of the CAT results, inclusive of any reviews or opinions on the results issued by independent risk management or internal audit functions regarding those results; |
| ● | Reviewing management’s determination of whether the Bank’s cybersecurity preparedness is aligned with its risks; |
| ● | Reviewing and approving plans to address any risk management or control weaknesses; and |
| ● | Reviewing the results of management’s ongoing monitoring of the Bank’s exposure to and preparedness for cyber threats. |
The Company has also appointed an ISO, who reports directly to the Audit Committee and shares a co-sourced relationship with an outside consulting firm. The ISO has been with Bank First for over 10 years in various operational and administrative roles. For the past four years, he has served as the Bank’s Enterprise Risk Manager, and as ISO for the past two years. In 2022, he earned the Certified Banking Security Manager certification from SBS Cybersecurity. The ISO works closely with the head of Information Technology to ensure that the Bank’s cybersecurity controls are in line with established internal culture, Board expectations and risk appetite, and all regulatory requirements. The ISO’s responsibilities include the following:
| ● | Developing a plan to conduct and complete the CAT; |
| ● | Working with the VP-Director of Technology to evaluate the results of the CAT; |
| ● | Leading employee efforts during the CAT to facilitate timely responses from across the Bank; |
| ● | Setting the target state of cybersecurity preparedness that best aligns to the Board of Directors’ approved risk appetite; |
| ● | Reviewing, approving, and supporting plans to address risk management and control weaknesses; |
| ● | Analyzing and presenting the results of the CAT to the Board of Directors; |
| ● | Providing periodic cybersecurity updates to the Board of Directors; |
| ● | Overseeing the performance of ongoing monitoring to remain nimble and agile in addressing evolving areas of cybersecurity risk; and |
| ● | Overseeing the Bank’s cybersecurity preparedness. |
| ● | Finally, the Company has established an Information Technology Committee to support the ISO in implementing the CAT, document formal action plans to be presented to the Board of Directors, enforce and implement the controls established by the CAT, and ensure employee compliance with internal controls |
39
ITEM 2. PROPERTIES
Our main office is located at 402 North 8th Street, Manitowoc, Wisconsin 54220. In addition, the Bank operates twenty-six (26) additional branches located in fourteen (14) counties in Wisconsin, which includes the branches that were acquired in connection with the Company’s recent acquisitions. The addresses of these offices are provided below. We believe these premises will be adequate for present and anticipated needs and that we have adequate insurance to cover our owned and leased premises. For each property that we lease, we believe that upon expiration of the lease we will be able to extend the lease on satisfactory terms or relocate to another acceptable location:
ITEM 3. LEGAL PROCEEDINGS
The Company and its subsidiaries are parties to various claims and lawsuits arising in the course of their normal business activities. Although the ultimate outcome of these suits cannot be ascertained at this time, it is the opinion of management that none of these matters, even if it resolved adversely to the Company, will have a material adverse effect on the Company’s consolidated financial position.
ITEM 4. MINE SAFETY DISCLOSURES
Not applicable.
40
PART II
ITEM 5. MARKET FOR REGISTRANT’S COMMON EQUITY, RELATED STOCKHOLDER MATTERS AND ISSUER PURCHASES OF EQUITY SECURITIES
Bank First registered its common stock under Section 12(b) of the Exchange Act on October 23, 2018, in connection with listing on the Nasdaq Capital Market, and trades under the symbol “BFC”. Prior to October 23, 2018, Bank First’s common stock was traded on the OTC Market Group’s Pink tier under the symbol “BFNC”. The trading volume of Bank First’s common stock is less than that of banks with larger market capitalizations, even though Bank First has improved accessibility to its common stock first through its listing on Nasdaq. As of February 29, 2024, Bank First had approximately 1,658 shareholders of record, 11,515,130 shares issued and 10,141,926 shares outstanding.
Share Repurchase Program
On April 18, 2023, the Company reactivated its share repurchase program, pursuant to which the Company may repurchase up to $26 million of its common stock, par value $0.01 per share, for a period of one (1) year ending on April 17, 2024. The program was announced in a Current Report on Form 8-K on April 19, 2023. The table below sets forth information regarding repurchases of our common stock during the fourth quarter of 2023 under that program and other repurchases.
|
|
| Total Number |
| Maximum Number | ||||
of Shares Repurchased as | of Shares | ||||||||
Part of | that May Yet Be | ||||||||
Total Number of Shares | Average Price Paid per | Publicly Announced | Purchased Under the | ||||||
(in thousands, except per share data) | Repurchased | Share(1) | Plans or Programs | Plans or Programs(2) | |||||
October 2023 |
| 14,611 | $ | 76.59 |
| 12,611 |
| 270,346 | |
November 2023 |
| — |
| — |
| — |
| 270,346 | |
December 2023 |
| — |
| — |
| — |
| 270,346 | |
Total |
| 14,611 | $ | 76.59 |
| 12,611 |
| 270,346 | |
(1) | The average price paid per share is calculated on a trade date basis for all open market transactions and excludes commissions and other transactions expenses. |
(2) | Based on the closing price per share as of December 31, 2023 ($86.66). |
The Inflation Reduction Act of 2022 (“IRA”) created a new nondeductible 1% excise tax on repurchases of corporate stock by certain publicly traded corporations or their specified affiliates after December 31, 2022. The tax is imposed on the fair value of the stock of a covered corporation that is repurchased in a given year, less the fair market value of any stock issued in that year. The Company falls under the definition of a “covered corporation”. The excise tax applies to all of the stock of a covered corporation regardless of whether the corporation has profits or losses. The impact of the IRA on our consolidated financial statements will be dependent on the extent of stock repurchases made in current and future periods.
41
Performance Graph
The following graph compares the yearly percentage change in cumulative shareholder return on Bank First stock with the cumulative total return of the Russell 2000 Index and the Nasdaq Bank Index for the last five fiscal years (assuming a $100 investment on December 31, 2018 and reinvestment of all dividends). The following performance graph and related information are neither “soliciting material” nor “filed” with the SEC, nor shall such information be incorporated by reference into any future filings under the Securities Act or the Exchange Act, except to the extent the Company specifically incorporates it by reference into such filing.
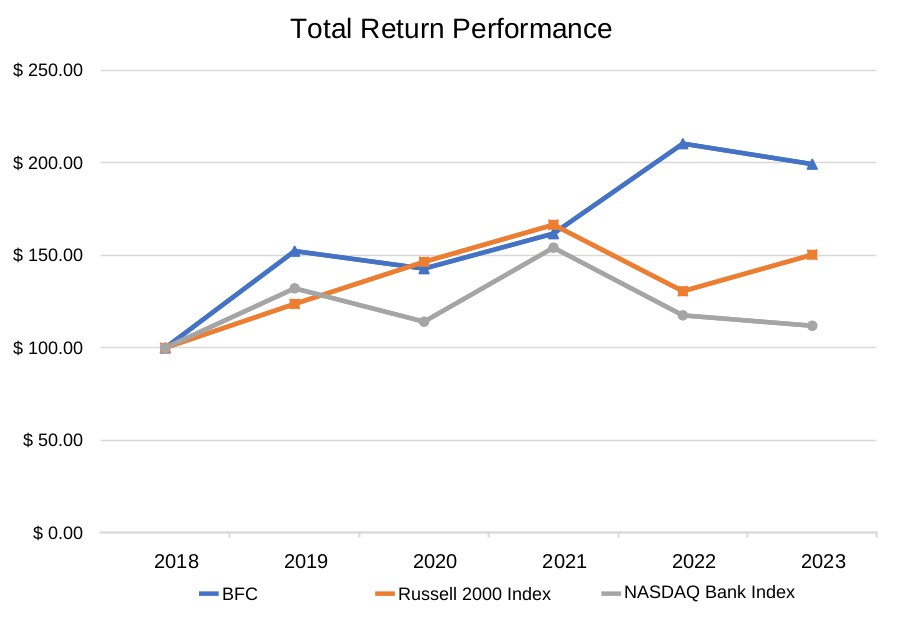
Period Ending | ||||||||||||||||||
Index |
| 12/31/18 |
| 12/31/19 |
| 12/31/20 |
| 12/31/21 |
| 12/31/22 |
| 12/31/23 | ||||||
BFC | $ | 100.00 | $ | 152.29 | $ | 142.81 | $ | 161.74 | $ | 210.36 | $ | 199.27 | ||||||
Russell 2000 |
| 100.00 |
| 123.72 |
| 146.44 |
| 166.50 |
| 130.60 |
| 150.31 | ||||||
Nasdaq Bank |
| 100.00 |
| 132.14 |
| 114.13 |
| 154.12 |
| 117.55 |
| 111.93 | ||||||
ITEM 6. RESERVED
42
ITEM 7. MANAGEMENT’S DISCUSSION AND ANALYSIS OF FINANCIAL CONDITION AND RESULTS OF OPERATIONS
The following discussion and analysis of our consolidated financial condition and results of operations should be read in conjunction with our consolidated financial statements and related notes. Historical results of operations and the percentage relationships among any amounts included, and any trends that may appear, may not indicate trends in operations or results of operations for any future periods. We are a bank holding company and we conduct all of our material business operations through the Bank. As a result, the discussion and analysis above relates to activities primarily conducted at the Bank level.
We have made, and will continue to make, various forward-looking statements with respect to financial and business matters. Comments regarding our business that are not historical facts are considered forward-looking statements that involve inherent risks and uncertainties. Actual results may differ materially from those contained in these forward-looking statements. For additional information regarding our cautionary disclosures, see the “Cautionary Note Regarding Forward-Looking Statements” at the beginning of this Annual Report.
OVERVIEW
Bank First Corporation is a Wisconsin corporation that was organized primarily to serve as the holding company for Bank First, N.A. Bank First, N.A., which was incorporated in 1894, is a nationally-chartered bank headquartered in Manitowoc, Wisconsin. It is a member of the Federal Reserve, and is regulated by the OCC. Including its headquarters in Manitowoc, Wisconsin, the Bank has 26 banking locations in Brown, Columbia, Dane, Fond du Lac, Jefferson, Manitowoc, Monroe, Outagamie, Ozaukee, Shawano, Sheboygan, Waupaca, Waushara, and Winnebago counties in Wisconsin. The Bank offers loan, deposit and treasury management products at each of its banking locations.
As with most community banks, the Bank derives a significant portion of its income from interest received on loans and investments. The Bank’s primary source of funding is deposits, both interest-bearing and noninterest-bearing. In order to maximize the Bank’s net interest income, or the difference between the income on interest-earning assets and the expense of interest-bearing liabilities, the Bank must not only manage the volume of these balance sheet items, but also the yields earned on interest-earning assets and the rates paid on interest-bearing liabilities. To account for credit risk inherent in all loans, the Bank maintains an allowance for credit losses (“ACL – Loans”) to absorb possible losses on existing loans that may become uncollectible. The Bank establishes and maintains this allowance by charging a provision for credit losses against operating earnings. Beyond its net interest income, the Bank further receives income through the net gain on sale of loans held for sale as well as servicing income which is retained on those sold loans. In order to maintain its operations and bank locations, the Bank incurs various operating expenses which are further described within the “Results of Operations” later in this section.
The Bank, through its 100% owned subsidiary TVG Holdings, Inc., holds a 40% ownership interest in Ansay & Associates, LLC, an insurance agency providing clients primarily located in Wisconsin with insurance and risk management solutions. The Bank owned 49.8% of UFS, LLC, which provides data processing solutions to over 60 banks in the Midwest, through October 1, 2023. On that date it sold 100% of its member interest in UFS to a third party. These unconsolidated subsidiary interests contribute noninterest income to the Bank through their underlying annual earnings.
As of December 31, 2023, the Company had total consolidated assets of $4.22 billion, total loans of $3.34 billion, total deposits of $3.43 billion and total stockholders’ equity of $619.8 million. The Company employs approximately 379 full-time equivalent employees and has an assets-to-FTE ratio of approximately $11.1 million. For more information, see the Company’s website at www.bankfirst.com.
Recent acquisitions
Hometown Bancorp, Ltd.
On February 10, 2023, the Company completed a merger with Hometown Bancorp, Ltd. ("Hometown"), a bank holding company headquartered in Fond du Lac, Wisconsin, pursuant to the merger agreement, dated as of July 25, 2022, by and between the Company and Hometown, whereby Hometown merged with and into the Company, and Hometown Bank,
43
Hometown's wholly-owned banking subsidiary, merged with and into the Bank. Hometown's principal activity was the ownership and operation of Hometown Bank, a state-chartered banking institution that operated ten (10) branches in Wisconsin at the time of closing. The merger consideration totaled approximately $130.5 million.
Pursuant to the terms of the merger agreement, Hometown shareholders could elect to receive either 0.3962 of a share of the Company’s common stock or $29.16 in cash for each outstanding share of Hometown common stock, subject to a maximum of 30% cash consideration in total, with cash paid in lieu of any remaining fractional share. Company stock issued totaled 1,450,272 shares valued at approximately $115.1 million, with cash of $15.4 million comprising the remainder of merger consideration.
Denmark Bancshares, Inc.
On August 12, 2022, the Company completed a merger with Denmark Bancshares, Inc. (“Denmark”), a bank holding company headquartered in Denmark, Wisconsin, pursuant to the merger agreement, dated as of January 18, 2022 by and between the Company and Denmark, whereby Denmark merged with and into the Company, and Denmark State Bank, Denmark’s wholly-owned banking subsidiary, merged with and into the Bank. Denmark’s principal activity was the ownership and operation of Denmark State Bank, a state-chartered banking institution that operated seven (7) branches in Wisconsin at the time of closing. The merger consideration totaled approximately $128.8 million.
Pursuant to the terms of the merger agreement, Denmark shareholders could elect to receive either 0.5276 of a share of the Company’s common stock or $38.10 in cash for each outstanding share of Denmark common stock, subject to a maximum of 20% cash consideration in total, with cash paid in lieu of any remaining fractional share. Company stock issued totaled 1,579,530 shares valued at approximately $124.8 million, with cash of $4.0 million comprising the remainder of merger consideration.
The Company accounts for these transactions under the acquisition method of accounting, and thus, the financial position and results of operations of acquired institutions prior to the consummation date are not included in the accompanying consolidated financial statements. The acquisition method of accounting required assets purchased and liabilities assumed to be recorded at their respective fair values at the date of acquisition. The Company determines the fair value of core deposit intangibles, securities, premises and equipment, loans, other assets and liabilities, deposits and borrowings with the assistance of third-party valuations, appraisals, and third-party advisors. The estimated fair values are subject to refinement for up to one year after the consummation as additional information becomes available relative to the closing date fair values.
CRITICAL ACCOUNTING POLICIES AND ACCOUNTING ESTIMATES
The accounting and reporting policies of the Company conform to GAAP in the United States and general practices within the financial institution industry. To prepare financial statements in conformity with GAAP, management makes estimates, assumptions and judgments based on available information. These estimates, assumptions and judgments are based on information available as of the date of the financial statements and, as this information changes, actual results could differ from the estimates, assumptions and judgments reflected in the financial statement. In particular, management has identified several accounting policies that, due to the estimates, assumptions and judgments inherent in those policies, are critical in understanding our financial statements.
The following is a discussion of the critical accounting policies and significant estimates that require us to make complex and subjective judgments. Additional information about these policies can be found in Note 1 of our consolidated financial statements as of December 31, 2023, included elsewhere in this Annual Report on Form 10-K.
Business Combinations, Core Deposit Intangible and Acquired Loans. We account for business combinations under the acquisition method of accounting in accordance with Accounting Standards Codification (ASC) 805, Business Combinations (ASC 805). We recognize the full fair value of the assets acquired and liabilities assumed and immediately expense transaction costs. Fair values are subject to refinement for up to one year after the closing date of an acquisition as information relative to closing date fair values becomes available. Results of operations of the acquired business are included in the statement of income from the effective date of the acquisition.
44
The primary identifiable intangible asset we typically record in connection with a whole bank or branch acquisition is the value of the core deposit intangible which represents the estimated value of the long-term deposit relationships acquired in the transaction. Determining the amount of identifiable intangible assets and their average lives involves multiple assumptions and estimates and is typically determined by performing a discounted cash flow analysis, which involves a combination of any or all of the following assumptions: customer attrition/runoff, alternative funding costs, deposit servicing costs, and discount rates.
Further, the valuation of acquired loans involves significant estimates and assumptions based on information available as of the acquisition date. Loans acquired in a business combination are evaluated either individually or in pools of loans with similar characteristics; including consideration of a credit component. A number of factors are considered in determining the estimated fair value of purchased loans including, among other things, the remaining life of the acquired loans, estimated prepayments, estimated loss ratios, estimated value of the underlying collateral, estimated holding periods, contractual interest rates compared to market interest rates, and net present value of cash flows expected to be received.
Allowance for Credit Losses — Loans. The ACL – Loans represents management’s estimate of expected credit losses in the Company’s loan portfolio at the balance sheet date. The Company estimates the ACL – Loans based on the amortized cost basis of the underlying loan using a current expected credit loss methodology (“CECL”). To estimate the amount of ACL-Loans, the Company considers historical loss rates and other qualitative adjustments, as well as a forward-looking component that considers reasonable and supportable forecasts over the expected life of each loan. The Company’s ACL - Loans is calculated using collectively evaluated and individually evaluated loans. This evaluation is inherently subjective as it requires material estimates that are susceptible to significant change including the amounts and timing of future cash flows expected to be received on loans.
Deferred Tax Assets. Deferred tax assets (“DTA”) and liabilities are determined using the liability method. DTAs and liabilities are determined based on the difference between the financial statement and tax bases of assets and liabilities and the current enacted tax rates which will be in effect when these differences are expected to reverse. Provision (benefit) for deferred taxes is the result of changes in the DTAs and liabilities. Deferred taxes are reviewed quarterly and are reduced by a valuation allowance if, based upon the information available, it is more likely than not that some or all of the DTAs will not be realized.
Recent Accounting Pronouncements. For a discussion of recent accounting pronouncements, see “Note 1 – Summary of Significant Accounting Policies" of the Notes to the Consolidated Financial Statements in Item 8 of this report on Form 10-K for further discussion.
RESULTS OF OPERATIONS
The following discussion and analysis presents the more significant factors that affected our financial condition as of December 31, 2023 and 2022 and results of operations for each of the years then ended. Refer to Management’s Discussion and Analysis of Financial Condition and Results of Operations included in our Annual Report on Form 10-K filed with the SEC on March 10, 2023 for a discussion and analysis of the more significant factors that affected periods prior to 2022.
General. Net income increased $29.3 million, or 64.8%, to $74.5 million for the year ended December 31, 2023, from $45.2 million for the year ended December 31, 2022. During 2023, as a result of the acquisition of Hometown during February 2023 and the impact of the acquisition of Denmark impacting the full year of 2023 compared to less than five months of 2022, the Company experienced increased net interest income, a higher provision for credit losses, an increase in service charge and loan servicing income, and a significant increase in many noninterest expense areas. Also during 2023 the Company sold 100% of its member interest in UFS, LLC, creating a pre-tax gain on sale of $38.9 million. Finally, the Company sold its available for sale US Treasury securities during 2023, creating a pre-tax loss on sale of $7.9 million.
Net Interest Income. The management of interest income and expense is fundamental to our financial performance. Net interest income, the difference between interest income and interest expense, is the largest component of the Company’s total revenue. Management closely monitors both total net interest income and the net interest margin (net interest income divided by average earning assets). We seek to maximize net interest income without exposing the Company to an
45
excessive level of interest rate risk through our asset and liability policies. Interest rate risk is managed by monitoring the pricing, maturity and repricing options of all classes of interest-bearing assets and liabilities. Our net interest margin can also be adversely impacted by the reversal of interest on nonaccrual loans and the reinvestment of loan payoffs into lower yielding investment securities and other short-term investments.
Net interest income after provision for credit losses increased by $26.9 million to $128.8 million for the year ended December 31, 2023, from $101.9 million for the year ended December 31, 2022. Interest income on loans increased by $61.9 million, or 57.8%, from 2022 to 2023. Total average interest-earning assets increased to $3.66 billion for the year ended December 31, 2023 from $3.09 billion for the year ended December 31, 2022. The Bank’s net interest margin increased twenty-eight basis points to 3.69% for the year ended December 31, 2023, up from 3.41% for the year ended December 31, 2022.
Interest Income. Total interest income increased $65.9 million, or 56.6%, to $182.5 million for the year ended December 31, 2023, up from $116.5 million for the year ended December 31, 2022. This increase was driven by an increase in average rates earned on interest-earning assets, rising from 3.82% during 2022 to 5.03% during 2023, and a $565.4 million increase in average interest-earning assets during 2023 when compared to 2022. Most of the growth in average interest-earning assets was the result of the acquisitions of Denmark and Hometown.
Interest Expense. Interest expense increased $36.6 million, or 293.6%, to $49.0 million for the year ended December 31, 2023, up from $12.4 million for the year ended December 31, 2022. The increase was driven by a combination of increases in the average rates paid on interest-bearing liabilities, rising from 0.60% during 2022 to 2.04% during 2023, and a $311.0 million increase in average interest-bearing liabilities. Once again, most of the growth in average interest-bearing liabilities was the result of the acquisitions of Denmark and Hometown.
Interest expense on interest-bearing deposits increased by $32.1 million to $42.4 million for the year ended December 31, 2023, from $10.3 million for the year ended December 31, 2022. This increase was due to a higher interest rate environment driving an increase in average rates paid on interest-bearing deposits, rising from 0.54% during 2022 to 1.84% during 2023, and growth of $398.9 million year-over-year in average interest-bearing deposits.
Provision for Credit Losses. Credit risk is inherent in the business of making loans. We establish an allowance for credit losses through charges to earnings, which are shown in the statements of income as the provision for credit losses. Specifically identifiable and quantifiable known losses are promptly charged off against the allowance. The provision for credit losses is determined by conducting a quarterly evaluation of the adequacy of our allowance for credit losses and charging the shortfall or excess, if any, to the current quarter’s expense. This has the effect of creating variability in the amount and frequency of charges to earnings. The provision for credit losses and level of allowance for each period are dependent upon many factors, including loan growth, net charge-offs, changes in the composition of the loan portfolio, delinquencies, management’s assessment of the quality of the loan portfolio, the valuation of problem loans and the general economic conditions in our market area. The determination of the amount is complex and involves a high degree of judgment and subjectivity.
We recorded a provision for credit losses of $4.7 million for the year ended December 31, 2023, compared to $2.2 million for the year ended December 31, 2022. The increased provision for credit losses during 2023 was primarily result of ASU 2016-13, which was adopted at the beginning of 2023, requiring a provision to be recorded related to loans acquired from Hometown. Metrics regarding the credit quality of the Bank’s loan portfolio continue to show very little in terms of credit stress during 2023. The ACL-Loans was $43.6 million, or 1.30% of total loans, at December 31, 2023 compared to $22.7 million, or 0.78% of total loans at December 31, 2022. The increased ACL - Loans coverage was also the result of adopting ASU 2016-13 as of January 1, 2023.
Noninterest Income. Noninterest income is an important component of our total revenues. A significant portion of our noninterest income has historically been associated with service charges and income from the Bank’s unconsolidated subsidiaries, Ansay and UFS. Other typical sources of noninterest income include loan servicing fees and gains on sales of mortgage loans.
46
Noninterest income increased by $38.4 million, or 195.0% to $58.1 million for 2023, up from $19.7 million during 2022. The primary driver of the increase in noninterest income was the aforementioned $38.9 million pre-tax gain on sale of UFS during 2023. This sale also led to a decrease in the income provided by UFS during 2023 as this revenue stream no longer existed during the final quarter. The continued slowdown in the retail mortgage lending market during 2023 led to a $0.7 million decline in gains on sales of mortgage loans to the secondary market year-over-year. While this slowdown continued from 2022, the positive impact it had on the valuation of the Company’s mortgage servicing rights (“MSR”) was less significant during 2023, leading to only $0.4 million in positive valuation adjustments to MSRs in 2023 compared to $2.9 million in 2022. Finally, income from service charges and loan servicing saw a significant increase year-over-year as a result of added scale from the acquisitions of Denmark and Hometown. The major components of our noninterest income are listed in the table below:
For the Years Ended |
| |||||||
December 31, |
| |||||||
|
| 2023 |
| 2022 |
| |||
(in thousands) |
| |||||||
Noninterest Income |
|
|
|
| ||||
Service charges | $ | 7,033 | $ | 5,810 | ||||
Income from Ansay | 2,922 | 2,558 | ||||||
Income from UFS |
| 2,265 |
| 3,055 | ||||
Loan servicing income |
| 2,860 |
| 1,922 | ||||
Valuation adjustment on MSR | 395 | 2,865 | ||||||
Net gain on sales of mortgage loans |
| 897 |
| 1,560 | ||||
Gain on sale of UFS | 38,904 | — | ||||||
Other |
| 2,839 |
| 1,931 | ||||
Total noninterest income | $ | 58,115 | $ | 19,701 | ||||
47
Noninterest Expense. Noninterest expense increased $26.2 million to $88.1 million for the year ended December 31, 2023, up from $62.0 million for the year ended December 31, 2022. One driver of this increase in noninterest expense was the aforementioned sale of a significant number of available for sale securities during 2023, resulting in a $7.9 million pre-tax loss during 2023. These securities had an average yield of 1.36%. Proceeds of these sales were reinvested in a combination of short and long-term investments with an average yield of 4.98%. Personnel expense increased $7.2 million, or 21.7%, data processing expense increased $1.7 million, or 26.7%, postage, stationary and supplies expense increased $0.3 million, or 40.6%, charitable contributions expense increased by $0.2 million, or 31.5%, advertising expense increased $0.1 million, or 19.9%, and other noninterest expense increased $2.7 million, or 42.1%, all primarily as a result of the added scale from the Denmark and Hometown acquisitions. Outside service fees decreased $0.4 million, or 5.6%, primarily as a result of nearly all legal and professional fees related to the Denmark acquisition and many of these same fees related to the Hometown acquisition occurring during 2022. Amortization of intangibles increased by $4.0 million, or 172.8%, as the acquisitions of Denmark and Hometown created core deposit intangibles of $15.1 million and $16.5 million, respectively, which began amortizing on the date those transactions closed. These acquisitions also resulted in several former bank branches of those institutions becoming other real estate owned, leading to the significant losses on sales and valuations of these buildings during 2023.The major components of our noninterest expense are listed in the table below:
For the Years Ended | |||||||
December 31, | |||||||
2023 | 2022 | ||||||
(In thousands) | |||||||
Noninterest Expense |
|
|
|
| |||
Salaries, commissions, and employee benefits | $ | 40,355 | $ | 33,155 | |||
Occupancy | 5,670 | 5,467 | |||||
Data processing |
| 8,011 |
| 6,324 | |||
Postage, stationary, and supplies |
| 1,084 |
| 771 | |||
Advertising |
| 326 |
| 271 | |||
Charitable contributions |
| 944 | 718 | ||||
Outside service fees |
| 6,350 |
| 6,727 | |||
Net loss (gain) on sales and valuations of other real estate owned |
| 2,133 |
| (146) | |||
Net loss on sales of securities |
| 7,901 |
| — | |||
Amortization of intangibles |
| 6,324 |
| 2,318 | |||
Other |
| 9,021 |
| 6,348 | |||
Total noninterest expenses | $ | 88,119 | $ | 61,953 | |||
Income Tax Expense. We recorded a provision for income taxes of $24.3 million for the year ended December 31, 2023, compared to $14.4 million for the year ended December 31, 2022, reflecting effective tax rates of 24.6% and 24.2%, respectively. The income tax expense related to the gain on sale of UFS offset the impact of legislation passed as part of the 2023 Wisconsin state budget which exempts interest and fees earned on certain commercial loans of $5 million or less made to borrowers who reside or are located in the state of Wisconsin. The expected future reduction in the Bank’s effective tax rate as a result of this legislation resulted in a valuation allowance on our deferred tax assets totaling $2.5 million, adding to income tax expense for 2023.
NET INTEREST MARGIN
Net interest income represents the difference between interest earned, primarily on loans and investments, and interest paid on funding sources, primarily deposits and borrowings. Interest rate spread is the difference between the average rate earned on total interest-earning assets and the average rate paid on total interest-bearing liabilities. Net interest margin is the amount of net interest income, on a fully taxable-equivalent basis, expressed as a percentage of average interest-earning assets. The average rate earned on earning assets is the amount of annualized taxable equivalent interest income expressed as a percentage of average earning assets. The average rate paid on interest-bearing liabilities is equal to annualized interest expense as a percentage of average interest-bearing liabilities.
48
The following tables set forth the distribution of our average assets, liabilities and shareholders’ equity, and average rates earned or paid on a fully taxable equivalent basis for each of the periods indicated:
| For the Year Ended December 31, |
| |||||||||||||||||||||||
2023 | 2022 | 2021 |
| ||||||||||||||||||||||
Interest | Rate | Interest | Rate | Interest | Rate |
| |||||||||||||||||||
Average | Income/ | Earned/ | Average | Income/ | Earned/ | Average | Income/ | Earned/ |
| ||||||||||||||||
| Balance |
| Expenses (1) |
| Paid (1) |
| Balance |
| Expenses (1) |
| Paid (1) |
| Balance |
| Expenses (1) |
| Paid (1) |
| |||||||
(dollars in thousands) | |||||||||||||||||||||||||
ASSETS |
|
|
|
|
|
|
|
|
|
|
|
|
|
|
|
|
|
| |||||||
Interest-earning assets |
|
|
|
|
|
|
|
|
|
|
|
|
|
|
|
|
|
| |||||||
Loans (2) |
|
|
|
|
|
|
|
|
|
|
|
|
|
|
|
|
|
| |||||||
Taxable | $ | 3,172,468 | $ | 165,113 |
| 5.20 | % | $ | 2,434,554 | $ | 103,612 |
| 4.26 | % | $ | 2,128,327 | $ | 90,172 |
| 4.24 | % | ||||
Tax-exempt |
| 103,957 |
| 4,686 |
| 4.51 | % |
| 96,183 |
| 4,227 |
| 4.39 | % |
| 88,978 |
| 4,113 |
| 4.62 | % | ||||
Securities | |||||||||||||||||||||||||
Taxable (available for sale) |
| 185,867 |
| 5,851 |
| 3.15 | % |
| 227,101 |
| 5,230 |
| 2.30 | % |
| 103,277 |
| 2,788 |
| 2.70 | % | ||||
Tax-exempt (available for sale) |
| 36,690 |
| 1,195 |
| 3.26 | % |
| 81,181 |
| 2,140 |
| 2.64 | % |
| 70,864 |
| 2,207 |
| 3.11 | % | ||||
Taxable (held to maturity) |
| 71,908 |
| 2,678 |
| 3.72 | % |
| 24,416 |
| 670 |
| 2.74 | % |
| — |
| — |
| — | % | ||||
Tax-exempt (held to maturity) |
| 4,426 |
| 115 |
| 2.60 | % |
| 5,396 |
| 139 |
| 2.58 | % |
| 6,098 |
| 155 |
| 2.54 | % | ||||
Cash and due from banks |
| 79,822 |
| 4,104 |
| 5.14 | % |
| 220,929 |
| 1,883 |
| 0.85 | % |
| 237,021 |
| 310 |
| 0.13 | % | ||||
Total interest-earning assets |
| 3,655,138 |
| 183,742 |
| 5.03 | % |
| 3,089,760 |
| 117,901 |
| 3.82 | % |
| 2,634,565 |
| 99,745 |
| 3.79 | % | ||||
Non interest-earning assets |
| 447,934 |
|
|
|
|
| 280,249 |
|
|
|
|
| 222,548 |
|
|
|
| |||||||
Allowance for loan losses |
| (41,714) |
|
|
|
|
| (22,152) |
|
|
|
|
| (19,320) |
|
|
|
| |||||||
Total assets | $ | 4,061,358 |
|
|
|
| $ | 3,347,857 |
|
|
|
| $ | 2,837,793 |
|
|
|
| |||||||
LIABILITIES AND SHAREHOLDERS’ EQUITY |
|
|
|
|
|
|
| ||||||||||||||||||
Interest-bearing deposits |
|
|
|
|
|
|
|
|
|
| |||||||||||||||
Checking accounts | $ | 293,568 | $ | 5,362 |
| 1.83 | % | $ | 253,443 | $ | 1,075 |
| 0.42 | % | $ | 209,970 | $ | 252 |
| 0.12 | % | ||||
Savings accounts |
| 833,360 |
| 9,796 |
| 1.18 | % |
| 691,599 |
| 3,099 |
| 0.45 | % |
| 497,958 |
| 1,773 |
| 0.36 | % | ||||
Money market accounts |
| 665,988 |
| 12,722 |
| 1.91 | % |
| 666,717 |
| 3,025 |
| 0.45 | % |
| 664,591 |
| 2,115 |
| 0.32 | % | ||||
Certificates of deposit |
| 509,273 |
| 14,396 |
| 2.83 | % |
| 286,054 |
| 2,818 |
| 0.99 | % |
| 278,602 |
| 2,967 |
| 1.06 | % | ||||
Brokered Deposits |
| 3,184 |
| 90 |
| 2.83 | % |
| 8,587 |
| 251 |
| 2.92 | % |
| 14,718 |
| 420 |
| 2.85 | % | ||||
Total interest bearing deposits |
| 2,305,373 |
| 42,366 |
| 1.84 | % |
| 1,906,400 |
| 10,268 |
| 0.54 | % |
| 1,665,839 |
| 7,527 |
| 0.45 | % | ||||
Other borrowed funds |
| 97,384 |
| 6,637 |
| 6.82 | % |
| 185,329 |
| 2,181 |
| 1.18 | % |
| 63,474 |
| 777 |
| 1.22 | % | ||||
Total interest-bearing liabilities |
| 2,402,757 |
| 49,003 |
| 2.04 | % |
| 2,091,729 |
| 12,449 |
| 0.60 | % |
| 1,729,313 |
| 8,304 |
| 0.48 | % | ||||
Non-interest bearing liabilities |
|
|
|
|
|
|
|
|
|
|
|
|
|
|
|
|
| ||||||||
Demand Deposits |
| 1,078,468 |
|
|
|
|
| 878,727 |
|
|
|
|
| 785,364 |
|
|
|
| |||||||
Other liabilities |
| 10,533 |
|
|
|
|
| 4,971 |
|
|
|
|
| 12,746 |
|
|
|
| |||||||
Total Liabilities |
| 3,491,758 |
|
|
|
|
| 2,975,427 |
|
|
|
|
| 2,527,423 |
|
|
|
| |||||||
Shareholders’ equity |
| 569,600 |
|
|
|
|
| 372,430 |
|
|
|
|
| 310,370 |
|
|
|
| |||||||
Total liabilities & shareholders' equity | $ | 4,061,358 |
|
|
|
| $ | 3,347,857 |
|
|
|
| $ | 2,837,793 |
|
|
|
| |||||||
Net interest income on a fully taxable equivalent basis |
|
| 134,739 |
|
|
|
| 105,452 |
|
|
|
| 91,441 |
|
| ||||||||||
Less taxable equivalent adjustment |
| (1,259) |
| (1,366) |
| (1,359) | |||||||||||||||||||
Net interest income |
|
| $ | 133,480 |
|
|
|
| $ | 104,086 |
|
|
|
| $ | 90,082 |
|
| |||||||
Net interest spread (3) |
|
|
| 2.99 | % |
|
|
| 3.22 | % |
|
|
| 3.31 | % | ||||||||||
Net interest margin (4) |
|
|
|
|
| 3.69 | % |
|
|
|
|
| 3.41 | % |
|
|
|
|
| 3.47 | % | ||||
| (1) | Annualized on a fully taxable equivalent basis calculated using a federal tax rate of 21%. |
| (2) | Nonaccrual loans are included in average amounts outstanding. |
| (3) | Interest rate spread represents the difference between the weighted average yield on interest-earning assets and the weighted average cost of interest-bearing liabilities. |
| (4) | Net interest margin represents net interest income on a fully tax equivalent basis as a percentage of average interest-earning assets. |
49
Rate/Volume Analysis
The following tables describe the extent to which changes in interest rates and changes in the volume of interest-earning assets and interest-bearing liabilities have affected our interest income and interest expense during the periods indicated. Information is provided in each category with respect to: (i) changes attributable to changes in volumes (changes in average balance multiplied by prior year average rate) and (ii) changes attributable to changes in rate (change in average interest rate multiplied by prior year average balance), while (iii) changes attributable to the combined impact of volumes and rates have been allocated proportionately to separate volume and rate categories.
| Twelve Months Ended December 31, 2023 |
| Twelve Months Ended December 31, 2022 | |||||||||||||||
Compared with | Compared with | |||||||||||||||||
Twelve Months Ended December 31, 2022 | Twelve Months Ended December 31, 2021 | |||||||||||||||||
Increase/(Decrease) | Increase/(Decrease) | |||||||||||||||||
Due to Change in | Due to Change in | |||||||||||||||||
Volume | Rate | Total | Volume | Rate | Total | |||||||||||||
(dollars in thousands) | (dollars in thousands) | |||||||||||||||||
Interest income | ||||||||||||||||||
Loans | ||||||||||||||||||
Taxable |
| $ | 35,439 |
| $ | 26,062 |
| $ | 61,501 |
| $ | 13,031 |
| $ | 409 |
| $ | 13,440 |
Tax-exempt | 348 | 111 | 459 | 323 | (209) | 114 | ||||||||||||
Securities | ||||||||||||||||||
Taxable (AFS) | (1,065) | 1,686 | 621 | 2,905 | (463) | 2,442 | ||||||||||||
Tax-exempt (AFS) | (1,366) | 421 | (945) | 297 | (364) | (67) | ||||||||||||
Taxable (HTM) | 1,696 | 312 | 2,008 | 670 | — | 670 | ||||||||||||
Tax-exempt (HTM) | (25) | 1 | (24) | (18) | 2 | (16) | ||||||||||||
Cash and due from banks | (1,884) | 4,105 | 2,221 | (22) | 1,595 | 1,573 | ||||||||||||
Total interest income | 33,143 | 32,698 | 65,841 | $ | 17,186 | $ | 970 | $ | 18,156 | |||||||||
Interest expense | ||||||||||||||||||
Deposits | ||||||||||||||||||
Checking accounts | $ | 196 | $ | 4,091 | $ | 4,287 | $ | 62 | $ | 761 | $ | 823 | ||||||
Savings accounts |
| 751 |
| 5,946 |
| 6,697 |
| 797 |
| 529 |
| 1,326 | ||||||
Money market accounts |
| (3) |
| 9,700 |
| 9,697 |
| 7 |
| 903 |
| 910 | ||||||
Certificates of deposit |
| 3,410 |
| 8,168 |
| 11,578 |
| 78 |
| (227) |
| (149) | ||||||
Brokered Deposits |
| (153) |
| (8) |
| (161) |
| (179) |
| 10 |
| (169) | ||||||
Total interest bearing deposits |
| 4,201 |
| 27,897 |
| 32,098 |
| 765 |
| 1,976 |
| 2,741 | ||||||
Other borrowed funds |
| (1,482) |
| 5,938 |
| 4,456 |
| 1,435 |
| (31) |
| 1,404 | ||||||
Total interest expense |
| 2,719 |
| 33,835 |
| 36,554 |
| 2,200 |
| 1,945 |
| 4,145 | ||||||
Change in net interest income | $ | 30,424 | $ | (1,137) | $ | 29,287 | $ | 14,986 | $ | (975) | $ | 14,011 | ||||||
CHANGES IN FINANCIAL CONDITION
Total Assets. Total assets increased $561.4 million, or 15.3%, to $4.22 billion at December 31, 2023 from $3.66 billion at December 31, 2022. The primary driver of this increase, as with most of the categories below, was our acquisition of Hometown, consisting of $615.1 million in assets, during 2023.
Cash and Cash Equivalents. Cash and cash equivalents increased by $128.1 million, or 107.3%, to $247.5 million at December 31, 2023 from $119.4 million at December 31, 2022.
Investment Securities. The carrying value of total investment securities decreased by $104.2 million to $245.5 million at December 31, 2023 from $349.7 million at December 31, 2022. This decrease was the result of sales of available for sale securities during 2023 as well as maturities of securities for which we chose to retain the funds in cash and cash equivalents rather than reinvest in securities.
Loans. Net loans increased by $428.1 million, or 14.9%, to $3.30 billion at December 31, 2023 from $2.87 billion at December 31, 2022.
50
Bank-Owned Life Insurance. At December 31, 2023, our investment in bank-owned life insurance was $61.3 million, an increase of $15.2 million from $46.1 million at December 31, 2022.
Deposits. Deposits increased $372.7 million, or 12.2%, to $3.43 billion at December 31, 2023 from $3.06 billion at December 31, 2022.
Borrowings. At December 31, 2023 and 2022, borrowings consisted of advances from the FHLB of Chicago, subordinated debt to other banks and a junior subordinated debenture related to the Hometown Bancorp, Ltd. Capital Trust I. FHLB borrowings totaled $35.3 million and $1.9 million at December 31, 2023 and 2022, respectively. Subordinated debt decreased from $23.5 million at December 31, 2022 to $12.0 million at December 31, 2023. The junior subordinated debenture, which resulted from the acquisition of Hometown, totaled $4.1 million at December 31, 2023.
Stockholders’ Equity. Total stockholders’ equity increased $166.7 million, or 36.8%, to $619.8 million at December 31, 2023 from $453.1 million at December 31, 2022.
LOANS
Our lending activities are conducted principally in Wisconsin. The Bank makes commercial and industrial loans, commercial real estate loans, construction and development loans, residential real estate loans, and a variety of consumer loans and other loans. Much of the loans made by the Bank are secured by real estate collateral. The Bank’s commercial business loans are primarily made based on the cash flow of the borrower and secondarily on the underlying collateral provided by the borrower, with liquidation of the underlying real estate collateral typically being viewed as the primary source of repayment in the event of borrower default. Although commercial business loans are also often collateralized by equipment, inventory, accounts receivable, or other business assets, the liquidation of collateral in the event of default is often an insufficient source of repayment. Repayment of the Bank’s residential loans are generally dependent on the health of the employment market in the borrowers’ geographic areas and that of the general economy with liquidation of the underlying real estate collateral being typically viewed as the primary source of repayment in the event of borrower default.
Our loan portfolio is our most significant earning asset, comprising 79.3%, 79.1% and 76.1% of our total assets as of December 31, 2023, 2022 and 2021, respectively. Our strategy is to grow our loan portfolio by originating quality commercial and consumer loans that comply with our credit policies and that produce revenues consistent with our financial objectives. We believe our loan portfolio is well-balanced, which provides us with the opportunity to grow while monitoring our loan concentrations.
Total loans increased $449.0 million, or 15.5%, to $3.34 billion as of December 31, 2023 as compared to $2.89 billion as of December 31, 2022. Our loan growth during the year ended December 31, 2023 has been comprised of a decrease of $4.5 million, or 0.9%, in commercial and industrial loans, an increase of $301.1 million, or 21.5%, in commercial real estate loans, an increase of $1.1 million, or 0.6%, in construction and development loans, an increase of $149.1 million, or 20.2%, in residential 1-4 family loans and an increase of $2.2 million, or 3.5%, in consumer and other loans.
51
The following table presents the balance and associated percentage of each major category in our loan portfolio at December 31, 2023, 2022, and 2021:
| December 31, | |||||||||||||||
% of | % of | % of | ||||||||||||||
(In thousands) | 2023 | Total | 2022 | Total | 2021 | Total | ||||||||||
|
|
|
|
|
| |||||||||||
Commercial & industrial | $ | 487,893 | 15 | % | $ | 492,450 | 17 | % | $ | 366,166 | 16 | % | ||||
Commercial real estate | ||||||||||||||||
Owner Occupied | 894,596 | 27 | % | 716,963 | 25 | % | 574,565 | 26 | % | |||||||
Non-owner occupied | 472,321 | 14 | % | 391,040 | 13 | % | 298,539 | 13 | % | |||||||
Multi-family | 332,757 | 10 | % | 290,580 | 10 | % | 238,353 | 11 | % | |||||||
Construction & Development | 200,835 | 6 | % | 199,708 | 7 | % | 132,454 | 6 | % | |||||||
Residential 1-4 family | 888,639 | 27 | % | 739,514 | 25 | % | 571,845 | 26 | % | |||||||
Consumer | 50,950 | 1 | % | 44,963 | 2 | % | 32,131 | 1 | % | |||||||
Other Loans | 14,983 | — | % | 18,760 | 1 | % | 21,461 | 1 | % | |||||||
Total Loans | $ | 3,342,974 | 100 | % | $ | 2,893,978 | 100 | % | $ | 2,235,514 | 100 | % | ||||
Our directors and officers and their affiliates are customers of, and have other transactions with, the Bank in the normal course of business. All loans and commitments included in such transactions were made on substantially the same terms, including interest rates and collateral, as those prevailing at the time for comparable transactions with other persons and do not involve more than normal risk of collection or present other unfavorable features. At December 31, 2023 and December 31, 2022, total loans outstanding to such directors and officers and their affiliates were $63.9 million and $70.2 million, respectively. During the year ended December 31, 2023, $24.5 million of additions and $30.8 million of repayments were made to these loans, compared to $46.5 million of additions and $49.8 million of repayments during the year ended December 31, 2022. At December 31, 2023 and December 31, 2022, all of the loans to directors and officers were performing according to their original terms.
Loan segments
Changes in the principal segments of our loan portfolio are discussed below. Descriptions of and risks related to these segments can be found in the consolidated financial statements and footnotes presented elsewhere in this report.
Commercial and Industrial (C&I). Our C&I portfolio totaled $487.9 million and $492.5 million at December 31, 2023 and 2022, respectively, and represented 15% and 17% of our total loans, respectively. C&I loans decreased 0.9% during 2023, as a result of exiting a few nonperforming borrowers and borrowers from acquired institutions that did not fit the Bank’s lending philosophy. C&I loans increased 34.5% during 2022 primarily as a result of loans acquired from Denmark during 2022, slightly offset by significant levels of PPP loans being forgiven during the year.
Commercial Real Estate (CRE). Our CRE loan portfolio totaled $1.70 billion and $1.40 billion at December 31, 2023 and 2022, respectively, and represented 51% and 48% of our total loans, respectively. Our CRE loans increased 21.5% during 2023, primarily as a result of loans acquired from Hometown during 2023. Our CRE loans increased 25.8% during 2022, primarily as a result of loans acquired from Denmark during 2022.
Construction and Development (C&D). Our C&D loan portfolio totaled $200.8 million and $199.7 million at December 31, 2023 and 2022, respectively, and represented 6% and 7% of our total loans, respectively. C&D loans increased 0.6% during 2023, as a result of management making a strategic decision to limit growth in this area. C&D loans increased 50.8% during 2022, primarily as a result of loans acquired from Denmark during 2022.
Residential 1-4 Family. Our residential 1-4 family loan portfolio totaled $888.6 million and $739.5 million at December 31, 2023 and 2022, respectively, and represented 27% and 25% of our total loans, respectively. Residential 1-4 family loans increased 20.2% during 2023, primarily as a result of loans acquired from Hometown during 2023. Residential 1-4 family loans increased 29.3% during 2022, primarily as a result of loans acquired from Denmark during 2022.
52
We do not offer reverse mortgages nor do we offer loans that provide for negative amortization of principal, such as “Option ARM” loans, where the borrower can pay less than the interest owed on his loan, resulting in an increased principal balance during the life of the loan. We also do not offer “subprime loans” (loans that are made with low down payments to borrowers with weakened credit histories typically characterized by payment delinquencies, previous charge-offs, judgments, bankruptcies, or borrowers with questionable repayment capacity as evidenced by low credit scores or high debt-burden ratios) or Alt-A loans (defined as loans having less than full documentation).
Residential real estate loans are originated both for sale to the secondary market as well as for retention in the Bank’s loan portfolio. The decision to sell a loan to the secondary market or retain within the portfolio is determined based on a variety of factors including but not limited to our asset/liability position, the current interest rate environment, and customer preference. Servicing rights are retained on all loans sold to the secondary market.
We were servicing mortgage loans sold to others without recourse of approximately $1.18 billion and $866.9 million at December 31, 2023 and 2022, respectively.
Loans sold with the retention of servicing assets result in the capitalization of servicing rights. Loan servicing rights are subsequently amortized as an offset to other income over the estimated period of servicing. The net balance of capitalized servicing rights amounted to $13.7 million and $9.6 million at December 31, 2023 and 2022, respectively.
Consumer Loans. Our consumer loan portfolio totaled $51.0 million and $45.0 million at December 31, 2023 and 2022, respectively, and represented 1% and 2% of our total loans, respectively. Consumer loans include secured and unsecured loans, lines of credit and personal installment loans. Our consumer loans increased by 13.3% and 39.9% during 2023 and 2022, respectively.
Other Loans. Our other loans totaled $15.0 million and $18.8 million at December 31, 2023 and 2022, respectively, and are immaterial to the overall loan portfolio. The other loans category consists primarily of overdrawn depository accounts, loans utilized to purchase or carry securities and loans to nonprofit organizations.
53
Loan Portfolio Maturities.
The following tables summarize the dollar amount of loans maturing in our portfolio based on their loan type, fixed or variable rate of interest, and contractual terms to maturity at December 31, 2023. The tables do not include any estimate of prepayments, which can significantly shorten the average life of all loans and may cause our actual repayment experience to differ from that shown below. Demand loans, loans having no stated repayment schedule or maturity, and overdraft loans are reported as being due in one year or less.
One Year or | One to Five | Five to Fifteen | Over Fifteen | ||||||||||||
Less | Years | Years | Years | Total | |||||||||||
(dollars in thousands) | |||||||||||||||
Commercial & industrial |
| $ | 101,801 |
| $ | 256,078 |
| $ | 126,788 | $ | 3,226 |
| $ | 487,893 | |
Commercial real estate | |||||||||||||||
Owner Occupied | 90,210 | 387,505 | 339,011 | 77,870 | 894,596 | ||||||||||
Non-owner Occupied | 57,783 | 237,426 | 168,851 | 8,261 | 472,321 | ||||||||||
Multi-family | 14,159 | 128,422 | 189,825 | 351 | 332,757 | ||||||||||
Construction & Development | 27,899 | 56,405 | 61,798 | 54,733 | 200,835 | ||||||||||
Residential 1-4 family | 15,601 | 104,794 | 236,583 | 531,661 | 888,639 | ||||||||||
Consumer and other | 6,094 | 38,862 | 16,633 | 4,344 | 65,933 | ||||||||||
Total | $ | 313,547 | $ | 1,209,492 | $ | 1,139,489 | $ | 680,446 | $ | 3,342,974 | |||||
Fixed Rate Loans: | |||||||||||||||
Commercial & industrial | $ | 12,626 | $ | 222,308 | $ | 88,840 | $ | 3,171 | $ | 326,945 | |||||
Commercial real estate | |||||||||||||||
Owner Occupied | 37,726 | 331,781 | 147,682 | 21,031 | 538,220 | ||||||||||
Non-owner Occupied | 49,109 | 227,264 | 56,423 | — | 332,796 | ||||||||||
Multi-family | 14,104 | 123,124 | 135,746 | — | 272,974 | ||||||||||
Construction & Development | 17,722 | 53,231 | 45,238 | 35,430 | 151,621 | ||||||||||
Residential 1-4 family | 8,132 | 84,741 | 192,964 | 277,503 | 563,340 | ||||||||||
Consumer and other | 5,247 | 37,888 | 16,173 | 4,344 | 63,652 | ||||||||||
Total | $ | 144,666 | $ | 1,080,337 | $ | 683,066 | $ | 341,479 | $ | 2,249,548 | |||||
Floating Rate Loans: | |||||||||||||||
Commercial & industrial | $ | 89,175 | $ | 33,770 | $ | 37,948 | $ | 55 | $ | 160,948 | |||||
Commercial real estate | |||||||||||||||
Owner Occupied | 52,484 | 55,724 | 191,329 | 56,839 | 356,376 | ||||||||||
Non-owner Occupied | 8,674 | 10,162 | 112,428 | 8,261 | 139,525 | ||||||||||
Multi-family | 55 | 5,298 | 54,079 | 351 | 59,783 | ||||||||||
Construction & Development | 10,177 | 3,174 | 16,560 | 19,303 | 49,214 | ||||||||||
Residential 1-4 family | 7,469 | 20,053 | 43,619 | 254,158 | 325,299 | ||||||||||
Consumer and other | 847 | 974 | 460 | — | 2,281 | ||||||||||
Total | $ | 168,881 | $ | 129,155 | $ | 456,423 | $ | 338,967 | $ | 1,093,426 | |||||
NONPERFORMING ASSETS
In order to operate with a sound risk profile, we focus on originating loans that we believe to be of high quality. We have established loan approval policies and procedures to assist us in maintaining the overall quality of our loan portfolio. When delinquencies in our loans exist, we rigorously monitor the levels of such delinquencies for any negative or adverse trends. From time to time, we may modify loans to extend the term or make other concessions to help a borrower with a deteriorating financial condition stay current on their loan and to avoid foreclosure. We generally do not forgive principal or interest on loans or modify the interest rates on loans to rates that are below market rates. Furthermore, we are committed to collecting on all of our loans and, as a result, at times have lower net charge-offs compared to many of our peer banks. We believe that our commitment to collecting on all of our loans results in higher loan recoveries.
54
Our nonperforming assets consist of nonperforming loans and foreclosed real estate. Nonperforming loans are those on which the accrual of interest has stopped, as well as loans that are contractually 90 days past due on which interest continues to accrue. The composition of our nonperforming assets is as follows:
| As of December 31, |
| As of December 31, |
| As of December 31, |
| ||||
2023 | 2022 | 2021 |
| |||||||
| (dollars in thousands) | |||||||||
Nonperforming loans | ||||||||||
Nonaccrual loans | ||||||||||
Commercial & industrial | $ | 1,344 | $ | 418 | $ | 247 | ||||
Commercial real estate | ||||||||||
Owner Occupied | 3,877 | 2,688 | 5,884 | |||||||
Non-owner Occupied | — | — | 650 | |||||||
Multi-family | — | — | — | |||||||
Construction & Development | — | 17 | 19 | |||||||
Residential 1-4 family | 429 | 505 | 439 | |||||||
Consumer and other | 12 | — | 2 | |||||||
Total nonaccrual loans | 5,662 | 3,628 | 7,241 | |||||||
Loans past due > 90 days, but still accruing | ||||||||||
Commercial & industrial | 106 | — | 738 | |||||||
Commercial real estate | ||||||||||
Owner Occupied | 252 | — | — | |||||||
Non-owner Occupied | — | — | — | |||||||
Multi-family | — | — | — | |||||||
Construction & Development | — | — | — | |||||||
Residential 1-4 family | 507 | 268 | 245 | |||||||
Consumer and other | 28 | 5 | 16 | |||||||
Total loans past due > 90 days, but still accruing | 893 | 273 | 999 | |||||||
Total nonperforming loans | $ | 6,555 | $ | 3,901 | $ | 8,240 | ||||
OREO | ||||||||||
Commercial real estate owned | $ | — | $ | — | $ | — | ||||
Residential real estate owned | — | — | 10 | |||||||
Acquired bank property real estate owned | 2,573 | 2,520 | 140 | |||||||
Total OREO | $ | 2,573 | $ | 2,520 | $ | 150 | ||||
Total nonperforming assets ("NPAs") | $ | 9,128 | $ | 6,421 | $ | 8,390 | ||||
Accruing modified loans to borrowers experiencing financial difficulty (1) | $ | 21 | $ | 450 | $ | 484 | ||||
Ratios | ||||||||||
Nonaccrual loans to total loans | 0.17 | % | 0.13 | % | 0.32 | % | ||||
NPAs to total loans plus OREO | 0.27 | % | 0.22 | % | 0.38 | % | ||||
NPAs to total assets | 0.21 | % | 0.18 | % | 0.29 | % | ||||
ACL - Loans to nonaccrual loans | 770 | % | 625 | % | 281 | % | ||||
ACL - Loans to total loans | 1.30 | % | 0.78 | % | 0.91 | % | ||||
| (1) | Amounts prior to January 1, 2023 represent accruing troubled debt restructured loans. |
At December 31, 2023, 2022 and 2021, loans individually evaluated had specific reserves of $4,245,000, $8,000 and $964,000, respectively. Levels of specific reserves are dependent on the specific underlying impaired loans at any given time. Management has evaluated the aforementioned loans and other loans classified as nonperforming and believes that all nonperforming loans have been adequately reserved for in the allowance for credit losses at December 31, 2023.
55
Nonaccrual Loans
Loans are typically placed on nonaccrual status when any payment of principal and/or interest is 90 days or more past due, unless the collateral is sufficient to cover both principal and interest and the loan is in the process of collection. Loans are also placed on nonaccrual status when management believes, after considering economic and business conditions, that the principal or interest will not be collectible in the normal course of business. We monitor closely the performance of our loan portfolio. In addition to the monitoring and review of loan performance internally, we have also contracted with an independent organization to review our commercial and retail loan portfolios. The status of delinquent loans, as well as situations identified as potential problems, is reviewed on a regular basis by senior management.
ALLOWANCE FOR CREDIT LOSSES - LOANS
The Company assesses the adequacy of its ACL - Loans at the end of each calendar quarter. The level of ACL - Loans is based on the Company’s evaluation of historical default and loss experience, current and projected economic conditions, asset quality trends, known and inherent risks in the portfolio, adverse situations that may affect the borrowers’ ability to repay a loan, the estimated value of any underlying collateral, composition of the loan portfolio and other relevant factors. The ACL - Loans is increased by a provision for credit losses, which is charged to expense, when the analysis shows that an increase is warranted. The ACL – Loans is reduced by charge-offs, net of recoveries, when they occur. The ACL is believed adequate to absorb all expected future losses to be recognized over the contractual life of the loans in the portfolio.
For further details on the Company’s ACL – Loans, refer to the footnotes presented along with the consolidated financial statements elsewhere in this report.
At December 31, 2023, the ACL - Loans was $43.6 million (representing 1.30% of period end loans). The Company adopted CECL as of January 1, 2023, which increased the ACL - Loans by $11.0 million. In addition, the ACL - Loans increased due to the acquisition of Hometown, which required a $3.6 million provision for credit losses on non-Purchase Credit Deteriorated (“PCD”) loans and a $5.5 million reserve related to PCD loans. The reserve related to PCD loans was recorded as an adjustment to the acquisition date fair values on these loans and was not included in the provision for credit losses. Net charge-offs remain negligible.
56
The following table summarizes the changes in our ACL - Loans for the years indicated:
Year ended | Year ended | Year ended | ||||||||
December 31, | December 31, | December 31, | ||||||||
2023 | 2022 | 2021 |
| |||||||
(dollars in thousands) | ||||||||||
Balance of ACL - Loans at the beginning of period |
| $ | 22,680 |
| $ | 20,315 |
| $ | 17,658 |
|
Adoption of CECL | 10,972 | — | — | |||||||
ACL - Loans on PCD loans acquired | 5,534 | — | — | |||||||
Net loans charged-off (recovered): |
|
|
|
| ||||||
Commercial & industrial |
| (22) |
| (499) |
| 180 |
| |||
Commercial real estate - owner occupied |
| (70) |
| 816 |
| 275 |
| |||
Commercial real estate - non-owner occupied |
| — |
| (360) |
| (5) |
| |||
Commercial real estate - multi-family | — | — | — | |||||||
Construction & Development |
| — |
| (152) |
| (143) |
| |||
Residential 1-4 family |
| (106) |
| 26 |
| 110 |
| |||
Consumer |
| — |
| 21 |
| 6 |
| |||
Other Loans |
| 67 |
| (17) |
| 20 |
| |||
Total net loans recovered |
| (131) |
| (165) |
| 443 |
| |||
Provision charged to operating expense |
| 4,292 |
| 2,200 |
| 3,100 |
| |||
Balance of ACL - Loans at end of period | $ | 43,609 | $ | 22,680 | $ | 20,315 | ||||
Ratio of net charge-offs (recoveries) to average loans by loan composition | ||||||||||
Commercial & industrial |
| (0.00) | % |
| (0.12) | % |
| 0.05 | % | |
Commercial real estate - owner occupied |
| (0.01) | % |
| 0.13 | % |
| 0.05 | % | |
Commercial real estate - non-owner occupied |
| — | % |
| (0.06) | % |
| — | % | |
Commercial real estate - multi-family | — | % | — | % | — | % | ||||
Construction & Development |
| — | % |
| (0.09) | % |
| (0.11) | % | |
Residential 1-4 family |
| (0.01) | % |
| — | % |
| 0.02 | % | |
Consumer |
| — | % |
| 0.05 | % |
| 0.02 | % | |
Other Loans |
| 0.36 | % |
| (0.04) | % |
| 0.07 | % | |
Total net charge-offs (recoveries) to average loans |
| (0.00) | % |
| (0.01) | % |
| 0.02 | % | |
The level of charge-offs depends on many factors, including the national and regional economy. Cyclical lagging factors may result in charge-offs being higher than historical levels. The dollar amount of the ACL - Loans increased primarily as a result of loan growth and changes in the portfolio composition. Although the allowance is allocated between categories, the entire allowance is available to absorb losses attributable to all loan categories. Management believes that the ACL - Loans is adequate.
57
The following table summarizes an allocation of the ACL - Loans and the related percentage of loans outstanding in each category for the periods below.
As of December 31 | ||||||||||||||||
2023 | 2022 | 2021 | ||||||||||||||
% of | % of | % of | ||||||||||||||
(in thousands, except %) |
| Amount |
| Loans |
| Amount |
| Loans |
| Amount |
| Loans |
| |||
Loan Type: |
|
|
|
|
|
|
|
|
|
|
|
|
| |||
Commercial & industrial | $ | 5,965 |
| 15 | % | $ | 4,071 |
| 17 | % | $ | 3,699 |
| 16 | % | |
Commercial real estate - owner occupied |
| 12,285 |
| 27 | % |
| 5,204 |
| 25 | % |
| 5,633 |
| 26 | % | |
Commercial real estate - non-owner occupied |
| 5,700 |
| 14 | % |
| 2,644 |
| 23 | % |
| 3,123 |
| 14 | % | |
Commercial real estate - multi-family | 4,754 | 10 | % | 2,761 | % | 2,028 | 10 | % | ||||||||
Construction & development |
| 3,597 |
| 6 | % |
| 1,592 |
| 7 | % |
| 984 |
| 6 | % | |
Residential 1-4 family |
| 10,620 |
| 27 | % |
| 5,944 |
| 25 | % |
| 4,445 |
| 26 | % | |
Consumer |
| 615 |
| 1 | % |
| 314 |
| 2 | % |
| 224 |
| 1 | % | |
Other loans |
| 73 |
| — | % |
| 150 |
| 1 | % |
| 179 |
| 1 | % | |
Total allowance | $ | 43,609 |
| 100 | % | $ | 22,680 |
| 100 | % | $ | 20,315 |
| 100 | % | |
SOURCES OF FUNDS
General. Deposits traditionally have been our primary source of funds for our investment and lending activities. We continue to focus on growing core deposits through our relationship driven banking philosophy and community-focused marketing programs. We also borrow from the FHLB of Chicago to supplement cash needs, to lengthen the maturities of liabilities for interest rate risk management purposes and to manage our cost of funds. Our additional sources of funds are scheduled payments and prepayments of principal and interest on loans and investment securities and fee income and proceeds from the sales of loans and securities.
Deposits. Our current deposit products include non-interest bearing and interest-bearing checking accounts, savings accounts, money market accounts, and certificate of deposits. As of December 31, 2023, deposit liabilities accounted for approximately 81.3% of our total liabilities and equity. We accept deposits primarily from customers in the communities in which our branches and offices are located, as well as from small businesses and other customers throughout our lending area. We rely on our competitive pricing and products, quality customer service, and convenient locations and hours to attract and retain deposits. Deposit rates and terms are based primarily on current business strategies, market interest rates, liquidity requirements and our deposit growth goals.
Total deposits were $3.43 billion and $3.06 billion as of December 31, 2023 and 2022, respectively. Noninterest-bearing deposits at December 31, 2023 and 2022 were $1.05 billion and $934.1 million, respectively, while interest-bearing deposits were $2.38 billion and $2.13 billion at December 31, 2023 and 2022, respectively.
At December 31, 2023, we had a total of $582.0 million in certificates of deposit, including $0.7 million of brokered deposits, of which $0.7 million had remaining maturities of one year or less. Based on historical experience and our current pricing strategy, we believe we will retain a large portion of these accounts upon maturity.
58
The following tables set forth the average balances of our deposits for the periods indicated:
Year ended | Year ended | Year ended | |||||||||||||||
December 31, 2023 | December 31, 2022 | December 31, 2021 | |||||||||||||||
| Amount |
| Percent |
| Amount |
| Percent |
| Amount |
| Percent |
| |||||
| (dollars in thousands) |
| |||||||||||||||
Noninterest-bearing demand deposits |
| $ | 1,078,468 |
| 31.9 | % | $ | 878,727 |
| 31.6 | % | $ | 785,364 |
| 32.0 | % | |
Interest-bearing checking deposits |
| 293,568 |
| 8.7 | % |
| 253,443 |
| 9.1 | % |
| 209,970 |
| 8.6 | % | ||
Savings deposits |
| 833,360 |
| 24.6 | % |
| 691,599 |
| 24.8 | % |
| 497,958 |
| 20.3 | % | ||
Money market accounts |
| 665,988 |
| 19.7 | % |
| 666,717 |
| 23.9 | % |
| 664,591 |
| 27.1 | % | ||
Certificates of deposit |
| 509,273 |
| 15.1 | % |
| 286,054 |
| 10.3 | % |
| 278,602 |
| 11.4 | % | ||
Brokered deposits |
| 3,184 |
| 0.1 | % |
| 8,587 |
| 0.3 | % |
| 14,718 |
| 0.6 | % | ||
Total | $ | 3,383,841 |
| 100 | % | $ | 2,785,127 | 100 | % | $ | 2,451,203 |
| 100 | % | |||
The following table provides information on maturities of certificates of deposits which exceed FDIC insurance limits of $250,000 as of December 31, 2023:
Time Deposits over FDIC | Portion of Time Deposits in | |||||
Insurance Limits |
| Excess of FDIC Insurance Limits | ||||
| (dollars in thousands) | |||||
3 months or less remaining | $ | 62,889 | $ | 34,139 | ||
Over 3 to 6 months remaining |
| 26,972 |
| 10,472 | ||
Over 6 to 12 months remaining |
| 41,665 |
| 21,665 | ||
Over 12 months or more remaining |
| 11,169 |
| 3,919 | ||
Total | $ | 142,695 | $ | 70,195 | ||
Borrowings
Deposits and investment securities for sale are the primary source of funds for our lending activities and general business purposes. However, we may also obtain advances from the FHLB, purchase federal funds and engage in overnight borrowing from the Federal Reserve, correspondent banks, or enter into repurchase agreements.
Securities sold under repurchase agreements
The Company has securities sold under repurchase agreements which have contractual maturities up to one year from the transaction date with variable and fixed rate terms. The agreements to repurchase require that the Company (seller) repurchase identical securities as those that are sold. The securities underlying the agreements are under the Company’s control.
The following table summarizes securities sold under repurchase agreements, and the weighted average interest rates paid:
Year ended December 31, | |||||||||||
(dollars in thousands) |
|
| 2023 |
| 2022 |
| 2021 |
| |||
Average daily amount of securities sold under repurchase agreements during the period | $ | 36,833 | $ | 25,749 | $ | 34,637 | |||||
Weighted average interest rate on average daily securities sold under repurchase agreements |
| 4.92 | % |
| 2.11 | % |
| 0.03 | % | ||
Maximum outstanding securities sold under repurchase agreements at any month-end | $ | 75,747 | $ | 97,196 | $ | 57,915 | |||||
Securities sold under repurchase agreements at period end | $ | 75,747 | $ | 97,196 | $ | 41,122 | |||||
Weighted average interest rate on securities sold under repurchase agreements at period end |
| 5.31 | % |
| 4.31 | % |
| 0.02 | % | ||
59
Lines of credit and other borrowings
The Company’s other borrowings have historically consisted primarily of short-term FHLB of Chicago advances collateralized by a blanket pledge agreement on the Company’s FHLB capital stock and retail and commercial loans held in the Company’s portfolio. There were $35.3 million and $1.9 million of advances outstanding from the FHLB at December 31, 2023 and 2022, respectively. See Note 14 “Notes Payable” of the Notes to Consolidated Financial Statements under Part II, Item 8 for additional disclosures.
The total loans pledged as collateral were $1.49 billion and $1.15 billion at December 31, 2023 and 2022, respectively.
The Company maintains a $7.5 million line of credit with a commercial bank, which was entered into on May 15, 2022. There were no outstanding balances on this note at December 31, 2023 or 2022. Any future borrowings will require monthly payments of interest at a variable rate, and will be due in full on May 15, 2024.
During September 2017, the Company entered into subordinated note agreements with three separate commercial banks under which it borrowed $11.5 million. These notes were all issued with 10-year maturities, carried interest at a variable rate payable quarterly, were callable on or after the sixth anniversary of the issuance dates, and qualified for Tier 2 capital for regulatory purposes. These notes were repaid in full during October 2023.
On July 22, 2020, the Company entered into subordinated note agreements with two separate commercial banks. The Company had through December 31, 2020, to borrow funds up to a maximum availability of $6.0 million under each agreement, or $12.0 million total. These notes were issued with 10-year maturities, carry interest at a fixed rate of 5.0% through June 30, 2025, and at a variable rate thereafter, payable quarterly. These notes are callable on or after January 1, 2026 and qualify for Tier 2 capital for regulatory purposes. The Company had outstanding balances of $6.0 million under these agreements at December 31, 2023 and 2022.
During August 2022, the Company entered into subordinated note agreements with an individual. The Company had outstanding balances of $6.0 million under these agreements as of December 31, 2023 and 2022. These notes were issued with 10-year maturities, carry interest at a fixed rate of 5.25% through August 6, 2027, and at a variable rate thereafter, payable quarterly. These notes are callable on or after August 6, 2027 and qualify for Tier 2 capital for regulatory purposes. The individual associated with these subordinated note agreements is not a related party of the Company.
As a result of the acquisition of Hometown during February 2023, the Company acquired all of the common securities of Hometown’s wholly-owned subsidiaries, Hometown Bancorp, Ltd. Capital Trust I (“Trust I”) and Hometown Bancorp, Ltd. Capital Trust II (“Trust II”). The Company also assumed adjustable rate junior subordinated debentures issued to these trusts. The junior subordinated debentures issued to Trust I and Trust II totaled $4.1 million and $8.2 million, respectively, carried interest at floating rates resetting on each quarterly payment date, and were due on January 7, 2034 and December 15, 2036, respectively. Applicable discounts originally totaling $1.5 million were recorded to carry the assumed debentures at their then estimated fair value and were being accreted to interest expense over the remaining life of the debentures. Both junior subordinated debentures were redeemable by the Company, subject to prior approval by the Federal Reserve Bank, on any quarterly payment date. The junior subordinated debentures represented the sole asset of Trust I and Trust II. The trusts were not included in the Company’s consolidated financial statements. The net effect of all agreements assumed with respect to Trust I and Trust II is that the Company, through payments on its debentures, was liable for the distributions and other payments required on the trusts’ preferred securities. Trust I and Trust II also provided the Company with $12.0 million in Tier 1 capital for regulatory capital purposes. The Company redeemed the junior subordinated debenture related to Trust II during December 2023, resulting in Trust II’s dissolution. The Company redeemed the junior subordinated debenture related to Trust I on January 8, 2024, resulting in Trust I’s dissolution. As a result of the redemption of the junior subordinated debenture related to Trust II and notification of the Company’s intent to redeem the junior subordinated debenture of Trust I prior to December 31, 2023, the Company amortized the remaining original fair value discounts into interest expense during 2023.
60
INVESTMENT SECURITIES
Our securities portfolio consists of securities available for sale and securities held to maturity. Securities are classified as held to maturity or available for sale at the time of purchase. Obligations of states and political subdivisions and mortgage-backed securities, all of which are issued by U.S. government agencies or U.S. government-sponsored enterprises, make up the largest components of the securities portfolio. We manage our investment portfolio to provide an adequate level of liquidity as well as to maintain neutral interest rate-sensitive positions, while earning an adequate level of investment income without taking undue or excessive risk.
Securities available for sale consist of U.S. Treasury securities, obligations of states and political subdivision, agency mortgage-backed securities, corporate notes, and certificates of deposits. Securities classified as available for sale, which management has the intent and ability to hold for an indefinite period of time, but not necessarily to maturity, are carried at fair value, with unrealized gains and losses, net of related deferred income taxes, included in stockholders’ equity as a separate component of other comprehensive income. The fair value of securities available for sale totaled $142.2 million and included gross unrealized gains of $86,000 and gross unrealized losses of $12.2 million at December 31, 2023. At December 31, 2022, the fair value of securities available for sale totaled $304.6 million and included gross unrealized gains of $0.5 million and gross unrealized losses of $21.8 million.
Securities classified as held to maturity consist of U.S. Treasury securities and obligations of states and political subdivisions. These securities, which management has the intent and ability to hold to maturity, are reported at amortized cost. Securities held to maturity as of December 31, 2023 and 2022, are carried at their amortized cost of $103.3 million and $45.1 million, respectively.
The Company recognized a net loss on sale of investment securities of $7.9 million during the year ended December 31, 2023. The Company did not sell any securities in 2022.
The following tables set forth the composition and maturities of investment securities as of December 31, 2023 and December 31, 2022. Actual maturities may differ from contractual maturities because borrowers may have the right to call or prepay obligations with or without call or prepayment penalties.
After One, But | After Five, But |
| ||||||||||||||||||||||||
Within One Year | Within Five Years | Within Ten Years | After Ten Years | Total |
| |||||||||||||||||||||
Weighted | Weighted | Weighted | Weighted | Weighted |
| |||||||||||||||||||||
Amortized | Average | Amortized | Average | Amortized | Average | Amortized | Average | Amortized | Average |
| ||||||||||||||||
At December 31, 2023 |
| Cost |
| Yield (1) |
| Cost |
| Yield (1) |
| Cost |
| Yield (1) |
| Cost |
| Yield (1) |
| Cost |
| Yield (1) |
| |||||
(dollars in thousands) | ||||||||||||||||||||||||||
Available for sale securities |
|
|
|
|
|
|
|
|
|
|
|
|
|
|
|
|
|
|
|
| ||||||
Obligations of U.S. Government sponsored agencies | $ | 980 |
| 5.1 | % | $ | 1,464 |
| 5.0 | % | $ | 16,202 |
| 2.2 | % | $ | 12,807 |
| 2.2 | % | $ | 31,453 |
| 2.5 | % | |
Obligations of states and political subdivisions |
| — |
| — | % |
| 9,828 |
| 4.1 | % |
| 14,542 |
| 3.5 | % |
| 39,559 |
| 2.8 | % |
| 63,929 |
| 3.1 | % | |
Mortgage-backed securities |
| 3,579 |
| 2.6 | % |
| 8,649 |
| 3.3 | % |
| 11,788 |
| 4.1 | % |
| 13,773 |
| 3.7 | % |
| 37,789 |
| 3.6 | % | |
Corporate notes |
| 4,995 |
| 3.3 | % |
| 5,000 |
| 6.5 | % |
| 9,119 |
| 3.4 | % |
| 1,543 |
| 6.5 | % |
| 20,657 |
| 4.4 | % | |
Certificates of deposit | 490 | 1.3 | % | — | — | % | — | — | % | — | — | % | 490 | 1.3 | % | |||||||||||
Total available for sale securities | $ | 10,044 |
| 3.1 | % | $ | 24,941 |
| 4.4 | % | $ | 51,651 |
| 3.2 | % | $ | 67,682 |
| 2.9 | % | $ | 154,318 |
| 3.3 | % | |
Held to maturity securities |
|
|
|
|
|
|
|
|
|
| ||||||||||||||||
U.S. Treasury securities | $ | 16,816 |
| 3.4 | % | $ | 60,714 |
| 3.6 | % | $ | 21,643 |
| 4.7 | % | $ | — |
| — | $ | 99,173 |
| 3.8 | % | ||
Obligations of states and political subdivisions | 956 |
| 2.7 | % | 2,324 |
| 2.5 | % | 871 |
| 3.0 | % | — |
| — | % | 4,151 | 2.6 | % | |||||||
Total held to maturity securities | $ | 17,772 | 3.4 | % | $ | 63,038 | 3.6 | % | $ | 22,514 |
| 4.6 | % | $ | — |
| — | % | $ | 103,324 | 3.8 | % | ||||
Total | $ | 27,816 |
| 3.3 | % | $ | 87,979 |
| 3.8 | % | $ | 74,165 |
| 3.7 | % | $ | 67,682 |
| 2.9 | % | $ | 257,642 |
| 3.5 | % | |
61
After One, But | After Five, But |
| ||||||||||||||||||||||||
Within One Year | Within Five Years | Within Ten Years | After Ten Years | Total |
| |||||||||||||||||||||
Weighted | Weighted | Weighted | Weighted | Weighted |
| |||||||||||||||||||||
Amortized | Average | Amortized | Average | Amortized | Average | Amortized | Average | Amortized | Average |
| ||||||||||||||||
At December 31, 2022 |
| Cost |
| Yield (1) |
| Cost |
| Yield (1) |
| Cost |
| Yield (1) |
| Cost |
| Yield (1) |
| Cost |
| Yield (1) |
| |||||
| (dollars in thousands) | |||||||||||||||||||||||||
Available for sale securities |
|
|
|
|
|
|
|
|
|
|
|
|
|
|
|
|
|
|
|
| ||||||
U.S. Treasury securities |
| $ | 99,991 |
| 1.2 | % | $ | 9,857 |
| 1.2 | % | $ | 39,766 |
| 1.5 | % | $ | — |
| — | % | 149,614 |
| 1.3 | % | |
Obligations of U.S. Government sponsored agencies | — |
| — | % | — |
| — | % | 12,846 |
| 1.5 | % | 12,089 |
| 1.9 | % | 24,935 |
| 1.7 | % | ||||||
Obligations of states and political subdivisions |
| 3,927 |
| 3.0 | % |
| 5,541 |
| 3.6 | % |
| 24,338 |
| 3.5 | % |
| 56,895 |
| 3.0 | % |
| 90,701 |
| 3.2 | % | |
Mortgage-backed securities |
| 3,358 |
| 2.4 | % |
| 9,829 |
| 2.9 | % |
| 12,608 |
| 3.2 | % |
| 12,906 |
| 3.4 | % |
| 38,701 |
| 3.1 | % | |
Corporate notes |
| — |
| — | % |
| 4,983 |
| 3.3 | % |
| 14,674 |
| 3.6 | % |
| 1,348 |
| 8.6 | % |
| 21,005 |
| 3.8 | % | |
Certificates of deposit | 503 | 1.1 | % | 501 | 1.2 | % | — | — | % | — | — | % | 1,004 | 1.2 | % | |||||||||||
Total available for sale securities | $ | 107,779 |
| 1.3 | % | $ | 30,711 |
| 2.5 | % | $ | 104,232 |
| 2.5 | % | $ | 83,238 |
| 3.0 | % | $ | 325,960 |
| 2.2 | % | |
Held to maturity securities |
|
|
|
|
|
|
|
|
|
|
|
|
|
| ||||||||||||
U.S. Treasury securities |
| $ | — |
| — | % | $ | 35,772 |
| 2.7 | % | $ | 4,130 |
| 3.6 | % | $ | — |
| — | % | 39,902 |
| 2.9 | % | |
Obligations of states and political subdivisions | 389 |
| 3.2 | % | 3,935 |
| 2.6 | % | 871 |
| 3.1 | % | — |
| — | % | 5,195 | 2.7 | % | |||||||
Total held to maturity securities | $ | 389 | 3.2 | % | $ | 39,707 | 2.7 | % | $ | 5,001 |
| 4.2 | % | $ | — |
| — | % | $ | 45,097 | 2.9 | % | ||||
Total | $ | 108,168 |
| 1.3 | % | $ | 70,418 |
| 2.6 | % | $ | 109,233 |
| 2.6 | % | $ | 83,238 |
| 3.0 | % | $ | 371,057 |
| 2.3 | % | |
| (1) | Weighted Average Yield is shown on a fully taxable equivalent basis using a federal tax rate of 21%. |
LIQUIDITY AND CAPITAL RESOURCES
Liquidity. Liquidity is defined as the Company’s ability to generate adequate cash to meet its needs for day-to-day operations and material long and short-term commitments. Liquidity is the risk of potential loss if we were unable to meet our funding requirements at a reasonable cost. We are expected to maintain adequate liquidity at the Bank to meet the cash flow requirements of customers who may be either depositors wishing to withdraw funds or borrowers needing assurance that sufficient funds will be available to meet their credit needs. Our asset and liability management policy is intended to cause the Bank to maintain adequate liquidity and, therefore, enhance our ability to raise funds to support asset growth, meet deposit withdrawals and lending needs, maintain reserve requirements and otherwise sustain our operations.
We continuously monitor our liquidity position to ensure that assets and liabilities are managed in a manner that will meet all of our short-term and long-term cash requirements. We manage our liquidity based on demand and specific events and uncertainties to meet current and future financial obligations of a short-term nature. We also monitor our liquidity requirements in light of interest rate trends, changes in the economy and the scheduled maturity and interest rate sensitivity of the investment and loan portfolios and deposits. Our objective in managing liquidity is to respond to the needs of depositors and borrowers as well as to increase earnings enhancement opportunities in a changing marketplace.
Our liquidity is maintained through investment portfolio, deposits, borrowings from the FHLB, and lines available from correspondent banks. Our highest priority is placed on growing noninterest bearing deposits through strong community involvement in the markets that we serve. Borrowings and brokered deposits are considered short-term supplements to our overall liquidity but are not intended to be relied upon for long-term needs. We believe that our present position is adequate to meet our current and future liquidity needs, and management knows of no trend or event that will have a material impact on the Company’s ability to maintain liquidity at satisfactory levels. Management further believes that our present position is adequate to assure that securities classified as held to maturity will not need to be sold prior to maturity.
Capital Adequacy. Total shareholders’ equity was $619.8 million at December 31, 2023, compared to $453.1 million at December 31, 2022. Our total shareholders’ equity increased during 2023 and 2022 as a result of our profitability, reduced by dividends paid and common share repurchases. Growth in shareholders’ equity was further stimulated by the acquisitions of Hometown during 2023 and Denmark during 2022.
62
Our capital management consists of providing adequate equity to support our current and future operations. We are subject to various regulatory capital requirements administered by state and federal banking agencies, including the Federal Reserve and the OCC. Failure to meet minimum capital requirements may prompt certain actions by regulators that, if undertaken, could have a direct material adverse effect on our financial condition and results of operations. Under capital adequacy guidelines and the regulatory framework for prompt corrective action, the Bank and Company must meet specific capital guidelines that involve quantitative measure of their assets, liabilities, and certain off-balance sheet items as calculated under regulatory accounting practices. The capital amounts and the classifications are also subject to qualitative judgment by the regulator in regards to risk weighting and other factors. See “Business—Supervision and Regulation—Capital Requirements.”
The following table reflects capital ratios computed pursuant to the regulatory capital rules as applicable to the Company and the Bank. As a result of the Economic Growth Act, the Company is no longer required to comply with its risk-based capital rules. For more information, see “Business—Supervision and Regulation—Capital Requirements.”
Minimum Capital Required | Minimum To Be Well- |
| |||||||||||||||||||
Minimum Capital | for Capital Adequacy Plus | Capitalized Under prompt |
| ||||||||||||||||||
Required for Capital | Capital Conservation Buffer | corrective Action |
| ||||||||||||||||||
Actual | Adequacy | Basel III Phase-In Schedule | Provisions |
| |||||||||||||||||
Amount | Ratio | Amount | Ratio | Amount | Ratio | Amount | Ratio |
| |||||||||||||
(dollars in thousands) |
| ||||||||||||||||||||
At December 31, 2023 |
|
|
|
|
|
|
|
|
|
|
|
|
|
|
|
| |||||
Bank First Corporation: | |||||||||||||||||||||
Total capital (to risk-weighted assets) | $ | 484,398 |
| 14.0 | % | $ | 276,904 |
| 8.0 | % | $ | 363,437 |
| 10.5 | % | N/A |
| N/A | |||
Tier I capital (to risk-weighted assets) | 437,979 |
| 12.7 | % | 207,678 |
| 6.0 | % | 294,211 |
| 8.5 | % | N/A |
| N/A | ||||||
Common equity tier I capital (to risk-weighted assets) | 433,979 |
| 12.5 | % | 155,759 |
| 4.5 | % | 242,291 |
| 7.0 | % | N/A |
| N/A | ||||||
Tier I capital (to average assets) | 437,979 |
| 11.1 | % | 158,581 |
| 4.0 | % | 158,581 |
| 4.0 | % | N/A |
| N/A | ||||||
Bank First, N.A: |
|
|
|
|
|
|
|
| |||||||||||||
Total capital (to risk-weighted assets) | $ | 446,634 |
| 12.9 | % | $ | 276,726 |
| 8.0 | % | $ | 363,202 |
| 10.5 | % | $ | 345,907 |
| 10.0 | % | |
Tier I capital (to risk-weighted assets) | 412,215 |
| 11.9 | % | 207,544 |
| 6.0 | % | 294,021 |
| 8.5 | % | 276,726 |
| 8.0 | % | |||||
Common equity tier I capital (to risk-weighted assets) | 412,215 |
| 11.9 | % | 155,658 |
| 4.5 | % | 242,135 | 7.0 | % | 224,840 | 6.5 | % | |||||||
Tier I capital (to average assets) | 412,215 |
| 10.4 | % | 158,585 |
| 4.0 | % | 158,585 |
| 4.0 | % | 198,231 |
| 5.0 | % | |||||
At December 31, 2022 |
|
|
|
|
|
|
|
|
|
|
|
|
|
|
| ||||||
Bank First Corporation: | |||||||||||||||||||||
Total capital (to risk-weighted assets) | $ | 387,814 |
| 12.2 | % | $ | 253,689 |
| 8.0 | % | $ | 332,967 |
| 10.5 | % | N/A |
| N/A | |||
Tier I capital (to risk-weighted assets) | 341,634 |
| 10.8 | % | 190,627 |
| 6.0 | % | 269,545 |
| 8.5 | % | N/A |
| N/A | ||||||
Common equity tier I capital (to risk-weighted assets) | 341,634 |
| 10.8 | % | 142,700 |
| 4.5 | % | 221,978 |
| 7.0 | % | N/A |
| N/A | ||||||
Tier I capital (to average assets) | 341,634 |
| 9.7 | % | 140,992 |
| 4.0 | % | 140,992 |
| 4.0 | % | N/A |
| N/A | ||||||
Bank First, N.A: |
|
|
|
|
|
|
|
| |||||||||||||
Total capital (to risk-weighted assets) | $ | 372,312 |
| 11.8 | % | $ | 253,504 |
| 8.0 | % | $ | 332,724 |
| 10.5 | % | $ | 316,880 |
| 10.0 | % | |
Tier I capital (to risk-weighted assets) | 349,632 |
| 11.0 | % | 190,128 |
| 6.0 | % | 269,348 |
| 8.5 | % | 253,504 |
| 8.0 | % | |||||
Common equity tier I capital (to risk-weighted assets) | 349,632 |
| 11.0 | % | 142,596 |
| 4.5 | % | 221,816 | 7.0 | % | 205,972 | 6.5 | % | |||||||
Tier I capital (to average assets) | 349,632 |
| 9.9 | % | 140,887 |
| 4.0 | % | 140,887 |
| 4.0 | % | 176,108 |
| 5.0 | % | |||||
As previously mentioned, the Company carried $12.0 million of subordinated debt and $4.0 million of junior subordinated debt as of December 31, 2023 and $23.5 million of subordinated debt as of December 31, 2022, which is included in total capital for the Company in the tables above.
FINANCIAL INSTRUMENTS WITH OFF-BALANCE-SHEET RISK
We are party to financial instruments with off-balance-sheet risk in the normal course of business to meet the financing needs of our customers. These financial instruments primarily include commitments to originate and sell loans, standby and direct pay letters of credit, unused lines of credit and unadvanced portions of construction and development loans. The instruments involve, to varying degrees, elements of credit and interest rate risk in excess of the amount recognized in the consolidated balance sheet. The contract or notional amounts of those instruments reflect the extent of involvement the Company has in these particular classes of financial instruments.
63
Our exposure to credit loss in the event of nonperformance by the other party to the financial instrument for loan commitments, standby and direct pay letters of credit and unadvanced portions of construction and development loans is represented by the contractual amount of those instruments. The Company uses the same credit policies in making commitments and conditional obligations as it does for on-balance-sheet instruments.
Off-Balance Sheet Arrangements.
Our significant off-balance-sheet arrangements consist of the following:
| ● | Unused lines of credit |
| ● | Standby and direct pay letters of credit |
| ● | Credit card arrangements |
Off-balance sheet arrangement means any transaction, agreement or other contractual arrangement to which an entity unconsolidated with the registrant is a party, under which the registrant has (1) any obligation under a guarantee contract, (2) retained or contingent interest in assets transferred to an unconsolidated entity or similar arrangement, (3) any obligation, including a contingent obligation, under a contract that would be accounted for as a derivative instrument, or (4) any obligation, including a contingent obligation, arising out of a variable interest.
Loan commitments are made to accommodate the financial needs of our customers. Standby and direct pay letters of credit commit us to make payments on behalf of customers when certain specified future events occur. Both arrangements have credit risk essentially the same as that involved in extending loans to clients and are subject to our normal credit policies. Collateral (e.g., securities, receivables, inventory, equipment, etc.) is obtained based on management’s credit assessment of the customer.
Loan commitments and standby and direct pay letters of credit do not necessarily represent our future cash requirements because while the borrower has the ability to draw upon these commitments at any time, these commitments occasionally expire without being drawn upon. Our off-balance sheet arrangements as of December 31, 2023 were as follows:
Amounts of Commitments Expiring - By Period as of December 31, 2023 | |||||||||||||||
Less Than | One to | Three to | After Five | ||||||||||||
Other Commitments |
| Total |
| One Year |
| Three Years |
| Five Years |
| Years | |||||
(dollars in thousands) | |||||||||||||||
Unused lines of credit | $ | 799,398 | $ | 369,800 | $ | 129,181 | $ | 66,070 | $ | 234,347 | |||||
Standby and direct pay letters of credit |
| 9,785 |
| 7,615 |
| 1,407 |
| 580 |
| 183 | |||||
Credit card arrangements |
| 21,213 |
| — |
| — |
| — |
| 21,213 | |||||
Total commitments | $ | 830,396 | $ | 377,415 | $ | 130,588 | $ | 66,650 | $ | 255,743 | |||||
We closely monitor the amount of our remaining future commitments to borrowers in light of prevailing economic conditions and adjust these commitments as necessary. We will continue this process as new commitments are entered into or existing commitments are renewed.
Effects of Inflation
The effect of inflation on a financial institution differs significantly from the effect on an industrial company. While a financial institution’s operating expenses, particularly salary and employee benefits, are affected by general inflation, the asset and liability structure of a financial institution consists largely of monetary items. Monetary items, such as cash, investments, loans, deposits and other borrowings, are those assets and liabilities which are or will be converted into a fixed number of dollars regardless of changes in prices. As a result, changes in interest rates have a more significant impact on a financial institution’s performance than does general inflation. For additional information regarding interest rates and changes in net interest income see “Quantitative and Qualitative Disclosures about Market Risk—Interest Rate Sensitivity.” Inflation may have impacts on the Bank’s customers, on businesses and consumers and their ability or willingness to invest, save or
64
spend, and perhaps on their ability to repay loans. As such, there would likely be impacts on the general appetite of banking products and the credit health of the Bank’s customer base.
ITEM 7A. QUANTITATIVE AND QUALITATIVE DISCLOSURES ABOUT MARKET RISK
Market risk is the risk of loss from adverse changes in market prices and rates. Our market risk arises primarily from interest rate risk inherent in its lending, investment and deposit-taking activities. To that end, management actively monitors and manages its interest rate risk exposure.
Our profitability is affected by fluctuations in interest rates. A sudden and substantial change in interest rates may adversely impact our earnings to the extent that the interest rates borne by assets and liabilities do not change at the same speed, to the same extent or on the same basis. We monitor the impact of changes in interest rates on its net interest income using several tools.
Our primary objective in managing interest rate risk is to minimize the adverse impact of changes in interest rates on our net interest income and capital, while configuring our asset-liability structure to obtain the maximum yield-cost spread on that structure. We rely primarily on our asset-liability structure to control interest rate risk.
Interest Rate Sensitivity. Interest rate risk is the risk to earnings and value arising from changes in market interest rates. Interest rate risk arises from timing differences in the repricings and maturities of interest-earning assets and interest-bearing liabilities (repricing risk), changes in the expected maturities of assets and liabilities arising from embedded options, such as borrowers’ ability to prepay home mortgage loans at any time and depositors’ ability to redeem certificates of deposit before maturity (option risk), changes in the shape of the yield curve where interest rates increase or decrease in a nonparallel fashion (yield curve risk), and changes in spread relationships between different yield curves, such as U.S. Treasuries and LIBOR (basis risk).
An asset sensitive position refers to a balance sheet position in which an increase in short-term interest rates is expected to generate higher net interest income, as rates earned on our interest-earning assets would reprice upward more quickly than rates paid on our interest-bearing liabilities, thus expanding our net interest margin. Conversely, a liability sensitive position refers to a balance sheet position in which an increase in short-term interest rates is expected to generate lower net interest income, as rates paid on our interest-bearing liabilities would reprice upward more quickly than rates earned on our interest-earning assets, thus compressing our net interest margin.
The Company actively manages its interest rate sensitivity position. The objectives of interest rate risk management are to control exposure of net interest income to risks associated with interest rate movements and to achieve sustainable growth in net interest income. The Company’s ALCO, using policies and procedures approved by the Company’s board of directors, is responsible for the management of the Company’s interest rate sensitivity position. The Company manages interest rate sensitivity by changing the mix, pricing and re-pricing characteristics of its assets and liabilities, through the management of its investment portfolio, its offerings of loan and selected deposit terms and through wholesale funding. Wholesale funding consists of, but is not limited to, multiple sources including borrowings with the FHLB of Chicago, the Federal Reserve Bank of Chicago’s discount window and certificates of deposit from institutional brokers.
The Company uses several tools to manage its interest rate risk including interest rate sensitivity analysis, or gap analysis, market value of portfolio equity analysis, interest rate simulations under various rate scenarios and net interest margin reports. The results of these reports are compared to limits established by the Company’s ALCO policies and appropriate adjustments are made if the results are outside the established limits.
There are an infinite number of potential interest rate scenarios, each of which can be accompanied by differing economic/political/regulatory climates; can generate multiple differing behavior patterns by markets, borrowers, depositors, etc.; and, can last for varying degrees of time. Therefore, by definition, interest rate risk sensitivity cannot be predicted with certainty. Accordingly, the Company’s interest rate risk measurement philosophy focuses on maintaining an appropriate balance between theoretical and practical scenarios; especially given the primary objective of the Company’s overall asset/liability management process is to facilitate meaningful strategy development and implementation.
65
Therefore, we model a set of interest rate scenarios capturing the financial effects of a range of plausible rate scenarios; the collective impact of which will enable the Company to clearly understand the nature and extent of its sensitivity to interest rate changes. Doing so necessitates an assessment of rate changes over varying time horizons and of varying/sufficient degrees such that the impact of embedded options within the balance sheet are sufficiently examined.
The following table demonstrates, as of December 31, 2023, the annualized result of an interest rate simulation and the estimated effect that a parallel interest rate shift, or “shock,” in the yield curve and subjective adjustments in deposit pricing might have on the Company’s projected net interest income over the next 12 months. This simulation assumes that there is no growth in interest-earning assets or interest-bearing liabilities over the next 12 months. The changes to net interest income shown below are in compliance with the Company’s policy guidelines.
Change in Interest Rates |
| Percentage Change in |
(in Basis Points) |
| Net Interest Income |
+400 |
| 0.1% |
+300 |
| 0.1% |
+200 |
| 0.1% |
+100 |
| 0.2% |
-100 |
| (0.1)% |
Economic Value of Equity Analysis. We also analyze the sensitivity of the Company’s financial condition to changes in interest rates through our economic value of equity model. This analysis measures the difference between estimated changes in the present value of the Company’s assets and estimated changes in the present value of the Company’s liabilities assuming various changes in current interest rates. The Company’s economic value of equity analysis as of December 31, 2023 estimated that, in the event of an instantaneous 200 basis point increase in interest rates, the Company would experience a 4.05% increase in the economic value of equity. At the same date, our analysis estimated that, in the event of an instantaneous 100 basis point decrease in interest rates, the Company would experience 2.10% decrease in the economic value of equity. The estimates of changes in the economic value of our equity require us to make certain assumptions including loan and mortgage-related investment prepayment speeds, reinvestment rates, and deposit maturities and decay rates. These assumptions are inherently uncertain and, as a result, we cannot precisely predict the impact of changes in interest rates on the economic value of our equity. Although our economic value of equity analysis provides an indication of our interest rate risk exposure at a particular point in time, such estimates are not intended to, and do not, provide a precise forecast of the effect of changes in market interest rates on the economic value of our equity and will differ from actual results.
66
ITEM 8. FINANCIAL STATEMENTS AND SUPPLEMENTARY DATA
| Page | |
Report of Independent Registered Public Accounting Firm – Financial Statements (PCAOB ID: | 69 | |
Report of Independent Registered Public Accounting Firm – Internal Control over Financial Reporting (PCAOB ID: 686) | 72 | |
74 | ||
75 | ||
76 | ||
77 | ||
78-79 | ||
80-118 |
67
Bank First Corporation and Subsidiaries Manitowoc, Wisconsin
Consolidated Financial Statements
Years Ended December 31, 2023, 2022 and 2021
68
Report of Independent Registered Public Accounting Firm
Board of Directors and Stockholders
Bank First Corporation
Opinion on the Consolidated Financial Statements
We have audited the accompanying consolidated balance sheets of Bank First Corporation and Subsidiaries (the “Company”) as December 31, 2023 and 2022, the related consolidated statements of income, comprehensive income, stockholders’ equity, and cash flows for each of the years in the three-year period ended December 31, 2023, and the related notes (collectively referred to as the “financial statements”). In our opinion, the financial statements referred to above present fairly, in all material respects, the financial position of the Company as of December 31, 2023, and 2022, and the results of its operations and its cash flows for each of the years in the three-year period ended December 31, 2023, in conformity with accounting principles generally accepted in the United States of America.
We also have audited, in accordance with the standards of the Public Company Accounting Oversight Board (United States) (“PCAOB”), the Company’s internal control over financial reporting as of December 31, 2023, based on criteria established in Internal Control – Integrated Framework (2013) issued by the Committee of Sponsoring Organizations of the Treadway Commission and our report dated February 29, 2024, expressed an unqualified opinion thereon.
Basis for Opinion
These financial statements are the responsibility of the Company’s management. Our responsibility is to express an opinion on the Company’s financial statements based on our audits.
We are a public accounting firm registered with the PCAOB and are required to be independent with respect to the Company in accordance with the U.S. federal securities laws and the applicable rules and regulations of the Securities and Exchange Commission and the PCAOB.
We conducted our audits in accordance with the standards of the PCAOB. Those standards require that we plan and perform the audits to obtain reasonable assurance about whether the financial statements are free of material misstatement, whether due to error or fraud.
Our audits included performing procedures to assess the risks of material misstatement of the financial statements, whether due to error or fraud, and performing procedures that respond to those risks. Such procedures include examining, on a test basis, evidence regarding the amounts and disclosures in the financial statements. Our audits also included evaluating the accounting principles used and significant estimates made by management, as well as evaluating the overall presentation of the financial statements. We believe that our audits provide a reasonable basis for our opinion.
Critical Audit Matters
The critical audit matters communicated below are matters arising from the current-period audit of the financial statements that were communicated or required to be communicated to the audit committee and that: (1) relate to accounts or disclosures that are material to the financial statements and (2) involved our especially challenging, subjective, or complex judgments. The communication of critical audit matters does not alter in any way our opinion on the financial statements, taken as a whole, and we are not, by communicating the critical audit matters below, providing separate opinions on the critical audit matters or on the accounts or disclosures to which they relate.
69
Allowance for Credit Losses - Loans
As described in Note 4 to the financial statements the Company’s allowance for credit losses on loans (“ACL-Loans”) was $43.6 million as of December 31, 2023. To estimate the ACL – Loans the Company segments the loan portfolio into loan pools based on loan type and similar credit risk elements. Loans with similar risk characteristics are evaluated in pools and the Company utilizes a discounted cash flow (“DCF”) method where probability of default and loss given default assumptions are applied to a projective model of the pool’s cash flows while considering prepayment and principal curtailment effects. The Company utilizes peer call report data to measure historical credit loss experience with similar risk characteristics within the segments over an economic cycle and has incorporated macroeconomic drivers to adjust the historical loss experience estimate for reasonable and supportable forecasts that are quantitatively related to the Company’s historical credit loss experience. The expected credit losses for each loan pool are then adjusted for changes in qualitative factors not inherently considered in the quantitative analyses and include lending policy, changes in nature and volume of loans, staff experience, changes in volume and trends of problem loans, concentration risk, trends in underlying collateral values, external factors, quality of loan review system and other economic conditions.
We identified the ACL-Loans as a critical audit matter. The principal considerations for our determination included the high degree of judgment and subjectivity in auditing management’s determination of the reasonable and supportable forecasts, and the identification and measurement of qualitative factor adjustments. This required a high degree of effort, specialized skills and knowledge, and significant judgment.
The primary procedures we performed to address this critical audit matter included:
| ● | Evaluated the design and operating effectiveness of controls relating to the ACL-Loans, including: |
| o | Controls over the completeness and accuracy of data included in the model used to determine the ACL-Loans, and |
| o | Controls over management’s review and approval of the ACL-Loans, including management’s determination of the reasonable and supportable forecasts and qualitative factor adjustments applied within the qualitative framework. |
| ● | Evaluated forecast inputs and assumptions and involved our internal specialists to test the model through a recalculation of the DCF methodology within the ACL-Loans model. |
| ● | Evaluated the reasonableness of management’s qualitative factor adjustments, including testing management’s identification of qualitative factors, the application of qualitative factor adjustments within the model, and assessing the completeness and accuracy of data utilized in development of the qualitative adjustments. |
| ● | Evaluated management’s judgments and assumptions related to the qualitative adjustments by assessing relevant trends in credit quality and evaluating the relationship of the trends to the qualitative adjustments applied to the ACL-Loans. |
Merger with Hometown Bancorp, Ltd. - Fair Value of Loans Acquired
As described in Note 2 to the financial statements, the Company completed a merger with Hometown Bancorp, Ltd. on February 10, 2023. The Company accounted for this acquisition under the acquisition method of accounting. The Company recognized the full fair value of assets acquired and liabilities and immediately expensed transaction costs. Determination of the acquisition date fair values of the assets acquired and liabilities assumed required management to make significant estimates and assumptions. Specifically, a high degree of management judgment was required to determine the fair value loan portfolio acquired in the business combination. The fair value of the acquired loans was $395.8 million as of February 10, 2023.
We identified the acquisition date fair value of acquired loans as a critical audit matter. The principal considerations for our determination included the high degree of judgment and subjectivity involved in auditing management’s key inputs and
70
assumptions, particularly as it relates to the discount rates, prepayment rates, identification and measurement of purchase credit deteriorated (“PCD”) loans, and credit loss assumptions used to determine the fair value of acquired loans. This required a high degree of auditor effort, specialized skills and knowledge, and significant auditor judgment.
The primary procedures we performed to address this critical audit matter included:
| ● | Evaluated the design and operating effectiveness of controls relating to the valuation of acquired loans, including controls addressing: |
| o | Management’s review of the reasonableness of the discount rates, prepayment rates, identification and measurement of PCD loans, and credit loss assumptions used in the estimate of the fair value of acquired loans. |
| o | Management’s review of the results of the third-party valuation of the acquired loan portfolio, including the review of the completeness and accuracy of the data inputs used as a basis for the valuations. |
| ● | Evaluated the completeness and accuracy of data inputs used as a basis for the valuation of the acquired loan portfolio. |
| ● | Evaluated, with the assistance of internal specialists, the reasonableness of the discount rates, prepayment rates, identification and measurement of PCD loans, and credit loss assumptions used in the estimate of the fair value of acquired loans, including, for a selected sample of loans, developing an independent expectation for comparison to management’s fair value of the acquired loans. |
| ● | Tested the mathematical accuracy of the estimated fair value, including the application of the assumptions used in the calculation. |
/s/
We have served as the Company’s auditor since 2019.
February 29, 2024
71
Report of Independent Registered Public Accounting Firm
Board of Directors and Stockholders
Bank First Corporation
Opinion on the Internal Control over Financial Reporting
We have audited Bank First Corporation and Subsidiaries’ (the “Company”) internal control over financial reporting as of December 31, 2023, based on criteria established in Internal Control – Integrated Framework (2013) issued by the Committee of Sponsoring Organizations of the Treadway Commission (COSO). In our opinion, the Company maintained, in all material respects, effective internal control over financial reporting as of December 31, 2023, based on criteria established in Internal Control – Integrated Framework (2013) issued by COSO.
We also have audited, in accordance with the standards of the Public Company Accounting Oversight Board (United States) (“PCAOB”), the consolidated financial statements of the Company as of December 31, 2023, and 2022, and for each of the three years in the period ended December 31, 2023, and our report dated February 29, 2024, expressed an unqualified opinion on those consolidated financial statements.
Basis for Opinion
The Company’s management is responsible for maintaining effective internal control over financial reporting and for its assessment of the effectiveness of internal control over financial reporting, included in the accompanying Management’s Annual Report on Internal Control over Financial Reporting. Our responsibility is to express an opinion on the Company’s internal control over financial reporting based on our audit.
We are a public accounting firm registered with the PCAOB and are required to be independent with respect to the Company in accordance with the U.S. federal securities laws and the applicable rules and regulations of the Securities and Exchange Commission and the PCAOB.
We conducted our audit in accordance with the standards of the PCAOB. Those standards require that we plan and perform the audit to obtain reasonable assurance about whether effective internal control over financial reporting was maintained in all material respects. Our audit included obtaining an understanding of internal control over financial reporting, assessing the risk that a material weakness exists, and testing and evaluating the design and operating effectiveness of internal control based on the assessed risk. Our audit also included performing such other procedures as we considered necessary in the circumstances. We believe that our audit provides a reasonable basis for our opinion.
As described in management’s annual report on internal control over financial reporting, the scope of management’s assessment of internal control over financial reporting as of December 31, 2023, has excluded Hometown Bancorp, Ltd. (“Hometown”) acquired on February 10, 2023. We have also excluded Hometown from the scope of our audit of internal control over financial reporting. The fair value of assets acquired from Hometown at the acquisition date represented 14.6 percent of the consolidated total assets of the Company as of December 31, 2023.
72
Definitions and Limitations of Internal Control over Financial Reporting
A company’s internal control over financial reporting is a process designed to provide reasonable assurance regarding the reliability of financial reporting and the preparation of reliable financial statements for external purposes in accordance with generally accepted accounting principles. A company’s internal control over financial reporting includes those policies and procedures that (1) pertain to the maintenance of records that, in reasonable detail, accurately and fairly reflect the transactions and dispositions of the assets of the company; (2) provide reasonable assurance that transactions are recorded as necessary to permit preparation of financial statements in accordance with generally accepted accounting principles, and that receipts and expenditures of the company are being made only in accordance with authorizations of management and directors of the company; and (3) provide reasonable assurance regarding prevention or timely detection of unauthorized acquisition, use, or disposition of the company’s assets that could have a material effect on the financial statements.
Because of its inherent limitations, internal control over financial reporting may not prevent or detect misstatements. Also, projections of any evaluation of effectiveness to future periods are subject to the risk that controls may become inadequate because of changes in conditions or that the degree of compliance with the policies or procedures may deteriorate.
/s/ FORVIS, LLP
Atlanta, GA
February 29, 2024
73
Bank First Corporation and Subsidiaries
Consolidated Balance Sheets
December 31, 2023 |
| December 31, 2022 | ||||
(In thousands, except share and per share data) | ||||||
Assets | ||||||
Cash and due from banks | $ | | $ | | ||
Interest-bearing deposits |
| |
| | ||
Cash and cash equivalents |
| |
| | ||
Securities held to maturity, at amortized cost ($ |
| |
| | ||
Securities available for sale, at fair value ($ |
| |
| | ||
Loans held for sale | | | ||||
Loans | | | ||||
Allowance for credit losses - loans ("ACL-Loans") | ( | ( | ||||
Loans, net |
| |
| | ||
Premises and equipment, net |
| |
| | ||
Goodwill |
| |
| | ||
Other investments |
| |
| | ||
Cash value of life insurance |
| |
| | ||
Core deposit intangibles, net |
| |
| | ||
Mortgage servicing rights ("MSR") | | | ||||
Other real estate owned (“OREO”) |
| |
| | ||
Investment in minority-owned subsidiaries |
| |
| | ||
Other assets |
| |
| | ||
TOTAL ASSETS | $ | | $ | | ||
Liabilities and Stockholders’ Equity |
|
|
| |||
Liabilities: |
|
|
|
| ||
Deposits: |
|
|
|
| ||
Interest-bearing deposits | $ | | $ | | ||
Noninterest-bearing deposits |
| |
| | ||
Total deposits |
| |
| | ||
Securities sold under repurchase agreements |
| |
| | ||
Notes payable |
| |
| | ||
Subordinated notes |
| |
| | ||
Junior subordinated debenture | | — | ||||
Other liabilities |
| |
| | ||
Total liabilities |
| |
| | ||
Stockholders’ equity: |
|
|
|
| ||
Serial preferred stock - $ |
|
|
|
| ||
Authorized - |
|
| ||||
Common stock - $ |
|
|
|
| ||
Authorized - |
|
|
|
| ||
Issued - |
|
|
|
| ||
Outstanding - |
| |
| | ||
Additional paid-in capital |
| |
| | ||
Retained earnings |
| |
| | ||
Treasury stock, at cost - |
| ( |
| ( | ||
Accumulated other comprehensive loss |
| ( |
| ( | ||
Total stockholders’ equity |
| |
| | ||
TOTAL LIABILITIES AND STOCKHOLDERS’ EQUITY | $ | | $ | | ||
See accompanying notes to consolidated financial statements.
74
Bank First Corporation and Subsidiaries
Consolidated Statements of Income
Years Ended December 31 | |||||||||
2023 |
| 2022 |
| 2021 | |||||
(In Thousands, except per share amounts) | |||||||||
Interest income: |
|
| |||||||
Loans, including fees | $ | | $ | | $ | | |||
Securities: |
|
|
| ||||||
Taxable |
| |
| |
| | |||
Tax-exempt |
| |
| |
| | |||
Other |
| |
| |
| | |||
Total interest income |
| |
| |
| | |||
Interest expense: |
|
|
|
|
|
| |||
Deposits |
| |
| |
| | |||
Securities sold under repurchase agreements |
| |
| |
| | |||
Borrowed funds |
| |
| |
| | |||
Total interest expense |
| |
| |
| | |||
Net interest income |
| |
| |
| | |||
Provision for credit losses |
| |
| |
| | |||
Net interest income after provision for credit losses |
| |
| |
| | |||
Noninterest income: |
|
|
| ||||||
Service charges |
| |
| |
| | |||
Income from Ansay and Associates, LLC (“Ansay”) |
| |
| |
| | |||
Income from UFS, LLC (“UFS”) |
| |
| |
| | |||
Loan servicing income |
| |
| |
| | |||
Valuation adjustment on MSR | | | | ||||||
Net gain on sales of mortgage loans |
| |
| |
| | |||
Gain on sale of UFS | | — | — | ||||||
Other |
| |
| |
| | |||
Total noninterest income |
| |
| |
| | |||
Noninterest expense: |
|
|
| ||||||
Salaries, commissions, and employee benefits |
| |
| |
| | |||
Occupancy |
| |
| |
| | |||
Data processing |
| |
| |
| | |||
Postage, stationery, and supplies |
| |
| |
| | |||
Net loss (gain) on sales and valuations of OREO |
| |
| ( |
| ( | |||
Net loss on sale of securities | | — | | ||||||
Advertising |
| |
| |
| | |||
Charitable contributions |
| |
| |
| | |||
Outside service fees |
| |
| |
| | |||
Amortization of intangibles |
| |
| |
| | |||
Other |
| |
| |
| | |||
Total noninterest expense |
| |
| |
| | |||
Income before provision for income taxes |
| |
| |
| | |||
Provision for income taxes |
| |
| |
| | |||
Net Income | $ | | $ | | $ | | |||
Earnings per share - basic | $ | | $ | | $ | | |||
Earnings per share - diluted | $ | | $ | | $ | | |||
See accompanying notes to consolidated financial statements
75
Bank First Corporation and Subsidiaries
Consolidated Statements of Comprehensive Income
Years Ended December 31 | |||||||||
2023 |
| 2022 |
| 2021 | |||||
(In Thousands) | |||||||||
Net Income | $ | | $ | | $ | | |||
Other comprehensive income (loss): |
|
|
|
|
|
| |||
Unrealized gains (losses) on available for sale securities: |
|
|
|
|
|
| |||
Unrealized holding gains (losses) arising during period |
| |
| ( |
| ( | |||
Amortization of unrealized holding gains on securities transferred from available for sale to held to maturity |
| ( |
| ( |
| ( | |||
Reclassification adjustment for losses included in net income |
| |
| — |
| | |||
Income tax benefit (expense) |
| ( |
| |
| | |||
Total other comprehensive income (loss) |
| |
| ( |
| ( | |||
Comprehensive income | $ | | $ | | $ | | |||
See accompanying notes to consolidated financial statements.
76
Bank First Corporation and Subsidiaries
Consolidated Statements of Stockholders’ Equity
|
|
|
|
|
| Accumulated |
| ||||||||||||||
Serial | Additional | Other | Total | ||||||||||||||||||
Preferred | Common | Paid-in | Retained | Treasury | Comprehensive | Stockholders’ | |||||||||||||||
Stock | Stock | Capital | Earnings | Stock | Income (loss) | Equity | |||||||||||||||
(dollars in thousands) | |||||||||||||||||||||
Balance at January 1, 2021 | $ | — | $ | | $ | | $ | | $ | ( | $ | | $ | | |||||||
Net income |
| — |
| — |
| — |
| |
| — |
| — |
| | |||||||
Other comprehensive loss |
| — |
| — |
| — |
| — |
| — |
| ( |
| ( | |||||||
Purchase of treasury stock |
| — |
| — |
| — |
| — |
| ( |
| — |
| ( | |||||||
Sale of treasury stock | — | — | — | — | | — | | ||||||||||||||
Cash dividends ($ |
| — |
| — |
| — |
| ( |
| — |
| — |
| ( | |||||||
Amortization of stock-based compensation |
| — |
| — |
| |
| — |
| — |
| — |
| | |||||||
Vesting of restricted stock awards |
| — |
| — |
| ( |
| — |
| |
| — |
| — | |||||||
Balance at December 31, 2021 | $ | — | $ | | $ | | $ | | $ | ( | $ | | $ | | |||||||
Net income |
| — |
| — |
| — |
| |
| — |
| — |
| | |||||||
Other comprehensive loss |
| — |
| — |
| — |
| — |
| — |
| ( |
| ( | |||||||
Purchase of treasury stock |
| — |
| — |
| — |
| — |
| ( |
| — |
| ( | |||||||
Sale of treasury stock | — | — | — | — | | — | | ||||||||||||||
Cash dividends ($ |
| — |
| — |
| — |
| ( |
| — |
| — |
| ( | |||||||
Amortization of stock-based compensation |
| — |
| — |
| |
| — |
| — |
| — |
| | |||||||
Vesting of restricted stock awards |
| — |
| — |
| ( |
| — |
| |
| — |
| — | |||||||
Shares issued in the acquisition of Denmark Bancshares, Inc. ( | — | | | — | — | — | | ||||||||||||||
Balance at December 31, 2022 | $ | — | $ | | $ | | $ | | $ | ( | $ | ( | $ | | |||||||
Net income |
| — |
| — |
| — |
| |
| — |
| — |
| | |||||||
Other comprehensive income |
| — |
| — |
| — |
| — |
| — |
| |
| | |||||||
Purchase of treasury stock | — | — | — | — | ( |
| — |
| ( | ||||||||||||
Sale of treasury stock | — | — | — | — | | — | | ||||||||||||||
Cash dividends ($ |
| — |
| — |
| — |
| ( |
| — |
| — |
| ( | |||||||
Amortization of stock-based compensation |
| — |
| — |
| |
| — |
| — |
| — |
| | |||||||
Vesting of restricted stock awards | — |
| — |
| ( |
| — |
| |
| — |
| — | ||||||||
Adoption of new accounting pronouncement (See Note 1) | — | — | — | ( | — | — | ( | ||||||||||||||
Shares issued in the acquisition of Hometown Bancorp, Ltd. ( | — | | | — | — | — | | ||||||||||||||
Balance at December 31, 2023 | $ | — | $ | | $ | | $ | | $ | ( | $ | ( | $ | | |||||||
See accompanying notes to consolidated financial statements.
77
Bank First Corporation and Subsidiaries
Consolidated Statements of Cash Flows
Years Ended December 31 | ||||||||||
| 2023 |
| 2022 |
| 2021 | |||||
(In Thousands) | ||||||||||
Cash flows from operating activities: | ||||||||||
Net income | $ | | $ | | $ | | ||||
Adjustments to reconcile net income to net cash provided by operating activities: |
|
|
| |||||||
Provision for credit losses |
| |
| |
| | ||||
Depreciation and amortization of premises and equipment |
| |
| |
| | ||||
Amortization of intangibles |
| |
| |
| | ||||
Net amortization (accretion) of securities |
| ( |
| |
| | ||||
Amortization of stock-based compensation |
| |
| |
| | ||||
Accretion of purchase accounting valuations |
| ( |
| ( |
| ( | ||||
Net change in deferred loan fees and costs |
| ( |
| ( |
| ( | ||||
Benefit from deferred income taxes | ( | ( | ( | |||||||
Change in fair value of MSR and other investments |
| ( |
| ( |
| | ||||
Loss (gain) from sale and disposal of premises and equipment and valuation allowance |
| |
| |
| ( | ||||
Net loss (gain) on sale of OREO and valuation allowance |
| |
| ( |
| ( | ||||
Proceeds from sales of mortgage loans |
| |
| |
| | ||||
Originations of mortgage loans held for sale |
| ( |
| ( |
| ( | ||||
Gain on sales of mortgage loans |
| ( |
| ( |
| ( | ||||
Realized loss on sale of securities |
| |
| — |
| | ||||
Realized gain on sale of UFS | ( | — | — | |||||||
Undistributed income of UFS joint venture |
| ( |
| ( |
| ( | ||||
Undistributed income of Ansay joint venture |
| ( |
| ( |
| ( | ||||
Net earnings on life insurance |
| ( |
| ( |
| ( | ||||
Decrease (increase) in other assets |
| ( |
| |
| | ||||
Increase (decrease) in other liabilities |
| |
| ( |
| ( | ||||
Net cash provided by operating activities |
| |
| |
| | ||||
Cash flows from investing activities, net of effects of business combination: |
|
|
|
|
|
| ||||
Activity in securities available for sale and held to maturity: |
|
|
|
|
|
| ||||
Sales |
| |
| — |
| | ||||
Maturities, prepayments, and calls |
| |
| |
| | ||||
Purchases |
| ( |
| ( |
| ( | ||||
Proceeds from other investments | | — | — | |||||||
Net increase in loans |
| ( |
| ( |
| ( | ||||
Proceeds from sale of UFS | | — | — | |||||||
Dividends received from UFS |
| |
| |
| | ||||
Dividends received from Ansay |
| |
| |
| | ||||
Proceeds from sale of OREO |
| |
| |
| | ||||
Net sales (purchases) of Federal Home Loan Bank (“FHLB”) stock |
| |
| ( |
| — | ||||
Net purchases of Federal Reserve Bank (“FRB”) stock | ( | ( | — | |||||||
Proceeds from life insurance |
| — |
| — |
| | ||||
Proceeds from sale of premises and equipment |
| — |
| — |
| | ||||
Purchases of premises and equipment |
| ( |
| ( |
| ( | ||||
Net cash received in business combination |
| |
| |
| — | ||||
Net cash provided by (used in) investing activities |
| |
| ( |
| ( | ||||
78
Bank First Corporation and Subsidiaries
Consolidated Statements of Cash Flows - (continued)
Years Ended December 31 | |||||||||
| 2023 |
| 2022 |
| 2021 | ||||
(In Thousands) | |||||||||
Cash flows from financing activities, net of effects of business combination: |
|
|
|
|
| ||||
Net increase (decrease) in deposits | $ | ( | $ | ( | $ | | |||
Net increase (decrease) in securities sold under repurchase agreements |
| ( |
| |
| | |||
Proceeds from advances of notes payable |
| |
| |
| | |||
Repayment of notes payable |
| ( |
| ( |
| ( | |||
Proceeds from issuance of subordinated notes | — | | — | ||||||
Repayment of subordinated notes | ( | — | — | ||||||
Repayment of junior subordinated debentures | ( | — | — | ||||||
Dividends paid |
| ( |
| ( |
| ( | |||
Proceeds from sales of common stock |
| |
| |
| | |||
Repurchase of common stock |
| ( |
| ( |
| ( | |||
Net cash provided by (used in) financing activities |
| ( |
| ( |
| | |||
Net increase (decrease) in cash and cash equivalents |
| |
| ( |
| | |||
Cash and cash equivalents at beginning of year |
| |
| |
| | |||
Cash and cash equivalents at end of year | $ | | $ | | $ | | |||
Supplemental disclosures of cash flow information: |
|
|
|
|
|
| |||
Cash paid during the year for: |
|
|
|
|
|
| |||
Interest | $ | | $ | | $ | | |||
Income taxes |
| |
| |
| | |||
Supplemental schedule of noncash activities: |
|
|
| ||||||
Loans transferred to OREO |
| — |
| |
| — | |||
Closed branch building transferred to OREO | | | | ||||||
MSR resulting from sale of loans |
| |
| |
| | |||
Amortization of unrealized holding gains on securities transferred from available for sale to held to maturity recognized in other comprehensive income, net of tax |
| ( |
| ( |
| ( | |||
Change in unrealized gains and losses on investment securities available for sale, net of tax |
| ( | ( | ( | |||||
Acquisition: |
| ||||||||
Fair value of assets acquired | $ | | $ | | $ | — | |||
Fair value of liabilities assumed |
| |
| |
| — | |||
Net assets acquired | $ | | $ | | $ | — | |||
Common stock issued in acquisition | $ | | $ | | $ | — | |||
See accompanying notes to consolidated financial statements.
79
Bank First Corporation and Subsidiaries
Notes to Consolidated Financial Statements
Note 1 Summary of Significant Accounting Policies
The accounting and reporting policies of Bank First Corporation and Subsidiaries (“Company”) conform to generally accepted accounting principles (“GAAP”) in the United States and general practices within the financial institution industry. Significant accounting and reporting policies are summarized below.
Principles of Consolidation
The consolidated financial statements include the accounts of the Company and its wholly owned subsidiaries, Veritas Asset Holdings, LLC (“Veritas”) and Bank First, National Association (“Bank”). Veritas was dissolved by the Company during the year ended December 31, 2023. The Bank’s wholly owned subsidiaries are Bank First Investments, Inc., TVG Holdings, Inc. (“TVG") and BFC Title LLC. All significant intercompany balances and transactions have been eliminated. The Bank and TVG have investments in minority-owned subsidiaries that are accounted for using the equity method in the consolidated financial statements. The Bank owned
Organization
The Company provides a variety of financial services to individual and business customers, primarily located in Wisconsin, through the Bank. The Bank is subject to competition from other traditional and nontraditional financial institutions and is also subject to the regulations of certain federal agencies and undergoes periodic examinations by those regulatory authorities including the Office of the Comptroller of the Currency and the Federal Reserve Bank.
Use of Estimates in Preparation of Financial Statements
The preparation of the accompanying consolidated financial statements in conformity with GAAP in the United States requires management to make estimates and assumptions that affect the reported amounts of assets and liabilities, the disclosure of contingent assets and liabilities at the date of the financial statements, and the reported amounts of revenue and expenses during the reporting period. Actual results may differ from these estimates. The allowance for credit losses, carrying value of real estate owned, carrying value of goodwill, fair value of mortgage servicing rights, and fair values of financial instruments are inherently subjective and are susceptible to significant change.
Business Combinations
The Company accounts for business combinations under the acquisition method of accounting in accordance with Financial Accounting Standards Board (“FASB”) Accounting Standards Codification (“ASC”) 805, Business Combinations. The Company recognizes the full fair value of the assets acquired and liabilities assumed and immediately expenses transaction costs. If the amount of consideration exceeds the fair value of assets purchased less the fair value of liabilities assumed, goodwill is recorded. Alternatively, if the amount by which the fair value of assets purchased exceeds the fair value of liabilities assumed and consideration paid, a gain (bargain purchase gain) is recorded. Fair values are subject to refinement for up to one year after the closing date of an acquisition as information relative to closing date fair values becomes available. Results of operations of the acquired business are included in the statement of income from the effective date of the acquisition. Additional information regarding acquisitions is provided in Note 2.
Cash and Cash Equivalents
For purposes of reporting cash flows in the consolidated financial statements, cash and cash equivalents include cash on hand, interest-bearing and noninterest-bearing accounts in other financial institutions, and federal funds sold, all of which have original maturities of three months or less. Generally, federal funds are purchased and sold for one day periods. In the normal course of business, the Company maintains cash and due from bank balances with correspondent banks. Accounts at each institution that are insured by the Federal Deposit Insurance Corporation have up to $250,000 of insurance. Total uninsured balances held at December 31, 2023 and 2022 were approximately $
80
Securities
Securities are classified as held to maturity (“HTM”) or available for sale (“AFS”) at the time of purchase. Investment securities classified as HTM, which management has the intent and ability to hold to maturity, are reported at amortized cost. Investment securities classified as AFS, which management has the intent and ability to hold for an indefinite period of time, but not necessarily to maturity, are carried at fair value, with unrealized gains and losses, net of related deferred income taxes, included in stockholders’ equity as a separate component of other comprehensive income.
The net carrying value of debt securities classified as HTM or AFS is adjusted for amortization of premiums and accretion of discounts utilizing the effective interest method over the expected estimated maturity. Such amortization and accretion is included as an adjustment to interest income from securities. Interest and dividends are included in interest income from securities.
Transfers of debt securities into the HTM classification from the AFS classification are made at fair value as of the date of transfer. The unrealized holding gain or loss as of the date of transfer is retained in other comprehensive income and in the carrying value of the HTM securities, establishing the amortized cost of the security. These unrealized holding gains and losses as of the date of transfer are amortized or accreted over the remaining life of the security.
Realized gains or losses, determined on the basis of the cost of specific securities sold, are included in earnings.
Prior to January 1, 2023, unrealized gains or losses considered temporary and the noncredit portion of unrealized losses deemed other-that-temporary were reported as an increase or decrease in accumulated other comprehensive income. The credit related portion of unrealized losses deemed other-than-temporary were recorded in current period earnings.
Subsequent to January 1, 2023, as a result of adopting ASU 2016-13, Financial Instruments – Credit Losses (Topic 326): Measurement of Credit Losses on Financial Instruments (“ASU 2016-13”), the Bank evaluates securities for potential credit losses at least on a quarterly basis, and more frequently when economic or market concerns warrant such evaluation. For AFS securities, management determines whether the decline in fair value below the amortized cost basis (impairment) is due to credit-related or other factors. In making that evaluation, management considers the extent to which the fair value has been less than cost, the financial condition and near-term prospects of the issuer, and the intent and ability of the Company to hold the security for a period of time sufficient to allow for any anticipated recovery in fair value. Any impairment on AFS securities that is related to factors other than credit is recognized in other comprehensive income, net of related deferred income taxes. Credit-related impairment on AFS securities is recognized as an allowance for credit losses (“ACL”) on the balance sheet based on the amount by which the amortized cost basis exceeds the fair value, with a corresponding charge to net income. Both the ACL and charge to net income may be reversed if conditions change. However, if the Company intends to sell, or more likely than not will be required to sell, an impaired AFS security before recovering its amortized cost basis, the entire impairment must be recognized in net income with a corresponding adjustment to the security’s amortized cost basis rather than through the establishment of an ACL. For HTM securities, management determines whether an ACL is necessary after considering the facts and circumstances of the underlying investment securities and evaluates expected credit losses by security type, aggregated by similar risk characteristics, based on historical credit losses adjusted for current conditions and supportable forecasts. The Company’s HTM portfolio primarily consists of U.S. Treasury securities which have an explicit government guarantee; therefore, no ACL has been recorded for these securities.
Other Investments
Other investments are carried at cost, or, where available, recently observable market prices, which approximates fair value, and consist of FHLB stock, FRB stock and Bankers’ Bancorporation stock. Other investments are evaluated for impairment at least on an annual basis.
81
Loans Held for Sale
Loans originated and intended for sale in the secondary market, consisting of the current origination of certain fixed-rate mortgage loans, are carried at the lower of cost or estimated fair value in the aggregate. A gain or loss is recognized at the time of the sale reflecting the present value of the difference between the contractual interest rate of the loans sold and the yield to the investor, adjusted for the initial value of mortgage servicing rights associated with loans sold with servicing retained. Net unrealized losses, if any, are recorded as a valuation allowance and charged to earnings.
Loans and Related Interest Income - Originated
Loans that management has the intent and ability to hold for the foreseeable future or until maturity or payoffs are carried at their amortized cost basis, which is the unpaid principal balance outstanding, net of deferred loan fees and costs and any direct principal charge-offs.
Interest income is accrued on the unpaid principal balance using the simple interest method. The accrual of interest income on loans is discontinued when, in the opinion of management, there is reasonable doubt as to the borrower’s ability to meet payment of interest or principal when due. Loans are generally placed on nonaccrual status when contractually past due 90 days or more as to interest or principal, though they may be placed in such status earlier. Loans past due 90 days or more may continue on accrual only when they are well secured and/or in process of collection or renewal. When interest accrual is discontinued, all previously accrued but uncollected interest is reversed against current period interest income. Except in very limited circumstances, cash collections on nonaccrual loans are credited to the loan receivable balance and no interest income is recognized on those loans until the principal balance is paid in full. Accrual of interest may be resumed when the customer is current on all principal and interest payments and has been paying on a timely basis for a sustained period of time.
A description of each segment of the loan portfolio, including the corresponding credit risk, is included below:
Commercial / Industrial – Commercial and industrial loans are typically made to small and middle-market established businesses involved in professional services, accommodation and food services, health care, financial services, wholesale trade, manufacturing, distribution, retailing and non-profits. Most clients are privately owned with markets that range from local to national in scope. Many of the loans to this segment are secured by liens on corporate assets and the personal guarantees of the principals. The regional economic strength or weakness impacts the relative risks in this loan category. There is little concentration in any one business sector, and loan risks are generally diversified among many borrowers. Risks associated with commercial and industrial loans include monitoring the condition of the collateral which often consists of inventory, accounts receivable, and other non-real estate assets. Declines in general economic conditions and other events can cause cash flows to fall to levels insufficient to service this debt.
Commercial Real Estate – Owner Occupied and Non-owner Occupied – Commercial real estate loans generally have terms of
82
Multi-Family – Multi-family loans are a subset of commercial real estate loans and generally carry similar terms and underwriting requirements. These loans are broken out as a separate segment due to unique risk characteristics that they exhibit. While similar in nature to other non-owner occupied commercial real estate, they are significantly impacted by the individual credit capacity of many more individual tenants than other commercial real estate as well as the condition and capacity of the local residential housing markets. The underlying real estate also has a lack of suitable alternative uses.
Construction and Development – Construction and development loans are generally limited to a term of
Residential 1-4 Family – We offer fixed and adjustable rate residential real estate loans with terms of up to
Consumer – Consumer loans are underwritten based on the borrower’s income, current debt level, past credit history, and the availability and value of collateral. Consumer rates are both fixed and variable, with negotiable terms. Our installment loans typically amortize over periods up to seven years. Although we typically require monthly principal and interest payments on our loan products, we will offer consumer loans at interest only with a single maturity date when a specific source of repayment is available. Consumer loans are generally considered to have greater risk than first or second mortgages on real estate because they may be unsecured, or, if they are secured, the value of the collateral may be difficult to assess and more likely to decrease in value than real estate.
Other – We make loans utilized to purchase or carry securities as well as loans to nonprofit organizations. Other loans also include overdrawn depository accounts.
Loans and Related Interest Income - Acquired
Loans purchased in acquisition transactions are acquired loans, and are recorded at their fair value at the acquisition date.
Prior to January 1, 2023, the Company initially classified acquired loans as either purchased credit impaired (“PCI”) loans (i.e., loans that reflect credit deterioration since origination and it is probable at acquisition that the Company will be unable to collect all contractually required payments) or purchased non-impaired loans (i.e., performing acquired loans). The Company estimated the fair value of PCI loans based on the amount and timing of expected principal, interest and other cash flows for each loan. The excess of the loan’s contractual principal and interest payments over all cash flows expected to be collected at acquisition was considered an amount that should not be accreted. These credit discounts (“nonaccretable marks”) were included in the determination of the initial fair value for acquired loans; therefore, no allowance for credit losses was recorded at the acquisition date. Differences between the estimated fair values and expected cash flows of acquired loans at the acquisition date that were not credit-based (“accretable marks”) were subsequently accreted to interest income over the estimated life of the loans. Subsequent to the acquisition date for PCI loans, increases in cash flows over those expected at the acquisition date resulted in a move of the discount from nonaccretable to accretable, while decreases in expected cash flows after the acquisition date were recognized through the provision for credit losses.
83
Subsequent to January 1, 2023, as a result of adopting ASU 2016-13, acquired loans that have evidence of more-than-insignificant deterioration in credit quality since origination are considered purchased credit deteriorated (“PCD”) loans. At acquisition, an estimate of expected credit losses is made for PCD loans. This initial allowance for credit losses is allocated to individual PCD loans and added to the purchase price or acquisition date fair value to establish the initial cost basis of the PCD loans. Any difference between the unpaid principal balance of PCD loans and the amortized cost basis is considered to relate to noncredit factors, resulting in a discount or premium that is accreted or amortized to interest income. For acquired loans not deemed PCD loans at acquisition, the difference between the initial fair value mark and the unpaid principal balance is recognized in interest income over the estimated life of the loans. In addition, an initial allowance for expected credit losses is estimated and recorded as provision expense at the acquisition date. The subsequent measurement of expected credit losses for all acquired loans is the same as the subsequent measurement of expected credit losses for originated loans.
Allowance for Credit Losses - Loans
The ACL – Loans represents management’s estimate of expected credit losses in the Company’s loan portfolio at the balance sheet date. The Company estimates the ACL – Loans based on the amortized cost basis of the underlying loan and has made an accounting policy election to exclude accrued interest from the loan’s amortized cost basis and the related measurement of the ACL – Loans. Estimating the amount of the ACL – Loans is a function of a number of factors, including but not limited to changes in the loan portfolio, net charge-offs, trends in past due and nonaccrual loans, and the level of potential problem loans, all of which may be susceptible to significant change. We establish the ACL – Loans through charges to earnings, which are shown in the statements of income as the provision for credit losses. Specifically identifiable and quantifiable known losses are promptly charged off against the allowance.
Prior to January 1, 2023, the Company used an incurred loss impairment model. This methodology assessed the overall appropriateness of the allowance for credit losses and included allocations for specifically impaired loans and loss factors for all remaining loans, with a component primarily based on historical loss rates and another component primarily based on other qualitative factors. Impaired loans were individually assessed and measured based on the present value of expected future cash flows discounted at the loan’s effective price or the fair value of the collateral if the loan was collateral dependent. Loans that were determined not to be impaired were collectively evaluated for impairment, stratified by type and allocated loss ranges based on the Company’s actual historical loss ratios for each strata, and adjustments were also provided for certain environmental and other qualitative factors.
Subsequent to January 1, 2023, as a result of adopting ASU 2016-13, the Company uses a current expected loss model (“CECL”). This methodology also considers historical loss rates and other qualitative adjustments, as well as a new forward-looking component that considers reasonable and supportable forecasts over the expected life of each loan. To develop the ACL – Loans estimate under CECL, the Company segments the loan portfolio into loan pools based on loan type and similar credit risk elements; calculates the historical loss rates for the segmented loan pools; applies the loss rates over the calculated life of the pooled loans; adjusts the forecasted macro-level economic conditions; and determines qualitative adjustments based on factors and conditions unique to the Company’s portfolio. The Company further individually evaluates PCD loans and other loans that no longer share similar risk characteristics with the collectively evaluated pools based on the amount and timing of estimated future cash flows or collateral values and establishes specific reserves when these estimated future cash flows or collateral values do not justify the carrying value of the loan.
Management believes that the ACL - Loans is adequate. While management uses available information to recognize losses on loans, future additions to the allowance may be necessary based on changes in economic conditions. In addition, various regulatory agencies, as an integral part of their examination process, periodically review the ACL - Loans. Such agencies may require the Bank to recognize additions to the allowance based on their judgments of information available to them at the time of their examination.
84
Allowance for Credit Losses – Unfunded Commitments
In addition to the ACL – Loans, the Company has established an allowance for unfunded commitments, included in other liabilities on the consolidated balance sheets, representing expected credit losses over the contractual period for which the Company is exposed to credit risk resulting from a contractual obligation to extend credit. The ACL – Unfunded Commitments is maintained at a level that management believes is sufficient to absorb losses arising from unfunded loan commitments, and is determined quarterly based on methodology similar to the methodology for determining the ACL – Loans.
Premises and Equipment
Premises and equipment are stated at cost less accumulated depreciation computed on the straight-line method over the estimated useful lives of the assets. Premises and equipment acquired in corporate acquisitions are recorded at estimated fair value on the date of acquisition. Maintenance and repair costs are charged to expense as incurred. Gains or losses on disposition of premises and equipment are reflected in income. Premises and equipment, and other long-term assets, are reviewed for impairment when events indicate their carrying amount may not be recoverable from future undiscounted cash flows. If impaired, the assets are recorded at fair value.
Depreciation expense is computed using the straight-line method over the following estimated useful lives.
Buildings and improvements |
| |
Land improvements |
| |
Furniture, fixtures and equipment |
| - |
Other Real Estate Owned
Assets acquired through, or in lieu of, loan foreclosure as well as buildings that the Company no longer utilizes in its operations are held for sale and are initially recorded at fair value at the date of foreclosure or abandonment less estimated costs to sell the asset, establishing a new cost basis. Any write downs at the time of foreclosure are charged to the allowance for credit loss. OREO properties acquired in conjunction with corporate acquisitions are recorded at fair value on the date of acquisition. Subsequent to foreclosure, valuations are periodically performed by management, and a valuation allowance is established if fair value declines below carrying value. Costs relating to the development and improvement of the property are capitalized. Revenue and expenses from operations and changes in the valuation allowance are included in other expenses.
Intangible Assets and Goodwill
Intangible assets consist of the value of core deposits, mortgage servicing assets and the excess of purchase price over fair value of net assets (goodwill). See Note 2 for additional information on acquisitions completed in 2023 and 2022.
The value of core deposits are typically recorded in connection with a whole bank or branch acquisition. The value of the core deposit intangible represents the estimated value of the long-term deposit relationships acquired in the transaction. Determining the value of cored deposits and their average lives involves multiple assumptions and estimates and is typically determined by performing a discounted cash flow analysis, which involves a combination of any or all of the following assumptions: customer attrition/runoff, alternative funding costs, deposit servicing costs, and discount rates. The value of core deposits are stated at cost less accumulated amortization and are amortized on a sum of the year’s digits basis over a period of one to ten years.
Mortgage servicing rights are recognized as separate assets when rights are acquired through purchase or through sale of mortgage loans with servicing retained. Servicing rights acquired through sale of financial assets are recorded based on the fair value of the servicing right. The determination of fair value is based on a valuation model and includes stratifying the mortgage servicing rights by predominant characteristics, such as interest rates and terms, and estimating the fair value of each stratum based on the present value of estimated future net servicing income. The valuation model incorporates assumptions that market participants would use in estimating future net servicing income, such as costs to service, a discount rate, and prepayment speeds. Changes in fair value are recorded as an adjustment to earnings.
85
The Company performs a “qualitative” assessment of goodwill to determine whether further impairment testing of indefinite-lived intangible assets is necessary on at least an annual basis. If it is determined, as a result of performing a qualitative assessment over goodwill, that it is more likely than not that goodwill is impaired, management will perform an impairment test to determine if the carrying value of goodwill is realizable.
The Company evaluated goodwill and core deposit intangibles for impairment during 2023, 2022 and 2021, determining that there was
Income Taxes
The Company files one consolidated federal income tax return and four state returns. Federal income tax expense is allocated to each subsidiary based on an intercompany tax sharing agreement.
Deferred tax assets and liabilities have been determined using the liability method. Deferred tax assets and liabilities are determined based on the difference between the financial statement and tax bases of assets and liabilities and the current enacted tax rates which will be in effect when these differences are expected to reverse. Provision (benefit) for deferred taxes is the result of changes in the deferred tax assets and liabilities.
Treasury Stock
Common stock shares repurchased by the Company are recorded as treasury stock at cost.
Securities Sold Under Repurchase Agreements
The Company sells securities under repurchase agreements. These transactions are accounted for as collateralized financing transactions and are recorded at the amounts at which the securities were sold. The Company may have to provide additional collateral to the counterparty, as necessary.
Off-Balance-Sheet Financial Instruments
In the ordinary course of business, the Company has entered into off-balance-sheet financial instruments including commitments to extend credit, unfunded commitments under lines of credit, and letters of credit. Such financial instruments are recorded in the consolidated financial statements when they are funded.
Advertising
Advertising costs are generally expensed as incurred.
Per Share Computations
Weighted average shares outstanding were
Loss Contingencies
Loss contingencies, including claims and legal actions arising in the ordinary course of business, are recorded as liabilities when the likelihood of loss is probable and an amount or range of loss can be reasonably estimated. Management does not believe that there are any such matters that will have a material effect on the consolidated financial statements at December 31, 2023 and 2022.
Transfers of Financial Assets
Transfers of financial assets are accounted for as sales when control over the assets has been relinquished. Control over transferred assets is deemed to be surrendered when the assets have been isolated from the Bank, the transferee obtains the right, free of conditions that constrain it from taking advantage of that right, to pledge or exchange the transferred assets and the Bank does not maintain effective control over the transferred assets through an agreement to repurchase them before maturity.
86
Comprehensive Income
GAAP normally requires that recognized revenues, expenses, gains and losses be included in net income. In addition to net income, another component of comprehensive income includes the after-tax effect of changes in unrealized gains and losses on available for sale securities. This item is reported as a separate component of stockholders’ equity. The Company presents comprehensive income in the statement of comprehensive income.
Stock-based Compensation
The Company uses the fair value method of recognizing expense for stock-based compensation based on the fair value of restricted stock awards at the date of grant as prescribed by accounting standards codification Topic 781-10 Compensation/Stock Compensation.
Mortgage Banking Derivatives
Commitments to fund mortgage loans, at a set interest rate, (interest rate locks) to be sold into the secondary market and forward commitments for the future delivery of these mortgage loans are accounted for as free-standing derivatives. Fair values of these mortgage derivatives are estimated based on changes in mortgage interest rates from the date the interest rate on the loan is locked. The Bank enters into forward commitments for the future delivery of mortgage loans when interest rate locks are entered into in order to hedge the change in interest rates resulting from its commitments to fund loans. The forward commitments for the future delivery of mortgage loans are based on the Bank’s “best efforts” and therefore the Bank is not penalized if a loan is not delivered to the investor if the loan did not get originated. Changes in the fair values of these derivatives generally offset each other and are included in “other income” in the consolidated statements of income.
Reclassifications
Certain 2022 and 2021 amounts have been reclassified to conform to the presentation used in 2023. These reclassifications had no effect on the operations, financial condition or cash flows of the Company.
New Accounting Pronouncements
In March 2020, the FASB issued ASU 2020-04, Reference Rate Reform (Topic 848): Facilitation of the Effects of Reference Rate Reform on Financial Reporting. This ASU provides optional guidance for a limited period of time to ease the potential burden in accounting for (or recognizing the effects of) reference rate reform on financial reporting. It provides optional expedients and exceptions for applying GAAP to contracts, hedging relationships, and other transactions affected by reference rate reform if certain criteria are met. The updated guidance was originally effective for all entities from March 12, 2020 through December 31, 2022. In December 2022, the FASB issued ASU 2022-06 which deferred the sunset date of Topic 848 from December 31, 2022 to December 31, 2024. The Company has been diligent in responding to reference rate reform and does not anticipate a significant impact to its financial statements as a result.
In October 2023, the FASB issued ASU 2023-06, Disclosure Improvements. This ASU modifies the disclosure or presentation requirements of a variety of topics in the Codification. Certain of the amendments represent clarifications to or technical corrections of the current requirements. The effective date for each amendment will be the date on which the Security and Exchange Commission’s removal of that related disclosure from Regulation S-X or Regulation S-K becomes effective, with early adoption prohibited. If, by June 30, 2027, the Securities and Exchange Commission has not removed the applicable requirement from Regulation S-X or Regulation S-K, the pending content of the related amendment will be removed from the Codification and will not become effective for any entity. The Company does not anticipate a significant impact to its financial statement disclosures as a result of this ASU.
Recently Implemented Accounting Standards
As a result of implementing ASU 2016-13 on January 1, 2023, the Company recorded a reduction to retained earnings of approximately $
The Company adopted ASU 2016-13 using the prospective transition approach for financial assets considered PCD that were previously classified as PCI. The amortized cost of the PCD assets were adjusted to reflect the addition of $
87
The following table presents the changes in the allowance for credit losses required as a result of this adoption:
January 1, 2023 As | December 31, 2022 | |||||||
Reported After ASU | Pre-ASU 2016-13 | Impact of | ||||||
Allowance for Credit Losses | 2016-13 Adoption | Adoption | 2016-13 Adoption | |||||
Assets | ||||||||
Loans held for investments | ||||||||
Commercial/industrial | $ | | $ | | $ | | ||
Commercial real estate - owner occupied | | | | |||||
Commercial real estate - non-owner occupied | | | | |||||
Commercial real estate - multi-family | | | | |||||
Construction and development | | | | |||||
Residential 1-4 family | | | | |||||
Consumer | | | | |||||
Other | | | ( | |||||
Loans held for investments, total | | | | |||||
Liabilities | ||||||||
Unfunded commitments | | - | | |||||
Total | $ | | $ | | $ | | ||
In March 2022, the FASB issued ASU 2022-02, Financial Instruments - Credit Losses (Topic 326): Troubled Debt Restructurings (“TDRs”) and Vintage Disclosures. This ASU eliminated the accounting guidance for TDRs by creditors and enhanced the disclosure requirements for loan modifications to borrowers experiencing financial difficulty. The ASU also requires public business entities to expand the vintage disclosures to include gross charge-offs by year of origination. The updated guidance was effective for fiscal years beginning after December 15, 2022. Adoption of this ASU did not have a material impact on the Company’s consolidated financial statements; however, it resulted in new disclosures. See Note 4 for the new disclosures.
Note 2 Acquisitions
Hometown Bancorp, Ltd.
On February 10, 2023, the Company completed a merger with Hometown Bancorp, Ltd. (“Hometown”), a bank holding company headquartered in Fond du Lac, Wisconsin, pursuant to the Agreement and Plan of Bank Merger (“Merger Agreement”), dated as of July 25, 2022 by and among the Company and Hometown, whereby Hometown merged with and into the Company, and Hometown Bank, Hometown’s wholly-owned banking subsidiary, merged with and into the Bank. Hometown’s principal activity was the ownership and operation of Hometown Bank, a state-chartered banking institution that operated
The merger consideration totaled approximately $
88
The fair value of the assets acquired and liabilities assumed on February 10, 2023 was as follows:
As Recorded by |
| Fair Value | As Recorded by | ||||||
Hometown |
| Adjustments |
| the Company | |||||
Cash, cash equivalents and securities | $ | | $ | ( | $ | | |||
Other investments |
| |
| — | | ||||
Loans, net |
| |
| ( | | ||||
Premises and equipment, net |
| |
| ( | | ||||
Core deposit intangible |
| |
| | | ||||
Other assets |
| |
| ( | | ||||
Total assets acquired | $ | | $ | ( | $ | | |||
Deposits | $ | | $ | | $ | | |||
Other borrowings |
| |
| ( |
| | |||
Junior subordinated debentures | | ( | | ||||||
Other liabilities |
| |
| |
| | |||
Total liabilities assumed | $ | | $ | ( | $ | | |||
Excess of assets acquired over liabilities assumed | $ | | $ | ( | $ | | |||
Less: purchase price |
|
|
|
|
| | |||
Goodwill | | ||||||||
Refinement to fair value estimates (1) | ( | ||||||||
Goodwill (after refinement) |
|
|
|
| $ | | |||
| (1) | Refinement consists of adjustments to the initial fair value estimates of other assets and liabilities. |
Goodwill of $
The Company purchased loans through this merger for which there was, at the date of acquisition, more than insignificant deterioration of credit quality since origination. The carrying value of these loans at acquisition was as follows:
February 10, 2023 | |||
Purchase price of PCD loans at acquisition | $ | | |
Non-credit discount on PCD loans at acquisition | | ||
Allowance for credit losses on PCD loans at acquisition | | ||
Par value of PCD acquired loans at acquisition | $ | | |
Denmark Bancshares, Inc.
On August 12, 2022, the Company completed a merger with Denmark Bancshares, Inc. (“Denmark”), a bank holding company headquartered in Denmark, Wisconsin, pursuant to the Agreement and Plan of Bank Merger, dated as of January 18, 2022 by and between the Company and Denmark, whereby Denmark merged with and into the Company, and Denmark State Bank, Denmark’s wholly-owned banking subsidiary, merged with and into the Bank. Denmark’s principal activity was the ownership and operation of Denmark State Bank, a state-chartered banking institution that operated seven (
Pursuant to the terms of the merger agreement, Denmark shareholders could elect to receive either
89
The fair value of the assets acquired and liabilities assumed on August 12, 2022 was as follows:
As Recorded by |
| Fair Value | As Recorded by | ||||||
(in thousands) | Denmark |
| Adjustments |
| the Company | ||||
Cash, cash equivalents and securities | $ | | $ | ( | $ | | |||
Other investments |
| |
| — | | ||||
Loans, net |
| |
| ( | | ||||
Premises and equipment, net |
| |
| ( | | ||||
Core deposit intangible |
| — |
| | | ||||
Other assets |
| |
| | | ||||
Total assets acquired | $ | | $ | | $ | | |||
Deposits | $ | | $ | | $ | | |||
Other borrowings |
| |
| — |
| | |||
Other liabilities |
| |
| |
| | |||
Total liabilities assumed | $ | | $ | | $ | | |||
Excess of assets acquired over liabilities assumed | $ | | $ | | $ | | |||
Less: purchase price |
|
|
|
|
| | |||
Goodwill (originally recorded) | | ||||||||
Refinement to fair value estimates (1) | ( | ||||||||
Goodwill (after refinement) |
|
|
|
| $ | | |||
| (1) | Refinement consists of adjustments to the initial fair value estimates of other assets and liabilities, primarily related to accrued and deferred income taxes. |
The following unaudited pro forma information is presented for illustrative purposes only. The pro forma information should not be relied upon as being indicative of the historical results of operations the companies would have had if the merger had occurred before such periods or the future results of operations that the companies will experience as a result of the merger. The pro forma information, although helpful in illustrating the financial characteristics of the combined
company under one set of assumptions, does not reflect the benefits of expected cost savings, opportunities to earn additional revenue, the impact of restructuring and merger-related expenses, or other factors that may result as a consequence of the merger and, accordingly, does not attempt to predict or suggest future results.
| Year Ended | |||||
(in thousands, except per share data) |
| December 31, 2022 | ||||
Total revenue, net of interest expense | $ | | ||||
Net income | $ | | ||||
Diluted earnings per common share | $ | | ||||
The Company accounted for these transactions under the acquisition method of accounting, and thus, the financial position and results of operations of Hometown and Denmark prior to the consummation dates were not included in the accompanying consolidated financial statements. The Company determined the fair value of core deposit intangibles, securities, premises and equipment, loans, other assets and liabilities and deposits with the assistance of third-party valuations, appraisals and third-party advisors. The estimated fair values are subject to refinement for up to one year after deal consummation as additional information becomes available relative to the closing date fair values.
90
Note 3 Securities
The following is a summary of available for sale securities (dollar amounts in thousands):
|
| Gross |
| Gross |
| ||||||||
Amortized | Unrealized | Unrealized | Estimated | ||||||||||
Cost | Gains | Losses | Fair Value | ||||||||||
December 31, 2023 |
|
|
|
|
|
|
|
| |||||
Obligations of U.S. Government sponsored agencies | $ | | $ | | $ | ( | $ | | |||||
Obligations of states and political subdivisions | | | ( | | |||||||||
Mortgage-backed securities | | | ( | | |||||||||
Corporate notes |
| |
| — |
| ( |
| | |||||
Certificates of deposit | | — | ( | | |||||||||
Total available for sale securities | $ | | $ | | $ | ( | $ | | |||||
December 31, 2022 |
|
|
|
|
|
|
|
| |||||
U.S. Treasury securities | $ | | $ | — | $ | ( | $ | | |||||
Obligations of U.S. Government sponsored agencies | | — | ( | | |||||||||
Obligations of states and political subdivisions | | | ( | | |||||||||
Mortgage-backed securities |
| |
| — |
| ( |
| | |||||
Corporate notes |
| |
| |
| ( |
| | |||||
Certificates of deposit | | — | ( | | |||||||||
Total available for sale securities | $ | | $ | | $ | ( | $ | | |||||
The following is a summary of held to maturity securities (dollar amounts in thousands):
|
| Gross |
| Gross |
| |||||||
Amortized | Unrealized | Unrealized | Estimated | |||||||||
Cost | Gains | Losses | Fair Value | |||||||||
December 31, 2023 | ||||||||||||
U.S. Treasury securities | $ | | $ | | $ | ( | $ | | ||||
Obligations of states and political subdivisions | | — | — | | ||||||||
Total held to maturity securities | $ | | $ | | $ | ( | $ | | ||||
December 31, 2022 |
|
|
|
|
|
|
|
| ||||
U.S. Treasury securities | $ | | $ | | $ | ( | $ | | ||||
Obligations of states and political subdivisions | | — | ( | | ||||||||
Total held to maturity securities | $ | | $ | | $ | ( | $ | | ||||
91
The following table shows the fair value and gross unrealized losses of securities with unrealized losses, aggregated by investment category and length of time that individual securities have been in a continuous unrealized loss position (dollar amounts in thousands):
Less Than 12 Months | Greater Than 12 Months | Total | |||||||||||||||||
Number | |||||||||||||||||||
Fair |
| Unrealized |
| Fair |
| Unrealized |
| Fair | Unrealized | of | |||||||||
Value | Losses | Value | Losses | Value | Losses | Securities | |||||||||||||
December 31, 2023 - Available for Sale | |||||||||||||||||||
Obligations of U.S. Government sponsored agencies | $ | | $ | ( | $ | | $ | ( | $ | | $ | ( | | ||||||
Obligations of states and political subdivisions | | ( | | ( | | ( | | ||||||||||||
Mortgage-backed securities |
| |
| ( |
| |
| ( |
| |
| ( |
| | |||||
Corporate notes |
| |
| ( |
| |
| ( |
| |
| ( |
| | |||||
Certificate of deposits | — | — | | ( | | ( | | ||||||||||||
Totals | $ | | $ | ( | $ | | $ | ( | $ | | $ | ( |
| | |||||
December 31, 2023 - Held to Maturity | |||||||||||||||||||
U.S. Treasury securities | $ | | $ | ( | $ | | $ | ( | $ | | $ | ( | | ||||||
Obligations of states and political subdivisions | — | — | | — | | — | | ||||||||||||
Totals | $ | | $ | ( | $ | | $ | ( | $ | | $ | ( | | ||||||
December 31, 2022 - Available for Sale |
|
|
|
|
|
|
|
|
|
|
|
|
|
| |||||
U.S. Treasury securities | $ | | $ | ( | $ | | $ | ( | $ | | $ | ( | | ||||||
Obligations of U.S. Government sponsored agencies | | ( | | ( | | ( | | ||||||||||||
Obligations of states and political subdivisions | | ( | | ( | | ( | | ||||||||||||
Mortgage-backed securities |
| |
| ( |
| |
| ( |
| |
| ( |
| | |||||
Corporate notes |
| |
| ( |
| |
| ( |
| |
| ( |
| | |||||
Certificate of deposits | | ( | — | — | | ( | | ||||||||||||
Totals | $ | | $ | ( | $ | | $ | ( | $ | | $ | ( | | ||||||
December 31, 2022 - Held to Maturity |
|
|
|
|
|
|
|
|
|
|
|
|
|
| |||||
U.S. Treasury securities | $ | | $ | ( | $ | | $ | ( | $ | | $ | ( | | ||||||
Obligations of states and political subdivisions |
| |
| ( |
| — |
| — |
| |
| ( | | ||||||
Totals | $ | | $ | ( | $ | | $ | ( | $ | | $ | ( | | ||||||
As of December 31, 2023,
92
Furthermore, the Company monitors the credit quality of debt securities held to maturity quarterly through the use of credit ratings. U.S. Treasury securities at December 31, 2023 were all rated AAA and have the full faith and credit backing of the United States Government. Obligations of states and political subdivisions in an unrealized loss position at December 31, 2023 are not material to the financial statements.
Contractual maturities will differ from expected maturities for mortgage-backed securities because borrowers may have the right to call or prepay obligations without penalties. The following is a summary of amortized cost and estimated fair value of securities, by contractual maturity, as of December 31, 2023 (dollar amounts in thousands):
Available for Sale | Held to Maturity | |||||||||||
| Amortized |
| Estimated |
| Amortized |
| Estimated | |||||
Cost | Fair Value | Cost | Fair Value | |||||||||
Due in one year or less | $ | | $ | | $ | | $ | | ||||
Due after one year through 5 years |
| |
| | | | ||||||
Due after 5 years through ten years |
| |
| | | | ||||||
Due after 10 years |
| |
| | — | — | ||||||
Subtotal |
| |
| | | | ||||||
Mortgage-backed securities |
| |
| | — | — | ||||||
Total | $ | | $ | | $ | | $ | | ||||
Following is a summary of the proceeds from sales of securities available for sale, as well as gross gains and losses, from the years ended December 31 (dollar amounts in thousands):
| 2023 |
| 2022 |
| 2021 | ||||
Proceeds from sales of securities | $ | | $ | $ | | ||||
Gross gains on sales |
| |
|
| — | ||||
Gross losses on sales |
| ( |
|
| ( | ||||
As of December 31, 2023 and 2022, the carrying values of securities pledged to secure public deposits, securities sold under repurchase agreements, and for other purposes required or permitted by law were approximately $
Note 4 Loans
The composition of loans at December 31 is as follows (dollar amounts in thousands):
2023 |
| 2022 | ||||
Commercial/industrial | $ | | $ | | ||
Commercial real estate - owner occupied |
| |
| | ||
Commercial real estate - non-owner occupied |
| |
| | ||
Multi-family | | | ||||
Construction and development |
| |
| | ||
Residential 1‑4 family |
| |
| | ||
Consumer |
| |
| | ||
Other |
| |
| | ||
Subtotals |
| |
| | ||
ACL - Loans |
| ( |
| ( | ||
Loans, net of ACL - Loans |
| |
| | ||
Deferred loan fees, net |
| ( |
| ( | ||
Loans, net | $ | | $ | | ||
93
The ACL - Loans is based on the Company’s evaluation of historical default and loss experience, current and projected economic conditions, asset quality trends, known and inherent risks in the portfolio, adverse situations that may affect the borrowers’ ability to repay a loan, the estimated value of any underlying collateral, composition of the loan portfolio and other relevant factors. Loans with similar risk characteristics are evaluated in pools and the Company utilizes a discounted cash flow (“DCF”) method to estimate ACL for all loan pools. Under the DCF method, probability of default (“PD”) and loss given default (“LGD”) are applied to a projective model of the pool’s cash flows while considering prepayment and principal curtailment effects. The analysis produces expected cash flows for each instrument in the pool by pairing loan-level term information (maturity date, payment amount, interest rate, etc.) with top-down pool assumptions (default rates and prepayment speeds). Management has determined that peer loss experience provides the best basis for its assessment of expected credit losses to determine the ACL. The Company utilized peer call report data to measure historical credit loss experience with similar risk characteristics within the segments over an economic cycle. Management reviewed the historical loss information to appropriately adjust for differences in current asset specific risk characteristics.
The historical loss experience estimate by pool is then adjusted by forecast factors that are quantitatively related to the Company’s historical credit loss experience. For all loan pools, the Company utilizes and forecasts the national unemployment rate as a loss driver. The Company also utilizes and forecasts national GDP growth as a second loss driver for its commercial real estate – owner occupied and construction and development pools, the CRE (SA) interest rates and price index as a second loss driver for its commercial real estate – non-owner occupied pool, the real retail and food services sales index as a second loss driver for its consumer loan pool, and the S&P Case-Schiller US home price index as a second loss driver for its residential 1-4 family pool. For both national unemployment and national GDP growth the Company utilized a twelve-month forecast period, followed by a twelve-month reversion to the mean. The Company utilized the high-end range of the Federal Reserve Bank Open Market Committee forecast for national unemployment and the low-end range for national GDP growth at December 31, 2023. As of December 31, 2023, the Company anticipates the national unemployment rate to rise during the forecast period and the national GDP growth rate to decline. Due to a lack of reliable forecasts, the Company utilized long-term averages for the remaining loss drivers. The reasonable and supportable period and reversion period are re-evaluated each quarter by the Company and are dependent on the current economic environment among other factors.
The expected credit losses for each loan pool are then adjusted for changes in qualitative factors not inherently considered in the quantitative analyses. The qualitative adjustments either increase or decrease the quantitative model estimation. The Company considers factors that are relevant within the qualitative framework which include the following: lending policy, changes in nature and volume of loans, staff experience, changes in volume and trends of problem loans, concentration risk, trends in underlying collateral values, external factors, quality of loan review system and other economic conditions.
Expected credit losses for loans that no longer share similar risk characteristics with the collectively evaluated pools are excluded from the collective evaluation and estimated on an individual basis. Specific allocations of the ACL for credit losses on individually evaluated loans are estimated on one of several methods, including the estimated fair value of the underlying collateral, observable market value of similar debt or the present value of expected cash flows.
In addition to several minor refinements to the model during the fourth quarter of 2023, the Company performed a loss driver refresh study to determine whether the utilized loss drivers remained appropriate. While the fundamental methodology remained unchanged, as a result of this study, the real retail and food services sales index was introduced and applied to the consumer loan pool. In addition, multi-family loans were separated from commercial real estate – non-owner occupied into their own pool. The net impact of these changes during the fourth quarter of 2023 were not material to the model as the ACL-Loans to total loans ratio was
94
A summary of the activity in ACL - Loans by loan type as of December 31, 2023 is as follows (dollar amounts in thousands):
|
| Commercial |
| Commercial |
|
|
|
|
| ||||||||||||||||||
Real Estate - | Real Estate - | Construction | |||||||||||||||||||||||||
Commercial / | Owner | Non - Owner | Multi- | and | Residential | ||||||||||||||||||||||
Industrial | Occupied | Occupied | Family | Development | 1-4 Family | Consumer | Other | Total | |||||||||||||||||||
ACL - Loans - January 1, 2023 | $ | | $ | | $ | | $ | | $ | | $ | | $ | | $ | | $ | | |||||||||
Adoption of CECL | | | | | | | | ( | | ||||||||||||||||||
ACL - Loans on PCD loans acquired | | | — | — | — | | — | — | | ||||||||||||||||||
Charge-offs |
| — | — | — | — |
| — |
| — |
| ( |
| ( |
| ( | ||||||||||||
Recoveries |
| | | — | — |
| — |
| |
| |
| |
| | ||||||||||||
Provision |
| ( | | | |
| ( |
| |
| ( |
| |
| | ||||||||||||
ACL - Loans - December 31, 2023 | $ | | $ | | $ | | $ | | $ | | $ | | $ | | $ | | $ | | |||||||||
A summary of the activity in the allowance for loan losses (“ALL”) by loan type as of December 31, 2022 is as follows (dollar amounts in thousands):
|
| Commercial |
| Commercial |
|
|
|
|
|
|
|
|
|
|
|
|
|
|
|
|
|
| |||||
Real Estate - | Real Estate - | Construction | |||||||||||||||||||||||||
Commercial / | Owner | Non - Owner | Multi- | and | Residential | ||||||||||||||||||||||
Industrial | Occupied | Occupied | Family | Development | 1-4 Family | Consumer | Other | Total | |||||||||||||||||||
ALL - January 1, 2022 | $ | | $ | | $ | | $ | | $ | | $ | | $ | | $ | | $ | | |||||||||
Charge-offs |
| — | ( | — | — |
| — |
| ( |
| ( |
| ( |
| ( | ||||||||||||
Recoveries |
| | | | — |
| |
| |
| |
| |
| | ||||||||||||
Provision |
| ( | | ( | — |
| |
| |
| |
| ( |
| | ||||||||||||
ALL December 31, 2022 |
| | | | |
| |
| |
| |
| |
| | ||||||||||||
ALL ending balance individually evaluated for impairment |
| — | — | | — |
| — |
| — |
| — |
| — |
| | ||||||||||||
ALL ending balance collectively evaluated for impairment | $ | | $ | | $ | | $ | | $ | | $ | | $ | | $ | | $ | | |||||||||
Loans outstanding - December 31, 2022 | $ | | $ | | $ | | $ | | $ | | $ | | $ | | $ | | $ | | |||||||||
Loans ending balance individually evaluated for impairment |
| | | | — |
| — |
| |
| — |
| — |
| | ||||||||||||
Loans ending balance collectively evaluated for impairment | $ | | $ | | $ | | $ | | $ | | $ | | $ | | $ | | $ | | |||||||||
In addition to the ACL-Loans, the Company has established an ACL-Unfunded Commitments, classified in other liabilities on the consolidated balance sheets. This allowance is maintained to absorb losses arising from unfunded loan commitments related to fixed and variable rate commitments to extend credit, and is determined quarterly based on methodology similar to the methodology for determining the ACL-Loans. This quarterly assessment includes consideration of the likelihood that funding of these commitments will eventually occur. The Company has identified the unfunded portion of certain lines of credit, credit card arrangements and letters of credit as unconditionally cancellable credit exposures, meaning the Company can cancel the unfunded commitment at any time. No credit loss estimate is recorded for off-balance sheet credit exposures that are unconditionally cancelable by the Company or for undrawn amounts under such arrangements that may be drawn prior to the cancellation of the arrangement. The ACL - Unfunded Commitments was $
95
The provision for credit losses is determined by the Company as the amount to be added to the ACL loss accounts for various types of financial instruments including loans, investment securities, and off-balance sheet credit exposures after net charge-offs have been deducted to bring the ACL to a level that, in management’s judgment, is necessary to absorb expected credit losses over the lives of the respective financial instruments.
The following table presents the components of the provision for credit losses (dollar amounts in thousands):
Year Ended | |||||||
December 31, 2023 | December 31, 2022 | ||||||
Provision for credit losses on: | |||||||
Loans | $ | | $ | | |||
Unfunded Commitments | | — | |||||
Total provision for credit losses | $ | | $ | | |||
A summary of past due loans as of December 31, 2023 are as follows (dollar amounts in thousands):
|
| 90 Days |
|
| Non-Accrual | ||||||||||
30-89 Days | or more | with no | |||||||||||||
Past Due | Past Due | Non- | specifically | ||||||||||||
Accruing | and Accruing | Accrual | Total | allocated ACL | |||||||||||
Commercial/industrial | $ | | $ | | $ | | $ | | $ | | |||||
Commercial real estate - owner occupied |
| |
| |
| |
| |
| | |||||
Commercial real estate - non-owner occupied |
| |
| — |
| — |
| |
| — | |||||
Multi-family | — | — | — | — | — | ||||||||||
Construction and development |
| — |
| — |
| — |
| — |
| — | |||||
Residential 1‑4 family |
| |
| |
| |
| |
| | |||||
Consumer |
| |
| |
| |
| |
| | |||||
Other |
| — |
| — |
| — |
| — |
| — | |||||
$ | | $ | | $ | | $ | | $ | | ||||||
A summary of past due loans as of December 31, 2022 are as follows (dollar amounts in thousands):
|
| 90 Days |
|
| |||||||||||
30-89 Days | or more | ||||||||||||||
Past Due | Past Due | ||||||||||||||
Accruing | and Accruing | Non-Accrual | Total | ||||||||||||
Commercial/industrial | $ | | $ | — | $ | | $ | | |||||||
Commercial real estate - owner occupied |
| |
| — |
| |
| | |||||||
Commercial real estate - non-owner occupied |
| — |
| — |
| — |
| — | |||||||
Multi-family | — | — | — | — | |||||||||||
Construction and development |
| |
| — |
| |
| | |||||||
Residential 1‑4 family |
| |
| |
| |
| | |||||||
Consumer |
| |
| |
| — |
| | |||||||
Other |
| — |
| — |
| — |
| — | |||||||
$ | | $ | | $ | | $ | | ||||||||
96
A loan is considered to be collateral dependent when, based upon management’s assessment, the borrower is experiencing financial difficulty and repayment is expected to be provided substantially through the operation or sale of the collateral. For collateral dependent loans, expected credit losses are based on the estimated fair value of the collateral at the balance sheet date, with consideration for estimated selling costs if satisfaction of the loan depends on the sale of the collateral.
The following table presents collateral dependent loans by portfolio segment and collateral type, including those loans with and without a related allowance allocation (dollar amounts in thousands). A significant portion of the loan balances in this table and essentially all of the allowance allocations relate to PCD loans which were acquired from Hometown. Real estate collateral primarily consists of operating facilities of the underlying borrowers. Other business assets collateral primarily consists of receivables and inventory of the underlying borrowers.
Collateral Type | ||||||||||||||||||
As of December 31, 2023 | Other | Without an | With an | Allowance | ||||||||||||||
Real Estate | Business Assets | Total | Allowance | Allowance | Allocation | |||||||||||||
Commercial/industrial | $ | — | $ | | $ | | $ | | $ | | $ | | ||||||
Commercial real estate - owner occupied |
| |
| — |
| |
| |
| |
| | ||||||
Commercial real estate - non-owner occupied |
| — |
| — |
| — |
| — |
| — |
| — | ||||||
Multi-family | — | — | — | — | — | — | ||||||||||||
Construction and development |
| — |
| — |
| — |
| — |
| — |
| — | ||||||
Residential 1‑4 family |
| |
| — |
| |
| |
| — |
| — | ||||||
Consumer |
| — |
| — |
| — |
| — |
| — |
| — | ||||||
Other |
| — |
| — |
| — |
| — |
| — |
| — | ||||||
Total Loans | $ | | $ | | $ | | $ | | $ | | $ | | ||||||
97
Prior to the adoption of ASU 2016-13, the allowance included specific reserves for certain individually evaluated impaired loans. Specific reserves reflected estimated losses on impaired loans from management’s analysis developed through specific credit allocations. The following table shows a summary of impaired loans individually evaluated as of December 31, 2022 (dollar amounts in thousands):
|
| Commercial |
| Commercial |
|
|
|
|
| ||||||||||||||||||
Real Estate - | Real Estate - | Construction | |||||||||||||||||||||||||
Commercial/ | Owner | Non - Owner | Multi- | and | Residential | ||||||||||||||||||||||
Industrial | Occupied | Occupied | Family | Development | 1‑4 Family | Consumer | Other | Total | |||||||||||||||||||
With an allowance recorded: |
|
|
|
|
|
|
|
|
|
|
|
|
|
|
|
| |||||||||||
Recorded investment | $ | — | $ | — | $ | | $ | — | $ | — | $ | — | $ | — | $ | — | $ | | |||||||||
Unpaid principal balance |
| — |
| — |
| |
| — |
| — |
| — |
| — |
| — |
| | |||||||||
Related allowance |
| — |
| — |
| |
| — |
| — |
| — |
| — |
| — |
| | |||||||||
With no related allowance recorded: |
|
|
|
|
|
|
|
|
|
|
|
| |||||||||||||||
Recorded investment | $ | | $ | | $ | | $ | — | $ | — | $ | | $ | — | $ | — | $ | | |||||||||
Unpaid principal balance |
| |
| |
| |
| — |
| — |
| |
| — |
| — |
| | |||||||||
Related allowance |
| — |
| — |
| — |
| — |
| — |
| — |
| — |
| — |
| — | |||||||||
Total: |
|
|
|
|
|
|
|
|
|
|
|
| |||||||||||||||
Recorded investment | $ | | $ | | $ | | $ | — | $ | — | $ | | $ | — | $ | — | $ | | |||||||||
Unpaid principal balance |
| |
| |
| |
| — |
| — |
| |
| — |
| — |
| | |||||||||
Related allowance |
| — |
| — |
| |
| — |
| — |
| — |
| — |
| — |
| | |||||||||
Average recorded investment | $ | | $ | | $ | | $ | — | $ | — | $ | | $ | — | $ | — | $ | | |||||||||
The Company utilizes a numerical risk rating system for commercial relationships. All other types of relationships (ex: residential, consumer, other) are assigned a “Pass” rating, unless they have fallen 90 days past due or more, at which time they receive a rating of 7. The Company uses split ratings for government guaranties on loans. The portion of a loan that is supported by a government guaranty is included with other Pass credits.
The determination of a commercial loan risk rating begins with completion of a matrix, which assigns scores based on the strength of the borrower’s debt service coverage, collateral coverage, balance sheet leverage, industry outlook, and customer concentration. A weighted average is taken of these individual scores to arrive at the overall rating. This rating is subject to adjustment by the loan officer based on facts and circumstances pertaining to the borrower. Risk ratings are subject to independent review.
Commercial borrowers with ratings between 1 and 5 are considered Pass credits, with 1 being most acceptable and 5 being just above the minimum level of acceptance. Commercial borrowers rated 6 have potential weaknesses which may jeopardize repayment ability. Borrowers rated 7 have a well-defined weakness or weaknesses such as the inability to demonstrate significant cash flow for debt service based on analysis of the company’s financial information. These loans remain on accrual status provided full collection of principal and interest is reasonably expected. Otherwise they are deemed impaired and placed on nonaccrual status. Borrowers rated 8 are the same as 7 rated credits with one exception: collection or liquidation in full is not probable.
98
The following table presents total loans by risk ratings and year of origination. Loans acquired from other previously acquired institutions have been included in the table based upon the actual origination date (dollar amounts in thousands).
Amortized Cost Basis by Origination Year | ||||||||||||||||||
As of December 31, 2023 | Revolving | |||||||||||||||||
2023 | 2022 | 2021 | 2020 | 2019 | Prior | Revolving | to Term | Total | ||||||||||
Commercial/industrial | ||||||||||||||||||
Grades 1-4 | $ | | $ | | $ | | $ | | $ | | $ | | $ | | $ | - | $ | |
Grade 5 | | | | | | | | - | | |||||||||
Grade 6 | | | | | - | - | | - | | |||||||||
Grade 7 | | | | | | | | - | | |||||||||
Grade 8 | - | - | - | - | - | - | - | - | - | |||||||||
Total | $ | | $ | | $ | | $ | | $ | | $ | | $ | | $ | - | $ | |
Current-period gross charge-offs | $ | - | $ | - | $ | - | $ | - | $ | - | $ | - | $ | - | $ | - | $ | - |
Commercial real estate - owner occupied | ||||||||||||||||||
Grades 1-4 | $ | | $ | | $ | | $ | | $ | | $ | | $ | | $ | - | $ | |
Grade 5 | | | | | | | | - | | |||||||||
Grade 6 | - | | | | | | | - | | |||||||||
Grade 7 | | | | | | | | - | | |||||||||
Grade 8 | - | - | - | - | - | - | - | - | - | |||||||||
Total | $ | | $ | | $ | | $ | | $ | | $ | | $ | | $ | - | $ | |
Current-period gross charge-offs | $ | - | $ | - | $ | - | $ | - | $ | - | $ | - | $ | - | $ | - | $ | - |
Commercial real estate - non-owner occupied | ||||||||||||||||||
Grades 1-4 | $ | | $ | | $ | | $ | | $ | | $ | | $ | | $ | - | $ | |
Grade 5 | | | | | | | - | - | | |||||||||
Grade 6 | - | - | - | - | - | - | - | - | - | |||||||||
Grade 7 | - | - | | | | | - | - | | |||||||||
Grade 8 | - | - | - | - | - | - | - | - | - | |||||||||
Total | $ | | $ | | $ | | $ | | $ | | $ | | $ | | $ | - | $ | |
Current-period gross charge-offs | $ | - | $ | - | $ | - | $ | - | $ | - | $ | - | $ | - | $ | - | $ | - |
Multi-family | ||||||||||||||||||
Grades 1-4 | $ | | $ | | $ | | $ | | $ | | $ | | $ | | $ | - | $ | |
Grade 5 | | | | - | - | | - | - | | |||||||||
Grade 6 | - | - | - | - | - | - | - | - | - | |||||||||
Grade 7 | - | - | - | - | - | - | - | - | - | |||||||||
Grade 8 | - | - | - | - | - | - | - | - | - | |||||||||
Total | $ | | $ | | $ | | $ | | $ | | $ | | $ | | $ | - | $ | |
Current-period gross charge-offs | $ | - | $ | - | $ | - | $ | - | $ | - | $ | - | $ | - | $ | - | $ | - |
Construction and development | ||||||||||||||||||
Grades 1-4 | $ | | $ | | $ | | $ | | $ | | $ | | $ | | $ | - | $ | |
Grade 5 | | | | | - | | | - | | |||||||||
Grade 6 | - | - | - | - | - | - | - | - | - | |||||||||
Grade 7 | | - | - | | - | | - | - | | |||||||||
Grade 8 | - | - | - | - | - | - | - | - | - | |||||||||
Total | $ | | $ | | $ | | $ | | $ | | $ | | $ | | $ | - | $ | |
Current-period gross charge-offs | $ | - | $ | - | $ | - | $ | - | $ | - | $ | - | $ | - | $ | - | $ | - |
Residential 1‑4 family | ||||||||||||||||||
Grades 1-4 | $ | | $ | | $ | | $ | | $ | | $ | | $ | | $ | - | $ | |
Grade 5 | | | | | | | | - | | |||||||||
Grade 6 | | | | - | - | | | - | | |||||||||
Grade 7 | | | | | | | | - | | |||||||||
Grade 8 | - | - | - | - | - | - | - | - | - | |||||||||
Total | $ | | $ | | $ | | $ | | $ | | $ | | $ | | $ | - | $ | |
Current-period gross charge-offs | $ | - | $ | - | $ | - | $ | - | $ | - | $ | - | $ | - | $ | - | $ | - |
Consumer | ||||||||||||||||||
Grades 1-4 | $ | | $ | | $ | | $ | | $ | | $ | | $ | | $ | - | $ | |
Grade 5 | - | - | - | - | - | - | - | - | - | |||||||||
Grade 6 | - | - | - | - | - | - | - | - | - | |||||||||
Grade 7 | - | - | - | - | - | | - | - | | |||||||||
Grade 8 | - | - | - | - | - | - | - | - | - | |||||||||
Total | $ | | $ | | $ | | $ | | $ | | $ | | $ | | $ | - | $ | |
Current-period gross charge-offs | $ | - | $ | - | $ | - | $ | - | $ | - | $ | - | $ | | $ | - | $ | |
Other | ||||||||||||||||||
Grades 1-4 | $ | | $ | | $ | | $ | | $ | | $ | | $ | | $ | - | $ | |
Grade 5 | - | - | - | - | - | - | | - | | |||||||||
Grade 6 | - | - | - | - | - | - | - | - | - | |||||||||
Grade 7 | - | - | - | - | - | - | - | - | - | |||||||||
Grade 8 | - | - | - | - | - | - | - | - | - | |||||||||
Total | $ | | $ | | $ | | $ | | $ | | $ | | $ | | $ | - | $ | |
Current-period gross charge-offs | $ | - | $ | - | $ | - | $ | - | $ | - | $ | - | $ | | $ | - | $ | |
Total Loans | $ | | $ | | $ | | $ | | $ | | $ | | $ | | $ | - | $ | |
Total current-period gross charge-offs | $ | - | $ | - | $ | - | $ | - | $ | - | $ | - | $ | | $ | - | $ | |
99
The breakdown of loans by risk rating as of December 31, 2022 is as follows (dollar amounts in thousands):
| Pass (1-5) |
| 6 |
| 7 |
| 8 |
| Total | ||||||
Commercial/industrial | $ | | $ | | $ | | $ | — | $ | | |||||
Commercial real estate - owner occupied |
| |
| |
| |
| — |
| | |||||
Commercial real estate - non-owner occupied |
| |
| — |
| |
| — |
| | |||||
Commercial real estate - multi-family | | — | — | — | | ||||||||||
Construction and development |
| |
| — |
| |
| — |
| | |||||
Residential 1‑4 family |
| |
| |
| |
| — |
| | |||||
Consumer |
| |
| — |
| |
| — |
| | |||||
Other |
| |
| — |
| — |
| — |
| | |||||
$ | | $ | | $ | | $ | — | $ | | ||||||
On January 1, 2023, the Company adopted ASU 2022-02, which eliminated the accounting guidance for TDRs by creditors and enhanced the disclosure requirements for certain loan modifications to borrowers experiencing financial difficulty. Loans that were both experiencing financial difficulty and were modified during the year ended December 31, 2023, were insignificant to these consolidated financial statements. The Company also had no new TDRs during the year ended December 31, 2022.
The following tables present loans acquired with deteriorated credit quality and the change in the accretable and non-accretable components of the related discounts prior to the adoption of ASU 2016-13 (dollar amounts in thousands).
December 31, 2022 | ||||||
Unpaid | ||||||
Recorded | Principal | |||||
| Investment |
| Balance | |||
Commercial & Industrial | $ | | $ | | ||
Commercial real estate - owner occupied |
| |
| | ||
Commercial real estate - non-owner occupied |
| — |
| — | ||
Commercial real estate - multi-family | — | — | ||||
Construction and development |
| — |
| — | ||
Residential 1‑4 family |
| |
| | ||
Consumer |
| — |
| — | ||
Other |
| — |
| — | ||
$ | | $ | | |||
The following table represents the change in the accretable and non-accretable components of discounts on loans acquired with deteriorated credit quality (dollar amounts in thousands):
December 31, 2022 | ||||||
Accretable | Non-accretable | |||||
| discount |
| discount | |||
Balance at beginning of period | $ | | $ | | ||
Acquired balance, net |
| |
| | ||
Reclassifications between accretable and non-accretable |
| |
| ( | ||
Accretion to loan interest income |
| ( |
| — | ||
Balance at end of period | $ | | $ | | ||
100
Note 5 Related Party Matters
Directors, executive officers, and principal shareholders of the Company, including their families and firms in which they are principal owners, are considered to be related parties. Loans to officers, directors, and shareholders owning 10% or more of the Company, that we are aware of, were made on the same terms, including interest rates and collateral, as those prevailing at the time for comparable transactions with others and did not involve more than the normal risk of collectability or present other unfavorable features.
A summary of loans to directors, executive officers, principal shareholders, and their affiliates for the years ended December 31 is as follows (dollar amounts in thousands):
| 2023 |
| 2022 | |||
Balances at beginning | $ | | $ | | ||
New loans and advances |
| |
| | ||
Repayments |
| ( |
| ( | ||
Balance at end | $ | | $ | | ||
Deposits from directors, executive officers, principal shareholders, and their affiliates totaled approximately $
Note 6 Mortgage Servicing Rights
Loans serviced for others are not included in the accompanying consolidated balance sheets. MSRs are recognized as separate assets when loans sold in the secondary market are sold with servicing retained. The Company utilizes a third-party consulting firm to determine an accurate assessment of the mortgage servicing rights fair value. The third-party firm collects relevant data points from numerous sources. Some of these data points relate directly to the pricing level or relative value of the mortgage servicing while other data points relate to the assumptions used to derive fair value. In addition, the valuation evaluates specific collateral types, and current and historical performance of the collateral in question. The valuation process focuses on the non-distressed secondary servicing market, common industry practices and current regulatory standards. The primary determinants of the fair value of mortgage servicing rights are servicing fee percentage, ancillary income, expected loan life or prepayment speeds, discount rates, costs to service, delinquency rates, foreclosure losses and recourse obligations. The valuation data also contains interest rate shock analyses for monitoring fair value changes in differing interest rate environments.
Following is an analysis of activity in servicing rights assets that are measured at fair value (dollar amounts in thousands):
| Year Ended |
| Year Ended | |||
December 31, 2023 | December 31, 2022 | |||||
Fair value at beginning of period | $ | | $ | | ||
Servicing asset additions |
| |
| | ||
Loan payments and payoffs |
| ( |
| ( | ||
Changes in valuation inputs and assumptions used in the valuation model |
| |
| | ||
Amount recognized through earnings | | | ||||
MSR asset acquired |
| |
| | ||
Fair value at end of period | $ | | $ | | ||
Unpaid principal balance of loans serviced for others | $ | | $ | | ||
Mortgage servicing rights as a percent of loans serviced for others |
| |
| | ||
During the years ended December 31, 2023 and 2022, the Company utilized economic assumptions in measuring the initial value of MSRs for loans sold whereby servicing is retained by the Company. The economic assumptions used at December 31, 2023 and 2022 included constant prepayment speed of
101
The assumptions used by the Company are hypothetical and supported by a third-party valuation. The Company’s methodology for estimating the fair value of MSRs is highly sensitive to changes in assumptions.
The carrying value of the mortgage servicing rights approximates fair market value at December 31, 2023 and 2022.
Note 7 Premises and Equipment
An analysis of premises and equipment at December 31 follows (dollar amounts in thousands):
| 2023 |
| 2022 | |||
Land and land improvements | $ | | $ | | ||
Buildings and building improvements |
| |
| | ||
Furniture and equipment |
| |
| | ||
Totals |
| |
| | ||
Less accumulated depreciation |
| |
| | ||
| | |||||
Premises and equipment, net | $ | | $ | | ||
Included in buildings and improvements at December 31, 2023 and 2022, is $
Depreciation and amortization of premises and equipment charged to operating expense totaled approximately $
Note 8 Other Real Estate Owned
Changes in OREO for the years ended December 31 were as follows (dollar amounts in thousands):
| 2023 |
| 2022 | |||
Beginning of year | $ | | $ | | ||
Transfers in |
| |
| | ||
Assets Acquired | | | ||||
(Loss) gain on sale of OREO and valuation allowance |
| ( |
| | ||
Sales |
| ( |
| ( | ||
End of year | $ | | $ | | ||
Activity in the valuation allowance for the years ended December 31 was as follows (dollar amounts in thousands):
| 2023 |
| 2022 |
| 2021 | ||||
Beginning of year | $ | $ | | $ | | ||||
Additions charged to expense |
| |
| |
| | |||
Valuation relieved due to sale of OREO |
| — |
| ( |
| ( | |||
End of year | $ | | $ | $ | | ||||
Note 9 Investment in Minority-owned Subsidiaries
TVG, the insurance subsidiary of the Bank, maintained a
102
As of December 31, 2023 and 2022, Ansay had term loans with the Bank totaling approximately $
Ansay maintained deposits at the Bank totaling $
The CEO of Ansay, Michael G. Ansay, served as a member of the Board of the Company until retiring on January 15, 2024. As a related party, during 2023, 2022 and 2021 the Company received insurance consulting services and purchased director and officer fidelity bond and commercial insurance coverage through Ansay spending approximately $
The Company’s proportionate share of earnings of Ansay flow through to its tax return. Deferred income taxes of approximately $
The Company had a
The Company’s proportionate share of earnings of UFS flow through to its tax return. Deferred income taxes of approximately $
Note 10 Core Deposit Intangibles
The gross carrying amount and accumulated amortization of core deposit intangibles for the years ended December 31 are as follows (dollar amounts in thousands):
2023 | 2022 | |||||||||||
| Gross |
| Intangible |
| Gross |
| Intangible | |||||
Carrying | Accumulated | Carrying | Accumulated | |||||||||
Amount | Amortization | Amount | Amortization | |||||||||
Core deposit intangible | $ | | $ | | $ | | $ | | ||||
Amortization expense was $
The following table shows the estimated future amortization expense of core deposit intangibles. The projections of amortization expense are based on existing asset balances as of December 31, 2023 (dollar amounts in thousands):
| Core | ||
Deposit | |||
Intangible | |||
2024 | $ | | |
2025 |
| | |
2026 |
| | |
2027 |
| | |
2028 |
| | |
Thereafter |
| | |
Total | $ | | |
103
Note 11 Goodwill
Goodwill was $
Note 12 Deposits
The composition of deposits at December 31 is as follows (dollar amounts in thousands):
| 2023 |
| 2022 | |||
Noninterest-bearing demand deposits | $ | | $ | | ||
Interest-bearing demand deposits |
| |
| | ||
Savings deposits |
| |
| | ||
Time deposits |
| |
| | ||
Brokered certificates of deposit |
| |
| | ||
Total deposits | $ | | $ | | ||
Time deposits of $250,000 or more were approximately $
The scheduled maturities of time deposits at December 31, 2023, are summarized as follows (dollar amounts in thousands):
2024 |
| $ | |
2025 |
| | |
2026 |
| | |
2027 |
| | |
2028 |
| | |
Thereafter |
| | |
Total | $ | |
Note 13 Securities Sold Under Repurchase Agreements
Securities sold under repurchase agreements have contractual maturities up to
Information concerning securities sold under repurchase agreements at December 31 consists of the following (dollar amounts in thousands):
| 2023 |
| 2022 |
| 2021 |
| ||||
Outstanding balance at the end of the year | $ | | $ | | $ | | ||||
Weighted average interest rate at the end of the year |
| | % |
| | % |
| | % | |
Average balance during the year | $ | | $ | | $ | | ||||
Average interest rate during the year |
| | % |
| | % |
| | % | |
Maximum month end balance during the year | $ | | $ | | $ | | ||||
104
Note 14 Notes Payable
There were $
| Maturity |
| Rate |
| 2023 |
| 2022 | |||
(dollars in thousands) | ||||||||||
Fixed rate, fixed term | 06/01/2023 | | % | — | | |||||
Fixed rate, fixed term |
| 11/21/2023 |
| | % |
| — |
| | |
Fixed rate, fixed term | 03/23/2026 | | % | | — | |||||
Fixed rate, fixed term | 05/26/2026 | | % | | — | |||||
Fixed rate, fixed term | 03/23/2027 | | % | | — | |||||
Fixed rate, fixed term | 03/23/2028 | | % | | — | |||||
Fixed rate, fixed term |
| 04/22/2030 |
| | % |
| |
| | |
| | |||||||||
Purchase accounting adjustment | ( | | ||||||||
Total notes payable | $ | | $ | | ||||||
Future maturities of borrowings were as follows (dollars in thousands):
December 31, | December 31, | |||||
2023 | 2022 | |||||
1 year or less |
| $ | — | $ | | |
1 to 2 years |
| |||||
2 to 3 years | |
| — | |||
3 to 4 years | |
| — | |||
4 to 5 years | |
| — | |||
Over 5 years | | | ||||
$ | | $ | | |||
At December 31, 2023 and 2022, respectively, total loans available to be pledged as collateral on FHLB borrowings were approximately $
The Company maintains a $
Note 15 Subordinated Debt
During September 2017, the Company entered into subordinated note agreements with
During July 2020, the Company entered into subordinated note agreements with
105
During August 2022, the Company entered into subordinated note agreements with an individual. The Company had outstanding balances of $
As a result of the acquisition of Hometown during February 2023, the Company acquired all of the common securities of Hometown’s wholly-owned subsidiaries, Hometown Bancorp, Ltd. Capital Trust I (“Trust I”) and Hometown Bancorp, Ltd. Capital Trust II (“Trust II”). The Company also assumed adjustable rate junior subordinated debentures issued to these trusts. The junior subordinated debentures issued to Trust I and Trust II totaled $
Note 16 Income Taxes
The components of the provision for income taxes for the years ended December 31 are as follows (dollar amounts in thousands):
| 2023 |
| 2022 |
| 2021 | ||||
Current tax expense: |
|
|
|
|
|
| |||
Federal | $ | | $ | | $ | | |||
State |
| |
| |
| | |||
Deferred tax benefit: |
|
|
| ||||||
Federal |
| ( |
| ( |
| ( | |||
State |
| ( |
| ( |
| | |||
Change in valuation allowance | | | | ||||||
Total provision for income taxes | $ | | $ | | $ | | |||
A summary of the sources of differences between income taxes at the federal statutory rate and the provision for income taxes for the years ended December 31 follows (dollar amounts in thousands):
|
| 2023 |
| 2022 |
| 2021 | |||
Tax expense at statutory rate | $ | | $ | | $ | | |||
Increase (decrease) in taxes resulting from: |
|
|
| ||||||
Tax-exempt interest |
| ( |
| ( |
| ( | |||
State taxes (net of federal benefit) |
| |
| |
| | |||
Cash surrender value of life insurance |
| ( |
| ( |
| ( | |||
ESOP dividend |
| ( |
| ( |
| ( | |||
Nondeductible expenses associated with acquisition |
| |
| |
| | |||
Change in valuation allowance |
| |
| |
| | |||
Other |
| ( |
| ( |
| ( | |||
Total provision for income taxes | $ | | $ | | $ | | |||
106
Deferred income taxes are provided for the temporary differences between the financial reporting basis and the tax basis of the Company’s assets and liabilities. Deferred taxes are included in other liabilities of the balance sheet. The major components of the net deferred tax asset (liability) as of December 31 are presented below (dollar amounts in thousands):
| 2023 | 2022 | ||||
Deferred tax assets: |
|
|
| |||
Deferred compensation | $ | | $ | | ||
Premises and equipment |
| |
| | ||
Allowance for credit losses |
| |
| | ||
Accrued vacation and severance |
| |
| | ||
Other real estate owned |
| |
| — | ||
Purchase accounting | | | ||||
Unrealized loss on securities available for sale |
| |
| | ||
Net operating loss carry forward |
| |
| — | ||
Other |
| |
| | ||
Total deferred tax assets |
| |
| | ||
Deferred tax liabilities: |
|
| ||||
Investment in acquisition and discount accretion |
| ( |
| ( | ||
Mortgage servicing rights |
| ( |
| ( | ||
Other investments |
| ( |
| ( | ||
Prepaid expenses |
| — |
| — | ||
Investment in minority owned subsidiaries |
| ( |
| ( | ||
Goodwill and other intangibles |
| ( |
| ( | ||
Total deferred tax liabilities |
| ( |
| ( | ||
Valuation allowance | ( | — | ||||
Net deferred tax asset (liability) | $ | | $ | | ||
In assessing the ability of the Company to realize the benefit of the deferred tax assets, management considers whether it is more likely than not that some portion or all of the deferred tax assets will not be realized. The ultimate realization of deferred tax assets is dependent upon the generation of future taxable income during the periods in which those temporary differences become deductible. Management considers the scheduled reversal of deferred tax liabilities, availability of operating loss carrybacks, projected future taxable income, and tax planning strategies in making this assessment. Based upon the level of historical taxable income and projections for future taxable income over the periods which deferred tax assets are deductible, management believes it is more likely than not the Company will generate sufficient federally taxable income to realize the benefits of these deductible differences at December 31, 2023. Due to legislation during 2023 related to exempting interest income on significant portions of the Company’s loan portfolio to taxability in the state of Wisconsin, however, management estimates that future state taxable income will be insufficient to fully realize the benefits of these deductible differences, resulting in a valuation allowance of $
Tax effects from an uncertain tax position can be recognized in the financial statements only if the position is more likely than not to be sustained on audit, based on the technical merits of the position. The Company recognizes the financial statement benefit of a tax position only after determining that the relevant tax authority would more likely than not sustain the position following an audit. For tax positions meeting the more likely than not threshold, the amount recognized in the financial statements is the largest benefit that has a greater than 50% likelihood of being realized upon ultimate settlement with the relevant tax authority. When applicable, interest and penalties on uncertain tax positions are calculated based on the guidance from the relevant tax authority and included in income tax expense. At December 31, 2023 and 2022, there was
107
Note 17 Employee Benefit Plans
Employee Stock Ownership Plan
The Company has a defined contribution profit sharing 401(k) plan which includes the provisions for an employee stock ownership plan (“ESOP”). The plan is available to all employees over 18 years of age after completion of
Share-based Compensation
The Company has made restricted share grants during 2023, 2022 and 2021 pursuant to the Bank First Corporation 2020 Equity Plan. The purpose of the Plan is to provide financial incentives for selected employees and for the non-employee Directors of the Company, thereby promoting the long-term growth and financial success of the Company. The Company stock to be offered under the Plan pursuant to Stock Appreciation Rights, performance unit awards, and restricted stock and unrestricted Company stock awards must be Company stock previously issued and outstanding and reacquired by the Company. The number of shares of Company stock that may be issued pursuant to awards under the 2020 Plan shall not exceed, in the aggregate,
As of December 31, 2023, there was $
For the year ended | For the year ended | |||||||||
December 31, 2023 | December 31, 2022 | |||||||||
|
| Weighted- |
|
| Weighted- | |||||
Average Grant- | Average Grant- | |||||||||
Shares | Date Fair Value | Shares | Date Fair Value | |||||||
Restricted Stock |
|
|
|
|
|
|
|
| ||
Outstanding at beginning of year |
| | $ | |
| | $ | | ||
Granted |
| |
| |
| |
| | ||
Vested |
| ( |
| |
| ( |
| | ||
Forfeited or cancelled |
| ( |
| |
| ( |
| | ||
Outstanding at end of year |
| | $ | |
| | $ | | ||
Deferred Compensation Plan
The Company has a deferred compensation agreement with one of its former executive officers. The benefits were payable beginning June 30, 2009, the date of termination of employment with the Company via retirement. The estimated annual cash benefit payment upon retirement at the age of 70 under the salary continuation plan is $
108
Note 18 Stockholders’ Equity and Regulatory Matters
The Bank, as a national bank, is subject to the dividend restrictions set forth by the Office of the Comptroller of the Currency. Under such restrictions, the Bank may not, without the prior approval of the Office of the Comptroller of the Currency, declare dividends in excess of the sum of the current year’s earnings (as defined) plus the retained earnings (as defined) from the prior two years. The dividends that the Bank could declare without the prior approval of the Office of the Comptroller of the Currency as of December 31, 2023 totaled approximately $
Banks and certain bank holding companies are subject to regulatory capital requirements administered by federal banking agencies. Capital adequacy guidelines and, additionally for banks, prompt corrective action regulations involve quantitative measures of assets, liabilities, and certain off-balance sheet items calculated under regulatory accounting practices. Capital amounts and classifications are also subject to qualitative judgments by regulators. Failure to meet capital requirements can initiate regulatory action.
Under regulatory guidance for non-advanced approaches institutions, the Bank and Company are required to maintain minimum amounts and ratios of common equity Tier I capital to risk-weighted assets, including an additional conservation buffer determined by banking regulators. As of December 31, 2023 and 2022, this buffer was
Actual and required capital amounts and ratios are presented below (dollar amounts in thousands):
To Be Well |
| ||||||||||||||||||||
Minimum Capital | Capitalized Under |
| |||||||||||||||||||
For Capital | Adequacy with | Prompt Corrective |
| ||||||||||||||||||
Actual | Adequacy Purposes | Capital Buffer | Action Provisions |
| |||||||||||||||||
| Amount |
| Ratio |
| Amount |
| Ratio |
| Amount |
| Ratio |
| Amount |
| Ratio |
| |||||
December 31, 2023 |
|
|
|
|
|
|
|
|
|
|
|
|
|
|
|
| |||||
Total capital (to risk-weighted assets): |
|
|
|
|
|
|
|
|
|
|
|
|
|
|
|
| |||||
Company | $ | |
| | % | $ | |
| | % | $ | |
| | % | NA |
| NA | |||
Bank | $ | |
| | % | $ | |
| | % | $ | |
| | % | $ | |
| | % | |
Tier 1 capital (to risk-weighted assets): |
|
|
|
|
|
|
|
|
|
|
|
|
|
| |||||||
Company | $ | |
| | % | $ | |
| | % | $ | |
| | % | NA |
| NA | |||
Bank | $ | |
| | % | $ | |
| | % | $ | |
| | % | $ | |
| | % | |
Common Equity Tier 1 capital (to risk-weighted assets): |
|
|
|
|
|
|
|
|
|
|
|
|
| ||||||||
Company | $ | |
| | % | $ | |
| | % | $ | |
| | % | NA |
| NA | |||
Bank | $ | |
| | % | $ | |
| | % | $ | |
| | % | $ | |
| | % | |
Tier 1 capital (to average assets): |
|
|
|
|
|
|
|
|
|
|
|
|
|
| |||||||
Company | $ | |
| | % | $ | |
| | % | $ | |
| | % | NA |
| NA | |||
Bank | $ | |
| | % | $ | |
| | % | $ | |
| | % | $ | |
| | % | |
To Be Well |
| ||||||||||||||||||||
Minimum Capital | Capitalized Under |
| |||||||||||||||||||
For Capital | Adequacy with | Prompt Corrective |
| ||||||||||||||||||
Actual | Adequacy Purposes | Capital Buffer | Action Provisions |
| |||||||||||||||||
| Amount |
| Ratio |
| Amount |
| Ratio |
| Amount |
| Ratio |
| Amount |
| Ratio |
| |||||
December 31, 2022 |
|
|
|
|
|
|
|
|
|
|
|
|
|
|
|
| |||||
Total capital (to risk-weighted assets): |
|
|
|
|
|
|
|
|
|
|
|
|
|
|
|
| |||||
Company | $ | |
| | % | $ | |
| | % | $ | |
| | % | NA |
| NA | |||
Bank | $ | |
| | % | $ | |
| | % | $ | |
| | % | $ | |
| | % | |
Tier 1 capital (to risk-weighted assets): |
|
|
|
|
|
|
|
|
|
|
|
|
|
| |||||||
Company | $ | |
| | % | $ | |
| | % | $ | |
| | % | NA |
| NA | |||
Bank | $ | |
| | % | $ | |
| | % | $ | |
| | % | $ | |
| | % | |
Common Equity Tier 1 capital (to risk-weighted assets): |
|
|
|
|
|
|
|
|
|
|
|
|
|
| |||||||
Company | $ | |
| | % | $ | |
| | % | $ | |
| | % | NA |
| NA | |||
Bank | $ | |
| | % | $ | |
| | % | $ | |
| | % | $ | |
| | % | |
Tier 1 capital (to average assets): |
|
|
|
|
|
|
|
|
|
|
|
|
|
| |||||||
Company | $ | |
| | % | $ | |
| | % | $ | |
| | % | NA |
| NA | |||
Bank | $ | |
| | % | $ | |
| | % | $ | |
| | % | $ | |
| | % | |
109
Note 19 Segment Information
The Company, through the branch network of its subsidiary, the Bank, provides a full range of consumer and commercial financial institution services to individuals and businesses in Wisconsin. These services include credit cards; secured and unsecured consumer, commercial, and real estate loans; demand, time, and savings deposits; and ATM processing. The Company also offers a full-line of insurance services through its equity investment in Ansay.
While the Company’s chief decision makers monitor the revenue streams of various Company products and services, operations are managed and financial performance is evaluated on a Company-wide basis. Accordingly, all of the Company’s financial institution operations are considered by management to be aggregated in
Note 20 Commitments and Contingencies
The Company enters into commitments to originate loans whereby the interest rate on the loan is determined prior to funding (rate lock commitments). Rate lock commitments on mortgage loans that are intended to be sold are considered to be derivatives. Accordingly, such commitments, along with any related fees received from potential borrowers, are recorded at fair value in derivative assets or liabilities, with changes in fair value recorded in the net gain or loss on sale of mortgage loans. Fair value is based on fees currently charged to enter into similar agreements and for fixed rate commitments also considers the difference between current levels of interest rates and committed rates. The notional amount of rate lock commitments at December 31, 2023 and 2022, respectively, was $
The Bank is party to financial instruments with off-balance sheet risk in the normal course of business to meet the financing needs of its customers. These instruments involve, to varying degrees, elements of credit risk in excess of the amount recognized in the consolidated balance sheets.
The Bank’s exposure to credit loss is represented by the contractual or notional amount of these commitments. The Bank follows the same credit policies in making commitments as it does for on-balance-sheet instruments. Since some of the commitments are expected to expire without being drawn upon and some of the commitments may not be drawn upon to the total extent of the commitment, the notional amount of these commitments does not necessarily represent future cash requirements.
The following commitments were outstanding at December 31 (dollar amounts in thousands):
Notional Amount | ||||||
| December 31, 2023 | December 31, 2022 | ||||
Commitments to extend credit: |
|
|
|
| ||
Fixed | $ | | $ | | ||
Variable |
| |
| | ||
Credit card arrangements |
| |
| | ||
Letters of credit |
| |
| | ||
Commitments to extend credit are agreements to lend to a customer at fixed or variable rates as long as there is no violation of any condition established in the contract. Commitments have fixed expiration dates or other termination clauses and may require payment of a fee. The amount of collateral obtained upon extension of credit is based on management’s credit evaluation of the customer. Collateral held varies but may include accounts receivable; inventory; property, plant, and equipment; real estate; and stocks and bonds.
110
Letters of credit include $
Note 21 Leases
In accordance with GAAP, leases where the Company is the lessee are recognized on-balance sheet through a right-of-use (“ROU”) model that requires recognition of a ROU lease asset and liability on the balance sheet for all leases with a term longer than 12 months. Leases are classified as finance or operating, with classification affecting the pattern and classification of expense recognition in the income statement.
The Company leases certain properties under operating leases that resulted in the recognition of ROU lease assets of approximately $
GAAP provides a number of optional practical expedients in transition. The Company has elected the “ of practical expedients,” which permits the Company not to reassess under the new standard the prior conclusions about lease identification, lease classification and initial direct costs. The Company also elected the use of the , a practical expedient which permits the use of information available after lease inception to determine the lease term via the knowledge of renewal options exercised not available as of the lease’s inception. The Company elected the short-term lease recognition exemption for all leases that qualify, meaning those with terms under twelve months. ROU assets or lease liabilities are not to be recognized for short-term leases. The Company also elected the practical to not separate lease and non-lease components for all leases, the majority of which consist of real estate common area maintenance expenses. However, since these non-lease items are subject to change, they are treated and disclosed as variable payments in the quantitative disclosures below.
Lessee Leases
The Company’s lessee leases are operating leases, and consist of leased real estate for branches. Options to extend and renew leases are generally exercised under normal circumstances. Advance notification is required prior to termination, and any noticing period is often limited to the months prior to renewal. Rent escalations are generally specified by a payment schedule, or are subject to a defined formula. The Company also elected the practical expedient to not separate lease and non-lease components for all leases, the majority of which consist of real estate common area maintenance expenses. Generally, leases do not include guaranteed residual values, but instead typically specify that the leased premises are to be returned in satisfactory condition with the Company liable for damages.
111
For operating leases, the lease liability and ROU asset (before adjustments) are recorded at the present value of future lease payments. The Company is electing to utilize the Wall Street Journal Prime Rate on the date of lease commencement as the lease interest rate.
Year Ended |
| ||||||
(dollars in thousands) |
| December 31, 2023 |
| December 31, 2022 |
| ||
Amortization of ROU Assets - Operating Leases | $ | ( | $ | ( | |||
Interest on Lease Liabilities - Operating Leases |
| | | ||||
Operating Lease Cost (Cost resulting from lease payments) |
| | | ||||
Weighted Average Lease Term (Years) - Operating Leases |
| ||||||
Weighted Average Discount Rate - Operating Leases |
| | % | | % | ||
A maturity analysis of operating lease liabilities and reconciliation of the undiscounted cash flows to the total operating lease liabilities is as follows (dollar amounts in thousands):
| December 31, 2023 | ||
Operating lease payments due: |
| ||
Within one year | $ | | |
After one but within two years | | ||
After two but within three years | | ||
After three but within four years | | ||
After four years but within five years | | ||
After five years | | ||
Total undiscounted cash flows | | ||
Discount on cash flows | ( | ||
$ | 1,583 | ||
Note 22 Fair Value of Financial Instruments
Accounting guidance establishes a fair value hierarchy to maximize the use of observable inputs and minimize the use of unobservable inputs when measuring fair value. The standard describes three levels of inputs that may be used to measure fair value.
Level 1: | Quoted prices (unadjusted) or identical assets or liabilities in active markets that the entity has the ability to access as of the measurement date. |
Level 2: | Significant other observable inputs other than Level 1 prices such as quoted prices for similar assets or liabilities; quoted prices in markets that are not active; or other inputs that are observable or can be corroborated by observable market data. |
Level 3: | Significant unobservable inputs that reflect a reporting entity’s own assumptions about the assumptions that market participants would use in pricing an asset or liability. |
112
Information regarding the fair value of assets measured at fair value on a recurring basis is as follows (dollar amounts in thousands):
| Instruments |
| Markets |
| Other |
| Significant | |||||
Measured | for Identical | Observable | Unobservable | |||||||||
At Fair | Assets | Inputs | Inputs | |||||||||
Value | (Level 1) | (Level 2) | (Level 3) | |||||||||
December 31, 2023 |
|
|
|
|
|
|
|
| ||||
Assets |
|
|
|
|
|
|
|
| ||||
Securities available for sale |
|
|
|
|
|
|
| |||||
Obligations of U.S. Government sponsored agencies | $ | | $ | — | $ | | $ | — | ||||
Obligations of states and political subdivisions |
| |
| — |
| |
| — | ||||
Mortgage-backed securities | | — | | — | ||||||||
Corporate notes |
| |
| — |
| |
| — | ||||
Certificates of deposit | | — | | — | ||||||||
Mortgage servicing rights |
| |
| — |
| |
| — | ||||
December 31, 2022 |
|
|
|
|
|
|
|
| ||||
Assets |
|
|
|
|
|
|
|
| ||||
Securities available for sale | ||||||||||||
U.S. Treasury securities | $ | | $ | — | $ | | $ | — | ||||
Obligations of U.S. Government sponsored agencies |
| |
| — |
| |
| — | ||||
Obligations of states and political subdivisions |
| |
| — |
| |
| — | ||||
Mortgage-backed securities | | — | | — | ||||||||
Corporate notes |
| |
| — |
| |
| — | ||||
Certificates of deposit | | — | | — | ||||||||
Mortgage servicing rights |
| |
| — |
| |
| — | ||||
There were
Information regarding the fair value of assets measured at fair value on a non-recurring basis is as follows (dollar amounts in thousands):
|
| Quoted Prices |
|
| ||||||||
In Active | Significant | |||||||||||
Assets | Markets | Other | Significant | |||||||||
Measured | for Identical | Observable | Unobservable | |||||||||
At Fair | Assets | Inputs | Inputs | |||||||||
Value | (Level 1) | (Level 2) | (Level 3) | |||||||||
December 31, 2023 |
|
|
|
|
|
|
|
| ||||
OREO | $ | | $ | — | $ | — | $ | | ||||
Loans individually evaluated, net of reserve | | — | — | | ||||||||
$ | | $ | — | $ | — | $ | | |||||
December 31, 2022 |
|
|
|
|
|
|
|
| ||||
OREO | $ | | $ | — | $ | — | $ | | ||||
Impaired Loans, net of impairment reserve |
| |
| — |
| — |
| | ||||
$ | | $ | — | $ | — | $ | | |||||
113
The following is a description of the valuation methodologies used by the Company for the items noted in the table above, including the general classification of such instruments in the fair value hierarchy. For individually evaluated impaired loans, the amount of impairment is based upon the present value of expected future cash flows discounted at the loan’s effective interest rate, the estimated fair value of the underlying collateral for collateral-dependent loans, or the estimated liquidity of the note. For OREO, the fair value is based upon the estimated fair value of the underlying collateral adjusted for the expected costs to sell. The following table shows significant unobservable inputs used in the fair value measurement of Level 3 assets:
|
|
|
| Weighted |
| ||||
Unobservable | Range of | Average |
| ||||||
Valuation Technique | Inputs | Discounts |
| Discount | |||||
As of December 31, 2023 |
|
|
|
|
|
|
|
| |
Other real estate owned |
| Third party appraisals, sales contracts or brokered price options |
| Collateral discounts and estimated costs to sell |
| % | | % | |
Loans individually evaluated |
| Third party appraisals and discounted cash flows |
| Collateral discounts and discount rates |
| % | | % | |
As of December 31, 2022 |
|
|
|
|
|
|
|
| |
Other real estate owned |
| Third party appraisals, sales contracts or brokered price options |
| Collateral discounts and estimated costs to sell |
| | % | | % |
Impaired loans |
| Third party appraisals and discounted cash flows |
| Collateral discounts and discount rates |
| % | | % |
The carrying value and estimated fair value of financial instruments at December 31 follows (dollar amounts in thousands):
Carrying | |||||||||||||||
December 31, 2023 |
| amount |
| Level 1 |
| Level 2 |
| Level 3 |
| Total | |||||
Financial assets: | |||||||||||||||
Cash and cash equivalents | $ | | $ | | $ | — | $ | — | $ | | |||||
Securities held to maturity |
| |
| |
| |
| — |
| | |||||
Loans held for sale |
| |
| — |
| — |
| |
| | |||||
Loans, net |
| |
| — |
| — |
| |
| | |||||
Other investments |
| |
| — |
| — |
| |
| | |||||
Mortgage servicing rights |
| |
| — |
| |
| — |
| | |||||
Financial liabilities: |
|
|
|
|
|
|
| ||||||||
Deposits | $ | | $ | — | $ | — | $ | | $ | | |||||
Securities sold under repurchase agreements |
| |
| — |
| |
| — | | ||||||
Notes payable | | — | | — | | ||||||||||
Subordinated notes |
| | — | | — | | |||||||||
Junior subordinated debentures | | — | | — | | ||||||||||
114
| Carrying |
|
|
|
| ||||||||||
December 31, 2022 | amount | Level 1 | Level 2 | Level 3 | Total | ||||||||||
Financial assets: | |||||||||||||||
Cash and cash equivalents | $ | | $ | | $ | — | $ | — | $ | | |||||
Securities held to maturity |
| |
| |
| |
| — |
| | |||||
Loans held for sale |
| |
| — |
| — |
| |
| | |||||
Loans, net |
| |
| — |
| — |
| |
| | |||||
Other investments |
| |
| — |
| — |
| |
| | |||||
Mortgage servicing rights |
| |
| — |
| |
| — |
| | |||||
Financial liabilities: |
|
|
|
| |||||||||||
Deposits | $ | |
| — |
| — |
| | | ||||||
Securities sold under repurchase agreements | | — | | — | | ||||||||||
Notes payable |
| | — | | — | | |||||||||
Subordinated notes |
| | — | | — | | |||||||||
The fair value of a financial instrument is the current amount that would be exchanged between willing parties, other than in a forced liquidation. Fair value is best determined based upon quoted market prices. However, in many instances, there are no quoted market prices for the Company’s various financial instruments. In cases where quoted market prices are not available, fair values are based on estimates using present value or other valuation techniques. Those techniques are significantly affected by the assumptions used, including the discount rate and estimates of future cash flows. Accordingly, the fair value estimates may not be realized in an immediate settlement of the instrument. Consequently, the aggregate fair value amounts presented may not necessarily represent the underlying fair value of the Company.
Fair value estimates are made at a specific point in time based on relevant market information and information about the financial instrument. These estimates do not reflect any premium or discount that could result from offering for sale at one time the Company’s entire holdings of a particular instrument. Because no market exists for a significant portion of the Company’s financial instruments, fair value estimates are based on judgments regarding future expected loss experience, current economic conditions, risk characteristics of various financial instruments, and other factors. These estimates are subjective in nature and involve uncertainties and matters that could affect the estimates. Fair value estimates are based on existing on- and off-balance-sheet financial instruments without attempting to estimate the value of anticipated future business and the value of assets and liabilities that are not considered financial instruments.
Deposits with no stated maturities are defined as having a fair value equivalent to the amount payable on demand. This prohibits adjusting fair value derived from retaining those deposits for an expected future period of time. This component, commonly referred to as a deposit base intangible, is neither considered in the above amounts nor is it recorded as an intangible asset on the consolidated balance sheet. Significant assets and liabilities that are not considered financial assets and liabilities include premises and equipment. In addition, the tax ramifications related to the realization of the unrealized gains and losses can have a significant effect on fair value estimates and have not been considered in the estimates.
115
Note 23 Parent Company Only Financial Statements
Balance Sheets
December 31 | ||||||
| 2023 |
| 2022 | |||
(In Thousands) | ||||||
Assets |
|
| ||||
Cash and cash equivalents | $ | | $ | | ||
Securities | | | ||||
Investment in Bank |
| |
| | ||
Investment in Veritas (Dissolved during 2023) |
| — |
| | ||
Other assets |
| |
| | ||
TOTAL ASSETS | $ | | $ | | ||
Liabilities and Stockholders’ Equity |
|
|
|
| ||
Liabilities |
|
|
|
| ||
Subordinated notes | $ | | $ | | ||
Junior subordinated notes | | — | ||||
Other liabilities |
| |
| | ||
Total liabilities |
| |
| | ||
Stockholders’ equity: |
|
|
|
| ||
Common stock |
| |
| | ||
Additional paid-in capital |
| |
| | ||
Retained earnings |
| |
| | ||
Treasury stock, at cost |
| ( |
| ( | ||
Accumulated other comprehensive income (loss) |
| ( |
| ( | ||
Total stockholders’ equity |
| |
| | ||
TOTAL LIABILITIES AND STOCKHOLDERS’ EQUITY | $ | | $ | | ||
Statements of Income
Years Ended December 31 | |||||||||
| 2023 |
| 2022 |
| 2021 | ||||
(In Thousands) | |||||||||
Income: | |||||||||
Dividends received from Bank | $ | | $ | | $ | | |||
Equity in undistributed earnings of subsidiaries |
| |
| |
| | |||
Other income |
| — |
| |
| — | |||
Total income |
| |
| |
| | |||
Other expenses |
| |
| |
| | |||
Benefit for income taxes |
| ( |
| ( |
| ( | |||
Net income | $ | | $ | | $ | | |||
116
Statements of Cash Flows
Years Ended December 31, | |||||||||
| 2023 |
| 2022 |
| 2021 | ||||
(In thousands) | |||||||||
Cash flow from operating activities: | |||||||||
Net income | $ | | $ | | $ | | |||
Adjustments to reconcile net income to net cash used in operating activities: |
|
|
|
| |||||
Stock compensation |
| |
| |
| | |||
Equity in earnings of subsidiaries (includes dividends) |
| ( |
| ( |
| ( | |||
Changes in other assets and liabilities: |
|
|
|
| |||||
Other assets |
| |
| ( |
| | |||
Other liabilities |
| ( |
| ( |
| ( | |||
Net cash used in operating activities |
| ( |
| ( |
| ( | |||
Cash flows from investing activities, net of effects of business combination: |
|
|
|
| |||||
Dividends received from Bank |
| |
| |
| | |||
Dividends received from Veritas |
| |
| — |
| — | |||
Net cash used in business combination |
| ( |
| |
| — | |||
Proceeds from other investments |
| |
| — |
| — | |||
Net cash provided by investing activities |
| |
| |
| | |||
Cash flows from financing activities, net of effects of business combination: |
|
|
|
| |||||
Repayment of junior subordinated debentures |
| ( |
| — |
| — | |||
Repayment of subordinate notes |
| ( |
| — |
| — | |||
Proceeds from subordinated notes |
| — |
| |
| — | |||
Cash dividends paid |
| ( |
| ( |
| ( | |||
Issuance of common stock |
| |
| |
| | |||
Repurchase of common stock |
| ( |
| ( |
| ( | |||
Net cash used in financing activities |
| ( |
| ( |
| ( | |||
Net increase in cash and cash equivalents |
| |
| |
| | |||
Cash and cash equivalents at beginning |
| |
| |
| | |||
Cash and cash equivalents at end | $ | | $ | | $ | | |||
117
Note 24 Earnings Per Common Share
See Note 1 for the Company’s accounting policy regarding per share computations. Earnings per common share, earnings per share assuming dilution, and related information are summarized as follows:
Years ended December 31, | |||||||||
(in thousands, except per share data) |
| 2023 |
| 2022 |
| 2021 | |||
Basic | |||||||||
Net income available to common shareholders | $ | | $ | | $ | | |||
Less: Earnings allocated to participating securities | ( | $ | ( | $ | ( | ||||
Net income allocated to common shareholders | $ | | $ | | $ | | |||
Weighted average common shares outstanding including participating securities | | | | ||||||
Less: Participating securities | ( | ( | ( | ||||||
Average shares | | | | ||||||
Basic earnings per common shares | $ | $ | $ | ||||||
Diluted | |||||||||
Net income available to common shareholders | $ | | $ | | $ | | |||
Weighted average common shares outstanding for basic earnings per common share | | | | ||||||
Add: Dilutive effects of stock based compensation awards | | | | ||||||
Average shares and dilutive potential common shares | | | | ||||||
Diluted earnings per common share | $ | $ | $ | ||||||
118
ITEM 9. CHANGES IN AND DISAGREEMENTS WITH ACCOUNTANTS ON ACCOUNTING AND FINANCIAL DISCLOSURE
None
ITEM 9A. CONTROLS AND PROCEDURES
Evaluation of Disclosure Controls and Procedures
An evaluation of the Company’s disclosure controls and procedures (as defined in Rule 13a-15(e) or 15d-15(e) under the Exchange Act) as of December 31, 2023 was carried out under the supervision and with the participation of the Company’s Chief Executive Officer, Chief Financial Officer and other members of the Company’s senior management. The Company’s Chief Executive Officer and Chief Financial Officer concluded that, as of December 31, 2023, the Company’s disclosure controls and procedures were effective for ensuring that information the Company is required to disclose in reports that it files or submits under the Exchange Act is recorded, processed, summarized and reported within the time periods specified in the SEC’s rules and forms and that such information is accumulated and communicated to the Company’s senior management, including its Chief Executive Officer and Chief Financial Officer, as appropriate to allow timely decisions regarding required disclosure.
Management’s Annual Report on Internal Control over Financial Reporting
The management of the Company is responsible for establishing and maintaining adequate internal control over financial reporting. The Company’s internal control system was designed to provide reasonable assurance to the Company’s management and board of directors regarding the preparation and fair presentation of the financial statements. No matter how well designed, internal control over financial reporting has inherent limitations, including the possibility that a control can be circumvented or overridden, and misstatements due to error or fraud may occur and not be detected. Therefore, even those systems determined to be effective can provide only reasonable assurance with respect to financial statement preparation and presentation.
The Company’s management assessed the effectiveness of the Company’s internal control over financial reporting as of December 31, 2023. In making this assessment, it used the criteria set forth by the Committee of Sponsoring Organizations of the Treadway Commission (COSO) in Internal Control-Integrated Framework (2013). As permitted by SEC guidance, management excluded from its assessment the operations of Hometown Bancorp, Ltd., which the Company acquired on February 10, 2023, as described in “Note 2 – Acquisitions” of the Notes to the Consolidated Financial Statements included in item 8 in this report. The fair value of assets acquired from Hometown Bancorp, Ltd. at the acquisition date represented 14.6% of the consolidated total assets of the Company as of December 31, 2023.
Based on this assessment management has determined that, as of December 31, 2023, the Company’s internal control over financial reporting is effective based on the specified criteria.
The effectiveness of the Company’s internal control over financial reporting as of December 31, 2023, has been audited by FORVIS, LLP, an independent registered public accounting firm, as state in their report herein – “Report of Independent Registered Accounting Firm.”
Changes in Internal Controls over Financial Reporting
There was no change in our internal control over financial reporting that occurred during the fourth quarter ended December 31, 2023 that has materially affected, or is reasonably likely to materially affect, our internal control over financial reporting. The Company is continually monitoring and assessing changes in processes and activities to determine any potential impact on the design and operating effectiveness of internal controls over financial reporting.
119
Limitations on the Effectiveness of Controls
The Company’s management recognizes that a control system, no matter how well conceived and operated, can provide only reasonable, not absolute, assurance that the objectives of the control system are met. Further, the design of a control system must reflect the fact that there are resource constraints, and the benefits of controls must be considered relative to their costs. Because of the inherent limitations in all control systems, no evaluation of controls can provide absolute assurance that all control issues, errors and instances of fraud, if any, within the Company have been detected.
ITEM 9B. OTHER INFORMATION
Rule 10b5-1 Trading Arrangements
The following table describes, for the quarter ended December 31, 2023, each trading arrangement for the sale or purchase of our securities adopted,
Name |
| Action Taken |
| Type |
| Nature |
| Duration |
| Aggregate Number of |
Adoption ( | Sales | |||||||||
ITEM 9C. DISCLOSURE REGARDING FOREIGN JURISDICTIONS THAT PREVENT INSPECTIONS
None.
120
PART III
ITEM 10. DIRECTORS, EXECUTIVE OFFICERS AND CORPORATE GOVERNANCE
The information required in Part III, Item 10 will be under the headings “Proposal 1—Election of Directors,” “Executive Officers,” “Corporate Governance,” “Committees of the Board of Directors” and “Section 16(a) Beneficial Ownership Reporting Compliance” in the Company’s definitive proxy statement for the 2024 Annual Meeting of Shareholders, incorporated herein by reference.
ITEM 11. EXECUTIVE COMPENSATION
The information required in Part III, Item 11 will be under the headings “Director Compensation,” “Named Executive Officer Compensation” and “Committees of the Board of Directors” in the Company’s definitive proxy statement for the 2024 Annual Meeting of Shareholders, incorporated herein by reference.
ITEM 12. SECURITY OWNERSHIP OF CERTAIN BENEFICIAL OWNERS AND MANAGEMENT AND RELATED STOCKHOLDER MATTERS
Equity Compensation Plan Information
The following table provides information as of December 31, 2023 with respect to shares of common stock that may be issued under the Company’s equity compensation plans.
Number of | |||||||
securities | |||||||
remaining | |||||||
Number of | Weighted | available for | |||||
securities to | average | future issuance | |||||
be issued upon | exercise |
| under equity | ||||
exercise | price of | compensation | |||||
of outstanding | outstanding | plans (excluding | |||||
options, | options, | securities | |||||
warrants and | warrants |
| reflected | ||||
rights | and rights |
| in column (a)) | ||||
Plan Category |
| (a) |
| (b) |
| (c) | |
Equity compensation plans approved by security holders | 0 | $ | 0 | 623,554 | |||
Total at December 31, 2023 | 0 | $ | 0 | 623,554 | |||
| (1) | On June 8, 2020, the Company's shareholders approved the Company's 2020 Equity Plan, authorizing up to 700,000 shares of stock to be awarded as long-term incentive compensation to employees and non-employee directors over a period of ten (10) years. |
The remaining information required in Part III, Item 12 will be under the heading “Common Stock Ownership of Certain Beneficial Owners and Management” in the Company’s definitive proxy statement for the 2024 Annual Meeting of Shareholders, incorporated herein by reference.
ITEM 13. CERTAIN RELATIONSHIPS AND RELATED TRANSACTIONS, AND DIRECTOR INDEPENDENCE
The information required in Part III, Item 13 will be under the headings “Certain Relationships and Related-Party Transactions” and “Corporate Governance” in the Company’s definitive proxy statement for the 2024 Annual Meeting of Shareholders, incorporated herein by reference.
ITEM 14. PRINCIPAL ACCOUNTING FEES AND SERVICES
The information required in Part III, Item 14 will be under the heading “Information Regarding the Company’s Independent Registered Public Accounting Firm” in the Company’s definitive proxy statement for the 2024 Annual Meeting of Shareholders, incorporated herein by reference.
121
PART IV
ITEM 15. EXHIBITS, FINANCIAL STATEMENT SCHEDULES
(a) 1. Financial Statements
The following consolidated financial statements of Bank First and our subsidiaries and related reports of our independent registered public accounting firm are incorporated in this Item 15 by reference from Part II - Item 8. Financial Statements and Supplementary Data of this Report.
Consolidated balance sheets as of December 31, 2023 and 2022 |
Consolidated statements of income for the years ended December 31, 2023, 2022 and 2021 |
Consolidated statements of comprehensive income for the years ended December 31, 2023, 2022 and 2021 |
Consolidated statements of changes in shareholders’ equity for the years ended December 31, 2023, 2022 and 2021 |
Consolidated statements of cash flows for the years ended December 31, 2023, 2022 and 2021 |
Notes to Consolidated Financial Statements |
Report of Independent Registered Public Accounting Firm |
2. Financial Statement Schedules
None are applicable because the required information has been incorporated in the consolidated financial statements and notes thereto of Bank First and our subsidiaries which are incorporated in this Annual Report by reference.
3. Exhibits
The following exhibits are filed or furnished herewith or are incorporated herein by reference to other documents previously filed with the SEC.
EXHIBIT INDEX
Exhibit |
| |
|---|---|---|
No. | Description | |
2.1 2.2 | ||
3.1 | ||
3.2 | ||
4.1 | ||
4.2 | ||
10.1 | ||
10.2 |
122
Exhibit |
| |
|---|---|---|
No. | Description | |
10.3 | ||
10.4 | ||
10.5 | ||
10.6 | ||
10.7 | ||
10.8 | ||
10.9 | ||
10.10 | ||
10.11 | Change in Control Agreement dated May 16, 2023 between Bank First Corporation and Kelly M. Dvorak* | |
10.12 | ||
21 | ||
23.1 | Consent of Independent Registered Public Accounting Firm (FORVIS, LLP). | |
24 | ||
31.1 | Certification of Chief Executive Officer pursuant to Section 302 of the Sarbanes-Oxley Act of 2002. | |
31.2 | Certification of Chief Financial Officer pursuant to Section 302 of the Sarbanes-Oxley Act of 2002. | |
32 | ||
97 | ||
101 INS | Inline XBRL Instance Document | |
101.SCH | Inline XBRL Taxonomy Extension Schema Document | |
101.CAL | Inline XBRL Taxonomy Extension Calculation Linkbase Document | |
101.DEF | Inline XBRL Taxonomy Extension Definition Linkbase Document | |
101.LAB | Inline XBRL Taxonomy Extension Label Linkbase Document | |
101.PRE | Inline XBRL Taxonomy Extension Presentation Linkbase Document | |
104 | Cover Page Interactive Data File (the cover page XBRL tags are embedded in the Inline XBRL document) |
* Compensatory plan or arrangement.
ITEM 16. FORM 10-K SUMMARY
None.
123
SIGNATURES
Pursuant to the requirements of Section 13 or 15(d) of the Securities Exchange Act of 1934, as amended, Bank First Corporation has duly caused this Report to be signed on its behalf by the undersigned, thereunto duly authorized.
BANK FIRST CORPORATION | ||
February 29, 2024 | By: | /s/ Michael B. Molepske |
Michael B. Molepske | ||
Chief Executive Officer | ||
(Principal Executive Officer) | ||
February 29, 2024 | By: | /s/ Kevin M. LeMahieu |
Kevin M. LeMahieu | ||
Chief Financial Officer | ||
(Principal Financial Officer and | ||
Principal Accounting Officer) | ||
124
POWER OF ATTORNEY
KNOW ALL MEN BY THESE PRESENTS, that each person whose signature appears below constitutes and appoints Michael B. Molepske and Kevin M. LeMahieu and each of them, his or her true and lawful attorney(s)-in-fact and agent(s), with full power of substitution and resubstitution, for him or her and in his or her name, place and stead, in any and all capacities, to sign any or all amendments to this report and to file the same, with all exhibits and schedules thereto, and other documents in connection therewith, with the Securities and Exchange Commission, granting unto said attorney(s)-in-fact and agent(s) full power and authority to do and perform each and every act and thing requisite and necessary to be done in and about the premises, as fully to all intents and purposes as he or she might or could do in person, hereby ratifying and confirming all that said attorney(s)-in-fact and agent (s), or their substitute(s), may lawfully do or cause to be done by virtue hereof.
Pursuant to the requirements of the Securities Exchange Act of 1934, as amended, this report has been signed below by the following persons in the capacities and on the dates indicated.
/s/ Mary-Kay H. Bourbulas | Director | February 29, 2024 | ||
Mary-Kay H. Bourbulas | ||||
/s/ Robert D. Gregorski | Director | February 29, 2024 | ||
Robert D. Gregorski | ||||
/s/ Judy L. Heun | Director | February 29, 2024 | ||
Judy L. Heun | ||||
/s/ Stephen E. Johnson | Director | February 29, 2024 | ||
Stephen E. Johnson /s/Laura E. Kohler | Director | February 29, 2024 | ||
Laura E. Kohler | ||||
/s/Phillip R. Maples | Director | February 29, 2024 | ||
Phillip R. Maples /s/Timothy J. McFarlane | Director | February 29, 2024 | ||
Timothy J. McFarlane | ||||
/s/ Michael B. Molepske | Director | February 29, 2024 | ||
Michael B. Molepske | ||||
/s/ David R. Sachse | Director | February 29, 2024 | ||
David R. Sachse | ||||
/s/ Peter J. Van Sistine | Director | February 29, 2024 | ||
Peter J. Van Sistine |
125