UNITED STATES
SECURITIES AND EXCHANGE COMMISSION
WASHINGTON, D.C. 20549
FORM
For the fiscal year ended
For the transition period from to
Commission File Number:

(Exact name of registrant as specified in its charter)
(State or other jurisdiction of incorporation or organization) | (I.R.S. Employer Identification No.) |
(Address of principal executive offices) | (Zip Code) |
Registrant’s telephone number, including area code: (
Securities registered pursuant to Section 12(b) of the Act:
Title of each class |
| Trading Symbol |
| Name of each exchange on which registered |
Securities registered pursuant to Section 12(g) of the Act: None
Indicate by check mark if the registrant is a well-known seasoned issuer, as defined in Rule 405 of the Securities Act. Yes ☐
Indicate by check mark if the registrant is not required to file reports pursuant to Section 13 or Section 15(d) of the Act. Yes ☐
Indicate by check mark whether the registrant (1) has filed all reports required to be filed by Section 13 or 15(d) of the Securities Exchange Act of 1934 during the preceding 12 months (or for such shorter period that the registrant was required to file such reports), and (2) has been subject to such filing requirements for the past 90 days.
Indicate by check mark whether the registrant has submitted electronically every Interactive Data File required to be submitted pursuant to Rule 405 of Regulation S-T (§232.405 of this chapter) during the preceding 12 months (or for such shorter period that the registrant was required to submit such files).
Indicate by check mark whether the registrant is a large accelerated filer, an accelerated filer, a non-accelerated filer, a smaller reporting company or an emerging growth company. See the definition of “large accelerated filer,” “accelerated filer”, “smaller reporting company”, or "emerging growth company" in Rule 12b-2 of the Exchange Act.
Large Accelerated Filer ☐ | Non-Accelerated Filer ☐ | Smaller Reporting Company | |
Emerging growth company |
If an emerging growth company, indicate by check mark if the registrant has elected not to use the extended transition period for complying with any new or revised financial accounting standards provided pursuant to Section 13(a) of the Exchange Act. ☐
Indicate by check mark whether the registrant has filed a report on and attestation to its management’s assessment of the effectiveness of its internal control over financial reporting under Section 404(b) of the Sarbanes-Oxley Act (15 U.S.C. 7262(b)) by the registered public accounting firm that prepared or issued its audit report.
If securities are registered pursuant to Section 12(b) of the Act, indicate by check mark whether the financial statements of the registrant included in the filing reflect the correction of an error to previously issued financial statements.
Indicate by check mark whether any of those error corrections are restatements that required a recovery analysis of incentive-based compensation received by any of the registrant’s executive officers during the relevant recovery period pursuant to §240.10D-1(b). ☐
Indicate by check mark whether the registrant is a shell company (as defined in Rule 12b-2 of the Exchange Act) Yes
The aggregate market value of the common stock held by non-affiliates of Bar Harbor Bankshares was $
The Registrant had
DOCUMENTS INCORPORATED BY REFERENCE
Portions of the Definitive Proxy Statement for the 2024 Annual Meeting of Shareholders, to be filed within 120 days after December 31, 2023 are incorporated by reference into Part III this Annual Report on Form 10-K.
BAR HARBOR BANKSHARES AND SUBSIDIARIES
FORM 10-K
INDEX
The Company conducts business operations principally through Bar Harbor Bank & Trust, which may be referred to as the Bank and which is a subsidiary of Bar Harbor Bankshares. Unless the context requires otherwise, references in this Annual Report on Form 10-K to "our Company, "our," "us," "we" and similar terms refer to Bar Harbor Bankshares and its subsidiaries, including the Bank, collectively.
2
PART I
ITEM 1. BUSINESS.
FORWARD-LOOKING STATEMENTS
CAUTIONARY STATEMENT REGARDING FORWARD-LOOKING STATEMENTS
Certain statements contained in this Annual Report on Form 10-K (the “Form 10-K” or “Annual Report”) that are not historical facts may constitute forward-looking statements within the meaning of Section 27A of the Securities Act of 1933, as amended ("Securities Act"), and Section 21E of the Securities Exchange Act of 1934, as amended ("Exchange Act"), and are intended to be covered by the safe harbor provisions of the Private Securities Litigation Reform Act of 1995. When used in this Form 10-K the words “believe,” “anticipate,” “expect,” “may,” “will,” “assume,” “should,” “predict,” “could,” “would,” “intend,” “targets,” “estimates,” “projects,” “plans,” and “potential,” and other similar words and expressions of the future, are intended to identify such forward-looking statements, but other statements not based on historical information may also be considered forward-looking, including statements about our future financial and operating results and plans, objectives, and intentions. All forward-looking statements are subject to risks, uncertainties, and other factors that may cause the actual results, performance, or achievements of our company to differ materially from any results, performance, or achievements expressed or implied by such forward-looking statements. These forward-looking statements are subject to known and unknown risks, uncertainties and other factors that could cause the actual results to differ materially from the statements, including, but not limited to:
| ● | deterioration in the financial performance and/or condition of borrowers of the Bank, including as a result of the negative impact of inflationary pressures on our customers and their businesses resulting in significant increases in credit losses and provisions for those losses; |
| ● | the possibility that our asset quality could decline or that we experience greater loan losses than anticipated; |
| ● | increased levels of other real estate owned, primarily as a result of foreclosures; |
| ● | the impact of liquidity needs on our results of operations and financial condition; |
| ● | competition from financial institutions and other financial service providers; |
| ● | the effect of interest rate increases on the cost of deposits; |
| ● | unanticipated weakness in loan demand or loan pricing; |
| ● | adverse conditions in the national or local economies including in our markets throughout Northern New England; |
| ● | changes in consumer spending, borrowing and saving habits; |
| ● | the emergence and effects related to a future pandemic, epidemic or outbreak of an infectious disease, including actions taken by governmental officials to curb the spread of such an infectious disease, and the resulting impact on general economic and financial market conditions and on the Company’s and our customers' business, results of operations, asset quality and financial condition; |
| ● | the effects of civil unrest, international hostilities or other geopolitical events, including the war in Ukraine and ongoing hostilities in the Middle East; |
| ● | inflation, interest rate, market, and monetary fluctuations; |
| ● | lack of strategic growth opportunities or our failure to execute on available opportunities; |
| ● | the ability to grow and retain low-cost core deposits and retain large, uninsured deposits; |
| ● | our ability to effectively manage problem credits; |
| ● | our ability to successfully implement efficiency initiatives on time and with the results projected; |
| ● | our ability to successfully develop and market new products and technology; |
| ● | the impact of negative developments in the financial industry and United States and global capital and credit markets; |
| ● | our ability to retain executive officers and key employees and their customer and community relationships; |
| ● | our ability to adapt to technological changes and to implement new technology effectively; |
| ● | the vulnerability of the Bank’s computer and information technology systems and networks, and the systems and networks of third parties with whom the Company or the Bank contract, to unauthorized access, computer viruses, phishing schemes, spam attacks, human error, natural disasters, power loss, and other security breaches and interruptions; |
3
| ● | changes in the reliability of our vendors, internal control systems or information systems; |
| ● | ongoing competition in the labor markets and increased employee turnover; |
| ● | the potential impact of climate change; |
| ● | our ability to comply with various governmental and regulatory requirements applicable to financial institutions; |
| ● | changes in state and federal laws, rules, regulations, or policies applicable to banks or bank holding companies, including regulatory or legislative developments; |
| ● | the effects of and changes in trade and monetary and fiscal policies and laws, including the interest rate policies of the Board of Governors of the Federal Reserve System (the “Federal Reserve Board”); |
| ● | adverse impacts (including costs, fines, reputational harm, or other negative effects) from and risks associated with current or future litigation, regulatory examinations, or other legal and/or regulatory actions; and |
| ● | general competitive, economic, political, and market conditions, including economic conditions in the local markets where we operate. |
Other factors not identified above, including those described in the Annual Report under the headings “Risk Factors” and “Management’s Discussion and Analysis of Financial Condition and Results of Operations.” Most of these factors are difficult to anticipate and are generally beyond our control. You should consider these factors in connection with considering any forward-looking statements that may be made by us. We undertake no obligation to release publicly any revisions to any forward-looking statements, to report events or to report the occurrence of unanticipated events unless we are required to do so by law.
GENERAL
Bar Harbor Bankshares (the “Company,” “we,” “our” or “us” or similar terms) is the parent company of Bar Harbor Bank & Trust (the "Bank”), which is the only community bank headquartered in Northern New England with branches in Maine, New Hampshire, and Vermont. The Bank is a regional community bank that thinks differently about banking. The Bank provides the technology offerings and capabilities of larger banks, accompanied by access to local decision makers who are acutely focused on their local markets. Having recently celebrated the 137th anniversary of the Bank’s founding, we remain focused on helping our customers achieve their goals as the key to the Bank’s success. With over 450 dedicated professionals and more than 50 locations, we are committed to servicing and building enduring relationships by providing a higher standard of banking. We offer a variety of financial products and services designed around our customers in order to serve their banking and financial needs. Through these efforts, we continue to be a relationship-focused community bank, maintaining our credit quality and serving businesses, entrepreneurs, and individuals within our footprint. Our corporate goal is to be one of the most consistently high performing community banks in New England, and our business model is centered on the following:
4
Shown below is a profile and geographical footprint of the Bank as of December 31, 2023:
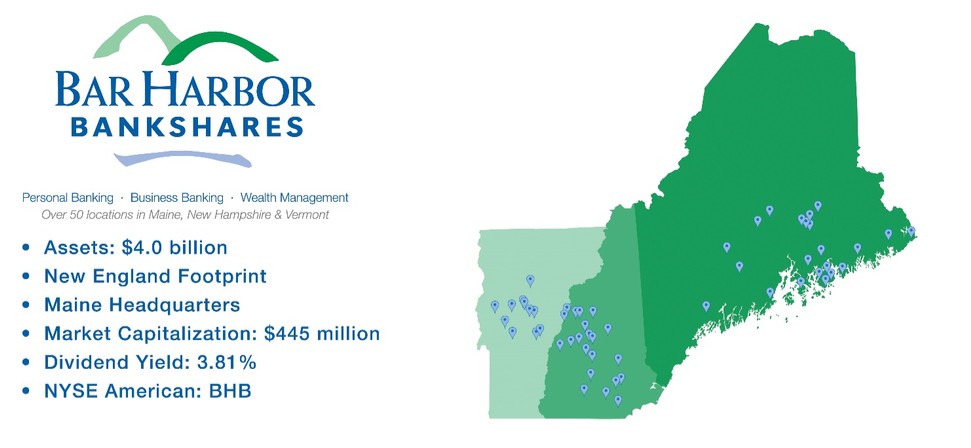
We serve affluent and growing markets in Maine, New Hampshire, and Vermont with more than 49 thousand, 48 thousand, and 24 thousand customers, respectively in those states. Within these markets, tourism, agriculture, and fishing industries remain strong and continue to drive economic activity. These core markets have also maintained their strength through diversification into various service industries.
Maine
We have 22 full-service branches in operation and two wealth management offices principally located in the regions of downeast, midcoast, and central Maine, which are generally characterized as rural areas. We also have a commercial loan production office in Portland, Maine. In Maine, we consider our primary market areas to be Hancock, Penobscot, Washington, Kennebec, Knox, and Sagadahoc counties. The economies in these counties are based primarily on tourism, healthcare, fishing and lobstering, agriculture, state government, and small local businesses. They are also supported by a large contingent of retirees.
New Hampshire
We have 21 full-service branches in operation and five wealth management offices in New Hampshire located in the Lake Sunapee, Upper Valley, and Merrimack Valley regions. There are several distinct markets within each of these regions. The towns or cities of Nashua, Manchester, and Concord are considered part of the Merrimack Valley. Nashua, New Hampshire is a regional commercial, entertainment, and dining destination. With its border to Massachusetts, it also enjoys a vibrant high-tech industry and a robust retail industry due in part to New Hampshire’s absence of a sales tax. The Upper Valley region of New Hampshire includes the towns of Lebanon and Hanover, which are home to Dartmouth-Hitchcock Medical Center and Dartmouth College, respectively. The Lake Sunapee market is a popular year-round recreation and resort area that includes both Lake Sunapee and Mount Sunapee and includes the towns of Claremont, New London, and Newport.
Vermont
We have 10 full-service branches in operation in Vermont. The branches are primarily located in central Vermont within Rutland, Windsor, and Orange counties. These markets are home to many attractions, including Killington Mountain and the city of Rutland. Popular vacation destinations in this region include Woodstock, Brandon, and Ludlow.
5
SUBSIDIARY ACTIVITIES
Bar Harbor Bankshares is a legal entity separate and distinct from its first-tier bank subsidiary, Bar Harbor Bank & Trust, and its second-tier subsidiaries, Bar Harbor Wealth Management (“BHWM”) and Cottage Street Corporation.
There are two Connecticut statutory trusts for which all of the common stock is owned. These capital trusts are unconsolidated, and their only material asset is a $20.6 million trust preferred security related to the junior subordinated debentures reported in Note 7 – Borrowed Funds of the Consolidated Financial Statements.
AVAILABLE INFORMATION
Annual, quarterly, and current reports, proxy statements and other information are required to be filed with the Securities and Exchange Commission (“SEC”). The SEC maintains a website at www.sec.gov that contains reports, proxy statements, and information statements, and other information regarding issuers that file electronically with the SEC.
The Annual Reports on Form 10-K, Quarterly Reports on Form 10-Q, Current Reports on Form 8-K, proxy statements, and amendments to those documents filed or furnished pursuant to Section 13(a) or 15(d) of the Exchange Act, are also available free of charge on our website at www.barharbor.bank under the Shareholders Relations link as soon as reasonably practicable after such reports are electronically filed with or furnished to the SEC.
Our Code of Ethics for Senior Financial Officers, Code of Conduct and Business Ethics, Securities and Insider Trading Policy and the charters of our Board of Directors’ audit committee, governance committee, and compensation and human resources committee are also available on our website (www.barharbor.bank) and in print free of charge to any shareholder who requests them. Requests should be sent by mail to our corporate secretary at our executive office. We intend to disclose on our website any amendments or waivers to our Code of Ethics for Senior Financial Officers or Code of Conduct and Business Ethics that are required to be disclosed pursuant to Item 5.05 of Form 8-K.
Investors should note announcements of material information to investors and others are performed using SEC filings, press releases, and postings on our website (www.barharbor.bank), including news and announcements regarding financial performance, key personnel, brands, and business strategy. Information posted on the corporate website could be deemed material to investors. Investors are encouraged to review the information posted on these channels. Updates may be made, from time to time, to the list of channels used to communicate information that could be deemed material, and any such change will be posted on www.barharbor.bank. The information on the website is not, and shall not be deemed to be, a part hereof or incorporated into this or any other filings with the SEC.
COMPETITION
Major competitors in market areas include local independent banks, local branches of large regional and national bank affiliates, thrift institutions, savings and loan institutions, mortgage companies, and credit unions.
We effectively compete with other financial institutions by emphasizing quality customer service, making decisions at the local level, maintaining long-term customer relationships, building customer loyalty, and providing products and services designed to address customers’ specific needs. However, no assurance can be provided regarding the ongoing ability to compete effectively with other financial institutions in the future.
No part of the business is materially dependent upon one or a few customers or upon a particular industry segment, the loss of which would have a material adverse impact on our results of operations.
LENDING ACTIVITIES
General
Loans are originated in four basic portfolio categories, which are discussed below. These portfolios include the categories commercial real estate, commercial and industrial, residential real estate and other consumer loans. Loan interest rates and
6
other key loan terms are affected principally by our lending policy, asset/liability strategy, loan demand, competition, and the supply of money available for lending purposes. The amount of long-term fixed-rate lending and adjustable-rate lending is monitored according to the Bank’s interest rate management policy. Loans originated are held for investment except for certain residential mortgages that are underwritten with the intention to be sold in the secondary mortgage market.
Loan Portfolio Analysis
The following table sets forth the year-end composition of the loan portfolio in dollar amounts and as a percentage of the portfolio for the years indicated. Further information about the composition of the loan portfolio is contained in Note 3 – Loans and Allowance for Credit Losses of the Consolidated Financial Statements.
2023 | 2022 | |||||||||||
(in thousands, except |
|
| % of |
| % of | |||||||
percentages) | Amount | Total | Amount | Total | ||||||||
Commercial construction |
| $ | 154,048 |
| 5 | % | $ | 117,577 |
| 4 | % | |
Commercial real estate owner occupied |
| 310,015 |
| 10 |
| 244,814 |
| 8 | ||||
Commercial real estate non-owner occupied | 1,144,566 | 38 | 1,146,674 | 40 | ||||||||
Tax exempt | 43,688 | 2 | 42,879 | 2 | ||||||||
Commercial and industrial | 310,883 | 10 | 297,112 | 10 | ||||||||
Residential real estate |
| 940,334 |
| 32 |
| 954,968 |
| 33 | ||||
Home equity | 87,683 | 3 | 90,865 | 3 | ||||||||
Consumer other |
| 7,832 |
| — |
| 7,801 |
| — | ||||
Total loans | $ | 2,999,049 |
| 100 | % | $ | 2,902,690 |
| 100 | % | ||
Commercial Loan Exposure and Industries
All commercial loans are assigned Standard Industrial Classification codes, North American Industry Classification System codes, and state and county codes. The following table summarizes the major industries of the commercial loan portfolio as of December 31, 2023 and 2022:
2023 | 2022 | |||||||||||||||||
(in thousands, except percentages) |
| Loans |
| Total Exposure | % of Total Portfolio | Loans | Total Exposure | % of Total Commerical Portfolio | ||||||||||
Real Estate and Rental and Leasing | $ | 1,018,035 | $ | 1,196,273 | 52 | % | $ | 946,591 | $ | 1,212,986 | 51 | % | ||||||
Accommodation and Food Services |
| 334,838 | 347,588 | 17 | 334,053 | 347,023 | 18 | |||||||||||
Health Care and Social Assistance |
| 99,601 | 109,771 | 5 | 105,634 | 145,361 | 6 | |||||||||||
Retail Trade |
| 78,036 | 94,074 | 4 | 61,265 | 79,401 | 3 | |||||||||||
Agriculture, Forestry, Fishing and Hunting | 55,214 | 63,052 | 3 | 60,815 | 68,040 | 3 | ||||||||||||
Wholesale Trade | 63,088 | 110,703 | 3 | 55,546 | 83,696 | 3 | ||||||||||||
Educational Services | 51,512 | 63,731 | 3 | 49,162 | 61,526 | 3 | ||||||||||||
Finance and Insurance | 59,753 | 103,444 | 3 | 33,148 | 52,551 | 2 | ||||||||||||
Manufacturing | 44,277 | 67,221 | 2 | 44,672 | 66,083 | 2 | ||||||||||||
Arts, Entertainment, and Recreation | 30,914 | 33,441 | 2 | 29,300 | 31,898 | 2 | ||||||||||||
Construction | 23,086 | 44,518 | 1 | 29,448 | 49,450 | 2 | ||||||||||||
Public Administration | 35,995 | 40,669 | — | 33,769 | 39,357 | 2 | ||||||||||||
Transportation and Warehousing | 14,424 | 22,139 | — | 14,087 | 16,051 | 1 | ||||||||||||
All other | 54,427 | 79,691 | 5 | 51,566 | 81,045 | 2 | ||||||||||||
Total commercial loans | $ | 1,963,200 | $ | 2,376,315 | 100 | % | $ | 1,849,056 | $ | 2,334,468 | 100 | % | ||||||
7
Within our non-owner-occupied commercial real estate portfolio (considered “Commercial construction” and “Commercial Real Estate Non-Owner Occupied” above), the top 10 loans represent approximately 13.9% of total commercial outstanding. The average loan size in the CRE segment is approximately $2.0 million. Delinquencies within the segment were nominal at less than 0.01% as a percentage of the total segment as of December 31, 2023. Maximum loan-to-value ratios at origination are governed by established policy and regulatory guidelines. The weighted average loan-to-value ratio for the top 10 loans within the non-owner occupied segment was 61.54% as of December 31, 2023. The top 10 office loans represent approximately 9% of the total commercial real estate segment exposure inclusive of unfunded commitments and 10% of the outstanding balances. The weighted average loan-to-value for the top ten loans within the office segment is 60.37%. Our total commercial portfolio has a pass rating of 93%, included in the commercial portfolio are office loans of $245.8 million which have a pass rating of 86%.
Maturity and Sensitivity of the Loan Portfolio
The following table shows contractual maturities of selected loan categories at December 31, 2023. The contractual maturities do not reflect premiums, discounts, deferred costs, or prepayments.
Within | 1 to 5 | 5 to 15 | After | |||||||||||||||
(in thousands, except percentages) | 1 year |
| Years |
| Years | 15 Years |
| Total | % of Total | |||||||||
Contractual Maturity | ||||||||||||||||||
Commercial construction |
| $ | 6,850 | $ | 72,019 | $ | 71,924 | $ | 3,255 | $ | 154,048 | 5 | % | |||||
Commercial real estate owner occupied |
| 8,979 |
| 79,518 |
| 204,259 |
| 17,259 |
| 310,015 | 10 | |||||||
Commercial real estate non-owner occupied | 73,288 |
| 473,200 |
| 584,110 |
| 13,968 |
| 1,144,566 | 38 | ||||||||
Tax exempt | 5,663 |
| 6,575 |
| 22,523 |
| 8,927 |
| 43,688 | 2 | ||||||||
Commercial and industrial | 69,179 | 116,484 | 79,481 | 45,739 | 310,883 | 10 | ||||||||||||
Residential real estate | 1,294 | 33,448 | 144,362 | 761,230 | 940,334 | 32 | ||||||||||||
Home equity | 2,512 | 5,438 | 11,050 | 68,683 | 87,683 | 3 | ||||||||||||
Consumer other | 1,791 | 5,446 | 430 | 165 | 7,832 | — | ||||||||||||
Total loans | $ | 169,556 | $ | 792,128 | $ | 1,118,139 | $ | 919,226 | $ | 2,999,049 | 100 | % | ||||||
Repricing Date | ||||||||||||||||||
Fixed-rate | 99,517 | 359,198 | 579,268 | 637,546 | 1,675,529 | 56 | ||||||||||||
Floating or adjustable rate | 70,039 | 432,930 | 538,871 | 281,680 | 1,323,520 | 44 | ||||||||||||
Total loans | $ | 169,556 | $ | 792,128 | $ | 1,118,139 | $ | 919,226 | $ | 2,999,049 | 100 | % | ||||||
Problem Assets
There is a preference to work with borrowers to resolve problems rather than proceeding to foreclosure. For commercial loans, this may result in a period of forbearance or restructuring of the loan, which is normally done at current market terms and may not result in a “troubled” loan designation. For residential mortgage loans, the Consumer Financial Protection Bureau (“CFPB”) guidelines are followed to attempt a restructuring that will enable owner-occupants to remain in their home. However, if these processes fail to result in a performing loan, foreclosure or other proceedings will be initiated no later than the 120th day of a delinquency, as necessary, to minimize any potential loss. Management reports on delinquent loans and non-performing assets to the Company’s Board of Directors monthly through the Board Risk Committee. Loans are generally removed from accruing status when they reach 90 days delinquent, except for certain loans which are well secured and in the process of collection. Loan collections are managed by a combination of the related business units and the managed assets group.
8
The following table presents the problem assets for the years indicated:
(in thousands, except ratios) |
| 2023 |
| 2022 |
| ||
Non-accruing loans: |
|
|
|
| |||
Commercial construction | $ | — | $ | — | |||
Commercial real estate owner occupied |
| 103 |
| 439 | |||
Commercial real estate non-owner occupied |
| 340 |
| 550 | |||
Tax exempt | — | — | |||||
Commercial and industrial |
| 363 |
| 207 | |||
Residential real estate | 3,908 | 4,385 | |||||
Home equity | 809 | 963 | |||||
Consumer other |
| 5 |
| 5 | |||
Total loans | 5,528 | 6,549 | |||||
Other real estate owned |
| — |
| — | |||
Total non-performing assets | $ | 5,528 | $ | 6,549 | |||
Total non-performing loans/total loans |
| 0.18 | % |
| 0.23 | % | |
Total non-performing assets/total assets |
| 0.14 |
| 0.17 | |||
Allowance for Credit Losses
Our loan portfolio is regularly reviewed by management to evaluate the adequacy of the allowance for credit losses (“ACL”). The allowance represents management’s estimate of inherent losses that are probable and estimable as of the date of the financial statements. The ACL is comprised of reserves measured on a collective (pool) basis based on a lifetime loss-rate model when similar risk characteristics exist. Loans that do not share risk characteristics are evaluated on an individual basis, generally larger non-accruing commercial loans. The ACL is discussed further in Note 1 – Summary of Significant Accounting Policies of the Consolidated Financial Statements.
9
The following table presents an analysis of the ACL for the years indicated:
(in thousands, except ratios) |
| 2023 |
| 2022 |
| ||
Balance at beginning of year | $ | 25,860 | $ | 22,718 | |||
Charged-off loans: |
|
|
|
| |||
Commercial construction |
| — |
| — | |||
Commercial real estate owner occupied |
| — |
| — | |||
Commercial real estate non-owner occupied |
| — |
| — | |||
Tax exempt | — | — | |||||
Commercial and industrial | (664) | (8) | |||||
Residential real estate | (8) | (84) | |||||
Home equity | (12) | (7) | |||||
Consumer other |
| (289) |
| (267) | |||
Total charged-off loans |
| (973) |
| (366) | |||
Recoveries on charged-off loans: |
|
|
|
| |||
Commercial construction |
| — |
| — | |||
Commercial real estate owner occupied |
| 142 |
| 120 | |||
Commercial real estate non-owner occupied |
| — |
| — | |||
Tax exempt | — | — | |||||
Commercial and industrial | 149 | 341 | |||||
Residential real estate | 31 | 106 | |||||
Home equity | 6 | 25 | |||||
Consumer other |
| 19 |
| 12 | |||
Total recoveries on charged-off loans |
| 347 |
| 604 | |||
Net (charge-offs) recoveries |
| (626) |
| 238 | |||
Provision for credit losses |
| 2,908 |
| 2,904 | |||
Balance at end of year | $ | 28,142 | $ | 25,860 | |||
Ratios: |
|
|
|
| |||
Net charge-offs (recoveries)/average loans |
| 0.02 | % |
| (0.01) | % | |
Recoveries/charged-off loans |
| 36 |
| 165 | |||
Allowance for credit losses/total loans |
| 0.94 |
| 0.89 | |||
Allowance for credit losses/non-accruing loans |
| 509 |
| 395 | |||
The following table presents year-end data for the approximate allocation of the ACL by loan categories at the dates indicated. For each loan category, the table shows the amount of the allowance allocated to that category as a percentage of the outstanding loans in that category. The allocation of the allowance to each category is not indicative of future losses and does not restrict the use of any of the allowance to absorb losses in any category.
2023 | 2022 |
| |||||||||
% Allocated to | % Allocated to |
| |||||||||
(in thousands, except ratios) |
| Amount |
| Total Loans |
| Amount |
| Total Loans |
| ||
Commercial construction |
| $ | 4,261 |
| 0.14 | % | $ | 2,579 |
| 0.09 | % |
Commercial real estate owner occupied |
| 2,863 |
| 0.10 |
| 2,189 |
| 0.08 | |||
Commercial real estate non-owner occupied | 9,443 |
| 0.31 |
| 9,341 |
| 0.32 | ||||
Tax exempt | 119 | — | 93 | — | |||||||
Commercial and industrial | 3,259 | 0.11 | 3,493 | 0.12 | |||||||
Residential real estate | 7,352 | 0.25 | 7,274 | 0.25 | |||||||
Home equity | 767 | 0.03 | 811 | 0.03 | |||||||
Consumer other | 78 | — | 80 | — | |||||||
Total | $ | 28,142 | 0.94 | % | $ | 25,860 | 0.89 | % | |||
10
INVESTMENT SECURITIES ACTIVITIES
The objective of the investment portfolio is to provide liquidity when loan demand is high, and to absorb excess funds when demand is low. The securities portfolio also provides a medium for certain interest rate risk measures intended to maintain an appropriate balance between interest income from loans and total interest expense. For additional information, see Item 7A of this Annual Report.
We invest in what we believe to be high-quality investment-grade securities. Investment decisions are made in accordance with the investment and treasury policies and include consideration of risk, return, duration, and portfolio concentrations. For further discussion on investments see Note 2 – Securities Available for Sale of the Consolidated Financial Statements.
The following table presents the amortized cost and fair value of securities available for sale for the years indicated:
2023 | 2022 | |||||||||||
Amortized | Amortized | |||||||||||
(in thousands) |
| Cost |
| Fair Value |
| Cost |
| Fair Value | ||||
Debt Securities: | ||||||||||||
Obligations of US Government-sponsored enterprises | $ | 2,021 | $ | 1,992 | $ | 2,692 | $ | 2,660 | ||||
Mortgage-backed securities and collateralized mortgage obligations: | ||||||||||||
US Government-sponsored enterprises | 223,602 | 193,282 | 249,838 | 215,027 | ||||||||
US Government agency |
| 85,005 |
| 74,213 |
| 90,318 |
| 79,606 | ||||
Private label |
| 60,888 |
| 59,051 |
| 64,056 |
| 60,154 | ||||
Obligations of states and political subdivisions thereof |
| 119,857 |
| 110,168 |
| 121,939 |
| 107,737 | ||||
Corporate bonds |
| 105,552 |
| 95,868 |
| 102,505 |
| 94,332 | ||||
Total | $ | 596,925 | $ | 534,574 | $ | 631,348 | $ | 559,516 | ||||
The following table presents the amortized cost and weighted average yields of securities available for sale at by maturity:
December 31, 2023 | ||||||||||||||||
Within | Over 1 Year | Over 5 Years | Over | |||||||||||||
(in thousands, except ratios) |
| 1 Year |
| to 5 Years | to 10 years | 10 Years | Total | |||||||||
Debt Securities: | ||||||||||||||||
Obligations of US Government-sponsored enterprises | $ | — | $ | 83 | $ | 513 | $ | 1,425 | $ | 2,021 | ||||||
Mortgage-backed securities and collateralized mortgage obligations: | ||||||||||||||||
US Government-sponsored enterprises | 634 | 3,447 | 17,225 | 202,296 | 223,602 | |||||||||||
US Government agency | 6 | 240 | 3,272 | 81,487 | 85,005 | |||||||||||
Private label |
| — |
|
| — | 27,234 | 33,654 | 60,888 | ||||||||
Obligations of states and political subdivisions thereof |
| — |
|
| 450 | 2,127 | 117,280 | 119,857 | ||||||||
Corporate bonds |
| 3,038 |
|
| 49,939 | 47,569 | 5,006 | 105,552 | ||||||||
Total | $ | 3,678 | $ | 54,159 | $ | 97,940 | $ | 441,148 | $ | 596,925 | ||||||
Weighted Average Yield | 5.51 | % | 5.67 | % | 5.28 | % | 2.68 | % | 3.40 | % | ||||||
DERIVATIVE FINANCIAL INSTRUMENTS
Interest swap derivatives are utilized to minimize fluctuations in earnings and cash flows caused by interest rate volatility either in the form of interest rate swaps on wholesale funding and variable rate loans designated as cash flow hedges or
11
partial interest rate hedges on securities accounted for as fair value hedges. For further discussion on derivatives see Note 10 – Derivative Financial Instruments and Hedging Activities of the Consolidated Financial Statements.
Derivative products are offered in the form of interest rate swaps and interest rate caps, to commercial loan customers to facilitate their risk management strategies. An interest rate swap is entered into with a customer, while at the same time an offsetting interest rate swap with another financial institution is entered into to offset. These interest rate swap transactions allow customers to effectively fix the interest rate on their loans. Customer loan derivative income is recognized for the upfront fee paid by the customer at origination. These swaps are designated as economic hedges and transactions are cleared through arrangements with third-party financial institutions.
Mortgage banking activities result in two types of derivative instruments. Interest rate lock commitments are offered to residential loan customers, to allow them the ability to lock into a fixed interest rate prior to closing, for loans intended to sell are classified as non-hedging derivatives. To offset this risk, an offsetting forward sale commitment may be entered into with national financial institutions to purchase the loans selected for sale under a best efforts or mandatory delivery contract accounted for as an economic hedge.
Floating-rate fundings are certain hedging transactions and certain products, such as floating-rate loans and mortgages, determine the applicable interest rate or payment amount by reference to a benchmark rate, such as the secured interbank overnight financing rate (“SOFR”), or to an index, basket or other financial metric.
DEPOSIT ACTIVITIES
A variety of deposit products to consumers, businesses and institutional customers with a wide range of interest rates and terms are offered. Deposits consist of interest-bearing and non-interest-bearing demand accounts, savings accounts, money market deposit accounts, and certificates of deposit. Deposits are solicited primarily in the market area, excluding brokered deposits. Competitive pricing policies, marketing and customer service to attract and retain deposits are relied upon.
Customer-related deposit fees are a significant source of fee income and principally derived from debit card interchange fees earned from transaction fees that merchants pay whenever a customer uses a debit card to make a purchase. Customer deposit fees are also earned from a variety of deposit accounts with various fee schedules and terms, which are designed to meet the customer’s financial needs. Other depositor-related fee services provided to customers include ATMs, remote deposit capture, ACH origination, wire transfers, internet bill pay, and other cash management services.
Pricing of deposits is managed in keeping with the asset/liability management, liquidity and profitability objectives, subject to market competitive factors. Based on our experience, deposits are relatively stable sources of funds. Despite this stability, the ability to attract and maintain these deposits and rates are significantly affected by market conditions.
The following table presents the average balances and weighted average rates for deposits for the years indicated:
2023 | 2022 |
| |||||||||||||
(in thousands, except ratios) |
| Average Balance |
| Percent of Total |
| Weighted Average Rate |
| Average Balance |
| Percent of Total |
| Weighted Average Rate | |||
Demand | $ | 618,685 |
| 20 | % | — | % | $ | 679,081 |
| 22 | % | — | % | |
NOW |
| 900,035 |
| 30 |
| 0.98 |
| 907,123 |
| 30 |
| 0.16 | |||
Savings |
| 594,959 |
| 20 |
| 0.39 |
| 657,591 |
| 21 |
| 0.10 | |||
Money market |
| 406,759 |
| 13 |
| 2.48 |
| 466,426 |
| 15 |
| 0.63 | |||
Time deposits |
| 532,981 |
| 17 |
| 3.19 |
| 366,404 |
| 12 |
| 0.61 | |||
Total | $ | 3,053,419 |
| 100 | % | 1.25 | % | $ | 3,076,625 |
| 100 | % | 0.24 | % | |
12
Estimated uninsured non-maturity deposits were $525.3 million as of December 31, 2023 and $617.7 million as of December 31, 2022. Estimated uninsured time deposits were $60.0 million and $27.9 million as of December 31, 2023 and 2022, respectively.
The following table presents the scheduled maturities of time deposits greater than $250 thousand at December 31, 2023:
|
| ||
(in thousands, except ratios) | Amount | ||
Three months or less | $ | 33,583 | |
Over 3 months through 6 months |
| 31,522 | |
Over 6 months through 12 months |
| 85,198 | |
Over 12 months |
| 4,122 | |
Total | $ | 154,425 | |
BORROWING ACTIVITIES
Borrowings may be utilized as an alternative source of funds which can be invested at a positive interest rate spread when additional capacity to fund loan demand is desired or when asset/liability management goals are met to diversify funding sources and enhance interest rate risk management.
Borrowings historically have included advances from the Federal Home Loan Bank of Boston ("FHLB"), securities sold under repurchase agreements, and a correspondent bank unsecured line of credit. Advances may be obtained from the FHLB by collateralizing the advances with certain loans and investment securities. These advances may be made pursuant to several different credit programs, each of which has its own interest rate, range of maturities and call features.
We also have subordinated notes, junior subordinated debenture and other sources of liquidity that are fully described in Note 7 –Borrowed Funds of the Consolidated Financial Statements.
RETAIL BROKERAGE SERVICES
Bar Harbor Financial Services principally serves the brokerage needs of individuals ranging from first-time purchasers to sophisticated investors. It also offers a line of life insurance, annuity, and retirement products, as well as financial planning services. These products are not deposits, are not insured by the Federal Deposit Insurance Corporation (“FDIC”) or any other government agency, are not guaranteed by the Bank or any affiliate, and may be subject to investment risk, including possible loss of principal.
Bar Harbor Financial Services is a branch office of Osaic Institutions, Inc., (“Osaic”) a full-service third-party broker-dealer, conducting business under the assumed business name “Bar Harbor Financial Services.” Osaic is an independent registered broker-dealer and is not affiliated with the Company or its subsidiaries. Osaic was formed by a group of member banks, and is one of the largest providers of third-party investment and insurance services to banks and their customers in New England. Through Osaic, the expertise, capabilities, and experience of a well-established third-party broker-dealer is obtained in a cost effective manner.
TRUST MANAGEMENT SERVICES
The Bank has one wholly-owned subsidiary, BHWM, that provides a comprehensive array of fiduciary services including trust and estate administration, wealth advisory services, and investment management services to individuals, businesses, not-for-profit organizations, and municipalities. As a New Hampshire-chartered trust company, BHWM is subject to New Hampshire laws applicable to trust companies and fiduciaries. Professional advisors help individuals and families structure accounts that will meet their long-term financial needs. To many wealth management clients, the effective transfer of wealth to future generations is of paramount importance. The trust services act as a fiduciary for various types of trusts and serves as the investment manager for these accounts. Outside of trust services, they also provide 401(k) plan services, financial, estate and charitable planning, investment management, family office, municipal and tax services. The
13
employees include credentialed investment professionals with extensive experience. At December 31, 2023 and 2022, trust management services had total assets under management (“AUM”) of $2.5 billion and $2.3 billion, respectively.
HUMAN CAPITAL
We are very fortunate to have a diverse, committed team throughout Maine, New Hampshire, and Vermont who are capable, determined and empowered to drive our company forward. As of December 31, 2023, we had 462 full time equivalent employees. None of our colleagues are represented by unions. All employment decisions are based on talent and potential for growth. Our ability to attract and retain diverse, top-tier talent while sustaining and deepening the current relationships is critical to maintaining a best-in-class customer and colleague experience. The opportunity for personal and professional development is a critically important focus of ours and one that helps us retain top talent. We are keenly aware of our ability to be a positive impact in the communities we serve, as such we are committed to supporting, developing, and encouraging colleague engagement with their communities.
We invest in our employees and continuously encourage them to build the skills they need to become an even more valuable team member. Opportunities are provided for colleagues to take on challenging and intriguing work to advance their career goals and transition into new roles as the banking industry evolves. In addition, we provide colleagues with access to a variety of programs developed to align with the knowledge, skills and capabilities that are critical to our organization’s success both now and in the future.
Attracting, retaining, and rewarding high-performing talent is key to our success. Our total rewards program is designed to recognize and reward top talent and keep colleagues engaged effectively. A critical component of our total rewards program is compensation. Our compensation strategy is deeply rooted in a pay for performance philosophy. The intent of this strategy is to align colleague contributions and rewards with the success of the organization. We participate in several market studies, including peers in the banking industry, to ensure competitive pay, benefits, and programs. Annual merit increases align with market data and performance to ensure fair and equitable practices are adhered to. Incentive programs are a meaningful component of colleague compensation and are tied to both company and individual performance. To complement these programs, colleagues are also able to provide and receive recognition through our online portal, Bar Harbor Connect. When recognized colleagues receive points that they can then redeem for rewards of their choice such as gift cards, logo items, and concert tickets.
Beyond compensation, our total rewards program underscores our commitment to colleague’s health and well-being. We offer comprehensive benefit packages, including medical, dental, vision, life, disability, and several other voluntary programs. We also contribute to employee-owned health savings accounts and utilize our wellness program to encourage colleagues to stay fit physically and mentally. The retirement savings programs include a 401(k) plan with a generous company match that vests immediately, along with an Employee Stock Purchase Plan (ESPP) that allows colleagues to be owners of the company at a reduced price. ESPP provides a benefit to our colleagues while also encouraging them to think and make decisions like shareholders.
Providing work-life balance choices results in our colleagues’ making more meaningful contributions in the workplace. We have a generous paid time off program as well as paid volunteer time to support this. In addition, we offer Flexible Work Arrangements, which offers options such as fully remote, partially remote, condensed workweeks, and flexible hours. The flexibility of these various arrangements allows colleagues to manage their work-life needs while continuing to deliver stellar results in the workplace.
Embracing unique perspectives and supporting inclusivity and diversity are at the core of who we are. We strive to understand the unique opportunities and challenges that our customers and colleagues face. Our commitment to racial and social equity is ingrained in our guiding principles and allows us to work together to foster an inclusive and equitable work environment.
Serving the needs of all of the members of our communities also remains an important part of our commitment and strategy. For more than 137 years, the Bank has contributed to the economic health and vitality of the communities we serve. We are proud that our employees are involved in the communities in which we live and work. Each year, colleagues volunteer countless hours of their time on community projects and serve on nonprofit boards. In addition to these efforts, we have
14
provided charitable donations to more than 450 community organizations across the Northern New England states of Maine, New Hampshire, and Vermont.
REGULATION AND SUPERVISION
As a bank holding company, the Company is regulated under the federal Bank Holding Company Act (“BHC Act”) and is subject to examination and supervision by the Federal Reserve Board. The Federal Reserve Board requires the Company to file various reports and also may conduct an examination of the Company.
The Company is also under the jurisdiction of the SEC and is subject to the disclosure and regulatory requirements of the Securities Act and the Exchange Act. The Company’s common stock is listed on the New York Stock Exchange American exchange (“NYSE American”) under the trading symbol “BHB,” and is subject to the rules of NYSE American for listed companies.
As a Maine-chartered financial institution, the Bank is subject to supervision, regular examination, and regulation by the Maine Bureau of Financial Institutions ("BFI") and the FDIC as its primary federal regulator and as its deposit insurer. The Bank’s deposits are insured by the FDIC in accordance with applicable federal laws and regulations. The prior approval of the BFI and the FDIC is required, among other things, for the Bank to assume deposits or engage in any merger, consolidation, purchase or sale of all or substantially all of the assets of any bank. The prior approval of the FDIC is required, and the prior approval of the BFI may be required, for the Bank to establish or relocate a branch office.
BHWM, a New Hampshire chartered non-depository trust company and an indirect subsidiary of the Bank, is subject to supervision, regular examination, and regulation by the New Hampshire Banking Department. On April 30, 2022, Bar Harbor Trust Services, which was a Maine chartered non-depository trust company and a wholly-owned subsidiary of the Bank, merged with and into BHWM (formerly named Charter Trust Company).
In accordance with NH RSA 383-C:5-502, BHWM’s Capital Plan requires minimum capital of $1.0 million to be invested in accordance with NH RSA 564-B:9-902. As of December 31, 2023, BHWM’s total capital was $16.8 million and it had liquidation reserves of $504 thousand held in a money market account. BHWM also had operating reserves of $15.7 million held primarily at the Bank. As of December 31, 2023, BHWM had an appropriate liquidation reserve, minimum capital in excess of statutory requirements, and all funds were held in accordance with prudent investor standards of NH RSA 564-B:9-902 and as required by NH RSA 383-C:5-502.
Any change in applicable laws or regulations could have a material adverse impact on the operations and financial performance of the Company and the Bank. In addition, the Company and the Bank are affected by the monetary and fiscal policies of the United States Government, including the Federal Reserve Board. In view of changing conditions in the national economy and in the financial markets, it is impossible for management to accurately predict future changes in monetary policy or the effect such changes may have on the business or financial condition of the Company and the Bank.
Certain Laws and Regulations Applicable to the Company
The BHC Act and other federal laws subject bank holding companies to particular restrictions on the types of activities in which the Company may engage, and to a range of supervisory requirements and activities, including regulatory enforcement actions for violations of laws and regulations. Below is a summary of certain provisions of the BHC Act and certain other laws and regulations applicable to the Company. These laws or regulations may be amended or changed by Congress or through other governmental or legal processes, which could have a material effect on the results of the Company.
Permitted Activities
Generally, bank holding companies are prohibited under the BHC Act from engaging in non-banking activities, or acquiring direct or indirect control of any company engaged in non-banking activities. The Federal Reserve Board has allowed by regulation some exceptions based on activities closely related to banking including: (i) making or servicing loans; (ii) performing certain data processing services; (iii) providing discount brokerage services; (iv) acting as fiduciary,
15
investment or financial advisor; and (v) acquiring a savings and loan association whose direct and indirect activities are limited to those permitted for bank holding companies. The Federal Reserve Board has the authority to require a bank holding company to terminate an activity or terminate control of or liquidate or divest certain subsidiaries or affiliates when the Federal Reserve Board believes the activity or the control of the subsidiary or affiliate constitutes a significant risk to the financial safety, soundness, or stability of any of its banking subsidiaries.
A bank holding company that qualifies and elects to become a financial holding company is permitted to engage in additional activities that are financial in nature or incidental or complementary to financial activity. The Company currently has no plans to make a financial holding company election.
Safe and Sound Banking Practices
Bank holding companies and their non-banking subsidiaries are prohibited from engaging in activities that represent unsafe and unsound banking practices. For example, under certain circumstances the Federal Reserve Board’s Regulation Y requires a holding company to give the Federal Reserve Board prior notice of any redemption or repurchase of its own equity securities if the consideration to be paid, together with the consideration paid for any repurchases during the preceding 12 months, is equal to 10% or more of the company’s consolidated net worth. The Federal Reserve Board may oppose the transaction if it believes that the transaction would constitute an unsafe or unsound practice or would violate a regulation. As another example, a holding company is prohibited from impairing its subsidiary bank’s safety and soundness by causing the bank to make funds available to non-banking subsidiaries or their customers if the Federal Reserve Board believes it not prudent to do so. The Federal Reserve Board has the power to assess civil money penalties for knowing or reckless violations, if the activities leading to a violation caused a substantial loss to a depository institution. Potential penalties are as high as $1,000,000 for each day the activity continues.
Dividends
Dividends from the Bank are the Company’s principal source of cash revenues. The Company’s earnings and activities are affected by federal and state legislation, regulations, local legislative and administrative bodies, and decisions of courts in the jurisdictions in which business is conducted. These include limitations on the ability of the Bank to pay dividends to the Company and the Company’s ability to pay dividends to its shareholders. It is the policy of the Federal Reserve Board that bank holding companies should pay cash dividends on common stock only out of income available over the past year and only if prospective earnings retention is consistent with the organization’s expected future needs and financial condition. The policy provides that bank holding companies should not maintain a level of cash dividends that undermines the bank holding company’s ability to serve as a source of strength to its banking subsidiary. Consistent with such policy, a banking organization should have comprehensive policies on dividend payments that clearly articulate the organization’s objectives and approaches for maintaining a strong capital position and achieving the objectives of the policy statement.
The FDIC has the authority to use its enforcement powers to prohibit a bank from paying dividends if, in its opinion, the payment of dividends would constitute an unsafe or unsound practice. Federal law also prohibits the payment of dividends by a bank that will result in the bank failing to meet its applicable capital requirements on a pro forma basis. Maine law requires the approval of the BFI for any dividend that would reduce a bank’s capital below prescribed limits.
Source of Strength
In accordance with Federal Reserve Board policy, the Company is expected to act as a source of financial and managerial strength to the Bank. Section 616 of the Dodd-Frank Wall Street Reform and Consumer Protection Act (“Dodd-Frank Act”) codifies the requirement that bank holding companies serve as a source of financial strength to their subsidiary depository institutions. Under this policy, the bank holding company is expected to commit resources to support its bank subsidiary, including at times when the bank holding company may not be in a financial position to provide it. As discussed below, the Company could be required to guarantee the capital plan of the Bank if it becomes undercapitalized for purposes of banking regulations. Any capital loans by a bank holding company to its subsidiary bank are subordinate in right of payment to deposits and to certain other indebtedness of such subsidiary bank. The BHC Act provides that, in the event of
16
a bank holding company’s bankruptcy, any commitment by the bank holding company to a federal bank regulatory agency to maintain the capital of a bank subsidiary will be assumed by the bankruptcy trustee and entitled to priority of payment.
Anti-tying Restrictions
Bank holding companies and their affiliates are prohibited from tying the provision of services, such as extensions of credit, to other services offered by a bank holding company or its affiliates.
Mergers & Acquisitions
The BHC Act, the federal Bank Merger Act, the laws of the State of Maine applicable to financial institutions and other federal and state statutes regulate acquisitions of banks and their holding companies. The BHC Act generally limits acquisitions by bank holding companies to banks and companies engaged in activities that the Federal Reserve Board has determined to be so closely related to banking as to be a proper incident thereto. The BHC Act requires every bank holding company to obtain the prior approval of the Federal Reserve Board before (i) acquiring more than 5% of the voting stock of any bank or other bank holding company, (ii) acquiring all or substantially all of the assets of any bank or bank holding company, or (iii) merging or consolidating with any other bank holding company.
In reviewing applications seeking approval of merger and acquisition transactions, the bank regulatory authorities generally consider, among other things, the competitive effect and public benefits of the transactions, the financial and managerial resources and future prospects of the combined organization (including the capital position of the combined organization), the applicant’s performance record under the federal Community Reinvestment Act (see Community Reinvestment Act included in Item I), fair housing laws and the effectiveness of the subject organizations in combating money laundering activities.
Limitations on Acquisitions of the Company’s Common Stock
The federal Change in Bank Control Act prohibits a person or group of persons from acquiring “control” of a bank holding company unless the appropriate federal bank regulator has been notified and has not objected to the transaction. Under a rebuttable presumption established by the federal bank regulator, the acquisition of 10% or more of a class of voting securities of a bank holding company with a class of securities registered under Section 12 of the Exchange Act would constitute the acquisition of control of a bank holding company. In addition, the BHC Act prohibits any company from acquiring control of a bank or bank holding company without first having obtained the approval of the federal bank regulator. Among other circumstances, under the BHC Act, a company has control of a bank or bank holding company if the company owns, controls or holds with power to vote 25% or more of a class of voting securities of the bank or bank holding company, controls in any manner the election of a majority of directors or trustees of the bank or bank holding company, or the federal bank regulator has determined, after notice and opportunity for hearing, that the company has the power to exercise a controlling influence over the management or policies of the bank or bank holding company.
Transactions with Affiliates
The holding company and the Bank are considered “affiliates” of each other under the Federal Reserve Act, and transactions between a bank and its affiliates are subject to certain restrictions, under Sections 23A and 23B of the Federal Reserve Act and the Federal Reserve Board’s implementing Regulation W. Generally, Sections 23A and 23B: (i) limit the extent to which an insured depository or its subsidiaries may engage in covered transactions (a) with an affiliate (as defined in such sections) to an amount equal to 10% of such institution’s capital and surplus, and (b) with all affiliates, in the aggregate to an amount equal to 20% of such capital and surplus; and (ii) require all transactions with an affiliate, whether or not covered transactions, to be on terms substantially the same, or at least as favorable to the institution or subsidiary, as the terms provided or that would be provided to a non-affiliate. The term “covered transaction” includes the making of loans, purchase of assets, issuance of a guarantee and other similar types of transactions.
17
State Law Restrictions
As a Maine corporation, the Company is subject to certain limitations and restrictions under applicable Maine corporate law. For example, state law restrictions in Maine include limitations and restrictions relating to indemnification of directors, distributions and dividends to shareholders, transactions involving directors, officers or interested shareholders, maintenance of books, records, and minutes, and observance of certain corporate formalities. Further, as a Maine financial institution holding company, the Company is also subject to certain requirements and restrictions under applicable Maine banking law.
Capital Adequacy and Prompt Corrective Action
In July 2013, the Federal Reserve Board, the FDIC and the Office of the Comptroller of the Currency issued final rules (the “Capital Rules”) that established the current capital framework for U.S. banking organizations. The Capital Rules generally implement the Basel Committee on Banking Supervision’s December 2010 final capital framework referred to as “Basel III” for strengthening international capital standards. In addition, the Capital Rules implement certain provisions of the Dodd-Frank Act, including the requirements of Section 939A to remove references to credit ratings from the federal banking agencies’ rules. The Capital Rules substantially revised the risk-based capital requirements applicable to bank holding companies and their depository institution subsidiaries. The risk based capital guidelines are designed to make regulatory capital requirements sensitive to differences in risk profiles among banks and bank holding companies, to account for off-balance sheet exposures and to minimize disincentives for holding liquid, low-risk assets.
The Capital Rules: (i) require a capital measure called “Common Equity Tier 1” (“CET1”) and related regulatory capital ratio of CET1 to risk-weighted assets; (ii) specify that Tier 1 capital consists of CET1 and “Additional Tier 1 capital” instruments meeting certain revised requirements; (iii) mandate that most deductions/adjustments to regulatory capital measures be made to CET1 and not to the other components of capital; and (iv) expand the scope of the deductions from and adjustments to capital as compared to existing regulations. The Capital Rules revised the definitions and the components of regulatory capital and impacted the calculation of the numerator in banking institutions’ regulatory capital ratios.
The Capital Rules prescribe a standardized approach for risk weightings, generally ranging from 0% for U.S. government and agency securities to 600% for certain equity exposures, resulting in higher risk weights for a variety of asset classes.
Pursuant to Section 38 of the Federal Deposit Insurance Act (“FDI Act”), federal banking agencies are required to take “prompt corrective action” should an insured depository institution fail to meet certain capital adequacy standards. At each successive lower capital category, an insured depository institution is subject to more restrictions and prohibitions, including restrictions on growth, restrictions on interest rates paid on deposits, restrictions or prohibitions on payment of dividends and restrictions on the acceptance of brokered deposits. Furthermore, if an insured depository institution is classified in one of the undercapitalized categories, it is required to submit a capital restoration plan to the appropriate federal banking agency, and the holding company must guarantee the performance of that plan. Based upon its capital levels, a bank that is classified as well-capitalized, adequately capitalized, or undercapitalized may be treated as though it were in the next lower capital category if the appropriate federal banking agency, after notice and opportunity for hearing, determines that an unsafe or unsound condition, or an unsafe or unsound practice, warrants such treatment.
For purposes of Section 38 of the FDI Act, for an insured depository institution to be classified as well-capitalized, it must have a:
(i) total risk-based capital ratio of at least 10%,
(ii) Tier 1 risk-based capital ratio of at least 8%,
(iii) CET1 risk-based capital ratio of at least 6.5%, and
(iv) leverage ratio of at least 5%.
In order to be classified as “well-capitalized” under the relevant regulatory framework, the Company must, on a consolidated basis, have a:
(i) total risk-based capital ratio of at least 10%, and
18
(ii) Tier 1 risk-based capital ratio of at least 6%.
Both the Bank and the Company have always maintained regulatory capital ratios above the levels to be considered quantitatively well-capitalized. For information regarding the regulatory capital ratios of the Bank and the Company as of December 31, 2023 and December 31, 2022, respectively, see the discussion under the section captioned Capital Resources included in Item 7 – Management’s Discussion and Analysis of Financial Condition and Results of Operations of this Annual Report and Note 12 – Shareholders’ Equity and Earnings Per Common Share of the Consolidated Financial Statements.
Other Significant Banking Regulations Applicable to the Bank
Deposit Insurance
The Bank’s deposit accounts are fully insured by the Deposit Insurance Fund ("DIF") of the FDIC up to the deposit insurance limits set forth in applicable law and regulations.
The FDIC uses a risk-based assessment system that imposes insurance premiums based upon a risk matrix that accounts for a bank’s capital level and supervisory rating (CAMELS rating). The risk matrix uses different risk categories distinguished by capital levels and supervisory ratings. The base for deposit insurance assessments is consolidated average assets less average tangible equity. Assessment rates are calculated using formulas that take into account the risk of the institution being assessed. The FDIC may increase or decrease the assessment rate schedule in order to manage the DIF to prescribed statutory target levels. An increase in the risk category for the Bank or in the assessment rates could have an adverse effect on the Bank’s and consequently the Company’s earnings. The FDIC may terminate deposit insurance if it determines the institution involved has engaged in or is engaging in unsafe or unsound banking practices, is in an unsafe or unsound condition, or has violated applicable laws, regulations or orders.
Consumer Financial Protection
The Company is subject to a number of federal and state consumer protection laws that govern its relationship with its customers. These laws include, for example, the Equal Credit Opportunity Act, the Fair Credit Reporting Act, the Truth in Lending Act, the Truth in Savings Act, the Electronic Fund Transfer Act, the Expedited Funds Availability Act, the Home Mortgage Disclosure Act, the Fair Housing Act, the Real Estate Settlement Procedures Act, the Fair Debt Collection Practices Act, the Right to Financial Privacy Act, the Service Members Civil Relief Act and these federal laws’ respective state law counterparts, as well as state usury laws and laws regarding unfair and deceptive acts and practices. These and other federal laws, among other things, require disclosures of the cost of credit and terms of deposit accounts, provide substantive consumer rights, prohibit discrimination in credit transactions, regulate the use of credit report information, provide financial privacy protections, prohibit unfair, deceptive and abusive practices, restrict the Bank’s ability to raise interest rates and subject the Bank to substantial regulatory oversight. Violations of applicable consumer protection laws can result in significant potential liability from litigation brought by customers, including actual damages, restitution and attorneys’ fees.
Further, the CFPB has broad rulemaking authority for a wide range of consumer financial laws that apply to all banks, including, among other things, the authority to prohibit “unfair, deceptive or abusive” acts and practices. Abusive acts or practices are defined as those that (i) materially interfere with a consumer’s ability to understand a term or condition of a consumer financial product or service; or (ii) take unreasonable advantage of: (a) a lack of understanding on the part of the consumer of the material risks, costs, or conditions of the product or service; (b) the inability of the consumer to protect the interests of the consumer in selecting or using a consumer financial product or service; or (c) the reasonable reliance by the consumer on a covered person to act in the interests of the consumer.
Neither the Dodd-Frank Act nor the individual consumer financial protection laws prevent states from adopting stricter consumer protection standards.
19
Brokered Deposit Restrictions
Under the FDIC Improvement Act, banks may be restricted in their ability to accept brokered deposits, depending on their classification. “Well-capitalized” institutions are permitted to accept brokered deposits, but all banks that are not well- capitalized could be restricted from accepting such deposits. The Bank is currently well-capitalized and not restricted from accepting brokered deposits.
Community Reinvestment Act
The Community Reinvestment Act of 1977 (“CRA”), requires depository institutions to assist in meeting the credit needs of their market areas consistent with safe and sound banking practice. Under the CRA, each depository institution is required to help meet the credit needs of its market areas by, among other things, providing credit to low- and moderate-income individuals and communities. These factors are also considered in evaluating mergers, acquisitions and applications to open a branch or facility. The applicable federal regulators regularly conduct CRA examinations to assess the performance of financial institutions and assign one of four ratings to the institution’s records of meeting the credit needs of its community. During its last examination, the Bank received a CRA rating of “satisfactory”.
Insider Credit Transactions
Section 22(h) of the Federal Reserve Act (the “FRA”) and its implementing Regulation O, restricts loans to directors, executive officers, and principal shareholders (“insiders”). Under Section 22(h), loans to insiders and their related interests may not exceed, together with all other outstanding loans to such persons and affiliated entities, the institution’s total capital and surplus. Loans to insiders above specified amounts must receive the prior approval of the Board of Directors. Further, under Section 22(h) of the FRA, loans to directors, executive officers and principal shareholders must be made on terms substantially the same as offered in comparable transactions to other persons, except that such insiders may receive preferential loans made under a benefit or compensation program that is widely available to the bank’s employees and does not give preference to the insider over the employees. Section 22(g) of the FRA places additional limitations on loans to executive officers. A violation of these restrictions may result in the assessment of substantial civil monetary penalties on the affected bank or any officer, director, employee, agent or other person participating in the conduct of the affairs of that bank, the imposition of a cease and desist order, and other regulatory sanctions.
Safety and Soundness
Under the FDI Act, each federal banking agency has prescribed, by regulation, non-capital safety and soundness standards for institutions under its authority. These standards cover internal controls, information and internal audit systems, loan documentation, credit underwriting, interest rate exposure, asset growth, compensation, fees and benefits, such other operational and managerial standards as the agency determines to be appropriate, and standards for asset quality, earnings and stock valuation. An institution that fails to meet these standards must develop a plan acceptable to the agency, specifying the steps that the institution will take to meet the standards. Failure to submit or implement such a plan may subject the institution to regulatory sanctions.
Financial Privacy
Section V of the Gramm-Leach-Bliley Act ("GLBA") and its implementing regulations require all financial institutions, including the Company and the Bank and the Bank’s subsidiaries, to adopt privacy policies, restrict the sharing of nonpublic customer data with non-affiliated parties at the customer’s request, limit the reuse of certain consumer information received from non-affiliated financial institutions, and establish procedures and practices to protect customer data from unauthorized access. In addition, the Fair Credit Reporting Act (“FCRA”), as amended by the Fair and Accurate Credit Transactions Act of 2003 (the "FACT Act”), includes many provisions affecting the Company, Bank, and/or their affiliates, including provisions concerning obtaining consumer reports, furnishing information to consumer reporting agencies, maintaining a program to prevent identity theft, sharing of certain information among affiliated companies, and other provisions. The FACT Act requires entities subject to FCRA to notify their customers if they report negative information about them to a credit bureau or if they are granted credit on terms less favorable than those generally available. The CFPB and the Federal Trade Commission (“FTC”) have extensive rulemaking authority under the FACT Act, and the
20
Company and the Bank are subject to the rules that have been promulgated under the FACT Act, including rules requiring financial institutions with covered accounts (e.g. consumer bank accounts and loans) to develop, implement, and administer an identity theft protection program, as well as rules regarding limitations on affiliate marketing and implementation of programs to identify, detect and mitigate certain identity theft red flags. The Company has developed policies and procedures for itself and its subsidiaries, including the Bank, and believes it is in compliance with all privacy, information sharing, and notification provisions of the GLBA and the FACT Act. The Bank is also subject to data security standards, privacy and data breach notice requirements, primarily those issued by the FDIC, as well as under state laws.
Anti-Money Laundering Initiatives and the USA Patriot Act
A major focus of governmental policy on financial institutions over the last two decades has been combating money laundering and terrorist financing. The USA PATRIOT Act of 2001 (“USA Patriot Act”), substantially broadened the scope of United States anti-money laundering laws and regulations by imposing significant new compliance and due diligence obligations, creating new crimes and penalties and expanding the extra-territorial jurisdiction of the United States. The U.S. Treasury Department has issued a number of regulations that apply various requirements of the USA Patriot Act to financial institutions such as the Bank. These regulations impose obligations on financial institutions to maintain appropriate policies, procedures and controls to detect, prevent and report money laundering and terrorist financing and to verify the identities of their customers. Financial institutions are also prohibited from entering into specified financial transactions and account relationships and must use enhanced due diligence procedures in their dealings with certain types of high-risk customers and implement a written customer identification program. Financial institutions must take certain steps to assist government agencies in detecting and preventing money laundering and report certain types of suspicious transactions. Regulatory authorities routinely examine financial institutions for compliance with these obligations, and failure of a financial institution to maintain and implement adequate programs to combat money laundering and terrorist financing, or to comply with all of the relevant laws or regulations, can have serious legal and reputational consequences for the institution.
Office of Foreign Assets Control Regulation
The United States has imposed economic sanctions that affect transactions with designated foreign countries, nationals and others. These are typically known as the “OFAC” rules based on their administration by the U.S. Treasury Department Office of Foreign Assets Control (“OFAC”). The OFAC-administered sanctions targeting countries take many different forms. Generally, however, they contain one or more of the following elements: (i) restrictions on trade with or investment in a sanctioned country, including prohibitions against direct or indirect imports from and exports to a sanctioned country and prohibitions on “U.S. persons” engaging in financial transactions relating to making investments in, or providing investment-related advice or assistance to, a sanctioned country; and (ii) a blocking of assets in which the government or specially designated nationals of the sanctioned country have an interest, by prohibiting transfers of property subject to U.S. jurisdiction (including property in the possession or control of U.S. persons). Blocked assets (e.g., property and bank deposits) cannot be paid out, withdrawn, set off or transferred in any manner without a license from OFAC. The Company is responsible for, among other things, blocking accounts of, and transactions with, such targets and countries, prohibiting unlicensed trade and financial transactions with them and reporting blocked transactions after their occurrence. Failure to comply with these sanctions could have serious legal and reputational consequences.
Guidance on Sound Compensation Policies
The Dodd-Frank Act requires publicly traded companies to give shareholders a non-binding vote on named executive officer compensation at least every three years (the so-called “say-on-pay vote”) and on so-called “golden parachute” payments in connection with approvals of mergers and acquisitions. In addition, the Dodd-Frank Act requires publicly traded companies to give shareholders a non-binding vote, at least once every six years, on how frequently to hold the “say on pay” vote.
The Dodd-Frank Act also requires the federal banking agencies and the SEC to establish joint regulations or guidelines prohibiting incentive-based payment arrangements at specified regulated entities with at least $1 billion in total consolidated assets that encourage inappropriate risks by providing an executive officer, employee, director or principal shareholder with excessive compensation, fees, or benefits that could lead to material financial loss to the entity. The
21
federal banking agencies and the SEC most recently proposed such regulations in 2016, but the regulations have not yet been finalized. If the regulations are adopted in the form initially proposed, they will restrict the manner in which executive compensation is structured.
Changing Regulatory Structure and Future Legislation and Regulation
Congress may enact further legislation that affects the regulation of the financial services industry, and state legislatures may enact further legislation affecting the regulation of financial institutions. Federal and state regulatory agencies also periodically propose and adopt changes to their regulations or change the manner in which existing regulations are applied. The Company cannot predict the substance or impact of pending or future legislation or regulations, or the application thereof, although enactment of the proposed legislation could impact the regulatory structure under which the Company operates and may significantly increase costs, impede the efficiency of internal business processes, require an increase in regulatory capital, require modifications to the Company’s business strategy, and limit the Company’s ability to pursue business opportunities in an efficient manner. A change in statutes, regulations or regulatory policies applicable to the Company or any of its subsidiaries could have a material effect on its business.
Other Laws and Regulations
The Company is not only subject to federal laws applicable to it, it is also subject to the rules and regulations of the various federal agencies charged with the responsibility of implementing these federal laws.
ITEM 1A. RISK FACTORS
An investment in our common stock is subject to risks inherent to our business. The material risks and uncertainties that management believes affect us are described below. Before making an investment decision, you should carefully consider the risks and uncertainties described below, together with all of the other information included or incorporated by reference herein. The risks and uncertainties described below are not the only ones facing us. Additional risks and uncertainties that management is not aware of or focused on or that management currently deems immaterial may also impair our business operations. This Annual Report is qualified in its entirety by these risk factors.
If any of the events described in the risk factors should actually occur, our financial condition and results of operations could be materially and adversely affected. If this were to happen, the value of our securities could decline significantly, and you could lose all or part of your investment.
Credit Risks
Deterioration in local economies or real estate markets may adversely affect our financial performance, as our borrowers’ ability to repay loans and the value of the collateral securing the loans may decline.
We serve individuals and businesses located in Maine, New Hampshire, and Vermont. A substantial portion of the loan portfolio is secured by real estate in these areas and the value of the associated collateral is subject to local real estate market conditions. Furthermore, many customers in the hospitality industry rely upon a high number of tourists to vacation destinations and attractions within our markets. Our success is largely dependent on the economic conditions, including employment levels, population growth, income levels, savings trends and government policies in those market areas. A downturn in the local economies may adversely affect collateral values, sources of funds, and demand for products, all of which could have a negative impact on results of operations, financial condition and business expansion.
High concentrations of commercial loans may increase exposure to credit loss upon borrower default.
As of December 31, 2023, approximately 64% of our loan portfolio consisted of commercial real estate, commercial and industrial and construction loans. Commercial loan portfolio concentration generally exposes lenders to greater risk of delinquency and loss than residential real estate loans because repayment of the loans often depends on the successful operation and income streams from the property. Commercial loans typically involve larger balances to single borrowers or groups of related borrowers as compared to residential real estate loans. As our loan portfolio contains a significant number of large commercial loans, the deterioration of one or a few of these loans could cause a significant increase in
22
non-performing loans, provision for loan losses, and/or an increase in loan charge-offs, all of which could adversely affect our financial condition and results of operations.
Greater than anticipated credit losses in the loan portfolios may adversely affect our earnings.
Credit losses are inherent in the business of making loans and could have a material adverse effect on operating results. We make various assumptions and judgments about the collectability of the loan portfolio and provide an ACL based on a number of factors. The ACL is evaluated on a periodic basis using current information, including the quality of the loan portfolio, economic conditions, and value of the underlying collateral and the level of non-accrual loans. Although we believe the ACL is appropriate to absorb probable losses in the loan portfolio, this allowance may not be adequate. Increases in the allowance will result in an expense for the period, thereby reducing reported net income.
We are exposed to risk of environmental liabilities with respect to properties to which we take title.
In the course of business, we may own or foreclose and take title to real estate that may be subject to environmental liabilities with respect to subject property. As a result, we may be held liable for property damage, personal injury, investigation and restoration costs. The cost associated with investigation or restoration activities could be substantial. In addition, as the owner or former owner of a contaminated site, we may be subject to common law claims by third parties based on damages and costs resulting from environmental contamination emanating from the property.
Liquidity and Interest Rate Risks
Interest rate volatility could significantly reduce our profitability.
Our earnings and cash flows are largely dependent upon net interest income. Net interest income is the difference between interest income earned on interest-bearing assets such as loans and securities and interest expense paid on interest-bearing liabilities such as deposits and borrowed funds. Interest rates are highly sensitive to many factors that are beyond our control, including general economic conditions, demand for loans, securities and deposits, policies of various governmental and regulatory agencies. Changes in monetary policy, including changes in interest rates, or the slope of the yield curve could influence not only the interest received on loans and securities and the amount of interest paid on deposits and borrowings, but such changes could also affect (i) the ability to originate loans and obtain deposits, (ii) the fair value of our financial assets and liabilities, and (iii) the average duration of loans and securities that are collateralized by mortgages. If the interest rates paid on deposits and other borrowings increase at a faster rate than the interest rates received on loans and other investments, net interest income, and therefore earnings, could be adversely affected. Earnings could also be adversely affected if the interest rates received on loans and other investments fall more quickly than the interest rates paid on deposits and other borrowings. If interest rates decline, higher-rate loans and investments may be subject to prepayment risk, which could negatively impact our net interest margin. Conversely, if interest rates increase, loans and investment securities may be subject to extension risk, which could negatively impact our net interest margin as well.
We are required to maintain sufficient capital and adequate liquidity.
As a banking organization, our capital and liquidity are subject to regulation and supervision by banking regulators. We are required to maintain minimum levels of capital. The proportion of the Bank’s deposit account balances that exceed FDIC insurance limits may expose the Bank to enhanced liquidity risk as it relates to maintaining such levels of capital as uninsured depositors historically have been more likely to withdraw their deposits. In addition, our banking regulators could require us to maintain more and higher quality capital than previously expected. Our banking regulators could also require us to hold higher levels of short-term investments, thereby limiting our ability to invest in longer-term or less liquid assets at higher yields. The need to maintain capital and liquidity could result in our being required to take steps to increase our regulatory capital and may dilute shareholder value or limit our ability to pay dividends or otherwise return capital to our investors through stock repurchases. In addition, if we fail to maintain appropriate levels of capital or liquidity, we could become subject to formal or informal enforcement actions that may impose restrictions on our business, including limiting our lending activities or our ability to expand, requiring us to raise additional capital (which may be dilutive to shareholders) or requiring regulatory approval to pay dividends or otherwise return capital to shareholders. See Item 1. “Business—Regulation and Supervision—Capital Adequacy and Prompt Corrective Action” for additional information on capital requirements applicable to us and the Bank.
23
The Company’s earnings may not grow if we are unable to successfully attract core deposits and lending opportunities and execute opportunities to generate fee-based income.
The Company has experienced growth, and our future business strategy is to continue to expand. Historically, the growth of our loans and deposits has been the principal factor in our increase in net-interest income. In the event that we are unable to execute our business strategy of continued growth in loans and deposits, our earnings could be adversely impacted. The Company’s ability to continue to grow depends, in part, upon our ability to expand our market share, to successfully attract core deposits and identify loan and investment opportunities, as well as opportunities to generate fee-based income. Our ability to manage growth successfully will also depend on whether we can continue to efficiently fund asset growth and maintain asset quality and cost controls, as well as on factors beyond our control, such as economic conditions and interest-rate trends.
Wholesale funding sources may prove insufficient to replace deposits, support operations and future growth.
We must maintain sufficient funds to respond to the needs of customers. To manage liquidity, we use a number of funding sources in addition to core deposit growth, loan repayments and maturities of loans and securities. These sources include FHLB and the Federal Reserve Bank (“FRB”) advances, proceeds from the sale of securities and loans and liquidity resources at the holding company. Our ability to manage liquidity will be severely constrained if unable to maintain access to funding or if adequate financing is not available to accommodate future growth at acceptable costs. In addition, if we need to rely heavily on more expensive funding sources to support future growth, revenues may not increase proportionately to cover costs. In this case, our operating margins and profitability would be adversely affected.
Loss of deposits or a change in deposit mix could increase our cost of funding.
Deposits are a low cost and stable source of funding. We compete with banks and other financial institutions for deposits. Funding costs may increase if deposits are lost and we are forced to replace them with more expensive sources of funding, if customers shift their deposits into higher cost products or if we need to raise interest rates to avoid losing deposits. Higher funding costs reduce our net interest income, net interest margin, and net income.
Our access to funds from subsidiaries may be restricted.
The Company is a separate and distinct legal entity from the Bank and its non-banking subsidiaries. The Company depends on dividends, distributions and other payments from its banking and non-banking subsidiaries to fund dividend payments on its common stock, debt service of subordinated borrowings, fund stock repurchase program and to fund strategic initiatives or other obligations. The Company’s subsidiaries are subject to laws that authorize regulatory bodies to block or reduce the flow of funds from those subsidiaries to the Company based on assertion that certain payments from subsidiaries are considered an unsafe or unsound practice, which could impede our access to funds that we may need to make payments on our obligations or dividend payments, if and when declared from time to time by our board of directors in its sole discretion out of funds legally available for that purpose.
Prepayments of loans may negatively impact our business as customers may prepay the principal amount of their outstanding loans at any time.
The speeds at which such prepayments occur, as well as the size of such prepayments, are within the customers’ discretion. Fluctuations in interest rates, in certain circumstances, may also lead to high levels of loan prepayments, which may also have an adverse impact on net interest income. If customers prepay the principal amount of their loans, and we are unable to lend those funds to other borrowers or invest the funds at the same or higher interest rates, interest income will be reduced. A significant reduction in interest income could have a negative impact on results of operations and financial condition.
Secondary mortgage market conditions may adversely affect financial condition and earnings.
The secondary mortgage markets are impacted by interest rates and investor demand for residential mortgage loans and increased investor yield requirements for these loans. These conditions may fluctuate in the future. As a result, a prolonged period of secondary market illiquidity may reduce our loan production volumes, change loan portfolio composition, and reduce operating results. Secondary markets are affected by Fannie Mae, Freddie Mac, and Ginny Mae for loan purchases that meet their conforming loan requirements. These agencies could limit purchases of conforming loans due to capital constraints, changes in conforming loan criteria or other factors. Proposals to reform mortgage finance could affect the role of these agencies and the market for conforming loans.
24
Operational Risks
We are subject to a variety of operational risks, including reputational risk, and the risk of fraud or theft by employees or outsiders, which may adversely affect our business and results of operations.
We are exposed to many types of operational risks, including reputational risk, legal and compliance risk, the risk of fraud or theft by employees or outsiders, and unauthorized transactions by employees or operational errors, including clerical or record-keeping errors or those resulting from faulty or disabled computer or telecommunications systems. If personal, non-public, confidential, or proprietary information of customers in our possession were to be mishandled or misused, we could suffer significant regulatory consequences, reputational damage, and financial loss.
Because the nature of the financial services business involves a high volume of transactions, certain errors may be repeated or compounded before they are discovered and successfully rectified. Our necessary dependence upon automated systems to record and process transactions and its large transaction volume may further increase the risk that technical flaws or employee tampering or manipulation of those systems will result in losses that are difficult to detect. We may also be subject to disruptions of our operating systems arising from events that are wholly or partially beyond its control (e.g., computer viruses or electrical or telecommunications outages, natural disaster, pandemics, or other damage to property or physical assets), which may give rise to disruption of service to customers and to financial loss or liability. We are further exposed to the risk that its external vendors may be unable to fulfill their contractual obligations (or will be subject to the same risk of fraud or operational errors by their respective employees) and to the risk that our vendors’ business continuity and data security systems prove to be inadequate. The occurrence of any of these risks could result in a diminished ability to operate (e.g., by requiring us to expend significant resources to correct the defect), as well as potential liability to customers, reputational damage, and regulatory intervention.
In addition, we are dependent on our reputation within our market area, as a trusted and responsible financial company, for all aspects of our relationships with customers, employees, vendors, third-party service providers and others with whom we conduct business or potential future business, particularly because our business is primarily concentrated in Northern New England. Our actual or perceived failure, including, to (i) identify and address potential conflicts of interest, ethical issues, money-laundering, or privacy issues; (ii) meet legal and regulatory requirements applicable to the Bank and to the Company; (iii) maintain the privacy of customer and accompanying personal information; (iv) maintain adequate record keeping; (v) engage in proper sales and trading practices; and (vi) identify the legal, reputational, credit, liquidity and market risks inherent in our products; or any action of one of our employees that results in actual or perceived misconduct or error, among other things, could give rise to reputational risk that could cause harm to the Bank and our business prospects. If we fail to address any of these issues in an appropriate manner, we could be subject to additional legal risks, which, in turn, could increase the size and number of litigation claims and damages asserted or subject us to enforcement actions, fines and penalties and cause us to incur related costs and expenses. Because we primarily serve individuals and businesses located in Northern New England, any negative impact resulting from reputational harm, including any impact on our ability to attract and retain customers and employees, likely would be greater than if our business were more geographically diverse.
Disruptions to our information systems and security breaches may adversely affect our business and reputation.
In the ordinary course of business, we rely on electronic communications and information systems to conduct its businesses and to store sensitive data, including financial information regarding its customers. The integrity of information systems is under significant threat from cyberattacks by third parties, including through coordinated attacks sponsored by foreign nations and criminal organizations to disrupt business operations and other compromises to data and systems for political or criminal purposes. We employ an in-depth, layered, defense approach that leverages people, processes and technology to manage and maintain cybersecurity controls. Notwithstanding the strength of defensive measures, the threat from cyberattacks is severe, attacks are sophisticated and attackers respond rapidly to changes in defensive measures. Cybersecurity risks may also occur with our third-party service providers, and may interfere with their ability to fulfill their contractual obligations to us, with additional potential for financial loss or liability that could adversely affect our financial condition or results of operations. We offer our customers the ability to bank remotely and provide other technology-based products and services, which services include the secure transmission of confidential information over the Internet and other remote channels. To the extent that our customers’ systems are not secure or are otherwise compromised, its network could be vulnerable to unauthorized access, malicious software, phishing schemes and other security breaches. To the extent that our activities or the activities of its customers or third-party service providers involve
25
the storage and transmission of confidential information, security breaches and malicious software could expose us to claims, regulatory scrutiny, litigation and other possible liabilities.
Information security risks have generally increased in recent years, and continue to increase, in part because of the proliferation of new technologies, the implementation of work-from-home arrangements, the use of the Internet and telecommunications technologies to conduct financial transactions, and the increased sophistication and activities of organized crime, hackers, terrorists, activists, and other external parties, some of which may be linked to terrorist organizations or hostile foreign governments. As cyber threats continue to evolve, we may be required to expend significant additional resources to continue to modify or enhance our systems or to investigate and remediate vulnerabilities. System enhancements and updates may also create risks associated with implementing and integrating new systems. Due to the complexity and interconnectedness of information technology systems, the process of enhancing our systems can itself create a risk of systems disruptions and security issues.
While to date we believe that we have not experienced a significant compromise, significant data loss or material financial losses related to cybersecurity attacks, our systems and those of our customers and third-party service providers, are under constant threat and may experience a significant event in the future. We may suffer material financial losses related to these risks or be subject to liability for compromises to its customers or third-party providers. Any such losses or liabilities could adversely affect our financial condition or results of operations, and could expose us to reputation risk, the loss of client business, increased operational costs, as well as additional regulatory scrutiny, possible litigation, and related financial liability. These risks also include possible business interruption, including the inability to access critical information and systems.
We have a continuing need for technological change, and we may not have the resources to implement new technology effectively, or we may experience operational challenges when implementing new technology or technology needed to compete effectively with larger institutions may not be available to us on a cost-effective basis.
The financial services industry undergoes rapid technological changes with frequent introductions of new technology-driven products and services, including developments in telecommunications, data processing, automation, internet-based banking, debit cards and so-called “smart cards” and remote deposit capture. In addition to serving clients better, the effective use of technology increases efficiency and enables financial institutions to reduce costs. Our future success will depend, at least in part, upon our ability to address the needs of our clients by using technology to provide products and services that will satisfy client demands for convenience, as well as to create additional efficiencies in our operations as we continue to grow and expand our products and service offerings. We offer electronic banking services for consumer and business customers via our website, including Internet banking and electronic bill payment, as well as mobile banking. We also offer debit cards, ATM cards, and automatic and ACH transfers. We may experience operational challenges as we implement these new technology enhancements or products, which could impair our ability to realize the anticipated benefits from such new technology or require us to incur significant costs to remedy any such challenges in a timely manner.
Many of our larger competitors have substantially greater resources to invest in technological improvements. Third parties upon which we rely for our technology needs may not be able to develop on a cost-effective basis the systems that will enable us to keep pace with such developments. As a result, competitors may be able to offer additional or superior products compared to those that we will be able to provide, which would put us at a competitive disadvantage. We may lose clients seeking new technology-driven products and services to the extent we are unable to provide such products and services. Accordingly, the ability to keep pace with technological change is important and the failure to do so could adversely affect our business, financial condition and results of operations.
Our operations are reliant on outside vendors.
Our operations are dependent on the use of certain outside vendors for its day-to-day operations. Vendors may not perform in accordance with established performance standards required in their agreements for any number of reasons including a change in the vendor’s senior management, financial condition, product line or mix and how they support existing customers, or simply change their strategic focus putting us at risk. While we have comprehensive policies and procedures in place to mitigate risk in all phases of vendor management from selection to performance monitoring, the failure of a vendor to perform in accordance with contractual agreements could be disruptive to our business, which could have a material adverse effect on our financial condition and results of operations.
26
We may be adversely affected by the soundness of other financial institutions.
Our ability to engage in routine funding transactions could be adversely affected by the actions and commercial soundness of other financial institutions. Bank and non-bank financial services companies are interrelated as a result of trading, clearing, counterparty and other relationships. Further, when volatility, market events or similar issues affect a subset of financial institutions, or when there are news reports or high-profile incidents relating to trends, concerns, and other issues in the banking industry, the ramifications can affect the sector as a whole, regardless of the effect, or lack thereof, on any specific institution. We have exposure to different industries and counterparties through transactions with counterparties in the bank and non-bank financial services industries, including brokers and dealers, commercial banks, investment banks and other institutional clients. As a result, defaults by, or even rumors or questions about, one or more bank or non-bank financial services companies, or the bank or non-bank financial services industries generally, have led to market-wide liquidity problems and could lead to losses or defaults by us or by other institutions. Future events of this nature could have an adverse effect on our business, financial condition and results of operations.
Changes in the federal, state or local tax laws may negatively impact our financial performance and we are subject to examinations and challenges by tax authorities.
We are subject to federal and applicable state tax laws and regulations. Changes in these tax laws and regulations, some of which may be retroactive to previous periods, could increase our effective tax rates and, as a result, could negatively affect our current and future financial performance. Furthermore, tax laws and regulations are often complex and require interpretation. In the normal course of business, we are routinely subject to examinations and challenges from federal and applicable state tax authorities regarding the amount of taxes due in connection with investments we have made and the businesses in which we have engaged. Recently, federal and state taxing authorities have become increasingly aggressive in challenging tax positions taken by financial institutions. These tax positions may relate to tax compliance, sales and use, franchise, gross receipts, payroll, property and income tax issues, including tax base, apportionment and tax credit planning. The challenges made by tax authorities may result in adjustments to the timing or amount of taxable income or deductions or the allocation of income among tax jurisdictions. If any such challenges are made and are not resolved in our favor, they could have a material adverse effect on our business, financial condition and results of operations.
The performance of our investment securities portfolio is subject to fluctuation due to changes in interest rates and market conditions, including credit deterioration of the issuers of individual securities.
Changes in interest rates can negatively affect the performance of most of our investment securities. Interest rate volatility can reduce unrealized gains or increase unrealized losses in our portfolio, as was the case in 2023 with the rising rate environment. Interest rates are highly sensitive to many factors including monetary policies, domestic and international economic, social and political conditions and issues, including trade disputes, global health pandemics, and other factors beyond our control. Fluctuations in interest rates can materially affect both the returns on and market value of our investment securities.
In addition, from time to time we may restructure portions of our investment securities portfolio as part of our asset liability management strategies or in response to liquidity needs, and we may incur losses, which may be material, in connection with any such restructuring. If we were to sell any of these securities before their value recovers, including as a result of asset liability management strategies or in response to liquidity needs, we would be required to recognize these losses and the recognition of those losses could materially and adversely affect our results of operations, capital and financial.
Impairment of investment securities or goodwill could result in a negative impact on our results of operations.
In assessing whether the impairment of securities is related to a deterioration in credit factors, we consider the length of time and extent to which the fair value has been less than cost, the financial condition and near-term prospects of the issuer, and the intent and ability to retain the securities for a period of time sufficient to allow for any anticipated recovery in fair value in the near term.
Under current accounting standards, goodwill is not amortized but, instead, is subject to impairment tests on at least an annual basis or more frequently if an event occurs or circumstances change that reduce the fair value of a reporting unit below its carrying amount. A decline in our stock price or occurrence of a triggering event following any of its quarterly earnings releases and prior to the filing of the periodic report for that period could, under certain circumstances, require performance of a goodwill impairment test and result in an impairment charge being recorded for that period which was not reflected in such earnings release. During 2023, our annual impairment test conducted in October, using discounted
27
cash flows and market-based approaches, indicated that the estimated fair value of our sole reporting unit “Bar Harbor Bank & Trust” exceeded the carrying value. In a future assessment, we could conclude that all or a portion of our goodwill is impaired, which would result in a non-cash charge to earnings.
Revenues from our wealth management business are significant to earnings.
Generating returns that satisfy customers in a variety of asset classes is important to maintaining existing business and attracting new business. Administering or managing assets in accordance with the terms of governing documents and applicable laws is also important to client satisfaction. Failure in either of the foregoing areas can expose us to liability, and result in a decrease in revenues and earnings.
Our wealth management business may be negatively affected by changes in economic and market conditions.
A decline in economic conditions, such as recession, economic downturn, and/or inflationary conditions, changes in domestic and foreign economic conditions, volatility in financial markets, and general trends in business and finance, all of which are beyond our control, could adversely impact the market value of wealth management AUM, which are primarily marketable securities, and the fee revenues derived from the management of these assets.
Strategic and External Risks
Changes and instability in economic conditions, geopolitical matters and financial markets, including a contraction of economic activity, could adversely impact our business, results of operations and financial condition.
Our success depends, to a certain extent, upon global, domestic and local economic and political conditions, as well as governmental monetary policies. Conditions such as changes in interest rates, money supply, levels of employment and other factors beyond our control may have a negative impact on economic activity. Any contraction of economic activity, including an economic recession, may adversely affect our asset quality, deposit levels and loan demand and, therefore, our earnings. In particular, interest rates are highly sensitive to many factors that are beyond our control, including global, domestic and local economic conditions and the policies of various governmental and regulatory agencies and, specifically, the FRB. Throughout 2023 the Federal Open Market Committee (“FOMC”) raised the target range for the Federal funds rate on four separate occasions and-citing factors including the hardships caused by the ongoing Russia-Ukraine conflict, an economic slowdown in China, continued global supply chain disruptions and imbalances, and increased inflationary pressure-the FOMC has indicated that ongoing increases may be appropriate.
The tightening of the FRB's monetary policies, including repeated and aggressive increases in the target range for the Federal funds rate as well as the conclusion of the FRB's tapering of asset purchases, together with ongoing economic and geopolitical instability, increases the risk of an economic recession. Although forecasts have varied, many economists are projecting that U.S. economic growth will slow and inflation will remain elevated in the coming quarters, potentially resulting in a contraction of U.S. gross domestic output in 2024. Any such downturn, especially domestically and in the regions in which we operate, may adversely affect our asset quality, deposit levels, loan demand and results of operations.
As a result of the economic and geopolitical factors discussed above, financial institutions also face heightened credit risk, among other forms of risk. Of note, because we have a significant amount of real estate loans, decreases in real estate values could adversely affect the value of property used as collateral, which, in turn, can adversely affect the value of our loan and investment portfolios. Adverse economic developments, specifically including inflation-related impacts, may have a negative effect on the ability of our borrowers to make timely repayments of their loans or to finance future home purchases. Moreover, while certain commercial real estate values have stabilized as demand has returned to pre-pandemic levels in several markets; the post-pandemic outlook for commercial real estate demand remains dependent on the broader economic environment and, specifically, how major subsectors respond to a rising interest rate environment, the reduction of office utilization due to the impact of hybrid working patterns, greater flexibility for work location, and higher prices for commodities, goods and services. In each case, credit performance over the medium- and long-term is susceptible to economic and market forces and therefore forecasts remain uncertain. Instability and uncertainty in the commercial and residential real estate markets, including headwinds for mortgage rates, lease rates and landlord cash flows, as well as in the broader commercial and retail credit markets, could have a material adverse effect on our financial condition and results of operations.
28
Monetary policy and economic environment could impact our financial performance.
Our earnings are significantly affected by the monetary and fiscal policies of governmental authorities, including the Federal Reserve Board. Among the instruments of monetary policy used by the Federal Reserve Board to implement these objectives are open-market operations in U.S. Government securities and federal funds, changes in the discount rate on member bank borrowings, and changes in reserve requirements against member bank deposits. These instruments of monetary policy are used in varying combinations to influence the overall level of bank loans, investments, and deposits, and the interest rates charged on loans and paid for deposits. The Federal Reserve Board frequently uses these instruments of monetary policy, especially its open-market operations and the discount rate, to influence the level of interest rates, thereby affecting the strength of the economy, the level of inflation, or the price of the dollar in foreign exchange markets. The monetary policies of the Federal Reserve Board have had a significant effect on the operating results of banking institutions in the past and are expected to continue to do so in the future. It is not possible to predict the nature of future changes in monetary and fiscal policies, or the effect which they may have on our business and earnings.
Involvement in wealth management creates risks associated with the industry.
Our wealth management operations present special risks not borne by institutions that focus exclusively on other traditional retail and commercial banking products. For example, the investment advisory industry is subject to fluctuations in the stock market and interest rate volatility that may have a significant adverse effect on transaction fees, client activity and client investment portfolio gains and losses. Also, additional or modified regulations may adversely affect our wealth management operations. In addition, our wealth management operations, are dependent on a small number of established financial advisors, whose departure could result in the loss of a significant number of client accounts. A significant decline in fees and commissions or trading losses suffered in the investment portfolio could adversely affect our income and potentially require the contribution of additional capital to support our operations.
Strong competition within our markets may significantly impact profitability.
We compete with an ever-increasing array of financial service providers. See the section entitled “Competition” in Part I. Item 1, “Business” of this Annual Report for additional competitor information. Competition from nationwide banks, as well as local institutions, continues to mount in our markets. To compete, we focus on quality customer service, making decisions at the local level, maintaining long-term customer relationships, building customer loyalty, and providing products and services designed to address the specific needs of customers. Failure to perform in any of these areas could significantly weaken our competitive position, which could adversely affect growth and profitability.
Market changes may adversely affect demand for our services and impact revenue, costs, and earnings.
Channels for servicing our customers are evolving rapidly, with less reliance on traditional branch facilities, increased use of e-commerce channels, and demand for universal bankers and other relationship managers who can service multiple product lines. We have an ongoing process for evaluating the profitability of its branch system and other office and operational facilities. The identification of unprofitable operations and facilities can lead to restructuring charges and introduce the risk of disruptions to revenues and customer relationships. We compete with larger financial institutions who are rapidly evolving their service channels and escalating the costs of evolving the service process.
Our business is concentrated in and largely dependent upon the continued growth and welfare of the general geographic markets in which we operate.
Our operations are concentrated in Northern New England (and in particular, Maine, New Hampshire and Vermont). As a result, the Company's financial condition, results of operations and cash flows are significantly impacted by changes in the economic conditions in those areas. Therefore, the Company’s financial performance generally, and in particular, the ability of borrowers to pay interest on and repay the principal of outstanding loans and the value of collateral securing these loans, is highly dependent upon the business environment in the markets where the Company operates. The Company's success depends to a significant extent upon the business activity, population, income levels, deposits and real estate activity in these markets. Although the Company's clients’ business and financial interests may extend well beyond these markets, adverse economic conditions that affect these markets could disproportionately reduce the Company's growth rate, affect the ability of the Company's clients to repay their loans to the Company, affect the value of collateral underlying loans and generally affect the Company's financial condition and results of operations. Because of the Company's geographic concentration, we are less able than other regional or national financial institutions to diversify our credit risks across multiple markets. For additional information on the Company's market area, see Part I, Item 1, "Business" of this Annual Report.
29
Expansion, growth, and acquisitions could negatively impact earnings if not successful.
We may grow organically both by geographic expansion and through business line expansion, as well as through acquisitions. Success of these activities depends on our ability to continue to maintain and develop an infrastructure appropriate to support and integrate such growth. Success may also depend on acceptance of the Bank by customers in these new markets and, in the case of expansion through acquisitions, these factors include the long-term recruitment and retention of key personnel and acquired customer relationships. Profitability depends on whether the marginal revenue generated in the new markets will offset the increased expenses of operating a larger entity, with more staff, more locations, and more product offerings. Failure to achieve any of these success factors may have a negative impact on our financial condition and results of operations.
We may be adversely affected by continuous technological change.
The financial services industry is continually undergoing rapid technological change with frequent introductions of new technology-driven products and services. The effective use of technology increases efficiency and enables financial institutions to better serve customers and to reduce costs. Our future success depends, in part, upon its ability to address the needs of customers by using technology to provide products and services that will satisfy customer demands, as well as to create additional operational efficiencies.
The introduction of new products and services can entail significant time and resources. Our failure to manage risks and uncertainties associated with new products and services exposes us to enhanced risk of operational lapses which may result in the recognition of financial statement liabilities. Regulatory and internal control requirements, capital requirements, competitive alternatives, vendor relationships and shifting market preferences may also determine if such initiatives can be brought to market in a manner that is timely and attractive to our customers. Products and services relying on internet and mobile technologies may expose us to fraud and cybersecurity risks. Failure to successfully manage these risks in the development and implementation of new products or services could have a material adverse effect on our business and reputation.
Societal responses to climate change could adversely affect our business and performance, including indirectly through impacts on our customers.
Concerns over the long-term impacts of climate change have led and will continue to lead to governmental efforts around the world to mitigate those impacts. Consumers and businesses also may change their behavior on their own as a result of these concerns. Our company and customers will need to respond to new laws and regulations as well as consumer and business preferences resulting from climate change concerns. Our company and customers may face cost increases, asset value reductions and operating process changes, among other impacts. The impact on our customers will likely vary depending on their specific attributes. In addition, we could face reductions in creditworthiness on the part of some customers or in the value of assets securing loans. Our efforts to take these risks into account in making lending and other decisions may not be effective in protecting us from the negative impact of new laws and regulations or changes in consumer or business behavior.
Factors associated with global climate change, including evolving and increasing regulations, increasing global concern and stakeholder scrutiny about climate change and extreme weather conditions could adversely affect our business, reputation, results of operations and financial position.
There has been an increased focus from regulators and stakeholders on environmental, social, and governance (“ESG”) matters. Our failure or perceived failure to achieve our ESG goals, maintain ESG practices, or comply with emerging ESG regulations that meet evolving regulatory or stakeholder expectations could adversely affect public perception of our business, employee morale or patient or stakeholder support, expend corporate resources, result in substantial costs and expenses, result in legal or regulatory proceedings against the Company and negatively impact our financial condition and results of operations. Damage to our reputation may reduce demand for our services and thus have an adverse effect on our future financial performance, as well as require additional resources to rebuild our reputation.
Global climate change also presents both immediate and long-term physical risks (such as extreme weather conditions) and risks associated with the transition to a low-carbon economy (such as regulatory or technology changes). These changes could result in, for example, closures of our banking offices and other facilities, and supply chain disruptions, as well as increased costs of products, commodities and energy (including utilities), and disruptions in our information systems, which in turn could negatively impact our business and results of operations. In addition, certain of our operations
30
and facilities are located in regions that may be disproportionately impacted by the physical risks of climate change (including hurricanes and flooding), and we face the risk of losses incurred as a result of physical damage to our facilities and business interruptions caused by such events. We maintain property insurance coverage to address the impact of physical damage to our facilities and for business interruption losses. However, such insurance coverage may be insufficient to cover all losses and we may experience a material, adverse effect on our results of operations that is not recoverable through our insurance policies. Additionally, if we experience a significant increase in climate-related events that result in material losses we may be unable to obtain similar levels of property insurance coverage in the future or at rates that are significantly higher than our current rates. Changes in consumer preferences and additional legislation and regulatory requirements, including those associated with the transition to a low-carbon economy, may increase costs associated with compliance, the operation of our facilities and supplies. Regulations limiting greenhouse gas emissions and energy inputs may also increase in coming years, which may adversely impact us through increased compliance costs for us and our suppliers and vendors.
Pandemics, severe weather, natural disasters, acts of war or terrorism, and other external events could significantly impact our business and the business of our customers.
Pandemics, including the continuing COVID-19 pandemic, severe weather, natural disasters, acts of war or terrorism, and other adverse external events could have a significant impact on our ability to conduct business. Such events could affect the stability of borrowers to repay outstanding loans, impair the value of collateral securing loans, cause significant property damage, result in loss of revenue and/or cause us to incur additional expenses. In particular, such events may have a particularly negative impact upon the business of customers who are engaged in the hospitality industry in our markets, which could have a direct negative impact on our business and results of operations. Further, work-from-home and other modified business practices may introduce additional operational risks, including cybersecurity and execution risks, which may result in inefficiencies or delays, and may affect our ability to, or the manner in which we, conduct our business activities.
Legal, Regulatory and Compliance Risks
We are subject to extensive government regulation and supervision, which may interfere with the ability to conduct business and may negatively impact our financial results.
Banking regulations are primarily intended to protect depositors’ funds, the Federal Deposit Insurance Fund and the safety and soundness of the banking system as a whole, not shareholders. These regulations affect our lending practices, capital structure, investment practices, dividend policy and growth, among other things. Congress and federal regulatory agencies continually review banking laws, regulations and policies for possible changes. Changes to statutes, regulations or regulatory policies, including changes in interpretation or implementation of statutes, regulations or policies, could affect us in substantial and unpredictable ways. Such changes could subject us to additional costs, limit the types of financial services and products we can offer, and/or limit the pricing we can charge on certain banking services, among other things. Compliance personnel and resources may increase costs of operations and adversely impact earnings.
We are subject to possible claims and litigation pertaining to fiduciary responsibilities.
From time to time, customers make claims and take legal action pertaining to our performance of fiduciary responsibilities. Whether customer claims and legal action related to our performance of fiduciary responsibilities are founded or unfounded, if such claims and legal actions are not resolved in a favorable manner, they may result in significant financial liability and/or adversely affect the market perception of us and products and services as well as impact customer demand for our products and services.
Failure to comply with laws, regulations or policies could result in sanctions by regulatory agencies, civil money penalties and/or reputation damage, which could have a material adverse effect on our business, financial condition and results of operations. While we have policies and procedures designed to prevent any such violations, there can be no assurance that such violations will not occur.
Fee revenues from overdraft protection programs constitute a significant portion of our noninterest income and may be subject to increased supervisory scrutiny.
Revenues derived from transaction fees associated with overdraft protection programs offered to our customers represent a significant portion of its noninterest income. In response to recent increased congressional and regulatory scrutiny, and
31
in anticipation of enhanced supervision and enforcement of overdraft protection practices in the future, certain banking organizations have begun to modify their overdraft protection programs, including by discontinuing the imposition of overdraft transaction fees. These competitive pressures, as well as any adoption by the Bank’s regulators of new rules or supervisory guidance or more aggressive examination and enforcement policies in respect of banks' overdraft protection practices, could cause it to modify programs and practices in ways that may have a negative impact on revenue and our earnings.
General Risk Factors
Changes in accounting policies or in accounting standards could materially affect our results of operations, and financial condition.
Accounting policies are fundamental to understanding our results of operations, and financial condition. Some of the accounting policies are critical because they require us to make difficult, subjective and complex judgments about matters that are inherently uncertain and because it is likely that materially different amounts would be reported under different conditions or using different assumptions. We may experience material losses if such estimates or assumptions underlying in our financial statements are incorrect.
From time to time, the FASB and the SEC change the financial accounting and reporting standards or the interpretation of those standards that govern the preparation of our external financial statements. These changes could materially impact how we report our results of operations and financial condition. New or revised standards could also require retroactive application, which could result in the restatement of our prior period financial statements in material amounts.
Internal controls may become ineffective in preventing or detecting material errors.
We regularly review and update our internal controls, disclosure controls and procedures, and corporate governance policies and procedures. Any system of controls, however well designed and operated, is based in part on certain assumptions and can provide only reasonable, not absolute, assurances that the objectives of the controls are met. Any failure or circumvention of our controls and procedures or failure to comply with regulations related to controls and procedures could have a material adverse effect on our business, results of operations, and financial condition.
We may be unable to attract and retain key personnel.
Our success depends, in large part, on its ability to attract and retain key personnel. Competition for qualified personnel in the financial services industry can be intense and we may not be able to hire or retain the key personnel. In addition, the Bank’s rural geographic marketplace, combined with relatively expensive real estate purchase prices in the many tourist communities we serve, create additional risks for the our ability to attract and retain key personnel. The unexpected loss of key personnel could have an adverse impact on our business because of their skills, knowledge of the markets in which we operate, years of industry experience and the difficulty of promptly finding qualified replacement personnel.
ITEM 1B. UNRESOLVED STAFF COMMENTS.
None.
ITEM 1C. CYBERSECURITY
Cybersecurity threats pose a risk to the Company as crimes committed through or involving the internet. Examples of those threats are malware, phishing, hacking, denial of service attacks, stealing information, unauthorized intrusions into internal systems or the systems of third-party vendors that could adversely impact operations or damage reputations.
We utilize third party service providers to support and facilitate business and operational activities to achieve strategic goals. However, third parties may expose us and our customers to various risks. We have implemented a Vendor Risk Management (“VRM”) framework, which provides the tools and practices utilized in the oversight of third-party service providers, with an objective to meet legal and regulatory obligations, contractual requirements, performance expectations,
32
and our own principles and values. For the 2023 period, there were no material incidents affecting the VRM framework or controls.
We have developed cybersecurity and data privacy programs designed to enable and safeguard the confidentiality, integrity and availability of our information systems and data by providing proactive security expertise and risk assessments, creating and maintaining a resilient and secure environment, and fostering a culture of security awareness and compliance throughout our organization. We maintain a robust Information Security Program that sets forth our commitment to the continual review and improvement of policies, processes, procedures, and standards for evaluating electronic and physical methods of accessing, collecting, storing, using, transmitting, disposing, and protecting sensitive information, including customer information under guidelines established as part of the Gramm Leach-Bliley Act (GLBA).
The Bank manages cybersecurity threats proactively and maintains robust controls to protect its critical systems and data by investing in secure, reliable and resilient technology infrastructure, fostering a culture of technology risk awareness and continuously improving its technology risk management practices. Our process for monitoring and mitigating cybersecurity risk is designed in conjunction with our overall Risk Management Policy and Information Security Program. One of the key aspects of these programs are various risk assessments that are used to identify industry and company-specific risks, measure control effectiveness, identify any gaps that need to be addressed, and linking our controls with applicable policies, standards and guidelines to ensure that responsible parties are aware of their obligations with respect to this program. Annually, we engage a third party to perform penetration testing and ongoing analysis to identify potential vulnerabilities and areas for additional enhancements as well as a full-scope independent audit of IT and Information Security processes.
All of our employees also have a responsibility to protect the privacy of Company and Bank confidential and proprietary information. They are required to undergo periodic information security awareness training to ensure a clear understanding of their roles in protecting information assets and to create a security-minded culture. Additionally, the Company carries out regular phishing simulation tests throughout the year to keep employees alert, spread awareness and ensure that employees have the knowledge and resources necessary to report suspicious activity.
The management of cybersecurity risks is ultimately the responsibility of Company management and is governed by the Board. They devote significant time and attention to the oversight of cybersecurity and information security risks. The Board through its BRC reviews monthly information technology and Information Security and Vendor Management reports that highlight key areas of focus and risk. The Board also reviews and approves the Information Security Program, the central program outlining cyber-security processes and controls annually and frequently receives presentations on and discusses cybersecurity and information security risks, industry trends and best practices.
We are subject to extensive federal and state regulation of customer privacy and the security of financial information. Our federal regulator, the FDIC, is part of the Federal Financial Institutions Examination Council (FFIEC), which publishes extensive guidelines and examination procedures that are used to review the security of financial institutions.
To date, we have not experienced a cybersecurity incident or data breach that has materially affected us or our business strategy, results of operations, or financial condition.
33
ITEM 2. PROPERTIES
Our principal executive office is in a building located at 82 Main Street, Bar Harbor, Maine. We provide full-banking services at 53 locations throughout Maine, New Hampshire and Vermont, of which 34 are owned and 19 are leased. We also have one stand-alone drive-up window in Vermont. In addition to banking offices, we also have Operations Centers located in Ellsworth, Maine, and Newport, New Hampshire that house our operations and data processing centers. We have leased spaces in Hampden, Maine, Portland, Maine, Rockland, Maine and Manchester, New Hampshire where back office support for multiple lines of business and related functions are located. Additionally, we own a Wealth Management office located in Concord, New Hampshire. In the opinion of management, our physical properties are considered adequate to meet the needs of customers in the communities served.
ITEM 3. LEGAL PROCEEDINGS
We are from time to time subject to claims and litigation arising in the ordinary course of business. These claims and litigation may include, among other things, allegations of violation of banking and other applicable regulations, competition laws, labor laws and consumer protection laws, as well as claims or litigation relating to intellectual property, securities, breach of contract and tort. We intend to defend ourselves vigorously against any pending or future claims and litigation.
At this time, in the opinion of management, the likelihood is remote that the impact of such proceedings, either individually or in the aggregate, would have a material adverse effect on our consolidated results of operations, financial condition or cash flows. However, one or more unfavorable outcomes in any claim or litigation against us could have a material adverse effect for the period in which they are resolved. In addition, regardless of their merits or their ultimate outcomes, such matters are costly, divert management’s attention and may materially adversely affect our reputation, even if resolved in our favor.
Item 4. Mine Safety Disclosures.
Not applicable.
34
PART II
ITEM 5. MARKET FOR REGISTRANT’S COMMON EQUITY, RELATED STOCKHOLDER MATTERS AND ISSUER PURCHASES OF EQUITY SECURITIES
Market Information
The common stock of the Company is traded on the NYSE American, under the trading symbol “BHB”. As of March 7, 2024, there were 15,185,021 shares of Bar Harbor Bankshares common stock, par value $2.00 per share, outstanding and approximately 1,375 shareholders of record, as obtained through the Company’s transfer agent.
Cash dividends declared and paid totaled $0.28 per share in the second, third and fourth quarters of 2023 and $0.26 per share in the first quarter of 2023. We currently expect that comparable cash dividends will continue to be paid in the future. However, no assurances can be given that any dividends will be declared or paid on the Company’s common stock in the future, or, if declared and paid, the amount or frequency of those dividends. The ability of the Company and the Bank to pay dividends is restricted by certain laws and regulations, and the payment of dividends by the Company and the Bank is within the discretion of their respective boards of directors.
Recent Sale of Unregistered Securities and Use of Proceeds from Registered Securities
No unregistered equity securities were sold by the Company during the year ended December 31, 2023.
On May 22, 2023, the Board approved a 12-month plan to repurchase up to 5% of the Company’s outstanding shares of common stock, representing 756,000 shares. No shares were repurchased by the Company during the year ended December 31, 2023 and the maximum number of shares that may yet be purchased under the plan is 756,000 shares.
35
Common Stock Performance Graph
The following graph illustrates the estimated yearly change in value of the cumulative total shareholder return on our common stock for each of the last five years. Total shareholder return is computed by taking the difference between the ending price of the common stock at the end of the previous year and the current year, plus any dividends paid divided by the ending price of the common stock at the end of the previous year. For purposes of comparison, the graph also matches our cumulative 5-Year total shareholder return on common stock with the cumulative total returns of the NYSE American Composite Index, and the S&P U.S. SmallCap Banks Index. The graph tracks the performance of a $100 investment in our common stock and in each index (with the reinvestment of all dividends) from December 31, 2018 to December 31, 2023.
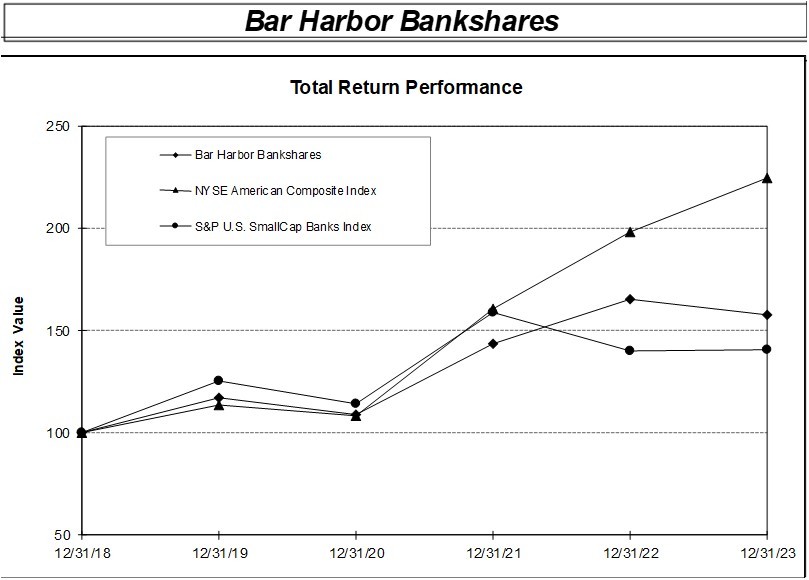
Period Ending | ||||||||||||
Index |
| 12/31/18 |
| 12/31/19 |
| 12/30/20 |
| 12/31/21 |
| 12/31/22 |
| 12/31/23 |
Bar Harbor Bankshares | 100.00 | 117.15 | 108.68 | 143.81 | 165.04 | 157.69 | ||||||
NYSE American Composite Index |
| 100.00 |
| 113.72 |
| 108.34 |
| 160.76 |
| 197.94 |
| 224.59 |
S&P U.S. SmallCap Banks Index |
| 100.00 |
| 125.46 |
| 113.94 |
| 158.62 |
| 139.85 |
| 140.55 |
36
ITEM 6. [RESERVED]
Not applicable.
ITEM 7. MANAGEMENT’S DISCUSSION AND ANALYSIS OF FINANCIAL CONDITION AND RESULTS OF OPERATIONS
The following discussion is management's analysis to assist in the understanding and evaluation of the consolidated financial condition and results of operations of the Company. It should be read in conjunction with the consolidated financial statements and footnotes and selected financial data presented elsewhere in this Annual Report. Within the tables presented, certain columns and rows may not sum due to the use of rounded numbers for disclosure purposes. The detailed financial discussion that follows focuses on 2023 results compared to 2022. For a discussion of 2022 results compared to 2021, see the Company's Annual Report on Form 10-K for the year ended December 31, 2022.
GENERAL
The Company is a bank holding company headquartered in Maine, providing a broad array of banking and nonbanking products and services to businesses and consumers primarily within our three-state footprint. The Company's primary sources of revenue, through the Bank, are net interest income (predominantly from loans and investment securities) and noninterest income (principally fees and other revenue from financial services provided to customers or ancillary services tied to loans and deposits).
ANNUAL PERFORMANCE SUMMARY
Earnings (For year ended December 31, 2023 compared to the same period of 2022)
| ● | Net income was $44.9 million compared to $43.6, an increase of 3%, driven primarily due to a benefit to net interest income as our assets repriced to higher rates. Diluted earnings per share was $2.95, an increase of $0.07 or 2%. |
| ● | Return on assets was 1.14% compared to 1.16%. Return on equity was 10.88% compared to 10.91%. Both ratios include higher borrowing costs and lower unrealized losses on securities as noted below under the “Financial Position” section. |
| ● | Net interest income was $117.7 million, an increase of 4%. Net interest margin was 3.29%, a decrease of 7 basis points from the same period in 2022. The decrease is primarily due to the repricing of variable rate assets and continued loan growth offset by higher borrowing costs and cost of interest-bearing liabilities. |
| ● | The provision for credit losses was an expense of $2.9 million in both 2023 and 2022. |
| ● | Non-interest income was $35.8 million, compared to $35.3 million primarily due to $699 thousand higher bank-owned life insurance (“BOLI”) income related to one-time death benefits during the first quarter of 2023. |
| ● | Non-interest expense was $93.5 million versus $91.3 million. Salaries and benefits expense increased $3.9 million to $52.5 million in 2023 due to revaluation of post-retirement plan liabilities, higher stock compensation expense and decrease in deferred loan origination costs. |
| ● | Efficiency ratio improved to 58.7% in 2023 from 59.3% in 2022. |
Financial Position (For year ended December 31, 2023 compared to the same period of 2022)
| ● | Total assets increased $61.1 million to $4.0 billion mainly due to loan growth offset by available for sale security pay-downs. |
37
| ● | Cash and cash equivalents increased to $94.8 million, from $92.3 million primarily due to excess cash available generated from operations. |
| ● | Total securities were $547.4 million, or 14% of total assets, compared to $574.4 million, or 15% of total assets. Net unrealized losses were $62.4 million, or 11% of gross securities, compared with a gain of $71.8 million, or 12% of gross securities. All securities are classified as available for sale preserving capital flexibility. |
| ● | Total loans grew 3% year-over-year as commercial loans increased 6%. The increase was the net result of the strategy to grow commercial construction and commercial real estate owner-occupied segments. |
| ● | The ratio of the allowance for credit losses to total loans was 0.94%, increasing from 0.89%, reflecting more refined economic forecasting, especially in the national unemployment figures, increase in specific reserves, and loan portfolio growth. Net charge-offs increased to $590 thousand in 2023 compared to a net recovery of $238 thousand in 2022 primarily driven by one non-accrual commercial and industrial (“C&I loan”). |
| ● | Deposit balances increased 3% year-over-year due to consumer’s migration to brokerage accounts and higher yielding time deposits and an increase in brokered deposits. |
| ● | Borrowings decreased to $331.5 million from $394.3 million primarily due to excess cash available generated from operations. |
| ● | Total book value per share was $28.48 compared to $26.09. Net unrealized security losses reduced book value per share by $3.14. Tangible book value per share excluding net unrealized security losses (non-GAAP) increased 9% on an annualized basis on net income offset by dividends to shareholders. |
38
SELECTED FINANCIAL DATA
At or For the Years Ended December 31, | |||||||||
(in millions, except ratios and share data) |
| 2023 |
| 2022 |
| 2021 | |||
Financial Condition Data: | |||||||||
Total assets | $ | 3,971 | $ | 3,910 | $ | 3,709 | |||
Total earning assets(1) |
| 3,664 |
| 3,601 |
| 3,377 | |||
Total investments |
| 547 |
| 574 |
| 626 | |||
Total loans |
| 2,999 |
| 2,903 |
| 2,532 | |||
Allowance for credit losses |
| 28 |
| 26 |
| 23 | |||
Total goodwill and intangible assets |
| 124 |
| 125 |
| 126 | |||
Total deposits |
| 3,141 |
| 3,043 |
| 3,049 | |||
Total borrowings |
| 332 |
| 394 |
| 179 | |||
Total shareholders' equity |
| 432 |
| 393 |
| 424 | |||
Operating Data: |
|
|
|
|
|
| |||
Total interest and dividend income | $ | 174 | $ | 127 | $ | 111 | |||
Total interest expense |
| 57 |
| 13 |
| 15 | |||
Net interest income |
| 118 |
| 114 |
| 96 | |||
Non-interest income |
| 36 |
| 35 |
| 42 | |||
Net revenue(2) |
| 154 |
| 149 |
| 138 | |||
Provision for credit losses |
| 3 |
| 3 |
| (1) | |||
Total non-interest expense |
| 93 |
| 91 |
| 91 | |||
Income tax expense |
| 12 |
| 11 |
| 9 | |||
Net income |
| 45 |
| 44 |
| 39 | |||
Ratios and Other Data: |
|
|
|
|
|
| |||
Per Common Share Data |
|
|
|
|
|
| |||
Basic earnings | $ | 2.96 | $ | 2.90 | $ | 2.63 | |||
Diluted earnings |
| 2.95 |
| 2.88 |
| 2.61 | |||
Total book value(5) |
| 28.48 |
| 26.09 |
| 28.27 | |||
Dividends |
| 1.10 |
| 1.02 |
| 0.94 | |||
Common stock price: |
|
|
|
|
|
| |||
High |
| 32.42 |
| 33.11 |
| 32.94 | |||
Low |
| 19.55 |
| 24.00 |
| 21.26 | |||
Close |
| 29.36 |
| 32.04 |
| 28.93 | |||
Weighted average common shares outstanding (in thousands): |
|
|
|
|
|
| |||
Basic |
| 15,142 |
| 15,040 |
| 14,969 | |||
Diluted |
| 15,195 |
| 15,112 |
| 15,045 | |||
39
At or For the Years Ended December 31, |
| ||||||
(in millions, except ratios and share data) |
| 2023 |
| 2022 |
| 2021 |
|
Performance Ratios:(4) | |||||||
Return on assets |
| 1.14 | % | 1.16 | % | 1.06 | % |
Return on equity |
| 10.88 |
| 10.91 |
| 9.50 | |
Interest rate spread |
| 2.86 |
| 3.24 |
| 2.74 | |
Net interest margin(5) |
| 3.29 |
| 3.36 |
| 2.88 | |
Dividend payout ratio |
| 36.93 |
| 35.20 |
| 35.81 | |
Organic Growth Ratios: |
|
|
|
|
|
| |
Total commercial loans |
| 6 | % | 19 | % | 7 | % |
Total loans |
| 3 |
| 15 |
| (1) | |
Total deposits |
| 3 |
| (0) |
| 5 | |
Asset Quality and Condition Ratios: |
|
|
|
|
|
| |
Non-accruing loans/total loans |
| 0.18 | % | 0.23 | % | 0.40 | % |
Net (recoveries) charge-offs/average loans |
| — |
| (0.01) |
| 0.01 | |
Allowance for credit losses/total loans |
| 0.94 |
| 0.89 |
| 0.90 | |
Loans/deposits |
| 95 |
| 95 |
| 83 | |
Capital Ratios: |
|
|
|
|
|
| |
Tier 1 capital to average assets - Company |
| 9.70 | % | 9.21 | % | 8.66 | % |
Tier 1 capital to risk-weighted assets - Company |
| 11.96 |
| 11.02 |
| 11.90 | |
Tier 1 capital to average assets - Bank |
| 10.50 |
| 10.10 |
| 9.62 | |
Tier 1 capital to risk-weighted assets - Bank |
| 12.96 |
| 12.67 |
| 13.22 | |
Shareholders equity to total assets(5) |
| 10.88 |
| 10.06 |
| 11.43 | |
| (1) | Earning assets includes non-accruing loans and interest-bearing deposits with other banks. Securities are valued at amortized cost. |
| (2) | Net revenue is defined as net interest income plus non-interest income. |
| (3) | All performance ratios are based on average balance sheet amounts, where applicable. |
| (4) | Fully taxable equivalent considers the impact of tax advantaged securities and loans. |
| (5) | Non-GAAP financial measure. Refer to the Reconciliation of Non-GAAP Financial Measures for additional information. |
40
AVERAGE BALANCES AND AVERAGE YIELDS/RATES
The following table presents average balances and average rates and yields on a fully taxable equivalent basis for the periods included:
Year Ended December 31, | |||||||||||||||||||||||||||
2023 | 2022 |
| 2021 | ||||||||||||||||||||||||
Average | Interest | Yield/ | Average | Interest | Yield/ | Average | Interest | Yield/ | |||||||||||||||||||
(in millions, except ratios) |
| Balance |
| (3) |
| Rate(3) | Balance |
| (3) |
| Rate(3) |
| Balance |
| (3) |
| Rate(3) | ||||||||||
Assets | |||||||||||||||||||||||||||
Interest-earning deposits with other banks | $ | 37 | $ | 2 | 5.33 | % | $ | 72 | 1 | 1.07 | % | $ | 219 | $ | — | 0.15 | % | ||||||||||
Securities available for sale and FHLB stock(2)(3) | 610 | 26 | 3.88 | 630 | 19 | 2.99 | 621 | 16 | 2.63 | ||||||||||||||||||
Loans: | |||||||||||||||||||||||||||
Commercial real estate | 1,537 | 81 | 5.27 | 1,340 | 55 | 4.13 | 1,210 | 40 |
| 3.34 | |||||||||||||||||
Commercial and industrial(3) |
| 437 | 28 | 6.39 |
| 410 | 17 | 4.25 |
| 348 |
| 14 |
| 3.98 | |||||||||||||
Paycheck protection program | — | — | — | 1 | — | 17.27 | 51 | 6 | 11.93 | ||||||||||||||||||
Residential |
| 905 | 35 | 3.82 |
| 873 | 31 | 3.55 |
| 825 |
| 32 |
| 3.86 | |||||||||||||
Consumer |
| 97 | 7 | 6.75 |
| 100 | 4 | 4.41 |
| 99 |
| 4 |
| 3.77 | |||||||||||||
Total loans (1) |
| 2,976 |
| 151 |
| 5.04 |
| 2,724 |
| 107 |
| 3.98 |
| 2,533 |
| 96 |
| 3.78 | |||||||||
Total earning assets |
| 3,623 | 179 | 4.85 | % |
| 3,426 | 127 | 3.73 | % |
| 3,373 |
| 112 |
| 3.33 | % | ||||||||||
Cash and due from banks | 34 | 37 | 35 |
|
| ||||||||||||||||||||||
Allowance for credit losses | (27) | (24) | (23) |
|
| ||||||||||||||||||||||
Other assets | 304 | 308 |
| 333 |
|
| |||||||||||||||||||||
Total assets | $ | 3,934 |
|
| $ | 3,747 |
|
| $ | 3,718 |
|
| |||||||||||||||
Liabilities |
|
|
|
|
|
|
|
|
|
|
|
|
|
|
|
|
|
| |||||||||
NOW | $ | 900 | $ | 9 | 0.98 | % | $ | 907 | 1 | 0.16 | % | $ | 949 | $ | 1 |
| 0.11 | % | |||||||||
Savings |
| 595 | 2 | 0.39 |
| 658 | 1 | 0.10 |
| 629 |
| 1 |
| 0.90 | |||||||||||||
Money market |
| 407 | 10 | 2.48 |
| 466 | 3 | 0.63 |
| 390 |
| 1 |
| 0.12 | |||||||||||||
Time deposits |
| 533 | 17 | 3.19 |
| 366 | 2 | 0.61 |
| 425 |
| 6 |
| 1.51 | |||||||||||||
Total interest bearing deposits |
| 2,435 |
| 38 |
| 1.57 |
| 2,397 |
| 7 |
| 0.31 |
| 2,393 |
| 9 |
| 0.36 | |||||||||
Borrowings |
| 401 | 18 | 4.56 |
| 203 | 6 | 2.71 |
| 175 |
| 7 |
| 3.82 | |||||||||||||
Total interest bearing liabilities |
| 2,836 |
| 56 |
| 1.99 | % |
| 2,600 |
| 13 |
| 0.49 | % |
| 2,568 |
| 16 |
| 0.59 | % | ||||||
Non-interest bearing demand deposits |
| 619 |
|
|
|
|
| 679 |
|
|
|
|
| 668 |
|
|
|
| |||||||||
Other liabilities |
| 67 |
|
|
|
|
| 69 |
|
|
|
|
| 68 |
|
|
|
| |||||||||
Total liabilities |
| 3,522 |
|
|
|
|
| 3,348 |
|
|
|
|
| 3,304 |
|
|
|
| |||||||||
Total shareholders' equity |
| 412 |
|
|
|
|
| 399 |
|
|
|
|
| 414 |
|
|
|
| |||||||||
Total liabilities and shareholders' equity | $ | 3,934 |
|
|
|
| $ | 3,747 |
|
|
|
| $ | 3,718 |
|
|
|
| |||||||||
Net interest spread | 2.86 | % | 3.24 | % | 2.74 | % | |||||||||||||||||||||
Net interest margin |
|
|
|
|
| 3.29 |
|
|
|
|
| 3.36 |
|
|
|
|
| 2.88 | |||||||||
| (1) | The average balances of loans include non-accrual loans and unamortized deferred fees and costs. |
| (2) | The average balance for securities is based on amortized cost. |
| (3) | Fully taxable equivalent considers the impact of tax-advantaged securities and loans. |
41
RATE/VOLUME ANALYSIS
The following table presents the effects of rate and volume changes on the fully taxable equivalent net interest income. Tax exempt interest revenue is shown on a tax-equivalent basis for proper comparison. For each category of interest- earning assets and interest-bearing liabilities, information is provided with respect to changes attributable to (1) changes in rate (change in rate multiplied by prior year volume), (2) changes in volume (change in volume multiplied by prior year rate), and (3) changes in volume/rate (change in rate multiplied by change in volume) have been allocated proportionately based on the absolute value of the change due to the rate and the change due to volume.
2023 Compared with 2022 | 2022 Compared with 2021 | |||||||||||||||||
Increases (Decreases) due to | Increases (Decreases) due to | |||||||||||||||||
(in thousands) |
| Rate |
| Volume |
| Net |
| Rate |
| Volume |
| Net | ||||||
Interest income: | ||||||||||||||||||
Interest-earning deposits with other banks | $ | 1,595 | $ | (369) | $ | 1,226 | $ | 660 | $ | (224) | $ | 436 | ||||||
Securities available for sale and FHLB stock | 5,424 | (575) | 4,849 | 2,274 | 233 | 2,507 | ||||||||||||
Loans: | ||||||||||||||||||
Commercial real estate | 17,630 | 8,110 | 25,740 | 10,614 | 4,340 | 14,954 | ||||||||||||
Commercial and industrial |
| 9,360 |
| 1,168 |
| 10,528 |
| 75 |
| 3,448 |
| 3,523 | ||||||
Paycheck protection program | — | (223) | (223) | 114 | (5,891) | (5,777) | ||||||||||||
Residential |
| 2,376 |
| 1,142 |
| 3,518 |
| (2,662) |
| 1,836 |
| (826) | ||||||
Consumer |
| 2,280 |
| (109) |
| 2,171 |
| 644 |
| 43 |
| 687 | ||||||
Total loans |
| 31,646 |
| 10,088 |
| 41,734 |
| 8,785 |
| 3,776 |
| 12,561 | ||||||
Total interest income | $ | 38,665 | $ | 9,144 | $ | 47,809 | $ | 11,719 | $ | 3,785 | $ | 15,504 | ||||||
Interest expense: |
|
|
|
|
|
|
|
|
|
|
|
| ||||||
Deposits: | ||||||||||||||||||
NOW | $ | 7,342 | $ | (12) | $ | 7,330 | $ | 466 | $ | (48) | $ | 418 | ||||||
Savings |
| 1,707 |
| (66) |
| 1,641 |
| 101 |
| 25 |
| 126 | ||||||
Money market |
| 7,517 |
| (376) |
| 7,141 |
| 2,368 |
| 93 |
| 2,461 | ||||||
Time deposits |
| 13,761 |
| 1,015 |
| 14,776 |
| (3,318) |
| (886) |
| (4,204) | ||||||
Total deposits |
| 30,327 |
| 561 |
| 30,888 |
| (383) |
| (816) |
| (1,199) | ||||||
Borrowings |
| 7,406 |
| 5,368 |
| 12,774 |
| (2,249) |
| 1,062 |
| (1,187) | ||||||
Total interest expense | $ | 37,733 | $ | 5,929 | $ | 43,662 | $ | (2,632) | $ | 246 | $ | (2,386) | ||||||
Change in net interest income | $ | 932 | $ | 3,215 | $ | 4,147 | $ | 14,351 | $ | 3,539 | $ | 17,890 | ||||||
42
NON-GAAP FINANCIAL MEASURES
Our accounting and reporting policies conform to accounting principles generally accepted in the United States of America ("GAAP") and the prevailing practices in the financial services industry. However, we also evaluate our performance by reference to certain additional financial measures discussed in this Annual Report that we identify as being “non-GAAP financial measures.” In accordance with SEC rules, we classify a financial measure as being a non-GAAP financial measure if that financial measure excludes or includes amounts, or is subject to adjustments that have the effect of excluding or including amounts, that are included or excluded, as the case may be, in the most directly comparable measure calculated and presented in accordance with GAAP as in effect from time to time in the United States in our statements of income, balance sheets or statements of cash flows. Non-GAAP financial measures do not include operating and other statistical measures or ratios or statistical measures calculated using exclusively either financial measures calculated in accordance with GAAP, operating measures or other measures that are not non-GAAP financial measures or both.
These non-GAAP measures are intended to provide the reader with additional supplemental perspectives on operating results, performance trends, and financial condition. Non-GAAP financial measures are not a substitute for GAAP measures; they should be read and used in conjunction with the Company's GAAP financial information. Because non-GAAP financial measures presented in this Annual Report are not measurements determined in accordance with GAAP and are susceptible to varying calculations, these non-GAAP financial measures, as presented, may not be comparable to other similarly titled measures presented by other companies. A reconciliation of non-GAAP financial measures to GAAP measures is provided herein. In all cases, it should be understood that non-GAAP measures do not depict amounts that accrue directly to the benefit of shareholders. An item which management excludes when computing non-GAAP financial measures can be of substantial importance to the Company’s results for any particular quarter or year. Each non-GAAP measure used by the Company in this Annual Report as supplemental financial data should be considered in conjunction with the Company's GAAP financial information. The Company utilizes these non-GAAP financial measures for purposes of measuring our performance against our peer group and other financial institutions and analyzing our internal performance. We also believe these non-GAAP financial measures help investors better understand the Company’s operating performance and trends and allow for better performance comparisons to other banks. In addition, these non-GAAP financial measures remove the impact of unusual items that may obscure trends in the Company’s underlying performance.
The non-GAAP financial measures that we discuss in this Annual Report should not be considered in isolation or as a substitute for the most directly comparable or other financial measures calculated in accordance with GAAP. Moreover, the manner in which we calculate the non-GAAP financial measures that we discuss in this Annual Report may differ from that of other companies reporting measures with similar names. You should understand how such other banking organizations calculate their financial measures similar or with names similar to the non-GAAP financial measures we have discussed in this Annual Report when comparing such non-GAAP financial measures. The following reconciliation table provides a more detailed analysis of these, and reconciliation for, each of non-GAAP financial measures.
43
RECONCILIATION OF NON-GAAP FINANCIAL MEASURES
The following table summarizes the reconciliation of non-GAAP items for the time periods presented:
|
| ||||||||||
Year Ended December 31, | |||||||||||
(in thousands) |
| Calculations |
| 2023 |
| 2022 |
| 2021 | |||
Net income |
|
| $ | 44,852 | $ | 43,557 | $ | 39,299 | |||
Non-recurring items: | |||||||||||
Gain on sale of securities, net |
|
|
| (34) |
| (53) |
| (2,870) | |||
Gain on sale of premises and equipment, net |
|
|
| 182 |
| 10 |
| 378 | |||
Loss on debt extinguishment | — | — | 2,851 | ||||||||
Acquisition, conversion and other expenses |
|
|
| 283 |
| 266 |
| 1,667 | |||
Income tax expense (1) |
|
|
| (104) |
| (51) |
| (479) | |||
Total non-recurring items | 327 | 172 | 1,547 | ||||||||
Total adjusted income(2) |
| (A) | $ | 45,179 | $ | 43,729 | $ | 40,846 | |||
Net interest income |
| (B) | $ | 117,675 | $ | 113,681 | $ | 95,573 | |||
Plus: Non-interest income |
|
|
| 35,829 |
| 35,321 |
| 42,261 | |||
Total Revenue |
|
|
| 153,504 |
| 149,002 |
| 137,834 | |||
Gain on sale of securities, net |
|
|
| (34) |
| (53) |
| (2,870) | |||
Total adjusted revenue(2) |
| (C) | $ | 153,470 | $ | 148,949 | $ | 134,964 | |||
Total non-interest expense |
|
| $ | 93,479 | $ | 91,253 | $ | 90,508 | |||
Non-recurring expenses: | |||||||||||
Gain on sale of premises and equipment, net |
|
|
| (182) |
| (10) |
| (378) | |||
Loss on debt extinguishment | — | — | (2,851) | ||||||||
Acquisition, conversion and other expenses |
|
|
| (283) |
| (266) |
| (1,667) | |||
Total non-recurring expenses | (465) | (276) | (4,896) | ||||||||
Adjusted non-interest expense(2) |
| (D) | $ | 93,014 | $ | 90,977 | $ | 85,612 | |||
Total revenue | 153,504 | 149,002 | 137,834 | ||||||||
Total non-interest expense | 93,479 | 91,253 | 90,508 | ||||||||
Pre-tax, pre-provision net revenue | $ | 60,025 | $ | 57,749 | $ | 47,326 | |||||
Adjusted revenue(2) | 153,470 | 148,949 | 134,964 | ||||||||
Adjusted non-interest expense(2) | 93,014 | 90,977 | 85,612 | ||||||||
Adjusted pre-tax, pre-provision net revenue(2) | (U) | $ | 60,456 | $ | 57,972 | $ | 49,352 | ||||
(in millions) |
|
|
|
|
|
|
|
| |||
Average earning assets |
| (E) | $ | 3,623 | $ | 3,425 | $ | 3,373 | |||
Average paycheck protection program (PPP) loans | (R) | — | 1 | 51 | |||||||
Average earning assets, excluding PPP loans | (S) | 3,623 | 3,424 | 3,103 | |||||||
Average assets |
| (F) |
| 3,934 |
| 3,747 |
| 3,718 | |||
Average shareholders' equity |
| (G) |
| 412 |
| 399 |
| 414 | |||
Average tangible shareholders' equity(2)(3) |
| (H) |
| 288 |
| 273 |
| 288 | |||
Tangible shareholders' equity, period-end(2)(3) |
| (I) |
| 308 |
| 268 |
| 298 | |||
Tangible assets, period-end(2)(3) |
| (J) |
| 3,847 |
| 3,784 |
| 3,583 | |||
44
Year Ended December 31, | ||||||||||||
Calculations |
| 2023 |
| 2022 |
| 2021 | ||||||
(in thousands) |
|
| ||||||||||
Common shares outstanding, period-end |
| (K) | 15,172 |
| 15,083 |
| 15,001 | |||||
Average diluted shares outstanding |
| (L) | 15,195 |
| 15,112 |
| 15,045 | |||||
Adjusted earnings per share, diluted(2) |
| (A/L) | $ | 2.95 | $ | 2.89 | $ | 2.72 | ||||
Tangible book value per share, period-end(2) |
| (I/K) | 20.28 |
| 17.78 |
| 19.86 | |||||
Securities adjustment, net of tax(1)(4) |
| (M) | (47,649) |
| (55,246) |
| 1,985 | |||||
Tangible book value per share, excluding securities adjustment(2)(4) |
| (I+M)/K | 23.42 |
| 21.44 |
| 19.73 | |||||
Total tangible shareholders' equity/total tangible assets(2) |
| (I/J) | 8.00 |
| 7.09 |
| 8.32 | |||||
Performance ratios(5) | ||||||||||||
Return on assets |
| 1.14 | % | 1.16 | % | 1.06 | % | |||||
Core return on assets(2) | (A/F) | 1.15 | 1.17 | 1.10 | ||||||||
Pre-tax, pre-provision return on assets | 1.53 | 1.54 | 1.27 | |||||||||
Adjusted pre-tax, pre-provision return on assets(2) | (U/F) | 1.54 | 1.49 | 1.33 | ||||||||
Return on equity |
| 10.88 | 10.91 | 9.50 | ||||||||
Core return on equity(2) | (A/G) | 10.96 | 10.96 | 9.87 | ||||||||
Return on tangible equity | 15.84 | 16.20 | 13.92 | |||||||||
Adjusted return on tangible equity(1)(2) | (A+Q)/H | 15.96 | 16.26 | 14.46 | ||||||||
Efficiency ratio(1)(2)(6) | (D-O-Q)/(C+N) | 58.67 | 59.26 | 61.29 | ||||||||
Net interest margin | (B+P)/E | 3.29 | 3.36 | 2.88 | ||||||||
Supplementary data (in thousands) |
|
|
|
| ||||||||
Taxable equivalent adjustment for efficiency ratio | (N) | $ | 2,392 | $ | 2,020 | $ | 2,330 | |||||
Franchise taxes included in non-interest expense | (O) | 638 | 583 | 528 | ||||||||
Tax equivalent adjustment for net interest margin | (P) | 1,550 | 1,398 | 1,653 | ||||||||
Intangible amortization | (Q) | 932 | 932 | 940 | ||||||||
Interest and fees on PPP loans | (T) | — | 223 | 6,039 | ||||||||
| (1) | 2023 assumes a marginal tax rate of 24.01% for the fourth quarter and 23.80% for the first three quarters. |
2022 assumes a marginal tax rate of 23.53% for the fourth quarter and 23.41% for the first three quarters. 2021 assumes a marginal tax rate of 23.41% for the fourth quarter and 23.71% for the first three quarters.
| (2) | Non-GAAP financial measure. |
| (3) | Tangible shareholders’ equity is computed by taking total shareholders’ equity less the intangible assets at period-end. Tangible assets are computed by taking total assets less the intangible assets at period-end. |
| (4) | Securities adjustment, net of tax represents the total unrealized (loss) gain on securities recorded on the Company’s consolidated balance sheets within total common shareholders’ equity. |
| (5) | All performance ratios are based on average balance sheet amounts, where applicable. |
| (6) | Efficiency ratio is computed by using adjusted non-interest expense net of franchise taxes and intangible amortization divided by adjusted revenue tax effected for tax-advantaged assets. Adjusted net interest margin excludes PPP loans and interest-earning deposits with other banks. |
45
COMPARISON OF FINANCIAL CONDITION AT DECEMBER 31, 2023 AND 2022
Cash and cash equivalents
Total cash and cash equivalents at December 31, 2023 were $94.8 million, compared to $92.3 million at December 31, 2022. Interest-earning cash held with other banks totaled $52.6 million at year-end 2023 compared to $52.4 million at year-end 2022 carrying a yield of 5.33% in 2023 versus 1.07% in 2022.
Securities
Securities totaled $547.4 million at year-end 2023 and $574.4 million at year-end 2022. During 2023, security purchases totaled $7.5 million and were offset $44.6 million of maturities, calls and pay-downs of amortizing securities. There were $18.4 million of purchases and $20.5 million in sales of FHLB stock during the year. Fair value adjustments decreased the security portfolio by $62.4 million in 2023 compared to a $71.8 million unrealized gain in 2022. Unrealized gains shifted to loss position in 2022 due to changes in the long-term treasury yield curve. The weighted average yield of the securities portfolio was 3.85% as of December 31, 2023 compared to 2.99% at year-end 2022. At the end of 2023, our securities portfolio had an average life of 8.7 years with an effective duration of 4.8 compared to an average life of 9.4 years with an effective duration of 5.0 years at the end of 2022. The extension of duration during 2022 was driven by the increase in rates. All securities remain classified as available for sale to provide flexibility in loan funding and management of our cost of funds.
Loans
Loans increased by $96.4 million from year-end 2022 or 3%. The controlled growth was a function of the tight credit markets and the rising interest rate environment in 2023 that limited commercial loan refinancing activity. Total commercial loans were $2.0 billion, growing 6% in 2023 and 19% in 2022 which was driven mostly from new relationships primarily to commercial borrowers. Total residential loans decreased 2% or $14.6 million from year-end 2022, due to lower demand for prevailing mortgage rates and strategy to sell production to the secondary market. Home Equity lines decreased 4% or $3.2 million from year-end 2022 due to the run-off of balances associated with the repricing of home equity lines of credit.
Allowance for Credit Losses
The ACL was $28.1 million at the end of 2023 compared to $25.9 million at year-end 2022. The increase was primarily due to more refined economic forecasting, especially in the national unemployment figures and in commercial real estate prices, and loan portfolio growth. Non-accruing loans decreased $1 million to $5.5 million, or 0.18% of total loans at the end of 2023 from $6.5 million or 0.23% of total loans at year-end 2022. The ratio of accruing past due loans to total loans increased to 0.12% of total loans from 0.09%. Total delinquent and non-accruing loans as percentage of total loans improved to 0.30% from 0.32%. Net charge-offs increased to $626 thousand in 2023 compared to a net recovery of $238 thousand in 2022 primarily driven by the resolution of one non-accruing C&I loan.
Other Assets
Total other assets decreased $10.6 million to $356 million at December 31, 2023 from $366 million as of December 31, 2022. The decrease is primarily attributed to a $5.1 million decrease in the asset position customer loan swaps and $2.2 million decrease in interest rate swaps on wholesale funding. Other intangible assets decreased $932 thousand from 2022 driven by amortization. Deferred tax assets, net, decreased $1.5 million as of December 31, 2023 compared to 2022 driven by the unrealized loss position in the securities available for sale portfolio. Cash surrender value of Bank Owned Life insurance decreased $1.2 million due to settlement of one-time death benefits that occurred in the first quarter of 2023.
Deposits and Borrowings
Total deposits increased $97.8 million to $3.1 billion at the end of 2023 compared to $3.0 billion at the end of 2022. Non-maturity deposits decreased $279.1 million in 2023, or 10% due to consumer’s migration to brokerage accounts and higher yielding Time deposits. 4,638 non-maturity deposit accounts with new customers were opened in 2023. Time deposits increased $376.8 million to $700.3 million at year-end 2023 versus $323.4 million in 2022. Brokered deposits increased $204.5 million. Retail time deposits increased $172.4 million as customers moved funds from non-maturity deposits into higher yielding alternatives. Our deposit composition at year-end 2023 and 2022 was 47% commercial customers and 53% consumer customers. Total borrowings decreased $62.7 million to $271 million at December 31, 2023 compared to $334 million as of December 31, 2022 primarily due to excess cash available generated from operations.
46
Derivative Financial Instruments and Other Liabilities
Other liabilities totaled $66.2 million at the end of 2023 compared to $78.7 million as of December 31, 2022. The $12.5 million decrease primarily reflects a $10.0 million decrease in capital commitments on limited partnership investments, a $5.2 million net decrease in customer loan swaps, and a $1.5 million variable rate loan hedge decrease offset by $3.5 million increase in brokered CD and a $581 thousand increase in CD interest payable. The net fair value of all derivatives was an asset of $3.2 million at the end of 2023 compared to a $4.8 million asset at year-end 2022. The decrease in net derivative fair values reflects the slowing of rising long-term interest rates. The reserve for unfunded commitments remained flat at the end of 2023 at $3.9 million, which are also recorded in other liabilities.
Equity
Total equity was $432.1 million at year-end 2023, compared with $393.5 million at year-end 2022. Book value per share was $28.48 as of December 31, 2023 compared with $26.09 at December 31, 2022. Equity included securities adjustments, net of tax, totaling a $47.6 million loss at the end of 2023 compared to a $55.3 million loss at year-end 2022.
During 2023 and 2022, the Company declared and distributed regular cash dividends on its common stock in the aggregate amounts of $16.6 million compared to $15.3 million, respectively. The Company’s 2023 dividend payout ratio amounted to 37%, compared with 35% in 2022. Total cash dividends paid in 2023 was $1.10 per share of common stock, compared with $1.02 per share of common stock in 2022.
The Company and the Bank remained well-capitalized under regulatory guidelines at period end as further described in Note 12 – Shareholders’ Equity and Earnings Per Common Share on the Consolidated Financial Statements.
COMPARISON OF OPERATING RESULTS FOR THE YEARS ENDED DECEMBER 31, 2023 AND 2022
Net Interest Income
Net interest income for 2023 was $117.7 million compared with $113.7 million in 2022. The net interest margin was 3.29% in 2023 compared to 3.35% in the prior year. Interest-earning cash balances, held mostly at the Federal Reserve Bank, reduced NIM by 2 basis points in the year and 5 basis points in 2022. The yield on earning assets totaled 4.85% compared to 3.73% in 2022. The yield on loans was 5.04% in 2023 and 3.98% in 2022. Costs of interest-bearing liabilities increased in 2023 to 1.99% from 0.49% in 2022 due to increased deposit rates. Interest expense on borrowings increased $12.8 million in 2023 compared to 2022 driven by a 79 basis point increase in the weighted average rate of borrowings to 3.24% from 2.45%, respectively, reflecting higher interest rates and increased average borrowings.
Provision for Credit Losses
The provision for credit losses in both 2023 and 2022 was a $2.9 million expense. The expense in 2023 was primarily due to more refined economic forecasting, especially in the national unemployment figures and in commercial real estate prices, and loan portfolio growth. Overall credit quality remains strong and credit quality metrics improved with notable decreases in non-accruing loans.
Non-Interest Income
Non-interest income in 2023 was $35.8 million compared to $35.3 million in 2022. Trust management fees were $14.3 million in 2023 compared to $14.6 in 2022 due to lower market valuation of assets under management (“AUM”) throughout the year. AUM was $2.5 billion compared to $2.3 billion in 2022, the increase of $143 million primarily due to higher security valuations in the fourth quarter 2023. Customer service fees increased 3% to $15.2 million in 2023 due to higher transaction volumes associated with 1,000 net new core accounts that opened during the year. BOLI income increased $699 thousand in 2023 compared to 2022 related to one-time death benefits during the first quarter of 2023.
Non-Interest Expense
Non-interest expense was $93.5 million in 2023 compared to $91.3 million in 2022. Salaries and benefits expense increased $3.9 million to $52.5 million in 2023 due to a $2.0 million increase in revaluation of post-retirement plan liabilities driven by rate environment, $711 thousand increase in stock compensation expense due to the revaluation of our
47
long term incentive obligations and a $782 thousand decrease in deferred loan origination costs driven by lower residential loan volume.
Income Tax Expense
Income tax expense was $12.3 million for the year ended December 31, 2023, compared with $11.3 million for the year ended December 31, 2022. The effective tax rate increased to 21.5% in 2023 from 20.6% in 2022 due to a higher proportion of revenue from non-exempt sources.
LIQUIDITY AND CASH FLOWS
Liquidity is measured by the ability to meet short-term cash needs at a reasonable cost or minimal loss. Favorable sources of liabilities are sought to maintain prudent levels of liquid assets in order to satisfy varied liquidity demands. Besides serving as a funding source for maturing obligations, liquidity provides flexibility in responding to customer initiated needs. Many factors affect the ability to meet liquidity needs, including variations in the markets served by its network of offices, its mix of assets and liabilities, reputation and credit standing in the marketplace, and general economic conditions.
The liquidity position is actively managed through target ratios established under our liquidity and funding policy. Continual monitoring of these ratios, by using historical data and through forecasts under multiple rate and stress scenarios, allows the ability to employ strategies necessary to maintain adequate liquidity. The policy is to maintain a liquidity position of at least 8% of total assets. A portion of the deposit base has been historically seasonal in nature, with balances typically declining in the winter months through late spring, during which period the liquidity position tightens.
A liquidity contingency plan is approved by the Bank’s Board of Directors. This plan addresses the steps that would be taken in the event of a liquidity crisis, and identifies other sources of liquidity available to the Company. Management believes that the level of liquidity is sufficient to meet current and future funding requirements. However, changes in economic conditions, including consumer savings habits and availability or access to the brokered deposit market could potentially have a significant impact on the liquidity position.
The existing cash and cash equivalents (including an interest-bearing deposit at the FRB Boston), securities available for sale and cash flows from operating activities will be sufficient to meet anticipated cash needs for at least the next 12 months. Future working capital needs will depend on many factors, including the rate of business and revenue growth. To the extent cash and cash equivalents, securities available for sale and cash flows from operating activities are insufficient to fund future activities, the need to raise additional funds through debt arrangements or public or private debt or equity financings may be utilized. The need to raise additional funds may be needed in the event it is determined in the future to effect one or more acquisitions of banks or businesses. If additional funding is required, we may not be able to obtain debt arrangements or to effect an equity or debt financing on terms acceptable or at all.
Capital Resources
Consistent with our long-term goal of operating a sound and profitable organization, at December 31, 2023, we continue to be a “well-capitalized” financial institution according to applicable regulatory standards. Management believes this to be vital in promoting depositor and investor confidence and providing a solid foundation for future growth.
At December 31, 2023, available same-day liquidity totaled approximately $1.2 billion, including cash, borrowing capacity at FHLB and the Federal Reserve Discount Window and various lines of credit. Additional sources of liquidity include cash flows from operations, wholesale deposits, cash flow from the Company's amortizing securities and loan portfolios. We have unused borrowing capacity at the FHLB of $381.4 million, unused borrowing capacity at the Federal Reserve of $126.6 million and unused lines of credit totaling $51.0 million, in addition to over $200 million in unencumbered, liquid investment portfolio assets.
Purchase Obligations
In the normal course of conducting our banking and financial services business, and in connection with providing products and services to our customers, a variety of traditional third-party contracts for support services have been entered into. Examples of such contractual agreements include, but are not limited to: services providing core banking systems, ATM and debit card processing, trust services software, accounting software and the leasing of T-1 telecommunication lines and
48
other technology infrastructure supporting our network. These types of purchase obligations that will come due during 2024 approximates $9.5 million as of December 31, 2023 which is expected to be funded by cash flows generated from our operations.
Impact of Inflation and Changing Prices
A banking organization’s assets and liabilities are primarily monetary. Changes in the rate of inflation do not have as great an impact on the financial condition of a bank as do changes in interest rates. Moreover, interest rates do not necessarily change at the same percentage as inflation. Accordingly, changes in inflation are not expected to have a material impact on the Company.
The FOMC often applies contractionary monetary policies during times of high inflation, resulting in elevated interest rates. Elevated interest rates may lower the market value of existing balance sheet assets and often result in a significant unrealized loss position. These lower market values may negatively affect the Bank’s liquidity position as it results in a lower value of the Bank’s liquid assets.
IMPACT OF NEW ACCOUNTING PRONOUNCEMENTS
Please refer to the notes on Recently Adopted Accounting Principles and Future Application of Accounting Pronouncements in Note 1 – Summary of Significant Accounting Policies of the Consolidated Financial Statements.
CRITICAL ACCOUNTING POLICIES AND ESTIMATES
Note 1 – Summary of Significant Accounting Policies to our audited Consolidated Financial Statements for the year ended December 31, 2023 contains a summary of significant accounting policies. Various elements of these accounting policies, by their nature, are subject to estimation techniques, valuation assumptions and other subjective assessments. Certain assets are carried in the consolidated statements of financial condition at estimated fair value or the lower of cost or estimated fair value. Policies with respect to the methodology used to determine the allowance for credit losses is a critical accounting policy and estimate because of its importance to the presentation of our financial condition and results of operations. The critical accounting policy involves a higher degree of complexity and requires management to make difficult and subjective judgments which often require assumptions or estimates about highly uncertain matters. The use of different judgments, assumptions, and estimates could result in material differences in the results of operations or financial condition.
Allowance for credit losses on loans (the “allowance”)
The allowance is sensitive to a number of internal factors, such as modifications in the mix and level of loan balances outstanding, portfolio performance and assigned risk ratings. The allowance is also sensitive to external factors such as the general health of the economy, as evidenced by changes in unemployment rates, home pricing index, gross domestic product, retail sales and changes in commercial real estate values. We consider these variables and all other available information when establishing the final level of the allowance. These variables and others have the ability to result in actual loan losses that differ from the originally estimated amounts.
Changes in the factors used by management to determine the appropriateness of the allowance or the availability of new information could cause the allowance to be increased or decreased in future periods. Additionally, changes in circumstances related to individually large credits, or certain macroeconomic forecast assumptions may result in volatility.
It is difficult to estimate how potential changes in any one economic factor might affect the overall allowance because a wide variety of factors and inputs are considered in the allowance estimate. Changes in the factors and inputs may not occur at the same rate and may not be consistent across all product types. Additionally, changes in factors and inputs may be directionally inconsistent, such that improvement in one factor may offset deterioration in others. However, to consider the impact of a hypothetical stressed forecast, we estimated the allowance using forecast inputs that were severely unfavorable to the expected scenario for each macroeconomic variable. This unfavorable scenario resulted in an allowance that is approximately $8.0 million higher than the allowance using the expected scenario.
49
ITEM 7A. QUANTITATIVE AND QUALITATIVE DISCLOSURES ABOUT MARKET RISK
Market Risk
Market risk is the risk of loss in a financial instrument arising from adverse changes in market rates/prices, such as interest rates, foreign currency exchange rates, commodity prices and equity prices. Interest rate risk is the most significant market risk affecting the Company. Other types of market risk do not arise in the normal course of our business activities.
The responsibility for interest rate risk management oversight is the function of the Bank’s Asset and Liability Committee (“ALCO”), chaired by the Chief Financial Officer and composed of various members of senior management. ALCO meets regularly to review balance sheet structure, formulate strategies in light of current and expected economic conditions, adjust product prices as necessary, implement policy, monitor liquidity, and review performance against guidelines established to control exposure to the various types of inherent risk.
Interest Rate Risk:
Interest rate risk can be defined as an exposure to movement in interest rates that could have an adverse impact on the net interest income. Interest rate risk arises from the imbalance in the re-pricing, maturity and/or cash flow characteristics of assets and liabilities. Management’s objectives are to measure, monitor and develop strategies in response to the interest rate risk profile inherent in the Bank’s balance sheet. The objectives in managing the balance sheet are to preserve the sensitivity of net interest income to actual or potential changes in interest rates, and to enhance profitability through strategies that promote sufficient reward for understood and controlled risk.
The interest rate risk measurement and management techniques incorporate the re-pricing and cash flow attributes of balance sheet and off-balance sheet instruments as each relate to current and potential changes in interest rates. The level of interest rate risk, measured in terms of the potential future effect on net interest income, is determined through the use of modeling and other techniques under multiple interest rate scenarios. Interest rate risk is evaluated in depth on a quarterly basis and reviewed by ALCO and the Board of Directors.
The Asset Liability Management Policy, approved annually by the Bank’s Board of Directors, establishes interest rate risk limits in terms of variability of net interest income under rising, flat, and decreasing rate scenarios. It is the role of the ALCO to evaluate the overall risk profile and to determine actions to maintain and achieve a posture consistent with policy guidelines.
Interest Rate Sensitivity Modeling:
An interest rate risk model widely recognized in the financial industry is used to monitor and measure interest rate risk. The model simulates the behavior of interest income and expense for all balance sheet and off-balance sheet instruments, under different interest rate scenarios together with a dynamic future balance sheet. Interest rate risk is measured in terms of potential changes in net interest income based upon shifts in the yield curve.
The interest rate risk sensitivity model requires that assets and liabilities be broken down into components as to fixed, variable, and adjustable interest rates, as well as other homogeneous groupings, which are segregated as to maturity and type of instrument. The model includes assumptions about how the balance sheet is likely to evolve through time and in different interest rate environments. The model uses contractual re-pricing dates for variable products, contractual maturities for fixed rate products, and product-specific assumptions for deposit accounts, such as money market accounts, that are subject to re-pricing based on current market conditions. Re-pricing margins are also determined for adjustable rate assets and incorporated in the model. Investment securities and borrowings with option provisions are examined on an individual basis in each rate environment to estimate the likelihood of exercise. Prepayment assumptions for mortgage loans are calibrated using specific Bank experience while mortgage-backed securities are developed from industry standard models of prepayment speeds, based upon similar coupon ranges and degree of seasoning. Cash flows and maturities are then determined, and for certain assets, prepayment assumptions are estimated under different interest rate scenarios. Interest income and interest expense are then simulated under several hypothetical interest rate conditions.
50
The simulation models a parallel and pro rata shift in rates over a 12-month period. Using this approach, we are able to produce simulation results that illustrate the effect that both a gradual “rate ramp” and a “rate shock” have on earnings expectations. Our net interest income sensitivity analysis reflects changes to net interest income assuming no balance sheet growth and a parallel shift in interest rates. All rate changes were “ramped” over the first 12-month period and then maintained at those levels over the remainder of the simulation horizon. Changes in net interest income based upon these simulations are measured against the flat interest rate scenario.
As of December 31, 2023, interest rate sensitivity modeling results indicate that the balance sheet was asset sensitive over the one- and two-year horizons.
The following table presents the changes in sensitivities on net interest income for the years ended December 31, 2023 and 2022:
Change in Interest Rates-Basis Points (Rate Ramp) | 1 - 12 Months | 13 - 24 Months |
| |||||||||
(in thousands, except ratios) | $ Change | % Change | $ Change | % Change |
| |||||||
At December 31, 2023 |
|
|
|
|
|
|
|
| ||||
-200 | $ | (6,229) | (5.0) | % | $ | (12,776) | (9.7) | % | ||||
-100 | (3,310) | (2.7) | (6,468) | (4.9) | ||||||||
+100 | 2,421 | 2.0 | 4,818 | 3.7 | ||||||||
+200 |
| 4,938 | (4.0) | 9,143 | 6.9 | |||||||
At December 31, 2022 |
|
|
|
|
|
| ||||||
-200 | $ | (6,183) | (4.3) | % | $ | (19,692) | (12.8) | % | ||||
-100 |
| (2,261) |
| (1.6) | (7,954) |
| (5.2) | |||||
+100 | 1,704 | 1.2 | 5,583 | 3.6 | ||||||||
+200 |
| 3,253 |
| 2.3 |
| 10,627 |
| 6.9 | ||||
Assuming short-term and long-term interest rates decline 100 to 200 basis points from current levels (i.e., a parallel yield curve shift) and the Bank’s balance sheet structure and size remain at current levels, management believes net interest income will deteriorate over the one year horizon while deteriorating further from that level over the two-year horizon.
Assuming the Bank’s balance sheet structure and size remain at current levels and the Federal Reserve increases short-term interest rates by 100 to 200 basis points with the balance of the yield curve shifting in parallel with these increases, management believes net interest income will improve over both the one and two-year horizons.
As compared to December 31, 2022, sensitivity to rate movements has decreased as the bank has incrementally shifted to a less asset sensitive position.
The preceding sensitivity analysis does not represent a forecast and should not be relied upon as being indicative of expected operating results. These hypothetical estimates are based upon numerous assumptions including: the nature and timing of interest rate levels and yield curve shape, prepayment speeds on loans and securities, deposit rates, pricing decisions on loans and deposits, reinvestment or replacement of asset and liability cash flows, and renegotiated loan terms with borrowers. While assumptions are developed based upon current economic and local market conditions, we cannot make any assurances as to the predictive nature of these assumptions including how customer preferences or competitor influences might change.
As market conditions vary from those assumed in the sensitivity analysis, actual results may also differ due to: prepayment and refinancing levels deviating from those assumed; the impact of interest rate changes, caps or floors on adjustable rate assets; the potential effect of changing debt service levels on customers with adjustable rate loans; depositor early withdrawals and product preference changes; and other such variables. The sensitivity analysis also does not reflect additional actions that the Bank’s senior executive team and Board of Directors might take in responding to or anticipating changes in interest rates, and the anticipated impact on the Bank’s net interest income.
51
ITEM 8. CONSOLIDATED FINANCIAL STATEMENTS AND SUPPLEMENTARY DATA
REPORT OF INDEPENDENT REGISTERED PUBLIC ACCOUNTING FIRM
To the Shareholders and the Board of Directors of Bar Harbor Bankshares and Subsidiaries
Opinion on the Financial Statements
We have audited the accompanying consolidated balance sheets of Bar Harbor Bankshares and Subsidiaries (the Company) as of December 31, 2023 and 2022, the related consolidated statements of income, comprehensive income, changes in shareholders' equity and cash flows for each of the three years in the period ended December 31, 2023, and the related notes to the consolidated financial statements (collectively, the financial statements). In our opinion, the financial statements present fairly, in all material respects, the financial position of the Company as of December 31, 2023 and 2022, and the results of its operations and its cash flows for each of the three years in the period ended December 31, 2023, in conformity with accounting principles generally accepted in the United States of America.
We have also audited, in accordance with the standards of the Public Company Accounting Oversight Board (United States) (PCAOB), the Company's internal control over financial reporting as of December 31, 2023, based on criteria established in Internal Control—Integrated Framework issued by the Committee of Sponsoring Organizations of the Treadway Commission in 2013, and our report dated March 11, 2024, expressed an unqualified opinion on the effectiveness of the Company's internal control over financial reporting.
Basis for Opinion
These financial statements are the responsibility of the Company’s management. Our responsibility is to express an opinion on the Company’s financial statements based on our audits. We are a public accounting firm registered with the PCAOB and are required to be independent with respect to the Company in accordance with U.S. federal securities laws and the applicable rules and regulations of the Securities and Exchange Commission and the PCAOB.
We conducted our audits in accordance with the standards of the PCAOB. Those standards require that we plan and perform the audit to obtain reasonable assurance about whether the financial statements are free of material misstatement, whether due to error or fraud. Our audits included performing procedures to assess the risks of material misstatement of the financial statements, whether due to error or fraud, and performing procedures that respond to those risks. Such procedures included examining, on a test basis, evidence regarding the amounts and disclosures in the financial statements. Our audits also included evaluating the accounting principles used and significant estimates made by management, as well as evaluating the overall presentation of the financial statements. We believe that our audits provide a reasonable basis for our opinion.
Critical Audit Matter
The critical audit matter communicated below is a matter arising from the current period audit of the financial statements that was communicated or required to be communicated to the audit committee and that: (1) relates to accounts or disclosures that are material to the financial statements and (2) involved our especially challenging, subjective or complex judgments. The communication of the critical audit matter does not alter in any way our opinion on the financial statements, taken as a whole, and we are not, by communicating the critical audit matter below, providing a separate opinion on the critical audit matter or on the accounts or disclosures to which it relates.
Allowance for Credit Losses on Loans
As described in Notes 1 and 3 to the consolidated financial statements, the allowance for credit losses on loans is established through a provision for credit losses and represents an amount which, in management’s judgment, will be adequate to absorb losses on existing loans. The Company’s consolidated allowance for credit losses on loan balances was $28.1 million at December 31, 2023. The allowance for credit losses on loans is comprised of reserves measured on a collective (pool) basis based on a lifetime loss-rate model when similar risk characteristics exist. Loans that do not share risk characteristics are evaluated on an individual basis, generally larger non-accruing commercial loans and troubled debt restructurings.
52
The Company uses the discounted cash flow method to estimate expected credit losses for all loan portfolio segments measured on a pool basis wherein payment expectations are adjusted for estimated prepayment speeds, probability of default (PD), and loss given default (LGD). The Company uses regression analysis of historical internal and peer data to determine suitable loss drivers to utilize when modeling lifetime PD. This analysis also determines how expected PD and LGD will react to forecasted levels of the loss drivers. Management utilizes various economic indicators such as changes in unemployment rates, gross domestic product (GDP), property values, housing starts and other relevant factors as loss drivers and has determined that, due to historical volatility in economic data, two quarters currently represents a reasonable and supportable forecast period, followed by a six-period reversion to historical mean levels for each of the various economic indicators. The allowance evaluation also considers various qualitative factors, such as: (i) changes to lending policies, underwriting standards and/or management personnel performing such functions, (ii) delinquency and other credit quality trends, (iii) credit risk concentrations, if any, (iv) changes to the nature of the Company’s business impacting the loan portfolio, (v) and other external factors, that may include, but are not limited to, results of internal loan reviews, stress testing, examinations by bank regulatory agencies, or other events such as a natural disaster. The development of the loan loss allocation for pools of loans with similar risk characteristics requires a significant amount of judgment by management and the assumptions utilized are subject to changing economic conditions.
We identified the Company’s allowance for credit losses on loans as a critical audit matter, specifically the economic forecasts and qualitative factors, because they involved complex auditor judgment in the evaluation of the Company’s assumptions. Additionally, complex auditor judgment was required to examine the methodology that underpins the allowance for credit losses on pools of loans with similar risk characteristics. This includes modeling of PD, LGD, economic forecasts, and qualitative factors.
Our audit procedures related to this critical audit matter included the following, among others:
•We obtained an understanding of the relevant controls related to the allowance for credit losses on loans and tested such controls for design and operating effectiveness, including those over model approval, validation and approval of key data inputs such as economic forecasts and qualitative factors.
•We tested the completeness and accuracy of data used by management in determining inputs to the PD and LGD, by agreeing those inputs to internal or external information sources.
•We evaluated management’s judgments used in the identification of peer banks for PD and LGD calculations, by comparing peer banks to those used in prior periods and to external information sources.
•We evaluated management’s forecasts of future economic indicators for reasonableness, which included unemployment, housing price index, and national GDP growth, among others, by comparing these forecasts to external and internal information sources.
•We evaluated management’s judgments and assumptions used in the development of the qualitative factors for reasonableness, and tested the reliability of the underlying data on which these factors are based, by comparing information to source documents and external information sources.
/s/
We have served as the Company's auditor since 2015.
March 11, 2024
53
BAR HARBOR BANKSHARES AND SUBSIDIARIES
CONSOLIDATED BALANCE SHEETS
(in thousands, except share data) |
| December 31, 2023 |
| December 31, 2022 | ||
Assets |
|
|
|
| ||
Cash and cash equivalents: | ||||||
Cash and due from banks | $ | | $ | | ||
Interest-earning deposits with other banks |
| |
| | ||
Total cash and cash equivalents |
| |
| | ||
Securities: | ||||||
Securities available for sale |
| |
| | ||
Federal Home Loan Bank stock |
| |
| | ||
Total securities |
| |
| | ||
Loans held for sale | | — | ||||
Total loans |
| |
| | ||
Less: Allowance for credit losses |
| ( |
| ( | ||
Net loans |
| |
| | ||
Premises and equipment, net |
| |
| | ||
Other real estate owned |
| — |
| — | ||
Goodwill |
| |
| | ||
Other intangible assets |
| |
| | ||
Cash surrender value of bank-owned life insurance |
| |
| | ||
Deferred tax assets, net |
| |
| | ||
Other assets |
| |
| | ||
Total assets | $ | | $ | | ||
Liabilities |
|
|
|
| ||
Deposits: |
|
|
|
| ||
Demand | $ | | $ | | ||
NOW |
| |
| | ||
Savings |
| |
| | ||
Money market |
| |
| | ||
Time |
| |
| | ||
Total deposits |
| |
| | ||
Borrowings: |
|
|
|
| ||
Senior |
| |
| | ||
Subordinated |
| |
| | ||
Total borrowings |
| |
| | ||
Other liabilities |
| |
| | ||
Total liabilities |
| |
| | ||
Shareholders’ equity |
|
| ||||
Capital stock, par value $ |
| |
| | ||
Additional paid-in capital |
| |
| | ||
Retained earnings |
| |
| | ||
Accumulated other comprehensive loss |
| ( |
| ( | ||
Less: |
| ( |
| ( | ||
Total shareholders’ equity |
| |
| | ||
Total liabilities and shareholders’ equity | $ | | $ | |
The accompanying notes are an integral part of these consolidated financial statements.
54
BAR HARBOR BANKSHARES AND SUBSIDIARIES
CONSOLIDATED STATEMENTS OF INCOME
Years Ended December 31, | |||||||||
(in thousands, except earnings per share data) |
| 2023 |
| 2022 |
| 2021 | |||
Interest and dividend income | |||||||||
Loans | $ | | $ | | $ | | |||
Securities and other |
| |
| |
| | |||
Total interest and dividend income |
| |
| |
| | |||
Interest expense |
|
|
|
|
|
| |||
Deposits |
| |
| |
| | |||
Borrowings |
| |
| |
| | |||
Total interest expense |
| |
| |
| | |||
Net interest income |
| |
| |
| | |||
Provision for credit losses |
| |
| |
| ( | |||
Net interest income after provision for credit losses |
| |
| |
| | |||
Non-interest income |
|
|
|
|
|
| |||
Trust and investment management fee income |
| |
| |
| | |||
Customer service fees |
| |
| |
| | |||
Gain on sales of securities, net |
| |
| |
| | |||
Mortgage banking income | | | | ||||||
Bank-owned life insurance income |
| |
| |
| | |||
Customer derivative income |
| |
| |
| | |||
Other income |
| |
| |
| | |||
Total non-interest income |
| |
| |
| | |||
Non-interest expense |
|
|
|
|
|
| |||
Salaries and employee benefits |
| |
| |
| | |||
Occupancy and equipment |
| |
| |
| | |||
Loss on sales of premises and equipment, net |
| |
| |
| | |||
Outside services |
| |
| |
| | |||
Professional services |
| |
| |
| | |||
Communication |
| |
| |
| | |||
Marketing |
| |
| |
| | |||
Amortization of intangible assets |
| |
| |
| | |||
Loss on debt extinguishment | — | — | | ||||||
Acquisition, conversion and other expenses |
| |
| |
| | |||
Provision for unfunded commitments | ( |
| | | |||||
Other expenses |
| |
| |
| | |||
Total non-interest expense |
| |
| |
| | |||
Income before income taxes |
| |
| |
| | |||
Income tax expense |
| |
| |
| | |||
Net income | $ | | $ | | $ | | |||
Earnings per share: |
|
|
|
|
|
| |||
Basic | $ | | $ | | $ | | |||
Diluted | $ | | $ | | $ | | |||
Weighted average common shares outstanding: |
|
|
|
|
|
| |||
Basic |
| |
| |
| | |||
Diluted |
| |
| |
| | |||
The accompanying notes are an integral part of these consolidated financial statements.
55
BAR HARBOR BANKSHARES AND SUBSIDIARIES
CONSOLIDATED STATEMENTS OF COMPREHENSIVE (LOSS) INCOME
|
| ||||||||
Years Ended December 31, | |||||||||
(in thousands) |
| 2023 |
| 2022 |
| 2021 | |||
Net income | $ | | $ | | $ | | |||
Other comprehensive income (loss), before tax: |
|
|
|
|
|
| |||
Changes in unrealized gain (loss) on securities available for sale |
| |
| ( |
| ( | |||
Changes in unrealized gain (loss) on hedging derivatives |
| |
| ( |
| | |||
Changes in unrealized gain (loss) on pension |
| |
| ( |
| | |||
Income taxes related to other comprehensive income (loss): |
|
|
|
|
| ||||
Changes in unrealized (gain) loss on securities available for sale |
| ( |
| |
| | |||
Changes in unrealized (gain) loss on hedging derivatives |
| ( |
| |
| ( | |||
Changes in unrealized (gain) loss on pension |
| ( |
| |
| ( | |||
Total other comprehensive income (loss) |
| |
| ( |
| ( | |||
Total comprehensive income (loss) | $ | | $ | ( | $ | | |||
The accompanying notes are an integral part of these consolidated financial statements.
56
BAR HARBOR BANKSHARES AND SUBSIDIARIES
CONSOLIDATED STATEMENTS OF CHANGES IN SHAREHOLDERS’ EQUITY
|
|
| Accumulated |
|
| |||||||||||||
Common | Additional | other | ||||||||||||||||
stock | paid-in | Retained | comprehensive | Treasury | ||||||||||||||
(in thousands, except per share data) |
| amount |
| capital |
| earnings |
| income (loss) |
| stock |
| Total | ||||||
Balance at December 31, 2020 | $ | | $ | | $ | | $ | | $ | ( | $ | | ||||||
Net income |
| — |
| — |
| |
| — |
| — |
| | ||||||
Other comprehensive (loss) | — |
| — |
| — |
| ( |
| — | ( | ||||||||
Impact of ASC 326 adoption | — | — | ( | — | — | ( | ||||||||||||
Cash dividends declared ($ | — |
| — |
| ( |
| — |
| — | ( | ||||||||
Net issuance ( |
| — |
| ( |
| — |
| — |
| |
| ( | ||||||
Recognition of stock based compensation |
| — |
| |
| — |
| — |
| — |
| | ||||||
Balance at December 31, 2021 | $ | | $ | | $ | | $ | | $ | ( | $ | | ||||||
Net income |
| — |
| — |
| |
| — |
| — |
| | ||||||
Other comprehensive loss |
| — |
| — |
| — |
| ( |
| — |
| ( | ||||||
Cash dividends declared ($ |
| — |
| — |
| ( |
| — |
| — |
| ( | ||||||
Net issuance ( |
| — |
| ( |
| — |
| — |
| |
| ( | ||||||
Recognition of stock based compensation |
| — |
| |
| — |
| — |
| — |
| | ||||||
Balance at December 31, 2022 | $ | | $ | | $ | | $ | ( | $ | ( | $ | | ||||||
Net income |
| — |
| — |
| |
| — |
| — |
| | ||||||
Other comprehensive income | — |
| — |
| — |
| |
| — | | ||||||||
Cash dividends declared ($ | — |
| — |
| ( |
| — |
| — | ( | ||||||||
Net issuance ( |
| — |
| ( |
| — |
| — |
| |
| ( | ||||||
Recognition of stock based compensation |
| — |
| |
| — |
| — |
| — |
| | ||||||
Balance at December 31, 2023 | $ | | $ | | $ | | $ | ( | $ | ( | $ | | ||||||
The accompanying notes are an integral part of these consolidated financial statements.
57
BAR HARBOR BANKSHARES AND SUBSIDIARIES
CONSOLIDATED STATEMENTS OF CASH FLOWS
Year Ended December 31, | |||||||||
(in thousands) |
| 2023 |
| 2022 | 2021 | ||||
Cash flows from operating activities: |
|
|
|
|
| ||||
Net income |
| $ | | $ | | $ | | ||
Adjustments to reconcile net income to net cash provided by operating activities: |
|
|
| ||||||
Net change in loans held for sale | ( | | | ||||||
Provision for credit losses |
| |
| |
| ( | |||
Net amortization of securities |
| |
| |
| | |||
Deferred tax (benefit) expense | ( | ( | | ||||||
Change in unamortized net loan costs and premiums |
| ( |
| |
| ( | |||
Premises and equipment depreciation |
| |
| |
| | |||
Stock-based compensation expense |
| |
| |
| | |||
Accretion of purchase accounting entries, net |
| — |
| — |
| ( | |||
Amortization of other intangibles |
| |
| |
| | |||
Income from cash surrender value of bank-owned life insurance policies |
| ( |
| ( |
| ( | |||
Gain on sales of securities, net |
| ( |
| ( |
| ( | |||
Amortization of right-of-use lease assets | | | | ||||||
Decrease in lease liabilities | ( | ( | ( | ||||||
Gain on premises and equipment, net |
| |
| |
| | |||
Net change in other assets and liabilities |
| ( |
| ( |
| ( | |||
Net cash provided by operating activities |
| |
| |
| | |||
Cash flows from investing activities: |
|
|
|
|
|
| |||
Proceeds from sales, maturities, calls and prepayments of securities available for sale |
| |
| |
| | |||
Purchases of securities available for sale |
| ( |
| ( |
| ( | |||
Net change in loans |
| ( |
| ( |
| | |||
Purchase of Federal Home Loan Bank stock |
| ( |
| ( |
| ( | |||
Proceeds from sale of Federal Home Loan Bank stock |
| |
| |
| | |||
Purchase of premises and equipment, net |
| ( |
| ( |
| ( | |||
Proceeds from sale of premises and equipment | | — | — | ||||||
Proceeds from premises held for sale | — | — | | ||||||
Proceeds from death benefit of bank-owned life insurance policy | | — | | ||||||
Net cash used in investing activities |
| ( |
| ( |
| ( | |||
Cash flows from financing activities: |
|
|
|
|
|
| |||
Net change in deposits |
| |
| ( |
| | |||
Net change in short-term borrowings | ( | | | ||||||
Repayments of long-term borrowings | ( | ( | ( | ||||||
Net issuance to employee stock plans | ( | ( | ( | ||||||
Cash dividends paid on common stock |
| ( |
| ( |
| ( | |||
Net cash provided by financing activities |
| |
| |
| ( | |||
Net change in cash and cash equivalents |
| |
| ( |
| | |||
Cash and cash equivalents at beginning of year |
| |
| |
| | |||
Cash and cash equivalents at end of period | $ | | $ | | $ | | |||
Supplemental cash flow information: |
|
|
|
|
|
| |||
Interest paid | $ | | $ | | $ | | |||
Income taxes paid, net |
| |
| |
| | |||
The accompanying notes are an integral part of these consolidated financial statements.
58
BAR HARBOR BANKSHARES AND SUBSIDIARIES
NOTES TO CONSOLIDATED FINANCIAL STATEMENTS
NOTE 1. SUMMARY OF SIGNIFICANT ACCOUNTING POLICIES
Basis of presentation: The consolidated financial statements (the “financial statements”) of Bar Harbor Bankshares and its subsidiaries (the “Company,” or “we”) have been prepared in conformity with accounting principles generally accepted in the United States of America (“U.S. GAAP”). Bar Harbor Bankshares is a Maine Financial Institution Holding Company for the purposes of the laws of the State of Maine, and as such, is subject to the jurisdiction of the Superintendent of the Maine Bureau of Financial Institutions. These financial statements include the accounts of the Company, its wholly-owned subsidiary Bar Harbor Bank & Trust (the "Bank") and the Bank’s consolidated subsidiaries. The results of operations of companies or assets acquired are included only from the dates of acquisition. All material wholly-owned and majority-owned subsidiaries are consolidated unless U.S. GAAP requires otherwise.
Consolidation: The accompanying consolidated financial statements have been prepared in accordance with U.S. GAAP. The consolidated financial statements include the accounts of Bar Harbor Bankshares and its wholly-owned subsidiaries, Bar Harbor Bank & Trust, Bar Harbor Wealth Management, and Cottage Street Corporation. In 2022, Charter Trust Company and Bar Harbor Trust Services merged to become Bar Harbor Wealth Management. All significant inter-company balances and transactions have been eliminated in consolidation. Assets held in a fiduciary capacity are not assets of the Company, but assets of customers, and therefore, are not included in the consolidated balance sheet.
Reclassifications: Whenever necessary, amounts in the prior years’ financial statements are reclassified to conform to current presentation. The reclassifications had no impact on net income in the Company’s consolidated income statement.
Use of estimates: In preparing financial statements in conformity with U.S. GAAP, management is required to make estimates and assumptions that affect the reported amount of assets and liabilities, the disclosure of contingent assets and liabilities at the date of the financial statements and revenues and expenses during the reporting period. Actual results could differ from those estimates. Material estimates that are particularly susceptible to change in the near term relate to the allowance for credit losses (“ACL”), off-balance sheet credit exposures, available for sale securities, the accounting for business combinations including subsequent impairment analyses for goodwill and other intangible assets, accounting for income taxes, post-retirement benefits, and asset impairment assessments.
Subsequent Events: Events and transactions subsequent to December 31, 2023 are evaluated for potential recognition or disclosure as required by GAAP.
Securities: All securities held at December 31, 2023 and 2022 were classified as available-for-sale (“AFS”). Available for sale securities primarily consist of mortgage-backed securities, obligations of state and political subdivisions thereof, and corporate bonds and are carried at estimated fair value. Changes in estimated fair value of AFS securities, net of applicable income taxes, are reported in accumulated other comprehensive income (loss) as a separate component of shareholders’ equity unless deemed to have a credit loss as discussed below.
Premiums and discounts on securities are amortized and accreted over the term or to first call of the securities using the level yield method. Municipal security premiums are accreted over full term straight-line and discounts are amortized over the call term on a straight light basis. Gains and losses on the sale of securities are recognized at the trade date using the specific-identification method and are shown separately in the Consolidated Statements of Income.
Allowance for Credit Loss on AFS Debt Securities: Credit quality of AFS debt securities is monitored through credit ratings from various rating agencies and substantial price changes. Credit ratings express opinions about the credit quality of a security and are utilized by us to make informed decisions. Securities are triggered for further review in the quarter if the security has significant fluctuations in ratings, drops below investment grade, or significant pricing changes. For securities without credit ratings, we utilize other financial information indicating the financial health of the underlying
59
municipality, agency, or organization associated with the underlying security. If this assessment indicates that a credit loss exists, the present value of cash flows expected to be collected from the security are compared to the amortized cost basis of the security. If the present value of cash flows expected to be collected is less than the amortized cost basis, a credit loss exists and an allowance on AFS debt securities is recorded for the credit loss, limited by the amount that the fair value is less than the amortized cost basis. When assessing an AFS debt security for credit loss, securities with identical CUSIPs are pooled together to assess for impairment using the average cost basis. Any impairment that has not been recorded through an allowance is recognized in other comprehensive income.
A change in the allowance on AFS debt securities may be in full or a portion thereof, is recorded as expense (credit) within provision for credit losses on the consolidated statements of income. Losses are charged against the allowance when management believes an AFS debt security is uncollectible based on the above described analysis. As of December 31, 2023 and December 31, 2022, there were no allowances carried on AFS debt securities. Refer to Note 2 – Securities Available for Sale of the consolidated financial statements for further discussion.
Federal Home Loan Bank Stock: Federal Home Loan Bank (“FHLB”) stock is a non-marketable equity security and therefore is reported at cost, which generally equals par value. Shares held in excess of the minimum required by the FHLB are generally redeemable at par value. Dividends from FHLB stock are reported in interest and dividend income.
FHLB stock is periodically evaluated for impairment based on the capital adequacy of the FHLB and its overall financial condition. Based on the capital adequacy, liquidity position and sustained profitability of the FHLB, there was no impairment related to the carrying amount of FHLB stock as of December 31, 2023 and 2022.
Loans Held for Sale: Residential loans originated with the intent to be sold in the secondary market are accounted for at fair value. Fair value is primarily determined based on quoted prices for similar loans in active markets. Residential loans held for sale are generally sold with servicing rights retained. The carrying value of loans sold is reduced by the amount allocated to the servicing right. Gains and losses on sales of residential loans (sales proceeds minus carrying value) are recorded in non-interest income. The loan portfolio is consistently evaluated in conjunction with asset/liability management practices, and certain residential mortgage loans may be sold to manage interest rate exposure and for other business purposes, including generating fee income through mortgage sale gains.
Loans: Loans held for investment are reported at amortized cost. Amortized cost is the principal balance outstanding net of the unamortized balance of any deferred fees or costs and the unamortized balance of any premiums or discounts on loans purchased or acquired through mergers.
For originated loans, loan fees and certain direct origination costs are deferred and amortized into interest income over the contractual term of the loan using the level-yield method over the estimated lives of the related loans. When a loan is paid off, the unamortized portion of deferred fees or costs are recognized in interest income. Interest income on originated loans is accrued based upon the daily principal amount outstanding except for loans on non-accrual status.
For acquired loans, interest income is accrued based upon the daily principal amount outstanding and is then further adjusted by the accretion of any discount or amortization of any premium associated with the loan that was recognized based on the acquisition date fair value. When a loan is paid off, the unamortized portion of any premiums or discounts on loans are recognized in interest income.
Purchase Credit Deteriorated (PCD) Loans: Loans acquired in acquisitions include some loans that have experienced more than insignificant credit deterioration since origination. The initial ACL is determined on a collective basis and allocated to the individual loans. The sum of the loan’s purchase price and acl becomes its initial amortized cost. The difference between the initial amortized cost and the par value of the loan is a discount or premium, which is amortized into interest income over the life of the loan. Subsequent changes to the allowance for credit losses are recorded through provision expense.
Non-performing loans: Residential real estate and home equity loans are generally placed on non-accrual status when reaching 90 days past due, are in process of foreclosure, or sooner if considered appropriate by management. Consumer other loans are generally placed on non-accrual when reaching 90 days or more past due, or sooner if considered
60
appropriate by management. Secured consumer other loans are written down to net realizable value and unsecured consumer loans are charged-off upon reaching 120 days past due. Commercial real estate loans and commercial and industrial loans that are 90 days or more past due are generally placed on non-accrual status, unless secured by sufficient cash or other assets immediately convertible to cash, and the loan is in the process of collection. Commercial real estate and commercial and industrial loans may be placed on non-accrual status prior to the 90 days delinquency date if considered appropriate by management.
When a loan has been placed on non-accrual status, previously accrued and uncollected interest is reversed against interest on the loan. The interest on non-accrual loans is accounted for using the cash-basis or cost-recovery method depending on corresponding credit risk, until qualifying for return to accrual status. A loan can be returned to accrual status when collectability of principal is reasonably assured and the loan has performed for a period of time, a minimum of six months.
Acquired loans that meet the criteria for non-accrual of interest prior to an acquisition are considered non-performing acquired loans that meet the criteria for non-accrual consistent with originated loans.
Loan Modifications to Borrowers Experiencing Financial Difficulty: In January 2023, the Company adopted ASU 2022-02, “Financial Instruments - Credit Losses (Topic 326): Troubled Debt Restructurings and Vintage Disclosures” which eliminated the accounting guidance for TDRs while enhancing disclosure requirements for certain loan refinancing and restructurings by creditors when a borrower is experiencing financial difficulty. This guidance was applied on a prospective basis. Upon adoption of this guidance, we are no longer required to establish a specific reserve for modifications to borrowers experiencing financial difficulty. Instead, modified loans are generally included in their respective category and a historical loss rate is applied to the current loan balance to arrive at the quantitative baseline portion of the ACL.
Loans are considered to have been modified when, due to a borrower’s financial difficulties, certain concessions are made to the borrower that would not otherwise consider. Modifications may include interest rate reductions, principal or interest forgiveness, forbearance, and other actions intended to minimize economic loss and to avoid foreclosure or repossession of collateral. Generally, a non-accrual loan that has been modified to borrowers experiencing financial difficulty will remain on non-accrual status for a period of at least
However, performance prior to the modification, or significant events that coincide with the modification, are included in assessing whether the borrower can meet the new terms and may result in the loan being returned to accrual status at the time of loan modification or after a shorter performance period. If the borrower’s ability to meet the revised payment schedule is uncertain, the loan remains on non-accrual status.
Allowance for Credit Losses: The allowance for credit losses (the “allowance”) is a significant accounting estimate used in the preparation of the Company’s consolidated financial statements. The allowance is comprised of the allowance for credit losses on loans and the allowance for off-balance sheet credit exposures, which is accounted for as a separate liability in other liabilities on the balance sheet. The level of the allowance represents management’s estimate of expected credit losses over the expected life of the loans at the balance sheet date.
The allowance for credit losses is a valuation account that is deducted from the amortized cost basis of loans to present the net amount expected to be collected on the loans. Loans, or portions thereof, are charged off against the allowance when they are deemed uncollectible. Expected recoveries do not exceed the aggregate of amounts previously charged-off and expected to be charged- off. The allowance is comprised of reserves measured on a collective (pool) basis based on a lifetime loss-rate model when similar risk characteristics exist. Loans that do not share risk characteristics are evaluated on an individual basis, which generally includes larger non-accruing commercial loans.
The discounted cash flow (“DCF”) method is used to estimate expected credit losses for all loan portfolio segments measured on a collective (pool) basis. For each loan segment, cash flow projections are generated at the instrument level wherein payment expectations are adjusted for estimated prepayment speeds, probability of default, and loss given default. The modeling of prepayment speeds is based on historical internal data.
61
Regression analysis of historical internal and peer data is used to determine suitable loss drivers to utilize when modeling lifetime probability of default. This analysis also determines how expected probability of default and loss given default will react to forecasted levels of the loss drivers. For all loan pools utilizing the DCF method, management utilizes various economic indicators such as changes in unemployment rates, gross domestic product, real estate values, and other relevant factors as loss drivers. For all DCF models, management has determined that due to historic volatility in economic data, two quarters currently represents a reasonable and supportable forecast period, followed by a six-period reversion to historical mean levels for each of the various economic indicators.
The combination of adjustments for credit expectations (default and loss) and timing expectations (prepayment, curtailment, and time to recovery) produces an expected cash flow stream at the instrument level. Specific instrument effective yields are calculated, net of the impacts of prepayment assumptions, and the instrument expected cash flows are then discounted at that effective yield to produce an instrument-level Net Present Value (“NPV”). An allowance is established for the difference between the instrument’s NPV and amortized cost basis.
The allowance evaluation also considers various qualitative factors, such as: (i) changes to lending policies, underwriting standards and/or management personnel performing such functions, (ii) delinquency and other credit quality trends, (iii) credit risk concentrations, if any, (iv) changes to the nature of the Company's business impacting the loan portfolio, and (v) other external factors, that may include, but are not limited to, results of internal loan reviews, stress testing, examinations by bank regulatory agencies, or other events such as a natural disaster.
Arriving at an appropriate level of allowance involves a high degree of judgment. The determination of the adequacy of the allowance and provisioning for estimated losses is evaluated regularly based on review of loans, with particular emphasis on non-performing and other loans that management believes warrant special consideration. While management uses available information to recognize losses on loans, changing economic conditions and the economic prospects of the borrowers may necessitate future additions or reductions to the allowance.
Individually Evaluated Loans: Loans that do not share risk characteristics with existing pools are evaluated on an individual basis. For loans that are individually evaluated and collateral dependent, financial loans where management has determined that foreclosure of the collateral is probable, or where the borrower is experiencing financial difficulty and management expects repayment of the financial asset to be provided substantially through the sale of the collateral, the ACL is measured based on the difference between the fair value of the collateral and the amortized cost basis of the asset as of the measurement date. When repayment is expected to be from the operation of the collateral or going concern, the specific credit loss reserve is calculated as the amount by which the amortized cost basis of the financial asset exceeds the NPV from the operation of the collateral. When repayment is expected to be from the sale of the collateral, the specific credit loss reserve is calculated as the amount by which the amortized costs basis of the financial asset exceeds the fair value of the underlying collateral less estimated cost to sell. The allowance may be zero if the fair value of the collateral at the measurement date exceeds the amortized cost basis of the financial asset.
Accrued Interest. Accrued interest receivable balances are presented within other assets on the consolidated balance sheet. Accrued interest is excluded from the measurement of the allowance for credit losses, including investments and loans. Generally, accrued interest is reversed when a loan is placed on non-accrual or is written-off. Current year accrued interest is reversed through interest income while accrued interest from prior years is written-off through the ACL. Historically, we have not experienced uncollectible accrued interest receivable on investment debt securities.
Allowance for off-balance sheet credit exposures: The exposure is a component of other liabilities in the consolidated balance sheet and represents the estimate for probable credit losses inherent in unfunded commitments to extend credit. Unfunded commitments to extend credit include unused portions of lines of credit and standby and commercial letters of credit. The process used to determine the allowance for these exposures is consistent with the process for determining the allowance for loans, as adjusted for estimated funding probabilities or loan equivalency factors. A charge (credit) to provision for credit losses on the consolidated statements of income is made to account for the change in the allowance on off-balance sheet exposures between reporting periods.
Premises and Equipment: Land is carried at cost. Premises and equipment and related improvements are stated at cost less accumulated depreciation. Depreciation is computed on the straight-line method over the lesser of the lease term or
62
estimated useful lives of related assets; generally to
Transfers of Financial Assets: Transfers of an entire financial asset, group of entire financial assets, or a participating interest in an entire financial asset are accounted for as sales when control over the assets has been surrendered. Control over transferred assets is deemed to be surrendered when (1) the assets have been isolated from total Company assets, (2) the transferee obtains the right to pledge or exchange the transferred assets, and (3) effective control is not maintained over the transferred assets.
Other Real Estate Owned: Other real estate owned consists of properties acquired through foreclosure proceedings or acceptance of a deed-in-lieu of foreclosure. These properties are recorded at fair value less estimated costs to sell the property. Initially at transfer if the recorded investment in the loan exceeds the property’s fair value at the time of acquisition, a charge-off is recorded against the allowance. If the fair value of the property initially at transfer exceeds the carrying amount of the loan, the excess is recorded either as a recovery to the allowance if a charge-off had previously been recorded, or as a gain on initial transfer in other non-interest income. Subsequent decreases in the property’s fair value and operating expenses of the property are recognized through charges to other non-interest expense. The fair value of the property acquired and ongoing valuation is based on third-party appraisals, broker price opinions, recent sales activity, or a combination thereof, subject to management judgment. Due to changing market conditions the amount ultimately realized on the other real estate owned may differ from the amounts reflected in the financial statements.
Goodwill: Goodwill represents the excess of the purchase price over the fair value of the net assets acquired in a business combination. Goodwill is assessed annually for impairment, and more frequently if events or changes in circumstances indicate that there may be an impairment. Adverse changes in the economic environment, declining operations, unanticipated competition, loss of key personnel, or other factors could result in a decline in the implied fair value of goodwill. Subsequent reversals of goodwill impairment are prohibited.
Other Intangibles: Intangible assets are acquired assets that lack physical substance but can be distinguished from goodwill because of contractual or other legal rights or the asset is capable of being sold or exchanged either on its own or in combination with a related contract, asset or liability.
The fair values of these assets are generally determined based on appraisals and are subsequently amortized on a straight-line basis or an accelerated basis over their estimated lives. Management assesses the recoverability of these intangible assets at least annually or whenever events or changes in circumstances indicate that their carrying value may not be recoverable. If the carrying amount exceeds fair value, an impairment charge is recorded to income.
Bank-Owned Life Insurance: Bank-owned life insurance (“BOLI”) represents life insurance on the lives of certain current and retired employees who had provided positive consent allowing the Bank to be the beneficiary of such policies. Increases in the cash value of the policies, as well as insurance proceeds received in excess of the cash value, are recorded in other non-interest income, and are not subject to income taxes.
Capitalized Servicing Rights: Capitalized servicing rights are recognized as assets when residential loans are sold and the rights to service those loans are retained.
Capitalized servicing rights are initially recorded at fair value. Fair values are established by using a discounted cash flow model to calculate the present value of estimated future net servicing income. Changes in the fair value of capitalized servicing rights are primarily due to changes in valuation inputs, assumptions, and the collection and realization of expected cash flows. However, these capitalized servicing rights are amortized in proportion to and over the period of estimated net servicing income, which includes prepayment assumptions. An impairment analysis is prepared on a quarterly basis by estimating the fair value of the capitalized servicing rights and comparing that value to the carrying amount. A valuation allowance is established when the carrying amount of these capitalized servicing rights exceeds fair value. The capitalized servicing rights are included in other assets on the consolidated balance sheet.
63
Derivative Financial Instruments: Derivative instruments are recognized on the consolidated balance sheet at fair value. On the inception date, management designates whether the derivative is part of a hedging relationship (i.e., cash flow or fair value hedge). Management formally documents relationships between hedging instruments and hedged items, as well as its risk management objective and strategy for undertaking hedge transactions. Both at the hedge’s inception and on an ongoing basis, management assesses whether the derivatives used in hedging transactions are highly effective in offsetting the changes in cash flows or fair values of hedged items. The fair value of the derivative is reflected on the Consolidated Balance Sheet in either other assets or liabilities.
Changes in the fair value of derivative instruments that are highly effective and qualify as cash flow hedge are recorded in other comprehensive income (loss). Any ineffective portion is recorded in earnings. For fair value hedges that are highly effective, the gain or loss on the derivative and the loss or gain on the hedged item attributable to the hedged risk are both recognized in earnings, with the differences (if any) representing hedge ineffectiveness. Management discontinues hedge accounting when it is determined that the derivative is no longer highly effective in offsetting changes of the hedged risk on the hedged item, or determines that the designation of the derivative as a hedging instrument is no longer appropriate.
Net cash settlements on derivatives that qualify for hedge accounting are recorded in interest income or interest expense based on the item being hedged. Net cash settlements on derivatives that do not quality for hedge accounting are reporting in non-interest income. Cash flows on hedges are classified in the cash flow statement the same as cash flows of the items being hedged.
Commitments to fund mortgage loans with borrowers (interest rate locks) and forward commitments for the future delivery of these mortgage loans for sale on the secondary market are classified as free standing derivatives. These derivatives are designed to hedge against inherent interest rate and pricing risk associated with selling loans. The commitments to lend generally terminate once the loan is funded, the lock period expires or the borrower decides not to contract for the loan. The forward commitments generally terminate once the loan is sold or the commitment period expires. These commitments are considered derivatives which are accounted for by recognizing their estimated fair value on the Consolidated Balance Sheet in either other assets or other liabilities.
Senior and Subordinated Borrowings: Senior borrowings include retail and wholesale repurchase agreements, FHLB overnight, FHLB short-term and long-term advances, federal funds purchased, credit facilities, and line of credit advances. Subordinated borrowings consist of subordinated notes issued to investors. At times, posting of collateral is required for which it, cash, loans and/or investment securities are used.
Off-Balance Sheet Financial Instruments: Off-balance sheet financial instruments consist of commitments to extend credit, and unused or unfunded loan funds and letters of credit. These financial instruments are recorded in the consolidated financial statements when they are funded or related fees are incurred or received.
Stock Based Compensation: Equity award plans include stock options, restricted stock awards restricted stock units and performance stock units, which are described more fully in Note 13 – Stock Based Compensation Plans of the Consolidated Financial Statements. Stock based compensation expenses are recognized for stock options and restricted awards based on the fair value of these awards as of the grant date. For restricted stock units and performance stock units the expense is recognized over the vesting periods of the grants. Treasury shares are used for issuing shares upon option exercises, restricted stock awards, restricted stock unit vesting and performance stock unit vesting.
64
Pension Plan: The pension plan is an inherited, frozen, noncontributory, qualified, defined benefit plan for certain employees who met age and service requirements. This plan is described more fully in Note 8 – Employee Benefit Plans of the Consolidated Financial Statements. In order to measure the expense associated with the Plans, various assumptions are made including the discount rate, expected return on plan assets, anticipated mortality rates, and expected future healthcare costs. The assumptions are based on historical experience as well as current facts and circumstances. As of the measurement date (December 31, 2023), plan assets are determined based on fair value, generally representing observable market prices. The projected benefit obligation is primarily determined based on the present value of projected benefit distributions at an assumed discount rate.
Net periodic pension benefit costs include interest costs based on an assumed discount rate, the expected return on plan assets based on actuarially derived market-related values, and the amortization of net actuarial losses. Differences between expected and actual results in each year are included in the net actuarial gain or loss amount, which is recognized in other comprehensive income. The net actuarial gain or loss in excess of a
At the end of each year the Plans’ assets and obligations are examined to determine its funded status as of the end of the fiscal year and recognizes those changes in other comprehensive income, net of tax. The plans over or under funded status is recognized in the consolidated balance sheet as an asset or liability, respectively.
401(k) Plan: The employer sponsored 401(k) plan to which participants may make contributions in the form of salary deferrals also provides participants with matching contributions in accordance with the terms of the plan. Contributions due under the terms of the defined contribution plans are accrued through compensation expense as earned by employees.
Income Taxes: The asset and liability method of accounting for income taxes. Under this method, deferred tax assets and liabilities are recognized for the future tax consequences attributable to differences between the financial statement carrying amounts of existing assets and liabilities and their respective tax bases. If current available information indicates that it is more likely than not that deferred tax assets will not be realized, a valuation allowance is established. Deferred tax assets and liabilities are measured using enacted tax rates expected to apply to taxable income in the years in which those temporary differences are expected to be recovered or settled. The effect on deferred tax assets and liabilities of a change in tax rates is recognized in income in the period that includes the enactment date.
Treasury Stock: Shares of the Company’s common stock that are repurchased are recorded in treasury stock at cost. On the date of subsequent re-issuance, the treasury stock account is reduced by the cost of such stock on an average cost basis.
Earnings Per Share: Basic earnings per share excludes dilution and is computed by dividing income available to common shareholders by the weighted average number of common shares outstanding for the period. Diluted earnings per share reflect the potential dilution that could occur if securities or other contracts to issue common stock were exercised or converted into common stock or resulted in the issuance of common stock that then shared in earnings, such as dilutive stock options.
Revenue Recognition: Non-interest revenue is recognized in accordance with ASC 606, "Revenue from Contracts with Customers." ASC 606 requires a five step process: (1) identify the contract(s) with a customer, (2) identify the performance obligations in the contract, (3) determine the transaction price, (4) allocate the transaction price to the performance obligations in the contract, and (5) recognize revenue when (or as) a performance obligation is satisfied. Revenue recognition under ASC 606 depicts the transfer of promised goods or services to customers in an amount that reflects the consideration to which the entity expects to be entitled in exchange for the goods or service. See Note 15 – Revenue from Contracts with Customers of the Company’s Consolidated Financial Statements for additional information on revenue recognition.
Wealth Management: Wealth management assets held in a fiduciary or agent capacity are not included in the accompanying Consolidated Balance Sheets because the ownership is held by customers. Trust and investment management fees are primarily comprised of fees earned from investment management, trust administration, tax return preparation, and financial planning. The performance obligation for revenue recognition is generally satisfied over time
65
and the resulting in monthly fee income, based on the daily accrual of the market value of the investment accounts and the applicable fee rate.
Marketing Costs: Marketing costs are expensed as incurred.
Segment Reporting: An operating segment is defined as a component of a business for which separate financial information is available that is evaluated regularly by the chief operating decision-maker in deciding how to allocate resources and evaluate performance. Operations of the Company are solely within community banking industry and include traditional community banking services, including lending activities, acceptance of demand, savings and time deposits, business services, investment management, trust and third-party brokerage services. These products and services have similar distribution methods, types of customers and regulatory responsibilities. Accordingly, segment information is not presented in the Consolidated Financial Statements.
Recent Accounting Pronouncements
The following table provides a brief description of accounting standards that could have a material impact to the Company’s consolidated financial statements upon adoption:
Standard |
|
| Description |
|
| Required Date |
|
| Effect on financial statements |
Standards Adopted in 2023 | |||||||||
ASU 2022-02 Financial Instruments - Credit Losses (Topic 326): Troubled Debt Restructurings ("TDRs") and Vintage Disclosures | The amendments in this update eliminate TDR recognition and measurement guidance and, instead, require that an entity evaluate (consistent with the accounting for other loan modifications) whether the modification represents a new loan or a continuation of an existing loan. The amendments enhance existing disclosure requirements and introduce new requirements related to certain modifications of receivables made to borrowers experiencing financial difficulty. | January 1, 2023 | The adoption of this ASU did not have a material impact on our consolidated financial statements. | ||||||
ASU 2023-02 Investments - Equity Method and Joint Ventures (Topic 323): Accounting for Investments in Tax Credit Structures Using the Proportional Amortization Method | The amendments in this update permit reporting entities to elect to account for their tax equity investments, regardless of the tax credit program from which the income tax credits are received, using the proportional amortization method if certain conditions are met. | December 15, 2023, including interim periods within the fiscal year | The adoption of this ASU did not have a material impact on our consolidated financial statements. | ||||||
Standards Not Yet Adopted | |||||||||
ASU 2023-09 Income Taxes (Topic 740): Improvements to Income Tax Disclosures | The amendments in this update require that public business entities on an annual basis (1) disclose specific categories in the rate reconciliation and (2) provide additional information for reconciling items that meet a quantitative threshold (if the effect of those reconciling items is equal to or greater than 5 percent of the amount computed by multiplying pretax income [or loss] by the applicable statutory income tax rate). | For public business entities, the amendments in this update are effective for | We do not expect adoption of this ASU to have a material impact on our consolidated financial statements. | ||||||
1
66
NOTE 2. SECURITIES AVAILABLE FOR SALE
The following is a summary of securities available for sale:
Gross | Gross | |||||||||||
Unrealized | Unrealized | |||||||||||
(in thousands) |
| Amortized Cost |
| Gains |
| Losses |
| Fair Value | ||||
December 31, 2023 |
|
|
|
|
|
|
|
| ||||
Debt securities: |
|
|
|
|
|
|
|
| ||||
Obligations of US Government-sponsored enterprises | $ | | $ | — | $ | ( | $ | | ||||
Mortgage-backed securities and collateralized mortgage obligations: |
|
|
|
|
|
|
|
| ||||
US Government-sponsored enterprises | | | ( | | ||||||||
US Government agency |
| |
| |
| ( |
| | ||||
Private label |
| |
| |
| ( |
| | ||||
Obligations of states and political subdivisions thereof |
| |
| |
| ( |
| | ||||
Corporate bonds |
| |
| |
| ( |
| | ||||
Total securities available for sale | $ | | $ | | $ | ( | $ | | ||||
Gross | Gross | |||||||||||
Unrealized | Unrealized | |||||||||||
(in thousands) |
| Amortized Cost |
| Gains |
| Losses |
| Fair Value | ||||
December 31, 2022 |
|
|
|
|
|
|
|
| ||||
Debt securities: |
|
|
|
|
|
|
|
| ||||
Obligations of US Government-sponsored enterprises | $ | | $ | | $ | ( | $ | | ||||
Mortgage-backed securities and collateralized mortgage obligations: |
|
|
|
|
|
|
|
| ||||
US Government-sponsored enterprises | | | ( | | ||||||||
US Government agency |
| |
| |
| ( |
| | ||||
Private label |
| |
| |
| ( |
| | ||||
Obligations of states and political subdivisions thereof |
| |
| |
| ( |
| | ||||
Corporate bonds |
| |
| |
| ( |
| | ||||
Total securities available for sale | $ | | $ | | $ | ( | $ | | ||||
Credit Quality Information
We monitor the credit quality of available for sale debt securities through credit ratings from various rating agencies and substantial price changes. In an effort to make informed decisions, we utilize credit ratings that express opinions about the credit quality of a security. Securities are triggered for further review in the quarter if the security has significant fluctuations in ratings, drops below investment-grade, or significant pricing changes. For securities without credit ratings, we utilize other financial information indicating the financial health of the underlying municipality, agency, or organization associated with the underlying security.
As of December 31, 2023 and 2022, we carried
The amortized cost and estimated fair value of available for sale securities segregated by contractual maturity at December 31, 2023 are presented below. Expected maturities may differ from contractual maturities because issuers may have the right to call or prepay obligations. Mortgage-backed securities are shown in total, as their maturities are highly variable.
67
Available for sale | ||||||
(in thousands) |
| Amortized Cost |
| Fair Value | ||
Within 1 year |
| $ | | $ | | |
Over 1 year to 5 years |
| |
| | ||
Over 5 years to 10 years |
| |
| | ||
Over 10 years |
| |
| | ||
Total bonds and obligations |
| |
| | ||
Mortgage-backed securities and collateralized mortgage obligations |
| |
| | ||
Total securities available for sale | $ | | $ | | ||
The following table summarizes proceeds from the sale of AFS securities and realized gains and losses:
Proceeds from Sale | ||||||||||||
of Securities | ||||||||||||
(in thousands) |
| Available for Sale |
| Realized Gains |
| Realized Losses |
| Net | ||||
2023 | $ | | $ | | $ | — | $ | | ||||
2022 | | | ( | | ||||||||
2021 |
| | | ( | | |||||||
There were
Securities with unrealized losses, segregated by the duration of their continuous unrealized loss positions, are summarized as follows:
Less Than Twelve Months | Over Twelve Months | Total | ||||||||||||||||
Gross |
|
| Gross |
|
| Gross |
| |||||||||||
Unrealized | Fair | Unrealized | Fair | Unrealized | Fair | |||||||||||||
(in thousands) |
| Losses |
| Value |
| Losses |
| Value |
| Losses |
| Value | ||||||
December 31, 2023 |
|
|
|
|
|
|
|
|
|
|
|
| ||||||
Debt securities: |
|
|
|
|
|
|
|
|
|
|
|
| ||||||
Obligations of US Government-sponsored enterprises | $ | | $ | | $ | | $ | | $ | | $ | | ||||||
Mortgage-backed securities and collateralized mortgage obligations: |
|
|
|
|
|
|
|
|
|
|
|
| ||||||
US Government-sponsored enterprises | | | | | | | ||||||||||||
US Government agency |
| |
| |
| |
| |
| |
| | ||||||
Private label |
| — |
| |
| |
| |
| |
| | ||||||
Obligations of states and political subdivisions thereof |
| |
| |
| |
| |
| |
| | ||||||
Corporate bonds |
| |
| |
| |
| |
| |
| | ||||||
Total securities available for sale | $ | | $ | | $ | | $ | | $ | | $ | | ||||||
68
Less Than Twelve Months | Over Twelve Months | Total | ||||||||||||||||
| Gross |
|
| Gross |
|
| Gross |
| ||||||||||
Unrealized | Fair | Unrealized | Fair | Unrealized | Fair | |||||||||||||
(in thousands) | Losses | Value | Losses | Value | Losses | Value | ||||||||||||
December 31, 2022 |
|
|
|
|
|
|
|
|
|
|
|
| ||||||
Debt securities: |
|
|
|
|
|
|
|
|
|
|
|
| ||||||
Obligations of US Government-sponsored enterprises | $ | | $ | | $ | | $ | | $ | | $ | | ||||||
Mortgage-backed securities and collateralized mortgage obligations: |
|
|
|
|
|
|
|
|
|
|
|
| ||||||
US Government-sponsored enterprises | | | | | | | ||||||||||||
US Government agency |
| |
| |
| |
| |
| |
| | ||||||
Private label |
| |
| |
| |
| |
| |
| | ||||||
Obligations of states and political subdivisions thereof |
| |
| |
| |
| |
| |
| | ||||||
Corporate bonds |
| |
| |
| |
| |
| |
| | ||||||
Total securities available for sale | $ | | $ | | $ | | $ | | $ | | $ | | ||||||
A summary of securities pledged as collateral for certain deposits and borrowing arrangements for the years ended December 31, 2023 and 2022 is as follows:
December 31, 2023 | December 31, 2022 | |||||||||||
| Carrying |
| Estimated |
| Carrying |
| Estimated | |||||
(in thousands) | Value | Fair Value | Value | Fair Value | ||||||||
Securities pledged for deposits | $ | | $ | | $ | | $ | | ||||
Securities pledged for repurchase agreements |
| |
| |
| |
| | ||||
Securities pledged for borrowings (1) |
| |
| |
| |
| | ||||
Total securities pledged | $ | | $ | | $ | | $ | | ||||
| (1) | The Bank pledged securities as collateral for certain borrowing arrangements with the Federal Home Loan Bank of Boston and Federal Reserve Bank of Boston. |
We expect to recover the amortized cost basis on all securities in our AFS portfolio. Furthermore, we do not intend to sell nor do we anticipate that we will be required to sell any securities in an unrealized loss position as of December 31, 2023, prior to this recovery. Our ability and intent to hold these securities until recovery is supported by our capital and liquidity positions as well as historically low portfolio turnover.
The following summarizes, by investment security type, the impact of securities in an unrealized loss position at December 31, 2023:
Obligations of US Government-sponsored enterprises
69
US Government-sponsored enterprises
US Government agency
Private label
Obligations of states and political subdivisions thereof
Corporate bonds
70
NOTE 3. LOANS AND ALLOWANCE FOR CREDIT LOSSES
We evaluate risk characteristics of loans based on regulatory call report code with segmentation based on the underlying collateral for certain loan types. The following is a summary of total loans by regulatory call report code segmentation based on underlying collateral for certain loan types:
December 31, | December 31, | |||||
(in thousands) |
| 2023 |
| 2022 | ||
Commercial construction | $ | | $ | | ||
Commercial real estate owner occupied |
| |
| | ||
Commercial real estate non-owner occupied |
| |
| | ||
Tax exempt |
| |
| | ||
Commercial and industrial |
| |
| | ||
Residential real estate |
| |
| | ||
Home equity |
| |
| | ||
Consumer other |
| |
| | ||
Total loans |
| |
| | ||
Allowance for credit losses |
| |
| | ||
Net loans | $ | | $ | | ||
Total unamortized net costs and premiums included in loan totals were as follows:
December 31, | December 31, | |||||
(in thousands) |
| 2023 |
| 2022 | ||
Net unamortized loan origination costs | $ | | $ | | ||
Net unamortized fair value discount on acquired loans |
| ( |
| ( | ||
Total | $ | | $ | ( | ||
We exclude accrued interest receivable from the amortized cost basis of loans disclosed throughout this footnote. As of December 31, 2023 and 2022, accrued interest receivable for loans totaled $
Characteristics of each loan portfolio segment are as follows:
Commercial construction - Loans in this segment primarily include raw land, land development and construction of commercial and multifamily residential properties. Collateral values are determined based upon appraisals and evaluations of the completed structure in accordance with established policy guidelines. Maximum loan-to-value ratios at origination are governed by established policy guidelines that are more restrictive than on stabilized commercial real estate transactions. Construction loans are primarily paid by the cash flow generated from the completed structure, such as operating leases, rents, or other operating cash flows from the borrower.
Commercial real estate owner occupied and non-owner occupied - Loans in these segments are primarily owner-occupied or income-producing properties. Loans to Real Estate Investment Trusts and unsecured loans to developers that closely correlate to the inherent risk in commercial real estate markets are also included. Commercial real estate loans are typically written with amortizing payment structures. Collateral values are determined based upon appraisals and evaluations in accordance with established policy guidelines. Maximum loan-to-value ratios at origination are governed by established policy and regulatory guidelines. Commercial real estate loans are primarily paid by the cash flow generated from the real property, such as operating leases, rents, or other operating cash flows from the borrower.
Tax Exempt - Loans in this segment primarily include loans to various state and municipal government entities. Loans made to these borrowers may provide us with tax-exempt income. While governed and underwritten similar to commercial loans they do have unique requirements based on established polices. Almost all state and municipal loans are considered a general obligation of the issuing entity. Given the size of many municipal borrowers, borrowings are normally not rated by major rating agencies.
71
Commercial and industrial loans - Loans consist of revolving and term loan obligations extended to business and corporate enterprises for the purpose of financing working capital and/or capital investment in this segment. Generally loans are secured by assets of the business such as accounts receivable, inventory, marketable securities, other liquid collateral, equipment and other business assets. Some loans in this category may be unsecured or guaranteed by government agencies such as the U.S. Small Business Administration. Loans are primarily paid by the operating cash flow of the borrower.
Residential real estate - All loans in this segment are collateralized by one-to-four family homes. Residential real estate loans held in the loan portfolio are made to borrowers who demonstrate the ability to make scheduled payments with full consideration to various underwriting factors. Borrower qualifications include favorable credit history combined with supportive income requirements and combined loan-to-value ratios within established policy guidelines.
Home equity - All loans and lines of credit are made to qualified individuals and are secured by senior or junior mortgage liens on owner-occupied one- to four-family homes, condominiums, or vacation homes. The home equity loan has a fixed rate and is billed as equal payments comprised of principal and interest. The home equity line of credit has a variable rate and is billed as interest-only payments during the draw period. At the end of the draw period, the home equity line of credit is billed as a percentage of the principal balance plus all accrued interest. Borrower qualifications include favorable credit history combined with supportive income requirements and combined loan-to-value ratios within established policy guidelines.
Consumer other - Loans in this segment include personal lines of credit and amortizing loans made to qualified individuals for various purposes such as auto loans, recreational equipment, overdraft protection or other consumer loans. Borrower qualifications include favorable credit history combined with supportive income and collateral requirements within established policy guidelines, as applicable.
Allowance for Credit Losses
The Allowance for Credit Losses (“ACL”) is comprised of the allowance for loan losses and the allowance for unfunded commitments which is accounted for as a separate liability in other liabilities on our consolidated balance sheet. The level of the ACL represents management’s estimate of expected credit losses over the expected life of the loans at the consolidated balance sheet date.
The ACL is a valuation account that is deducted from the amortized cost basis of loans to present the net amount expected to be collected on the loans. Loans, or portions thereof, are charged off against the allowance when they are deemed uncollectible. Expected recoveries do not exceed the aggregate of amounts previously charged-off and expected to be charged off. The ACL is comprised of reserves measured on a collective (pool) basis based on a lifetime loss-rate model when similar risk characteristics exist. Loans that do not share risk characteristics are evaluated on an individual basis, generally larger non-accruing commercial loans.
72
The activity in the allowance for credit losses for the periods ended are as follows:
At or for the Year Ended December 31, 2023 | |||||||||||||||
Balance at | |||||||||||||||
Beginning of | Balance at | ||||||||||||||
(in thousands) |
| Period | Charge Offs |
| Recoveries |
| Provision |
| End of Period | ||||||
Commercial construction | $ | | $ | — | $ | — | $ | | $ | | |||||
Commercial real estate owner occupied |
| |
| — |
| |
| |
| | |||||
Commercial real estate non-owner occupied |
| |
| — |
| — |
| |
| | |||||
Tax exempt |
| |
| — |
| — |
| |
| | |||||
Commercial and industrial |
| |
| ( |
| |
| |
| | |||||
Residential real estate |
| |
| ( |
| |
| |
| | |||||
Home equity |
| |
| ( |
| |
| ( |
| | |||||
Consumer other |
| |
| ( |
| |
| |
| | |||||
Total | $ | | $ | ( | $ | | $ | | $ | | |||||
At or for the Year Ended December 31, 2022 | |||||||||||||||
Balance at | |||||||||||||||
Beginning of | Balance at | ||||||||||||||
(in thousands) |
| Period | Charge Offs |
| Recoveries |
| Provision |
| End of Period | ||||||
Commercial construction | $ | | $ | — | $ | — | $ | | $ | | |||||
Commercial real estate owner occupied |
| |
| — |
| |
| ( |
| | |||||
Commercial real estate non-owner occupied |
| |
| — |
| — |
| |
| | |||||
Tax exempt |
| |
| — |
| — |
| |
| | |||||
Commercial and industrial |
| |
| ( | |
| ( |
| | ||||||
Residential real estate |
| |
| ( |
| |
| |
| | |||||
Home equity |
| |
| ( |
| |
| ( |
| | |||||
Consumer other |
| |
| ( |
| |
| |
| | |||||
Total | $ | | $ | ( | $ | | $ | | $ | | |||||
At or for the Year Ended December 31, 2021 | ||||||||||||||||||
Balance at | ||||||||||||||||||
Beginning of | Impact of ASC | Balance at | ||||||||||||||||
(in thousands) |
| Period | 326 |
| Charge Offs |
| Recoveries |
| Provision |
| End of Period | |||||||
Commercial construction | $ | | $ | | $ | — | $ | | $ | | $ | | ||||||
Commercial real estate owner occupied |
| |
| |
| ( |
| |
| |
| | ||||||
Commercial real estate non-owner occupied |
| |
| ( |
| — |
| |
| ( |
| | ||||||
Tax exempt |
| |
| |
| — |
| — |
| ( |
| | ||||||
Commercial and industrial |
| |
| |
| ( | |
| ( |
| | |||||||
Residential real estate |
| |
| |
| ( |
| |
| ( |
| | ||||||
Home equity |
| |
| |
| ( |
| |
| |
| | ||||||
Consumer other |
| |
| ( |
| ( |
| |
| |
| | ||||||
Total | $ | | $ | | $ | ( | $ | | $ | ( | $ | | ||||||
73
Unfunded Commitments
The allowance for credit losses on unfunded commitments is recognized as a liability (other liabilities on the consolidated balance sheet), with adjustments to the reserve recognized in other non-interest expense in the consolidated statement of operations. The activity in the allowance for credit losses on unfunded commitments for the periods ended was as follows:
At or for the Years Ended December 31, | |||||||||
(in thousands) | 2023 |
| 2022 |
| 2021 | ||||
Beginning Balance | $ | | $ | | $ | | |||
Impact of ASC 326 | — | — | | ||||||
Provision for credit losses |
| ( |
| |
| | |||
Ending Balance | $ | | $ | | $ | | |||
Loan Origination/Risk Management: We have certain lending policies and procedures in place designed to maximize loan income within an acceptable level of risk. Our Board of Directors reviews and approves these policies and procedures on a regular basis. A reporting system supplements the review process by providing management and the Board of Directors with frequent reports related to loan production, loan quality, and concentration of credit, loan delinquencies, non-performing loans and potential problem loans. We seek to diversify the loan portfolio as a means of managing risk associated with fluctuations in economic conditions.
Credit Quality Indicators: In monitoring the credit quality of the portfolio, management applies a credit quality indicator and uses an internal risk rating system to categorize commercial loans. These credit quality indicators range from one through nine, with a higher number correlating to increasing risk of loss. Consistent with regulatory guidelines, the Company provides for the classification of loans which are considered to be of lesser quality as special mention, substandard, doubtful, or loss (i.e. risk-rated 6, 7, 8 and 9, respectively).
The following are the definitions of our credit quality indicators:
Pass: Loans we consider in the commercial portfolio segments that are not adversely rated, are contractually current as to principal and interest, and are otherwise in compliance with the contractual terms of the loan agreement. Management believes there is a low risk of loss related to these loans considered pass-rated.
Special Mention: Loans considered having some potential weaknesses, but are deemed to not carry levels of risk inherent in one of the subsequent categories, are designated as special mention. A special mention loan has potential weaknesses that deserve management’s close attention. If left uncorrected, these potential weaknesses may result in deterioration of the repayment prospects for the asset or in the institution’s credit position at some future date. This might include loans that may require a higher level of supervision or internal reporting because of: (i) declining industry trends; (ii) increasing reliance on secondary sources of repayment; (iii) the poor condition of or lack of control over collateral; or (iv) failure to obtain proper documentation or any other deviations from prudent lending practices. Economic or market conditions which may, in the future, affect the obligor may warrant special mention of the asset. Loans for which an adverse trend in the borrower's operations or an imbalanced position in the balance sheet which has not reached a point where the liquidation is jeopardized may be included in this classification. Special mention loans are not adversely classified and do not expose us to sufficient risks to warrant classification.
Substandard: Loans we consider as substandard are inadequately protected by the current net worth and paying capacity of the borrower or of the collateral pledged, if any. Substandard loans have a well-defined weakness that jeopardizes liquidation of the debt. Substandard loans include those loans where there is the distinct possibility of some loss of principal, if the deficiencies are not corrected.
Doubtful: Loans we consider as doubtful have all of the weaknesses inherent in those loans that are classified as substandard. These loans have the added characteristic of a well-defined weakness which is inadequately protected by the current sound worth and paying capacity of borrower or of the collateral pledged, if any, and calls into question the collectability of the full balance of the loan. The possibility of loss is high but because of certain important and reasonably
74
specific pending factors, which may work to the advantage and strengthening of the loan, its classification as loss is deferred until its more exact status is determined. Pending factors include proposed merger, acquisition, or liquidation procedures, capital injection, perfecting liens on additional collateral and refinancing plans. The entire amount of the loan might not be classified as doubtful when collection of a specific portion appears highly probable. Loans are generally not classified doubtful for an extended period of time (i.e., over a year).
Loss: Loans we consider as losses are those considered uncollectible and of such little value that their continuance as an asset is not warranted and the uncollectible amounts are charged-off. This classification does not mean the asset has absolutely no recovery or salvage value, but rather it is not practical or desirable to defer writing off this worthless asset even though partial recovery may be affected in the future. Losses are taken in the period in which they are determined to be uncollectible.
The following table presents our loans by year of origination, loan segmentation and risk indicator as of December 31, 2023:
|
|
|
|
|
|
| |||||||||||||||
(in thousands) | 2023 | 2022 | 2021 | 2020 | 2019 | Prior | Total | ||||||||||||||
Commercial construction |
|
|
|
|
|
|
|
|
|
|
|
|
|
| |||||||
Risk rating: |
|
|
|
|
|
|
|
|
|
|
|
|
|
| |||||||
Pass | $ | | $ | | $ | | $ | | $ | — | $ | | $ | | |||||||
Special mention |
| — |
| — |
| — |
| — |
| — |
| — |
| — | |||||||
Substandard |
| — |
| — |
| — |
| — |
| — |
| — |
| — | |||||||
Total | $ | | $ | | $ | | $ | | $ | — | $ | | $ | | |||||||
Current period gross write-offs | — | — | — | — | — | — | — | ||||||||||||||
Commercial real estate owner occupied |
|
|
|
|
|
|
|
|
|
|
|
|
|
| |||||||
Risk rating: |
|
|
|
|
|
|
|
|
|
|
|
|
|
| |||||||
Pass | $ | | $ | | $ | | $ | | $ | | $ | | $ | | |||||||
Special mention |
| |
| |
| |
| |
| — |
| |
| | |||||||
Substandard |
| — |
| — |
| — |
| — |
| — |
| |
| | |||||||
Doubtful | — | — | — | — | — | | | ||||||||||||||
Total | $ | | $ | | $ | | $ | | $ | | $ | | $ | | |||||||
Current period gross write-offs | — | — | — | — | — | — | — | ||||||||||||||
Commercial real estate non-owner occupied |
|
|
|
|
|
|
|
|
|
|
|
|
|
| |||||||
Risk rating: |
|
|
|
|
|
|
|
|
|
|
|
|
|
| |||||||
Pass | $ | | $ | | $ | | $ | | $ | | $ | | $ | | |||||||
Special mention |
| |
| — |
| |
| |
| |
| |
| | |||||||
Substandard |
| — |
| — |
| — |
| — |
| — |
| |
| | |||||||
Doubtful | — | — | — | — | — | — | — | ||||||||||||||
Total | $ | | $ | | $ | | $ | | $ | | $ | | $ | | |||||||
Current period gross write-offs | — | — | — | — | — | — | — | ||||||||||||||
Tax exempt |
|
|
|
|
|
|
|
|
|
|
|
|
|
| |||||||
Risk rating: |
|
|
|
|
|
|
|
|
|
|
|
|
|
| |||||||
Pass | $ | | $ | | $ | | $ | | $ | | $ | | $ | | |||||||
Special mention |
| — |
| — |
| — |
| — |
| — |
| — |
| — | |||||||
Substandard |
| — |
| — |
| — |
| — |
| — |
| — |
| — | |||||||
Total | $ | | $ | | $ | | $ | | $ | | $ | | $ | | |||||||
Current period gross write-offs | — | — | — | — | — | — | — | ||||||||||||||
Commercial and industrial |
|
|
|
|
|
|
|
|
|
|
|
|
|
| |||||||
Risk rating: |
|
|
|
|
|
|
|
|
|
|
|
|
|
| |||||||
Pass | $ | | $ | | $ | | $ | | $ | | $ | | $ | | |||||||
Special mention |
| |
| |
| — |
| |
| |
| |
| | |||||||
Substandard |
| |
| |
| |
| |
| |
| |
| | |||||||
Doubtful | — | — | — | — | | | | ||||||||||||||
Total | $ | | $ | | $ | | $ | | $ | | $ | | $ | | |||||||
Current period gross write-offs | — | — | — | — | | | | ||||||||||||||
75
(in thousands) | 2023 | 2022 | 2021 | 2020 | 2019 | Prior | Total | ||||||||||||||
Residential real estate |
|
|
|
|
|
|
|
|
|
|
|
|
|
| |||||||
Performing | $ | | $ | | $ | | $ | | $ | | $ | | $ | | |||||||
Nonperforming |
| — |
| — |
| |
| — |
| |
| |
| | |||||||
Total | $ | | $ | | $ | | $ | | $ | | $ | | $ | | |||||||
Current period gross write-offs | — | — | — | — | — | | | ||||||||||||||
Home equity |
|
|
|
|
|
|
|
|
|
|
|
|
|
| |||||||
Performing | $ | | $ | | $ | | $ | | $ | | $ | | $ | | |||||||
Nonperforming |
| — |
| — |
| — |
| — |
| — |
| |
| | |||||||
Total | $ | | $ | | $ | | $ | | $ | | $ | | $ | | |||||||
Current period gross write-offs | — | — | — | — | — | | | ||||||||||||||
Consumer other |
|
|
|
|
|
|
|
|
|
|
|
|
|
| |||||||
Performing | $ | | $ | | $ | | $ | | $ | | $ | | $ | | |||||||
Nonperforming |
| — |
| — |
| |
| |
| — |
| — |
| | |||||||
Total | $ | | $ | | $ | | $ | | $ | | $ | | $ | | |||||||
Current period gross write-offs | — | | | | — | | | ||||||||||||||
Total Loans | $ | | $ | | $ | | $ | | $ | | $ | | $ | | |||||||
The following table presents our loans by year of origination, loan segmentation and risk indicator as of December 31, 2022:
|
|
|
|
|
|
| |||||||||||||||
(in thousands) | 2022 | 2021 | 2020 | 2019 | 2018 | Prior | Total | ||||||||||||||
Commercial construction |
|
|
|
|
|
|
|
|
|
|
|
|
|
| |||||||
Risk rating: |
|
|
|
|
|
|
|
|
|
|
|
|
|
| |||||||
Pass | $ | | $ | | $ | | $ | | $ | | $ | — | $ | | |||||||
Special mention |
| — |
| — |
| |
| — |
| — |
| — |
| | |||||||
Substandard |
| — |
| — |
| — |
| — |
| — |
| — |
| — | |||||||
Total | $ | | $ | | $ | | $ | | $ | | $ | — | $ | | |||||||
Commercial real estate owner occupied |
|
|
|
|
|
|
|
|
|
|
|
|
|
| |||||||
Risk rating: |
|
|
|
|
|
|
|
|
|
|
|
|
|
| |||||||
Pass | $ | | $ | | $ | | $ | | $ | | $ | | $ | | |||||||
Special mention |
| — |
| — |
| |
| |
| |
| |
| | |||||||
Substandard |
| — |
| — |
| — |
| — |
| |
| |
| | |||||||
Doubtful | — | — | — | — | — | | | ||||||||||||||
Total | $ | | $ | | $ | | $ | | $ | | $ | | $ | | |||||||
Commercial real estate non-owner occupied |
|
|
|
|
|
|
|
|
|
|
|
|
|
| |||||||
Risk rating: |
|
|
|
|
|
|
|
|
|
|
|
|
|
| |||||||
Pass | $ | | $ | | $ | | $ | | $ | | $ | | $ | | |||||||
Special mention |
| — |
| |
| — |
| |
| |
| |
| | |||||||
Substandard |
| — |
| — |
| — |
| — |
| — |
| |
| | |||||||
Doubtful | — | — | — | — | — | | | ||||||||||||||
Total | $ | | $ | | $ | | $ | | $ | | $ | | $ | | |||||||
Tax exempt |
|
|
|
|
|
|
|
|
|
|
|
|
|
| |||||||
Risk rating: |
|
|
|
|
|
|
|
|
|
|
|
|
|
| |||||||
Pass | $ | | $ | | $ | | $ | | $ | | $ | | $ | | |||||||
Special mention |
| — |
| — |
| — |
| — |
| — |
| — |
| — | |||||||
Substandard |
| — |
| — |
| — |
| — |
| — |
| — |
| — | |||||||
Total | $ | | $ | | $ | | $ | | $ | | $ | | $ | | |||||||
Commercial and industrial |
|
|
|
|
|
|
|
|
|
|
|
|
|
| |||||||
Risk rating: |
|
|
|
|
|
|
|
|
|
|
|
|
|
| |||||||
Pass | $ | | $ | | $ | | $ | | $ | | $ | | $ | | |||||||
Special mention |
| |
| — |
| |
| |
| |
| |
| | |||||||
Substandard |
| — |
| |
| |
| |
| |
| |
| | |||||||
Doubtful | — | — | — | — | — | | | ||||||||||||||
Total | $ | | $ | | $ | | $ | | $ | | $ | | $ | | |||||||
76
(in thousands) | 2022 | 2021 | 2020 | 2019 | 2018 | Prior | Total | ||||||||||||||
Residential real estate |
|
|
|
|
|
|
|
|
|
|
|
|
|
| |||||||
Performing | $ | | $ | | $ | | $ | | $ | | $ | | $ | | |||||||
Nonperforming |
| — |
| |
| — |
| |
| |
| |
| | |||||||
Total | $ | | $ | | $ | | $ | | $ | | $ | | $ | | |||||||
Home equity |
|
|
|
|
|
|
|
|
|
|
|
|
|
| |||||||
Performing | $ | | $ | | $ | | $ | | $ | | $ | | $ | | |||||||
Nonperforming |
| — |
| — |
| — |
| — |
| — |
| |
| | |||||||
Total | $ | | $ | | $ | | $ | | $ | | $ | | $ | | |||||||
Consumer other |
|
|
|
|
|
|
|
|
|
|
|
|
|
| |||||||
Performing | $ | | $ | | $ | | $ | | $ | | $ | | $ | | |||||||
Nonperforming |
| — |
| — |
| |
| — |
| — |
| — |
| | |||||||
Total | $ | | $ | | $ | | $ | | $ | | $ | | $ | | |||||||
Total Loans | $ | | $ | | $ | | $ | | $ | | $ | | $ | | |||||||
Past Dues
The following is a summary of past due loans for the periods ended:
December 31, 2023 | ||||||||||||||||||
(in thousands) |
| 30-59 |
| 60-89 |
| 90+ |
| Total Past Due |
| Current |
| Total Loans | ||||||
Commercial construction | $ | — | $ | — | $ | — | $ | — | $ | | $ | | ||||||
Commercial real estate owner occupied |
| — |
| — |
| — |
| — |
| |
| | ||||||
Commercial real estate non-owner occupied |
| — |
| — |
| |
| |
| |
| | ||||||
Tax exempt |
| — |
| — |
| — |
| — |
| |
| | ||||||
Commercial and industrial |
| |
| |
| |
| |
| |
| | ||||||
Residential real estate |
| |
| |
| |
| |
| |
| | ||||||
Home equity |
| |
| — |
| |
| |
| |
| | ||||||
Consumer other |
| |
| |
| — |
| |
| |
| | ||||||
Total | $ | | $ | | $ | | $ | | $ | | $ | | ||||||
December 31, 2022 | ||||||||||||||||||
(in thousands) |
| 30-59 |
| 60-89 |
| 90+ |
| Total Past Due |
| Current |
| Total Loans | ||||||
Commercial construction | $ | — | $ | — | $ | — | $ | — | $ | | $ | | ||||||
Commercial real estate owner occupied |
| |
| — |
| — |
| |
| |
| | ||||||
Commercial real estate non-owner occupied |
| |
| |
| |
| |
| |
| | ||||||
Tax exempt |
| — |
| — |
| — |
| — |
| |
| | ||||||
Commercial and industrial |
| |
| — |
| |
| |
| |
| | ||||||
Residential real estate |
| |
| |
| |
| |
| |
| | ||||||
Home equity |
| |
| |
| |
| |
| |
| | ||||||
Consumer other |
| |
| |
| — |
| |
| |
| | ||||||
Total | $ | | $ | | $ | | $ | | $ | | $ | | ||||||
77
Non-Accrual Loans
The following is a summary of non-accrual loans for the periods ended:
December 31, 2023 | |||||||||
Nonaccrual With No | 90+ Days Past | ||||||||
(in thousands) |
| Nonaccrual |
| Related Allowance |
| Due and Accruing | |||
Commercial construction | $ | — | $ | — | $ | — | |||
Commercial real estate owner occupied |
| |
| |
| — | |||
Commercial real estate non-owner occupied |
| |
| |
| — | |||
Tax exempt |
| — |
| — |
| — | |||
Commercial and industrial |
| |
| |
| — | |||
Residential real estate |
| |
| |
| | |||
Home equity |
| |
| |
| | |||
Consumer other |
| |
| — |
| — | |||
Total | $ | | $ | | $ | | |||
December 31, 2022 | |||||||||
Nonaccrual With No | 90+ Days Past | ||||||||
(in thousands) |
| Nonaccrual |
| Related Allowance |
| Due and Accruing | |||
Commercial construction | $ | — | $ | — | $ | — | |||
Commercial real estate owner occupied |
| |
| |
| — | |||
Commercial real estate non-owner occupied |
| |
| |
| — | |||
Tax exempt |
| — |
| — |
| — | |||
Commercial and industrial |
| |
| |
| — | |||
Residential real estate |
| |
| |
| | |||
Home equity |
| |
| |
| | |||
Consumer other |
| |
| — |
| — | |||
Total | $ | | $ | | $ | | |||
Our policy is to reverse previously recorded interest income when a loan is placed on non-accrual, as such, the Company did not record any interest income on its non-accrual for the year ended December 31, 2023 and 2022.
78
Collateral Dependent Loans
Loans that do not share risk characteristics are evaluated on an individual basis. For loans that are individually evaluated and collateral dependent, financial loans where we have determined that foreclosure of the collateral is probable, or where the borrower is experiencing financial difficulty and we expect repayment of the financial asset to be provided substantially through the operation or sale of the collateral, the ACL is measured based on the difference between the fair value of the collateral and the amortized cost basis of the asset as of the measurement date.
The following table presents the amortized cost basis of collateral-dependent loans by loan portfolio segment for the periods ended.
December 31, 2023 | December 31, 2022 | |||||||||||
(in thousands) |
| Real Estate |
| Other |
| Real Estate |
| Other | ||||
Commercial construction | $ | — | $ | — | $ | — | $ | — | ||||
Commercial real estate owner occupied |
| |
| — |
| |
| — | ||||
Commercial real estate non-owner occupied |
| |
| — |
| |
| — | ||||
Tax exempt |
| — |
| — |
| — |
| — | ||||
Commercial and industrial |
| |
| |
| |
| | ||||
Residential real estate |
| |
| — |
| |
| — | ||||
Home equity |
| |
| — |
| |
| — | ||||
Consumer other |
| |
| — |
| |
| — | ||||
Total | $ | | $ | | $ | | $ | | ||||
Loan Modifications to Borrowers Experiencing Financial Difficulty
In January 2023, the Company adopted ASU 2022-02, “Financial Instruments - Credit Losses (Topic 326): Troubled Debt Restructurings and Vintage Disclosures” which eliminated the accounting guidance for TDRs while enhancing disclosure requirements for certain loan refinancing and restructurings by creditors when a borrower is experiencing financial difficulty. This guidance was applied on a prospective basis. Upon adoption of this guidance, we are no longer required to establish a specific reserve for modifications to borrowers experiencing financial difficulty. Instead, these modifications are included in their respective category and a historical loss rate is applied to the current loan balance to arrive at the quantitative baseline portion of the ACL.
These modifications typically result from loss mitigation activities and could include reductions in the interest rate, payment extensions, forgiveness of principal, forbearance, or other actions. There were no qualifying modifications for the twelve months ended December 31, 2022.
The following table presents the amortized cost basis of loans that were both experiencing financial difficulty and modified during the twelve months ended December 31, 2023, by class and by type of modification.
(in thousands) | Principal Forgiveness | Payment Delay | Term Extension | Interest Rate Reduction | Combination Interest Rate Reduction and Term Extension | % of Total Class of Loans | ||||||||||||
Twelve Months Ended December 31, 2023 | ||||||||||||||||||
Commercial construction | $ | — | $ | — | $ | — | $ | — | $ | — | — | % | ||||||
Commercial real estate owner occupied |
| — |
| — |
| — |
| — |
| — | — | |||||||
Commercial real estate non-owner occupied |
| — |
| — |
| — |
| — |
| — | — | |||||||
Tax exempt |
| — |
| — |
| — |
| — |
| — | — | |||||||
Commercial and industrial |
| — |
| |
| |
| — |
| — | | |||||||
Residential real estate |
| — |
| — |
| — |
| |
| — | | |||||||
Home equity |
| — |
| — |
| — |
| — |
| — | — | |||||||
Consumer other |
| — |
| — |
| — |
| — |
| — | — | |||||||
Total | $ | — | $ | | $ | | $ | | $ | — | | % | ||||||
79
The following table presents the financial effect of loan modifications made to borrowers experiencing financial difficulty during the twelve months ended December 31, 2023.
(in thousands) | Weighted-Average Months of Payment Delay | Weighted-Average Months of Term Extension | Weighted-Average Interest Rate Reduction | |||||||
Twelve Months Ended December 31, 2023 | ||||||||||
Commercial construction | — | — | — | % | ||||||
Commercial real estate owner occupied | — | — | — | |||||||
Commercial real estate non-owner occupied | — | — | — | |||||||
Tax exempt | — | — | — | |||||||
Commercial and industrial | — | |||||||||
Residential real estate | — | — | | |||||||
Home equity | — | — | — | |||||||
Consumer other | — | — | — | |||||||
Total | | % | ||||||||
Foreclosure
Residential mortgage loans collateralized by real estate that are in the process of foreclosure as of December 31, 2023 and December 31, 2022 totaled $
Loan Concentrations
Loan concentrations in specific industries may occasionally emerge as a result of economic conditions, changes in local demands, natural loan growth and runoff. At December 31, 2023, the largest industry concentration outside of commercial real estate was the hospitality industry which represents
Loans to Related Parties
In the ordinary course of business, the Bank has made loans at prevailing rates and terms to directors, officers and other related parties. In management’s opinion, such loans do not present more than the normal risk of collectability or incorporate other unfavorable features, and were made under terms that are consistent with the Bank’s lending policies.
Loan to related parties at December 31, 2023 and December 31, 2022 are summarized below:
(in thousands) | 2023 | 2022 | ||||
Beginning balance | $ | | $ | | ||
Changes in composition(1) |
| — | | |||
New loans |
| — | | |||
Less: repayments |
| ( | ( | |||
Ending balance | $ | | $ | | ||
| (1) | Adjustments to reflect changes in status of directors and officers for each year presented. |
Mortgage Banking
Loans sold
For the years ended December 31, 2023 and 2022, we sold $
80
Loans Held for Sale
We had $
Servicing Assets
The Bank sells loans in the secondary market and retains the ability to service many of these loans. The Bank earns fees for the servicing provided. At year end 2023 and 2022, the Bank was servicing loans for participants totaling $
Servicing rights activity during 2023 and 2022, included in other assets, was as follows:
At or for the Twelve Months Ended | ||||||
December 31, | ||||||
(in thousands) |
| 2023 |
| 2022 | ||
Balance at beginning of year | $ | | $ | | ||
Additions |
| |
| | ||
Amortization |
| ( |
| ( | ||
Balance at end of year | $ | | $ | | ||
NOTE 4. PREMISES AND EQUIPMENT
Premises and equipment at December 31, 2023 and December 31, 2022 are summarized as follows:
|
| Estimated Useful | ||||||
(in thousands, except years) |
| 2023 |
| 2022 |
| Life | ||
Land | $ | | $ | |
| N/A | ||
Buildings and improvements |
| |
| |
| |||
Furniture and equipment |
| |
| |
| |||
Premises and equipment, gross |
| |
| |
|
| ||
Accumulated depreciation |
| ( |
| ( |
|
| ||
Premises and equipment, net | $ | | $ | |
|
|
Depreciation expense for the years ended December 31, 2023 and 2022 amounted to $
Premises held for sale for the years ended December 31, 2023, 2022 and 2021 were $
81
NOTE 5. GOODWILL AND OTHER INTANGIBLES
The activity impacting goodwill in 2023 and 2022 is as follows:
(in thousands) |
| 2023 |
| 2022 | ||
Balance at beginning of year | $ | | $ | | ||
Acquisition |
| — |
| — | ||
Balance at end of year | $ | | $ | | ||
In the fourth quarter of 2023, we completed annual goodwill impairment testing using balance sheet and market data as of September 30, 2023. The analysis was performed at the consolidated Bank level, which is considered the smallest reporting unit carrying goodwill.
The components of other intangible assets in 2023 and 2022 are as follows:
2023 | |||||||||
Gross | Accumulated | Net Intangible | |||||||
(in thousands) |
| Intangible Assets |
| Amortization |
| Assets | |||
Core deposit intangible (non-maturity deposits) | $ | | $ | ( | $ | | |||
Customer list and other intangibles |
| |
| ( |
| | |||
Total | $ | | $ | ( | $ | | |||
2022 | |||||||||
Gross | Accumulated | Net Intangible | |||||||
(in thousands) |
| Intangible Assets |
| Amortization |
| Assets | |||
Core deposit intangible (non-maturity deposits) | $ | | $ | ( | $ | | |||
Customer list and other intangibles |
| |
| ( |
| | |||
Total | $ | | $ | ( | $ | | |||
Other intangible assets are amortized on a straight-line basis over their estimated lives, which range from
The estimated aggregate future amortization expense for other intangible assets remaining at year end 2023 is as follows:
Other Intangible | |||
(in thousands) |
| Assets | |
2024 | $ | | |
2025 |
| | |
2026 |
| | |
2027 |
| | |
2028 |
| | |
and thereafter |
| | |
Total | $ | | |
82
NOTE 6. DEPOSITS
A summary of time deposits at December 31, 2023 and December 31, 2022 are as follows:
(in thousands) |
| December 31, 2023 |
| December 31, 2022 | ||
Time less than $100,000 | $ | | $ | | ||
Time $100,000 through $250,000 |
| |
| | ||
Time $250,000 or more |
| |
| | ||
Total | $ | | $ | | ||
At December 31, 2023 and December 31, 2022, the scheduled maturities by year for time deposits are as follows:
(in thousands) |
| December 31, 2023 | December 31, 2022 | |||
Within 1 year | $ | | $ | | ||
Over 1 year to 2 years |
| |
| | ||
Over 2 years to 3 years |
| |
| | ||
Over 3 years to 4 years |
| |
| | ||
Over 4 years to 5 years |
| |
| | ||
Over 5 years |
| |
| | ||
Total | $ | | $ | | ||
Included in time deposits are brokered deposits of $
NOTE 7. BORROWED FUNDS
Borrowed funds at December 31, 2023 and December 31, 2022 are summarized, as follows:
December 31, 2023 | December 31, 2022 |
| ||||||||||
Weighted | Weighted | |||||||||||
(dollars in thousands) |
| Carrying Value |
| Average Rate | Carrying Value |
| Average Rate |
| ||||
Short-term borrowings |
|
|
|
|
| |||||||
Advances from the FHLB | $ | |
| | % | $ | |
| | % | ||
Advances from the FRB BTFP | | | — | — | ||||||||
Other borrowings |
| |
| |
| |
| | ||||
Total short-term borrowings |
| |
| |
| |
| | ||||
Long-term borrowings |
|
|
|
|
|
|
|
| ||||
Advances from the FHLB |
| |
| |
| |
| | ||||
Subordinated borrowings |
| |
| |
| |
| | ||||
Total long-term borrowings |
| |
| |
| |
| | ||||
Total | $ | |
| | % | $ | |
| | % | ||
Short-term debt includes FHLB advances with a remaining maturity of less than one year. We also maintain a $
We also have capacity to borrow funds on a secured basis utilizing the Federal Reserve Discount Window and the Bank Term Funding Program (“BTFP”). As of December 31, 2023, our available secured line of credit at the FRB was $
83
During the fourth quarter of 2023, we entered into the Bank Term Funding Program for $
We maintain an unused unsecured federal funds line of credit with a correspondent bank that has an aggregate overnight borrowing capacity of $
Long-term FHLB advances consist of advances with a remaining maturity of more than one year. The advances outstanding at December 31, 2023 include $
A summary of maturities of FHLB advances as of December 31, 2023 is as follows:
|
| Weighted Average |
| |||
(in thousands, except rates) | Amount | Rate |
| |||
2024 | $ | |
| | % | |
2025 |
| — |
| — | ||
2026 |
| — |
| — | ||
2027 |
| — |
| — | ||
2028 |
| — |
| — | ||
Thereafter |
| |
| | ||
Total FHLB advances | $ | |
| | % | |
We executed a Subordinated Note Purchase Agreement with an aggregate of $
We also have $
Repurchase Agreements
We can raise additional liquidity by entering into repurchase agreements at our discretion. In a security repurchase agreement transaction, we will generally sell a security, agreeing to repurchase either the same or substantially identical security on a specified later date, at a greater price than the original sales price. The difference between the sale price and purchase price is the cost of the proceeds, which is recorded as interest expense on the consolidated statements of income. The securities underlying the agreements are delivered to counterparties as security for the repurchase obligations. Since the securities are treated as collateral and the agreement does not qualify for a full transfer of effective control, the transactions do not meet the criteria to be classified as sales, and are therefore considered secured borrowing transactions for accounting purposes. Payments on such borrowings are interest only until the scheduled repurchase date. In a repurchase agreement, we are subject to the risk that the purchaser may default at maturity and not return the securities underlying the agreements. In order to minimize this potential risk, we either deal with established firms when entering into these transactions or with customers whose agreements stipulate that the securities underlying the agreement are not delivered to the customer and instead are held in segregated safekeeping accounts by our safekeeping agents.
84
Our repurchase agreements accounted for as secured borrowings, as of December 31, 2023 and December 31, 2022 are as follows:
(in thousands) | December 31, 2023 | December 31, 2022 | ||||
Customer Repurchase Agreements |
|
|
|
| ||
US Government-sponsored enterprises | $ | | $ | | ||
Total | $ | | $ | | ||
NOTE 8. EMPLOYEE BENEFIT PLANS
Pension Plans
We maintain a legacy, employer-sponsored defined benefit pension plan (the “Plan”) for which participation and benefit accruals were frozen on January 13, 2017. Accordingly, no employees are permitted to commence participation in the Plan and future salary increases and years of credited service are not considered when computing an employee’s benefits under the Plan. As of December 31, 2023, all minimum Employee Retirement Income Security Act (“ERISA”) funding requirements have been met.
The following tables set forth information about the plan for the year ended December 31, 2023 and 2022:
(in thousands) |
| 2023 |
| 2022 | ||
Change in projected benefit obligation: | ||||||
Projected benefit obligation at beginning of year | $ | |
| $ | | |
Interest cost |
| |
| | ||
Actuarial Gain/(loss) |
| |
| ( | ||
Benefits paid |
| ( |
| ( | ||
Settlements |
| — |
| ( | ||
Projected benefit obligation at end of year |
| |
| | ||
Change in fair value of plan assets: |
|
|
|
| ||
Fair value of plan assets at beginning of year |
| |
| | ||
Expected return on plan assets |
| |
| ( | ||
Benefits paid |
| ( |
| ( | ||
Settlements |
| — |
| ( | ||
Fair value of plan assets at end of year |
| |
| | ||
Overfunded status | $ | ( |
| $ | ( | |
Amounts recognized in consolidated balance sheet: |
|
|
|
| ||
Other assets | $ | |
| $ | | |
85
Net periodic pension cost/(benefit) is comprised of the following for the years ended December 31, 2023 and 2022:
(in thousands) |
| 2023 |
| 2022 | ||
Interest cost | $ | | $ | | ||
Expected return on plan assets |
| ( |
| ( | ||
Unrecognized loss |
| |
| — | ||
Net periodic pension benefit | $ | | $ | ( | ||
Amounts recognized in other comprehensive income for the years ended December 31, 2023 and 2022 included:
(in thousands) |
| 2023 |
| 2022 | ||
Net actuarial loss (gain) | $ | ( | $ | | ||
Recognized loss |
| ( |
| — | ||
Net period pension benefit (credit) |
| |
| ( | ||
Total recognized in other comprehensive income | $ | ( | $ | | ||
Change in plan assets and benefit obligations recognized in accumulated other comprehensive income as of December 31, 2023 and 2022 are as follows:
(in thousands) |
| 2023 |
| 2022 | ||
Net actuarial (gain) loss | $ | ( | $ | | ||
Recognized loss |
| ( |
| — | ||
Prior service cost |
| — |
| — | ||
Amounts Recognized in accumulated other comprehensive (gain) loss (pre-tax) | $ | ( | $ | | ||
The after tax components of accumulated other comprehensive loss, which have not yet been recognized in net periodic pension cost, related to the Plan are a net loss of $
The principal actuarial assumptions used at December 31, 2023 and 2022 were as follows:
| 2023 |
| 2022 |
| ||
Projected benefit obligation |
|
|
|
| ||
Discount rate |
| | % | | % | |
Net periodic pension cost | ||||||
Discount rate |
| | % | | % | |
Long-term rate of return on plan assets |
| |
| |
The discount rate that is used in the measurement of the pension obligation is determined by comparing the expected future retirement payment cash flows of the plan to the Citigroup Above Median Double-A Curve as of the measurement date. The expected long-term rate of return on Plan assets reflects expectations of future returns as applied to the plan’s target allocation of asset classes. In estimating that rate, appropriate consideration was given to historical returns earned by equities and fixed income securities.
Our overall investment strategy with respect to the Plan’s assets is to maintain assets at a level that will sufficiently cover future beneficiary obligations while achieving long term growth in assets. The Plan’s targeted asset allocation is
The fair values for investment securities are determined by quoted prices in active markets, if available (Level 1). For securities where quoted prices are not available, fair values are calculated based on market prices of similar securities (Level 2). For securities where quoted prices or market prices of similar securities are not available, fair values are calculated using discounted cash flows or other market indicators (Level 3).
86
The fair value of the Plan’s assets by category and level within fair value hierarchy are as follows at December 31, 2023 and 2022:
| 2023 | ||||||||
(in thousands) |
| Total |
| Level 1 |
| Level 2 | |||
Equity mutual funds: |
|
|
|
|
| ||||
Large-cap | $ | | $ | | $ | — | |||
Mid-cap |
| |
| |
| — | |||
Small-cap |
| |
| |
| — | |||
International |
| |
| |
| — | |||
Fixed income funds: |
|
|
|
|
|
| |||
Fixed-income - core plus |
| — |
| — |
| — | |||
Intermediate duration |
| — |
| — |
| — | |||
Long duration | | | — | ||||||
Common stock |
| |
| |
| — | |||
Common/collective trusts - large-cap |
| |
| — |
| | |||
Cash equivalents - money market |
| |
| |
| — | |||
Total | $ | | $ | | $ | | |||
| 2022 | ||||||||
(in thousands) |
| Total |
| Level 1 |
| Level 2 | |||
Equity mutual funds: |
|
|
|
|
|
| |||
Large-cap | $ | | $ | | $ | — | |||
Mid-cap |
| |
| |
| — | |||
Small-cap |
| |
| |
| — | |||
International |
| |
| |
| — | |||
Fixed income funds: |
|
|
|
|
|
| |||
Long duration | | | — | ||||||
Common stock |
| |
| |
| — | |||
Common/collective trusts - large-cap |
| |
| — |
| | |||
Cash equivalents - money market |
| |
| |
| — | |||
Total | $ | | $ | | $ | | |||
The Plan did not hold any assets classified as Level 3, and there were
Estimated benefit payments under our pension plan over the next 10 years at December 31, 2023 are as follows:
(in thousands) |
| Payments | |
2024 | $ | | |
2025 |
| | |
2026 |
| | |
2027 |
| | |
2028 |
| | |
2029-2033 |
| | |
Total | $ | | |
Non-qualified Supplemental Executive Retirement Plan
We have non-qualified supplemental executive retirement agreements with certain retired officers. The agreements provide supplemental retirement benefits payable in installments over a period of years upon retirement or death. This agreement provides a stream of future payments in accordance with individually defined vesting schedules upon retirement, termination, or in the event that the participating executive leaves the Company following a change of control event.
87
The following table sets forth changes in benefit obligation, changes in plan assets, and the funded status of the plan as of and for the years ended December 31, 2023 and December 31, 2022:
(in thousands) |
| 2023 |
| 2022 | ||
Change in benefit obligation: |
|
|
|
| ||
Projected benefit obligation at beginning of year | $ | | $ | | ||
Service cost |
| — |
| — | ||
Interest cost |
| |
| | ||
Actuarial (gain) loss |
| ( |
| ( | ||
Benefits paid |
| ( |
| ( | ||
Projected benefit obligation at end of year | $ | | $ | | ||
Change in fair value of plan assets: |
|
|
|
| ||
Fair value of plan assets at beginning of year | $ | — | $ | — | ||
Expected return on plan assets |
| — |
| — | ||
Contributions by employer |
| |
| | ||
Benefits paid |
| ( |
| ( | ||
Fair value of plan assets at end of year | $ | — | $ | — | ||
Underfunded status | $ | | $ | | ||
Amounts recognized in consolidated balance sheet |
|
|
|
| ||
Other liabilities | $ | | $ | | ||
Net periodic benefit cost is comprised of the following for the years ended December 31, 2023 and 2022:
(in thousands) |
| 2023 |
| 2022 | ||
Interest cost | $ | | $ | | ||
Expected return on plan assets |
| — |
| — | ||
Amortization of unrecognized actuarial loss |
| |
| | ||
Net periodic benefit cost | $ | | $ | | ||
Amounts recognized in other comprehensive income for the years ended December 31, 2023 and 2022 included:
(in thousands) |
| 2023 |
| 2022 | ||
Net actuarial loss (gain) | $ | | $ | ( | ||
Amortization of unrecognized actuarial loss |
| ( |
| ( | ||
Total recognized in other comprehensive loss (gain) | $ | | $ | ( | ||
Change in plan assets and benefit obligations recognized in accumulated other comprehensive income in 2023 and 2022 are as follows:
(in thousands) |
| 2023 |
| 2022 | ||
Accumulated other comprehensive loss at beginning of the year (pre-tax) | | | ||||
Actuarial loss (gain) |
| |
| ( | ||
Amortization of actuarial loss |
| ( |
| ( | ||
Accumulated other comprehensive loss at end of year (pre-tax) | $ | | $ | | ||
The after tax components of accumulated other comprehensive loss, which have not yet been recognized in net periodic benefit cost, related to the non-qualified supplemental executive retirement agreements are a net loss of $
88
The principal actuarial assumptions used at December 31, 2023 and December 31, 2022 were as follows:
| 2023 |
| 2022 |
| |
Discount rate beginning of year |
| | % | | % |
Discount rate end of year |
| |
| |
The discount rate used in the measurement of the non-qualified supplemental executive retirement plan obligation is determined by comparing the expected future retirement payment cash flows to the Citigroup Above Median Double- A Curve as of the measurement date.
We expect to contribute the following amounts to fund benefit payments under the supplemental executive retirement plans:
(in thousands) |
| Payments | |
2024 | $ | | |
2025 |
| | |
2026 |
| | |
2027 |
| | |
2028 |
| | |
2029-2033 |
| | |
Total | $ | | |
401(k) Plan
We maintain a Section 401(k) savings plan for substantially all of its employees. Employees are eligible to participate in the 401(k) Plan on the first day of any quarter following their date of hire and attainment of age 21½ . Under the plan, we make a matching contribution of a portion of the amount contributed by each participating employee, up to a percentage of the employee’s annual salary. The plan allows for supplementary profit sharing contributions by Bar Harbor, at its discretion, for the benefit of participating employees. The total expense for this plan in 2023, 2022, and 2021 was $
Other Plans
As a result of the acquisition of a business combination in 2017, we assumed salary continuation agreements for supplemental retirement income with certain prior executives and senior officers along with an executive indexed supplemental retirement plan for
We also assumed split-dollar life insurance agreements from the 2017 business combination with an accrued liability of $
89
NOTE 9. INCOME TAXES
The following table summarizes the current and deferred components of income tax expense (benefit) for each of the years ended December 31, 2023, 2022 and 2021:
(in thousands) |
| 2023 |
| 2022 |
| 2021 | |||
Current: |
|
|
|
|
|
| |||
Federal tax expense | $ | | $ | | $ | | |||
State tax expense |
| |
| |
| | |||
Total current tax expense |
| |
| |
| | |||
Deferred tax (benefit) expense |
| ( |
| ( |
| | |||
Total income tax expense | $ | | $ | | $ | | |||
The following table reconciles the expected federal income tax expense (computed by applying the federal statutory tax rate of
2023 | 2022 | 2021 |
| |||||||||||||
(in thousands, except ratios) | Amount | Rate | Amount | Rate | Amount | Rate |
| |||||||||
Statutory tax rate |
| $ | |
| | % | $ | |
| | % | $ | |
| | % |
Increase (decrease) resulting from: |
|
|
|
|
|
|
|
|
|
| ||||||
State taxes, net of federal benefit |
| |
| |
| |
| |
| |
| |
| |||
Tax exempt interest |
| ( |
| ( |
| ( |
| ( |
| ( |
| ( |
| |||
Federal tax credits |
| ( |
| ( |
| ( |
| ( |
| ( |
| ( |
| |||
Officers' life insurance |
| ( |
| ( |
| ( |
| ( |
| ( |
| ( |
| |||
Gain on disposal of low income housing tax credit investments |
| — |
| — |
| — |
| — |
| — |
| — |
| |||
Stock-based compensation plans |
| |
| |
| ( |
| ( |
| ( |
| ( |
| |||
Other |
| | |
| |
| |
| |
| |
| ||||
Effective tax rate | $ | |
| | % | $ | |
| | % | $ | |
| | % | |
The net deferred tax asset was $
90
The tax effects of temporary differences that give rise to deferred tax assets and deferred tax liabilities at December 31, 2023 and 2022 are summarized below:
2023 | 2022 | |||||||||||
(in thousands) | Assets | Liabilities | Assets | Liabilities | ||||||||
Allowance for credit losses |
| $ | |
| $ | — |
| $ | |
| $ | — |
Deferred compensation |
| |
| — |
| |
| — | ||||
Unrealized gain or loss on securities available for sale |
| |
| — |
| |
| — | ||||
Unrealized gain or loss on derivatives |
| |
| — |
| |
| — | ||||
Depreciation |
| — |
| |
| — |
| | ||||
Deferred loan origination fees, net |
| — |
| |
| |
| — | ||||
Non-accrual interest |
| |
| — |
| |
| — | ||||
Branch acquisition costs and goodwill |
| — |
| |
| — |
| | ||||
Core deposit intangible |
| — |
| |
| — |
| | ||||
Acquisition fair value adjustments |
| |
| — |
| |
| — | ||||
Prepaid expenses |
| — |
| |
| — |
| | ||||
Mortgage servicing rights |
| — |
| |
| — |
| | ||||
Equity compensation |
| |
| — |
| |
| — | ||||
Prepaid pension |
| — |
| |
| — |
| | ||||
Contract incentives |
| |
| — |
| |
| — | ||||
Right of use asset |
| — |
| |
| — |
| | ||||
Lease liability |
| |
| — |
| |
| — | ||||
Other |
| |
| — |
| |
| — | ||||
Total | $ | | $ | | $ | | $ | | ||||
We have determined that a valuation allowance is not required for its net deferred tax asset since it is more likely than not that this asset is realizable principally through future taxable income and future reversal of existing temporary differences.
GAAP requires the measurement of unrecorded tax benefits related to uncertain tax positions. An unrecorded tax benefit is the difference between the tax benefit of a position taken, or expected to be taken, on a tax return and the benefit recorded for accounting purposes. At December 31, 2023 and 2022, we had
We are subject to income tax in the U.S. federal jurisdiction and also in the states of Maine, New Hampshire and Massachusetts. We are no longer subject to examination by taxing authorities for years before 2020.
91
NOTE 10. DERIVATIVE FINANCIAL INSTRUMENTS AND HEDGING ACTIVITIES
We use derivative instruments to minimize fluctuations in earnings and cash flows caused by interest rate volatility. Our interest rate risk management strategy involves modifying the re-pricing characteristics of certain assets or liabilities so the changes in interest rates do not have a significant effect on net interest income. Thus, all of our derivative contracts are considered to be interest rate contracts.
We recognize our derivative instruments on the consolidated balance sheet at fair value. On the date the derivative instrument is entered into, we designate whether the derivative is part of a hedging relationship (i.e., cash flow or fair value hedge). We formally document relationships between hedging instruments and hedged items, as well as our risk management objective and strategy for undertaking hedge transactions. We also assess, both at the hedge’s inception and on an ongoing basis, whether the derivatives used in hedging transactions are highly effective in offsetting the changes in cash flows or fair values of hedged items. Changes in fair value of derivative instruments that are highly effective and qualify as cash flow hedges are recorded in other comprehensive income or loss.
We offer derivative products in the form of interest rate swaps, to commercial loan customers to facilitate their risk management strategies. These instruments are executed through Master Netting Arrangements (“MNA”) with financial institution counterparties or Risk Participation Agreements (“RPA”) with commercial bank counterparties, for which we assume a pro rata share of the credit exposure associated with a borrower's performance related to the derivative contract with the counterparty.
Information about derivative assets and liabilities at December 31, 2023 and December 31, 2022, follows:
December 31, 2023 | |||||||||||
Weighted |
| ||||||||||
Notional | Average | Fair Value | Location Fair | ||||||||
Amount | Maturity | Asset (Liability) |
| Value Asset | |||||||
| (in thousands) |
| (in years) |
| (in thousands) |
| (Liability) | ||||
Cash flow hedges: | |||||||||||
Interest rate swap on wholesale funding | $ | |
| $ | | Other assets | |||||
Interest rate swap on variable rate loans | | ( | Other liabilities | ||||||||
Total cash flow hedges |
| |
| ( | |||||||
Fair value hedges: | |||||||||||
Interest rate swap on securities |
| |
|
| | Other assets | |||||
Total fair value hedges |
| |
| | |||||||
Economic hedges: | |||||||||||
Forward sale commitments |
| |
| — |
| ( | Other liabilities | ||||
Customer Loan Swaps-MNA Counterparty | | ( | Other liabilities | ||||||||
Customer Loan Swaps-RPA Counterparty | | ( | Other liabilities | ||||||||
Customer Loan Swaps-Customer | | | Other assets | ||||||||
Total economic hedges |
| |
| ( | |||||||
Non-hedging derivatives: | |||||||||||
Interest rate lock commitments |
| |
|
| | Other assets | |||||
Total non-hedging derivatives |
| |
| | |||||||
Total | $ | | $ | | |||||||
92
December 31, 2022 | |||||||||||
Weighted |
| ||||||||||
Notional | Average | Fair Value | Location Fair | ||||||||
Amount | Maturity | Asset (Liability) |
| Value Asset | |||||||
| (in thousands) |
| (in years) |
| (in thousands) |
| (Liability) | ||||
Cash flow hedges: |
|
|
|
|
|
| |||||
Interest rate swap on wholesale funding | $ | |
| $ | | Other assets | |||||
Interest rate swap on variable rate loans | | ( | Other liabilities | ||||||||
Total cash flow hedges |
| |
| | |||||||
Fair value hedges: | |||||||||||
Interest rate swap on securities |
| |
|
| | Other assets | |||||
Total fair value hedges |
| |
| | |||||||
Economic hedges: | |||||||||||
Forward sale commitments | — |
| — |
| — | Other assets | |||||
Customer Loan Swaps-MNA Counterparty | | ( | Other liabilities | ||||||||
Customer Loan Swaps-RPA Counterparty | | — | Other liabilities | ||||||||
Customer Loan Swaps-Customer | | | Other assets | ||||||||
Total economic hedges |
| |
| — | |||||||
Non-hedging derivatives: |
| ||||||||||
Interest rate lock commitments |
| — |
| — |
| — | Other assets | ||||
Total non-hedging derivatives |
| — |
| — | |||||||
Total | $ | | $ | | |||||||
As of December 31, 2023, and 2022, the following amounts were recorded on the balance sheet related to cumulative basis adjustments for fair value hedges:
|
|
| Cumulative Amount of Fair | |||||
Location of Hedged Item on | Carrying Amount of Hedged | Value Hedging Adjustment in | ||||||
| Balance Sheet |
| Assets |
| Carrying Amount | |||
December 31, 2023 |
|
|
|
|
|
| ||
Interest rate swap on securities |
| Securities available for sale | $ | | $ | ( | ||
December 31, 2022 |
|
|
|
|
|
| ||
Interest rate swap on securities |
| Securities available for sale | $ | | $ | ( | ||
93
Information about derivative assets and liabilities for December 31, 2023 and December 31, 2022, follows:
Year Ended December 31, 2023 | |||||||||||||
| Amount of |
|
| Amount of |
|
| |||||||
Gain (Loss) | Gain (Loss) | ||||||||||||
Recognized in | Reclassified | Location of | Amount of | ||||||||||
Other | Location of Gain (Loss) | from Other | Gain (Loss) | Gain (Loss) | |||||||||
Comprehensive | Reclassified from Other | Comprehensive | Recognized in | Recognized | |||||||||
(in thousands) |
| Income |
| Comprehensive Income |
| Income |
| Income |
| ||||
Cash flow hedges: |
|
|
|
|
|
|
|
|
|
| |||
Interest rate swap on wholesale funding | $ | ( | Interest expense | $ | — |
| Interest expense | $ | | ||||
Interest rate swap on variable rate loans | | Interest income | — | Interest income | ( | ||||||||
Total cash flow hedges |
| ( |
|
| — |
|
|
| | ||||
Fair value hedges: |
|
|
|
|
|
|
| ||||||
Interest rate swap on securities |
| |
| Interest income |
| — |
| Interest income |
| | |||
Total fair value hedges |
| |
|
| — |
|
|
| | ||||
Economic hedges: |
|
|
|
|
|
|
| ||||||
Forward commitments |
| — |
| Other income |
| — |
| Mortgage banking income |
| ( | |||
Total economic hedges |
| — |
|
| — |
|
|
| ( | ||||
Non-hedging derivatives: |
|
|
|
|
|
|
| ||||||
Interest rate lock commitments |
| — |
| Other expense |
| — |
| Mortgage banking income |
| ( | |||
Total non-hedging derivatives |
| — |
|
| — |
|
|
| ( | ||||
Total | $ | | $ | — |
|
| $ | | |||||
| (1) | As of December 31, 2023, we do not expect any gains or losses from accumulated other comprehensive income into earnings within the next 12 months. |
94
Year Ended December 31, 2022 | |||||||||||||
| Amount of |
|
| Amount of |
|
| |||||||
Gain (Loss) | Gain (Loss) | ||||||||||||
Recognized in | Reclassified | Location of | Amount of | ||||||||||
Other | Location of Gain (Loss) | from Other | Gain (Loss) | Gain (Loss) | |||||||||
Comprehensive | Reclassified from Other | Comprehensive | Recognized in | Recognized | |||||||||
(in thousands) | Income | Comprehensive Income | Income | Income | in Income | ||||||||
Cash flow hedges: |
|
|
|
|
|
|
|
|
|
| |||
Interest rate swap on wholesale funding | $ | |
| Interest expense | $ | — |
| Interest expense | $ | | |||
Interest rate swap on variable rate loans | ( | Interest income | — | Interest income | ( | ||||||||
Total cash flow hedges | |
| — |
|
| ( | |||||||
Fair value hedges: |
|
|
|
|
|
| |||||||
Interest rate swap on securities |
| — |
| Interest income |
| — |
| Interest income |
| | |||
Total economic hedges | — |
| — |
|
|
| | ||||||
Economic hedges: |
|
|
|
|
|
| |||||||
Forward commitments |
| — |
| Other income |
| — |
| Mortgage banking income |
| ( | |||
Total economic hedges | — |
| — |
|
|
| ( | ||||||
Non-hedging derivatives: |
|
|
|
|
|
|
| ||||||
Interest rate lock commitments |
| — |
| Other income |
| — |
| Mortgage banking income |
| ( | |||
Total non-hedging derivatives | — |
| — |
|
|
| ( | ||||||
Total | $ | |
|
| $ | — |
|
| $ | ( | |||
95
The effect of cash flow hedging and fair value accounting on the consolidated statements of income for the years ended December 31, 2023 and 2022:
Year Ended December 31, 2023 | |||||||||||||||
Interest and Dividend Income | Interest Expense | ||||||||||||||
(in thousands) |
| Loans | Securities and other |
| Deposits | Borrowings |
| Non-interest Income | |||||||
Income and expense line items presented in the consolidated statements of income |
| $ | | $ | | $ | | $ | | $ | | ||||
|
|
|
|
|
| ||||||||||
The effects of cash flow and fair value hedging: | |||||||||||||||
|
|
|
|
|
| ||||||||||
Gain (loss) on cash flow hedges: | |||||||||||||||
Interest rate swap on wholesale funding | — | — | — | | — | ||||||||||
Interest rate swap on variable rate loans |
| ( | — |
| — | — |
| — | |||||||
|
|
|
|
|
| ||||||||||
Gain (loss) on fair value hedges: |
|
|
|
|
| ||||||||||
Interest rate swap on securities | — | | — | — | — | ||||||||||
Year Ended December 31, 2022 | |||||||||||||||
Interest and Dividend Income | Interest Expense | ||||||||||||||
(in thousands) |
| Loans | Securities and other |
| Deposits | Borrowings |
| Non-interest Income | |||||||
Income and expense line items presented in the consolidated statements of income |
| $ | | $ | | $ | | $ | | $ | | ||||
|
|
|
|
|
| ||||||||||
The effects of cash flow and fair value hedging: | |||||||||||||||
|
|
|
|
|
| ||||||||||
Gain (loss) on cash flow hedges: | |||||||||||||||
Interest rate swap on wholesale funding | — | — | — | | — | ||||||||||
Interest rate swap on variable rate loans |
| ( | — |
| — | — |
| — | |||||||
|
|
|
|
|
| ||||||||||
Gain (loss) on fair value hedges: |
|
|
|
|
| ||||||||||
Interest rate swap on securities | — | | — | — | — | ||||||||||
Cash flow hedges
Interest rate swaps on wholesale funding
As of December 31, 2023, we have
Interest rate swap on variable rate loans
We have an interest rate swap that effectively fixes our interest rate on $
96
Fair value hedges
For derivative instruments that are designated and qualify as a fair value hedge, the gain or loss on the derivative instrument as well as the offsetting loss or gain on the hedged asset or liability attributable to the hedged risk are recognized in current earnings. We utilize interest rate swaps designated as fair value hedges to mitigate the effect of changing interest rates on the fair values of fixed rate callable securities available-for-sale. The hedging strategy on securities converts the fixed interest rates to SOFR-based variable interest rates. These derivatives are designated as partial term hedges of selected cash flows covering specified periods of time prior to the call dates of the hedged securities. During 2019, we entered into
Economic hedges
Forward sale commitments
We utilize forward sale commitments on residential mortgage loans to hedge interest rate risk and the associated effects on the fair value of interest rate lock commitments and loans originated for sale. The forward sale commitments are accounted for as derivatives. We typically use a combination of best efforts and mandatory delivery contracts. The contracts are loan sale agreements where we commit to deliver a certain principal amount of mortgage loans to an investor at a specified price on or before a specified date. Generally, we enter into contracts just prior to the loan closing with a customer.
Customer loan derivatives
We enter into customer loan derivatives to facilitate the risk management strategies for commercial banking customers. We mitigate this risk by entering into equal and offsetting loan swap agreements with highly rated third-party financial institutions. The loan swap agreements are free standing derivatives and are recorded at fair value in our consolidated balance sheet. We are party to master netting arrangements with our financial institutional counterparties; however, we do not offset assets and liabilities under these arrangements for financial statement presentation purposes.
The master netting arrangements provide for a single net settlement of all loan swap agreements, as well as collateral or cash funds, in the event of default on, or termination of, any one contract. Collateral is provided by cash or securities received or posted by the counterparty with net liability positions, respectively, in accordance with contract thresholds.
The below table describes the potential effect of master netting arrangements on the consolidated balance sheet and the financial collateral pledged for these arrangements:
Gross Amounts Offset in the Consolidated Balance Sheet | ||||||||||||
Derivative | Cash Collateral | |||||||||||
(in thousands) |
| Liabilities |
| Derivative Assets |
| Pledged |
| Net Amount | ||||
As of December 31, 2023 |
|
|
|
| ||||||||
Customer Loan Derivatives: |
|
|
|
|
|
|
|
| ||||
MNA counterparty | $ | ( | $ | | $ | — | $ | |||||
RPA counterparty |
| ( |
| |
| — |
| |||||
Total | $ | ( | $ | | $ | — | $ | |||||
Non-hedging derivatives
Interest rate lock commitments
We enter into interest rate lock commitments (“IRLCs”) for residential mortgage loans, which commit us to lend funds to a potential borrower at a specific interest rate and within a specified period of time. IRLCs relate to the origination of residential mortgage loans that are held for sale and are considered derivative financial instruments under applicable accounting guidance. Outstanding IRLCs expose us to the risk that the price of the mortgage loans underlying the commitments may decline due to increases in mortgage interest rates from inception of the rate lock to the funding of the loan. The IRLCs are free standing derivatives, which are carried at fair value with changes recorded in non-interest income
97
in our Consolidated Statements of Income. Changes in the fair value of IRLCs subsequent to inception are based on (i) changes in the fair value of the underlying loan resulting from the fulfillment of the commitment and (ii) changes in the probability when the loan will fund within the terms of the commitment, which is affected primarily by changes in interest rates and the passage of time.
NOTE 11. OTHER COMMITMENTS, CONTINGENCIES, AND OFF-BALANCE SHEET ACTIVITIES
Customer Obligations
We are a party to financial instruments in the normal course of business to meet financing needs of our customers. These financial instruments include commitments to extend credit, unused or unadvanced loan funds, and letters of credit. We use the same lending policies and procedures to make such commitments as we use for other lending products. Customer’s creditworthiness is evaluated on a case-by-case basis.
Commitments to originate loans, including unused or unadvanced loan funds, are agreements to lend to a customer provided there is no violation of any condition established in the contract. Commitments generally have fixed expiration dates or other termination clauses and may require customer payment of a fee. Since many of the commitments are expected to expire without being fully drawn upon, the total commitment amounts do not necessarily represent future cash requirements.
Standby letters of credit are conditional commitments issued to guarantee the performance of a customer to a third party. Standby letters of credit generally become payable upon the failure of the customer to perform according to the terms of the underlying contract with the third party, while commercial letters of credit are issued specifically to facilitate commerce and typically result in the commitment being drawn on when the underlying transaction is consummated between the customer and a third party. The contractual amount of these letters of credit represents the maximum potential future payments guaranteed by us. Typically these letters of credit expire if unused; therefore the total amounts do not necessarily represent future cash requirements.
The following table summarizes the contractual amounts of commitments and contingent liabilities to customers as of December 31, 2023 and December 31, 2022:
(in thousands) |
| 2023 |
| 2022 | ||
Commitments to originate new loans | $ | | $ | | ||
Unused funds on commercial and other lines of credit |
| |
| | ||
Unadvanced funds on home equity lines of credit | | | ||||
Unadvanced funds on construction and real estate loans |
| |
| | ||
Commercial and standby letters of credit | | | ||||
Letters of credit securing municipal deposits | | | ||||
Total | $ | | $ | | ||
Legal Claims
Various legal claims arise from time to time in the normal course of business. As of December 31, 2023, neither the Company nor its subsidiaries were involved in any pending legal proceedings believed by management to be material to our financial condition or results of operations. Periodically, there have been various claims and lawsuits involving the Company, such as claims to enforce liens, condemnation proceedings on properties in which we hold security interests, claims involving the making and servicing of real property loans, and other issues incident in the normal course of our business. However, neither the Company nor its subsidiaries are a party to any pending legal proceedings that it believes, either individually or in the aggregate, would have a material adverse effect on our financial condition or operations. Additionally, future, probable losses cannot be estimated as of December 31, 2023.
98
NOTE 12. SHAREHOLDERS’ EQUITY AND EARNINGS PER COMMON SHARE
The actual and required capital ratios at December 31, 2023 and December 31, 2022 were as follows:
December 31, 2023 | ||||||||||||
Minimum Regulatory | ||||||||||||
Actual | Capital Requirements | |||||||||||
(in thousands, except ratios) |
| Amount |
| Ratio | Amount |
| Ratio | |||||
Company (consolidated) |
| |||||||||||
Total capital to risk-weighted assets | $ | | | % | $ | | | % | ||||
Common equity tier 1 capital to risk-weighted assets |
| | |
| | | ||||||
Tier 1 capital to risk-weighted assets |
| | |
| | | ||||||
Tier 1 capital to average assets (leverage ratio) |
| | |
| | | ||||||
Bank | ||||||||||||
Total capital to risk-weighted assets | $ | | | % | $ | | | % | ||||
Common equity tier 1 capital to risk-weighted assets |
| | |
| | | ||||||
Tier 1 capital to risk-weighted assets |
| | |
| | | ||||||
Tier 1 capital to average assets (leverage ratio) |
| | |
| | | ||||||
December 31, 2022 | ||||||||||||
Minimum Regulatory | ||||||||||||
Actual | Capital Requirements | |||||||||||
(in thousands, except ratios) |
| Amount |
| Ratio | Amount |
| Ratio | |||||
Company (consolidated) |
| |||||||||||
Total capital to risk-weighted assets | $ | | | % | $ | | | % | ||||
Common equity tier 1 capital to risk-weighted assets |
| | |
| | | ||||||
Tier 1 capital to risk-weighted assets |
| | |
| | | ||||||
Tier 1 capital to average assets (leverage ratio) |
| | |
| | | ||||||
Bank | ||||||||||||
Total capital to risk-weighted assets | $ | | | % | $ | | | % | ||||
Common equity tier 1 capital to risk-weighted assets |
| | |
| | | ||||||
Tier 1 capital to risk-weighted assets |
| | |
| | | ||||||
Tier 1 capital to average assets (leverage ratio) |
| | |
| | | ||||||
In order to be classified as “well-capitalized” under the relevant regulatory framework, the Company must, on a consolidated basis, maintain a total risk-based capital ratio of 10.00% or greater and a Tier 1 risk-based capital ratio of 6.00% or greater, and the Bank must maintain a total risk-based capital ratio of 10.00% or greater, a Tier 1 risk-based capital ratio of 8.00% or greater, a common equity Tier 1 capital ratio of 6.50% or greater, and a leverage ratio of 5.00% or greater. At each date shown in the tables above, the Company and the Bank met the conditions to be classified as “well-capitalized” under the relevant regulatory framework.
99
Accumulated Other Comprehensive Income
Components of accumulated other comprehensive income at December 31, 2023 and December 31, 2022 are as follows:
(in thousands) |
| December 31, 2023 |
| December 31, 2022 | ||
Accumulated other comprehensive loss, before tax: |
|
|
|
| ||
Net unrealized loss on AFS securities | $ | ( | $ | ( | ||
Net unrealized loss on hedging derivatives |
| ( |
| ( | ||
Net unrealized loss on post-retirement plans |
| ( |
| ( | ||
Income taxes related to items of accumulated other comprehensive loss: |
|
|
|
| ||
Net unrealized loss on AFS securities |
| |
| | ||
Net unrealized loss on hedging derivatives |
| |
| | ||
Net unrealized loss on post-retirement plans |
| |
| | ||
Accumulated other comprehensive loss | $ | ( | $ | ( | ||
The following table presents the components of other comprehensive income in 2023, 2022 and 2021:
(in thousands) |
| Before Tax |
| Tax Effect |
| Net of Tax | |||
Year Ended December 31, 2023 |
|
|
|
|
|
| |||
Net unrealized gain on AFS securities: |
|
|
|
|
|
| |||
Net unrealized gain arising during the period | $ | | $ | ( | $ | | |||
Less: reclassification adjustment for gains realized in net income |
| |
| ( |
| | |||
Net unrealized gain on AFS securities |
| |
| ( |
| | |||
Net unrealized gain on hedging derivatives: |
|
|
|
|
| ||||
Net unrealized gain arising during the period |
| |
| ( |
| | |||
Less: reclassification adjustment for gains realized in net income |
| — |
| — |
| — | |||
Net unrealized gain on hedging derivatives |
| |
| ( |
| | |||
Net unrealized gain on post-retirement plans: |
|
|
|
|
|
| |||
Net unrealized gain arising during the period |
| |
| ( |
| | |||
Less: reclassification adjustment for gains realized in net income |
| — |
| — |
| — | |||
Net unrealized gain on post-retirement plans |
| |
| ( |
| | |||
Other comprehensive income | $ | | $ | ( | $ | | |||
Year Ended December 31, 2022 |
|
|
|
|
|
| |||
Net unrealized loss on AFS securities: |
|
|
|
|
|
| |||
Net unrealized loss arising during the period | $ | ( | $ | | $ | ( | |||
Less: reclassification adjustment for gains realized in net income |
| |
| ( |
| | |||
Net unrealized loss on AFS securities |
| ( |
| |
| ( | |||
Net unrealized loss on hedging derivatives: |
|
|
|
|
|
| |||
Net unrealized loss arising during the period |
| ( |
| |
| ( | |||
Less: reclassification adjustment for gains (losses) realized in net income |
| — |
| — |
| — | |||
Net unrealized gain on hedging derivatives |
| ( |
| |
| ( | |||
Net unrealized loss on post-retirement plans: |
|
|
|
|
|
| |||
Net unrealized loss arising during the period |
| ( |
| |
| ( | |||
Less: reclassification adjustment for gains (losses) realized in net income |
| — |
| — |
| — | |||
Net unrealized loss on post-retirement plans |
| ( |
| |
| ( | |||
Other comprehensive loss | $ | ( | $ | | $ | ( | |||
100
2021 | |||||||||
(in thousands) |
| Before Tax |
| Tax Effect |
| Net of Tax | |||
Net unrealized loss on AFS securities: |
|
|
|
|
|
| |||
Net unrealized loss arising during the period | $ | ( | $ | | $ | ( | |||
Less: reclassification adjustment for gains realized in net income |
| |
| ( |
| | |||
Net unrealized loss on AFS securities |
| ( |
| |
| ( | |||
Net unrealized gain on hedging derivatives: |
|
|
|
|
|
| |||
Net unrealized gain arising during the period |
| |
| ( |
| | |||
Less: reclassification adjustment for gains (losses) realized in net income |
| — |
| — |
| — | |||
Net unrealized gain on cash flow hedging derivatives |
| |
| ( |
| | |||
Net unrealized loss on post-retirement plans: |
|
|
|
|
|
| |||
Net unrealized loss arising during the period |
| |
| ( |
| | |||
Less: reclassification adjustment for gains (losses) realized in net income |
| — |
| — |
| — | |||
Net unrealized loss on post-retirement plans |
| |
| ( |
| | |||
Other comprehensive loss | $ | ( | $ | | $ | ( | |||
The following table presents the changes in each component of accumulated other comprehensive income/(loss) in 2023, 2022 and 2021:
| ||||||||||||
| Net unrealized |
| Net gain (loss) on |
| Net unrealized |
| ||||||
gain (loss) | effective cash | loss | ||||||||||
on AFS | flow hedging | on pension | ||||||||||
(in thousands) | Securities | derivatives | plans | Total | ||||||||
Year Ended December 31, 2023 |
|
|
|
|
|
|
| |||||
Balance at beginning of period | $ | ( | $ | ( | $ | ( | $ | ( | ||||
Other comprehensive gain before reclassifications |
| |
| |
| |
| | ||||
Less: amounts reclassified from accumulated other comprehensive income |
| |
| — |
| — |
| | ||||
Total other comprehensive income |
| |
| |
| |
| | ||||
Balance at end of period | $ | ( | $ | ( | $ | ( | $ | ( | ||||
Year Ended December 31, 2022 | ||||||||||||
Balance at beginning of period | $ | | $ | | $ | ( | $ | | ||||
Other comprehensive loss before reclassifications |
| ( |
| ( |
| ( |
| ( | ||||
Less: amounts reclassified from accumulated other comprehensive income |
| |
| — |
| — |
| | ||||
Total other comprehensive loss |
| ( |
| ( |
| ( |
| ( | ||||
Balance at end of period | $ | ( | $ | ( | $ | ( | $ | ( | ||||
Year Ended December 31, 2021 | ||||||||||||
Balance at beginning of period | $ | | $ | ( | $ | ( | $ | | ||||
Other comprehensive loss before reclassifications |
| ( |
| |
| |
| ( | ||||
Less: amounts reclassified from accumulated other comprehensive income |
| |
| — |
| — |
| | ||||
Total other comprehensive loss |
| ( |
| |
| |
| ( | ||||
Balance at end of period | $ | | $ | | $ | ( | $ | | ||||
101
The following tables presents the amounts reclassified out of each component of accumulated other comprehensive income (loss) in 2023, 2022 and 2021:
Affected Line Item where | |||||||||||
(in thousands) |
| 2023 |
| 2022 |
| 2021 |
| Net Income is Presented | |||
Net realized gains on AFS securities: |
|
|
|
| |||||||
Before tax | $ | | $ | | $ | |
| Non-interest income | |||
Tax effect |
| ( |
| ( |
| ( |
| Tax expense | |||
Total reclassifications for the period | $ | | $ | | $ | | |||||
Earnings per Share
Earnings per share have been computed based on the following:
(in thousands, except per share and share data) |
| 2023 |
| 2022 |
| 2021 | |||
Net income | $ | | $ | | $ | | |||
Average number of basic common shares outstanding |
| |
| |
| | |||
Plus: dilutive effect of stock options and awards outstanding |
| |
| |
| | |||
Average number of diluted common shares outstanding(1) |
| |
| |
| | |||
Earnings per share: |
|
|
|
|
|
| |||
Basic | $ | | $ | | $ | | |||
Diluted | $ | | $ | | $ | | |||
| (1) | Average diluted shares outstanding are computed using the treasury stock method. |
102
NOTE 13. STOCK-BASED COMPENSATION PLANS
We have several stock-based compensation plans that allow for grants of restricted stock, restricted shares, performance share units, performance shares and restricted stock units to our employees and non-employee directors. Our stock-based compensation plans are administered by the Compensation Committee of the Board of Directors. For the years ended December 31, 2023, 2022 and 2021, all common stock issuances in connection with stock-based compensation arrangements were issued from unissued shares. As of December 31, 2023, total shares authorized under the stock-based compensation 2019 plan for employees and directors were
Compensation expense recognized in connection with the stock-based compensation plans are presented in the following table for the years ended December 31, 2023, 2022, and 2021:
(in thousands) |
| 2023 |
| 2022 |
| 2021 | |||
Stock options | $ | — | $ | — | $ | — | |||
Restricted stock awards | | | | ||||||
Performance stock units |
| |
| |
| | |||
Restricted stock units |
| |
| |
| | |||
Total compensation expense | $ | | $ | | $ | | |||
Tax benefits recognized from stock-based compensation plans for the years ended December 31, 2023, 2022, and 2021 are, as follows:
(in thousands) |
| 2023 |
| 2022 |
| 2021 | |||
Stock options(1) | $ | | $ | | $ | | |||
Restricted stock awards | | | | ||||||
Performance stock units |
| |
| |
| | |||
Restricted stock units |
| |
| |
| | |||
Total tax benefit | $ | | $ | | $ | | |||
(1) We do not receive a tax benefit on this plan until disqualifying dispositions are made.
Stock Options
A summary of stock options as of December 31, 2023 and 2022, and changes during the year then ended is presented below:
Number of | Weighted | Aggregate | ||||||
Stock Options | Average | Intrinsic Value | ||||||
Stock Options |
| Outstanding |
| Exercise Price |
| (in thousands) | ||
Outstanding at January 1, 2023 |
| | $ | |
|
| ||
Granted |
| — |
| — |
|
| ||
Exercised |
| ( |
| |
|
| ||
Forfeited |
| — |
| — |
|
| ||
Expired | ( | | ||||||
Outstanding at December 31, 2023 |
| | $ | | $ | | ||
Ending vested and expected to vest December 31, 2023 |
| | $ | | $ | | ||
Exercisable at December 31, 2023 |
| |
| |
| | ||
103
Number of | Weighted | Aggregate | ||||||
Stock Options | Average | Intrinsic Value | ||||||
Stock Options |
| Outstanding |
| Exercise Price |
| (in thousands) | ||
Outstanding at January 1, 2022 |
| | $ | |
|
| ||
Granted |
| — |
| — |
|
| ||
Exercised |
| ( |
| |
|
| ||
Forfeited |
| — |
| — |
|
| ||
Expired | — | — | ||||||
Outstanding at December 31, 2022 |
| | $ | | $ | | ||
Ending vested and expected to vest December 31, 2022 |
| | $ | | $ | | ||
Exercisable at December 31, 2022 |
| |
| |
| | ||
All outstanding options were fully vested with
Restricted Stock Awards
Restricted stock awards (“RSAs”) are granted to certain directors and executive officers and vest immediately. A summary of RSAs as of December 31, 2023 and 2022, and changes during the year then ended is presented below:
Number of | |||||
Restricted Stock | Weighted Average | ||||
Awards | Grant Date Fair | ||||
Restricted Stock Awards |
| Outstanding |
| Value | |
Outstanding at January 1, 2023 |
| | $ | | |
Awarded |
| |
| | |
Vested |
| ( |
| | |
Forfeited |
| — |
| — | |
Outstanding at December 31, 2023 |
| | $ | | |
Number of | |||||
Restricted Stock | Weighted Average | ||||
Awards | Grant Date Fair | ||||
Restricted Stock Awards |
| Outstanding |
| Value | |
Outstanding at January 1, 2022 |
| — | $ | — | |
Awarded |
| |
| | |
Vested |
| ( |
| | |
Forfeited |
| — |
| — | |
Outstanding at December 31, 2022 |
| | $ | | |
Unrecognized expense for non-vested RSAs totaled $
Performance Stock Units
We have a long-term incentive plan where performance unit awards (“PSUs”) are granted to certain executive officers providing the opportunity to earn shares of common stock of the Company based on our performance compared to peers. Participants in the plan were collectively granted PSUs ranging from
104
The following table summarizes PSUs at target as of December 31, 2023 and 2022:
Number of | Weighted Average | ||||
Performance Stock | Grant Date Fair | ||||
Performance Stock Units |
| Units Outstanding |
| Value | |
Nonvested at January 1, 2023 |
| | $ | | |
Awarded |
| |
| | |
Vested and exercised |
| ( |
| | |
Forfeited |
| ( |
| | |
Nonvested at December 31, 2023 |
| | $ | | |
Number of | Weighted Average | ||||
Performance Stock | Grant Date Fair | ||||
Performance Stock Units |
| Units Outstanding |
| Value | |
Nonvested at January 1, 2022 |
| | $ | | |
Awarded |
| |
| | |
Vested and exercised |
| — |
| — | |
Forfeited |
| ( |
| | |
Nonvested at December 31, 2022 |
| | $ | | |
Unrecognized expense for non-vested PSUs totaled $
Restricted Stock Units
During 2023 and 2022, restricted stock units (“RSUs”) were granted to certain executive officers and senior vice presidents. Awards to executives vest annually over
The following table summarizes RSUs activity in 2023 and 2022:
Number of | Weighted Average | ||||
Restricted Stock | Grant Date Fair | ||||
| Units Outstanding |
| Value | ||
Outstanding at January 1, 2023 | |
| $ | | |
Granted | | | |||
Vested and exercised | ( | | |||
Forfeited | ( | | |||
Outstanding at December 31, 2023 | | $ | | ||
Number of | Weighted Average | ||||
Restricted Stock | Grant Date Fair | ||||
| Units Outstanding |
| Value | ||
Outstanding at January 1, 2022 | |
| $ | | |
Granted | | | |||
Vested and exercised | ( | | |||
Forfeited | ( | | |||
Outstanding at December 31, 2022 | | $ | | ||
RSUs include cash-based restricted stock units (“CRSUs”), total CRSUs vested and exercised during 2023 and 2022 were
105
Employee Stock Purchase Plan
We maintain an employee stock purchase plan (“ESPP”) under which employees, through payroll deductions, are able to purchase shares of Company’s common stock. The purchase price is
106
NOTE 14. FAIR VALUE MEASUREMENTS
Recurring Fair Value Measurements
The following table summarizes financial assets and financial liabilities measured at fair value on a recurring basis as of December 31, 2023 and December 31, 2022, segregated by the level of the valuation inputs within the fair value hierarchy utilized to measure fair value.
December 31, 2023 | ||||||||||||
| Level 1 |
| Level 2 |
| Level 3 |
| Total | |||||
(in thousands) | Inputs | Inputs | Inputs | Fair Value | ||||||||
Available for sale securities: |
|
|
| |||||||||
Obligations of US Government-sponsored enterprises | $ | | $ | | $ | | $ | | ||||
Mortgage-backed securities: |
|
|
|
|
|
|
| |||||
US Government-sponsored enterprises | | | | | ||||||||
US Government agency |
| |
| |
| |
| | ||||
Private label |
| |
| |
| |
| | ||||
Obligations of states and political subdivisions thereof |
| |
| |
| |
| | ||||
Corporate bonds |
| |
| |
| |
| | ||||
Loans held for sale | | | | | ||||||||
Derivative assets |
| |
| |
| |
| | ||||
Derivative liabilities |
| |
| ( |
| ( |
| ( | ||||
December 31, 2022 | ||||||||||||
| Level 1 |
| Level 2 |
| Level 3 |
| Total | |||||
(in thousands) | Inputs | Inputs | Inputs | Fair Value | ||||||||
Available for sale securities: |
|
|
|
| ||||||||
Obligations of US Government-sponsored enterprises | $ | — | $ | | $ | — | $ | | ||||
Mortgage-backed securities: |
|
|
|
|
|
|
|
| ||||
US Government-sponsored enterprises | — | | — | | ||||||||
US Government agency |
| — |
| |
| — |
| | ||||
Private label |
| — |
| |
| — |
| | ||||
Obligations of states and political subdivisions thereof |
| — |
| |
| — |
| | ||||
Corporate bonds |
| — |
| |
| — |
| | ||||
Loans held for sale | — | — | — | — | ||||||||
Derivative assets |
| — |
| |
| — |
| | ||||
Derivative liabilities |
| — |
| ( |
| — |
| ( | ||||
Securities Available for Sale: All securities and major categories of securities classified as available for sale are reported at fair value utilizing Level 2 inputs. For these securities, we obtain fair value measurements from independent pricing providers. The fair value measurements used by the pricing providers consider observable data that may include dealer quotes, market maker quotes and live trading systems. If quoted prices are not readily available, fair values are determined using matrix pricing models, or other model-based valuation techniques requiring observable inputs other than quoted prices such as market pricing spreads, credit information, callable features, cash flows, the US Treasury yield curve, trade execution data, market consensus prepayment speeds, default rates, and the securities’ terms and conditions, among other things.
Loans Held for Sale: The valuation of our loans held for sale are determined on an individual basis using quoted secondary market prices and are classified as Level 2 measurements.
107
Derivative Assets and Liabilities
Cash Flow Hedges. The valuation of our cash flow hedges are obtained from a third party. The pricing analysis is based on observable inputs for the contractual terms of the derivatives, including the period to maturity and interest rate curves. The inputs used to value the cash flow hedges are all classified as Level 2 measurements.
Interest Rate Lock Commitments. We enter into IRLCs for residential mortgage loans, which commit us to lend funds to potential borrowers at a specific interest rate and within a specified period of time. The estimated fair value of commitments to originate residential mortgage loans for sale is based on quoted prices for similar loans in active markets. However, this value is adjusted by a factor which considers the likelihood of a loan in a lock position will ultimately close. The closing ratio is derived from internal data and is adjusted using significant management judgment. As such, IRLCs are classified as Level 3 measurements.
Forward Sale Commitments. We utilize forward sale commitments as economic hedges against potential changes in the values of the IRLCs and loans originated for sale. The fair values of mandatory delivery loan sale commitments are determined similarly to the IRLCs using quoted prices in the marketplace that are observable. However, closing ratios included in the calculation are internally generated and are based on management’s judgment and prior experience, which are not considered observable factors. As such, mandatory delivery forward commitments are classified as Level 3 measurements.
Customer Loan Derivatives. The valuation of our customer loan derivatives is obtained from a third-party pricing service and is determined using a discounted cash flow analysis on the expected cash flows of each derivative. The pricing analysis is based on observable inputs for the contractual terms of the derivatives, including the period to maturity and interest rate curves. We incorporate credit valuation adjustments to appropriately reflect our nonperformance risk and the respective counterparty’s nonperformance risk in the fair value measurements. In adjusting the fair value of the derivative contracts for the effect of nonperformance risk, we have considered the impact of master netting arrangements and any applicable credit enhancements, such as collateral postings.
Although we have determined that the majority of the inputs used to value customer loan derivatives fall within Level 2 of the fair value hierarchy, the credit valuation adjustments associated with derivatives utilize Level 3 inputs, such as estimates of current credit spreads to evaluate the likelihood of default by itself and counterparties. However, as of December 31, 2023, we assessed the significance of the impact of the credit valuation adjustments on the overall valuation of our derivative positions and determined that the credit valuation adjustments are not significant to the overall valuation of our derivatives. As a result, we determined that the derivative valuations in their entirety are classified in Level 2 of the fair value hierarchy.
The table below presents the changes in Level 3 assets and liabilities that were measured at fair value on a recurring basis in 2023 and 2022.
Assets (Liabilities) | ||||||
Interest Rate Lock | Forward | |||||
(in thousands) |
| Commitments |
| Commitments | ||
Year Ended December 31, 2023 |
|
|
|
| ||
Balance at beginning of period | $ | — | $ | — | ||
| |
| — | |||
Balance at end of period | $ | | $ | — | ||
Year Ended December 31, 2022 |
|
|
|
| ||
Balance at beginning of period | $ | | $ | | ||
| ( |
| ( | |||
Balance at end of period | $ | — | $ | | ||
108
Quantitative information about the significant unobservable inputs within Level 3 recurring assets and liabilities is as follows:
Fair Value | |||||||||||
(in thousands, | December 31, | Valuation | Unobservable | Unobservable | |||||||
except ratios) |
| 2023 |
| Techniques |
| Inputs |
| Input Value |
| ||
Assets (Liabilities) |
|
|
|
|
| ||||||
Interest Rate Lock Commitment |
| $ | | Pull-through Rate Analysis |
| Closing Ratio |
| | % | ||
| Pricing Model | Origination Costs, per loan | $ | | |||||||
Discount Cash Flows | Mortgage Servicing Asset | | % | ||||||||
Total | $ | | |||||||||
| Fair Value |
|
| Significant |
| ||||||
December 31, | Valuation | Unobservable | Unobservable | ||||||||
(in thousands, except ratios) |
| 2022 | Techniques |
| Inputs |
| Input Value | ||||
Assets (Liabilities) |
|
|
|
|
| ||||||
Interest Rate Lock Commitment |
| $ | | Pull-through Rate Analysis |
| Closing Ratio |
| | % | ||
| Pricing Model | Origination Costs, per loan | $ | | |||||||
Discount Cash Flows | Mortgage Servicing Asset | | % | ||||||||
| |||||||||||
Forward Commitments |
| | Quoted prices for similar loans in active markets |
| Freddie Mac pricing system |
| $ | ||||
Total | $ | | |||||||||
There were
Non-Recurring Fair Value Measurements
We are required, on a non-recurring basis, to adjust the carrying value or provide valuation allowances for certain assets using fair value measurements in accordance with U.S. GAAP. The following is a summary of applicable non-recurring fair value measurements.
Fair Value | |||||||||||
Measurement Date as of | |||||||||||
Dec 31, 2023 | Dec 31, 2022 | December 31, 2023 | December 31, 2023 | ||||||||
Level 3 | Level 3 | Total | Level 3 | ||||||||
(in thousands) |
| Inputs |
| Inputs |
| Gains (Losses) |
| Inputs | |||
Assets |
|
|
|
| |||||||
Individually evaluated loans | $ | | $ | | $ | ( | December 2023 | ||||
Capitalized servicing rights |
| | |
| ( |
| December 2023 | ||||
Premises held for sale |
| | |
| |
| December 2023 | ||||
$ | | $ | | $ | ( |
|
| ||||
109
Quantitative information about the significant unobservable inputs within Level 3 non-recurring assets as of December 31, 2023 and December 31, 2022 is as follows:
(in thousands, except ratios) |
| Fair Value December 31, 2023 |
| Valuation Techniques |
| Unobservable Inputs |
| Range (Weighted Average)(a) |
| ||
Assets |
|
|
|
|
|
|
| ||||
Individually evaluated loans | $ | |
| Fair value of collateral-appraised value |
| Loss severity | |||||
| Appraised value | $ | |||||||||
Individually evaluated loans |
| |
| Discount cash flow |
| Discount rate |
| ||||
| Cash flows | $ | |||||||||
Capitalized servicing rights |
| |
| Discounted cash flow |
| Constant prepayment rate |
| ||||
|
|
|
| Discount rate |
| ||||||
Premises held for sale |
| |
| Fair value of asset less selling costs |
| Appraised value | $ | ||||
|
|
|
| Selling Costs |
| ||||||
Total | $ | |
|
|
|
|
|
| |||
| (a) | Where dollar amounts are disclosed, the amounts represent the lowest and highest fair value of the respective assets in the population except for adjustments for market/property conditions, which represents the range of adjustments to individuals properties. |
(in thousands, except ratios) |
| Fair Value December 31, 2022 |
| Valuation Techniques |
| Unobservable Inputs |
| Range (Weighted Average)(a) | |||
Assets | |||||||||||
Individually evaluated loans | $ | |
| Fair value of collateral-appraised value |
| Loss severity | |||||
| Appraised value | $ | |||||||||
Individually evaluated loans |
| |
| Discount cash flow |
| Discount rate |
| ||||
| Cash flows | $ | |||||||||
Capitalized servicing rights |
| |
| Discounted cash flow |
| Constant prepayment rate |
| ||||
|
|
|
| Discount rate |
| ||||||
Premises held for sale |
| |
| Fair value of asset less selling costs |
| Appraised value | $ | ||||
|
|
| Selling Costs |
| |||||||
Total | $ | | |||||||||
| (a) | Where dollar amounts are disclosed, the amounts represent the lowest and highest fair value of the respective assets in the population except for adjustments for market/property conditions, which represents the range of adjustments to individuals properties. |
There were
110
Individually evaluated loans. Loans are generally not recorded at fair value on a recurring basis. Periodically, we record non-recurring adjustments to the carrying value of loans based on fair value measurements for partial charge-offs of the uncollectible portions of those loans. Non-recurring adjustments can also include certain impairment amounts for collateral-dependent loans calculated when establishing the allowance for credit losses. Such amounts are generally based on the fair value of the underlying collateral supporting the loan and, as a result, the carrying value of the loan less the calculated valuation amount does not necessarily represent the fair value of the loan. Real estate collateral is typically valued using appraisals or other indications of value based on recent comparable sales of similar properties or assumptions generally observable in the marketplace. However, the choice of observable data is subject to significant judgment, and there are often adjustments based on judgment in order to make observable data comparable and to consider the impact of time, the condition of properties, interest rates, and other market factors on current values. Additionally, commercial real estate appraisals frequently involve discounting of projected cash flows, which relies inherently on unobservable data. Therefore, non-recurring fair value measurement adjustments relating to real estate collateral have generally been classified as Level 3. Estimates of fair value for other collateral supporting commercial loans are generally based on assumptions not observable in the marketplace and therefore such valuations have been classified as Level 3.
Capitalized loan servicing rights. A loan servicing right asset represents the amount by which the present value of the estimated future net cash flows to be received from servicing loans exceed adequate compensation for performing the servicing. The fair value of loan servicing rights is estimated using a present value cash flow model. The most important assumptions used in the valuation model are the anticipated rate of the loan prepayments and discount rates. Adjustments are only recorded when the discounted cash flows derived from the valuation model are less than the carrying value of the asset. Although some assumptions in determining fair value are based on standards used by market participants, some are based on unobservable inputs and therefore are classified in Level 3 of the valuation hierarchy.
Other real estate owned or OREO. OREO results from the foreclosure process on residential or commercial loans issued by the Bank. Upon assuming the real estate, we record the property at the fair value of the asset less the estimated sales costs. Thereafter, OREO properties are recorded at the lower of cost or fair value less the estimated sales costs. OREO fair values are primarily determined based on Level 3 data including sales comparables and appraisals.
Premises held for sale. Assets held for sale, identified as part of our strategic review and branch optimization exercise, were transferred from premises and equipment at the lower of amortized cost or fair value less the estimated sales costs. Assets held for sale fair values are primarily determined based on Level 3 data including sales comparables and appraisals.
111
Summary of Estimated Fair Values of Financial Instruments
The estimated fair values, and related carrying amounts, of our financial instruments are included in the table below. Certain financial instruments and all non-financial instruments are excluded from disclosure requirements. Accordingly, the aggregate fair value amounts presented herein may not necessarily represent the underlying fair value of the Company.
December 31, 2023 | |||||||||||||||
Carrying | Fair | ||||||||||||||
(in thousands) |
| Amount |
| Value |
| Level 1 |
| Level 2 |
| Level 3 | |||||
Financial Assets |
|
|
|
|
|
|
|
|
|
| |||||
Cash and cash equivalents | $ | | $ | | $ | | $ | — | $ | — | |||||
Securities available for sale |
| |
| |
| — |
| |
| — | |||||
FHLB stock |
| |
| |
| — |
| |
| — | |||||
Loans held for sale | | | — | | — | ||||||||||
Net loans |
| |
| |
| — |
| — |
| | |||||
Accrued interest receivable |
| |
| |
| — |
| |
| — | |||||
Cash surrender value of bank-owned life insurance policies |
| |
| |
| — |
| |
| — | |||||
Derivative assets |
| |
| |
| — |
| |
| | |||||
Financial Liabilities |
|
|
|
|
|
|
|
|
|
| |||||
Non-maturity deposits | $ | | $ | | $ | — | $ | | $ | — | |||||
Time deposits | | | — | | — | ||||||||||
Securities sold under agreements to repurchase | | | — | | — | ||||||||||
FHLB advances |
| |
| |
| — |
| |
| — | |||||
Subordinated borrowings |
| |
| |
| — |
| |
| — | |||||
Derivative liabilities |
| |
| |
| — |
| |
| | |||||
December 31, 2022 | |||||||||||||||
Carrying | Fair | ||||||||||||||
(in thousands) |
| Amount |
| Value |
| Level 1 |
| Level 2 |
| Level 3 | |||||
Financial Assets |
|
|
|
|
|
|
|
|
|
| |||||
Cash and cash equivalents | $ | | $ | | $ | | $ | — | $ | — | |||||
Securities available for sale |
| |
| |
| — |
| |
| — | |||||
FHLB stock |
| |
| |
| — |
| |
| — | |||||
Loans held for sale | — | — | — | — | — | ||||||||||
Net loans |
| |
| |
| — |
| — |
| | |||||
Accrued interest receivable |
| |
| |
| — |
| |
| — | |||||
Cash surrender value of bank-owned life insurance policies |
| |
| |
| — |
| |
| — | |||||
Derivative assets |
| |
| |
| — |
| |
| — | |||||
Financial Liabilities |
|
|
|
|
|
|
|
|
|
| |||||
Non-maturity deposits | $ | | $ | | $ | — | $ | | $ | — | |||||
Time deposits | | | — | | — | ||||||||||
Securities sold under agreements to repurchase | | | — | | — | ||||||||||
FHLB advances |
| |
| |
| — |
| |
| — | |||||
Subordinated borrowings |
| |
| |
| — |
| |
| — | |||||
Derivative liabilities |
| |
| |
| — |
| |
| — | |||||
112
NOTE 15. REVENUE FROM CONTRACTS WITH CUSTOMERS
We have accounted for the various non-interest revenue streams and related contracts under ASC 606.
Disaggregation of Revenue
The following tables present disaggregation of our non-interest revenue by major business line and timing of revenue recognition for the transfer of products or services:
Year Ended December 31, | ||||||
(in thousands) |
| 2023 |
| 2022 | ||
Non-interest income within the scope of ASC 606: |
|
|
|
| ||
Trust management fees | $ | | $ | | ||
Financial services fees |
| |
| | ||
Interchange fees |
| |
| | ||
Customer deposit fees |
| |
| | ||
Other customer service fees |
| |
| | ||
Total non-interest income within the scope of ASC 606 | | | ||||
Total non-interest income not within the scope of ASC 606 | | | ||||
Total non-interest income | $ | | $ | | ||
Year Ended December 31, | ||||||
(in thousands) |
| 2023 |
| 2022 | ||
Timing of Revenue Recognition |
|
|
|
| ||
Products and services transferred at a point in time | $ | | $ | | ||
Products and services transferred over time |
| |
| | ||
Total | $ | | $ | | ||
Trust Management Fees
The trust management business generates revenue through a range of fiduciary services including trust and estate administration, financial advice, and investment management to individuals, businesses, not-for-profit organizations, and municipalities. These fees are primarily earned over time as we charge our customers on a monthly or quarterly basis in accordance with investment advisory agreements. Fees are generally assessed based on a tiered scale of the market value of AUM at month end. Certain fees, such as bill paying fees, distribution fees, real estate sale fees, and supplemental tax service fees, are recorded as revenue at a point in time upon the completion of the service.
Financial Services Fees
Bar Harbor Financial Services is a branch office of Osaic, an independent registered broker dealer offering securities and insurance products not affiliated with the Company or its subsidiaries. We have a revenue sharing agreement with Osaic for any financial service fee income generated. Financial services fees are recognized at a point in time upon the completion of service requirements.
Interchange Fees
We earn interchange fees from transaction fees that merchants pay whenever a customer uses a debit card to make a purchase from their store. The fees are paid to the card-issuing bank to cover handling costs, fraud, bad debt costs and the risk involved in approving the payment. Interchange fees are generally recognized as revenue at a point in time upon the completion of a debit card transaction.
Customer Deposit Fees
The customer deposit business offers a variety of deposit accounts with a range of interest rates, fee schedules and other terms, which are designed to meet the customer's financial needs. Additional depositor-related services provided to customers include ATM, bank-by-phone, internet banking, internet bill pay, mobile banking, and other cash management
113
services which include remote deposit capture, ACH origination, and wire transfers. These customer deposit fees are generally recognized at a point in time upon the completion of the service.
Other Customer Service Fees
We have certain incentive and referral fee arrangements with independent third parties in which fees are earned for new account activity, product sales, or transaction volume generated for the respective third parties. We also earn a percentage of the fees generated from third-party credit card plans promoted through the Bank. Revenue from these incentive and referral fee arrangements is recognized over time using the right to invoice measure of progress.
Contract Balances with Customers
The following table provides information about contract assets or receivables and contract liabilities or deferred revenues from contracts with customers:
|
| |||||
(in thousands) | December 31, 2023 | December 31, 2022 | ||||
Balances from contracts with customers only: |
|
|
|
| ||
Other Assets | $ | | $ | | ||
Other Liabilities |
| |
| | ||
The timing of revenue recognition, billings and cash collections results in contract assets or receivables and contract liabilities or deferred revenue on the consolidated balance sheets. For most customer contracts, fees are deducted directly from customer accounts and, therefore, there is no associated impact on the accounts receivable balance. For certain types of service contracts, we have an unconditional right to consideration under the service contract and an accounts receivable balance is recorded for services completed. When consideration is received, or such consideration is unconditionally due, from a customer prior to transferring goods or services to the customer under the terms of a contract, a contract liability is recorded. Contract liabilities are recognized as revenue after control of the products or services is transferred to the customer and all revenue recognition criteria have been met.
Costs to Obtain and Fulfill a Contract
We currently expense contract costs for processing and administrative fees for debit card transactions. We also expense custody fees and transactional costs associated with securities transactions as well as third party tax preparation fees. We have elected the practical expedient in ASC 340-40-25-4, whereby we recognize the incremental costs of obtaining contracts as an expense when incurred if the amortization period of the assets we otherwise would have recognized is
NOTE 16. LEASES
A lease is defined as a contract, or part of a contract, that conveys the right to control the use of identified property, plant or equipment for a period of time in exchange for consideration. Most of our leases are for branches, ATM locations, and office space and have terms extending through 2040. All leases are classified as operating leases, and are recognized on the consolidated balance sheets as a right-of-use (“ROU”) asset with a corresponding lease liability.
The following table presents the consolidated statements of condition classification of the ROU assets and lease liabilities:
(in thousands) |
| Classification |
| December 31, 2023 |
| December 31, 2022 | ||
Lease Right-of-Use Assets |
|
|
| |||||
Operating lease right-of-use assets |
| $ | | $ | | |||
Lease Liabilities |
|
|
|
|
|
| ||
Operating lease liabilities |
|
| |
| | |||
The calculated amount of the ROU assets and lease liabilities in the table above are impacted by the length of the lease term and the discount rate used for the present value of the minimum lease payments. The lease agreements often include
114
one or more options to renew at our discretion. If at lease inception, we consider the exercising of a renewal option to be reasonably certain, we will include the extended term in the calculation of the ROU asset and lease liability.
The following table presents the weighted average lease term and discount rate of the leases:
| December 31, 2023 |
| December 31, 2022 | |||
Weighted-average remaining lease term (in years) |
|
| ||||
Operating leases | ||||||
Weighted-average discount rate |
|
| ||||
Operating leases | | % | | % | ||
The following table represents lease costs and other lease information. As we have elected, for all classes of underlying assets, not to separate lease and non-lease components and instead to account for them as a single lease component, the variable lease cost primarily represents variable payments such as real estate taxes, common area maintenance and utilities.
Year Ended | |||||||||
(in thousands) | December 31, 2023 |
| December 31, 2022 | December 31, 2021 | |||||
Lease Costs |
|
|
|
| |||||
Operating lease cost | $ | | $ | | $ | | |||
Variable lease cost |
| |
| |
| | |||
Total lease cost | $ | | $ | | $ | | |||
Future minimum payments for operating leases with initial or remaining terms of one year or more as of December 31, 2023 are, as follows:
(in thousands) |
| Payments | |
Twelve Months Ended: |
|
| |
December 31, 2024 | $ | | |
December 31, 2025 |
| | |
December 31, 2026 |
| | |
December 31, 2027 |
| | |
December 31, 2028 |
| | |
Thereafter |
| | |
Total future minimum lease payments |
| | |
Amounts representing interest |
| ( | |
Present value of net future minimum lease payments | $ | | |
115
NOTE 17. CONDENSED FINANCIAL STATEMENTS OF PARENT COMPANY
The condensed balance sheets of Bar Harbor Bankshares as of December 31, 2023 and 2022, and the condensed statements of income and cash flows for the years ended December 31, 2023, 2022 and 2021 are presented below:
CONDENSED BALANCE SHEETS
December 31, | ||||||
(in thousands) |
| 2023 |
| 2022 | ||
Assets |
|
|
|
| ||
Cash | $ | | $ | | ||
Investment in subsidiaries |
| |
| | ||
Premises and equipment |
| |
| | ||
Other assets |
| |
| | ||
Total assets | $ | | $ | | ||
Liabilities and Shareholders’ Equity |
|
|
|
| ||
Subordinated notes | $ | | $ | | ||
Accrued expenses |
| |
| | ||
Shareholders’ equity |
| |
| | ||
Total liabilities and shareholders’ equity | $ | | $ | | ||
CONDENSED STATEMENTS OF INCOME
Years Ended December 31, | |||||||||
(in thousands) |
| 2023 |
| 2022 |
| 2021 | |||
Income: | |||||||||
Dividends from subsidiaries | $ | | $ | | $ | | |||
Other income |
| |
| |
| | |||
Total income |
| |
| |
| | |||
Interest expense |
| |
| |
| | |||
Non-interest expense |
| |
| |
| | |||
Total expense |
| |
| |
| | |||
Income before taxes and equity in undistributed income of subsidiaries |
| |
| |
| | |||
Income tax benefit |
| ( |
| ( |
| ( | |||
Income before equity in undistributed income of subsidiaries |
| |
| |
| | |||
Equity in undistributed income of subsidiaries |
| |
| |
| | |||
Net income | $ | | $ | | $ | | |||
116
CONDENSED STATEMENTS OF CASH FLOWS
Years Ended December 31, | |||||||||
(in thousands) |
| 2023 |
| 2022 |
| 2021 | |||
Cash flows from operating activities: | |||||||||
Net income | $ | | $ | | $ | | |||
Adjustments to reconcile net income to net cash provided by (used in) operating activities: |
|
|
|
|
|
| |||
Equity in undistributed income of subsidiaries |
| ( |
| ( |
| ( | |||
Other, net |
| ( |
| |
| ( | |||
Net cash provided by operating activities |
| |
| |
| | |||
Cash flows from investing activities: |
|
|
|
|
|
| |||
Acquisitions, net of cash paid |
| — |
| — |
| — | |||
Purchase of securities |
| — |
| — |
| — | |||
Capital contribution to subsidiary |
| — |
| — |
| — | |||
Net cash (used in) investing activities |
| — |
| — |
| — | |||
Cash flows from financing activities: |
|
|
|
|
|
| |||
Proceeds from issuance of subordinated debt |
| — |
| — |
| — | |||
Repayment of subordinated debt |
| — |
| — |
| — | |||
Net proceeds from common stock |
| |
| |
| | |||
Net proceeds from reissuance of treasury stock |
| — |
| — |
| — | |||
Common stock cash dividends paid |
| ( |
| ( |
| ( | |||
Net cash used in financing activities |
| ( |
| ( |
| ( | |||
Net change in cash and cash equivalents |
| |
| |
| ( | |||
Cash and cash equivalents at beginning of year |
| |
| |
| | |||
Cash and cash equivalents at end of year | $ | | $ | | $ | | |||
NOTE 18. SUBSEQUENT EVENTS
There were no significant subsequent events between December 31, 2023 and through the date the financial statements are issued.
ITEM 9. CHANGES IN AND DISAGREEMENTS WITH ACCOUNTANTS ON ACCOUNTING AND FINANCIAL DISCLOSURE.
None.
117
ITEM 9A. CONTROLS AND PROCEDURES
Evaluation of Disclosure Controls and Procedures: The Company carried out an evaluation, under the supervision and with the participation of management, including the Chief Executive Officer and Chief Financial Officer, of the effectiveness of its disclosure controls and procedures as of the end of the period covered by this Annual Report. Based upon that evaluation, the Chief Executive Officer and Chief Financial Officer concluded that the disclosure controls and procedures designed to ensure that the information required to be disclosed in the reports filed or submitted under the Exchange Act is recorded, processed, summarized and reported within the time periods specified in the Securities and Exchange Commission’s rules and forms and are operating in an effective manner.
Management Report on Internal Control over Financial Reporting: Management of the Company is responsible for establishing and maintaining adequate internal control over financial reporting. Internal control over financial reporting as defined in Rule 13a-15(f) and 15d-15(f) under the Exchange Act is a process designed by, or under the supervision of, the Company’s principal executive and principal financial officers and effected by the Company’s Board of Directors, management and other personnel to provide reasonable assurance regarding the reliability of financial reporting and the preparation of financial statements for external purposes in accordance with generally accepted accounting principles and includes those policies and procedures that:
| ● | Pertain to the maintenance of records that in reasonable detail accurately and fairly reflect the transactions and dispositions of the assets of the Company; |
| ● | Provide reasonable assurance that transactions are recorded as necessary to permit preparation of financial statements in accordance with GAAP, and that receipts and expenditures of the Company are being made only in accordance with authorizations of management and directors of the Company; and |
| ● | Provide reasonable assurance regarding prevention or timely detection of unauthorized acquisition, use or disposition of the Company’s assets that could have a material effect on the financial statements. |
Management assessed the effectiveness of the Company’s internal control over financial reporting as of December 31, 2023. In making this assessment, management used the criteria set forth by the Committee of Sponsoring Organizations of the Treadway Commission (“COSO”) in Internal Control-Integrated Framework (2013).
Based on its assessment, management believes that as of December 31, 2023, the Company’s internal control over financial reporting is effective, based on the criteria set forth by COSO in Internal Control – Integrated Framework (2013).
The Company’s independent registered public accounting firm has issued an audit report on the effectiveness of the Company’s internal control over financial reporting. This audit report appears within Item 8 of this Annual Report.
Changes in Internal Control Over Financial Reporting: No change in the internal control over financial reporting (as defined in Rules 13a-15(f) and 15d-15(f) under the Exchange Act) occurred during the last fiscal year that has materially affected, or is reasonably likely to materially affect, the Company’s internal control over financial reporting.
ITEM 9B. OTHER INFORMATION
Trading Arrangements
During the quarter ended December 31, 2023, (as defined in Rule 16a-1(f) under the Exchange Act) of the Company adopted or terminated any "Rule 10b5-1 trading arrangement" or "non-Rule 10b5-1 trading arrangement" as such terms are defined in Item 408(a) of Regulation S-K.
118
Josephine Iannelli Employment Agreement
On March 8, 2024, the Company and the Bank, entered into a new employment agreement with Josephine Iannelli with respect to the terms of Ms. Iannelli’s continued service as our and the Bank’s Chief Financial Officer (the “Employment Agreement”). The Employment Agreement supersedes and replaces the current employment agreement with Ms. Iannelli, which was entered into on September 14, 2020. The terms of the Employment Agreement were approved by the compensation and human resources committee of our Board of Directors (the “Compensation Committee”), and the compensation terms were established in part based upon the advice of our independent compensation consultant.
The initial term of the Employment Agreement is three years. In the absence of notice of intent not to extend the Employment Agreement, then the Employment Agreement will automatically extend for additional one-year terms. The Employment Agreement includes certain restrictive covenants that survive Ms. Iannelli’s termination of employment for a period of one year with respect to competition with us and non-solicitation of our customers and employees.
Under the terms of the Employment Agreement, Ms. Iannelli is entitled to an annual base salary of $459,000, which will be reviewed annually by the Compensation Committee, and the Employment Agreement further provides that her base compensation will not be reduced downward during the term of the Employment Agreement. We have also agreed to pay Ms. Iannelli certain other consideration and benefits. Ms. Iannelli is also eligible to participate in our annual incentive and long-term incentive plans previously approved by our Board. Other benefits under the Employment Agreement include participation in our Company benefit plans provided to other similarly situated executives and reasonable paid vacation and sick leave benefits consistent with our vacation and sick leave policies.
Ms. Iannelli’s Employment Agreement also provides for certain benefits and payments to her in the event she is terminated without “cause”, if she resigns with “good reason” (as those terms are defined in the Employment Agreement), or if the Employment Agreement is not renewed following the initial term. In addition to accrued benefits, her payment upon termination of the Employment Agreement without cause, resignation with good reason or termination of employment due to non-renewal will include (i) a lump sum payment equal to three times her base compensation as of the effective date of termination of employment, and (ii) a payment equal to 36 months of our share of premium contributions for group health benefits (including medical, vision and dental benefits). If such termination without cause or with good reason occurs as a result, or in anticipation, of a change in control (as such term is defined in the Employment Agreement), then Ms. Iannelli will also be eligible to receive a payment equal to three times her target annual bonus for such year. In each case, severance payments are conditioned on Ms. Iannelli providing us with a release of claims and complying with applicable post-employment covenants. Severance payments under the Employment Agreement may be reduced to the extent necessary to avoid the adverse tax consequences of Sections 280G and 4999 of the Internal Revenue Code of 1986, as amended.
The foregoing description of the Employment Agreement does not purport to be complete and is subject to, and qualified in its entirety by, the full text thereof, which is included as Exhibit 10.4 to this Annual Report and is incorporated into this Item 9B by reference.
ITEM 9C. DISCLOSURE REGARDING FOREIGN JURISDICTIONS THAT PREVENT INSPECTIONS.
None.
119
REPORT OF INDEPENDENT REGISTERED PUBLIC ACCOUNTING FIRM
To the Shareholders and the Board of Directors of Bar Harbor Bankshares and Subsidiaries
Opinion on the Internal Control Over Financial Reporting
We have audited Bar Harbor Bankshares and Subsidiaries' (the Company) internal control over financial reporting as of December 31, 2023, based on criteria established in Internal Control — Integrated Framework issued by the Committee of Sponsoring Organizations of the Treadway Commission in 2013. In our opinion, the Company maintained, in all material respects, effective internal control over financial reporting as of December 31, 2023, based on criteria established in Internal Control — Integrated Framework issued by the Committee of Sponsoring Organizations of the Treadway Commission in 2013.
We have also audited, in accordance with the standards of the Public Company Accounting Oversight Board (United States) (PCAOB), the consolidated balance sheets of the Company as of December 31, 2023 and 2022, the related consolidated statements of income, comprehensive income, changes in shareholders' equity and cash flows for each of the three years in the period ended December 31, 2023, and the related notes to the consolidated financial statements of the Company and our report dated March 11, 2024 expressed an unqualified opinion.
Basis for Opinion
The Company’s management is responsible for maintaining effective internal control over financial reporting and for its assessment of the effectiveness of internal control over financial reporting in the accompanying “Management Report on Internal Control Over Financial Reporting”. Our responsibility is to express an opinion on the Company’s internal control over financial reporting based on our audit. We are a public accounting firm registered with the PCAOB and are required to be independent with respect to the Company in accordance with U.S. federal securities laws and the applicable rules and regulations of the Securities and Exchange Commission and the PCAOB.
We conducted our audit in accordance with the standards of the PCAOB. Those standards require that we plan and perform the audit to obtain reasonable assurance about whether effective internal control over financial reporting was maintained in all material respects. Our audit included obtaining an understanding of internal control over financial reporting, assessing the risk that a material weakness exists, and testing and evaluating the design and operating effectiveness of internal control based on the assessed risk. Our audit also included performing such other procedures as we considered necessary in the circumstances. We believe that our audit provides a reasonable basis for our opinion.
Definition and Limitations of Internal Control Over Financial Reporting
A company's internal control over financial reporting is a process designed to provide reasonable assurance regarding the reliability of financial reporting and the preparation of financial statements for external purposes in accordance with generally accepted accounting principles. A company's internal control over financial reporting includes those policies and procedures that (1) pertain to the maintenance of records that, in reasonable detail, accurately and fairly reflect the transactions and dispositions of the assets of the Company; (2) provide reasonable assurance that transactions are recorded as necessary to permit preparation of financial statements in accordance with generally accepted accounting principles, and that receipts and expenditures of the Company are being made only in accordance with authorizations of management and directors of the Company; and (3) provide reasonable assurance regarding prevention or timely detection of unauthorized acquisition, use or disposition of the Company's assets that could have a material effect on the financial statements.
Because of its inherent limitations, internal control over financial reporting may not prevent or detect misstatements. Also, projections of any evaluation of effectiveness to future periods are subject to the risk that controls may become inadequate because of changes in conditions, or that the degree of compliance with the policies or procedures may deteriorate.
/s/ RSM US LLP
Hartford, Connecticut
March 11, 2024
120
PART III
ITEM 10. DIRECTORS, EXECUTIVE OFFICERS, AND CORPORATE GOVERNANCE
The information required in response to this Item 10 is incorporated herein by reference to the Company’s Definitive Proxy Statement relating to the 2024 Annual Meeting of Shareholders (the “2024 Proxy Statement”) to be filed with the SEC pursuant to Regulation 14A of the Exchange Act not later than 120 days after the end of the fiscal year covered by this Annual Report and is incorporated herein by reference.
ITEM 11. EXECUTIVE COMPENSATION
The information called for by this item is set forth in our 2024 Proxy Statement, and is incorporated herein by reference.
ITEM 12. SECURITY OWNERSHIP OF CERTAIN BENEFICIAL OWNERS AND MANAGEMENT AND RELATED STOCKHOLDER MATTERS
The information called for by this item is set forth in our 2024 Proxy Statement, and is incorporated herein by reference.
ITEM 13. CERTAIN RELATIONSHIPS AND RELATED TRANSACTIONS, AND DIRECTOR INDEPENDENCE
The information called for by this item is set forth in our 2024 Proxy Statement, and is incorporated herein by reference.
ITEM 14. PRINCIPAL ACCOUNTING FEES AND SERVICES
The information called for by this item is set forth in our 2024 Proxy Statement, and is incorporated herein by reference.
PART IV
ITEM 15. EXHIBITS AND FINANCIAL STATEMENT SCHEDULES
The consolidated financial statements of the Company and report of the Company’s independent registered public accounting firm incorporated herein are included in Item 8 of this Annual Report as follows:
Item |
| Page |
Report of Independent Registered Public Accounting Firm (PCAOB ID: | 52 | |
54 | ||
55 | ||
56 | ||
57 | ||
58 | ||
59 | ||
121
EXHIBIT INDEX
Exhibit No. |
| Description |
3.1 | ||
3.2 | ||
4.1 | ||
4.2 | ||
4.3 | ||
4.4 | ||
4.5 | ||
4.6* | ||
4.7 | ||
10.1† | ||
10.2† | ||
10.3† | ||
10.4†** | ||
10.5† | ||
10.6† | ||
122
10.7† | ||
10.8† | ||
10.9†** | 2024 through 2026 Long Term Executive Incentive Program Guidelines | |
10.10† | ||
10.11† | ||
10.12† | ||
10.13† | ||
10.14† | ||
10.15† | ||
10.16 | ||
Exhibit No. |
| Description |
21.1 | ||
23.1** | Consent of Independent Registered Public Accounting Firm, RSM US LLP | |
31.1** | Certification of Chief Executive Officer under Rule 13a-14(a)/15d-14(a) | |
31.2** | Certification of Chief Financial Officer under Rule 13a-14(a)/15d-14(a) | |
32.1*** | Certification of Chief Executive Officer under 18 U.S.C. Sec. 1350. | |
32.2*** | Certification of Chief Financial Officer under 18 U.S.C. Sec. 1350. | |
97** | Bar Harbor Bankshares Incentive-Based Compensation Recovery Policy | |
101** | The following financial information from the Company’s Annual Report on Form 10-K for the year ended December 31, 2023 is formatted in inline XBRL: (i) Consolidated Condensed Statements of Income, (ii) the Condensed Consolidated Balance Sheets, (iii) the Condensed Consolidated Statements of Changes in Shareholders’ Equity, (iv) Consolidated Statements of Cash Flows and (v) Notes to the Consolidated Condensed Financial Statements |
123
104 | Cover Page Interactive Data File - the cover page XBRL tags are embedded within the Inline XBRL document (included in Exhibit 101) |
* | Certain schedules and similar attachments have been omitted pursuant to Item 601(a)(5) of Regulation S-K. The registrant will furnish a copy of any omitted schedule to the Securities and Exchange Commission upon request. |
† | Indicates management contract or compensatory plan. |
** | Filed herewith. |
*** | Furnished herewith. |
ITEM 16. FORM 10-K SUMMARY
None.
124
SIGNATURES
Pursuant to the requirements of Section 13 or 15(d) of the Securities Exchange Act of 1934, the Registrant has duly caused this report to be signed on its behalf by the undersigned, thereunto duly authorized.
Date: March 11, 2024 | /s/ Curtis C. Simard |
Name: Curtis C. Simard | |
Title: President and Chief Executive Officer |
Pursuant to the requirements of the Securities Exchange Act of 1934, this Report has been signed below on March 14, 2024 by the following persons on behalf of the Registrant and in the capacities indicated.
/s/ David B. Woodside |
| /s/ Curtis C. Simard |
David B. Woodside, Chairman, Board of Directors | Curtis C. Simard, Director | |
President & Chief Executive Officer (Principal Executive Officer) | ||
/s/ Daina H. Belair | /s/ Josephine Iannelli | |
Daina H. Belair, Director | Josephine Iannelli | |
Executive Vice President and Chief Financial Officer (Principal Financial and Principal Accounting Officer) | ||
/s/ Matthew L. Caras | /s/ Debra B. Miller | |
Matthew Caras, Director | Debra B. Miller, Director | |
/s/ David M. Colter | /s/ Brian D. Shaw | |
David M. Colter, Director | Brian D. Shaw, Director | |
/s/ Martha Tod Dudman | /s/ Kenneth E. Smith | |
Martha Tod Dudman, Director | Kenneth E. Smith, Director | |
/s/ Lauri E. Fernald | ||
Lauri E. Fernald, Director |
125