UNITED STATES SECURITIES AND EXCHANGE COMMISSION
Washington, D.C. 20549
__________________________
FORM 10-K
| ANNUAL REPORT PURSUANT TO SECTION 13 OR 15(d) OF THE SECURITIES EXCHANGE ACT OF 1934 | |||||
For the fiscal year ended December 31, 2023
or
| TRANSITION REPORT PURSUANT TO SECTION 13 OR 15(d) OF THE SECURITIES EXCHANGE ACT OF 1934 | |||||
For the transition period from ___ to ___
Commission File Number: 001-37905

(Exact name of registrant as specified in its charter)
| (State or other jurisdiction of incorporation or organization) | (I.R.S. Employer Identification No.) | |||||||||||||
| (Address of principal executive offices) | (Zip Code) | |||||||||||||
(Registrant’s telephone number, including area code)
Securities registered pursuant to Section 12(b) of the Act:
| Title of each class | Trading symbol(s) | Name of each exchange on which registered | ||||||
Securities registered pursuant to Section 12(g) of the Act: None
Indicate by check mark if the registrant is a well-known seasoned issuer, as defined in Rule 405 of the Securities Act. Yes þ No ¨
Indicate by check mark if the registrant is not required to file reports pursuant to Section 13 or 15(d) of the Act. Yes ¨ No þ
Indicate by check mark whether the registrant (1) has filed all reports required to be filed by Section 13 or 15(d) of the Securities Exchange Act of 1934 during the preceding 12 months (or for such shorter period that the registrant was required to file such reports), and (2) has been subject to such filing requirements for the past 90 days. Yes þ No ¨
Indicate by check mark whether the registrant has submitted electronically every Interactive Data File required to be submitted pursuant to Rule 405 of Regulation S-T (§ 232.405 of this chapter) during the preceding 12 months (or for such shorter period that the registrant was required to submit such files). Yes þ No ¨
Indicate by check mark whether the registrant is a large accelerated filer, an accelerated filer, a non-accelerated filer, a smaller reporting company, or an emerging growth company. See the definitions of “large accelerated filer,” “accelerated filer,” “smaller reporting company” and “emerging growth company” in Rule 12b-2 of the Exchange Act.
| þ | Accelerated filer | ¨ | |||||||||||||||
| Non-accelerated filer | ¨ | Smaller reporting company | |||||||||||||||
| Emerging growth company | |||||||||||||||||
If an emerging growth company, indicate by check mark if the registrant has elected not to use the extended transition period for complying with any new or revised financial accounting standards provided pursuant to Section 13(a) of the Exchange Act. ¨
Indicate by check mark whether the registrant has filed a report on and attestation to its management’s assessment of the effectiveness of its internal control over financial reporting under Section 404(b) of the Sarbanes-Oxley Act (15 U.S.C. 7262(b)) by the registered public accounting firm that prepared or issued its audit report. ☑
If securities are registered pursuant to Section 12(b) of the Act, indicate by check mark whether the financial statements of the registrant included in the filing reflect the correction of an error to previously issued financial statements. ☐
Indicate by check mark whether any of those error corrections are restatements that required a recovery analysis of incentive-based compensation received by any of the registrant’s executive officers during the relevant recovery period pursuant to §240.10D-1(b). ☐
Indicate by check mark whether the registrant is a shell company (as defined in Rule 12b-2 of the Exchange Act). Yes ☐ No þ
As of June 30, 2023, the last business day of the registrant’s most recently completed second fiscal quarter, the aggregate market value of the registrant’s common stock held by non-affiliates of the registrant was approximately $3.1 billion.
As of February 16, 2024, 62,882,143 shares of the registrant’s common stock were outstanding.
DOCUMENTS INCORPORATED BY REFERENCE
Portions of the registrant’s proxy statement to be filed with the U.S. Securities and Exchange Commission in connection with the registrant’s 2024 annual meeting of stockholders (the “2024 Proxy Statement”) are incorporated by reference into Part III of this Annual Report on Form 10-K. Such 2024 Proxy Statement will be filed within 120 days of the registrant’s fiscal year ended December 31, 2023.
Table of Contents
| Page | ||||||||||||||
Part I | ||||||||||||||
Item 1. | ||||||||||||||
Item 1A. | ||||||||||||||
Item 1B. | ||||||||||||||
Item 1C. | ||||||||||||||
| Item 2. | ||||||||||||||
Item 3. | ||||||||||||||
Item 4. | ||||||||||||||
| Part II | ||||||||||||||
Item 5. | ||||||||||||||
Item 6. | ||||||||||||||
Item 7. | ||||||||||||||
Item 7A. | ||||||||||||||
Item 8. | ||||||||||||||
Item 9. | ||||||||||||||
Item 9A. | ||||||||||||||
Item 9B. | ||||||||||||||
| Item 9C. | ||||||||||||||
| Part III | ||||||||||||||
Item 10. | ||||||||||||||
Item 11. | ||||||||||||||
Item 12. | ||||||||||||||
Item 13. | ||||||||||||||
Item 14. | ||||||||||||||
| Part IV | ||||||||||||||
Item 15. | ||||||||||||||
| Item 16. | ||||||||||||||
Throughout this Annual Report on Form 10-K, “Brighthouse Financial,” the “Company,” “we,” “our” and “us” refer to Brighthouse Financial, Inc. and its subsidiaries, and “BHF” refers solely to Brighthouse Financial, Inc., the ultimate holding company for all of our subsidiaries, and not to any of its subsidiaries. The term “Separation” refers to the separation of a substantial portion of MetLife, Inc.’s (together with its subsidiaries and affiliates, “MetLife”) former Retail segment, as well as certain portions of its former Corporate Benefit Funding segment, into a separate, publicly-traded company, Brighthouse Financial, which was completed on August 4, 2017. For definitions of selected financial and product terms used herein, refer to “Glossary.”
Note Regarding Forward-Looking Statements and Summary of Risk Factors
This report and other oral or written statements that we make from time to time may contain information that includes or is based upon forward-looking statements within the meaning of the Private Securities Litigation Reform Act of 1995. Such forward-looking statements involve substantial risks and uncertainties. We have tried, wherever possible, to identify such statements using words such as “anticipate,” “estimate,” “expect,” “project,” “may,” “will,” “could,” “intend,” “goal,” “target,” “guidance,” “forecast,” “preliminary,” “objective,” “continue,” “aim,” “plan,” “believe” and other words and terms of similar meaning, or that are tied to future periods, in connection with a discussion of future operating or financial performance. In particular, these include, without limitation, statements relating to future actions, prospective services or products, financial projections, future performance or results of current and anticipated services or products, sales efforts, expenses, the outcome of contingencies such as legal proceedings, as well as trends in operating and financial results. The list below is also a summary of the material risks and uncertainties that could adversely affect our business, financial condition and results of operations. You should read this summary together with the more detailed description of the risks and uncertainties in “Risk Factors.”
Any or all forward-looking statements may turn out to be wrong. They can be affected by inaccurate assumptions or by known or unknown risks and uncertainties. Many such factors will be important in determining the actual future results of Brighthouse Financial. These statements are based on current expectations and the current economic environment and involve a number of risks and uncertainties that are difficult to predict. These statements are not guarantees of future performance. Actual results could differ materially from those expressed or implied in the forward-looking statements due to a variety of known and unknown risks, uncertainties and other factors. Although it is not possible to identify all of these risks and factors, they include, among others:
•differences between actual experience and actuarial assumptions and the effectiveness of our actuarial models;
•higher risk management costs and exposure to increased market risk due to guarantees within certain of our products;
•the effectiveness of our variable annuity exposure risk management strategy and the impacts of such strategy on volatility in our profitability measures and the negative effects on our statutory capital;
•material differences between actual outcomes and the sensitivities calculated under certain scenarios that we may utilize in connection with our variable annuity risk management strategies;
•the impact of interest rates on our future universal life with secondary guarantees (“ULSG”) policyholder obligations and net income volatility;
•the potential material adverse effect of changes in accounting standards, practices or policies applicable to us, including changes in the accounting for long-duration contracts;
•loss of business and other negative impacts resulting from a downgrade or a potential downgrade in our financial strength or credit ratings;
•the availability of reinsurance and the ability of the counterparties to our reinsurance or indemnification arrangements to perform their obligations thereunder;
•heightened competition, including with respect to service, product features, scale, price, actual or perceived financial strength, claims-paying ratings, credit ratings, e-business capabilities and name recognition;
•our ability to market and distribute our products through distribution channels;
•any failure of third parties to provide services we need, any failure of the practices and procedures of such third parties and any inability to obtain information or assistance we need from third parties;
•the ability of our subsidiaries to pay dividends to us, and our ability to pay dividends to our shareholders and repurchase our common stock;
2
•the risks associated with climate change;
•the adverse impact of public health crises, extreme mortality events or similar occurrences on our business and the economy in general;
•the impact of adverse capital and credit market conditions, including with respect to our ability to meet liquidity needs and access capital;
•the impact of economic conditions in the capital markets and the U.S. and global economy, as well as geopolitical events, military actions or catastrophic events, on our profitability measures as well as our investment portfolio, including on realized and unrealized losses and impairments, net investment spread and net investment income;
•the financial risks that our investment portfolio is subject to, including credit risk, interest rate risk, inflation risk, market valuation risk, liquidity risk, real estate risk, derivatives risk, and other factors outside our control;
•the impact of changes in regulation and in supervisory and enforcement policies or interpretations thereof on our insurance business or other operations;
•the potential material negative tax impact of potential future tax legislation that could make some of our products less attractive to consumers or increase our tax liability;
•the effectiveness of our policies, procedures and processes in managing risk;
•the loss or disclosure of confidential information, damage to our reputation and impairment of our ability to conduct business effectively as a result of any failure in cyber- or other information security systems;
•whether all or any portion of the tax consequences of the Separation are not as expected, leading to material additional taxes or material adverse consequences to tax attributes that impact us; and
•other factors described in this report and from time to time in documents that we file with the U.S. Securities and Exchange Commission (“SEC”).
For the reasons described above, we caution you against relying on any forward-looking statements, which should also be read in conjunction with the other cautionary statements included and the risks, uncertainties and other factors identified in this Annual Report on Form 10-K, particularly in the sections entitled “Risk Factors” and “Quantitative and Qualitative Disclosures About Market Risk,” as well as in our other subsequent filings with the SEC. Further, any forward-looking statement speaks only as of the date on which it is made, and we undertake no obligation to update or revise any forward-looking statement to reflect events or circumstances after the date on which the statement is made or to reflect the occurrence of unanticipated events, except as otherwise may be required by law.
Corporate Information
We routinely use our Investor Relations website to provide presentations, press releases, insurance subsidiaries’ statutory filings, and other information that may be deemed important or material to investors. Accordingly, we encourage investors and others interested in the Company to review the information that we share at http://investor.brighthousefinancial.com. In addition, our Investor Relations website allows interested persons to sign up to automatically receive e-mail alerts when we make filings with the SEC. Information contained on or connected to any website referenced in this Annual Report on Form 10-K is not incorporated by reference in this Annual Report on Form 10-K or in any other report or document we file with the SEC, and any website references are intended to be inactive textual references only unless expressly noted.
Note Regarding Reliance on Statements in Our Contracts
See “Exhibit Index — Note Regarding Reliance on Statements in Our Contracts” for information regarding agreements included as exhibits to this Annual Report on Form 10-K.
3
PART I
Item 1. Business
Index to Business
| Page | |||||
4
Our Company
We are one of the largest providers of annuity and life insurance products in the U.S. with over 2.3 million annuity contracts and insurance policies in force at December 31, 2023. We deliver our products through multiple independent distribution channels and marketing arrangements with a diverse network of distribution partners. We primarily transact business through our insurance subsidiaries, Brighthouse Life Insurance Company, Brighthouse Life Insurance Company of NY (“BHNY”) and New England Life Insurance Company (“NELICO”); however, NELICO does not currently write new business.
We believe we are a financially disciplined company with an emphasis on independent distribution and that our strategy of offering a targeted set of products to serve our customers and distribution partners will enhance our ability to invest in our business and distribute cash to our shareholders over time. We also believe that general demographic trends in the U.S. population, the increase in under-insured individuals, the potential risk to governmental social safety net programs and the shifting of responsibility for retirement planning and financial security from employers and other institutions to individuals will create opportunities to generate significant demand for our products.
Risk management of both our in-force book and our new business to enhance sustained, long-term shareholder value is fundamental to our strategy. In writing new business, we assess the value of new products by taking into account the amount and timing of cash flows, the use and cost of capital required to support our financial strength ratings, diversification to our in-force business and the cost of risk mitigation. We remain focused on maintaining our strong capital base and excess liquidity at the holding company, and we have established a risk management approach that seeks to mitigate the effects of severe market disruptions and other economic events on our business. See “Management’s Discussion and Analysis of Financial Condition and Results of Operations — Risk Management Strategies,” “Risk Factors — Risks Related to Our Business — Our variable annuity exposure risk management strategy may not be effective, may result in significant volatility in our profitability measures or may negatively affect our statutory capital” and “— Segments and Corporate & Other — Annuities.”
Segments and Corporate & Other
We are organized into three segments: Annuities; Life; and Run-off. In addition, we report certain of our results of operations in Corporate & Other. In addition to the discussion that follows, refer to “Management’s Discussion and Analysis of Financial Condition and Results of Operations — Results of Operations — Segments and Corporate & Other Results for the Years Ended December 31, 2023 and 2022 - Adjusted Earnings” and Note 3 of the Notes to the Consolidated Financial Statements for additional information regarding each of our segments and Corporate & Other. Substantially all of our premiums, universal life and investment-type product policy fees and other revenues originated in the U.S.
Assets under management (“AUM”) for each of our segments, as well as Corporate & Other, was as follows at:
| December 31, 2023 | December 31, 2022 | |||||||||||||||||||||||||||||||||||||
| General Account Investments | Separate Account Assets | Total | General Account Investments | Separate Account Assets | Total | |||||||||||||||||||||||||||||||||
| (In millions) | ||||||||||||||||||||||||||||||||||||||
| Annuities | $ | 68,489 | $ | 80,169 | $ | 148,658 | $ | 61,279 | $ | 77,798 | $ | 139,077 | ||||||||||||||||||||||||||
| Life | 9,966 | 5,921 | 15,887 | 10,427 | 5,218 | 15,645 | ||||||||||||||||||||||||||||||||
| Run-off | 25,397 | 2,181 | 27,578 | 25,302 | 1,949 | 27,251 | ||||||||||||||||||||||||||||||||
| Corporate & Other | 11,604 | — | 11,604 | 11,584 | — | 11,584 | ||||||||||||||||||||||||||||||||
| Total | $ | 115,456 | $ | 88,271 | $ | 203,727 | $ | 108,592 | $ | 84,965 | $ | 193,557 | ||||||||||||||||||||||||||
Annuities
Our Annuities segment consists of a variety of variable, fixed, index-linked and income annuities designed to address contract holders’ needs for protected wealth accumulation on a tax-deferred basis, wealth transfer and income security. In 2013, we began a shift in our business mix towards fixed products with lower guaranteed minimum crediting rates and variable annuity products with less risky living benefits while simultaneously increasing our emphasis on index-linked annuity products. Since 2014, our new sales have primarily consisted of Shield® Level Annuities (“Shield” and “Shield Annuities”) and variable annuities with simplified living benefits. We have launched new products and refined existing products as we continue to strive to innovate in response to customer and distributor needs and market conditions.
5
Insurance liabilities of our annuity products were as follows at:
| December 31, 2023 | December 31, 2022 | |||||||||||||||||||||||||||||||||||||
| General Account (1) | Separate Account | Total | General Account (1) | Separate Account | Total | |||||||||||||||||||||||||||||||||
| (In millions) | ||||||||||||||||||||||||||||||||||||||
| Variable | $ | 4,307 | $ | 79,990 | $ | 84,297 | $ | 4,907 | $ | 77,653 | $ | 82,560 | ||||||||||||||||||||||||||
| Shield Annuities | 19,794 | — | 19,794 | 25,516 | — | 25,516 | ||||||||||||||||||||||||||||||||
| Fixed deferred | 28,850 | — | 28,850 | 19,177 | — | 19,177 | ||||||||||||||||||||||||||||||||
| Income | 4,279 | 179 | 4,458 | 4,037 | 145 | 4,182 | ||||||||||||||||||||||||||||||||
| Total | $ | 57,230 | $ | 80,169 | $ | 137,399 | $ | 53,637 | $ | 77,798 | $ | 131,435 | ||||||||||||||||||||||||||
_______________
(1)Excludes market risk benefit (“MRB”) liabilities for guaranteed minimum benefits (“GMxB”) and Shield embedded derivatives.
We seek to meet our risk-adjusted return objectives in our Annuities segment through a disciplined risk selection approach and innovative product design, balancing overall profitability with sales growth. We believe we have the underwriting approach, product design capabilities and distribution relationships to permit us to offer new products that meet our risk-adjusted return objectives and that such capabilities will enhance our ability to maintain market presence and relevance over the long-term. We intend to meet our risk management objectives by continuing to hedge significant market risks associated with our existing annuity products, as well as new business. See “Management’s Discussion and Analysis of Financial Condition and Results of Operations — Risk Management Strategies — Variable Annuity Exposure Risk Management.”
Products
Shield Annuities
Our flagship suite of Shield Annuities provides for accumulation of retirement savings or other long-term investments and combines certain features found in both variable and fixed annuities. Shield Annuities are deferred annuity contracts that provide the contract holder with the ability to participate in the appreciation of certain financial markets up to a stated level, while offering protection from a portion of declines. Rather than allocating purchase payments directly into the equity market, the contract holder has an opportunity to participate in the returns of a specified market index. Shield Annuities also offer account value and return of premium death benefits. A recent addition to our suite of Shield Annuities is an individual single premium deferred annuity contract, which provides for the potential accumulation of retirement savings as well as an opportunity for lifetime income through a guaranteed lifetime withdrawal benefit rider. To protect us from premature withdrawals, we impose surrender charges, which are typically applicable during the early years of the annuity contract and decline over time. Surrender charges allow us to recoup amounts we expended to initially market and sell such annuities.
Fixed Deferred Annuities
Fixed deferred annuities are single premium deferred annuity contracts that are designed for growth and to address asset accumulation needs. Purchase payments under fixed deferred annuity contracts are allocated to our general account and interest is credited based on rates we determine for fixed rate annuities or the performance of an index or indices for fixed index annuities (“FIA”), subject to specified guaranteed minimums. Credited interest rates are guaranteed for at least one year. A new addition to our FIA offerings is an individual single premium deferred annuity contract, which provides for the potential accumulation of retirement savings as well as an opportunity for lifetime income through an optional guaranteed lifetime withdrawal benefit rider. To protect us from premature withdrawals, we impose surrender charges, which are typically applicable during the early years of the annuity contract and decline over time.
6
Income Annuities
Income annuities are annuity contracts under which the contract holder contributes a portion of their retirement assets in exchange for a steady stream of retirement income, lasting either for a specified period of time or the life of the annuitant. We offer two types of income annuities: immediate income annuities, referred to as “single premium immediate annuities” (“SPIA”), and deferred income annuities (“DIA”). Both products provide guaranteed lifetime income that can be used to supplement other retirement income sources. SPIAs are single premium annuity products that provide a guaranteed level of income, beginning within 12 months from the contract issuance date, to the contract holder for a specified number of years or the duration of the life of the annuitant(s). DIAs differ from SPIAs in that DIAs require the contract holder to wait at least 15 months before income payments commence. SPIAs and DIAs are priced based on considerations consistent with the annuitant’s age, gender and, in the case of DIAs, the deferral period. DIAs provide a pension-like stream of income payments after a specified deferral period.
Variable Annuities
We issue variable annuity contracts that offer contract holders a tax-deferred basis for wealth accumulation and rights to receive a future stream of payments. The contract holder can choose to invest purchase payments in the separate account or, if available, the general account investment options under the contract. For the separate account options, the contract holder can elect among several subaccounts that invest in internally and externally managed investment portfolios. Unless the contract holder has elected to pay for guaranteed minimum living or death benefits, as discussed below, the contract holder bears the entire risk and receives all of the net returns resulting from the investment option(s) chosen. For the general account options, we credit the contract’s account value with the net purchase payment and credit interest to the contract holder at rates declared periodically, subject to a guaranteed minimum crediting rate. The account value of most types of general account options is guaranteed and is not exposed to market risk, because the issuing insurance company (rather than the contract holder) directly bears the risk that the value of the underlying general account investments of the insurance companies may decline.
The majority of the variable annuities we issue have GMxBs, which we believe make these products attractive to our customers in periods of economic uncertainty. GMxBs provide the contract holder with protection against the possibility that a downturn in the markets will reduce the certain specified benefits that can be claimed under the contract. Variable annuities may have more than one type of GMxB. The primary types of GMxBs are those that guarantee death benefits payable upon the death of a contract holder (guaranteed minimum death benefits, “GMDB”) and those that guarantee benefits payable while the contract holder or annuitant is alive (guaranteed minimum living benefits, “GMLB”). There are three primary types of GMLBs: guaranteed minimum income benefits (“GMIB”), guaranteed minimum withdrawal benefits (“GMWB”) and guaranteed minimum accumulation benefits (“GMAB”).
The guaranteed benefit received by a contract holder pursuant to the GMxBs is calculated based on a notional amount known as the benefit base (“Benefit Base”). The calculation of the Benefit Base varies by benefit type and may differ in value from the contract holder’s account value for the following reasons:
•The Benefit Base is defined to exclude the effect of a decline in the market value of the contract holder’s account value. By excluding market declines, actual claim payments to be made in the future to the contract holder will be determined without giving effect to equity market declines;
•The terms of the Benefit Base may allow it to increase at a guaranteed rate irrespective of the rate of return on the contract holder’s account value; or
•The Benefit Base may also increase with subsequent purchase payments, after the initial purchase payment made by the contract holder at the time of issuance of the contract, or at the contract holder’s election with an increase in the account value due to market performance.
Variable Annuity Fees
We earn various types of fee revenue based on account value, fund assets and the guarantees for contracts that invest through a separate account. We earned fees and charges on our variable annuity contracts that invest through a separate account of $2.6 billion and $2.8 billion, net of pass-through amounts, for the years ended December 31, 2023 and 2022, respectively. In addition to fee revenue, we also earn a spread on the portion of the account value allocated to the general account.
7
Mortality & Expense Fees and Administrative Fees. We earn mortality and expense fees (“M&E Fees”), as well as administrative fees on our variable annuity contracts. M&E Fees are calculated based on the portion of the contract holder’s account value allocated to the separate accounts and are expressed as an annual percentage deducted daily. These fees are used to offset the insurance and operational expenses relating to our variable annuity contracts. Additionally, the administrative fees are charged either based on the daily average of the net asset values in the subaccounts or when contracts fall below minimum values based on a flat annual fee per contract.
Surrender Charges. Most, but not all, variable annuity contracts (depending on their share class) may also impose surrender charges on withdrawals for a period of time after the purchase and in certain products for a period of time after each subsequent deposit, also known as the surrender charge period. A surrender charge is a deduction of a percentage of the contract holder’s account value prior to distribution to him or her. Surrender charges generally decline gradually over the surrender charge period, which can range from zero to 10 years. Our variable annuity contracts typically permit contract holders to withdraw up to 10% of their account value each year without any surrender charge, however, their guarantees may be significantly impacted by such withdrawals. Contracts may also specify circumstances when no surrender charges apply, for example, upon payment of a death benefit.
Investment Management Fees. We charge investment management fees for managing the proprietary funds managed by our subsidiary, Brighthouse Investment Advisers, LLC (“Brighthouse Advisers”), that are offered as investments under our variable annuities. Investment management fees are also paid on the non-proprietary funds managed by investment advisors unaffiliated with us, to the unaffiliated investment advisors. Investment management fees differ by fund. A portion of the investment management fees charged on proprietary funds managed by subadvisors unaffiliated with us are paid by us to such subadvisors. Investment management fees reduce the net returns on the variable annuity investments.
12b-1 Fees and Other Revenue. We earn monthly or quarterly fees for providing certain services to customers and distributors (“12b-1 fees”). 12b-1 fees are paid by the mutual funds selected by our contract holders and are calculated based on the net assets of the funds allocated to our subaccounts. These fees reduce the returns contract holders earn from such funds. Additionally, mutual fund companies with funds which are available to contract holders through the variable annuity subaccounts pay us fees consistent with the terms of administrative service agreements. These fees are funded from the fund companies’ net revenues. See Note 14 of the Notes to the Consolidated Financial Statements for additional information on 12b-1 fees.
Death Benefit Rider Fees. We may earn fees in addition to the base M&E fees for promising to pay GMDBs. The fees earned vary by generation and rider type. For some death benefits, the fees are calculated based on account value, but for enhanced death benefits (“EDB”), the fees are normally calculated based on the Benefit Base. In general, these fees were set at a level intended to be sufficient to cover anticipated expenses related to claim payments and hedge costs associated with these benefits. These fees are deducted from the account value.
Living Benefit Rider Fees. We earn these fees for promising to pay guaranteed benefits while the contract holder is alive, such as for any type of GMLB (including GMIBs, GMWBs and GMABs). The fees earned vary by generation and rider type and are typically calculated based on the Benefit Base. In general, GMLB fees calculated based on the Benefit Base are more stable in market downturns compared to fees based on the account value. These fees are set at a level intended to be sufficient to cover anticipated expenses related to claim payments and hedge costs associated with these benefits. These fees are deducted from the account value.
Pricing and Risk Selection
Product pricing reflects our pricing standards and guidelines. Annuity pricing is based on the expected payout of account value or guarantees, which is calculated using our assumptions for mortality, sales mix, expenses, policyholder behavior and investment returns, as well as certain macroeconomic factors (e.g., inflation, volatility and interest rates). Our product pricing models consider additional factors, such as hedging costs, reinsurance premiums and capital requirements.
Rates for annuity products generally include pricing terms that are guaranteed for a certain period of time. Such products generally include surrender charges for early withdrawals and fees for guaranteed benefits. We periodically reevaluate the costs associated with such guarantees and may adjust pricing levels accordingly. We may also reevaluate the type and level of guarantee features being offered from time to time.
We continually review our pricing guidelines, models and assumptions in light of applicable regulations and experience to ensure that our policies remain competitive and aligned with our marketing strategies and profitability goals.
8
Evolution of our Variable Annuity Business
Our in-force variable annuity block reflects a wide variety of product offerings within each type of guarantee, reflecting the changing nature of these products over the past two decades. The changes in product features and terms over time are driven partially by customer demand and also reflect our continually refined evaluation of the guarantees, their expected long-term claims costs and the most effective market risk management strategies.
We introduced our first variable annuity product over 50 years ago and began offering GMIBs, which were our first living benefit riders, in 2001. Beginning in 2009, we reduced the minimum payments we guaranteed if the contract holder were to annuitize; in 2012 we began to reduce the guaranteed portion of account value up to a percentage of the Benefit Base (“roll-up rates”); and, after first reducing the maximum equity allocation in separate accounts, in 2011 we introduced managed volatility funds for all of our GMIBs. We ceased offering GMABs and GMIBs for new purchases in 2016 and, to the extent permitted, we suspended subsequent premium payments on all but our final generation of GMIBs. While we added GMWBs to our variable annuity product suite in 2003, we shifted our marketing focus from GMIBs to GMWBs in 2015 with the release of FlexChoiceSM, a GMWB with lifetime payments. In 2018, we launched an updated version of FlexChoiceSM, “Flex Choice Access” to provide financial advisors and their clients more investment flexibility.
We introduced Shield Annuities in 2013 and expect to continue to increase sales of Shield Annuities due to growing consumer demand. In addition, we believe Shield Annuities provide us with risk offset to the GMxBs offered in our traditional variable annuity products. At December 31, 2023, we had $28.8 billion of policyholder account balances for Shield Annuities.
We intend to focus on selling the following variable annuity products with the goal of continuing to diversify and better manage our in-force block:
•our suite of Shield Annuities;
•variable annuities with GMWBs; and
•variable annuities with GMDB only.
Deposits for our Shield Annuities and variable annuities were as follows:
| Years Ended December 31, | ||||||||||||||||||||
| 2023 | 2022 | 2021 | ||||||||||||||||||
| (In millions) | ||||||||||||||||||||
| Shield Annuities | $ | 6,857 | $ | 5,848 | $ | 6,201 | ||||||||||||||
| GMWB | 402 | 852 | 1,548 | |||||||||||||||||
| GMDB only | 220 | 286 | 376 | |||||||||||||||||
| GMIB | 24 | 49 | 76 | |||||||||||||||||
| Total | $ | 7,503 | $ | 7,035 | $ | 8,201 | ||||||||||||||
Guaranteed Minimum Death Benefits
Since 2001, we have offered a variety of GMDBs to our contract holders, which include the following:
•Account Value Death Benefit. The Account Value Death Benefit returns the account value at the time of the claim with no imposition of surrender charges.
•Return of Premium Death Benefit. The Return of Premium Death Benefit, also referred to as Principal Protection, pays the greater of (i) the account value at the time of the claim or (ii) the total purchase payments, adjusted proportionately for any withdrawals.
•Annual Step-Up Death Benefit. The Annual Step-Up Death Benefit, an election made for an additional fee, allows the contract holder the option to “step-up” or lock-in the high-water mark on their guaranteed death benefit on any contract anniversary. This benefit pays the greater of (i) the account value at the time of the claim, (ii) the total purchase payments or (iii) the highest anniversary “step-up” value, adjusted proportionately for any withdrawals.
9
•Combination Death Benefit. The Combination Death Benefit, which we no longer offer, consists of the Compounded-Plus Death Benefit and the Enhanced Death Benefit. The Compounded-Plus Death Benefit pays the greater of (i) the account value at the time of the claim, (ii) the highest anniversary “step-up” value or (iii) a roll-up Benefit Base, adjusted proportionately for any withdrawals. The Enhanced Death Benefit pays the greater of (i) the highest anniversary “step-up” value or (ii) a roll-up benefit which allows for dollar-for-dollar withdrawals up to the permitted amount for that contract year and proportional adjustments for withdrawals in excess of the permitted amount.
•Interval Reset Death Benefit. The Interval Reset Death Benefit, which we no longer offer, pays the greater of (i) the account value at the time of the claim, (ii) the total purchase payments or (iii) the interval reset value, a guaranteed death benefit on the interval anniversary date with this level of death benefit being reset (either up or down) on the next interval anniversary date, adjusted proportionately for any withdrawals.
In addition, we currently also offer an optional death benefit for an additional fee with our FlexChoiceSM riders, available at issue through age 65, which has a similar level of death benefit protection as the Benefit Base for the living benefit rider. However, the Benefit Base for this death benefit is adjusted for all withdrawals.
Our variable annuity account values and Benefit Base by type of GMDB were as follows at:
December 31, 2023 (1) | December 31, 2022 (1) | |||||||||||||||||||||||||
| Account Value | Benefit Base | Account Value | Benefit Base | |||||||||||||||||||||||
| (In millions) | ||||||||||||||||||||||||||
| Account value | $ | 3,039 | $ | 2,483 | $ | 2,907 | $ | 2,431 | ||||||||||||||||||
| Return of premium | 37,826 | 38,194 | 37,171 | 37,921 | ||||||||||||||||||||||
| Annual step-up | 17,269 | 18,485 | 16,737 | 20,020 | ||||||||||||||||||||||
| Combination (2) | 20,847 | 32,084 | 20,806 | 32,695 | ||||||||||||||||||||||
| Interval reset | 5,316 | 5,562 | 4,940 | 5,327 | ||||||||||||||||||||||
| Total | $ | 84,297 | $ | 96,808 | $ | 82,561 | $ | 98,394 | ||||||||||||||||||
_______________
(1)Many of our annuity contracts offer more than one type of guarantee and therefore certain death benefit guarantee amounts included in this table may also be included in the GMLBs table below.
(2)Includes Compounded-Plus Death Benefit, Enhanced Death Benefit, and FlexChoiceSM death benefit.
Guaranteed Minimum Living Benefits
Our in-force block of variable annuities consists of three varieties of GMLBs, including variable annuities with GMIBs, GMWBs and GMABs. Based on total account value, approximately 76% and 77% of our variable annuity block included living benefit guarantees at December 31, 2023 and 2022, respectively.
GMIBs. GMIBs are our largest block of living benefit guarantees based on in-force account value. Contract holders must wait for a defined period, usually 10 years, before they can elect to receive income through guaranteed annuity payments.
Contract holder behavior around choosing a particular option cannot be predicted with certainty at the time of contract issuance or thereafter. The incidence and timing of benefit elections and the resulting benefit payments may differ materially from those we anticipated at the time we issued a variable annuity contract with a GMIB. As we observe actual contract holder behavior, we periodically update our assumptions with respect to contract holder behavior and take appropriate action with respect to the amount of the reserves we establish for the future payment of such benefits. See “Risk Factors — Risks Related to Our Business — Guarantees within certain of our annuity products may decrease our earnings, decrease our capitalization, increase the volatility of our results, result in higher risk management costs and expose us to increased market risk” and “Management’s Discussion and Analysis of Financial Condition and Results of Operations — Summary of Critical Accounting Estimates.”
We employed several risk exposure reduction strategies at the product level. These include reducing the interest rates used to determine annuity payout rates on GMIBs from 2.5% to 0.5% over time. In addition, we increased the setback period used to determine the annuity payout rates for contract holders from seven years to 10 years. We also reduced the guaranteed roll-up rates from 6% to 4%.
10
Additionally, we introduced limitations on fund selections inside certain legacy variable annuity contracts. In 2005, we reduced the maximum equity allocation in the separate accounts. Further, in 2011 we introduced managed volatility funds to our fund offerings in conjunction with the introduction of our last generation GMIB product “Max.” Approximately 29% and 30% of GMIB total account value at December 31, 2023 and 2022, respectively, was invested in managed volatility funds. The managers of these funds seek to reduce the risk of large, sudden declines in account value during market downturns by managing the volatility or draw-down risk of the underlying fund holdings by rebalancing the fund holdings within certain guidelines or overlaying hedging strategies at the fund level. We believe that these risk mitigation actions at the fund level reduce the amount of hedging or reinsurance we require to manage our risks arising from guarantees we provide on the underlying variable annuity separate accounts.
GMWBs. GMWBs have a Benefit Base that contract holders may roll up for up to 10 years. If contract holders take withdrawals early, the roll-up may be less than 10 years. This is in contrast to GMIBs, in which roll-ups may continue beyond 10 years. Therefore, the roll-up period for the Benefit Base on GMWBs is typically less uncertain and is shorter than those on GMIBs. Additionally, the contract holder may receive income only through withdrawal of their Benefit Base. These withdrawal percentages are defined in the contract and differ by the age when contract holders start to take withdrawals. Withdrawal rates may differ if they are offered on a single contract holder or a couple (joint life). GMWBs primarily come in two versions depending on if they are period certain or if they are lifetime payments.
GMABs. GMABs guarantee a minimum amount of account value to the contract holder after a set period of time, which can also include locking in capital markets gains. This protects the value of the annuity from market fluctuations.
Our variable annuity account value and Benefit Base by type of GMLB were as follows at:
December 31, 2023 (1) | December 31, 2022 (1) | |||||||||||||||||||||||||
| Account Value (2) | Benefit Base | Account Value (2) | Benefit Base | |||||||||||||||||||||||
| (In millions) | ||||||||||||||||||||||||||
| GMIB | $ | 44,028 | $ | 67,086 | $ | 43,873 | $ | 69,100 | ||||||||||||||||||
| GMWB | 19,961 | 21,241 | 19,270 | 22,602 | ||||||||||||||||||||||
| GMAB | 431 | 343 | 492 | 435 | ||||||||||||||||||||||
| Total | $ | 64,420 | $ | 88,670 | $ | 63,635 | $ | 92,137 | ||||||||||||||||||
_______________
(1)Many of our annuity contracts offer more than one type of guarantee and therefore certain living benefit guarantee amounts included in this table may also be included in the GMDBs table above.
(2)Total account value includes investments in the general account totaling $4.3 billion and $4.9 billion at December 31, 2023 and 2022, respectively.
Net Amount at Risk
The net amount at risk (“NAR”) for the GMIB is the amount (if any) that would be required to be added to the total account value to purchase a lifetime income stream, based on current annuity rates, equal to the minimum amount provided under the guaranteed benefit. This amount represents our potential economic exposure to such guarantees in the event all contract holders were to annuitize on the balance sheet date, even though the guaranteed amount under the contract may not be annuitized until after the waiting period of the contract.
The NAR for the GMWB is the amount of guaranteed benefits in excess of the account values (if any) as of the balance sheet date and assumes utilization of benefits by all contract holders as of the balance sheet date. Only a small portion of the Benefit Base is available for withdrawal on an annual basis.
The NAR for the GMAB is the amount of guaranteed benefits in excess of the account values (if any) as of the balance sheet date and assumes utilization of benefits by all contract holders as of the balance sheet. The NAR for the GMAB is not available until the GMAB maturity date.
The NAR for the GMDB is the amount of death benefit in excess of the account value (if any) as of the balance sheet date. It represents the amount of the claim we would incur if death claims were made on all contracts on the balance sheet date and includes any additional contractual claims associated with riders purchased to assist with covering income taxes payable upon death.
11
Our variable annuity account value and NAR by type of GMxB were as follows at:
| December 31, 2023 | December 31, 2022 | |||||||||||||||||||||||||||||||||||||||||||||||||
| Account Value | Death Benefit NAR (1) | Living Benefit NAR (1) | % of Account Value In-the-Money (2) | Account Value | Death Benefit NAR (1) | Living Benefit NAR (1) | % of Account Value In-the-Money (2) | |||||||||||||||||||||||||||||||||||||||||||
| (Dollars in millions) | ||||||||||||||||||||||||||||||||||||||||||||||||||
| GMIB | $ | 32,079 | $ | 4,089 | $ | 3,600 | 30.3 | % | $ | 31,541 | $ | 5,517 | $ | 4,484 | 42.9 | % | ||||||||||||||||||||||||||||||||||
| GMIB Max with EDB | 7,605 | 6,092 | 470 | 31.9 | % | 7,868 | 6,013 | 415 | 34.8 | % | ||||||||||||||||||||||||||||||||||||||||
| GMIB Max without EDB | 4,344 | 133 | 107 | 17.8 | % | 4,464 | 196 | 92 | 18.7 | % | ||||||||||||||||||||||||||||||||||||||||
| GMWB | 19,961 | 541 | 249 | 10.2 | % | 19,270 | 1,584 | 662 | 26.5 | % | ||||||||||||||||||||||||||||||||||||||||
| GMAB | 431 | 4 | 4 | 17.9 | % | 492 | 18 | 18 | 25.4 | % | ||||||||||||||||||||||||||||||||||||||||
| GMDB only (other than EDB) | 16,768 | 1,056 | — | N/A | 15,917 | 1,737 | — | N/A | ||||||||||||||||||||||||||||||||||||||||||
| EDB only | 3,109 | 1,325 | — | N/A | 3,009 | 1,439 | — | N/A | ||||||||||||||||||||||||||||||||||||||||||
| Total | $ | 84,297 | $ | 13,240 | $ | 4,430 | $ | 82,561 | $ | 16,504 | $ | 5,671 | ||||||||||||||||||||||||||||||||||||||
_______________
(1)The “Death Benefit NAR” and “Living Benefit NAR” are not additive at the contract level.
(2)In-the-money is defined as any contract with a living benefit NAR in excess of zero.
Reserves
Under accounting principles generally accepted in the United States of America (“GAAP”), variable annuity guarantees are classified as MRBs, measured at estimated fair value, and are reported in market risk benefit assets and liabilities on the consolidated balance sheets, with changes reported in change in market risk benefits on the consolidated statements of operations, except for changes related to nonperformance risk, which are reported in other comprehensive income on the consolidated statements of comprehensive income (loss). Additionally, the index protection and accumulation features of Shield Annuities are accounted for as embedded derivatives (“Shield liabilities”), measured at estimated fair value, and are reported in policyholder account balances on the consolidated balance sheets, with changes reported in net derivative gains (losses) on the consolidated statements of operations. These liabilities were valued at $7.7 billion at December 31, 2023.
Our variable annuity MRBs by type of GMxB were as follows at:
| December 31, | ||||||||||||||
| 2023 | 2022 | |||||||||||||
| (In millions) | ||||||||||||||
| GMIB | $ | 9,485 | $ | 9,457 | ||||||||||
| GMWB | 41 | 209 | ||||||||||||
| GMDB | 788 | 720 | ||||||||||||
| Total | $ | 10,314 | $ | 10,386 | ||||||||||
The estimated fair value of these guarantees can change significantly due to changes in equity market performance, equity market volatility or interest rates. Fair values are also affected by our assumptions around mortality, separate account returns and policyholder behavior, including lapse, annuitization and withdrawal rates. See “Risk Factors — Risks Related to Our Business — Guarantees within certain of our annuity products may decrease our earnings, decrease our capitalization, increase the volatility of our results, result in higher risk management costs and expose us to increased market risk.”
12
Life
Our Life segment consists of insurance products, including term, universal, whole and variable life products designed to address policyholders’ needs for financial security and protected wealth transfer, which may be on a tax-advantaged basis. While our in-force book reflects a broad range of life products, we are currently focused on term life products and universal life products with index-linked benefits, consistent with our financial objectives, with a concentration on design and profitability over volume. By managing our in-force book of business, we expect to generate future revenue and profits from premiums, investment margins, expense margins, mortality margins, morbidity margins and surrender fees. We aim to maximize our profits by focusing on efficiency in order to continue to reduce the cost basis and underwriting expenses. Our life insurance in-force book provides natural diversification to our Annuities segment.
Insurance liabilities of our life insurance products were as follows at:
| December 31, 2023 | December 31, 2022 | |||||||||||||||||||||||||||||||||||||
| General Account | Separate Account | Total | General Account | Separate Account | Total | |||||||||||||||||||||||||||||||||
| (In millions) | ||||||||||||||||||||||||||||||||||||||
| Term | $ | 2,473 | $ | — | $ | 2,473 | $ | 2,348 | $ | — | $ | 2,348 | ||||||||||||||||||||||||||
| Whole | 3,312 | — | 3,312 | 3,163 | — | 3,163 | ||||||||||||||||||||||||||||||||
| Universal | 1,969 | — | 1,969 | 2,048 | — | 2,048 | ||||||||||||||||||||||||||||||||
| Variable | 1,143 | 5,921 | 7,064 | 1,163 | 5,218 | 6,381 | ||||||||||||||||||||||||||||||||
| Total | $ | 8,897 | $ | 5,921 | $ | 14,818 | $ | 8,722 | $ | 5,218 | $ | 13,940 | ||||||||||||||||||||||||||
The in-force face amount and direct premiums received for our life insurance products were as follows:
| In-Force Face Amount | Premiums | |||||||||||||||||||||||||||||||
| December 31, | Years Ended December 31, | |||||||||||||||||||||||||||||||
| 2023 | 2022 | 2023 | 2022 | 2021 | ||||||||||||||||||||||||||||
| (In millions) | ||||||||||||||||||||||||||||||||
| Term | $ | 351,824 | $ | 360,611 | $ | 531 | $ | 535 | $ | 577 | ||||||||||||||||||||||
| Whole | $ | 17,561 | $ | 18,264 | $ | 388 | $ | 408 | $ | 418 | ||||||||||||||||||||||
| Universal | $ | 10,171 | $ | 10,894 | $ | 105 | $ | 113 | $ | 176 | ||||||||||||||||||||||
| Variable | $ | 33,916 | $ | 35,106 | $ | 161 | $ | 175 | $ | 187 | ||||||||||||||||||||||
Products
Term Life
Term life products are designed to provide a fixed death benefit in exchange for a guaranteed level premium to be paid over a specified period of time. In 2019, we suspended sales of our 10- to 30-year level premium term products and, in 2020, we launched a new term product with 10-, 20- or 30-year level premium term options. We also offer a one-year term option. Our term life products do not include any cash value, accumulation or investment components. As a result, they are our most basic life insurance product offering and generally have lower premiums than other forms of life insurance. Term life products may allow the policyholder to continue coverage beyond the guaranteed level premium period, generally at an elevated cost. Some of our term life policies allow the policyholder to convert the policy during the conversion period to a permanent policy. Such conversion does not require additional medical or financial underwriting. Term life products allow us to spread expenses over a large number of policies while gaining mortality insights that come from high policy volumes.
Universal Life
We have a significant in-force book of universal life policies and currently offer two universal life products with index-linked benefits. Universal life products typically provide a death benefit in return for payment of specified annual policy charges that are generally related to specific costs, which may change over time. To the extent that the policyholder chooses to pay more than the charges required in any given year to keep the policy in-force, the excess premium will be added to the cash value of the policy and credited with a stated interest rate. This structure gives policyholders flexibility in the amount and timing of premium payments, subject to tax guidelines. Consequently, universal life policies can be used in a variety of different ways. Brighthouse SmartCare®, our index-linked universal life product launched in 2019, which we market as a hybrid life insurance and long-term care policy, allows policyholders to
13
pay for qualified long-term care expenses by accelerating a significant portion of the face amount of the policy over a period of time. After that period of time, the policyholder may continue to receive benefits up to their maximum monthly amount for up to four additional years. Brighthouse SmartGuard Plus®, our index-linked universal life product launched in 2023, offers a guaranteed distribution rider that ensures a minimum amount of distribution payments will always be payable, regardless of policy performance, through policy loans. With positive policy performance, the amount of guaranteed distribution payments available may increase over time.
Whole Life
We currently offer a non-participating conversion whole life product that is available for term and group conversions and to satisfy other contractual obligations. We have a significant in-force book of both participating and non-participating whole life policies. Whole life products provide a guaranteed death benefit in exchange for a guaranteed level premium for a specified period of time in order to maintain coverage for the life of the insured. Whole life products also have guaranteed minimum cash surrender values. Our in-force whole life products provide for participation in the returns generated by the business, delivered to the policyholder in the form of non-guaranteed dividend payments. The policyholder can elect to receive the dividends in cash or to use them to increase the paid-up policy death benefit or pay the required premium. They can also be used for other purposes, including payment of loans and loan interest. The versatility of whole life allows it to be used for a variety of purposes beyond just the primary purpose of death benefit protection. With our in-force policies, the policyholder can withdraw or borrow against the policy (sometimes on a tax favored basis).
Variable Life
We have a significant in-force book of variable life policies, but do not currently offer variable life policies. We may choose to issue additional variable life products in the future. Variable life products operate similarly to universal life products, with the additional feature that the excess amount paid over policy charges can be directed by the policyholder into a variety of separate account investment options. In certain separate account investment options, the policyholder bears the entire risk of the investment results. We collect specified fees for the management of the investment options in addition to the base policy charges. In some instances, these investment options are managed by third-party asset management firms. The policyholder’s cash value reflects the investment return of the selected investment options, net of management fees and insurance-related charges. With some products, by maintaining a certain premium level, policyholders may also have the advantage of various guarantees designed to protect the death benefit from adverse investment experience.
Pricing and Underwriting
Pricing
Life insurance pricing at issuance is based on the expected payout of benefits calculated using our assumptions for mortality, morbidity, premium payment patterns, sales mix, expenses, persistency and investment returns, as well as certain macroeconomic factors, such as inflation. Our product pricing models consider additional factors, such as hedging costs, reinsurance programs, and capital requirements. Our product pricing reflects our pricing standards and guidelines. We continually review our pricing guidelines in light of applicable regulations and to ensure that our policies remain competitive and aligned with our marketing strategies and profitability goals.
We have established important controls around management of underwriting and pricing processes, including regular experience studies to monitor assumptions against expectations, formal new product approval processes, periodic updates to product profitability studies and the use of reinsurance to manage our exposures, as appropriate.
Underwriting
Underwriting generally involves an evaluation of applications by a professional staff of underwriters and actuaries who determine the type and the amount of insurance risk that we are willing to accept. We employ detailed underwriting policies, guidelines and procedures designed to assist the underwriters to properly assess and quantify such risks before issuing policies to qualified applicants or groups.
Insurance underwriting may consider not only an insured’s medical history, but also other factors such as the insured’s foreign travel, vocation, alcohol, drug and tobacco use, and the policyholder’s financial profile. We generally perform our own underwriting; however, certain policies are reviewed by intermediaries under guidelines established by us. Requests for coverage are reviewed on their merits and a policy is not issued unless the particular risk has been examined and approved in accordance with our underwriting guidelines.
14
The underwriting conducted by our corporate underwriting office and intermediaries is subject to periodic quality assurance reviews to maintain high standards of underwriting and consistency. The office is also subject to periodic external audits by reinsurers with whom we do business.
We have established oversight of the underwriting process that facilitates quality sales and serves the needs of our customers, while supporting our financial strength and business objectives. Our goal is to achieve the underwriting, mortality and morbidity levels reflected in the assumptions in our product pricing. This is accomplished by determining and establishing underwriting policies, guidelines, philosophies and strategies that are competitive and suitable for the customer, the agent and us.
We continually review our underwriting guidelines (i) in light of applicable regulations and (ii) to ensure that our practices remain competitive and aligned with our marketing strategies, emerging industry trends and profitability goals.
Run-off
Our Run-off segment consists of products that are no longer actively sold and are separately managed, including ULSG, structured settlements, pension risk transfer contracts, certain company-owned life insurance policies and certain funding agreements.
Insurance liabilities of our annuity contracts and life insurance policies reported in our Run-off segment were as follows at:
| December 31, 2023 | December 31, 2022 | |||||||||||||||||||||||||||||||||||||
| General Account | Separate Account | Total | General Account | Separate Account | Total | |||||||||||||||||||||||||||||||||
| (In millions) | ||||||||||||||||||||||||||||||||||||||
| ULSG | $ | 17,487 | $ | — | $ | 17,487 | $ | 16,999 | $ | — | $ | 16,999 | ||||||||||||||||||||||||||
| Structured settlements | 4,997 | — | 4,997 | 4,933 | — | 4,933 | ||||||||||||||||||||||||||||||||
| Pension risk transfer | 2,423 | — | 2,423 | 2,510 | — | 2,510 | ||||||||||||||||||||||||||||||||
| Other | 1,191 | 2,181 | 3,372 | 1,179 | 1,949 | 3,128 | ||||||||||||||||||||||||||||||||
| Total | $ | 26,098 | $ | 2,181 | $ | 28,279 | $ | 25,621 | $ | 1,949 | $ | 27,570 | ||||||||||||||||||||||||||
Corporate & Other
Corporate & Other contains the excess capital not allocated to the segments, interest expense related to our outstanding debt, and preferred stock dividends, as well as expenses associated with certain legal proceedings and income tax audit issues. Corporate & Other also includes long-term care business reinsured through 100% quota share reinsurance agreements and activities related to funding agreements associated with our institutional spread margin business.
Reinsurance Activity
Unaffiliated Third-Party Reinsurance
In connection with our risk management efforts and in order to provide opportunities for growth and capital management, we enter into reinsurance arrangements pursuant to which we cede certain insurance risks to unaffiliated third-party reinsurers. We cede risks to third parties in order to limit losses, minimize exposure to significant risks and provide capacity for future growth. We enter into various agreements with reinsurers that cover groups of risks, as well as individual risks. Our ceded reinsurance to third parties is primarily structured on a treaty basis as coinsurance, yearly renewable term, excess or catastrophe excess of retention insurance. These reinsurance arrangements are an important part of our risk management strategy because they permit us to spread risk and minimize the effect of losses. The extent of each risk retained by us depends on our evaluation of the specific risk, subject, in certain circumstances, to maximum retention limits based on the characteristics and relative cost of reinsurance. We also cede first dollar mortality risk under certain contracts. In addition to reinsuring mortality risk, we cede other risks, as well as specific coverages.
Under the terms of the reinsurance agreements, the reinsurer agrees to reimburse us for the ceded amount in the event that we pay a claim. Cessions under reinsurance agreements do not discharge our obligations as the primary insurer. In the event the reinsurers do not meet their obligations under the terms of the reinsurance agreements, reinsurance recoverable balances could become uncollectible. See “Risk Factors — Risks Related to Our Business — If the counterparties to our reinsurance or indemnification arrangements or to the derivatives we use to hedge our business risks default or fail to perform, we may be exposed to risks we had sought to mitigate, which could materially adversely affect our financial condition and results of operations.”
15
We have historically reinsured the mortality risk on our life insurance policies primarily on an excess of retention basis or on a quota share basis. When we cede risks to a reinsurer on an excess of retention basis we retain the liability up to a contractually specified amount and the reinsurer is responsible for indemnifying us for amounts in excess of the liability we retain, which may be subject to a cap. When we cede risks on a quota share basis, we share a portion of the risk within a contractually specified layer of reinsurance coverage. We reinsure on a facultative basis for risks with specified characteristics. On a case-by-case basis, we may retain up to $20 million per life and reinsure 100% of the risk in excess of the amount we retain. We also reinsure portions of the risk associated with certain whole life policies to a former affiliate, and we assume certain term life policies and universal life policies with secondary death benefit guarantees issued by a former affiliate. We routinely evaluate our reinsurance program and may increase or decrease our retention at any time.
Our reinsurance is diversified with a group of primarily highly rated reinsurers. We analyze recent trends in arbitration and litigation outcomes in disputes, if any, with our reinsurers and monitor ratings and the financial strength of our reinsurers. In addition, the reinsurance recoverable balance due from each reinsurer and the recoverability of such balance is evaluated as part of this overall monitoring process. We generally secure large reinsurance recoverable balances with various forms of collateral, including secured trusts, funds withheld accounts and irrevocable letters of credit.
We reinsure, through 100% quota share reinsurance agreements, certain run-off long-term care and workers’ compensation business that we originally wrote. For products in our Run-off segment other than ULSG, we have periodically engaged in reinsurance activities on an opportunistic basis.
Our ordinary course net reinsurance recoverables from unaffiliated third-party reinsurers at December 31, 2023 were as follows:
| Reinsurance Recoverables | A.M. Best Financial Strength Rating (1) | |||||||||||||
| (In millions) | ||||||||||||||
| MetLife, Inc. | $ | 3,427 | A+ | |||||||||||
| Munich American Reassurance Company | 496 | A+ | ||||||||||||
| The Travelers Indemnity Company (2) | 470 | A++ | ||||||||||||
| RGA Reinsurance Company | 450 | A+ | ||||||||||||
| Swiss Re Life & Health America Inc. | 394 | A+ | ||||||||||||
| SCOR | 355 | A+ | ||||||||||||
| Aegon NV | 126 | A | ||||||||||||
| General Re Life Corporation | 99 | NR | ||||||||||||
| Other | 336 | |||||||||||||
| Allowance for credit losses | (3) | |||||||||||||
| Total | $ | 6,150 | ||||||||||||
_______________
(1)These financial strength ratings are the most currently available for our reinsurance counterparties and reflect the ratings of the ultimate parent companies of such counterparties, as there may be numerous subsidiary counterparties to each listed parent.
(2)Relates to a block of workers’ compensation insurance policies reinsured in connection with a former affiliate’s acquisition of The Travelers Indemnity Company (“Travelers”) from Citigroup, Inc. (“Citigroup”).
NR = Not rated
In addition, a block of long-term care insurance business with reserves of $5.8 billion at December 31, 2023 is reinsured to Genworth Life Insurance Company and Genworth Life Insurance Company of New York (collectively, the “Genworth reinsurers”) who further retroceded this business to Union Fidelity Life Insurance Company (“UFLIC”), an indirect subsidiary of General Electric Company (“GE”). We acquired this block of long-term care insurance business in 2005 when our former parent acquired Travelers from Citigroup. Prior to the acquisition, Travelers agreed to reinsure a 90% quota share of its long-term care business to certain affiliates of GE, which following a spin-off became part of Genworth, and subsequently agreed to reinsure the remaining 10% quota share of such long-term care insurance business. The Genworth reinsurers established trust accounts for our benefit to secure their obligations under such arrangements requiring that they maintain qualifying collateral with an aggregate fair market value equal to at least 102% of the statutory reserves attributable to the long-term care business. Additionally, Citigroup agreed to indemnify us for losses and certain other payment obligations we might incur with respect to this block of reinsured long-term care insurance business. The most currently
16
available financial strength rating for each of the Genworth reinsurers is C++ from A.M. Best, and Citigroup’s credit ratings are A3 from Moody’s and BBB+ from S&P. In February 2021, we received a demand for arbitration from the Genworth reinsurers seeking authorization to withdraw certain amounts from the trust accounts. In March 2023, the arbitration panel ruled that the trusts were funded in excess of the amount required and that such excess amounts were to be released from the trusts. We have complied with the arbitration panel’s ruling.
See “Risk Factors — Risks Related to Our Business — If the counterparties to our reinsurance or indemnification arrangements or to the derivatives we use to hedge our business risks default or fail to perform, we may be exposed to risks we had sought to mitigate, which could materially adversely affect our financial condition and results of operations.” Further, as disclosed in Genworth’s filings with the SEC, UFLIC has established trust accounts for the Genworth reinsurers’ benefit to secure UFLIC’s obligations under its arrangements with them concerning this block of long-term care insurance business, and GE has also agreed, under a capital maintenance agreement, to keep sufficient capital in UFLIC to maintain UFLIC’s risk-based capital (“RBC”) above a specified minimum level.
Affiliated Reinsurance
Affiliated reinsurance companies are affiliated insurance companies licensed under specific provisions of insurance law of their respective jurisdictions, such as the Special Purpose Financial Captive law adopted by several states, including Delaware.
Brighthouse Reinsurance Company of Delaware (“BRCD”), our reinsurance subsidiary, was formed to manage our capital and risk exposures and to support our term life insurance and ULSG businesses through the use of affiliated reinsurance arrangements and related reinsurance financing. BRCD is capitalized with cash and invested assets, including funds withheld, at a level we believe to be sufficient to satisfy its future cash obligations under a variety of scenarios, including a permanent level yield curve and interest rates at lower levels, consistent with National Association of Insurance Commissioners (“NAIC”) cash flow testing scenarios. BRCD utilizes reinsurance financing to cover the difference between the sum of the fully required statutory assets (i.e., NAIC Valuation of Life Insurance Policies Model Regulation (“Regulation XXX”) and NAIC Actuarial Guideline 38 (“Guideline AXXX”) reserves) and the target margins less cash, invested assets and funds withheld, on BRCD’s statutory statements. BRCD’s admitted deferred tax asset could also serve to reduce the amount of funding required on a statutory basis under BRCD’s reinsurance financing. See Notes 12 and 13 of the Notes to the Consolidated Financial Statements for additional information regarding BRCD’s reinsurance financing.
BRCD provides certain benefits to Brighthouse Financial, including (i) enhancing our ability to hedge the interest rate risk of our reinsurance liabilities, (ii) allowing increased allocation flexibility in managing our investment portfolio and (iii) improving operating flexibility and administrative cost efficiency, however there can be no assurance that such benefits will continue to materialize. See “Risk Factors — Risks Related to Our Business — We may not be able to take credit for reinsurance, our statutory life insurance reinsurance financings may be subject to cost increases and new financings may be subject to limited market capacity” and “— Regulation — Insurance Regulation.”
Catastrophe Coverage
We have exposure to catastrophes which could contribute to significant fluctuations in our results of operations. We use excess of retention and quota share reinsurance agreements to provide greater diversification of risk and minimize exposure to larger risks. See “Risk Factors — Risks Related to Our Business — Public health crises, extreme mortality events or similar occurrences may adversely impact our business, financial condition, or results of operations, as well as the economy in general.”
Sales Distribution
We distribute our annuity and life insurance products through multiple independent distribution channels and marketing arrangements with a geographically diverse network of over 400 distribution partners. We have successfully built independent distribution relationships since 2001.
Our annuity products are distributed through national and regional broker-dealers, banks, independent financial planners, independent marketing organizations and other financial institutions and financial planners. Our life insurance products are distributed through national and regional broker-dealers, general agencies, financial advisors, brokerage general agencies, banks, financial intermediaries and online marketplaces. We believe this strategy permits us to maximize penetration of our target markets and distribution partners without incurring the fixed costs of maintaining a proprietary distribution channel and will facilitate our ability to quickly comply with evolving regulatory requirements applicable to the sale of our products.
In furtherance of our strategy, we provide certain key distributors with focused product, sales and technology support through our strategic relationship managers (“SRM”) and internal and external wholesalers.
17
Strategic Relationship Managers
Our SRMs serve as the principal contact for our largest annuity and life insurance distributors and coordinate the relationship between Brighthouse Financial and the distributor. SRMs provide an enhanced level of service to partners that require more resources to support their larger distribution network. SRMs are responsible for tracking and providing certain key distributors with sales and activity data. They participate in business planning sessions with our distributors and are critical to providing us with insights into the product design, education and other support requirements of our principal distributors. They are also responsible for proactively addressing relationship issues with our distributors.
Wholesalers
Our wholesalers are licensed sales representatives responsible for providing our distributors with product support and facilitating business between our distributors and the clients they serve. Our wholesalers are organized into internal wholesalers and external wholesalers. Our internal wholesalers support our distributors by providing telephonic and online sales support functions. Our field sales representatives, whom we refer to as external wholesalers, are responsible for providing on-site face-to-face product and sales support to our distributors. The external wholesalers generally have responsibility for a specific geographic region.
Principal Distribution Channels and Related Data
The relative percentage of our annuity sales by our principal distribution channels were as follows:
| Year Ended December 31, 2023 | ||||||||||||||||||||||||||||||||
| Distribution Channel | Variable | Fixed | Shield Annuities | Fixed Index Annuity | Total | |||||||||||||||||||||||||||
| Independent financial planners | 6 | % | 6 | % | 38 | % | 2 | % | 52 | % | ||||||||||||||||||||||
| Banks/financial institutions | — | % | 10 | % | 17 | % | — | % | 27 | % | ||||||||||||||||||||||
| Regional broker-dealers | — | % | 6 | % | 4 | % | — | % | 10 | % | ||||||||||||||||||||||
| National broker-dealers | — | % | 4 | % | 2 | % | — | % | 6 | % | ||||||||||||||||||||||
| Other | — | % | — | % | 4 | % | 1 | % | 5 | % | ||||||||||||||||||||||
Our top five distributors of annuity products produced 15%, 10%, 8%, 6% and 6% of our deposits of annuity products for the year ended December 31, 2023.
The relative percentage of our life insurance sales by our principal distribution channels were as follows:
| Distribution Channel | Year Ended December 31, 2023 | |||||||
| Financial intermediaries | 83 | % | ||||||
| Brokerage general agencies | 17 | % | ||||||
Our top five distributors of life insurance policies produced 26%, 21%, 17%, 12% and 11% of our life insurance sales for the year ended December 31, 2023.
18
Regulation
Index to Regulation
| Page | |||||
19
Overview
Our insurance subsidiaries and BRCD are primarily regulated at the state level, with some products and services also subject to federal regulation. In addition, BHF and its insurance subsidiaries are subject to regulation under the insurance holding company laws of various U.S. jurisdictions. Furthermore, some of our operations, products and services are subject to the Employee Retirement Income Security Act of 1974, as amended (“ERISA”), consumer protection laws, securities, broker-dealer and investment advisor regulations, and environmental and unclaimed property laws and regulations. See “Risk Factors — Regulatory and Legal Risks.”
Insurance Regulation
State insurance regulation generally aims at supervising and regulating insurers, with the goal of protecting policyholders and ensuring that insurance companies remain solvent. Insurance regulators have increasingly sought information about the potential impact of activities in holding company systems as a whole and have adopted laws and regulations enhancing “group-wide” supervision. See “— Holding Company Regulation” for information regarding an enterprise risk report.
Each of our insurance subsidiaries is licensed and regulated in each U.S. jurisdiction where it conducts insurance business. Brighthouse Life Insurance Company is licensed to issue insurance products in all U.S. states (except New York), the District of Columbia, the Bahamas, Guam, Puerto Rico, the British Virgin Islands and the U.S. Virgin Islands. BHNY is only licensed to issue insurance products in New York, and NELICO is licensed to issue insurance products in all U.S. states and the District of Columbia. The primary regulator of an insurance company, however, is the insurance regulator in its state of domicile. Our insurance subsidiaries, Brighthouse Life Insurance Company, BHNY and NELICO, are domiciled in Delaware, New York and Massachusetts, respectively, and regulated by the Delaware Department of Insurance (the “Delaware DOI”), the New York State Department of Financial Services (“NYDFS”) and the Massachusetts Division of Insurance, respectively. In addition, BRCD, which provides reinsurance to our insurance subsidiaries, is domiciled in Delaware and regulated by the Delaware DOI.
The extent of such regulation varies, but most jurisdictions have laws and regulations governing certain financial aspects of insurers and the administration and design of their respective products, as well as the business conduct of insurers and distributors. State laws in the U.S. grant insurance regulatory authorities broad administrative powers with respect to, among other things:
•licensing companies and agents to transact business;
•calculating the value of assets to determine compliance with statutory requirements;
•mandating certain insurance benefits;
•regulating certain premium rates;
•reviewing and approving certain policy forms and rates;
•regulating unfair trade and claims practices, including through the imposition of restrictions on marketing and sales practices, distribution arrangements and payment of inducements, and identifying and paying to the states benefits and other property that are not claimed by the owners;
•regulating underwriting, advertising and marketing of insurance products, including the use of external data and information, as well as the use of certain emerging technologies;
•protecting privacy and cybersecurity;
•establishing statutory accounting and reserve requirements and solvency standards (including RBC);
•specifying the conditions under which a ceding company can take credit for reinsurance in its statutory financial statements (i.e., reduce its reserves by the amount of reserves ceded to a reinsurer);
•fixing maximum interest rates on insurance policy loans and minimum rates for guaranteed crediting rates on life insurance policies and annuity contracts;
•adopting and enforcing replacement, best interest, or suitability standards with respect to the sale of annuities and other insurance products;
•approving changes in control of insurance companies;
•restricting the payment of dividends to affiliates, as well as certain other transactions between affiliates; and
20
•regulating the types, amounts and valuation of investments.
Each of our insurance subsidiaries and BRCD are required to file reports, generally including detailed annual financial statements, with insurance regulatory authorities in each of the jurisdictions in which it does business, and its operations and accounts are subject to periodic examination by such authorities. Our insurance subsidiaries must also file, and in many jurisdictions and for some lines of insurance obtain regulatory approval for, rules, rates and forms relating to the insurance written in the jurisdictions in which they operate.
State and federal insurance and securities regulatory authorities and other state law enforcement agencies and attorneys general from time to time may make inquiries regarding our compliance with insurance, securities and other laws and regulations regarding the conduct of our insurance and securities businesses. We cooperate with such inquiries and take corrective action when warranted. See Note 18 of the Notes to the Consolidated Financial Statements.
Statutory Accounting, Reserves and Risk-Based Capital
The NAIC is an organization whose mission is to assist state insurance regulatory authorities in serving the public interest and achieving the insurance regulatory goals of its members, the state insurance regulatory officials. Through the NAIC, state insurance regulators establish standards and best practices, conduct peer reviews, and coordinate their regulatory oversight. The NAIC provides standardized insurance industry accounting and reporting guidance through its Accounting Practices and Procedures Manual. The NAIC also provides guidance for the computation of reserves through its Valuation Manual, which states have largely adopted by regulation. However, statutory accounting principles and reserve requirements continue to be established by individual state laws, regulations and permitted practices, which may differ from the guidance provided by the NAIC. Changes to accounting, reporting or reserve guidance, or modifications to any laws, regulations or permitted practices by the various states, may impact our statutory capital and surplus.
The NAIC has established RBC requirements that are used by regulators to assess the minimum amount of statutory capital and surplus needed for an insurance company to support its operations, based on its size and risk profile (referred to as “company action level RBC”). Insurers are required to maintain their capital and surplus at or above minimum levels. Companies below 100% of the company action level RBC are subject to corrective action. Regulators have discretionary authority, in connection with the continued licensing of an insurer, to limit or prohibit the insurer’s sales to policyholders if, in their judgment, the regulators determine that such insurer has not maintained the minimum surplus or capital or that the further transaction of business will be hazardous to policyholders. Each of our insurance subsidiaries is subject to RBC requirements and other minimum statutory capital and surplus requirements imposed under the laws of its respective jurisdiction of domicile. RBC is based on a formula calculated by applying factors to various asset, premium, claim, expense and statutory reserve items. The formula takes into account the risk characteristics of the insurer and is calculated for NAIC reporting purposes on an annual basis. The major categories of risk involved are asset risk, insurance risk, interest rate risk, market risk and business risk, including equity, interest rate and expense recovery risks associated with variable annuities that contain guaranteed minimum death and living benefits. The RBC ratio is a method of measuring an insurance company’s capital and is based on statutory financial statements. The RBC ratio, which is the basis for determining regulatory compliance, is equal to total adjusted capital (“TAC”) divided by the applicable company action level RBC.
The RBC framework is used as an early warning regulatory tool to identify possible inadequately capitalized insurers for purposes of initiating regulatory action, and not as a means to rank insurers generally. State insurance laws provide insurance regulators the authority to require various actions by, or take various actions against, insurers whose TAC does not meet or exceed certain RBC levels. See “Risk Factors — Regulatory and Legal Risks — A decrease in the RBC ratio of our insurance subsidiaries (as a result of a reduction in statutory capital and surplus or an increase in the required RBC capital charges), or a change in the rating agency proprietary capital models for our insurance subsidiaries, could result in increased scrutiny by insurance regulators and rating agencies and could have a material adverse effect on our financial condition and results of operations,” “Management’s Discussion and Analysis of Financial Condition and Results of Operations — Liquidity and Capital Resources” and Note 13 of the Notes to the Consolidated Financial Statements.
In August 2022, the NAIC adopted changes to the RBC factors for life insurance contracts. These changes became effective on December 31, 2022, and, upon adoption, they did not have a material impact on our combined RBC ratio.
In June 2021, the NAIC adopted changes to the RBC factors for bonds and real estate and created a new set of RBC charges for longevity risk. These changes became effective on December 31, 2021, and, upon adoption, they did not have a material impact on our combined RBC ratio.
21
In August 2018, the NAIC adopted the framework for variable annuity reserve and capital reform (“VA Reform”), which was adopted by Brighthouse Financial effective December 31, 2019. The revisions, which resulted in substantial changes in reserves, statutory surplus and capital requirements, were designed to mitigate the incentive for insurers to engage in captive reinsurance transactions by making improvements to Actuarial Guideline 43 and the Life Risk Based Capital C3 Market Risk (“RBC C3 Market Risk”) capital requirements. VA Reform is intended to (i) mitigate the asset liability accounting mismatch between hedge instruments and statutory instruments and statutory liabilities, (ii) remove the non-economic volatility in statutory capital charges and the resulting solvency ratios and (iii) facilitate greater harmonization across insurers and their products for greater comparability. In August 2022, the NAIC adopted amendments to the Valuation Manual that changed the requirements for reflecting hedge instruments in variable annuity reserves and RBC C3 Market Risk. The changes became effective on December 31, 2023, resulting in a decrease to our statutory capital and surplus and an insignificant change to our combined RBC ratio as of such date.
Further changes to VA Reform, including changes resulting from work currently underway by the NAIC to find a suitable replacement for the Economic Scenario Generators developed by the American Academy of Actuaries, could negatively impact our statutory surplus and required capital.
See “Risk Factors — Regulatory and Legal Risks — Our insurance business is highly regulated, and changes in regulation and in supervisory and enforcement policies or interpretations thereof may materially impact our capitalization or cash flows, reduce our profitability and limit our growth.”
Holding Company Regulation
Insurance holding company laws and regulations vary from jurisdiction to jurisdiction, but generally require a controlled insurance company (i.e., insurers that are subsidiaries of insurance holding companies) to register with state regulatory authorities and to file with those authorities certain reports, including information concerning its capital structure, ownership, financial condition, certain intercompany transactions and general business operations. Most states have adopted substantially similar versions of the NAIC Insurance Holding Company System Model Act and the Insurance Holding Company System Model Regulation. Other states, including New York and Massachusetts, have adopted modified versions, although their supporting regulation is substantially similar to the model regulation.
Insurance holding company regulations generally provide that no person, corporation or other entity may acquire control of an insurance company, or a controlling interest in any parent company of an insurance company, without the prior approval of such insurance company’s domiciliary state insurance regulator. Under the laws of each of the domiciliary states of our insurance subsidiaries, any person acquiring, directly or indirectly, 10% or more of the voting securities of an insurance company (or any holding company of the insurance company) is presumed to have acquired “control” of the company. This statutory presumption of control may be rebutted by a showing that control does not exist, in fact. The state insurance regulators, however, may find that “control” exists in circumstances in which a person owns or controls less than 10% of an insurance company’s voting securities. The laws and regulations regarding acquisition of control transactions may discourage potential acquisition proposals and may delay, deter or prevent a change of control involving us, including through unsolicited transactions that some of our shareholders might consider desirable.
The insurance holding company laws and regulations include a requirement that the ultimate controlling person of a U.S. insurer file an annual enterprise risk report with the lead state of the insurance holding company system identifying risks likely to have a material adverse effect upon the financial condition or liquidity of the insurer or its insurance holding company system as a whole. All of the states where Brighthouse Financial has domestic insurers have enacted this enterprise risk reporting requirement.
State insurance statutes also typically place restrictions and limitations on the amount of dividends or other distributions payable by insurance subsidiaries to their parent companies, as well as on transactions between an insurer and its affiliates. Dividends in excess of prescribed limits and transactions above a specified size between an insurer and its affiliates require the prior approval of the insurance regulator in the insurer’s state of domicile.
The Delaware Insurance Commissioner (the “Delaware Commissioner”), the Massachusetts Commissioner of Insurance and the New York Superintendent of Financial Services have broad discretion in determining whether the financial condition of a stock life insurance company would support the payment of such dividends to its stockholders.
See Note 13 of the Notes to the Consolidated Financial Statements for a discussion of dividend restrictions under the insurance laws of Delaware, New York and Massachusetts, as well as the dividend restrictions under BRCD’s plan of operations.
See “Risk Factors — Risks Related to Our Business — As a holding company, BHF depends on the ability of its subsidiaries to pay dividends.”
22
Group Capital Contribution
The NAIC adopted a group capital calculation tool, implemented by Brighthouse Financial in 2022, that uses an RBC aggregation methodology for all entities within an insurance holding company system. The NAIC has stated that the calculation is a tool to assist regulators in assessing group risks and capital adequacy and does not constitute a minimum capital requirement or standard; however, there is no guarantee that will be the case in the future. It is unclear how the group capital calculation will interact with existing capital requirements for insurance companies in the U.S.
Own Risk and Solvency Assessment Model Act
In 2012, the NAIC adopted the Risk Management and Own Risk and Solvency Assessment Model Act (“ORSA”), which has been enacted by our insurance subsidiaries’ domiciliary states. ORSA requires that insurers maintain a risk management framework and conduct an internal own risk and solvency assessment of the insurer’s material risks in normal and stressed environments. The assessment must be documented in a confidential annual summary report, a copy of which must be made available to regulators as required or upon request.
Captive Reinsurer Regulation
During 2014, the NAIC approved a regulatory framework applicable to the use of captive insurers in connection with Regulation XXX and Guideline AXXX transactions. Among other things, the framework called for more disclosure of an insurer’s use of captives in its statutory financial statements and narrows the types of assets permitted to back statutory reserves that are required to support the insurer’s future obligations. In 2014, the NAIC implemented the framework through an actuarial guideline (“AG 48”), which requires the ceding insurer’s actuary to opine on the insurer’s reserves and to issue a qualified opinion if the framework is not followed. The requirements of AG 48 are effective in all U.S. states, and such requirements apply to policies issued and new reinsurance transactions entered into on or after January 1, 2015. In 2016, the NAIC adopted a model regulation containing similar substantive requirements to AG 48.
Federal Initiatives
Although the insurance business in the U.S. is primarily regulated by the states, federal initiatives often have an impact on our business in a variety of ways. Federal regulation of financial services, securities, derivatives and pensions, as well as legislation affecting cybersecurity, privacy, tort reform and taxation, may significantly and adversely affect the insurance business. In addition, various forms of direct and indirect federal regulation of insurance have been proposed from time to time, including proposals for the establishment of an optional federal charter for insurance companies.
Guaranty Associations and Similar Arrangements
All of the jurisdictions in which we are admitted to transact business require life insurers doing business within the jurisdiction to participate in guaranty associations, which are organized to pay contractual benefits owed pursuant to insurance policies issued by impaired, insolvent or failed insurers, or those that may become impaired, insolvent or fail, for example, following the occurrence of one or more catastrophic events. These associations levy assessments, up to prescribed limits, on all member insurers in a particular state on the basis of the proportionate share of the premiums written by member insurers in the lines of business in which the impaired, insolvent or failed insurer is engaged. Some states permit member insurers to recover assessments paid through full or partial premium tax offsets.
Over the past several years, the aggregate assessments levied against us have not been material. We have established liabilities for guaranty fund assessments that we consider adequate.
Insurance Regulatory Examinations and Other Activities
As part of their regulatory oversight process, state insurance departments conduct periodic detailed examinations of the books, records, accounts, and business practices of insurers domiciled in their states, including periodic financial examinations and market conduct examinations, some of which are currently in process. State insurance departments also have the authority to conduct examinations of non-domiciliary insurers that are licensed in their states, and such states routinely conduct examinations of us. Over the past several years, there have been no material adverse findings in connection with any examinations of us conducted by state insurance departments, although there can be no assurance that there will not be any material adverse findings in the future.
23
Regulatory authorities in a small number of states, the Financial Industry Regulatory Authority, Inc. (“FINRA”) and, occasionally, the SEC, have conducted investigations or inquiries relating to sales or administration of individual life insurance policies, annuities or other products by our insurance subsidiaries. These investigations have focused on the conduct of particular financial services representatives, the sale of unregistered or unsuitable products, the misuse of client assets, and sales and replacements of annuities and certain riders on such annuities. Over the past several years, these and a number of investigations of our insurance subsidiaries by other regulatory authorities were resolved for monetary payments and certain other relief, including restitution payments. We may continue to receive, and may resolve, further investigations and actions on these matters in a similar manner. In addition, insurance companies’ claims payment, abandoned property and escheatment practices have received increased scrutiny from regulators.
Policy and Contract Reserve Adequacy Analysis
Annually, our insurance subsidiaries and BRCD are required to conduct an analysis of the adequacy of all statutory reserves. In each case, a qualified actuary must submit an opinion which states that the statutory reserves make adequate provision, according to accepted actuarial standards of practice, for the anticipated cash flows required by the contractual obligations and related expenses of the insurance company. The adequacy of the statutory reserves is considered in light of the assets held by the insurer with respect to such reserves and related actuarial items, including, but not limited to, the investment earnings on such assets, and the consideration anticipated to be received and retained under the related policies and contracts. An insurance company may increase reserves in order to submit an opinion without qualification. Our insurance subsidiaries and BRCD, which are required by their respective states of domicile to provide these opinions, have provided such opinions without qualifications.
Regulation of Investments
Each of our insurance subsidiaries is subject to state laws and regulations that require diversification of investment portfolios and limit the amount of investments that an insurer may have in certain asset categories, such as below investment grade fixed income securities, real estate equity, other equity investments, and derivatives, and we have internal procedures designed to ensure that the investments made by each of our insurance subsidiaries comply with such laws and regulations. Failure to comply with these laws and regulations would cause investments exceeding regulatory limitations to be treated as non-admitted assets for purposes of measuring surplus and, in some instances, would require divestiture of such non-qualifying investments. The NAIC periodically reviews the statutory accounting and RBC requirements for investments and makes changes from time to time. For example, the NAIC is currently examining the risks associated with certain types of structured securities including Collateralized Loan Obligations and is considering modifications to the methodology used to assess credit risk and determine RBC requirements.
NYDFS Insurance Regulation 47
In August 2022, the NYDFS amended Insurance Regulation 47 (as amended, “Regulation 47”), which implemented new requirements for certain annuity products. Certain sections of Regulation 47 became effective as of January 1, 2023, and the remainder became effective on January 1, 2024. The regulation is likely to open the New York market to new competitors and has impacted some components of our current product designs. We continue to assess the impact of these new factors on our sales in New York. See “Risk Factors — Risks Related to Our Business — Factors affecting our competitiveness may adversely affect our market share and profitability” and “Risk Factors — Risks Related to Our Business — We may experience difficulty in marketing and distributing products through our distribution channels.”
NYDFS Insurance Regulation 210
In March 2018, NYDFS Insurance Regulation 210: Life Insurance and Annuity Non-Guaranteed Elements took effect. The regulation establishes standards for the determination and readjustment of non-guaranteed elements (“NGE”) that may vary at the insurer’s discretion for life insurance policies and annuity contracts delivered or issued for delivery in New York. In addition, the regulation establishes guidelines for related disclosure to the NYDFS and policy owners prior to any adverse change in NGEs. The regulation applies to all individual life insurance policies, individual annuity contracts and certain group life insurance and group annuity certificates that contain NGEs. NGEs include premiums, expense charges, cost of insurance rates and interest credits.
24
Privacy and Cybersecurity Regulation
In the course of our business, we and our distributors collect and maintain customer data, including personally identifiable nonpublic financial and health information. We also collect and handle the personal information of our associates and certain third parties who distribute our products. As a result, we and the third parties who distribute our products are subject to U.S. federal and state privacy laws and regulations, including the Health Insurance Portability and Accountability Act as well as additional regulation, including those described below. These laws and regulations require that we implement and maintain certain policies and procedures to safeguard this information from improper use or disclosure and that we provide notice of our practices related to the collection and disclosure of such information. Other laws and regulations require us to notify affected individuals and regulators of security breaches.
Congress and many states have enacted privacy and information security laws and regulations that impose compliance obligations applicable to our business, including obligations to protect sensitive personal and creditworthiness information, as well as limitations on the use and sharing of such information. For example, the NYDFS’s Part 500 – Cybersecurity Regulation (the “NYDFS Cybersecurity Regulation”), which became effective in March 2017, requires companies to establish a cybersecurity program. In November 2023, the NYDFS announced amendments to the NYDFS Cybersecurity Regulation. The amended NYDFS Cybersecurity Regulation went into effect in phases beginning November 1, 2023 and continuing through December 2025, and it includes additional and new requirements regarding certification, governance, audit requirements, technology and business continuity, security control and training requirements, and notification obligations.
In addition, the California Consumer Privacy Act of 2018 (the “CCPA”), which became effective in January 2020, affords California residents expanded privacy protections and control over the collection, use and sharing of their personal information. The CCPA requires companies to make certain disclosures to California consumers regarding personal information, among other privacy protective measures. The CCPA’s definition of “personal information” is more expansive than those found in other privacy laws in the United States applicable to us. Failure to comply with the CCPA risks regulatory fines, and the CCPA grants a private right of action and statutory damages for an unauthorized access and exfiltration, theft, or disclosure of certain types of personal information resulting from the Company’s violation of a duty to maintain reasonable security procedures and practices. The CCPA, amended by the California Privacy Rights Act (the “CPRA”), effective as of January 1, 2023, and the implementing regulations require additional investment in compliance programs and potential modifications to business processes. Further, the CCPA, as amended, creates the California Privacy Protection Agency to enforce the statute as well as its regulations, and it imposes new requirements relating to additional consumer rights, data minimization, and other obligations. The California legislature did not extend certain exemptions under the amended CCPA, specifically information collected in employment or business-to-business contexts, and such information therefore is now covered by the CCPA. Enforcement of the CCPA, as amended by the CPRA, began on July 1, 2023.
In 2017, the NAIC adopted the Insurance Data Security Model Law, which established standards for data security and for the investigation and notification of insurance commissioners of cybersecurity events involving unauthorized access to, or the misuse of, certain nonpublic information. More than 20 U.S. states have enacted the Insurance Data Security Model Law or similar laws, and we expect more states to follow.
In July 2023, the SEC adopted the Risk Management, Strategy, Governance, and Incident Disclosure Final Rule (the “Cybersecurity Final Rule”) that enhances the disclosure requirements for registered companies covering cybersecurity risk and management. The Cybersecurity Final Rule requires registrants to disclose material cybersecurity incidents on Form 8-K. The Cybersecurity Final Rule also requires periodic disclosures of the Company’s cybersecurity risk management processes, governance, and management’s role in overseeing such a compliance program. See “Cybersecurity” for a discussion of our cybersecurity risk management and governance framework.
All U.S. states, the District of Columbia, and U.S. territories also require entities to provide notification to affected residents and, in certain instances, state regulators, such as state attorneys general or state insurance commissioners, in the event of certain security breaches affecting personal information. Also, as noted above, state governments, Congress, and agencies may consider and enact additional legislation or promulgate regulations governing privacy, cybersecurity, and data breach reporting requirements. We cannot predict whether such legislation will be enacted, or what impact, if any, such legislation may have on our business practices, results of operations or financial condition.
25
Regulation of the Use of Artificial Intelligence
State legislatures and insurance regulators have shown increasing concern about the use of artificial intelligence (“AI”) and the potential for discrimination and bias in insurance practices. For example, on September 21, 2023, the Colorado Division of Insurance released its Final Governance and Risk Management Framework Requirements for Life Insurers’ Use of External Consumer Data and Information Sources (“ECDIS”), Algorithms, and Predictive Models, which requires life insurers authorized to do business in Colorado to implement AI governance and risk management measures that are reasonably designed to prevent unfair discrimination in the use of ECDIS, algorithms and predictive models. Additionally, on September 28, 2023, the Colorado Department of Insurance released its draft regulation on Quantitative Testing for Unfairly Discriminatory Outcomes for Algorithms and Predictive Models Used for Life Insurance Underwriting, which would require insurers to estimate the race and ethnicity of proposed insureds that have applied for life insurance coverage on or after the insurer’s initial adoption of the use of ECDIS, or algorithms and predictive models that used ECDIS. While we currently do not expect any of the existing regulations to have a material impact on our business, there can be no assurance that there will not be any material impacts in the future.
Other state legislatures and insurance regulators, as well as U.S. federal agencies, may also adopt regulations that govern the use of AI.
Securities, Broker-Dealer and Investment Advisor Regulation
Some of our activities in offering and selling variable insurance products, as well as certain fixed interest rate or index-linked contracts, are subject to extensive regulation under the federal securities laws administered by the SEC or state securities laws. Federal and state securities laws and regulations treat variable insurance products and certain fixed interest rate or index-linked contracts as securities that must be registered with the SEC under the Securities Act of 1933, as amended (the “Securities Act”), and distributed through broker-dealers registered under the Securities Exchange Act of 1934, as amended (the “Exchange Act”). These registered broker-dealers are also FINRA members; therefore, sales of these registered products are also subject to the requirements of FINRA rules.
Our subsidiary, Brighthouse Securities, LLC (“Brighthouse Securities”) is registered with the SEC as a broker-dealer and is approved as a member of, and subject to regulation by, FINRA. Brighthouse Securities is also registered as a broker-dealer in all applicable U.S. states. Its business is to serve as the principal underwriter and exclusive distributor of the registered products issued by its affiliates, and as the principal underwriter for the registered funds advised by its affiliated investment advisor, Brighthouse Advisers, and used to fund variable insurance products.
We issue variable insurance products through separate accounts that are registered with the SEC as investment companies under the Investment Company Act of 1940, as amended (the “Investment Company Act”). Each registered separate account is generally divided into subaccounts, each of which invests in an underlying fund which is itself a registered investment company under the Investment Company Act. Our subsidiary, Brighthouse Advisers is registered as an investment advisor with the SEC under the Investment Advisers Act of 1940, and its primary business is to serve as investment advisor to certain of the registered funds that underlie our variable annuity contracts and variable life insurance policies. Certain variable contract separate accounts sponsored by our insurance subsidiaries are exempt from registration under the Securities Act and the Investment Company Act but may be subject to other provisions of the federal securities laws.
Federal, state and other securities regulatory authorities, including the SEC and FINRA, may from time to time make inquiries and conduct examinations regarding our compliance with securities and other laws and regulations. We will cooperate with such inquiries and examinations and take corrective action when warranted. See “— Insurance Regulation — Insurance Regulatory Examinations and Other Activities.”
Federal and state securities laws and regulations are primarily intended to ensure the integrity of the financial markets, to protect investors in the securities markets, and to protect investment advisory or brokerage clients, and generally grant regulatory agencies broad rulemaking and enforcement powers, including the power to limit or restrict the conduct of business for failure to comply with such laws and regulations.
Department of Labor and ERISA Considerations
We manufacture individual retirement annuities that are subject to the Internal Revenue Code of 1986, as amended (the “Tax Code”), for third parties to sell to individuals. Also, a portion of our in-force life insurance products and annuity products are held by tax-qualified pension and retirement plans that are subject to ERISA or the Tax Code. While we currently believe manufacturers do not have as much exposure to ERISA and the Tax Code as distributors, certain activities are subject to the restrictions imposed by ERISA and the Tax Code, including restrictions on the provision of investment advice to ERISA qualified plans, plan participants and individual retirement annuity and individual retirement account
26
(collectively, “IRAs”) owners if the investment recommendation results in fees paid to an individual advisor, the firm that employs the advisor or their affiliates. In June 2020, the Department of Labor (“DOL”) issued guidance that expands the definition of “investment advice.” In October 2023, the DOL issued a new proposed regulation that would further update the definition of “investment advice.” See “— Standard of Conduct Regulation — Department of Labor Fiduciary Advice Rule.”
The DOL has issued a number of regulations that increase the level of disclosure that must be provided to plan sponsors and participants. The participant disclosure regulations and the regulations which require service providers to disclose fee and other information to plan sponsors took effect in 2012. Our insurance subsidiaries have taken and continue to take steps designed to ensure compliance with these regulations as they apply to service providers.
In John Hancock Mutual Life Insurance Company v. Harris Trust and Savings Bank (1993), the U.S. Supreme Court held that certain assets in excess of amounts necessary to satisfy guaranteed obligations under a participating group annuity general account contract are “plan assets.” Therefore, these assets are subject to certain fiduciary obligations under ERISA, which requires fiduciaries to perform their duties solely in the interest of participants and beneficiaries of a plan subject to Title I of ERISA (an “ERISA Plan”). DOL regulations issued thereafter provide that, if an insurer satisfies certain requirements, assets supporting a policy backed by the insurer’s general account and issued before 1999 will not constitute “plan assets.” We have taken and continue to take steps designed to ensure compliance with these regulations. An insurer issuing a new policy that is backed by its general account and is issued to or for an employee benefit plan after December 31, 1998 is generally subject to fiduciary obligations under ERISA, unless the policy is an insurance policy or contract that provides for benefits the amount of which is guaranteed by the insurer (a “guaranteed benefit policy”), in which case, the assets would not be considered “plan assets.” We have taken and continue to take steps designed to ensure that policies issued to ERISA Plans after 1998 qualify as guaranteed benefit policies.
Standard of Conduct Regulation
As a result of overlapping efforts by the DOL, the NAIC, individual states and the SEC to impose fiduciary-like requirements in connection with the sale of annuities, life insurance policies and securities, which are each discussed in more detail below, there have been a number of proposed or adopted changes to the laws and regulations that govern the conduct of our business and the firms that distribute our products. As a manufacturer of annuity and life insurance products, we do not directly distribute our products to consumers. However, regulations establishing standards of conduct in connection with the distribution and sale of these products could affect our business by imposing greater compliance, oversight, disclosure and notification requirements on our distributors or us, which may in either case increase our costs or limit distribution of our products. We cannot predict what other proposals may be made, what legislation or regulations may be introduced or enacted, or what impact any future legislation or regulations may have on our business, financial condition and results of operations.
Department of Labor Fiduciary Advice Rule
A regulatory action by the DOL (the “Fiduciary Advice Rule”), which became effective on February 16, 2021, reinstated the text of the DOL’s 1975 investment advice regulation defining what constitutes fiduciary “investment advice” to ERISA Plans and IRAs and provides guidance interpreting such regulation. The guidance provided by the DOL broadens the circumstances under which financial institutions, including insurance companies, could be considered fiduciaries under ERISA or the Tax Code. In particular, the DOL states that a recommendation to “roll over” assets from a qualified retirement plan to an IRA or from an IRA to another IRA, can be considered fiduciary investment advice if provided by someone with an existing relationship with the ERISA Plan or an IRA owner (or in anticipation of establishing such a relationship). This guidance reverses an earlier DOL interpretation suggesting that roll over advice does not constitute investment advice giving rise to a fiduciary relationship.
Under the Fiduciary Advice Rule, individuals or entities providing investment advice would be considered fiduciaries under ERISA or the Tax Code, as applicable, and would therefore be required to act solely in the interest of ERISA Plan participants or IRA beneficiaries, or risk exposure to fiduciary liability with respect to their advice. They would further be prohibited from receiving compensation for this advice, unless an exemption applied.
In connection with the Fiduciary Advice Rule, the DOL also issued an exemption, Prohibited Transaction Exemption (“PTE”) 2020-02, that allows fiduciaries to receive compensation in connection with providing investment advice, including advice with respect to roll overs, that would otherwise be prohibited as a result of their fiduciary relationship to the ERISA Plan or IRA. In order to be eligible for the exemption, among other conditions, the investment advice fiduciary is required to acknowledge its fiduciary status, refrain from putting its own interests ahead of the plan beneficiaries’ interests or making material misleading statements, act in accordance with ERISA’s “prudent person” standard of care and receive no more than reasonable compensation for the advice.
27
Because we do not engage in direct distribution of retail products, including IRA products and retail annuities sold to ERISA Plan participants and to IRA owners, we believe that we have limited exposure to the Fiduciary Advice Rule. However, while we cannot predict the rule’s impact, the DOL’s interpretation of the ERISA fiduciary investment advice regulation could have an adverse effect on sales of annuity products through our independent distribution partners, as a significant portion of our annuity sales are as IRAs. The Fiduciary Advice Rule may also lead to changes to our compensation practices and product offerings as well as increase our litigation risk, any of which could adversely affect our financial condition and results of operations. We may also need to take certain additional actions in order to comply with, or assist our distributors in their compliance with, the Fiduciary Advice Rule.
On October 31, 2023, the DOL announced a proposed regulation that would update the definition of an “investment advice fiduciary” under ERISA and amend related administrative PTEs, including PTE 2020-02. The proposed regulation would broaden the circumstances under which financial institutions, including insurance companies, could be considered fiduciaries to ERISA plans and IRA investors. While we cannot predict whether the proposed regulation will be adopted or enacted in its proposed form, it could have further adverse effects on sales of our products through our independent distribution partners and may also lead to further changes to our product offerings and compensation practices, as well as increase our litigation risk, any of which could adversely affect our financial condition and results of operations. We may also need to take certain additional actions to comply with, or assist our distributors in their compliance with, the regulation. We are assessing the potential impact of the proposed regulation and PTE amendments on our annuity and life insurance businesses and will continue to monitor developments regarding the proposal.
State Law Standard of Conduct Rules and Regulations
The NAIC adopted a Suitability in Annuity Transactions Regulation (the “NAIC SAT”) that includes a best interest standard on February 13, 2020 in an effort to promote harmonization across various regulators, including the SEC Regulation Best Interest. The NAIC SAT model standard requires producers to act in the best interest of the consumer when recommending annuities. Several states have adopted the NAIC SAT model, effective in 2021, and we expect that other states will also consider adopting the NAIC SAT model.
Additionally, certain regulators have issued proposals to impose a fiduciary duty on some investment professionals, and other states may be considering similar regulations. We continue to assess the impact of these issued and proposed standards on our business, and we expect that we and our third-party distributors will need to implement additional compliance measures that could ultimately impact sales of our products.
NYDFS Insurance Regulation 187
In July 2018, the NYDFS amended Insurance Regulation 187 (as amended, “Regulation 187”), adopting a “best interest” standard for the sale of annuities and life insurance products in New York. Regulation 187 generally requires that an insurance producer or insurer consider only a consumer’s best interest, and not the financial interests of the producer or insurer, in making a recommendation as to which life insurance or annuity product a consumer should purchase. In addition, Regulation 187 imposes a best interest standard on consumer in-force transactions. We have assessed the impact to our annuity and life insurance businesses and have adopted certain changes to promote compliance with the provisions by their respective effective dates. In April 2021, the Appellate Division of the New York State Supreme Court overturned the amendment to Regulation 187 for being unconstitutionally vague, and the NYDFS filed an appeal to the New York Court of Appeals in May 2021. On October 20, 2022, the New York Court of Appeals held that the amendment to Regulation 187 is constitutional, which leaves Regulation 187 in effect.
SEC Rules Addressing Standards of Conduct for Broker-Dealers
On June 5, 2019, the SEC adopted a comprehensive set of rules and interpretations for broker-dealers and investment advisers, including Regulation Best Interest. Among other things, this regulatory package:
•requires broker-dealers and their financial professionals to act in the best interest of retail customers when making recommendations to such customers without placing their own interests ahead of the customers’ interests, including by satisfying obligations relating to disclosure, care, mitigation of conflicts of interest, and compliance policies and procedures;
•clarifies the nature of the fiduciary obligations owed by registered investment advisers to their clients;
•imposes new requirements on broker-dealers and investment advisers to deliver Form CRS relationship summaries designed to assist customers in understanding key facts regarding their relationships with their investment professionals and differences between the broker-dealer and investment adviser business models; and
28
•restricts broker-dealers and their financial professionals from using certain compensation practices and the terms “adviser” or “advisor.”
The intent of Regulation Best Interest is to impose an enhanced standard of care on broker-dealers and their financial professionals which is more similar to that of an investment adviser. Among other things, this would require broker-dealers to mitigate conflicts of interest arising from transaction-based financial arrangements for their employees.
Regulation Best Interest may change the way broker-dealers sell securities such as variable annuities to their retail customers as well as their associated costs. Moreover, it may impact broker-dealer sales of other annuity products that are not securities because it could be difficult for broker-dealers to differentiate their sales practices by product. Broker-dealers were required to comply with the requirements of Regulation Best Interest beginning June 30, 2020. In addition, individual states and their securities regulators may adopt their own enhanced conduct standards for broker-dealers that may further impact their practices, and it is uncertain to what extent they would be preempted by Regulation Best Interest.
Federal Tax Reform
On August 16, 2022, the Inflation Reduction Act was signed into law by President Biden. The Inflation Reduction Act establishes a 15% corporate alternative minimum tax (the “CAMT”) for corporations whose average annual adjusted financial statement income for any consecutive three–tax year period ending after December 31, 2021 and preceding the tax year exceeds $1.0 billion. Based on limited guidance issued by the U.S. Department of Treasury to date, the Company does not currently expect to be subject to the CAMT for the year ended December 31, 2023. However, the Company will assess the applicability of the CAMT on an annual basis and may be subject to the CAMT in future years.
In addition, the Inflation Reduction Act also establishes a one percent excise tax on stock repurchases made by publicly-traded U.S. corporations. Both provisions are effective for tax years beginning after December 31, 2022.
Regulation of Over-the-Counter Derivatives
The Dodd-Frank Wall Street Reform and Consumer Protection Act (“Dodd-Frank”) includes a framework of regulation of the over-the-counter (“OTC”) derivatives markets which requires clearing of certain types of derivatives and imposes additional costs, including new reporting and margin requirements. We use derivatives to mitigate a wide range of risks in connection with our businesses, including the impact of increased benefit exposures from certain of our annuity products that offer guaranteed benefits. Our costs of risk mitigation have increased under Dodd-Frank. For example, Dodd-Frank imposes requirements for (i) the mandatory clearing of certain OTC derivatives transactions that must be cleared and settled through central clearing counterparties (“OTC-cleared”), and (ii) the mandatory exchange of margin for OTC in-scope derivatives transactions that are bilateral contracts between two counterparties (“OTC-bilateral” or “uncleared”) entered into after the applicable phase-in period. The initial margin requirements for OTC-bilateral derivatives transactions, which requires the collecting and posting of collateral to reduce future exposure to a given counterparty, became applicable to us in September 2021. The increased margin requirements, combined with increased capital charges for our counterparties and central clearinghouses with respect to non-cash collateral, will likely require increased holdings of cash and highly liquid securities with lower yields causing a reduction in income and less favorable pricing for cleared and OTC-bilateral derivatives transactions. Centralized clearing of certain derivatives also exposes us to the risk of a default by a clearing member or clearinghouse with respect to our cleared derivatives transactions. We could be subject to higher costs of entering into derivatives transactions (including customized derivatives) and the reduced availability of customized derivatives that might result from the implementation of Dodd-Frank and comparable international derivatives regulations.
Federal banking regulators adopted rules that apply to certain qualified financial contracts, including many derivatives contracts, securities lending agreements and repurchase agreements, with certain banking institutions and certain of their affiliates. These rules, which became effective on January 1, 2019, generally require the banking institutions and their applicable affiliates to include contractual provisions in their qualified financial contracts that limit or delay certain rights of their counterparties arising in connection with the banking institution or an applicable affiliate becoming subject to a bankruptcy, insolvency, resolution or similar proceeding. Certain of our derivatives, securities lending agreements and repurchase agreements are subject to these rules, and as a result, we are subject to greater risk and more limited recovery in the event of a default by such banking institutions or their applicable affiliates.
29
Environmental Considerations
We hold equity interests in companies that may be subject to extensive federal, state and local environmental laws and regulations and, accordingly, could potentially be subject to environmental liabilities. Our properties routinely have environmental assessments performed with respect to real estate being acquired for investment and real property to be acquired through foreclosure. We cannot provide assurance that unexpected environmental liabilities will not arise. However, based on information currently available to us, we believe that any costs associated with compliance with environmental laws and regulations or any remediation of properties in our investment portfolio will not have a material adverse effect on our results of operations or financial condition. See Note 9 of the Notes to the Consolidated Financial Statements for a discussion on certain limitations and interests regarding our arrangements in or with variable interest entities.
Unclaimed Property
We are subject to the laws and regulations of states and other jurisdictions concerning identification, reporting and escheatment of unclaimed or abandoned funds, and are subject to audit and examination for compliance with these requirements, which may result in fines or penalties. Litigation may be brought by, or on behalf, of one or more entities, seeking to recover unclaimed or abandoned funds and interest. The claimant or claimants also may allege entitlement to other damages or penalties, including for alleged false claims.
Competition
Both the annuities and the life insurance markets are very competitive, with many participants and no one company dominating the market for all products. According to the American Council of Life Insurers (Life Insurers Fact Book 2023), the U.S. life insurance industry is made up of 727 companies with sales and operations across the country and U.S. territories. We compete with major, well-established stock and mutual life insurance companies and non-insurance financial services companies (e.g., banks, broker-dealers and asset managers) in all of our product offerings, including certain of our distributors that currently manufacture competing products or may manufacture competing products in the future. Our Annuities segment also faces competition from other financial service providers that focus on retirement products and advice. Our competitive positioning overall is focused on access to distribution channels, product features and financial strength.
Principal competitive factors in the annuities business include product features, distribution channel relationships, ease of doing business, annual fees, investment performance, speed to market, brand recognition, technology and the financial strength ratings of the insurance company. In particular for the variable annuity business, our living benefit rider product features and the quality of our relationship management and wholesaling support are key drivers in our competitive position. In the fixed annuity business, the crediting rates and guaranteed payout product features are the primary competitive factors, while for index-linked annuities the competitiveness of the crediting methodology is the primary driver. For income annuities, the competitiveness of the lifetime income payment amount is generally the principal factor.
Principal competitive factors in the life insurance business include product and underwriting features, customer service and distribution channel relationships, price, the financial strength ratings of the insurance company, technology and financial stability. For our hybrid indexed universal life with long-term care product, product features, long-term care benefits and our underwriting process are the primary competitive factors. The principal factors for our income product are its guaranteed distributions, crediting strategies and underwriting process.
Human Capital Resources
At Brighthouse Financial, our employees are one of our most valuable assets. Our ability to successfully execute our business strategy and deliver on our mission to help people achieve financial security starts with our culture and values, which are brought to life every day by our employees. At December 31, 2023, we had approximately 1,500 employees.
The Company’s Board of Directors and its Compensation and Human Capital Committee oversee our human capital matters, including pay equity; talent and leadership development; the Company’s efforts to attract, engage and retain talent; culture; and the development and execution of the Company’s strategy to advance its diversity, equity and inclusion (“DEI”) objectives. Such objectives include increasing representation of underrepresented populations across the Company, by seeking a diverse slate of candidates for open positions and through other efforts, strengthening our inclusive culture, promoting the development of an inclusive pipeline for supplier and vendor opportunities, supporting the communities we serve and working with educational institutions and other organizations to help create more opportunities for individuals from underrepresented groups.
30
Our Culture, Values and Ethics
Our culture is rooted in three core values — collaboration, adaptability and passion. We believe these values help us build an organization where talented people from all backgrounds can make meaningful contributions to our success while growing their careers. We are committed to continually enhancing our culture through a variety of programs, policies and initiatives. We place a high value on employee feedback, which we believe is critical to our efforts to continue to strengthen our culture. We collect employee feedback on an ongoing basis in multiple ways, including through periodic surveys, coaching and feedback discussions, exit surveys and interviews, employee network groups (discussed below), listening and learning sessions and leader-led office hours.
Our culture is also built on our deep commitment to ethics and integrity, and we recognize that the continued success of the Company is dependent upon the trust of our employees, distribution partners, customers and stockholders. We strive to adhere to the highest standards of business conduct at all times and put honesty, fairness and trustworthiness at the center of all that we do. To help maintain a safe and productive workplace, we establish and oversee programs to build awareness and train employees on important standards, policies and procedures, as required by applicable regulations, Company policy or best practices. As part of our commitment to ethics and integrity, we require all employees to review and certify compliance with our code of conduct for employees on an annual basis, as well as complete more extensive training on the code of conduct on a biennial basis. In addition, we help to ensure that employees are well informed of the Company’s reporting and escalation process, including options for anonymous whistleblower reporting, through regular communications.
Attracting, Engaging, Developing and Retaining Talent
We believe that our success depends, in large part, on our ability to attract and retain highly skilled employees. There is strong competition for talent in our industry, and current U.S. labor market dynamics may further increase the challenge of attracting and retaining employees. We continue to monitor the current U.S. labor environment and adapt, as needed, our activities, policies and practices to attract, engage, develop and retain employees and to ensure that Brighthouse Financial remains a great place to work. These efforts include, among other things, seeking to support our employees with competitive and equitable pay and benefits and to provide our employees with training and other learning and development opportunities. In addition, we continue to operate under a flexible, hybrid work model, which has enabled us to expand our recruiting strategy.
We offer all of our employees benefits programs that are designed to help meet their financial, physical and mental needs. All employees are eligible to participate in our 401(k) savings plan, to which we make matching and annual nondiscretionary contributions, and in our Employee Stock Purchase Plan, through which employees can purchase BHF stock at a discounted price. We offer competitive health care benefits options for medical, dental and vision coverage, as well as health care and dependent care flexible spending accounts. We offer all employees paid time off, holidays and volunteer and study time off to help promote healthier work-life balance and other well-being benefits, including paid parental and family leave for new parents. In addition, we conduct annual pay equity reviews to help ensure that individual compensation is determined exclusively based on performance, experience, job level and other neutral factors.
Our talent management and development strategies are built on continuous coaching and feedback, learning, training, collaboration and inclusivity. We provide employees with many opportunities and resources to learn and develop, including a curated set of courses designed to help employees achieve their personal and professional goals. In addition, we offer all employees access to optional monthly learning sessions designed to further enhance their understanding of our corporate strategy and culture, as well as to provide the opportunity to build and enhance skills. We also offer a mentorship program designed to provide professional development opportunities through engagement with leaders across the Company. As noted above, we collect employee feedback on an ongoing basis, which facilitates our efforts to understand and optimize our employees’ experiences at the Company and assists us in attracting, engaging, developing and retaining talent. To further help our employees remain engaged and well connected to the Company and each other, we hold a variety of events and issue a wide range of communications throughout the year, including town hall meetings, podcasts from our CEO, companywide discussions with members of our leadership team, intranet articles and a weekly newsletter highlighting events and news from around the Company.
31
Diversity, Equity and Inclusion
We are committed to providing an inclusive workplace where employees can trust that their unique backgrounds and perspectives will be recognized, respected and celebrated. We believe that by building such a workplace, we are better able to attract and retain talent and provide valuable products that meet the needs of our distribution partners and the financial professionals who sell our products, as well as their clients. We seek to attract and retain talent that reflects the diversity of our communities, and we remain focused on maintaining strong representation of underrepresented groups across the Company. Our varied approach to attracting and recruiting talent includes efforts to diversify candidate slates for open positions, diversify interview teams to reduce bias and build partnerships with diverse professional organizations and universities. In recognition of the importance of DEI to Brighthouse Financial, in 2021, the Compensation and Human Capital Committee began to incorporate into its assessment of our senior leaders’ individual performance, in connection with the approval of their short-term incentive awards, their efforts with respect to advancing the Company’s DEI strategy.
We employ a multifaceted approach to advancing DEI across the Company that includes various programs and initiatives. One such initiative is our DEI Council which is comprised of representatives from across Brighthouse Financial. The DEI Council creates and sponsors programs and development opportunities with the aim of further embedding DEI within the Company and continuously enhancing our Company’s culture. In 2022, we launched our Company’s employee network groups, which are open to all employees and provide a forum for employees across various dimensions of diversity to discuss relevant professional and personal topics, learn from one another, find support and allyship, expand their networks and deepen their level of compassion and understanding. In addition, to continue fostering our inclusive workplace, the Company requires all employees to complete annual DEI training. The Company also has developed a supplier diversity program designed to advance the building of an inclusive pipeline of talent for supplier and vendor opportunities.
The Company further seeks to deliver on its commitment to DEI through its own charitable organizations and through strategic partnerships with community organizations, educational institutions and industry peers. The Brighthouse Financial Foundation (the “Foundation”), a non-profit organization, was established in 2017 with the mission to improve the financial security, culture and opportunities afforded to communities in which the Company’s employees live and work by providing resources and support to other tax-exempt organizations which further that mission. In addition, through Brighthouse Scholar Connections, Inc., a non-profit organization established in 2022, scholarships are provided to expand educational opportunities for students who are members of historically underrepresented or disadvantaged populations due to race, ethnicity, socioeconomic status or other factors. Brighthouse Financial employees have the opportunity to serve as mentors for students who have been awarded scholarships by this organization.
Information About Our Executive Officers
The following table presents certain information regarding our executive officers as of February 22, 2024.
| Name | Age | Position with Brighthouse Financial and Certain Other Business Experience | ||||||||||||
| Eric T. Steigerwalt | 62 | Brighthouse Financial: President and Chief Executive Officer (August 2017 – present) MetLife: President and Chief Executive Officer, Brighthouse Financial, Inc. (August 2016 – August 2017); Executive Vice President, U.S. Retail (September 2012 – August 2017) | ||||||||||||
| Edward A. Spehar | 58 | Brighthouse Financial: Executive Vice President and Chief Financial Officer (August 2019 – present) MetLife: Executive Vice President and Treasurer (August 2018 – July 2019); Chief Financial Officer of Europe, Middle East and Africa Region (July 2016 – February 2019) | ||||||||||||
| Vonda R. Huss | 57 | Brighthouse Financial: Executive Vice President and Chief Human Resources Officer (November 2017 – present) Wells Fargo, a financial services company: Executive Vice President, Co-Head of Human Resources (September 2015 – November 2017) | ||||||||||||
| Myles J. Lambert | 49 | Brighthouse Financial: Executive Vice President and Chief Marketing and Distribution Officer (August 2017 – present) MetLife: Executive Vice President and Chief Marketing and Distribution Officer, Brighthouse Financial, Inc. (August 2016 – August 2017); Senior Vice President, U.S. Retail Distribution and Marketing (April 2016 – August 2017) | ||||||||||||
| Allie Lin | 46 | Brighthouse Financial: Executive Vice President and General Counsel (December 2022 – present); Head of Litigation and Employment Law (February 2021 – December 2022); Lead Litigation and Employment Attorney (September 2019 – February 2021); Corporate Counsel, Litigation Attorney (March 2018 – September 2019) AXA Equitable Life Insurance Company: Senior Director and Counsel (October 2013 – March 2018) | ||||||||||||
| John L. Rosenthal | 63 | Brighthouse Financial: Executive Vice President and Chief Investment Officer (August 2017 – present) MetLife: Executive Vice President and Chief Investment Officer, Brighthouse Financial, Inc. (August 2016 – August 2017); Senior Managing Director, Head of Global Portfolio Management (2011 – August 2017) | ||||||||||||
32
Intellectual Property
We rely on a combination of contractual rights with third parties and copyright, trademark, patent and trade secret laws to establish and protect our intellectual property. We have established a portfolio of trademarks in the U.S. that we consider important in the marketing of our products and services, including for our name, “Brighthouse Financial,” our logo design and taglines.
Available Information and the Brighthouse Financial Website
Our website is located at www.brighthousefinancial.com. We use our website as a routine channel for distribution of information that may be deemed material for investors, including news releases, presentations, financial information, statutory filings and corporate governance information. We post filings on our website as soon as practicable after they are electronically filed with, or furnished to, the SEC, including our annual and quarterly reports on Forms 10-K and 10-Q and current reports on Form 8-K; our proxy statements; and any amendments to those reports or statements. All such postings and filings are available on the “Investor Relations” portion of our website free of charge. In addition, our Investor Relations website allows interested persons to sign up to automatically receive e-mail alerts when we make filings with the SEC. The SEC’s website, www.sec.gov, contains reports, proxy and information statements, and other information regarding issuers that file electronically with the SEC.
We may use our website as a means of disclosing material information and for complying with our disclosure obligations under Regulation Fair Disclosure promulgated by the SEC. These disclosures are included on our website in the “Investor Relations” or “Newsroom” sections. Accordingly, investors should monitor these portions of our website, in addition to following Brighthouse Financial’s news releases, SEC filings, public conference calls and webcasts.
Information contained on or connected to any website referenced in this Annual Report on Form 10-K is not incorporated by reference in this Annual Report on Form 10-K or in any other report or document we file with the SEC, and any website references are intended to be inactive textual references only, unless expressly noted.
33
Item 1A. Risk Factors
Index to Risk Factors
| Page | |||||
34
Overview
You should carefully consider the factors described below, in addition to the other information set forth in this Annual Report on Form 10-K. These risk factors are important to understanding the contents of this Annual Report on Form 10-K and our other filings with the SEC. If any of the following events occur, our business, financial condition and results of operations could be materially adversely affected. In that event, the trading price of our securities could decline, and you could lose all or part of your investment. A summary of the factors described below can be found in “Note Regarding Forward-Looking Statements and Summary of Risk Factors.”
The materialization of any risks and uncertainties set forth below or identified in “Note Regarding Forward-Looking Statements and Summary of Risk Factors” contained in this Annual Report on Form 10-K and “Note Regarding Forward-Looking Statements” in our other filings with the SEC or those that are presently unforeseen or that we currently believe to be immaterial could result in significant adverse effects on our business, financial condition, results of operations and cash flows. See “Note Regarding Forward-Looking Statements and Summary of Risk Factors.”
Risks Related to Our Business
Differences between actual experience and actuarial assumptions may adversely affect our financial results, capitalization and financial condition
Our earnings significantly depend upon the extent to which our actual claims experience and benefit payments on our products are consistent with the assumptions we use in setting prices for our products and establishing liabilities for future policy benefits and claims. Such liabilities are established based on actuarial estimates of how much we will need to pay for future benefits and claims. To the extent that actual claims and benefits experience differs from the underlying assumptions we used in establishing such liabilities, we could be required to increase our liabilities. We make assumptions regarding policyholder behavior at the time of pricing, including regarding the selection and utilization of the guaranteed options inherent within certain of our products, based in part on expected persistency of the products, which change the probability that a policy or contract will remain in-force from one period to the next. Persistency could be adversely affected by a number of factors, including adverse economic conditions, as well as by developments affecting policyholder perception of us, including perceptions arising from any potential adverse publicity or negative rating agency actions. The pricing of certain of our variable annuity products that contain certain living benefit guarantees is also based on assumptions about utilization rates (i.e., the percentage of contracts that will utilize the benefit during the contract duration), including the timing of the first withdrawal. Our earnings may vary based on differences between actual and expected benefit utilization. A material increase in the valuation of the liability could result to the extent that emerging and actual experience deviates from these policyholder option utilization assumptions; in certain circumstances this deviation may impair our solvency. We conduct an annual actuarial review (the “AAR”) of the key inputs into our actuarial models that rely on management judgment and update any models where we have credible evidence from actual experience, industry data or other relevant sources to ensure our price-setting criteria and reserve valuation practices continue to be appropriate.
Due to the nature of the underlying risks and the uncertainty associated with the determination of liabilities for future policy benefits and claims, we cannot precisely determine the amounts which we will ultimately pay to settle these liabilities. Such amounts may vary materially from the estimated amounts, particularly when those payments may not occur until well into the future. We evaluate our liabilities periodically based on accounting requirements (which change from time to time), the assumptions and models used to establish the liabilities, as well as our actual experience. If the liabilities originally established for future benefit payments and claims prove inadequate, we will be required to increase them.
An increase in our reserves for any of the above reasons, individually or in the aggregate, could have a material adverse effect on our financial condition and results of operations and our profitability measures, as well as materially impact our capitalization, our statutory free cash flow, our ability to receive dividends from our insurance subsidiaries and BRCD, as well as our liquidity. This could in turn impact our RBC ratios and our financial strength ratings, which are necessary to support our product sales, and, in certain circumstances, ultimately impact our solvency.
See “Management’s Discussion and Analysis of Financial Condition and Results of Operations — Policyholder Liabilities.”
35
Guarantees within certain of our annuity products may decrease our earnings, decrease our capitalization, increase the volatility of our results, result in higher risk management costs and expose us to increased market risk
Certain of the variable annuity products we offer include guaranteed benefits designed to protect contract holders against significant changes in equity markets and interest rates, including GMDBs and GMWBs. While we have GMABs and GMIBs in-force with respect to which we are obligated to perform, we no longer sell new products that include GMABs or GMIBs. We hold liabilities based on the value of the benefits we expect to be payable under such guarantees in excess of the contract holders’ projected account balances. As a result, any periods of significant and sustained negative or low separate account returns, increased equity volatility, or reduced interest rates could result in an increase in the valuation of our liabilities associated with variable annuity guarantees.
Additionally, we make assumptions regarding policyholder behavior at the time of pricing, including the selection and utilization of the guaranteed options inherent within our products (e.g., utilization of option to annuitize within a GMIB product). An increase in the valuation of the liability could result to the extent emerging and actual experience deviates from these policyholder persistency and option utilization assumptions. We review key actuarial assumptions used to record our variable annuity liabilities on an annual basis, including the assumptions regarding policyholder behavior. Changes to assumptions based on our AAR in future years could result in an increase in the liabilities we record for these guarantees.
Furthermore, our Shield Annuities are index-linked annuities with guarantees for a defined amount of equity loss protection and upside participation. If the separate account assets consisting of fixed income securities are insufficient to support the increased liabilities resulting from a period of sustained growth in the equity index on which the product is based, we may be required to fund such separate accounts with additional assets from our general account, where we manage the equity risk as part of our overall variable annuity exposure risk management strategy. To the extent policyholder persistency is different from what we anticipate in a sustained period of equity index growth, it could have a negative impact on our liquidity.
An increase in our variable annuity guarantee liabilities for any of the above reasons, individually or in the aggregate, could have a material adverse effect on our financial condition and results of operations and our profitability measures, as well as materially impact our capitalization, our statutory free cash flow, our ability to receive dividends from our insurance subsidiaries and our liquidity. This could in turn impact our RBC ratios and our financial strength ratings, which are necessary to support our product sales, and, in certain circumstances, ultimately impact our solvency.
See “Management’s Discussion and Analysis of Financial Condition and Results of Operations — Risk Management Strategies,” “Management’s Discussion and Analysis of Financial Condition and Results of Operations — Results of Operations — Annual Actuarial Review” and “Management’s Discussion and Analysis of Financial Condition and Results of Operations — Industry Trends and Uncertainties — Financial and Economic Environment.”
Our variable annuity exposure risk management strategy may not be effective, may result in significant volatility in our profitability measures or may negatively affect our statutory capital
Our variable annuity exposure risk management strategy seeks to mitigate the potential adverse effects of changes in capital markets, specifically equity markets and interest rates. The strategy primarily relies on a hedging strategy using derivative instruments and, to a lesser extent, reinsurance. We utilize a combination of short-term and longer-term derivative instruments to have a laddered maturity of protection and reduce roll-over risk during periods of market disruption or higher volatility.
However, our hedging strategy may not be fully effective. In connection with our exposure risk management program, we may determine to seek the approval of applicable regulatory authorities to permit us to increase our hedge limits consistent with those contemplated by the program. No assurance can be given that any of our requested approvals will be obtained, and, even if obtained, any such approvals may be subject to qualifications, limitations or conditions. If our capital is depleted in the event of persistent market downturns, we may need to replenish it by contributing additional capital, which we may have allocated for other uses, or purchase additional or more expensive hedging protection. Under our hedging strategy, period-to-period changes in the valuation of our hedges relative to the guarantee liabilities may result in significant volatility in certain of our profitability measures, which in certain circumstances could be more significant than has been the case historically.
In addition, hedging instruments we enter into may not effectively offset the costs of the guarantees within certain of our annuity products or may otherwise be insufficient in relation to our obligations. For example, in the event that derivative counterparties or central clearinghouses are unable or unwilling to pay, we remain liable for the guaranteed benefits. Furthermore, we are subject to the risk that changes in policyholder behavior or mortality, combined with adverse market events, could produce economic losses not addressed by the risk management techniques employed.
36
Finally, the cost of our hedging program may be greater than anticipated because adverse market conditions can limit the availability, and increase the costs of, the derivatives we intend to employ, and such costs may not be recovered in the pricing of the underlying products we offer.
The above factors, individually or in the aggregate, could have a material adverse effect on our financial condition and results of operations and our profitability measures, as well as materially impact our capitalization, our statutory free cash flow, our ability to receive dividends from our insurance subsidiaries and BRCD as well as our liquidity. This could in turn impact our RBC ratios and our financial strength ratings, which are necessary to support our product sales, and, in certain circumstances, ultimately impact our solvency. See “Business — Segments and Corporate & Other — Annuities — Products — Variable Annuities” for further consideration of the risks associated with guaranteed benefits, as well as “Management’s Discussion and Analysis of Financial Condition and Results of Operations — Risk Management Strategies — Variable Annuity Exposure Risk Management.”
Our analyses of scenarios and sensitivities that we may utilize in connection with our variable annuity risk management strategies may involve significant estimates based on assumptions and may, therefore, result in material differences between actual outcomes and the sensitivities calculated under such scenarios
As part of our variable annuity exposure risk management program, we estimate the impact of various market factors under certain scenarios on our variable annuity statutory free cash flow, our reserves, or our capital (collectively, the “market sensitivities”).
Any such market sensitivities may use inputs that are difficult to approximate and could include estimates that may differ materially from actual results. Any such estimates, or the absence thereof, may, among other things, be associated with: (i) basis returns related to equity or fixed income indices; (ii) actuarial assumptions related to policyholder behavior and life expectancy; and (iii) management actions that may occur in response to developing facts, circumstances and experience for which no estimates are made in any market sensitivities. Any such estimates, or the absence thereof, may produce sensitivities that could differ materially from actual outcomes and may, therefore, influence our actions in connection with our exposure risk management program.
The actual effect of changes in equity markets and interest rates on the assets supporting our variable annuity contracts and corresponding liabilities may vary materially from the estimated market sensitivities due to a number of factors which may include, but are not limited to: (i) changes in our hedging program; (ii) actual policyholder behavior being different from our assumptions; and (iii) underlying fund performance being different from our assumptions. In addition, any market sensitivities are valid only as of a particular date and may not factor in the possibility of simultaneous shocks to equity markets, interest rates and market volatility. Furthermore, any market sensitivities could illustrate the estimated impact of the indicated shocks occurring instantaneously, and, therefore, may not give effect to rebalancing over the course of the shock event. The estimates of equity market shocks may reflect a shock of the same magnitude to both domestic and global equity markets, while the estimates of interest rate shocks may reflect a shock to rates at all durations (a parallel shift in the yield curve). Any such instantaneous or equilateral impact assumptions may result in estimated sensitivities that could differ materially from the actual impacts.
Finally, no assurances can be given that the assumptions underlying any market sensitivities can or will be realized. Our liquidity, statutory capitalization, financial condition and results of operations could be affected by a broad range of capital markets scenarios, which, if they adversely affect account values, could materially affect our statutory free cash flow and our reserving requirements, and by extension, could materially affect the accuracy of estimates used in any market sensitivities.
We may not have sufficient assets to meet our future ULSG policyholder obligations, and changes in interest rates may result in net income volatility
The primary market risk associated with our ULSG block is the uncertainty around the future levels of U.S. interest rates and bond yields. To help ensure we have sufficient assets to meet future ULSG policyholder obligations, we have employed an actuarial approach based upon Statutory Cash Flow Testing (“ULSG CFT”) to set our ULSG asset requirement target for BRCD, which reinsures the majority of the ULSG business written by certain of our insurance subsidiaries. For the business retained by our insurance subsidiaries, we set our ULSG asset requirement target to equal the actuarially determined statutory reserves, which, taken together with our ULSG asset requirement target for BRCD, comprises our total ULSG asset requirement target (“ULSG Target”). Under the ULSG CFT approach, we assume that interest rates remain flat or lower than current levels, and our actuarial assumptions include a provision for adverse deviation. These underlying assumptions used in ULSG CFT include scenarios that are more conservative than those required under GAAP, which assumes a long-term mean reversion of interest rates and best estimate actuarial assumptions without additional provisions for adverse deviation.
37
We seek to mitigate exposure to interest rate risk associated with these liabilities by holding invested assets and interest rate derivatives to closely match our ULSG Target in different interest rate environments.
Our ULSG Target is sensitive to the actual and future expected level of long-term U.S. interest rates. If interest rates fall, our ULSG Target will likely increase, and conversely, if interest rates rise, our ULSG Target will likely decline. As part of our interest rate hedging program, we use interest rate swaps, swaptions and interest rate forwards to protect our statutory capitalization from increases in the ULSG Target in lower interest rate environments. This risk mitigation strategy may negatively impact our GAAP stockholders’ equity and net income when interest rates rise and our ULSG Target likely declines, since our reported ULSG liabilities under GAAP are largely insensitive to actual fluctuations in interest rates. The ULSG liabilities under GAAP reflect changes in interest rates only when we revise our long-term assumptions due to sustained changes in the market interest rates, such as when we increased our mean reversion rate from 3.50% to 3.75% in the third quarter of 2023 following our AAR.
Our interest rate derivative instruments may not effectively offset the costs of our ULSG policyholder obligations or may otherwise be insufficient. In addition, this risk mitigation strategy may fail to adequately cover a scenario under which our obligations are higher than projected and may be required to sell investments to cover these increased obligations. If our liquid investments are depleted, we may need to sell higher-yielding, less liquid assets or take other actions, including utilizing contingent liquidity sources or raising capital. The above factors, individually or in the aggregate, could have a material adverse effect on our financial condition and results of operations, or our profitability measures, as well as materially impact our capitalization, our statutory free cash flow, our ability to receive dividends from our insurance subsidiaries and BRCD and our liquidity. This could in turn impact our RBC ratios and our financial strength ratings, which are necessary to support our product sales, and in certain circumstances could ultimately impact our solvency. See “Management’s Discussion and Analysis of Financial Condition and Results of Operations — Risk Management Strategies — ULSG Market Risk Exposure Management.”
Changes in accounting standards issued by the Financial Accounting Standards Board may adversely affect our financial statements
Our financial statements are subject to the application of GAAP, which is periodically revised by the Financial Accounting Standards Board (“FASB”). Accordingly, from time to time, we are required to adopt new or revised accounting standards or interpretations issued by the FASB. For example, the FASB issued an accounting standards update that resulted in significant changes to the accounting for long-duration insurance contracts (“LDTI”), which became effective on January 1, 2023. The adoption of LDTI had a significant impact on our financial statements, including total stockholders’ equity. The impact of accounting pronouncements that have been issued but not yet implemented is disclosed in our reports filed with the SEC. The required adoption of future accounting standards could adversely affect our financial statements. See Note 1 of the Notes to the Consolidated Financial Statements.
A downgrade or a potential downgrade in our financial strength or credit ratings could result in a loss of business and materially adversely affect our financial condition and results of operations
Downgrades in our financial strength ratings or credit ratings or changes to our ratings outlooks could have a material adverse effect on our financial condition and results of operations in many ways, including:
•reducing new sales of insurance products and annuity products;
•losing existing distributors or negatively impacting our ability to establish relationships with new distributors;
•adversely affecting our relationships with independent sales intermediaries;
•increasing the number or amount of policy surrenders and withdrawals by contract holders and policyholders;
•requiring us to reduce prices for many of our products and services to remain competitive;
•providing termination rights for the benefit of our derivative instrument counterparties;
•providing termination rights to cedents under assumed reinsurance contracts;
•adversely affecting our ability to obtain reinsurance at reasonable prices, if at all;
•subjecting us to potentially increased regulatory scrutiny;
•limiting our access to capital markets or other contingent funding sources; and
•increasing our cost of capital, which could adversely affect our liquidity.
38
Credit rating agencies may continue to review and adjust their ratings for the companies that they rate, including us. The credit rating agencies also evaluate the insurance industry as a whole and may change our credit rating based on their overall view of our industry. See “Management’s Discussion and Analysis of Financial Condition and Results of Operations — Liquidity and Capital Resources — The Company — Rating Agencies” for additional information regarding our financial strength ratings and credit ratings, including current ratings and outlooks.
Our indebtedness and the degree to which we are leveraged could cause a material adverse effect on our financial condition and results of operations
We had $3.2 billion of total long-term consolidated indebtedness outstanding at December 31, 2023, consisting of debt securities issued to investors. We are required to service this indebtedness with cash at BHF and with dividends and other intercompany cash flows from our subsidiaries. The funds needed to service our indebtedness, as well as to make required dividend payments on our outstanding preferred stock, may not be available to meet any short-term liquidity needs we may have, to invest in our business, to pay any potential dividends on our common stock or to carry out any share or debt repurchases that we may undertake.
Overall, our ability to generate cash is subject to general economic, financial market, competitive, legislative, regulatory, client behavior-related and other factors that are beyond our control. We may not generate sufficient funds to service our indebtedness and meet our business needs, such as funding working capital or the expansion of our operations. In addition, our leverage could put us at a competitive disadvantage compared to our competitors that are less leveraged. Our leverage could also impede our ability to withstand downturns in our industry or the economy, in general, or lead to actions by rating agencies. See “— A downgrade or a potential downgrade in our financial strength or credit ratings could result in a loss of business and materially adversely affect our financial condition and results of operations.” See also “Management’s Discussion and Analysis of Financial Condition and Results of Operations — Liquidity and Capital Resources — The Company — Primary Sources of Liquidity and Capital” for more details about our indebtedness. Limitations on our operations and use of funds resulting from our indebtedness could have a material adverse effect on our financial condition and results of operations.
Our failure to comply with the agreements relating to our outstanding indebtedness, including as a result of events beyond our control, could result in an event of default that could materially and adversely affect our business, financial condition, results of operations or cash flows
If there were an event of default under any of the agreements governing our outstanding indebtedness, we may not be able to incur additional indebtedness and the holders of the defaulted indebtedness could cause all amounts outstanding with respect to that indebtedness to be due and payable immediately.
Our $1.0 billion senior unsecured revolving credit facility maturing April 15, 2027 (the “Revolving Credit Facility”) and our reinsurance financing arrangement contain certain administrative, reporting, legal and financial covenants, including, in the case of the Revolving Credit Facility, requirements to maintain a specified minimum consolidated net worth and to maintain a ratio of indebtedness to total capitalization not in excess of a specified percentage, as well as limitations on the dollar amount of indebtedness that may be incurred by our subsidiaries. Such covenants could restrict our operations and use of funds. See “Management’s Discussion and Analysis of Financial Condition and Results of Operations — Liquidity and Capital Resources — The Company.” Failure to comply with such covenants or the conditions to borrowings, as well as the failure of lenders to fund their lending commitments in the amounts provided for under the terms of the Revolving Credit Facility or our reinsurance financing arrangement (whether due to insolvency, illiquidity or other reasons), would restrict our ability to access the Revolving Credit Facility and our reinsurance financing arrangement when needed and, consequently, could have a material adverse effect on our financial condition, results of operations and liquidity. See “Management’s Discussion and Analysis of Financial Condition and Results of Operations — Liquidity and Capital Resources — The Company — Primary Sources of Liquidity and Capital — Credit and Committed Facilities” for a discussion of our credit facilities and committed facilities, including the Revolving Credit Facility.
Our ability to make payments on and to refinance our existing indebtedness, as well as any future indebtedness that we may incur, will depend on our ability to generate cash in the future from operations, financings or asset sales. Our ability to generate cash to meet our debt obligations in the future is sensitive to capital markets returns, primarily due to our variable annuity business. Overall, our ability to generate cash is subject to general economic, financial market, competitive, legislative, regulatory, client behavior-related, and other factors that are beyond our control.
The lenders holding our indebtedness could also accelerate amounts due in the event that we default, which could potentially trigger a default or acceleration of the maturity of our other indebtedness. There can be no assurances that our assets or cash flow would be sufficient to fully repay borrowings under our outstanding debt instruments if accelerated upon an event of default. Any failure to do so could, in turn, have a material adverse effect on our ability to continue to operate as a
39
going concern. If we are not able to repay or refinance our indebtedness as it becomes due, we may be forced to take disadvantageous actions, including significant business and legal entity restructuring, limited new business investment, selling assets or dedicating an unsustainable level of our cash flow from operations to the payment of principal and interest on our indebtedness, or any combination of such actions. In addition, our ability to withstand competitive pressures and to react to changes in the insurance industry could be impaired. Further, if we are unable to repay, refinance or restructure our secured indebtedness, the holders of such indebtedness could proceed against any collateral securing that indebtedness.
Reinsurance may not be available, affordable or adequate to protect us against losses
As part of our overall risk management strategy, our insurance subsidiaries purchase reinsurance from third-party reinsurers for certain risks we underwrite. While reinsurance agreements generally bind the reinsurer for the life of the business reinsured at generally fixed pricing, market conditions beyond our control determine the availability and cost of the reinsurance protection for new business. The premium rates and other fees that we charge for our products are based, in part, on the assumption that reinsurance will be available at a certain cost. Some of our reinsurance contracts contain provisions that limit the reinsurer’s ability to increase rates on in-force business; however, some do not. We have faced a number of rate increase actions on in-force business in recent years and may face additional increases in the future. There can be no assurance that the outcome of any future rate increase actions would not have a material effect on our financial condition and results of operations. If a reinsurer raises the rates that it charges on a block of in-force business, in some instances, we will not be able to pass the increased costs on to our customers and our profitability will be negatively impacted as a result. Additionally, such a rate increase could result in our recapturing the reinsured business, which would result in a need to maintain additional reserves, reduce reinsurance receivables and expose us to greater risks. Accordingly, we may be forced to incur additional expenses for reinsurance or may not be able to obtain sufficient reinsurance on acceptable terms, which could adversely affect our ability to write future business or result in an increase in the amount of risk that we retain with respect to those policies we issue. See “Business — Reinsurance Activity.”
If the counterparties to our reinsurance or indemnification arrangements or to the derivatives we use to hedge our business risks default or fail to perform, we may be exposed to risks we had sought to mitigate, which could materially adversely affect our financial condition and results of operations
We use reinsurance, indemnification and derivatives to mitigate our risks in various circumstances. In general, reinsurance, indemnification and derivatives do not relieve us of our direct liability to our policyholders, even when a third party is liable to us. Accordingly, we bear credit risk with respect to our reinsurers, indemnitors, counterparties and central clearinghouses. A reinsurer’s, indemnitor’s, counterparty’s or central clearinghouse’s insolvency, inability or unwillingness to make payments under the terms of reinsurance agreements, indemnity agreements or derivative agreements with us or inability or unwillingness to return collateral could have a material adverse effect on our financial condition and results of operations.
We cede a large block of long-term care insurance business to certain affiliates of Genworth, which results in a significant concentration of reinsurance risk. The Genworth reinsurers’ obligations to us are secured by trust accounts and Citigroup has agreed to indemnify us for losses and certain other payment obligations we might incur with respect to this business. Notwithstanding these arrangements, if the Genworth reinsurers become insolvent and the amounts in the trust accounts are insufficient to pay their obligations to us, it could have a material adverse effect on our financial condition and results of operations. See “Business — Reinsurance Activity — Unaffiliated Third-Party Reinsurance.”
In addition, we use derivatives to hedge various business risks. We enter into a variety of OTC-bilateral and OTC-cleared derivatives, including options, forwards, interest rate, credit default and currency swaps. See “Management’s Discussion and Analysis of Financial Condition and Results of Operations — Derivatives.” If our counterparties, clearing brokers or central clearinghouses fail or refuse to honor their obligations under these derivatives, our hedges of the related risk will be ineffective. Such failure could have a material adverse effect on our financial condition and results of operations.
We may not be able to take credit for reinsurance, our statutory life insurance reinsurance financings may be subject to cost increases and new financings may be subject to limited market capacity
We currently utilize reinsurance and capital markets solutions to mitigate the capital impact of the statutory reserve requirements for several of our products, including, but not limited to, our level premium term life products subject to Regulation XXX and ULSG subject to Guideline AXXX. Our primary solution involves BRCD, our reinsurance subsidiary. See “Business — Reinsurance Activity — Affiliated Reinsurance.” BRCD obtained statutory reinsurance financing through a funding structure involving a single financing arrangement supported by a pool of highly rated third-party reinsurers. In connection with this financing arrangement, BRCD, with the explicit permission of the Delaware Commissioner, has included the value of credit-linked notes as admitted assets. See Notes 12 and 13 of the Notes to the Consolidated Financial
40
Statements for a description of the financing arrangement and this associated permitted practice. The financing facility matures in 2039, and we may therefore need to refinance this facility in the future.
The NAIC adopted AG 48, which regulates the terms of captive insurer arrangements that are entered into or amended in certain ways after December 31, 2014. See “Business — Regulation — Insurance Regulation — Captive Reinsurer Regulation.” There can be no assurance that, in light of AG 48, future rules and regulations, or changes in interpretations by state insurance departments, we will be able to continue to efficiently implement these arrangements, nor can there be assurances that future capacity for these arrangements will be available in the marketplace. To the extent we cannot continue to efficiently implement these arrangements, our statutory capitalization, financial condition and results of operations, as well as our competitiveness, could be adversely affected.
Factors affecting our competitiveness may adversely affect our market share and profitability
We believe competition among insurance companies is based on a number of factors, including service, product features, scale, price, actual or perceived financial strength, claims-paying ratings, credit ratings, e-business capabilities and name recognition. We face intense competition from a large number of other insurance companies, as well as non-insurance financial services companies (e.g., banks, private equity firms, broker-dealers and asset managers). In addition, certain of our distributors also currently offer their own competing products or may offer competing products in the future. Some of our competitors offer a broader array of products, have more competitive pricing or, with respect to other insurance companies, have higher claims-paying ability and financial strength ratings. Some may also have greater financial resources with which to compete. In some circumstances, national banks that sell annuity products of life insurers may also have a pre-existing customer base for financial services products. These competitive pressures may adversely affect the persistency of our products, as well as our ability to sell our products in the future. In addition, new and disruptive technologies may present competitive risks. If, as a result of competitive factors or otherwise, we are unable to generate a sufficient return on insurance policies and annuity products we sell in the future, we may stop selling such policies and products, which could have a material adverse effect on our financial condition and results of operations. See “Business — Competition.”
We have limited control over many of our costs. For example, we have limited control over the cost of unaffiliated third-party reinsurance, the cost of meeting changing regulatory requirements, and our cost to access capital or financing. There can be no assurance that we will be able to achieve or maintain a cost advantage over our competitors. If our cost structure increases and we are not able to achieve or maintain a cost advantage over our competitors, it could have a material adverse effect on our ability to execute our strategy, as well as on our financial condition and results of operations. If we hold substantially more capital than is needed to support credit ratings that are commensurate with our business strategy, over time, our competitive position could be adversely affected.
In addition, the highly regulated nature of our business, as well as the legislative or other changes affecting the regulatory environment for our business, may, over time, affect our competitive position within the annuities and life insurance industry, and within the broader financial services industry. See “— Regulatory and Legal Risks” and “Business — Regulation.”
We may experience difficulty in marketing and distributing products through our distribution channels
We distribute our products through a variety of third-party distribution channels. Our agreements with our third-party distributors may be terminated by either party with or without cause. We may periodically renegotiate the terms of these agreements, and there can be no assurance that such terms will remain acceptable to us or such third parties. If we are unable to maintain our relationships, our sales of individual insurance, annuities and investment products could decline, and our financial condition and results of operations could be materially adversely affected. Our distributors may elect to suspend, alter, reduce or terminate their distribution relationships with us for various reasons, including changes in our distribution strategy, adverse developments in our business, adverse rating agency actions, or concerns about market-related risks. We are also at risk that key distribution partners may merge, consolidate, change their business models in ways that affect how our products are sold, or terminate their distribution contracts with us, or that new distribution channels could emerge in the marketplace, any of which could adversely impact the effectiveness of our distribution efforts. Also, if we are unsuccessful in attracting and retaining key internal associates who conduct our business, including wholesalers, our sales could decline.
An interruption or significant change in certain key relationships could materially affect our ability to market our products and could have a material adverse effect on our financial condition and results of operations. In addition, we rely on a core number of our distributors to produce the majority of our sales. If one or more such distributors were to terminate its relationship with us or reduce the amount of sales which it produces for us, our results of operations could be adversely affected. An increase in bank and broker-dealer consolidation activity could increase competition for access to distributors, result in greater distribution expenses and impair our ability to market products through these channels. Consolidation of distributors or other industry changes may also increase the likelihood that distributors will try to renegotiate the terms of any existing selling agreements to terms less favorable to us.
41
Because our products are distributed through unaffiliated firms, we may not be able to monitor or control the manner of their distribution despite our training and compliance programs. If our products are distributed by such firms in an inappropriate manner, or to customers for whom such products are not in the best interest, we may suffer reputational and other harm to our business.
We compete with major, well-established stock and mutual life insurance companies and non-insurance financial services companies (e.g., banks, private equity firms, broker-dealers and asset managers) in all of our product offerings, and our distributors sell such competitors’ products along with our products. In addition, certain of our distributors currently offer their own competing products or may offer competing products in the future. If our distributors concentrate their efforts in selling their firm’s own products or our other competitors’ products instead of ours, our sales could be adversely impacted.
The failure of third parties to provide various services to us, or any failure of the practices and procedures that these third parties use to provide services to us, could have a material adverse effect on our business
A key part of our operating strategy is to leverage third parties to deliver certain services important to our business, including administrative, operational, technology, financial, investment and actuarial services. There can be no assurance that the services provided to us by third parties (or their suppliers, vendors or subcontractors) will be sufficient to meet our operational and business needs, that such third parties will continue to be able to perform their functions in a manner satisfactory to us, that the practices and procedures of such third parties will continue to enable them to adequately manage any processes they handle on our behalf, or that any remedies available under these third-party arrangements will be sufficient in the event of a dispute or nonperformance. In addition, as we transition to new third-party service providers and convert certain administrative systems or platforms, certain issues have occurred in the past and may arise again in the future. There can be no assurance that in connection with any such conversions, transitions to new third-party service providers, or in connection with any of the services provided to us by third parties (or such third-party’s supplier, vendor or subcontractor), we will not incur unanticipated expenses or experience other economic or reputational harm, service delays or interruptions, or be subject to litigation or regulatory investigations and actions, any of which could have a material adverse effect on our business and financial results.
Furthermore, if a third-party provider (or such third-party’s supplier, vendor or subcontractor) fails to meet contractual requirements (e.g., compliance with applicable laws and regulations or fails to provide material information on a timely basis), fails to provide required services due to the loss of key personnel or otherwise, or suffers a cyberattack or other security breach, then, in each case, we could suffer economic and reputational harm that could have a material adverse effect on our business and financial reporting. In addition, such failures could result in the loss of key distributors, impact the accuracy of our financial reporting, or subject us to litigation or regulatory investigations and actions, which could have a material adverse effect on our business, financial condition and results of operations. See “— Risks Related to Our Business — We may experience difficulty in marketing and distributing products through our distribution channels” and “— Operational Risks — Any failure in cyber- or other information security systems, as well as the occurrence of events unanticipated in Brighthouse Financial’s or our third-party service providers’ disaster recovery systems and business continuity planning could result in a loss or disclosure of confidential information, damage to our reputation and impairment of our ability to conduct business effectively.”
Similarly, if any third-party provider (or such third-party’s supplier, vendor or subcontractor) experiences any deficiency in internal controls, determines that its practices and procedures used in providing services to us (including administering any of our policies or managing any of our investments) require review, or otherwise fails to provide services to us in accordance with appropriate standards, we could incur expenses and experience other adverse effects as a result. In such situations, we may be unable to resolve any issues on our own without assistance from the third-party provider, and we could have limited ability to influence the speed and effectiveness of that resolution.
In addition, from time to time, certain third parties have brought to our attention practices, procedures and reserves with respect to certain products they administer on our behalf that require further review. While we do not believe, based on the information made available to us to date, that any of the matters brought to our attention will require material modifications to reserves or will have a material effect on our business and financial reporting, we are reliant on our third-party service providers to provide further information and assistance with respect to those products. There can also be no assurance that such matters will not require material modifications to reserves or have a material effect on our financial condition or results of operations in the future, or that our third-party service providers will provide further information and assistance.
It may be difficult, disruptive and costly for us to replace some of our third-party providers in a timely manner if in the future they were unwilling or unable to provide us with the services we require (as a result of their financial or business conditions or otherwise), which could have a material adverse effect on our business and financial results. In addition, if a
42
third-party provider raises the rates that it charges us for its services, we may not be able to pass the increased costs onto our customers and our profitability may be negatively impacted as a result.
Changes in our deferred income tax assets or liabilities, including changes in our ability to realize our deferred income tax assets, could adversely affect our financial condition or results of operations
Deferred income tax represents the tax effect of the differences between the book and tax bases of assets and liabilities. Deferred income tax assets are assessed periodically by management to determine whether they are realizable. Factors in management’s determination include the performance of the business, including the ability to generate future taxable income. If, based on available information, it is more likely than not that the deferred income tax asset will not be realized, then a valuation allowance must be established with a corresponding charge to our profitability measures. Such charges could have a material adverse effect on our financial condition and results of operations. Changes in the statutory tax rate or other tax law changes could also affect the value of our deferred income tax assets and may require a write-off of some of those assets. See “Management’s Discussion and Analysis of Financial Condition and Results of Operations — Summary of Critical Accounting Estimates.”
As a holding company, BHF depends on the ability of its subsidiaries to pay dividends
BHF is a holding company for its insurance subsidiaries and BRCD and does not have any significant operations of its own. We depend on the cash at the holding company as well as dividends or other capital inflows from our subsidiaries to meet our obligations and to pay dividends on our preferred and common stock, if any. See “Management’s Discussion and Analysis of Financial Condition and Results of Operations — Liquidity and Capital Resources — The Parent Company — Liquidity and Capital — Statutory Capital and Dividends.”
If the cash BHF receives from its subsidiaries is insufficient for it to fund its debt-service and other holding company obligations, BHF may be required to raise capital through the incurrence of indebtedness, the issuance of additional equity or the sale of assets. Our ability to access funds through such methods is subject to prevailing market conditions and there can be no assurance that we will be able to do so. See “— Economic Environment and Capital Markets-Related Risks — Adverse capital and credit market conditions may significantly affect our ability to meet liquidity needs and our access to capital.”
The payment of dividends and other distributions by our insurance subsidiaries is regulated by insurance laws and regulations. In general, dividends in excess of prescribed limits require insurance regulatory approval. In addition, insurance regulators may prohibit the payment of dividends or other payments by our insurance subsidiaries if they determine that the payment could be adverse to the interests of our policyholders or contract holders. Any requested payment of dividends by our insurance subsidiaries in excess of their respective ordinary dividend capacity would be considered an extraordinary dividend subject to prior approval by the Delaware DOI, the Massachusetts Division of Insurance, or the NYDFS, as applicable. Any payment of dividends by Brighthouse Life Insurance Company in 2024 would be considered an extraordinary dividend subject to regulatory approval. See Note 13 of the Notes to the Consolidated Financial Statements for a discussion of the applicable dividend restrictions and certain of our subsidiaries’ ordinary dividend capacity, as well as the circumstances under which regulatory approval would be required. Furthermore, any dividends by BRCD are subject to the approval of the Delaware DOI. The payment of dividends and other distributions by our insurance subsidiaries is also influenced by business conditions, including those described in the Risk Factors above as well as rating agency considerations. There can be no assurance that any regulatory approval described herein will be received. See “— Regulatory and Legal Risks — A decrease in the RBC ratio of our insurance subsidiaries (as a result of a reduction in statutory capital and surplus or an increase in the required RBC capital charges), or a change in the rating agency proprietary capital models for our insurance subsidiaries, could result in increased scrutiny by insurance regulators and rating agencies and could have a material adverse effect on our financial condition and results of operations.” See also “Business — Regulation — Insurance Regulation” and “Management’s Discussion and Analysis of Financial Condition and Results of Operations — Liquidity and Capital Resources — The Parent Company — Liquidity and Capital — Statutory Capital and Dividends.”
Risks associated with climate change could adversely affect our business, financial condition and results of operations.
Climate change could pose a systemic risk to the global financial system. Climate change could increase the frequency and severity of weather-related disasters and pandemics. Efforts to reduce greenhouse gas emissions and limit global warming could impact global investment asset valuations. There is also a risk that some asset sectors could face significantly higher costs and a disorderly adjustment to asset values leading to an adverse impact on the value and future performance of investment assets as a result of climate change or regulatory or other responses. Climate change could also impact our counterparties and other third parties, including, among others, reinsurers and derivative counterparties. Increasing scrutiny and evolving expectations from investors, customers, regulators, and other stakeholders regarding climate change matters may adversely affect our reputation. The above risks could adversely affect our business, financial condition and results of operations.
43
Public health crises, extreme mortality events or similar occurrences may adversely impact our business, financial condition, or results of operations, as well as the economy in general
Public health crises, extreme mortality events or other similar occurrences could have a major impact on the global economy and the financial markets or the economies of particular countries or regions, including market volatility and disruptions to commerce, the health system, and the food supply, as well as reduced economic activity and labor shortages. In addition, a public health crisis that affected our employees or the employees of our distributors or of other companies with which we do business, including providers of third-party services, could disrupt our business operations. Furthermore, the value of our investment portfolio could be negatively impacted. See “— Risks Related to Our Investment Portfolio — Ongoing military actions, the continued threat of terrorism, climate change as well as other catastrophic events may adversely affect the value of our investment portfolio and the level of claim losses we incur.”
Economic uncertainty resulting from a public health crisis or similar event could impact sales of certain of our products, and we may decide or otherwise be required to provide relief to customers adversely affected by such an event, similar to the relief we provided in connection with the COVID-19 pandemic.
In addition, our life insurance operations are exposed to the risk of catastrophic mortality, such as a pandemic or other event that causes a large number of deaths. For example, the COVID-19 pandemic and several significant influenza pandemics have occurred in the last century. The likelihood, timing, and severity of a future pandemic that may impact our policyholders cannot be predicted. Moreover, the impact of climate change could cause changes in the frequency or severity of outbreaks of certain diseases. Circumstances resulting from a public health crisis or similar event could affect the incidence of claims, utilization of benefits, lapses or surrenders of policies and payments on insurance premiums, any of which could impact the revenues and expenses associated with our products.
Consistent with industry practice and accounting standards, we establish liabilities for claims arising from a catastrophe only after assessing the probable losses arising from the event. We cannot be certain that the liabilities we have established will be adequate to cover actual claim liabilities. A catastrophic event or multiple catastrophic events could have a material adverse effect on our business, financial condition and results of operations. Conversely, improvements in medical care and other developments which positively affect life expectancy can cause our assumptions with respect to longevity, which we use when we price our products, to become incorrect and, accordingly, can adversely affect our financial condition and results of operations.
We could face difficulties, unforeseen liabilities, asset impairments or rating actions arising from business acquisitions or dispositions
We may engage in dispositions or acquisitions of businesses. Such activity exposes us to a number of risks arising from (i) potential difficulties achieving projected financial results, including the costs and benefits of integration or deconsolidation; (ii) unforeseen liabilities or asset impairments; (iii) the scope and duration of rights to indemnification for losses; (iv) the use of capital which could be used for other purposes; (v) rating agency reactions; (vi) regulatory requirements that could impact our operations or capital requirements; (vii) changes in statutory accounting principles or GAAP, practices or policies; and (viii) certain other risks specifically arising from activities relating to a legal entity reorganization.
Our ability to achieve certain financial benefits we anticipate from any acquisitions of businesses will depend, in part, upon our ability to successfully integrate such businesses in an efficient and effective manner. There may be liabilities or asset impairments that we fail, or are unable, to discover in the course of performing acquisition-related due diligence reviews. Furthermore, even for obligations and liabilities that we do discover during the due diligence process, neither the valuation adjustment nor the contractual protections we negotiate may be sufficient to fully protect us from losses.
We may from time to time dispose of business or blocks of in-force business through outright sales, reinsurance transactions or by alternate means. After a disposition, we may remain liable to the acquirer or to third parties for certain losses or costs arising from the divested business or on other bases. We also may not realize the anticipated profit on a disposition or incur a loss on the disposition. In anticipation of any disposition, we may need to restructure our operations, which could disrupt such operations and affect our ability to recruit key personnel needed to operate and grow such business pending the completion of such transaction. In addition, the actions of key employees of the business to be divested could adversely affect the success of such disposition as they may be more focused on obtaining employment, or the terms of their employment, than on maximizing the value of the business to be divested. Furthermore, transition services or tax arrangements related to any such disposition could further disrupt our operations and may impose restrictions, liabilities, losses or indemnification obligations on us. Depending on its particulars, a disposition could increase our exposure to certain risks, such as by decreasing the diversification of our sources of revenue. Moreover, we may be unable to timely dissolve all contractual relationships with the divested business in the course of the proposed transaction, which may materially adversely affect our ability to realize value from the disposition. Such disposition could also adversely affect our internal controls and
44
procedures and impair our relationships with key customers, distributors and suppliers. An interruption or significant change in certain key relationships could materially affect our ability to market our products and could have a material adverse effect on our business, financial condition and results of operations.
Increasing scrutiny and evolving expectations from investors, customers, regulators and other stakeholders regarding environmental, social and governance matters may adversely affect our reputation or otherwise adversely impact our business and results of operations
There is increasing scrutiny and evolving expectations from investors, customers, regulators and other stakeholders on environmental, social and governance (“ESG”) practices and disclosures, including those related to environmental stewardship, climate change, diversity, equity and inclusion, racial justice and workplace conduct. Regulators have imposed and likely will continue to impose ESG-related rules and guidance, which may conflict with one another and impose additional costs on us or expose us to new or additional risks. In view of evolving regulatory expectations, growing investor interest, and changing consumer preferences and social expectations, ESG issues can represent emerging or unforeseen risks to our long-term operating performance and financial condition. Moreover, certain organizations that provide information to investors have developed ratings for evaluating companies on their approach to different ESG matters, and unfavorable ratings of the Company or our industry may lead to negative investor sentiment and the diversion of investment to other companies or industries.
Economic Environment and Capital Markets-Related Risks
If difficult conditions in the capital markets and the U.S. economy generally persist or are perceived to persist, they may materially adversely affect our business and results of operations
Our business and results of operations are materially affected by conditions in the capital markets and the U.S. economy generally, as well as by the global economy to the extent it affects the U.S. economy. In addition, while our operations are entirely in the U.S., we have foreign investments in our general and separate accounts and, accordingly, conditions in the global capital markets can affect the value of our general account and separate account assets, as well as our financial results. Actual or perceived stressed conditions, volatility and disruptions in financial asset classes or various capital markets can have an adverse effect on us, both because we have a large and well-diversified investment portfolio and our benefit and claim liabilities are sensitive to changing market factors, including interest rates, credit spreads, equity and commodity prices, derivative prices and availability, real estate markets, foreign currency exchange rates and the returns and volatility of capital markets. In an economic downturn characterized by rapid increases in inflation, higher unemployment, lower family income, lower corporate earnings, lower business investment or lower consumer spending, the demand for our products could be adversely affected as customers are unwilling or unable to purchase them. In addition, we may experience an elevated incidence of claims, adverse utilization of benefits relative to our best estimate expectations and lapses or surrenders of policies. Furthermore, our policyholders may choose to defer paying insurance premiums or stop paying insurance premiums altogether. Such adverse changes in the economy could negatively affect our earnings and capitalization and have a material adverse effect on our financial condition, results of operations and our ability to receive dividends from our insurance subsidiaries and BRCD. In addition, adverse economic conditions could have a material impact on our investment portfolio.
Significant market volatility in reaction to geopolitical risks, changing monetary policy, trade disputes and uncertain fiscal policy may exacerbate some of the risks we face. Increased market volatility may affect the performance of the various asset classes in which we invest, as well as separate account values. See “Management’s Discussion and Analysis of Financial Condition and Results of Operations — Investments — Current Environment” and “Management’s Discussion and Analysis of Financial Condition and Results of Operations — Industry Trends and Uncertainties — Financial and Economic Environment.”
Extreme declines or shocks in equity markets, as well as sustained stagnation and persistent low interest rates, could cause us to incur significant capital or operating losses due to, among other reasons, the impact of guarantees related to our annuity products, including increases in liabilities, increased capital requirements, or collateral requirements. Furthermore, periods of sustained stagnation in equity and bond markets, which are characterized by multiple years of low annualized total returns impacting the growth in separate accounts or low level of U.S. interest rates, may materially increase our insurance contract liabilities due to inherent market return guarantees in these liabilities. Similarly, sustained periods of low interest rates and risk asset returns could reduce income from our investment portfolio, increase our insurance contract liabilities, and increase the cost of risk transfer measures such as hedging, causing our profit margins to erode as a result of reduced investment portfolio income and increased insurance liabilities. See also “— Risks Related to Our Business — Guarantees within certain of our annuity products may decrease our earnings, decrease our capitalization, increase the volatility of our results, result in higher risk management costs and expose us to increased market risk” and “— Risks Related to Our
45
Business — Public health crises, extreme mortality events or similar occurrences may adversely impact our business, financial condition, or results of operations, as well as the economy in general.”
Adverse capital and credit market conditions may significantly affect our ability to meet liquidity needs and our access to capital
The capital and credit markets may be subject to periods of extreme volatility. Disruptions in capital markets could adversely affect our liquidity and credit capacity or limit our access to capital which may in the future be needed to operate our business and meet policyholder obligations.
We need liquidity at our holding company to pay our operating expenses, pay interest on our indebtedness, pay dividends on our preferred stock, carry out any share or debt repurchases that we may undertake, pay any potential dividends on our common stock, provide our subsidiaries with cash or collateral, maintain our securities lending activities and replace certain maturing liabilities. Without sufficient liquidity, we could be forced to curtail our operations and limit the investments necessary to grow our business.
For our insurance subsidiaries, the principal sources of liquidity are insurance premiums and fees paid in connection with annuity products, and cash flow from our investment portfolio to the extent consisting of cash and readily marketable securities.
In the event capital markets or other conditions have an adverse impact on our capital and liquidity, or our stress-testing indicates that such conditions could have an adverse impact beyond expectations and our current resources do not satisfy our needs or regulatory requirements, we may have to seek additional financing to enhance our capital and liquidity position. The availability of additional financing will depend on a variety of factors, such as the then current market conditions, regulatory capital requirements, availability of credit to us and the financial services industry generally, our credit ratings and financial leverage, and the perception of our customers and lenders regarding our long- or short-term financial prospects if we incur large operating or investment losses or if the level of our business activity decreases due to a market downturn. Similarly, our access to funds may be impaired if regulatory authorities or rating agencies take negative actions against us. Our internal sources of liquidity may prove to be insufficient and, in such case, we may not be able to successfully obtain additional financing on favorable terms, or at all.
In addition, our liquidity requirements may change if, among other things, we are required to return significant amounts of cash collateral on short notice under securities lending agreements or other collateral requirements. See “— Risks Related to Our Investment Portfolio — Our investment portfolio is subject to significant financial risks both in the U.S. and global financial markets, including credit risk, interest rate risk, inflation risk, market valuation risk, liquidity risk, real estate risk, derivatives risk, and other factors outside our control, the occurrence of any of which could have a material adverse effect on our financial condition and results of operations.”
Our financial condition, results of operations, cash flows and statutory capital position could be materially adversely affected by disruptions in the financial markets, as such disruptions may limit our ability to replace, in a timely manner, maturing liabilities, satisfy regulatory capital requirements, and access the capital that may be necessary to grow our business. See “— Regulatory and Legal Risks — Our insurance business is highly regulated, and changes in regulation and in supervisory and enforcement policies or interpretations thereof may materially impact our capitalization or cash flows, reduce our profitability and limit our growth.” As a result, we may be forced to delay raising capital, issue different types of securities than we would have otherwise, less effectively deploy such capital, issue shorter tenor securities than we prefer, or bear an unattractive cost of capital, which could decrease our profitability and significantly reduce our financial flexibility.
We are exposed to significant financial and capital markets risks which may adversely affect our financial condition, results of operations and liquidity, and may cause our profitability measures to vary from period-to-period
Economic risks and other factors described below, as well as significant volatility in the markets, individually or collectively, could have a material adverse effect on our financial condition, results of operations, liquidity or cash flows through a change in our insurance liabilities or increases in reserves for future policyholder benefits.
Interest Rate Risk
Some of our current or anticipated future products, principally traditional life, universal life, and fixed index-linked and income annuities, as well as funding agreements and structured settlements, expose us to the risk that changes in interest rates will reduce our investment margin or “net investment spread,” or the difference between the amounts that we are required to pay under the contracts in our general account and the rate of return we earn on general account investments intended to support the obligations under such contracts. Our net investment spread is a key component of our profitability measures.
46
Although reducing interest crediting rates can help offset decreases in net investment spreads on some products, our ability to reduce these rates is limited to the portion of our in-force product portfolio that has adjustable interest crediting rates and could be limited by the actions of our competitors or contractually guaranteed minimum rates and may not match the timing or magnitude of changes in asset yields. As a result, our net investment spread would decrease or potentially become negative, which could have a material adverse effect on our financial condition and results of operations. See “Management’s Discussion and Analysis of Financial Condition and Results of Operations — Policyholder Liabilities.”
An increase in interest rates could result in decreased fee revenue associated with a decline in the value of variable annuity account balances invested in fixed income funds. In addition, during periods of declining interest rates, our return on investments that do not support particular policy obligations may decrease. During periods of sustained lower interest rates, our reserves for policy liabilities may not be sufficient to meet future policy obligations and may need to be strengthened. Accordingly, declining and sustained lower interest rates may materially adversely affect our financial condition and results of operations, our ability to receive dividends from our insurance subsidiaries and BRCD and significantly reduce our profitability. We may therefore have to accept a lower credit spread and lower profitability or face a decline in sales and greater loss of existing contracts and related assets.
In addition, because our interest rate hedging program is primarily a risk mitigation strategy intended to reduce our risk to statutory capitalization and long-term economic exposures from sustained low levels of interest rates, this strategy will likely result in higher net income volatility due to the insensitivity of related ULSG GAAP liabilities to the change in interest rate levels. This strategy may adversely affect our financial condition and results of operations. See “— Risks Related to Our Business — We may not have sufficient assets to meet our future ULSG policyholder obligations, and changes in interest rates may result in net income volatility” and “Management’s Discussion and Analysis of Financial Condition and Results of Operations — Risk Management Strategies — ULSG Market Risk Exposure Management.”
Inflation Risk
Inflation increases expenses (including, among others, for labor and third-party services), potentially putting pressure on profitability in the event that such additional costs cannot be passed through to policyholders. High inflation could also cause a change in consumer sentiment and behavior adversely affecting the sales of certain of our products.
Equity Risk
Our primary equity risk relates to the potential for lower earnings associated with certain of our businesses where fee income is earned based upon the estimated market value of the separate account assets and other assets related to our variable annuity business. Because fees generated by such products are primarily related to the value of the separate account assets and other AUM, a decline in the equity markets could reduce our revenues as a result of the reduction in the value of the investment assets supporting those products and services. We seek to mitigate the impact of such exposure to weak or stagnant equity markets through the use of derivatives, reinsurance and capital management. However, such derivatives and reinsurance may become less available and, if they remain available, their price could materially increase in a period characterized by volatile equity markets. The risk of stagnation in equity market returns cannot be addressed by hedging. See “Business — Segments and Corporate & Other — Annuities — Products — Variable Annuities” for details regarding sensitivity of our variable annuity business to capital markets.
See “— Risks Related to Our Business — Guarantees within certain of our annuity products may decrease our earnings, decrease our capitalization, increase the volatility of our results, result in higher risk management costs and expose us to increased market risk.”
Risks Related to Our Investment Portfolio
Our investment portfolio is subject to significant financial risks both in the U.S. and global financial markets, including credit risk, interest rate risk, inflation risk, market valuation risk, liquidity risk, real estate risk, derivatives risk, and other factors outside our control, the occurrence of any of which could have a material adverse effect on our financial condition and results of operations
Credit Risk
Fixed income securities and mortgage loans represent a significant portion of our investment portfolio. We are also subject to the risk that the issuers or guarantors of the fixed income securities and mortgage loans in our investment portfolio may default on principal and interest payments they owe us. In addition, the underlying collateral within asset-backed securities (“ABS”), including mortgage-backed securities, may default on principal and interest payments causing an adverse change in cash flows. The occurrence of a major economic downturn, acts of corporate malfeasance, widening mortgage or credit spreads, or other events that adversely affect the issuers, guarantors or underlying collateral of these
47
securities and mortgage loans could cause the estimated fair value of our portfolio of fixed income securities and mortgage loans and our earnings to decline and the default rate of the fixed income securities and mortgage loans in our investment portfolio to increase.
Defaults or deteriorating credit of other financial institutions could adversely affect us as we have exposure to many different industries and counterparties, and routinely execute transactions with counterparties in the financial services industry, including brokers and dealers, central clearinghouses, commercial banks, investment banks, hedge funds and investment funds and other financial institutions. Many of these transactions expose us to credit risk in the event of the default of our counterparty. In addition, with respect to secured transactions, our credit risk may be exacerbated when the collateral held by us cannot be realized or is liquidated at prices not sufficient to recover the full amount of the loan or derivative exposure due to us. We also have exposure to these financial institutions in the form of unsecured debt instruments, non-redeemable and redeemable preferred securities, derivatives, joint ventures and equity investments. Any losses or impairments to the carrying value of these investments or other changes could materially and adversely affect our financial condition and results of operations.
Interest Rate Risk
We are exposed to certain risks in a variety of interest rate environments. When interest rates are low, we may be forced to reinvest proceeds from investments that have matured or have been prepaid or sold at lower yields, which will reduce our net investment income. Moreover, borrowers may prepay or redeem the fixed income securities and commercial, agricultural or residential mortgage loans in our investment portfolio with greater frequency in order to borrow at lower market rates, thereby exacerbating this risk.
Increases in interest rates could negatively affect our profitability. In periods of rapidly increasing interest rates, similar to those experienced in 2022, we may not be able to replace, in a timely manner, the investments in our general account with higher-yielding investments needed to fund the higher crediting rates necessary to keep interest rate sensitive products competitive. In addition, as interest rates rise, policy loans, surrenders and withdrawals may increase as policyholders seek investments with higher perceived returns. This process may result in cash outflows requiring that we sell investments at a time when the prices of those investments are adversely affected by the increase in interest rates, which may result in realized investment losses. An increase in interest rates could also have a material adverse effect on the value of our investments, for example, by decreasing the estimated fair values of the fixed income securities and mortgage loans that comprise a significant portion of our investment portfolio.
Inflation Risk
A sustained or material increase in inflation could affect our business in several ways. During inflationary periods, the value of fixed income investments may fall, which could increase realized and unrealized losses. Interest rates have increased and may continue to increase due to central bank policy responses to combat inflation, which may positively impact our business in certain respects, but could also increase the risk of a recession or an equity market downturn and could negatively impact various portions of our business, including our investment portfolio. Prolonged and elevated inflation could adversely affect the financial markets and the economy generally, and dispelling it may require governments to pursue a restrictive fiscal and monetary policy, which could constrain overall economic activity and inhibit revenue growth. See “Management’s Discussion and Analysis of Financial Condition and Results of Operations — Industry Trends and Uncertainties — Financial and Economic Environment” for a discussion of the current impacts of inflation.
Market Valuation Risk
Market valuation risk relates to the variability in the estimated fair value of investments associated with changes in market factors. Our portfolio’s market valuation risks include the following:
•Credit Spread Risk – We are exposed to credit spread risk primarily as a result of market price volatility and investment risk associated with the fluctuation in credit spreads. Widening credit spreads may cause unrealized losses in our investment portfolio and increase losses associated with written credit protection derivatives used in replication transactions. Additionally, an increase in credit spreads relative to U.S. Treasury benchmarks can also adversely affect the cost of our borrowing if we need to access credit markets. Tightening credit spreads may reduce our investment income and cause an increase in the reported value of certain liabilities that are valued using a discount rate that reflects our own credit spread.
48
•Risks Related to Equity Markets – A portion of our investments are in leveraged buy-out funds and other private equity funds. The amount and timing of net investment income from such funds tends to be uneven as a result of the performance of the underlying investments. As a result, the amount of net investment income from these investments can vary substantially from period-to-period. Significant volatility could adversely impact returns and net investment income on these investments. In addition, the estimated fair value of such investments may be affected by downturns or volatility in equity or other markets.
•Risks Related to the Valuation of Securities – Fixed maturity and equity securities, as well as short-term investments that are reported at estimated fair value, represent the majority of our total cash and investments. See Note 1 to the Notes to the Consolidated Financial Statements for more information on how we calculate fair value. During periods of market disruption, including periods of significantly rising or high interest rates, rapidly widening credit spreads or illiquidity, it may be difficult to value certain of our securities if trading becomes less frequent or market data becomes less observable. In addition, in times of financial market disruption, certain asset classes that were in active markets with significant observable data may become illiquid. In those cases, the valuation process includes inputs that are less observable and require more subjectivity and management judgment. Valuations may result in estimated fair values which vary significantly from the amount at which the investments may ultimately be sold. Further, rapidly changing and unprecedented credit and equity market conditions could materially impact the valuation of securities as reported within our consolidated financial statements and the period-to-period changes in estimated fair value could vary significantly. Decreases in the estimated fair value of securities we hold could have a material adverse effect on our financial condition and results of operations.
•Risks Related to the Determination of Allowances and Impairments – The determination of the amount of allowances and impairments is subjective and varies by investment type, which is based on our periodic evaluation and assessment of known and inherent risks associated with the respective asset class. However, historical trends may not be indicative of future impairments or allowances.
•Gross Unrealized Losses on Fixed Maturity Securities and Related Impairment Risks – Unrealized gains or losses on fixed maturity securities classified as available-for-sale (“AFS”) securities are recognized as a component of other comprehensive income (loss) (“OCI”) and are, therefore, excluded from our profitability measures. The accumulated change in estimated fair value of these AFS securities is recognized in our profitability measures when the gain or loss is realized upon the sale of the security or in the event that the decline in estimated fair value is determined to be credit-related and impairment charges are taken. See “Management’s Discussion and Analysis of Financial Condition and Results of Operations — Investments — Fixed Maturity Securities Available-for-sale.”
•Defaults, Downgrades or Other Events Affecting Issuers or Guarantors of Securities and Related Impairment Risks – The occurrence of a major economic downturn, acts of corporate malfeasance, widening credit spreads, or other events that adversely affect the issuers or guarantors of securities or the underlying collateral of residential mortgage-backed securities (“RMBS”), commercial mortgage-backed securities (“CMBS”) and ABS (collectively, “Structured Securities”) could cause the estimated fair value of our fixed maturity securities portfolio and corresponding net investment income to decline and cause the default rate of the fixed maturity securities in our portfolio to increase. A ratings downgrade affecting issuers or guarantors of particular securities, or similar trends that could worsen the credit quality of issuers, such as the corporate issuers of securities in our portfolio, could also have a similar effect. Economic uncertainty can adversely affect credit quality of issuers or guarantors. Similarly, a ratings downgrade affecting a security we hold could indicate the credit quality of that security has deteriorated and could increase the capital we must hold to support that security to maintain our RBC levels. Our intent to sell or assessment of the likelihood that we would be required to sell fixed maturity securities that have declined in value may affect the level of write-downs or impairments.
Liquidity Risk
There may be a limited market for certain investments we hold in our investment portfolio, making them relatively illiquid. These include privately-placed fixed maturity securities, derivative instruments such as options, mortgage loans, policy loans, leveraged leases, other limited partnership interests, and real estate equity, such as real estate limited partnerships, limited liability companies and funds. In the past, even some of our very high-quality investments experienced reduced liquidity during periods of market volatility or disruption. If we were forced to sell certain of our investments during periods of market volatility or disruption, market prices may be lower than our carrying value in such investments. This could result in realized losses which could have a material adverse effect on our financial condition and results of operations, as well as our financial ratios, which could affect compliance with our credit instruments and rating
49
agency capital adequacy measures. Moreover, our ability to sell assets could be limited if other market participants are seeking to sell fungible or similar assets at the same time.
Similarly, we loan blocks of our securities to third parties (primarily brokerage firms and commercial banks) through our securities lending program, including fixed maturity securities and short-term investments. See “Management’s Discussion and Analysis of Financial Condition and Results of Operations — Investments — Securities Lending” for a discussion of our obligations under our securities lending program.
If we are required to return significant amounts of cash collateral in connection with our securities lending or otherwise need significant amounts of cash on short notice and we are forced to sell securities, we may have difficulty selling such collateral that is invested in securities in a timely manner, be forced to sell securities in a volatile or illiquid market for less than we otherwise would have been able to realize in normal market conditions, or both. In the event of a forced sale, accounting guidance requires the recognition of a loss for securities in an unrealized loss position and may require the impairment of other securities based on our ability to hold those securities, which would negatively impact our financial condition and results of operations, as well as our financial ratios, which could affect compliance with our credit instruments and rating agency capital adequacy measures. In addition, under stressful capital markets and economic conditions, liquidity broadly deteriorates, which could further restrict our ability to sell securities. Furthermore, if we decrease the amount of our securities lending activities over time, the amount of net investment income generated by these activities will also likely decline.
Real Estate Risk
A portion of our investment portfolio consists of mortgage loans on commercial, agricultural and residential real estate. Our exposure to this risk stems from various factors, including the supply and demand of leasable commercial space, creditworthiness of tenants and partners, capital markets volatility, interest rate fluctuations, agricultural prices and farm incomes. Although we manage credit risk and market valuation risk for our commercial, agricultural and residential real estate assets through geographic, property type and product type diversification and asset allocation, general economic conditions in the commercial, agricultural and residential real estate sectors will continue to influence the performance of these investments. These factors, which are beyond our control, could have a material adverse effect on our financial condition, results of operations, liquidity or cash flows.
Mortgage loans in our portfolio also face default risk. An increase in the default rate of our mortgage loan investments or fluctuations in their performance could have a material adverse effect on our financial condition and results of operations.
Further, any geographic or property type concentration of the mortgage loans in our portfolio may have adverse effects on our portfolio and, consequently, on our financial condition and results of operations. Events or developments that have a negative effect on any particular geographic region or sector may have a greater adverse effect on our investment portfolio to the extent that the portfolio is concentrated. See “Management’s Discussion and Analysis of Financial Condition and Results of Operations — Investments — Mortgage Loans” and Notes 9 and 11 of the Notes to the Consolidated Financial Statements.
Derivative Risk
We use a variety of strategies to manage risk related to our ongoing business operations, including the use of derivatives. Our derivative counterparties’ defaults could have a material adverse effect on our financial condition and results of operations. In addition, ratings downgrades or financial difficulties of derivative counterparties may require us to utilize additional capital with respect to the affected businesses. Furthermore, the valuation of our derivatives could change based on changes to our valuation methodology or the discovery of errors.
Substantially all of our derivative transactions require us to pledge or receive collateral or make payments related to any decline in the net estimated fair value of such derivative transactions. The amount of collateral we may be required to pledge and the payments we may be required to make under our derivative transactions may increase under certain circumstances as a result of the requirement to pledge initial margin or variation margin for OTC-bilateral transactions. Such requirements could adversely affect our liquidity, expose us to central clearinghouse and counterparty credit risk, or increase our costs of hedging. See “Business — Regulation — Regulation of Over-the-Counter Derivatives.”
50
Other Risks
We are also exposed to other risks outside of our control, including foreign currency exchange rate risk relating to the variability in currency exchange rates for non-U.S. dollar denominated investments, as well as other financial and operational risks related to using external asset management firms.
See “Management’s Discussion and Analysis of Financial Condition and Results of Operations — Investments — Investment Risk Management Strategy” for discussion of how we manage the risks related to our investment portfolio.
Ongoing military actions, the continued threat of terrorism, climate change as well as other catastrophic events may adversely affect the value of our investment portfolio and the level of claim losses we incur
Ongoing military actions (including the ongoing armed conflicts in Europe and the Middle East), the continued threat of terrorism, both within the U.S. and abroad, and heightened security measures in response to these types of threats, as well as climate change and other natural or man-made catastrophic events, may cause significant decline and volatility in global financial markets and result in loss of life, property damage, additional disruptions to commerce, the health system, and the food supply and reduced economic activity. The effects of climate change could cause changes in weather patterns, resulting in more severe and more frequent natural disasters such as forest fires, hurricanes, tornados, floods and storm surges. The value of assets in our investment portfolio may be adversely affected by declines in the credit and equity markets and reduced economic activity caused by the continued threat of catastrophic events. Companies in which we maintain investments may suffer losses as a result of financial, commercial or economic disruptions and such disruptions might affect the ability of those companies to pay interest or principal on their securities or mortgage loans. Catastrophic events could also disrupt our operations as well as the operations of our third-party service providers and also result in higher than anticipated claims under insurance policies that we have issued. See “Management’s Discussion and Analysis of Financial Condition and Results of Operations — Policyholder Liabilities.”
Regulatory and Legal Risks
Our insurance business is highly regulated, and changes in regulation and in supervisory and enforcement policies or interpretations thereof may materially impact our capitalization or cash flows, reduce our profitability and limit our growth
Our operations are subject to a wide variety of insurance and other laws and regulations. Our insurance subsidiaries and BRCD are subject to regulation by their primary Delaware, Massachusetts and New York state regulators, as applicable, as well as other regulation in states in which they operate. Changes in these laws and regulations could adversely affect our business, financial condition and results of operations. See “Business — Regulation,” as supplemented by discussions of regulatory developments in our subsequently filed Quarterly Reports on Form 10-Q under the caption “Management’s Discussion and Analysis of Financial Condition and Results of Operations — Industry Trends and Uncertainties — Regulatory Developments.”
In addition, we cannot predict what proposals may be made, what legislation or regulations may be introduced or enacted, or what impact any future legislation or regulations could have on our business, financial condition and results of operations, including the cost of any such compliance. Furthermore, regulatory uncertainty could create confusion among our distribution partners and customers, which could negatively impact product sales. See “Business — Regulation — Standard of Conduct Regulation” for a more detailed discussion of particular regulatory efforts by various regulators.
Changes to the laws and regulations that govern the standards of conduct that apply to the sale of our products, as well as the firms that distribute our products, could adversely affect our operations and profitability. Such changes could increase our regulatory and compliance burden, resulting in increased costs, or limit the type, amount or structure of compensation arrangements into which we may enter with certain of our employees, which could negatively impact our ability to compete with other companies, including with respect to recruiting and retaining key personnel. Additionally, our ability to react to rapidly changing economic conditions and the dynamic, competitive market for our products will depend on the continued efficacy of provisions we have incorporated into our product design allowing frequent and contemporaneous revisions of key pricing elements, as well as our ability to work collaboratively with regulators. Changes in regulatory approval processes, rules and other dynamics in the regulatory process could adversely impact our ability to react to such changing conditions.
We cannot predict the impact that “best interest” or fiduciary standards adopted or proposed by various regulators may have on our business, financial condition or results of operations. Compliance with new or changed rules or legislation in this area may increase our regulatory burden and that of our distribution partners, require changes to our compensation practices and product offerings, and increase litigation risk, which could adversely affect our financial condition and results of operations.
51
In addition, we are subject to federal, state and other securities and state insurance laws and regulations which, among other things, require that we distribute certain of our products through a registered broker-dealer. The failure to comply with these laws or changes to these laws could have a material adverse effect on our operations and our profitability. Furthermore, changes in laws and regulations that affect our customers and distribution partners or their operations also may affect our business relationships with them and their ability to purchase or distribute our products. Such actions may negatively affect our business and results of operations.
If our associates fail to adhere to regulatory requirements or our policies and procedures, we may be subject to penalties, restrictions or other sanctions by applicable regulators, and we may suffer reputational harm. See “Business — Regulation.”
A decrease in the RBC ratio of our insurance subsidiaries (as a result of a reduction in statutory capital and surplus or an increase in the required RBC capital charges), or a change in the rating agency proprietary capital models for our insurance subsidiaries, could result in increased scrutiny by insurance regulators and rating agencies and could have a material adverse effect on our financial condition and results of operations
The NAIC has established model regulations that provide minimum capitalization requirements based on RBC formulas for insurance companies. Each of our insurance subsidiaries is subject to RBC standards or other minimum statutory capital and surplus requirements imposed under the laws of its respective jurisdiction of domicile. See “Business — Regulation — Insurance Regulation — Statutory Accounting, Reserves and Risk-Based Capital.” A failure to meet these requirements could subject our insurance subsidiaries to further examination or corrective action imposed by insurance regulators, including limitations on their ability to write additional business, increased regulatory supervision, or seizure or liquidation. Any corrective action imposed could cause a material adverse effect on our business, financial condition, results of operations and cash flows. A decline in RBC ratio, whether or not it results in a failure to meet applicable RBC requirements, could limit the ability of an insurance subsidiary to make dividends or distributions to us, could result in a loss of customers or new business, or could influence ratings agencies to downgrade our financial strength ratings, each of which could cause a material adverse effect on our business, financial condition and results of operations.
In any particular year, TAC amounts, and thus RBC ratios, may fluctuate depending on a variety of factors, including the amount of statutory income or losses generated by the insurance subsidiary, the amount of additional capital such insurer must hold to support business growth, equity and credit market conditions, the value and credit ratings of certain fixed income and equity securities in its investment portfolio, the value of certain derivative instruments that do not receive hedge accounting, as well as changes to the RBC formulas and the interpretation of the NAIC’s instructions with respect to RBC calculation methodologies. In addition, rating agencies may implement changes to their own proprietary capital models, which differ from the RBC capital model, that have the effect of increasing or decreasing the amount of capital our insurance subsidiaries should hold relative to the rating agencies’ expectations. Under stressed or stagnant capital markets conditions and with the aging of existing insurance liabilities, without offsets from new business, the amount of additional statutory reserves that an insurance subsidiary is required to hold could materially increase. This increase in reserves would decrease the capital available for use in calculating the subsidiary’s RBC ratio. To the extent that an insurance subsidiary’s RBC ratio is deemed to be insufficient, we may seek to take actions either to increase the capitalization of the insurer or to reduce the capitalization requirements. If we were unable to accomplish such actions, the rating agencies could view this as a reason for a ratings downgrade.
Changes in tax laws or interpretations of such laws could reduce our earnings and materially impact our operations by increasing our corporate taxes and making some of our products less attractive to consumers
Changes in tax laws or interpretations of such laws could have a material adverse effect on our profitability and financial condition and could result in our incurring materially higher statutory taxes. Higher tax rates or differences in interpretation of tax laws may adversely affect our business, financial condition, results of operations and liquidity. Conversely, declines in tax rates could make our products less attractive to consumers. See “Business — Regulation — Federal Tax Reform” for a discussion of the potential impacts of the Inflation Reduction Act and the related corporate alternative minimum tax.
Legal disputes and regulatory investigations are common in our businesses and may result in significant financial losses or harm to our reputation
We face a significant risk of legal disputes and regulatory investigations in the ordinary course of operating our businesses, including the risk of class action lawsuits. Our pending legal actions and regulatory investigations include proceedings specific to us, as well as other proceedings that raise issues that are generally applicable to business practices in the industries in which we operate.
52
In connection with our insurance operations, plaintiffs’ lawyers may bring or are bringing class actions and individual suits alleging, among other things, issues relating to sales or underwriting practices, claims payments and procedures, escheatment, product design, disclosure, administration, investments, denial or delay of benefits, lapse or termination of policies, cost of insurance and breaches of fiduciary or other duties to customers. Plaintiffs in class action and other lawsuits against us may seek very large or indeterminate amounts, including punitive and treble damages. Due to the vagaries of litigation, the outcome of a litigation matter and the amount or range of potential loss at particular points in time may be difficult to ascertain. Material pending litigation and other legal disputes, as well as regulatory matters affecting us and risks to our business presented by these proceedings, if any, are discussed in Note 18 of the Notes to the Consolidated Financial Statements.
A substantial legal liability or a significant federal, state or other regulatory action against us, as well as regulatory inquiries or investigations, could harm our reputation, result in material fines or penalties, result in significant legal costs and otherwise have a material adverse effect on our business, financial condition and results of operations. Even if we ultimately prevail in the litigation, regulatory action or investigation, our ability to attract new customers and distributors, retain our current customers and distributors, and recruit and retain personnel could be materially and adversely impacted. Regulatory inquiries and legal disputes may also cause volatility in the price of BHF securities and the securities of companies in our industry.
Current claims, litigation, unasserted claims probable of assertion, investigations and other proceedings against us, as well as any other disputes or other matters involving third parties, could have a material adverse effect on our business, financial condition and results of operations. It is also possible that related or unrelated claims, litigation, unasserted claims probable of assertion, investigations and proceedings may be commenced in the future, and we could become subject to further investigations and have lawsuits filed or enforcement actions initiated against us. Increased regulatory scrutiny and any resulting investigations or proceedings in any of the jurisdictions where we operate could result in new legal actions and precedents or changes in laws, rules or regulations that could adversely affect our business, financial condition and results of operations.
Operational Risks
Any gaps in our policies, procedures, or processes may leave us exposed to unidentified or unanticipated risk, and our models used by our business may not operate properly and could contain errors, each of which could adversely affect our business, financial condition, or results of operations
We have developed policies, procedures and processes to enable and support the ongoing review of the actual and potential risks facing the Company. Nonetheless, our policies, procedures and processes may not be fully effective in identifying and assessing such risks, leaving us exposed to unidentified or unanticipated risks. In addition, we rely on third-party providers to administer and service many of our products, and our policies, procedures and processes may not enable us to identify and assess every risk with respect to those products, especially to the extent we rely on those providers for relevant information, including detailed information regarding the holders of our products.
We use models to manage our business and evaluate the associated risk exposures. The models may not operate properly and could contain errors related to model inputs, data, assumptions, calculations, or output that may adversely impact our results of operations. In addition, these models may not fully predict future exposures, which may be significantly greater than our historical measures indicate. For example, we use actuarial models to assist us in establishing reserves for liabilities arising from our insurance policies and annuity contracts. We periodically review the effectiveness of these models, their underlying logic, and, from time to time, implement refinements to our models based on these reviews. We implement refinements after rigorous testing and validation; even after such validation and testing, our models remain subject to inherent limitations. Accordingly, no assurances can be given as to whether or when we will implement refinements to our actuarial models, and, if implemented, whether such refinements will be sufficient. Furthermore, if implemented, any such refinements could cause us to increase the reserves we hold for our insurance policy and annuity contract liabilities. If models are misused or fail to serve their intended purposes, they could produce incorrect or inappropriate results. Business decisions based on incorrect or misused model outputs or reports could have a material adverse impact on our results of operations.
Other risk management models depend upon the evaluation of information regarding markets, clients, catastrophe occurrence, or other matters that are publicly available or otherwise accessible to us. This information may not always be accurate, complete, up-to-date, or properly evaluated. Furthermore, there can be no assurance that we can effectively review and monitor all risks or that all of our employees will follow our policies, procedures and processes, nor can there be any assurance that our policies, procedures and processes, or the policies, procedures and processes of third parties that administer or service our products, will enable us to accurately identify all risks and limit our exposures based on our assessments. In addition, if our business changes or the markets in which we operate evolve and new risks emerge, we may have to
53
implement more extensive and perhaps different policies, procedures or processes and our risk management framework may not evolve at the same pace as those changes. See “— Risks Related to Our Business — Our variable annuity exposure risk management strategy may not be effective, may result in significant volatility in our profitability measures or may negatively affect our statutory capital.”
Any failure in cyber- or other information security systems, as well as the occurrence of events unanticipated in Brighthouse Financial’s or our third-party service providers’ disaster recovery systems and business continuity planning could result in a loss or disclosure of confidential information, damage to our reputation and impairment of our ability to conduct business effectively
We heavily rely on communications, information systems (both internal and provided by third parties), and the internet to conduct our business. We rely on these systems throughout our business for a variety of functions, including processing new business, claims, and post-issue transactions, providing information to customers and distributors, performing actuarial analyses, managing our investments and maintaining financial records. A failure in the security of such systems or a failure to maintain the security of such systems, or the confidential information stored thereon, may result in regulatory enforcement action, harm our reputation or otherwise adversely affect our ability to conduct business, our financial condition or results of operations. In addition, our continuous technological evaluations and enhancements, including changes designed to update our protective measures, may increase our risk of a breach or gap in our security, and there can be no assurance that any such efforts will be effective in preventing or limiting the impact of future cyberattacks.
We and our vendors, like other commercial entities, have been, and will likely continue to be, subject to a variety of forms of cyberattacks with the objective of gaining unauthorized access to our systems and data, or disrupting our operations. Potential attacks may include, but are not limited to, cyberattacks, phishing attacks, account takeover attempts, the introduction of computer viruses or malicious code (commonly referred to as “malware”), ransomware or other extortion tactics, denial of service attacks, credential stuffing, and other computer-related penetrations. Hardware, software or applications developed by us or received from third parties may contain exploitable vulnerabilities, bugs, or defects in design, maintenance or manufacture or other issues that could compromise information and cybersecurity. The risk of cyberattacks has also increased and may continue to increase in connection with recent geopolitical conflicts, including in Europe and the Middle East, and other geopolitical events and dynamics that may adversely disrupt or degrade our operations and may compromise our data. Malicious actors may attempt to fraudulently induce employees, customers, or other users of our systems to disclose credentials or other similar sensitive information in order to gain access to our systems or data, or that of our customers, through social engineering, phishing, mobile phone malware, and other methods.
Cybersecurity threats are rapidly evolving, and those threats and the means for obtaining access to our systems are becoming increasingly sophisticated. Cybersecurity threats can originate from a wide variety of sources including terrorists, nation states, financially motivated actors, internal actors, or third parties, such as external service providers, and the techniques used change frequently or are often not recognized until after they have been launched. The rapid evolution and increased adoption of artificial intelligence technologies may intensify our cybersecurity risks, including the deployment of artificial intelligence technologies by threat actors. There is no assurance that administrative, physical and technical controls and other preventive actions taken to reduce the risk of cyberattacks and protect our information technology will prevent physical and electronic break-ins, cyberattacks or other security breaches to such computer systems. In some cases, such physical and electronic break-ins, cyberattacks or other security breaches may not be immediately detected. If we or our vendors fail to prevent, detect, address and mitigate such incidents, this may impede or interrupt our business operations and could adversely affect our business, financial condition and results of operations.
A disaster such as a natural catastrophe, epidemic, pandemic, industrial accident, blackout, terrorist attack, cyberattack or war, unanticipated problems with our or our vendors’ disaster recovery systems (and the disaster recovery systems of such vendors’ suppliers, vendors or subcontractors), could cause our computer systems to be inaccessible to our employees, distributors, vendors or customers or may destroy valuable data. In addition, in the event that a significant number of our or our vendors’ managers were unavailable following a disaster, our ability to effectively conduct business could be severely compromised. These interruptions also may interfere with our suppliers’ ability to provide goods and services and our employees’ ability to perform their job responsibilities. Unanticipated problems with, or failures of, our disaster recovery systems and business continuity plans could have a material impact on our ability to conduct business and on our financial condition and results of operations.
54
A failure of our or relevant third-party (or such third-party’s supplier’s, vendor’s or subcontractor’s computer systems) computer systems could cause significant interruptions in our operations, result in a failure to maintain the security, confidentiality or privacy of sensitive data, harm our reputation, subject us to regulatory sanctions and legal claims, lead to a loss of customers and revenues, and otherwise adversely affect our business and financial results. Our cyber liability insurance may not be sufficient to protect us against all losses. See also “— Any failure to protect the confidentiality of customer, employee, or other third-party information could adversely affect our reputation and have a material adverse effect on our business, financial condition and results of operations.”
Our employees and those of our third-party service providers may take excessive risks which could negatively affect our financial condition and business
As an insurance enterprise, we are in the business of accepting certain risks. The individuals who conduct our business include executive officers and other members of management, sales intermediaries, investment professionals, product managers, and other associates, as well as associates of our various third-party service providers. Each of these individuals makes decisions and choices that may expose us to risk. These include decisions such as setting underwriting guidelines and standards, product design and pricing, determining what assets to purchase for investment and when to sell them, which business opportunities to pursue, and other decisions. Such individuals may take excessive risks regardless of the structure of our risk management framework or our compensation programs and practices, which may not effectively deter excessive risk-taking or misconduct. Similarly, our controls and procedures designed to monitor associates’ business decisions and prevent them from taking excessive risks, and to prevent employee misconduct, may not be effective. If our associates and those of our third-party service providers take excessive risks, the impact of those risks could harm our reputation and have a material adverse effect on our financial condition and results of operations.
Any failure to protect the confidentiality of customer, employee, or other third-party information could adversely affect our reputation and have a material adverse effect on our business, financial condition and results of operations
Federal and state legislatures and various government agencies have established laws and regulations protecting the privacy and security of personal information. See “Business — Regulation — Privacy and Cybersecurity Regulation.” Our third-party service-providers and our employees have access to, and routinely process, personal information through a variety of media, including information technology systems. It is possible that an employee or third-party service provider (or their suppliers, vendors or subcontractors) could, intentionally or unintentionally, disclose or misappropriate confidential personal information, and there can be no assurance that our information security policies and systems in place can prevent unauthorized use or disclosure of confidential information, including nonpublic personal information. Additionally, our data has been and could in the future be the subject of cyberattacks, and the misappropriation or intentional or unintentional inappropriate disclosure or misuse of employee or client information could occur, including as a result of us or our third-party service providers (or their suppliers, vendors or subcontractors) failing to maintain adequate internal controls or if our associates or any of our third-party service providers fail to comply with applicable policies and procedures. Any failure or perceived failure by us to comply with our privacy policies, our privacy-related obligations to customers, employees, or other third parties, or our privacy-related legal obligations, or any compromise of security that results in the unauthorized release or transfer of sensitive information, which could include personally identifiable information or other user data, may result in governmental investigations, enforcement actions, regulatory fines, litigation and public statements against us by consumer advocacy groups or others, and could cause our customers, employees, or other third parties to lose trust in us, all of which could be costly and have a material adverse effect on our business, financial condition and results of operations. See “— Any failure in cyber- or other information security systems, as well as the occurrence of events unanticipated in Brighthouse Financial’s or our third-party service providers’ disaster recovery systems and business continuity planning could result in a loss or disclosure of confidential information, damage to our reputation and impairment of our ability to conduct business effectively.” In addition, compliance with complex variations in privacy and data security laws may require modifications to current business practices, including significant technology efforts that require long implementation timelines, increased costs and dedicated resources.
Furthermore, there has been increased scrutiny as well as enacted and proposed additional regulation, including from state regulators, regarding the use of customer data. We may analyze customer data or input such data into third-party analytics in order to better manage our business. Any inquiry in connection with our analytics business practices, as well as any misuse or alleged misuse of those analytics insights, could cause reputational harm or result in regulatory enforcement actions or litigation, and any related limitations imposed on us could have a material impact on our business, financial condition and results of operations.
55
Risks Related to Our Separation from, and Continuing Relationship with, MetLife
If the Separation were to fail to qualify for non-recognition treatment for federal income tax purposes, then we could be subject to significant tax liabilities
In connection with the Separation, MetLife received a private letter ruling from the Internal Revenue Service (“IRS”) regarding certain significant issues under the Tax Code, as well as an opinion from its tax advisor that, subject to certain limited exceptions, the Separation qualifies for non-recognition of gain or loss to MetLife and MetLife’s shareholders pursuant to Sections 355 and 361 of the Tax Code. Notwithstanding the receipt of the private letter ruling and the tax opinion, the tax opinion is not binding on the IRS or the courts, and the IRS could determine that the Separation should be treated as a taxable transaction and, as a result, we could incur significant federal income tax liabilities, and we could have an indemnification obligation to MetLife.
Generally, taxes resulting from the failure of the Separation to qualify for non-recognition treatment for federal income tax purposes would be imposed on MetLife or MetLife’s shareholders. Under the tax separation agreement with MetLife, Inc. (the “Tax Separation Agreement”), MetLife is generally obligated to indemnify us against such taxes if the failure to qualify for tax-free treatment results from, among other things, any action or inaction that is within MetLife’s control. MetLife may dispute an indemnification obligation to us under the Tax Separation Agreement, and there can be no assurance that MetLife will be able to satisfy its indemnification obligation to us or that such indemnification will be sufficient for us in the event of nonperformance by MetLife. The failure of MetLife to fully indemnify us could have a material adverse effect on our financial condition and results of operations.
In addition, MetLife will generally bear tax-related losses due to the failure of certain steps that were part of the Separation to qualify for their intended tax treatment. However, the IRS could seek to hold us responsible for such liabilities, and under the Tax Separation Agreement, we could be required, under certain circumstances, to indemnify MetLife and its affiliates against certain tax-related liabilities caused by those failures. If the Separation does not qualify for non-recognition treatment or if certain other steps that are part of the Separation do not qualify for their intended tax treatment, we could be required to pay material additional taxes or be obligated to indemnify MetLife, which could have a material adverse effect on our financial condition and results of operations.
The Separation was also subject to tax rules regarding the treatment of certain of our tax attributes (such as the basis in our assets). In certain circumstances such rules could require us to reduce those attributes, which could materially and adversely affect our financial condition. The ultimate tax consequences to us of the Separation may not be finally determined for many years and may differ from the tax consequences that we and MetLife expected at the time of the Separation. As a result, we could be required to pay material additional taxes and to materially reduce the tax assets (or materially increase the tax liabilities) on our consolidated balance sheet. These changes could impact our available capital, ratings or cost of capital. There can be no assurance that the Tax Separation Agreement will protect us from any such consequences, or that any issue that may arise will be subject to indemnification by MetLife under the Tax Separation Agreement. As a result, our financial condition and results of operations could be materially and adversely affected.
Disputes or disagreements with MetLife may affect our financial statements and business operations, and our contractual remedies may not be sufficient; we may also be required to share in certain of MetLife's liabilities
The Master Separation Agreement that sets forth our agreements with MetLife relating to the ownership of certain assets and the allocation of certain liabilities in connection with the Separation (the “Master Separation Agreement”) provides that, subject to certain exceptions, we will indemnify, hold harmless and defend MetLife and certain related individuals from and against all liabilities relating to, arising out of or resulting from certain events relating to our business. We cannot predict whether any event triggering this indemnity will occur or the extent to which we may be obligated to indemnify MetLife or such related individuals. In addition, the Master Separation Agreement provides that, subject to certain exceptions, MetLife will indemnify, hold harmless and defend us and certain related individuals from and against all liabilities relating to, arising out of or resulting from certain events relating to its business. There can be no assurance that MetLife will be able to satisfy its indemnification obligation to us or that such indemnification will be sufficient to us in the event of a dispute or nonperformance by MetLife.
In addition, the Master Separation Agreement allocates responsibility among MetLife and Brighthouse Financial with respect to certain claims (including litigation or regulatory actions or investigations where Brighthouse Financial is not a party). As a result, we may face indemnification obligations or be required to share in certain of MetLife’s liabilities with respect to such claims.
56
Risks Related to Our Securities
We currently have no plans to declare and pay dividends on our common stock, and legal restrictions could limit our ability to pay dividends on our capital stock and our ability to repurchase our common stock at the level we wish
We currently have no plans to declare and pay cash dividends on our common stock. We currently intend to use our future statutory free cash flow, if any, to pay debt obligations, to fund our growth, to develop our business, for working capital needs, to carry out any share or debt repurchases that we may undertake, as well as for general corporate purposes. Therefore, you are not likely to receive any dividends on your common stock in the near-term, and the success of an investment in shares of our common stock will depend upon any future appreciation in their value. There is no guarantee that shares of our common stock will appreciate in value or even maintain the price at which the shares currently trade, and the market price of our common stock may fluctuate widely depending on many factors, some of which may be beyond our control. Any future declaration and payment of dividends or other distributions or returns of capital will be at the discretion of our Board of Directors and will depend on many factors, including our financial condition, earnings, cash needs, regulatory constraints, capital requirements (including capital requirements of our insurance subsidiaries), and any other factors that our Board of Directors deems relevant in making such a determination. Therefore, there can be no assurance that we will pay any dividends or make other distributions or returns on our common stock, or as to the amount of any such dividends, distributions or returns of capital.
In addition, the terms of the agreements governing preferred stock and certain of our outstanding indebtedness, as well as debt and other financial instruments that we may issue in the future, may limit or prohibit the payment of dividends on our common stock or preferred stock, or the payment of interest on our junior subordinated debentures. See “Management’s Discussion and Analysis of Financial Condition and Results of Operations — Liquidity and Capital Resources — The Company — Primary Uses of Liquidity and Capital — ‘Dividend Stopper’ Provisions in BHF’s Preferred Stock and Junior Subordinated Debentures.”
State insurance laws and Delaware corporate law, as well as certain provisions of our amended and restated certificate of incorporation and amended and restated bylaws, may prevent or delay an acquisition of us, which could decrease the trading price of our common stock
State laws may delay, deter, prevent or render more difficult a takeover attempt that our stockholders might consider in their best interests. For example, such laws may prevent our stockholders from receiving the benefit from any premium to the market price of our common stock offered by a bidder in a takeover context. Delaware law also imposes some restrictions on mergers and other business combinations between the Company and “interested stockholders.” An “interested stockholder” is defined to include persons who, together with affiliates, own, or did own within three years prior to the determination of interested stockholder status, 15% or more of the outstanding voting stock of a corporation.
The insurance laws and regulations of the various states in which our insurance subsidiaries are organized may delay or impede a business combination involving the Company. State insurance laws prohibit an entity from acquiring control of an insurance company without the prior approval of the domestic insurance regulator. Under most states’ statutes, an entity is presumed to have control of an insurance company if it owns, directly or indirectly, 10% or more of the voting stock of that insurance company or its parent company. See “Business — Regulation — Insurance Regulation — Holding Company Regulation.” These regulatory restrictions may delay, deter or prevent a potential merger or sale of our company, even if our Board of Directors decides that it is in the best interests of stockholders for us to merge or be sold. These restrictions also may delay sales by us or acquisitions by third parties of our insurance subsidiaries. In addition, the Investment Company Act may require approval by the contract owners of our variable contracts in order to effectuate a change of control of any affiliated investment advisor to a fund underlying our variable contracts, including Brighthouse Advisers. Further, FINRA approval would be necessary for a change of control of any broker-dealer that is a direct or indirect subsidiary of BHF.
In addition, our amended and restated certificate of incorporation and amended and restated bylaws contain provisions that may deter coercive takeover practices and inadequate takeover bids and may encourage prospective acquirers to negotiate with our Board of Directors rather than attempt a hostile takeover. These provisions will apply even if the offer may be considered beneficial by some stockholders and could delay or prevent an acquisition that our Board of Directors determines is not in the best interests of Brighthouse Financial and our stockholders. These provisions may also prevent or discourage attempts to remove and replace incumbent directors.
Item 1B. Unresolved Staff Comments
None.
57
Item 1C. Cybersecurity
Cybersecurity Risk Management Program and Strategy
We understand the importance of maintaining a robust cybersecurity program to assess, identify, and manage the material risks associated with cybersecurity threats.
Managing Cybersecurity Risks; Cybersecurity Risk Management Strategy
Our cybersecurity risk management program is integrated into the Company’s enterprise risk management framework, and our strategy focuses on implementing effective and efficient processes, technologies, and controls to assess, identify, and manage cybersecurity risks. Our cybersecurity program is designed to be aligned with the National Institute of Standards and Technology (“NIST”) framework, which organizes the management of cybersecurity risks into five categories: identify, protect, detect, respond, and recover.
Our Chief Technology Officer (“CTO”) has overall responsibility for our information technology program, which includes the Company’s cybersecurity program. Our Chief Information Security Officer (“CISO”) is directly responsible for the Company’s cybersecurity program, which is designed to protect and preserve the integrity, confidentiality, and continued availability of the information owned by, or in the care of, the Company. Our CTO has over 25 years of information technology experience, including systems development, technology strategy, and vendor management; our CISO has over 30 years of information technology and cybersecurity program management experience. Prior to joining Brighthouse Financial, both our CTO and CISO previously served in roles that involved leading and overseeing information technology and cybersecurity programs at other public companies in the financial services industry. In addition, our CTO serves on a cross-departmental, management-level risk committee that oversees the Company’s enterprise risks, including cybersecurity risks. This enterprise-level risk committee is informed about and monitors the prevention, mitigation, detection, and remediation of cybersecurity incidents.
Our cybersecurity team regularly assesses the threat landscape and takes an enterprise-wide view of cybersecurity risks. We monitor issues that are internally discovered or externally reported that may affect our business, and we employ a range of tools and third-party services to effectuate our cybersecurity risk identification and assessments, including regular network and endpoint monitoring, threat and vulnerability assessments, and external penetration testing. In addition, our cybersecurity team conducts regular reviews, conducts tabletop exercises, performs internal testing, and leverages the audits performed by our internal audit team, as well as the services of third-party consultants, to assess and evaluate the effectiveness of our controls (in alignment with the NIST framework) and to improve our security measures and strategy. The cybersecurity team has also engaged a third party to measure our cybersecurity program against the NIST cybersecurity framework. The results of this assessment confirmed the rigor of our cybersecurity risk management practices.
Our cybersecurity team has also established Company-wide policies and procedures that cover cybersecurity matters, which are designed to enable us to effectively identify, evaluate, and respond to events that have the potential to impact our business. In the event of a cybersecurity incident, the Company utilizes a well-defined incident response plan that coordinates the activities we take to prepare for, detect, respond to and recover from cybersecurity incidents, which include processes to triage, assess severity, escalate, contain, investigate, and remediate the incident, as well as to comply with potentially applicable legal obligations (including relevant securities laws) and mitigate brand and reputational damage. This plan includes immediate actions to mitigate the impact, as well as long-term strategies for the remediation and prevention of future incidents. In accordance with this plan, we have established a cross-departmental Brighthouse Response Team that is responsible for coordinating enterprise-wide responses to cybersecurity incidents, as applicable. This Brighthouse Response Team provides reports regarding cybersecurity incidents to the enterprise-level risk committee referenced above.
Further, employees outside of our technology organization have a role in our cybersecurity defenses, and we encourage a corporate culture supportive of security, which we believe improves the effectiveness of our cybersecurity risk management program. Through our Security Awareness Program, we provide our employees with regular cybersecurity training and educational resources to help ensure that they remain vigilant against threats. These include frequent simulations, newsletters, alerts, e-mail reminders, and a mandatory annual cybersecurity awareness training course for all employees. In addition to company policies that we make available to all employees, our awareness training provides clear reporting and escalation processes in the event of suspicious activity.
58
Third-Party Risk Management
Our processes also address the cybersecurity risks associated with our use of third-party vendors, some of whom have access to our customer and employee data. We conduct security assessments of all third-party vendors that have access to our systems, our data and/or the facilities that house such systems or data. As part of our third-party risk management program, our cybersecurity risk management and third-party risk management teams collaborate to monitor our third-party vendors’ compliance with our cybersecurity standards. This approach is designed to mitigate risks related to data breaches or other security incidents originating from third parties.
Risks from Cybersecurity Threats
Our systems and our third-party vendors’ systems periodically experience directed attacks intended to lead to (i) interruptions or delays in our operations or (ii) the loss, misuse or theft of personal information and other data, including confidential information or intellectual property. We have not experienced any cybersecurity incidents to date, directly or indirectly, that have materially impacted our business, financial condition, or results of operations. For more information regarding our risks from cybersecurity threats, see “Risk Factors — Operational Risks — Any failure in cyber- or other information security systems, as well as the occurrence of events unanticipated in Brighthouse Financial’s or our third-party service providers’ disaster recovery systems and business continuity planning could result in a loss or disclosure of confidential information, damage to our reputation and impairment of our ability to conduct business effectively” and “Risk Factors —Operational Risks — Any failure to protect the confidentiality of customer, employee, or other third-party information could adversely affect our reputation and have a material adverse effect on our business, financial condition and results of operations.”
Governance
Board of Directors - Oversight and Management Reporting
The Audit Committee of the Board of Directors (the “Audit Committee”) is primarily responsible for overseeing cybersecurity risks, and the Board of Directors is actively engaged with respect to these risks. The Audit Committee and/or the Board of Directors generally meet with our CTO and CISO on a quarterly basis to review our information technology and cybersecurity risk profile and to discuss our activities to manage the related risks, including risk assessments, mitigation strategies, areas of emerging risks, incidents and industry trends, tabletop exercises, and other areas of importance. In addition to these regular meetings, we have an escalation process in place to timely inform the Board of Directors of any significant cybersecurity incidents, including any updates relating thereto, to ensure that the Board of Directors’ oversight is proactive and responsive. Our Chief Compliance Officer also regularly reports to the Audit Committee regarding the Company’s compliance with applicable regulations relating to cybersecurity.
Item 2. Properties
Not material.
Item 3. Legal Proceedings
See Note 18 of the Notes to the Consolidated Financial Statements.
Item 4. Mine Safety Disclosures
Not applicable.
59
PART II
Item 5. Market for Registrant’s Common Equity, Related Stockholder Matters and Issuer Purchases of Equity Securities
Issuer Common Equity
BHF’s common stock, par value $0.01 per share, trades on the Nasdaq under the symbol “BHF.”
As of February 16, 2024, there were approximately 1.1 million registered holders of record of our common stock. The actual number of holders of our common stock is substantially greater than this number of record holders, and includes stockholders who are beneficial owners, but whose shares are held in “street name” by banks, brokers, and other financial institutions.
We currently have no plans to declare and pay dividends on our common stock. See “Risk Factors — Risks Related to Our Securities — We currently have no plans to declare and pay dividends on our common stock, and legal restrictions could limit our ability to pay dividends on our capital stock and our ability to repurchase our common stock at the level we wish” and “Management’s Discussion and Analysis of Financial Condition and Results of Operations — Liquidity and Capital Resources — The Company — Capital.”
Stock Performance Graph
The graph and table below present BHF’s cumulative total shareholder return relative to the performance of (1) the S&P 500 Index, (2) the S&P 500 Financials Index and (3) the S&P 500 Life & Health Insurance Index, respectively, for the five-year period ended December 31, 2023. All values assume a $100 initial investment at the opening price of BHF’s common stock on the Nasdaq and data for each of the S&P 500 Index, the S&P 500 Financials Index and the S&P 500 Life & Health Insurance Index assume all dividends were reinvested on the date paid. The points on the graph and the values in the table represent month-end values based on the last trading day of each month. The comparisons are based on historical data and are not indicative of, nor intended to forecast, the future performance of our common stock.
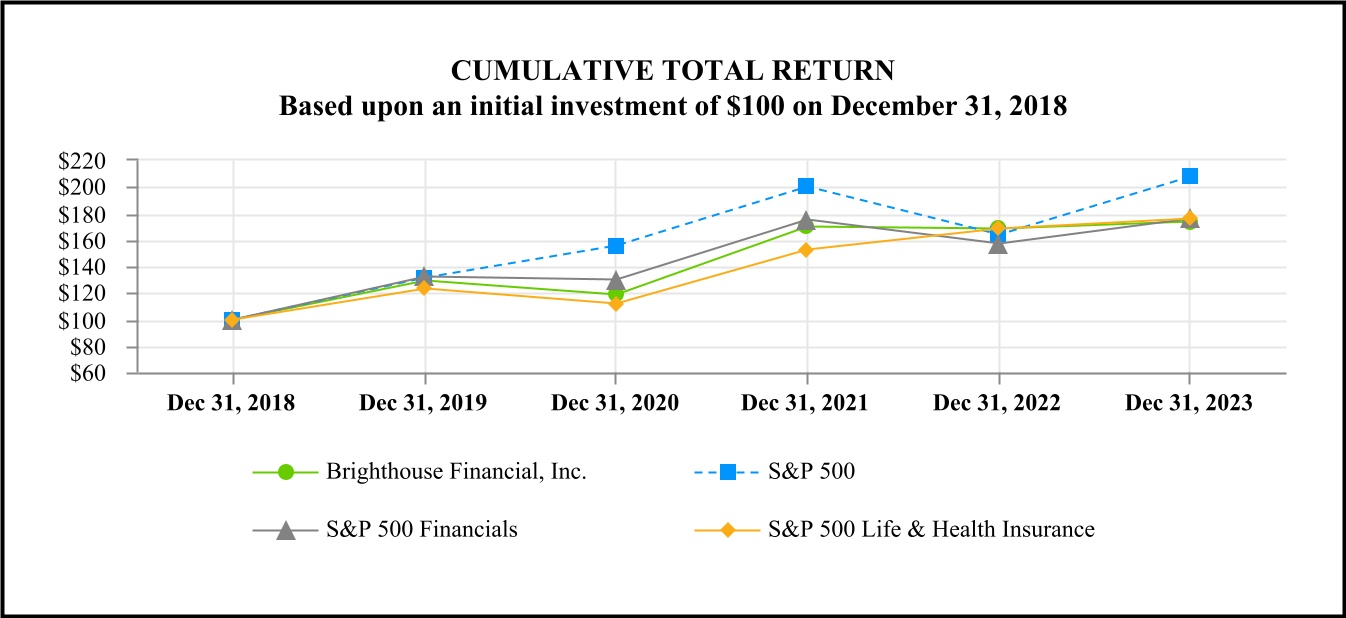
| Dec 31, 2018 | Dec 31, 2019 | Dec 31, 2020 | Dec 31, 2021 | Dec 31, 2022 | Dec 31, 2023 | |||||||||||||||||||||||||||||||||
| BHF common stock | $ | 100.00 | $ | 128.71 | $ | 118.78 | $ | 169.95 | $ | 168.21 | $ | 173.62 | ||||||||||||||||||||||||||
| S&P 500 | $ | 100.00 | $ | 131.49 | $ | 155.68 | $ | 200.37 | $ | 164.08 | $ | 207.21 | ||||||||||||||||||||||||||
| S&P 500 Financials | $ | 100.00 | $ | 132.13 | $ | 129.89 | $ | 175.40 | $ | 156.92 | $ | 175.99 | ||||||||||||||||||||||||||
| S&P 500 Life & Health Insurance | $ | 100.00 | $ | 123.18 | $ | 111.51 | $ | 152.41 | $ | 168.18 | $ | 176.00 | ||||||||||||||||||||||||||
60
Issuer Purchases of Equity Securities
Purchases of BHF common stock made by or on behalf of BHF or its affiliates during the three months ended December 31, 2023 are set forth below:
| Period | Total Number of Shares Purchased (1) | Average Price Paid per Share | Total Number of Shares Purchased as Part of Publicly Announced Plans or Programs (2) | Approximate Dollar Value of Shares that May Yet Be Purchased Under the Plans or Programs (2) | ||||||||||||||||||||||
| (In millions) | ||||||||||||||||||||||||||
October 1 — October 31, 2023 | 460,522 | $ | 47.24 | 461,248 | $ | 82 | ||||||||||||||||||||
November 1 — November 30, 2023 | 423,457 | $ | 48.31 | 423,788 | $ | 811 | ||||||||||||||||||||
December 1 — December 31, 2023 | 342,658 | $ | 53.14 | 342,658 | $ | 793 | ||||||||||||||||||||
| Total | 1,226,637 | 1,227,694 | ||||||||||||||||||||||||
_______________
(1)Where applicable, total number of shares purchased includes shares of common stock withheld with respect to option exercise costs and tax withholding obligations associated with the exercise or vesting of share-based compensation awards under our publicly announced benefit plans or programs.
(2)On November 16, 2023, we authorized the repurchase of up to $750 million of our common stock, which is in addition to the $1.2 billion total repurchases authorized in 2021. See “Management’s Discussion and Analysis of Financial Condition and Results of Operations — Liquidity and Capital Resources — The Company — Primary Uses of Liquidity and Capital — Common Stock Repurchases” and Note 13 of the Notes to the Consolidated Financial Statements for more information on common stock repurchases.
Item 6. [Reserved]
61
Item 7. Management’s Discussion and Analysis of Financial Condition and Results of Operations
Index to Management’s Discussion and Analysis of Financial Condition and Results of Operations
| Page | |||||
62
The following discussion may contain forward-looking statements that reflect our plans, estimates and beliefs. Our actual results could differ materially from those discussed in these forward-looking statements. Factors that could cause or contribute to these differences include those factors discussed below and elsewhere in this report, particularly in “Note Regarding Forward-Looking Statements and Summary of Risk Factors” and “Risk Factors.” This Management’s Discussion and Analysis of Financial Condition and Results of Operations should also be read in conjunction with “Quantitative and Qualitative Disclosures About Market Risk” and our consolidated financial statements included elsewhere herein.
Introduction
This Management’s Discussion and Analysis of Financial Condition and Results of Operations is intended to help the reader understand the results of operations, financial condition and cash flows of Brighthouse Financial for the periods indicated. In addition to Brighthouse Financial, Inc., the companies and businesses included in the results of operations, financial condition and cash flows are:
•Brighthouse Life Insurance Company (together with its subsidiaries and affiliates, “BLIC”), our largest insurance subsidiary, domiciled in Delaware and licensed to write business in all U.S. states (except New York), the District of Columbia, the Bahamas, Guam, Puerto Rico, the British Virgin Islands and the U.S. Virgin Islands;
•NELICO, domiciled in Massachusetts and licensed to write business in all U.S. states and the District of Columbia;
•BHNY, domiciled in New York and licensed to write business only in New York, which is a subsidiary of Brighthouse Life Insurance Company;
•BRCD, our reinsurance subsidiary domiciled and licensed in Delaware, which is a subsidiary of Brighthouse Life Insurance Company;
•Brighthouse Advisers, serving as investment advisor to certain proprietary funds that are underlying investments under our and MetLife’s variable insurance products;
•Brighthouse Services, LLC, an internal services and payroll company;
•Brighthouse Securities, registered as a broker-dealer with the SEC, approved as a member of FINRA, registered as a broker-dealer and licensed as an insurance agency in all required states; and
•Brighthouse Holdings, LLC (“BH Holdings”), a direct holding company subsidiary of Brighthouse Financial, Inc. domiciled in Delaware.
Prior to discussing our results of operations, we present information that we believe is useful to understanding the discussion of our financial results. This information precedes our results of operations discussion and is most beneficial when read in the sequence presented. A summary of key informational sections is as follows:
•“Executive Summary” provides summarized information regarding our business, segments and financial results.
•“Risk Management Strategies” describes the Company’s risk management strategies to protect against capital markets risks specific to our variable annuity and ULSG businesses.
•“Industry Trends and Uncertainties” discusses updates and changes to a number of trends and uncertainties that we believe may materially affect our future financial condition, results of operations or cash flows.
•“Summary of Critical Accounting Estimates” explains the most critical estimates and judgments applied in determining our results in accordance with GAAP.
•“Non-GAAP and Other Financial Disclosures” defines key financial measures presented in our results of operations discussion that are not calculated in accordance with GAAP but are used by management in evaluating company and segment performance. As described in this section, adjusted earnings is presented by key business activities which are derived, but different, from the line items presented in the GAAP statements of operations. This section also refers to certain other terms used to describe our insurance business and financial and operating metrics but is not intended to be exhaustive.
•“Results of Operations” begins with a discussion of our AAR, including a summary of the changes made to the key assumptions in 2023 and 2022, as well as the resulting impact on net income (loss) available to shareholders in each period.
63
Our Results of Operations discussion and analysis presents a review for the years ended December 31, 2023 and 2022 and year-over-year comparisons between these years. Our Results of Operations discussion and analysis for the year ended December 31, 2022, including a review of the 2022 AAR and year-over-year comparisons between the years ended December 31, 2022 and 2021 can be found in “Management’s Discussion and Analysis of Financial Condition and Results of Operations — Results of Operations” in our Annual Report on Form 10-K for the year ended December 31, 2022 (our “2022 Annual Report”), which was filed with the SEC on February 23, 2023, and such discussions are incorporated herein by reference.
Certain amounts presented in prior periods within the following discussions of our financial results have been reclassified to conform with the current year presentation, including amounts related to the adoption of LDTI. See Note 1 of the Notes to the Consolidated Financial Statements for further information.
Executive Summary
We are one of the largest providers of annuity and life insurance products in the U.S. through multiple independent distribution channels and marketing arrangements with a diverse network of distribution partners. We are organized into three segments: (i) Annuities, (ii) Life and (iii) Run-off, which consists of products that are no longer actively sold and are separately managed. In addition, we report certain of our results of operations in Corporate & Other. See “Business — Segments and Corporate & Other” and Note 3 of the Notes to the Consolidated Financial Statements for further information regarding our segments and Corporate & Other.
Net income (loss) available to shareholders and adjusted earnings, a non-GAAP financial measure, were as follows:
| Years Ended December 31, | |||||||||||
| 2023 | 2022 | ||||||||||
| (In millions) | |||||||||||
| Income (loss) available to shareholders before provision for income tax | $ | (1,581) | $ | 4,623 | |||||||
| Less: Provision for income tax expense (benefit) | (367) | 848 | |||||||||
| Net income (loss) available to shareholders (1) | $ | (1,214) | $ | 3,775 | |||||||
| Pre-tax adjusted earnings, less net income (loss) attributable to noncontrolling interests and preferred stock dividends | $ | 1,182 | $ | 1,343 | |||||||
| Less: Provision for income tax expense (benefit) | 213 | 159 | |||||||||
| Adjusted earnings | $ | 969 | $ | 1,184 | |||||||
__________________
(1)We use the term “net income (loss) available to shareholders” to refer to “net income (loss) available to Brighthouse Financial, Inc.’s common shareholders” throughout the results of operations discussions.
For the year ended December 31, 2023, we had net loss available to shareholders of $1.2 billion and adjusted earnings of $969 million compared to net income available to shareholders of $3.8 billion and adjusted earnings of $1.2 billion for the year ended December 31, 2022. Net loss available to shareholders for the year ended December 31, 2023 primarily reflects net unfavorable changes in the estimated fair value of our variable annuity guaranteed benefit riders due to market factors, net losses on sales of fixed maturity securities and an unfavorable change in the estimated fair value of freestanding interest rate derivatives we use to hedge our ULSG business resulting from increasing long-term interest rates. These unfavorable impacts were partially offset by favorable pre-tax adjusted earnings.
See “— Non-GAAP and Other Financial Disclosures.” See “— Results of Operations” for a detailed discussion of our results.
64
Risk Management Strategies
We employ risk management strategies to protect against capital markets risks specific to our variable annuity and ULSG businesses, which includes the utilization of a combined RBC ratio. Combined RBC ratio reflects the aggregate RBC ratio of our insurance subsidiaries, defined as aggregate TAC of our insurance subsidiaries divided by the total of their respective company action level RBCs. Combined RBC ratio is an internal metric used by the Company to manage the risk associated with its insurance products through our capital and exposure risk management program; it is not a metric required or used by regulators.
Interest Rate Hedging
We are exposed to interest rate risk in most of our products, with the more significant longer-dated exposure residing in our in-force variable annuity guarantees and ULSG business. We individually manage the interest rate risk in these two blocks with hedge targets based on statutory metrics designed principally to protect the capital of our largest insurance subsidiary, BLIC. Our interest rate hedge programs may also include hybrid options that have other risk exposure in addition to interest rate exposure.
The gross notional amount and estimated fair value of the derivatives hedging our in-force variable annuity guarantees and ULSG business viewed in aggregate in our interest rate hedging program were as follows at:
| December 31, 2023 | December 31, 2022 | |||||||||||||||||||||||||||||||||||||
| Instrument Type | Gross Notional Amount (1) | Estimated Fair Value | Gross Notional Amount (1) | Estimated Fair Value | ||||||||||||||||||||||||||||||||||
| Assets | Liabilities | Assets | Liabilities | |||||||||||||||||||||||||||||||||||
| (In millions) | ||||||||||||||||||||||||||||||||||||||
| Interest rate swaps | $ | 23,037 | $ | 71 | $ | 50 | $ | 2,330 | $ | 38 | $ | 46 | ||||||||||||||||||||||||||
| Interest rate options | 33,680 | 47 | 167 | 28,688 | 22 | 232 | ||||||||||||||||||||||||||||||||
| Interest rate forwards | 16,155 | 32 | 1,877 | 16,848 | 35 | 2,387 | ||||||||||||||||||||||||||||||||
| Hybrid options (2) | 270 | — | — | — | — | — | ||||||||||||||||||||||||||||||||
| Total | $ | 73,142 | $ | 150 | $ | 2,094 | $ | 47,866 | $ | 95 | $ | 2,665 | ||||||||||||||||||||||||||
(1)The gross notional amounts presented do not necessarily represent the relative economic coverage provided by derivative instruments because certain positions were closed out by entering into offsetting positions that are not netted in the above table.
(2)Hybrid options have equity exposure in addition to interest rate exposure.
This aggregate view includes all interest rate derivatives used to manage the variable annuity and ULSG product exposures based on the hedge targets of the respective programs as of the balance sheet date. We intend to maintain an adequate amount of liquid investments in the investment portfolios supporting these businesses to cover any contingent collateral posting requirements from this hedging strategy.
Variable Annuity Exposure Risk Management
With the adoption of VA Reform, our management of, and our hedging strategy associated with, our variable annuity business aligns with the regulatory framework. Given this alignment and our large non-variable annuity business, among other things, we utilize a combined RBC ratio to manage the risk associated with our insurance products through our capital and exposure risk management program. In support of our target combined RBC ratio of 400% to 450% in normal market conditions, we expect to maintain a capital and exposure risk management program that targets total assets supporting our variable annuity contracts at or above the CTE98 level in normal market conditions. We refer to our target level of assets as our “Variable Annuity Target Funding Level.” With our risk management focus on the core drivers of our combined RBC ratio, we can also better manage our RBC in stressed market scenarios. See “Glossary” for the definition of CTE.
When setting our hedge target, we consider the fact that our obligations under Shield Annuity contracts decrease in falling equity markets when variable annuity guarantee obligations increase, and increase in rising equity markets when variable annuity guarantee obligations decrease. Shield Annuities are included with variable annuities in our statutory reserve requirements, as well as in our CTE estimates.
65
Our exposure risk management program seeks to mitigate the potential adverse effects of changes in capital markets, specifically equity markets and interest rates, on our Variable Annuity Target Funding Level, as well as on our statutory free cash flow. We utilize a combination of short-term and longer-term derivative instruments to establish a layered maturity of protection, which we believe will reduce rollover risk during periods of market disruption or higher volatility. We continually review our hedging strategy in the context of our overall capitalization targets and monitor the capital markets for opportunities to adjust our derivative positions to manage our variable annuity exposure, as appropriate.
Under this strategy, we plan to operate with a first loss position of no more than $500 million. The first loss position is relative to our Variable Annuity Target Funding Level such that the impact on reserves, and thus TAC, could be greater than the first loss position. However, under such a scenario there would be an offset in required statutory capital.
In addition, while recent amendments to the Valuation Manual, which became effective on December 31, 2023, changed the requirements for reflecting hedge instruments in reserves and capital, the key pillars of our hedging strategy (including our targeted combined RBC ratio in normal markets, our Variable Annuity Target Funding Level, and our first loss position) were not impacted by this new statutory requirement. See “Business — Regulation — Insurance Regulation — Statutory Accounting, Reserves and Risk-Based Capital” for more information regarding the new statutory requirement and the related impacts.
We believe the level of our capital protection provides us financial flexibility and supports deploying capital for growing long-term, sustainable shareholder value. However, because our hedging strategy places a lower priority on offsetting changes to GAAP liabilities, changes to markets over time, including market volatility, could result in GAAP net income volatility, which could potentially impact stockholders’ equity. See “Risk Factors — Risks Related to Our Business — Our variable annuity exposure risk management strategy may not be effective, may result in significant volatility in our profitability measures or may negatively affect our statutory capital” and “— Summary of Critical Accounting Estimates.”
The gross notional amount and estimated fair value of the derivatives held in our variable annuity hedging program were as follows at:
| December 31, 2023 | December 31, 2022 | |||||||||||||||||||||||||||||||||||||
| Instrument Type | Gross Notional Amount (1) | Estimated Fair Value | Gross Notional Amount (1) | Estimated Fair Value | ||||||||||||||||||||||||||||||||||
| Assets | Liabilities | Assets | Liabilities | |||||||||||||||||||||||||||||||||||
| (In millions) | ||||||||||||||||||||||||||||||||||||||
| Equity index options | $ | 16,183 | $ | 472 | $ | 680 | $ | 13,862 | $ | 525 | $ | 350 | ||||||||||||||||||||||||||
| Equity total return swaps | 53,742 | 2,236 | 2,137 | 32,909 | 520 | 747 | ||||||||||||||||||||||||||||||||
| Interest rate swaps | 30,864 | 92 | 103 | 2,330 | 38 | 46 | ||||||||||||||||||||||||||||||||
| Interest rate options | 27,580 | 39 | 123 | 27,088 | 21 | 126 | ||||||||||||||||||||||||||||||||
| Interest rate forwards | 8,519 | — | 619 | 10,565 | 35 | 1,255 | ||||||||||||||||||||||||||||||||
| Hybrid options | 270 | — | — | — | — | — | ||||||||||||||||||||||||||||||||
| Total | $ | 137,158 | $ | 2,839 | $ | 3,662 | $ | 86,754 | $ | 1,139 | $ | 2,524 | ||||||||||||||||||||||||||
_______________
(1)The gross notional amounts presented do not necessarily represent the relative economic coverage provided by option instruments because certain positions were closed out by entering into offsetting positions that are not netted in the above table.
ULSG Market Risk Exposure Management
The ULSG block includes the business retained by our insurance subsidiaries and the portion of it that is ceded to BRCD for providing redundant, non-economic reinsurance financing support. The primary market risk associated with our ULSG block is the uncertainty around the future levels of U.S. interest rates and bond yields. To help ensure we have sufficient assets to meet future ULSG policyholder obligations, we have employed an actuarial approach based upon ULSG CFT to set our ULSG asset requirement target for BRCD, which reinsures the majority of the ULSG business written by our insurance subsidiaries. For the business retained by our insurance subsidiaries, we set our ULSG asset requirement target to equal the actuarially determined statutory reserves, which, taken together with our ULSG asset requirement target of BRCD, comprises our ULSG Target. Under the ULSG CFT approach, we assume that interest rates remain flat or lower than current levels and our actuarial assumptions include a provision for adverse deviation. These underlying assumptions used in ULSG CFT include scenarios that are more conservative than those required under GAAP, which assumes a long-term upward mean reversion of interest rates and best estimate actuarial assumptions without additional provisions for adverse deviation.
66
We seek to mitigate interest rate exposures associated with these liabilities by holding ULSG Assets to closely match our ULSG Target under different interest rate environments. “ULSG Assets” are defined as (i) total general account assets supporting statutory reserves and capital in the ULSG portfolios of our insurance subsidiaries and BRCD and (ii) interest rate derivative instruments to mitigate ULSG interest rate exposures.
The net statutory reserves for the ULSG business in our insurance subsidiaries and BRCD (which is in part supported by reinsurance financings) were $24.1 billion and $23.4 billion for the years ended December 31, 2023 and 2022, respectively.
Our ULSG Target is sensitive to the actual and future expected level of long-term U.S. interest rates. If interest rates fall, our ULSG Target increases. Likewise, if interest rates rise, our ULSG Target declines. The interest rate derivatives allocated to ULSG Assets prioritizes the ULSG Target (comprised of ULSG CFT and statutory considerations). This could increase the period-to-period volatility of net income and equity due to differences in the sensitivity of the ULSG Target and GAAP liabilities to the changes in interest rates.
We closely monitor the sensitivity of our ULSG Assets and ULSG Target to changes in interest rates. We seek to maintain ULSG Assets above the ULSG Target across a wide range of interest rate scenarios. At December 31, 2023, BRCD assets exceeded the ULSG CFT requirement. Maintaining ULSG Assets that closely match our ULSG Target supports our target combined RBC ratio of 400% to 450% in normal market conditions.
Industry Trends and Uncertainties
Throughout this Management’s Discussion and Analysis of Financial Condition and Results of Operations, we discuss a number of trends and uncertainties that we believe may materially affect our future financial condition, results of operations or cash flows. Where these trends or uncertainties are specific to a particular aspect of our business, we often include such a discussion under the relevant caption of this Management’s Discussion and Analysis of Financial Condition and Results of Operations, as part of our broader analysis of that area of our business. In addition, the following factors represent some of the key general trends and uncertainties that have influenced the development of our business and our historical financial performance and that we believe will continue to influence our business and results of operations in the future.
Changes in Accounting Standards
Our financial statements are subject to the application of GAAP, which is periodically revised by the FASB. The FASB issued new guidance, effective January 1, 2023, that resulted in significant changes to the accounting for long-duration insurance contracts, including a requirement that all variable annuity guarantees be considered MRBs and measured at fair value. See Notes 1 and 2 of the Notes to the Consolidated Financial Statements for a discussion of the impacts. See also “Risk Factors — Risks Related to Our Business — Changes in accounting standards issued by the Financial Accounting Standards Board may adversely affect our financial statements.”
Financial and Economic Environment
Our business and results of operations are materially affected by conditions in the capital markets and the economy generally. Stressed conditions, volatility and disruptions in the capital markets or financial asset classes can have an adverse effect on us. Equity market performance can affect our profitability for variable annuities and other separate account products as a result of the effects it has on product demand, revenues, expenses, reserves and our risk management effectiveness. The level of long-term interest rates and the shape of the yield curve can have a negative effect on the profitability for variable annuities, as well as the demand for, and the profitability of, spread-based products such as fixed annuities, index-linked annuities and universal life insurance. Low interest rates and risk premium, including credit spread, affect new money rates on invested assets and the cost of product guarantees. Insurance premium growth and demand for our products is impacted by the general health of U.S. economic activity. A sustained or material increase in inflation could also affect our business in several ways. During inflationary periods, the value of fixed income investments falls which could increase realized and unrealized losses. Interest rates have increased and may continue to increase due to central bank policy responses to combat inflation, which may positively impact our business in certain respects, but could also increase the risk of a recession or an equity market downturn and could negatively impact various portions of our business, including our investment portfolio. Inflation also increases our expenses (including, among others, for labor and third-party services), potentially putting pressure on profitability if such costs cannot be passed through to policyholders in our product prices. Prolonged and elevated inflation could adversely affect the financial markets and the economy generally and dispelling it may require governments to pursue a restrictive fiscal and monetary policy, which could constrain overall economic activity and inhibit revenue growth. Events involving limited liquidity, defaults, nonperformance or other adverse developments that affect financial institutions or the financial services industry generally, or concerns or rumors about events of these kinds or other similar risks, could adversely affect market-wide liquidity, which could increase the risk of a recession or an equity market downturn and negatively impact various portions of our business, including our investment portfolio. See “Risk Factors — Economic Environment and
67
Capital Markets-Related Risks — If difficult conditions in the capital markets and the U.S. economy generally persist or are perceived to persist, they may materially adversely affect our business and results of operations” and “Risk Factors — Risks Related to our Investment Portfolio — Our investment portfolio is subject to significant financial risks both in the U.S. and global financial markets, including credit risk, interest rate risk, inflation risk, market valuation risk, liquidity risk, real estate risk, derivatives risk, and other factors outside our control, the occurrence of any of which could have a material adverse effect on our financial condition and results of operations.”
The above factors affect our expectations regarding future margins. We review our long-term assumptions about capital markets returns and interest rates, along with other assumptions such as contract holder behavior, as part of our annual actuarial review. As additional company specific or industry information on contract holder behavior becomes available, related assumptions may change and may potentially have a material impact on liability valuations and net income.
We continue to closely monitor political and economic conditions that might contribute to market volatility and their impact on our business operations, investment portfolio and derivatives, such as global inflation, uncertainty and instability in certain asset classes (including commercial real estate), supply chain disruptions and recent geopolitical conflicts, including in Europe and the Middle East. See “— Investments — Current Environment” herein, as well as “Risk Factors — Economic Environment and Capital Markets-Related Risks,” “Risk Factors — Risks Related to Our Investment Portfolio” and “— Risk Management Strategies” for a detailed discussion of financial and economic impacts on our business, including the potential impacts of interest rate risk and inflation risk on our investments and overall business.
Demographics
We believe that demographic trends in the U.S. population, the increase in under-insured individuals, the potential risk to governmental social safety net programs and the shifting of responsibility for retirement planning and financial security from employers and other institutions to individuals, highlight the need of individuals to plan for their long-term financial security and will create opportunities to generate significant demand for our products.
By focusing our product development and marketing efforts to meeting the needs of certain targeted customer segments identified as part of our strategy, we will be able to focus on offering a smaller number of products that we believe are appropriately priced given current economic conditions. We believe this strategy will benefit our expense ratio thereby increasing our profitability.
Competitive Environment
The life insurance industry remains highly fragmented and competitive. See “Business — Competition.” In particular, we believe that financial strength and financial flexibility are highly relevant differentiators from the perspective of customers and distributors. We believe we are adequately positioned to compete in this environment.
Regulatory Developments
Our insurance subsidiaries and BRCD are primarily regulated at the state level, with some products and services also subject to federal regulation. In addition, BHF and its insurance subsidiaries are subject to regulation under the insurance holding company laws of various U.S. jurisdictions. Furthermore, some of our operations, products and services are subject to ERISA, consumer protection laws, securities, broker-dealer and investment advisor regulations, as well as environmental and unclaimed property laws and regulations. See “Business — Regulation,” as well as “Risk Factors — Regulatory and Legal Risks.”
Summary of Critical Accounting Estimates
The preparation of financial statements in conformity with GAAP requires management to adopt accounting policies and make estimates and assumptions that affect amounts reported on the Consolidated Financial Statements.
The most critical estimates include those used in determining:
•liability for future policy benefits (“LFPB”);
•estimated fair values of MRBs;
•estimated fair values of freestanding derivatives and the recognition and estimated fair value of embedded derivatives requiring bifurcation; and
•measurement of income taxes and the valuation of deferred tax assets.
68
In applying our accounting policies, we make subjective and complex judgments that frequently require estimates about matters that are inherently uncertain. Many of these policies, estimates and related judgments are common in the insurance and financial services industries; others are specific to our business and operations. Actual results could differ from these estimates.
The above critical accounting estimates are described below and in Note 1 of the Notes to the Consolidated Financial Statements, which reflect updates related to the adoption of LDTI.
Liability for Future Policy Benefits
The Company establishes an LFPB for income annuities, as well as non-participating term and whole life insurance. LFPBs are accrued over time as revenue is recognized based on a net premium ratio. The net premium ratio is the portion of gross premiums required to provide for all future benefits. LFPBs are established using the Company’s current assumptions of future cash flows, discounted at a rate that approximates a single A corporate bond curve. The Company generally aggregates insurance contracts into groupings by issue year, product and segment for determining the net premium ratio and related LFPBs.
The Company reviews cash flow assumptions regularly, and, if such assumptions change significantly, LFPBs are adjusted by determining a revised net premium ratio. The revised net premium ratio is calculated as of contract inception using both actual historical experience and updated future cash flow assumptions. The recalculated net premium ratio is applied to derive a remeasurement gain or loss recognized in current period net income. The net premium ratio is also updated for the difference between actual and expected experience.
The measurement of our LFPBs can be significantly impacted by changes in assumptions for mortality, policy lapses and market interest rates. See Note 4 of the Notes to the Consolidated Financial Statements for additional information on the effects of changes in assumptions on the measurement of our LFPBs.
The Company establishes liabilities in addition to the account balance for secondary guarantees on universal life insurance. These liabilities are determined by estimating the expected value of death benefits payable when the account balance is projected to be zero and recognizing those benefits ratably over the contract period based on total expected assessments. The benefits used in calculating the liabilities are based on the average benefits payable over a range of scenarios. The Company also maintains a liability for profits followed by losses on ULSG, which is determined by projecting future earnings and establishing a liability to offset losses that are expected to occur in later years. The Company reviews cash flow assumptions regularly, and, if they change significantly, the liability for secondary guarantees is adjusted by a cumulative charge or credit to net income.
The measurement of our ULSG liabilities can be significantly impacted by changes in assumptions for the general account rate of return, which is driven by our assumption for long-term treasury yields, and changes in assumptions for premium, premium persistency, mortality and lapses. The Company’s practice of projecting treasury yields uses a mean reversion approach that assumes that long-term interest rates are less influenced by short-term fluctuations and are only changed when sustained interim deviations are expected. As part of our 2023 AAR, we increased our projected long-term general account earned rate, as well as our mean reversion rate over a period of ten years from 3.50% to 3.75%, which resulted in a decrease in our ULSG liabilities of $259 million. We also updated other assumptions related to ULSG, see “— Results of Operations — Annual Actuarial Review” for more information.
See Note 4 of the Notes to the Consolidated Financial Statements for additional information on the effects of inputs and assumptions on the measurement of ULSG liabilities.
Market Risk Benefits
MRBs principally include guaranteed minimum benefits on variable annuity contracts, including reinsured benefits related to these guarantees.
The estimated fair value of variable annuity guarantees accounted for as MRBs is determined based on the present value of projected future benefits, less the present value of projected future fees attributable to the guarantees. At policy inception, the Company determines an attributed fee ratio by solving for a percentage of projected future rider fees to be collected from the policyholder equal to the present value of projected future guaranteed benefits. To the extent the rider fees are insufficient, the Company may also include fees related to mortality and expense charges in the attributed fee ratio, provided the total fees included in the calculation do not exceed total contract fees and assessments collected from the contract holder. The attributed fee ratio is not updated in subsequent periods.
69
The Company updates the estimated fair value of variable annuity guarantees in subsequent periods by projecting future benefits using capital markets inputs and actuarial assumptions, including expectations of policyholder behavior. A risk neutral valuation methodology is used to project the cash flows from the guarantees under multiple capital markets scenarios. The reported estimated fair value is then determined by taking the present value of these cash flows using a discount rate that incorporates a spread over the risk-free rate to reflect the Company’s nonperformance risk and adding a risk margin (as discussed below). For more information on the determination of estimated fair value of MRBs, see Note 11 of the Notes to the Consolidated Financial Statements.
The valuation of MRBs includes an adjustment for the risk that the Company fails to satisfy its obligations, which is referred to as nonperformance risk. The nonperformance risk adjustment is captured as an additional spread applied to the risk-free rate in determining the rate to discount the cash flows of the liability. The spread over the risk-free rate is based on our creditworthiness taking into consideration publicly available information relating to spreads in the secondary market for Brighthouse Financial’s debt. These observable spreads are then adjusted, as necessary, to reflect the financial strength ratings of the issuing insurance subsidiaries as compared to the credit rating of Brighthouse Financial.
Risk margins are established to capture the non-capital markets risks of the instrument which represent the additional compensation a market participant would require to assume the risks related to the uncertainties in certain actuarial assumptions. The establishment of risk margins requires the use of significant actuarial judgment, including assumptions of the amount needed to cover the guarantees.
Actuarial assumptions are reviewed at least annually, and if they change significantly, the estimated fair value is adjusted through net income. Capital market inputs used in the measurement of variable annuity guarantees are updated quarterly through net income, except for the change attributable to the Company’s nonperformance risk, which is reported in OCI.
Market conditions, including, but not limited to, changes in interest rates, equity indices, market volatility and variations in actuarial assumptions, including policyholder behavior, mortality and risk margins related to non-capital markets inputs, as well as changes in nonperformance risk, may result in significant fluctuations in the estimated fair value of the guarantees. In 2023, the Company updated assumptions regarding policyholder behavior, mortality, separate account fund allocations and volatility. See Note 5 of the Notes to the Consolidated Financial Statements for additional information on the effects of changes in inputs and assumptions on the measurement of our liabilities for variable annuity guarantees.
Derivatives
We use freestanding derivative instruments to hedge various capital markets risks in our products, including: (i) certain variable annuity guarantees, which are reported as MRBs; (ii) index-linked interest credited features, which are reported as embedded derivatives; (iii) current or future changes in the fair value of our assets and liabilities; and (iv) current or future changes in cash flows. All derivatives, whether freestanding or embedded, are required to be carried on the balance sheet at fair value with changes reflected in either net income (loss) available to shareholders or in OCI, depending on the type of hedge. Below is a summary of critical accounting estimates by type of derivative.
Freestanding Derivatives
The determination of the estimated fair value of freestanding derivatives, when quoted market values are not available, is based on market standard valuation methodologies and inputs that management believes are consistent with what other market participants would use when pricing such instruments. Derivative valuations can be affected by changes in interest rates, foreign currency exchange rates, financial indices, credit spreads, default risk, nonperformance risk, volatility, liquidity and changes in estimates and assumptions used in the pricing models. See Note 10 of the Notes to the Consolidated Financial Statements for additional information on significant inputs into the OTC derivative pricing models and credit risk adjustment.
Embedded Derivatives in Index-Linked Annuities
The Company issues, and assumes through reinsurance, index-linked annuities, including Shield, that contain crediting rates classified as embedded derivatives. The crediting rates are measured at estimated fair value separately from the fixed annuity host contracts, which is determined using a combination of an option pricing methodology and an option-budget approach. The estimated fair value includes capital market inputs and actuarial policyholder behavior assumptions, including expectations for renewals at the end of the term period. Actuarial assumptions are reviewed at least annually, and, if they change significantly, the estimated fair value is adjusted through net income. Capital market inputs used in the measurement of crediting rate embedded derivatives are updated quarterly through net income.
70
Market conditions, including interest rates and implied volatilities, and variations in actuarial assumptions and risk margins, as well as changes in our nonperformance risk adjustment, may result in significant fluctuations in the estimated fair value that could have a material impact on net income. See Note 11 of the Notes to the Consolidated Financial Statements for more information on the determination of estimated fair value of crediting rate embedded derivatives.
Income Taxes
We provide for federal and state income taxes currently payable, as well as those deferred due to temporary differences between the financial reporting and tax bases of assets and liabilities. Our accounting for income taxes represents our best estimate of various events and transactions. Tax laws are often complex and may be subject to differing interpretations by the taxpayer and the relevant governmental taxing authorities. In establishing a provision for income tax expense, we must make judgments and interpretations about the application of tax laws. We must also make estimates about when in the future certain items will affect taxable income in the various taxing jurisdictions.
In establishing a liability for unrecognized tax benefits, assumptions may be made in determining whether, and to what extent, a tax position may be sustained. Once established, unrecognized tax benefits are adjusted when there is more information available or when events occur requiring a change.
Valuation allowances are established against deferred tax assets, particularly those arising from carryforwards, when management determines, based on available information, that it is more likely than not that deferred income tax assets will not be realized. The realization of deferred tax assets related to carryforwards depends upon the existence of sufficient taxable income within the carryforward periods under the tax law in the applicable tax jurisdiction. Significant judgment is required in projecting future taxable income to determine whether valuation allowances should be established, as well as the amount of such allowances. See Note 1 of the Notes to the Consolidated Financial Statements for additional information relating to our determination of such valuation allowances.
We may be required to change our provision for income taxes when estimates used in determining valuation allowances on deferred tax assets significantly change, or when new information indicates the need for adjustment in valuation allowances. Additionally, future events, such as changes in tax laws, tax regulations, or interpretations of such laws or regulations, could have an impact on the provision for income tax and the effective tax rate. Any such changes could significantly affect the amounts reported in the financial statements in the year these changes occur.
See Notes 1 and 16 of the Notes to the Consolidated Financial Statements as well as “Business — Regulation — Federal Tax Reform” for additional information on our income taxes.
Non-GAAP and Other Financial Disclosures
Our definitions of non-GAAP and other financial measures may differ from those used by other companies.
Non-GAAP Financial Disclosures
Adjusted Earnings
In this report, we present adjusted earnings as a measure of our performance that is not calculated in accordance with GAAP. Adjusted earnings is used by management to evaluate performance and facilitate comparisons to industry results. We believe the presentation of adjusted earnings, as the Company measures it for management purposes, enhances the understanding of our performance by the investor community by highlighting the results of operations and the underlying profitability drivers of our business. Adjusted earnings should not be viewed as a substitute for net income (loss) available to Brighthouse Financial, Inc.’s common shareholders, which is the most directly comparable financial measure calculated in accordance with GAAP. See “— Results of Operations” for a reconciliation of adjusted earnings to net income (loss) available to Brighthouse Financial, Inc.’s common shareholders.
Adjusted earnings, which may be positive or negative, focuses on our primary businesses by excluding the impact of market volatility, which could distort trends.
The following are significant items excluded from total revenues in calculating adjusted earnings:
•Net investment gains (losses); and
•Net derivative gains (losses), excluding earned income and amortization of premium on derivatives that are hedges of investments or that are used to replicate certain investments, but do not qualify for hedge accounting treatment (“Investment Hedge Adjustments”).
71
The following are significant items excluded from total expenses in calculating adjusted earnings:
•Change in MRBs; and
•Change in fair value of the crediting rate on experience-rated contracts (“Market Value Adjustments”).
The provision for income tax related to adjusted earnings is calculated using the statutory tax rate of 21%, net of impacts related to the dividends received deduction, tax credits and current period non-recurring items.
We present adjusted earnings in a manner consistent with management’s view of the primary business activities that drive the profitability of our core businesses. The following table illustrates how each component of adjusted earnings is calculated from the GAAP statements of operations line items:
| Component of Adjusted Earnings | How Derived from GAAP (1) | ||||||||||
| (i) | Fee income | (i) | Universal life and investment-type product policy fees plus Other revenues. | ||||||||
| (ii) | Net investment spread | (ii) | Net investment income plus Investment Hedge Adjustments reduced by Interest credited to policyholder account balances (excluding Market Value Adjustments) and interest on future policy benefits. | ||||||||
| (iii) | Insurance-related activities | (iii) | Premiums less Policyholder benefits and claims, excluding interest on future policy benefits. | ||||||||
| (iv) | Amortization of DAC and VOBA | (iv) | Amortization of deferred policy acquisition costs (“DAC”) and value of business acquired (“VOBA”). | ||||||||
| (v) | Other expenses | (v) | Other expenses. | ||||||||
| (vi) | Provision for income tax expense (benefit) | (vi) | Tax impact of the above items, calculated using the statutory tax rate of 21%, net of impacts related to the dividends received deduction, tax credits and current period non-recurring items. | ||||||||
_______________
(1)Italicized items indicate GAAP statements of operations line items.
Consistent with GAAP guidance for segment reporting, adjusted earnings is also our GAAP measure of segment performance. Accordingly, we report adjusted earnings by segment in Note 3 of the Notes to the Consolidated Financial Statements.
Adjusted Net Investment Income
We present adjusted net investment income to measure our performance for management purposes, and we believe it enhances the understanding of our investment portfolio results. Adjusted net investment income represents GAAP net investment income plus Investment Hedge Adjustments. For a reconciliation of adjusted net investment income to net investment income, the most directly comparable GAAP measure, see table note (3) to the summary yield table located in “— Investments — Current Environment — Investment Portfolio Results.”
Other Financial Disclosures
Similar to adjusted net investment income, we present net investment income yields as a performance measure we believe enhances the understanding of our investment portfolio results. Net investment income yields are calculated on adjusted net investment income as a percentage of average quarterly asset carrying values. Asset carrying values exclude unrealized gains (losses), collateral received in connection with our securities lending program, freestanding derivative assets and collateral received from derivative counterparties. Investment fee and expense yields are calculated as a percentage of average quarterly asset estimated fair values. Asset estimated fair values exclude collateral received in connection with our securities lending program, freestanding derivative assets and collateral received from derivative counterparties.
72
Results of Operations
Index to Results of Operations
| Page | |||||
Consolidated Results for the Years Ended December 31, 2023 and 2022 | |||||
Consolidated Results for the Years Ended December 31, 2023 and 2022 - Adjusted Earnings | |||||
Segments and Corporate & Other Results for the Years Ended December 31, 2023 and 2022 - Adjusted Earnings | |||||
Annuity Guaranteed Benefits and Shield Annuity Liabilities for the Years Ended December 31, 2023 and 2022 | |||||
73
Annual Actuarial Review
We typically conduct our AAR in the third quarter of each year. As part of the 2023 AAR, for our ULSG business, we increased the long-term general account earned rate, driven by an increase in the mean reversion rate from 3.50% to 3.75%. Also, with respect to our ULSG business, we updated assumptions regarding policyholder behavior, including mortality, premium persistency, lapses, withdrawals and maintenance expenses. For our variable annuity business, we updated our annuitization, mortality, lapses and withdrawals, as well as separate account assumptions, including fund fees, allocations and volatility. For term participating and non-participating whole life insurance, we updated assumptions regarding mortality and lapses.
As part of the 2022 AAR, for our ULSG business, we increased the long-term general account earned rate, driven by an increase in the mean reversion rate from 3.00% to 3.50%. Also, with respect to our ULSG business, we updated assumptions regarding policyholder behavior, including mortality, premium persistency, lapses, withdrawals and maintenance expenses. For our variable annuity business, we updated our fund allocations, mortality, lapses and withdrawals. For term and non-participating whole life insurance, we updated assumptions regarding mortality and lapses.
The impact on income (loss) available to shareholders before provision for income tax was as follows:
| Years Ended December 31, | ||||||||||||||
| 2023 | 2022 | |||||||||||||
| (In millions) | ||||||||||||||
Market risk benefits | $ | (251) | $ | (210) | ||||||||||
| Included in pre-tax adjusted earnings: | ||||||||||||||
| Other annuity business | 15 | (125) | ||||||||||||
| Life business | (90) | (20) | ||||||||||||
| Run-off | 119 | 319 | ||||||||||||
| Total included in pre-tax adjusted earnings | 44 | 174 | ||||||||||||
| Total impact on income (loss) available to shareholders before provision for income tax | $ | (207) | $ | (36) | ||||||||||
74
Consolidated Results for the Years Ended December 31, 2023 and 2022
Unless otherwise noted, all amounts in the following discussions of our results of operations are stated before income tax except for adjusted earnings, which are presented net of income tax.
| Years Ended December 31, | ||||||||||||||
| 2023 | 2022 | |||||||||||||
| (In millions) | ||||||||||||||
Revenues | ||||||||||||||
Premiums | $ | 828 | $ | 662 | ||||||||||
Universal life and investment-type product policy fees | 2,295 | 2,435 | ||||||||||||
Net investment income | 4,664 | 4,138 | ||||||||||||
Other revenues | 483 | 478 | ||||||||||||
Net investment gains (losses) | (246) | (248) | ||||||||||||
Net derivative gains (losses) | (3,907) | (592) | ||||||||||||
| Total revenues | 4,117 | 6,873 | ||||||||||||
Expenses | ||||||||||||||
Policyholder benefits and claims (including liability remeasurement gains (losses) of ($234) and $137, respectively) | 2,676 | 2,193 | ||||||||||||
Interest credited to policyholder account balances | 1,825 | 1,338 | ||||||||||||
Amortization of DAC and VOBA | 620 | 629 | ||||||||||||
| Change in market risk benefits | (1,507) | (4,104) | ||||||||||||
Interest expense on debt | 153 | 153 | ||||||||||||
Other expenses | 1,824 | 1,932 | ||||||||||||
| Total expenses | 5,591 | 2,141 | ||||||||||||
Income (loss) before provision for income tax | (1,474) | 4,732 | ||||||||||||
Provision for income tax expense (benefit) | (367) | 848 | ||||||||||||
| Net income (loss) | (1,107) | 3,884 | ||||||||||||
Less: Net income (loss) attributable to noncontrolling interests | 5 | 5 | ||||||||||||
| Net income (loss) attributable to Brighthouse Financial, Inc. | (1,112) | 3,879 | ||||||||||||
Less: Preferred stock dividends | 102 | 104 | ||||||||||||
Net income (loss) available to Brighthouse Financial, Inc.’s common shareholders | $ | (1,214) | $ | 3,775 | ||||||||||
The components of net income (loss) available to shareholders were as follows:
| Years Ended December 31, | ||||||||||||||
| 2023 | 2022 | |||||||||||||
| (In millions) | ||||||||||||||
| Change in market risk benefits | $ | 1,507 | $ | 4,104 | ||||||||||
Net investment gains (losses) | (246) | (248) | ||||||||||||
| Net derivative gains (losses), excluding investment hedge adjustments | (4,012) | (663) | ||||||||||||
| Market value adjustments | (12) | 87 | ||||||||||||
Pre-tax adjusted earnings, less net income (loss) attributable to noncontrolling interests and preferred stock dividends | 1,182 | 1,343 | ||||||||||||
Income (loss) available to shareholders before provision for income tax | (1,581) | 4,623 | ||||||||||||
Provision for income tax expense (benefit) | (367) | 848 | ||||||||||||
| Net income (loss) available to shareholders | $ | (1,214) | $ | 3,775 | ||||||||||
Change in Market Risk Benefits. The change in MRBs reflects changes in the projected value of annuity guaranteed benefits discounted at current risk-free rates, plus a nonperformance risk spread that is locked-in at policy issuance.
Net Derivative Gains (Losses), Excluding Investment Hedge Adjustments. We have certain derivative instruments for which changes in estimated fair value are recognized in net derivative gains (losses). See “— Non-GAAP and Other Financial Disclosures — Non-GAAP Financial Disclosures — Adjusted Earnings.”
75
Freestanding Derivatives. We have freestanding derivatives that economically hedge certain invested assets and insurance liabilities. The majority of this hedging activity is focused in the following areas:
•use of a proprietary mix of derivative instruments to hedge variable annuity guaranteed benefit riders against adverse changes in capital markets;
•use of interest rate swaps, swaptions and interest rate forwards in connection with our ULSG business;
•use of interest rate swaps when we have duration mismatches where suitable assets with maturities similar to those of our long-dated liabilities are not readily available in the market;
•use of interest rate forwards hedging reinvestment risk from maturing assets with higher yields than currently available in the market that support long-dated liabilities;
•use of foreign currency swaps when we hold fixed maturity securities denominated in foreign currencies that are matching insurance liabilities denominated in U.S. dollars; and
•use of equity index options to hedge index-linked annuity products against adverse changes in equity markets.
Embedded Derivatives. The changes in liability values of our fixed index-linked annuity and Shield products that result from changes in the underlying equity index are accounted for as embedded derivatives. In addition, certain ceded reinsurance agreements in our Life and Run-off segments are written on a coinsurance with funds withheld basis. The funds withheld component is accounted for as an embedded derivative with changes in the estimated fair value recognized in net income (loss) in the period in which they occur.
Market Value Adjustments. See “— Non-GAAP and Other Financial Disclosures — Non-GAAP Financial Disclosures — Adjusted Earnings.”
Pre-tax Adjusted Earnings. See “— Non-GAAP and Other Financial Disclosures — Non-GAAP Financial Disclosures — Adjusted Earnings.”
Year Ended December 31, 2023 Compared with the Year Ended December 31, 2022
Loss available to shareholders before provision for income tax was $1.6 billion ($1.2 billion, net of income tax), a decrease of $6.2 billion ($5.0 billion, net of income tax) from income available to shareholders before provision for income tax of $4.6 billion ($3.8 billion, net of income tax) in the prior period.
The decrease in income before provision for income tax was driven by the following unfavorable items:
•losses from variable annuity guaranteed benefit riders, see “— Annuity Guaranteed Benefits and Shield Annuity Liabilities for the Years Ended December 31, 2023 and 2022,” and
•lower pre-tax adjusted earnings, as discussed in greater detail below.
The decrease in income before provision for income tax was partially offset by the favorable impact of long-term interest rates on interest rate derivatives used to manage interest rate exposure in our ULSG business, as the long-term interest rate increased less in the current period resulting in a loss of $197 million and increased more in the prior period resulting in a loss of $1.9 billion;
The provision for income tax, expressed as a percentage of income (loss) before provision for income tax, resulted in an effective tax rate of 25% in the current period compared to 18% in the prior period. Our effective tax rate differs from the statutory tax rate primarily due to the impacts of the dividends received deduction, tax credits and current period non-recurring items.
76
Reconciliation of Net Income (Loss) Available to Shareholders to Adjusted Earnings
The reconciliation of net income (loss) available to shareholders to adjusted earnings was as follows:
| Year Ended December 31, 2023 | ||||||||||||||||||||||||||||||||
| Annuities | Life | Run-off | Corporate & Other | Total | ||||||||||||||||||||||||||||
| (In millions) | ||||||||||||||||||||||||||||||||
| Net income (loss) available to shareholders | $ | (1,253) | $ | (83) | $ | 563 | $ | (441) | $ | (1,214) | ||||||||||||||||||||||
| Add: Provision for income tax expense (benefit) | 263 | (16) | (913) | 299 | (367) | |||||||||||||||||||||||||||
| Income (loss) available to shareholders before provision for income tax | (990) | (99) | (350) | (142) | (1,581) | |||||||||||||||||||||||||||
| Less: Net investment gains (losses) | (169) | (28) | (33) | (16) | (246) | |||||||||||||||||||||||||||
Less: Net derivative gains (losses), excluding investment hedge adjustments of $ | (3,765) | (2) | (205) | (40) | (4,012) | |||||||||||||||||||||||||||
| Less: Change in market risk benefits | 1,507 | — | — | — | 1,507 | |||||||||||||||||||||||||||
| Less: Market value adjustments | — | — | (12) | — | (12) | |||||||||||||||||||||||||||
Pre-tax adjusted earnings, less net income (loss) attributable to noncontrolling interests and preferred stock dividends | 1,437 | (69) | (100) | (86) | 1,182 | |||||||||||||||||||||||||||
| Less: Provision for income tax expense (benefit) | 268 | (16) | (23) | (16) | 213 | |||||||||||||||||||||||||||
| Adjusted earnings | $ | 1,169 | $ | (53) | $ | (77) | $ | (70) | $ | 969 | ||||||||||||||||||||||
| Year Ended December 31, 2022 | ||||||||||||||||||||||||||||||||
| Annuities | Life | Run-off | Corporate & Other | Total | ||||||||||||||||||||||||||||
| (In millions) | ||||||||||||||||||||||||||||||||
| Net income (loss) available to shareholders | $ | 5,967 | $ | 47 | $ | (2,274) | $ | 35 | $ | 3,775 | ||||||||||||||||||||||
| Add: Provision for income tax expense (benefit) | 420 | 16 | 569 | (157) | 848 | |||||||||||||||||||||||||||
| Income (loss) available to shareholders before provision for income tax | 6,387 | 63 | (1,705) | (122) | 4,623 | |||||||||||||||||||||||||||
| Less: Net investment gains (losses) | (149) | (33) | (78) | 12 | (248) | |||||||||||||||||||||||||||
Less: Net derivative gains (losses), excluding investment hedge adjustments of $ | 1,115 | 2 | (1,823) | 43 | (663) | |||||||||||||||||||||||||||
| Less: Change in market risk benefits | 4,104 | — | — | — | 4,104 | |||||||||||||||||||||||||||
| Less: Market value adjustments | — | — | 87 | — | 87 | |||||||||||||||||||||||||||
Pre-tax adjusted earnings, less net income (loss) attributable to noncontrolling interests and preferred stock dividends | 1,317 | 94 | 109 | (177) | 1,343 | |||||||||||||||||||||||||||
| Less: Provision for income tax expense (benefit) | 247 | 16 | 22 | (126) | 159 | |||||||||||||||||||||||||||
| Adjusted earnings | $ | 1,070 | $ | 78 | $ | 87 | $ | (51) | $ | 1,184 | ||||||||||||||||||||||
77
Consolidated Results for the Years Ended December 31, 2023 and 2022 - Adjusted Earnings
The components of adjusted earnings were as follows:
| Years Ended December 31, | ||||||||||||||
| 2023 | 2022 | |||||||||||||
| (In millions) | ||||||||||||||
| Fee income | $ | 2,778 | $ | 2,913 | ||||||||||
| Net investment spread | 2,855 | 2,680 | ||||||||||||
| Insurance-related activities | (1,747) | (1,427) | ||||||||||||
| Amortization of DAC and VOBA | (620) | (629) | ||||||||||||
| Other expenses | (1,977) | (2,085) | ||||||||||||
Less: Net income (loss) attributable to noncontrolling interests and preferred stock dividends | 107 | 109 | ||||||||||||
Pre-tax adjusted earnings, less net income (loss) attributable to noncontrolling interests and preferred stock dividends | 1,182 | 1,343 | ||||||||||||
| Provision for income tax expense (benefit) | 213 | 159 | ||||||||||||
| Adjusted earnings | $ | 969 | $ | 1,184 | ||||||||||
Year Ended December 31, 2023 Compared with the Year Ended December 31, 2022
Adjusted earnings were $969 million in the current period, a decrease of $215 million.
Key net unfavorable impacts were:
•higher net costs associated with insurance-related activities due to:
◦an increase in liability balances resulting from actuarial model refinements in the prior period; and
◦a net increase in liability balances resulting from year-over-year changes made in connection with the AAR;
partially offset by
◦lower liabilities from the impact of new reinsurance agreements entered into in the prior period; and
◦lower paid claims, net of reinsurance, in our Run-off and Life segments; and
•lower net fee income due to:
◦lower asset-based fees resulting from lower average separate account balances, a portion of which is offset in other expenses; and
◦a decline in the net cost of insurance fees driven by the aging in-force business in our Run-off segment;
partially offset by
◦lower ceded cost of insurance fees consistent with favorable equity market returns in our Life segment, which is mostly offset in other expenses.
Key net favorable impacts were:
•higher net investment spread due to:
◦higher investment yields and average invested long-term assets from funding agreements issued in connection with our institutional spread margin business;
◦higher average invested assets resulting from positive net flows in the general account;
◦higher investment yields on our fixed income portfolio, as proceeds from maturing investments and the growth in the investment portfolio were invested at higher yields than the portfolio average; and
◦higher returns from short-term investments;
partially offset by
◦higher interest credited to policyholders due to higher account balances, net of changes made in the prior period in connection with the AAR, and current period actuarial modeling improvements;
◦lower returns on investments in real estate limited partnerships and limited liability companies (“LLC”); and
78
◦lower income from our securities lending program; and
•lower other expenses due to:
◦the settlement of a reinsurance-related matter in the prior period;
◦higher systems conversion costs in the prior period;
◦lower asset-based variable annuity expenses resulting from lower average separate account balances, a portion of which is offset in fee income; and
◦lower transition services agreement expenses;
partially offset by
◦higher deferred compensation and operational expenses;
◦lower ceded cost of insurance expenses consistent with favorable equity market returns in our Life segment, which is offset in fee income;
◦lower interest expenses in the prior period related to prior year tax matters; and
◦higher legal reserves.
The provision for income tax, expressed as a percentage of pre-tax adjusted earnings, resulted in an effective tax rate of 17% in the current period compared to 11% in the prior period. Our effective tax rate differs from the statutory tax rate primarily due to the impacts of the dividends received deduction, tax credits and current period non-recurring items.
Segments and Corporate & Other Results for the Years Ended December 31, 2023 and 2022 — Adjusted Earnings
Annuities
The components of adjusted earnings for our Annuities segment were as follows:
| Years Ended December 31, | ||||||||||||||
| 2023 | 2022 | |||||||||||||
| (In millions) | ||||||||||||||
| Fee income | $ | 1,999 | $ | 2,142 | ||||||||||
| Net investment spread | 1,514 | 1,364 | ||||||||||||
| Insurance-related activities | (169) | (257) | ||||||||||||
| Amortization of DAC and VOBA | (516) | (515) | ||||||||||||
| Other expenses | (1,391) | (1,417) | ||||||||||||
| Pre-tax adjusted earnings | 1,437 | 1,317 | ||||||||||||
| Provision for income tax expense (benefit) | 268 | 247 | ||||||||||||
| Adjusted earnings | $ | 1,169 | $ | 1,070 | ||||||||||
A significant portion of our adjusted earnings is driven by separate account balances related to our variable annuity business, as these balances determine asset-based fee income and commissions. The changes in our variable annuities separate account balances are presented in Note 6 of the Notes to the Consolidated Financial Statements.
Year Ended December 31, 2023 Compared with the Year Ended December 31, 2022
Adjusted earnings were $1.2 billion in the current period, an increase of $99 million.
Key net favorable impacts were:
•higher net investment spread due to:
◦higher average invested assets resulting from positive net flows in the general account;
◦higher investment yields on our fixed income portfolio, as proceeds from maturing investments and the growth in the investment portfolio were invested at higher yields than the portfolio average; and
◦higher returns from short-term investments;
partially offset by
79
◦higher interest credited to policyholders due to higher account balances, net of changes made in the prior period in connection with the AAR, and current period actuarial modeling improvements;
◦lower returns on investments in real estate limited partnerships and LLCs; and
◦lower income from our securities lending program;
•lower costs associated with insurance-related activities due to:
◦a net decrease in liability balances resulting from year-over-year changes made in connection with the AAR; and
◦an increase in income annuity underwriting margins; and
•lower other expenses due to:
◦lower asset-based variable annuity expenses resulting from lower average separate account balances, a portion of which is offset in fee income; and
◦lower transition services agreement expenses;
partially offset by
◦higher operational and deferred compensation expenses.
Key unfavorable impact was lower fee income due to lower asset-based fees resulting from lower average separate account balances, a portion of which is offset in other expenses.
The provision for income tax, expressed as a percentage of pre-tax adjusted earnings, resulted in an effective tax rate of 19% in both the current period and the prior period. Our effective tax rate differs from the statutory tax rate primarily due to the impact of the dividends received deduction.
Life
The components of adjusted earnings for our Life segment were as follows:
| Years Ended December 31, | ||||||||||||||
| 2023 | 2022 | |||||||||||||
| (In millions) | ||||||||||||||
| Fee income | $ | 282 | $ | 234 | ||||||||||
| Net investment spread | 239 | 263 | ||||||||||||
| Insurance-related activities | (283) | (159) | ||||||||||||
| Amortization of DAC and VOBA | (104) | (114) | ||||||||||||
| Other expenses | (203) | (130) | ||||||||||||
| Pre-tax adjusted earnings | (69) | 94 | ||||||||||||
| Provision for income tax expense (benefit) | (16) | 16 | ||||||||||||
| Adjusted earnings | $ | (53) | $ | 78 | ||||||||||
Year Ended December 31, 2023 Compared with the Year Ended December 31, 2022
Adjusted earnings were a loss of $53 million in the current period, a decrease of $131 million.
Key net unfavorable impacts were:
•higher net costs associated with insurance-related activities due to:
◦a net increase in liability balances resulting from year-over-year changes made in connection with the AAR;
partially offset by
◦lower paid claims, net of reinsurance;
•higher other expenses due to:
◦lower ceded cost of insurance expenses consistent with favorable equity market returns, which is offset in fee income; and
◦higher deferred compensation and operational expenses; and
80
•lower net investment spread due to lower income from our securities lending program.
Key favorable impact was higher fee income due to lower ceded cost of insurance fees consistent with favorable equity market returns, which is offset in other expenses.
The provision for income tax, expressed as a percentage of pre-tax adjusted earnings, resulted in an effective tax rate of 23% in the current period compared to 17% in the prior period. Our effective tax rate differs from the statutory tax rate primarily due to the impact of the dividends received deduction.
Run-off
The components of adjusted earnings for our Run-off segment were as follows:
| Years Ended December 31, | ||||||||||||||
| 2023 | 2022 | |||||||||||||
| (In millions) | ||||||||||||||
| Fee income | $ | 495 | $ | 537 | ||||||||||
| Net investment spread | 867 | 876 | ||||||||||||
| Insurance-related activities | (1,295) | (1,011) | ||||||||||||
| Amortization of DAC and VOBA | — | — | ||||||||||||
| Other expenses | (167) | (293) | ||||||||||||
| Pre-tax adjusted earnings | (100) | 109 | ||||||||||||
| Provision for income tax expense (benefit) | (23) | 22 | ||||||||||||
| Adjusted earnings | $ | (77) | $ | 87 | ||||||||||
Year Ended December 31, 2023 Compared with the Year Ended December 31, 2022
Adjusted earnings were a loss of $77 million in the current period, a decrease of $164 million.
Key net unfavorable impacts were:
•higher net costs associated with insurance-related activities due to:
◦an increase in liability balances resulting from actuarial model refinements in the prior period; and
◦a net increase in liability balances resulting from year-over-year changes made in connection with the AAR;
partially offset by
◦lower liabilities from the impact of new reinsurance agreements entered into in the prior period; and
◦lower paid claims, net of reinsurance;
•lower fee income due to a decline in the net cost of insurance fees driven by the aging in-force business; and
•lower net investment spread due to:
◦lower average invested assets; and
◦lower income from our securities lending program.
Key favorable impact was lower other expenses due to the settlement of a reinsurance-related matter in the prior period.
The provision for income tax, expressed as a percentage of pre-tax adjusted earnings, resulted in an effective tax rate of 23% in the current period compared to 20% in the prior period. Our effective tax rate differs from the statutory tax rate primarily due to the impact of the dividends received deduction.
81
Corporate & Other
The components of adjusted earnings for Corporate & Other were as follows:
| Years Ended December 31, | ||||||||||||||
| 2023 | 2022 | |||||||||||||
| (In millions) | ||||||||||||||
| Fee income | $ | 2 | $ | — | ||||||||||
| Net investment spread | 235 | 177 | ||||||||||||
| Insurance-related activities | — | — | ||||||||||||
| Amortization of DAC and VOBA | — | — | ||||||||||||
| Other expenses | (216) | (245) | ||||||||||||
| Less: Net income (loss) attributable to noncontrolling interests and preferred stock dividends | 107 | 109 | ||||||||||||
Pre-tax adjusted earnings, less net income (loss) attributable to noncontrolling interests and preferred stock dividends | (86) | (177) | ||||||||||||
| Provision for income tax expense (benefit) | (16) | (126) | ||||||||||||
| Adjusted earnings | $ | (70) | $ | (51) | ||||||||||
Year Ended December 31, 2023 Compared with the Year Ended December 31, 2022
Adjusted earnings were a loss of $70 million in the current period, a higher loss of $19 million.
The provision for income tax, expressed as a percentage of pre-tax adjusted earnings, resulted in a lower effective tax rate in the current period compared to the prior period. Our effective tax rate differs from the statutory tax rate primarily due to the impacts of the dividends received deduction and tax credits. We believe the effective tax rate for Corporate & Other is not generally meaningful, neither on a standalone basis nor for comparison to prior periods, since taxes for Corporate & Other are derived from the difference between the overall consolidated effective tax rate and total taxes for the combined operating segments.
Key net favorable pre-tax adjusted earnings, less net income (loss) attributable to noncontrolling interests and preferred stock dividends impacts were:
•higher net investment spread due to:
◦higher investment yields and average invested long-term assets from funding agreements issued in connection with our institutional spread margin business; and
◦higher returns from short-term investments;
partially offset by
◦lower income from our securities lending program; and
•lower other expenses due to:
◦higher systems conversion costs in the prior period;
partially offset by
◦lower interest expenses in the prior period related to prior year tax matters; and
◦higher legal reserves.
82
Annuity Guaranteed Benefits and Shield Annuity Liabilities for the Years Ended December 31, 2023 and 2022
The overall impact on income (loss) available to shareholders before provision for income tax from the performance of annuity guaranteed benefits and Shield annuity liabilities, which includes (i) changes in the fair value of liabilities and reinsurance, (ii) fees net of claims and (iii) the mark-to-market of hedges, was as follows:
| Years Ended December 31, | ||||||||||||||
| 2023 | 2022 | |||||||||||||
| (In millions) | ||||||||||||||
| Market risk benefits mark-to-market | $ | 903 | $ | 3,382 | ||||||||||
| Annuity guaranteed benefit rider fees, net of claims | 635 | 773 | ||||||||||||
| Ceded reinsurance | (31) | (51) | ||||||||||||
Total changes attributable to annuity guaranteed benefits | 1,507 | 4,104 | ||||||||||||
| Variable annuity hedges | 369 | (1,551) | ||||||||||||
| Shield embedded derivatives | (4,129) | 2,679 | ||||||||||||
Total | $ | (2,253) | $ | 5,232 | ||||||||||
Market Risk Benefits Mark-to-Market. Annuity guaranteed rider benefits are accounted for as MRBs. MRBs related to guaranteed rider benefits represent the current estimated fair value of the obligation to protect policyholders against the possibility that a downturn in the markets will reduce the specified benefits that can be claimed under the base annuity contract. Any periods of significant or sustained downturns in equity markets, increased equity volatility, or reduced interest rates could result in an increase in the valuation of these liabilities. An increase in these liabilities would result in a decrease to our net income (loss) available to shareholders, which could be significant.
Annuity Guaranteed Benefit Rider Fees, Net of Claims. We earn fees from the guaranteed rider benefits, which are calculated using the policyholder’s Benefit Base. Fees calculated using the Benefit Base are more stable in market downturns, compared to fees based on the account value because the Benefit Base excludes the impact of a decline in the market value of the policyholder’s account value. We use the fees directly earned from the guarantee riders to fund the reserves, future claims and costs associated with the hedges of market risks inherent in these liabilities. The future fees are included in the estimated fair value of MRB liabilities, with changes recorded in MRBs.
Variable Annuity Hedges and Reinsurance. We enter into freestanding derivatives to hedge certain aspects of the annuity guaranteed benefits accounted for as MRBs and index-linked crediting rates accounted for as embedded derivatives. Generally, the same market factors that impact the estimated fair value of the annuity guaranteed benefits impact the value of the hedges, though in the opposite direction. However, the changes in value of MRBs and related hedges may not be symmetrical and the divergence could be significant due to certain factors, including unhedged risks within MRBs. We may also use reinsurance to manage our exposure related to MRBs.
Shield Embedded Derivatives. Shield Annuities provide the contract holder the ability to participate in the appreciation of certain financial markets up to a stated level, while offering protection from a portion of declines in the applicable indices or benchmark. Shield embedded derivatives represent the estimated fair value of these features. We believe that Shield Annuities provide us with a risk offset to liabilities related to guaranteed rider benefits.
See “— Risk Management Strategies — Variable Annuity Exposure Risk Management” for discussion of our management of our hedging strategy associated with our variable annuity business, which remains unchanged following the adoption of LDTI.
Year Ended December 31, 2023 Compared with the Year Ended December 31, 2022
Annuity guaranteed benefits and Shield annuity liabilities performance was unfavorable for the year ended December 31, 2023, primarily driven by:
•decreases in annuity guaranteed benefits liabilities due to increasing equity markets and interest rates, partially offset by changes made in connection with the AAR;
•favorable changes in variable annuity hedges due to increasing equity markets, partially offset by increasing long-term interest rates; and
•unfavorable changes in Shield embedded derivatives due to increasing equity markets.
83
Annuity guaranteed benefits and Shield annuity liabilities performance was favorable for the year ended December 31, 2022, primarily driven by:
•decreases in annuity guaranteed benefits liabilities due to increasing interest rates, partially offset by decreasing equity markets and changes made in connection with the AAR;
•unfavorable changes in variable annuity hedges due to increasing long-term interest rates, partially offset by decreasing equity markets; and
•favorable changes in Shield embedded derivatives due to decreasing equity markets, partially offset by increasing interest rates.
Investments
Investment Risk Management Strategy
We manage the risks related to our investment portfolio through asset-type allocation as well as industry and issuer diversification. We also use risk limits to promote diversification by asset sector, avoid concentrations in any single issuer and limit overall aggregate credit and equity risk exposure. We manage real estate risk through geographic, property type and product type diversification and asset allocation. Interest rate risk is managed as part of our Asset Liability Management (“ALM”) strategies. We also utilize product design to manage interest rate risk (e.g., market value adjustment features and surrender charges). These ALM strategies include maintaining an investment portfolio that targets a weighted average duration that reflects the duration of our estimated liability cash flow profile. For certain of our liability portfolios, it is not possible to invest assets for the full liability duration, thereby creating some asset/liability mismatch. We also use certain derivatives in the management of credit, interest rate, equity market and foreign currency exchange rate risks.
Investment Management Agreements
Other than our derivatives trading, which we manage in-house, we have engaged a select group of experienced external asset management firms to manage the investment of the assets comprising our general account portfolio and certain separate account assets of our insurance subsidiaries, as well as assets of BHF and our reinsurance subsidiary, BRCD.
Current Environment
Our business and results of operations are materially affected by conditions in capital markets and the economy, generally. As a U.S. insurance company, we are affected by the monetary policy of the Federal Reserve in the U.S. The Federal Reserve may increase or decrease the federal funds rate in the future, which may have an impact on the pricing levels of risk-bearing investments and may adversely impact the level of product sales. We are also affected by the monetary policy of central banks around the world due to the diversification of our investment portfolio. See “— Industry Trends and Uncertainties — Financial and Economic Environment.”
In 2023, the Federal Reserve increased the target range for the federal funds rate four times — from between 4.25% and 4.50% to between 5.25% and 5.50% as of December 31, 2023. These target range increases have contributed to the net unrealized loss position in our investment portfolio, and any additional target increases could similarly contribute to further increases in net unrealized losses.
In the current period, as a result of recent increases in interest rates, the unrealized losses on our fixed maturity securities exceeded the unrealized gains. If interest rates rise further, our unrealized gains would decrease, and our unrealized losses would increase, perhaps substantially.
See “Risk Factors — Risks Related to Our Investment Portfolio — Our investment portfolio is subject to significant financial risks both in the U.S. and global financial markets, including credit risk, interest rate risk, inflation risk, market valuation risk, liquidity risk, real estate risk, derivatives risk, and other factors outside our control, the occurrence of any of which could have a material adverse effect on our financial condition and results of operations.”
Selected Sector Investments
Recent elevated levels of market volatility have affected the performance of various asset classes. See “Risk Factors — Risks Related to Our Investment Portfolio — Our investment portfolio is subject to significant financial risks both in the U.S. and global financial markets, including credit risk, interest rate risk, inflation risk, market valuation risk, liquidity risk, real estate risk, derivatives risk, and other factors outside our control, the occurrence of any of which could have a material adverse effect on our financial condition and results of operations,” and “Risk Factors — Risks Related to Our Investment Portfolio — Ongoing military actions, the continued threat of terrorism, climate change as well as other catastrophic events may adversely affect the value of our investment portfolio and the level of claim losses we incur.”
84
There has been an increased market focus on commercial real estate, including office properties, as a result of companies shifting to hybrid work arrangements and the resulting impact on the demand for office space.
We have direct commercial real estate exposure through mortgage loans and certain structured securities, which include RMBS, CMBS and ABS. In addition, we have direct and indirect exposure through certain financial industry corporate fixed maturity securities. See “Risk Factors — Risks Related to Our Investment Portfolio — Our investment portfolio is subject to significant financial risks both in the U.S. and global financial markets, including credit risk, interest rate risk, inflation risk, market valuation risk, liquidity risk, real estate risk, derivatives risk, and other factors outside our control, the occurrence of any of which could have a material adverse effect on our financial condition and results of operations,” as well as “— Investments — Mortgage Loans” and Note 9 of the Notes to the Consolidated Financial Statements for information on mortgage loans, including credit quality by portfolio segment and commercial mortgage loans by property type. Additionally, see “— Investments — Fixed Maturity Securities Available-for-sale — Structured Securities” for information on Structured Securities, including security type, risk profile and ratings profile as well as “— Investments — Fixed Maturity Securities Available-for-sale — U.S. and Foreign Corporate Fixed Maturity Securities” for our exposure to the finance industry.
We monitor direct and indirect investment exposure across sectors and asset classes and adjust our level of investment exposure, as appropriate. At this time, we do not expect that our general account investments in these sectors and asset classes will have a material adverse effect on our results of operations or financial condition.
Investment Portfolio Results
The following summary yield table presents the yield and adjusted net investment income for our investment portfolio for the periods indicated. As described below, this table reflects certain differences from the presentation of net investment income presented in the GAAP statements of operations. This summary yield table presentation is consistent with how we measure our investment performance for management purposes, and we believe it enhances understanding of our investment portfolio results.
| Years Ended December 31, | ||||||||||||||||||||||||||||||||||||||
| 2023 | 2022 | 2021 | ||||||||||||||||||||||||||||||||||||
| Yield % | Amount | Yield % | Amount | Yield % | Amount | |||||||||||||||||||||||||||||||||
| (Dollars in millions) | ||||||||||||||||||||||||||||||||||||||
| Investment income (1) | 4.23 | % | $ | 4,917 | 3.96 | % | $ | 4,363 | 5.13 | % | $ | 5,046 | ||||||||||||||||||||||||||
| Investment fees and expenses (2) | (0.14) | (148) | (0.14) | (154) | (0.13) | (144) | ||||||||||||||||||||||||||||||||
| Adjusted net investment income (3) | 4.09 | % | $ | 4,769 | 3.82 | % | $ | 4,209 | 5.00 | % | $ | 4,902 | ||||||||||||||||||||||||||
_______________
(1)Investment income yields are calculated as investment income as a percentage of average quarterly asset carrying values. Investment income excludes recognized gains and losses and reflects the adjustments discussed in table note (3) below to arrive at adjusted net investment income. Asset carrying values exclude unrealized gains (losses), collateral received in connection with our securities lending program, freestanding derivative assets and collateral received from derivative counterparties.
(2)Investment fee and expense yields are calculated as a percentage of average quarterly asset estimated fair values. Asset estimated fair values exclude collateral received in connection with our securities lending program, freestanding derivative assets and collateral received from derivative counterparties.
(3)Adjusted net investment income presented in the yield table varies from the most directly comparable GAAP measure due to certain reclassifications, as presented below.
| Years Ended December 31, | ||||||||||||||||||||
| 2023 | 2022 | 2021 | ||||||||||||||||||
| (In millions) | ||||||||||||||||||||
| Net investment income | $ | 4,664 | $ | 4,138 | $ | 4,881 | ||||||||||||||
| Less: Investment hedge adjustments | (105) | (71) | (21) | |||||||||||||||||
| Adjusted net investment income — in the above yield table | $ | 4,769 | $ | 4,209 | $ | 4,902 | ||||||||||||||
85
See “— Results of Operations — Consolidated Results for the Years Ended December 31, 2023 and 2022” and “Management’s Discussion and Analysis of Financial Condition and Results of Operations — Results of Operations — Consolidated Results for the Years Ended December 31, 2022 and 2021” in our 2022 Annual Report for an analysis of the year-over-year changes in net investment income.
Fixed Maturity Securities Available-for-sale
Fixed maturity securities held by type (public or private) were as follows at:
| December 31, 2023 | December 31, 2022 | ||||||||||||||||||||||
| Estimated Fair Value | % of Total | Estimated Fair Value | % of Total | ||||||||||||||||||||
| (Dollars in millions) | |||||||||||||||||||||||
| Publicly-traded | $ | 67,056 | 82.8 | % | $ | 62,199 | 82.3 | % | |||||||||||||||
| Privately-placed | 13,935 | 17.2 | 13,378 | 17.7 | |||||||||||||||||||
| Total fixed maturity securities | $ | 80,991 | 100.0 | % | $ | 75,577 | 100.0 | % | |||||||||||||||
| Percentage of cash and invested assets | 67.9 | % | 67.1 | % | |||||||||||||||||||
See Note 11 of the Notes to the Consolidated Financial Statements for further information on our valuation controls and procedures including our formal process to challenge any prices received from independent pricing services that are not considered representative of estimated fair value.
See Notes 1 and 9 of the Notes to the Consolidated Financial Statements for further information about fixed maturity securities by sector, contractual maturities, continuous gross unrealized losses and the allowance for credit losses.
Fixed Maturity Securities Credit Quality — Ratings
Rating agency ratings are based on availability of applicable ratings from rating agencies on the NAIC credit rating provider list, including Moody’s, S&P, Fitch, Dominion Bond Rating Service and Kroll Bond Rating Agency. If no rating is available from a rating agency, then an internally developed rating is used.
The NAIC has methodologies to assess credit quality for certain Structured Securities comprised of non-agency RMBS, CMBS and ABS. The NAIC’s objective with these methodologies is to increase the accuracy in assessing expected losses, and to use the improved assessment to determine a more appropriate capital requirement for such Structured Securities. The methodologies reduce regulatory reliance on rating agencies and allow for greater regulatory input into the assumptions used to estimate expected losses from Structured Securities. In 2021, these methodologies were updated to only apply to those Structured Securities issued prior to 2013. We apply the NAIC methodologies to Structured Securities held by our insurance subsidiaries and BRCD. The NAIC’s present methodology is to evaluate Structured Securities held by insurers on an annual basis. If our insurance subsidiaries and BRCD acquire Structured Securities that have not been previously evaluated by the NAIC but are expected to be evaluated by the NAIC in the upcoming annual review, an internally developed designation is used until a final designation becomes available.
The following table presents total fixed maturity securities by nationally statistical rating organizations (“NRSRO”) rating and the applicable NAIC designation from the NAIC published comparison of NRSRO ratings to NAIC designations, except for certain Structured Securities, which are presented using the NAIC methodologies, as well as the percentage, based on estimated fair value that each NAIC designation is comprised of at:
| December 31, 2023 | December 31, 2022 | |||||||||||||||||||||||||||||||||||||||||||||||||||||||||||||||||||
| NAIC Designation | NRSRO Rating | Amortized Cost | Allowance for Credit Losses | Unrealized Gain (Loss) | Estimated Fair Value | % of Total | Amortized Cost | Allowance for Credit Losses | Unrealized Gain (Loss) | Estimated Fair Value | % of Total | |||||||||||||||||||||||||||||||||||||||||||||||||||||||||
| (Dollars in millions) | ||||||||||||||||||||||||||||||||||||||||||||||||||||||||||||||||||||
| 1 | Aaa/Aa/A | $ | 56,944 | $ | 5 | $ | (3,586) | $ | 53,353 | 65.8 | % | $ | 53,935 | $ | 2 | $ | (4,870) | $ | 49,063 | 64.9 | % | |||||||||||||||||||||||||||||||||||||||||||||||
| 2 | Baa | 27,567 | — | (2,331) | 25,236 | 31.2 | 27,269 | — | (3,546) | 23,723 | 31.4 | |||||||||||||||||||||||||||||||||||||||||||||||||||||||||
| Subtotal investment grade | 84,511 | 5 | (5,917) | 78,589 | 97.0 | % | 81,204 | 2 | (8,416) | 72,786 | 96.3 | % | ||||||||||||||||||||||||||||||||||||||||||||||||||||||||
| 3 | Ba | 1,839 | — | (122) | 1,717 | 2.1 | 2,343 | — | (232) | 2,111 | 2.8 | |||||||||||||||||||||||||||||||||||||||||||||||||||||||||
| 4 | B | 593 | 3 | (44) | 546 | 0.7 | 677 | 1 | (88) | 588 | 0.8 | |||||||||||||||||||||||||||||||||||||||||||||||||||||||||
| 5 | Caa and lower | 113 | 2 | (24) | 87 | 0.1 | 120 | 4 | (24) | 92 | 0.1 | |||||||||||||||||||||||||||||||||||||||||||||||||||||||||
| 6 | In or near default | 75 | 11 | (12) | 52 | 0.1 | — | — | — | — | — | |||||||||||||||||||||||||||||||||||||||||||||||||||||||||
| Subtotal below investment grade | 2,620 | 16 | (202) | 2,402 | 3.0 | % | 3,140 | 5 | (344) | 2,791 | 3.7 | % | ||||||||||||||||||||||||||||||||||||||||||||||||||||||||
| Total fixed maturity securities | $ | 87,131 | $ | 21 | $ | (6,119) | $ | 80,991 | 100.0 | % | $ | 84,344 | $ | 7 | $ | (8,760) | $ | 75,577 | 100.0 | % | ||||||||||||||||||||||||||||||||||||||||||||||||
86
The following tables present total fixed maturity securities, based on estimated fair value, by sector classification and by NRSRO rating and the applicable NAIC designations from the NAIC published comparison of NRSRO ratings to NAIC designations, except for certain Structured Securities, which are presented using the NAIC methodologies as described above:
| Fixed Maturity Securities — by Sector & Credit Quality Rating | |||||||||||||||||||||||||||||||||||||||||
| NAIC Designation | 1 | 2 | 3 | 4 | 5 | 6 | Total Estimated Fair Value | ||||||||||||||||||||||||||||||||||
| NRSRO Rating | Aaa/Aa/A | Baa | Ba | B | Caa and Lower | In or Near Default | |||||||||||||||||||||||||||||||||||
| (In millions) | |||||||||||||||||||||||||||||||||||||||||
| December 31, 2023 | |||||||||||||||||||||||||||||||||||||||||
| U.S. corporate | $ | 16,617 | $ | 17,260 | $ | 1,293 | $ | 476 | $ | 57 | $ | 52 | $ | 35,755 | |||||||||||||||||||||||||||
| Foreign corporate | 4,841 | 6,423 | 344 | 57 | — | — | 11,665 | ||||||||||||||||||||||||||||||||||
| U.S. government and agency | 8,306 | 113 | — | — | — | — | 8,419 | ||||||||||||||||||||||||||||||||||
| RMBS | 7,390 | 18 | 12 | 1 | 9 | — | 7,430 | ||||||||||||||||||||||||||||||||||
| CMBS | 6,039 | 344 | 24 | — | 3 | — | 6,410 | ||||||||||||||||||||||||||||||||||
| ABS | 5,746 | 621 | 17 | 12 | 10 | — | 6,406 | ||||||||||||||||||||||||||||||||||
| State and political subdivision | 3,808 | 57 | 1 | — | 8 | — | 3,874 | ||||||||||||||||||||||||||||||||||
| Foreign government | 606 | 400 | 26 | — | — | — | 1,032 | ||||||||||||||||||||||||||||||||||
| Total fixed maturity securities | $ | 53,353 | $ | 25,236 | $ | 1,717 | $ | 546 | $ | 87 | $ | 52 | $ | 80,991 | |||||||||||||||||||||||||||
| December 31, 2022 | |||||||||||||||||||||||||||||||||||||||||
| U.S. corporate | $ | 14,697 | $ | 15,683 | $ | 1,671 | $ | 499 | $ | 57 | $ | — | $ | 32,607 | |||||||||||||||||||||||||||
| Foreign corporate | 3,758 | 6,377 | 373 | 68 | — | — | 10,576 | ||||||||||||||||||||||||||||||||||
| U.S. government and agency | 7,887 | 129 | — | — | — | — | 8,016 | ||||||||||||||||||||||||||||||||||
| RMBS | 7,490 | 14 | 12 | 2 | 10 | — | 7,528 | ||||||||||||||||||||||||||||||||||
| CMBS | 6,240 | 351 | 9 | 7 | 4 | — | 6,611 | ||||||||||||||||||||||||||||||||||
| ABS | 4,648 | 672 | 17 | 12 | 10 | — | 5,359 | ||||||||||||||||||||||||||||||||||
| State and political subdivision | 3,682 | 105 | 1 | — | 11 | — | 3,799 | ||||||||||||||||||||||||||||||||||
| Foreign government | 661 | 392 | 28 | — | — | — | 1,081 | ||||||||||||||||||||||||||||||||||
| Total fixed maturity securities | $ | 49,063 | $ | 23,723 | $ | 2,111 | $ | 588 | $ | 92 | $ | — | $ | 75,577 | |||||||||||||||||||||||||||
U.S. and Foreign Corporate Fixed Maturity Securities
We maintain a diversified portfolio of corporate fixed maturity securities across industries and issuers. Our portfolio does not have any exposure to any single issuer in excess of 1% of total investments and the top ten holdings in aggregate comprise 1% of total investments at both December 31, 2023 and 2022. Our U.S. and foreign corporate fixed maturity securities holdings by industry were as follows at:
| December 31, 2023 | December 31, 2022 | ||||||||||||||||||||||
| Estimated Fair Value | % of Total | Estimated Fair Value | % of Total | ||||||||||||||||||||
| (Dollars in millions) | |||||||||||||||||||||||
| Industrial | $ | 14,751 | 31.1 | % | $ | 13,290 | 30.7 | % | |||||||||||||||
| Finance | 12,957 | 27.3 | 11,988 | 27.8 | |||||||||||||||||||
| Consumer | 10,683 | 22.6 | 9,459 | 21.9 | |||||||||||||||||||
| Utility | 6,273 | 13.2 | 5,767 | 13.4 | |||||||||||||||||||
| Communications | 2,756 | 5.8 | 2,679 | 6.2 | |||||||||||||||||||
| Total | $ | 47,420 | 100.0 | % | $ | 43,183 | 100.0 | % | |||||||||||||||
Structured Securities
We held $20.2 billion and $19.5 billion of Structured Securities, at estimated fair value, at December 31, 2023 and 2022, respectively, as presented in the RMBS, CMBS and ABS sections below.
87
RMBS
Our RMBS holdings are diversified by security type, risk profile and ratings profile, which were as follows at:
| December 31, 2023 | December 31, 2022 | |||||||||||||||||||||||||||||||||||||
| Estimated Fair Value | % of Total | Net Unrealized Gains (Losses) | Estimated Fair Value | % of Total | Net Unrealized Gains (Losses) | |||||||||||||||||||||||||||||||||
| (Dollars in millions) | ||||||||||||||||||||||||||||||||||||||
| Security type: | ||||||||||||||||||||||||||||||||||||||
| Pass-through securities | $ | 3,922 | 52.8 | % | $ | (491) | $ | 3,846 | 51.1 | % | $ | (590) | ||||||||||||||||||||||||||
| Collateralized mortgage obligations | 3,508 | 47.2 | (273) | 3,682 | 48.9 | (311) | ||||||||||||||||||||||||||||||||
| Total RMBS | $ | 7,430 | 100.0 | % | $ | (764) | $ | 7,528 | 100.0 | % | $ | (901) | ||||||||||||||||||||||||||
| Risk profile: | ||||||||||||||||||||||||||||||||||||||
| Agency | $ | 6,152 | 82.8 | % | $ | (724) | $ | 6,137 | 81.5 | % | $ | (842) | ||||||||||||||||||||||||||
| Prime | 152 | 2.0 | (16) | 149 | 2.0 | (20) | ||||||||||||||||||||||||||||||||
| Alt-A | 756 | 10.2 | (23) | 788 | 10.5 | (37) | ||||||||||||||||||||||||||||||||
| Sub-prime | 370 | 5.0 | (1) | 454 | 6.0 | (2) | ||||||||||||||||||||||||||||||||
| Total RMBS | $ | 7,430 | 100.0 | % | $ | (764) | $ | 7,528 | 100.0 | % | $ | (901) | ||||||||||||||||||||||||||
| Ratings profile: | ||||||||||||||||||||||||||||||||||||||
Rated Aaa (1) | $ | 554 | 7.5 | % | $ | 6,643 | 88.2 | % | ||||||||||||||||||||||||||||||
| Designated NAIC 1 | $ | 7,390 | 99.5 | % | $ | 7,490 | 99.5 | % | ||||||||||||||||||||||||||||||
_______________
(1)During the year ended December 31, 2023, Fitch Ratings downgraded the U.S. credit rating from Aaa to Aa1, which resulted in a decrease in Aaa assets in our RMBS holdings.
Historically, our exposure to sub-prime RMBS holdings has been managed by focusing primarily on senior tranche securities, stress-testing the portfolio with severe loss assumptions and closely monitoring the performance of the portfolio. Our sub-prime RMBS portfolio consists predominantly of securities that were purchased after 2012 at significant discounts to par value and discounts to the expected principal recovery value of these securities. The vast majority of these securities are investment grade under the NAIC designations (e.g., NAIC 1 and NAIC 2).
CMBS
Our CMBS holdings are diversified by vintage year, which were as follows at:
| December 31, 2023 | December 31, 2022 | ||||||||||||||||||||||
| Amortized Cost | Estimated Fair Value | Amortized Cost | Estimated Fair Value | ||||||||||||||||||||
| (In millions) | |||||||||||||||||||||||
| 2003 - 2011 | $ | 89 | $ | 83 | $ | 90 | $ | 82 | |||||||||||||||
| 2012 | 2 | 1 | 41 | 38 | |||||||||||||||||||
| 2013 | 43 | 36 | 204 | 197 | |||||||||||||||||||
| 2014 | 283 | 256 | 322 | 294 | |||||||||||||||||||
| 2015 | 949 | 876 | 966 | 879 | |||||||||||||||||||
| 2016 | 461 | 425 | 463 | 421 | |||||||||||||||||||
| 2017 | 717 | 655 | 732 | 667 | |||||||||||||||||||
| 2018 | 1,633 | 1,521 | 1,668 | 1,538 | |||||||||||||||||||
| 2019 | 993 | 869 | 1,021 | 879 | |||||||||||||||||||
| 2020 | 538 | 442 | 534 | 426 | |||||||||||||||||||
| 2021 | 813 | 760 | 821 | 748 | |||||||||||||||||||
2022 | 451 | 436 | 462 | 442 | |||||||||||||||||||
2023 | 51 | 50 | — | — | |||||||||||||||||||
| Total | $ | 7,023 | $ | 6,410 | $ | 7,324 | $ | 6,611 | |||||||||||||||
88
The estimated fair value of CMBS rated Aaa using rating agency ratings was $4.4 billion, or 68.5% of total CMBS, and designated NAIC 1 was $6.0 billion, or 94.2% of total CMBS, at December 31, 2023. The estimated fair value of CMBS Aaa rating agency ratings was $4.6 billion, or 70.0% of total CMBS, and designated NAIC 1 was $6.2 billion, or 94.4% of total CMBS, at December 31, 2022.
ABS
Our ABS holdings are diversified by both collateral type and issuer. Our ABS holdings by collateral type and ratings profile were as follows at:
| December 31, 2023 | December 31, 2022 | |||||||||||||||||||||||||||||||||||||
| Estimated Fair Value | % of Total | Net Unrealized Gains (Losses) | Estimated Fair Value | % of Total | Net Unrealized Gains (Losses) | |||||||||||||||||||||||||||||||||
| (Dollars in millions) | ||||||||||||||||||||||||||||||||||||||
| Collateral type: | ||||||||||||||||||||||||||||||||||||||
| Collateralized obligations | $ | 3,819 | 59.6 | % | $ | (9) | $ | 3,239 | 60.5 | % | $ | (124) | ||||||||||||||||||||||||||
| Automobile loans | 487 | 7.6 | (2) | 216 | 4.0 | (9) | ||||||||||||||||||||||||||||||||
Student loans | 397 | 6.2 | (22) | 393 | 7.3 | (34) | ||||||||||||||||||||||||||||||||
| Consumer loans | 346 | 5.4 | (19) | 420 | 7.8 | (36) | ||||||||||||||||||||||||||||||||
| Credit card loans | 262 | 4.1 | (6) | 158 | 3.0 | (10) | ||||||||||||||||||||||||||||||||
| Other loans | 1,095 | 17.1 | (50) | 933 | 17.4 | (80) | ||||||||||||||||||||||||||||||||
| Total | $ | 6,406 | 100.0 | % | $ | (108) | $ | 5,359 | 100.0 | % | $ | (293) | ||||||||||||||||||||||||||
| Ratings profile: | ||||||||||||||||||||||||||||||||||||||
| Rated Aaa | $ | 3,548 | 55.4 | % | $ | 2,300 | 42.9 | % | ||||||||||||||||||||||||||||||
| Designated NAIC 1 | $ | 5,746 | 89.7 | % | $ | 4,648 | 86.7 | % | ||||||||||||||||||||||||||||||
Allowance for Credit Losses for Fixed Maturity Securities
See Note 9 of the Notes to the Consolidated Financial Statements for information about the evaluation of fixed maturity securities for an allowance for credit losses or write-offs due to uncollectibility.
Securities Lending
We participate in a securities lending program whereby securities are loaned to third parties, primarily brokerage firms and commercial banks. We obtain collateral, usually cash, in an amount generally equal to 102% of the estimated fair value of the securities loaned, which is obtained at the inception of a loan and maintained at a level greater than or equal to 100% for the duration of the loan. The estimated fair value of the securities loaned is monitored on a daily basis with additional collateral obtained as necessary throughout the duration of the loan. Securities loaned under such transactions may be sold or re-pledged by the transferee. We are liable to return to our counterparties the cash collateral under our control. Security collateral received from counterparties may not be sold or re-pledged, unless the counterparty is in default, and is not reflected in the financial statements. These transactions are treated as financing arrangements and the associated cash collateral liability is recorded at the amount of the cash received.
See “— Liquidity and Capital Resources — The Company — Primary Uses of Liquidity and Capital — Securities Lending” and Note 9 of the Notes to the Consolidated Financial Statements for information regarding our securities lending program.
89
Mortgage Loans
Our mortgage loans are principally collateralized by commercial, agricultural and residential properties. Information regarding mortgage loans by portfolio segment is summarized as follows at:
| December 31, 2023 | December 31, 2022 | |||||||||||||||||||||||||||||||||||||||||||||||||
| Amortized Cost | % of Total | Allowance for Credit Losses | % of Amortized Cost | Amortized Cost | % of Total | Allowance for Credit Losses | % of Amortized Cost | |||||||||||||||||||||||||||||||||||||||||||
| (Dollars in millions) | ||||||||||||||||||||||||||||||||||||||||||||||||||
| Commercial | $ | 13,193 | 58.3 | % | $ | 69 | 0.5 | % | $ | 13,574 | 58.9 | % | $ | 49 | 0.4 | % | ||||||||||||||||||||||||||||||||||
| Agricultural | 4,445 | 19.6 | 19 | 0.4 | % | 4,365 | 18.9 | 15 | 0.3 | % | ||||||||||||||||||||||||||||||||||||||||
| Residential | 5,007 | 22.1 | 49 | 1.0 | % | 5,116 | 22.2 | 55 | 1.1 | % | ||||||||||||||||||||||||||||||||||||||||
| Total | $ | 22,645 | 100.0 | % | $ | 137 | 0.6 | % | $ | 23,055 | 100.0 | % | $ | 119 | 0.5 | % | ||||||||||||||||||||||||||||||||||
Our mortgage loan portfolio is diversified by both geographic region and property type to reduce the risk of concentration. The percentage of our commercial and agricultural mortgage loan portfolios collateralized by properties located in the U.S. was 98% at both December 31, 2023 and 2022. The remainder was collateralized by properties located outside of the U.S. At December 31, 2023, the carrying value as a percentage of total commercial and agricultural mortgage loans for the top three states in the U.S. was 17% for California, 11% for Texas and 8% for New York. Additionally, we manage risk when originating commercial and agricultural mortgage loans by generally lending up to 75% of the estimated fair value of the underlying real estate collateral.
Our residential mortgage loan portfolio is managed in a similar manner to reduce risk of concentration. All residential mortgage loans were collateralized by properties located in the U.S. at both December 31, 2023 and 2022. At December 31, 2023, the carrying value as a percentage of total residential mortgage loans for the top three states in the U.S. was 39% for California, 11% for Florida and 7% for New York.
90
Commercial Mortgage Loans by Geographic Region and Property Type. Commercial mortgage loans are the largest component of the mortgage loan invested asset class. The diversification across geographic regions and property types of commercial mortgage loans was as follows at:
| December 31, 2023 | December 31, 2022 | |||||||||||||||||||||||||
| Amount | % of Total | Amount | % of Total | |||||||||||||||||||||||
| (Dollars in millions) | ||||||||||||||||||||||||||
| Geographic region: | ||||||||||||||||||||||||||
| South Atlantic | $ | 2,747 | 20.8 | % | $ | 3,026 | 22.3 | % | ||||||||||||||||||
Pacific | 2,562 | 19.4 | 2,765 | 20.4 | ||||||||||||||||||||||
| Middle Atlantic | 2,153 | 16.3 | 2,344 | 17.3 | ||||||||||||||||||||||
| West South Central | 1,513 | 11.5 | 1,642 | 12.1 | ||||||||||||||||||||||
| Mountain | 1,182 | 9.0 | 1,140 | 8.4 | ||||||||||||||||||||||
East North Central | 737 | 5.6 | 794 | 5.8 | ||||||||||||||||||||||
New England | 735 | 5.6 | 741 | 5.4 | ||||||||||||||||||||||
| International | 409 | 3.1 | 390 | 2.9 | ||||||||||||||||||||||
| West North Central | 347 | 2.6 | 361 | 2.7 | ||||||||||||||||||||||
| East South Central | 306 | 2.3 | 306 | 2.2 | ||||||||||||||||||||||
Multi-region and Other (1) | 502 | 3.8 | 65 | 0.5 | ||||||||||||||||||||||
| Total recorded investment | 13,193 | 100.0 | % | 13,574 | 100.0 | % | ||||||||||||||||||||
| Less: allowance for credit losses | 69 | 49 | ||||||||||||||||||||||||
| Carrying value, net of allowance for credit losses | $ | 13,124 | $ | 13,525 | ||||||||||||||||||||||
| Property type: | ||||||||||||||||||||||||||
| Apartment | $ | 5,371 | 40.8 | % | $ | 5,366 | 39.5 | % | ||||||||||||||||||
| Office | 3,185 | 24.1 | 3,375 | 24.9 | ||||||||||||||||||||||
| Industrial | 2,092 | 15.9 | 2,051 | 15.1 | ||||||||||||||||||||||
| Retail | 1,747 | 13.2 | 1,934 | 14.3 | ||||||||||||||||||||||
| Hotel | 798 | 6.0 | 848 | 6.2 | ||||||||||||||||||||||
| Total recorded investment | 13,193 | 100.0 | % | 13,574 | 100.0 | % | ||||||||||||||||||||
| Less: allowance for credit losses | 69 | 49 | ||||||||||||||||||||||||
| Carrying value, net of allowance for credit losses | $ | 13,124 | $ | 13,525 | ||||||||||||||||||||||
_______________
(1) During the year, certain commercial mortgage loans were reclassified into the Multi-region and Other geographic region.
Mortgage Loan Credit Quality — Monitoring Process. Our mortgage loan investments are monitored on an ongoing basis, including a review of loans that are current, past due, restructured and under foreclosure. Quarterly, we conduct a formal review of the portfolio with our investment managers. See Note 9 of the Notes to the Consolidated Financial Statements for information on mortgage loans by credit quality indicator, past due status, nonaccrual status and modified mortgage loans.
Our commercial mortgage loans are reviewed on an ongoing basis. These reviews may include an analysis of the property financial statements and rent roll, lease rollover analysis, property inspections, market analysis, estimated valuations of the underlying collateral, loan-to-value ratios, debt-service coverage ratios and tenant creditworthiness. The monitoring process focuses on higher risk loans, which include those that are classified as restructured, delinquent or in foreclosure, as well as loans with higher loan-to-value ratios and lower debt-service coverage ratios. The monitoring process for agricultural mortgage loans is generally similar, with a focus on higher risk loans, such as loans with higher loan-to-value ratios, including reviews on a geographic and sector basis. Our residential mortgage loans are reviewed on an ongoing basis. See Note 9 of the Notes to the Consolidated Financial Statements for information on our evaluation of residential mortgage loans and related measurement of allowance for credit losses.
91
Loan-to-value ratios and debt-service coverage ratios are common measures in the assessment of the quality of commercial mortgage loans. Loan-to-value ratios are a common measure in the assessment of the quality of agricultural mortgage loans. Loan-to-value ratios compare the amount of the loan to the estimated fair value of the underlying collateral. A loan-to-value ratio greater than 100% indicates that the loan amount is greater than the collateral value. A loan-to-value ratio of less than 100% indicates an excess of collateral value over the loan amount. Generally, the higher the loan-to-value ratio, the higher the risk of experiencing a credit loss. The debt-service coverage ratio compares a property’s net operating income to amounts needed to service the principal and interest due under the loan. Generally, the lower the debt-service coverage ratio, the higher the risk of experiencing a credit loss. For our commercial mortgage loans, our average loan-to-value ratio was 65% and 57% at December 31, 2023 and 2022, respectively, and our average debt-service coverage ratio was 2.3x and 2.2x at December 31, 2023 and 2022, respectively. The debt-service coverage ratio, as well as the values utilized in calculating the ratio, is updated annually on a rolling basis, with a portion of the portfolio updated each quarter. In addition, the loan-to-value ratio is routinely updated for all but the lowest risk loans as part of our ongoing review of our commercial mortgage loan portfolio. For our agricultural mortgage loans, our average loan-to-value ratio was 47% and 48% at December 31, 2023 and 2022, respectively. The values utilized in calculating the agricultural mortgage loan loan-to-value ratio are developed in connection with the ongoing review of the agricultural loan portfolio and are routinely updated.
Mortgage Loan Allowance for Credit Losses. See Note 9 of the Notes to the Consolidated Financial Statements for information about how the allowance for credit losses is established and monitored, as well as activity in and balances of the allowance for credit losses for the years ended December 31, 2023 and 2022.
Limited Partnerships and Limited Liability Companies
The carrying values of our limited partnerships and LLCs were as follows at:
| December 31, 2023 | December 31, 2022 | |||||||||||||
| (In millions) | ||||||||||||||
| Other limited partnerships | $ | 4,140 | $ | 3,941 | ||||||||||
| Real estate limited partnerships and LLCs (1) | 806 | 834 | ||||||||||||
| Total | $ | 4,946 | $ | 4,775 | ||||||||||
_______________
(1)The estimated fair value of real estate limited partnerships and LLCs was $927 million and $987 million at December 31, 2023 and 2022, respectively.
Cash distributions on these investments are generated from investment gains, operating income from the underlying investments of the funds and liquidation of the underlying investments of the funds. We estimate that the underlying investment of the private equity funds will typically be liquidated over the next 10 to 20 years.
Other Invested Assets
The carrying value of our other invested assets by type was as follows at:
| December 31, 2023 | December 31, 2022 | |||||||||||||||||||||||||
| Carrying Value | % of Total | Carrying Value | % of Total | |||||||||||||||||||||||
| (Dollars in millions) | ||||||||||||||||||||||||||
| Freestanding derivatives with positive estimated fair values | $ | 3,714 | 84.2 | % | $ | 2,284 | 80.1 | % | ||||||||||||||||||
| Company-owned life insurance | 340 | 7.7 | 250 | 8.8 | ||||||||||||||||||||||
Federal Home Loan Bank stock | 245 | 5.5 | 201 | 7.0 | ||||||||||||||||||||||
| Tax credit and renewable energy partnerships | 52 | 1.2 | 55 | 1.9 | ||||||||||||||||||||||
| Leveraged leases, net of non-recourse debt | 47 | 1.1 | 48 | 1.7 | ||||||||||||||||||||||
| Other | 11 | 0.3 | 14 | 0.5 | ||||||||||||||||||||||
| Total | $ | 4,409 | 100.0 | % | $ | 2,852 | 100.0 | % | ||||||||||||||||||
92
Derivatives
Derivative Risks
We are exposed to various risks relating to our ongoing business operations, including interest rate, foreign currency exchange rate, credit and equity market risks. We use a variety of strategies to manage these risks, including the use of derivatives. See Note 10 of the Notes to the Consolidated Financial Statements for:
•a comprehensive description of the nature of our derivatives, including the strategies for which derivatives are used in managing various risks;
•information about the gross notional amount, estimated fair value, and primary underlying risk exposure of our derivatives by type of hedge designation, excluding embedded derivatives held at December 31, 2023 and 2022; and
•the effects of derivatives in cash flow, fair value, or non-qualifying hedge relationships on the statements of operations for the years ended December 31, 2023, 2022 and 2021.
See “Business — Segments and Corporate & Other — Annuities” and “— Risk Management Strategies” for more information about our use of derivatives by major hedging programs, as well as “— Results of Operations — Annual Actuarial Review” and “Risk Factors — Risks Related to our Investment Portfolio — Our investment portfolio is subject to significant financial risks both in the U.S. and global financial markets, including credit risk, interest rate risk, inflation risk, market valuation risk, liquidity risk, real estate risk, derivatives risk, and other factors outside our control, the occurrence of any of which could have a material adverse effect on our financial condition and results of operations.”
Fair Value Hierarchy
See Note 11 of the Notes to the Consolidated Financial Statements for derivatives measured at estimated fair value on a recurring basis and their corresponding fair value hierarchy, as well as a rollforward of the fair value measurements for derivatives measured at estimated fair value on a recurring basis using significant unobservable (Level 3) inputs as discussed below.
The valuation of Level 3 derivatives involves the use of significant unobservable inputs and generally requires a higher degree of management judgment or estimation than the valuations of Level 1 and Level 2 derivatives. Although Level 3 inputs are unobservable, management believes they are consistent with what other market participants would use when pricing such instruments and are considered appropriate given the circumstances. The use of different inputs or methodologies could have a material effect on the estimated fair value of Level 3 derivatives and could materially affect net income.
Derivatives categorized as Level 3 at December 31, 2023 include: credit default swaps priced using unobservable credit spreads, or that are priced through independent broker quotations; equity hybrid options with unobservable volatility inputs; and foreign currency swaps with certain unobservable inputs.
Credit Risk
See Note 10 of the Notes to the Consolidated Financial Statements for information about how we manage credit risk related to derivatives and for the estimated fair value of our net derivative assets and net derivative liabilities after the application of master netting agreements and collateral. See “Risk Factors — Risks Related to our Investment Portfolio — Our investment portfolio is subject to significant financial risks both in the U.S. and global financial markets, including credit risk, interest rate risk, inflation risk, market valuation risk, liquidity risk, real estate risk, derivatives risk, and other factors outside our control, the occurrence of any of which could have a material adverse effect on our financial condition and results of operations.”
Our policy is not to offset the fair value amounts recognized for derivatives executed with the same counterparty under the same master netting agreement. This policy applies to the recognition of derivatives on the balance sheet and does not affect our legal right of offset.
93
Credit Derivatives
The gross notional amount and estimated fair value of credit default swaps were as follows at:
| December 31, 2023 | December 31, 2022 | |||||||||||||||||||||||||
| Gross Notional Amount | Estimated Fair Value | Gross Notional Amount | Estimated Fair Value | |||||||||||||||||||||||
| (In millions) | ||||||||||||||||||||||||||
| Written | $ | 1,405 | $ | 27 | $ | 1,757 | $ | 16 | ||||||||||||||||||
| Total | $ | 1,405 | $ | 27 | $ | 1,757 | $ | 16 | ||||||||||||||||||
The maximum amount at risk related to our written credit default swaps is equal to the corresponding gross notional amount. In a replication transaction, we pair an asset on our balance sheet with a written credit default swap to synthetically replicate a corporate bond, a core asset holding of life insurance companies. Replications are entered into in accordance with the guidelines approved by state insurance regulators and the NAIC and are an important tool in managing the overall corporate credit risk within the Company. In order to match our long-dated insurance liabilities, we seek to buy long-dated corporate bonds. In some instances, these may not be readily available in the market, or they may be issued by corporations to which we already have significant corporate credit exposure. For example, by purchasing Treasury bonds (or other high-quality assets) and associating them with written credit default swaps on the desired corporate credit name, we can replicate the desired bond exposures and meet our ALM needs. This can expose the Company to changes in credit spreads as the written credit default swap tenor is shorter than the maturity of Treasury bonds.
Embedded Derivatives
See Note 11 of the Notes to the Consolidated Financial Statements for (i) information about embedded derivatives measured at estimated fair value on a recurring basis and their corresponding fair value hierarchy and (ii) a rollforward of the fair value measurements for net embedded derivatives measured at estimated fair value on a recurring basis using significant unobservable (Level 3) inputs.
See “— Summary of Critical Accounting Estimates — Derivatives” for additional information on the estimates and assumptions that affect embedded derivatives.
Policyholder Liabilities
We establish, and carry as liabilities, actuarially determined amounts that are calculated to meet policy obligations or to provide for future annuity and life insurance benefit payments. Amounts for actuarial liabilities are computed and reported in the financial statements in conformity with GAAP. See “— Summary of Critical Accounting Estimates” and Notes 1, 4 and 5 of the Notes to the Consolidated Financial Statements for more details on policyholder liabilities.
Due to the nature of the underlying risks and the uncertainty associated with the determination of actuarial liabilities, we cannot precisely determine the amounts that will ultimately be paid with respect to these actuarial liabilities, and the ultimate amounts may vary from the estimated amounts, particularly when payments may not occur until well into the future.
We periodically review the assumptions supporting our estimates of actuarial liabilities for future policy benefits. We revise estimates, to the extent permitted or required under GAAP, if we determine that future expected experience differs from assumptions used in the development of actuarial liabilities. We charge or credit changes in our liabilities to expenses in the period the liabilities are established or re-estimated. If the liabilities originally established for future benefit payments prove inadequate, we must increase them. Such an increase could adversely affect our earnings and have a material adverse effect on our business, financial condition and results of operations.
We have experienced, and will likely in the future experience, catastrophe losses and possibly acts of terrorism, as well as turbulent financial markets that may have an adverse impact on our business, financial condition and results of operations. Moreover, the impact of climate change could cause changes in the frequency or severity of outbreaks of certain diseases. Due to their nature, we cannot predict the incidence, timing, severity or amount of losses from catastrophes, acts of terrorism or climate change, but we make broad use of catastrophic and non-catastrophic reinsurance to manage risk from these perils.
94
Future Policy Benefits
We establish liabilities for future amounts payable under insurance policies. A discussion of future policy benefits by segment, as well as Corporate & Other follows.
Annuities
Future policy benefits for the annuities business are comprised mainly of liabilities for life contingent income annuities.
Life
Future policy benefits for the life business are comprised mainly of liabilities for term, whole, universal and variable life insurance contracts. In order to manage risk, we have often reinsured a portion of the mortality risk on life insurance policies. The reinsurance programs are routinely evaluated, and this may result in increases or decreases to existing coverage. We have entered into various derivative positions, primarily interest rate swaps, to mitigate the risk that investment of premiums received and reinvestment of maturing assets over the life of the policy will be at rates below those assumed in the original pricing of these contracts.
Run-off
Future policy benefits primarily include liabilities for structured settlements and pension risk transfer contracts. There is no interest rate crediting flexibility on the liabilities for immediate annuities. As a result, a sustained low interest rate environment could negatively impact earnings; however, we mitigate our risks by applying various ALM strategies, including the use of derivative positions, primarily interest rate swaps, to mitigate the risks associated with such a scenario.
Corporate & Other
Future policy benefits primarily include liabilities for long-term care business reinsured through 100% quota share reinsurance agreements.
Policyholder Account Balances
Policyholder account balance liabilities are established for products with an explicit account value and generally equal to the balance accrued to the contract holder, which includes accrued interest credited, but excludes the impact of any applicable charge that may be incurred upon surrender. See “Quantitative and Qualitative Disclosures About Market Risk — Market Risk - Fair Value Exposures — Interest Rates.”
Policyholder account balances also include embedded derivatives on index-linked annuities and amounts associated with funding agreements issued for additional liquidity or in connection with our institutional spread margin business. See “— Liquidity and Capital Resources — The Company — Primary Sources of Liquidity and Capital — Funding Sources — Funding Agreements.” A discussion of policyholder account balances by segment follows.
Annuities
Policyholder account balance liabilities are held for fixed deferred annuities, the fixed account portion of variable annuities and non-life contingent income annuities. Interest is credited to the policyholder’s account at interest rates we determine which are influenced by current market rates, subject to specified minimums. A sustained low interest rate environment could negatively impact earnings as a result of the minimum credited rate guarantees present in most of these policyholder account balances. We have various interest rate derivative positions, as part of the Company’s interest rate hedging program, to partially mitigate the risks associated with such a scenario. A breakdown of account value subject to minimum guaranteed crediting rates can be found in Note 4 of the Notes to the Consolidated Financial Statements.
As a result of acquisitions, we establish additional liabilities known as excess interest reserves for policies with credited rates in excess of market rates as of the applicable acquisition dates.
Life
Life policyholder account balance liabilities are held for retained asset accounts, universal life policies and the fixed account of universal variable life insurance policies. Interest is credited to the policyholder’s account at interest rates we determine which are influenced by current market rates, subject to specified minimums. A sustained low interest rate environment could negatively impact earnings as a result of the minimum credited rate guarantees present in most of these policyholder account balances. We have various derivative positions to partially mitigate the risks associated with such a scenario. A breakdown of account value subject to minimum guaranteed crediting rates can be found in Note 4 of the Notes to Consolidated Financial Statements.
95
As a result of acquisitions, we establish additional liabilities known as excess interest reserves for policies with credited rates in excess of market rates as of the applicable acquisition dates.
Run-off
Policyholder account balance liabilities in Run-off are comprised of ULSG, certain company-owned life insurance policies and certain funding agreements. Interest crediting rates vary by type of contract and can be fixed or variable. We are exposed to interest rate risks, when guaranteeing payment of interest and return on principal at the contractual maturity date. We mitigate our risks by applying various ALM strategies. A breakdown of account value subject to minimum guaranteed crediting rates can be found in Note 4 of the Notes to the Consolidated Financial Statements.
As a result of acquisitions, we establish additional liabilities known as excess interest reserves for policies with credited rates in excess of market rates as of the applicable acquisition dates.
Market Risk Benefits
We issue certain variable annuity products with GMxBs that provide the policyholder a minimum return based on their initial deposit (i.e., the Benefit Base) less withdrawals. In some cases, the Benefit Base may be increased by additional deposits, bonus amounts, accruals or optional market value step-ups. Variable annuity guaranteed benefits are classified as MRBs and measured at fair value. Certain index-linked annuity products may also have GMxBs classified as MRBs. See “Quantitative and Qualitative Disclosures About Market Risk — Market Risk - Fair Value Exposures — Interest Rates.”
Liquidity and Capital Resources
Our business and results of operations are materially affected by conditions in the global capital markets and the economy generally. Stressed conditions, volatility or disruptions in global capital markets, particular markets or financial asset classes can impact us adversely, in part because we have a large investment portfolio and our insurance liabilities and derivatives are sensitive to changing market factors. Changing conditions in the global capital markets and the economy may affect our financing costs and market interest rates for our debt or equity securities. For further information regarding market factors that could affect our ability to meet liquidity and capital needs, see “— Industry Trends and Uncertainties — Financial and Economic Environment,” as well as “Risk Factors — Economic Environment and Capital Markets-Related Risks” and “Risk Factors — Risks Related to Our Investment Portfolio.”
Liquidity and Capital Management
Based upon our capitalization, expectations regarding maintaining our business mix, ratings and funding sources available to us, we believe we have sufficient liquidity to meet business requirements in current market conditions and certain stress scenarios. Our Board of Directors and senior management are directly involved in the governance of the capital management process, including proposed changes to the annual capital plan and capital targets. We continuously monitor and adjust our liquidity and capital plans in light of market conditions, as well as changing needs and opportunities.
We maintain a substantial short-term liquidity position, which was $3.8 billion and $3.6 billion at December 31, 2023 and 2022, respectively. Short-term liquidity is comprised of cash and cash equivalents and short-term investments, excluding assets that are pledged or otherwise committed. Assets pledged or otherwise committed include amounts received in connection with securities lending, derivatives and assets held on deposit or in trust.
An integral part of our liquidity management includes managing our level of liquid assets, which was $45.2 billion and $40.8 billion at December 31, 2023 and 2022, respectively. Liquid assets are comprised of cash and cash equivalents, short-term investments and publicly-traded securities, excluding assets that are pledged or otherwise committed. Assets pledged or otherwise committed include amounts received in connection with securities lending, funding agreements, derivatives and assets held on deposit or in trust.
The Company
Liquidity
Liquidity refers to our ability to generate adequate cash flows from our normal operations to meet the cash requirements of our operating, investing and financing activities. We determine our liquidity needs based on a rolling 12-month forecast by portfolio of invested assets, which we monitor daily. We adjust the general account asset and derivatives mix and general account asset maturities based on this rolling 12-month forecast. To support this forecast, we conduct cash flow and stress testing, which reflect the impact of various scenarios, including (i) the potential increase in our requirement to pledge additional collateral or return collateral to our counterparties, (ii) a reduction in new business sales, and (iii) the risk of early contract holder and policyholder withdrawals, as well as lapses and surrenders of existing policies and contracts. We include provisions limiting withdrawal rights in many of our products, which deter the customer from
96
making withdrawals prior to the maturity date of the product. If significant cash is required beyond our anticipated liquidity needs, we have various alternatives available depending on market conditions and the amount and timing of the liquidity need. These available alternative sources of liquidity include cash flows from operations, sales of liquid assets and funding sources, including secured funding agreements, unsecured credit facilities and secured committed facilities.
Under certain adverse market and economic conditions, our access to liquidity may deteriorate, or the cost to access liquidity may increase. See “Risk Factors — Economic Environment and Capital Markets-Related Risks — Adverse capital and credit market conditions may significantly affect our ability to meet liquidity needs and our access to capital.”
Capital
We manage our capital position to maintain our financial strength and credit ratings. Our capital position is supported by our ability to generate cash flows within our insurance subsidiaries, our ability to effectively manage the risks of our businesses and our expected ability to borrow funds and raise additional capital to meet operating and growth needs under a variety of market and economic conditions.
We monitor our debt-to-capital ratio using an average of our key leverage ratios as calculated by A.M. Best, Fitch, Moody’s and S&P, and we aim to maintain a ratio commensurate with our financial strength and credit ratings. As such, we may opportunistically look to pursue additional financing over time, which may include borrowings under credit facilities, the issuance of debt, equity or hybrid securities, the incurrence of term loans, or the refinancing or extinguishment of existing indebtedness. There can be no assurance that we will be able to complete any such financing transactions on terms and conditions favorable to us or at all.
In support of our target combined RBC ratio of 400% to 450% in normal market conditions, we expect to continue to maintain a capital and exposure risk management program that targets total assets supporting our variable annuity contracts at or above the CTE98 level in normal market conditions. With our risk management focus on the core drivers of our combined RBC ratio, we believe we can better manage our RBC in stressed market scenarios.
On November 16, 2023, we authorized the repurchase of up to $750 million of our common stock, which was in addition to our prior $1.2 billion total repurchases authorized in 2021. Repurchases under the authorizations, of which a combined $793 million was remaining at December 31, 2023, may be made through open market purchases, including pursuant to 10b5-1 plans or pursuant to accelerated stock repurchase plans, or through privately negotiated transactions, from time to time at management’s discretion in accordance with applicable legal requirements. Common stock repurchases are dependent upon several factors, including our capital position, liquidity, financial strength and credit ratings, general market conditions, the market price of our common stock compared to management’s assessment of the stock’s underlying value and applicable regulatory approvals, as well as other legal and accounting factors.
We currently have no plans to declare and pay dividends on our common stock. Any future declaration and payment of dividends or other distributions or returns of capital will be at the discretion of our Board of Directors and will depend on and be subject to our financial condition, results of operations, cash needs, regulatory and other constraints, capital requirements (including capital requirements of our insurance subsidiaries), contractual restrictions and any other factors that our Board of Directors deems relevant in making such a determination. Therefore, there can be no assurance that we will pay any dividends or make other distributions or returns of capital on our common stock, or as to the amount of any such dividends, distributions or returns of capital.
Rating Agencies
Financial strength ratings represent the opinion of rating agencies regarding the ability of an insurance company to pay obligations under insurance policies and contracts in accordance with their terms. Credit ratings indicate the rating agency’s opinion regarding a debt issuer’s ability to meet the terms of debt obligations in a timely manner. They are important factors in our overall funding profile and ability to access certain types of liquidity and capital. The level and composition of our regulatory capital at the subsidiary level, our combined RBC ratio and our equity capital are among the many factors considered in determining our financial strength ratings and credit ratings. Each agency has its own capital adequacy evaluation methodology, and assessments are generally based on a combination of factors. Financial strength ratings are not statements of fact nor are they recommendations to purchase, hold or sell any security, contract or policy. Each rating should be evaluated independently of any other rating.
97
Our financial strength ratings and long-term issuer credit ratings as of the date of this filing were as follows:
| A.M. Best (1) | Fitch (2) | Moody’s (3) | S&P (4) | ||||||||||||||||||||
| Current outlook | Stable | Stable | Stable | Stable | |||||||||||||||||||
| Financial Strength Ratings: | |||||||||||||||||||||||
| Brighthouse Life Insurance Company | A | A | A3 | A+ | |||||||||||||||||||
| New England Life Insurance Company | A | A | A3 | A+ | |||||||||||||||||||
| Brighthouse Life Insurance Company of NY | A | NR | NR | A+ | |||||||||||||||||||
| Long-term Issuer Credit Ratings: | |||||||||||||||||||||||
| Brighthouse Financial, Inc. | bbb+ | BBB+ | Baa3 | BBB+ | |||||||||||||||||||
| Brighthouse Holdings, LLC | bbb+ | BBB+ | Baa3 | BBB+ | |||||||||||||||||||
_______________
(1)A.M. Best’s financial strength ratings for insurance companies range from “A++ (Superior)” to “S (Suspended).” A.M. Best’s long-term issuer credit ratings range from “aaa (exceptional)” to “s (suspended).”
(2)Fitch’s financial strength ratings for insurance companies range from “AAA (highest rating)” to “C (distressed).” Fitch’s long-term issuer credit ratings range from “AAA (highest rating)” to “D (default).”
(3)Moody’s financial strength ratings for insurance companies and long-term issuer credit ratings range from “Aaa (highest quality)” to “C (lowest rated).”
(4)S&P’s financial strength ratings for insurance companies and long-term issuer credit ratings range from “AAA (extremely strong)” to “SD (selective default)” or “D (default).”
NR = Not rated
Rating agencies may continue to review and adjust our ratings. See “Risk Factors — Risks Related to Our Business — A downgrade or a potential downgrade in our financial strength or credit ratings could result in a loss of business and materially adversely affect our financial condition and results of operations” for a description of the impact of a potential ratings downgrade.
98
Sources and Uses of Liquidity and Capital
Our primary sources and uses of liquidity and capital were as follows at:
| Years Ended December 31, | |||||||||||||||||
| 2023 | 2022 | 2021 | |||||||||||||||
| (In millions) | |||||||||||||||||
| Sources: | |||||||||||||||||
| Operating activities, net | $ | — | $ | — | $ | 641 | |||||||||||
| Changes in policyholder account balances, net | 4,242 | 11,650 | 11,929 | ||||||||||||||
| Changes in payables for collateral under securities loaned and other transactions, net | — | — | 1,017 | ||||||||||||||
| Long-term debt issued | — | — | 400 | ||||||||||||||
| Preferred stock issued, net of issuance costs | — | — | 339 | ||||||||||||||
Financing element on certain derivative instruments and other derivative related transactions, net | 90 | — | — | ||||||||||||||
| Total sources | 4,332 | 11,650 | 14,326 | ||||||||||||||
| Uses: | |||||||||||||||||
| Operating activities, net | 137 | 1,228 | — | ||||||||||||||
| Investing activities, net | 3,196 | 8,276 | 12,238 | ||||||||||||||
| Changes in payables for collateral under securities loaned and other transactions, net | 890 | 1,709 | — | ||||||||||||||
| Long-term debt repaid | 2 | 3 | 680 | ||||||||||||||
| Dividends on preferred stock | 102 | 104 | 89 | ||||||||||||||
| Treasury stock acquired in connection with share repurchases | 250 | 488 | 499 | ||||||||||||||
Financing element on certain derivative instruments and other derivative related transactions, net | — | 185 | 368 | ||||||||||||||
| Other, net | 19 | 16 | 86 | ||||||||||||||
| Total uses | 4,596 | 12,009 | 13,960 | ||||||||||||||
| Net increase (decrease) in cash and cash equivalents | $ | (264) | $ | (359) | $ | 366 | |||||||||||
Cash Flows from Operating Activities
The principal cash inflows from our insurance activities come from insurance premiums, annuity considerations and net investment income. The principal cash outflows are the result of various annuity and life insurance products, operating expenses and income tax, as well as interest expense. The primary liquidity concern with respect to these cash flows is the risk of early contract holder and policyholder withdrawal.
Cash Flows from Investing Activities
The principal cash inflows from our investment activities come from repayments of principal, proceeds from maturities and sales of investments, as well as settlements of freestanding derivatives. The principal cash outflows relate to purchases of investments and settlements of freestanding derivatives. We typically can have a net cash outflow from investing activities because cash inflows from insurance operations are reinvested in accordance with our ALM discipline to fund insurance liabilities. We closely monitor and manage these risks through our comprehensive investment risk management process. The primary liquidity concerns with respect to these cash flows are the risk of default by debtors and market disruption.
Cash Flows from Financing Activities
The principal cash inflows from our financing activities come from issuances of debt and equity securities, deposits of funds associated with policyholder account balances and lending of securities. The principal cash outflows come from repayments of debt, common stock repurchases, preferred stock dividends, withdrawals associated with policyholder account balances and the return of securities on loan. The primary liquidity concerns with respect to these cash flows are market disruption and the risk of early policyholder withdrawal.
99
Primary Sources of Liquidity and Capital
In addition to the summary description of liquidity and capital sources discussed in “— Sources and Uses of Liquidity and Capital,” the following additional information is provided regarding our primary sources of liquidity and capital:
Funding Sources
Liquidity is provided by a variety of funding sources, including secured and unsecured funding agreements, unsecured credit facilities and secured committed facilities. Capital is provided by a variety of funding sources, including issuances of debt and equity securities, as well as borrowings under our credit facilities. We maintain a shelf registration statement with the SEC that permits the issuance of public debt, equity and hybrid securities. As a “Well-Known Seasoned Issuer” under SEC rules, our shelf registration statement provides for automatic effectiveness upon filing and has no stated issuance capacity. The diversity of our funding sources enhances our funding flexibility, limits dependence on any one market or source of funds and generally lowers the cost of funds. Our primary funding sources include:
Preferred Stock
See Note 13 of the Notes to the Consolidated Financial Statements for information on preferred stock issuances.
Funding Agreements
Brighthouse Life Insurance Company issues funding agreements and uses the proceeds from such issuances for spread lending purposes in connection with our institutional spread margin business or to provide additional liquidity. The institutional spread margin business is comprised of funding agreements issued in connection with the programs described in more detail below. Activity related to these programs are reported in Corporate & Other. See “Obligations Under Funding Agreements” in Note 4 of the Notes to the Consolidated Financial Statements for additional information on funding agreements.
Funding Agreement-Backed Repurchase Agreement Program
In January 2024, Brighthouse Life Insurance Company established a secured funding agreement-backed repurchase agreement program (the “FABR Program”), pursuant to which Brighthouse Life Insurance Company may enter into repurchase agreements with bank counterparties and the proceeds of the repurchase agreements are then used by a special-purpose entity to purchase funding agreements from Brighthouse Life Insurance Company.
Funding Agreement-Backed Commercial Paper Program
In July 2021, Brighthouse Life Insurance Company established a funding agreement-backed commercial paper program (the “FABCP Program”) for spread lending purposes, pursuant to which a special purpose limited liability company (the “SPLLC”) may issue commercial paper and deposit the proceeds with Brighthouse Life Insurance Company under a funding agreement issued by Brighthouse Life Insurance Company to the SPLLC. The maximum aggregate principal amount permitted to be outstanding at any one time under the FABCP Program was increased from $3.0 billion to $5.0 billion in June 2023.
Funding Agreement-Backed Notes Program
In April 2021, Brighthouse Life Insurance Company established a funding agreement-backed notes program (the “FABN Program”), pursuant to which Brighthouse Life Insurance Company may issue funding agreements to a special purpose statutory trust for spread lending purposes. The maximum aggregate principal amount permitted to be outstanding at any one time under the FABN Program is $7.0 billion.
Federal Home Loan Bank Funding Agreements
Brighthouse Life Insurance Company is a member of the Federal Home Loan Bank (“FHLB”) of Atlanta, where it maintains a secured funding agreement program, under which funding agreements may be issued.
Farmer Mac Funding Agreements
Brighthouse Life Insurance Company has a secured funding agreement program with the Federal Agricultural Mortgage Corporation and its affiliate Farmer Mac Mortgage Securities Corporation (“Farmer Mac”) with a term ending on December 1, 2026, pursuant to which the parties may enter into funding agreements in an aggregate amount of up to $750 million.
100
Information regarding funding agreements issued for spread lending purposes is as follows:
| Aggregate Principal Amount Outstanding | Issuances | Repayments | ||||||||||||||||||||||||||||||||||||||||||||||||
| December 31, | Years Ended December 31, | |||||||||||||||||||||||||||||||||||||||||||||||||
| 2023 | 2022 | 2023 | 2022 | 2021 | 2023 | 2022 | 2021 | |||||||||||||||||||||||||||||||||||||||||||
| (In millions) | ||||||||||||||||||||||||||||||||||||||||||||||||||
FABR Program (1) | $ | — | $ | — | $ | — | $ | — | $ | — | $ | — | $ | — | $ | — | ||||||||||||||||||||||||||||||||||
| FABCP Program | 3,442 | 2,097 | 8,046 | 12,682 | 2,939 | 6,701 | 12,433 | 1,091 | ||||||||||||||||||||||||||||||||||||||||||
| FABN Program | 2,100 | 3,450 | — | 550 | 2,900 | 1,350 | — | — | ||||||||||||||||||||||||||||||||||||||||||
| FHLB Funding Agreements | 4,350 | 3,900 | 2,350 | 6,275 | 1,352 | 1,900 | 3,275 | 452 | ||||||||||||||||||||||||||||||||||||||||||
| Farmer Mac Funding Agreements | 700 | 700 | — | 600 | 125 | — | 25 | — | ||||||||||||||||||||||||||||||||||||||||||
| Total | $ | 10,592 | $ | 10,147 | $ | 10,396 | $ | 20,107 | $ | 7,316 | $ | 9,951 | $ | 15,733 | $ | 1,543 | ||||||||||||||||||||||||||||||||||
_______________
(1) On February 16, 2024, there was $500 million of FABR funding agreements outstanding.
Debt Issuances
See Note 12 of the Notes to the Consolidated Financial Statements for information on debt issuances.
Credit and Committed Facilities
See Notes 12 and 13 of the Notes to the Consolidated Financial Statements for information regarding our credit and committed facilities.
We have no reason to believe that our lending counterparties would be unable to fulfill their respective contractual obligations under these facilities. As commitments under our credit and committed facilities may expire unused, these amounts do not necessarily reflect our actual future cash funding requirements.
Our Revolving Credit Facility contains financial covenants, including requirements to maintain a specified minimum adjusted consolidated net worth, to maintain a ratio of total indebtedness to total capitalization not in excess of a specified percentage and that place limitations on the dollar amount of indebtedness that may be incurred by our subsidiaries, which could restrict our operations and use of funds. At December 31, 2023, we were in compliance with these financial covenants.
Primary Uses of Liquidity and Capital
In addition to the summarized description of liquidity and capital uses discussed in “— Sources and Uses of Liquidity and Capital,” the following additional information is provided regarding our primary uses of liquidity and capital:
Common Stock Repurchases
See Note 13 of the Notes to the Consolidated Financial Statements for information relating to authorizations to repurchase BHF common stock, amounts of common stock repurchased pursuant to such authorizations and the amount remaining under such authorizations at December 31, 2023. In 2024, through February 16, 2024, BHF repurchased an additional 636,454 shares of its common stock through open market purchases, pursuant to a 10b5-1 plan, for $33 million.
Preferred Stock Dividends
See Note 13 of the Notes to the Consolidated Financial Statements for information relating to dividends declared and paid on our preferred stock.
101
“Dividend Stopper” Provisions in BHF’s Preferred Stock and Junior Subordinated Debentures
Terms applicable to our junior subordinated debentures may restrict our ability to pay interest on those debentures in certain circumstances. Suspension of payments of interest on our junior subordinated debentures, whether required under the relevant indenture or optional, could cause “dividend stopper” provisions applicable under those and other instruments to restrict our ability to pay dividends, if any, on our common stock and repurchase our common stock in various situations, including situations where we may be experiencing financial stress, and may restrict our ability to pay dividends or interest on our preferred stock and junior subordinated debentures as well. Similarly, the terms of our outstanding preferred stock contain restrictions on our ability to repurchase our common stock or pay dividends thereon if we have not fulfilled our dividend obligations under such preferred stock or other preferred securities. In addition, the terms of the agreements governing any preferred stock, debt or other financial instruments that we may issue in the future, may limit or prohibit the payment of dividends on our common stock or preferred stock, or the payment of interest on our junior subordinated debentures.
Debt Repayments, Repurchases, Redemptions and Exchanges
See Note 12 of the Notes to the Consolidated Financial Statements for information on debt repayments and repurchases, as well as debt maturities and the terms of our outstanding long-term debt.
We may from time to time seek to retire or purchase our outstanding indebtedness through cash purchases or exchanges for other securities, purchases in the open market, privately negotiated transactions or otherwise. Any such repurchases or exchanges will be dependent upon several factors, including our liquidity requirements, contractual restrictions, general market conditions, as well as applicable regulatory, legal and accounting factors. Whether or not we repurchase any debt and the size and timing of any such repurchases will be determined at our discretion.
Insurance Liabilities
Liabilities arising from our insurance activities primarily relate to benefit payments under various annuity and life insurance products, as well as payments for policy surrenders, withdrawals and loans.
At December 31, 2023, our insurance liabilities, excluding obligations under our institutional spread margin business, totaled $106.9 billion and the related future estimated cash payments totaled $181.9 billion, of which $10.2 billion is due in the next twelve months. These estimated cash payments are based on assumptions related to mortality, morbidity, policy lapses, withdrawals, surrender charges, annuitization, future interest credited and other assumptions comparable with our experience and expectations of future payment patterns, as well as other contingent events as appropriate for the respective product type. These amounts are undiscounted and, therefore, exceed the liabilities included on the consolidated balance sheet. Actual cash payments on insurance liabilities may differ significantly from future estimated cash payments due to differences between actual experience and the assumptions used in the establishment of the liabilities and the estimation of the future cash payments. All future estimated cash payments are presented gross of any reinsurance recoverable. At December 31, 2023, obligations under our institutional spread margin business totaled $10.6 billion and the related future estimated cash payments, including interest, totaled $11.0 billion, of which $5.9 billion is due in the next twelve months.
Pledged Collateral
We enter into derivatives to manage various risks relating to our ongoing business operations. We pledge collateral to, and have collateral pledged to us by, counterparties in connection with our derivatives. At December 31, 2023 and 2022, we pledged cash collateral to counterparties of $16 million and $7 million, respectively. At December 31, 2023 and 2022, we were obligated to return cash collateral pledged to us by counterparties of $393 million and $829 million, respectively. The timing of the return of the derivatives collateral is uncertain. We also pledge collateral from time to time in connection with our funding agreements.
We receive non-cash collateral from counterparties for derivatives, which can be sold or re-pledged subject to certain constraints, and which is not recorded on our consolidated balance sheets. The amount of this non-cash collateral at estimated fair value was $2.4 billion and $1.0 billion at December 31, 2023 and 2022, respectively.
See Note 10 of the Notes to the Consolidated Financial Statements for additional information regarding pledged collateral.
102
Securities Lending
We have a securities lending program that aims to enhance the total return on our investment portfolio, whereby securities are loaned to third parties, primarily brokerage firms and commercial banks. We obtain collateral, usually cash, from the borrower, which must be returned to the borrower when the loaned securities are returned to us. Generally, our securities lending contracts expire within twelve months of issuance. We were liable for cash collateral under our control of $3.3 billion and $3.7 billion at December 31, 2023 and 2022, respectively.
We receive non-cash collateral for securities lending from counterparties, which cannot be sold or re-pledged, and which is not recorded on our consolidated balance sheets. There was no non-cash collateral at both December 31, 2023 and 2022.
See Note 9 of the Notes to the Consolidated Financial Statements for further discussion of our securities lending program.
Contingencies, Commitments and Guarantees
We establish liabilities for litigation, regulatory and other loss contingencies when it is probable that a loss has been incurred and the amount of the loss can be reasonably estimated. See “Contingencies” in Note 18 of the Notes to the Consolidated Financial Statements.
We enter into commitments for the purpose of enhancing the total return on our investment portfolio consisting of commitments to fund partnership investments, bank credit facilities and private corporate bond investments, as well as commitments to lend funds under mortgage loan commitments. We anticipate these commitments could be invested any time over the next five years. See Note 9 of the Notes to the Consolidated Financial Statements. See “Commitments” in Note 18 of the Notes to the Consolidated Financial Statements.
In the normal course of our business, we have provided certain indemnities, guarantees and commitments to third parties such that we may be required to make payments now or in the future. See “Guarantees” in Note 18 of the Notes to the Consolidated Financial Statements.
The Parent Company
Liquidity and Capital
In evaluating liquidity, it is important to distinguish the cash flow needs of the parent company from the cash flow needs of the combined group of companies. BHF is largely dependent on cash flows from its insurance subsidiaries to meet its obligations. Constraints on BHF’s liquidity may occur as a result of operational demands or as a result of compliance with regulatory requirements. See “Risk Factors — Risks Related to Our Business — As a holding company, BHF depends on the ability of its subsidiaries to pay dividends,” “Risk Factors — Economic Environment and Capital Markets-Related Risks — Adverse capital and credit market conditions may significantly affect our ability to meet liquidity needs and our access to capital” and “Risk Factors — Regulatory and Legal Risks — Our insurance business is highly regulated, and changes in regulation and in supervisory and enforcement policies or interpretations thereof may materially impact our capitalization or cash flows, reduce our profitability and limit our growth,” as well as Note 13 of the Notes to the Consolidated Financial Statements.
Short-term Liquidity and Liquid Assets
At December 31, 2023 and 2022, BHF and certain of its non-insurance subsidiaries had short-term liquidity of $1.2 billion and $1.0 billion, respectively. Short-term liquidity is comprised of cash and cash equivalents and short-term investments, excluding assets that are pledged or otherwise committed. Assets pledged or otherwise committed include assets held in trust.
At December 31, 2023 and 2022, BHF and certain of its non-insurance subsidiaries had liquid assets of $1.3 billion and $1.0 billion, respectively, of which $1.2 billion and $987 million, respectively, was held by BHF. Liquid assets are comprised of cash and cash equivalents, short-term investments and publicly-traded securities, excluding assets that are pledged or otherwise committed. Assets pledged or otherwise committed include assets held in trust.
103
Statutory Capital and Dividends
The NAIC and state insurance departments have established regulations that provide minimum capitalization requirements based on RBC formulas for insurance companies. See “Business — Regulation — Insurance Regulation” and Note 13 of the Notes to the Consolidated Financial Statements for information regarding our statutory accounting and reserves, as well as the calculation of RBC and the regulatory RBC requirements. At December 31, 2023, our insurance subsidiaries had a combined statutory TAC of approximately $6.3 billion, resulting in a combined RBC ratio of approximately 428%.
The amount of dividends that our insurance subsidiaries can ultimately pay to BHF through their various parent entities provides an additional margin for risk protection and investment in our businesses. Such dividends are constrained by the amount of surplus our insurance subsidiaries hold to maintain their ratings, which is generally higher than minimum RBC requirements. We proactively take actions to maintain capital consistent with these ratings objectives, which may include adjusting dividend amounts and deploying financial resources from internal or external sources of capital. Certain of these activities may require regulatory approval. Furthermore, the payment of dividends and other distributions by our insurance subsidiaries is governed by the insurance laws and regulations of the states where they are domiciled. Any payment of dividends by Brighthouse Life Insurance Company in 2024 would be subject to Delaware DOI approval. See also Note 13 of the Notes to the Consolidated Financial Statements for additional information regarding the applicable dividend restrictions and certain of our subsidiaries’ ordinary dividend capacity, as well as the circumstances under which regulatory approval would be required.
Normalized Statutory Earnings
Normalized statutory earnings (loss) is used by management to measure our insurance subsidiaries’ ability to pay future distributions and is reflective of whether our hedging program functions as intended. Normalized statutory earnings (loss) is calculated as statutory pre-tax net gain (loss) from operations adjusted for the favorable or unfavorable impacts of (i) net realized capital gains (losses), (ii) the change in total asset requirement at CTE98, net of the change in our variable annuity reserves, which are calculated at CTE70, and (iii) unrealized gains (losses) associated with our variable annuities and Shield hedging programs and other equity risk management strategies. See “Glossary” for the definition of CTE. Normalized statutory earnings (loss) may be further adjusted for certain unanticipated items that impact our results in order to help management and investors better understand, evaluate and forecast those results.
Our variable annuity block has been managed by funding the balance sheet with assets equal to or greater than a CTE98 level. We have also managed market-related risks of increases in these asset requirements by hedging the market sensitivity of the CTE98 level to changes in the capital markets. By including hedge gains and losses related to our variable annuity risk management strategy in our calculation of normalized statutory earnings (loss), we are able to fully reflect the change in value of the hedges, as well as the change in the value of the underlying CTE98 total asset requirement level. We believe this allows us to determine whether our hedging program is providing the desired level of protection. See “— Risk Management Strategies — Variable Annuity Exposure Risk Management” for additional details regarding our hedge program.
The following table presents the components of combined normalized statutory earnings for Brighthouse Life Insurance Company and NELICO:
| Years Ended December 31, | ||||||||||||||
| 2023 | 2022 | |||||||||||||
| (In billions) | ||||||||||||||
Statutory net gain (loss) from operations, pre-tax (1) | $ | (2.0) | $ | 1.0 | ||||||||||
| Add: net realized capital gains (losses) | (1.1) | 0.4 | ||||||||||||
Add: change in total asset requirement at CTE98, net of the change in variable annuity reserves (1) | 2.5 | 0.7 | ||||||||||||
| Add: unrealized gains (losses) on variable annuity & Shield hedging programs and other equity risk management strategies | 1.2 | (1.6) | ||||||||||||
Add: impact of actuarial items and other insurance adjustments (1) | (0.8) | 0.4 | ||||||||||||
| Add: other adjustments, net | — | 0.1 | ||||||||||||
| Normalized statutory earnings (loss) | $ | (0.2) | $ | 1.0 | ||||||||||
_______________
(1)As a result of implementing a new statutory requirement as of December 31, 2023 under which all future hedges must be reflected in reserves and required capital, CTE70 increased $870 million and the total asset requirement at CTE98
104
decreased $1.1 billion for the year ended December 31, 2023. The $1.1 billion impact to CTE98 is reflected in ‘impact of actuarial and other insurance adjustments’ to normalize the effect of implementing this new statutory requirement.
Primary Sources and Uses of Liquidity and Capital
The principal sources of funds available to BHF include distributions from BH Holdings, dividends and returns of capital from its insurance subsidiaries and BRCD, capital markets issuances, as well as its own cash and cash equivalents and short-term investments. These sources of funds may also be supplemented by alternate sources of liquidity either directly or indirectly through our insurance subsidiaries. For example, we have established internal liquidity facilities to provide liquidity within and across our regulated and non-regulated entities to support our businesses.
The primary uses of liquidity of BHF include debt-service obligations (including interest expense and debt repayments), preferred stock dividends, capital contributions to subsidiaries, common stock repurchases and payment of general operating expenses. Based on our analysis and comparison of our current and future cash inflows from the dividends we receive from subsidiaries that are permitted to be paid without prior insurance regulatory approval, our investment portfolio and other cash flows and anticipated access to the capital markets, we believe there will be sufficient liquidity and capital to enable BHF to make payments on debt, pay preferred stock dividends, contribute capital to its subsidiaries, repurchase its common stock, pay all general operating expenses and meet its cash needs.
In addition to the liquidity and capital sources discussed in “— The Company — Primary Sources of Liquidity and Capital” and “— The Company — Primary Uses of Liquidity and Capital,” the following additional information is provided regarding BHF’s primary sources and uses of liquidity and capital:
Distributions from and Capital Contributions to BH Holdings
See Note 2 of Schedule II — Condensed Financial Information (Parent Company Only) for information relating to distributions from and capital contributions to BH Holdings.
Short-term Intercompany Loans and Intercompany Liquidity Facilities
See Note 3 of Schedule II — Condensed Financial Information (Parent Company Only) for information relating to short-term intercompany loans and our intercompany liquidity facilities including obligations outstanding, issuances and repayments.
Item 7A. Quantitative and Qualitative Disclosures About Market Risk
The quantitative and qualitative disclosures about Market Risk reflect the impact of the adoption of LDTI, including the requirement that all variable annuity guarantees are classified as MRBs and measured at fair value.
Risk Management
We have an integrated process for managing risk exposures, which is coordinated among our Risk Management, Finance and Investment Departments. The process is designed to assess and manage exposures on a consolidated, company-wide basis. The Brighthouse Financial Balance Sheet Committee (“BSC”) is responsible for periodically reviewing all material financial risks and, in the event risks exceed desired tolerances, informs the Finance and Risk Committee of the Board of Directors, considers possible courses of action and determines how best to resolve or mitigate such risks. In taking such actions, the BSC considers industry best practices and the current economic environment. The BSC also reviews and approves target investment portfolios in order to align them with our liability profile and establishes guidelines and limits for various risk-taking departments, such as the Investment Department. Our Finance Department and our Investment Department, together with Risk Management, are responsible for coordinating our ALM strategies throughout the enterprise. The membership of the BSC is comprised of the following members of senior management: Chief Executive Officer, Chief Risk Officer, Chief Financial Officer, Chief Investment Officer and Head of Product Strategy and Pricing.
Our significant market risk management practices include, but are not limited to, the following:
Managing Interest Rate Risk
We manage interest rate risk as part of our asset and liability management strategies, which include (i) maintaining an investment portfolio that has a weighted average duration approximately equal to the duration of our estimated liability cash flow profile, and (ii) maintaining hedging programs. For certain of our liability portfolios, it is not possible to invest assets to the full liability duration, thereby creating some asset/liability mismatch. Where a liability cash flow may exceed the maturity of available assets, as is the case with certain life insurance and annuity products, we may support such liabilities with equity investments, derivatives or other mismatch mitigation strategies. Although we take measures to manage the economic risks of investing in a changing interest rate environment, we may not be able to mitigate completely
105
the interest rate or other mismatch risk of our fixed income investments relative to our interest rate sensitive liabilities. The level of interest rates also affects our liabilities for benefits under our annuity contracts. As interest rates decline, we may need to increase our reserves for future benefits under our annuity contracts, which would adversely affect our financial condition and results of operations.
We also employ product design and pricing strategies to mitigate the potential effects of interest rate movements. These strategies include the use of surrender charges, market value adjustment features or restrictions on withdrawals, and for certain products, the ability to reset crediting rates.
We analyze interest rate risk using various models, including multi-scenario cash flow projection models that forecast cash flows of the liabilities and their supporting investments, including derivatives. These projections involve evaluating the potential gain or loss on most of our in-force business under various increasing and decreasing interest rate environments. State insurance department regulations require that we perform some of these analyses annually as part of our review of the sufficiency of our regulatory reserves. We measure relative sensitivities of the value of our assets and liabilities to changes in key assumptions using internal models. These models reflect specific product characteristics and include assumptions based on current and anticipated experience regarding lapse, mortality and interest crediting rates. In addition, these models include asset cash flow projections reflecting interest payments, sinking fund payments, principal payments, bond calls, prepayments and defaults.
We also use common industry metrics, such as duration and convexity, to measure the relative sensitivity of asset and liability values to changes in interest rates. In computing the duration of liabilities, we consider all policyholder guarantees and how indeterminate policy elements such as interest credits or dividends are set. Each asset portfolio has a duration target based on the liability duration and the investment objectives of that portfolio.
Managing Equity Market and Foreign Currency Risks
We manage equity market risk in a coordinated process across our Risk Management, Investment and Finance Departments primarily by (i) holding sufficient capital to permit us to absorb modest losses, which may be temporary, from changes in equity markets and interest rates, and (ii) through the use of derivatives.
We also employ product design strategies to mitigate the effect of changes in equity markets such as prioritizing products that provide a risk offset and diversification to our legacy variable products.
Key management objectives include limiting losses, minimizing exposures to significant risks and providing additional capital capacity for future growth. The Investment and Finance Departments are also responsible for managing the exposure to foreign currency denominated investments. We use foreign currency swaps and forwards to mitigate the exposure, risk of loss and financial statement volatility associated with foreign currency denominated fixed income investments.
Market Risk - Fair Value Exposures
We regularly analyze our market risk exposure to interest rate, equity market price, credit spreads and foreign currency exchange rate risks. As a result of that analysis, we have determined that the estimated fair values of certain assets and liabilities are significantly exposed to changes in interest rates, and to a lesser extent, to changes in equity market prices and foreign currency exchange rates. We have exposure to market risk through our insurance operations and general account investment activities. For purposes of this discussion, “market risk” is defined as changes in estimated fair value resulting from changes in interest rates, equity market prices, credit spreads and foreign currency exchange rates. We may have additional financial impacts other than changes in estimated fair value, which are beyond the scope of this discussion. See “Risk Factors” for additional disclosure regarding our market risk and related sensitivities.
Interest Rates
Our fair value exposure to changes in interest rates arises most significantly from our interest rate sensitive liabilities and our holdings of fixed maturity securities, mortgage loans and derivatives that are used to support our policyholder liabilities. Our interest rate sensitive liabilities include long-term debt, policyholder account balances related to certain investment contracts and variable annuity guarantees accounted for as MRBs. Our fixed maturity securities including U.S. and foreign government bonds, securities issued by government agencies, corporate bonds, mortgage-backed and other ABS, and our commercial, agricultural and residential mortgage loans, are exposed to changes in interest rates. We also use interest rate derivatives to mitigate the exposure related to interest rate risks from our policyholder liabilities.
106
Equity Market
Our fair value exposure to equity market risk primarily arises from policyholder liabilities with long-term guarantees on equity performance, including crediting rates on index-linked annuities accounted for as embedded derivatives and variable annuity guarantees. In addition, we have exposure to equity markets through equity derivatives that we enter into to mitigate potential equity market exposure from our policyholder liabilities.
Foreign Currency Exchange Rates
Our fair value exposure to fluctuations in foreign currency exchange rates against the U.S. dollar results from our holdings in non-U.S. dollar denominated fixed maturity securities, mortgage loans and certain liabilities. The principal currencies that create foreign currency exchange rate risk in our investment portfolios and liabilities are the Euro and the British pound. We economically hedge substantially all of our foreign currency exposure.
Risk Measurement: Sensitivity Analysis
In the following discussion and analysis, we measure market risk related to our market sensitive assets and liabilities based on changes in interest rates, equity market prices and foreign currency exchange rates using a sensitivity analysis. This analysis estimates the potential changes in estimated fair value based on a hypothetical 100 basis point change (increase or decrease) in interest rates, or a 10% change in equity market prices or foreign currency exchange rates. We believe that these changes in market rates and prices are reasonably possible in the near-term. In performing the analysis summarized below, we used market rates as of December 31, 2023. We modeled the impact of changes in market rates and prices on the estimated fair values of our market sensitive assets and liabilities as follows:
•the estimated fair value of our interest rate sensitive exposures resulting from a 100 basis point change (increase or decrease) in interest rates;
•the estimated fair value of our equity positions due to a 10% change (increase or decrease) in equity market prices; and
•the U.S. dollar equivalent of estimated fair values of our foreign currency exposures due to a 10% change (increase in the value of the U.S. dollar compared to the foreign currencies or decrease in the value of the U.S. dollar compared to the foreign currencies) in foreign currency exchange rates.
The sensitivity analysis is an estimate and should not be viewed as predictive of our future financial performance. Our actual losses in any particular period may vary from the amounts indicated in the table below. Limitations related to this sensitivity analysis include:
•interest sensitive liabilities do not include $36.4 billion of insurance contract liabilities at December 31, 2023. Management believes that the changes in the economic value of those contracts under changing interest rates would offset a significant portion of the fair value changes of interest sensitive assets;
•the market risk information is limited by the assumptions and parameters established in creating the related sensitivity analysis, including the impact of prepayment rates on mortgage loans;
•for derivatives that qualify for hedge accounting, the impact on reported earnings may be materially different from the change in market values;
•the analysis excludes limited partnership interests; and
•the model assumes that the composition of assets and liabilities remains unchanged throughout the period.
Accordingly, we use such models as tools and not as substitutes for the experience and judgment of our management.
107
The potential loss in the estimated fair value of our interest rate sensitive financial instruments due to a 100 basis point increase in the yield curve by type of asset and liability was as follows at:
| December 31, 2023 | |||||||||||||||||
| Notional Amount | Estimated Fair Value (1) | 100 Basis Point Increase in the Yield Curve | |||||||||||||||
| (In millions) | |||||||||||||||||
| Financial assets with interest rate risk | |||||||||||||||||
| Fixed maturity securities | $ | 80,991 | $ | (5,247) | |||||||||||||
| Mortgage loans | $ | 20,609 | (880) | ||||||||||||||
| Policy loans | $ | 1,455 | (97) | ||||||||||||||
| Premiums, reinsurance and other receivables | $ | 7,724 | (117) | ||||||||||||||
| Reinsurance of market risk benefits | $ | 43 | (30) | ||||||||||||||
| Increase (decrease) in estimated fair value of assets | (6,371) | ||||||||||||||||
| Financial liabilities with interest rate risk (2) | |||||||||||||||||
| Policyholder account balances | $ | 30,606 | 130 | ||||||||||||||
| Long-term debt | $ | 2,769 | 222 | ||||||||||||||
| Other liabilities | $ | 1,142 | (7) | ||||||||||||||
| Embedded derivatives on index-linked annuities (3) | $ | 8,186 | (85) | ||||||||||||||
| (Increase) decrease in estimated fair value of liabilities | 260 | ||||||||||||||||
| Market risk benefits associated with variable annuities | $ | 9,701 | (3,025) | ||||||||||||||
| Derivative instruments with interest rate risk | |||||||||||||||||
| Interest rate contracts | $ | 92,499 | $ | (1,964) | (1,730) | ||||||||||||
| Foreign currency contracts | $ | 5,221 | $ | 394 | (26) | ||||||||||||
| Equity contracts | $ | 74,111 | $ | 169 | 13 | ||||||||||||
| Increase (decrease) in estimated fair value of derivative instruments | (1,743) | ||||||||||||||||
| Net change | $ | (4,829) | |||||||||||||||
_______________
(1)Separate account assets and liabilities, which are interest rate sensitive, are not included herein as any interest rate risk is borne by the contract holder.
(2)Excludes $36.4 billion of liabilities at carrying value pursuant to insurance contracts reported within future policy benefits and other policy-related balances on the consolidated balance sheet at December 31, 2023. Management believes that the changes in the economic value of those contracts under changing interest rates would offset a significant portion of the fair value changes of interest rate sensitive assets.
(3)Embedded derivatives on index-linked annuities are recognized on the consolidated balance sheet in the same caption as the host contract.
Sensitivity Summary
Sensitivity to a 100 basis point rise in interest rates was $4.8 billion at December 31, 2023.
Sensitivity to a 10% decrease in equity prices was $89 million at December 31, 2023.
As discussed above, we economically hedge substantially all of our foreign currency exposure such that sensitivity to changes in foreign currencies is minimal.
108
Item 8. Financial Statements and Supplementary Data
Index to Consolidated Financial Statements, Notes and Schedules
Page | |||||
Financial Statements at December 31, 2023 and 2022 and for the Years Ended December 31, 2023, 2022 and 2021: | |||||
Financial Statement Schedules at December 31, 2023 and 2022 and for the Years Ended December 31, 2023, 2022 and 2021: | |||||
109
REPORT OF INDEPENDENT REGISTERED PUBLIC ACCOUNTING FIRM
To the stockholders and the Board of Directors of Brighthouse Financial, Inc.
Opinion on the Financial Statements
We have audited the accompanying consolidated balance sheets of Brighthouse Financial, Inc. and subsidiaries (the “Company”) as of December 31, 2023 and 2022, the related consolidated statements of operations, comprehensive income (loss), equity, and cash flows for each of the three years in the period ended December 31, 2023, and the related notes and the schedules listed in the Index to Consolidated Financial Statements, Notes and Schedules (collectively referred to as the “financial statements”). In our opinion, the financial statements present fairly, in all material respects, the financial position of the Company as of December 31, 2023 and 2022, and the results of its operations and its cash flows for each of the three years in the period ended December 31, 2023, in conformity with accounting principles generally accepted in the United States of America.
We have also audited, in accordance with the standards of the Public Company Accounting Oversight Board (United States) (PCAOB), the Company’s internal control over financial reporting as of December 31, 2023, based on criteria established in Internal Control — Integrated Framework (2013) issued by the Committee of Sponsoring Organizations of the Treadway Commission and our report dated February 22, 2024, expressed an unqualified opinion on the Company’s internal control over financial reporting.
Change in Accounting Principle
As discussed in Notes 1 and 2 to the financial statements, the Company has changed its method of accounting for long-duration contracts due to the adoption of ASU 2018-12, Targeted Improvements to the Accounting for Long-Duration Contracts (“ASU 2018-12”), effective January 1, 2023, with a transition date of January 1, 2021.
Basis for Opinion
These financial statements are the responsibility of the Company’s management. Our responsibility is to express an opinion on the Company’s financial statements based on our audits. We are a public accounting firm registered with the PCAOB and are required to be independent with respect to the Company in accordance with the U.S. federal securities laws and the applicable rules and regulations of the Securities and Exchange Commission and the PCAOB.
We conducted our audits in accordance with the standards of the PCAOB. Those standards require that we plan and perform the audit to obtain reasonable assurance about whether the financial statements are free of material misstatement, whether due to error or fraud. Our audits included performing procedures to assess the risks of material misstatement of the financial statements, whether due to error or fraud, and performing procedures that respond to those risks. Such procedures included examining, on a test basis, evidence regarding the amounts and disclosures in the financial statements. Our audits also included evaluating the accounting principles used and significant estimates made by management, as well as evaluating the overall presentation of the financial statements. We believe that our audits provide a reasonable basis for our opinion.
Critical Audit Matters
The critical audit matters communicated below are matters arising from the current-period audit of the financial statements that were communicated or required to be communicated to the audit committee and that (1) relate to accounts or disclosures that are material to the financial statements and (2) involved our especially challenging, subjective, or complex judgments. The communication of critical audit matters does not alter in any way our opinion on the financial statements, taken as a whole, and we are not, by communicating the critical audit matters below, providing separate opinions on the critical audit matters or on the accounts or disclosures to which they relate.
110
Certain Assumptions Used in the Valuation of Liability for Future Policy Benefits – Refer to Notes 1 and 4 to the financial statements
Critical Audit Matter Description
The Company has obligations under insurance contracts to pay benefits over an extended period of time. The Company establishes a liability for future policy benefits (“LFPB”) for nonparticipating traditional and limited-payment contracts and the additional insurance liabilities for universal life-type contracts with secondary guarantees.
Management regularly reviews its cash flow assumptions supporting the estimates of these actuarial liabilities and, if such assumptions change significantly, the associated liability is adjusted. The measurement of LFPBs can be significantly impacted by changes in economic assumptions related to market interest rates and the general account rate of return and changes in assumptions for policyholder behavior including premium persistency, mortality and lapses.
Given the future policy benefit obligation for certain contracts is sensitive to changes in these economic and policyholder behavior assumptions and the significant uncertainty inherent in estimating these actuarial liabilities, we identified management’s evaluation of these assumptions in the valuation of certain LFPBs as a critical audit matter. This required a high degree of auditor judgment and an increased extent of effort, including the involvement of our actuarial specialists.
How the Critical Audit Matter Was Addressed in the Audit
Our audit procedures related to these assumptions in the valuation of certain LFPBs included the following, among others:
•We tested the effectiveness of management’s controls over the assumption review process, including those over the selection of the significant economic and policyholder behavior assumptions.
•With the assistance of our actuarial specialists, we evaluated the appropriateness of the significant assumptions used, developed an independent estimate of the LFPBs for a sample of policies and cohorts, and compared our estimates to management’s estimates.
•We tested the completeness and accuracy of the underlying data that served as the basis for the actuarial analysis to test that the inputs to the actuarial estimate were reasonable.
•We evaluated the methods and significant assumptions used by management to identify potential bias.
•We evaluated whether the significant assumptions used were consistent with evidence obtained in other areas of the audit.
Certain Assumptions Used in the Valuation of Market Risk Benefits – Refer to Notes 1, 5, and 11 to the financial statements
Critical Audit Matter Description
Market risk benefits are measured at fair value and separately presented on the consolidated balance sheet. The Company estimates market risk benefit assets and liabilities using significant judgment including discount rate assumptions, nonperformance risk, and actuarially determined assumptions including policyholder behavior, mortality and risk margins.
Given the sensitivity of certain market risk benefits to changes in these assumptions and the significant uncertainty inherent in estimating the market risk benefits, we identified management’s evaluation of these assumptions in the valuation of certain market risk benefits as a critical audit matter. This required a high degree of auditor judgment and an increased extent of effort, including the involvement of our actuarial and fair value specialists.
How the Critical Audit Matter Was Addressed in the Audit
Our audit procedures related to these assumptions in the valuation of certain market risk benefits included the following, among others:
111
•We tested the effectiveness of management’s controls over the assumption review process, including those over the selection of the significant assumptions related to policyholder behavior, mortality and risk margins, as well as changes in nonperformance risk.
•With the assistance of our actuarial specialists, we evaluated the appropriateness of the significant assumptions used, developed an independent estimate of the market risk benefits for a sample of policies, and compared our estimates to management’s estimates.
•We tested the completeness and accuracy of the underlying data that served as the basis for the actuarial analysis to test that the inputs to the actuarial estimate were reasonable.
•We evaluated the reasonableness of the Company’s assumptions by comparing those selected by management to those independently derived by our fair value and actuarial specialists, drawing upon standard actuarial and industry practice.
•We evaluated the methods and assumptions used by management to identify potential bias in the determination of the market risk benefits.
•We evaluated whether the assumptions used were consistent with evidence obtained in other areas of the audit.
/s/ DELOITTE & TOUCHE LLP
Charlotte, North Carolina
February 22, 2024
We have served as the Company’s auditor since 2016.
112
Brighthouse Financial, Inc.
Consolidated Balance Sheets
December 31, 2023 and 2022
(In millions, except share and per share data)
| 2023 | 2022 | |||||||||||||
| Assets | ||||||||||||||
| Investments: | ||||||||||||||
Fixed maturity securities available-for-sale, at estimated fair value (amortized cost: $ | $ | $ | ||||||||||||
| Equity securities, at estimated fair value | ||||||||||||||
Mortgage loans (net of allowance for credit losses of $ | ||||||||||||||
| Policy loans | ||||||||||||||
| Limited partnerships and limited liability companies | ||||||||||||||
| Short-term investments, principally at estimated fair value | ||||||||||||||
Other invested assets, principally at estimated fair value (net of allowance for credit losses of $ | ||||||||||||||
| Total investments | ||||||||||||||
| Cash and cash equivalents | ||||||||||||||
| Accrued investment income | ||||||||||||||
Premiums, reinsurance and other receivables (net of allowance for credit losses of $ | ||||||||||||||
| Deferred policy acquisition costs and value of business acquired | ||||||||||||||
| Current income tax recoverable | ||||||||||||||
| Deferred income tax asset | ||||||||||||||
| Market risk benefit assets | ||||||||||||||
| Other assets | ||||||||||||||
| Separate account assets | ||||||||||||||
| Total assets | $ | $ | ||||||||||||
| Liabilities and Equity | ||||||||||||||
| Liabilities | ||||||||||||||
| Future policy benefits | $ | $ | ||||||||||||
| Policyholder account balances | ||||||||||||||
| Market risk benefit liabilities | ||||||||||||||
| Other policy-related balances | ||||||||||||||
| Payables for collateral under securities loaned and other transactions | ||||||||||||||
| Long-term debt | ||||||||||||||
| Other liabilities | ||||||||||||||
| Separate account liabilities | ||||||||||||||
| Total liabilities | ||||||||||||||
Contingencies, Commitments and Guarantees (Note 18) | ||||||||||||||
| Equity | ||||||||||||||
| Brighthouse Financial, Inc.’s stockholders’ equity: | ||||||||||||||
Preferred stock, par value $ | ||||||||||||||
Common stock, par value $ | ||||||||||||||
| Additional paid-in capital | ||||||||||||||
| Retained earnings (deficit) | ( | ( | ||||||||||||
Treasury stock, at cost; | ( | ( | ||||||||||||
| Accumulated other comprehensive income (loss) | ( | ( | ||||||||||||
| Total Brighthouse Financial, Inc.’s stockholders’ equity | ||||||||||||||
| Noncontrolling interests | ||||||||||||||
| Total equity | ||||||||||||||
| Total liabilities and equity | $ | $ | ||||||||||||
See accompanying notes to the consolidated financial statements.
113
Brighthouse Financial, Inc.
Consolidated Statements of Operations
For the Years Ended December 31, 2023, 2022 and 2021
(In millions, except per share data)
| 2023 | 2022 | 2021 | |||||||||||||||
| Revenues | |||||||||||||||||
| Premiums | $ | $ | $ | ||||||||||||||
| Universal life and investment-type product policy fees | |||||||||||||||||
| Net investment income | |||||||||||||||||
| Other revenues | |||||||||||||||||
| Net investment gains (losses) | ( | ( | ( | ||||||||||||||
| Net derivative gains (losses) | ( | ( | ( | ||||||||||||||
| Total revenues | |||||||||||||||||
| Expenses | |||||||||||||||||
Policyholder benefits and claims (including liability remeasurement gains (losses) of ($ | |||||||||||||||||
| Interest credited to policyholder account balances | |||||||||||||||||
| Amortization of deferred policy acquisition costs and value of business acquired | |||||||||||||||||
| Change in market risk benefits | ( | ( | ( | ||||||||||||||
| Other expenses | |||||||||||||||||
| Total expenses | |||||||||||||||||
| Income (loss) before provision for income tax | ( | ||||||||||||||||
| Provision for income tax expense (benefit) | ( | ||||||||||||||||
| Net income (loss) | ( | ||||||||||||||||
| Less: Net income (loss) attributable to noncontrolling interests | |||||||||||||||||
| Net income (loss) attributable to Brighthouse Financial, Inc. | ( | ||||||||||||||||
| Less: Preferred stock dividends | |||||||||||||||||
| Net income (loss) available to Brighthouse Financial, Inc.’s common shareholders | $ | ( | $ | $ | |||||||||||||
| Earnings per common share | |||||||||||||||||
| Basic | $ | ( | $ | $ | |||||||||||||
| Diluted | $ | ( | $ | $ | |||||||||||||
See accompanying notes to the consolidated financial statements.
114
Brighthouse Financial, Inc.
Consolidated Statements of Comprehensive Income (Loss)
For the Years Ended December 31, 2023, 2022 and 2021
(In millions)
| 2023 | 2022 | 2021 | |||||||||||||||
| Net income (loss) | $ | ( | $ | $ | |||||||||||||
| Other comprehensive income (loss): | |||||||||||||||||
| Unrealized investment gains (losses), net of related offsets | ( | ( | |||||||||||||||
| Unrealized gains (losses) on derivatives | ( | ||||||||||||||||
| Changes in instrument-specific credit risk on market risk benefits | ( | ( | |||||||||||||||
| Changes in discount rates on the liability for future policy benefits | ( | ||||||||||||||||
| Foreign currency translation adjustments | ( | ||||||||||||||||
| Defined benefit plans adjustment | ( | ( | |||||||||||||||
| Other comprehensive income (loss), before income tax | ( | ( | |||||||||||||||
| Income tax (expense) benefit related to items of other comprehensive income (loss) | ( | ||||||||||||||||
| Other comprehensive income (loss), net of income tax | ( | ( | |||||||||||||||
| Comprehensive income (loss) | ( | ( | ( | ||||||||||||||
| Less: Comprehensive income (loss) attributable to noncontrolling interests, net of income tax | |||||||||||||||||
| Comprehensive income (loss) attributable to Brighthouse Financial, Inc. | $ | ( | $ | ( | $ | ( | |||||||||||
See accompanying notes to the consolidated financial statements.
115
Brighthouse Financial, Inc.
Consolidated Statements of Equity
For the Years Ended December 31, 2023, 2022 and 2021
(In millions)
| Preferred Stock | Common Stock | Additional Paid-in Capital | Retained Earnings (Deficit) | Treasury Stock at Cost | Accumulated Other Comprehensive Income (Loss) | Brighthouse Financial, Inc.’s Stockholders’ Equity | Noncontrolling Interests | Total Equity | ||||||||||||||||||||||||||||||||||||||||||||||||
| Balance at December 31, 2020 | $ | $ | $ | $ | ( | $ | ( | $ | $ | $ | $ | |||||||||||||||||||||||||||||||||||||||||||||
| Cumulative effect of change in accounting principle, net of income tax | ( | ( | ( | ( | ||||||||||||||||||||||||||||||||||||||||||||||||||||
| Balance at January 1, 2021 | ( | ( | ||||||||||||||||||||||||||||||||||||||||||||||||||||||
| Preferred stock issuance | ||||||||||||||||||||||||||||||||||||||||||||||||||||||||
| Treasury stock acquired in connection with share repurchases | ( | ( | ( | |||||||||||||||||||||||||||||||||||||||||||||||||||||
| Share-based compensation | ( | |||||||||||||||||||||||||||||||||||||||||||||||||||||||
| Dividends on preferred stock | ( | ( | ( | |||||||||||||||||||||||||||||||||||||||||||||||||||||
| Change in noncontrolling interests | ( | ( | ||||||||||||||||||||||||||||||||||||||||||||||||||||||
| Net income (loss) | ||||||||||||||||||||||||||||||||||||||||||||||||||||||||
| Other comprehensive income (loss), net of income tax | ( | ( | ( | |||||||||||||||||||||||||||||||||||||||||||||||||||||
| Balance at December 31, 2021 | ( | ( | ||||||||||||||||||||||||||||||||||||||||||||||||||||||
| Treasury stock acquired in connection with share repurchases | ( | ( | ( | |||||||||||||||||||||||||||||||||||||||||||||||||||||
| Share-based compensation | ( | |||||||||||||||||||||||||||||||||||||||||||||||||||||||
| Dividends on preferred stock | ( | ( | ( | |||||||||||||||||||||||||||||||||||||||||||||||||||||
| Change in noncontrolling interests | ( | ( | ||||||||||||||||||||||||||||||||||||||||||||||||||||||
| Net income (loss) | ||||||||||||||||||||||||||||||||||||||||||||||||||||||||
| Other comprehensive income (loss), net of income tax | ( | ( | ( | |||||||||||||||||||||||||||||||||||||||||||||||||||||
| Balance at December 31, 2022 | ( | ( | ( | |||||||||||||||||||||||||||||||||||||||||||||||||||||
| Treasury stock acquired in connection with share repurchases | ( | ( | ( | |||||||||||||||||||||||||||||||||||||||||||||||||||||
| Share-based compensation | ( | |||||||||||||||||||||||||||||||||||||||||||||||||||||||
| Dividends on preferred stock | ( | ( | ( | |||||||||||||||||||||||||||||||||||||||||||||||||||||
| Change in noncontrolling interests | ( | ( | ||||||||||||||||||||||||||||||||||||||||||||||||||||||
| Net income (loss) | ( | ( | ( | |||||||||||||||||||||||||||||||||||||||||||||||||||||
| Other comprehensive income (loss), net of income tax | ||||||||||||||||||||||||||||||||||||||||||||||||||||||||
| Balance at December 31, 2023 | $ | $ | $ | $ | ( | $ | ( | $ | ( | $ | $ | $ | ||||||||||||||||||||||||||||||||||||||||||||
See accompanying notes to the consolidated financial statements.
116
Brighthouse Financial, Inc.
Consolidated Statements of Cash Flows
For the Years Ended December 31, 2023, 2022 and 2021
(In millions)
| 2023 | 2022 | 2021 | |||||||||||||||
| Cash flows from operating activities | |||||||||||||||||
| Net income (loss) | $ | ( | $ | $ | |||||||||||||
| Adjustments to reconcile net income (loss) to net cash provided by (used in) operating activities: | |||||||||||||||||
| Amortization of premiums and accretion of discounts associated with investments, net | ( | ( | ( | ||||||||||||||
| (Gains) losses on investments, net | |||||||||||||||||
| (Gains) losses on derivatives, net | |||||||||||||||||
| (Income) loss from equity method investments, net of dividends and distributions | ( | ||||||||||||||||
| Interest credited to policyholder account balances | |||||||||||||||||
| Universal life and investment-type product policy fees | ( | ( | ( | ||||||||||||||
Change in market risk benefits, net | ( | ( | ( | ||||||||||||||
| Change in accrued investment income | ( | ( | ( | ||||||||||||||
| Change in premiums, reinsurance and other receivables | ( | ( | |||||||||||||||
| Change in deferred policy acquisition costs and value of business acquired, net | |||||||||||||||||
| Change in income tax | ( | ||||||||||||||||
| Change in other assets | |||||||||||||||||
| Change in future policy benefits and other policy-related balances | ( | ( | |||||||||||||||
| Change in other liabilities | ( | ||||||||||||||||
| Other, net | |||||||||||||||||
| Net cash provided by (used in) operating activities | ( | ( | |||||||||||||||
| Cash flows from investing activities | |||||||||||||||||
| Sales, maturities and repayments of: | |||||||||||||||||
| Fixed maturity securities | |||||||||||||||||
| Equity securities | |||||||||||||||||
| Mortgage loans | |||||||||||||||||
| Limited partnerships and limited liability companies | |||||||||||||||||
| Purchases of: | |||||||||||||||||
| Fixed maturity securities | ( | ( | ( | ||||||||||||||
| Equity securities | ( | ( | ( | ||||||||||||||
| Mortgage loans | ( | ( | ( | ||||||||||||||
| Limited partnerships and limited liability companies | ( | ( | ( | ||||||||||||||
| Cash received in connection with freestanding derivatives | |||||||||||||||||
| Cash paid in connection with freestanding derivatives | ( | ( | ( | ||||||||||||||
| Net change in policy loans | ( | ( | |||||||||||||||
| Net change in short-term investments | ( | ||||||||||||||||
| Net change in other invested assets | ( | ( | ( | ||||||||||||||
| Net cash provided by (used in) investing activities | $ | ( | $ | ( | $ | ( | |||||||||||
See accompanying notes to the consolidated financial statements.
117
Brighthouse Financial, Inc.
Consolidated Statements of Cash Flows (continued)
For the Years Ended December 31, 2023, 2022 and 2021
(In millions)
| 2023 | 2022 | 2021 | |||||||||||||||
| Cash flows from financing activities | |||||||||||||||||
| Policyholder account balances: | |||||||||||||||||
| Deposits | $ | $ | $ | ||||||||||||||
| Withdrawals | ( | ( | ( | ||||||||||||||
| Net change in payables for collateral under securities loaned and other transactions | ( | ( | |||||||||||||||
| Long-term debt issued | |||||||||||||||||
| Long-term debt repaid | ( | ( | ( | ||||||||||||||
| Preferred stock issued, net of issuance costs | |||||||||||||||||
| Dividends on preferred stock | ( | ( | ( | ||||||||||||||
| Treasury stock acquired in connection with share repurchases | ( | ( | ( | ||||||||||||||
| Financing element on certain derivative instruments and other derivative related transactions, net | ( | ( | |||||||||||||||
| Other, net | ( | ( | ( | ||||||||||||||
| Net cash provided by (used in) financing activities | |||||||||||||||||
| Change in cash, cash equivalents and restricted cash | ( | ( | |||||||||||||||
| Cash, cash equivalents and restricted cash, beginning of year | |||||||||||||||||
| Cash, cash equivalents and restricted cash, end of year | $ | $ | $ | ||||||||||||||
| Supplemental disclosures of cash flow information | |||||||||||||||||
| Net cash paid (received) for: | |||||||||||||||||
| Interest | $ | $ | $ | ||||||||||||||
| Income tax | $ | $ | $ | ||||||||||||||
| Non-cash transactions: | |||||||||||||||||
| Transfer of mortgage loans to affiliates | $ | $ | $ | ||||||||||||||
| Transfer of limited partnerships and limited liability companies from affiliates | $ | $ | $ | ||||||||||||||
See accompanying notes to the consolidated financial statements.
118
1. Business, Basis of Presentation and Summary of Significant Accounting Policies
Business
Brighthouse Financial, Inc. (“BHF” and together with its subsidiaries, “Brighthouse Financial” or the “Company”) is a holding company formed in 2016 to own the legal entities that historically operated a substantial portion of MetLife, Inc.’s (together with its subsidiaries and affiliates, “MetLife”) former retail segment until becoming a separate, publicly-traded company in August 2017. Brighthouse Financial is one of the largest providers of annuity and life insurance products in the U.S. through multiple independent distribution channels and marketing arrangements with a diverse network of distribution partners. The Company is organized into three segments: Annuities; Life; and Run-off. In addition, the Company reports certain of its results of operations in Corporate & Other.
Basis of Presentation
The preparation of financial statements in conformity with accounting principles generally accepted in the United States of America (“GAAP”) requires management to adopt accounting policies and make estimates and assumptions that affect amounts reported on the consolidated financial statements. In applying these policies and estimates, management makes subjective and complex judgments that frequently require assumptions about matters that are inherently uncertain. Many of these policies, estimates and related judgments are common in the insurance and financial services industries; others are specific to the Company’s business and operations. Actual results could differ from these estimates.
Consolidation
The accompanying consolidated financial statements include the accounts of Brighthouse Financial, as well as partnerships and limited liability companies (“LLC”) that the Company controls. Intercompany accounts and transactions have been eliminated.
The Company uses the equity method of accounting for investments in limited partnerships and LLCs when it has more than a minor ownership interest or more than a minor influence over the investee’s operations. The Company generally recognizes its share of the investee’s earnings on a three-month lag in instances where the investee’s financial information is not sufficiently timely or when the investee’s reporting period differs from the Company’s reporting period. When the Company has virtually no influence over the investee’s operations, the investment is carried at fair value.
Reclassifications
Summary of Significant Accounting Policies
Insurance Contract Obligations
The Company has obligations under insurance contracts to pay benefits over an extended period of time. The Company establishes liabilities for future obligations under long-duration insurance contracts based on the accounting model appropriate for each type of contract or contract feature. Liabilities for insurance contract benefits are generally accrued over time as revenue is recognized, or established based on the balance that accrues to the contract holder. In addition, certain insurance contracts may contain features that are required to be measured at fair value separately from the base contracts, either as a market risk benefit (“MRB”) or embedded derivative.
The discussion below provides an overview of the different accounting models for insurance contract obligations and the applicability of such models to the Company’s insurance products.
119
Brighthouse Financial, Inc.
Notes to the Consolidated Financial Statements (continued)
1. Business, Basis of Presentation and Summary of Significant Accounting Policies (continued)
Liability for Future Policy Benefits
The Company establishes a liability for future policy benefits (“LFPB”) for non-participating term and whole life insurance and income annuities. LFPBs are accrued over time as revenue is recognized based on a net premium ratio. The net premium ratio is the portion of gross premiums required to provide for all future benefits. LFPBs are established using the Company’s current assumptions of future cash flows, discounted at a rate that approximates a single A corporate bond curve. The Company generally aggregates insurance contracts into groupings by issue year, product and segment for determining the net premium ratio and related LFPBs.
The Company reviews cash flow assumptions regularly, and if they change significantly, LFPBs are adjusted by determining a revised net premium ratio. The revised net premium ratio is calculated as of contract inception using both actual historical experience and updated future cash flow assumptions. The recalculated net premium ratio is applied to derive a remeasurement gain or loss recognized in the current period net income. For insurance policies in-force as of December 31, 2020, January 1, 2021 is considered the contract inception date. The net premium ratio is also updated quarterly for the difference between actual and expected experience.
The net premium ratio is not updated for changes in discount rate assumptions, as changes in the discount rate are updated quarterly and the impacts are reflected in other comprehensive income (loss) (“OCI”). The discount rate assumption is determined by developing a yield curve based on market observable yields for upper-medium grade fixed income instruments derived from an external index. The yield curve is applied to the expected future cash flows used in the measurement of LFPBs based on the duration characteristics of those liabilities.
The most significant cash flow assumptions used in the establishment of LFPBs are mortality, policy lapses and market interest rates. See Note 4 for more information on the effect of changes in assumptions on the measurement of LFPBs.
The Company also establishes an LFPB for participating term and whole life insurance using a net premium ratio and the Company’s current assumptions of future cash flows. Assumptions are determined at issuance of the policy and are not updated unless a premium deficiency exists. A premium deficiency exists when the LFPB plus the present value of expected future gross premiums are less than expected future benefits and expenses (based on current assumptions). When a premium deficiency exists, the Company will reduce any deferred acquisition costs and may also establish an additional liability to eliminate the deficiency. See Note 4 for more information on assumptions used in establishing LFPBs related to participating term and whole life insurance.
Policyholder Account Balances
The Company establishes a policyholder account balance liability for customer deposits on universal life insurance, universal life insurance with secondary guarantees (“ULSG”) and deferred annuity contracts. The policyholder account balance liability is equal to the sum of deposits, plus interest credited, less charges and withdrawals, excluding the impact of any applicable charge that may be incurred upon surrender. The Company also holds additional liabilities for certain product features including secondary guarantees on universal life insurance contracts and the crediting rates associated with index-linked annuities.
Additional Liabilities for ULSG
The Company establishes a liability in addition to the account balance for ULSG. These liabilities are determined by estimating the expected value of death benefits payable when the account balance is projected to be zero and recognizing those benefits ratably over the contract period based on total expected assessments. The benefits used in calculating the liabilities are based on the average benefits payable over a range of scenarios. The Company also maintains a liability for profits followed by losses on ULSG determined by projecting future earnings and establishing a liability to offset losses that are expected to occur in later years. Both ULSG liabilities are adjusted for the effects of unrealized investment gains and losses.
The Company reviews cash flow assumptions regularly, and, if they change significantly, the liability for secondary guarantees is adjusted by a cumulative charge or credit to net income. Liabilities for secondary guarantees are presented within future policy benefits with changes in the liabilities reported in policyholder benefits and claims, except for the effects of unrealized investment gains and losses, which are reported in OCI.
120
Brighthouse Financial, Inc.
Notes to the Consolidated Financial Statements (continued)
1. Business, Basis of Presentation and Summary of Significant Accounting Policies (continued)
The most significant assumptions used in estimating liabilities for secondary guarantees are the general account rate of return, premium persistency, mortality and lapses. See Note 4 for more information on the effect of changes in assumptions on the measurement of liabilities for secondary guarantees.
Market Risk Benefits on Annuity Guarantees
MRBs are contracts or contract features that provide protection to the policyholder from capital markets risks by transferring such risks to the Company. MRBs are required to be separated from the deferred annuity host contract and measured at fair value. The Company establishes MRB assets and liabilities for guaranteed minimum benefits on variable annuity contracts including guaranteed minimum death benefits (“GMDB”), guaranteed minimum income benefits (“GMIB”), guaranteed minimum accumulation benefits (“GMAB”) and guaranteed minimum withdrawal benefits (“GMWB”). MRB assets are also established for reinsured benefits related to these guarantees. Certain index-linked annuity products may also have guaranteed minimum benefits classified as MRBs.
The measurement of fair value includes an adjustment for the risk that the Company fails to satisfy its obligations, which is referred to as nonperformance risk, as well as risk margin to capture the non-capital markets risks of the instrument, which represents the additional compensation a market participant would require to assume the risks related to the uncertainties in certain actuarial assumptions. MRBs are measured at estimated fair value, with changes reported in change in MRBs on the consolidated statements of operations, except for the change due to nonperformance risk, which is reported in OCI.
See Note 5 for more information on the effect of changes in inputs and assumptions on the measurement of MRBs and Note 11 for more information on the determination of fair value of MRBs.
Embedded Derivatives on Index-Linked Annuities
The Company issues, and assumes through reinsurance, index-linked annuities which allow the policyholder to participate in returns from certain specified equity indices. The crediting rates associated with these features are classified as embedded derivatives and measured at estimated fair value, with changes in estimated fair value reported in net derivative gains (losses). These embedded derivatives are classified within policyholder account balances on the consolidated balance sheets.
Embedded derivative liabilities are required to be separated from the deferred annuity host contract and measured at fair value. The estimated fair value is determined using a combination of an option pricing model and an option-budget approach. Under this approach, the Company estimates the cost of funding the crediting rate using option pricing and establishes that cost on the balance sheet as a reduction to the initial deposit amount. The estimate of fair value includes an adjustment for nonperformance risk, as well as a risk margin.
Actuarial assumptions are reviewed at least annually, and if they change significantly, the estimated fair value is adjusted through net income. Capital market inputs used in the measurement of index-linked crediting rate embedded derivatives are updated quarterly through net income. The reduction to the initial deposit is accreted back up to the initial deposit over the estimated life of the contract. Embedded derivatives related to index-linked annuities are presented within policyholder account balances while changes in the estimated fair value are reported in net derivative gains (losses).
For more information on the determination of estimated fair value of embedded derivatives, see Note 11.
Recognition of Revenues and Deposits on Insurance Contracts
Premiums related to traditional long-duration contracts are recognized as revenues when due from policyholders. When premiums for income annuities are due over a significantly shorter period than the period over which policyholder benefits are incurred, the Company establishes a deferred profit liability (“DPL”) for the excess of the gross premium over the net premium. DPLs are amortized into net income in proportion to the amount of expected future benefit payments. Assumptions used in the measurement of the DPL are updated at the same time as the related LFPBs, with the updated estimates used to recalculate the DPL as of contract inception. The remeasurement gain or loss from updating DPLs is recognized in current period net income along with the related change in LFPBs.
121
Brighthouse Financial, Inc.
Notes to the Consolidated Financial Statements (continued)
1. Business, Basis of Presentation and Summary of Significant Accounting Policies (continued)
Deposits related to universal life insurance, deferred annuity contracts and investment contracts are credited to policyholder account balances. Revenues from such contracts consist of asset-based investment management fees, cost of insurance charges, risk charges, policy administration fees and surrender charges. These fees, which are included in universal life and investment-type product policy fees, are recognized when assessed to the contract holder, except for non-level insurance charges which are deferred by the establishment of an unearned revenue liability and amortized over the expected life of the contracts.
Premiums and policy fees are presented net of reinsurance.
Deferred Policy Acquisition Costs, Value of Business Acquired and Other Intangibles
The Company incurs significant costs in connection with acquiring new and renewal insurance business. Costs that are directly related to the successful acquisition or renewal of insurance contracts are capitalized as deferred policy acquisition costs (“DAC”). These costs mainly consist of commissions and include the portion of employees’ compensation and benefits related to time spent selling, underwriting or processing the issuance of new insurance contracts. All other acquisition-related costs are expensed as incurred.
Value of business acquired (“VOBA”) is an intangible asset resulting from a business combination that represents the excess of book value over the estimated fair value of acquired insurance, annuity and investment-type contracts in-force as of the acquisition date.
The Company amortizes DAC and VOBA in a manner that approximates a straight-line basis over the expected life of the related contracts. For life insurance contracts, amortization is based on projections of amounts of insurance in-force, while projections of policy counts are used for deferred annuity contracts and expected future benefits payments for income annuities. These assumptions are reviewed at least annually, and if they change significantly, updates are recognized through changes to future amortization. VOBA balances are tested annually to determine if the balance is deemed unrecoverable from expected future profits. All changes in DAC and VOBA balances are recorded to net income.
Periodically, the Company modifies product benefits, features, rights or coverages that occur by the exchange of an existing contract for a new contract, or by amendment, endorsement, or rider to a contract, or by election or coverage within a contract. If a modification is considered to have substantially changed the contract, the associated DAC or VOBA is written off immediately through net income and any new acquisition costs associated with the replacement contract are deferred. If the modification does not substantially change the contract, the DAC or VOBA amortization on the original contract will continue and any acquisition costs associated with the related modification are expensed.
The Company also has intangible assets representing deferred sales inducements (“DSI”), which are included in other assets, and unearned revenue liabilities, which are included in other policy-related balances. The Company defers sales inducements and unearned revenue and amortizes the balances using the same methodology and assumptions used to amortize DAC and VOBA.
Reinsurance
The Company enters into reinsurance arrangements pursuant to which it cedes certain insurance risks to unaffiliated reinsurers. Cessions under reinsurance agreements do not discharge the Company’s obligations as the primary insurer. The accounting for reinsurance arrangements depends on whether the arrangement provides indemnification against loss or liability relating to insurance risk in accordance with GAAP.
For ceded reinsurance of existing in-force blocks of insurance contracts that transfer significant insurance risk, premiums, benefits and the amortization of DAC are reported net of reinsurance ceded. Amounts recoverable from reinsurers related to incurred claims and ceded reserves are included in premiums, reinsurance and other receivables and amounts payable to reinsurers included in other liabilities.
If the Company determines that a reinsurance agreement does not expose the reinsurer to a reasonable possibility of a significant loss from insurance risk, the Company records the agreement using the deposit method of accounting. Deposits received are included in other liabilities and deposits made are included in premiums, reinsurance and other receivables. As amounts are paid or received, consistent with the underlying contracts, the deposit assets or liabilities are adjusted. Interest on such deposits is recorded as other revenues or other expenses, as appropriate.
122
Brighthouse Financial, Inc.
Notes to the Consolidated Financial Statements (continued)
1. Business, Basis of Presentation and Summary of Significant Accounting Policies (continued)
The funds withheld liability represents amounts withheld by the Company in accordance with the terms of the reinsurance agreements. Under certain reinsurance agreements, the Company withholds the funds rather than transferring the underlying investments and, as a result, records a funds withheld liability in other liabilities. The Company recognizes interest on funds withheld, included in other expenses, at rates defined by the terms of the agreement which may be contractually specified or directly related to the investment portfolio.
Certain funds withheld arrangements may also contain embedded derivatives measured at fair value that are related to the investment return on the assets withheld. Embedded derivatives related to funds withheld arrangements are presented within policyholder account balances on the consolidated balance sheets, with changes in the estimated fair value reported in net derivative gains (losses).
Reinsurance arrangements may also contain features classified as MRBs, including reinsurance of guaranteed minimum benefits associated with variable annuity contracts.
The Company accounts for assumed reinsurance similar to directly written business.
Investments
Net Investment Income and Net Investment Gains (Losses)
Income from investments is reported in net investment income, unless otherwise stated herein. Gains and losses on sales of investments, impairment losses and changes in valuation allowances are reported in net investment gains (losses), unless otherwise stated herein.
Fixed Maturity Securities Available-For-Sale
The Company’s fixed maturity securities are classified as available-for-sale and are reported at their estimated fair value. Unrealized investment gains and losses on these securities are recorded as a separate component of OCI, net of policy-related amounts and deferred income taxes. Publicly-traded security transactions are recorded on a trade date basis, while privately-placed and bank loan security transactions are recorded on a settlement date basis. Investment gains and losses on sales are determined on a specific identification basis.
Interest income and prepayment fees are recognized when earned. Interest income is recognized using an effective yield method giving effect to amortization of premiums and accretion of discounts and is based on the estimated economic life of the securities, which for residential mortgage-backed securities (“RMBS”), commercial mortgage-backed securities (“CMBS”) and asset-backed securities (“ABS”) (collectively, “Structured Securities”) considers the estimated timing and amount of prepayments of the underlying loans. The amortization of premium and accretion of discount of fixed maturity securities also takes into consideration call and maturity dates.
Amortization of premium and accretion of discount on Structured Securities considers the estimated timing and amount of prepayments of the underlying loans. Actual prepayment experience is periodically reviewed, and effective yields are recalculated when differences arise between the originally anticipated and the actual prepayments received and currently anticipated. Prepayment assumptions for Structured Securities are estimated using inputs obtained from third-party specialists and based on management’s knowledge of the current market. For credit-sensitive Structured Securities and certain prepayment-sensitive securities, the effective yield is recalculated on a prospective basis. For all other Structured Securities, the effective yield is recalculated on a retrospective basis.
The Company regularly evaluates fixed maturity securities for declines in fair value to determine if a credit loss exists. This evaluation is based on management’s case-by-case evaluation of the underlying reasons for the decline in fair value including, but not limited to an analysis of the gross unrealized losses by severity and financial condition of the issuer.
For fixed maturity securities in an unrealized loss position, when the Company has the intent to sell the security, or it is more likely than not that the Company will be required to sell the security before recovery, the amortized cost basis of the security is written down to fair value through net investment gains (losses).
123
Brighthouse Financial, Inc.
Notes to the Consolidated Financial Statements (continued)
1. Business, Basis of Presentation and Summary of Significant Accounting Policies (continued)
For fixed maturity securities that do not meet the aforementioned criteria, management evaluates whether the decline in estimated fair value has resulted from credit losses or other factors. If the Company determines the decline in estimated fair value is due to credit losses, the difference between the amortized cost of the security and the present value of projected future cash flows expected to be collected is recognized as an allowance through net investment gains (losses). If the estimated fair value is less than the present value of projected future cash flows expected to be collected, this portion of the allowance related to other-than-credit factors is recorded in OCI.
Once a security specific allowance for credit losses is established, the present value of cash flows expected to be collected from the security continues to be reassessed. Any changes in the security specific allowance for credit losses are recorded as a provision for (or reversal of) credit loss expense in net investment gains (losses).
Fixed maturity securities are also evaluated to determine whether any amounts have become uncollectible. When all, or a portion, of a security is deemed uncollectible, the uncollectible portion is written-off with an adjustment to amortized cost and a corresponding reduction to the allowance for credit losses.
Mortgage Loans
Mortgage loans are stated at unpaid principal balance, adjusted for any unamortized premium or discount, and any deferred fees or expenses, and net of an allowance for credit losses. Interest income and prepayment fees are recognized when earned. Interest income is recognized using an effective yield method giving effect to amortization of premiums and accretion of discounts. The allowance for credit losses for mortgage loans represents the Company’s best estimate of expected credit losses over the remaining life of the loans and is determined using relevant available information from internal and external sources, relating to past events, current conditions, and a reasonable and supportable forecast.
Policy Loans
Policy loans are stated at unpaid principal balances. Interest income is recorded as earned using the contractual interest rate. Generally, accrued interest is capitalized on the policy’s anniversary date. Any unpaid principal and accrued interest is deducted from the cash surrender value or the death benefit prior to settlement of the insurance policy.
Limited Partnerships and LLCs
The Company uses the equity method of accounting for investments when it has more than a minor ownership interest or more than a minor influence over the investee’s operations; when the Company has virtually no influence over the investee’s operations the investment is carried at estimated fair value. The Company generally recognizes its share of the equity method investee’s earnings on a three-month lag in instances where the investee’s financial information is not sufficiently timely or when the investee’s reporting period differs from the Company’s reporting period; while distributions on investments carried at estimated fair value are recognized as earned or received.
Short-term Investments
Short-term investments include securities and other investments with remaining maturities of one year or less, but greater than three months, at the time of purchase and are stated at estimated fair value or amortized cost, which approximates estimated fair value. The Company’s short-term investments generally involve large dollar amounts that turn over quickly and have short maturities.
For the years ended December 31, 2023, 2022 and 2021, cash proceeds from sales, maturities and repayments of short-term investments were $4.2 billion, $4.9 billion and $6.3 billion, respectively. For the years ended December 31, 2023, 2022 and 2021, cash payments on purchases of short-term investments were $4.2 billion, $4.1 billion and $4.9 billion, respectively.
Other Invested Assets
Other invested assets consist principally of freestanding derivatives with positive estimated fair values which are described in “— Derivatives” below.
124
Brighthouse Financial, Inc.
Notes to the Consolidated Financial Statements (continued)
1. Business, Basis of Presentation and Summary of Significant Accounting Policies (continued)
Securities Lending Program
Securities lending transactions whereby blocks of securities are loaned to third parties, primarily brokerage firms and commercial banks, are treated as financing arrangements and the associated liability is recorded at the amount of cash received. Income and expenses associated with securities lending transactions are reported as investment income and investment expense, respectively, in net investment income.
The Company obtains collateral at the inception of the loan, usually cash, in an amount generally equal to 102% of the estimated fair value of the securities loaned and maintains it at a level greater than or equal to 100% for the duration of the loan. The Company monitors the estimated fair value of the securities loaned on a daily basis and additional collateral is obtained as necessary throughout the duration of the loan. Securities loaned under such transactions may be sold or re-pledged by the transferee. The Company is liable to return to the counterparties the cash collateral received.
Funding Agreements
The Company established liabilities for funding agreements associated with the Company’s institutional spread margin business, which are equal to the unpaid principal balance, adjusted for any unamortized premium or discount. Liabilities related to funding agreements are reported in policyholder account balances.
Derivatives
Freestanding Derivatives
Freestanding derivatives are carried at estimated fair value on the Company’s balance sheet either as assets in other invested assets or as liabilities in other liabilities. The Company does not offset the estimated fair value amounts recognized for derivatives executed with the same counterparty under the same master netting agreement.
If a derivative is not designated or did not qualify as an accounting hedge, changes in the estimated fair value of the derivative are reported in net derivative gains (losses).
The Company generally reports cash received or paid for a derivative in the investing activity section of the statement of cash flows except for cash flows of certain derivative options with deferred premiums, which are reported in the financing activity section of the statement of cash flows.
Hedge Accounting
The Company primarily designates derivatives as a hedge of a forecasted transaction or a variability of cash flows to be received or paid related to a recognized asset or liability (cash flow hedge). When a derivative is designated as a cash flow hedge and is determined to be highly effective, changes in fair value are recorded in OCI and subsequently reclassified into the statement of operations when the Company’s earnings are affected by the variability in cash flows of the hedged item.
To qualify for hedge accounting, at the inception of the hedging relationship, the Company formally documents its risk management objective and strategy for undertaking the hedging transaction, as well as its designation of the hedge. In its hedge documentation, the Company sets forth how the hedging instrument is expected to hedge the designated risks related to the hedged item and sets forth the method that will be used to retrospectively and prospectively assess the hedging instrument’s effectiveness. A derivative designated as a hedging instrument must be assessed as being highly effective in offsetting the designated risk of the hedged item. Hedge effectiveness is formally assessed at inception and at least quarterly throughout the life of the designated hedging relationship.
The Company discontinues hedge accounting prospectively when: (i) it is determined that the derivative is no longer highly effective in offsetting changes in the estimated fair value or cash flows of a hedged item; (ii) the derivative or hedged item expires, is sold, terminated, or exercised; (iii) it is no longer probable that the hedged forecasted transaction will occur; or (iv) the derivative is de-designated as a hedging instrument.
When hedge accounting is discontinued the derivative is carried at its estimated fair value on the balance sheet, with changes in its estimated fair value recognized in the current period as net derivative gains (losses). The changes in estimated fair value of derivatives previously recorded in OCI related to discontinued cash flow hedges are released into the statement of operations when the Company’s earnings are affected by the variability in cash flows of the hedged item. When the hedged item matures or is sold, or the forecasted transaction is not probable of occurring, the Company immediately reclassifies any remaining balances in OCI to net derivative gains (losses).
125
Brighthouse Financial, Inc.
Notes to the Consolidated Financial Statements (continued)
1. Business, Basis of Presentation and Summary of Significant Accounting Policies (continued)
Embedded Derivatives
The Company has index-linked annuities that are directly written or assumed through reinsurance contracts that contain embedded derivatives which are required to be separated from their host contracts and reported as derivatives. Certain funds withheld arrangements associated with reinsurance may also contain embedded derivatives. See “— Insurance Contract Obligations” and “— Reinsurance” for additional information on the accounting policies for embedded derivatives.
Fair Value
Fair value is defined as the price that would be received to sell an asset or paid to transfer a liability (an exit price) in the principal or most advantageous market for the asset or liability in an orderly transaction between market participants on the measurement date. In most cases, the exit price and the transaction (or entry) price will be the same at initial recognition.
In determining the estimated fair value of the Company’s investments, fair values are based on unadjusted quoted prices for identical investments in active markets that are readily and regularly obtainable. When such quoted prices are not available, fair values are based on quoted prices in markets that are not active, quoted prices for similar but not identical investments, or other observable inputs. If these inputs are not available, or observable inputs are not determinable, unobservable inputs and/or adjustments to observable inputs requiring management judgment are used to determine the estimated fair value of investments.
Separate Accounts
Separate accounts underlying the Company’s variable life and annuity contracts are reported at fair value. Assets in separate accounts supporting the contract liabilities are legally insulated from the Company’s general account liabilities. Investments in these separate accounts are directed by the contract holder and all investment performance, net of contract fees and assessments, is passed through to the contract holder. Investment performance and the corresponding amounts credited to contract holders of such separate accounts are offset in the same line on the statements of operations.
Separate accounts that do not pass all investment performance to the contract holder, including those underlying certain index-linked annuities, are combined on a line-by-line basis with the Company’s general account assets, liabilities, revenues and expenses. The accounting for investments in these separate accounts is consistent with the methodologies described herein for similar financial instruments held in the general account.
The Company receives asset-based distribution and service fees from mutual funds available to the variable life and annuity contract holders as investment options in its separate accounts. These fees are recognized in the period in which the related services are performed and are included in other revenues.
Income Tax
The Company’s income tax provision was prepared following the modified separate return method. The modified separate return method applies the Accounting Standards Codification 740 — Income Taxes (“ASC 740”) to the standalone financial statements of each member of the consolidated group as if the member were a separate taxpayer and a standalone enterprise, after providing benefits for losses. The Company’s accounting for income taxes represents management’s best estimate of various events and transactions. Current and deferred income taxes included herein and attributable to periods up until the Company’s separation from MetLife (“Separation”) have been allocated to the Company in a manner that is systematic, rational and consistent with the asset and liability method prescribed by ASC 740.
Deferred tax assets and liabilities resulting from temporary differences between the financial reporting and tax bases of assets and liabilities are measured at the balance sheet date using enacted tax rates expected to apply to taxable income in the years the temporary differences are expected to reverse.
126
Brighthouse Financial, Inc.
Notes to the Consolidated Financial Statements (continued)
1. Business, Basis of Presentation and Summary of Significant Accounting Policies (continued)
The realization of deferred tax assets depends upon the existence of sufficient taxable income within the carryback or carryforward periods under the tax law in the applicable tax jurisdiction. Valuation allowances are established when management determines, based on available information, that it is more likely than not that deferred income tax assets will not be realized. Significant judgment is required in determining whether valuation allowances should be established, as well as the amount of such allowances. When making such determination, the Company considers many factors, including the jurisdiction in which the deferred tax asset was generated, the length of time that carryforward can be utilized in the various taxing jurisdictions, future taxable income exclusive of reversing temporary differences and carryforwards, future reversals of existing taxable temporary differences, taxable income in prior carryback years, tax planning strategies and the nature, frequency, and amount of cumulative financial reporting income and losses in recent years.
The Inflation Reduction Act, which was enacted in 2022, established a 15% corporate alternative minimum tax (“CAMT”) for corporations whose average annual adjusted financial statement income for any consecutive three–tax year period ending after December 31, 2021, and preceding the tax year exceeds $1.0 billion. The Company elects not to consider any future effects resulting from applicability of the CAMT when assessing the valuation allowance for regular deferred tax assets.
The Company may be required to change its provision for income taxes when estimates used in determining valuation allowances on deferred tax assets significantly change or when receipt of new information indicates the need for adjustment in valuation allowances. Additionally, the effect of changes in tax laws, tax regulations, or interpretations of such laws or regulations, is recognized in net income tax expense (benefit) in the period of change.
The Company determines whether it is more likely than not that a tax position will be sustained upon examination by the appropriate taxing authorities before any part of the benefit can be recorded on the financial statements. A tax position is measured at the largest amount of benefit that is greater than 50% likely of being realized upon settlement. Unrecognized tax benefits due to tax uncertainties that do not meet the threshold are included in other liabilities and are charged to earnings in the period that such determination is made.
The Company classifies interest recognized as interest expense and penalties recognized as a component of income tax expense.
Litigation and Other Loss Contingencies
The Company is a party to or involved in a number of legal disputes, including litigation matters and disputes or other matters involving third parties (e.g., vendors, reinsurers or tax or other authorities), and are subject in the ordinary course to a number of regulatory examinations and investigations. The Company reviews relevant information with respect to litigation and other loss contingencies related to these matters and establishes liabilities when it is probable that a loss has been incurred and the amount of the loss can be reasonably estimated. Legal costs are recognized as incurred.
In matters where it is not probable, but it is reasonably possible that a loss will be incurred and the amount of loss can be reasonably estimated, such losses or range of losses are disclosed, and no accrual is made. In the absence of sufficient information to support an assessment of a reasonably possible loss or range of loss, no accrual is made and no loss or range of loss is disclosed.
Other Accounting Policies
Cash and Cash Equivalents
The Company considers all highly liquid securities and other investments purchased with an original or remaining maturity of three months or less at the date of purchase to be cash equivalents. Cash equivalents are stated at estimated fair value or amortized cost, which approximates estimated fair value.
Employee Benefit Plans
Brighthouse Services, LLC (“Brighthouse Services”) sponsors qualified and non-qualified defined contribution plans, and New England Life Insurance Company (“NELICO”) sponsors certain frozen defined benefit pension and postretirement plans. NELICO recognizes the funded status of each of its pension plans, measured as the difference between the fair value of plan assets and the benefit obligation, which is the projected benefit obligation (“PBO”) for pension benefits in other assets or other liabilities. Brighthouse Services and NELICO are both indirect wholly-owned subsidiaries.
127
Brighthouse Financial, Inc.
Notes to the Consolidated Financial Statements (continued)
1. Business, Basis of Presentation and Summary of Significant Accounting Policies (continued)
Actuarial gains and losses result from differences between the actual experience and the assumed experience on plan assets or PBO during a particular period and are recorded in accumulated other comprehensive income (loss) (“AOCI”). To the extent such gains and losses exceed 10% of the greater of the PBO or the estimated fair value of plan assets, the excess is amortized into net periodic benefit costs over the average projected future lifetime of all plan participants or projected future working lifetime, as appropriate. Prior service costs (credit) are recognized in AOCI at the time of the amendment and then amortized into net periodic benefit costs over the average projected future lifetime of all plan participants or projected future working lifetime, as appropriate.
Net periodic benefit costs are determined using management estimates and actuarial assumptions; and are comprised of service cost, interest cost, expected return on plan assets, amortization of net actuarial (gains) losses, settlement and curtailment costs, and amortization of prior service costs (credit).
Adoption of New Accounting Pronouncements
Changes to GAAP are established by the Financial Accounting Standards Board (“FASB”) in the form of accounting standards updates (“ASU”) to the FASB Accounting Standards Codification. The Company considers the applicability and impact of all ASUs. Except as noted below, there were no significant ASUs adopted during the year ended December 31, 2023.
In March 2022, the FASB issued new guidance on Troubled Debt Restructurings (“TDR”) (ASU 2022-02, Financial Instruments—Credit Losses (Topic 326): Troubled Debt Restructurings and Vintage Disclosures). This ASU eliminates TDR recognition and measurement guidance and, instead, requires that an entity evaluate (consistent with the accounting for other loan modifications) whether the modification represents a new loan or a continuation of an existing loan. The amendments also enhance existing disclosure requirements and introduce new requirements related to certain modifications of receivables made to borrowers experiencing financial difficulty. The Company adopted this guidance on January 1, 2023. This ASU was applied prospectively and did not have a material impact on the consolidated financial statements upon adoption but could change the future recognition and measurement of modified loans and other receivables.
In August 2018, the FASB issued new guidance on long-duration contracts (ASU 2018-12, Financial Services-Insurance (Topic 944): Targeted Improvements to the Accounting for Long-Duration Contracts (“LDTI”)). LDTI is effective for fiscal years beginning after January 1, 2023. LDTI resulted in significant changes to the measurement, presentation and disclosure requirements for long-duration insurance contracts. A summary of the most significant changes is provided below:
(1) Guaranteed benefits associated with variable annuity and certain fixed annuity contracts have been classified and presented separately on the consolidated balance sheets as MRBs. MRBs are now measured at estimated fair value through net income and reported separately on the consolidated statements of operations, except for nonperformance risk changes, which will be recognized in OCI.
(2) Cash flow assumptions used to measure LFPBs on traditional long-duration contracts (including term and non-participating whole life insurance and immediate annuities) have been updated on an annual basis using a retrospective method. The resulting remeasurement gain or loss is now reported separately on the consolidated statements of operations along with the remeasurement gain or loss on universal life-type contract liabilities.
(3) The discount rate assumption used to measure the liability for traditional long-duration contracts is now based on an upper-medium grade fixed income yield, updated quarterly, with changes recognized in OCI.
(4) DAC for all insurance products are required to be amortized on a constant-level basis over the expected term of the contracts, using amortization methods that are not a function of revenue or profit emergence. Changes in assumptions used to amortize DAC have been recognized as a revision to future amortization amounts.
(5) There was a significant increase in required disclosures, including disaggregated rollforwards of insurance contract assets and liabilities supplemented by qualitative and quantitative information regarding the cash flows, assumptions, methods and judgements used to measure those balances.
The transition date was January 1, 2021. MRB changes were required to be applied on a retrospective basis, while the changes for insurance liability assumption updates and DAC amortization were applied to existing carrying amounts on the transition date.
128
Brighthouse Financial, Inc.
Notes to the Consolidated Financial Statements (continued)
1. Business, Basis of Presentation and Summary of Significant Accounting Policies (continued)
The cumulative effect, on an after-tax basis, of the adoption of ASU 2018-12 as of the transition date was a $5.4 billion decrease to retained earnings and a $3.9 billion decrease to AOCI. See Note 2 for more detailed information on the impacts of the ASU to the Company’s financial statements.
Future Adoption of New Accounting Pronouncements
In November 2023, the FASB issued new guidance on Segment Reporting Disclosures (ASU 2023-07, Segment Reporting (Topic 280): Improvements to Reportable Segment Disclosures). This ASU updates reportable segment disclosures primarily through enhanced disclosures about significant segment expenses. This ASU does not change how a company identifies its operating segments, aggregates those operating segments, or applies the quantitative thresholds to determine its reportable segments. This ASU is effective for fiscal years starting January 1, 2024, and for interim periods starting January 1, 2025, and will be applied on a retrospective basis. The Company is currently evaluating the impact of this guidance on its financial statements.
In December 2023, the FASB issued new guidance on Income Tax Disclosures (ASU 2023-09, Income Taxes (Topic 740): Improvements to Income Tax Disclosures). This ASU updates the required income tax disclosures to include disclosure of income taxes paid disaggregated by jurisdiction and greater disaggregation of information in the required rate reconciliation. This ASU is effective for fiscal years starting January 1, 2025, and will be applied on a prospective basis. The Company is currently evaluating the impact of this guidance on its financial statements.
2. ASU 2018-12 Transition
The Company adopted ASU 2018-12 for LFPBs, DAC and other balances amortized on a basis consistent with DAC by applying the guidance to contracts in-force on the basis of their existing carrying amounts at the transition date. The Company adopted ASU 2018-12 for MRBs on a fully retrospective basis.
The effect of transition adjustments on stockholders’ equity at January 1, 2021 due to the adoption of ASU 2018-12 was as follows:
| Retained Earnings (Deficit) | AOCI | |||||||||||||
| (In millions) | ||||||||||||||
| Liability for future policy benefits | $ | ( | $ | ( | ||||||||||
| Market risk benefits and related adjustments | ( | ( | ||||||||||||
| DAC and VOBA | ||||||||||||||
| Reinsurance recoverables | ( | |||||||||||||
Deferred income tax asset | ||||||||||||||
| Total | $ | ( | $ | ( | ||||||||||
For LFPBs, the transition adjustment to retained earnings relates to instances where net premiums exceed gross premiums resulting in LFPBs being increased to eliminate the premium deficiency. The premium deficiency primarily relates to structured settlement annuities. The transition adjustment related to AOCI represents the effect of the requirement to discount LFPBs based on an upper-medium grade fixed income rate as well as the removal of amounts previously recorded in AOCI for the effects of unrealized investment gains and losses.
For MRBs, the transition adjustment to AOCI relates to the cumulative effect of changes in the nonperformance risk between contract issue date and transition date. In aggregate, the additional spread applied to the risk-free rate decreased from contract inception to the transition date, which had a negative impact on equity. The remaining difference between the estimated fair value and carrying amount of MRBs at transition, excluding the amounts recorded in AOCI, was recorded as an adjustment to retained earnings as of the transition date.
For DAC and VOBA, the Company removed amounts previously recorded in AOCI for the effect of unrealized investment gains and losses.
For reinsurance, the adjustments to both retained earnings and AOCI were made to align the measurement of reinsurance recoverables with the related LFPBs.
129
Brighthouse Financial, Inc.
Notes to the Consolidated Financial Statements (continued)
2. ASU 2018-12 Transition (continued)
The balances of and changes in LFPBs at January 1, 2021 due to the adoption of ASU 2018-12 were as follows:
| Term and Whole Life Insurance | Income Annuities | Structured Settlement and Pension Risk Transfer Annuities | ||||||||||||||||||
| (In millions) | ||||||||||||||||||||
| Balance at December 31, 2020 | $ | $ | $ | |||||||||||||||||
| Removal of related balances in AOCI | ( | ( | ||||||||||||||||||
| Change in cash flow assumptions | ( | |||||||||||||||||||
Initial recognition of deferred profit liabilities | ||||||||||||||||||||
| Change in discount rate assumptions | ||||||||||||||||||||
| Adjusted balance at January 1, 2021 | ||||||||||||||||||||
| Less: Reinsurance recoverable | ||||||||||||||||||||
| Adjusted balance at January 1, 2021, net of reinsurance | $ | $ | $ | |||||||||||||||||
The balance of and changes in liabilities classified as MRBs at January 1, 2021 due to the adoption of ASU 2018-12 were as follows:
| Variable Annuities | ||||||||
| (In millions) | ||||||||
| Balance at December 31, 2020 | $ | |||||||
Adjustment for the difference between carrying amount and estimated fair value, except for the difference due to nonperformance risk | ||||||||
Adjustment for cumulative effect of changes in nonperformance risk since issuance | ||||||||
| Adjusted balance at January 1, 2021 | ||||||||
| Less: Reinsurance recoverable | ||||||||
| Adjusted balance at January 1, 2021, net of reinsurance | $ | |||||||
The balances of and changes in DAC and VOBA on January 1, 2021 due to the adoption of ASU 2018-12 were as follows:
| Variable Annuities | Fixed Rate Annuities | Index-Linked Annuities | Term and Whole Life Insurance | Universal Life Insurance | ||||||||||||||||||||||||||||
| (In millions) | ||||||||||||||||||||||||||||||||
| DAC: | ||||||||||||||||||||||||||||||||
| Balance at December 31, 2020 | $ | $ | $ | $ | $ | |||||||||||||||||||||||||||
| Removal of related amounts in AOCI | ( | |||||||||||||||||||||||||||||||
| Adjusted balance at January 1, 2021 | $ | $ | $ | $ | $ | |||||||||||||||||||||||||||
| VOBA: | ||||||||||||||||||||||||||||||||
| Balance at December 31, 2020 | $ | $ | $ | $ | $ | |||||||||||||||||||||||||||
| Removal of related amounts in AOCI | ||||||||||||||||||||||||||||||||
| Adjusted balance at January 1, 2021 | $ | $ | $ | $ | $ | |||||||||||||||||||||||||||
The following tables present amounts previously reported in 2022 and 2021, the effect on those amounts of the change due to the adoption of ASU 2018-12 as described in Note 1, and the currently reported amounts in the Consolidated Balance Sheets and Consolidated Statements of Operations. See Notes 4, 5, 6 and 7 for more information.
130
Brighthouse Financial, Inc.
Notes to the Consolidated Financial Statements (continued)
2. ASU 2018-12 Transition (continued)
| December 31, 2022 | December 31, 2021 | |||||||||||||||||||||||||||||||||||||
| As Previously Reported | Effect of Change | As Currently Reported | As Previously Reported | Effect of Change | As Currently Reported | |||||||||||||||||||||||||||||||||
| (In millions) | ||||||||||||||||||||||||||||||||||||||
| Total assets | $ | $ | ( | $ | $ | $ | $ | |||||||||||||||||||||||||||||||
| Future policy benefits | $ | $ | ( | $ | $ | $ | ( | $ | ||||||||||||||||||||||||||||||
| Policyholder account balances | $ | $ | ( | $ | $ | $ | ( | $ | ||||||||||||||||||||||||||||||
| Market risk benefit liabilities | $ | $ | $ | $ | $ | $ | ||||||||||||||||||||||||||||||||
| Total liabilities | $ | $ | ( | $ | $ | $ | $ | |||||||||||||||||||||||||||||||
| Retained earnings (deficit) | $ | ( | $ | $ | ( | $ | ( | $ | ( | $ | ( | |||||||||||||||||||||||||||
| Accumulated other comprehensive income (loss) | $ | ( | $ | ( | $ | ( | $ | $ | ( | $ | ||||||||||||||||||||||||||||
| Total equity | $ | $ | ( | $ | $ | $ | ( | $ | ||||||||||||||||||||||||||||||
| Total liabilities and equity | $ | $ | ( | $ | $ | $ | $ | |||||||||||||||||||||||||||||||
| Year Ended December 31, 2022 | Year Ended December 31, 2021 | |||||||||||||||||||||||||||||||||||||
| As Previously Reported | Effect of Change | As Currently Reported | As Previously Reported | Effect of Change | As Currently Reported | |||||||||||||||||||||||||||||||||
| (In millions) | ||||||||||||||||||||||||||||||||||||||
| Universal life and investment-type product policy fees | $ | $ | ( | $ | $ | $ | ( | $ | ||||||||||||||||||||||||||||||
| Net derivative gains (losses) | $ | $ | ( | $ | ( | $ | ( | $ | ( | $ | ( | |||||||||||||||||||||||||||
| Total revenues | $ | $ | ( | $ | $ | $ | ( | $ | ||||||||||||||||||||||||||||||
| Policyholder benefits and claims | $ | $ | ( | $ | $ | $ | ( | $ | ||||||||||||||||||||||||||||||
| Change in market risk benefits | $ | $ | ( | $ | ( | $ | $ | ( | $ | ( | ||||||||||||||||||||||||||||
| Total expenses | $ | $ | ( | $ | $ | $ | ( | $ | ||||||||||||||||||||||||||||||
| Net income (loss) | $ | $ | $ | $ | ( | $ | $ | |||||||||||||||||||||||||||||||
3. Segment Information
The Company is organized into three segments: Annuities; Life; and Run-off. In addition, the Company reports certain of its results of operations in Corporate & Other.
Annuities
The Annuities segment consists of a variety of variable, fixed, index-linked and income annuities designed to address contract holders’ needs for protected wealth accumulation on a tax-deferred basis, wealth transfer and income security.
Life
The Life segment consists of insurance products, including term, universal, whole and variable life products designed to address policyholders’ needs for financial security and protected wealth transfer, which may be on a tax-advantaged basis.
Run-off
The Run-off segment consists of products that are no longer actively sold and are separately managed, including ULSG, structured settlements, pension risk transfer contracts, certain company-owned life insurance policies and certain funding agreements.
131
Brighthouse Financial, Inc.
Notes to the Consolidated Financial Statements (continued)
3. Segment Information (continued)
Corporate & Other
Corporate & Other contains the excess capital not allocated to the segments and interest expense related to the Company’s outstanding debt, as well as expenses associated with certain legal proceedings and income tax audit issues. Corporate & Other also includes long-term care business reinsured through 100% quota share reinsurance agreements and activities related to funding agreements associated with the Company’s institutional spread margin business.
In connection with the adoption of ASU 2018-12, the Company reclassified direct-to-consumer life insurance that is no longer sold from Corporate & Other to the Life segment. The segment information below reflects the direct-to-consumer life insurance in the Life segment for all periods presented.
Financial Measures and Segment Accounting Policies
Adjusted earnings is a financial measure used by management to evaluate performance and facilitate comparisons to industry results. Consistent with GAAP guidance for segment reporting, adjusted earnings is also used to measure segment performance. The Company believes the presentation of adjusted earnings, as the Company measures it for management purposes, enhances the understanding of its performance by the investor community by highlighting the results of operations and the underlying profitability drivers of the business.
Adjusted earnings, which may be positive or negative, focuses on the Company’s primary businesses by excluding the impact of market volatility, which could distort trends.
The following are significant items excluded from total revenues in calculating adjusted earnings:
•Net investment gains (losses); and
•Net derivative gains (losses), excluding earned income and amortization of premium on derivatives that are hedges of investments or that are used to replicate certain investments, but do not qualify for hedge accounting treatment (“Investment Hedge Adjustments”).
The following are significant items excluded from total expenses in calculating adjusted earnings:
•Change in MRBs; and
•Change in fair value of the crediting rate on experience-rated contracts (“Market Value Adjustments”).
The provision for income tax related to adjusted earnings is calculated using the statutory tax rate of 21%, net of impacts related to the dividends received deduction, tax credits and current period non-recurring items.
The Company’s adjusted earnings definition and presentation has been updated for all periods presented to reflect the adoption of ASU 2018-12.
The segment accounting policies are the same as those used to prepare the Company’s consolidated financial statements, except for the adjustments to calculate adjusted earnings described above. In addition, segment accounting policies include the methods of capital allocation described below.
Segment investment and capitalization targets are based on statutory oriented risk principles and metrics. Segment invested assets backing liabilities are based on net statutory liabilities plus excess capital. For the variable annuity business, the excess capital held is based on the target statutory total asset requirement consistent with the Company’s variable annuity risk management strategy. For insurance businesses other than variable annuities, excess capital held is based on a percentage of required statutory risk-based capital (“RBC”). Assets in excess of those allocated to the segments, if any, are held in Corporate & Other. Segment net investment income reflects the performance of each segment’s respective invested assets.
132
Brighthouse Financial, Inc.
Notes to the Consolidated Financial Statements (continued)
3. Segment Information (continued)
Operating results by segment, as well as Corporate & Other, were as follows:
| Year Ended December 31, 2023 | ||||||||||||||||||||||||||||||||
| Annuities | Life | Run-off | Corporate & Other | Total | ||||||||||||||||||||||||||||
| (In millions) | ||||||||||||||||||||||||||||||||
| Pre-tax adjusted earnings | $ | $ | ( | $ | ( | $ | $ | |||||||||||||||||||||||||
| Provision for income tax expense (benefit) | ( | ( | ( | |||||||||||||||||||||||||||||
| Post-tax adjusted earnings | ( | ( | ||||||||||||||||||||||||||||||
| Less: Net income (loss) attributable to noncontrolling interests | ||||||||||||||||||||||||||||||||
| Less: Preferred stock dividends | ||||||||||||||||||||||||||||||||
| Adjusted earnings | $ | $ | ( | $ | ( | $ | ( | |||||||||||||||||||||||||
| Adjustments for: | ||||||||||||||||||||||||||||||||
| Net investment gains (losses) | ( | |||||||||||||||||||||||||||||||
Net derivative gains (losses), excluding investment hedge adjustments of $ | ( | |||||||||||||||||||||||||||||||
| Change in market risk benefits | ||||||||||||||||||||||||||||||||
Market value adjustments | ( | |||||||||||||||||||||||||||||||
| Provision for income tax (expense) benefit | ||||||||||||||||||||||||||||||||
| Net income (loss) available to Brighthouse Financial, Inc.’s common shareholders | $ | ( | ||||||||||||||||||||||||||||||
| Interest revenue | $ | $ | $ | $ | ||||||||||||||||||||||||||||
| Interest expense | $ | $ | $ | $ | ||||||||||||||||||||||||||||
| Year Ended December 31, 2022 | ||||||||||||||||||||||||||||||||
| Annuities | Life | Run-off | Corporate & Other | Total | ||||||||||||||||||||||||||||
| (In millions) | ||||||||||||||||||||||||||||||||
| Pre-tax adjusted earnings | $ | $ | $ | $ | ( | $ | ||||||||||||||||||||||||||
| Provision for income tax expense (benefit) | ( | |||||||||||||||||||||||||||||||
| Post-tax adjusted earnings | ||||||||||||||||||||||||||||||||
| Less: Net income (loss) attributable to noncontrolling interests | ||||||||||||||||||||||||||||||||
| Less: Preferred stock dividends | ||||||||||||||||||||||||||||||||
| Adjusted earnings | $ | $ | $ | $ | ( | |||||||||||||||||||||||||||
| Adjustments for: | ||||||||||||||||||||||||||||||||
| Net investment gains (losses) | ( | |||||||||||||||||||||||||||||||
Net derivative gains (losses), excluding investment hedge adjustments of $ | ( | |||||||||||||||||||||||||||||||
| Change in market risk benefits | ||||||||||||||||||||||||||||||||
Market value adjustments | ||||||||||||||||||||||||||||||||
| Provision for income tax (expense) benefit | ( | |||||||||||||||||||||||||||||||
| Net income (loss) available to Brighthouse Financial, Inc.’s common shareholders | $ | |||||||||||||||||||||||||||||||
| Interest revenue | $ | $ | $ | $ | ||||||||||||||||||||||||||||
| Interest expense | $ | $ | $ | $ | ||||||||||||||||||||||||||||
133
Brighthouse Financial, Inc.
Notes to the Consolidated Financial Statements (continued)
3. Segment Information (continued)
| Year Ended December 31, 2021 | ||||||||||||||||||||||||||||||||
| Annuities | Life | Run-off | Corporate & Other | Total | ||||||||||||||||||||||||||||
| (In millions) | ||||||||||||||||||||||||||||||||
| Pre-tax adjusted earnings | $ | $ | $ | $ | ( | $ | ||||||||||||||||||||||||||
| Provision for income tax expense (benefit) | ( | |||||||||||||||||||||||||||||||
| Post-tax adjusted earnings | ( | |||||||||||||||||||||||||||||||
| Less: Net income (loss) attributable to noncontrolling interests | ||||||||||||||||||||||||||||||||
| Less: Preferred stock dividends | ||||||||||||||||||||||||||||||||
| Adjusted earnings | $ | $ | $ | $ | ( | |||||||||||||||||||||||||||
| Adjustments for: | ||||||||||||||||||||||||||||||||
| Net investment gains (losses) | ( | |||||||||||||||||||||||||||||||
Net derivative gains (losses), excluding investment hedge adjustments of $ | ( | |||||||||||||||||||||||||||||||
| Change in market risk benefits | ||||||||||||||||||||||||||||||||
Market value adjustments | ||||||||||||||||||||||||||||||||
| Provision for income tax (expense) benefit | ( | |||||||||||||||||||||||||||||||
| Net income (loss) available to Brighthouse Financial, Inc.’s common shareholders | $ | |||||||||||||||||||||||||||||||
| Interest revenue | $ | $ | $ | $ | ||||||||||||||||||||||||||||
| Interest expense | $ | $ | $ | $ | ||||||||||||||||||||||||||||
Total revenues by segment, as well as Corporate & Other, were as follows:
| Years Ended December 31, | |||||||||||||||||
| 2023 | 2022 | 2021 | |||||||||||||||
| (In millions) | |||||||||||||||||
| Annuities | $ | $ | $ | ||||||||||||||
| Life | |||||||||||||||||
| Run-off | |||||||||||||||||
| Corporate & Other | |||||||||||||||||
| Adjustments | ( | ( | ( | ||||||||||||||
| Total | $ | $ | $ | ||||||||||||||
Total assets by segment, as well as Corporate & Other, were as follows at:
| December 31, | ||||||||||||||
| 2023 | 2022 | |||||||||||||
| (In millions) | ||||||||||||||
| Annuities | $ | $ | ||||||||||||
| Life | ||||||||||||||
| Run-off | ||||||||||||||
| Corporate & Other | ||||||||||||||
| Total | $ | $ | ||||||||||||
134
Brighthouse Financial, Inc.
Notes to the Consolidated Financial Statements (continued)
3. Segment Information (continued)
Total premiums, universal life and investment-type product policy fees and other revenues by major product group were as follows:
| Years Ended December 31, | |||||||||||||||||
| 2023 | 2022 | 2021 | |||||||||||||||
| (In millions) | |||||||||||||||||
| Annuity products | $ | $ | $ | ||||||||||||||
| Life insurance products | |||||||||||||||||
| Other products | |||||||||||||||||
| Total | $ | $ | $ | ||||||||||||||
Substantially all of the Company’s premiums, universal life and investment-type product policy fees and other revenues originated in the U.S.
Revenues derived from any individual customer did not exceed 10% of premiums, universal life and investment-type product policy fees and other revenues for the years ended December 31, 2023, 2022 and 2021.
135
4. Insurance Liabilities
Liability for Future Policy Benefits
Information regarding LFPBs for non-participating traditional and limited-payment contracts was as follows:
| Years Ended December 31, | ||||||||||||||||||||||||||||||||||||||||||||||||||||||||
| 2023 | 2022 | 2021 | ||||||||||||||||||||||||||||||||||||||||||||||||||||||
| Term and Whole Life Insurance | Income Annuities | Structured Settlement and Pension Risk Transfer Annuities | Term and Whole Life Insurance | Income Annuities | Structured Settlement and Pension Risk Transfer Annuities | Term and Whole Life Insurance | Income Annuities | Structured Settlement and Pension Risk Transfer Annuities | ||||||||||||||||||||||||||||||||||||||||||||||||
| (Dollars in millions) | ||||||||||||||||||||||||||||||||||||||||||||||||||||||||
| Present value of expected net premiums: | ||||||||||||||||||||||||||||||||||||||||||||||||||||||||
| Balance, beginning of year | $ | $ | $ | $ | $ | $ | $ | $ | $ | |||||||||||||||||||||||||||||||||||||||||||||||
| Beginning balance at original discount rate | ||||||||||||||||||||||||||||||||||||||||||||||||||||||||
| Effect of model refinements | ||||||||||||||||||||||||||||||||||||||||||||||||||||||||
| Effect of changes in cash flow assumptions | ||||||||||||||||||||||||||||||||||||||||||||||||||||||||
| Effect of actual variances from expected experience | ( | |||||||||||||||||||||||||||||||||||||||||||||||||||||||
| Adjusted beginning of year balance | ||||||||||||||||||||||||||||||||||||||||||||||||||||||||
| Issuances | ||||||||||||||||||||||||||||||||||||||||||||||||||||||||
| Interest accrual | ||||||||||||||||||||||||||||||||||||||||||||||||||||||||
| Net premiums collected | ( | ( | ( | |||||||||||||||||||||||||||||||||||||||||||||||||||||
| Ending balance at original discount rate | ||||||||||||||||||||||||||||||||||||||||||||||||||||||||
| Effect of changes in discount rate assumptions | ( | ( | ||||||||||||||||||||||||||||||||||||||||||||||||||||||
| Balance, end of year | $ | $ | $ | $ | $ | $ | $ | $ | $ | |||||||||||||||||||||||||||||||||||||||||||||||
| Present value of expected future policy benefits: | ||||||||||||||||||||||||||||||||||||||||||||||||||||||||
| Balance, beginning of year | $ | $ | $ | $ | $ | $ | $ | $ | $ | |||||||||||||||||||||||||||||||||||||||||||||||
| Beginning balance at original discount rate | ||||||||||||||||||||||||||||||||||||||||||||||||||||||||
| Effect of model refinements | ( | |||||||||||||||||||||||||||||||||||||||||||||||||||||||
| Effect of changes in cash flow assumptions | ( | ( | ( | |||||||||||||||||||||||||||||||||||||||||||||||||||||
| Effect of actual variances from expected experience | ( | ( | ( | ( | ( | ( | ( | |||||||||||||||||||||||||||||||||||||||||||||||||
| Adjusted beginning of year balance | ||||||||||||||||||||||||||||||||||||||||||||||||||||||||
| Issuances | ||||||||||||||||||||||||||||||||||||||||||||||||||||||||
| Interest accrual | ||||||||||||||||||||||||||||||||||||||||||||||||||||||||
| Benefit payments | ( | ( | ( | ( | ( | ( | ( | ( | ( | |||||||||||||||||||||||||||||||||||||||||||||||
| Ending balance at original discount rate | ||||||||||||||||||||||||||||||||||||||||||||||||||||||||
| Effect of changes in discount rate assumptions | ( | ( | ( | ( | ( | ( | ||||||||||||||||||||||||||||||||||||||||||||||||||
| Balance, end of year | $ | $ | $ | $ | $ | $ | $ | $ | $ | |||||||||||||||||||||||||||||||||||||||||||||||
| Net liability for future policy benefits, end of year | $ | $ | $ | $ | $ | $ | $ | $ | $ | |||||||||||||||||||||||||||||||||||||||||||||||
| Less: Reinsurance recoverable, end of year | ||||||||||||||||||||||||||||||||||||||||||||||||||||||||
| Net liability for future policy benefits, after reinsurance recoverable | $ | $ | $ | $ | $ | $ | $ | $ | $ | |||||||||||||||||||||||||||||||||||||||||||||||
| Weighted-average duration of liability | ||||||||||||||||||||||||||||||||||||||||||||||||||||||||
| Weighted-average interest accretion rate | % | % | % | % | % | % | % | % | % | |||||||||||||||||||||||||||||||||||||||||||||||
| Current discount rate | % | % | % | % | % | % | % | % | % | |||||||||||||||||||||||||||||||||||||||||||||||
| Gross premiums or assessments recognized during period | $ | $ | $ | $ | $ | $ | $ | $ | $ | |||||||||||||||||||||||||||||||||||||||||||||||
| Expected future gross premiums, undiscounted | $ | $ | $ | $ | $ | $ | $ | $ | $ | |||||||||||||||||||||||||||||||||||||||||||||||
| Expected future gross premiums, discounted | $ | $ | $ | $ | $ | $ | $ | $ | $ | |||||||||||||||||||||||||||||||||||||||||||||||
| Expected future benefit payments, undiscounted | $ | $ | $ | $ | $ | $ | $ | $ | $ | |||||||||||||||||||||||||||||||||||||||||||||||
| Expected future benefit payments, discounted | $ | $ | $ | $ | $ | $ | $ | $ | $ | |||||||||||||||||||||||||||||||||||||||||||||||
136
Brighthouse Financial, Inc.
Notes to the Consolidated Financial Statements
4. Insurance Liabilities (continued)
The measurement of LFPBs can be significantly impacted by changes in assumptions for policyholder behavior. As part of the 2023 and 2022 annual actuarial review (“AAR”), the Company updated assumptions regarding mortality and lapses for term and non-participating whole life insurance. The impact from changes in assumptions is presented in effect of changes in cash flow assumptions in the table above.
Information regarding the additional insurance liabilities for universal life-type contracts with secondary guarantees was as follows:
| Years Ended December 31, | ||||||||||||||||||||
| 2023 | 2022 | 2021 | ||||||||||||||||||
| (Dollars in millions) | ||||||||||||||||||||
| Balance, beginning of year | $ | $ | $ | |||||||||||||||||
| Beginning balance before the effect of unrealized gains and losses | ||||||||||||||||||||
| Effect of changes in cash flow assumptions | ( | |||||||||||||||||||
| Effect of actual variances from expected experience | ( | |||||||||||||||||||
| Adjusted beginning of year balance | ||||||||||||||||||||
| Interest accrual | ||||||||||||||||||||
| Net assessments collected | ||||||||||||||||||||
| Benefit payments | ( | ( | ( | |||||||||||||||||
| Effect of realized capital gains (losses) | ||||||||||||||||||||
| Ending balance before the effect of unrealized gains and losses | ||||||||||||||||||||
| Effect of unrealized gains and losses | ( | ( | ||||||||||||||||||
| Balance, end of year | ||||||||||||||||||||
| Less: Reinsurance recoverable, end of year | ||||||||||||||||||||
| Net additional liability, after reinsurance recoverable | $ | $ | $ | |||||||||||||||||
| Weighted-average duration of liability | ||||||||||||||||||||
| Weighted-average interest accretion rate | % | % | % | |||||||||||||||||
| Gross assessments recognized during period | $ | $ | $ | |||||||||||||||||
The measurement of liabilities for secondary guarantees can be significantly impacted by changes in the expected general account rate of return, which is driven by the Company’s assumption for long-term treasury yields. The Company’s practice of projecting treasury yields uses a mean reversion approach that assumes that long-term interest rates are less influenced by short-term fluctuations and are only changed when sustained interim deviations are expected. As part of the 2023 AAR, the Company increased the long-term general account earned rate, driven by an increase in the mean reversion rate from 3.50 % to 3.75 %. The Company also updated assumptions regarding policyholder behavior, including mortality, premium persistency, lapses, withdrawals and maintenance expenses. As part of the 2022 AAR, the Company increased the long-term general account earned rate, driven by an increase in the mean reversion rate from 3.00 % to 3.50 %. Both period assumption updates are reflected in the table above.
137
Brighthouse Financial, Inc.
Notes to the Consolidated Financial Statements
4. Insurance Liabilities (continued)
A reconciliation of the net LFPBs for nonparticipating traditional and limited-payment contracts and the additional insurance liabilities for universal life-type contracts with secondary guarantees reported in the preceding rollforward tables to LFPBs on the consolidated balance sheets was as follows at:
| December 31, | ||||||||||||||
| 2023 | 2022 | |||||||||||||
| (In millions) | ||||||||||||||
| Liabilities reported in the preceding rollforward tables | $ | $ | ||||||||||||
| Long-term care insurance (1) | ||||||||||||||
| ULSG liabilities, including liability for profits followed by losses | ||||||||||||||
| Participating whole life insurance (2) | ||||||||||||||
| Deferred profit liabilities | ||||||||||||||
| Other | ||||||||||||||
| Total liability for future policy benefits | $ | $ | ||||||||||||
_______________
(1)Includes liabilities related to fully reinsured individual long-term care insurance. See Note 8.
(2)Participating whole life insurance uses an interest assumption based on the non-forfeiture interest rate, ranging from 3.5 % to 4.5 %, and mortality rates guaranteed in calculating the cash surrender values described in such contracts, and also includes a liability for terminal dividends. Participating whole life insurance represented 3 % of the Company’s life insurance in-force at both December 31, 2023 and 2022, and 40 % and 41 % of gross traditional life insurance premiums for the years ended December 31, 2023 and 2022, respectively.
138
Brighthouse Financial, Inc.
Notes to the Consolidated Financial Statements
4. Insurance Liabilities (continued)
Policyholder Account Balances
Information regarding policyholder account balances was as follows:
| Universal Life Insurance | Variable Annuities (1) | Index-linked Annuities | Fixed Rate Annuities | ULSG | Company-Owned Life Insurance (1) | |||||||||||||||||||||||||||||||||
| (Dollars in millions) | ||||||||||||||||||||||||||||||||||||||
| Year Ended December 31, 2023 | ||||||||||||||||||||||||||||||||||||||
| Balance, beginning of year | $ | $ | $ | $ | $ | $ | ||||||||||||||||||||||||||||||||
| Premiums and deposits | ||||||||||||||||||||||||||||||||||||||
| Surrenders and withdrawals | ( | ( | ( | ( | ( | |||||||||||||||||||||||||||||||||
| Benefit payments | ( | ( | ( | ( | ( | ( | ||||||||||||||||||||||||||||||||
| Net transfers from (to) separate account | ||||||||||||||||||||||||||||||||||||||
| Interest credited | ||||||||||||||||||||||||||||||||||||||
| Policy charges | ( | ( | ( | ( | ( | |||||||||||||||||||||||||||||||||
| Changes related to embedded derivatives | ||||||||||||||||||||||||||||||||||||||
| Balance, end of year | $ | $ | $ | $ | $ | $ | ||||||||||||||||||||||||||||||||
| Weighted-average crediting rate (2) | % | % | % | % | % | % | ||||||||||||||||||||||||||||||||
| Year Ended December 31, 2022 | ||||||||||||||||||||||||||||||||||||||
| Balance, beginning of year | $ | $ | $ | $ | $ | $ | ||||||||||||||||||||||||||||||||
| Premiums and deposits | ||||||||||||||||||||||||||||||||||||||
| Surrenders and withdrawals | ( | ( | ( | ( | ( | |||||||||||||||||||||||||||||||||
| Benefit payments | ( | ( | ( | ( | ( | ( | ||||||||||||||||||||||||||||||||
| Net transfers from (to) separate account | ( | |||||||||||||||||||||||||||||||||||||
| Interest credited | ( | |||||||||||||||||||||||||||||||||||||
| Policy charges | ( | ( | ( | ( | ( | |||||||||||||||||||||||||||||||||
| Changes related to embedded derivatives | ( | |||||||||||||||||||||||||||||||||||||
| Balance, end of year | $ | $ | $ | $ | $ | $ | ||||||||||||||||||||||||||||||||
| Weighted-average crediting rate (2) | % | % | % | ( | % | % | % | |||||||||||||||||||||||||||||||
| Year Ended December 31, 2021 | ||||||||||||||||||||||||||||||||||||||
| Balance, beginning of year | $ | $ | $ | $ | $ | $ | ||||||||||||||||||||||||||||||||
| Premiums and deposits | ||||||||||||||||||||||||||||||||||||||
| Surrenders and withdrawals | ( | ( | ( | ( | ( | |||||||||||||||||||||||||||||||||
| Benefit payments | ( | ( | ( | ( | ( | ( | ||||||||||||||||||||||||||||||||
| Net transfers from (to) separate account | ( | |||||||||||||||||||||||||||||||||||||
| Interest credited | ||||||||||||||||||||||||||||||||||||||
| Policy charges | ( | ( | ( | ( | ( | |||||||||||||||||||||||||||||||||
| Changes related to embedded derivatives | ||||||||||||||||||||||||||||||||||||||
| Balance, end of year | $ | $ | $ | $ | $ | $ | ||||||||||||||||||||||||||||||||
| Weighted-average crediting rate (2) | % | % | % | % | % | % | ||||||||||||||||||||||||||||||||
_______________
(1)Includes liabilities related to separate account products where the contract holder elected a general account investment option.
(2)Excludes the effects of embedded derivatives related to index-linked crediting rates.
139
Brighthouse Financial, Inc.
Notes to the Consolidated Financial Statements
4. Insurance Liabilities (continued)
A reconciliation of policyholder account balances reported in the preceding rollforward table to the liability for policyholder account balances on the consolidated balance sheets was as follows at:
| December 31, | ||||||||||||||
| 2023 | 2022 | |||||||||||||
| (In millions) | ||||||||||||||
| Policyholder account balances reported in the preceding rollforward table | $ | $ | ||||||||||||
| Funding agreements classified as investment contracts | ||||||||||||||
| Other investment contract liabilities | ||||||||||||||
| Total policyholder account balances | $ | $ | ||||||||||||
The balance of account values by range of guaranteed minimum crediting rates and the related range of difference, in basis points, between rates being credited to policyholders and the respective guaranteed minimums was as follows at:
| Range of Guaranteed Minimum Crediting Rate | At Guaranteed Minimum | 1 to 50 Basis Points Above | 51 to 150 Basis Points Above | Greater than 150 Basis Points Above | Total | |||||||||||||||||||||||||||
| (In millions) | ||||||||||||||||||||||||||||||||
| December 31, 2023 | ||||||||||||||||||||||||||||||||
| Annuities (1): | ||||||||||||||||||||||||||||||||
| Less than 2.00% | $ | $ | $ | $ | $ | |||||||||||||||||||||||||||
| 2.00% to 3.99% | ||||||||||||||||||||||||||||||||
| Greater than 3.99% | ||||||||||||||||||||||||||||||||
| Total | $ | $ | $ | $ | $ | |||||||||||||||||||||||||||
| Life insurance (2) (3): | ||||||||||||||||||||||||||||||||
| Less than 2.00% | $ | $ | $ | $ | $ | |||||||||||||||||||||||||||
| 2.00% to 3.99% | ||||||||||||||||||||||||||||||||
| Greater than 3.99% | ||||||||||||||||||||||||||||||||
| Total | $ | $ | $ | $ | $ | |||||||||||||||||||||||||||
| ULSG (3): | ||||||||||||||||||||||||||||||||
| Less than 2.00% | $ | $ | $ | $ | $ | |||||||||||||||||||||||||||
| 2.00% to 3.99% | ||||||||||||||||||||||||||||||||
| Greater than 3.99% | ||||||||||||||||||||||||||||||||
| Total | $ | $ | $ | $ | $ | |||||||||||||||||||||||||||
| December 31, 2022 | ||||||||||||||||||||||||||||||||
| Annuities (1): | ||||||||||||||||||||||||||||||||
| Less than 2.00% | $ | $ | $ | $ | $ | |||||||||||||||||||||||||||
| 2.00% to 3.99% | ||||||||||||||||||||||||||||||||
| Greater than 3.99% | ||||||||||||||||||||||||||||||||
| Total | $ | $ | $ | $ | $ | |||||||||||||||||||||||||||
| Life insurance (2) (3): | ||||||||||||||||||||||||||||||||
| Less than 2.00% | $ | $ | $ | $ | $ | |||||||||||||||||||||||||||
| 2.00% to 3.99% | ||||||||||||||||||||||||||||||||
| Greater than 3.99% | ||||||||||||||||||||||||||||||||
| Total | $ | $ | $ | $ | $ | |||||||||||||||||||||||||||
| ULSG (3): | ||||||||||||||||||||||||||||||||
| Less than 2.00% | $ | $ | $ | $ | $ | |||||||||||||||||||||||||||
| 2.00% to 3.99% | ||||||||||||||||||||||||||||||||
| Greater than 3.99% | ||||||||||||||||||||||||||||||||
| Total | $ | $ | $ | $ | $ | |||||||||||||||||||||||||||
_______________
(1)Includes policyholder account balances for fixed rate annuities and the fixed account portion of variable annuities.
140
Brighthouse Financial, Inc.
Notes to the Consolidated Financial Statements
4. Insurance Liabilities (continued)
(2)Includes policyholder account balances for retained asset accounts, universal life policies and the fixed account portion of universal variable life insurance policies.
(3)Amounts are gross of policy loans.
See Note 6 for information regarding net amount at risk and cash surrender values.
Obligations Under Funding Agreements
Institutional Spread Margin Business
Brighthouse Life Insurance Company has issued unsecured fixed and floating rate funding agreements to certain special purpose entities that have issued either debt securities or commercial paper for which payment of interest and principal is secured by such funding agreements. The Company had obligations outstanding under these funding agreements of $5.5
Brighthouse Life Insurance Company has a secured funding agreement program with the Federal Home Loan Bank (“FHLB”) of Atlanta. The Company had obligations outstanding under this program of $4.4 billion and $3.9 billion at December 31, 2023 and 2022, respectively. Funding agreements are issued to FHLBs in exchange for cash, for which the FHLBs have been granted liens on certain assets, some of which are in their custody to collateralize the Company’s obligations under the funding agreements. The Company is permitted to withdraw any portion of the collateral in the custody of the FHLBs as long as there is no event of default and the remaining qualified collateral is sufficient to satisfy the collateral maintenance level. Upon any event of default by the Company, the FHLBs’ recovery on the collateral is limited to the amount of the Company’s liabilities to the FHLBs. See Note 9 for information on invested assets pledged as collateral in connection with funding agreements.
Brighthouse Life Insurance Company has a secured funding agreement program with the Federal Agricultural Mortgage Corporation and its affiliate Farmer Mac Mortgage Securities Corporation (“Farmer Mac”). The Company had obligations outstanding under this program of $700
Inactive Funding Agreement Programs
141
Brighthouse Financial, Inc.
Notes to the Consolidated Financial Statements (continued)
5. Market Risk Benefits
Information regarding MRB assets and liabilities associated with variable annuities was as follows:
| Years Ended December 31, | ||||||||||||||||||||
| 2023 | 2022 | 2021 | ||||||||||||||||||
| (Dollars in millions) | ||||||||||||||||||||
| Balance, beginning of year | $ | $ | $ | |||||||||||||||||
Balance, beginning of year, before effect of changes in nonperformance risk | ||||||||||||||||||||
| Decrements | ( | ( | ||||||||||||||||||
| Effect of changes in future expected assumptions | ||||||||||||||||||||
| Effect of actual different from expected experience | ( | ( | ||||||||||||||||||
| Effect of changes in interest rates | ( | ( | ( | |||||||||||||||||
| Effect of changes in fund returns | ( | ( | ||||||||||||||||||
| Issuances | ( | ( | ( | |||||||||||||||||
| Effect of changes in risk margin | ( | ( | ( | |||||||||||||||||
| Aging of the block and other | ||||||||||||||||||||
Balance, end of year, before effect of changes in nonperformance risk | ||||||||||||||||||||
| Effect of changes in nonperformance risk | ||||||||||||||||||||
| Balance, end of year | ||||||||||||||||||||
| Less: Reinsurance recoverable, end of year | ||||||||||||||||||||
| Balance, end of year, net of reinsurance (1) | $ | $ | $ | |||||||||||||||||
| Weighted-average attained age of contract holder | ||||||||||||||||||||
_______________
(1)Amounts represent the sum of MRB assets and MRB liabilities presented on the consolidated balance sheets at December 31, 2023, 2022 and 2021, with the exception of $9 million, $3 million and $5 million, respectively, of index-linked annuities not included in this table.
Market conditions, including, but not limited to, changes in interest rates, equity indices, market volatility and variations in actuarial assumptions, including policyholder behavior, mortality and risk margins related to non-capital markets inputs, as well as changes in nonperformance risk, may result in significant fluctuations in the estimated fair value of the guarantees. As part of the AAR in 2023 and 2022, the Company updated assumptions regarding policyholder behavior, mortality, separate account fund allocations and volatility, which are reflected in the table above.
142
Brighthouse Financial, Inc.
Notes to the Consolidated Financial Statements (continued)
6. Separate Accounts
Separate Accounts
Information regarding separate account liabilities was as follows:
| Years Ended December 31, | ||||||||||||||||||||||||||||||||||||||||||||||||||||||||
| 2023 | 2022 | 2021 | ||||||||||||||||||||||||||||||||||||||||||||||||||||||
| Variable Annuities | Universal Life Insurance | Company-Owned Life Insurance | Variable Annuities | Universal Life Insurance | Company-Owned Life Insurance | Variable Annuities | Universal Life Insurance | Company-Owned Life Insurance | ||||||||||||||||||||||||||||||||||||||||||||||||
| (In millions) | ||||||||||||||||||||||||||||||||||||||||||||||||||||||||
| Balance, beginning of year | $ | $ | $ | $ | $ | $ | $ | $ | $ | |||||||||||||||||||||||||||||||||||||||||||||||
| Premiums and deposits | ||||||||||||||||||||||||||||||||||||||||||||||||||||||||
| Surrenders and withdrawals | ( | ( | ( | ( | ( | ( | ( | ( | ( | |||||||||||||||||||||||||||||||||||||||||||||||
| Benefit payments | ( | ( | ( | ( | ( | ( | ( | ( | ( | |||||||||||||||||||||||||||||||||||||||||||||||
| Investment performance | ( | ( | ( | |||||||||||||||||||||||||||||||||||||||||||||||||||||
| Policy charges | ( | ( | ( | ( | ( | ( | ( | ( | ( | |||||||||||||||||||||||||||||||||||||||||||||||
| Net transfers from (to) general account | ( | ( | ( | ( | ( | ( | ( | |||||||||||||||||||||||||||||||||||||||||||||||||
| Other | ( | ( | ( | ( | ( | ( | ||||||||||||||||||||||||||||||||||||||||||||||||||
| Balance, end of year | $ | $ | $ | $ | $ | $ | $ | $ | $ | |||||||||||||||||||||||||||||||||||||||||||||||
A reconciliation of separate account liabilities reported in the preceding rollforward table to the separate account liabilities balance on the consolidated balance sheets was as follows at:
| December 31, | ||||||||||||||
| 2023 | 2022 | |||||||||||||
| (In millions) | ||||||||||||||
| Separate account liabilities reported in the preceding rollforward table | $ | $ | ||||||||||||
| Variable income annuities | ||||||||||||||
| Pension risk transfer annuities | ||||||||||||||
| Total separate account liabilities | $ | $ | ||||||||||||
The aggregate estimated fair value of assets, by major investment asset category, supporting separate accounts was as follows at:
| December 31, | ||||||||||||||
| 2023 | 2022 | |||||||||||||
| (In millions) | ||||||||||||||
Equity securities | $ | $ | ||||||||||||
Fixed maturity securities | ||||||||||||||
| Cash and cash equivalents | ||||||||||||||
| Other assets | ||||||||||||||
Total aggregate estimated fair value of assets | $ | $ | ||||||||||||
143
Brighthouse Financial, Inc.
Notes to the Consolidated Financial Statements (continued)
6. Separate Accounts (continued)
Net Amount at Risk and Cash Surrender Values
Information regarding the net amount at risk and cash surrender value for insurance products was as follows at:
| Universal Life Insurance | Variable Annuities | Index-linked Annuities | Fixed Rate Annuities | ULSG | Company-Owned Life Insurance | |||||||||||||||||||||||||||||||||
| (In millions) | ||||||||||||||||||||||||||||||||||||||
| December 31, 2023 | ||||||||||||||||||||||||||||||||||||||
| Account balances reported in the preceding rollforward tables: | ||||||||||||||||||||||||||||||||||||||
| Policyholder account balances | $ | $ | $ | $ | $ | $ | ||||||||||||||||||||||||||||||||
| Separate account liabilities | ||||||||||||||||||||||||||||||||||||||
| Total account balances | $ | $ | $ | $ | $ | $ | ||||||||||||||||||||||||||||||||
| Net amount at risk | $ | $ | N/A | N/A | $ | $ | ||||||||||||||||||||||||||||||||
| Cash surrender value | $ | $ | $ | $ | $ | $ | ||||||||||||||||||||||||||||||||
| December 31, 2022 | ||||||||||||||||||||||||||||||||||||||
| Account balances reported in the preceding rollforward tables: | ||||||||||||||||||||||||||||||||||||||
| Policyholder account balances | $ | $ | $ | $ | $ | $ | ||||||||||||||||||||||||||||||||
| Separate account liabilities | ||||||||||||||||||||||||||||||||||||||
| Total account balances | $ | $ | $ | $ | $ | $ | ||||||||||||||||||||||||||||||||
| Net amount at risk | $ | $ | N/A | N/A | $ | $ | ||||||||||||||||||||||||||||||||
| Cash surrender value | $ | $ | $ | $ | $ | $ | ||||||||||||||||||||||||||||||||
| December 31, 2021 | ||||||||||||||||||||||||||||||||||||||
| Account balances reported in the preceding rollforward tables: | ||||||||||||||||||||||||||||||||||||||
| Policyholder account balances | $ | $ | $ | $ | $ | $ | ||||||||||||||||||||||||||||||||
| Separate account liabilities | ||||||||||||||||||||||||||||||||||||||
| Total account balances | $ | $ | $ | $ | $ | $ | ||||||||||||||||||||||||||||||||
| Net amount at risk | $ | $ | N/A | N/A | $ | $ | ||||||||||||||||||||||||||||||||
| Cash surrender value | $ | $ | $ | $ | $ | $ | ||||||||||||||||||||||||||||||||
Products may contain both separate account and general account fund options; accordingly, net amount at risk and cash surrender value reported in the table above relate to the total account balance for each respective product grouping.
144
Brighthouse Financial, Inc.
Notes to the Consolidated Financial Statements (continued)
7. Deferred Policy Acquisition Costs, Value of Business Acquired and Other Intangibles
Deferred Policy Acquisition Costs and Value of Business Acquired
See Note 1 for a description of capitalized acquisition costs.
Information regarding DAC and VOBA was as follows:
| Variable Annuities | Fixed Rate Annuities | Index-linked Annuities | Term and Whole Life Insurance | Universal Life Insurance | ||||||||||||||||||||||||||||
| (In millions) | ||||||||||||||||||||||||||||||||
| DAC: | ||||||||||||||||||||||||||||||||
| Adjusted balance at January 1, 2021 (1) | $ | $ | $ | $ | $ | |||||||||||||||||||||||||||
| Capitalization | ( | |||||||||||||||||||||||||||||||
| Amortization | ( | ( | ( | ( | ( | |||||||||||||||||||||||||||
| Balance at December 31, 2021 | ||||||||||||||||||||||||||||||||
| Capitalization | ( | |||||||||||||||||||||||||||||||
| Amortization | ( | ( | ( | ( | ( | |||||||||||||||||||||||||||
| Balance at December 31, 2022 | ||||||||||||||||||||||||||||||||
| Capitalization | ||||||||||||||||||||||||||||||||
| Amortization | ( | ( | ( | ( | ( | |||||||||||||||||||||||||||
| Balance at December 31, 2023 | $ | $ | $ | $ | $ | |||||||||||||||||||||||||||
| VOBA: | ||||||||||||||||||||||||||||||||
| Adjusted balance at January 1, 2021 (1) | $ | $ | $ | $ | $ | |||||||||||||||||||||||||||
| Amortization | ( | ( | ( | ( | ||||||||||||||||||||||||||||
| Balance at December 31, 2021 | ||||||||||||||||||||||||||||||||
| Amortization | ( | ( | ( | ( | ||||||||||||||||||||||||||||
| Balance at December 31, 2022 | ||||||||||||||||||||||||||||||||
| Amortization | ( | ( | ( | ( | ||||||||||||||||||||||||||||
| Balance at December 31, 2023 | $ | $ | $ | $ | $ | |||||||||||||||||||||||||||
| Total DAC and VOBA: | ||||||||||||||||||||||||||||||||
| Balance at December 31, 2023 | $ | $ | $ | $ | $ | |||||||||||||||||||||||||||
| Balance at December 31, 2022 | $ | $ | $ | $ | $ | |||||||||||||||||||||||||||
| Balance at December 31, 2021 | $ | $ | $ | $ | $ | |||||||||||||||||||||||||||
_______________
(1)Includes an adjustment to eliminate balances included in AOCI related to the adoption of ASU 2018-12 (see Note 2).
Deferred Sales Inducements
Information regarding DSI, included in other assets, was as follows:
| December 31, | ||||||||||||||||||||||||||||||||||||||
| 2023 | 2022 | 2021 | ||||||||||||||||||||||||||||||||||||
| Variable Annuities | Fixed Rate Annuities | Variable Annuities | Fixed Rate Annuities | Variable Annuities | Fixed Rate Annuities | |||||||||||||||||||||||||||||||||
| (In millions) | ||||||||||||||||||||||||||||||||||||||
| Balance, beginning of year | $ | $ | $ | $ | $ | $ | ||||||||||||||||||||||||||||||||
| Capitalization | ||||||||||||||||||||||||||||||||||||||
| Amortization | ( | ( | ( | ( | ( | ( | ||||||||||||||||||||||||||||||||
| Balance, end of year | $ | $ | $ | $ | $ | $ | ||||||||||||||||||||||||||||||||
145
Brighthouse Financial, Inc.
Notes to the Consolidated Financial Statements (continued)
7. Deferred Policy Acquisition Costs, Value of Business Acquired and Deferred Sales Inducements (continued)
Unearned Revenue
Information regarding unearned revenue, included in other policy-related balances, was as follows:
| December 31, | ||||||||||||||||||||||||||||||||||||||||||||||||||||||||
| 2022 | 2021 | |||||||||||||||||||||||||||||||||||||||||||||||||||||||
| Universal Life Insurance | ULSG | Variable Annuities | Universal Life Insurance | ULSG | Variable Annuities | Universal Life Insurance | ULSG | Variable Annuities | ||||||||||||||||||||||||||||||||||||||||||||||||
| (In millions) | ||||||||||||||||||||||||||||||||||||||||||||||||||||||||
| Balance, beginning of year | $ | $ | $ | $ | $ | $ | $ | $ | $ | |||||||||||||||||||||||||||||||||||||||||||||||
| Capitalization | ||||||||||||||||||||||||||||||||||||||||||||||||||||||||
| Amortization | ( | ( | ( | ( | ( | ( | ( | ( | ( | |||||||||||||||||||||||||||||||||||||||||||||||
| Balance, end of year | $ | $ | $ | $ | $ | $ | $ | $ | $ | |||||||||||||||||||||||||||||||||||||||||||||||
8. Reinsurance
The Company enters into reinsurance agreements primarily as a purchaser of reinsurance for its various insurance products and also as a provider of reinsurance for some insurance products issued by former affiliated and unaffiliated companies. The Company participates in reinsurance activities in order to limit losses, minimize exposure to significant risks and provide additional capacity for future growth.
Accounting for reinsurance requires extensive use of assumptions and estimates, particularly related to the future performance of the underlying business and the potential impact of counterparty credit risks. The Company periodically reviews actual and anticipated experience compared to the aforementioned assumptions used to establish assets and liabilities relating to ceded and assumed reinsurance and evaluates the financial strength of counterparties to its reinsurance agreements using criteria similar to that evaluated in the security impairment process discussed in Note 9.
Annuities and Life
For annuities, the Company reinsures portions of the living and death benefit guarantees issued in connection with certain variable annuities to unaffiliated reinsurers. Under these reinsurance agreements, the Company pays a reinsurance premium generally based on fees associated with the guarantees collected from policyholders and receives reimbursement for benefits paid or accrued in excess of account values, subject to certain limitations. The value of MRBs on the ceded risk is determined using a methodology consistent with the guarantees directly written by the Company with the exception of the input for nonperformance risk that reflects the credit of the reinsurer. The Company cedes certain fixed rate annuities to unaffiliated third-party reinsurers and assumes certain index-linked annuities from an unaffiliated third-party insurer. These reinsurance arrangements are structured on a coinsurance basis and are reported as deposit accounting.
For its life products, the Company has historically reinsured the mortality risk primarily on an excess of retention basis or on a quota share basis. In addition to reinsuring mortality risk as described above, the Company reinsures other risks, as well as specific coverages. Placement of reinsurance is done primarily on an automatic basis and also on a facultative basis for risks with specified characteristics. On a case-by-case basis, the Company may retain up to $20 million per life and reinsure 100 % of amounts in excess of the amount the Company retains. The Company also reinsures 90 % of the risk associated with participating whole life policies to a former affiliate and assumes certain term life policies and universal life policies with secondary death benefit guarantees issued by a former affiliate. The Company evaluates its reinsurance programs routinely and may increase or decrease its retention at any time.
Corporate & Other
The Company reinsures, through 100 % quota share reinsurance agreements, certain run-off long-term care and workers’ compensation business written by the Company. At December 31, 2023, the Company had $5.8 billion of reinsurance recoverables associated with its reinsured long-term care business. The reinsurer has established trust accounts for the Company’s benefit to secure their obligations under the reinsurance agreements. Additionally, the Company is indemnified for losses and certain other payment obligations it might incur with respect to such reinsured long-term care insurance business.
146
Brighthouse Financial, Inc.
Notes to the Consolidated Financial Statements (continued)
8. Reinsurance (continued)
Catastrophe Coverage
Reinsurance Recoverables
The Company reinsures its business through a diversified group of primarily highly rated reinsurers. The Company analyzes recent trends in arbitration and litigation outcomes in disputes, if any, with its reinsurers and monitors ratings and the financial strength of its reinsurers. In addition, the reinsurance recoverable balance due from each reinsurer and the recoverability of such balance is evaluated as part of this overall monitoring process.
The Company generally secures large reinsurance recoverable balances with various forms of collateral, including secured trusts, funds withheld accounts and irrevocable letters of credit. These reinsurance recoverable balances are stated net of allowances for uncollectible reinsurance, which at both December 31, 2023 and 2022 were not significant. The Company had $6.1 billion and $6.2 billion of unsecured reinsurance recoverable balances with third-party reinsurers at December 31, 2023 and 2022, respectively.
The Company records an allowance for credit losses which is a valuation account that reduces reinsurance recoverable balances to present the net amount expected to be collected from reinsurers. When assessing the creditworthiness of the Company’s reinsurance recoverable balances, beyond the analysis of individual claims disputes, the Company considers the financial strength of its reinsurers using public ratings and ratings reports, current existing credit enhancements to reinsurance agreements and the statutory and GAAP financial statements of the reinsurers. Impairments are then determined based on probable and estimable defaults. The Company had an allowance for credit losses of $3 million and $10 million on its reinsurance recoverable balances at December 31, 2023 and 2022, respectively. In 2023, the Company had $3 million of additions to the allowance and $10 million of impairments charged against the allowance.
At December 31, 2023, the Company had $18.9 billion of net ceded reinsurance recoverables with third-party reinsurers. Of this total, $16.8 billion, or 89 %, were with the Company’s five largest ceded reinsurers, including $4.3 billion of net ceded reinsurance recoverables which were unsecured. At December 31, 2022, the Company had $17.6 billion of net ceded reinsurance recoverables with third-party reinsurers. Of this total, $15.4 billion, or 88 %, were with the Company’s five largest ceded reinsurers, including $4.3 billion of net ceded reinsurance recoverables which were unsecured.
147
Brighthouse Financial, Inc.
Notes to the Consolidated Financial Statements (continued)
8. Reinsurance (continued)
The amounts on the consolidated statements of operations include the impact of reinsurance. Information regarding the significant effects of reinsurance was as follows:
| Years Ended December 31, | ||||||||||||||||||||
| 2023 | 2022 | 2021 | ||||||||||||||||||
| (In millions) | ||||||||||||||||||||
| Premiums | ||||||||||||||||||||
| Direct premiums | $ | $ | $ | |||||||||||||||||
| Reinsurance assumed | ( | |||||||||||||||||||
| Reinsurance ceded | ( | ( | ( | |||||||||||||||||
| Net premiums | $ | $ | $ | |||||||||||||||||
| Universal life and investment-type product policy fees | ||||||||||||||||||||
| Direct universal life and investment-type product policy fees | $ | $ | $ | |||||||||||||||||
| Reinsurance assumed | ||||||||||||||||||||
| Reinsurance ceded | ( | ( | ( | |||||||||||||||||
| Net universal life and investment-type product policy fees | $ | $ | $ | |||||||||||||||||
| Other revenues | ||||||||||||||||||||
| Direct other revenues | $ | $ | $ | |||||||||||||||||
Reinsurance assumed | ||||||||||||||||||||
Reinsurance ceded | ||||||||||||||||||||
| Net other revenues | $ | $ | $ | |||||||||||||||||
| Policyholder benefits and claims | ||||||||||||||||||||
| Direct policyholder benefits and claims | $ | $ | $ | |||||||||||||||||
| Reinsurance assumed | ||||||||||||||||||||
| Reinsurance ceded | ( | ( | ( | |||||||||||||||||
| Net policyholder benefits and claims | $ | $ | $ | |||||||||||||||||
| Change in market risk benefits | ||||||||||||||||||||
| Direct change in market risk benefits | $ | ( | $ | ( | $ | ( | ||||||||||||||
| Reinsurance assumed | ( | ( | ||||||||||||||||||
| Reinsurance ceded | ||||||||||||||||||||
| Net change in market risk benefits | $ | ( | $ | ( | $ | ( | ||||||||||||||
The amounts on the consolidated balance sheets include the impact of reinsurance. Information regarding the significant effects of reinsurance was as follows at:
| December 31, | |||||||||||||||||||||||||||||||||||||||||||||||
| 2023 | 2022 | ||||||||||||||||||||||||||||||||||||||||||||||
| Direct | Assumed | Ceded | Total Balance Sheet | Direct | Assumed | Ceded | Total Balance Sheet | ||||||||||||||||||||||||||||||||||||||||
| (In millions) | |||||||||||||||||||||||||||||||||||||||||||||||
| Assets | |||||||||||||||||||||||||||||||||||||||||||||||
| Premiums, reinsurance and other receivables (net of allowance for credit losses) | $ | $ | $ | $ | $ | $ | $ | $ | |||||||||||||||||||||||||||||||||||||||
| Market risk benefit assets | $ | $ | $ | $ | $ | $ | $ | $ | |||||||||||||||||||||||||||||||||||||||
| Liabilities | |||||||||||||||||||||||||||||||||||||||||||||||
| Future policy benefits | $ | $ | $ | $ | $ | $ | $ | $ | |||||||||||||||||||||||||||||||||||||||
| Policyholder account balances | $ | $ | $ | $ | $ | $ | $ | $ | |||||||||||||||||||||||||||||||||||||||
| Market risk benefit liabilities | $ | $ | $ | $ | $ | $ | $ | $ | |||||||||||||||||||||||||||||||||||||||
| Other policy-related balances | $ | $ | $ | $ | $ | $ | $ | $ | |||||||||||||||||||||||||||||||||||||||
| Other liabilities | $ | $ | $ | $ | $ | $ | $ | $ | |||||||||||||||||||||||||||||||||||||||
148
Brighthouse Financial, Inc.
Notes to the Consolidated Financial Statements (continued)
8. Reinsurance (continued)
Reinsurance agreements that do not expose the Company to a reasonable possibility of a significant loss from insurance risk are recorded using the deposit method of accounting. The deposit assets on reinsurance were $7.5 billion and $6.0 billion at December 31, 2023 and 2022, respectively. The deposit liabilities on reinsurance were $3.9 billion and $3.8 billion at December 31, 2023 and 2022, respectively.
9. Investments
See Notes 1 and 11 for a description of the Company’s accounting policies for investments and the fair value hierarchy for investments and the related valuation methodologies.
Fixed Maturity Securities Available-for-sale
Fixed Maturity Securities by Sector
Fixed maturity securities by sector were as follows at:
| December 31, 2023 | December 31, 2022 | ||||||||||||||||||||||||||||||||||||||||||||||||||||||||||
| Amortized Cost | Allowance for Credit Losses | Gross Unrealized | Estimated Fair Value | Amortized Cost | Allowance for Credit Losses | Gross Unrealized | Estimated Fair Value | ||||||||||||||||||||||||||||||||||||||||||||||||||||
| Gains | Losses | Gains | Losses | ||||||||||||||||||||||||||||||||||||||||||||||||||||||||
| (In millions) | |||||||||||||||||||||||||||||||||||||||||||||||||||||||||||
| U.S. corporate | $ | $ | $ | $ | $ | $ | $ | $ | $ | $ | |||||||||||||||||||||||||||||||||||||||||||||||||
| Foreign corporate | |||||||||||||||||||||||||||||||||||||||||||||||||||||||||||
| U.S. government and agency | |||||||||||||||||||||||||||||||||||||||||||||||||||||||||||
| RMBS | |||||||||||||||||||||||||||||||||||||||||||||||||||||||||||
| CMBS | |||||||||||||||||||||||||||||||||||||||||||||||||||||||||||
| ABS | |||||||||||||||||||||||||||||||||||||||||||||||||||||||||||
| State and political subdivision | |||||||||||||||||||||||||||||||||||||||||||||||||||||||||||
| Foreign government | |||||||||||||||||||||||||||||||||||||||||||||||||||||||||||
| Total fixed maturity securities | $ | $ | $ | $ | $ | $ | $ | $ | $ | $ | |||||||||||||||||||||||||||||||||||||||||||||||||
The Company held non-income producing fixed maturity securities with an estimated fair value of $52 million at December 31, 2023. The Company did not hold non-income producing fixed maturity securities at December 31, 2022.
Maturities of Fixed Maturity Securities
The amortized cost and estimated fair value of fixed maturity securities, by contractual maturity date, were as follows at December 31, 2023:
| Due in One Year or Less | Due After One Year Through Five Years | Due After Five Years Through Ten Years | Due After Ten Years | Structured Securities | Total Fixed Maturity Securities | ||||||||||||||||||||||||||||||
| (In millions) | |||||||||||||||||||||||||||||||||||
| Amortized cost | $ | $ | $ | $ | $ | $ | |||||||||||||||||||||||||||||
| Estimated fair value | $ | $ | $ | $ | $ | $ | |||||||||||||||||||||||||||||
Actual maturities may differ from contractual maturities due to the exercise of call or prepayment options. Fixed maturity securities not due at a single maturity date have been presented in the year of final contractual maturity. Structured Securities are shown separately, as they are not due at a single maturity.
149
Brighthouse Financial, Inc.
Notes to the Consolidated Financial Statements (continued)
9. Investments (continued)
Continuous Gross Unrealized Losses for Fixed Maturity Securities by Sector
The estimated fair value and gross unrealized losses of fixed maturity securities in an unrealized loss position, by sector and by length of time that the securities have been in a continuous unrealized loss position, were as follows at:
| December 31, 2023 | December 31, 2022 | ||||||||||||||||||||||||||||||||||||||||||||||
| Less than 12 Months | 12 Months or Greater | Less than 12 Months | 12 Months or Greater | ||||||||||||||||||||||||||||||||||||||||||||
| Estimated Fair Value | Gross Unrealized Losses | Estimated Fair Value | Gross Unrealized Losses | Estimated Fair Value | Gross Unrealized Losses | Estimated Fair Value | Gross Unrealized Losses | ||||||||||||||||||||||||||||||||||||||||
| (Dollars in millions) | |||||||||||||||||||||||||||||||||||||||||||||||
| U.S. corporate | $ | $ | $ | $ | $ | $ | $ | $ | |||||||||||||||||||||||||||||||||||||||
| Foreign corporate | |||||||||||||||||||||||||||||||||||||||||||||||
| U.S. government and agency | |||||||||||||||||||||||||||||||||||||||||||||||
| RMBS | |||||||||||||||||||||||||||||||||||||||||||||||
| CMBS | |||||||||||||||||||||||||||||||||||||||||||||||
| ABS | |||||||||||||||||||||||||||||||||||||||||||||||
| State and political subdivision | |||||||||||||||||||||||||||||||||||||||||||||||
| Foreign government | |||||||||||||||||||||||||||||||||||||||||||||||
| Total fixed maturity securities | $ | $ | $ | $ | $ | $ | $ | $ | |||||||||||||||||||||||||||||||||||||||
| Total number of securities in an unrealized loss position | |||||||||||||||||||||||||||||||||||||||||||||||
Allowance for Credit Losses for Fixed Maturity Securities
Evaluation and Measurement Methodologies
For fixed maturity securities in an unrealized loss position, management first assesses whether the Company intends to sell, or whether it is more likely than not it will be required to sell the security before recovery of its amortized cost basis. If either of the criteria regarding intent or requirement to sell is met, the security’s amortized cost basis is written down to estimated fair value through net investment gains (losses). For fixed maturity securities that do not meet the aforementioned criteria, management evaluates whether the decline in estimated fair value has resulted from credit losses or other factors. Inherent in management’s evaluation of the security are assumptions and estimates about the operations of the issuer and its future earnings potential. Considerations used in the allowance for credit loss evaluation process include, but are not limited to: (i) the extent to which estimated fair value is less than amortized cost; (ii) any changes to the rating of the security by a rating agency; (iii) adverse conditions specifically related to the security, industry or geographic area; and (iv) payment structure of the fixed maturity security and the likelihood of the issuer being able to make payments in the future or the issuer’s failure to make scheduled interest and principal payments. If this assessment indicates that a credit loss exists, the present value of cash flows expected to be collected from the security are compared to the amortized cost basis of the security. If the present value of cash flows expected to be collected is less than the amortized cost basis, a credit loss is deemed to exist and an allowance for credit losses is recorded, limited by the amount that the estimated fair value is less than the amortized cost basis, with a corresponding charge to net investment gains (losses). Any unrealized losses that have not been recorded through an allowance for credit losses are recognized in OCI.
Once a security specific allowance for credit losses is established, the present value of cash flows expected to be collected from the security continues to be reassessed. Any changes in the security specific allowance for credit losses are recorded as a provision for (or reversal of) credit loss expense in net investment gains (losses).
Fixed maturity securities are also evaluated to determine whether any amounts have become uncollectible. When all, or a portion, of a security is deemed uncollectible, the uncollectible portion is written-off with an adjustment to amortized cost and a corresponding reduction to the allowance for credit losses.
150
Brighthouse Financial, Inc.
Notes to the Consolidated Financial Statements (continued)
9. Investments (continued)
Fixed maturity securities are also evaluated to determine if they qualify as purchased financial assets with credit deterioration (“PCD”). To determine if the credit deterioration experienced since origination is more than insignificant, both (i) the extent of the credit deterioration and (ii) any rating agency downgrades are evaluated. For securities categorized as PCD assets, the present value of cash flows expected to be collected from the security are compared to the par value of the security. If the present value of cash flows expected to be collected is less than the par value, credit losses are embedded in the purchase price of the PCD asset. In this situation, both an allowance for credit losses and amortized cost gross-up is recorded, limited by the amount that the estimated fair value is less than the grossed-up amortized cost basis. Any difference between the purchase price and the present value of cash flows is amortized or accreted into net investment income over the life of the PCD asset. Any subsequent PCD asset allowance for credit losses is evaluated in a manner similar to the process described above for fixed maturity securities.
Current Period Evaluation
Rollforward of the Allowance for Credit Losses for Fixed Maturity Securities by Sector
The changes in the allowance for credit losses by sector were as follows:
| U.S. Corporate | RMBS | CMBS | Foreign Corporate | Total | ||||||||||||||||||||||||||||
| (In millions) | ||||||||||||||||||||||||||||||||
| Balance at December 31, 2021 | $ | $ | $ | $ | $ | |||||||||||||||||||||||||||
| Allowance on securities where credit losses were not previously recorded | ||||||||||||||||||||||||||||||||
| Reductions for securities sold | ( | ( | ||||||||||||||||||||||||||||||
| Change in allowance on securities with an allowance recorded in a previous period | ||||||||||||||||||||||||||||||||
| Write-offs charged against allowance (1) | ( | ( | ||||||||||||||||||||||||||||||
Balance at December 31, 2022 | ||||||||||||||||||||||||||||||||
| Allowance on securities where credit losses were not previously recorded | ||||||||||||||||||||||||||||||||
| Reductions for securities sold | ( | ( | ( | |||||||||||||||||||||||||||||
| Change in allowance on securities with an allowance recorded in a previous period | ( | ( | ||||||||||||||||||||||||||||||
| Write-offs charged against allowance (1) | ( | ( | ||||||||||||||||||||||||||||||
Balance at December 31, 2023 | $ | $ | $ | $ | $ | |||||||||||||||||||||||||||
_______________
(1)The Company recorded total write-offs of $8 million and $10 million for the years ended December 31, 2023 and 2022, respectively.
151
Brighthouse Financial, Inc.
Notes to the Consolidated Financial Statements (continued)
9. Investments (continued)
Mortgage Loans
Mortgage Loans by Portfolio Segment
Mortgage loans are summarized as follows at:
| December 31, | ||||||||||||||||||||||||||
| 2023 | 2022 | |||||||||||||||||||||||||
| Carrying Value | % of Total | Carrying Value | % of Total | |||||||||||||||||||||||
| (Dollars in millions) | ||||||||||||||||||||||||||
| Commercial | $ | % | $ | % | ||||||||||||||||||||||
| Agricultural | ||||||||||||||||||||||||||
| Residential | ||||||||||||||||||||||||||
| Total mortgage loans (1) | ||||||||||||||||||||||||||
| Allowance for credit losses | ( | ( | ( | ( | ||||||||||||||||||||||
| Total mortgage loans, net | $ | % | $ | % | ||||||||||||||||||||||
_______________
(1)Purchases of mortgage loans from third parties were $311 million and $2.2 billion for the years ended December 31, 2023 and 2022, respectively, and were primarily comprised of residential mortgage loans.
Allowance for Credit Losses for Mortgage Loans
Evaluation and Measurement Methodologies
The allowance for credit losses is a valuation account that is deducted from the mortgage loan’s amortized cost basis to present the net amount expected to be collected on the mortgage loan. The loan balance, or a portion of the loan balance, is written-off against the allowance when management believes this amount is uncollectible.
The allowance for credit losses is estimated using relevant available information, from internal and external sources, relating to past events, current conditions, and a reasonable and supportable forecast. Historical credit loss experience provides the basis for estimating expected credit losses. Adjustments to historical loss information are made for differences in current loan-specific risk characteristics and environmental conditions. A reasonable and supportable forecast period of two-years is used with an input reversion period of one-year.
Mortgage loans are evaluated in each of the three portfolio segments to determine the allowance for credit losses. The loan-level loss rates are determined using individual loan terms and characteristics, risk pools/internal ratings, national economic forecasts, prepayment speeds, and estimated default and loss severity. The resulting loss rates are applied to the mortgage loan’s amortized cost to generate an allowance for credit losses. In certain situations, the allowance for credit losses is measured as the difference between the loan’s amortized cost and liquidation value of the collateral. These situations include collateral dependent loans, modifications, foreclosure probable loans, and loans with dissimilar risk characteristics.
152
Brighthouse Financial, Inc.
Notes to the Consolidated Financial Statements (continued)
9. Investments (continued)
Mortgage loans are also evaluated to determine if they qualify as PCD assets. To determine if the credit deterioration experienced since origination is more than insignificant, the extent of credit deterioration is evaluated. All re-performing/modified loan (“RPL”) pools purchased after December 31, 2019 are determined to have been acquired with evidence of more than insignificant credit deterioration since origination and are classified as PCD assets. RPLs are pools of residential mortgage loans acquired at a discount or premium which have both credit and non-credit components. For PCD mortgage loans, the allowance for credit losses is determined using a similar methodology described above, except the loss-rate is determined at the pool level instead of the individual loan level. The initial allowance for credit losses, determined on a collective basis, is then allocated to the individual loans. The initial amortized cost of the loan is grossed-up to reflect the sum of the loan’s purchase price and allowance for credit losses. The difference between the grossed-up amortized cost basis and the par value of the loan is a non-credit discount or premium, which is accreted or amortized into net investment income over the remaining life of the loan. Any subsequent PCD mortgage loan allowance for credit losses is evaluated in a manner similar to the process described above for each of the three portfolio segments.
Rollforward of the Allowance for Credit Losses for Mortgage Loans by Portfolio Segment
The changes in the allowance for credit losses by portfolio segment were as follows:
| Commercial | Agricultural | Residential | Total | ||||||||||||||||||||
| (In millions) | |||||||||||||||||||||||
Balance at December 31, 2021 | $ | $ | $ | $ | |||||||||||||||||||
| Current period provision | |||||||||||||||||||||||
| Charge-offs, net of recoveries | ( | ( | |||||||||||||||||||||
Balance at December 31, 2022 | |||||||||||||||||||||||
| Current period provision | ( | ||||||||||||||||||||||
| Charge-offs, net of recoveries | ( | ( | ( | ||||||||||||||||||||
Balance at December 31, 2023 | $ | $ | $ | $ | |||||||||||||||||||
PCD Mortgage Loans
There were no new purchases of PCD mortgage loans during the year ended December 31, 2023. Purchases of PCD mortgage loans were $69 million at December 31, 2022.
153
Brighthouse Financial, Inc.
Notes to the Consolidated Financial Statements (continued)
9. Investments (continued)
Credit Quality of Mortgage Loans by Portfolio Segment
The amortized cost of mortgage loans by year of origination and credit quality indicator was as follows at:
| 2023 | 2022 | 2021 | 2020 | 2019 | Prior | Total | |||||||||||||||||||||||||||||||||||
| (In millions) | |||||||||||||||||||||||||||||||||||||||||
December 31, 2023 | |||||||||||||||||||||||||||||||||||||||||
| Commercial mortgage loans | |||||||||||||||||||||||||||||||||||||||||
| Loan-to-value ratios: | |||||||||||||||||||||||||||||||||||||||||
| Less than 65% | $ | $ | $ | $ | $ | $ | $ | ||||||||||||||||||||||||||||||||||
| 65% to 75% | |||||||||||||||||||||||||||||||||||||||||
| 76% to 80% | |||||||||||||||||||||||||||||||||||||||||
| Greater than 80% | |||||||||||||||||||||||||||||||||||||||||
| Total commercial mortgage loans | |||||||||||||||||||||||||||||||||||||||||
| Agricultural mortgage loans | |||||||||||||||||||||||||||||||||||||||||
| Loan-to-value ratios: | |||||||||||||||||||||||||||||||||||||||||
| Less than 65% | |||||||||||||||||||||||||||||||||||||||||
| 65% to 75% | |||||||||||||||||||||||||||||||||||||||||
| Greater than 80% | |||||||||||||||||||||||||||||||||||||||||
| Total agricultural mortgage loans | |||||||||||||||||||||||||||||||||||||||||
| Residential mortgage loans | |||||||||||||||||||||||||||||||||||||||||
| Performing | |||||||||||||||||||||||||||||||||||||||||
| Nonperforming | |||||||||||||||||||||||||||||||||||||||||
| Total residential mortgage loans | |||||||||||||||||||||||||||||||||||||||||
| Total | $ | $ | $ | $ | $ | $ | $ | ||||||||||||||||||||||||||||||||||
| 2022 | 2021 | 2020 | 2019 | 2017 | Prior | Total | |||||||||||||||||||||||||||||||||||
| (In millions) | |||||||||||||||||||||||||||||||||||||||||
| December 31, 2022 | |||||||||||||||||||||||||||||||||||||||||
| Commercial mortgage loans | |||||||||||||||||||||||||||||||||||||||||
| Loan-to-value ratios: | |||||||||||||||||||||||||||||||||||||||||
| Less than 65% | $ | $ | $ | $ | $ | $ | $ | ||||||||||||||||||||||||||||||||||
| 65% to 75% | |||||||||||||||||||||||||||||||||||||||||
| 76% to 80% | |||||||||||||||||||||||||||||||||||||||||
| Greater than 80% | |||||||||||||||||||||||||||||||||||||||||
| Total commercial mortgage loans | |||||||||||||||||||||||||||||||||||||||||
| Agricultural mortgage loans | |||||||||||||||||||||||||||||||||||||||||
| Loan-to-value ratios: | |||||||||||||||||||||||||||||||||||||||||
| Less than 65% | |||||||||||||||||||||||||||||||||||||||||
| 65% to 75% | |||||||||||||||||||||||||||||||||||||||||
| Greater than 80% | |||||||||||||||||||||||||||||||||||||||||
| Total agricultural mortgage loans | |||||||||||||||||||||||||||||||||||||||||
| Residential mortgage loans | |||||||||||||||||||||||||||||||||||||||||
| Performing | |||||||||||||||||||||||||||||||||||||||||
| Nonperforming | |||||||||||||||||||||||||||||||||||||||||
| Total residential mortgage loans | |||||||||||||||||||||||||||||||||||||||||
| Total | $ | $ | $ | $ | $ | $ | $ | ||||||||||||||||||||||||||||||||||
154
Brighthouse Financial, Inc.
Notes to the Consolidated Financial Statements (continued)
9. Investments (continued)
The loan-to-value ratio is a measure commonly used to assess the quality of commercial and agricultural mortgage loans. The loan-to-value ratio compares the amount of the loan to the estimated fair value of the underlying property collateralizing the loan and is commonly expressed as a percentage. A loan-to-value ratio less than 100% indicates an excess of collateral value over the loan amount. Loan-to-value ratios greater than 100% indicate that the loan amount exceeds the collateral value. Performing status is a measure commonly used to assess the quality of residential mortgage loans. A loan is considered performing when the borrower makes consistent and timely payments.
The amortized cost of commercial mortgage loans by debt-service coverage ratio was as follows at:
| December 31, | |||||||||||||||||||||||
| 2023 | 2022 | ||||||||||||||||||||||
| Amortized Cost | % of Total | Amortized Cost | % of Total | ||||||||||||||||||||
| (Dollars in millions) | |||||||||||||||||||||||
| Debt-service coverage ratios: | |||||||||||||||||||||||
| Greater than 1.20x | $ | % | $ | % | |||||||||||||||||||
| 1.00x - 1.20x | |||||||||||||||||||||||
| Less than 1.00x | |||||||||||||||||||||||
| Total | $ | % | $ | % | |||||||||||||||||||
The debt-service coverage ratio compares a property’s net operating income to its debt-service payments. Debt-service coverage ratios less than 1.00 times indicate that property operations do not generate enough income to cover the loan’s current debt payments. A debt-service coverage ratio greater than 1.00 times indicates an excess of net operating income over the debt-service payments.
Past Due Mortgage Loans by Portfolio Segment
The Company has a high-quality, well-performing mortgage loan portfolio, with over 99 Delinquency is defined consistent with industry practice, when mortgage loans are past due as follows: commercial and residential mortgage loans — 60 days and agricultural mortgage loans — 90 days.
The aging of the amortized cost of past due mortgage loans by portfolio segment was as follows at:
| December 31, | |||||||||||||||||||||||||||||||||||||||||||||||
| 2022 | |||||||||||||||||||||||||||||||||||||||||||||||
| Commercial | Agricultural | Residential | Total | Commercial | Agricultural | Residential | Total | ||||||||||||||||||||||||||||||||||||||||
| (In millions) | |||||||||||||||||||||||||||||||||||||||||||||||
| Current | $ | $ | $ | $ | $ | $ | $ | $ | |||||||||||||||||||||||||||||||||||||||
| 30-59 days past due | |||||||||||||||||||||||||||||||||||||||||||||||
| 60-89 days past due | |||||||||||||||||||||||||||||||||||||||||||||||
| 90-179 days past due | |||||||||||||||||||||||||||||||||||||||||||||||
| 180+ days past due | |||||||||||||||||||||||||||||||||||||||||||||||
| Total | $ | $ | $ | $ | $ | $ | $ | $ | |||||||||||||||||||||||||||||||||||||||
Mortgage Loans in Nonaccrual Status by Portfolio Segment
Mortgage loans are placed in a nonaccrual status if there are concerns regarding collectability of future payments or the loan is past due, unless the past due loan is well collateralized.
155
Brighthouse Financial, Inc.
Notes to the Consolidated Financial Statements (continued)
9. Investments (continued)
The amortized cost of mortgage loans in a nonaccrual status by portfolio segment was as follows at:
| Commercial | Agricultural | Residential (1) | Total | ||||||||||||||||||||
| (In millions) | |||||||||||||||||||||||
December 31, 2023 | $ | $ | $ | $ | |||||||||||||||||||
December 31, 2022 | $ | $ | $ | $ | |||||||||||||||||||
_______________
(1)The Company had no mortgage loans in nonaccrual status for which there was no related allowance for credit losses at both December 31, 2023 and 2022.
Modified Mortgage Loans by Portfolio Segment
Under certain circumstances, modifications are granted to nonperforming mortgage loans. Generally, the types of concessions may include interest rate reduction, term extension, principal forgiveness, or a combination of all three. The Company did not
Other Invested Assets
Over 80 % of other invested assets is comprised of freestanding derivatives with positive estimated fair values. See Note 10 for information about freestanding derivatives with positive estimated fair values. Other invested assets also includes the Company’s investment in company-owned life insurance, FHLB stock, tax credit and renewable energy partnerships and leveraged leases.
Leveraged Leases
The carrying value of leveraged leases was $47 million and $48 million at December 31, 2023 and 2022, respectively. The allowance for credit losses was $13 nine years . For rental receivables, the primary credit quality indicator is whether the rental receivable is performing or nonperforming, which is assessed monthly. Nonperforming rental receivables are generally defined as those that are 90 days or more past due. At both December 31, 2023 and 2022, all leveraged leases were performing.
Net Unrealized Investment Gains (Losses)
Unrealized investment gains (losses) on fixed maturity securities and the effect on future policy benefits, that would result from the realization of the unrealized gains (losses), are included in net unrealized investment gains (losses) in AOCI.
The components of net unrealized investment gains (losses), included in AOCI, were as follows:
| Years Ended December 31, | ||||||||||||||||||||
| 2023 | 2022 | 2021 | ||||||||||||||||||
| (In millions) | ||||||||||||||||||||
| Fixed maturity securities | $ | ( | $ | ( | $ | |||||||||||||||
| Derivatives | ||||||||||||||||||||
| Other | ( | |||||||||||||||||||
| Subtotal | ( | ( | ||||||||||||||||||
| Amounts allocated from: | ||||||||||||||||||||
| Future policy benefits | ( | |||||||||||||||||||
| Deferred income tax benefit (expense) | ( | |||||||||||||||||||
| Net unrealized investment gains (losses) | $ | ( | $ | ( | $ | |||||||||||||||
156
Brighthouse Financial, Inc.
Notes to the Consolidated Financial Statements (continued)
9. Investments (continued)
The changes in net unrealized investment gains (losses) were as follows:
| Years Ended December 31, | ||||||||||||||||||||
| 2023 | 2022 | 2021 | ||||||||||||||||||
| (In millions) | ||||||||||||||||||||
Balance at December 31, | $ | ( | $ | $ | ||||||||||||||||
| Unrealized investment gains (losses) change due to cumulative effect, net of income tax | ||||||||||||||||||||
| Balance at January 1, | $ | ( | $ | $ | ||||||||||||||||
| Unrealized investment gains (losses) during the year | ( | ( | ||||||||||||||||||
| Unrealized investment gains (losses) relating to: | ||||||||||||||||||||
| Future policy benefits | ( | |||||||||||||||||||
| Deferred income tax benefit (expense) | ( | |||||||||||||||||||
| Balance at December 31, | $ | ( | $ | ( | $ | |||||||||||||||
| Change in net unrealized investment gains (losses) | $ | $ | ( | $ | ( | |||||||||||||||
Concentrations of Credit Risk
There were no investments in any counterparty that were greater than 10% of the Company’s equity, other than the U.S. government and its agencies, at both December 31, 2023 and 2022.
Securities Lending
Elements of the securities lending program are presented below at:
| December 31, | |||||||||||
| 2023 | 2022 | ||||||||||
| (In millions) | |||||||||||
| Securities on loan: (1) | |||||||||||
| Amortized cost | $ | $ | |||||||||
| Estimated fair value | $ | $ | |||||||||
| Cash collateral received from counterparties (2) | $ | $ | |||||||||
| Reinvestment portfolio — estimated fair value | $ | $ | |||||||||
_______________
(1)Included in fixed maturity securities.
(2)Included in payables for collateral under securities loaned and other transactions.
The cash collateral liability by loaned security type and remaining tenor of the agreements were as follows at:
| December 31, 2023 | December 31, 2022 | ||||||||||||||||||||||||||||||||||||||||||||||
| Open (1) | 1 Month or Less | 1 to 6 Months | Total | Open (1) | 1 Month or Less | 1 to 6 Months | Total | ||||||||||||||||||||||||||||||||||||||||
| (In millions) | |||||||||||||||||||||||||||||||||||||||||||||||
| U.S. government and agency | $ | $ | $ | $ | $ | $ | $ | $ | |||||||||||||||||||||||||||||||||||||||
| U.S. corporate | |||||||||||||||||||||||||||||||||||||||||||||||
| Foreign corporate | |||||||||||||||||||||||||||||||||||||||||||||||
| Foreign government | |||||||||||||||||||||||||||||||||||||||||||||||
| Total | $ | $ | $ | $ | $ | $ | $ | $ | |||||||||||||||||||||||||||||||||||||||
_______________
(1)The related loaned security could be returned to the Company on the next business day which would require the Company to immediately return the cash collateral.
157
Brighthouse Financial, Inc.
Notes to the Consolidated Financial Statements (continued)
9. Investments (continued)
If the Company is required to return significant amounts of cash collateral on short notice and is forced to sell securities to meet the return obligation, it may have difficulty selling such collateral that is invested in securities in a timely manner, be forced to sell securities in a volatile or illiquid market for less than what otherwise would have been realized in normal market conditions, or both. The estimated fair value of the securities on loan related to the cash collateral on open at December 31, 2023 was $631 million, primarily comprised of U.S. government and agency securities which, if put back to the Company, could be immediately sold to satisfy the cash requirement.
The reinvestment portfolio acquired with the cash collateral consisted principally of fixed maturity securities (including agency RMBS, ABS, U.S. government and agency securities, U.S. and foreign corporate securities, non-agency RMBS and CMBS) with 56 % invested in agency RMBS, U.S. government and agency securities and cash and cash equivalents at December 31, 2023. If the securities on loan or the reinvestment portfolio become less liquid, the Company has the liquidity resources of most of its general account available to meet any potential cash demands when securities on loan are put back to the Company.
Invested Assets on Deposit, Held in Trust and Pledged as Collateral
Invested assets on deposit, held in trust and pledged as collateral at estimated fair value were as follows at:
| December 31, | |||||||||||
| 2023 | 2022 | ||||||||||
| (In millions) | |||||||||||
| Invested assets on deposit (regulatory deposits) (1) | $ | $ | |||||||||
| Invested assets held in trust (reinsurance agreements) (2) | |||||||||||
| Invested assets pledged as collateral (3) | |||||||||||
| Total invested assets on deposit, held in trust and pledged as collateral | $ | $ | |||||||||
_______________
(1)The Company has assets, primarily fixed maturity securities, on deposit with governmental authorities relating to certain policyholder liabilities, of which $102 million and $21 million of the assets on deposit represents restricted cash and cash equivalents at December 31, 2023 and 2022, respectively.
(2)The Company has assets, primarily fixed maturity securities, held in trust relating to certain reinsurance transactions, of which $120 million and $240 million of the assets held in trust balance represents restricted cash and cash equivalents at December 31, 2023 and 2022, respectively.
(3)The Company has pledged invested assets in connection with various agreements and transactions, including funding agreements (see Note 4) and derivative transactions (see Note 10).
See “— Securities Lending” for information regarding securities on loan. In addition, the Company’s investment in FHLB common stock, which is considered restricted until redeemed by the issuer, was $245 million and $201 million at redemption value at December 31, 2023 and 2022, respectively.
Collectively Significant Equity Method Investments
The Company holds investments in limited partnerships and LLCs consisting of leveraged buy-out funds, private equity funds, joint ventures and other funds. The portion of these investments accounted for under the equity method had a carrying value of $5.0 billion at December 31, 2023. The Company’s maximum exposure to loss related to these equity method investments is the carrying value of these investments plus unfunded commitments of $1.2 billion at December 31, 2023. The Company’s investments in limited partnerships and LLCs are generally of a passive nature in that the Company does not participate in the management of the entities.
As described in Note 1, the Company generally records its share of earnings in its equity method investments using a three-month lag methodology and within net investment income. Aggregate net investment income from these equity method investments exceeded 10% of the Company’s consolidated pre-tax income (loss) for each of the years ended December 31, 2023, 2022 and 2021. This aggregated summarized financial data does not represent the Company’s proportionate share of the assets, liabilities or earnings of such entities.
158
Brighthouse Financial, Inc.
Notes to the Consolidated Financial Statements (continued)
9. Investments (continued)
The aggregated summarized financial data presented below reflects the latest available financial information and is as of and for the years ended December 31, 2023, 2022 and 2021. Aggregate total assets of these entities totaled $799.2 billion and $880.1 billion at December 31, 2023 and 2022, respectively. Aggregate total liabilities of these entities totaled $56.8 billion and $109.3 billion at December 31, 2023 and 2022, respectively. Aggregate net income (loss) of these entities totaled $24.8 billion, ($12.8 ) billion and $22.6 billion for the years ended December 31, 2023, 2022 and 2021, respectively. Aggregate net income (loss) from the underlying entities in which the Company invests is primarily comprised of investment income, including recurring investment income and realized and unrealized investment gains (losses).
Variable Interest Entities
A variable interest entity (“VIE”) is a legal entity that does not have sufficient equity at risk to finance its activities or is structured such that equity investors lack the ability to make significant decisions relating to the entity’s operations through voting rights or do not substantively participate in the gains and losses of the entity.
The Company enters into various arrangements with VIEs in the normal course of business and has invested in legal entities that are VIEs. VIEs are consolidated when it is determined that the Company is the primary beneficiary. A primary beneficiary is the variable interest holder in a VIE with both (i) the power to direct the activities of the VIE that most significantly impact the economic performance of the VIE and (ii) the obligation to absorb losses or the right to receive benefits that could potentially be significant to the VIE. In addition, the evaluation of whether a legal entity is a VIE and if the Company is a primary beneficiary includes a review of the capital structure of the VIE, the related contractual relationships and terms, the nature of the operations and purpose of the VIE, the nature of the VIE interests issued and the Company’s involvement with the entity.
There were no material VIEs for which the Company has concluded that it is the primary beneficiary at either December 31, 2023 or 2022.
The carrying amount and maximum exposure to loss related to the VIEs for which the Company has concluded that it holds a variable interest, but is not the primary beneficiary, were as follows at:
| December 31, | |||||||||||||||||||||||
| 2023 | 2022 | ||||||||||||||||||||||
| Carrying Amount | Maximum Exposure to Loss | Carrying Amount | Maximum Exposure to Loss | ||||||||||||||||||||
| (In millions) | |||||||||||||||||||||||
| Fixed maturity securities | $ | $ | $ | $ | |||||||||||||||||||
| Limited partnerships and LLCs | |||||||||||||||||||||||
| Total | $ | $ | $ | $ | |||||||||||||||||||
159
Brighthouse Financial, Inc.
Notes to the Consolidated Financial Statements (continued)
9. Investments (continued)
The Company’s investments in unconsolidated VIEs are described below.
Fixed Maturity Securities
The Company invests in U.S. corporate bonds, foreign corporate bonds and Structured Securities issued by VIEs. The Company is not obligated to provide any financial or other support to these VIEs, other than the original investment. The Company’s involvement with these entities is limited to that of a passive investor. The Company has no unilateral right to appoint or remove the servicer, special servicer, or investment manager, which are generally viewed as having the power to direct the activities that most significantly impact the economic performance of the VIE, nor does the Company function in any of these roles. The Company does not have the obligation to absorb losses or the right to receive benefits from the entity that could potentially be significant to the entity; as a result, the Company has determined it is not the primary beneficiary, or consolidator, of the VIE. The Company’s maximum exposure to loss on these fixed maturity securities is limited to the amortized cost of these investments. See “— Fixed Maturity Securities Available-for-sale” for information on these securities.
Limited Partnerships and LLCs
The Company holds investments in certain limited partnerships and LLCs which are VIEs. These ventures include limited partnerships, LLCs, private equity funds, and, to a lesser extent, tax credit and renewable energy partnerships. The Company is not considered the primary beneficiary, or consolidator, when its involvement takes the form of a limited partner interest and is restricted to a role of a passive investor, as a limited partner’s interest does not provide the Company with any substantive kick-out or participating rights, nor does it provide the Company with the power to direct the activities of the fund. The Company’s maximum exposure to loss on these investments is limited to: (i) the amount invested in debt or equity of the VIE and (ii) commitments to the VIE, as described in Note 18.
Net Investment Income
The components of net investment income were as follows:
| Years Ended December 31, | |||||||||||||||||
| 2023 | 2022 | 2021 | |||||||||||||||
| (In millions) | |||||||||||||||||
| Investment income: | |||||||||||||||||
| Fixed maturity securities | $ | $ | $ | ||||||||||||||
| Equity securities | |||||||||||||||||
| Mortgage loans | |||||||||||||||||
| Policy loans | |||||||||||||||||
| Limited partnerships and LLCs (1) | |||||||||||||||||
| Cash, cash equivalents and short-term investments | |||||||||||||||||
| Other | |||||||||||||||||
| Total investment income | |||||||||||||||||
| Less: Investment expenses | |||||||||||||||||
| Net investment income | $ | $ | $ | ||||||||||||||
_______________
(1)Includes net investment income pertaining to other limited partnership interests of $187 million, $170 million and $1.3 billion for the years ended December 31, 2023, 2022 and 2021, respectively.
160
Brighthouse Financial, Inc.
Notes to the Consolidated Financial Statements (continued)
9. Investments (continued)
Net Investment Gains (Losses)
Components of Net Investment Gains (Losses)
The components of net investment gains (losses) were as follows:
| Years Ended December 31, | |||||||||||||||||
| 2023 | 2022 | 2021 | |||||||||||||||
| (In millions) | |||||||||||||||||
| Fixed maturity securities | $ | ( | $ | ( | $ | ( | |||||||||||
| Equity securities | ( | ||||||||||||||||
| Mortgage loans | ( | ( | ( | ||||||||||||||
| Limited partnerships and LLCs | ( | ( | |||||||||||||||
| Other | ( | ( | ( | ||||||||||||||
| Total net investment gains (losses) | $ | ( | $ | ( | $ | ( | |||||||||||
Gains (losses) from foreign currency transactions included within net investment gains (losses) were ($2 ) million, ($17 ) million and $1 million for the years ended December 31, 2023, 2022 and 2021, respectively.
Sales or Disposals of Fixed Maturity Securities
Investment gains and losses on sales of securities are determined on a specific identification basis. Proceeds from sales or disposals of fixed maturity securities and the components of fixed maturity securities net investment gains (losses) were as follows:
| Years Ended December 31, | |||||||||||||||||
| 2023 | 2022 | 2021 | |||||||||||||||
| (In millions) | |||||||||||||||||
| Proceeds | $ | $ | $ | ||||||||||||||
| Gross investment gains | $ | $ | $ | ||||||||||||||
| Gross investment losses | ( | ( | ( | ||||||||||||||
| Net investment gains (losses) | $ | ( | $ | ( | $ | ( | |||||||||||
161
Brighthouse Financial, Inc.
Notes to the Consolidated Financial Statements (continued)
10. Derivatives
Accounting for Derivatives
See Note 1 for a description of the Company’s accounting policies for derivatives and Note 11 for information about the fair value hierarchy for derivatives.
Derivative Strategies
The Company maintains an overall risk management strategy that incorporates the use of derivative instruments to minimize its exposure to various market risks, including interest rate, foreign currency exchange rate, credit and equity market.
Derivatives are financial instruments with values derived from interest rates, foreign currency exchange rates, credit spreads and/or other financial indices. Derivatives may be exchange-traded or contracted in the over-the-counter (“OTC”) market. Certain of the Company’s OTC derivatives are cleared and settled through central clearing counterparties (“OTC-cleared”), while others are bilateral contracts between two counterparties (“OTC-bilateral”).
Interest Rate Derivatives
Interest rate swaps: The Company uses interest rate swaps to manage the interest rate risks primarily in variable annuity products and ULSG. Interest rate swaps are used in non-qualifying hedging relationships.
Interest rate caps: The Company uses interest rate caps to protect its floating rate liabilities against rises in interest rates above a specified level, and against interest rate exposure arising from mismatches between assets and liabilities. Interest rate caps are used in non-qualifying hedging relationships.
Interest rate floors: The Company uses interest rate floors to protect against a decline in interest rates on floating rate assets in the Company’s institutional spread margin business. Interest rate floors are used in non-qualifying hedging relationships.
Interest rate swaptions: The Company uses interest rate swaptions to manage the interest rate risks primarily in variable annuity products and ULSG. Interest rate swaptions are used in non-qualifying hedging relationships. Interest rate swaptions are included in interest rate options.
Interest rate forwards: The Company uses interest rate forwards to manage the interest rate risks primarily in variable annuity products and ULSG. Interest rate forwards are used in cash flow and non-qualifying hedging relationships.
Foreign Currency Exchange Rate Derivatives
Foreign currency swaps: The Company uses foreign currency swaps to convert foreign currency denominated cash flows to U.S. dollars to reduce cash flow fluctuations due to changes in currency exchange rates. Foreign currency swaps are used in cash flow and non-qualifying hedging relationships.
Foreign currency forwards: The Company uses foreign currency forwards to hedge currency exposure on its invested assets. Foreign currency forwards are used in non-qualifying hedging relationships.
Credit Derivatives
Credit default swaps: The Company uses credit default swaps to create synthetic credit investments to replicate credit exposure that is more economically attractive than what is available in the market or otherwise unavailable (written credit protection), or to reduce credit loss exposure on certain assets that the Company owns (purchased credit protection). Credit default swaps are used in non-qualifying hedging relationships.
Credit default swaptions: The Company uses credit default swaptions to synthetically create investments that are either more expensive to acquire or otherwise unavailable in the cash markets. Swaptions are used to create callable bonds from replication synthetic asset transaction (“RSAT”) positions. This enhances the income of the RSAT program through earned premiums while not changing the credit profile of the RSATs. Credit default swaptions are used in non-qualifying hedging relationships.
162
Brighthouse Financial, Inc.
Notes to the Consolidated Financial Statements (continued)
10. Derivatives (continued)
Equity Market Derivatives
Equity index options: The Company uses equity index options primarily to hedge minimum guarantees embedded in certain variable annuity products against adverse changes in equity markets. Additionally, the Company uses equity index options to hedge index-linked annuity products and certain invested assets against adverse changes in equity markets. Certain of these contracts may also contain settlement provisions linked to interest rates (“hybrid options”). Equity index options are used in non-qualifying hedging relationships.
Equity total return swaps: The Company uses equity total return swaps to hedge minimum guarantees embedded in certain variable annuity products against adverse changes in equity markets. Additionally, the Company uses equity total return swaps to hedge index-linked annuity products against adverse changes in equity markets. Equity total return swaps are used in non-qualifying hedging relationships.
Equity variance swaps: The Company uses equity variance swaps to hedge minimum guarantees embedded in certain variable annuity products offered by the Company. Equity variance swaps are used in non-qualifying hedging relationships.
Primary Risks Managed by Derivatives
The primary underlying risk exposure, gross notional amount and estimated fair value of derivatives, excluding embedded derivatives, held were as follows at:
| December 31, | |||||||||||||||||||||||||||||||||||||||||
| 2023 | 2022 | ||||||||||||||||||||||||||||||||||||||||
| Primary Underlying Risk Exposure | Gross Notional Amount | Estimated Fair Value | Gross Notional Amount | Estimated Fair Value | |||||||||||||||||||||||||||||||||||||
| Assets | Liabilities | Assets | Liabilities | ||||||||||||||||||||||||||||||||||||||
| (In millions) | |||||||||||||||||||||||||||||||||||||||||
| Derivatives Designated as Hedging Instruments: | |||||||||||||||||||||||||||||||||||||||||
| Cash flow hedges: | |||||||||||||||||||||||||||||||||||||||||
| Interest rate forwards | Interest rate | $ | $ | $ | $ | $ | $ | ||||||||||||||||||||||||||||||||||
| Foreign currency swaps | Foreign currency exchange rate | ||||||||||||||||||||||||||||||||||||||||
| Total qualifying hedges | |||||||||||||||||||||||||||||||||||||||||
| Derivatives Not Designated or Not Qualifying as Hedging Instruments: | |||||||||||||||||||||||||||||||||||||||||
| Interest rate swaps | Interest rate | ||||||||||||||||||||||||||||||||||||||||
| Interest rate floors | Interest rate | ||||||||||||||||||||||||||||||||||||||||
| Interest rate caps | Interest rate | ||||||||||||||||||||||||||||||||||||||||
| Interest rate options | Interest rate | ||||||||||||||||||||||||||||||||||||||||
| Interest rate forwards | Interest rate | ||||||||||||||||||||||||||||||||||||||||
| Foreign currency swaps | Foreign currency exchange rate | ||||||||||||||||||||||||||||||||||||||||
| Foreign currency forwards | Foreign currency exchange rate | ||||||||||||||||||||||||||||||||||||||||
| Credit default swaps — written | Credit | ||||||||||||||||||||||||||||||||||||||||
| Credit default swaptions | Credit | ||||||||||||||||||||||||||||||||||||||||
| Equity index options | Equity market | ||||||||||||||||||||||||||||||||||||||||
| Equity total return swaps | Equity market | ||||||||||||||||||||||||||||||||||||||||
| Hybrid options | Equity market | ||||||||||||||||||||||||||||||||||||||||
| Total non-designated or non-qualifying derivatives | |||||||||||||||||||||||||||||||||||||||||
| Total | $ | $ | $ | $ | $ | $ | |||||||||||||||||||||||||||||||||||
163
Brighthouse Financial, Inc.
Notes to the Consolidated Financial Statements (continued)
10. Derivatives (continued)
The amount and location of gains (losses), including earned income, recognized for derivatives and gains (losses) pertaining to hedged items reported in net derivative gains (losses) were as follows:
| Year Ended December 31, 2023 | |||||||||||||||||||||||
| Net Derivative Gains (Losses) Recognized for Derivatives | Net Derivative Gains (Losses) Recognized for Hedged Items | Net Investment Income | Amount of Gains (Losses) Deferred in AOCI | ||||||||||||||||||||
| (In millions) | |||||||||||||||||||||||
| Derivatives Designated as Hedging Instruments: | |||||||||||||||||||||||
| Cash flow hedges: | |||||||||||||||||||||||
| Interest rate | $ | $ | $ | $ | ( | ||||||||||||||||||
| Foreign currency exchange rate | ( | ( | |||||||||||||||||||||
| Total cash flow hedges | ( | ( | |||||||||||||||||||||
| Derivatives Not Designated or Not Qualifying as Hedging Instruments: | |||||||||||||||||||||||
| Interest rate | ( | ||||||||||||||||||||||
| Foreign currency exchange rate | ( | ( | |||||||||||||||||||||
| Credit | |||||||||||||||||||||||
| Equity market | |||||||||||||||||||||||
| Embedded | ( | ||||||||||||||||||||||
| Total non-qualifying hedges | ( | ( | |||||||||||||||||||||
| Total | $ | ( | $ | ( | $ | $ | ( | ||||||||||||||||
| Year Ended December 31, 2022 | |||||||||||||||||||||||
| Net Derivative Gains (Losses) Recognized for Derivatives | Net Derivative Gains (Losses) Recognized for Hedged Items | Net Investment Income | Amount of Gains (Losses) Deferred in AOCI | ||||||||||||||||||||
| (In millions) | |||||||||||||||||||||||
| Derivatives Designated as Hedging Instruments: | |||||||||||||||||||||||
| Cash flow hedges: | |||||||||||||||||||||||
| Interest rate | $ | $ | $ | $ | ( | ||||||||||||||||||
| Foreign currency exchange rate | ( | ||||||||||||||||||||||
| Total cash flow hedges | ( | ||||||||||||||||||||||
| Derivatives Not Designated or Not Qualifying as Hedging Instruments: | |||||||||||||||||||||||
| Interest rate | ( | ||||||||||||||||||||||
| Foreign currency exchange rate | ( | ||||||||||||||||||||||
| Credit | ( | ||||||||||||||||||||||
| Equity market | |||||||||||||||||||||||
| Embedded | |||||||||||||||||||||||
| Total non-qualifying hedges | ( | ( | |||||||||||||||||||||
| Total | $ | ( | $ | ( | $ | $ | |||||||||||||||||
164
Brighthouse Financial, Inc.
Notes to the Consolidated Financial Statements (continued)
10. Derivatives (continued)
| Year Ended December 31, 2021 | |||||||||||||||||||||||
| Net Derivative Gains (Losses) Recognized for Derivatives | Net Derivative Gains (Losses) Recognized for Hedged Items | Net Investment Income | Amount of Gains (Losses) Deferred in AOCI | ||||||||||||||||||||
| (In millions) | |||||||||||||||||||||||
| Derivatives Designated as Hedging Instruments: | |||||||||||||||||||||||
| Cash flow hedges: | |||||||||||||||||||||||
| Interest rate | $ | $ | $ | $ | ( | ||||||||||||||||||
| Foreign currency exchange rate | ( | ||||||||||||||||||||||
| Total cash flow hedges | ( | ||||||||||||||||||||||
| Derivatives Not Designated or Not Qualifying as Hedging Instruments: | |||||||||||||||||||||||
| Interest rate | ( | ||||||||||||||||||||||
| Foreign currency exchange rate | ( | ||||||||||||||||||||||
| Credit | |||||||||||||||||||||||
| Equity market | ( | ||||||||||||||||||||||
| Embedded | ( | ||||||||||||||||||||||
| Total non-qualifying hedges | ( | ( | |||||||||||||||||||||
| Total | $ | ( | $ | ( | $ | $ | |||||||||||||||||
At December 31, 2023, the Company held no qualified derivatives hedging exposure to future cash flows for forecasted asset purchases. At December 31, 2022, the maximum length of time over which the Company was hedging its exposure to variability in future cash flows for forecasted transactions was less than one year .
At December 31, 2023 and 2022, the balance in AOCI associated with cash flow hedges was $351 million and $638 million, respectively.
Credit Derivatives
In connection with synthetically created credit investment transactions, the Company writes credit default swaps for which it receives a premium to insure credit risk. If a credit event occurs, as defined by the contract, the contract may be cash settled or it may be settled gross by the Company paying the counterparty the specified swap notional amount in exchange for the delivery of par quantities of the referenced credit obligation.
The estimated fair value, maximum amount of future payments and weighted average years to maturity of written credit default swaps were as follows at:
| December 31, | ||||||||||||||||||||||||||||||||||||||
| 2023 | 2022 | |||||||||||||||||||||||||||||||||||||
| Rating Agency Designation of Referenced Credit Obligations (1) | Estimated Fair Value of Credit Default Swaps | Maximum Amount of Future Payments under Credit Default Swaps | Weighted Average Years to Maturity (2) | Estimated Fair Value of Credit Default Swaps | Maximum Amount of Future Payments under Credit Default Swaps | Weighted Average Years to Maturity (2) | ||||||||||||||||||||||||||||||||
| (Dollars in millions) | ||||||||||||||||||||||||||||||||||||||
| Aaa/Aa/A | $ | $ | $ | $ | ||||||||||||||||||||||||||||||||||
| Baa | ||||||||||||||||||||||||||||||||||||||
| Ba | ||||||||||||||||||||||||||||||||||||||
| Caa and Lower | ( | |||||||||||||||||||||||||||||||||||||
| Total | $ | $ | $ | $ | ||||||||||||||||||||||||||||||||||
_______________
(1)The Company has written credit protection on both single name and index references. The rating agency designations are based on availability and the midpoint of the applicable ratings among Moody’s, S&P and Fitch. If no rating is available from a rating agency, then an internally developed rating is used.
165
Brighthouse Financial, Inc.
Notes to the Consolidated Financial Statements (continued)
10. Derivatives (continued)
(2)The weighted average years to maturity of the credit default swaps is calculated based on weighted average gross notional amounts.
Counterparty Credit Risk
The Company may be exposed to credit-related losses in the event of counterparty nonperformance on derivative instruments. Generally, the credit exposure is the fair value at the reporting date less any collateral received from the counterparty.
The Company manages its credit risk by: (i) entering into derivative transactions with creditworthy counterparties governed by master netting agreements; (ii) trading through regulated exchanges and central clearing counterparties; (iii) obtaining collateral, such as cash and securities, when appropriate; and (iv) setting limits on single party credit exposures which are subject to periodic management review.
See Note 11 for a description of the impact of credit risk on the valuation of derivatives.
The estimated fair values of net derivative assets and net derivative liabilities after the application of master netting agreements and collateral were as follows at:
| Gross Amounts Not Offset on the Consolidated Balance Sheets | ||||||||||||||||||||||||||||||||||||||
| Gross Amount Recognized | Financial Instruments (1) | Collateral Received/Pledged (2) | Net Amount | Securities Collateral Received/Pledged (3) | Net Amount After Securities Collateral | |||||||||||||||||||||||||||||||||
| (In millions) | ||||||||||||||||||||||||||||||||||||||
| December 31, 2023 | ||||||||||||||||||||||||||||||||||||||
| Derivative assets | $ | $ | ( | $ | ( | $ | $ | ( | $ | |||||||||||||||||||||||||||||
| Derivative liabilities | $ | $ | ( | $ | ( | $ | $ | ( | $ | |||||||||||||||||||||||||||||
| December 31, 2022 | ||||||||||||||||||||||||||||||||||||||
| Derivative assets | $ | $ | ( | $ | ( | $ | $ | ( | $ | |||||||||||||||||||||||||||||
| Derivative liabilities | $ | $ | ( | $ | ( | $ | $ | ( | $ | |||||||||||||||||||||||||||||
_______________
(1)Represents amounts subject to an enforceable master netting agreement or similar agreement.
(2)The amount of cash collateral offset in the table above is limited to the net estimated fair value of derivatives after application of netting agreement.
(3)Securities collateral received from counterparties is not reported on the consolidated balance sheets and may not be sold or re-pledged unless the counterparty is in default. Amounts do not include excess of collateral pledged or received.
The Company’s collateral arrangements generally require the counterparty in a net liability position, after considering the effect of netting agreements, to pledge collateral when the amount owed by that counterparty reaches a minimum transfer amount. Certain of these arrangements also include credit-contingent provisions which permit the party with positive fair value to terminate the derivative at the current fair value or demand immediate full collateralization from the party in a net liability position, in the event that the financial strength or credit rating of the party in a net liability position falls below a certain level.
166
Brighthouse Financial, Inc.
Notes to the Consolidated Financial Statements (continued)
10. Derivatives (continued)
The aggregate estimated fair values of derivatives in a net liability position containing such credit-contingent provisions and the aggregate estimated fair value of assets posted as collateral for such instruments were as follows at:
| December 31, | ||||||||||||||
| 2023 | 2022 | |||||||||||||
| (In millions) | ||||||||||||||
| Estimated fair value of derivatives in a net liability position (1) | $ | $ | ||||||||||||
Estimated fair value of collateral provided (2): | ||||||||||||||
| Fixed maturity securities | $ | $ | ||||||||||||
_______________
(1)After taking into consideration the existence of netting agreements.
(2)Substantially all of the Company’s collateral arrangements provide for daily posting of collateral for the full value of the derivative contract. As a result, if the credit-contingent provisions of derivative contracts in a net liability position were triggered, minimal additional assets would be required to be posted as collateral or needed to settle the instruments immediately. Additionally, the Company is required to pledge initial margin for certain new OTC-bilateral derivative transactions to third-party custodians.
11. Fair Value
When developing estimated fair values, the Company considers three broad valuation techniques: (i) the market approach, (ii) the income approach, and (iii) the cost approach. The Company determines the most appropriate valuation technique to use, given what is being measured and the availability of sufficient inputs, giving priority to observable inputs. The Company categorizes its assets and liabilities measured at estimated fair value into a three-level hierarchy, based on the significant input with the lowest level in its valuation. The input levels are as follows:
| Level 1 | Unadjusted quoted prices in active markets for identical assets or liabilities. The Company defines active markets based on average trading volume for equity securities. The size of the bid/ask spread is used as an indicator of market activity for fixed maturity securities. | ||||
| Level 2 | Quoted prices in markets that are not active or inputs that are observable either directly or indirectly. These inputs can include quoted prices for similar assets or liabilities other than quoted prices in Level 1, quoted prices in markets that are not active, or other significant inputs that are observable or can be derived principally from or corroborated by observable market data for substantially the full term of the assets or liabilities. | ||||
| Level 3 | Unobservable inputs that are supported by little or no market activity and are significant to the determination of estimated fair value of the assets or liabilities. Unobservable inputs reflect the reporting entity’s own assumptions about the assumptions that market participants would use in pricing the asset or liability. | ||||
167
Brighthouse Financial, Inc.
Notes to the Consolidated Financial Statements (continued)
11. Fair Value (continued)
Recurring Fair Value Measurements
The assets and liabilities measured at estimated fair value on a recurring basis and their corresponding placement in the fair value hierarchy are presented in the tables below. Investments that do not have a readily determinable fair value and are measured at net asset value (or equivalent) as a practical expedient to estimated fair value are excluded from the fair value hierarchy.
| December 31, 2023 | |||||||||||||||||||||||
| Fair Value Hierarchy | |||||||||||||||||||||||
| Level 1 | Level 2 | Level 3 | Total Estimated Fair Value | ||||||||||||||||||||
| (In millions) | |||||||||||||||||||||||
| Assets | |||||||||||||||||||||||
| Fixed maturity securities: | |||||||||||||||||||||||
| U.S. corporate | $ | $ | $ | $ | |||||||||||||||||||
| Foreign corporate | |||||||||||||||||||||||
| U.S. government and agency | |||||||||||||||||||||||
RMBS | |||||||||||||||||||||||
| CMBS | |||||||||||||||||||||||
ABS | |||||||||||||||||||||||
| State and political subdivision | |||||||||||||||||||||||
| Foreign government | |||||||||||||||||||||||
| Total fixed maturity securities | |||||||||||||||||||||||
| Equity securities | |||||||||||||||||||||||
| Short-term investments | |||||||||||||||||||||||
| Derivative assets: (1) | |||||||||||||||||||||||
| Interest rate | |||||||||||||||||||||||
| Foreign currency exchange rate | |||||||||||||||||||||||
| Credit | |||||||||||||||||||||||
| Equity market | |||||||||||||||||||||||
| Total derivative assets | |||||||||||||||||||||||
Market risk benefit assets | |||||||||||||||||||||||
| Separate account assets | |||||||||||||||||||||||
| Total assets | $ | $ | $ | $ | |||||||||||||||||||
| Liabilities | |||||||||||||||||||||||
| Market risk benefit liabilities | $ | $ | $ | $ | |||||||||||||||||||
| Derivative liabilities: (1) | |||||||||||||||||||||||
| Interest rate | |||||||||||||||||||||||
| Foreign currency exchange rate | |||||||||||||||||||||||
| Credit | |||||||||||||||||||||||
| Equity market | |||||||||||||||||||||||
| Total derivative liabilities | |||||||||||||||||||||||
Embedded derivatives on index-linked annuities (2) | |||||||||||||||||||||||
| Total liabilities | $ | $ | $ | $ | |||||||||||||||||||
168
Brighthouse Financial, Inc.
Notes to the Consolidated Financial Statements (continued)
11. Fair Value (continued)
| December 31, 2022 | |||||||||||||||||||||||
| Fair Value Hierarchy | |||||||||||||||||||||||
| Level 1 | Level 2 | Level 3 | Total Estimated Fair Value | ||||||||||||||||||||
| (In millions) | |||||||||||||||||||||||
| Assets | |||||||||||||||||||||||
| Fixed maturity securities: | |||||||||||||||||||||||
| U.S. corporate | $ | $ | $ | $ | |||||||||||||||||||
| Foreign corporate | |||||||||||||||||||||||
| U.S. government and agency | |||||||||||||||||||||||
| RMBS | |||||||||||||||||||||||
| CMBS | |||||||||||||||||||||||
| ABS | |||||||||||||||||||||||
| State and political subdivision | |||||||||||||||||||||||
| Foreign government | |||||||||||||||||||||||
| Total fixed maturity securities | |||||||||||||||||||||||
| Equity securities | |||||||||||||||||||||||
| Short-term investments | |||||||||||||||||||||||
| Derivative assets: (1) | |||||||||||||||||||||||
| Interest rate | |||||||||||||||||||||||
| Foreign currency exchange rate | |||||||||||||||||||||||
| Credit | |||||||||||||||||||||||
| Equity market | |||||||||||||||||||||||
| Total derivative assets | |||||||||||||||||||||||
Market risk benefit assets | |||||||||||||||||||||||
| Separate account assets | |||||||||||||||||||||||
| Total assets | $ | $ | $ | $ | |||||||||||||||||||
| Liabilities | |||||||||||||||||||||||
Market risk benefit liabilities | $ | $ | $ | $ | |||||||||||||||||||
| Derivative liabilities: (1) | |||||||||||||||||||||||
| Interest rate | |||||||||||||||||||||||
| Foreign currency exchange rate | |||||||||||||||||||||||
| Credit | |||||||||||||||||||||||
| Equity market | |||||||||||||||||||||||
| Total derivative liabilities | |||||||||||||||||||||||
Embedded derivatives on index-linked annuities (2) | |||||||||||||||||||||||
| Total liabilities | $ | $ | $ | $ | |||||||||||||||||||
_______________
(1)Derivative assets are reported in other invested assets and derivative liabilities are reported in other liabilities. The amounts are presented gross in the tables above to reflect the presentation on the consolidated balance sheets.
(2)Embedded derivative liabilities on index-linked annuities are reported in policyholder account balances.
Valuation Controls and Procedures
The Company monitors and provides oversight of valuation controls and policies for securities, mortgage loans and derivatives, which are primarily executed by its valuation service providers. The valuation methodologies used to determine fair values prioritize the use of observable market prices and market-based parameters and determines that judgmental valuation adjustments, when applied, are based upon established policies and are applied consistently over time. The valuation methodologies for securities, mortgage loans and derivatives are reviewed on an ongoing basis and revised when necessary. In addition, the Chief Accounting Officer periodically reports to the Audit Committee of Brighthouse Financial’s Board of Directors regarding compliance with fair value accounting standards.
169
Brighthouse Financial, Inc.
Notes to the Consolidated Financial Statements (continued)
11. Fair Value (continued)
The fair value of financial assets and financial liabilities is based on quoted market prices, where available. Prices received are assessed to determine if they represent a reasonable estimate of fair value. Several controls are performed, including certain monthly controls, which include, but are not limited to, analysis of portfolio returns to corresponding benchmark returns, comparing a sample of executed prices of securities sold to the fair value estimates, reviewing the bid/ask spreads to assess activity, comparing prices from multiple independent pricing services and ongoing due diligence to confirm that independent pricing services use market-based parameters. The process includes a determination of the observability of inputs used in estimated fair values received from independent pricing services or brokers by assessing whether these inputs can be corroborated by observable market data. Independent non-binding broker quotes, also referred to herein as “consensus pricing,” are used for a non-significant portion of the portfolio. Prices received from independent brokers are assessed to determine if they represent a reasonable estimate of fair value by considering such pricing relative to the current market dynamics and current pricing for similar financial instruments.
A formal process is also applied to challenge any prices received from independent pricing services that are not considered representative of estimated fair value. If prices received from independent pricing services are not considered reflective of market activity or representative of estimated fair value, independent non-binding broker quotations are obtained. If obtaining an independent non-binding broker quotation is unsuccessful, the last available price will be used.
Additional controls are performed, such as, balance sheet analytics to assess reasonableness of period-to-period pricing changes, including any price adjustments. Price adjustments are applied if prices or quotes received from independent pricing services or brokers are not considered reflective of market activity or representative of estimated fair value. The Company did not have significant price adjustments during the year ended December 31, 2023.
Determination of Fair Value
Fixed Maturity Securities
The fair values for actively traded marketable bonds, primarily U.S. government and agency securities, are determined using the quoted market prices and are classified as Level 1 assets. For fixed maturity securities classified as Level 2 assets, fair values are determined using either a market or income approach and are valued based on a variety of observable inputs as described below.
U.S. corporate and foreign corporate securities: Fair value is determined using third-party commercial pricing services, with the primary inputs being quoted prices in markets that are not active, benchmark yields, spreads off benchmark yields, new issuances, issuer rating, trades of identical or comparable securities, or duration. Privately-placed securities are valued using the additional key inputs: market yield curve, call provisions, observable prices and spreads for similar public or private securities that incorporate the credit quality and industry sector of the issuer, and delta spread adjustments to reflect specific credit-related issues.
U.S. government and agency, state and political subdivision and foreign government securities: Fair value is determined using third-party commercial pricing services, with the primary inputs being quoted prices in markets that are not active, benchmark U.S. Treasury yield or other yields, spread off the U.S. Treasury yield curve for the identical security, issuer ratings and issuer spreads, broker-dealer quotes, and comparable securities that are actively traded.
Structured Securities: Fair value is determined using third-party commercial pricing services, with the primary inputs being quoted prices in markets that are not active, spreads for actively traded securities, spreads off benchmark yields, expected prepayment speeds and volumes, current and forecasted loss severity, ratings, geographic region, weighted average coupon and weighted average maturity, average delinquency rates and debt-service coverage ratios. Other issuance-specific information is also used, including, but not limited to, collateral type, structure of the security, vintage of the loans, payment terms of the underlying asset, payment priority within tranche, and deal performance.
Equity Securities and Short-term Investments
The fair value for actively traded equity securities and short-term investments are determined using quoted market prices and are classified as Level 1 assets. For financial instruments classified as Level 2 assets, fair values are determined using a market approach and are valued based on a variety of observable inputs as described below.
Equity securities and short-term investments: Fair value is determined using third-party commercial pricing services, with the primary input being quoted prices in markets that are not active.
170
Brighthouse Financial, Inc.
Notes to the Consolidated Financial Statements (continued)
11. Fair Value (continued)
Derivatives
The fair values for exchange-traded derivatives are determined using the quoted market prices and are classified as Level 1 assets. For OTC-bilateral derivatives and OTC-cleared derivatives classified as Level 2 assets or liabilities, fair values are determined using the income approach. Valuations of non-option-based derivatives utilize present value techniques, whereas valuations of option-based derivatives utilize option pricing models which are based on market standard valuation methodologies and a variety of observable inputs.
The significant inputs to the pricing models for most OTC-bilateral and OTC-cleared derivatives are inputs that are observable in the market or can be derived principally from, or corroborated by, observable market data. Certain OTC-bilateral and OTC-cleared derivatives may rely on inputs that are significant to the estimated fair value that are not observable in the market or cannot be derived principally from, or corroborated by, observable market data. These unobservable inputs may involve significant management judgment or estimation. Even though unobservable, these inputs are based on assumptions deemed appropriate given the circumstances and management believes they are consistent with what other market participants would use when pricing such instruments.
Most inputs for OTC-bilateral and OTC-cleared derivatives are mid-market inputs but, in certain cases, liquidity adjustments are made when they are deemed more representative of exit value. Market liquidity, as well as the use of different methodologies, assumptions and inputs, may have a material effect on the estimated fair values of the Company’s derivatives and could materially affect net income.
The credit risk of both the counterparty and the Company are considered in determining the estimated fair value for all OTC-bilateral and OTC-cleared derivatives, and any potential credit adjustment is based on the net exposure by counterparty after taking into account the effects of netting agreements and collateral arrangements. The Company values its OTC-bilateral and OTC-cleared derivatives using standard swap curves which may include a spread to the risk-free rate, depending upon specific collateral arrangements. This credit spread is appropriate for those parties that execute trades at pricing levels consistent with similar collateral arrangements. As the Company and its significant derivative counterparties generally execute trades at such pricing levels and hold sufficient collateral, additional credit risk adjustments are not currently required in the valuation process. The Company’s ability to consistently execute at such pricing levels is in part due to the netting agreements and collateral arrangements that are in place with all of its significant derivative counterparties. An evaluation of the requirement to make additional credit risk adjustments is performed by the Company each reporting period.
Market Risk Benefits
MRBs principally include guaranteed minimum benefits on variable annuity contracts including benefits reinsured related to these guarantees.
The estimated fair value of variable annuity guarantees accounted for as MRBs is determined based on the present value of projected future benefits less the present value of projected future fees attributable to the guarantees. At policy inception, the Company determines an attributed fee ratio by solving for a percentage of projected future rider fees to be collected from the policyholder equal to the present value of projected future guaranteed benefits. To the extent the rider fees are insufficient, the Company may also include fees related to mortality and expense charges in the attributed fee ratio, provided the total fees included in the calculation do not exceed total contract fees and assessments collected from the contract holder. Any additional fees not included in the attributed fee ratio are considered revenue and reported in universal life and investment-type product policy fees. The attributed fee ratio is not updated in subsequent periods.
The Company updates the estimated fair value of variable annuity guarantees in subsequent periods by projecting future benefits using capital markets inputs and actuarial assumptions including expectations of policyholder behavior. A risk neutral valuation methodology is used to project the cash flows from the guarantees under multiple capital markets scenarios. The reported estimated fair value is then determined by taking the present value of these cash flows using a discount rate that incorporates a spread over the risk-free rate to reflect the Company’s nonperformance risk and adding a risk margin.
171
Brighthouse Financial, Inc.
Notes to the Consolidated Financial Statements (continued)
11. Fair Value (continued)
The valuation of MRBs includes an adjustment for the risk that the Company fails to satisfy its obligations, which is referred to as nonperformance risk. The nonperformance risk adjustment is captured as an additional spread applied to the risk-free rate in determining the rate to discount the cash flows of the liability. The spread over the risk-free rate is based on the Company’s creditworthiness taking into consideration publicly available information relating to spreads in the secondary market for Brighthouse Financial’s debt. These observable spreads are then adjusted, as necessary, to reflect the financial strength ratings of the issuing insurance subsidiaries as compared to the credit rating of Brighthouse Financial.
Risk margins are established to capture the non-capital markets risks of the instrument which represent the additional compensation a market participant would require to assume the risks related to the uncertainties in certain actuarial assumptions. The establishment of risk margins requires the use of significant actuarial judgment, including assumptions of the amount needed to cover the guarantees.
Actuarial assumptions are reviewed at least annually, and if they change significantly, the estimated fair value is adjusted through net income. Capital market inputs used in the measurement of variable annuity guarantees are updated quarterly through net income, except for the change attributable to the Company’s nonperformance risk, which is reported in OCI.
Embedded Derivatives
Embedded derivatives include crediting rates associated with index-linked annuity contracts. Embedded derivatives are recorded at estimated fair value with changes in estimated fair value reported in net income.
The crediting rates associated with these features are embedded derivatives which are measured at estimated fair value separately from the host fixed annuity contract. These embedded derivatives are classified within policyholder account balances on the consolidated balance sheets.
The estimated fair value of crediting rates associated with index-linked annuities is determined using a combination of an option pricing model and an option-budget approach. The valuation of these embedded derivatives also includes the establishment of a risk margin, as well as changes in nonperformance risk.
Actuarial assumptions including policyholder behavior and expectations for renewals at the end of the term period are reviewed at least annually, and if they change significantly, the estimated fair value is adjusted through net income. Capital market inputs used in the measurement of crediting rate embedded derivatives are updated quarterly through net income.
Transfers Into or Out of Level 3:
Assets and liabilities are transferred into Level 3 when a significant input cannot be corroborated with market observable data. This occurs when market activity decreases significantly and underlying inputs cannot be observed, current prices are not available, and/or when there are significant variances in quoted prices, thereby affecting transparency. Assets and liabilities are transferred out of Level 3 when circumstances change such that a significant input can be corroborated with market observable data. This may be due to a significant increase in market activity, a specific event, or one or more significant input(s) becoming observable.
172
Brighthouse Financial, Inc.
Notes to the Consolidated Financial Statements (continued)
11. Fair Value (continued)
Assets and Liabilities Measured at Fair Value Using Significant Unobservable Inputs (Level 3)
Certain quantitative information about the significant unobservable inputs used in the fair value measurement, and the sensitivity of the estimated fair value to changes in those inputs, for the more significant asset and liability classes measured at fair value on a recurring basis using significant unobservable inputs (Level 3) were as follows at:
| December 31, 2023 | December 31, 2022 | Impact of Increase in Input on Estimated Fair Value | |||||||||||||||||||||||||||||||||||||||||||||
| Valuation Techniques | Significant Unobservable Inputs | Range | Range | ||||||||||||||||||||||||||||||||||||||||||||
Market Risk Benefits | |||||||||||||||||||||||||||||||||||||||||||||||
| Variable annuity guaranteed minimum benefits | • | Option pricing techniques | • | Mortality rates | - | - | Decrease (1) | ||||||||||||||||||||||||||||||||||||||||
| • | Lapse rates | - | - | Decrease (2) | |||||||||||||||||||||||||||||||||||||||||||
| • | Utilization rates | - | - | Increase (3) | |||||||||||||||||||||||||||||||||||||||||||
| • | Withdrawal rates | - | - | (4) | |||||||||||||||||||||||||||||||||||||||||||
| • | Long-term equity volatilities | - | - | Increase (5) | |||||||||||||||||||||||||||||||||||||||||||
| • | Nonperformance risk spread | - | ( | - | Decrease (6) | ||||||||||||||||||||||||||||||||||||||||||
| Embedded Derivatives | |||||||||||||||||||||||||||||||||||||||||||||||
Index-linked annuity crediting rates | • | Option pricing techniques | • | Mortality rates | - | - | Decrease (1) | ||||||||||||||||||||||||||||||||||||||||
| • | Lapse rates | - | - | Decrease (2) | |||||||||||||||||||||||||||||||||||||||||||
| • | Withdrawal rates | - | - | (4) | |||||||||||||||||||||||||||||||||||||||||||
| • | Nonperformance risk spread | - | - | Decrease (6) | |||||||||||||||||||||||||||||||||||||||||||
_______________
(1)Mortality rates vary by age and by demographic characteristics such as gender. The range shown reflects the mortality rate for policyholders between 35 and 90 years old. Mortality rate assumptions are set based on company experience and include an assumption for mortality improvement.
(2)The lapse rate range reflects base lapse rates for major product categories for duration 1-20. Base lapse rates are adjusted at the contract level based on a comparison of the actuarially calculated guaranteed values and the current policyholder account value, as well as other factors, such as the applicability of any surrender charges. For variable annuity guarantees, a dynamic lapse function reduces the base lapse rate when the guaranteed amount is greater than the account value as in-the-money contracts are less likely to lapse. Lapse rates are also generally assumed to be lower in periods when a surrender charge applies.
(3)The utilization rate assumption for variable annuity guarantees estimates the percentage of contract holders with a GMIB or lifetime withdrawal benefit who will elect to utilize the benefit upon becoming eligible in a given year. The range shown represents the floor and cap of the GMIB dynamic election rates across varying levels of in-the-money. For lifetime withdrawal guarantee riders, the assumption is that everyone will begin withdrawals once account value reaches zero which is equivalent to a 100% utilization rate. Utilization rates may vary by the type of guarantee, the amount by which the guaranteed amount is greater than the account value, the contract’s withdrawal history and by the age of the policyholder.
(4)The withdrawal rate represents the percentage of account balance that any given policyholder will elect to withdraw from the contract each year. The withdrawal rate assumption varies by age and duration of the contract, and also by other factors such as benefit type. For any given contract, withdrawal rates vary throughout the period over which cash flows are projected for purposes of valuing the embedded derivative. For variable annuity GMWBs, any increase (decrease) in withdrawal rates results in an increase (decrease) in the estimated fair value of the guarantees. For variable annuity GMABs and GMIBs, any increase (decrease) in withdrawal rates results in a decrease (increase) in the estimated fair value.
(5)Long-term equity volatilities represent equity volatility beyond the period for which observable equity volatilities are available. For any given contract, long-term equity volatility rates vary throughout the period over which cash flows are projected for purposes of valuing MRBs.
(6)Nonperformance risk spread varies by duration. For any given contract, multiple nonperformance risk spreads will apply, depending on the duration of the cash flow being discounted for purposes of valuing the MRB or embedded derivative.
173
Brighthouse Financial, Inc.
Notes to the Consolidated Financial Statements (continued)
11. Fair Value (continued)
The Company does not develop unobservable inputs used in measuring fair value for all other assets and liabilities classified within Level 3; therefore, these are not included in the table above. The other Level 3 assets and liabilities primarily included fixed maturity securities and derivatives. For fixed maturity securities valued based on non-binding broker quotes, an increase (decrease) in credit spreads would result in a higher (lower) fair value. For derivatives valued based on third-party pricing models, an increase (decrease) in credit spreads would generally result in a higher (lower) fair value.
The changes in assets and (liabilities) measured at estimated fair value on a recurring basis using significant unobservable inputs (excluding MRBs disclosed in Note 5) were summarized as follows:
Fair Value Measurements Using Significant Unobservable Inputs (Level 3) | ||||||||||||||||||||||||||||||||||||||||||||
| Fixed Maturity Securities | ||||||||||||||||||||||||||||||||||||||||||||
| Corporate (1) | Structured Securities | Foreign Government | Equity Securities | Short-term Investments | Net Derivatives (2) | Embedded Derivatives on Index-Linked Annuities | ||||||||||||||||||||||||||||||||||||||
| (In millions) | ||||||||||||||||||||||||||||||||||||||||||||
Balance, January 1, 2022 | $ | $ | $ | $ | $ | $ | $ | ( | ||||||||||||||||||||||||||||||||||||
Total realized/unrealized gains (losses) included in net income (loss) (3) (4) | ( | ( | ||||||||||||||||||||||||||||||||||||||||||
Total realized/unrealized gains (losses) included in AOCI | ( | ( | ( | |||||||||||||||||||||||||||||||||||||||||
Purchases (5) | ||||||||||||||||||||||||||||||||||||||||||||
Sales (5) | ( | ( | ( | ( | ( | |||||||||||||||||||||||||||||||||||||||
Issuances (5) | ||||||||||||||||||||||||||||||||||||||||||||
Settlements (5) | ( | |||||||||||||||||||||||||||||||||||||||||||
Transfers into Level 3 (6) | ||||||||||||||||||||||||||||||||||||||||||||
Transfers out of Level 3 (6) | ( | ( | ( | |||||||||||||||||||||||||||||||||||||||||
Balance, December 31, 2022 | ( | |||||||||||||||||||||||||||||||||||||||||||
Total realized/unrealized gains (losses) included in net income (loss) (3) (4) | ( | ( | ( | ( | ||||||||||||||||||||||||||||||||||||||||
Total realized/unrealized gains (losses) included in AOCI | ( | |||||||||||||||||||||||||||||||||||||||||||
Purchases (5) | ||||||||||||||||||||||||||||||||||||||||||||
Sales (5) | ( | ( | ( | ( | ||||||||||||||||||||||||||||||||||||||||
Issuances (5) | ||||||||||||||||||||||||||||||||||||||||||||
Settlements (5) | ( | |||||||||||||||||||||||||||||||||||||||||||
Transfers into Level 3 (6) | ||||||||||||||||||||||||||||||||||||||||||||
Transfers out of Level 3 (6) | ( | ( | ( | ( | ||||||||||||||||||||||||||||||||||||||||
Balance, December 31, 2023 | $ | $ | $ | $ | $ | $ | $ | ( | ||||||||||||||||||||||||||||||||||||
Changes in unrealized gains (losses) included in net income (loss) for the instruments still held at December 31, 2021 (7) | $ | ( | $ | $ | $ | $ | $ | ( | $ | ( | ||||||||||||||||||||||||||||||||||
Changes in unrealized gains (losses) included in net income (loss) for the instruments still held at December 31, 2022 (7) | $ | $ | $ | $ | $ | $ | ( | $ | ||||||||||||||||||||||||||||||||||||
Changes in unrealized gains (losses) included in net income (loss) for the instruments still held at December 31, 2023 (7) | $ | ( | $ | $ | $ | ( | $ | $ | ( | $ | ( | |||||||||||||||||||||||||||||||||
Changes in unrealized gains (losses) included in OCI for the instruments still held as of December 31, 2021 (7) | $ | ( | $ | $ | $ | $ | $ | $ | ||||||||||||||||||||||||||||||||||||
Changes in unrealized gains (losses) included in OCI for the instruments still held as of December 31, 2022 (7) | $ | ( | $ | ( | $ | ( | $ | $ | $ | $ | ||||||||||||||||||||||||||||||||||
Changes in unrealized gains (losses) included in OCI for the instruments still held as of December 31, 2023 (7) | $ | $ | $ | $ | $ | $ | ( | $ | ||||||||||||||||||||||||||||||||||||
Gains (Losses) Data for the year ended December 31, 2021: | ||||||||||||||||||||||||||||||||||||||||||||
Total realized/unrealized gains (losses) included in net income (loss) (3) (4) | $ | ( | $ | $ | $ | $ | $ | $ | ( | |||||||||||||||||||||||||||||||||||
| Total realized/unrealized gains (losses) included in AOCI | $ | ( | $ | $ | $ | $ | $ | $ | ||||||||||||||||||||||||||||||||||||
_______________
174
Brighthouse Financial, Inc.
Notes to the Consolidated Financial Statements (continued)
11. Fair Value (continued)
(1)Comprised of U.S. and foreign corporate securities.
(2)Freestanding derivative assets and liabilities are reported net for purposes of the rollforward.
(3)Amortization of premium/accretion of discount is included in net investment income. Changes in the allowance for credit losses and direct write-offs are charged to net income (loss) on securities are included in net investment gains (losses). Lapses associated with net embedded derivatives are included in net derivative gains (losses). Substantially all realized/unrealized gains (losses) included in net income (loss) for net derivatives and net embedded derivatives are reported in net derivative gains (losses).
(4)Interest and dividend accruals, as well as cash interest coupons and dividends received, are excluded from the rollforward.
(5)Items purchased/issued and then sold/settled in the same period are excluded from the rollforward. Fees attributed to embedded derivatives are included in settlements.
(6)Gains and losses, in net income (loss) and OCI, are calculated assuming transfers into and/or out of Level 3 occurred at the beginning of the period. Items transferred into and out of Level 3 in the same period are excluded from the rollforward.
(7)Changes in unrealized gains (losses) included in net income (loss) for fixed maturities are reported in either net investment income or net investment gains (losses). Substantially all changes in unrealized gains (losses) included in net income (loss) for net derivatives and net embedded derivatives are reported in net derivative gains (losses).
Fair Value of Financial Instruments Carried at Other Than Fair Value
The following tables provide fair value information for financial instruments that are carried on the balance sheet at amounts other than fair value. These tables exclude the following financial instruments: cash and cash equivalents, accrued investment income and payables for collateral under securities loaned and other transactions. The estimated fair value of the excluded financial instruments, which are primarily classified in Level 2, approximates carrying value as they are short-term in nature such that the Company believes there is minimal risk of material changes in interest rates or credit quality. All remaining balance sheet amounts excluded from the tables below are not considered financial instruments subject to this disclosure.
The carrying values and estimated fair values for such financial instruments, and their corresponding placement in the fair value hierarchy, are summarized as follows at:
| December 31, 2023 | ||||||||||||||||||||||||||||||||
| Fair Value Hierarchy | ||||||||||||||||||||||||||||||||
| Carrying Value | Level 1 | Level 2 | Level 3 | Total Estimated Fair Value | ||||||||||||||||||||||||||||
| (In millions) | ||||||||||||||||||||||||||||||||
| Assets | ||||||||||||||||||||||||||||||||
| Mortgage loans | $ | $ | $ | $ | $ | |||||||||||||||||||||||||||
| Policy loans | $ | $ | $ | $ | $ | |||||||||||||||||||||||||||
| Other invested assets | $ | $ | $ | $ | $ | |||||||||||||||||||||||||||
| Premiums, reinsurance and other receivables | $ | $ | $ | $ | $ | |||||||||||||||||||||||||||
| Liabilities | ||||||||||||||||||||||||||||||||
| Policyholder account balances | $ | $ | $ | $ | $ | |||||||||||||||||||||||||||
| Long-term debt | $ | $ | $ | $ | $ | |||||||||||||||||||||||||||
| Other liabilities | $ | $ | $ | $ | $ | |||||||||||||||||||||||||||
| Separate account liabilities | $ | $ | $ | $ | $ | |||||||||||||||||||||||||||
175
Brighthouse Financial, Inc.
Notes to the Consolidated Financial Statements (continued)
11. Fair Value (continued)
| December 31, 2022 | ||||||||||||||||||||||||||||||||
| Fair Value Hierarchy | ||||||||||||||||||||||||||||||||
| Carrying Value | Level 1 | Level 2 | Level 3 | Total Estimated Fair Value | ||||||||||||||||||||||||||||
| (In millions) | ||||||||||||||||||||||||||||||||
| Assets | ||||||||||||||||||||||||||||||||
| Mortgage loans | $ | $ | $ | $ | $ | |||||||||||||||||||||||||||
| Policy loans | $ | $ | $ | $ | $ | |||||||||||||||||||||||||||
| Other invested assets | $ | $ | $ | $ | $ | |||||||||||||||||||||||||||
| Premiums, reinsurance and other receivables | $ | $ | $ | $ | $ | |||||||||||||||||||||||||||
| Liabilities | ||||||||||||||||||||||||||||||||
| Policyholder account balances | $ | $ | $ | $ | $ | |||||||||||||||||||||||||||
| Long-term debt | $ | $ | $ | $ | $ | |||||||||||||||||||||||||||
| Other liabilities | $ | $ | $ | $ | $ | |||||||||||||||||||||||||||
| Separate account liabilities | $ | $ | $ | $ | $ | |||||||||||||||||||||||||||
12. Long-term Debt
Long-term debt outstanding was as follows at:
| December 31, | ||||||||||||||||||||||||||||||||||||||
| 2023 | 2022 | |||||||||||||||||||||||||||||||||||||
| Stated Interest Rate | Maturity | Face Value | Carrying Value | Face Value | Carrying Value | |||||||||||||||||||||||||||||||||
| (In millions) | ||||||||||||||||||||||||||||||||||||||
| Senior notes (1) | 2027 | $ | $ | $ | $ | |||||||||||||||||||||||||||||||||
| Senior notes (1) | 2030 | |||||||||||||||||||||||||||||||||||||
| Senior notes (1) | 2047 | |||||||||||||||||||||||||||||||||||||
| Senior notes (1) | 2051 | |||||||||||||||||||||||||||||||||||||
| Junior subordinated debentures (1) | 2058 | |||||||||||||||||||||||||||||||||||||
| Other long-term debt (2) | 2030 | |||||||||||||||||||||||||||||||||||||
| Total long-term debt (3) | $ | $ | $ | $ | ||||||||||||||||||||||||||||||||||
_______________
(1)Interest on senior notes is payable semi-annually. Interest on junior subordinated debentures is payable quarterly subject to BHF’s right to defer interest payments in accordance with the terms of the debentures.
(2)Represents non-recourse debt for which creditors have no access, subject to customary exceptions, to the general assets of the Company other than recourse to certain investment companies.
(3)Includes unamortized debt issuance costs, discounts and premiums, as applicable, totaling net $30 million and $32 million for the senior notes and junior subordinated debentures on a combined basis at December 31, 2023 and 2022, respectively.
The aggregate maturities of long-term debt at December 31, 2023 were $2 million in 2024, $3 761 million in 2027, $3 million in 2028, and $2.4 billion thereafter.
Unsecured senior notes rank highest in priority, followed by subordinated debt consisting of junior subordinated debentures.
Interest expense related to long-term debt of $153 million, $153 million and $163 million for the years ended December 31, 2023, 2022 and 2021, respectively, is included in other expenses.
176
Brighthouse Financial, Inc.
Notes to the Consolidated Financial Statements (continued)
12. Long-term Debt (continued)
The Company’s debt instruments and credit and committed facilities contain certain administrative, reporting and legal covenants. Additionally, the Revolving Credit Facility (as defined below) contain financial covenants, including requirements to maintain a specified minimum adjusted consolidated net worth, to maintain a ratio of total indebtedness to total capitalization not in excess of a specified percentage and that place limitations on the dollar amount of indebtedness that may be incurred by the Company’ subsidiaries. At December 31, 2023, the Company was in compliance with these financial covenants.
Senior Notes
In November 2021, BHF used the net proceeds from the issuances of the Series D Depositary Shares (as defined in Note 13) and the 2051 Senior Notes (as defined below) to repurchase $543 million principal amount of senior notes due 2027 and $136 million principal amount of senior notes due 2047. In connection with this repurchase, BHF recorded a premium of $71 million paid in excess of the debt principal and wrote off $4 million of unamortized debt issuance costs, which is included in other expenses.
In November 2021, BHF issued $400 million aggregate principal amount of senior notes due December 2051 (the “2051 Senior Notes”) for aggregate net cash proceeds of $396 million. The 2051 Senior Notes bear interest at a fixed rate of 3.850 %, payable semi-annually.
Credit Facilities
Revolving Credit Facility
On April 15, 2022, BHF entered into a new revolving credit agreement with respect to a new $1.0 billion senior unsecured revolving credit facility maturing April 15, 2027 (the “2022 Revolving Credit Facility”), all of which may be used for revolving loans or letters of credit. The 2022 Revolving Credit Facility refinanced and replaced BHF’s former $1.0 billion senior unsecured revolving credit facility that was scheduled to mature May 7, 2024. At December 31, 2023, there were no
Committed Facilities
Reinsurance Financing Arrangement
Brighthouse Reinsurance Company of Delaware (“BRCD”) maintains a $15.0 billion financing arrangement with a pool of highly rated third-party reinsurers consisting of credit-linked notes that each mature in 2039. At December 31, 2023, there were no borrowings and there was $15.0 billion of funding available under this financing arrangement. For the years ended December 31, 2023, 2022 and 2021, the Company recognized commitment fees of $21 million, $26 million and $34 million, respectively, in other expenses associated with this financing arrangement.
Repurchase Facilities
At December 31, 2023, Brighthouse Life Insurance Company maintains secured committed repurchase facilities (the “Repurchase Facilities”) with terms of up to three years under which Brighthouse Life Insurance Company may enter into repurchase transactions in an aggregate amount up to $2.5 billion. Under the Repurchase Facilities, Brighthouse Life Insurance Company may sell certain eligible securities at a purchase price based on the market value of the securities less an applicable margin based on the types of securities sold, with a concurrent agreement to repurchase such securities at a predetermined future date (up to three months) and at a price which represents the original purchase price plus interest. At December 31, 2023, there were no borrowings under the Repurchase Facilities.
177
Brighthouse Financial, Inc.
Notes to the Consolidated Financial Statements (continued)
13. Equity
Preferred Stock
Preferred stock shares authorized, issued and outstanding were as follows at:
| December 31, | ||||||||||||||||||||||||||||||||||||||
| 2023 | 2022 | |||||||||||||||||||||||||||||||||||||
| Shares Authorized | Shares Issued | Shares Outstanding | Shares Authorized | Shares Issued | Shares Outstanding | |||||||||||||||||||||||||||||||||
| Not designated | ||||||||||||||||||||||||||||||||||||||
| Total | ||||||||||||||||||||||||||||||||||||||
In November 2021, BHF issued depositary shares (the “Series D Depositary Shares”), each representing a 1/1,000th ownership interest in a share of BHF’s perpetual 4.625 % Series D non-cumulative preferred stock (the “Series D Preferred Stock”) and in the aggregate representing 14,000 shares of Series D Preferred Stock, with a stated amount of $25,000 per share, for aggregate net cash proceeds of $339 million. Dividends, if declared, will be payable commencing on March 25, 2022 and will accrue and be payable quarterly, in arrears, at an annual rate of 4.625 % on the stated amount per share. In connection with the issuance of the Series D Depositary Shares and the underlying Series D Preferred Stock, BHF incurred $11 million of issuance costs, which have been recorded as a reduction of additional paid-in capital.
In November 2020, BHF issued depositary shares (the “Series C Depositary Shares”), each representing a 1/1,000th ownership interest in a share of BHF’s perpetual 5.375 % Series C non-cumulative preferred stock (the “Series C Preferred Stock”) and in the aggregate representing 23,000 shares of Series C Preferred Stock, with a stated amount of $25,000 per share, for aggregate net cash proceeds of $558 million. Dividends, if declared, will accrue and be payable quarterly, in arrears, at an annual rate of 5.375 % on the stated amount per share. In connection with the issuance of the Series C Depositary Shares and the underlying Series C Preferred Stock, BHF incurred $17 million of issuance costs, which have been recorded as a reduction of additional paid-in capital.
In May 2020, BHF issued depositary shares (the “Series B Depositary Shares”), each representing a 1/1,000th ownership interest in a share of its perpetual 6.750 % non-cumulative preferred stock, Series B (the “Series B Preferred Stock”) and in the aggregate representing 16,100 shares of Series B Preferred Stock, with a stated amount of $25,000 per share, for aggregate net cash proceeds of $390 million. Dividends, if declared, will accrue and be payable quarterly, in arrears, at an annual rate of 6.750 % on the stated amount per share. In connection with the issuance of the Series B Depositary Shares and the underlying Series B Preferred Stock, BHF incurred $13 million of issuance costs, which have been recorded as a reduction of additional paid-in capital.
In March 2019, BHF issued depositary shares, each representing a 1/1,000th ownership interest in a share of BHF’s perpetual 6.600 % Series A non-cumulative preferred stock (the “Series A Preferred Stock”) and in the aggregate representing 17,000 shares of Series A Preferred Stock, with a stated amount of $25,000 per share, for aggregate net cash proceeds of $412 million. Dividends, if declared, will accrue and be payable quarterly, in arrears, at an annual rate of 6.600 % on the stated amount per share. In connection with the issuance of the depositary shares and the underlying Series A Preferred Stock, BHF incurred $13 million of issuance costs, which have been recorded as a reduction of additional paid-in capital.
178
Brighthouse Financial, Inc.
Notes to the Consolidated Financial Statements (continued)
13. Equity (continued)
The Series A Preferred Stock, the Series B Preferred Stock, Series C Preferred Stock and the Series D Preferred Stock (together, the “Preferred Stock”) rank equally with each other. The Preferred Stock ranks senior to common stock with respect to the payment of dividends and distributions of assets upon liquidation, dissolution or winding-up of the Company. Holders of the Preferred Stock are not entitled to any other amounts from the Company after they have received their full liquidation preference and do not have voting rights except in certain limited circumstances, including where dividends have not been paid in full for at least six dividend payment periods, whether or not such periods are consecutive. In such circumstances, the holders of the Preferred Stock, and, in turn, the underlying depositary shares, will have certain voting rights with respect to the election of additional directors to the BHF Board of Directors, as provided in the Certificate of Designations for each series of Preferred Stock.
Each series of Preferred Stock has a stated amount of $25,000 per share, is perpetual and has no maturity date. Dividends are payable, if declared, quarterly in arrears on the 25th day of March, June, September and December of each year at a specified annual rate on the stated amount per share applicable to each particular series. Dividends are recorded when declared. No dividends may be paid or declared on BHF’s common stock and BHF may not purchase, redeem, or otherwise acquire its common stock unless the full dividends for the latest completed dividend period on all outstanding Preferred Stock have been declared and either paid or a sum sufficient for the payment thereof has been set aside.
The Preferred Stock is not convertible into, or exchangeable for, shares of any other class or series of stock or other securities of the Company or its subsidiaries and is not subject to any mandatory redemption, sinking fund, retirement fund, purchase fund or similar provisions. Each series of the Preferred Stock is redeemable at the Company’s option in whole or in part on or after a specified optional redemption date applicable to that series (March 25, 2024 for the Series A Preferred Stock, June 25, 2025 for the Series B Preferred Stock, December 25, 2025 for the Series C Preferred Stock and December 25, 2026 for the Series D Preferred Stock) at a redemption price equal to $25,000 per share, plus any accrued but unpaid dividends. Prior to the optional redemption date applicable to each series of Preferred Stock, the Preferred Stock is redeemable at the Company’s option in whole but not in part within 90 days of the occurrence of (i) a specified rating agency event or (ii) a specified regulatory capital event, in each case at a specified redemption price.
The per share and aggregate dividends declared for BHF’s preferred stock by series were as follows:
| Years Ended December 31, | ||||||||||||||||||||||||||||||||||||||
| 2023 | 2022 | 2021 | ||||||||||||||||||||||||||||||||||||
| Series | Per Share | Aggregate | Per Share | Aggregate | Per Share | Aggregate | ||||||||||||||||||||||||||||||||
| (In millions, except per share data) | ||||||||||||||||||||||||||||||||||||||
| A | $ | $ | $ | $ | $ | $ | ||||||||||||||||||||||||||||||||
| B | $ | $ | $ | |||||||||||||||||||||||||||||||||||
| C | $ | $ | $ | |||||||||||||||||||||||||||||||||||
| D | $ | $ | $ | |||||||||||||||||||||||||||||||||||
| Total | $ | $ | $ | |||||||||||||||||||||||||||||||||||
See Note 20 for information relating to preferred dividends declared subsequent to December 31, 2023.
Common Stock
Changes in common shares outstanding were as follows:
| Years Ended December 31, | ||||||||||||||||||||
| 2023 | 2022 | 2021 | ||||||||||||||||||
| Shares outstanding at beginning of year | ||||||||||||||||||||
| Shares issued | ||||||||||||||||||||
| Shares repurchased (1) | ( | ( | ( | |||||||||||||||||
| Shares outstanding at end of year | ||||||||||||||||||||
_______________
(1)Includes shares of common stock withheld with respect to tax withholding obligations associated with the vesting of share-based compensation awards under the Company’s publicly announced benefit plans or programs.
179
Brighthouse Financial, Inc.
Notes to the Consolidated Financial Statements (continued)
13. Equity (continued)
On November 16, 2023, BHF authorized the repurchase of up to $750 million of its common stock, which is in addition to the $1.2 billion total repurchases authorized in 2021. Repurchases under the November 16, 2023 authorization may be made through open market purchases, including pursuant to a 10b5-1 plan or pursuant to accelerated stock repurchase plans, or through privately negotiated transactions, from time to time at management’s discretion in accordance with applicable legal requirements.
During the years ended December 31, 2023, 2022 and 2021, BHF repurchased 5,195,832 shares, 10,000,026 shares and 10,703,165 shares, respectively, of its common stock through open market purchases pursuant to 10b5-1 plans for $250 million, $488 million and $499 million, respectively. At December 31, 2023, BHF had $793 million remaining under its common stock repurchase program.
Share-Based Compensation Plans
All share-based compensation is measured at fair value as of the grant date. The Company recognizes compensation expense related to share-based awards based on the number of awards expected to vest, which for some award types represent the awards granted less expected forfeitures over the life of the award, as estimated at the date of grant and actual forfeitures for other award types. Unless a material deviation from the assumed forfeiture rate is observed during the term in which the awards are expensed, the Company recognizes any adjustment necessary to reflect differences in actual experience in the period the award becomes payable or exercisable. Compensation expense related to share-based awards, which is included in other expenses, is principally related to the issuance of restricted stock units and performance share units with other costs incurred relating to stock options. The Company grants the majority of each year’s awards in the first quarter of the year.
Compensation Expense Related to Share-Based Compensation
The following table presents total share-based compensation expense:
| Years Ended December 31, | ||||||||||||||||||||
| 2023 | 2022 | 2021 | ||||||||||||||||||
| (In millions) | ||||||||||||||||||||
| RSUs | $ | $ | $ | |||||||||||||||||
| PSUs | ||||||||||||||||||||
| Employee stock purchase plan | ||||||||||||||||||||
| Total share-based compensation expense | $ | $ | $ | |||||||||||||||||
| Income tax benefit | $ | $ | $ | |||||||||||||||||
At December 31, 2023, unrecognized share-based compensation and the weighted average remaining recognition period was $10 million and 0.8 years, respectively, for RSUs and $17 million and 1.1 years, respectively, for PSUs.
Equity Awards
Restricted Stock Units
RSUs are units that, if vested, are payable in shares of BHF common stock. The Company does not credit RSUs with dividend-equivalents as RSUs do not accrue dividends. Accordingly, the estimated fair value of RSUs is based upon the closing price of shares on the date of grant. Most RSUs use graded vesting and vest in thirds on, or shortly after, the first three anniversaries of their grant date, while other RSUs vest in their entirety on the specified anniversary of their grant date. Vesting is subject to continued service, except for employees who meet specified age and service criteria, and in certain other limited circumstances.
180
Brighthouse Financial, Inc.
Notes to the Consolidated Financial Statements (continued)
13. Equity (continued)
Performance Share Units
For awards granted for performance periods in progress through December 31, 2023, the vested PSUs will be multiplied by a performance factor up to a maximum payout of 150 %. Assuming the Company has met certain threshold performance targets, the Compensation and Human Capital Committee of BHF’s Board of Directors will determine the performance factor at its discretion.
The following table presents a summary of PSU and RSU activity:
| RSUs | PSUs | ||||||||||||||||||||||
| Units | Weighted Average Grant Date Fair Value | Units | Weighted Average Grant Date Fair Value | ||||||||||||||||||||
Nonvested at January 1, 2023 | $ | $ | |||||||||||||||||||||
| Granted | $ | $ | |||||||||||||||||||||
| Performance factor adjustment | $ | $ | |||||||||||||||||||||
| Forfeited | ( | $ | $ | ||||||||||||||||||||
| Vested | ( | $ | ( | $ | |||||||||||||||||||
Nonvested at December 31, 2023 | $ | $ | |||||||||||||||||||||
The weighted average grant date fair value of RSUs granted during the years ended December 31, 2022 and 2021, was $47.72 and $41.81 , respectively. The weighted average grant date fair value of PSUs granted during the years ended December 31, 2022 and 2021, was $48.06 and $41.26 , respectively. The total fair value of RSUs that vested during each of the years ended December 31, 2023, 2022 and 2021 was $15 9 million, $7 million and $4 million, respectively.
Stock Options
Stock options represent the contingent right of award holders to purchase shares of BHF common stock at a stated price for a limited time. All stock options have an exercise price equal to the closing price of a share on the date of grant and have a maximum term of ten years. Stock options granted are exercisable at a rate of one-third of each award on each of the first three anniversaries of the grant date. Vesting is subject to continued service, except for employees who meet specified age and service criteria, and in certain other limited circumstances.
Employee Stock Purchase Plan Shares
Under the ESPP, eligible employees of the Company purchase common stock at a discount rate of 15 % of the market price per share on the lesser of the first or last trading day of the offering period. Employees purchase a variable number of shares of stock through payroll deductions elected just prior to the beginning of the offering period. During the years ended December 31, 2023, 2022 and 2021, employees purchased 77,598 shares, 74,734 shares and 73,999 shares, respectively. The weighted average per share fair value of the discount under the ESPP was $9.04 , $8.54 and $10.06 during the years ended December 31, 2023, 2022 and 2021, respectively, which was recorded in other expenses.
181
Brighthouse Financial, Inc.
Notes to the Consolidated Financial Statements (continued)
13. Equity (continued)
Statutory Financial Information
The states of domicile of the Company’s insurance subsidiaries impose RBC requirements that were developed by the National Association of Insurance Commissioners (“NAIC”). Such requirements are used by regulators to assess the minimum amount of statutory capital and surplus needed for an insurance company to support its operations, based on its size and risk profile (referred to as “company action level RBC”). RBC is based on statutory financial statements and is calculated in a manner prescribed by the NAIC. The RBC ratio, which is the basis for determining regulatory compliance, is equal to total adjusted capital (“TAC”) divided by the applicable company action level RBC. Companies below 100% of the company action level RBC are subject to corrective action. As of December 31, 2023, the annual RBC ratios for the Company’s insurance subsidiaries were each in excess of 400 %.
The Company’s insurance subsidiaries prepare statutory-basis financial statements in accordance with statutory accounting practices prescribed or permitted by the insurance department of the state of domicile.
Statutory accounting principles differ from GAAP primarily by charging policy acquisition costs to expense as incurred, establishing future policy benefit liabilities using different actuarial assumptions, reporting of reinsurance agreements and valuing investments and deferred tax assets on a different basis.
The tables below present amounts from certain of the Company’s insurance subsidiaries, which are derived from the statutory-basis financial statements as filed with the insurance regulators.
Statutory net income (loss) was as follows:
| Years Ended December 31, | ||||||||||||||||||||||||||
| Company | State of Domicile | 2023 | 2022 | 2021 | ||||||||||||||||||||||
| (In millions) | ||||||||||||||||||||||||||
| Brighthouse Life Insurance Company | Delaware | $ | ( | $ | $ | ( | ||||||||||||||||||||
| New England Life Insurance Company | Massachusetts | $ | $ | $ | ||||||||||||||||||||||
Statutory capital and surplus was as follows at:
| December 31, | ||||||||||||||
| Company | 2023 | 2022 | ||||||||||||
| (In millions) | ||||||||||||||
| Brighthouse Life Insurance Company | $ | $ | ||||||||||||
| New England Life Insurance Company | $ | $ | ||||||||||||
The Company has a reinsurance subsidiary, BRCD, which reinsures risks including level premium term life and ULSG assumed from other Brighthouse Financial life insurance subsidiaries. BRCD, with the explicit permission of the Delaware Insurance Commissioner (“Delaware Commissioner”), has included the value of credit-linked notes as admitted assets, which resulted in higher statutory capital and surplus of $11.0 billion and $10.7 billion for the years ended December 31, 2023 and 2022, respectively.
The statutory net income (loss) of BRCD was ($300 ) million, ($208 ) million and $543 million for the years ended December 31, 2023, 2022 and 2021, respectively, and the combined statutory capital and surplus, including the aforementioned prescribed practices, were $661 million and $696 million at December 31, 2023 and 2022, respectively.
182
Brighthouse Financial, Inc.
Notes to the Consolidated Financial Statements (continued)
13. Equity (continued)
Dividend Restrictions
The table below sets forth the dividends permitted to be paid by certain of the Company’s insurance companies without insurance regulatory approval and dividends paid:
| 2024 | 2023 | 2022 | 2021 | |||||||||||||||||||||||
| Company | Permitted Without Approval (1) | Paid (2) | Paid (2) | Paid (2) | ||||||||||||||||||||||
| (In millions) | ||||||||||||||||||||||||||
Brighthouse Life Insurance Company (3) | $ | $ | $ | $ | ||||||||||||||||||||||
| New England Life Insurance Company | $ | $ | $ | $ | ||||||||||||||||||||||
______________
(1)Reflects dividend amounts that may be paid during 2024 without prior regulatory approval. However, because dividend tests may be based on dividends previously paid over rolling 12-month periods, if paid before a specified date during 2024, some or all of such dividends may require regulatory approval to the extent dividends were paid in 2023.
(2)Reflects all amounts paid, including those requiring regulatory approval.
(3)Any payment of dividends in 2024 would be considered an extraordinary dividend subject to regulatory approval due to negative unassigned funds (surplus).
Under the Delaware Insurance Law, Brighthouse Life Insurance Company is permitted, without prior insurance regulatory clearance, to pay a stockholder dividend as long as the amount of the dividend when aggregated with all other dividends in the preceding 12 months does not exceed the greater of: (i) 10% of its surplus to policyholders as of the end of the immediately preceding calendar year; or (ii) its net gain from operations for the immediately preceding calendar year (excluding realized capital gains), not including pro rata distributions of Brighthouse Life Insurance Company’s own securities. Brighthouse Life Insurance Company will be permitted to pay a stockholder dividend in excess of the greater of such two amounts only if it files notice of the declaration of such a dividend and the amount thereof with the Delaware Commissioner and the Delaware Commissioner either approves the distribution of the dividend or does not disapprove the distribution within 30 days of its filing. In addition, any dividend that exceeds earned surplus (defined as “unassigned funds (surplus)”) as of the immediately preceding calendar year requires insurance regulatory approval. Under the Delaware Insurance Law, the Delaware Commissioner has broad discretion in determining whether the financial condition of a stock life insurance company would support the payment of such dividends to its stockholders.
Under the Massachusetts State Insurance Law, NELICO is permitted, without prior insurance regulatory clearance, to pay a stockholder dividend as long as the aggregate amount of the dividend, when aggregated with all other dividends paid in the preceding 12 months, does not exceed the greater of: (i) 10% of its surplus to policyholders as of the end of the immediately preceding calendar year; or (ii) its net gain from operations for the immediately preceding calendar year, not including pro rata distributions of NELICO’s own securities. NELICO will be permitted to pay a dividend in excess of the greater of such two amounts only if it files notice of the declaration of such a dividend and the amount thereof with the Massachusetts Commissioner of Insurance (the “Massachusetts Commissioner”) and the Massachusetts Commissioner either approves the distribution of the dividend or does not disapprove the distribution within 30 days of its filing. In addition, any dividend that exceeds earned surplus (defined as “unassigned funds (surplus)”) as of the last filed annual statutory statement requires insurance regulatory approval. Under the Massachusetts State Insurance Law, the Massachusetts Commissioner has broad discretion in determining whether the financial condition of a stock life insurance company would support the payment of such dividends to its stockholders.
183
Brighthouse Financial, Inc.
Notes to the Consolidated Financial Statements (continued)
13. Equity (continued)
Under New York insurance laws, Brighthouse Life Insurance Company of NY (“BHNY”) is permitted, without prior insurance regulatory clearance, to pay stockholder dividends to its parent in any calendar year based on one of two standards. Under one standard, BHNY is permitted, without prior insurance regulatory clearance, to pay dividends out of earned surplus (defined as positive “unassigned funds (surplus),” excluding 85% of the change in net unrealized capital gains or losses (less capital gains tax), for the immediately preceding calendar year), in an amount up to the greater of: (i) 10% of its surplus to policyholders as of the end of the immediately preceding calendar year or (ii) its statutory net gain from operations for the immediately preceding calendar year (excluding realized capital gains), not to exceed 30% of surplus to policyholders as of the end of the immediately preceding calendar year. In addition, under this standard, BHNY may not, without prior insurance regulatory clearance, pay any dividends in any calendar year immediately following a calendar year for which its net gain from operations, excluding realized capital gains, was negative. Under the second standard, if dividends are paid from a source other than earned surplus, BHNY may, without prior insurance regulatory clearance, pay an amount up to the lesser of: (i) 10% of its surplus to policyholders as of the end of the immediately preceding calendar year or (ii) its statutory net gain from operations for the immediately preceding calendar year (excluding realized capital gains). In addition, BHNY will be permitted to pay a dividend to its parent in excess of the amounts allowed under both standards only if it files notice of its intention to declare such a dividend and the amount thereof with the New York Superintendent of Financial Services (the “NY Superintendent”), and the NY Superintendent either approves the distribution of the dividend or does not disapprove the dividend within 30 days of its filing. To the extent BHNY pays a stockholder dividend, such dividend will be paid to Brighthouse Life Insurance Company, its direct parent and sole stockholder.
Under BRCD’s plan of operations, no dividend or distribution may be made by BRCD without the prior approval of the Delaware Commissioner. BRCD did no 400 million, invested assets of $197 million and cash of $3 million. During each of the years ended December 31, 2023, 2022 and 2021, BRCD paid cash dividends of $1
184
Brighthouse Financial, Inc.
Notes to the Consolidated Financial Statements (continued)
13. Equity (continued)
Accumulated Other Comprehensive Income (Loss)
Information regarding changes in the balances of each component of AOCI was as follows:
| Unrealized Investment Gains (Losses), Net of Related Offsets (1) | Unrealized Gains (Losses) on Derivatives | Changes in Nonperformance Risk on Market Risk Benefits | Changes in Discount Rates on the Liability for Future Policy Benefits | Other (2) | Total | ||||||||||||||||||||||||||||||
| (In millions) | |||||||||||||||||||||||||||||||||||
| Balance at December 31, 2020 | $ | $ | $ | $ | $ | ( | $ | ||||||||||||||||||||||||||||
Cumulative effect to change in accounting principle, net of income tax (3) | ( | ( | ( | ||||||||||||||||||||||||||||||||
Balance at January 1, 2021 | ( | ( | ( | ||||||||||||||||||||||||||||||||
| OCI before reclassifications | ( | ( | ( | ( | |||||||||||||||||||||||||||||||
Deferred income tax benefit (expense) (4) | ( | ( | |||||||||||||||||||||||||||||||||
| AOCI before reclassifications, net of income tax | ( | ( | ( | ||||||||||||||||||||||||||||||||
| Amounts reclassified from AOCI | ( | ( | ( | ||||||||||||||||||||||||||||||||
Deferred income tax benefit (expense) (4) | ( | ||||||||||||||||||||||||||||||||||
| Amounts reclassified from AOCI, net of income tax | ( | ( | ( | ||||||||||||||||||||||||||||||||
| Balance at December 31, 2021 | ( | ( | ( | ||||||||||||||||||||||||||||||||
| OCI before reclassifications | ( | ( | ( | ||||||||||||||||||||||||||||||||
Deferred income tax benefit (expense) (4) | ( | ( | ( | ||||||||||||||||||||||||||||||||
| AOCI before reclassifications, net of income tax | ( | ( | ( | ( | |||||||||||||||||||||||||||||||
| Amounts reclassified from AOCI | ( | ||||||||||||||||||||||||||||||||||
Deferred income tax benefit (expense) (4) | ( | ( | |||||||||||||||||||||||||||||||||
| Amounts reclassified from AOCI, net of income tax | ( | ||||||||||||||||||||||||||||||||||
| Balance at December 31, 2022 | ( | ( | ( | ( | |||||||||||||||||||||||||||||||
| OCI before reclassifications | ( | ( | ( | ||||||||||||||||||||||||||||||||
Deferred income tax benefit (expense) (4) | ( | ( | ( | ||||||||||||||||||||||||||||||||
| AOCI before reclassifications, net of income tax | ( | ( | ( | ( | |||||||||||||||||||||||||||||||
| Amounts reclassified from AOCI | ( | ||||||||||||||||||||||||||||||||||
Deferred income tax benefit (expense) (4) | ( | ( | ( | ||||||||||||||||||||||||||||||||
| Amounts reclassified from AOCI, net of income tax | ( | ||||||||||||||||||||||||||||||||||
Balance at December 31, 2023 | $ | ( | $ | $ | ( | $ | $ | ( | $ | ( | |||||||||||||||||||||||||
_______________
(1)See Note 9 for information on offsets to investments related to future policy benefits.
(2)Includes OCI related to foreign currency translation and defined benefit plan gains and losses.
(3)See Notes 1 and 2 for information on the adoption of ASU 2018-12.
(4)The effects of income taxes on amounts recorded to AOCI are also recognized in AOCI. These income tax effects are released from AOCI when the related activity is reclassified into results from operations.
185
Brighthouse Financial, Inc.
Notes to the Consolidated Financial Statements (continued)
13. Equity (continued)
Information regarding amounts reclassified out of each component of AOCI was as follows:
| AOCI Components | Amounts Reclassified from AOCI | Consolidated Statements of Operations Locations | ||||||||||||||||||||||||
| Years Ended December 31, | ||||||||||||||||||||||||||
| 2023 | 2022 | 2021 | ||||||||||||||||||||||||
| (In millions) | ||||||||||||||||||||||||||
| Net unrealized investment gains (losses): | ||||||||||||||||||||||||||
| Net unrealized investment gains (losses) | $ | ( | $ | ( | $ | ( | Net investment gains (losses) | |||||||||||||||||||
| Net unrealized investment gains (losses) | ( | ( | ( | Net derivative gains (losses) | ||||||||||||||||||||||
| Net unrealized investment gains (losses), before income tax | ( | ( | ( | |||||||||||||||||||||||
| Income tax (expense) benefit | ||||||||||||||||||||||||||
| Net unrealized investment gains (losses), net of income tax | ( | ( | ( | |||||||||||||||||||||||
| Unrealized gains (losses) on derivatives - cash flow hedges: | ||||||||||||||||||||||||||
| Interest rate swaps | Net derivative gains (losses) | |||||||||||||||||||||||||
| Interest rate swaps | Net investment income | |||||||||||||||||||||||||
| Foreign currency swaps | Net derivative gains (losses) | |||||||||||||||||||||||||
| Gains (losses) on cash flow hedges, before income tax | ||||||||||||||||||||||||||
| Income tax (expense) benefit | ( | ( | ( | |||||||||||||||||||||||
| Gains (losses) on cash flow hedges, net of income tax | ||||||||||||||||||||||||||
| Defined benefit plans adjustment: | ||||||||||||||||||||||||||
| Amortization of net actuarial gains (losses) | ( | ( | ||||||||||||||||||||||||
| Amortization of defined benefit plans, before income tax | ( | ( | ||||||||||||||||||||||||
| Income tax (expense) benefit | ||||||||||||||||||||||||||
| Amortization of defined benefit plans, net of income tax | ( | ( | ||||||||||||||||||||||||
| Total reclassifications, net of income tax | $ | ( | $ | ( | $ | |||||||||||||||||||||
14. Other Revenues and Other Expenses
Other Revenues
The Company has entered into contracts with mutual funds, fund managers, and their affiliates (collectively, the “Funds”) whereby the Company is paid monthly or quarterly fees (“12b-1 fees”) for providing certain services to customers and distributors of the Funds. The 12b-1 fees are generally equal to a fixed percentage of the average daily balance of the customer’s investment in a fund. The percentage is specified in the contract between the Company and the Funds. Payments are generally collected when due and are neither refundable nor able to offset future fees.
To earn these fees, the Company performs services such as responding to phone inquiries, maintaining records, providing information to distributors and shareholders about fund performance and providing training to account managers and sales agents. The passage of time reflects the satisfaction of the Company’s performance obligations to the Funds and is used to recognize revenue associated with 12b-1 fees.
Other revenues consisted primarily of 12b-1 fees of $266 million, $292 million and $360 million for the years ended December 31, 2023, 2022 and 2021, respectively, of which substantially all were reported in the Annuities segment.
186
Brighthouse Financial, Inc.
Notes to the Consolidated Financial Statements (continued)
14. Other Revenues and Other Expenses (continued)
Other Expenses
Information on other expenses was as follows:
| Years Ended December 31, | ||||||||||||||||||||
| 2023 | 2022 | 2021 | ||||||||||||||||||
| (In millions) | ||||||||||||||||||||
| Compensation | $ | $ | $ | |||||||||||||||||
| Contracted services and other labor costs | ||||||||||||||||||||
| Transition services agreements | ||||||||||||||||||||
| Establishment costs | ||||||||||||||||||||
| Premium and other taxes, licenses and fees | ||||||||||||||||||||
| Separate account fees | ||||||||||||||||||||
| Volume related costs, excluding compensation, net of DAC capitalization | ||||||||||||||||||||
| Interest expense on debt | ||||||||||||||||||||
| Debt repayment costs | ||||||||||||||||||||
| Other | ||||||||||||||||||||
| Total other expenses | $ | $ | $ | |||||||||||||||||
Capitalization of DAC
See Note 7 for additional information on the capitalization of DAC.
Interest Expense on Debt
See Note 12 for attribution of interest expense by debt issuance.
15. Employee Benefit Plans
BHF Active Defined Contribution Plans
Brighthouse Services sponsors qualified and non-qualified defined contribution plans. For the years ended December 31, 2023, 2022 and 2021, the total employer contributions for the qualified defined contribution plan were $19 million, $18 million and $18 million, respectively, and the total (benefit) expense recognition for the non-qualified defined contribution plans were $9 million, ($2 ) million and $9 million, respectively, all of which are reported in other expenses.
NELICO Legacy Pension and Other Unfunded Benefit Plans
NELICO sponsors both a qualified and a non-qualified defined benefit pension plan, a postretirement plan and other unfunded benefit plans. These pension and other unfunded benefit plans were amended to cease benefit accruals and are closed to new entrants. The qualified defined benefit pension plan had an accumulated benefit obligation of $129 million and $128 million at December 31, 2023 and 2022, respectively. This plan was fully funded at December 31, 2023 and 2022 with assets in excess of the accumulated benefit obligation of $5 million and $3 million, respectively. The Company did no
The non-qualified defined benefit pension plan and the postretirement plan had a combined accumulated benefit obligation totaling $83 million and $82 million at December 31, 2023 and 2022, respectively. These amounts are unfunded.
The other unfunded benefit plans consist primarily of deferred compensation due to former agents which represent general unsecured liabilities of NELICO. The amounts due under these other unfunded benefit plans were $57 million and $56 million at December 31, 2023 and 2022, respectively.
187
Brighthouse Financial, Inc.
Notes to the Consolidated Financial Statements (continued)
15. Employee Benefit Plans (continued)
Although NELICO remains the legal obligor for these plans, an employee matters agreement (“EMA”) exists between BHF and MetLife, whereby MetLife has agreed to reimburse BHF for the obligations under the non-qualified and other unfunded plans as payments are made. BHF established a receivable in the amount of the unfunded obligations due under these plans. MetLife is required to annually reimburse BHF for each prior year’s benefit payments, claims and premiums under the NELICO plans that are listed in the EMA. The Company’s receivable under the EMA for future total estimated benefit payments, claims and premiums was $155 million and $174 million at December 31, 2023 and 2022, respectively. The receivable is reported in premiums, reinsurance and other receivables. Increases and decreases to the EMA receivable are reported in other revenues.
16. Income Tax
The provision for income tax was as follows:
| Years Ended December 31, | |||||||||||||||||
| 2023 | 2022 | 2021 | |||||||||||||||
| (In millions) | |||||||||||||||||
| Current: | |||||||||||||||||
| Federal | $ | $ | ( | $ | |||||||||||||
| State and local | |||||||||||||||||
| Subtotal | ( | ||||||||||||||||
| Deferred: | |||||||||||||||||
| Federal | ( | ||||||||||||||||
| Provision for income tax expense (benefit) | $ | ( | $ | $ | |||||||||||||
The reconciliation of the income tax provision at the statutory tax rate to the provision for income tax as reported was as follows:
| Years Ended December 31, | |||||||||||||||||
| 2023 | 2022 | 2021 | |||||||||||||||
| (Dollars in millions) | |||||||||||||||||
| Tax provision at statutory rate | $ | ( | $ | $ | |||||||||||||
| Tax effect of: | |||||||||||||||||
Resolution of prior years | ( | ( | |||||||||||||||
| Dividends received deduction | ( | ( | ( | ||||||||||||||
| Tax credits | ( | ( | ( | ||||||||||||||
Change in uncertain tax benefits | ( | ||||||||||||||||
Return to provision | ( | ( | |||||||||||||||
Adjustments to deferred tax | ( | ( | |||||||||||||||
| Change in valuation allowance | ( | ||||||||||||||||
State tax, net of federal benefit | |||||||||||||||||
| Other, net | ( | ||||||||||||||||
| Provision for income tax expense (benefit) | $ | ( | $ | $ | |||||||||||||
| Effective tax rate | % | % | % | ||||||||||||||
188
Brighthouse Financial, Inc.
Notes to the Consolidated Financial Statements (continued)
16. Income Tax (continued)
Deferred income tax represents the tax effect of the differences between the book and tax bases of assets and liabilities. Net deferred income tax assets and liabilities consisted of the following at:
| December 31, | |||||||||||
| 2023 | 2022 | ||||||||||
| (In millions) | |||||||||||
| Deferred income tax assets: | |||||||||||
Net unrealized investment losses | $ | $ | |||||||||
| Net operating loss carryforwards | |||||||||||
Investments, including derivatives | |||||||||||
| Tax credit carryforwards | |||||||||||
| Employee benefits | |||||||||||
| Intangibles | |||||||||||
| Other | |||||||||||
| Total deferred income tax assets | |||||||||||
Less: Valuation allowance | |||||||||||
| Total net deferred income tax assets | |||||||||||
| Deferred income tax liabilities: | |||||||||||
| Policyholder liabilities and receivables | |||||||||||
| DAC | |||||||||||
| Other | |||||||||||
| Total deferred income tax liabilities | |||||||||||
| Net deferred income tax asset (liability) | $ | $ | |||||||||
The following table sets forth the net operating loss carryforwards for tax purposes at December 31, 2023.
| Net Operating Loss Carryforwards | ||||||||
| (In millions) | ||||||||
| Expiration | ||||||||
| 2032-2037 | $ | |||||||
| Indefinite | ||||||||
| $ | ||||||||
The following table sets forth the general business credits and foreign tax credits available for carryforward for tax purposes at December 31, 2023.
| Tax Credit Carryforwards | ||||||||||||||
| General Business Credits | Foreign Tax Credits | |||||||||||||
| (In millions) | ||||||||||||||
| Expiration | ||||||||||||||
| 2024-2028 | $ | $ | ||||||||||||
| 2029-2033 | ||||||||||||||
| 2034-2038 | ||||||||||||||
| 2039-2043 | ||||||||||||||
| Indefinite | ||||||||||||||
| $ | $ | |||||||||||||
189
Brighthouse Financial, Inc.
Notes to the Consolidated Financial Statements (continued)
16. Income Tax (continued)
The Company’s liability for unrecognized tax benefits may increase or decrease in the next 12 months. A reasonable estimate of the increase or decrease cannot be made at this time. However, the Company continues to believe that the ultimate resolution of the pending issues will not result in a material change to its consolidated financial statements, although the resolution of income tax matters could impact the Company’s effective tax rate in the future.
A reconciliation of the beginning and ending amount of unrecognized tax benefits was as follows:
| Years Ended December 31, | |||||||||||||||||
| 2023 | 2022 | 2021 | |||||||||||||||
| (In millions) | |||||||||||||||||
| Balance at January 1, | $ | $ | $ | ||||||||||||||
| Additions for tax positions of prior years | |||||||||||||||||
| Reductions for tax positions of prior years | |||||||||||||||||
| Additions for tax positions of current year | |||||||||||||||||
| Reductions for tax positions of current year | |||||||||||||||||
| Settlements with tax authorities | |||||||||||||||||
Lapses of statutes of limitations | ( | ||||||||||||||||
| Balance at December 31, | $ | $ | $ | ||||||||||||||
| Unrecognized tax benefits that, if recognized would impact the effective rate | $ | $ | $ | ||||||||||||||
The Company classifies interest accrued related to unrecognized tax benefits in interest expense, included in other expenses, while penalties are included in income tax expense. Interest related to unrecognized tax benefits was not significant. The Company had no
The Company is subject to examination by the Internal Revenue Service and other tax authorities in jurisdictions in which the Company has significant business operations. The income tax years under examination vary by jurisdiction and subsidiary. The Company is no longer subject to federal, state or local income tax examinations for years prior to 2017. Management believes it has established adequate tax liabilities, and final resolution of any audits for the years 2017 and forward is not expected to have a material impact on the Company’s consolidated financial statements.
Tax Sharing Agreements
For the periods prior to the Separation, BHF and certain of its subsidiaries filed a consolidated federal income tax return with MetLife and its insurance and non-insurance subsidiaries. Current taxes (and the benefits of tax attributes such as losses) are allocated to BHF, and its includable subsidiaries, under a tax sharing agreement with MetLife. This tax sharing agreement states that federal taxes are computed on a modified separate return basis with benefits for losses.
For periods after the Separation through the year ended December 31, 2022, BHF entered into two separate tax sharing agreements. Brighthouse Life Insurance Company, BHNY and BRCD entered into a tax sharing agreement to join a consolidated federal income tax return. BHF and certain of its non-insurance subsidiaries entered into a tax sharing agreement to join a consolidated federal income tax return. The tax sharing agreements state that federal taxes are computed on a modified separate return basis with benefit for losses. NELICO and the non-insurance subsidiaries of Brighthouse Life Insurance Company filed their own federal income tax returns.
BHF and certain of its subsidiaries, including its insurance and reinsurance subsidiaries, intend to file a consolidated federal income tax return for the year ended December 31, 2023 and future years. In furtherance thereof, such parties intend to join a single tax sharing agreement, pursuant to which federal taxes are computed on a modified separate return basis with benefits for losses.
190
Brighthouse Financial, Inc.
Notes to the Consolidated Financial Statements (continued)
16. Income Tax (continued)
Income Tax Transactions with Former Parent
In connection with the Separation, the Company entered into a tax receivables agreement (the “Tax Receivables Agreement”) with MetLife that provides MetLife with the right to receive, as partial consideration for its contribution of assets to BHF, future payments from BHF equal to 86 % of the amount of cash savings, if any, in federal income tax that Brighthouse Financial actually, or is deemed to, realize as a result of the utilization of Brighthouse Financial, Inc. and its subsidiaries’ net operating losses, capital losses, tax basis and amortization or depreciation deductions in respect of certain tax benefits it may realize as a result of certain transactions involved in the Separation. In connection with the Tax Receivables Agreement, the Company has a payable to MetLife of $328
17. Earnings Per Common Share
The calculation of earnings per common share was as follows:
| Years Ended December 31, | |||||||||||||||||
| 2023 | 2022 | 2021 | |||||||||||||||
| (In millions, except share and per share data) | |||||||||||||||||
| Net income (loss) available to Brighthouse Financial, Inc.’s common shareholders | $ | ( | $ | $ | |||||||||||||
| Weighted average common shares outstanding — basic | |||||||||||||||||
| Dilutive effect of share-based awards | |||||||||||||||||
| Weighted average common shares outstanding — diluted | |||||||||||||||||
| Earnings per common share: | |||||||||||||||||
| Basic | $ | ( | $ | $ | |||||||||||||
| Diluted | $ | ( | $ | $ | |||||||||||||
For the year ended December 31, 2023, basic loss per common share equaled diluted loss per common share. The diluted shares were not included in the per share calculation for this period as the inclusion of such shares would have an antidilutive effect.
For the years ended December 31, 2022 and 2021, weighted average shares used for calculating diluted earnings per common share excludes 187,371
191
Brighthouse Financial, Inc.
Notes to the Consolidated Financial Statements (continued)
Contingencies
Litigation
The Company is a defendant in a number of litigation matters. In some of the matters, large or indeterminate amounts, including punitive and treble damages, are sought. Modern pleading practice in the U.S. permits considerable variation in the assertion of monetary damages or other relief. Jurisdictions may permit claimants not to specify the monetary damages sought or may permit claimants to state only that the amount sought is sufficient to invoke the jurisdiction of the trial court. In addition, jurisdictions may permit plaintiffs to allege monetary damages in amounts well exceeding reasonably possible verdicts in the jurisdiction for similar matters. This variability in pleadings, together with the actual experience of the Company in litigating or resolving through settlement numerous claims over an extended period of time, demonstrates to management that the monetary relief which may be specified in a lawsuit or claim bears little relevance to its merits or disposition value.
The Company also receives and responds to subpoenas or other inquiries seeking a broad range of information from various state and federal regulators, agencies and officials. The issues involved in information requests and regulatory matters vary widely, but can include inquiries or investigations concerning the Company’s compliance with applicable insurance and other laws and regulations. The Company cooperates in these inquiries.
Due to the vagaries of litigation, the outcome of a litigation matter and the amount or range of potential loss at particular points in time may normally be difficult to ascertain. Uncertainties can include how fact finders will evaluate documentary evidence and the credibility and effectiveness of witness testimony, and how trial and appellate courts will apply the law in the context of the pleadings or evidence presented, whether by motion practice, or at trial or on appeal. Disposition valuations are also subject to the uncertainty of how opposing parties and their counsel will themselves view the relevant evidence and applicable law.
The Company establishes liabilities for litigation and regulatory loss contingencies when it is probable that a loss has been incurred and the amount of the loss can be reasonably estimated. It is possible that some matters could require the Company to pay damages or make other expenditures or establish accruals in amounts that could not be estimated at December 31, 2023.
Matters as to Which an Estimate Can Be Made
For some loss contingency matters, the Company is able to estimate a reasonably possible range of loss. For such matters where a loss is believed to be reasonably possible, but not probable, no accrual has been made. In addition to amounts accrued for probable and reasonably estimable losses, as of December 31, 2023, the Company estimates the aggregate range of reasonably possible losses to be up to approximately $10 million.
Matters as to Which an Estimate Cannot Be Made
For other matters, the Company is not currently able to estimate the reasonably possible loss or range of loss. The Company is often unable to estimate the possible loss or range of loss until developments in such matters have provided sufficient information to support an assessment of the range of possible loss, such as quantification of a damage demand from plaintiffs, discovery from other parties and investigation of factual allegations, rulings by the court on motions or appeals, analysis by experts, and the progress of settlement negotiations. On a quarterly and annual basis, the Company reviews relevant information with respect to litigation contingencies and updates its accruals, disclosures and estimates of reasonably possible losses or ranges of loss based on such reviews.
Sales Practices Claims
Over the past several years, the Company has faced claims and regulatory inquiries and investigations, alleging improper marketing or sales of individual life insurance policies, annuities or other products. The Company continues to defend vigorously against the claims in these matters. The Company believes adequate provision has been made in its consolidated financial statements for all probable and reasonably estimable losses for sales practices matters.
192
Brighthouse Financial, Inc.
Notes to the Consolidated Financial Statements (continued)
18. Contingencies, Commitments and Guarantees (continued)
Cost of Insurance Class Actions
Richard A. Newton v. Brighthouse Life Insurance Company (U.S. District Court, Northern District of Georgia, Atlanta Division, filed May 8, 2020). Plaintiff has filed a purported class action lawsuit against Brighthouse Life Insurance Company. Plaintiff was the owner of a universal life insurance policy issued by Travelers Insurance Company, a predecessor to Brighthouse Life Insurance Company. Plaintiff seeks to certify a class of all persons who own or owned life insurance policies issued where the terms of the life insurance policy provide or provided, among other things, a guarantee that the cost of insurance rates would not be increased by more than a specified percentage in any contract year. Plaintiff also alleges that cost of insurance charges were based on improper factors and should have decreased over time due to improving mortality but did not. Plaintiff alleges, among other things, causes of action for breach of contract, fraud, suppression and concealment, and violation of the Georgia Racketeer Influenced and Corrupt Organizations Act. Plaintiff seeks to recover damages, including punitive damages, interest and treble damages, attorneys’ fees, and injunctive and declaratory relief. Brighthouse Life Insurance Company filed a motion to dismiss in June 2020, which was granted in part and denied in part in March 2021. Plaintiff was granted leave to amend the complaint. On January 18, 2023, the plaintiff filed a motion on consent to amend the second amended class action complaint to narrow the scope of the class sought to those persons who own or owned life insurance policies issued in Georgia. The motion was granted on January 23, 2023, and the third amended class action complaint was filed on January 23, 2023. The Company intends to vigorously defend this matter.
Lawrence Martin v. Brighthouse Life Insurance Company (U.S. District Court, Southern District of New York, filed April 6, 2021). Plaintiff has filed a purported class action lawsuit against Brighthouse Life Insurance Company. Plaintiff is the owner of a universal life insurance policy issued by Travelers Insurance Company, a predecessor to Brighthouse Life Insurance Company. Plaintiff seeks to certify a class of similarly situated owners of universal life insurance policies issued or administered by defendants and alleges that cost of insurance charges were based on improper factors and should have decreased over time due to improving mortality but did not. Plaintiff alleges, among other things, causes of action for breach of contract, breach of the covenant of good faith and fair dealing, and unjust enrichment. Plaintiff seeks to recover compensatory damages, attorney’s fees, interest, and equitable relief including a constructive trust. Brighthouse Life Insurance Company filed a motion to dismiss in June 2021, which was denied in February 2022. Brighthouse Life Insurance Company of NY was initially named as a defendant when the lawsuit was filed, but was dismissed as a defendant, without prejudice, in April 2022. The Company intends to vigorously defend this matter.
MOVEit Data Security Incident Litigation
Kennedy v. Progress Software Corporation, et al. (U.S. District Court, District of Massachusetts, filed October 3, 2023). BHF has been named as a defendant in a purported class action lawsuit. The action relates to a data security incident at an alleged third-party vendor, PBI Research Services (“PBI”), and allegedly involves the MOVEit file transfer system that PBI uses in its provision of services (“MOVEit Incident”). As it relates to BHF, plaintiff seeks to certify a subclass of persons whose private information was allegedly maintained by BHF and accessed or acquired in connection with the MOVEit Incident. Plaintiff alleges, among other things, that BHF negligently chose to utilize PBI to store and transfer plaintiff’s and purported class members’ private information despite PBI’s use of the MOVEit software which plaintiff contends contained security vulnerabilities. The complaint asserts claims against BHF for negligence, negligence per se, and unjust enrichment, and plaintiff seeks declaratory and injunctive relief, damages, attorneys’ fees and prejudgment interest. BHF intends to vigorously defend this matter.
Summary
Various litigations, claims and assessments against the Company, in addition to those discussed previously and those otherwise provided for in the Company’s consolidated financial statements, have arisen in the course of the Company’s business, including, but not limited to, in connection with its activities as an insurer, investor and taxpayer. Further, state insurance regulatory authorities and other federal and state authorities regularly make inquiries and conduct investigations concerning the Company’s compliance with applicable insurance and other laws and regulations.
193
Brighthouse Financial, Inc.
Notes to the Consolidated Financial Statements (continued)
18. Contingencies, Commitments and Guarantees (continued)
It is not possible to predict the ultimate outcome of all pending investigations and legal proceedings. In some of the matters referred to previously, large or indeterminate amounts, including punitive and treble damages, are sought. Although, in light of these considerations, it is possible that an adverse outcome in certain cases could have a material effect upon the Company’s financial position, based on information currently known by the Company’s management, in its opinion, the outcomes of such pending investigations and legal proceedings are not likely to have such an effect. However, given the large or indeterminate amounts sought in certain of these matters and the inherent unpredictability of litigation, it is possible that an adverse outcome in certain matters could, from time to time, have a material effect on the Company’s consolidated net income or cash flows in particular quarterly or annual periods.
Other Loss Contingencies
As with litigation and regulatory loss contingencies, the Company considers establishing liabilities for loss contingencies associated with disputes or other matters involving third parties, including counterparties to contractual arrangements entered into by the Company (e.g., third-party vendors and reinsurers), as well as with tax or other authorities (“other loss contingencies”). The Company establishes liabilities for such other loss contingencies when it is probable that a loss will be incurred and the amount of the loss can be reasonably estimated. In matters where it is not probable, but is reasonably possible that a loss will be incurred and the amount of loss can be reasonably estimated, such losses or range of losses are disclosed, and no accrual is made. In the absence of sufficient information to support an assessment of the reasonably possible loss or range of loss, no accrual is made and no loss or range of loss is disclosed. On a quarterly basis, the Company reviews relevant information with respect to other loss contingencies and, when applicable, updates its accruals, disclosures and estimates of reasonably possible losses or ranges of loss based on such reviews.
In the matters where the Company’s subsidiaries are acting as the reinsured or the reinsurer, such matters have involved assertions by third parties primarily related to rates, fees or reinsured benefit calculations, and, in certain of such matters, the counterparty has made a request to arbitrate. For tax-related matters, this has involved disputes with taxing authorities, ongoing audits, evaluation of filing positions and any potential assessments related thereto. As of December 31, 2023, the Company estimates the range of reasonably possible losses in excess of the amounts accrued for certain other loss contingencies to be from zero up to approximately $200 million for the aforementioned matters. For certain other matters, the Company may not currently be able to estimate the reasonably possible loss or range of loss until developments in such matters have provided sufficient information to support an assessment of such loss.
During the second quarter of 2022, the Company settled a reinsurance-related matter with a third party for $140 million, which is reported in other expenses.
Commitments
Mortgage Loan Commitments
The Company commits to lend funds under mortgage loan commitments. The amounts of these mortgage loan commitments were $377 million and $247 million at December 31, 2023 and 2022, respectively.
Commitments to Fund Partnership Investments, Bank Credit Facilities and Private Corporate Bond Investments
The Company commits to fund partnership investments and to lend funds under bank credit facilities and private corporate bond investments. The amounts of these unfunded commitments were $1.4 billion and $1.9 billion at December 31, 2023 and 2022, respectively.
194
Brighthouse Financial, Inc.
Notes to the Consolidated Financial Statements (continued)
18. Contingencies, Commitments and Guarantees (continued)
Guarantees
In the normal course of its business, the Company has provided certain indemnities, guarantees and commitments to third parties such that it may be required to make payments now or in the future. In the context of acquisition, disposition, investment and other transactions, the Company has provided indemnities and guarantees, including those related to tax, environmental and other specific liabilities and other indemnities and guarantees that are triggered by, among other things, breaches of representations, warranties or covenants provided by the Company. In addition, in the normal course of business, the Company provides indemnifications to counterparties in contracts with triggers similar to the foregoing, as well as for certain other liabilities, such as third-party lawsuits. These obligations are often subject to time limitations that vary in duration, including contractual limitations and those that arise by operation of law, such as applicable statutes of limitation. In some cases, the maximum potential obligation under the indemnities and guarantees is subject to a contractual limitation ranging from less than $1 million to $92 million, with a cumulative maximum of $98 million, while in other cases such limitations are not specified or applicable. Since certain of these obligations are not subject to limitations, the Company does not believe that it is possible to determine the maximum potential amount that could become due under these guarantees in the future. Management believes that it is unlikely the Company will have to make any material payments under these indemnities, guarantees, or commitments.
In addition, the Company indemnifies its directors and officers as provided in its charters and bylaws. Also, the Company indemnifies its agents for liabilities incurred as a result of their representation of the Company’s interests. Since these indemnities are generally not subject to limitation with respect to duration or amount, the Company does not believe that it is possible to determine the maximum potential amount that could become due under these indemnities in the future.
The Company’s recorded liabilities were $1
195
Brighthouse Financial, Inc.
Notes to the Consolidated Financial Statements (continued)
As described in Note 1, the Company adopted LDTI effective January 1, 2023. LDTI resulted in significant changes to the measurement, presentation and disclosure requirements for long-duration insurance contracts. The transition date was January 1, 2021. MRB changes were required to be applied on a retrospective basis, while the changes for insurance liability assumption updates and DAC amortization were applied to existing carrying amounts on the transition date. The unaudited quarterly results of operations for 2023 and 2022, which include the impacts of LDTI, are summarized in the table below:
| Three Months Ended | |||||||||||||||||||||||
| March 31, | June 30, | September 30, | December 31, | ||||||||||||||||||||
| (In millions, except per share data) | |||||||||||||||||||||||
| 2023 | |||||||||||||||||||||||
| Total revenues | $ | $ | $ | $ | |||||||||||||||||||
| Total expenses | $ | $ | $ | $ | |||||||||||||||||||
| Net income (loss) | $ | ( | $ | ( | $ | $ | ( | ||||||||||||||||
| Less: Net income (loss) attributable to noncontrolling interests | $ | $ | $ | $ | |||||||||||||||||||
| Net income (loss) attributable to Brighthouse Financial, Inc. | $ | ( | $ | ( | $ | $ | ( | ||||||||||||||||
| Less: Preferred stock dividends | $ | $ | $ | $ | |||||||||||||||||||
| Net income (loss) available to Brighthouse Financial, Inc.’s common shareholders | $ | ( | $ | ( | $ | $ | ( | ||||||||||||||||
| Basic earnings per common share (1) | $ | ( | $ | ( | $ | $ | ( | ||||||||||||||||
| Diluted earnings per common share (1) | $ | ( | $ | ( | $ | $ | ( | ||||||||||||||||
| 2022 | |||||||||||||||||||||||
| Total revenues | $ | $ | $ | $ | ( | ||||||||||||||||||
| Total expenses | $ | $ | $ | $ | ( | ||||||||||||||||||
| Net income (loss) | $ | $ | $ | $ | |||||||||||||||||||
| Less: Net income (loss) attributable to noncontrolling interests | $ | $ | $ | $ | |||||||||||||||||||
| Net income (loss) attributable to Brighthouse Financial, Inc. | $ | $ | $ | $ | |||||||||||||||||||
| Less: Preferred stock dividends | $ | $ | $ | $ | |||||||||||||||||||
| Net income (loss) available to Brighthouse Financial, Inc.’s common shareholders | $ | $ | $ | $ | |||||||||||||||||||
| Basic earnings per common share (1) | $ | $ | $ | $ | |||||||||||||||||||
| Diluted earnings per common share (1) | $ | $ | $ | $ | |||||||||||||||||||
_______________
(1)See Note 17 for additional information on the calculation of EPS.
20. Subsequent Event
Preferred Stock Dividend
On February 15, 2024, BHF declared a dividend of $412.50 per share on its Series A Preferred Stock, $421.88 per share on its Series B Preferred Stock, $335.94 per share on its Series C Preferred Stock and $289.06 per share on its Series D Preferred Stock for a total of $26 million, which will be paid on March 25, 2024 to stockholders of record as of March 10, 2024.
196
Brighthouse Financial, Inc.
Schedule I
Consolidated Summary of Investments —
Other Than Investments in Related Parties
December 31, 2023
(In millions)
| Types of Investments | Cost or Amortized Cost (1) | Estimated Fair Value | Amount at Which Shown on Balance Sheet | ||||||||||||||
| Fixed maturity securities: | |||||||||||||||||
| Bonds: | |||||||||||||||||
| U.S. government and agency | $ | $ | $ | ||||||||||||||
| State and political subdivision | |||||||||||||||||
| Public utilities | |||||||||||||||||
| Foreign government | |||||||||||||||||
| All other corporate bonds | |||||||||||||||||
| Total bonds | |||||||||||||||||
| Mortgage-backed and asset-backed securities | |||||||||||||||||
| Redeemable preferred stock | |||||||||||||||||
| Total fixed maturity securities | |||||||||||||||||
| Equity securities: | |||||||||||||||||
| Non-redeemable preferred stock | |||||||||||||||||
| Common stock: | |||||||||||||||||
| Industrial, miscellaneous and all other | |||||||||||||||||
| Banks, trust and insurance companies | |||||||||||||||||
| Public utilities | |||||||||||||||||
| Total equity securities | |||||||||||||||||
| Mortgage loans | |||||||||||||||||
| Policy loans | |||||||||||||||||
| Limited partnerships and LLCs | |||||||||||||||||
| Short-term investments | |||||||||||||||||
| Other invested assets | |||||||||||||||||
| Total investments | $ | $ | |||||||||||||||
_______________
(1)Cost or amortized cost for fixed maturity securities represents original cost reduced by impairments that are charged to earnings and adjusted for amortization of premiums or accretion of discounts; for mortgage loans, cost represents original cost reduced by repayments and valuation allowances and adjusted for amortization of premiums or accretion of discounts; for equity securities, cost represents original cost; for limited partnerships and LLCs, cost represents original cost adjusted for equity in earnings and distributions.
197
Brighthouse Financial, Inc.
Schedule II
Condensed Financial Information
(Parent Company Only)
December 31, 2023 and 2022
(In millions, except share and per share data)
| 2023 | 2022 | |||||||||||||
| Condensed Balance Sheets | ||||||||||||||
| Assets | ||||||||||||||
| Investments: | ||||||||||||||
Fixed maturity securities available-for-sale, at estimated fair value (amortized cost: $ | $ | $ | ||||||||||||
| Short-term investments, principally at estimated fair value | ||||||||||||||
| Investment in subsidiary | ||||||||||||||
| Total investments | ||||||||||||||
| Cash and cash equivalents | ||||||||||||||
| Premiums and other receivables | ||||||||||||||
| Current income tax recoverable | ||||||||||||||
| Deferred income tax asset | ||||||||||||||
| Other assets | ||||||||||||||
| Total assets | $ | $ | ||||||||||||
| Liabilities and Stockholders’ Equity | ||||||||||||||
| Liabilities | ||||||||||||||
| Long-term and short-term debt | $ | $ | ||||||||||||
| Deferred income tax liability | ||||||||||||||
| Other liabilities | ||||||||||||||
| Total liabilities | ||||||||||||||
| Stockholders’ Equity | ||||||||||||||
Preferred stock, par value $ | ||||||||||||||
Common stock, par value $ | ||||||||||||||
| Additional paid-in capital | ||||||||||||||
| Retained earnings (deficit) | ( | ( | ||||||||||||
Treasury stock, at cost; | ( | ( | ||||||||||||
| Accumulated other comprehensive income (loss) | ( | ( | ||||||||||||
| Total stockholders’ equity | ||||||||||||||
| Total liabilities and stockholders’ equity | $ | $ | ||||||||||||
See accompanying notes to the condensed financial information.
198
Brighthouse Financial, Inc.
Schedule II
Condensed Financial Information (continued)
(Parent Company Only)
For the Years Ended December 31, 2023, 2022 and 2021
(In millions)
| 2023 | 2022 | 2021 | ||||||||||||||||||
| Condensed Statements of Operations | ||||||||||||||||||||
| Revenues | ||||||||||||||||||||
| Net investment income | $ | $ | $ | |||||||||||||||||
| Other revenues | ( | |||||||||||||||||||
| Net investment gains (losses) | ( | |||||||||||||||||||
| Net derivative gains (losses) | ( | |||||||||||||||||||
| Total revenues | ||||||||||||||||||||
| Expenses | ||||||||||||||||||||
| Debt repayment costs | ||||||||||||||||||||
| Other expenses | ||||||||||||||||||||
| Total expenses | ||||||||||||||||||||
| Income (loss) before provision for income tax and equity in earnings (losses) of subsidiaries | ( | ( | ( | |||||||||||||||||
| Provision for income tax expense (benefit) | ( | ( | ( | |||||||||||||||||
| Income (loss) before equity in earnings (losses) of subsidiaries | ( | ( | ( | |||||||||||||||||
| Equity in earnings (losses) of subsidiaries | ( | |||||||||||||||||||
| Net income (loss) | ( | |||||||||||||||||||
| Less: Preferred stock dividends | ||||||||||||||||||||
| Net income (loss) available to common shareholders | $ | ( | $ | $ | ||||||||||||||||
| Comprehensive income (loss) | $ | ( | $ | ( | $ | ( | ||||||||||||||
See accompanying notes to the condensed financial information.
199
Brighthouse Financial, Inc.
Schedule II
Condensed Financial Information (continued)
(Parent Company Only)
For the Years Ended December 31, 2023, 2022 and 2021
(In millions)
| 2023 | 2022 | 2021 | ||||||||||||||||||
| Condensed Statements of Cash Flows | ||||||||||||||||||||
| Cash flows from operating activities | ||||||||||||||||||||
| Net income (loss) | $ | ( | $ | $ | ||||||||||||||||
| Equity in (earnings) losses of subsidiaries | ( | ( | ||||||||||||||||||
| Distributions from subsidiary | ||||||||||||||||||||
| Other, net | ( | |||||||||||||||||||
| Net cash provided by (used in) operating activities | ( | |||||||||||||||||||
| Cash flows from investing activities | ||||||||||||||||||||
| Sales, maturities and repayments of fixed maturity securities | ||||||||||||||||||||
| Purchases of fixed maturity securities | ( | |||||||||||||||||||
| Cash received in connection with freestanding derivatives | ||||||||||||||||||||
| Cash paid in connection with freestanding derivatives | ( | ( | ( | |||||||||||||||||
| Net change in short-term investments | ||||||||||||||||||||
| Net cash provided by (used in) investing activities | ||||||||||||||||||||
| Cash flows from financing activities | ||||||||||||||||||||
| Long-term and short-term debt issued | ||||||||||||||||||||
| Long-term and short-term debt repaid | ( | ( | ( | |||||||||||||||||
| Debt repayment costs | ( | |||||||||||||||||||
| Preferred stock issued, net of issuance costs | ||||||||||||||||||||
| Dividends on preferred stock | ( | ( | ( | |||||||||||||||||
| Treasury stock acquired in connection with share repurchases | ( | ( | ( | |||||||||||||||||
| Financing element on certain derivative instruments and other derivative related transactions, net | ( | ( | ||||||||||||||||||
| Other, net | ( | ( | ( | |||||||||||||||||
| Net cash provided by (used in) financing activities | ( | ( | ( | |||||||||||||||||
| Change in cash and cash equivalents | ( | |||||||||||||||||||
| Cash and cash equivalents, beginning of year | ||||||||||||||||||||
| Cash and cash equivalents, end of year | $ | $ | $ | |||||||||||||||||
| Supplemental disclosures of cash flow information | ||||||||||||||||||||
| Net cash paid (received) for: | ||||||||||||||||||||
| Interest | $ | $ | $ | |||||||||||||||||
| Income tax | $ | ( | $ | ( | $ | ( | ||||||||||||||
See accompanying notes to the condensed financial information.
200
Brighthouse Financial, Inc.
Schedule II
Condensed Financial Information (continued)
(Parent Company Only)
1. Basis of Presentation
The condensed financial information of Brighthouse Financial, Inc. (the “Parent Company” or “BHF”) should be read in conjunction with the consolidated financial statements of Brighthouse Financial, Inc. and its subsidiaries and the notes thereto (the “Consolidated Financial Statements”). These condensed unconsolidated financial statements reflect the results of operations, financial position and cash flows for Brighthouse Financial, Inc. Investments in subsidiaries are accounted for using the equity method of accounting.
Certain amounts in the prior years’ condensed financial statements of the Parent Company have changed. See Note 1 of the Notes to the Consolidated Financial Statements for information regarding the adoption of new guidance on long-duration contracts as of January 1, 2023.
The preparation of these condensed unconsolidated financial statements in conformity with GAAP requires management to adopt accounting policies and make certain estimates and assumptions. The most important of these estimates and assumptions relate to the fair value measurements, identifiable intangible assets and the provision for potential losses that may arise from litigation and regulatory proceedings and tax audits, which may affect the amounts reported in the condensed unconsolidated financial statements and accompanying notes. Actual results could differ from these estimates.
2. Investment in Subsidiary
During the year ended December 31, 2023, BHF received cash distributions of $350 million and non-cash distributions of $100 million from Brighthouse Holdings, LLC (“BH Holdings”) and did not make any capital contributions to BH Holdings. Cash distributions received during the year ended December 31, 2023 primarily related to $266 million of ordinary cash dividends paid by Brighthouse Life Insurance Company to BH Holdings. The non-cash distributions received related to reductions of short-term intercompany loans of $50 million from Brighthouse Services, LLC to BH Holdings (which was then contributed to BHF) and an additional $50 million from BH Holdings to BHF.
During the year ended December 31, 2022, BHF received non-cash distributions of $350 million from BH Holdings and did not make any capital contributions to BH Holdings. The non-cash distributions received related to reductions of short-term intercompany loans of $250 million from Brighthouse Services, LLC to BH Holdings (which was then contributed to BHF) and an additional $100 million from BH Holdings to BHF.
During the year ended December 31, 2021, BHF received cash distributions of $310 million from BH Holdings and did not make any capital contributions to BH Holdings. Distributions received during the year ended December 31, 2021 primarily related to $550 million of ordinary cash dividends paid by Brighthouse Life Insurance Company to BH Holdings.
3. Long-term and Short-term Debt
Long-term and short-term debt outstanding was as follows at:
| December 31, | ||||||||||||||||||||||||||
| Stated Interest Rate | Maturity | 2023 | 2022 | |||||||||||||||||||||||
| (In millions) | ||||||||||||||||||||||||||
| Senior notes — unaffiliated | 2027 | $ | $ | |||||||||||||||||||||||
| Senior notes — unaffiliated | 2030 | |||||||||||||||||||||||||
| Senior notes — unaffiliated | 2047 | |||||||||||||||||||||||||
| Senior notes — unaffiliated | 2051 | |||||||||||||||||||||||||
| Junior subordinated debentures — unaffiliated | 2058 | |||||||||||||||||||||||||
| Total long-term debt (1) | ||||||||||||||||||||||||||
| Short-term intercompany loans | ||||||||||||||||||||||||||
| Total long-term and short-term debt (1) | $ | $ | ||||||||||||||||||||||||
_______________
(1)Includes unamortized debt issuance costs, discounts and premiums, as applicable, totaling net $30 million and $32 million for the senior notes and junior subordinated debentures on a combined basis at December 31, 2023 and 2022, respectively.
201
Brighthouse Financial, Inc.
Schedule II
Condensed Financial Information (continued)
(Parent Company Only)
The aggregate maturities of long-term and short-term debt at December 31, 2023 were $727 million in 2024, $0 757 million in 2027, $0 in 2028, and $2.4 billion thereafter.
Interest expense related to long-term and short-term debt of $178 million, $155 million and $159 million for the years ended December 31, 2023, 2022 and 2021, respectively, is included in other expenses.
Senior Notes and Junior Subordinated Debentures
See Note 12 of the Notes to the Consolidated Financial Statements for information regarding the unaffiliated senior notes and junior subordinated debentures.
Credit Facilities
See Note 12 of the Notes to the Consolidated Financial Statements for information regarding BHF’s credit facilities.
Short-term Intercompany Loans
BHF, as borrower, has a short-term intercompany loan agreement with certain of its non-insurance subsidiaries, as lenders, for the purposes of facilitating the management of the available cash of the borrower and the lenders on a short-term and consolidated basis. Such intercompany loan agreement allows management to optimize the efficient use of and maximize the yield on cash between BHF and its subsidiary lenders. Each loan entered into under this intercompany loan agreement has a term not more than 364 days and bears interest on the unpaid principal amount at a variable rate, payable monthly. During the years ended December 31, 2023, 2022 and 2021, BHF borrowed $753 million, $1.0 billion and $1.1 billion, respectively, from certain of its non-insurance subsidiaries and repaid $439 million, $811 million and $805 million of such borrowings during the years ended December 31, 2023, 2022 and 2021, respectively. The weighted average interest rate on short-term intercompany loans outstanding at December 31, 2023, 2022 and 2021 was 4.73 %, 3.73 % and 0.05 %, respectively.
Intercompany Liquidity Facilities
BHF has established intercompany liquidity facilities with certain of its insurance and non-insurance subsidiaries to provide short-term liquidity within and across the combined group of companies. Under these facilities, which are comprised of a series of revolving loan agreements among BHF and its participating subsidiaries, each company may lend to or borrow from each other, subject to certain maximum limits for a term of up to 364 days, depending on the agreement. During the years ended December 31, 2023, 2022 and 2021, there were no
202
Brighthouse Financial, Inc.
Schedule III
Consolidated Supplementary Insurance Information
December 31, 2023 and 2022
(In millions)
| Segment | DAC and VOBA | Future Policy Benefits and Other Policy-Related Balances | Policyholder Account Balances | Unearned Premiums (1)(2) | Unearned Revenue (1) | |||||||||||||||||||||||||||
| 2023 | ||||||||||||||||||||||||||||||||
| Annuities | $ | $ | $ | $ | $ | |||||||||||||||||||||||||||
| Life | ||||||||||||||||||||||||||||||||
| Run-off | ||||||||||||||||||||||||||||||||
| Corporate & Other | ||||||||||||||||||||||||||||||||
| Total | $ | $ | $ | $ | $ | |||||||||||||||||||||||||||
| 2022 | ||||||||||||||||||||||||||||||||
| Annuities | $ | $ | $ | $ | $ | |||||||||||||||||||||||||||
| Life | ||||||||||||||||||||||||||||||||
| Run-off | ||||||||||||||||||||||||||||||||
| Corporate & Other | ||||||||||||||||||||||||||||||||
| Total | $ | $ | $ | $ | $ | |||||||||||||||||||||||||||
_______________
(1)Amounts are included in the future policy benefits and other policy-related balances column.
(2)Includes premiums received in advance.
203
Brighthouse Financial, Inc.
Schedule III
Consolidated Supplementary Insurance Information (continued)
December 31, 2023, 2022 and 2021
(In millions)
| Segment | Premiums and Universal Life and Investment-Type Product Policy Fees | Net Investment Income (1) | Policyholder Benefits and Claims and Interest Credited to Policyholder Account Balances | Amortization of DAC and VOBA | Other Expenses | |||||||||||||||||||||||||||
| 2023 | ||||||||||||||||||||||||||||||||
| Annuities | $ | $ | $ | $ | $ | |||||||||||||||||||||||||||
| Life | ||||||||||||||||||||||||||||||||
| Run-off | ||||||||||||||||||||||||||||||||
| Corporate & Other | ||||||||||||||||||||||||||||||||
| Total | $ | $ | $ | $ | $ | |||||||||||||||||||||||||||
| 2022 | ||||||||||||||||||||||||||||||||
| Annuities | $ | $ | $ | $ | $ | |||||||||||||||||||||||||||
| Life | ||||||||||||||||||||||||||||||||
| Run-off | ||||||||||||||||||||||||||||||||
| Corporate & Other | ||||||||||||||||||||||||||||||||
| Total | $ | $ | $ | $ | $ | |||||||||||||||||||||||||||
| 2021 | ||||||||||||||||||||||||||||||||
| Annuities | $ | $ | $ | $ | $ | |||||||||||||||||||||||||||
| Life | ||||||||||||||||||||||||||||||||
| Run-off | ||||||||||||||||||||||||||||||||
| Corporate & Other | ||||||||||||||||||||||||||||||||
| Total | $ | $ | $ | $ | $ | |||||||||||||||||||||||||||
_______________
(1)See Note 3 of the Notes to the Consolidated Financial Statements for the basis of allocation of net investment income.
204
Brighthouse Financial, Inc.
Schedule IV
Consolidated Reinsurance
December 31, 2023, 2022 and 2021
(Dollars in millions)
| Gross Amount | Ceded | Assumed | Net Amount | % Amount Assumed to Net | ||||||||||||||||||||||||||||
| 2023 | ||||||||||||||||||||||||||||||||
| Life insurance in-force | $ | $ | $ | $ | ||||||||||||||||||||||||||||
| Insurance premium | ||||||||||||||||||||||||||||||||
| Life insurance (1) | $ | $ | $ | $ | ||||||||||||||||||||||||||||
| Accident & health insurance | ||||||||||||||||||||||||||||||||
| Total insurance premium | $ | $ | $ | $ | ||||||||||||||||||||||||||||
| 2022 | ||||||||||||||||||||||||||||||||
| Life insurance in-force | $ | $ | $ | $ | ||||||||||||||||||||||||||||
| Insurance premium | ||||||||||||||||||||||||||||||||
| Life insurance (1) | $ | $ | $ | $ | ||||||||||||||||||||||||||||
| Accident & health insurance | ||||||||||||||||||||||||||||||||
| Total insurance premium | $ | $ | $ | $ | ||||||||||||||||||||||||||||
| 2021 | ||||||||||||||||||||||||||||||||
| Life insurance in-force | $ | $ | $ | $ | ||||||||||||||||||||||||||||
| Insurance premium | ||||||||||||||||||||||||||||||||
| Life insurance (1) | $ | $ | $ | ( | $ | ( | ||||||||||||||||||||||||||
| Accident & health insurance | ||||||||||||||||||||||||||||||||
| Total insurance premium | $ | $ | $ | ( | $ | ( | ||||||||||||||||||||||||||
_______________
(1)Includes annuities with life contingencies.
205
Item 9. Changes in and Disagreements with Accountants on Accounting and Financial Disclosure
None.
Item 9A. Controls and Procedures
Evaluation of Disclosure Controls and Procedures
Management, with the participation of the Chief Executive Officer and the Chief Financial Officer, has evaluated the effectiveness of the design and operation of the Company’s disclosure controls and procedures as defined in Rules 13a-15(e) and 15d-15(e) under the Exchange Act, as of the end of the period covered by this report. Based on that evaluation, the Chief Executive Officer and the Chief Financial Officer have concluded that these disclosure controls and procedures were effective as of December 31, 2023.
Changes in Internal Control Over Financial Reporting
MetLife provides certain services to the Company on a transitional basis through services agreements. The Company continues to change business processes, implement systems and establish new third-party arrangements. We consider these in aggregate to be material changes in our internal control over financial reporting.
Other than as noted above, there were no changes to the Company’s internal control over financial reporting (as defined in Rules 13a-15(f) and 15d-15(f) under the Exchange Act) that occurred during the quarter ended December 31, 2023 that have materially affected, or are reasonably likely to materially affect, these internal controls over financial reporting.
Management’s Annual Report on Internal Control Over Financial Reporting
Management of Brighthouse Financial, Inc. is responsible for establishing and maintaining adequate internal control over financial reporting. In fulfilling this responsibility, estimates and judgments by management are required to assess the expected benefits and related costs of control procedures. The objectives of internal control include providing management with reasonable, but not absolute, assurance that assets are safeguarded against loss from unauthorized use or disposition, and that transactions are executed in accordance with management’s authorization and recorded properly to permit the preparation of consolidated financial statements in conformity with GAAP.
Due to its inherent limitations, internal control over financial reporting may not prevent or detect misstatements. Also, projections of any evaluation of effectiveness to future periods are subject to the risk that controls may become inadequate because of changes in conditions, or that the degree of compliance with the policies or procedures may deteriorate. Management has completed an assessment of the effectiveness of the Company’s internal control over financial reporting as of December 31, 2023. In making the assessment, management used the criteria set forth in “Internal Control - Integrated Framework” promulgated by the Committee of Sponsoring Organizations of the Treadway Commission.
Based upon the assessment performed under that framework, management has maintained and concluded that the Company’s internal control over financial reporting was effective as of December 31, 2023.
Attestation Report of the Company’s Registered Public Accounting Firm
The Company’s independent registered public accounting firm, Deloitte & Touche LLP, has issued their attestation report on management’s internal control over financial reporting which is set forth below.
206
REPORT OF INDEPENDENT REGISTERED PUBLIC ACCOUNTING FIRM
To the stockholders and the Board of Directors of Brighthouse Financial, Inc.
Opinion on Internal Control over Financial Reporting
We have audited the internal control over financial reporting of Brighthouse Financial, Inc. and subsidiaries (the “Company”) as of December 31, 2023, based on criteria established in Internal Control — Integrated Framework (2013) issued by the Committee of Sponsoring Organizations of the Treadway Commission (COSO). In our opinion, the Company maintained, in all material respects, effective internal control over financial reporting as of December 31, 2023, based on criteria established in Internal Control — Integrated Framework (2013) issued by COSO.
We have also audited, in accordance with the standards of the Public Company Accounting Oversight Board (United States) (PCAOB) the Consolidated Financial Statements, Notes and Schedules as of and for the year ended December 31, 2023, of the Company and our report dated February 22, 2024, expressed an unqualified opinion on those financial statements.
Basis for Opinion
The Company’s management is responsible for maintaining effective internal control over financial reporting and for its assessment of the effectiveness of internal control over financial reporting, included in the accompanying Management’s Annual Report on Internal Control Over Financial Reporting. Our responsibility is to express an opinion on the Company’s internal control over financial reporting based on our audit. We are a public accounting firm registered with the PCAOB and are required to be independent with respect to the Company in accordance with the U.S. federal securities laws and the applicable rules and regulations of the Securities and Exchange Commission and the PCAOB.
We conducted our audit in accordance with the standards of the PCAOB. Those standards require that we plan and perform the audit to obtain reasonable assurance about whether effective internal control over financial reporting was maintained in all material respects. Our audit included obtaining an understanding of internal control over financial reporting, assessing the risk that a material weakness exists, testing and evaluating the design and operating effectiveness of internal control based on the assessed risk, and performing such other procedures as we considered necessary in the circumstances. We believe that our audit provides a reasonable basis for our opinion.
Definition and Limitations of Internal Control over Financial Reporting
A company’s internal control over financial reporting is a process designed to provide reasonable assurance regarding the reliability of financial reporting and the preparation of financial statements for external purposes in accordance with generally accepted accounting principles. A company’s internal control over financial reporting includes those policies and procedures that (1) pertain to the maintenance of records that, in reasonable detail, accurately and fairly reflect the transactions and dispositions of the assets of the company; (2) provide reasonable assurance that transactions are recorded as necessary to permit preparation of financial statements in accordance with generally accepted accounting principles, and that receipts and expenditures of the company are being made only in accordance with authorizations of management and directors of the company; and (3) provide reasonable assurance regarding prevention or timely detection of unauthorized acquisition, use, or disposition of the company’s assets that could have a material effect on the financial statements.
Because of its inherent limitations, internal control over financial reporting may not prevent or detect misstatements. Also, projections of any evaluation of effectiveness to future periods are subject to the risk that controls may become inadequate because of changes in conditions, or that the degree of compliance with the policies or procedures may deteriorate.
/s/ DELOITTE & TOUCHE LLP
February 22, 2024
207
Item 9B. Other Information
Director and Officer 10b5-1 Plans
During the year ended December 31, 2023, none of the Company’s directors or officers (as defined in Rule 16a-1(f) of the Exchange Act) adopted terminated
Item 9C. Disclosure Regarding Foreign Jurisdictions that Prevent Inspections
Not applicable.
PART III
Item 10. Directors, Executive Officers and Corporate Governance
Certain of the information required by this Item pertaining to Executive Officers appears in “Business — Information About Our Executive Officers” in this Annual Report on Form 10-K. The other information required by this Item will be set forth in the 2024 Proxy Statement, which information is hereby incorporated by reference.
Item 11. Executive Compensation
The information required by this Item will be set forth in the 2024 Proxy Statement, which information is hereby incorporated by reference.
Item 12. Security Ownership of Certain Beneficial Owners and Management and Related Stockholder Matters
The information required by this Item will be set forth in the 2024 Proxy Statement, which information is hereby incorporated by reference.
Item 13. Certain Relationships, Related Person Transactions and Director Independence
The information required by this Item will be set forth in the 2024 Proxy Statement, which information is hereby incorporated by reference.
Item 14. Principal Accountant Fees and Services
The information about aggregate fees billed to us by our principal accountant, Deloitte & Touche LLP (PCAOB ID No. 34 ), will be set forth in the 2024 Proxy Statement and is incorporated herein by reference.
PART IV
Item 15. Exhibits and Financial Statement Schedules
The following documents are filed as part of this report:
1.Financial Statements: See “Index to Consolidated Financial Statements, Notes and Schedules.”
2.Financial Statement Schedules: See “Index to Consolidated Financial Statements, Notes and Schedules.”
3.Exhibits: See “Exhibit Index.”
Item 16. Form 10-K Summary
None.
208
GLOSSARY
Glossary of Selected Financial Terms
| Account value | The amount of money in a policyholder’s account. The value increases with additional premiums and investment gains, and it decreases with withdrawals, investment losses and fees. | |||||||
| Adjusted earnings | See “Management’s Discussion and Analysis of Financial Condition and Results of Operations — Non-GAAP and Other Financial Disclosures.” | |||||||
| Alternative investments | General account investments in other limited partnership interests. | |||||||
| Assets under management (“AUM”) | General account investments and separate account assets. | |||||||
| Conditional tail expectation (“CTE”) | A statistical tail risk measure used to assess the adequacy of assets supporting variable annuity contract liabilities, which is calculated as the average amount of total assets required to satisfy obligations over the life of the contract or policy in the worst “x%” of scenarios. Represented as CTE (100 less x). Example: CTE70 represents the worst thirty percent of scenarios and CTE98 represents the worst two percent of scenarios. | |||||||
| Credit loss on investments | The difference between the amortized cost of the security and the present value of the cash flows expected to be collected that is attributed to credit risk, is recognized as an allowance on the balance sheet with a corresponding adjustment to earnings, or if deemed uncollectible, as a permanent write-off of book value. | |||||||
| Deferred policy acquisition cost (“DAC”) | Represents the incremental costs related directly to the successful acquisition of new and renewal insurance and annuity contracts and which have been deferred on the balance sheet as an asset. | |||||||
| Deferred sales inducements (“DSI”) | Represent amounts that are credited to a policyholder’s account balance that are higher than the expected crediting rates on similar contracts without such an inducement and that are an incentive to purchase a contract and also meet the accounting criteria to be deferred as an asset that is amortized over the life of the contract. | |||||||
| General account assets | All insurance company assets not allocated to separate accounts. | |||||||
| Invested assets | General account investments in fixed maturity securities, equity securities, mortgage loans, policy loans, other limited partnership interests, real estate limited partnerships and limited liability companies, short-term investments and other invested assets. | |||||||
| Investment Hedge Adjustments | Earned income and amortization of premium on derivatives that are hedges of investments or that are used to replicate certain investments, but do not qualify for hedge accounting treatment. | |||||||
| Market Value Adjustments | Amounts associated with the change in fair value of the crediting rate on experience-rated contracts | |||||||
| Net amount at risk (“NAR”) | Represents the difference between a claim amount payable if a specific event occurs and the amount set aside to support the claim. The calculation of NAR can differ by policy type or guarantee. | |||||||
| Net investment spread | See “Management’s Discussion and Analysis of Financial Condition and Results of Operations — Non-GAAP and Other Financial Disclosures.” | |||||||
| Normalized statutory earnings | See “Management’s Discussion and Analysis of Financial Condition and Results of Operations — Liquidity and Capital Resources — The Parent Company — Liquidity and Capital — Normalized Statutory Earnings.” | |||||||
| Reinsurance | Insurance that an insurance company buys for its own protection. Reinsurance enables an insurance company to expand its capacity, stabilize its underwriting results, or finance its expanding volume. | |||||||
| Risk-based capital (“RBC”) ratio | The risk-based capital ratio is a method of measuring an insurance company’s capital, taking into consideration its relative size and risk profile, in order to ensure compliance with minimum regulatory capital requirements set by the National Association of Insurance Commissioners. When referred to as “combined,” represents that of our insurance subsidiaries as a whole. | |||||||
| Total adjusted capital (“TAC”) | Total adjusted capital primarily consists of statutory capital and surplus, as well as the statutory asset valuation reserve. When referred to as “combined,” represents that of our insurance subsidiaries as a whole. | |||||||
| Value of business acquired (“VOBA”) | Present value of projected future gross profits from in-force policies of acquired businesses. | |||||||
209
Glossary of Product Terms
| Accumulation phase | The phase of a variable annuity contract during which assets accumulate based on the policyholder’s lump sum payment or periodic deposits and reinvested interest, capital gains and dividends that are generally tax-deferred. | |||||||
| Annuitant | The person who receives annuity payments or the person whose life expectancy determines the amount of variable annuity payments upon annuitization of a life contingent annuity. | |||||||
| Annuities | Long-term, tax-deferred investments designed to help investors save for retirement. | |||||||
| Annuitization | The process of converting an annuity investment into a series of periodic income payments, generally for life. | |||||||
| Annuity sales | Annuity sales consist of 100 percent of direct statutory premiums, except for fixed index annuity sales, which represents 100% of gross sales on directly written business and the proportion of assumed gross sales under reinsurance agreements. Annuity sales exclude certain internal exchanges. These sales statistics do not correspond to revenues under GAAP, but are used as relevant measures of business activity. | |||||||
| Benefit Base | A notional amount (not actual cash value) used to calculate the owner’s guaranteed benefits within an annuity contract. The death benefit and living benefit within the same contract may not have the same Benefit Base. | |||||||
| Cash surrender value | The amount an insurance company pays (minus any surrender charge) to the variable annuity owner when the contract is voluntarily terminated prematurely. | |||||||
| Deferred annuity | An annuity purchased with premiums paid either over a period of years or as a lump sum, for which savings accumulate prior to annuitization or surrender, and upon annuitization, such savings are exchanged for either a future lump sum payment or periodic payments for a specified period of time or for a lifetime. | |||||||
| Deferred income annuity (“DIA”) | An annuity that provides a pension-like stream of income payments after a specified deferral period. | |||||||
| Dollar-for-dollar withdrawal | A method of calculating the reduction of a variable annuity Benefit Base after a withdrawal in which the benefit is reduced by one dollar for every dollar withdrawn. | |||||||
| Enhanced death benefit (“EDB”) | An optional benefit that locks in investment gains annually, or every few years, or pays a minimum stated interest rate on purchase payments to the beneficiary. | |||||||
| Fixed annuity | An annuity that guarantees a set annual rate of return with interest at rates we determine, subject to specified minimums. Credited interest rates are guaranteed not to change for certain limited periods of time. | |||||||
| Future policy benefits | Future policy benefits for the annuities business are comprised mainly of liabilities for life contingent income annuities, and liabilities for the variable annuity guaranteed minimum benefits accounted for as insurance. | |||||||
| Guaranteed minimum accumulation benefits (“GMAB”) | An optional benefit (available for an additional cost) which entitles an annuitant to a minimum payment, typically in a lump sum, after a set period of time, typically referred to as the accumulation period. The minimum payment is based on the Benefit Base, which could be greater than the underlying account value. | |||||||
| Guaranteed minimum death benefits (“GMDB”) | An optional benefit (available for an additional cost) that guarantees an annuitant’s beneficiaries are entitled to a minimum payment based on the Benefit Base, which could be greater than the underlying account value, upon the death of the annuitant. | |||||||
| Guaranteed minimum income benefits (“GMIB”) | An optional benefit (available for an additional cost) where an annuitant is entitled to annuitize the policy and receive a minimum payment stream based on the Benefit Base, which could be greater than the underlying account value. | |||||||
| Guaranteed minimum living benefits (“GMLB”) | A reference to all forms of guaranteed minimum living benefits, including GMIBs, GMWBs and GMABs (does not include GMDBs). | |||||||
| Guaranteed minimum withdrawal benefits (“GMWB”) | An optional benefit (available for an additional cost) where an annuitant is entitled to withdraw a maximum amount of their Benefit Base each year, for which cumulative payments to the annuitant could be greater than the underlying account value. | |||||||
| Guaranteed minimum benefits (“GMxB”) | A general reference to all forms of guaranteed minimum benefits, inclusive of living benefits and death benefits. | |||||||
210
| Immediate annuity | An annuity for which the owner pays a lump sum payment and receives periodic payments immediately or soon after purchase. Single premium immediate annuities (“SPIAs”) are single premium annuity products that provide a guaranteed level of income to the owner generally for a specified number of years or for the life of the annuitant. | |||||||
| Index-linked annuity | An annuity that provides for asset accumulation and asset distribution needs with an ability to share in the upside from certain financial markets such as equity indices, or an interest rate benchmark. The customer’s account value can grow or decline due to various external financial market indices performance. | |||||||
| Life insurance sales | Life insurance sales consist of 100 percent of annualized new premium for term life, first-year paid premium for whole life, universal life, and variable universal life, and total paid premium for indexed universal life. We exclude company-sponsored internal exchanges, corporate-owned life insurance, bank-owned life insurance, and private placement variable universal life. | |||||||
| Living benefits | Optional benefits (available at an additional cost) that guarantee that the owner will get back at least his original investment when the money is withdrawn. | |||||||
| Mortality and expense risk fees (“M&E Fees”) | Fees charged by insurance companies to compensate for the risk they take by issuing variable annuity contracts. | |||||||
| Net flows | Net change in customer account balances in a period including, but not limited to, new sales, full or partial exits and the net impact of clients utilizing or withdrawing their funds. It excludes the impact of markets on account balances. | |||||||
| Period certain annuity | An annuity that guarantees payment to the annuitant for a specified period of time and to the beneficiary if the annuitant dies before the period ends. | |||||||
| Policyholder account balances | Annuities: Policyholder account balances are held for fixed deferred annuities, the fixed account portion of variable annuities, and non-life contingent income annuities. Interest is credited to the policyholder’s account at interest rates we determine which are influenced by current market rates, subject to specified minimums. Life Insurance Policies: Policyholder account balances are held for retained asset accounts, universal life policies and the fixed account of universal variable life insurance policies. Interest is credited to the policyholder’s account at interest rates we determine which are influenced by current market rates, subject to specified minimums. | |||||||
| Rider | An optional feature or benefit that a variable annuity contract holder can purchase at an additional cost. | |||||||
| Roll-up rate | The guaranteed percentage that the Benefit Base increases by each year. | |||||||
| Separate account | An insurance company account, legally segregated from the general account, that holds the contract assets or subaccount investments that can be actively or passively managed and invest in stock, bonds or money market portfolios. | |||||||
| Step-up | An optional variable annuity feature (available at an additional cost) that can increase the Benefit Base amount if the variable annuity account value is higher than the Benefit Base on specified dates. | |||||||
| Surrender charge | A fee paid by a contract owner for the early withdrawal of an amount that exceeds a specific percentage or for cancellation of the contract within a specified amount of time after purchase. | |||||||
| Term life | Life insurance that provides a fixed death benefit in exchange for a guaranteed level premium over a specified period of time, usually ten to thirty years. Generally, term life insurance does not include any cash value, savings or investment components. | |||||||
| Universal life | Life insurance that provides a death benefit in return for payment of specified annual policy charges that are generally related to specific costs, which may change over time. To the extent that the policyholder chooses to pay more than the charges required in any given year to keep the policy in-force, the excess premium will be placed into the account value of the policy and credited with a stated interest rate on a monthly basis. | |||||||
| Variable annuity | An annuity that offers guaranteed periodic payments for a specified period of time or for a lifetime and gives owners the ability to invest in various markets though the underlying investment options, which may result in potentially higher, but variable, returns. | |||||||
211
| Variable universal life | Universal life insurance where the excess amount paid over policy charges can be directed by the policyholder into a variety of separate account investment options. In the separate account investment options, the policyholder bears the entire risk and returns of the investment results. | |||||||
| Whole life | Life insurance that provides a guaranteed death benefit in exchange for a guaranteed level premium for a specified period of time in order to maintain coverage for the life of the insured. Whole life products also have guaranteed minimum cash surrender values. Although the primary purpose is protection, the policyholder can withdraw or borrow against the policy (sometimes on a tax favored basis). | |||||||
212
Exhibit Index
(Note Regarding Reliance on Statements in Our Contracts: In reviewing the agreements included as exhibits to this Annual Report on Form 10-K, please remember that they are included to provide you with information regarding their terms and are not intended to provide any other factual or disclosure information about Brighthouse Financial, Inc. and its subsidiaries or affiliates or the other parties to the agreements. The agreements contain representations and warranties by each of the parties to the applicable agreement. These representations and warranties have been made solely for the benefit of the other parties to the applicable agreement and (i) should not in all instances be treated as categorical statements of fact, but rather as a way of allocating the risk to one of the parties if those statements prove to be inaccurate; (ii) have been qualified by disclosures that were made to the other party in connection with the negotiation of the applicable agreement, which disclosures are not necessarily reflected in the agreement; (iii) may apply standards of materiality in a way that is different from what may be viewed as material to investors; and (iv) were made only as of the date of the applicable agreement or such other date or dates as may be specified in the agreement and are subject to more recent developments. Accordingly, these representations and warranties may not describe the actual state of affairs as of the date they were made or at any other time. Additional information about Brighthouse Financial, Inc. and its subsidiaries and affiliates may be found elsewhere in this Annual Report on Form 10-K and Brighthouse Financial, Inc.’s other public filings, which are available without charge through the U.S. Securities and Exchange Commission website at www.sec.gov.)
| Exhibit No. | Description | |||||||
| 2.1 | ||||||||
| 3.1 | ||||||||
| 3.2 | ||||||||
| 4.1 | ||||||||
| 4.2 | ||||||||
| 4.3 | ||||||||
| 4.3.1 | ||||||||
| 4.3.2 | ||||||||
| 4.4 | ||||||||
| 4.5 | ||||||||
| 4.6 | ||||||||
| 4.6.1 | ||||||||
| 4.7 | ||||||||
| 4.8 | ||||||||
| 4.9 | ||||||||
| 4.10 | ||||||||
| 4.11 | ||||||||
| 4.12 | ||||||||
213
| 4.13 | ||||||||
| 4.14 | ||||||||
| 4.15 | ||||||||
| 4.16 | ||||||||
| 4.17 | ||||||||
| 4.18 | ||||||||
| 4.19 | ||||||||
4.20* | ||||||||
| 10.1 | ||||||||
| 10.2 | ||||||||
| 10.3 | ||||||||
| 10.4 | ||||||||
| 10.5# | ||||||||
| 10.5.1# | ||||||||
| 10.5.2# | ||||||||
| 10.5.3# | ||||||||
| 10.6# | ||||||||
| 10.7# | ||||||||
| 10.7.1# | ||||||||
| 10.7.2# | ||||||||
| 10.7.3# | ||||||||
10.7.4# | ||||||||
| 10.8# | ||||||||
| 10.9# | ||||||||
| 10.10# | ||||||||
214
| 10.11# | ||||||||
| 10.12# | ||||||||
| 10.13# | ||||||||
| 10.14# | ||||||||
| 10.15# | ||||||||
| 10.16# | ||||||||
| 10.17# | ||||||||
| 10.18# | ||||||||
| 10.19# | ||||||||
| 10.20# | ||||||||
| 10.21# | ||||||||
10.21.1# | ||||||||
| 10.22# | ||||||||
10.22.1# | ||||||||
| 10.23# | ||||||||
| 10.24# | ||||||||
10.24.1# | ||||||||
10.25# | ||||||||
| 21.1* | ||||||||
| 23.1* | ||||||||
| 31.1* | ||||||||
| 31.2* | ||||||||
| 32.1** | ||||||||
| 32.2** | ||||||||
97.1* | ||||||||
| 101.INS* | XBRL Instance Document - the instance document does not appear in the Interactive Data File because its XBRL tags are embedded within the Inline XBRL document. | |||||||
| 101.SCH* | Inline XBRL Taxonomy Extension Schema Document. | |||||||
| 101.CAL* | Inline XBRL Taxonomy Extension Calculation Linkbase Document. | |||||||
| 101.LAB* | Inline XBRL Taxonomy Extension Label Linkbase Document. | |||||||
| 101.PRE* | Inline XBRL Taxonomy Extension Presentation Linkbase Document. | |||||||
| 101.DEF* | Inline XBRL Taxonomy Extension Definition Linkbase Document. | |||||||
215
| 104* | The cover page of Brighthouse Financial, Inc.’s Annual Report on Form 10-K for the year ended December 31, 2023, formatted in Inline XBRL (included within the Exhibit 101 attachments). | |||||||
* Filed herewith.
** Furnished herewith.
# Denotes management contracts or compensation plans or arrangements.
216
SIGNATURES
Pursuant to the requirements of Section 13 or 15(d) of the Securities Exchange Act of 1934, the registrant has duly caused this report to be signed on its behalf by the undersigned, thereunto duly authorized.
| BRIGHTHOUSE FINANCIAL, INC. | ||||||||
| By: | /s/ Edward A. Spehar | |||||||
| Name: | Edward A. Spehar | |||||||
| Title: | Executive Vice President and Chief Financial Officer | |||||||
| Date: | February 22, 2024 | |||||||
Pursuant to the requirements of the Securities Exchange Act of 1934, this report has been signed below by the following persons on behalf of the registrant and in the capacities and on the dates indicated.
| Signature | Title | Date | ||||||||||||
| /s/ Eric T. Steigerwalt | Director, President and Chief Executive Officer (Principal Executive Officer) | February 22, 2024 | ||||||||||||
| Eric T. Steigerwalt | ||||||||||||||
| /s/ Edward A. Spehar | Executive Vice President and Chief Financial Officer (Principal Financial Officer) | February 22, 2024 | ||||||||||||
| Edward A. Spehar | ||||||||||||||
| /s/ Kristine H. Toscano | Chief Accounting Officer (Principal Accounting Officer) | February 22, 2024 | ||||||||||||
| Kristine H. Toscano | ||||||||||||||
| /s/ C. Edward Chaplin | Chairman of the Board of Directors | February 22, 2024 | ||||||||||||
| C. Edward Chaplin | ||||||||||||||
| /s/ Stephen C. Hooley | Director | February 22, 2024 | ||||||||||||
| Stephen C. Hooley | ||||||||||||||
| /s/ Carol D. Juel | Director | February 22, 2024 | ||||||||||||
| Carol D. Juel | ||||||||||||||
| /s/ Eileen A. Mallesch | Director | February 22, 2024 | ||||||||||||
| Eileen A. Mallesch | ||||||||||||||
| /s/ Diane E. Offereins | Director | February 22, 2024 | ||||||||||||
| Diane E. Offereins | ||||||||||||||
| /s/ Paul M. Wetzel | Director | February 22, 2024 | ||||||||||||
| Paul M. Wetzel | ||||||||||||||
217