Table of Contents
REGISTRATION STATEMENT PURSUANT TO SECTION 12(b) OR 12(g) OF THE SECURITIES EXCHANGE ACT OF 1934 |
ANNUAL REPORT PURSUANT TO SECTION 13 OR 15(d) OF THE SECURITIES EXCHANGE ACT OF 1934 |
or |
TRANSITION REPORT PURSUANT TO SECTION 13 OR 15(d) OF THE SECURITIES EXCHANGE ACT OF 1934 |
or |
SHELL COMPANY REPORT PURSUANT TO SECTION 13 OR 15(d) OF THE SECURITIES EXCHANGE ACT OF 1934 |
Title of Each Class |
Trading Symbol |
Name of Each Exchange on Which Registered | ||
(The Nasdaq Global Select Market) | ||||
(The Nasdaq Global Select Market) | ||||
Class A ordinary shares, par value US$0.000000625 per share |
9888 |
The Stock Exchange of Hong Kong Limited |
* |
Not for trading, but only in connection with the listing on The Nasdaq Global Select Market of American depositary shares. |
Accelerated filer ☐ |
Non-accelerated filer ☐ |
Emerging growth company |
| International Financial Reporting Standards as issued by the International Accounting Standards Board ☐ | Other ☐ |
Table of Contents
TABLE OF CONTENTS
| 1 | ||||||
| 2 | ||||||
| 3 | ||||||
| Item 1. | 3 | |||||
| Item 2. | 3 | |||||
| Item 3. | 3 | |||||
| Item 4. | 88 | |||||
| Item 4A. | 151 | |||||
| Item 5. | 151 | |||||
| Item 6. | 185 | |||||
| Item 7. | 200 | |||||
| Item 8. | 202 | |||||
| Item 9. | 204 | |||||
| Item 10. | 205 | |||||
| Item 11. | 219 | |||||
| Item 12. | 220 | |||||
| 224 | ||||||
| Item 13. | 224 | |||||
| Item 14. | Material Modifications to the Rights of Security Holders and Use of Proceeds |
224 | ||||
| Item 15. | 225 | |||||
| Item 16A. | 225 | |||||
| Item 16B. | 225 | |||||
| Item 16C. | 226 | |||||
| Item 16D. | 226 | |||||
| Item 16E. | Purchases of Equity Securities by the Issuer and Affiliated Purchasers |
226 | ||||
| Item 16F. | 227 | |||||
| Item 16G. | 227 | |||||
| Item 16H. | 227 | |||||
| Item 16I. | Disclosure Regarding Foreign Jurisdictions that Prevent Inspections |
227 | ||||
| Item 16J. | 227 | |||||
| Item 16K. | 227 | |||||
| PART III | 228 | |||||
| Item 17. | 228 | |||||
| Item 18. | 228 | |||||
| Item 19. | 228 | |||||
| 241 | ||||||
| F-1 | ||||||
i
Table of Contents
INTRODUCTION
In this annual report, except where the context otherwise requires and for purposes of this annual report only:
| • | “ADSs” refer to our American depositary shares, each ADSs representing eight Class A ordinary shares; |
| • | “China” or “PRC” refers to the People’s Republic of China, including Hong Kong, Macau and Taiwan; and “mainland China” refers to the People’s Republic of China, excluding Hong Kong, Macau and Taiwan; |
| • | “Class A ordinary shares” refer to Class A ordinary shares of the share capital of our company with a par value of US$0.000000625 each, conferring a holder of a Class A ordinary share one vote per share on all matters submitted for voting at general meetings of our company; |
| • | “Class B ordinary shares” refer to Class B ordinary shares of the share capital of our company with a par value of US$0.000000625 each, conferring weighted voting rights in our company such that a holder of a Class B ordinary share is entitled to 10 votes per share on all matters submitted for voting at general meetings of our company; |
| • | “Hong Kong” or “HK” or “Hong Kong S.A.R.” refers to the Hong Kong Special Administrative Region of the PRC; |
| • | “Hong Kong Listing Rules” refer to the Rules Governing the Listing of Securities on The Stock Exchange of Hong Kong Limited, as amended or supplemented from time to time; |
| • | “Hong Kong Share Registrar” refers to Computershare Hong Kong Investor Services Limited; |
| • | “Hong Kong Stock Exchange” refers to The Stock Exchange of Hong Kong Limited; |
| • | “Main Board” refers to the stock market (excluding the option market) operated by the Hong Kong Stock Exchange which is independent from and operated in parallel with the Growth Enterprise Market of the Hong Kong Stock Exchange; |
| • | “MAU”, or monthly active user, refers to the number of mobile devices that launched our mobile apps during a given month; |
| • | “our company” refers to Baidu, Inc., which is not a PRC operating company but a Cayman Islands holding company with operations primarily conducted through (i) our mainland China subsidiaries and (ii) contractual arrangements with the variable interest entities, or the VIEs, based in mainland China. This structure entails unique risks to investors, see “Item 3.D. Key Information—Risk Factors—Risks Related to our Corporate Structure” for more details; |
| • | “RMB” or “Renminbi” refers to the legal currency of mainland China; |
| • | “SFO” refers to the Securities and Futures Ordinance (Chapter 571 of the Laws of Hong Kong), as amended or supplemented from time to time; |
| • | “shares” or “ordinary shares” refer to our ordinary shares, which include both Class A ordinary shares and Class B ordinary shares; |
| • | “user traffic” or “traffic” refers generally to page views of a website, with “page views” measuring the number of web pages viewed by internet users over a specified period of time except that multiple page views of the same page viewed by the same user on the same day are counted only once; |
| • | “U.S. GAAP” refers to generally accepted accounting principles in the United States; |
| • | “we,” “us,” “our,” or “Baidu” refers to Baidu, Inc., its subsidiaries, and, in the context of describing our operations and consolidated financial information, the variable interest entities established in mainland China and other consolidated affiliated entities in which we do not have any equity ownership but |
1
Table of Contents
| whose financial results have been consolidated into our consolidated financial statements based solely on contractual arrangements in accordance with U.S. GAAP. These variable interest entities include, but are not limited to, Beijing Baidu Netcom Science Technology Co., Ltd., or Baidu Netcom, Beijing Perusal Technology Co., Ltd., or Beijing Perusal, Beijing iQIYI Science & Technology Co., Ltd., or Beijing iQIYI. See “Item 4. Information on the Company—C. Organizational Structure” for an illustrative diagram of our corporate structure; |
| • | “iQIYI” refers to iQIYI, Inc., a company incorporated in the Cayman Islands listed on Nasdaq under the symbol “IQ” and one of our subsidiaries; |
| • | “$,” “dollars,” “US$” or “U.S. dollars” refers to the legal currency of the United States; and |
| • | all discrepancies in any table between the amounts identified as total amounts and the sum of the amounts listed therein are due to rounding. |
On March 1, 2021, Baidu, Inc. effected a change to its authorized share capital by 1-to-80 subdivision of shares. Concurrently, Baidu, Inc. effected a proportionate change in ADS to Class A ordinary share ratio from 10 ADSs representing 1 Class A ordinary share to each ADS representing 8 Class A ordinary shares, or the Share Subdivision. Such changes been reflected retroactively throughout this document.
FORWARD-LOOKING INFORMATION
This annual report on Form 20-F contains forward-looking statements that reflect our current expectations and views of future events. These statements are made under the “safe harbor” provisions of the U.S. Private Securities Litigation Reform Act of 1995. You can identify these forward-looking statements by terminology such as “may,” “will,” “expect,” “anticipate,” “future,” “intend,” “plan,” “believe,” “estimate,” “is/are likely to” or other similar expressions. We have based these forward-looking statements largely on our current expectations and projections about future events and financial trends that we believe may affect our financial condition, results of operations, business strategy and financial needs. These forward-looking statements include, but are not limited to:
| • | our operations and business prospects; |
| • | our business and operating strategies and our ability to implement such strategies; |
| • | our ability to develop and manage our operations and business; |
| • | competition for, among other things, capital, technology and skilled personnel; |
| • | our ability to control costs; |
| • | our ability to identify and conduct investments and acquisitions, obtain regulatory approvals from government authorities, as well as integrate acquired target(s); |
| • | changes to regulatory and operating conditions in the industry and geographical markets in which we operate; |
| • | our dividend policy; and |
| • | all other risks and uncertainties described in “Item 3.D. Key Information—Risk Factors.” |
We would like to caution you not to place undue reliance on these forward-looking statements and you should read these statements in conjunction with the risk factors disclosed in “Item 3.D. Key Information—Risk Factors.” Those risks are not exhaustive. We operate in a rapidly evolving environment. New risks emerge from time to time and it is impossible for our management to predict all risk factors, nor can we assess the impact of all factors on our business or the extent to which any factor, or combination of factors, may cause actual results
2
Table of Contents
to differ from those contained in any forward-looking statement. We do not undertake any obligation to update or revise the forward-looking statements except as required under applicable law.
Unless otherwise noted, all translations from Renminbi to U.S. dollars and from U.S. dollars to Renminbi in this annual report are made at a rate of RMB7.0999 to US$1.00, the exchange rate in effect as of December 29, 2023 as set forth in the H.10 statistical release of The Board of Governors of the Federal Reserve System. We make no representation that any Renminbi or U.S. dollar amounts could have been, or could be, converted into U.S. dollars or Renminbi, as the case may be, at any particular rate, or at all.
PART I
| Item 1. | Identity of Directors, Senior Management and Advisers |
Not applicable.
| Item 2. | Offer Statistics and Expected Timetable |
Not applicable.
| Item 3. | Key Information |
Our Corporate Structure and Contractual Arrangements with the Variable Interest Entities
Baidu, Inc. is not a PRC operating company but a Cayman Islands holding company with operations primarily conducted through (i) our subsidiaries incorporated in mainland China, or mainland China subsidiaries, and (ii) contractual arrangements with the variable interest entities based in mainland China. Our internet content services, value-added telecommunication-based services, internet map services, online audio and video services and mobile application distribution businesses in mainland China have been conducted through the applicable VIEs in order to comply with the laws and regulations of mainland China, which restrict and impose conditions on foreign direct investment in companies involved in the provision of such businesses. Accordingly, we operate these businesses in mainland China through the variable interest entities, and rely on contractual arrangements among Baidu, Inc./iQIYI, Inc., our mainland China subsidiaries, the variable interest entities and their nominee shareholders to control the business operations of the variable interest entities. External revenues contributed by the variable interest entities accounted for 44%, 47% and 45% of our total external revenues for the years ended December 31, 2021, 2022 and 2023, respectively. As used in this annual report, “our company” refers to Baidu, Inc., whereas “we,” “us,” “our,” or “Baidu” refers to Baidu, Inc., its subsidiaries, and, in the context of describing our operations and consolidated financial information, the variable interest entities in mainland China and all of the variable interest entities are domestic companies incorporated in mainland China in which we do not have any equity ownership but whose financial results have been consolidated into our consolidated financial statements based solely on contractual arrangements in accordance with U.S. GAAP. Investors in our ADSs are not purchasing equity interest in the variable interest entities in mainland China but instead are purchasing equity interest in a holding company incorporated in the Cayman Islands.
Baidu, Inc./iQIYI, Inc., our mainland China subsidiaries, the variable interest entities and their nominee shareholders have entered into a series of contractual agreements. These contractual arrangements:
| • | enable us to receive the economic benefits that could potentially be significant to the variable interest entities in consideration for the services provided by our subsidiaries; |
| • | effectively assigned all of the voting rights underlying the nominee shareholders’ equity interest in the variable interest entities to us; and enable us to hold an exclusive option to purchase all or part of the equity interests in the variable interest entities when and to the extent permitted by the laws of mainland China. |
3
Table of Contents
These contractual arrangements generally include shareholder voting rights trust agreements or proxy agreements, exclusive equity purchase and transfer option agreements or exclusive purchase option agreements, loan agreements, operating agreements or business operation agreements, exclusive technology consulting and services agreements, and equity pledge agreements, as the case may be. As for some of the variable interest entities, our subsidiaries have entered into additional business cooperation agreements, power of attorney, license agreements and/or commitment letters (as the case may be) with these variable interest entities and their respective shareholders. Terms contained in each set of contractual arrangements with the variable interest entities and their respective shareholders are substantially similar. As a result of the contractual arrangements, the shareholders of the variable interest entities effectively assigned all of their voting rights underlying their equity interest in the variable interest entities to the primary beneficiaries of these companies, which gives our company or its subsidiaries/iQIYI the power to direct the activities that most significantly impact the variable interest entities’ economic performance. The nominee shareholders of Baidu Netcom, Beijing Perusal and Beijing iQIYI, the variable interest entities, are directors or members of senior management of us or iQIYI. We or iQIYI consider such people suitable to act as the nominee shareholders of these variable interest entities because of, among other considerations, their contribution to us or iQIYI, their competence and their length of service with and loyalty to us or iQIYI. For more details of these contractual arrangements, see “Item 4. Information on the Company—C. Organizational Structure—Contractual Arrangements with the Variable Interest Entities and Other Consolidated Affiliated Entities and their Shareholders.”
However, the contractual arrangements may not be as effective as direct ownership in providing us with control over the variable interest entities and we may incur substantial costs to enforce the terms of the arrangements. If the variable interest entities or the nominee shareholders fail to perform their respective obligations under the contractual arrangements, we could be limited in our ability to enforce the contractual arrangements that effectively assigned us the voting rights in the variable interest entities, and these agreements have not been tested in the courts of mainland China. Furthermore, if we are unable to maintain such effective assignment, we would not be able to continue to consolidate the financial results of these entities in our financial statements. See “Item 3.D. Key Information—Risk Factors—Risks Related to Our Corporate Structure—Our contractual arrangements with the variable interest entities in mainland China and the individual nominee shareholders may not be as effective in providing control over these entities as direct ownership” and “Item 3.D. Key Information—Risk Factors—Risks Related to Our Corporate Structure—The individual nominee shareholders of the variable interest entities may have potential conflicts of interest with us, which may adversely affect our business. We do not have any arrangements in place to address such potential conflicts.”
There are also substantial uncertainties regarding the interpretation and application of current and future laws, regulations and rules of mainland China regarding the status of the rights of our Cayman Islands holding company with respect to its contractual arrangements with the variable interest entities and their nominee shareholders. It is uncertain whether any new laws or regulations of mainland China relating to variable interest entity structures will be adopted or if adopted, what they would provide. If we or any of the variable interest entities is found to be in violation of any existing or future laws or regulations of mainland China, or fail to obtain or maintain any of the required permits or approvals, the PRC regulatory authorities would have broad discretion in accordance with the applicable laws and regulations to take action in dealing with such violations or failures. See “Item 3.D. Key Information—Risk Factors—Risks Related to Our Corporate Structure—Laws and regulations of mainland China governing our businesses and the validity of certain of our contractual arrangements are uncertain. If we are found to be in violation, we could be subject to sanctions. In addition, changes in the laws and regulations of mainland China or changes in interpretations thereof may materially and adversely affect our business.”
Our operations are primarily conducted in mainland China through (i) our mainland China subsidiaries and (ii) contractual arrangements with the variable interest entities based in mainland China, and revenues are primarily generated from mainland China. Though the PRC Foreign Investment Law does not explicitly classify contractual arrangements as a form of foreign investment, the definition of “foreign investment” thereunder is relatively wide and contains a catch-all provision which includes investments made by foreign investors through
4
Table of Contents
means stipulated in laws or administrative regulations or other methods prescribed by the State Council. Therefore, there is no assurance that foreign investment via contractual arrangement would not be interpreted as a type of indirect foreign investment activities in the future. If any of the variable interest entities were deemed as a foreign-invested enterprise under any such future laws, administrative regulations or provisions and any of our business would be included in any negative list or other form of restrictions on foreign investment, we may need to take further actions to comply with such future laws, administrative regulations or provisions. Such actions may have a material and adverse impact on our business, financial condition, result of operations and prospects. In addition, if the PRC regulatory authorities were to find our legal structure and contractual arrangements to be in violation of any laws, administrative regulations or provisions of mainland China, we are uncertain what impact of above PRC regulatory authorities’ actions would have on us and our ability to consolidate the variable interest entities in the consolidated financial statements. For more details, see “Item 3.D. Key Information—Risk Factors—Risks Related to Doing Business in China—Uncertainties exist with respect to the interpretation and implementation of the PRC Foreign Investment Law and its implementation regulations and how it may impact the viability of our current corporate structure, corporate governance and business operations.”
Our corporate structure is subject to risks associated with our contractual arrangements with the variable interest entities. Our company and its investors may never have a direct ownership interest in the businesses that are conducted by the variable interest entities. Uncertainties in the PRC legal system could limit our ability to enforce these contractual arrangements, and these contractual arrangements have not been tested in a court of law. If the PRC government finds that the agreements that establish the structure for operating our business in mainland China do not comply with the laws and regulations of mainland China, or if these regulations or the interpretation of existing regulations change or are interpreted differently in the future, we and the variable interest entities could be subject to severe penalties or be forced to relinquish our interests in those operations. This would result in the variable interest entities being deconsolidated. The majority of our assets, including the necessary licenses to conduct business in mainland China, are held by the variable interest entities. A significant part of our revenues are generated by the variable interest entities. An event that results in the deconsolidation of the variable interest entities would have a material effect on our operations and result in the value of the securities of our company diminish substantially or even become worthless. Our company, our mainland China subsidiaries and the variable interest entities, and investors of our company face uncertainty about potential future actions by the PRC government that could affect the enforceability of the contractual arrangements with the variable interest entities and, consequently, significantly affect the financial performance of the variable interest entities and our company as a whole. Baidu, Inc. may not be able to repay its indebtedness, and the Class A ordinary shares or ADSs of our company may decline in value or become worthless, if we are unable to assert our contractual control rights over the assets of our mainland China subsidiaries and the variable interest entities that conduct all or substantially all of our operations. For a detailed description of the risks associated with our corporate structure, please refer to risks disclosed under “Item 3.D. Key Information—Risk Factors—Risks Related to Our Corporate Structure.”
Our company and the variable interest entities face various risks and uncertainties related to doing business in China. For example, we face risks associated with regulatory approvals on offshore offerings, antimonopoly regulatory actions, and oversight on cybersecurity and data privacy. These risks could result in a material adverse change in our operations and the value of our ADSs, significantly limit or completely hinder our ability to continue to offer securities to investors, or adversely affect the value of such securities. For a detailed description of risks related to doing business in China, see “Item 3.D. Key Information—Risk Factors—Risks Related to Doing Business in China.”
PRC government’s certain administrative measures in regulating (i) our operations and (ii) offerings conducted overseas by, and foreign investment in, China-based issuers, could significantly limit or completely hinder our ability to offer or continue to offer securities to investors. Implementation of industry-wide regulations, including data security or anti-monopoly related regulations, in this nature may result in adverse effect on the value of such securities. For more details, see “Item 3.D. Key Information—Risk Factors—Risks
5
Table of Contents
Related to Doing Business in China—Failure to meet the PRC government’s complex regulatory requirements on our business operation could have a material adverse effect on our operations and the value of our securities.”
Risks and uncertainties arising from the PRC legal system, including risks and uncertainties regarding the enforcement of laws and quickly evolving rules and regulations in mainland China, could result in a material adverse change in our operations and the value of our ADSs. For more details, see “Item 3.D. Key Information—Risk Factors—Risks Related to Doing Business in China—Uncertainties exist with respect to the interpretation and implementation of the PRC Foreign Investment Law and its implementation regulations and how it may impact the viability of our current corporate structure, corporate governance and business operations.”
The Holding Foreign Companies Accountable Act
Pursuant to the Holding Foreign Companies Accountable Act, which was enacted on December 18, 2020 and further amended by the Consolidated Appropriations Act, 2023 signed into law on December 29, 2022, or the HFCAA, if the Securities and Exchange Commission, or the SEC, determines that we have filed audit reports issued by a registered public accounting firm that has not been subject to inspections by the Public Company Accounting Oversight Board, or the PCAOB, for two consecutive years, the SEC will prohibit our shares or the ADSs from being traded on a national securities exchange or in the over-the-counter trading market in the United States. On December 16, 2021, the PCAOB issued a report to notify the SEC of its determination that the PCAOB was unable to inspect or investigate completely registered public accounting firms headquartered in mainland China and Hong Kong, including our auditor. In April 2022, the SEC conclusively listed us as a Commission-Identified Issuer under the HFCAA following the filing of our annual report on Form 20-F for the fiscal year ended December 31, 2021. On December 15, 2022, the PCAOB issued a report that vacated its December 16, 2021 determination and removed mainland China and Hong Kong from the list of jurisdictions where it is unable to inspect or investigate completely registered public accounting firms. For this reason, we were not identified as a Commission-Identified Issuer under the HFCAA after we filed our annual report on Form 20-F for the fiscal year ended December 31, 2022 and do not expect to be so identified after we file this annual report on Form 20-F for the fiscal year ended December 31, 2023. Each year, the PCAOB will determine whether it can inspect and investigate completely audit firms in mainland China and Hong Kong, among other jurisdictions. If the PCAOB determines in the future that it no longer has full access to inspect and investigate completely accounting firms in mainland China and Hong Kong and we use an accounting firm headquartered in one of these jurisdictions to issue an audit report on our financial statements filed with the SEC, we would be identified as a Commission-Identified Issuer following the filing of the annual report on Form 20-F for the relevant fiscal year. There can be no assurance that we would not be identified as a Commission-Identified Issuer for any future fiscal year, and if we were so identified for two consecutive years, we would become subject to the prohibition on trading under the HFCAA. See “Item 3.D. Key Information—Risk Factors—Risks Related to Doing Business in China—The PCAOB had historically been unable to inspect our auditor in relation to their audit work performed for our financial statements and the inability of the PCAOB to conduct inspections of our auditor in the past has deprived our investors with the benefits of such inspections.” and “Item 3.D. Key Information—Risk Factors—Risks Related to Doing Business in China—Our ADSs may be prohibited from trading in the United States under the HFCAA in the future if the PCAOB is unable to inspect or investigate completely auditors located in China. The delisting or prohibition of trading of the ADSs, or the threat of their being delisted or prohibited from trading, may materially and adversely affect the value of your investment.”
Permissions Required from the PRC Government Authorities for Our Operations
We conduct our business primarily through our subsidiaries and the variable interest entities in mainland China. Our operations in mainland China are governed by the laws and regulations of mainland China. As of the date of this annual report, our mainland China subsidiaries and the variable interest entities have obtained the requisite licenses and permits from the PRC government authorities that are material for the business operations of our subsidiaries and the variable interest entities in mainland China, including, among others, the Value-Added Telecommunication Business Operating License, the Internet News Information Service License, the
6
Table of Contents
Short Messaging Service Access Code Certificate, the Online Audio/Video Program Transmission License, the Radio and Television Program Production License, the Surveying and Mapping Qualification Certificate for internet map services, the Internet Culture Business Permit, the Publication Business Operating License, the Filing Certificate for Internet Drug and Medical Devices Information Services/the Qualification Certificate for Internet Drug Information Services, the Human Resource Services License, the Filing Certificate for the Online Transaction Platform, the Filing Certificate for Business of Category II Medical Devices, the Registration Certificate for Medical Devices, the Food Business License, the Medicine Business License, the Filing Certificate for the Online Publication Transaction Platform, the Internet Domain Name Services License, the Medical Device Operation License, the Medical Device Production License, the Filing Certificate for Third-Party Platform Provider of Online Trading Service for Drugs and the Filing Certificate for Third-Party Platform Provider of Online Trading Service for Medical Device, the Practice License of Medical Institutions, the Internet Religious Information Service License, the Filing Certificate of Artworks Operators, the Filing Information Form of Third Party Platform Providers of Online Food Trading, the Aquatic Wildlife Operation and Utilization License, the Online Taxi-Hailing Operation License and certain permits for road testing and demonstration application and/or commercial operations of autonomous driving vehicles. Given the uncertainties of interpretation and implementation of relevant laws and regulations and the enforcement practice by the government authorities, we may be required to obtain additional licenses, permits, filings or approvals for our businesses and services in the future. For more detailed information, see “Item 3.D. Key Information—Risk Factors—Risks Related to Doing Business in China—We may be adversely affected by the complexity, uncertainties and changes in the regulations of internet and related business and companies in mainland China.”
Furthermore, in connection with our historical issuance of securities to foreign investors, we, our mainland China subsidiaries and the variable interest entities, (i) are not required to obtain permission from the China Securities Regulatory Commission, or the CSRC, (ii) are not required to go through a cybersecurity review by the Cyberspace Administration of China, or the CAC, and (iii) have not been asked to obtain permission by any PRC government authority.
However, the PRC government has promulgated certain regulations and rules to exert more oversight and control over offerings that are conducted overseas and/or foreign investment in China-based issuers. On February 17, 2023, the CSRC released the Trial Administrative Measures of Overseas Securities Offering and Listing by Domestic Companies and five supporting guidelines, or, collectively, the Filing Rules, which took effect on March 31, 2023. According to the Filing Rules, domestic companies in mainland China that directly or indirectly offer or list their securities in an overseas market are required to file with the CSRC. In addition, an overseas listed company must also submit the filing with respect to its follow-on offerings, issuance of convertible corporate bonds and exchangeable bonds, and other equivalent offering activities, within a specific time frame requested under the Filing Rules. Therefore, we will be required to file with the CSRC for our overseas offering of equity and equity linked securities in the future within the applicable scope of the Filing Rules. For more detailed information, see “Item 3.D. Key Information—Risk Factors—Risks Related to Doing Business in China—The approval of and/or filing with the CSRC or other PRC government authorities may be required in connection with our offshore offerings under the laws of mainland China, and, if required, we cannot predict whether or for how long we will be able to obtain such approval or complete such filing.”
Cash Flows through Our Organization
Baidu, Inc. is a holding company with no operations of its own. We conduct our operations in mainland China primarily through our subsidiaries and the variable interest entities in mainland China. As a result, although other means are available for us to obtain financing at the holding company level, Baidu, Inc.’s ability to pay dividends to the shareholders and to service any debt it may incur may depend upon dividends paid by our mainland China subsidiaries and license and service fees paid by the variable interest entities. If any of our subsidiaries incurs debt on its own behalf, the instruments governing such debt may restrict its ability to pay dividends to Baidu, Inc. In addition, our mainland China subsidiaries are permitted to pay dividends to Baidu, Inc. only out of their retained earnings, if any, as determined in accordance with PRC accounting standards and
7
Table of Contents
regulations. Further, our mainland China subsidiaries and the variable interest entities are required to make appropriations to certain statutory reserve funds or may make appropriations to certain discretionary funds, which are not distributable as cash dividends except in the event of a solvent liquidation of the companies. For more details, see “Item 5.B. Operating and Financial Review and Prospects—Liquidity and Capital Resources—Holding Company Structure.”
Under the laws and regulations of mainland China, our mainland China subsidiaries and the variable interest entities are subject to certain restrictions with respect to paying dividends or otherwise transferring any of their net assets to us. Remittance of dividends by a wholly foreign-owned enterprise out of mainland China is also subject to examination by the banks designated by State Administration of Foreign Exchange, or SAFE. The amounts restricted include the paid-up capital and the statutory reserve funds of our mainland China subsidiaries and the net assets of the variable interest entities in which we have no legal ownership, totaling RMB45.9 billion, RMB47.3 billion and RMB48.0 billion (US$6.8 billion) as of December 31, 2021, 2022 and 2023, respectively. For risks relating to the fund flows of our operations in mainland China, see “Item 3.D. Key Information—Risk Factors—Risks Related to Doing Business in China—Our subsidiaries and the variable interest entities in mainland China are subject to restrictions on paying dividends and making other payments to our holding company.”
From 2021 to 2023, certain of our mainland China subsidiaries have declared and distributed profits earned to Baidu (Hong Kong) Limited for an aggregate amount of RMB23.1 billion (US$3.2 billion); the dividend payments are subject to withholding tax. We have made tax provisions based on the corresponding tax rate. If our mainland China subsidiaries further declare and distribute profits earned after January 1, 2008 in the future, the dividend payments will be subject to withholding tax, which will increase our tax liability and reduce the amount of cash available to our company. For the potential distributable profits to be distributed to our qualified Hong Kong incorporated subsidiary, the deferred tax liabilities are accrued at a 5% withholding tax rate. For more information on related risks, please see “Item 3.D. Key Information—Risk Factors—Risks Related to Doing Business in China—If our mainland China subsidiaries declare and distribute dividends to their respective offshore parent companies, we will be required to pay more taxes, which could have a material and adverse effect on our result of operations.”
Under the laws of mainland China, Baidu Inc. may provide funding to our mainland China subsidiaries only through capital contributions or loans, and to the variable interest entities only through loans, subject to satisfaction of applicable government registration and approval requirements.
For the years ended December 31, 2021, 2022 and 2023, Baidu, Inc. provided loans with principal amount of RMB14.5 billion, RMB11.0 billion and RMB24.4 billion (US$3.4 billion), respectively, to its subsidiaries, and the subsidiaries repaid principal amount of RMB4.9 billion, RMB12.6 billion and RMB27.1 billion (US$3.8 billion), respectively, to Baidu, Inc.
For the years ended December 31, 2021, 2022 and 2023, the subsidiaries of Baidu, Inc. provided loans with principal amount of RMB3.1 billion, RMB22.3 billion and RMB21.4 billion (US$3.0 billion), respectively, to Baidu, Inc. and Baidu, Inc. repaid principal amount of RMB3.0 billion, RMB3.1 billion and RMB23.3 billion (US$3.3 billion), respectively, to its subsidiaries.
For the years ended December 31, 2021, 2022 and 2023, loans for the amounts of RMB409 million, RMB65 million and RMB58 million (US$8 million), respectively, were provided to the nominee shareholders to fund the capitalization of the variable interest entities for which the Company does not intend to seek repayment, and nil was repaid by the nominee shareholders.
For the years ended December 31, 2021, 2022 and 2023, the variable interest entities received RMB6.9 billion, RMB5.4 billion and RMB1.5 billion (US$218 million), respectively, as capital contributions or loans from the subsidiaries of Baidu, Inc. and the variable interest entities repaid principal amount of nil, RMB6.5 billion and RMB5.2 billion (US$725 million), respectively, to the subsidiaries.
8
Table of Contents
For the years ended December 31, 2021, 2022 and 2023, the variable interest entities provided loans with principal amount of RMB450 million, nil and nil, respectively, to the subsidiaries of Baidu, Inc. and the subsidiaries repaid principal amount of RMB10 million, RMB200 million and RMB345 million (US$49 million), respectively, to the variable interest entities.
Baidu, Inc. has not declared or paid any cash dividends, nor does it has any present plan to pay any cash dividends on its ordinary shares in the foreseeable future. We currently intend to retain most, if not all, of our available funds and any future earnings to operate and expand our business. See “Item 8. Financial Information—A. Consolidated Statements and Other Financial Information—Dividend Policy.” For mainland China and United States federal income tax considerations of an investment in our ADSs, see “Item 10. Additional Information—E. Taxation.”
| A. | [Reserved] |
The following table presents the selected consolidated financial information for our company. The selected consolidated statements of comprehensive income data and cash flow data for the three years ended December 31, 2021, 2022 and 2023 and the consolidated balance sheets data as of December 31, 2022 and 2023 have been derived from our audited consolidated financial statements, which are included in this annual report beginning on page F-1. The selected consolidated statements of comprehensive income data and cash flow data for the years ended December 31, 2019 and 2020 and the selected consolidated balance sheets data as of December 31, 2019, 2020 and 2021 have been derived from our audited consolidated financial statements for the years ended December 31, 2019, 2020 and 2021, which are not included in this annual report. Our historical results do not necessarily indicate results expected for any future periods. The selected consolidated financial data should be read in conjunction with, and are qualified in their entirety by reference to, our audited consolidated financial statements and related notes and “Item 5. Operating and Financial Review and Prospects” below. Our audited consolidated financial statements are prepared and presented in accordance with U.S. GAAP.
| Year Ended December 31, | ||||||||||||||||||||||||
| 2019 | 2020 | 2021 | 2022 | 2023 | ||||||||||||||||||||
| RMB | RMB | RMB | RMB | RMB | US$ | |||||||||||||||||||
| (In millions, except per share and per ADS data) | ||||||||||||||||||||||||
| Consolidated Statements of Comprehensive Income Data: |
||||||||||||||||||||||||
| Revenues: |
||||||||||||||||||||||||
| Online marketing services |
78,093 | 72,840 | 80,695 | 74,711 | 81,203 | 11,437 | ||||||||||||||||||
| Others |
29,320 | 34,234 | 43,798 | 48,964 | 53,395 | 7,521 | ||||||||||||||||||
|
|
|
|
|
|
|
|
|
|
|
|
|
|||||||||||||
| Total revenues |
107,413 | 107,074 | 124,493 | 123,675 | 134,598 | 18,958 | ||||||||||||||||||
|
|
|
|
|
|
|
|
|
|
|
|
|
|||||||||||||
| Operating costs and expenses: |
||||||||||||||||||||||||
| Cost of revenues |
62,850 | 55,158 | 64,314 | 63,935 | 65,031 | 9,159 | ||||||||||||||||||
| Selling, general and administrative |
19,910 | 18,063 | 24,723 | 20,514 | 23,519 | 3,314 | ||||||||||||||||||
| Research and development |
18,346 | 19,513 | 24,938 | 23,315 | 24,192 | 3,407 | ||||||||||||||||||
|
|
|
|
|
|
|
|
|
|
|
|
|
|||||||||||||
| Total operating costs and expenses |
101,106 | 92,734 | 113,975 | 107,764 | 112,742 | 15,880 | ||||||||||||||||||
|
|
|
|
|
|
|
|
|
|
|
|
|
|||||||||||||
| Operating profit |
6,307 | 14,340 | 10,518 | 15,911 | 21,856 | 3,078 | ||||||||||||||||||
|
|
|
|
|
|
|
|
|
|
|
|
|
|||||||||||||
| Total other (loss) income, net |
(6,647 | ) | 8,750 | 260 | (5,799 | ) | 3,342 | 472 | ||||||||||||||||
|
|
|
|
|
|
|
|
|
|
|
|
|
|||||||||||||
| (Loss) income before income taxes |
(340 | ) | 23,090 | 10,778 | 10,112 | 25,198 | 3,550 | |||||||||||||||||
|
|
|
|
|
|
|
|
|
|
|
|
|
|||||||||||||
| Income taxes |
1,948 | 4,064 | 3,187 | 2,578 | 3,649 | 514 | ||||||||||||||||||
|
|
|
|
|
|
|
|
|
|
|
|
|
|||||||||||||
| Net (loss) income |
(2,288 | ) | 19,026 | 7,591 | 7,534 | 21,549 | 3,036 | |||||||||||||||||
|
|
|
|
|
|
|
|
|
|
|
|
|
|||||||||||||
| Less: Net (loss) income attributable to non-controlling interests |
(4,345 | ) | (3,446 | ) | (2,635 | ) | (25 | ) | 1,234 | 175 | ||||||||||||||
|
|
|
|
|
|
|
|
|
|
|
|
|
|||||||||||||
| Net income attributable to Baidu, Inc. |
2,057 | 22,472 | 10,226 | 7,559 | 20,315 | 2,861 | ||||||||||||||||||
|
|
|
|
|
|
|
|
|
|
|
|
|
|||||||||||||
9
Table of Contents
| As of December 31, | ||||||||||||||||||||||||
| 2019 | 2020 | 2021 | 2022 | 2023 | ||||||||||||||||||||
| RMB | RMB | RMB | RMB | RMB | US$ | |||||||||||||||||||
| (In millions) | ||||||||||||||||||||||||
| Consolidated Balance Sheets Data: |
||||||||||||||||||||||||
| Cash and cash equivalents |
33,443 | 35,782 | 36,850 | 53,156 | 25,231 | 3,554 | ||||||||||||||||||
| Restricted cash |
996 | 758 | 10,821 | 11,330 | 11,503 | 1,620 | ||||||||||||||||||
| Short-term investments, net(1) |
112,924 | 126,402 | 143,243 | 120,839 | 168,670 | 23,757 | ||||||||||||||||||
| Total assets |
301,316 | 332,708 | 380,034 | 390,973 | 406,759 | 57,291 | ||||||||||||||||||
| Short-term loans |
2,618 | 3,016 | 4,168 | 5,343 | 10,257 | 1,445 | ||||||||||||||||||
| Long-term loans, current portion |
737 | 7,427 | 2 | — | 2 | — | ||||||||||||||||||
| Long-term loans |
7,804 | — | 12,629 | 13,722 | 14,223 | 2,003 | ||||||||||||||||||
| Notes payable, current portion |
5,219 | — | 10,505 | 6,904 | 6,029 | 849 | ||||||||||||||||||
| Notes payable |
38,090 | 48,408 | 43,120 | 39,893 | 34,990 | 4,928 | ||||||||||||||||||
| Convertible senior notes, current portion(2) |
— | 4,752 | — | 8,305 | 2,802 | 395 | ||||||||||||||||||
| Convertible senior notes(2) |
12,297 | 11,927 | 12,652 | 9,568 | 8,144 | 1,147 | ||||||||||||||||||
| Total liabilities |
128,501 | 140,865 | 156,082 | 153,168 | 144,151 | 20,304 | ||||||||||||||||||
| Total Baidu, Inc. shareholders’ equity |
163,599 | 182,696 | 211,459 | 223,478 | 243,626 | 34,314 | ||||||||||||||||||
| (1) | We adopted Accounting Standards Update (ASU) No. 2016-13, Financial Instruments-Credit Losses (Topic 326): Measurement of Credit Losses on Financial Instruments on January 1, 2020, which requires the measurement and recognition of expected credit losses for financial assets held at amortized cost. ASU 2016-13 replaces the existing incurred loss impairment model with an expected loss methodology, resulting in more timely recognition of credit losses. |
| (2) | We adopted ASU No. 2020-06, Accounting for Convertible Instruments and Contracts in an Entity’s Own Equity on January 1, 2022 using a modified retrospective transition method. Following the adoption of ASU 2020-06, all of the proceeds received from the issuance of the existing notes have been recorded as a liability on the balance sheet in accordance with ASC 470-20. The difference between the principal amount of each of the existing notes and net proceeds from the issuance is considered debt discount and is amortized at their respective effective interest rates to accrete the carrying value of the existing notes to its face value on the respective put dates of the existing notes. |
| Year Ended December 31, | ||||||||||||||||||||||||
| 2019 | 2020 | 2021 | 2022 | 2023 | ||||||||||||||||||||
| RMB | RMB | RMB | RMB | RMB | US$ | |||||||||||||||||||
| (In millions) | ||||||||||||||||||||||||
| Consolidated Cash Flow Data: |
||||||||||||||||||||||||
| Net cash provided by operating activities |
28,458 | 24,200 | 20,122 | 26,170 | 36,615 | 5,157 | ||||||||||||||||||
| Net cash used in investing activities |
(19,974 | ) | (27,552 | ) | (31,444 | ) | (3,944 | ) | (50,397 | ) | (7,098 | ) | ||||||||||||
| Net cash (used in)/provided by financing activities |
(3,873 | ) | 5,665 | 23,396 | (6,390 | ) | (14,162 | ) | (1,995 | ) | ||||||||||||||
| Net increase/(decrease) in cash, cash equivalents and restricted cash |
4,612 | 2,101 | 11,131 | 17,565 | (27,662 | ) | (3,896 | ) | ||||||||||||||||
Financial Information Related to the Variable Interest Entities
The following tables present the condensed consolidating schedule of financial performance, financial position and cash flows for Baidu, Inc., its wholly owned subsidiaries that are the Primary Beneficiaries of the VIEs under U.S. GAAP, or the Primary Beneficiaries of VIEs excluding Baidu, Inc., its other subsidiaries that are not the Primary Beneficiaries of VIEs, or the “Other Subsidiaries, the VIEs and VIEs’ subsidiaries that we consolidate for the periods and as of the dates presented.
| • | “Baidu Inc.” is our holding company in the Cayman Islands, and the primary beneficiary of the VIEs including Beijing Baidu Netcom Science Technology Co., Ltd., or Baidu Netcom, and Beijing Perusal Technology Co., Ltd., or Beijing Perusal, and other VIEs. “Primary Beneficiaries of VIEs excluding Baidu, Inc.” mainly refer to iQIYI, Inc., the primary beneficiary of Beijing iQIYI Science & Technology Co., Ltd., Beijing iQIYI, and other iQIYI VIEs. |
| • | “Other Subsidiaries” refer to the sum of non-VIE subsidiaries, which mainly include Baidu Online Network Technology (Beijing) Co., Ltd., or Baidu Online, Baidu (China) Co., Ltd., or Baidu China, |
10
Table of Contents
| Baidu.com Times Technology (Beijing) Co., Ltd., or Baidu Times, Beijing QIYI Century Science & Technology Co., Ltd., or Beijing QIYI Century, a wholly-owned foreign enterprise of iQIYI, Inc., and other wholly-owned subsidiaries, which mainly provide online marketing services to external customers. In addition, as instructed by the primary beneficiaries of the VIEs, certain wholly-owned subsidiaries including Baidu Online and Beijing QIYI Century also provide long-term loans to the nominee shareholders of the VIEs to fund the capitalization of these entities as well as exclusive technology consulting and services to the VIEs. |
| • | “VIEs and VIEs’ subsidiaries” refer to the sum of Baidu Netcom, Beijing Perusal, Beijing iQIYI and other iQIYI VIEs, and other VIEs. |
Selected Condensed Consolidating Statements of Comprehensive Income Information
| For the Year Ended December 31, 2023 | ||||||||||||||||||||||||
| Baidu Inc. |
Primary Beneficiaries of VIEs excluding Baidu, Inc. |
Other Subsidiaries |
VIEs and VIEs’ subsidiaries |
Eliminations | Consolidated Total |
|||||||||||||||||||
| RMB | ||||||||||||||||||||||||
| (In millions) | ||||||||||||||||||||||||
| Revenues |
— | 22 | 92,326 | 67,001 | (24,751 | ) | 134,598 | |||||||||||||||||
| Share of income of the VIEs and VIEs’ subsidiaries |
4,021 | 501 | — | — | (4,522 | ) | — | |||||||||||||||||
| Net income |
20,315 | 1,819 | 19,235 | 4,202 | (24,022 | ) | 21,549 | |||||||||||||||||
| For the Year Ended December 31, 2022 | ||||||||||||||||||||||||
| Baidu Inc. |
Primary Beneficiaries of VIEs excluding Baidu, Inc. |
Other Subsidiaries |
VIEs and VIEs’ subsidiaries |
Eliminations | Consolidated Total |
|||||||||||||||||||
| RMB | ||||||||||||||||||||||||
| (In millions) | ||||||||||||||||||||||||
| Revenues |
— | 14 | 82,471 | 62,121 | (20,931 | ) | 123,675 | |||||||||||||||||
| Share of income of the VIEs and VIEs’ subsidiaries |
158 | 164 | — | — | (322 | ) | — | |||||||||||||||||
| Net income (loss) |
7,559 | (272 | ) | 11,640 | 212 | (11,605 | ) | 7,534 | ||||||||||||||||
| For the Year Ended December 31, 2021 | ||||||||||||||||||||||||
| Baidu Inc. |
Primary Beneficiaries of VIEs excluding Baidu, Inc. |
Other Subsidiaries |
VIEs and VIEs’ subsidiaries |
Eliminations | Consolidated Total |
|||||||||||||||||||
| RMB | ||||||||||||||||||||||||
| (In millions) | ||||||||||||||||||||||||
| Revenues |
— | 4 | 83,424 | 61,380 | (20,315 | ) | 124,493 | |||||||||||||||||
| Share of loss of the VIEs and VIEs’ subsidiaries |
(276 | ) | (2,067 | ) | — | — | 2,343 | — | ||||||||||||||||
| Net income (loss) |
10,226 | (6,248 | ) | 16,330 | (220 | ) | (12,497 | ) | 7,591 | |||||||||||||||
11
Table of Contents
Selected Condensed Consolidating Balance Sheets Information
| As of December 31, 2023 | ||||||||||||||||||||||||
| Baidu, Inc. |
Primary Beneficiaries of VIEs excluding Baidu, Inc. |
Other Subsidiaries |
VIEs and VIEs’ subsidiaries |
Eliminations | Consolidated Total |
|||||||||||||||||||
| RMB | ||||||||||||||||||||||||
| (In millions) | ||||||||||||||||||||||||
| Assets |
||||||||||||||||||||||||
| Cash and cash equivalents |
5,463 | 406 | 14,524 | 4,838 | — | 25,231 | ||||||||||||||||||
| Short-term investments, net |
4,338 | — | 159,277 | 5,055 | — | 168,670 | ||||||||||||||||||
| Accounts receivable, net |
— | — | 3,206 | 7,642 | — | 10,848 | ||||||||||||||||||
| Others |
13 | 42 | 17,165 | 8,286 | — | 25,506 | ||||||||||||||||||
| Total current assets |
9,814 | 448 | 194,172 | 25,821 | — | 230,255 | ||||||||||||||||||
| Fixed assets, net |
217 | — | 18,659 | 9,084 | — | 27,960 | ||||||||||||||||||
| Intangible assets, net |
— | — | 46 | 835 | — | 881 | ||||||||||||||||||
| Licensed copyrights, net |
— | — | 5,016 | 1,951 | — | 6,967 | ||||||||||||||||||
| Produced content, net |
— | — | 1,028 | 12,349 | — | 13,377 | ||||||||||||||||||
| Long-term investments, net |
423 | 354 | 29,752 | 17,428 | — | 47,957 | ||||||||||||||||||
| Long-term time deposits and held-to-maturity investments |
2,528 | — | 21,808 | 330 | — | 24,666 | ||||||||||||||||||
| Investments in subsidiaries |
298,642 | 958 | — | — | (299,600 | ) | — | |||||||||||||||||
| Contractual interests in the VIEs and VIEs’ subsidiaries(1) |
3,654 | — | 23,859 | — | (27,513 | ) | — | |||||||||||||||||
| Operating lease right-of-use assets |
— | — | 4,610 | 6,241 | — | 10,851 | ||||||||||||||||||
| Others |
— | 152 | 32,427 | 11,266 | — | 43,845 | ||||||||||||||||||
| Total non-current assets |
305,464 | 1,464 | 137,205 | 59,484 | (327,113 | ) | 176,504 | |||||||||||||||||
| Amounts due from the entities within Baidu(2) |
— | 24,823 | — | — | (24,823 | ) | — | |||||||||||||||||
| Total assets |
315,278 | 26,735 | 331,377 | 85,305 | (351,936 | ) | 406,759 | |||||||||||||||||
| Liabilities |
||||||||||||||||||||||||
| Accounts payable and accrued liabilities |
572 | 41 | 20,719 | 16,385 | — | 37,717 | ||||||||||||||||||
| Customers’ deposits and deferred revenue |
— | — | 6,620 | 8,007 | — | 14,627 | ||||||||||||||||||
| Operating lease liabilities |
— | — | 225 | 2,883 | — | 3,108 | ||||||||||||||||||
| Others |
6,029 | 2,802 | 5,387 | 6,781 | — | 20,999 | ||||||||||||||||||
| Total current liabilities |
6,601 | 2,843 | 32,951 | 34,056 | — | 76,451 | ||||||||||||||||||
| Operating lease liabilities |
— | — | 120 | 4,920 | — | 5,040 | ||||||||||||||||||
| Others |
49,115 | 8,144 | 3,568 | 1,833 | — | 62,660 | ||||||||||||||||||
| Total non-current liabilities |
49,115 | 8,144 | 3,688 | 6,753 | — | 67,700 | ||||||||||||||||||
| Amounts due to the entities within Baidu(2) |
15,936 | — | 696 | 13,985 | (30,617 | ) | — | |||||||||||||||||
| Total liabilities |
71,652 | 10,987 | 37,335 | 54,794 | (30,617 | ) | 144,151 | |||||||||||||||||
| Redeemable noncontrolling interests |
— | 6,090 | 3,261 | 114 | — | 9,465 | ||||||||||||||||||
| Equity |
||||||||||||||||||||||||
| Total Baidu shareholders’ equity(3) |
243,626 | 3,060 | 290,746 | 27,513 | (321,319 | ) | 243,626 | |||||||||||||||||
| Noncontrolling interests |
— | 6,598 | 35 | 2,884 | — | 9,517 | ||||||||||||||||||
| Total equity |
243,626 | 9,658 | 290,781 | 30,397 | (321,319 | ) | 253,143 | |||||||||||||||||
| Total liabilities, redeemable noncontrolling interests and equity |
315,278 | 26,735 | 331,377 | 85,305 | (351,936 | ) | 406,759 | |||||||||||||||||
12
Table of Contents
| As of December 31, 2022 | ||||||||||||||||||||||||
| Baidu, Inc. |
Primary Beneficiaries of VIEs excluding Baidu, Inc. |
Other Subsidiaries |
VIEs and VIEs’ subsidiaries |
Eliminations | Consolidated Total |
|||||||||||||||||||
| RMB | ||||||||||||||||||||||||
| (In millions) | ||||||||||||||||||||||||
| Assets |
||||||||||||||||||||||||
| Cash and cash equivalents |
18,691 | 4,351 | 26,333 | 3,781 | — | 53,156 | ||||||||||||||||||
| Short-term investments, net |
5,485 | — | 110,704 | 4,650 | — | 120,839 | ||||||||||||||||||
| Accounts receivable, net |
— | — | 3,325 | 8,408 | — | 11,733 | ||||||||||||||||||
| Others |
— | 48 | 18,587 | 8,487 | — | 27,122 | ||||||||||||||||||
| Total current assets |
24,176 | 4,399 | 158,949 | 25,326 | — | 212,850 | ||||||||||||||||||
| Fixed assets, net |
225 | — | 16,124 | 7,624 | — | 23,973 | ||||||||||||||||||
| Intangible assets, net |
— | — | 45 | 1,209 | — | 1,254 | ||||||||||||||||||
| Licensed copyrights, net |
— | — | 4,889 | 1,952 | — | 6,841 | ||||||||||||||||||
| Produced content, net |
— | — | 468 | 12,534 | — | 13,002 | ||||||||||||||||||
| Long-term investments, net |
— | 365 | 36,775 | 18,157 | — | 55,297 | ||||||||||||||||||
| Long-term time deposits and held-to-maturity investments |
— | — | 23,329 | 300 | — | 23,629 | ||||||||||||||||||
| Investments in subsidiaries |
274,483 | 243 | — | — | (274,726 | ) | — | |||||||||||||||||
| Contractual interests in the VIEs and VIEs’ subsidiaries(1) |
884 | — | 23,778 | — | (24,662 | ) | — | |||||||||||||||||
| Operating lease right-of-use assets |
— | — | 4,905 | 5,460 | — | 10,365 | ||||||||||||||||||
| Others |
— | 152 | 32,781 | 10,829 | — | 43,762 | ||||||||||||||||||
| Total non-current assets |
275,592 | 760 | 143,094 | 58,065 | (299,388 | ) | 178,123 | |||||||||||||||||
| Amounts due from the entities within Baidu(2) |
— | 22,648 | 3,206 | — | (25,854 | ) | — | |||||||||||||||||
| Total assets |
299,768 | 27,807 | 305,249 | 83,391 | (325,242 | ) | 390,973 | |||||||||||||||||
| Liabilities |
||||||||||||||||||||||||
| Accounts payable and accrued liabilities |
616 | 167 | 21,482 | 15,749 | — | 38,014 | ||||||||||||||||||
| Customers’ deposits and deferred revenue |
— | — | 5,729 | 7,387 | — | 13,116 | ||||||||||||||||||
| Operating lease liabilities |
— | — | 255 | 2,554 | — | 2,809 | ||||||||||||||||||
| Others |
6,904 | 8,305 | 5,804 | 4,678 | — | 25,691 | ||||||||||||||||||
| Total current liabilities |
7,520 | 8,472 | 33,270 | 30,368 | — | 79,630 | ||||||||||||||||||
| Operating lease liabilities |
— | — | 245 | 4,565 | — | 4,810 | ||||||||||||||||||
| Others |
53,614 | 9,568 | 3,448 | 2,098 | — | 68,728 | ||||||||||||||||||
| Total non-current liabilities |
53,614 | 9,568 | 3,693 | 6,663 | — | 73,538 | ||||||||||||||||||
| Amounts due to the entities within Baidu(2) |
15,156 | — | — | 18,743 | (33,899 | ) | — | |||||||||||||||||
| Total liabilities |
76,290 | 18,040 | 36,963 | 55,774 | (33,899 | ) | 153,168 | |||||||||||||||||
| Redeemable noncontrolling interests |
— | 5,604 | 2,678 | 111 | — | 8,393 | ||||||||||||||||||
| Equity |
||||||||||||||||||||||||
| Total Baidu shareholders’ equity(3) |
223,478 | 1,041 | 265,640 | 24,662 | (291,343 | ) | 223,478 | |||||||||||||||||
| Noncontrolling interests |
— | 3,122 | (32 | ) | 2,844 | — | 5,934 | |||||||||||||||||
| Total equity |
223,478 | 4,163 | 265,608 | 27,506 | (291,343 | ) | 229,412 | |||||||||||||||||
| Total liabilities, redeemable noncontrolling interests and equity |
299,768 | 27,807 | 305,249 | 83,391 | (325,242 | ) | 390,973 | |||||||||||||||||
Note:
| (1) | It represents the elimination of the contractual interests in the VIEs and VIEs’ subsidiaries, which includes contractual interests in the VIEs through loans to nominee shareholders or capital contributions and the primary beneficiaries’ share of income (loss) from the VIEs and VIEs’ subsidiaries. |
13
Table of Contents
| (2) | It represents the elimination of intercompany balances among Baidu, Inc., the primary beneficiaries, other subsidiaries and the VIEs and VIEs’ subsidiaries. The short-term loans and long-term loans provided to the VIEs and VIEs’ subsidiaries were RMB9.9 billion (US$1.4 billion) and RMB3.4 billion (US$479 million), respectively, as of December 31, 2023 and RMB8.8 billion and RMB8.1 billion, respectively, as of December 31, 2022. |
| (3) | The loans provided to the nominee shareholders were RMB19.2 billion (US$2.7 billion) and RMB19.1 billion as of December 31, 2023 and 2022, respectively, which will mature from 2027 to 2047. The loans provided to the nominee shareholders were to fund the capitalization of the VIEs for which the Company does not intend to seek repayment. The term of all such loans provided to the nominee shareholders has historically been extended prior to their respective original maturity dates, and we will continue to extend the term of all outstanding loans before they become due. |
Selected Condensed Consolidating Cash Flows Information
| For the Year Ended December 31, 2023 | ||||||||||||||||||||||||
| Baidu, Inc. |
Primary Beneficiaries of VIEs excluding Baidu, Inc. |
Other Subsidiaries |
VIEs and VIEs’ subsidiaries |
Eliminations | Consolidated Total |
|||||||||||||||||||
| RMB | ||||||||||||||||||||||||
| (In millions) | ||||||||||||||||||||||||
| Net cash (used in)/provided by operating activities |
(2,012 | ) | (361 | ) | 33,660 | 5,328 | — | 36,615 | ||||||||||||||||
| Net cash provided by/ (used in) investing activities |
2,592 | 237 | (41,608 | ) | (2,381 | ) | (9,237 | ) | (50,397 | ) | ||||||||||||||
| Including: Cash contribution to VIEs and VIEs’ subsidiaries(1)(2) |
— | — | (58 | ) | — | 58 | — | |||||||||||||||||
| Loans provided to VIEs and VIEs’ subsidiaries(3) |
— | — | (1,492 | ) | — | 1,492 | — | |||||||||||||||||
| Loans repayments from VIEs and VIEs’ subsidiaries(3) |
— | — | 5,150 | — | (5,150 | ) | — | |||||||||||||||||
| Net cash used in financing activities |
(13,881 | ) | (3,863 | ) | (3,657 | ) | (1,998 | ) | 9,237 | (14,162 | ) | |||||||||||||
| Including: Cash contribution to VIEs and VIEs’ subsidiaries(1)(2) |
— | — | — | 58 | (58 | ) | — | |||||||||||||||||
| Loans provided to VIEs and VIEs’ subsidiaries(3) |
— | — | — | 1,492 | (1,492 | ) | — | |||||||||||||||||
| Loans repayments from VIEs and VIEs’ subsidiaries(3) |
— | — | — | (5,150 | ) | 5,150 | — | |||||||||||||||||
14
Table of Contents
| For the Year Ended December 31, 2022 | ||||||||||||||||||||||||
| Baidu, Inc. |
Primary Beneficiaries of VIEs excluding Baidu, Inc. |
Other Subsidiaries |
VIEs and VIEs’ subsidiaries |
Eliminations | Consolidated Total |
|||||||||||||||||||
| RMB | ||||||||||||||||||||||||
| (In millions) | ||||||||||||||||||||||||
| Net cash (used in)/provided by operating activities |
(2,418 | ) | (161 | ) | 25,664 | 2,938 | 147 | 26,170 | ||||||||||||||||
| Net cash provided by/ (used in) investing activities |
2,753 | (2,773 | ) | (21,268 | ) | (1,898 | ) | 19,242 | (3,944 | ) | ||||||||||||||
| Including: Cash contribution to VIEs and VIEs’ subsidiaries(1)(2) |
— | — | (65 | ) | — | 65 | — | |||||||||||||||||
| Loans provided to VIEs and VIEs’ subsidiaries(3) |
— | — | (5,313 | ) | — | 5,313 | — | |||||||||||||||||
| Loans repayments from VIEs and VIEs’ subsidiaries(3) |
— | — | 6,480 | — | (6,480 | ) | — | |||||||||||||||||
| Net cash provided by/ (used in) financing activities |
6,054 | 5,580 | 1,429 | (64 | ) | (19,389 | ) | (6,390 | ) | |||||||||||||||
| Including: Cash contribution to VIEs and VIEs’ subsidiaries(1)(2) |
— | — | — | 65 | (65 | ) | — | |||||||||||||||||
| Loans provided to VIEs and VIEs’ subsidiaries(3) |
— | — | — | 5,313 | (5,313 | ) | — | |||||||||||||||||
| Loans repayments from VIEs and VIEs’ subsidiaries(3) |
— | — | — | (6,480 | ) | 6,480 | — | |||||||||||||||||
15
Table of Contents
| For the Year Ended December 31, 2021 | ||||||||||||||||||||||||
| Baidu, Inc. |
Primary Beneficiaries of VIEs excluding Baidu, Inc. |
Other Subsidiaries |
VIEs and VIEs’ subsidiaries |
Eliminations | Consolidated Total |
|||||||||||||||||||
| RMB | ||||||||||||||||||||||||
| (In millions) | ||||||||||||||||||||||||
| Net cash (used in)/provided by operating activities |
(1,853 | ) | (371 | ) | 18,080 | 4,121 | 145 | 20,122 | ||||||||||||||||
| Net cash used in investing activities |
(16,183 | ) | (3,564 | ) | (25,522 | ) | (7,551 | ) | 21,376 | (31,444 | ) | |||||||||||||
| Including: Cash contribution to VIEs and VIEs’ subsidiaries(1)(2) |
— | — | (1,408 | ) | — | 1,408 | — | |||||||||||||||||
| Loans provided to VIEs and VIEs’ subsidiaries(3) |
— | — | (5,520 | ) | — | 5,520 | — | |||||||||||||||||
| Net cash provided by/(used in) financing activities |
25,628 | (272 | ) | 15,562 | 3,999 | (21,521 | ) | 23,396 | ||||||||||||||||
| Including: Cash contribution to VIEs and VIEs’ subsidiaries(1)(2) |
— | — | — | 1,408 | (1,408 | ) | — | |||||||||||||||||
| Loans provided to VIEs and VIEs’ subsidiaries(3) |
— | — | — | 5,520 | (5,520 | ) | — | |||||||||||||||||
Note:
| (1) | For the years ended December 31, 2021, 2022 and 2023, the primary beneficiaries designated its subsidiaries to provide loans totaling RMB409 million, RMB65 million and RMB58 million (US$8 million), respectively, to the nominee shareholders to fund the capitalization of the VIEs and VIEs’ subsidiaries for which the primary beneficiaries do not intend to seek repayment, and nil was repaid by the nominee shareholders. |
| (2) | For the years ended December 31, 2021, 2022 and 2023, the VIEs and VIEs’ subsidiaries received RMB1.0 billion, nil and nil, respectively, as capital contribution from other subsidiaries. |
| (3) | For the years ended December 31, 2021, 2022 and 2023, the VIEs and VIEs’ subsidiaries received RMB5.5 billion, RMB5.3 billion and RMB1.5 billion (US$210 million), respectively, as loans from other subsidiaries and the VIEs and VIEs’ subsidiaries repaid principal amounts of nil, RMB6.5 billion and RMB5.2 billion (US$725 million), respectively, to other subsidiaries. |
16
Table of Contents
| B. | Capitalization and Indebtedness |
Not applicable.
| C. | Reasons for the Offer and Use of Proceeds |
Not applicable.
| D. | Risk Factors |
Summary of Risk Factors
An investment in our ADSs or Class A ordinary shares involves significant risks. Below is a summary of material risks we face, organized under relevant headings. All the operational risks associated with being based in and having operations in mainland China also apply to operations in Hong Kong. With respect to the legal risks associated with being based in and having operations in mainland China, the laws, regulations and the discretion of mainland China government authorities discussed in this annual report are expected to apply to mainland China entities and businesses, rather than entities or businesses in Hong Kong which operate under a different set of laws from mainland China. These risks are discussed more fully in Item 3.D. Key Information—Risk Factors.
Risks Related to Our Business and Industry
| • | If we fail to retain existing customers or attract new customers for our online marketing services, our business, results of operations and growth prospects could be seriously harmed; |
| • | Our business and results of operations could continue to be materially and adversely affected by the challenging macroeconomic environment impacting online marketing demand; |
| • | Our business depends on a strong brand, and if we are unable to maintain and enhance our brand, our business and results of operations may be harmed; |
| • | We face risks arising from our termination of the share purchase agreement for our proposed acquisition of YY Live; |
| • | We face significant competition and may suffer from loss of users and customers as a result; |
| • | If our expansions into new businesses are not successful, our results of operation and growth prospects may be materially and adversely affected; |
| • | We have made significant investments in foundation models and generative AI and may face uncertainties with respect to their commercialization and the evolving laws and regulations applicable to us; |
| • | We have experienced slowdowns and declines in our revenues, and we may sustain net loss from time to time, and we may experience downward pressure on our operating and profit margins in the future; |
| • | Potential issues in the adoption and use of artificial intelligence in our product offerings may result in reputational harm or liability; and |
| • | If we fail to continue to innovate and provide products, services and high-quality internet experience that attract and retain users, we may not be able to remain competitive; we may expend significant resources in order to remain competitive. |
17
Table of Contents
Risks Related to Our Corporate Structure
| • | Our company is a Cayman Islands holding company with no equity ownership in the variable interest entities and we conduct our operations in mainland China through (i) our mainland China subsidiaries and (ii) the variable interest entities with which we have maintained contractual arrangements. Investors in our Class A ordinary shares or the ADSs thus are not purchasing equity interest in the variable interest entities in mainland China but instead are purchasing equity interest in a Cayman Islands holding company. If the PRC government deems that our contractual arrangements with the variable interest entities do not comply with mainland China’s regulatory restrictions on foreign investment in the relevant industries, or if these regulations or the interpretation of existing regulations change or are interpreted differently in the future, we could be subject to severe penalties or be forced to relinquish our interests in those operations. Our holding company in the Cayman Islands, the variable interest entities, and investors of our company face uncertainty about potential future actions by the PRC government that could affect the enforceability of the contractual arrangements with the variable interest entities and, consequently, significantly affect the financial performance of the variable interest entities and our company as a group; |
| • | Our contractual arrangements with the variable interest entities in mainland China and the individual nominee shareholders may not be as effective in providing control over these entities as direct ownership; and |
| • | We are in the process of registering the pledges of equity interests by nominee shareholders of some of the variable interest entities, and we may not be able to enforce the equity pledges against any third parties who acquire the equity interests in good faith in the relevant variable interest entities before the pledges are registered. |
Risks Related to Doing Business in China
| • | Changes in China’s economic, political or social conditions or government policies could have a material and adverse effect on our business and operations; |
| • | The approval of and/or filing with the CSRC or other PRC government authorities may be required in connection with our offshore offerings under the laws of mainland China, and, if required, we cannot predict whether or for how long we will be able to obtain such approval or complete such filing; |
| • | There are uncertainties regarding the interpretation and enforcement of PRC laws, rules and regulations; |
| • | We may be adversely affected by the complexity, uncertainties and changes in the regulations of internet and related business and companies in mainland China; |
| • | Failure to meet the PRC government’s complex regulatory requirements on our business operation could have a material adverse effect on our operations and the value of our securities; |
| • | Any failure or perceived failure by us to comply with the enacted Guidelines to Anti-Monopoly in the Field of Internet Platforms and other anti-monopoly laws and regulations may result in governmental investigations or enforcement actions, litigation or claims against us and could have an adverse effect on our business, financial condition and results of operations; |
| • | It may be difficult for overseas regulators to conduct investigation or collect evidence within mainland China; |
| • | The PCAOB had historically been unable to inspect our auditor in relation to their audit work performed for our financial statements and the inability of the PCAOB to conduct inspections of our auditor in the past has deprived our investors with the benefits of such inspections; and |
| • | Our ADSs may be prohibited from trading in the United States under the HFCAA in the future if the PCAOB is unable to inspect or investigate completely auditors located in China. The delisting or |
18
Table of Contents
| prohibition of trading of the ADSs, or the threat of their being delisted or prohibited from trading, may materially and adversely affect the value of your investment. |
Risks Related to our ADSs and Class A Ordinary Shares
| • | The trading price of our ADSs and/or our Class A ordinary shares has been and is likely to continue to be volatile regardless of our operating performance; |
| • | We adopt different practices as to certain matters as compared with many other companies primarily listed on the Hong Kong Stock Exchange; |
| • | Substantial future sales or perceived potential sales of our Class A ordinary shares and/or ADSs in the public market could cause the price of our Class A ordinary shares and/or ADSs to decline; and |
| • | The different characteristics of the capital markets in Hong Kong and the U.S. may negatively affect the trading prices of our Class A ordinary shares and/or ADSs. |
Risks Related to Our Business and Industry
If we fail to retain existing customers or attract new customers for our online marketing services, our business, results of operations and growth prospects could be seriously harmed.
We generate a substantial majority of our revenues from online marketing services. Our online marketing customers will not continue to do business with us if their investment does not generate sales leads and ultimately consumers, or if we do not deliver their web pages in an appropriate and effective manner. Our online marketing customers may choose to discontinue their business with us, which are not subject to fixed-term contracts. In addition, third parties may develop and use certain technologies to block the display of our customers’ advertisements and other marketing products on our Baidu platform, which may in turn cause us to lose customers and adversely affect our results of operations. Furthermore, as our P4P services enable our customers to bid for priority placement of their paid sponsored links, we may lose customers if they find the bidding mechanism not cost effective or otherwise not attractive. Additionally, if our users do not increase their engagement on our platform, or our content ecosystem fails to offer rich and quality content that meets users’ tastes and preferences, or our users spend more time with or otherwise satisfy their content consumption demands on competing platforms, or we otherwise experience user traffic decline due to any reason, it would be difficult for us to attract new customers or retain existing customers. If our customers determine that their expenditures on our platform do not generate the returns they expect, they may allocate a greater portion or all of their advertising budgets to other advertising channels, such as other online marketing platforms, television and outdoor media, and reduce or discontinue business with us. Since most of our customers are not bound by long-term contracts, they may amend or terminate their advertising arrangements with us with little advance notice under certain circumstances. Failure to retain our existing customers or attract new customers for our online marketing services could seriously harm our business, results of operations and growth prospects. We have recorded substantial customer deposits and deferred revenue, which mainly consist of deposits received from certain customers of our online marketing services. If we are unable to fulfill our obligation in respect of such customer deposits and deferred revenue, we may have to refund the balance to our customers and our cash flow and liquidity position would be materially adversely affected.
We have in the past removed, and may in the future again remove, questionable listings or advertisements to ensure the quality and reliability of our search results and/or information feed. Such removal, whether temporary or permanent, may cause affected customers to discontinue their business with us or negatively impact our relationships with affected Baidu Union partners. We also examine the relevant business licenses and bank accounts of prospective customers prior to business engagement, as a quality control measure. In addition, we have taken steps to implement measures requested by PRC regulatory authorities, such as modifying paid search practices and limiting the displays of advertisements in connection with certain industries. We have also proactively implemented numerous additional measures to deliver a better user experience and build a safer and
19
Table of Contents
more trustworthy platform for users. Such measures have had a negative impact on the number of customers and our revenues, although we believe such impact is likely to be temporary. Regulations on online marketing services in mainland China are evolving, and uncertainties remain with respect to the implementation of and compliance with new regulations that may emerge, which in turn may have a material adverse impact on our business, results of operations and growth prospects.
Our business and results of operations could continue to be materially and adversely affected by the challenging macroeconomic environment impacting online marketing demand.
Online marketing services continue to be a primary source of our revenues. While revenues from online marketing services increased in 2021 and 2023, they declined in 2020 and 2022 mainly due to the weakness in online advertising demand as our customers faced a challenging macroeconomic environment in their respective industries and in the general economy, in part due to the significant adverse impact of the COVID-19 pandemic. Our business and results of operations could continue to be materially and adversely affected by the challenging macroeconomic environment as well as by trends in online marketing through internet searches or feeds. With the evolution of the internet in China, customers have many channels to conduct online marketing and promotions. As users may not spend as much time on search-plus-newsfeed as they do on other types of internet platforms, many current and potential customers may not allocate as much of their marketing budgets to online marketing through search-plus-newsfeed, as compared to other methods of online marketing. Our ability to increase revenue and profitability from online marketing may be adversely impacted by a number of factors, many of which are beyond our control, including but not limited to:
| • | difficulties associated with developing and maintaining a larger user base with demographic characteristics attractive to online marketing customers and maintaining and increasing user engagement; |
| • | increased competition and potential re-allocation of marketing budgets and downward pressure on online marketing prices, for example, resulting from an oversupply of advertising inventory released into the market; |
| • | higher customer acquisition costs due in part to the limited experience of small to medium-sized enterprises, or SMEs, with the internet as a marketing channel or due to competition; |
| • | decreased use of our search and paid click because search queries are increasingly being undertaken via voice-activated smart devices, apps, social media or other online platforms; |
| • | ineffectiveness of our online marketing delivery, tracking and reporting systems; |
| • | decreased use of internet or online marketing in China; and |
| • | tightened regulatory environment in mainland China’s internet space. |
Our business depends on a strong brand, and if we are unable to maintain and enhance our brand, our business and results of operations may be harmed.
We believe that our brand “Baidu” has contributed significantly to the success of our business. We also believe that maintaining and enhancing the “Baidu” brand is critical to increasing the number of our users, customers, Baidu Union partners and content providers, as well as to expanding our developer communities and to attracting and retaining enterprise and public sector customers and partners. We have conducted various marketing and brand promotion activities, but we cannot assure you that these activities will achieve the brand promotion effect that we expect. If we fail to maintain and further promote the “Baidu” brand, or if we incur excessive expenses in this effort, our business and results of operations may be materially and adversely affected.
In addition, any negative publicity about us, our products and services, our employees, our business practices, our search results or the platform to which our search results link, regardless of its veracity, could harm
20
Table of Contents
our brand image and in turn adversely affect our business and results of operations. We cannot assure you that we will be able to defuse negative publicity to the satisfaction of our investors, users, customers and business partners. From time to time, there has been negative publicity about us, our brand image, our value proposition and our business practice, which has adversely affected our public image and reputation during certain periods of intense negative publicity. Moreover, our platform and services by nature may from time to time be related to, or perceived to be related to, certain controversial public events or discussion, leading to public criticism against us. The negative publicity surrounding similar incidents have resulted in significant adverse impact on our public image and reputation. Intense negative publicity may divert our management’s attention and may adversely impact our business. We cannot assure you that our brand, public image and reputation will not be materially and adversely affected in the future.
We face risks arising from our termination of the share purchase agreement for our proposed acquisition of YY Live.
Baidu (Hong Kong) Limited, our wholly-owned subsidiary, entered into definitive agreements with JOYY Inc. and certain of its affiliates, which are collectively referred to as JOYY, to acquire JOYY’s domestic video-based entertainment live streaming business in China, known as YY Live, on November 16, 2020, and subsequently amended and supplemented the share purchase agreement, including on February 7, 2021. The closing of this acquisition was subject to certain conditions, including, among others, obtaining necessary regulatory approvals from government authorities, and the share purchase agreement was subject to termination by either party if the closing did not occur by the long stop date. We have paid an aggregate of US$1.9 billion, after considering working capital adjustment of US$0.1 billion, to JOYY and its designated escrow account, and deposited an aggregate of US$1.6 billion into several escrow accounts, in accordance with the terms and schedule set forth in the share purchase agreement. Despite good faith efforts, the closing conditions provided for in the share purchase agreement had not been fully satisfied as of December 31, 2023, the long stop date, and on January 1, 2024, we exercised our right to terminate the share purchase agreement based on the terms of the share purchase agreement. As a result of the termination, we are not able to achieve the intended objectives, benefits or opportunities associated with the proposed acquisition, despite the significant diversion of resources and management attention to date. We are in discussion with JOYY on the next steps following the termination of the share purchase agreement. However, there is no guarantee that a mutually satisfactory solution can be reached between both parties. If no mutually satisfactory solution is reached by both parties, we may be subject to claims, disputes or legal proceedings in connection with this transaction. Resolving such claims, disputes or legal proceedings could be time-consuming and would divert the attention and efforts of our management. There is no guarantee that we will prevail in these claims, disputes or legal proceedings. There may be uncertainties related to our recovery as to our payments and deposits held in escrow accounts. As a result, our business, prospects, reputation, liquidity, financial condition and operating results and the value of our securities could be materially and adversely affected.
We face significant competition and may suffer from loss of users and customers as a result.
We face significant competition in almost every aspect of our business. For our Baidu Core businesses, our primary competitors are mainly internet companies, online marketing platforms in China and other search engines. We compete with these entities for both users and customers on the basis of user traffic, cyber security quality (relevance) of search (and other marketing and advertising) results, availability and user experience products and services, distribution channels and the number of associated third-party websites. iQIYI competes with other internet media and entertainment services, such as internet and social platforms and short-form video platforms, as well as major TV stations. iQIYI competes with these market players for both users and advertising customers, and primarily on the basis of obtaining IP rights to popular content, conducting brand promotions and other marketing activities, and making investments in and acquisitions of business partners. See “Item 4.B. Information on the Company—Business Overview—Competition.” Some of our competitors have significant financial resources and long operating histories and are experienced in attracting and retaining their users,
21
Table of Contents
accommodating their users’ habits and preferences and managing customers. They may use their experience and resources to compete with us in a variety of ways, including competing for users and their time, customers, third-party agents, content, strategic partners and networks of third-party websites/wapsites, investing more heavily in research and development and making investments and acquisitions. Our business environment is rapidly evolving and competitive. Our business faces changing technologies, shifting user needs, and frequent introductions of rival products and services. Some of our competitors in the search sector may have innovative business models, extensive distribution network or proprietary content or technologies that may provide users with better user experience and customers with better services. They may use their resources in ways that could affect our competitive position, including developing new products, making acquisitions, continuing to invest heavily in research and development and in talent, and continuing to compete aggressively for users, advertisers, customers, the acquisition of traffic and content. If any of our competitors provides comparable or better Chinese language search and feed experience or internet video services, our user traffic could decline significantly. Additionally, if the channels and properties that we use to distribute services or products to our users and customers are no longer available to us, we may experience a decline in user traffic. Any such decline in traffic could weaken our brand and result in loss of users and customers, which could have a material and adverse effect on our results of operations.
There are vertical service providers in the forms of mobile apps and/or websites that allow users to search within their closed ecosystems. These players often purchase traffic from search engines and try to retain their users by offering comprehensive services on their platforms. As these vertical service providers expand, though they will continue to acquire traffic from search engines, their reliance on search engines may decline, especially if they can consolidate their industry verticals.
We also face competition from other types of advertising media, including traditional advertising media, such as newspapers, magazines, yellow pages, billboards, other forms of outdoor media, television and radio, mobile apps, webcasting and online video. Large companies in China generally allocate, and may continue to allocate, a limited portion of their budgets to online marketing, as opposed to traditional advertising and other forms of advertising media. If these companies do not devote a larger portion of their marketing budgets to online marketing services provided by us, or if our existing customers reduce the amount they spend on online marketing, our results of operations and growth prospects could be adversely affected.
If our expansions into new businesses are not successful, our results of operation and growth prospects may be materially and adversely affected.
As part of our growth strategy, we enter into new businesses from time to time to generate additional revenue streams and through our development of new business lines or strategic investments in or acquisitions of other businesses. Expansions into new businesses may present operating, marketing and compliance challenges that differ from those that we currently encounter.
We have invested significant resources in the research and development of AI technology and have made significant progress in the commercialization of AI-enabled offerings, including in-app services, cloud services and solutions, intelligent driving services and solutions and smart devices and services. We plan to continue to invest capital and other resources into our AI-enabled business operations, in particular, generative AI and foundation models. However, AI technology is rapidly evolving with significant uncertainties, and we cannot assure you that our investment and exploration in AI technology and AI-enabled products and services will be successful. Our operating results may also suffer if our innovation is not responsive to the needs of our users, customers and partners, inappropriately timed with market opportunities, or marketed ineffectively. For example, we have limited experience with operating and scaling AI-enabled business, including cloud services and solutions, intelligent driving services and solutions and smart devices and services, which could subject us to various challenges and risks, including developing and managing relationships with enterprises and public sector customers and partners, who are likely to have different needs and preferences from our existing customers, users and partners, highly competitive procurement processes, instances of corrupt practices or other illegal gains,
22
Table of Contents
longer receivable payment cycles and lower collection rates. We also may not alter our business practices in time to avoid or reduce adverse effects from any of the foregoing risks. In addition, our AI-enabled business requires very different products and services, sales and marketing channels and internal operational systems and processes. These requirements could disrupt our current operations and harm our financial condition and operating results, especially during the initial stage of investment, development and scaling of our new AI-enabled offerings.
We may also enter into other markets and industries/industry verticals that are new to us through organic business initiatives or investment and acquisitions, such as generative AI, robotaxis, intelligent electric vehicles, e-commerce, short-video, and healthcare vertical including internet hospital, which may subject us to different and unforeseen risks. However, we cannot assure you that such efforts will be successful due to various factors such as potential regulatory actions taken by government authorities in these new markets. For these new markets and industries/industry verticals, we may not have sufficient experience and may not be able to navigate the rapidly evolving regulatory environment or forecast and meet the continually changing demands and preferences for products and services. Some of these new markets and industries/industry verticals are emerging with relatively novel and untested business models. Any of the foregoing could pose significant challenges to us. We may not realize the anticipated benefits of our investments or acquisitions due to the uncertainties related to the performance and valuation of the relevant targets, or failure to integrate the targets into our existing business, or difficulty in operating the acquired business with our existing expertise and resources. See also “—Our strategy of investments and acquiring complementary businesses and assets may fail.”
It is uncertain whether our strategies will attract users and customers or generate the revenue required to succeed. If we fail to generate sufficient usage of our new products and services, we may not grow revenue in line with the significant resources we invest in these new businesses. This may negatively impact gross margins and operating income. Commercial success of our expansion into new business areas depends on many factors, including innovativeness, competitiveness, effectiveness of distribution and marketing, and pricing and investments strategies, especially in the early stage of competition for market share. For example, the smart transportation industry is highly competitive and fragmented. Our current and potential competitors in this industry range from large and established technology companies to emerging start-ups. Some competitors have longer operating histories in the sector. They can use their experience, resources and network in ways that could affect our competitive position, including making acquisitions, continuing to invest heavily in research and development and in talents, aggressively initiating intellectual property claims (whether or not meritorious), and continuing to compete aggressively for customers, partners and investees. Our competitors may be able to innovate and provide products and services faster than we can or may foresee product-and-service needs before we do. As a result, we may not achieve significant revenues from our new business areas for several years, or at all, and may incur significant losses during the process and fail to recoup our investments. On the other hand, market conditions and general acceptance of products and services could be adversely impacted if other players in the market fail to adopt appropriate business and operational model, develop and offer successful products and services and develop and adapt appropriate technologies and infrastructure. If the markets of our new businesses, such as intelligent driving and electric vehicle, do not develop and grow as we anticipate, we may incur significant loss from our new businesses and our growth prospects may be materially adversely impacted.
In addition, we may encounter regulatory uncertainties related to new business areas that we enter into. The laws and regulations related to AI technology and products are at an early stage of development and still evolving in mainland China. The effects of such laws and regulations remain unclear and may add uncertainties to the development and operation of our AI-related business. For example, as mainland China’s regulatory framework on autonomous driving evolves, we may be required to comply with approval and other compliance requirements for autonomous driving road test, operation and commercialization, internet security and related data collection and sharing promulgated by PRC government authorities from time to time. See “Item 4.B. Information on the Company—Business Overview—Regulations—Regulations on Artificial Intelligence.” We may confront other challenges as we enter new business domains, including the lack of adoption of new products and services, the
23
Table of Contents
lack of management talent in the new business, cost management and other factors required for the expansion of new businesses.
We have made significant investments in foundation models and generative AI and may face uncertainties with respect to their commercialization and the evolving laws and regulations applicable to us.
Foundation models and generative AI technologies have developed rapidly in recent years. For instance, the ChatGPT, a chatbot developed by OpenAI, has been tested by people all over the world since its launch in November 2022. We have made significant investments in foundation models and generative AI and have also allocated significant resources in these areas, including human resources and infrastructure updates. However, foundation models and generative AI are in the initial stages of development and there is no proven business model for commercializing the new technologies. We also face intense competition in these fields as many players in these fields have also devoted significant resources in the research and development of these technologies. In addition, the regulatory and legal framework on generative AI of mainland China is also evolving rapidly. In recent years, the PRC government authorities have released a series of laws and regulations related to generative AI services, including the Administration Provisions on Algorithmic Recommendation of Internet Information Services, the Administrative Provisions on Deep Synthesis of Internet Information Services and the Interim Measures on the Management of Generative AI Services. See “Item 4.B. Information on the Company—Business Overview—Regulations—Regulations on Artificial Intelligence—Regulations on Generative AI.” However, these laws and regulations related to generative AI services are relatively new, and the competent government authorities of mainland China may introduce additional or more detailed laws and regulations to oversee the generative AI services. Therefore, we may need to comply with more compliance requirements in the field of generative AI, which may increase our compliance costs. We also face uncertainties with respect to such evolving laws and regulations as well as their interpretations and our business operations and development may be affected as a result.
We have experienced slowdowns and declines in our revenues, and we may sustain net loss from time to time, and we may experience downward pressure on our operating and profit margins in the future.
From 2019 to 2023, we experienced a slow-down in revenue growth, including decreases from 2019 to 2020 and again from 2021 to 2022, due to various factors such as macroeconomic environment and the impact of the COVID-19 pandemic. We could continue to experience a decline in our revenues, as a result of a number of factors, including changes in the mix of products and services, customer demographics, industry and channel, changes in policy or policy implementation, increase in market competition for marketing and/or new AI offerings, and decrease in pricing arising from an oversupply of advertising inventory in the market, which has been witnessed since 2019. We may also experience a decline in our revenue or revenue growth rate, if there is a decrease in the rate of adoption for our products, services and technologies, or deceleration or decline in demand for platforms used to access our services, among other factors.
Our operating margin and net income attributable to us as a percentage of revenue fluctuated notably from 2019 to 2023 due to various factors such as the macroeconomic environment and the impact of the COVID-19 pandemic. We may experience downward pressure on our operating margin from increasing competition, revenue growth slower than expenses, and increased costs and expenses from many aspects of our business, including within online marketing where revenue growth does not keep up with traffic cost growth and related infrastructure costs to support our online properties, such as Baidu App, video-related and other products requiring huge data transmission and computing power. We may also pay increased fees for our distribution channels, as well as increased content acquisition costs to content providers. Additionally, an increase in personnel-related costs, an increase in spending to promote new products and services, and the expiration of temporary tax exemptions or reductions may dampen our operating margin. We may also experience downward pressure on our operating margin resulting from a variety of factors, such as the expansion of our business into new areas, including generative AI, foundation models, AI cloud, intelligent driving, voice assistant & smart device, all of which have margins much lower than that of online marketing. Our operating margin may also be
24
Table of Contents
negatively impacted from a greater proportion of revenue contributed by new business areas, which has grown faster than online marketing.
In addition, we may also sustain net loss from time to time due to investment impairment and foreign currency fluctuation. The declining operating margin and investment impairment have led to our experiencing net losses in several quarters since 2020, and there is no guarantee that we will not experience loss in the future.
Due to these factors and the evolving nature of our business, our historical revenue growth rate, historical operating margin and historical profitability may not be indicative of our future performance.
Potential issues in the adoption and use of artificial intelligence in our product offerings may result in reputational harm or liability.
We are building AI, including foundation models and generative AI, into many of our product offerings and we expect this element of our business to be a driver for our future growth. We envision a future in which AI operates in our services and applications, such as search-plus-feed, cloud services and solutions, intelligent driving services and solutions and Xiaodu smart devices and services, and the cloud helps our customers become more productive. As with many disruptive innovations, AI presents risks and challenges that could affect its adoption, and, therefore, our business. Our products and services based on AI may not be adopted by our users or customers. AI algorithms may be flawed. Datasets may be insufficient or contain biased information. Inappropriate or controversial data practices by us or others could impair the acceptance of our AI solutions. Our AI-generated content offerings may not be able to compete against those of our competitors. In addition, AI services may involve complex intellectual property issues. However, the laws and regulations in mainland China are still evolving and are subject to further interpretation and implementation. Therefore, AI-generated content could lead to copyright and other legal disputes. Such deficiencies could undermine the decisions, predictions or analysis produced by AI applications, subjecting us to legal liability and potential harm to our brand or reputation. The laws and regulations in mainland China regarding AI are gradually improving, and they require AI service providers or technology supporters to avoid such deficiencies to the maximum extent possible. Although we believe that we have taken necessary measures according to the applicable laws, we cannot guarantee that we will always meet the regulatory requirements in the future. If we fail to meet legal and regulatory requirements, we may be subject to penalties. In addition, some AI scenarios present ethical issues. If we enable or offer AI solutions that are controversial because of their impact on human rights, privacy, employment, or other social issues, we may experience reputational harm or be exposed to liability.
If we fail to continue to innovate and provide products, services and high-quality internet experience that attract and retain users, we may not be able to remain competitive; we may expend significant resources in order to remain competitive.
Our success depends on providing products and services to attract users and enable users to have a high-quality internet experience. In order to attract and retain users and compete against our competitors, we must continue to invest significant resources in research and development to enhance our AI or other new technologies, improve our existing products and services, and introduce additional high-quality products and services. If we are unable to anticipate user preferences or industry changes, enhance the quality of our products and services on a timely basis or fail to provide sufficient content, or provide other consumer-facing services and products, including our maps and smart devices, to our users’ satisfaction, we may suffer a decline in the size of our user base. Our results of operations may also suffer if our innovations do not respond to the needs of our users, are not appropriately timed with market opportunities or are not effectively brought to market. As search, marketing and AI technologies and new forms of devices and apps continue to develop, we may expend significant resources in research and development and strategic investments and acquisitions in order to remain competitive.
25
Table of Contents
If we fail to keep up with technological advancements and upgrades, our business, results of operations and financial condition may be materially and adversely affected.
Our businesses operate in industries that are subject to rapid technological advancements, upgrades and changing consumer needs. Our success will depend on our ability to keep up with the latest developments in technology innovations and commercialization and if we fail to do so successfully, the demand for our products, solutions and services may decline. For instance, applications of technologies similar to ChatGPT to our products and services to cater to consumer needs may be essential for us to remain competitive in the market. In addition, research and development of technological changes and innovations will typically require substantial capital expenditures as well as upgrades of products or services. Furthermore, we may not execute successfully on our development strategy, including because of challenges with regard to technical hurdles that we fail to overcome in a timely fashion. In addition, changes in user behavior resulting from technological developments may also adversely affect us. For example, the number of people accessing the internet through mobile devices and internet of things, or IoTs, such as smartphones, tablets and smart (voice-activated internet) home devices, has increased in recent years, and we expect this trend to continue while 5G and more advanced mobile communications technologies are broadly implemented. If we fail to develop products and technologies that are compatible with all mobile devices, IoTs and operating systems, or if the products and services we develop are not widely accepted and used by users of various mobile devices and IoTs, our position in the internet and AI sectors may be adversely affected. In addition, the widespread adoption of new internet, networking or telecommunications technologies or other technological changes could require substantial expenditures to modify or integrate our products, services or infrastructure. As such, if we fail to adapt our products and services to technological innovations in an effective and timely manner, our business, financial condition and results of operations could be materially and adversely affected.
If our content ecosystem fails to continually offer quality content in a cost effective manner, we may experience declines in user traffic and user engagement, our business and results of operations may be harmed.
Our content ecosystem consists of products developed for our partners, such as Baijiahao, Smart Mini Program, Managed Page, Baidu Union, and internally developed content and services products, such as Baidu Knows, Baidu Wiki, Baidu Health, Baidu Wenku, Baidu Experience, Baidu Post, Haokan, and iQIYI. The success of our content ecosystem depends on our ability to attract content creators and producers to contribute quality content to our platform by leveraging our user traffic and enhance user engagement through the provision of attractive content, so as to create a virtuous cycle. We have relied, and will continue to rely, on third parties for the majority of the content offered in our content ecosystem and some of our products include third party intellectual property. As the competition for quality content becomes increasingly intense in China, we cannot assure you that we will be able to manage our content acquisition costs effectively and generate sufficient revenues to outpace future increase in content spending. We may also be unable to renew some of our content or intellectual property licensing agreements upon their expiration or termination and any renewal of the content or intellectual property licensing agreements may involve higher costs or less favorable terms. If we are not able to license popular premium content on commercially reasonable terms or renew our content or intellectual property licensing agreements, our financial condition and results of operations may be materially and adversely affected. We have undertaken commitments of future minimum payments under non-cancellable agreements for produced content and licensed copyrights. If the content does not achieve anticipated popularity and commercial success, such commitments may not be recoverable. In addition, we rely on users to contribute content to our various products, including Baijiahao, Baidu Knows, Baidu Wiki, Baidu Health, Baidu Experience, Baidu Post, Baidu Wenku, Haokan and iQIYI’s user generated content. If these parties fail to develop and maintain high-quality and engaging content, if our desired premium content becomes exclusive to our competitors, if we are unable to continue to grow our content offerings and stay competitive vis-à-vis other content platforms, or if a large number of our existing relationships are terminated, the attractiveness of our content offerings to users may be severely impaired. If we are unable to offer content that meets users’ tastes and preferences on a continuing basis,
26
Table of Contents
including continually upgrading our content recommendation engines and in a cost effective manner, our user experience may deteriorate, we may suffer from reduced user traffic, our business and results of operations may be harmed.
We have been and may again be subject to legal proceedings, claims and investigations and could be adversely impacted by unfavorable results of legal proceedings and investigations.
We are subject to various legal proceedings, claims and government investigations, penalties or actions that have arisen in the ordinary course of business and have not yet been fully resolved, and new legal proceedings, claims, regulatory investigations, penalties or actions may arise in the future. In addition, agreements entered into by us sometimes include indemnification provisions which may subject us to costs and damages in the event of a claim against an indemnified third party. The existence of litigation, claims, governmental investigations and proceedings have adversely affected and may continue to adversely affect our reputation, business and the trading price of our securities. For example, in 2020, we and certain of our current and former officers, along with iQIYI and certain of its current and former officers and directors, were named as defendants in various federal putative securities class actions, including two ongoing related actions alleging that defendants made false and misleading statements concerning various reported financial and operational results in violation of the federal securities laws. In the event that a court finds that iQIYI, Baidu and/or other defendants violated any of the applicable securities laws, or in the event that iQIYI, Baidu and/or other defendants choose to reach a settlement with the plaintiffs, iQIYI and/or Baidu may be liable for civil monetary damages and the potential financial, operational and reputational impact on iQIYI and/or Baidu may be material. However, we cannot predict the timing, outcome or consequences of these class actions, and there is no basis to conclude at this point whether such actions will be successful or whether we will be subject to any damages, let alone how much. For more details, see “Item 8.A. Financial Information—Consolidated Statements and Other Financial Information—Legal Proceedings.” Regardless of the merit of particular claims, legal proceedings, government investigations and proceedings may result in reputational harm, be expensive to respond, time consuming, disruptive to our operations and distracting to management. In the event we or iQIYI does not prevail or we or iQIYI enters into settlement arrangements in any of these proceedings or investigations, we or iQIYI may incur significant expenses which may materially adversely affect our results of operations.
The outcome of legal proceedings and investigations is inherently uncertain. If one or more legal matters were resolved against us or an indemnified third party in a reporting period for amounts in excess of management’s expectations, our financial condition and operating results for that reporting period could be materially adversely affected. Further, such an outcome could result in significant compensatory, punitive or trebled monetary damages, disgorgement of revenue or profits, remedial corporate measures or injunctive relief against us that could materially adversely affect our financial condition and operating results.
In addition to the content developed and posted on our platform by ourselves, our users may post information on Baidu Post, Baidu Knows, Baidu Wiki, Baidu Wenku and other sections of our platform, our content providers may provide content through Baijiahao platform and our P4P customers may create text-based descriptions, image descriptions and other phrases to be used as text, images or keywords in our search listings, and users can also use our personal cloud computing service to upload, store and share documents, images, audio and videos on our cloud servers. We have been and may continue to be subject to claims and investigations for intellectual property ownership and infringement, defamation, negligence or other legal theories based on the content found on our platform, the results in our paid search listings or our other products and services, which, with or without merit, may result in diversion of management attention and financial resources and negative publicity for our brand and reputation. See “Item 8.A. Financial Information—Consolidated Statements and Other Financial Information—Legal Proceedings.” Furthermore, if the content posted on our platform or found, stored or shared through our other products and services contains information that government authorities find objectionable, our platform or relevant products or services may be shut down and we may be subject to other penalties. See “—Risks Related to Doing Business in China—We may be subject to liability for information displayed on or linked to our websites, mobile apps, Smart Mini Program or Managed Page and negative publicity in international media, and our business may be adversely affected as a result.”
27
Table of Contents
We have been, and may again in the future be, subject to claims, investigations or negative publicity based on the results in our paid search listings. Claims have been filed against us after we allowed certain customers to register keywords containing trademarks, trade names or brand names owned by others and displayed links to such customers’ websites in our paid search listings. While we maintain a database of certain well-known trademarks and continually update our system algorithms and functions to guard against customers keywords containing the well-known trademarks that are owned by others, it is not possible for us to completely prevent our customers from bidding on keywords that contain trademarks, trade names or brand names owned by others. There has been negative publicity about fraudulent information in our paid search listings. Although we have been continually enhancing our technology, control and oversight to prevent fraudulent websites, web pages and information from appearing in our paid search listings, there is no guarantee that the measures we have taken are effective at all times. Claims, investigations and negative publicity based on the results in our paid search listings, regardless of their merit, may divert management attention, severely disrupt our operations, adversely affect our results of operations and harm our reputation.
Our increasing focus on cloud-based services presents execution, competitive and compliance risks; Baidu Core’s results of operations and financial performance may be materially adversely affected by our ability to develop cloud-based services and generate sufficient usage of such services.
A growing part of our business involves cloud-based services available across a spectrum of computing devices. Our Baidu Core cloud services revenue was RMB18.7 billion (US$2.6 billion) in 2023, increasing by 6% from 2022. We are devoting significant resources to provide cloud infrastructure and other services to enterprises and individuals. At the same time, our competitors are rapidly developing and deploying their cloud-based solutions and services. Pricing, technology and delivery models are evolving. Devices and form factors influence how users access services in the cloud and sometimes the user’s choice of which suite of cloud-based services to use. Our success in cloud-based services strategy will depend on the level of adoption of our products and services. We may not establish market share sufficient to achieve scale necessary to achieve our business objectives or recoup costs incurred to build and maintain infrastructure to support our cloud-based services. It is uncertain whether our strategies will attract the users or generate the revenue required to succeed. If we fail to generate sufficient usage of our new products and services, we may not grow revenue in line with the costs associated with infrastructure development and research and development investments. This may negatively and materially impact our results of operations and financial performance.
The development of cloud-based services is accompanied by regulatory compliance risks. For example, PRC government authorities are increasing enforcement efforts against non-compliance relating to companies operating content delivery networks, internet data centers, and internet service providers. However, the interpretation and application of laws in mainland China and other jurisdictions are often uncertain and in flux, and any failure or perceived failure to comply with all applicable laws and regulations may result in legal proceedings or regulatory actions against us, and could have a material adverse effect on our business and results of operations.
In the past, our peers have experienced data security and infrastructure stability issues arising out of their cloud services. Our cloud services may also encounter similar issues, which could have a material and adverse impact on our brand, operations and financial performance.
Liability claims against, or any unauthorized control or manipulation of our autonomous driving systems, could result in the loss of confidence in us, our brands and our products, and harm our business.
Our Intelligent Driving platform contains complex information technology systems. We have designed, implemented and tested security measures intended to prevent unauthorized access to our Intelligent Driving platform, but there can be no assurance that vulnerabilities will not be identified in the future, or that our remediation efforts will be successful. Hackers have reportedly attempted, and may attempt in the future, to gain unauthorized access to modify, alter and use our Intelligent Driving platform to gain control of, or to change,
28
Table of Contents
functionality, user interface and performance characteristics of vehicles utilizing our Intelligent Driving platform, or to gain access to data stored in or generated by the vehicles. Any unauthorized access to or control of autonomous driving vehicles or their systems or any loss of data could result in death and personal injury, and legal claims or proceedings against us.
Our Intelligent Driving platform may be involved in crashes resulting in property damage, death or personal injury in the future, and such crashes may be the subject of significant public attention. We may face claims related to any misuse or failure of new technologies that we are pioneering, including our Intelligent Driving platform and related solutions, such as smart transportation. A successful product liability claim against us could require us to pay substantial monetary damages.
Moreover, product liability claims or reports of unauthorized access to our Intelligent Driving platform or data, regardless of their veracity, could generate substantial negative publicity about our products and business and could have material adverse impact on our brand, business, prospects and operating results.
We may face challenges in connection with developing, manufacturing and marketing new Xiaodu smart products in response to changing customer requirements, new technologies and market competition.
The market for our Xiaodu smart products is characterized by rapidly changing technology, evolving industry standards, short product life cycles, frequent new product introductions, continual improvement in product price and performance characteristics, and price and feature sensitivity on the part of consumers and businesses. As a result, we must continually introduce new products and technologies and enhance existing products in order to remain competitive.
The success of our Xiaodu smart products depends on several factors, including our ability to:
| • | anticipate technology and market trends; |
| • | develop innovative new products and enhancements on a timely basis; |
| • | distinguish our products from those of our competitors; |
| • | manufacture and deliver high-quality products in sufficient volumes at competitive cost structure; |
| • | establish strong, efficient online and offline distribution channels; |
| • | price our products competitively; |
| • | develop a vibrant DuerOS skills store and a large developer community to increase user stickiness and loyalty; and |
| • | innovate post-hardware sales monetization models. |
If we are unable to develop, manufacture, market and introduce enhanced or new Xiaodu smart products in a timely manner in response to changing market conditions or customer requirements, including changing fashion trends and styles, it will materially adversely affect our business, revenue growth, financial condition and results of operations. Furthermore, as we develop new generations of products more quickly, we expect that the pace of product obsolescence will increase concurrently. The disposition of inventories of excess or obsolete products may result in reductions to our operating margins and materially and adversely affect our earnings and results of operations. We also face uncertainties with respect to the evolving laws and regulations that are or may be applicable to our Xiaodu smart products. For example, there is no guarantee that our Xiaodu smart products will not be subject to new regulatory requirements in the future that could potentially impose limits on various aspects such as sales, marketing, and pricing strategies associated with our products.
29
Table of Contents
The success of our Xiaodu smart products depends on the continued growth of the smart device market, our ability to establish and maintain the brand and market share and compete with other companies, and our ability to monetize through services after the initial hardware sale.
We have invested significant resources in the “Xiaodu” brand and the research and development of Xiaodu smart products. If the smart device market does not continue to grow or grow in unpredictable ways, or we fail to maintain and further promote the “Xiaodu” brand, our revenue may fall short of expectations and our operating results may be harmed. Also, we have continued to offer sales discounts on Xiaodu smart products to attract customers, build our brand and gain market share. Offering such discounts negatively affects our financial performance in the short term. We cannot assure you that our decision to offer such sales discounts is producing, or will produce, positive outcomes for our results of operations. The market for smart devices may not continue to grow; even if it does, we may not be successful in developing and selling devices that appeal to consumers or gain sufficient market acceptance, which typically takes longer in the smart device market. To succeed in this market, we will need to design, produce and sell innovative and compelling products and partner with other businesses that enable us to capitalize on new technologies, some of which have developed or may develop and sell smart devices of their own. We are currently exploring different business models with Xiaodu smart devices, and exploring different monetization model through services after hardware sales, such as membership, advertising and revenue sharing from distribution of third-party skills. Whether we will be able to achieve profitability in smart devices depends in part on our ability to generate revenue through services after the initial hardware sale at a level sufficient to cover associated operating expenses, but there can be no assurance that we will succeed in formulating and implementing the appropriate business and monetization model. Moreover, competition from other companies that seek to provide smart devices will adversely affect our profitability.
We face a number of manufacturing, supply chain, distribution channel and inventory risks as well as product quality and financing risks that, if not properly managed, could harm our financial condition, operating results, and prospects.
We rely on third parties to manufacture our Xiaodu smart products, to design certain of our components and parts, and to participate in the distribution of our products. Our business could be negatively affected if we are not able to engage these companies with the necessary capabilities or capacity on reasonable terms, or if those we engage fail to meet their obligations (whether due to financial difficulties or other reasons), or make adverse changes in the pricing or other material terms of our arrangements with them.
We may experience supply shortages and price increases driven by a variety of factors, such as raw material availability, manufacturing capacity, labor shortages, tariffs, trade disputes and barriers, natural disasters, and significant changes in the financial or business condition of our suppliers. We may experience shortages or other supply chain disruptions that could negatively affect our operations. In addition, some of the components we use in our Xiaodu smart products are available only from a single source or limited sources, and we may not be able to find replacement vendors on favorable terms in the event of a supply chain disruption.
Our Xiaodu smart products may have quality issues resulting from design, manufacturing, or operations. Sometimes, these issues may be caused by components we purchase from other manufacturers or suppliers. If the quality of our Xiaodu smart products does not meet expectations or are defective, it could harm our reputation, financial condition, and operating results.
We are exposed to significant inventory risks that may adversely affect our operating results as a result of seasonality, new product launches, rapid changes in product cycles and pricing, defective merchandise, changes in consumer demand and consumer spending patterns, and other factors. We endeavor to accurately predict these trends and avoid overstocking or understocking issues. Demand for our Xiaodu smart products, however, can change significantly between the time inventory or components are ordered and the date of sale. We may misjudge customer demand, resulting in inventory buildup and possible significant inventory write-down. It may also make it more difficult for us to inspect and control quality and ensure proper handling, storage and delivery.
30
Table of Contents
We may experience higher return rates on new products, receive more customer complaints about them and face costly product liability claims as a result of selling them, which would harm our brand and reputation as well as our financial performance.
Smart Living Group (SLG) encompasses our DuerOS and Xiaodu operations. Our majority-owned subsidiary, which operates SLG, completed its first and second rounds of funding between 2020 and 2022. Historically, it has experienced operating losses. If SLG is unable to satisfy its cashflow needs by generating sufficient cash from its operations in the near future, it may have to rely on subsequent round(s) of financing. If SLG’s operating cashflow does not improve and if SLG fails to conduct financing on reasonable terms, it may not be able to continue its business operations, which may adversely impact our results of operations and financial performance.
Du Xiaoman’s financial services business may subject us to operational and reputational risks, which may have a material adverse effect on our business, results of operations and financial condition.
In August 2018, we completed the divestiture of a majority equity stake in our financial services business unit, which has been rebranded as Du Xiaoman Financial and subsequently further rebranded as Du Xiaoman. After the divestiture, we hold a non-controlling equity interest in Du Xiaoman and have since then deconsolidated the financial results of Du Xiaoman from our consolidated financial statements in accordance with U.S. GAAP. Du Xiaoman runs a one-stop financial services platform which offers end-consumer credit enablement, supply chain financing, wealth management, digital payment and fintech solutions services, in order to serve end-users’ needs. We are still the largest shareholder of Du Xiaoman and would be exposed to losses from Du Xiaoman.
The laws and regulations of mainland China concerning the Internet finance industry are continually evolving and improving. Although to our knowledge Du Xiaoman has taken careful measures to comply with the laws and regulations that are applicable to its financial services, the PRC government authorities may promulgate new policies, rules and regulations regulating the internet finance industry. For example, the People’s Bank of China issued the Announcement of the People’s Bank of China [2021] No. 3 on March 12, 2021. In accordance with this announcement, when credit business institutions market loan products through websites, mobile applications, posters or similar channels, they must explicitly indicate the applicable annualized loan interest rate to the borrower in a conspicuous manner, and specify such annualized interest rate in the loan contract. It is allowed to indicate the daily interest rate or the monthly interest rate at the same time only if they are not displayed in a manner more conspicuous than the annualized interest rate. Under this announcement, “credit business institutions” include, among others, deposit financial institutions, consumer financing companies, micro-loan companies and online platforms providing advertisement and displaying services to credit business operators.
In order to thoroughly implement the risk-based anti-money laundering method and improve the ability of financial institutions to identify the risks on money laundering and terrorist financing, the Anti-Money Laundering Bureau of the People’s Bank of China formulated and issued the Guidelines on Self-Assessment of Money Laundering and Terrorist Financing Risks of Corporate Financial Institutions in 2021, which are applicable to all types of financial institutions and non-bank payment institutions. These guidelines provide guidance for such institutions to implement risk self-assessment and effectively make use of the results of such assessment, and require such institutions to complete the comprehensive risk self-assessment consistent with these guidelines for the first time by the end of 2022. Du Xiaoman has set up an institutional money laundering risk assessment mechanism to fully understand the key money laundering and terrorist financing risks faced it faces, fully optimize the allocation of anti-money laundering resources, and prevent its financial products and businesses from being exploited by criminals in illegal and criminal fund cleaning activities.
In order to comply with the Interim Measures for the Administration on Online Micro-loan Business (Draft for Comment) issued in November 2020, Du Xiaoman has rectified its loan limit control, and adjust the joint loan
31
Table of Contents
ratio and the shareholding of client platform. Furthermore, the People’s Bank of China and other six PRC government authorities issued a draft of Administration Measures for Online Marketing of Financial Products for public comments on December 31, 2021. These draft administration measures regulate the actions of third-party platform operators who are entrusted by financial institutions to promote financial products on the internet, as well as the content and methods of marketing and propagandizing financial products. However, since all these draft measures have not been formally promulgated and become effective as of the date of this annual report, substantial uncertainties still exist with respect to the final content, interpretation and implementation of these draft measures.
As we hold a non-controlling equity interest in Du Xiaoman and do not control Du Xiaoman’s business conduct and operations, we cannot assure you that the practices of Du Xiaoman would not be deemed to violate any applicable laws or regulations, nor can we ensure that all business cooperators on Du Xiaoman’s platform meet all the regulatory compliance requirements. If Du Xiaoman were deemed to violate any current or future applicable laws or regulations, such as the exposure draft of the Interim Measures for the Administration of Internet Small Loan Business released in November 2020, we may be exposed to negative publicity as a result of the potential misconception that Du Xiaoman is still part of our consolidated group. Many internet financial platforms, including Du Xiaoman, have removed deposit products from their platforms. Events like this may expose us to negative publicity as well.
Interruption or failure of our own information technology and communications systems or those of third-party service providers we rely upon could impair our ability to provide products and services, which could damage our reputation and harm our results of operations.
Our ability to provide products and services depends on the continuing operation of our information technology and communications systems. Any damage to or failure of our systems could interrupt our services. Service interruptions could reduce our revenue and profit and damage our brand if our systems are perceived to be unreliable. Our systems are vulnerable to damage or interruption as a result of terrorist attacks, wars, earthquakes, floods, fires, power loss, telecommunications failures, health epidemics, undetected errors or “bugs” in our software, computer viruses, interruptions in access to our platform through the use of “denial of service” or similar attacks, hacking or other attempts to harm our systems, and similar events. Some of our systems are not fully redundant, and our disaster recovery planning does not account for all possible scenarios. We have experienced service disruptions in the past which adversely affected our user experience.
Our servers, which are hosted at third-party or our own internet data centers, are vulnerable to break-ins, sabotage and vandalism. The occurrence of natural disasters or closure of an internet data center by a third-party provider without adequate notice could result in lengthy service interruptions. In addition, our domain names are resolved into internet protocol (IP) addresses by systems of third-party domain name registrars and registries. Any interruptions or failures of those service providers’ systems, which are beyond our control, could significantly disrupt our own services. If we experience frequent or persistent system failures on our platform, whether due to interruptions and failures of our own information technology and communications systems or those of third-party service providers that we rely upon, our reputation and brand could be severely harmed. The steps we take to increase the reliability and redundancy of our systems may cause us to incur heavy costs and reduce our operating margin, and may not be successful in reducing the frequency or duration of service interruptions.
We may not be able to manage our expanding operations effectively.
We expect to continue to expand our operations as we grow our user and customer base and explore new opportunities. To manage the further expansion of our business and growth of our operations and personnel, we need to continually improve our operational and financial systems, procedures and controls, and expand, train, manage and maintain good relations with our growing employee base. We have experienced labor disputes in the past and may experience the same in the future. Although these disputes were resolved promptly, we cannot assure you that there will not be any new labor disputes in the future.
32
Table of Contents
We expect our AI-enabled business to become a key revenue driver for Baidu Core, and believe our future growth relies on the success of our AI-enabled business. Our systems and processes were designed in the past to support our mobile ecosystem business operations. For our AI-enabled business operations to be successful, we must be able to attract industry expertise and talents, and adapt to systems and processes suitable for the enterprise and public sector business environment. If we are unable to do so, we may not be competitive in these markets and our AI-enabled business offerings will not be successful. In addition, we must maintain and expand our relationships with other websites, internet companies and other third parties. Our current and future personnel, systems, procedures and controls may not be adequate to support our expanding operations, and consequently our financial condition and operating results may be materially and adversely affected.
We may face intellectual property infringement claims and other related claims, which could be time-consuming and costly to defend and may result in an adverse impact over our operations.
Internet, technology and media companies are frequently involved in litigation based on allegations of infringement of intellectual property rights, unfair competition, invasion of privacy, defamation and other violations of other parties’ rights. The validity, enforceability and scope of protection of intellectual property in internet-related and AI-related industries, particularly in mainland China, are still evolving and subject to further clarification and interpretation. The evolving laws and regulations on the protection of intellectual property may require us to take more actions to prevent from infringing third-parties’ intellectual property. If we cannot take the necessary actions in time, disputes may arise alleging us to infringe certain third-parties’ intellectual property. As we face increasing competition and as litigation becomes more common in mainland China in resolving commercial disputes, we face a higher risk of being the subject of intellectual property infringement claims. We may be subject to administrative actions brought by the PRC competent government authorities such as the PRC National Copyright Administration and in the most severe scenario, criminal prosecution for alleged copyright infringement, and as a result may be subject to fines and other penalties and be required to discontinue infringing activities. Furthermore, as we expand our operations outside of China, we may be subject to claims brought against us in jurisdictions outside of China.
Our search products and services link to materials in which third parties may claim ownership of trademarks, copyrights or other rights. As we adopt new technologies and roll out new products and services, we face the risk of being subject to intellectual property infringement claims that may arise from our use of new technologies and provision of new products and services. Our products and services including those based on content storage and sharing, such as Baidu Knows, Baidu Wiki, Baidu Wenku, Baidu Post, Baidu Drive, Baijiahao, Haokan, and iQIYI’s user-generated content, allow our users to upload, store and share documents, images, audio and videos on our servers, or share, link to or otherwise provide access to contents from other websites, and we also operate distribution platforms whereby developers can upload, share and sell their apps or games to users. Although we have made commercially reasonable efforts to request users or developers to comply with applicable intellectual property laws, we cannot ensure that all of our users or developers have the rights to upload or share these contents or apps. In addition, we have been and may continue to be subject to copyright or trademark infringement and other related claims from time to time, in China and internationally.
We have been making continuous efforts to keep ourselves informed of and to comply with all applicable laws and regulations affecting our business. However, the laws and regulations of mainland China are complex and evolving, and uncertainties still exist with respect to the interpretation of the legal standards for determining liabilities of internet search and other internet service providers for (a) providing links to content on third-party websites that infringe upon others’ copyrights or hosting such content, (b) providing information storage space, file sharing technology or other internet services that are used by internet users to disseminate such content, or (c) providing information generated by AI. The Supreme People’s Court of the PRC promulgated a judicial interpretation on infringement of the right of dissemination through the internet in December 2012, with amendments that came into effect on January 1, 2021. This judicial interpretation, like certain court rulings and certain other judicial interpretations, provides that the courts will place the burden on internet service providers to remove not only links or contents that have been specifically mentioned in the notices of infringement from
33
Table of Contents
right holders, but also links or contents they “should have known” to contain infringing content. The interpretation further provides that where an internet service provider has directly obtained economic benefits from any content made available by an internet user, it has a higher duty of care with respect to internet users’ infringement of third-party copyrights. A guidance on the trial of audio/video sharing copyright disputes promulgated by the Higher People’s Court of Beijing in December 2012 provides that where an internet service provider has directly obtained economic benefits from any audio/video content made available by an internet user who has no authorization for sharing such content, the internet service provider shall be presumed to be at fault. These interpretations could subject us to significant administrative burdens and litigation risks. The PRC Civil Code promulgated in 2020 has further elaborated the circumstances where internet service providers may be found liable for the infringement of third parties. See “Item 4.B. Information on the Company—Business Overview—Regulations—Regulations on Tort Liability.” The PRC Copyright Law, which became effective in June 2021, further provides that the competent copyright authority may require compliance from the relevant parties in the process of investigating the infringing activities.
We conduct our business operations primarily in mainland China. However, we could be subject to claims under U.S. copyright laws, including the legal standards for determining indirect liability for copyright infringement. Although we believe such claims would be without merit, we cannot assure you that we will not be subject to copyright infringement lawsuits or other proceedings in the U.S. or elsewhere in the future.
Intellectual property litigation is expensive, time-consuming and could divert resources and management attention from the operations of our business. We are currently named as defendant in certain copyright infringement suits in connection with Baidu Feed, P4P, Baidu Post, Baidu Search, iQIYI, Baidu Wenku, Baidu Drive, Baijiahao, Haokan, Xiaodu and certain other products or services. See “Item 8.A. Financial Information—Consolidated Statements and Other Financial Information—Legal Proceedings.” There is no guarantee that the courts will accept our defenses and rule in our favor. If there is a successful claim of infringement, we may be required to discontinue the infringing activities, pay substantial fines and damages and enter into royalty or license agreements that may not be available on commercially acceptable terms, if at all. Our failure to obtain a license of the rights on a timely basis could harm our business. Any intellectual property litigation by third parties and/or negative publicity alleging our intellectual property infringement could have an adverse effect on our business, reputation, financial condition or results of operations. To address the risks relating to intellectual property infringement, we may have to substantially modify, limit or terminate some of our search services. Any such change could materially affect user experience and in turn have an adverse impact on our business.
Our strategy of investments and acquiring complementary businesses and assets may fail.
As part of our business strategy, we have pursued, and intend to continue to pursue, selective strategic investments and acquisitions of businesses and assets that complement our existing business and help us execute our growth strategies. For example, we invested in Trip.com Group Limited (formerly known as Ctrip).
We intend to make other strategic investments and acquisitions in the future if suitable opportunities arise. Investments and acquisitions involve uncertainties and risks, including, but not limited to:
| • | potential ongoing financial obligations and unforeseen or hidden liabilities, including liability for infringement of third-party copyrights or other intellectual property; |
| • | failure to achieve the intended objectives, benefits or revenue-enhancing opportunities, |
| • | non-occurrence of anticipated or speculative transactions and any resulting negative impact; |
| • | costs and difficulties of integrating acquired businesses and managing a larger business; |
| • | in the case of investments where we do not obtain management and operational control, lack of influence over the controlling partner or shareholder, which may prevent us from achieving our strategic goals in the investments; |
34
Table of Contents
| • | possible unsatisfactory operational or financial performance, including financial loss, or fraudulent activities of a target business; |
| • | possible loss of key employees of a target business; |
| • | potential claims or litigation regarding our board’s exercise of its duty of care and other duties required under applicable law in connection with any of our significant acquisitions or investments approved by the board; |
| • | diversion of resources and management attention; |
| • | regulatory hurdles and compliance risks, including the anti-monopoly and competition laws, rules and regulations of mainland China and other jurisdictions and the enhanced compliance requirement for outbound acquisitions and investment under the laws and regulations of mainland China; |
| • | in the case of acquisitions of businesses or assets outside of China, the need to integrate operations across different business cultures and languages and to address the particular economic, currency, political, and regulatory risks associated with specific countries; and |
| • | potential fair value changes, which impact our profits. |
Any failure to address these risks successfully may have a material and adverse effect on our financial condition and results of operations. Investments and acquisitions may require a significant amount of capital, which would decrease the amount of cash available for working capital or capital expenditures. In addition, if we use our equity securities to pay for investments and acquisitions, the value of our listed securities may be diluted. If we borrow funds to finance investments and acquisitions, such debt instruments may contain restrictive covenants that could, among other things, restrict us from distributing dividends. Moreover, acquisitions may also generate significant amortization expenses related to intangible assets. We are required to test our intangible assets and goodwill for impairment annually or more frequently if events or changes in circumstances indicate that they may be impaired. We may also incur investment loss or impairment charges to acquired businesses and assets.
Our business is subject to complex and evolving Chinese and international laws and regulations, including those regarding data privacy and cybersecurity. Failure to comply with these laws and regulations would result in claims, penalties, damages to our reputation and brand, or declines in user growth or engagement, or otherwise harm our business.
We are required by privacy and data protection laws in mainland China and other jurisdictions, including, without limitation, the PRC Cyber Security Law and the PRC Data Security Law, to ensure the confidentiality, integrity and availability of the information of our users, customers, third-party agents, content providers and Baidu Union partners, and other data, which is also essential to maintaining their confidence in our online products and services.
In recent years, the PRC government authorities have increasingly focused on safeguarding information and data security. The PRC Cyber Security Law provides that network operators must fulfill their obligations to safeguard network security during the course of conducting business and providing services. Network service providers must take technical and other necessary measures as required by laws, regulations and mandatory requirements to safeguard the operation of networks, respond to network security effectively, prevent illegal and criminal activities and maintain the integrity, confidentiality and usability of network data. Pursuant to the Regulations on Protection of Critical Information Infrastructure, which became effective in September 2021, critical information infrastructure means any important network facilities or information systems of the important industry or field, which may endanger national security, people’s livelihood and public interest in case of damage, function loss or data leakage. If a company is designated as a critical information infrastructure operator, it must comply with specific obligations mandated by applicable cybersecurity laws and regulations, which include, among others, that any personal information and important data collected and generated in
35
Table of Contents
operations within mainland China must be stored within the territory of mainland China. However, these PRC laws and regulations relating to cybersecurity are relatively new, and the applicable scope of these laws and regulations, including the applicable scope of “critical information infrastructure” under the current regulatory regime, remains unclear and shall be subject to more interpretation from the competent government authorities.
Since 2021, the PRC government authorities have also promulgated a series of laws and regulations to build a system for cybersecurity review. The PRC Data Security Law, which took effect in September 2021, provides for a security review procedure for the data activities that may affect national security. Pursuant to the Cybersecurity Review Measures, which was published by the CAC and became effective in February 2022, critical information infrastructure operators that procure internet products and services, as well as network platform operators engaging in data processing activities, must be subject to a cybersecurity review if their activities affect or may affect national security. A cybersecurity review could result in significant costs and expose such critical information infrastructure operators to various challenges, both throughout the review process and in the course of implementing the required improvements to their cybersecurity protocols. Since the Cybersecurity Review Measures provide no further explanation or interpretation on the determination of “affecting national security,” there remain uncertainties as to whether our data processing activities may be deemed to affect national security. In addition, network platform operators holding over one million users’ personal information must apply for a cybersecurity review with the Cybersecurity Review Office before any public offering in a foreign country. Moreover, the CAC also publicly solicited comments on the Regulations on the Network Data Security (Draft for Comments) on November 14, 2021, which have not yet been promulgated into law as of the date of this annual report. The Regulations on the Network Data Security (Draft for Comments) set forth different scenarios where data processors are required to apply for cybersecurity reviews, including, among others, listing abroad of data processors which process over one million users’ personal information, listing in Hong Kong which affects or may affect national security, and other data processing activities that affect or may affect national security. See “Item 4.B. Information on the Company—Business Overview—Regulations—Regulations on Information Security” for more details.
Moreover, the PRC government authorities are also improving the legal system on the protection of the personal information. On August 20, 2021, the Standing Committee of the National People’s Congress promulgated the PRC Personal Information Protection Law, which integrates the scattered rules with respect to personal information rights and privacy protection and took effect on November 1, 2021. In addition, the CAC and three other authorities jointly issued the Rules on the Scope of Necessary Personal Information for Common Types of Mobile Internet Applications, which specify the scope of necessary personal information to be collected each for a variety of common mobile internet applications, such as maps and navigation apps, online ride-hailing apps, instant messaging apps and online community apps. See “Item 4.B. Information on the Company—Business Overview—Regulations—Regulations on Internet Privacy” for more details.
The PRC government authorities also further enhanced the supervision and regulation of cross-border data transmission. Pursuant to the Measures for the Security Assessment of Cross-border Data Transfer, which became effective in September 2022, data processors will be subject to security assessment conducted by the CAC prior to any cross-border transfer of data if the transfer involves certain types of data such as important data. See “Item 4.B. Information on the Company—Business Overview—Regulations—Regulations on Information Security” for more details.
The PRC Cyber Security Law, the PRC Data Security Law, the PRC Personal Information Protection Law and the other related laws and regulations as mentioned above are relatively new and subject to interpretation by the regulators. Although we only gain access to user information that is necessary for, and relevant to, the services we provide, the data we obtain and use may include information that is deemed as “personal information,” “network data” or “important data” under the relevant data privacy and protection laws and regulations. As such, we have implemented a series of measures to ensure that we comply with the laws and regulations in the collection, use, disclosure, sharing, storage, and security of user information and other data. Although we believe that we have complied with such laws and regulations related to cybersecurity, data privacy
36
Table of Contents
and personal information protection in all material aspects, the measures we have implemented could still be deemed insufficient, improper, or even invasive of user privacy by the government authorities, which may result in penalties, including fines, suspension of business activities, restrictions on new user registrations (even temporarily) and revocation of licenses. Consequently, our reputation and results of operations could be materially and adversely affected. In addition, the activities of third parties such as our customers and business partners are beyond our control. If our business partners violate the laws and regulations relating to cybersecurity, data privacy and personal information protection, or fail to fully comply with the service agreements with us, or if any of our employees fails to comply with our internal control measures and misuse the information, we may be subject to penalties and other legal liabilities. As part of the efforts by the CAC and other regulators to enhance data protection, a wide number of apps and companies have been reprimanded since the first half of 2021, including certain Baidu apps. We have updated the apps and are committed to keeping our apps fully compliant with the requirements of the CAC. Nevertheless, due to the rapidly evolving regulatory requirements, we still cannot guarantee you that we will not be subject to more similar rectification requests from the government authorities or that we will fully comply with all applicable rules and regulations at all times. In addition, as the enforcement regime with regard to cybersecurity, data security, data privacy and personal information protection has been evolving and PRC regulators have been increasingly focusing on regulation in these areas, some of our business operations, in particular our cloud services, may be subject to enhanced oversight and scrutiny. As a result, we may be involved with enquiries, claims, complaints or other administrative actions from time to time, which are subject to the uncertainties associated with the evolving legislative activities and varied local enforcement practices. Any failure or perceived failure to comply with all applicable data privacy and protection laws and regulations or to take prompt rectification actions as required by the enforcement authorities, any failure or perceived failure of our business partners to do so, or any failure or perceived failure of our employees to comply with our internal control measures, may result in negative publicity and legal proceedings or regulatory actions against us, and could damage our reputation, discourage current and potential users and customers from using our products or services and subject us to fines, damages and rectification, which could have a material adverse effect on our business and results of operations.
Besides the evolving regulatory requirements on cybersecurity and data privacy in mainland China, there are also a number of legislative proposals in the European Union, the United States, at both the federal and state level, as well as other jurisdictions that could impose new obligations in areas affecting our business. For instance, on February 28, 2024, the Biden administration issued an executive order titled “Preventing Access to Americans’ Bulk Sensitive Personal Data and United States Government-Related Data by Countries of Concern.” This executive order aims to prohibit and restrict the transfer of substantial quantities of personal data belonging to U.S. individuals, as well as certain data pertaining to the U.S. government, to countries of concern, including China. The types of personal data of U.S. citizens that fall under the purview of this executive order encompass, but are not limited to, biometric identifiers, human genomic information, and confidential health and financial records, subject to bulk collection thresholds that range from one hundred to one million. Our data practices may be deemed inconsistent with new laws or regulations concerning data protection and transfer, or the interpretation and application of existing laws or regulations concerning data protection and transfer, which are often uncertain and in flux. The introduction of new products or other actions that we may take may subject us to additional laws, regulations or other government scrutiny. Complying with new laws and regulations could cause us to incur substantial costs or require us to change our business practices in a manner materially adverse to our business. For example, if new laws and regulations promulgated in the future impose restrictions on selling demographically targeted advertising, it could increase our cost and the complexity to provide such services such that we may become less attractive to online advertising customers. In addition, some countries are considering or have passed legislation implementing data protection requirements or requiring local storage and processing of data or similar requirements that could increase the cost and complexity of delivering our services.
Any failure or perceived failure by us to prevent information security breaches or to comply with data security and privacy policies or related legal obligations, or any compromise of security that results in the unauthorized use, release or transfer of personally identifiable information or other data, could cause our users to lose trust in us and expose us to legal claims or penalties. Any perception by the public that privacy of user
37
Table of Contents
information or data security are becoming increasingly unsafe or vulnerable to attacks could inhibit the growth of our products and services generally. We expect that these areas will be subject to greater public scrutiny and attention from regulators and more frequent and rigid investigation or review by regulators, which will increase our compliance costs and subject us to heightened risks and challenges. We may have to spend much more personnel cost and time evaluating and managing these risks and challenges in connection with our products and services in the ordinary course of our business operations, and cooperated and will keep cooperating in the future with the competent regulators in these respects. If we are unable to manage these risks, we could become subject to penalties, including fines, suspension of business and revocation of required licenses, and our reputation and results of operations could be materially and adversely affected.
Our business may be adversely affected if we were found to have failed to fulfill the additional obligations under the online advertising rules.
Although the PRC Advertising Law has not specified “paid search results” as a form of advertising, the Administrative Measures for Internet Advertising, which was promulgated and amended by the State Administration for Market Regulation, or the SAMR, on February 25, 2023 and became effective on May 1, 2023, characterize “paid search results” as a form of internet advertising from the perspective of regulating the online advertising business. Pursuant to such measures, we are subject to additional legal obligations to monitor our P4P customers’ listings on our website during the course of our provision of P4P services. For example, we must examine, verify and record identity information of our P4P customers, such as the customer’s name, address and contact information, and maintain an updated verification of such information on a regular basis. Moreover, we must examine supporting documentation provided by our P4P customers. Where a special government review is required for specific categories of advertisements before posting, we must confirm that the review has been performed and approval has been obtained. If the content of the advertisement is inconsistent with the supporting documentation, or the supporting documentation is incomplete, the advertisement cannot be published. With respect to the promotion of goods or services in the form of paid listing, advertising distributors shall indicate them conspicuously as an advertisement to distinguish them from the natural search results. Publishing and distributing advertisements by means of internet shall not affect the normal internet access by users, and it is prohibited to insert advertisements in the form of paid listing into the search results of government service websites, webpages, internet apps, official accounts, etc. The advertisers, operators and publishers of internet advertisements containing links shall examine the contents in the next level link that are related to the front-end advertisements. In addition to the Administrative Measures for Internet Advertising, the PRC government may, from time to time, promulgate more detailed or new advertising laws and regulations to impose further requirements on online advertising services in specific fields, such as medical, pharmaceutical, health care, after-school tutoring and other similar businesses. For example, the Circular on the Administration of After-School Tutoring Advertisement jointly issued by the SAMR and seven other authorities on November 3, 2021 prohibits new media, internet platforms and other mainstream media from publishing or broadcasting any advertisement of after-school tutoring services targeted at pre-school children and primary and middle school students. Similarly, the Administrative Measures for Internet Advertising also propose to ban internet advertisement of such after-school tutoring services. We cannot assure you that we will be in compliance with the requirements under these more detailed or new laws and regulations and failure to comply with these obligations may subject us to fines and other administrative penalties. If advertisements shown on our platform are in violation of applicable advertising laws and regulations, or if the supporting documentation and government approvals provided to us by our P4P customers in connection with the advertising content are not complete or accurate, we may be subject to legal liabilities and our reputation could be harmed. Furthermore, we may modify the operation of our online marketing business and curb advertisements of certain restricted sectors in order to meet the evolving compliance requirements on the industry, which may adversely affect our online marketing revenue. See “Item 4.B. Information on the Company—Business Overview—Regulations—Regulations on Advertisements and Online Advertising.”
38
Table of Contents
We may be subject to patent infringement claims with respect to our P4P platform.
Our technologies and business methods, including those relating to our P4P platform, may be subject to third-party claims or rights that limit or prevent their use. We applied for certain patents in mainland China for our P4P platform, but some of our applications were rejected on the ground that they are not patentable. Certain companies have been granted patents in the United States relating to P4P platforms and similar business methods and related technologies. While we believe that we are not subject to U.S. patent laws since we conduct our business operations primarily in mainland China, we cannot assure you that U.S. patent laws would not be applicable to our business operations, or that holders of patents relating to a P4P platform would not seek to enforce such patents against us in the United States or mainland China.
Many parties are actively developing and seeking protection for internet-related technologies, including patent protection. They may hold patents issued or pending that relate to certain aspects of our technologies, products, business methods or services. Any patent infringement claims, regardless of their merits, could be time-consuming and costly to us. If we were sued for patent infringement claims with respect to our P4P platform and were found to infringe upon the patents and were not able to adopt non-infringing technologies, we may be severely limited in our ability to operate our P4P platform, which would have a material and adverse effect on our results of operations and prospects.
Our business may be adversely affected by third-party software apps or practices that interfere with our receipt of information from, or provision of information to, our users, which may impair our users’ experience.
Our business may be adversely affected by third-party malicious or unintentional software apps that make changes to our users’ computers and interfere with our products and services. These software apps may change our users’ internet experience by hijacking queries to our platform, altering or replacing our search results, or otherwise interfering with our ability to connect with our users. The interference often occurs without disclosure to or consent from users, resulting in a negative experience, which users may associate with our platform. These software apps may be difficult to remove or disable, may reinstall themselves and may circumvent other apps’ efforts to block or remove them.
In addition, our business may be adversely affected by the practices of third-party website owners, content providers and developers which interfere with our ability to crawl and index their web pages and contents including apps. The ability to provide a superior user experience is critical to our success. If we are unable to successfully combat malicious third-party software apps that interfere with our products and services, our reputation may be harmed. If a significant number of website owners, content providers and developers prevent us from indexing and including their high-quality web pages and content including apps in our search results, or if we cannot effectively combat web spam from low-quality and irrelevant content websites, the quality of our search results may be impaired, which may damage our reputation and deter our current and potential users from using our products and services.
We may not be able to prevent others from unauthorized use of our intellectual property, which could harm our business and competitive position.
We rely on a combination of copyright, trademark and trade secret laws, as well as nondisclosure agreements and other methods to protect our intellectual property rights. The protection of intellectual property rights in mainland China may not be as effective as those in the United States or other jurisdictions. The steps we have taken may be inadequate to prevent the misappropriation of our technology. Reverse engineering, unauthorized copying or other misappropriation of our technologies could enable third parties to benefit from our technologies without paying us. Moreover, unauthorized use of our technology could enable our competitors to offer products and services that compete with ours, which could harm our business and competitive position. We have in the past resorted to litigation to enforce our intellectual property rights, and may have to do so from time to time in the future. There is no guarantee that the competent courts will accept our claims and rule in our favor. Such litigation may result in substantial costs and diversion of resources and management attention.
39
Table of Contents
Our success depends on the continuing and collaborative efforts of our management team and other key personnel, and our business may be disrupted if we lose their services and are not able to find their successors in a timely manner.
Our success depends heavily upon the continuing services of our management team, in particular our chairman and chief executive officer, Robin Yanhong Li. If one or more of our executives or other key personnel are unable or unwilling to continue in their present positions and we are not able to find their successors in a timely manner, our business may be disrupted and our financial condition and results of operations may be adversely affected. Competition for management and key personnel is intense, the pool of qualified candidates is limited, and we may not be able to retain the services of our executives or key personnel, or attract and retain experienced executives or key personnel in the future.
If any of our executives or other key personnel joins a competitor or forms a competing company, we may not be able to successfully retain customers, key agents, know-how and key personnel. Each of our executive officers and key employees has entered into an employment agreement with us, containing confidentiality and non-competition provisions. If any disputes arise between any of our executives or key personnel and us, we cannot assure you the extent to which any of these agreements may be enforced.
We rely on highly skilled personnel. If we are unable to retain or motivate them or hire additional qualified personnel, we may not be able to grow effectively.
Our performance and future success depend on the talents and efforts of highly skilled individuals. We will need to continue to identify, hire, develop, motivate and retain highly skilled personnel for all areas of our organization and business operations. Competition for qualified employees in the industries we operate in is intense. Our continued ability to compete effectively depends on our ability to attract new employees and to retain and motivate our existing employees. As competitions in our industries intensify, it may be more difficult for us to hire, motivate and retain highly skilled personnel. In general, if we do not succeed in attracting additional highly skilled personnel or retaining or motivating our existing personnel, we may be unable to grow effectively. In certain emerging industry, such as autonomous driving, foundation models and generative AI, many players with sufficient funds would heavily devote their resources to compete for talents with us. To keep our competitiveness and market position, we would need to, among others, recruit, train and retain our key talents and employees, in particular research and development personnel. If we fail to do so, we may lag behind with respect to the ever-emerging and cutting-edge technologies in the emerging industry, and our prospects in such industry would be ultimately harmed.
We are exposed to significant downward adjustments or impairments in the market values of our investments, which may materially affect our financial results.
As part of our business strategy, we have investments in both private and public companies. Fair values of these investments can be negatively impacted by fluctuations in the share prices of public companies we own, the fair value of private companies we own, liquidity, credit deterioration or losses, financial results, foreign exchange rates, changes in interest rates, or other factors. For equity securities without readily determinable fair value and do not qualify for the net asset value practical expedient of the investment, we elected to use the measurement alternative to measure those investments at cost, less any impairment, plus or minus changes resulting from observable price changes in orderly transactions for identical or similar investments of the same issuer, if any. Equity securities with readily determinable fair values are measured at fair value, and any changes in fair value are recognized in earnings. The impairment and change of equity securities’ fair value could result in significant fluctuation of our financial condition and operating results.
For example, we have recognized impairment charges on our long-term investments from 2021 to 2023 due to the impact of COVID-19, regulatory and competitive environment of the industries, circumstances of our invested companies and other factors. We may still suffer significant impairment loss or downward adjustments
40
Table of Contents
of our investments in the future, due to deterioration in global economic conditions or escalation of geopolitical conflicts or other factors. The carrying amounts of short-term investments, long-term investments, and long-term time deposits and held-to-maturity investments as of December 31, 2023 were RMB168.7 billion (US$23.8 billion), RMB48.0 billion (US$6.8 billion) and RMB24.7 billion (US$3.5 billion), respectively. The value or liquidity of our investments could decline and result in a material impairment, which could materially adversely affect our financial condition and operating results.
We are subject to risks and uncertainties faced by companies in a rapidly evolving industry.
We operate in the rapidly evolving internet industry, which makes it difficult to predict our future results of operations. Accordingly, you should consider our future prospects in light of the risks and uncertainties experienced by companies in evolving industries. Some of these risks and uncertainties relate to our ability to:
| • | maintain our leading position in the Chinese-language internet search market; |
| • | offer attractive, useful and innovative products and services to attract and retain a larger user base; |
| • | procure content from studios and other content providers, as well as distribution channels and other licensors of content; |
| • | attract users’ continuing use of internet search services; |
| • | retain existing customers and attract additional customers and increase spending per customer; |
| • | evaluate the credit worthiness and collectability of accounts receivables from an evolving variety of customers, whose failure to pay us in a timely manner may adversely affect our liquidity position; |
| • | retain members and attract new members of iQIYI’s membership services; |
| • | upgrade our technology to support increased traffic and expanded product-and-service offerings; |
| • | further enhance our brand; |
| • | respond to competitive market conditions; |
| • | respond to evolving user preferences or industry changes; |
| • | respond to changes in the regulatory environment and manage legal risks, including those associated with intellectual property rights; |
| • | maintain effective control of our costs and expenses; |
| • | execute our strategic investments and acquisitions and post-acquisition integrations effectively; |
| • | attract, retain and motivate qualified personnel and maintain good relations with a young and growing work force; and |
| • | build profitable operations in new markets and other overseas internet markets we have entered into. |
If we are unsuccessful in addressing any of these risks and uncertainties, our business may be materially and adversely affected.
Our indebtedness could adversely affect our financial condition and our ability to obtain additional capital on reasonable terms when necessary.
As of December 31, 2023, we had an aggregate of RMB76.4 billion (US$10.8 billion) of outstanding indebtedness (including loans, convertible senior notes and notes payable), which will mature between 2024 and 2031, which include RMB14.6 billion (US$2.1 billion) of outstanding indebtedness of iQIYI. On April 2, 2021, we entered into a five-year term and revolving facilities agreement with a group of 22 arrangers, pursuant to which we are entitled to borrow US$3.0 billion with a term of five years and we have drawn down US$2.0 billion
41
Table of Contents
(RMB14.2 billion) loan under the facility commitment. See “Item 5.B. Operating and Financial Review and Prospects—Liquidity and Capital Resources.” We may incur additional indebtedness in the future. Our current and future debt requires us to dedicate a portion of our cash flow to service interest and principal payments and may limit our ability to engage in other transactions. Our ability to pay interest and repay the principal for our indebtedness is dependent upon our ability to manage our business operations, generate sufficient cash flows, raise additional capital and the other factors discussed in this section. There can be no assurance that we will be able to manage any of these risks successfully.
Certain of our outstanding indebtedness include financial and other covenants. For example, certain of these covenants require iQIYI to maintain minimum liquidity or pertain to iQIYI’s solvency or listing status. If we fail to comply with these covenants and are unable to remedy or obtain a waiver or amendment, an event of default would result. If an event of default were to occur, the lenders could, among other things, declare outstanding amounts due and payable. In addition, outstanding notes of Baidu, Inc. contain customary cross default and cross acceleration provisions, which would permit the notes holders to accelerate the repayment of these notes. In particular, for certain of the outstanding notes of Baidu, Inc., an event of default or declaration of acceleration under the indebtedness of principal controlled entities, such as iQIYI, could also result in an event of default under such notes of Baidu, Inc., which would permit the notes holders to accelerate the repayment of such notes of Baidu, Inc. For more detailed description of cross default and cross acceleration provisions under these notes, see “Item 5.B. Operating and Financial Review and Prospects—Liquidity and Capital Resources.” If the payment of any of our outstanding notes is accelerated, we may be required to renegotiate, repay or refinance these obligations and may not have sufficient funds available to repay it, and our liquidity and financial position would be materially and adversely affected.
We may require additional capital to support our business growth or to respond to business opportunities, challenges or unforeseen circumstances. Our ability to obtain additional capital, if and when required, will depend on our business plans, investor demand, our operating performance, the condition of the capital markets, and other factors, and our indebtedness may limit our ability to borrow additional funds. We may have difficulty incurring new debt on terms that we would consider to be commercially reasonable. In addition, we may also need to refinance a portion or all of our outstanding debt as it matures. There is a risk that we may not be able to refinance existing debt or that the terms of any refinancing may not be as favorable as the terms of our existing debt.
iQIYI has significant working capital requirements, and our controlling interest in iQIYI may be diluted if iQIYI raises additional capital by issuing and selling additional equity in the future.
iQIYI, our controlled subsidiary listed on the Nasdaq Global Select Market, had experienced a working capital deficit as of December 31, 2021, 2022 and 2023. There is no assurance that iQIYI will be able to improve its working capital position and achieve working capital surplus, although iQIYI will take actions to manage its working capital. In March 2022, iQIYI issued ordinary shares for a total cash purchase price of US$285 million in a private placement transaction. In December 2022, iQIYI issued US$500 million convertible senior notes due January 2028 to PAGAC IV-1 (Cayman) Limited, PAG Pegasus Fund LP and/or their affiliates, collectively referred to as PAG in this annual report. In February 2023, iQIYI issued to PAG an additional US$50 million principal amount of the such notes upon its exercise to subscribe for additional notes in full. In January 2023, iQIYI completed a registered follow-on public offering of iQIYI’s ordinary shares in the form of ADSs and received net proceeds of US$500 million in aggregate. In March 2023, iQIYI completed an offering of US$600 million in aggregate principal amount of 6.50% convertible senior notes due March 2028, or the iQIYI 2028 Convertible Notes. Concurrently with and shortly after the offering of the iQIYI 2028 Convertible Notes, iQIYI entered into separate individually and privately negotiated agreements with certain holders of the iQIYI 2026 Convertible Notes to repurchase US$340 million principal amount of such notes for cash. There can be no assurance that iQIYI will be able to raise additional equity or debt financing on terms that are acceptable to iQIYI in the future. Any failure to do so as and when necessary could materially adversely affect iQIYI’s liquidity, results of operations, financial condition and ability to operate. In addition, when iQIYI obtains
42
Table of Contents
additional financing by issuing and selling additional equity or equity-linked securities, such as convertible bonds, our interest in iQIYI will be diluted.
iQIYI operates in a capital intensive industry and requires a significant amount of cash to fund its operations, content acquisitions and technology investments. If iQIYI cannot obtain sufficient capital, its business, financial condition and prospects may be materially and adversely affected.
The operation of an internet video streaming platform requires significant and continuous investment in content and technology. Producing high-quality original content is costly and time-consuming and will typically take a long period of time to realize returns on investment, if at all. To date, iQIYI has financed its operations primarily with net cash generated from financing activities such as placements of shares, convertible senior notes and asset-based securities, bank loans, and the proceeds from its initial public offering and offering of securities. In order to implement its growth strategies, iQIYI will incur additional capital in the future to cover, among others, costs to produce and license content. iQIYI may need to obtain additional financing, including equity offerings or debt financing, to fund the operation and expansion of business. iQIYI’s ability to obtain additional financing in the future, however, is subject to a number of uncertainties, including those relating to:
| • | iQIYI’s future business development, financial condition and results of operations; |
| • | general market conditions for financing activities by companies in iQIYI’s industry; and |
| • | macro-economic and other conditions in mainland China and elsewhere. |
As a public company with a growing business, iQIYI expects to increasingly rely on net cash provided by operating activities, financing through capital markets and commercial banks for its liquidity needs. However, iQIYI cannot assure you that it will be successful in its efforts to further diversify its sources of liquidity and obtain financing. In addition, certain financing may pose additional capital needs on iQIYI, for example, the potential redemption by holders of iQIYI’s convertible notes. Further, inability to maintain liquidity or solvency might result in default under iQIYI’s existing indebtedness, which would pose additional repayment needs and negatively impact iQIYI’s ability to raise more funds through new financing. Moreover, deterioration in global economic conditions or escalation of geopolitical conflicts may adversely impact iQIYI’s ability to secure additional financing. If iQIYI cannot obtain sufficient capital to meet its capital needs, iQIYI may not be able to execute its growth strategies and its business, financial condition and prospects may be materially and adversely affected.
Our results of operations may fluctuate, which makes our results difficult to predict and could cause our results to fall short of expectations.
Our results of operations may fluctuate as a result of a number of factors, many of which are beyond our control. For these reasons, comparing our results of operations on a period-to-period basis may not be meaningful, and you should not rely on our past results as an indication of our future performance. Our quarterly and annual revenues and costs and expenses as a percentage of our revenues may be significantly different from our historical or projected figures. Our results of operations in future quarters may fall below expectations. We have ceased or downsized certain of our business, such as games and education, in the past year due to the changing business and regulatory environment in China, which had an adverse effect on our financial results. We cannot assure you that similar cessation or downsize of business will not take place in the future, and our financial results may be adversely affected. Any of the foregoing could cause the price of our ADSs to fall. Any of the risk factors listed in this “Risk Factors” section, and in particular the following factors, could cause our results of operations to fluctuate from quarter to quarter:
| • | general economic conditions in China and economic conditions specific to the internet, internet search and feed, and online marketing industries; |
| • | our ability to continue to attract users to our platform despite the emergence of mobile apps and other services; |
43
Table of Contents
| • | our ability to retain existing customers, attract additional customers and increase spending per customer; |
| • | the announcement or introduction of new or enhanced products and services by us or our competitors; |
| • | the introduction of new technology by us or our competitors; |
| • | the amount and timing of operating costs and capital expenditures related to the maintenance and expansion of our businesses, operations and infrastructure; |
| • | the results of our acquisitions of, or investments in, other businesses or assets; |
| • | Mainland China’s regulations or government actions pertaining to activities on the internet, including various forms of entertainment, online payment and activities otherwise affecting our online marketing customers, and those relating to the products and services we provide; |
| • | unforeseen events, such as negative publicity arising from widespread media coverage and other sources and labor disputes, or unexpected cessation or downsize of existing business; and |
| • | geopolitical events, natural disasters or epidemics. |
Because of the rapid growth of our business, our historical results of operations may not be useful to you in predicting our future results of operations. Our user traffic tends to be seasonal. For example, we generally experience less user traffic during public holidays and other special event periods in China. In addition, advertising and other marketing spending in China has historically been cyclical, reflecting overall economic conditions as well as budgeting and buying patterns. As we continue to grow, we expect that the cyclicality and seasonality in our business may cause our results of operations to fluctuate.
A severe and prolonged downturn in the Chinese or global economy could materially and adversely affect our business, results of operations and financial condition.
COVID-19 had a severe and negative impact on the Chinese and the global economy from 2020 through 2022, and the global macroeconomic environment still faces numerous challenges. The growth rate of the Chinese economy has been slowing since 2010 and the Chinese population began to decline in 2022. The Federal Reserve and other central banks outside of China have raised interest rates. The Russia-Ukraine conflict, the Hamas-Israel conflict and the attacks on shipping in the Red Sea have heightened geopolitical tensions across the world. The impact of the Russia-Ukraine conflict on Ukraine food exports has contributed to increases in food prices and thus to inflation more generally. There have also been concerns about the relationship between China and other countries which may potentially have economic effects. In particular, there is significant uncertainty about the future relationship between the United States and China with respect to a wide range of issues including trade policies, treaties, government regulations and tariffs. Economic conditions in China are sensitive to global economic conditions, as well as changes in domestic economic and political policies and the expected or perceived overall economic growth rate in China. In addition, SMEs as our customers are more vulnerable to changes in macroeconomic conditions. If macroeconomic conditions deteriorate, SMEs may be directly hit, which in turn may lead to higher default rates or decreasing borrowings. As a result, any severe or prolonged slowdown in the global or Chinese economy may materially and adversely affect our business, results of operations and financial condition.
Rising international political tensions, including changes in U.S. and international trade policies, particularly with regard to China, may adversely impact our business and operating results.
The U.S. government has made statements and taken certain actions that may lead to changes in U.S. and international trade policies towards China. It remains unclear what additional actions, if any, will be taken by the U.S. or other governments with respect to international trade agreements, the imposition of tariffs on goods imported into the United States, tax policy related to international commerce, or other trade matters. While cross-
44
Table of Contents
border business may not be an area of focus for us, any unfavorable government policies on international trade, such as capital controls or tariffs, may affect the demand for our products and services, impact the competitive position of our products or prevent us from selling products in certain countries. If any new tariffs, legislation and/or regulations are implemented, or if existing trade agreements are renegotiated or, in particular, if the U.S. government takes retaliatory trade actions due to ongoing U.S.-China trade tensions, such changes could have an adverse effect on our business, financial condition and results of operations.
In addition, we have been closely monitoring domestic policies in the United States designed to restrict certain Chinese companies from supplying or operating in the U.S. market. These policies include the Clean Network project initiated by the U.S. Department of State in August 2020, new authorities granted to the Department of Commerce to prohibit or restrict the use of information and communications technology and services, and the Executive Order on Protecting America’s Sensitive Data from Foreign Adversaries published in June 2021. While a substantial majority of our business is conducted in mainland China, policies like these may deter U.S. users from accessing and/or using our search engine, apps and other products in the United States, which could adversely impact our user experience and reputation. Similarly, India has permanently banned a large number of apps since 2020 out of national security concerns, many of which are China-based apps (including our apps), escalating regional political and trade tensions. From time to time, in connection with perceived security incidents, the U.S. government may impose more stringent control measures or restrictions on the products and services of Chinese companies. The government measures taken and potential subsequent developments are beyond our control, and we could be adversely affected regardless whether or not we were actually involved in the incidents.
Likewise, we are monitoring policies in the United States that are aimed at restricting U.S. persons from investing in or supplying certain Chinese companies. The United States and various foreign governments have imposed controls, license requirements and restrictions on the import or export of technologies and products, or voiced the intention to do so. For instance, in October 2022, the U.S. government imposed a set of export control measures with respect to China. Among other things, these export control measures add certain semiconductor manufacturing equipment, advanced chips, and items containing such chips to the Commerce Control List, expand the number of items made outside the United States that are subject to U.S. export controls in the advanced computing and semiconductor context, and impose license requirements for certain items destined for China for use in supercomputers, the development or production of semiconductors or semiconductor manufacturing equipment, or destined for semiconductor fabrication facilities in China that produce certain advanced chips. These measures also restrict the ability of U.S. persons to provide “support” for semiconductor manufacturing and related activities in China and may seriously affect the ability of Chinese companies to purchase or obtain certain semiconductor manufacturing equipment or advanced chips, which may in turn further affect the operations and development of AI technologies of such companies. On October 17, 2023, the U.S. government released two additional interim rules expanding and enhancing export controls of semiconductors under the above export control measures. These interim rules became effective in November 2023 and intend to further restrict China’s access to U.S. semiconductor technology by setting tighter parameters on existing restrictions on chips and strengthening restrictions on semiconductor manufacturing equipment. We have invested significant resources in the research and development of AI technology and expect this element to be a driver for our future growth. However, the introduction of new export control measures could potentially impose limitations on our access to advanced semiconductor technologies, which may hinder the process of the research and development of our AI technology and AI chips. As a result, our future AI abilities and our financial performance may be materially and adversely affected.
On August 9, 2023, the Biden administration released an executive order directing the Treasury Department to create an outbound foreign direct investment review program that will require reporting on or (in more narrow circumstances) will prohibit investments by U.S. persons involving “covered national security technologies and products,” which is defined to include “sensitive technologies and products in the semiconductors and microelectronics, quantum information technologies, and AI sectors that are critical for the military, intelligence, surveillance, or cyber-enabled capabilities” of China (to include Hong Kong and Macau). On the same day, the
45
Table of Contents
Treasury Department issued an advance notice of proposed rulemaking, which provides a conceptual framework for outbound investment controls focused on China. As of the date of this annual report, the final rules implementing the executive order has not become effective yet, and the scope of the outbound foreign direct investment review program may be materially different from what is currently contemplated. Therefore, there are substantial uncertainties on whether the outbound foreign direct investment review program will have a material impact on our business, results of operations, financial condition, and prospects.
In addition, the United States is in the process of developing new export controls with respect to “emerging and foundational” technologies, which may include certain AI and semiconductor technologies. The U.S. government also reportedly is considering imposing new restrictions on the ability of U.S. persons to make investments in or engage in transactions with certain Chinese companies. The United States has also restricted U.S. persons from investing in publicly-traded securities of “Chinese Military-Industrial Complex” companies identified by the Treasury Department. Measures such as these could deter suppliers in the United States and/or other countries that impose export controls and other restrictions from providing technologies and products to, making investments in, or otherwise engaging in transactions with Chinese companies.
As a result of these and other measures, Chinese companies may have to identify and secure alterative supplies or sources of financing, which they may not be able to do so in a timely manner and at commercially acceptable terms, or at all. In addition, Chinese companies may have to limit and reduce their research and development and other business activities, or cease conducting transactions with parties, in the United States and other countries that impose export controls or other restrictions. Like other Chinese companies, our business, financial condition and results of operations could be adversely affected as a result.
Failure to retain key third-party agents or attract additional third-party agents, or termination of our relationship with third-party agents could materially and adversely affect our business. Moreover, there is no assurance that our direct sales model in some key geographic markets will continue to be successful.
We rely, to a large extent, on a nationwide distribution network of third-party agents for our sales to, and collection of payment from, our customers. The operations and conduct of such third-party agents are beyond our control. They may fail to provide quality services to our customers or otherwise breach their contracts with our customers, or experience operational or financial difficulties or run out of business, or engage in misconduct with respect to our sales and our customers. If any of the foregoing issues arise, we may terminate our relationship with third-party agents, lose customers and our results of operations may be materially and adversely affected. In addition, since most of third-party agents are not bound by long-term contracts, we cannot assure you that we will continue to maintain favorable relationships with them. If we fail to retain key third-party agents or attract additional ones on terms that are commercially reasonable, our business and results of operations could be materially and adversely affected. We may decide to terminate existing third-party agents and transition to new ones or to our own distribution channel. If we decide and fail to smoothly transition our business to new third-party agents or to our own distribution channel, our business and results of operations could be materially and adversely affected.
We have transitioned to using our direct sales force to serve customers in some key geographic markets, such as Beijing, Shanghai and other cities. There is no assurance that our direct sales model in those markets will continue to be successful. If we fail to maintain an adequate direct sales force, retain existing customers and continue to attract new customers in those markets, our business, results of operations and prospects could be materially and adversely affected.
We may not be able to detect or prevent misconduct committed by our employees or third parties.
Misconduct by our employees, such as unauthorized business transactions, bribery, corruption and breach of our internal policies and procedures, or by consultants or other third parties, such as breach of law, may be difficult to detect or prevent. It could subject us to financial loss and sanctions imposed by government
46
Table of Contents
authorities while seriously damaging our reputation. This may also impair our ability to effectively attract prospective users, develop customer loyalty, obtain financing on favorable terms and conduct other business activities. Our risk management systems, information technology systems and internal control procedures are designed to monitor our operations and overall compliance. Historically we have identified certain incidents of employee and third-party misconduct. Although we have zero tolerance towards any illegal activities and have put in place internal policies and procedures against employee misconduct, however, there can be no assurance we will be able to identify non-compliance or illegal activities promptly, or at all. Furthermore, it is not always possible to detect and prevent misconduct committed by our employees or third parties, and the precautions we take to prevent and detect such activities may not be effective. This may materially and adversely affect our business, brand, financial condition and results of operations.
We rely on Baidu Union partners for a significant portion of our revenues. If we fail to retain existing Baidu Union partners or attract additional members, our revenue growth and profitability may be adversely affected.
We pay Baidu Union partners a portion of our revenues as we leverage traffic of the Baidu Union partners’ internet properties. Some of Baidu Union partners, however, may compete with us in one or more areas of our business. Therefore, they may decide in the future to terminate their relationships with us. If Baidu Union partners decide to use a competitor’s or their own internet search services, or if our competitors offer more attractive prices to bid for union traffic, our user traffic may decline, which may adversely affect our revenues. If we fail to attract additional Baidu Union partners, our revenue growth may be adversely affected. In addition, if we have to share a larger portion of our revenues to retain existing Baidu Union partners or attract additional partners, our profitability may be adversely affected.
Our overseas operations may not be successful.
We have launched products and services in local languages to internet users in several countries. It is uncertain when the operation will become profitable, if at all. In particular, we rely on local telecommunication operators and service providers to provide us with network services and data center hosting services, and our systems for these international products and services are not redundant across different regions and data centers. Any interruption to the internet infrastructure or any data center may render our products and services in the region unavailable.
We face certain risks inherent in doing business internationally, including:
| • | difficulties in developing, staffing and simultaneously managing a foreign operation as a result of distance, language and cultural differences; |
| • | challenges in formulating effective local sales and marketing strategies targeting users from various jurisdictions and cultures, who have a diverse range of preferences and demands; |
| • | challenges in identifying appropriate local business partners and establishing and maintaining good working relationships with them; |
| • | dependence on local platforms in marketing our international products and services overseas; |
| • | challenges in selecting suitable geographical regions for international business; |
| • | longer customer payment cycles; |
| • | currency exchange rate fluctuations; |
| • | political or social unrest or economic instability; |
| • | compliance with applicable foreign laws and regulations and unexpected changes in laws or regulations; |
| • | exposure to different tax jurisdictions that may subject us to greater fluctuations in our effective tax rate and potentially adverse tax consequences; and |
47
Table of Contents
| • | increased costs associated with doing business in foreign jurisdictions. |
One or more of these factors could harm our overseas operations and consequently, could harm our overall results of operations.
If we are unable to adapt or expand our existing technology infrastructure to accommodate greater traffic, content or additional customer requirements, our business may be harmed.
Our Baidu platform regularly serves a large number of users and customers and delivers a large number of daily page views. Our technology infrastructure is highly complex and may not provide satisfactory service in the future, especially as the number of users and customers increases. We may be required to upgrade our technology infrastructure to keep up with the increasing traffic on our Baidu platform, such as increasing the capacity of our servers and the sophistication of our software. If we fail to adapt our technology infrastructure to accommodate greater traffic or customer requirements, our users and customers may become dissatisfied with our services and switch to our competitors’ websites, which could harm our business.
If we fail to detect fraudulent click-throughs, our customers’ confidence in us could be damaged and our revenues could decline.
We are exposed to the risk of click-through fraud on our paid search results. Click-through fraud occurs when a person clicks paid search results for a reason other than to view the underlying content of search results. Although our anti-spam algorithms and tools can identify and respond to spam web pages quickly and effectively and thus capture and prevent some fraudulent click-throughs, there is no assurance that our anti-spam technology is able to detect and stop all fraudulent click-throughs. If we fail to detect fraudulent clicks or otherwise are unable to prevent this fraudulent activity, the affected customers may experience a reduced return on investment in our online marketing services and lose confidence in the effectiveness of our services, and we may issue refunds to our customers. If this happens, we may be unable to retain existing customers or attract new customers for our online marketing services, and our online marketing revenues could decline. In addition, affected customers may also file legal actions against us claiming that we have over-charged or failed to refund them. Any such claims or similar claims, regardless of their merits, could be time-consuming and costly for us to defend against and could also adversely affect our brand and our customers’ confidence in the effectiveness of our services. We experienced a number of incidents involving fraudulent click-throughs in recent years. Although the amount of revenue involved in these incidents was immaterial, such cases of fraudulent click-throughs, if occurring on a large-scale and widespread manner, may damage the reputation of our search ecosystem.
The successful operation of our business depends upon the performance and reliability of the internet infrastructure and fixed telecommunications networks in China.
Our business depends on the performance and reliability of the internet infrastructure in China. Almost all access to the internet is maintained through state-owned telecommunication operators under the administrative control and regulatory supervision of the PRC Ministry of Industry and Information Technology, or the MIIT. In addition, the national networks in mainland China are connected to the internet through international gateways controlled by the PRC government. These international gateways are the only channels through which a domestic user can connect to the internet. It is unpredictable whether a more sophisticated internet infrastructure will be developed in mainland China. We may not have access to alternative networks in the event of disruptions, failures or other problems with mainland China’s internet infrastructure. In addition, the internet infrastructure in mainland China may not support the demands associated with continued growth in internet usage.
We rely heavily on China Telecommunications Corporation, or China Telecom, China United Network Communications Group Company Limited, or China Unicom, and China Mobile Communications Corporation, or China Mobile, to provide us with network services and data center hosting services. We have entered into
48
Table of Contents
contracts with various local branches or subsidiaries of China Telecom, China Unicom and China Mobile to obtain data communications capacity. We have limited access to alternative services in the event of disruptions, failures or other problems with the fixed telecommunications networks of these companies, or if these companies otherwise fail to provide the services. Any unscheduled service interruption could damage our reputation and result in a decrease in our revenues. Furthermore, we have no control over the costs of the services provided by these telecommunication companies. If the prices that we pay for telecommunications and internet services rise significantly, our gross margins could be adversely affected. In addition, if internet access fees or other charges to internet users increase, our user traffic may decrease, which in turn may harm our revenues.
Security breaches and improper access to or disclosure of our data or user data, or any system failure or compromise of our security, could harm our reputation and adversely affect our business.
Our business is prone to cyber-attacks seeking unauthorized access to our data or user data or to disrupt our ability to provide services. Any failure to prevent or mitigate security breaches and improper access to or disclosure of our data or user data, such as personal information, including names, accounts, user IDs and passwords, and payment or transaction related information, could result in the loss or misuse of such data, which could cause a loss or give rise to liabilities to the owners of confidential information, such as our users, customers, third-party agents, content providers and Baidu Union partners, subject us to penalties imposed by administrative authorities, and disrupt our operations. For example, Baidu Drive provides services to many individual users who may upload sensitive personal information and documents of significance to Baidu Drive. In the event of an unauthorized access, such information and documents might be leaked or even further sold through illegal means. In addition, computer malware, viruses, social engineering (predominantly spear phishing attacks), and general hacking have become more prevalent in our industry, have occurred on our systems in the past, and may occur again on our systems in the future. We also regularly encounter attempts to create false or undesirable user accounts, purchase ads, or take other actions on our platform for purposes such as spamming, spreading misinformation, or other objectionable ends. As a result of our prominence, the size of our user base, and the types and volume of personal data on our systems, we believe that we are a particularly attractive target for such breaches and attacks. Such attacks may cause interruptions to the services we provide, degrade the user experience, cause users or customers to lose confidence and trust in our products and services, impair our internal systems, or result in financial harm to us.
We have adopted strict information security policies and deployed advanced measures to implement the policies, including, among others, advanced encryption technologies. However, we may not be able to implement adequate preventative measures or prevent compromises or breaches of our preventative measures due to the evolution of the sophistication of cyber-attacks, advances in technology, an increased level of sophistication and diversity of our products and services, an increased level of expertise of hackers, new discoveries in the field of cryptography or others, software bugs or other technical malfunctions, employee, contractor, or vendor error or malfeasance, government surveillance, or other evolving threats. As a result, we may incur significant costs in protecting against or remediating cyber-attacks.
In addition, some of our developers or other partners, such as those that help us measure the effectiveness of advertisements, may receive or store information provided by us or by our users through mobile or web applications integrated with our products. We provide limited information to such third parties based on the scope of services provided to us. However, if these third parties fail to adopt or adhere to adequate data security practices, or in the event of a breach of their networks, our data or our users’ data may be improperly accessed, used, or disclosed.
Affected users or government authorities could initiate legal or regulatory actions against us in connection with any actual or perceived security breaches or improper disclosure of data, which could cause us to incur significant expense and liabilities or result in orders or consent decrees forcing us to modify our business practices. Such incidents or our efforts to remediate such incidents may also result in a decline in our user base or engagement levels. Any of these events could have a material and adverse effect on our business, reputation, or results of operations.
49
Table of Contents
Defects or errors in our products or services could diminish demand for our products or services, harm our business and results of operations and subject us to liability.
Our customers use our products for important aspects of their personal lives or businesses. Any errors, defects or disruptions to our products and any other performance problems with our products could damage our customers’ personal lives or businesses and, in turn, hurt our brand and reputation. We provide regular updates to our products, which have in the past contained, and may in the future contain, undetected errors, failures, vulnerabilities and bugs when first introduced or released. Real or perceived errors, failures or bugs in our products could result in negative publicity, loss of or delay in market acceptance of our platform, loss of competitive position, lower customer retention or claims by customers for losses sustained by them. In such an event, we may be required, or may choose, for customer relations or other reasons, to expend additional resources in order to help correct the problem. In addition, we may not carry insurance to compensate us for any losses that may result from claims arising from defects or disruptions in our products. As a result, our reputation and our brand could be harmed, and our business, results of operations and financial condition may be adversely affected.
Concerns and unfavorable media coverage relating to our privacy practices could damage our reputation, deter current and potential users and customers from using our products and services and negatively impact our business.
The internet industry is facing significant challenges with respect to information security and privacy, including the storage, transmission and sharing of confidential information. The general public, our users, customers, third-party agents, content providers and Baidu Union partners are increasingly aware of the vulnerability of confidential and private information. We will continue to experience media or regulatory scrutiny of our actions or decisions regarding user privacy, content or advertising. Furthermore, concerns have been expressed from time to time about whether our products, services or processes could compromise the privacy of users and others.
We transmit and store confidential and private information of our users, customers, third-party agents, content providers and Baidu Union partners, such as personal information, including names, accounts, user IDs and passwords, and payment or transaction related information. Historically there has been negative publicity or media reports making allegations about our practice, and we cannot rule out similar possibilities of such in the future. Although we strive to comply with all privacy related requirements, we cannot guarantee that our products or services are at all times without defect due to the complexity and rapid evolvement of technology, etc. Concerns about our practices with regard to the collection, use, disclosure, or security of personal information or other privacy related matters, and any negative publicity on our information safety or privacy protection mechanism and policy, even if unfounded, has in the past, and could adversely affect our business and results of operations and financial condition. Such concerns and negative publicity could damage our reputation and brand, and have an adverse effect on the size, engagement and loyalty of our user base, which could adversely affect our business and results.
If we fail to maintain an effective system of internal control over financial reporting, we may lose investor confidence in the reliability of our financial statements.
We are subject to reporting obligations under the U.S. securities laws. The SEC, as required by Section 404 of the Sarbanes-Oxley Act of 2002, adopted rules requiring every public company to include a management report on the company’s internal control over financial reporting in its annual report, which contains management’s assessment of the effectiveness of its internal control over financial reporting. In addition, an independent registered public accounting firm must attest to and report on the effectiveness of the company’s internal control over financial reporting.
Our management has concluded that our internal control over financial reporting was effective as of December 31, 2023. See “Item 15. Controls and Procedures.” Our independent registered public accounting firm
50
Table of Contents
has issued an attestation report, which has concluded that our internal control over financial reporting was effective in all material aspects as of December 31, 2023. However, if we fail to maintain an effective system of internal control over financial reporting in the future, our management and our independent registered public accounting firm may not be able to conclude that we have effective internal control over financial reporting at a reasonable assurance level. This could in turn result in loss of investor confidence in the reliability of our financial statements and negatively impact the trading price of our Class A ordinary shares and ADSs. Furthermore, we have incurred and anticipate that we will continue to incur considerable costs, management time and other resources in an effort to comply with Section 404 of the Sarbanes-Oxley Act and other requirements.
Termination or other changes of related party transactions in the ordinary course of business may have an adverse impact on our results of operations and financial performance.
Certain parties with which we transact may be deemed as our related parties by virtual of our equity interests in or significant influence over them. We have entered into transactions with these related parties in the ordinary course of business such as providing online marketing and/or other services to them. In 2021, 2022 and 2023, we had related party transactions of RMB4.4 billion, RMB4.4 billion and RMB4.5 billion (US$636 million) in aggregate, respectively, in connection with online marketing and other services provided to related parties in our ordinary course of business. Please refer to “Item 7. Major Shareholders and Related Party Transactions” for more details. However, such related party transactions may discontinue in the future for a variety of reasons, such as the development status of relevant business or our relationship with the relevant parties. For example, a party may cease to be our related party, when we strategically dispose of our equity interests or otherwise cease to have significant influence over it, and such change in relationship may adversely affect our transactions and other business collaboration with the party. In addition, if we later on acquire a controlling stake in a related party or otherwise consolidate its results into our consolidated financial statements, our transactions with such party will no longer be related party transactions, and will not contribute to our financial results on a consolidated basis. Although we do not rely on these related party transactions, such change in relationship and/or transactions with related parties may have an adverse impact on our results of operations and financial performance.
We may have exposure to greater than anticipated tax liabilities.
We are subject to enterprise income tax, value-added tax and other taxes in many provinces and cities in mainland China and our tax structure is subject to review by various local tax authorities. The determination of our provision for income tax and other tax liabilities requires significant judgment. In the ordinary course of our business, there are many transactions and calculations where the ultimate tax determination is uncertain. For example, if our P4P service is classified as a form of advertisement distribution service, we may be required to pay a cultural business construction fee. See “Item 5.A. Operating and Financial Review and Prospects—Operating Results—Taxation.” In addition, if this classification of P4P services were to be retroactively applied, we might be subject to sanctions, including payment of delinquent fees and fines for the revenues generated from our P4P services prior to the classification. Moreover, under the PRC Enterprise Income Tax Law, or the EIT Law, the PRC tax authorities may impose reasonable adjustments on taxation if they have identified any related party transactions that are inconsistent with arm’s-length principles. Particularly, pursuant to the Administrative Measures for Special Tax Adjustment and Investigation and Mutual Consultation Procedures issued by the State Administration of Tax in March 2017, if a mainland China enterprise makes an outbound payment to its overseas related party which undertakes no functions, bears no risks or has no substantial operation or activities and such payment is inconsistent with arm’s-length principles, the tax authorities may carry out a special tax adjustment based on the full amount deducted prior to tax. Although we believe all our related party transactions, including all payments by our mainland China subsidiaries and the variable interest entities to our non-mainland China entities, are made on an arm’s-length basis and our estimates are reasonable, the ultimate decisions by the tax authorities may differ from the amounts recorded in our financial statements and may materially affect our financial results in the period or periods for which such determination is made.
51
Table of Contents
Furthermore, due to shifting economic and political conditions, tax policies and laws, tax rates in various jurisdictions may be subject to significant changes in ways that could impair our financial results. Various jurisdictions around the world have enacted or are considering enacting digital services taxes, which could lead to inconsistent and potentially overlapping international tax regimes applicable to highly-digitalized businesses. In 2021, the Organization for Economic Cooperation and Development announced an Inclusive Framework on Base Erosion and Profit Shifting including Pillar Two Model Rules defining the global minimum tax, which calls for the taxation of large multinational corporations at a minimum rate of 15%. Subsequently, multiple sets of administrative guidance have been issued. Various tax jurisdictions have either recently enacted legislation to adopt certain components of the Pillar Two Model Rules beginning in 2024 with the adoption of additional components in later years or announced their plans to enact such legislation in future years. We will continue to evaluate the impact of such legislative initiatives in the tax jurisdictions we operate in. There are uncertainties on the rules and implementations and there is no guarantee that this will not affect our financial results.
In addition, our mainland China subsidiaries and the variable interest entities providing advertising services are exempted from cultural business construction fee for 2020 and 2021 and enjoy a 50% reduction of cultural business construction fee from January 1, 2022 to December 31, 2024. There is no assurance that the 50% reduction will continue after 2024.
We are subject to changing laws and regulations regarding regulatory matters, corporate governance and public disclosures that have increased both our costs and the risk of non-compliance.
We are subject to rules and regulations by various governing bodies, including, for example, the SEC, which is charged with the protection of investors and the oversight of companies whose securities are publicly traded, and the various regulatory authorities in China and the Cayman Islands, and to new and evolving regulatory measures under applicable law. Our efforts to comply with new and changing laws and regulations have resulted in and are likely to continue to result in, increased general and administrative expenses and a diversion of management time and attention from revenue-generating activities to compliance activities.
Moreover, because these laws, regulations and standards change over time and are subject to varying interpretations, their application in practice may evolve as new guidance becomes available. This evolution may result in ongoing uncertainty regarding compliance matters and additional costs due to continuous revisions of our disclosure and governance practices. If we fail to address and comply with these regulations and any subsequent changes, we may face penalties and our business could suffer harm. For example, on December 29, 2023, the Standing Committee of the National People’s Congress promulgated the Amended PRC Company Law, which will come into effect on July 1, 2024 and supersede the existing PRC Company Law. The amended PRC Company Law imposes stricter requirements on capital contributions for companies established in the PRC. On February 6, 2024, the SAMR released a draft of the Provisions of the State Council on Implementing the Registered Capital Registration and Management System under the Amended PRC Company Law for public comments until March 5, 2024. This draft further specifies the detailed requirements and measures for the registration and management of registered capital under the Amended PRC Company Law. See “Item 4.B. Information on the Company—Business Overview—Regulations—Regulations on Corporate Governance” for details. According to the Amended PRC Company Law, we may need to fulfill capital contribution obligations to our subsidiaries or provide financial support to the nominee shareholders of the variable interest entities within a much shorter time frame than currently required. However, since the amended PRC Company Law is still relatively new and the foregoing draft implementation measures have only been released for public comment, there remains uncertainty regarding the law’s implementation and interpretation, as well as the adoption and effective date of the implementation measures. We will closely monitor the legislative developments related to the amended PRC Company Law and its implementation measures to assess the potential impact on us in a timely manner.
52
Table of Contents
We have limited business insurance coverage.
We have purchased insurance to cover certain liabilities, properties, product quality and employees in connection with certain aspects of our businesses. However, we only have limited business liability or disruption insurance coverage for our operations in mainland China. Any business disruption may result in our incurring substantial costs and the diversion of our resources.
We face risks related to health epidemics, severe weather conditions and other outbreaks.
In recent years, there have been outbreaks of health epidemics in China and globally, including the outbreak of COVID-19 pandemic. COVID-19 resulted in quarantines, travel restrictions, and temporary closure of businesses and facilities in China and worldwide between 2020 and 2022. For its impact on our financial results, please see “Item 5. Operating and Financial Review and Prospects.” Potential impacts of health epidemics may include, but are not limited to, the following:
| • | temporary closure of offices, travel restrictions or suspension of services of our customers and suppliers may negatively affect the demand for our services; |
| • | our customers in industries that are negatively impacted by epidemics, including the healthcare, travel, offline education, franchising, auto/transportation and real estate/home furnishing sectors, may reduce their budgets on online advertising and marketing, which may materially adversely impact our revenue from online marketing services; |
| • | our customers may require additional time to pay us or fail to pay us at all, which could significantly increase the amount of accounts receivable and require us to record additional allowances for doubtful accounts; |
| • | the business operations of our third-party agents could be negatively impacted, which may negatively impact our distribution channel, or result in loss of customers or disruption of our services, which may in turn materially adversely affect our financial condition and operating results; |
| • | any disruption of our supply chain, logistics providers or customers could adversely impact our business and results of operations, including causing us or our suppliers to cease manufacturing Xiaodu smart devices for a period of time or materially delay delivery to customers, which may also lead to loss of customers, as well as reputational, competitive and business harm to us; |
| • | many of our customers, third-party agents, suppliers and other partners are SMEs, which may not have strong cash flows or be well capitalized, and may be vulnerable to a pandemic and slowing macroeconomic conditions; |
| • | the global stock markets may experience significant declines and the private and public companies that we have invested in could be materially adversely affected, which may lead to significant impairment in the fair values of our investments and in turn materially adversely affect our financial condition and operating results; and |
| • | corporate social responsibility initiatives we put forth in response to epidemics may negatively affect our financial condition and operating results. |
Risks Related to Our Corporate Structure
Laws and regulations of mainland China governing our businesses and the validity of certain of our contractual arrangements are uncertain. If we are found to be in violation, we could be subject to sanctions. In addition, changes in the laws and regulations of mainland China or changes in interpretations thereof may materially and adversely affect our business.
Current laws and regulations of mainland China place certain restrictions and conditions on foreign ownership of certain areas of businesses. For example, pursuant to the Special Administrative Measures
53
Table of Contents
(Negative List) for Foreign Investment Access (2021 Version), foreign investors are not allowed to own more than 50% of the equity interests in a value-added telecommunication service provider (excluding e-commerce, domestic multiparty communications, store-and-forward and call centers). In addition, foreign investors are prohibited from investing in companies engaged in internet culture businesses (except for music) and radio and television program production businesses.
We and our mainland China subsidiaries are still considered foreign persons or foreign-invested enterprises under the laws related to foreign investment of mainland China. As a result, we and our mainland China subsidiaries are subject to legal restrictions on or conditions for foreign ownership of various industries, including the aforementioned ones. Due to these restrictions and conditions, we operate our platform and conduct business in certain restricted or prohibited industries in mainland China through the variable interest entities. As all the nominee shareholders of the variable interest entities are either citizens of mainland China or domestic enterprises in mainland China, these entities are therefore considered as domestic enterprises under the laws of mainland China. The “nominee shareholders” refer to those shareholders who have entered into exclusive equity purchase and transfer option agreements and equity pledge agreements with us as part of the contractual arrangements. Our contractual arrangements with the variable interest entities and the nominee shareholders allow us to have the power to direct the activities of these entities that most significantly impact their economic performance. These contractual arrangements demonstrate our ability and intention to continue to exercise the ability to absorb losses or receive economic benefits that could potentially be significant to the variable interest entities. In 2021, 2022 and 2023, we derived 44%, 47% and 45% of our external revenues from the variable interest entities, respectively.
However, our company is a Cayman Islands holding company with no equity ownership in the variable interest entities and we conduct our operations in mainland China through (i) our mainland China subsidiaries and (ii) the variable interest entities with which we have maintained contractual arrangements. Investors in our Class A ordinary shares or the ADSs thus are not purchasing equity interest in the variable interest entities in mainland China but instead are purchasing equity interest in a Cayman Islands holding company. If the PRC government deems that our contractual arrangements with the variable interest entities do not comply with mainland China’s regulatory restrictions on foreign investment in the relevant industries, or if these regulations or the interpretation of existing regulations change or are interpreted differently in the future, we could be subject to severe penalties or be forced to relinquish our interests in those operations. Baidu, Inc. may not be able to repay our indebtedness, and our shares may decline in value or become worthless, if we are unable to assert our contractual control rights over the assets of the variable interest entities. Our holding company in the Cayman Islands, the variable interest entities, and investors of our company face uncertainty about potential future actions by the PRC government that could affect the enforceability of the contractual arrangements with the variable interest entities and, consequently, significantly affect the financial performance of the variable interest entities and our company as a group.
There are substantial uncertainties regarding the interpretation, application and change of the laws and regulations of mainland China, including, but not limited to, the laws and regulations governing our business, or the enforcement and performance of our contractual arrangements with the variable interest entities, including but not limited to Baidu Netcom and the nominee shareholders. Due to the uncertainty and complexity of the regulatory environment, we cannot assure you that we would always be in full compliance with applicable laws and regulations, the violation of which may have adverse effect on our business and our reputation.
Although we believe we, our mainland China subsidiaries and the variable interest entities comply with current laws and regulations of mainland China, we cannot assure you that the PRC government would agree that our contractual arrangements comply with the licensing, registration or other regulatory requirements of mainland China, with existing policies or with requirements or policies that may be adopted in the future. The PRC government has discretion in determining rectifiable or punitive measures for non-compliance with or violations of the laws and regulations of mainland China. If the PRC government determines that we or the variable interest entities do not comply with applicable law, it could revoke the variable interest entities’ business
54
Table of Contents
and operating licenses, require the variable interest entities to discontinue or restrict the variable interest entities’ operations, restrict the variable interest entities’ right to collect revenues, block the variable interest entities’ websites, require the variable interest entities to restructure their operations, impose additional conditions or requirements with which the variable interest entities may not be able to comply, impose restrictions on the variable interest entities’ business operations or on their customers, or take other regulatory or enforcement actions against the variable interest entities that could be harmful to their business. Any of these or similar occurrences could significantly disrupt our or the variable interest entities’ business operations or restrict the variable interest entities from conducting a substantial portion of their business operations, which could materially and adversely affect the variable interest entities’ business, financial condition and results of operations. If any of these occurrences results in our inability to direct the activities of any of the variable interest entities that most significantly impact its economic performance, and/or our failure to receive the economic benefits from any of the variable interest entities, we may not be able to consolidate these entities in our consolidated financial statements in accordance with U.S. GAAP.
Our contractual arrangements with the variable interest entities in mainland China and the individual nominee shareholders may not be as effective in providing control over these entities as direct ownership.
Since the laws of mainland China restrict or impose conditions on foreign equity ownership in, among other areas, the internet content services, value-added telecommunication-based services, internet map services, online audio and video services and mobile application distribution companies in mainland China, we operate our platform and conduct these businesses through the variable interest entities in mainland China. We have no equity interest in any of these entities and must rely on contractual arrangements to control and operate the businesses and assets held by the variable interest entities, including the domain names and trademarks that have been transferred from our subsidiaries to the variable interest entities in accordance with requirements of the laws of mainland China. These contractual arrangements may not be as effective in providing control over these entities as direct ownership. For example, the variable interest entities and the individual nominee shareholders could breach their contractual arrangements with us by, among other things, failing to operate our business, such as using the domain names and trademarks our subsidiaries have transferred to them or maintaining our platform, in an acceptable manner or taking other actions that are detrimental to our interests. If the variable interest entities or the individual nominee shareholders fail to perform their obligations under these contractual arrangements, we may have to incur substantial costs to enforce such arrangements, and rely on legal remedies under the laws of mainland China, including contract remedies, which may not be sufficient or effective. If we are unable to enforce these contractual arrangements, or if we suffer significant delay or other obstacles in the process of enforcing these contractual arrangements, we may not be able to have the power to direct the activities that most significantly affect the economic performance of the variable interest entities, and we may lose control over the assets owned by the variable interest entities, including our baidu.com domain name and website, and any other domain names and websites we have access to may not attract a large number of users and customers at the same level as baidu.com. As a result, our ability to conduct our business may be materially and adversely affected, and we may not be able to consolidate the financial results of the relevant variable interest entities into our consolidated financial statements in accordance with U.S. GAAP, which may materially and adversely affect our results of operations and damage our reputation. In addition, we have entered into similar contractual arrangements with other consolidated affiliated entities and their nominee shareholders in other jurisdictions. Similar to the potential risks associated with the contractual arrangement in the mainland China, the effectiveness and enforceability of such contractual arrangements may also be subject to the laws and precedents of the respective jurisdictions.
Our contractual arrangements with the variable interest entities in mainland China may result in adverse tax consequences to us.
As a result of our corporate structure and the contractual arrangements between our subsidiaries and each of the variable interest entities in mainland China, we would be subject to adverse tax consequences if the PRC tax authorities were to determine that the contracts between our subsidiaries and these variable interest entities were
55
Table of Contents
not on an arm’s-length basis and therefore constituted a favorable transfer pricing. Under the EIT Law, an enterprise must submit its annual tax return together with information on related-party transactions to the PRC tax authorities. The PRC tax authorities may impose reasonable adjustments on taxation if they have identified any related party transactions that are inconsistent with arm’s-length principles. For example, the PRC tax authorities could request that the variable interest entities adjust their taxable income upward for PRC tax purposes. Such adjustment could adversely affect us by increasing the variable interest entities’ tax expenses without reducing our subsidiaries’ tax expenses, which could subject the variable interest entities to interest due on late payments and other penalties for under-payment of taxes.
The individual nominee shareholders of the variable interest entities may have potential conflicts of interest with us, which may adversely affect our business. We do not have any arrangements in place to address such potential conflicts.
We have designated individuals who are PRC nationals to be the nominee shareholders of the variable interest entities in mainland China. For example, Robin Yanhong Li, our chairman, chief executive officer and co-founder, is also the principal nominee shareholder of Baidu Netcom, which is the principal variable interest entity.
Although the individual nominee shareholders are contractually obligated to act in good faith and in our best interest, they may still have potential conflicts of interest with us. For example, some individual nominee shareholders of the variable interest entities do not have a significant equity stake in our company other than the share options granted to them. We cannot assure you that when conflicts of interest arise, any or all of these individuals will act in the best interests of our company or such conflicts will be resolved in our favor. In addition, these individuals may breach, cause the variable interest entities to breach or refuse to renew, the existing contractual arrangements with us. Currently, we do not have any arrangements to address potential conflicts of interest between these individuals and our company, except that we could exercise our transfer option under the exclusive equity purchase and transfer option agreement with the relevant individual nominee shareholder to request him/her to transfer all of his/her equity ownership in the relevant variable interest entity to a mainland China entity or individual designated by us. We rely on Mr. Robin Yanhong Li, who is also a director of our company, to abide by the Cayman Islands law, which provides that directors owe a fiduciary duty to the company, and those who are also directors or officers of our mainland China subsidiaries to abide by the laws of mainland China, which provides that directors and officers owe a fiduciary duty to the company. Such fiduciary duty requires directors and/or officers to act in good faith and in the best interests of the company and not to use their positions for personal gains. There are, however, no specific provisions under the Cayman Islands law or the laws of mainland China on how to address potential conflicts of interest. If we cannot resolve any conflict of interest or dispute between us and the individual nominee shareholders of the variable interest entities, we would have to rely on legal proceedings, which could disrupt our business, distract management and subject us to substantial uncertainty as to the outcome of any such legal proceedings.
We may be unable to collect long-term loans to the nominee shareholders of the variable interest entities in mainland China.
As of December 31, 2023, we have made long-term loans in an aggregate principal amount of RMB19.2 billion (US$2.7 billion) to the nominee shareholders of the variable interest entities. We extended these loans to enable the nominee shareholders to fund the capitalization of these entities. We may in the future provide additional loans to the nominee shareholders of the variable interest entities in mainland China in connection with any increase in their capitalization to the extent necessary and permissible under applicable law. Our ability to ultimately collect these loans will depend on the profitability of these variable interest entities and their operational needs, which are uncertain. As of the date of this annual report, we do not have any repayment schedule with respect to such loans to the nominee shareholders of the variable interest entities.
56
Table of Contents
We are in the process of registering the pledges of equity interests by nominee shareholders of some of the variable interest entities, and we may not be able to enforce the equity pledges against any third parties who acquire the equity interests in good faith in the relevant variable interest entities before the pledges are registered.
Pursuant to equity pledge agreements under the contractual arrangements, the nominee shareholders of each of the variable interest entities should pledge all of their equity interests in the relevant variable interest entities to our subsidiaries. An equity pledge agreement becomes effective among the parties upon execution. However, according to the PRC Civil Code, which became effective from January 1, 2021, an equity pledge is not perfected as a security property right unless it is registered with the local administration for market regulation. We are still in the process of registering the pledge relating to certain variable interest entity(ies), relating to recent equity interest transfers and capital increase. Prior to the completion of the registration, we may not be able to successfully enforce the equity pledge against any third parties who have acquired property right interests in good faith in the equity interests in the relevant variable interest entity(ies).
If the chops of our mainland China subsidiaries and the variable interest entities are not kept safely, are stolen or are used by unauthorized persons or for unauthorized purposes, the corporate governance of these entities could be severely and adversely compromised.
In mainland China, a company chop or seal serves as the legal representation of the company towards third parties even when unaccompanied by a signature. Each legally registered company in mainland China is required to maintain a company chop, which must be registered with the local Public Security Bureau. In addition to this mandatory company chop, companies may have several other chops which can be used for specific purposes. The chops of our mainland China subsidiaries and the variable interest entities are generally held securely by personnel designated or approved by us in accordance with our internal control procedures. To the extent those chops are not kept safely, are stolen or are used by unauthorized persons or for unauthorized purposes, the corporate governance of these entities could be severely and adversely compromised and those corporate entities may be bound to abide by the terms of any documents so chopped, even if they were chopped by an individual who lacked the requisite power and authority to do so. In addition, if the chops are misused by unauthorized persons, we could experience disruption to our normal business operations. We may have to take corporate or legal action, which could involve significant time and resources to resolve while distracting management from our operations.
Risks Related to Doing Business in China
Changes in China’s economic, political or social conditions or government policies could have a material and adverse effect on our business and operations.
Most of our business operations are conducted in mainland China. Accordingly, our business, results of operations, financial condition and prospects are affected by economic, political and social conditions in China generally and by continued economic growth in China as a whole.
Although mainland China’s economy has grown significantly in the past decades, growth has been uneven, both geographically and among various sectors of the economy. Some of the government measures aim to benefit the overall Chinese economy, but may unexpectedly have a negative effect on us. For example, our financial condition and results of operations may be affected by government control over capital investments or changes in tax regulations. Some of the stimulus measures designed to boost the Chinese economy may unexpectedly cause higher inflation, which could affect our results of operations and financial condition. For example, certain operating costs and expenses, such as employee compensation and office operating expenses, may increase as a result of higher inflation. Additionally, because a substantial portion of our assets consists of cash and cash equivalents, restricted cash and short-term investments, high inflation could significantly reduce the value and purchasing power of these assets.
57
Table of Contents
There are uncertainties regarding the interpretation and enforcement of PRC laws, rules and regulations.
We conduct our business primarily through our subsidiaries and the variable interest entities in mainland China. Our operations in mainland China are governed by the laws and regulations of mainland China. Our subsidiaries are generally subject to laws and regulations applicable to foreign investments in mainland China. As a civil law jurisdiction, the legal system of mainland China is based on written statutes. Prior court decisions may be cited for reference but have limited precedential value.
The laws and regulations of mainland China have significantly enhanced the protections afforded to various forms of foreign investments in mainland China for the past decades. However, because certain laws and regulations are relatively new, and because of the limited volume of published decisions and their nonbinding nature, the interpretation and enforcement of these laws and regulations involve uncertainties.
Furthermore, the legal system of mainland China is based in part on government policies and mainland China is geographically large and divided into various provinces and municipalities. As such, different regulations and policies may have different and varying applications and interpretations in different parts of mainland China, and it is possible that we may not be aware in a timely manner that we have been identified to be in violation of these policies and rules until sometime after the occurrence of the violation. In addition, certain administrative and court proceedings in mainland China may result in substantial costs and diversion of resources and management attention.
PRC government has complex regulatory requirements on the conduct of our business and it has recently promulgated certain regulations and rules to exert more oversight over offerings that are conducted overseas and/ or foreign investment in mainland China-based issuers. Such action could significantly limit or hinder our ability to offer or continue to offer securities to investors and cause the value of such securities to significantly decline.
We may be adversely affected by the complexity, uncertainties and changes in the regulations of internet and related business and companies in mainland China.
The PRC government regulates the internet and related industry extensively, including foreign ownership of, and the licensing and permit requirements pertaining to, companies in the internet industry. These internet-related laws and regulations are rapidly developing and evolving, and thus their interpretation and enforcement, and under certain circumstances, the compliance requirements still involve significant uncertainties. For example, we only have contractual control over our websites. We do not own the websites due to the restriction of foreign investment in businesses providing value-added telecommunications services in mainland China, including online information services.
The licensing requirements relating to the internet business in mainland China are uncertain and evolving. This means that permits, licenses or operations at some of our mainland China subsidiaries and the variable interest entities may be subject to challenge, or we may not be able to obtain or renew certain permits or licenses, including, without limitation, a Value-Added Telecommunication Business Operating License, which is issued by the MIIT, an Internet News License, which is issued by the CAC, a Short Messaging Service Access Code Certificate, which is issued by the MIIT, an Online Audio/Video Program Transmission License, which is issued by the State Administration of Press, Publication, Radio, Film and Television, or the SAPPRFT (the corresponding regulatory body currently known as National Radio and Television Administration, or the NRTA), a Radio and Television Program Production License, which is issued by the local bureau of the NRTA, a Surveying and Mapping Qualification Certificate for internet map services, which is issued by the National Administration of Surveying, Mapping and Geo-information, an Internet Culture Business Permit, which is issued by the local bureau of the then Ministry of Culture, or the Ministry of Culture and Tourism which has replaced the Ministry of Culture, a Publication Business Operating License, which is issued by the local bureau of the SAPPRFT or NPPA, a Filing Certificate for Internet Drug and Medical Devices Information Services or the Qualification Certificate for Internet Drug Information Services, which is issued by provincial branch of the State Food and Drug Administration (the corresponding regulatory body currently known as the National Medical Products Administration), a Human Resource Services License, which is issued by the local bureau of
58
Table of Contents
the Ministry of Human Resources and Social Security, a Filing Certificate for the Online Transaction Platform, which is issued by Beijing News and Publications Bureau, a Filing Certificate for Business of Category II Medical Devices, which is issued by Haidian Branch of Beijing Administration for Market Regulation, a Registration Certificate for Medical Devices, which is issued by Beijing Medical Products Administration, a Food Business License, which is issued by Zengcheng Branch of Guangzhou Administration for Market Regulation, a Medicine Business License, which is issued by Guangdong Medical Products Administration, a Filing Certificate for the Publication Online Transaction Platform, which is issued by Shanghai News and Publications Bureau, an Internet Domain Name Services License, which is issued by Beijing Communications Administration, a Medical Device Operation License, which is issued by Guangzhou Administration for Market Regulation, a Medical Device Production License, which is issued by Beijing Medical Products Administration, a Filing Certificate for Third-Party Platform Provider of Online Trading Service for Drugs, which is issued by Beijing Medical Products Administration, a Filing Certificate for Third-Party Platform Provider of Online Trading Service for Medical Devices, which is issued by Beijing Medical Products Administration, the Practice Licenses of Medical Institutions, which are issued by the local competent government authorities of Yinchuan and Hainan, an Internet Religious Information Service License, which is issued by Beijing Ethnic and Religious Affairs Commission, a Filing Certificate of Artworks Operators, which is issued by Haidian Brach of Beijing Culture and Tourism Bureau, a Filing Information Form of Third Party Platform Providers of Online Food Trading, which is issued by Beijing Medical Products Administration, an Aquatic Wildlife Operation and Utilization License, which is issued by Guangzhou Agriculture and Rural Affairs Bureau, an Online Taxi-Hailing Operation License, which is issued by Administrative Approval and Services Bureau of Zhaoyuan, and several permits for road testing, demonstration application and/or commercial operation of autonomous driving vehicles, which are issued by the local competent administrations for autonomous driving in certain cities in mainland China. Violation of the laws and regulations governing these licenses, approvals, filings or qualifications may result in penalties and even suspension or revocation of the licenses, approvals, filings or qualifications. Failure to obtain, maintain or renew these permits and licenses may significantly disrupt our business, or subject us to sanctions, requirements to increase capital or other conditions or enforcement, or compromise enforceability of related contractual arrangements, or have other harmful effects on us.
New laws and regulations may be promulgated to regulate internet activities, including online advertising and internet cultural activities. Other aspects of our online operations may be further regulated in the future. If these new laws and regulations are promulgated, additional licenses may be required for our online operations. If our operations do not comply with these new regulations at the time they become effective, or if we fail to obtain any licenses required under these new laws and regulations, we could be subject to penalties.
We provide value-added telecommunications services through the variable interest entities, which hold the required licenses. In July 2006, the MIIT issued the Notice of the Ministry of Industry and Information Technology on Intensifying the Administration of Foreign Investment in Value-Added Telecommunications Services. This notice prohibits domestic telecommunication service providers from leasing, transferring or selling telecommunication business operating licenses to any foreign investor in any form, or providing any resources, sites or facilities to any foreign investor for their illegal operation of a telecommunication business in mainland China. According to this notice, either the holder of a Value-Added Telecommunication Business Operating License or its shareholders must directly own the domain names and trademarks used by the license holder in its provision of value-added telecommunications services. The major variable interest entities hold the necessary assets that are material to the operation of our business, including domain names, personnel, facilities and most of our intellectual property rights.
As we enter into new businesses, we may encounter additional regulatory uncertainties. For example, the current legal framework of mainland China on autonomous cars or autonomous driving is relatively new and evolving. Pursuant to the local rules and regulations in various cities including Beijing, Shanghai, Chongqing, Guangzhou, Wuhan and other cities, any entity intending to conduct a road testing, demonstration application of autonomous driving vehicles and/or commercial operations in these cities must file an application for road testing, demonstration application and/or commercial operations with a designated local agency supervising road
59
Table of Contents
testing, operation and commercialization of autonomous vehicles in these cities. It also remains uncertain what additional compliance requirements we need to meet in order to undertake a road testing, operation and commercialization of our autonomous driving cars in other locations in mainland China. Baidu has obtained permission to conduct road testing in Beijing, Shanghai, Guangzhou, Shenzhen, Chongqing, Wuhan, Changsha, Chengdu, Hefei, Yangquan, Wuzhen and certain other cities or regions. It has also achieved the qualification for remote driving commercialization demonstration, allowing it to carry out fully driverless pilot commercialization in Wuhan, Chongqing, Beijing and Shenzhen. In addition, it has received the remote driving road test permit in Shanghai, along with the qualification to demonstrate remote driving with passenger carriage in Guangzhou. Furthermore, Baidu has secured the qualification for pilot commercialization in Beijing, Shanghai, Guangzhou, Shenzhen, Chongqing, Wuhan, Changsha, Hefei, Wuzhen and Yangquan. In particular, Baidu has obtained the permits to charge fees for driverless ride-hailing services (with a safety operator in the vehicles, but not behind the steering wheel) on public roads in Beijing in July 2022, and obtained the permits for fully driverless ride-hailing services on open roads in Chongqing and Wuhan in August 2022. There is no guarantee that the road testing, demonstration application and/or commercial operations of our autonomous driving cars in other locations fully complies with local laws and regulations. If our road testing, demonstration application and/or commercial operations are deemed by local enforcement authority as a violation of the applicable traffic and transportation laws, in addition to being warned or fined according to the laws and regulations on road traffic safety, we may also have to suspend the road testing, the demonstration application and/or commercial operations, which may result in that the progress of our research and development of autonomous cars will be adversely affected and our revenue from driverless ride-hailing services will decline. We also engage in generative AI business which is a new business area in mainland China. The regulatory and legal framework on generative AI is evolving rapidly and may not sufficiently cover all aspects of the research, development and application of generative AI in mainland China. The PRC government authorities have gradually accelerated the pace of legislation for generative AI related technologies including algorithm recommendation and deep synthesis in recent years. Since the end of 2021, PRC government authorities have released a series of regulations on generative AI. See “Item 4.B. Information on the Company—Business Overview—Regulations—Regulations on Artificial Intelligence—Regulations on Generative AI.” However, since some of such laws and regulations are still relatively new and significant uncertainties exist with respect to the interpretation and implementation of such laws and regulations, we cannot assure whether we will be able to comply with the requirements of such laws and regulations in a timely manner or at all. If we are unable to obtain the necessary approvals or if we have any dispute with any third party relating to intellectual property or data security, our business operation may be adversely affected.
The interpretation and application of existing laws, regulations and policies and possible new laws, regulations or policies of mainland China relating to the internet industry have created substantial uncertainties regarding the legality of existing and future foreign investments in, and the businesses and activities of, internet businesses in mainland China, including our business.
Failure to meet the PRC government’s complex regulatory requirements on our business operation could have a material adverse effect on our operations and the value of our securities.
We conduct our business primarily through the variable interest entities and the variable interest entities’ subsidiaries in mainland China. The PRC government has significant oversight over the conduct of our business according to the laws and regulations of mainland China. However, since the PRC legal system continues to rapidly evolve and many laws and regulations are relatively new, the interpretation and enforcement of these laws, regulations and rules involve uncertainties. Any failure to meet the PRC government’s complex regulatory requirements due to such uncertainties could have a material adverse effect on our operation and/or the value of our listed securities. Also, the PRC government has recently promulgated certain regulations and rules to exert more oversight and control over offerings that are conducted overseas and/or foreign investment in China-based issuers. For example, on July 6, 2021, the relevant PRC government authorities made public the Opinions on Strictly Scrutinizing Illegal Securities Activities in Accordance with the Law, which emphasize the need to strengthen the administration over illegal securities activities and the supervision on overseas listings by
60
Table of Contents
mainland China-based companies. On February 17, 2023, the CSRC released the Trial Administrative Measures of Overseas Securities Offering and Listing by Domestic Companies and five supporting guidelines, which took effect on March 31, 2023. Pursuant to the Filing Rules, domestic companies that seek to offer or list their securities in an overseas market, whether directly or indirectly, are required to fulfill a filing procedure and report relevant information to the CSRC. On December 28, 2021, the CAC issued the Cybersecurity Review Measures, which require that network platform operators holding over one million users’ personal information are required to apply for a cybersecurity review with the Cybersecurity Review Office before any public offering in a foreign country. On November 14, 2021, the CAC released the draft Regulations on the Network Data Security for public comments, which stipulate that a prior cybersecurity review is required for listing abroad of data processors which process over one million users’ personal information, and the listing of data processors in Hong Kong which affects or may affect national security. Since the draft regulations are in the process of being formulated, and the Opinions on Strictly Scrutinizing Illegal Securities Activities in Accordance with the Law, the Filing Rules and the Cybersecurity Review Measures are relatively new and remain unclear on how they will be interpreted, amended and implemented by the PRC government authorities, it remains uncertain whether we can obtain the specific regulatory approvals from, and complete the required filings with the CSRC, CAC or any other PRC government authorities for our future securities offering in a timely basis or at all. If we are unable to obtain such approvals or complete such filings, or such approvals or filings are rescinded even if obtained, our ability to continue to offer securities to investors will be significantly limited or completely hindered and the value of such securities may be significantly declined. In addition, implementation of industry-wide regulations directly targeting our operations could result in adverse effect on the value of our securities. Therefore, investors of our company and our business face potential uncertainty from any of our failure to meet the PRC government’s regulatory requirements on our operation.
Any failure or perceived failure by us to comply with the enacted Guidelines to Anti-Monopoly in the Field of Internet Platforms and other anti-monopoly laws and regulations may result in governmental investigations or enforcement actions, litigation or claims against us and could have an adverse effect on our business, financial condition and results of operations.
The PRC anti-monopoly enforcement agencies have in recent years strengthened enforcement under the PRC Anti-monopoly Law. In March 2018, the SAMR was formed as a new governmental agency to take over, among other things, the anti-monopoly enforcement functions from the Ministry of Commerce, the NDRC and the State Administration for Industry and Commerce (now the SAMR), respectively. Since its inception, the SAMR has continued to strengthen anti-monopoly enforcement. In November 2021, the National Anti-monopoly Bureau was inaugurated by the State Council, which aims to further implement the fair competition policies, and strengthen anti-monopoly supervision in mainland China, especially to strengthen oversight and law enforcement in areas involving platform economy, innovation, science and technology, information security and people’s livelihood.
In addition to improving the anti-monopoly enforcement agencies, the PRC government is also enhancing its anti-monopoly laws, regulations and guidance in recent years. In September 2020, the SAMR issued Anti-monopoly Compliance Guideline for Operators, which encourages, under the PRC Anti-monopoly Law, operators to establish anti-monopoly compliance management systems to prevent anti-monopoly compliance risks. In particular, on February 7, 2021, the Anti-monopoly Commission of the State Council officially promulgated Guidelines to Anti-Monopoly in the Field of Internet Platforms. Pursuant to an official interpretation from the Anti-monopoly Commission of the State Council, these guidelines mainly cover five aspects, including general provisions, monopoly agreements, abuse of market dominance, concentration of undertakings, and abuse of administrative powers that eliminate or restrict competition. These guidelines prohibit certain monopolistic acts of internet platforms so as to protect market competition and safeguard interests of consumers and undertakings participating in internet platform economy, including without limitation, prohibiting companies with dominant position from abusing their market dominance (such as discriminating customers in terms of pricing and other transactional conditions using big data and analytics, coercing counterparties into exclusivity arrangements through entering into written or oral agreements or using technologies to block
61
Table of Contents
competitors’ interface or reduce positions in search results of goods displays, using bundle services to sell different services or products, compulsory collection of unnecessary user data). In addition, these guidelines also reinforces anti-monopoly merger review for internet platform related transactions to safeguard market competition. In practice, the PRC government authority also strengthens the supervision of monopoly and other unfair competition acts, and requests to establish a new order of the platform economy. In April 2021, the SAMR, together with certain other PRC government authorities convened an administrative guidance meeting, focusing on the problem of requiring the operators on the platform to choose “one out of two” competitive platforms and other prominent problems, requesting major internet companies to conduct self-inspection and rectification on the activities which may violate anti-monopoly, anti-unfair competition, tax and other related laws and regulations, to comply with the laws and regulations strictly and to be subject to public supervision. In addition, many internet companies, including the over 30 companies which attended such administrative guidance meeting, were required to conduct a comprehensive self-inspection and make necessary rectification accordingly. The SAMR has stated it will organize and conduct inspections on the companies’ rectification results. If the companies are found to conduct illegal activities, more severe penalties are expected to be imposed on them in accordance with the laws. We have completed such self-inspection and have not received any further inquiry from the government authorities as of the date of this annual report. As these guidelines were relatively new, we are unable to estimate its specific impact on our business, financial condition, results of operations and prospects. We cannot assure you that our business operations comply with such regulations and authorities’ requirements in all respects. If any non-compliance is raised by the authorities and determined against us, we may be subject to fines and other penalties.
According to the PRC Anti-monopoly Law and related regulations, companies undertaking certain investments and acquisitions relating to business in China must notify and obtain approval from the PRC anti-monopoly enforcement agencies before completing any transaction where the parties’ revenues exceed certain thresholds and the buyer would obtain control of, or decisive influence over, the other party, or any transaction that would otherwise trigger the merger control filing obligations. As part of the PRC government authorities’ measures to strengthen antimonopoly supervision, the PRC Anti-monopoly Law, which was amended and became effective on August 1, 2022, raises the maximum fines for failure to file for concentration of undertakings, and introduces a “stop-clock mechanism” which may prolong the length of period for concentration review. In addition, on January 22, 2024, the State Council of the PRC released the revised Provisions of the State Council on the Threshold for the Filing of Concentration of Undertakings, which raise the filing threshold of revenue, and provide that certain transactions should also be reported to the anti-monopoly authority even if the revenue threshold is not met. Under these provisions, certain acquisition or investment transactions between one party with large revenue, like us, and small-scale enterprises, may be also subject to the filing of concentration of undertakings. See “Item 4.B. Information on the Company—Business Overview—Regulations—Regulations on Anti-Monopoly Matters related to Internet Platform Companies.”
In addition to amending certain laws and regulations related to concentrations of undertaking, the PRC government has also expanded the scope of the concentrations of undertaking subject to examination. To our knowledge, there had been few precedents where internet companies with a VIE structure were investigated for being involved in the concentrations of undertaking before year of 2020. It had been long debated whether transactions involving internet companies with a VIE structure are subject to prior filing of notification requirements, since filing of notification of concentration of undertaking made by some internet companies were not accepted in the past. Due to such regulatory history in the industry and as a matter of common industry practice in the past, we did not file prior notification of concentrations of undertaking. However, since 2020, the SAMR has indicated a change of its regulatory practice in this regard by publishing cases of concentration of undertaking involving a VIE structure, explicit inclusion for the first time of the filing requirement for concentrations involving a VIE structure in the anti-monopoly regulations and rules and penalizing certain internet companies with a VIE structure for failure to file prior notifications of implementing concentrations. Hence, starting from 2020, the SAMR has been reviewing historical cases of concentrations of undertaking of internet companies with a VIE structure, and past failure to file prior notification of concentrations of undertaking may be investigated and penalized.
62
Table of Contents
We previously received enquiries from the SAMR related to failure to file prior notification of concentrations of undertaking, and with respect to certain past transactions for which we failed to file the prior notification, we were fined an amount of RMB500,000 for each case. There can be no assurance that we will not be subject to more enquiries or penalties in the future. If the anti-monopoly authority determines we, in the past or in the future, have failed to file other concentrations which are subject to the prior notification, we may be subject to penalty, and in extreme case being ordered to terminate the contemplated concentration, to dispose of our equity or asset within a prescribed period, to transfer our business within a prescribed time or to take any other necessary measures to restore to the pre-concentration status.
Due to the enhanced enforcement of and tightened regulatory requirements under the Amended Anti-Monopoly Law, we may receive greater scrutiny and attention from regulators and more frequent and stringent investigation or review by regulators, which will increase our compliance costs and subject us to heightened risks and challenges. In addition, there are significant uncertainties on the evolving legislative activities and varied local implementation practices of anti-monopoly and competition laws and regulations in mainland China. We may have to spend much more personnel cost and time evaluating and managing these risks and challenges in connection with our products and services as well as our investments in our ordinary business course to avoid any failure to comply with these regulations. Any failure or perceived failure by us to comply with the enacted Guidelines to Anti-Monopoly in the Field of Internet Platforms and other anti-monopoly laws and regulations may result in governmental investigations or enforcement actions, lawsuits or claims against us and could have an adverse effect on our business, financial condition and results of operations.
We are subject to various economic sanction and export control laws.
We are subject to various economic and trade sanctions laws in different jurisdictions. For example, U.S. economic sanctions prohibit the provision of products and services to countries, governments, and persons targeted by U.S. sanctions, including specific license requirements for the export, re-export and/or transfer of specified items. United Kingdom financial sanctions and European Union sanctions also have similar regime to prohibit the provision of products and services to countries, governments and persons on their respective target list.
In December 2023, the Ministry of Commerce and the Ministry of Technology jointly promulgated the amended Catalog of Technologies Prohibited or Restricted from Export of the PRC, which superseded the No. 38 Announcement in 2020 on Adjusting and Promulgating the Catalogue of Technologies Prohibited or Restricted from Export of the PRC and provided that certain technologies on interactive interface of AI, voice recognition and speech synthesis which are specially used in Chinese and minority languages in the PRC and personalized information push service technology based on data analysis could be restricted for export from mainland China without approval. According to the Administrative Measures on the Import and Export of Technologies of the PRC, which were revised by the State Council in November 2020, if we would like to conduct any type of cross-border technology service or cooperation involving certain AI technologies which are or may be (subject to determination by the government authority) restricted from export, we would be required to apply for approval from the provincial competent commercial department before entering into any substantial stage of negotiation or execution of any technology export contract. If and after such contract is executed, we must apply for an export certificate and such contract would only come into effect after the competent commercial department has granted us the permit. Such process may be time consuming and there is no guarantee that such permit would always be granted, which could negatively affect our potential cross-border technology service or cooperation.
While we believe that we have been, and that we continue to be, in compliance with applicable economic sanction and export control laws, our failure to employ appropriate safeguards with respect to users located in countries that are targets of economic sanctions or export control may result in a violation of such laws and regulations. Non-compliance with applicable governmental economic sanctions or export control laws could subject us to adverse media coverage, investigations, severe administrative, civil and possibly criminal sanctions, and expenses related to remedial measures and legal expenses, which could materially and adversely affect our reputation, business, financial condition, results of operations and prospects.
63
Table of Contents
There are uncertainties associated with the laws and regulations of mainland China on virtual assets, and therefore it is not clear what liabilities, if any, we may have relating to the loss of virtual assets by our users.
While participating on our platform, our users may acquire, purchase and accumulate certain virtual assets, such as gifts or certain statuses and privileges. Such virtual assets can be important to users and have monetary value and, in some cases, can be cashed to actual money. However, virtual assets may become lost for various reasons, often through unauthorized use of the account of one user by other users and occasionally through data loss caused by delays in network service, network crashes or hacking activities. Currently, since the legislation of mainland China on virtual assets are still developing and evolving, uncertainties still exist as to who the legal owner of virtual assets is, whether and how the ownership of virtual assets is protected by law, and whether an operator of a platform would have any liability, whether in contract, tort or otherwise, to users or other interested parties, for loss of such virtual assets. Some judgments of the courts of mainland China ordered certain online platform operators liable for losses of virtual assets by platform users, and have ordered online platform operators to restore the lost virtual items to users or pay damages and losses. In case of a loss of virtual assets, we may be sued by our users and held liable for losses, which may negatively affect our reputation, business, financial condition, results of operations and prospects. We have been involved in virtual items related lawsuits in the past, and we cannot assure you that such lawsuits will not be brought against us again in the future.
Uncertainties exist with respect to the interpretation and implementation of the PRC Foreign Investment Law and its implementation regulations and how it may impact the viability of our current corporate structure, corporate governance and business operations.
On January 1, 2020, the PRC Foreign Investment Law and the Regulations for Implementation of the PRC Foreign Investment Law came into effect and replaced the trio of prior laws regulating foreign investment in mainland China, namely, the Sino-foreign Equity Joint Venture Enterprise Law, the Sino-foreign Cooperative Joint Venture Enterprise Law and the Wholly Foreign-invested Enterprise Law, together with their implementation rules and ancillary regulations. The PRC Foreign Investment Law and its implementation regulations embody an expected regulatory trend of mainland China to rationalize its foreign investment regulatory regime in line with prevailing international practice and the legislative efforts to unify the corporate legal requirements for both foreign and domestic investments. However, there are still uncertainties in relation to the interpretation and implementation of the PRC Foreign Investment Law and its implementation regulations. For instance, under the PRC Foreign Investment Law, “foreign investment” refers to the investment activities directly or indirectly conducted in mainland China by foreign individuals, enterprises or other entities. Though it does not explicitly classify contractual arrangements as a form of foreign investment, there is no assurance that foreign investment via contractual arrangement would not be interpreted as a type of indirect foreign investment activities under the definition in the future. In addition, the definition contains a catch-all provision which includes investments made by foreign investors through means stipulated in laws or administrative regulations or other methods prescribed by the State Council. Therefore, it still leaves leeway for future laws, administrative regulations or provisions promulgated by the State Council to provide for contractual arrangements as a form of foreign investment. In any of these cases, it will be uncertain whether our contractual arrangements will be deemed to be in violation of the market access requirements for foreign investment under the laws and regulations of mainland China. Furthermore, if future laws, administrative regulations or provisions prescribed by the State Council mandate further actions to be taken by companies with respect to existing contractual arrangements, we may face substantial uncertainties as to whether we can complete such actions in a timely manner, or at all.
If any of the variable interest entities were deemed as foreign invested enterprise under any such future laws, administrative regulations or provisions and any of our business were included in any negative list or other form of restrictions on foreign investment, we may need to take further actions to comply with such future laws, administrative regulations or provisions. Such actions may have a material and adverse impact on our business, financial condition, result of operations and prospects. If we or any of the variable interest entities is found to be in violation of any existing or future laws, administrative regulations or provisions of mainland China, or fail to
64
Table of Contents
obtain or maintain any of the required permits or approvals, the PRC regulatory authorities would have broad discretion to take corresponding action regarding such violations or failures to such entities, such as:
| • | order to immediately terminate prohibited investment activities and to take certain measures to return to the pre-investment status; |
| • | order to rectify within prescribed period and to take necessary measures to comply with such laws, administrative regulations or provisions; |
| • | revocation of such entities’ business licenses and/or operating licenses; |
| • | shutting down of our website, or discontinuance or restriction on any transactions between certain of our mainland China subsidiaries with them; |
| • | fines, confiscation of the income from our mainland China subsidiaries or the variable interest entities, or other requirements with which we or the variable interest entities may not be able to comply; |
| • | order to restructure our ownership structure, corporate governance and business operations, including terminating the contractual arrangements with the variable interest entities and deregistering the equity pledges of the variable interest entities, which in turn would affect our ability to consolidate, derive economic interests from, or impose control over the variable interest entities; or |
| • | restriction or prohibition on our use of the proceeds of any financing outside mainland China to finance our business operations in mainland China, and other regulatory or enforcement actions that could be harmful to our business. |
Any of the above penalties may result in a material and adverse effect on our business operation. In addition, if the PRC regulatory authorities were to find our legal structure and contractual arrangements to be in violation of any laws, administrative regulations or provisions of mainland China, we are uncertain what impact of above PRC regulatory authorities’ actions would have on us and our ability to consolidate the variable interest entities in the consolidated financial statement. If any of these regulatory actions result in us losing our right to direct the activities of the variable interest entities or to receive substantially all the economic benefits and residual returns from the variable interest entities and we are not able to restructure our ownership structure and operations in a satisfactory manner, we would no longer be able to consolidate the financial results of the variable interest entities in the consolidated financial statements. Any of the above results, or any other significant unfavorable actions that might be imposed on us in this event, would have an adverse effect on our business, financial condition, results of operations and prospects. Failure to take timely and appropriate measures to cope with any of these or similar regulatory compliance challenges could materially and adversely affect our current corporate structure, corporate governance and business operations.
It may be difficult for overseas regulators to conduct investigation or collect evidence within mainland China.
Shareholder claims or regulatory investigation that are common in the United States generally are difficult to pursue as a matter of law or practicality in mainland China. For example, in mainland China, there are significant legal and other obstacles to providing information needed for regulatory investigations or litigation initiated outside mainland China. Although the authorities in mainland China may establish a regulatory cooperation mechanism with the securities regulatory authorities of another country or region to implement cross-border supervision and administration, such cooperation with the securities regulatory authorities in the United States may not be efficient in the absence of mutual and practical cooperation mechanism. Furthermore, according to Article 177 of the PRC Securities Law, which became effective in March 2020, no overseas securities regulator is allowed to directly conduct investigation or evidence collection activities within the territory of mainland China. While detailed interpretation of or implementation rules under this Article 177 have yet to be promulgated, the inability for an overseas securities regulator to directly conduct investigation or evidence collection activities within mainland China may further increase difficulties faced by you in protecting your interests. See also “—Risks Related to Our ADSs and Class A Ordinary Shares—Certain judgments
65
Table of Contents
obtained against us by our shareholders may not be enforceable.” for risks associated with investing in us as a Cayman Islands company.
We may be subject to liability for information displayed on or linked to our websites, mobile apps, Smart Mini Program or Managed Page and negative publicity in international media, and our business may be adversely affected as a result.
The PRC government has adopted regulations governing internet access and distribution of news and other information over the internet. Under these regulations, internet content providers and internet publishers are prohibited from posting or displaying over the internet content that, among other things, violates the laws and regulations of mainland China, impairs the national dignity of China, contains terrorism or extremism content, or is reactionary, obscene, superstitious, fraudulent or defamatory. Failure to comply with these requirements may result in the revocation of licenses to provide internet content and other licenses and the closure of the concerned websites. In the past, failure to comply with these requirements has resulted in the closure of certain websites. The website operator may also be held liable for the information displayed on or linked to the website or the mobile apps.
In particular, the MIIT has published regulations that subject website operators to potential liability for content displayed on their websites or mobile apps and the actions of users and others using their systems, including liability for violations of the laws and regulations of mainland China prohibiting the dissemination of content deemed to be socially destabilizing. The Ministry of Public Security has the authority to order any local internet service provider to block any internet website at its sole discretion. From time to time, the Ministry of Public Security has stopped the dissemination over the internet of information which it believes to be socially destabilizing. The State Secrecy Bureau is also authorized to block any website it deems to be leaking state secrets or failing to meet the regulations relating to the protection of state secrets in the dissemination of online information. Furthermore, we are required to report any suspicious content to the government authorities, and to undergo computer security inspections. If we fail to implement the relevant safeguards against security breaches, our websites may be shut down and our business and ICP licenses may be revoked. In addition, the CAC has, from time to time, also issued rules enhancing the internet service provider’s obligations to monitor information displayed on its information platform and prevent dissemination of illegal contents. See “Item 4.B. Information on the Company—Business Overview—Regulations—Regulations on Value-Added Telecommunications Services and Internet Content Services—Regulations on Content.”
The PRC Anti-Terrorism Law, which took effect on January 1, 2016 and was amended on April 27, 2018, further requires internet service providers to verify the identity of their users, and to not provide services to anyone whose identity is unclear or who declines verification. Although the identity verification requirements are already embodied in some internet related regulations, the PRC Anti-Terrorism Law extends these requirements to all types of internet services. The internet service providers are also required to provide technical interfaces, decryption and other technical support and assistance for the competent departments to prevent and investigate terrorist activities. See “Item 4.B. Information on the Company—Business Overview—Regulations—Regulations on Information Security” for more details.
Although we attempt to monitor the content in our search results, mobile apps, online communities such as Baidu Post, Smart Mini Programs and Managed Page, we are not able to control or restrict the content of other internet content providers linked to or accessible through our websites, mobile apps, or content generated or placed on our Baidu Post message boards, mini programs, Managed Page, or our other online communities by our users. To the extent that PRC regulatory authorities find any content displayed on our websites or mobile apps illegal, they may require us to limit or eliminate the dissemination of such information on our websites or mobile apps. To the extent that PRC regulatory authorities find any content displayed on our websites or mobile apps objectionable, they may suggest that we limit or eliminate the dissemination of such information on our websites or mobile apps. If third-party websites linked to or accessible through our websites or mini programs accessible through our mobile apps conduct unlawful activities such as online gambling, PRC regulatory
66
Table of Contents
authorities may require us to report such unlawful activities to the authorities and to remove the links to such websites or mobile apps, or they may suspend or shut down the operation of these third-party websites. PRC regulatory authorities may also temporarily block access to certain websites or mobile apps for a period of time for reasons beyond our control. Any of these actions may reduce our user traffic and adversely affect our business. In addition, we have been and may be subject to penalties in the future for violations of those regulations arising from information displayed on or linked to our websites or mobile apps, including a suspension or shutdown of our online operations. Although we make our best efforts to closely monitor and filter the contents displayed and disseminated on our Baidu App and other products, we cannot assure you that incidents of similar type would not take place in the future. Moreover, our compliance with mainland China’s regulations governing internet access and distribution of news and other information over the internet may subject us to negative publicity or even legal actions outside of mainland China.
Discontinuation of any of the preferential income tax treatments currently available to us in mainland China could have a material and adverse effect on our result of operations and financial condition.
Pursuant to the EIT Law, as further clarified by subsequent tax regulations implementing the EIT Law, foreign-invested enterprises and domestic enterprises are subject to enterprise income tax at a uniform rate of 25%. Certain enterprises may benefit from a preferential tax rate of 15% under the EIT Law if they qualify as “High and New Technology Enterprises strongly supported by the state,” subject to certain general factors described in the EIT Law and the related regulations. Furthermore, a “High and New Technology Enterprise” can claim a super deduction for eligible research and development expenses, receiving a 175% super deduction from January 1, 2018 to September 30, 2022, and a 200% super deduction from October 1, 2022 onwards.
A number of our mainland China subsidiaries and the variable interest entities are entitled to enjoy a preferential tax rate of 15% due to their qualification as “High and New Technology Enterprise,” which are subject to renewal every three years. If any or some of these mainland China subsidiaries and variable interest entities fail to maintain the “High and New Technology Enterprise” qualification, their applicable enterprise income tax rate will increase to 25%. Certain of our mainland China subsidiaries and the variable interest entities enjoy a 200% super deduction for eligible research and development expenses. However, there is no assurance that the 200% super deduction preferential policy will continue in the future.
Discontinuation of any of the above-mentioned preferential income tax treatments currently available to us in mainland China could have a material and adverse effect on our result of operations and financial condition. We cannot assure you that we will be able to maintain our current effective tax rate in the future.
If our mainland China subsidiaries declare and distribute dividends to their respective offshore parent companies, we will be required to pay more taxes, which could have a material and adverse effect on our result of operations.
Under the EIT Law and related regulations, dividends, interests, rent or royalties payable by a foreign-invested enterprise, such as our mainland China subsidiaries, to any of its foreign non-resident enterprise investors, and proceeds from any such foreign enterprise investor’s disposition of assets (after deducting the net value of such assets) are subject to a 10% withholding tax, unless the foreign enterprise investor’s jurisdiction of incorporation has a tax treaty with mainland China that provides for a reduced rate of withholding tax. Undistributed profits earned by foreign-invested enterprises prior to January 1, 2008 are exempted from any withholding tax. The British Virgin Islands, where Baidu Holdings Limited, which wholly owns our mainland China subsidiaries, Baidu Online and Beijing Duyou Information Technology Co., Ltd., is incorporated, does not have such a tax treaty with mainland China. Hong Kong has a tax arrangement with mainland China that provides for a 5% withholding tax on dividends subject to certain conditions and requirements, such as the requirement that the Hong Kong resident enterprise owns at least 25% of the mainland China enterprise distributing the dividend at all times within the 12-month period immediately preceding the distribution of dividends and be a “beneficial owner” of the dividends. For example, Baidu (Hong Kong) Limited,
67
Table of Contents
which directly owns our mainland China subsidiaries Baidu China and Baidu Times, is incorporated in Hong Kong.
However, if Baidu (Hong Kong) Limited is not considered to be a Hong Kong tax resident enterprise or the beneficial owner of dividends paid or to be paid to it by Baidu China and Baidu Times under the tax circulars promulgated in February 2009 and 2018, such dividends would be subject to withholding tax at a rate of 10%. See “Item 5.A. Operating and Financial Review and Prospects—Operating Results—Taxation—Mainland China Enterprise Income Tax.” If our mainland China subsidiaries further declare and distribute profits earned after January 1, 2008 to us in the future, such payments will be subject to withholding tax, which will further increase our tax liability and reduce the amount of cash available to our company.
We may be deemed a mainland China resident enterprise under the EIT Law, which could subject us to mainland China’s taxation on our global income, and which may have a material and adverse effect on our results of operations.
Under the EIT Law and related regulations, an enterprise established outside of mainland China with “de facto management body” within mainland China is considered a mainland China resident enterprise and is subject to enterprise income tax at the rate of 25% on its worldwide income as well as PRC enterprise income tax reporting obligations. The related regulations define the term “de facto management body” as “the establishment that exercises substantial and overall management and control over the production, business, personnel, accounts and properties of an enterprise.” The State Administration of Taxation issued the Notice Regarding the Determination of Chinese-Controlled Offshore-Incorporated Enterprises as PRC Tax Resident Enterprises on the basis of de facto management bodies, issued on April 22, 2009 and further amended on December 29, 2017, or the SAT Circular 82 in April 2009, which provides certain specific criteria for determining whether the “de facto management body” of a Chinese-controlled overseas-incorporated enterprise is located in mainland China. The State Administration of Taxation issued additional rules to provide more guidance on the implementation of SAT Circular 82 in July 2011, and issued an amendment to SAT Circular 82 delegating the authority to its provincial branches to determine whether a Chinese-controlled overseas-incorporated enterprise should be considered a mainland China resident enterprise, in January 2014. See “Item 5.A. Operating and Financial Review and Prospects—Operating Results—Taxation—Mainland China Enterprise Income Tax.” Although the SAT Circular 82, the additional guidance and amendment apply only to overseas registered enterprises controlled by mainland China enterprises, not to those controlled by mainland China individuals or foreigners, the criteria set forth in SAT Circular 82 may reflect the State Administration of Taxation’s general position on how the “de facto management body” test should be applied in determining the tax resident status of offshore enterprises, regardless of whether they are controlled by enterprises or individuals of mainland China. If we are deemed a mainland China resident enterprise, we may be subject to enterprise income tax at 25% on our global income, except that the dividends we receive from our mainland China subsidiaries may be exempt from enterprise income tax to the extent such dividends are deemed as “dividends among qualified mainland China resident enterprises.” If we are deemed a mainland China resident enterprise and earn income other than dividends from our mainland China subsidiaries, a 25% enterprise income tax on our global income could significantly increase our tax burden and materially and adversely affect our cash flow and profitability.
Under the tax laws of mainland China, dividends payable by us and gains on the disposition of our shares or ADSs may be subject to mainland China taxation.
If we are considered a mainland China resident enterprise under the EIT Law, our shareholders and ADS holders who are deemed non-resident enterprises may be subject to enterprise income tax at the rate of 10% upon the dividends payable by us or upon any gains realized from the transfer of our shares or ADSs, if such income is deemed derived from mainland China; provided that (i) such foreign enterprise investor has no establishment or premises in mainland China, or (ii) it has establishment or premises in mainland China but its income derived from mainland China has no real connection with such establishment or premises. If we are required under the EIT Law to withhold mainland China income tax on our dividends payable to our non-mainland China resident
68
Table of Contents
enterprise shareholders and ADS holders, or if any gains realized from the transfer of our shares or ADSs by our non-mainland China resident enterprise shareholders and ADS holders are subject to enterprise income tax, your investment in our shares or ADSs could be materially and adversely affected.
Furthermore, if we are considered a mainland China resident enterprise and the PRC tax authorities consider dividends we pay with respect to our shares or ADSs and the gains realized from the transfer of our shares or ADSs to be income derived from sources within mainland China, it is possible that such dividends and gains earned by non-resident individuals may be subject to mainland China individual income tax at a rate of 20%. If we are required under the tax laws of mainland China to withhold mainland China income tax on dividends payable to our non-mainland China investors that are non-resident individuals or if you are required to pay mainland China income tax on the transfer of our shares or ADSs, the value of your investment in our shares or ADSs may be materially and adversely affected.
Our subsidiaries and the variable interest entities in mainland China are subject to restrictions on paying dividends and making other payments to our holding company.
Baidu, Inc. is our holding company incorporated in the Cayman Islands. As a result of the holding company structure, it currently relies on dividend payments from our subsidiaries in mainland China. However, the regulations of mainland China currently permit payment of dividends only out of accumulated profits, as determined in accordance with PRC accounting standards and regulations. Our subsidiaries and the variable interest entities in mainland China are also required to set aside a portion of their after-tax profits according to PRC accounting standards and regulations to fund certain reserve funds. The PRC government also imposes controls on the conversion of RMB into foreign currencies and the remittance of foreign currencies out of mainland China. We may experience difficulties in completing the administrative procedures necessary to obtain and remit foreign currency. See “—Governmental control of currency conversion may affect the value of your investment.” Furthermore, if our subsidiaries or the variable interest entities in mainland China incur debt on their own in the future, the instruments governing the debt may restrict their ability to pay dividends or make other payments. If our subsidiaries and the variable interest entities in mainland China are unable to pay dividends or make other payments to us, we may be unable to pay dividends on our ordinary shares and ADSs.
Governmental control of currency conversion may affect the value of your investment.
The PRC government imposes controls on the convertibility of RMB into foreign currencies and, in certain cases, the remittance of foreign currency out of mainland China. We receive most of our revenues in RMB. Under our current structure, our income at the Cayman Islands holding company level will primarily be derived from dividend payments from our mainland China subsidiaries. Shortages in the availability of foreign currency may restrict the ability of our mainland subsidiaries and the variable interest entities to remit sufficient foreign currency to pay dividends or other payments to us, or otherwise satisfy their foreign currency denominated obligations. Under existing foreign exchange regulations of mainland China, payments of current account items, including profit distributions, interest payments and expenditures from trade-related transactions, can be made in foreign currencies without prior approval from the SAFE by complying with certain procedural requirements. However, approval from appropriate government authorities is required where RMB is to be converted into foreign currency and remitted out of mainland China to pay capital expenses such as the repayment of loans denominated in foreign currencies. The PRC government may also at its discretion restrict access in the future to foreign currencies for current account transactions. If the foreign exchange control system prevents us from obtaining sufficient foreign currency to satisfy our currency demands, we may not be able to pay dividends in foreign currencies to our shareholders or ADS holders.
69
Table of Contents
Mainland China’s regulation of loans to and direct investment in entities in mainland China by offshore holding companies and governmental control of currency conversion may delay or prevent us from making loans to our mainland China subsidiaries, the variable interest entities and certain related parties, or making additional capital contributions to our mainland China subsidiaries, which could adversely affect our ability to fund and expand our business.
Baidu, Inc. is our offshore holding company conducting operations in mainland China through our mainland China subsidiaries and the variable interest entities. We may make loans to our mainland China subsidiaries and the variable interest entities, or we may make additional capital contributions to our mainland China subsidiaries. Loans by Baidu, Inc. or any of our offshore subsidiaries to our mainland China subsidiaries, which are treated as foreign-invested enterprises under the laws of mainland China, or to the variable interest entities are subject to the regulations and foreign exchange loan registrations of mainland China. Such loans to any of our mainland China subsidiaries and the variable interest entities to finance their activities cannot exceed a statutory upper limit and must be filed with SAFE through the online filing system of SAFE pursuant to the applicable regulations of mainland China. We may also decide to finance our mainland China subsidiaries by means of capital contributions, in which case the mainland China subsidiary is required to register the details of the capital contribution with the local branch of SAMR and submit a report on the capital contribution via the online enterprise registration system to the Ministry of Commerce. Meanwhile, we are not likely to finance the activities of the variable interest entities by means of capital contributions given the mainland China’s legal restrictions on foreign ownership of internet content services, value-added telecommunication-based services, internet map services, online audio and video services and mobile application distribution businesses.
In May 2014, SAFE promulgated the Provisions on the Foreign Exchange Administration Rules on Cross-border Guarantee, which, along with the PRC Foreign Currency Administration Rules, provides that failure to register a cross-border guarantee may subject the violator to order to rectify, warning and a fine no more than RMB300,000. In June 2016, SAFE promulgated SAFE Circular No. 16, which removed certain restrictions previously provided under several SAFE circulars in respect of conversion by a foreign-invested enterprise of foreign currency registered capital into RMB and use of such RMB capital. However, SAFE Circular No. 16 continues to prohibit foreign-invested enterprises from, among other things, using RMB fund converted from its foreign exchange capitals for expenditure beyond its business scope, and providing loans to non-affiliated enterprises except as permitted in the business scope. On October 23, 2019, the SAFE issued the Circular on Further Promoting Cross-border Trade and Investment Facilitation, or SAFE Circular 28. Among others, SAFE Circular 28 relaxes prior restrictions and allows foreign-invested enterprises that do not have equity investments in their approved business scope to use their capital obtained from foreign exchange settlement to make domestic equity investments as long as the investments are real and in compliance with the foreign investment-related laws and regulations.
In light of the various requirements imposed by the regulations of mainland China on loans to and direct investment in entities in mainland China by offshore holding companies, including SAFE Rules and Circulars referred to above, we cannot assure you that we will be able to complete the necessary government registrations or filings on a timely basis, if at all, with respect to existing and future loans by us to our mainland China subsidiaries, the variable interest entities and certain related parties or additional capital contributions by us to our mainland China subsidiaries, and conversion of such loans or capital contributions into RMB. If we fail to complete such registrations or filings, our ability to capitalize or otherwise fund our operations in mainland China may be negatively affected, which could adversely affect our ability to fund and expand our business.
Mainland China’s regulations relating to the establishment of offshore special purpose companies by domestic residents may limit our ability to inject capital into our mainland China subsidiaries, limit our subsidiaries’ ability to increase their registered capital or distribute profits to us, or may otherwise adversely affect us.
The Notice on Relevant Issues Concerning Foreign Exchange Administration for Domestic Residents to Engage in Financing and Inbound Investment via Overseas Special Purpose Vehicles, or SAFE Circular No. 75, and a series of implementation rules and guidance issued by SAFE, including the circular relating to operating
70
Table of Contents
procedures that came into effect in July 2011, require domestic residents and domestic corporate entities of mainland China to register with local branches of SAFE in connection with their direct or indirect offshore investment in an overseas special purpose vehicle, or SPV, for the purposes of overseas equity financing activities, and to update such registration in the event of any significant changes with respect to that offshore company. SAFE promulgated the Circular on Relevant Issues Concerning Foreign Exchange Control on Domestic Residents’ Offshore Investment and Financing and Roundtrip Investment through Special Purpose Vehicles, or SAFE Circular No. 37, on July 4, 2014, which replaced the SAFE Circular No. 75. SAFE Circular No. 37 requires domestic residents to register with local branches of SAFE in connection with their direct establishment or indirect control of an offshore entity, for the purpose of overseas investment and financing, with such domestic residents’ legally owned assets or equity interests in domestic enterprises or offshore assets or interests, referred to in SAFE Circular No. 37 as a “special purpose vehicle.” The term “control” under SAFE Circular No. 37 is broadly defined as the operation rights, beneficiary rights or decision-making rights acquired by the domestic residents in the offshore special purpose vehicles or domestic companies by such means as acquisition, trust, proxy, voting rights, repurchase, convertible bonds or other arrangements. SAFE Circular No. 37 further requires amendment to the registration in the event of any changes with respect to the basic information of the special purpose vehicle, such as changes in a domestic resident individual shareholder, name or operation period; or any significant changes with respect to the special purpose vehicle, such as increase or decrease of capital contributed by domestic individuals, share transfer or exchange, merger, division or other material event. If the shareholders of the offshore holding company who are mainland China domestic residents do not complete their registration with the local SAFE branches, the mainland China subsidiaries may be prohibited from distributing their profits and proceeds from any reduction in capital, share transfer or liquidation to the offshore company, and the offshore company may be restricted in its ability to contribute additional capital to its mainland China subsidiaries. Moreover, failure to comply with SAFE registration and amendment requirements described above could result in liability under the laws of mainland China for evasion of applicable foreign exchange restrictions. On February 28, 2015, SAFE promulgated a Notice on Further Simplifying and Improving Foreign Exchange Administration Policy on Direct Investment, or SAFE Notice 13, which became effective on June 1, 2015. In accordance with SAFE Notice 13, entities and individuals are required to apply for foreign exchange registration of foreign direct investment and overseas direct investment, including those required under the SAFE Circular No. 37, with qualified banks, instead of SAFE. The qualified banks, under the supervision of SAFE, directly examine the applications and conduct the registration.
In addition, our shareholders who are entities in mainland China must complete their overseas direct investment filings according to applicable laws and regulations regarding the overseas direct investment by such entities, including certificates, filings or registrations with the Ministry of Commerce and the NDRC, or the local branch of the Ministry of Commerce and the NDRC based on the investment amount, invested industry or other factors thereof, and should also update or apply for amendment in respect to the certificates, filings or registrations in the event of any significant changes with respect to the offshore investment.
We have notified holders of ordinary shares of our company whom we know are domestic residents of mainland China to register with the local SAFE branch and update their registrations as required under the SAFE regulations described above. We are aware that Mr. Robin Yanhong Li, our chairman, chief executive officer and principal shareholder, who is a domestic resident of mainland China, has registered, and updated registration when required, with the local SAFE branch. We, however, cannot provide any assurances that all of our shareholders or ADS holders who are domestic residents will file all applicable registrations or update previously filed registrations as required by these SAFE regulations. The failure or inability of our domestic resident shareholders to comply with the registration procedures or other applicable regulations of mainland China may subject the domestic resident shareholders to fines and legal sanctions, restrict our cross-border investment activities, or limit our mainland China subsidiaries’ ability to distribute dividends to or obtain foreign exchange-dominated loans from our company.
As it is uncertain how the SAFE regulations described above and any future regulation concerning offshore or cross-border transactions will be interpreted, amended or implemented, we cannot predict how these
71
Table of Contents
regulations will affect our business operations or future strategy. For example, we may be subject to more stringent review and approval process with respect to our foreign exchange activities, such as remittance of dividends and foreign currency-denominated borrowings, which may adversely affect our results of operations and financial condition. In addition, if we decide to acquire a domestic company, we cannot assure you that we or the owners of such company will be able to obtain the necessary approvals or complete the necessary filings and registrations required by the SAFE regulations. This may restrict our ability to implement our acquisition strategy and could adversely affect our business and prospects.
Failure to comply with mainland China’s regulations regarding the registration requirements for employee stock ownership plans or share option plans may subject the plan participants in mainland China or us to fines and other legal or administrative sanctions.
In February 2012, SAFE promulgated the Notices on Issues concerning the Foreign Exchange Administration for Domestic Individuals Participating in Stock Incentive Plan of Overseas Publicly-Listed Company, replacing the earlier rules promulgated in March 2007. Under the notices, domestic residents of mainland China who are granted stock options by an overseas publicly listed company are required, through a domestic agent or domestic subsidiary in mainland China of such overseas publicly listed company, to register with the SAFE and complete certain other procedures. We and our domestic resident employees who have been granted stock options are subject to these regulations. We have designated our mainland China subsidiary Baidu Online to handle the registration and other procedures required by the notices. However, if we or our domestic optionees fail to comply with these regulations on a timely basis, we or our domestic optionees and their local employers may be subject to fines and legal sanctions.
Mainland China’s regulations establish complex procedures for some acquisitions conducted by foreign investors, which could make it more difficult for us to pursue growth through acquisitions in mainland China.
The Regulations on Mergers and Acquisitions of Domestic Enterprises by Foreign Investors, adopted by six PRC regulatory agencies in August 2006 and amended in June 2009, among other things, established additional procedures and requirements that could make merger and acquisition activities by foreign investors more time-consuming and complex. In addition, the Implementing Rules Concerning Security Review on the Mergers and Acquisitions by Foreign Investors of Domestic Enterprises issued by the Ministry of Commerce in August 2011 specify that mergers and acquisitions by foreign investors involved in “an industry related to national security” are subject to strict review by the Ministry of Commerce, and prohibit any activities attempting to bypass such security review, including by structuring the transaction through a proxy or contractual control arrangement. We believe that our business is not in an industry related to national security, but we cannot preclude the possibility that the competent PRC government authorities may publish explanations contrary to our understanding or broaden the scope of such security reviews in the future, in which case our future acquisitions and investment in mainland China, including those by way of entering into contractual control arrangements with target entities, may be closely scrutinized or prohibited. Moreover, according to the Anti-Monopoly Law, as amended, the SMAR should be notified in advance of any concentration of undertaking if certain filing thresholds are triggered. We may grow our business in part by directly acquiring complementary businesses in mainland China. Complying with the requirements of the laws and regulations mentioned above and other regulations of mainland China to complete such transactions could be time-consuming, and any required approval processes, including obtaining approval from the SMAR, may delay or inhibit our ability to complete such transactions, which could affect our ability to expand our business or maintain our market share. Our ability to expand our business or maintain or expand our market share through future acquisitions would as such be materially and adversely affected.
In December 2020, the NDRC and the Ministry of Commerce promulgated the Measures for the Security Review of Foreign Investment, which came into effect on January 18, 2021. See “Item 4.B. Information on the Company—Business Overview—Regulations—Regulations on Foreign Investment” for more details. Official
72
Table of Contents
guidance has not been issued by the designated office in charge of such security review yet. At this stage, the interpretation of those measures remains unclear in many aspects, such as what would constitute “important information technology and internet services and products” and whether these measures may apply to foreign investment that is implemented or completed before the enactment of these new measures. As our business may be deemed to constitute the foregoing circumstances, we cannot assure you that our current business operations will remain fully compliant, or we can adapt our business operations to new regulatory requirements on a timely basis, or at all.
The approval of and/or filing with the CSRC or other PRC government authorities may be required in connection with our offshore offerings under the laws of mainland China, and, if required, we cannot predict whether or for how long we will be able to obtain such approval or complete such filing.
The Regulations on Mergers and Acquisitions of Domestic Enterprises by Foreign Investors adopted by six PRC regulatory agencies in 2006 and amended in 2009, require an overseas special purpose vehicle formed for listing purposes through acquisitions of domestic companies in mainland China and controlled by Domestic persons or entities of mainland China to obtain the approval of the CSRC prior to the listing and trading of such special purpose vehicle’s securities on an overseas stock exchange. The interpretation and application of the regulations remain unclear, and our offshore offerings may ultimately require approval of the CSRC. If the CSRC approval is required, it is uncertain whether we can or how long it will take us to obtain the approval and, even if we obtain such CSRC approval, the approval could be rescinded. Any failure to obtain or delay in obtaining the CSRC approval for any of our offshore offerings, or a rescission of such approval if obtained by us, would subject us to sanctions imposed by the CSRC or other PRC regulatory authorities, which could include fines and penalties on our operations in mainland China, restrictions or limitations on our ability to pay dividends outside of mainland China, and other forms of sanctions that may materially and adversely affect our business, financial condition, and results of operations.
On July 6, 2021, the PRC government authorities issued Opinions on Strictly Cracking Down Illegal Securities Activities in Accordance with the Law. These opinions emphasized the need to strengthen the administration over illegal securities activities and the supervision on overseas listings by mainland China-based companies and proposed to take effective measures, such as promoting the construction of relevant regulatory systems to deal with the risks and incidents faced by mainland China-based overseas-listed companies. As a follow-up, on February 17, 2023, the CSRC, as approved by the State Council, released the Trial Administrative Measures of Overseas Securities Offering and Listing by Domestic Companies and five supporting guidelines, which took effect on March 31, 2023. The Filing Rules establish a new filing-based regime to regulate overseas offerings of stocks, depository receipts, convertible corporate bond, or other equity securities, and overseas listing of these securities for trading, by domestic companies. According to the Filing Rules, domestic companies that directly or indirectly offer or list their securities in an overseas market should file with the CSRC. Specifically, the examination and determination of an indirect offering and listing will be conducted on a substance-over-form basis, and an offering and listing should be considered as an indirect overseas offering and listing by a domestic company if the issuer meets both of the following conditions: (i) any of the revenue, profits, total assets or net assets of such domestic company in the most recent financial year account for more than 50% of the corresponding data in the issuer’s audited consolidated financial statements for the same period; and (ii) the majority of its business operations are conducted in mainland China or its principal place of business is located in the mainland China, or the majority of senior management in charge of business operations are Chinese citizens or have domicile in the mainland China. According to the Filing Rules, the issuer or its affiliated domestic company, as the case may be, must file with the CSRC for its initial public offering, follow-on offering and other equivalent offering activities. Particularly, a listed company like us is required to submit the filing with respect to its follow-on offerings, issuance of convertible corporate bonds and exchangeable bonds, and other equivalent offering activities, within a specific time frame. Failure to comply with the filing requirements may result in an order of rectification, a warning and fines to the relevant domestic companies, and a warning and fines on the controlling shareholder, the actual controller and other responsible persons. The Filing Rules also sets forth certain regulatory red lines for overseas offerings and listings by domestic enterprises and additional
73
Table of Contents
reporting obligations for listed companies in the case of material changes. For more details of the Filing Rules, please refer to “Item 4.B. Information on the Company—Business Overview—Regulation—Regulations on Overseas Offering and Listing.”
In a Q&A released on the CSRC’s official website, the respondent CSRC official stated that the domestic companies which have listed their securities in the overseas market as of March 31, 2023 will be regarded as the existing overseas listed companies, which will not be required to file with the CSRC until they conduct any new offerings subject to the filing requirements under Filing Rules. The Q&A also addressed the contractual arrangements and pointed out that, as for companies with contractual arrangements seeking overseas offering, the CSRC will solicit opinions from the regulatory authorities and complete the filing procedures for companies with contractual arrangements complying with the laws and regulations. If we fail to file with the CSRC in a timely manner or at all, for any future offering (including, among others, follow-on offerings, issuance of convertible corporate bonds and exchangeable bonds, and other equivalent offering activities) pursuant to the Filing Rules due to our contractual arrangements, our ability to raise or utilize funds could be materially and adversely affected, and we may even need to unwind our contractual arrangements or restructure our business operations to rectify the failure to complete the filings. However, as the Filing Rules were promulgated only recently, there remain substantial uncertainties as to their interpretation, application, and enforcement and how they will affect our operations and our future financing.
On February 24, 2023, the CSRC, jointly with other government authorities, promulgated the revised Provisions on Strengthening Confidentiality and Archives Management of Overseas Securities Issuance and Listing by Domestic Enterprises, which took effect on March 31, 2023. According to these provisions, domestic companies, whether offering and listing securities overseas directly or indirectly, must strictly abide the applicable laws and regulations when providing or publicly disclosing, either directly or through their overseas listed entities, documents and materials to securities services providers such as securities companies and accounting firms or overseas regulators in the process of their overseas offering and listing. If such documents or materials contain any state secrets or government authorities work secrets, domestic companies must obtain the approval from competent government authorities according to the applicable laws, and file with the secrecy administrative department at the same level with the approving government authority. Furthermore, these provisions also provides that securities companies and securities service providers shall also fulfill the applicable legal procedures when providing overseas regulatory institutions and other relevant institutions and individuals with documents or materials containing any state secrets or government authorities work secrets or other documents or materials that, if divulged, will jeopardize national security or public interest. See “Item 4.B. Information on the Company—Business Overview—Regulations—Regulations on Overseas Offering and Listing.” Since these provisions were promulgated only recently, substantial uncertainties still exist with respect to the interpretation and implementation of such provisions and how they will affect us.
In addition, we cannot assure you that any new rules or regulations promulgated in the future will not impose additional requirements on us. If it is determined in the future that any additional approval and filing from the CSRC or other regulatory authorities or other procedures, including the cybersecurity review under the Measures for Cybersecurity Review and the draft of Regulations on the Network Data Security, are required for our offshore offerings, it is uncertain whether we can or how long it will take us to obtain such approval or complete such filing procedures and any such approval or filing could be rescinded or rejected. Any failure to obtain or delay in obtaining such approval or completing such filing procedures for our offshore offerings, or a rescission of any such approval or filing if obtained by us, would subject us to sanctions by the CSRC or other PRC regulatory authorities for failure to seek CSRC approval or filing or other government authorization for our offshore offerings. These regulatory authorities may impose fines and penalties on our operations in mainland China, limit our ability to pay dividends outside of mainland China, limit our operating privileges in mainland China, delay or restrict the repatriation of the proceeds from our offshore offerings into mainland China or take other actions that could materially and adversely affect our business, financial condition, results of operations, and prospects, as well as the trading price of our listed securities. The CSRC or other PRC regulatory authorities also may take actions requiring us, or making it advisable for us, to halt our offshore offerings before settlement
74
Table of Contents
and delivery of the shares offered. Consequently, if investors engage in market trading or other activities in anticipation of and prior to settlement and delivery, they do so at the risk that settlement and delivery may not occur. In addition, if any regulatory authorities later promulgate new rules or explanations requiring that we obtain their approvals or accomplish the required filing or other regulatory procedures for our prior offshore offerings, we may be unable to obtain a waiver of such approval requirements, if and when procedures are established to obtain such a waiver. Any uncertainties or negative publicity regarding such approval requirement could materially and adversely affect our business, prospects, financial condition, reputation, and the trading price of our listed securities.
The PCAOB had historically been unable to inspect our auditor in relation to their audit work performed for our financial statements and the inability of the PCAOB to conduct inspections of our auditor in the past has deprived our investors with the benefits of such inspections.
Our auditor, the independent registered public accounting firm that issues the audit report included elsewhere in this annual report, as an auditor of companies that are traded publicly in the United States and a firm registered with the PCAOB, is subject to laws in the United States pursuant to which the PCAOB conducts regular inspections to assess its compliance with the applicable professional standards. The auditor is located in mainland China, a jurisdiction where the PCAOB was historically unable to conduct inspections and investigations completely before 2022. As a result, we and investors in the ADSs were deprived of the benefits of such PCAOB inspections. The inability of the PCAOB to conduct inspections of auditors in China in the past has made it more difficult to evaluate the effectiveness of our independent registered public accounting firm’s audit procedures or quality control procedures as compared to auditors outside of China that are subject to the PCAOB inspections. On December 15, 2022, the PCAOB issued a report that vacated its December 16, 2021 determination and removed mainland China and Hong Kong from the list of jurisdictions where it is unable to inspect or investigate completely registered public accounting firms. However, if the PCAOB determines in the future that it no longer has full access to inspect and investigate completely accounting firms in mainland China and Hong Kong, and we use an accounting firm headquartered in one of these jurisdictions to issue an audit report on our financial statements filed with the SEC, we and investors in our ADSs would be deprived of the benefits of such PCAOB inspections again, which could cause investors and potential investors in the ADSs to lose confidence in our audit procedures and reported financial information and the quality of our financial statements.
Our ADSs may be prohibited from trading in the United States under the HFCAA in the future if the PCAOB is unable to inspect or investigate completely auditors located in China. The delisting or prohibition of trading of the ADSs, or the threat of their being delisted or prohibited from trading, may materially and adversely affect the value of your investment.
Pursuant to the HFCAA, if the SEC determines that we have filed audit reports issued by a registered public accounting firm that has not been subject to inspections by the PCAOB for two consecutive years, the SEC will prohibit our shares or ADSs from being traded on a national securities exchange or in the over-the-counter trading market in the United States.
On December 16, 2021, the PCAOB issued a report to notify the SEC of its determination that the PCAOB was unable to inspect or investigate completely registered public accounting firms headquartered in mainland China and Hong Kong, and our auditor was subject to that determination. In April 2022, the SEC conclusively listed us as a Commission-Identified Issuer under the HFCAA following the filing of our annual report on Form 20-F for the fiscal year ended December 31, 2021. On December 15, 2022, the PCAOB removed mainland China and Hong Kong from the list of jurisdictions where it is unable to inspect or investigate completely registered public accounting firms. For this reason, we were not identified as a Commission-Identified Issuer under the HFCAA after we filed our annual report on Form 20-F for the fiscal year ended December 31, 2022 and do not expect to be so identified after we file this annual report on Form 20-F for the fiscal year ended December 31, 2023.
75
Table of Contents
Each year, the PCAOB will determine whether it can inspect and investigate completely audit firms in mainland China and Hong Kong, among other jurisdictions. If the PCAOB determines in the future that it no longer has full access to inspect and investigate completely accounting firms in mainland China and Hong Kong and we use an accounting firm headquartered in one of these jurisdictions to issue an audit report on our financial statements filed with the SEC, we would be identified as a Commission-Identified Issuer following the filing of the annual report on Form 20-F for the relevant fiscal year. In accordance with the HFCAA, our securities would be prohibited from being traded on a national securities exchange or in the over-the-counter trading market in the United States if we are identified as a Commission-Identified Issuer for two consecutive years in the future. Although our Class A ordinary shares have been listed on the Hong Kong Stock Exchange and the ADSs and Class A ordinary shares are fully fungible, we cannot assure your that an active trading market for our Class A ordinary shares on the Hong Kong Stock Exchange will be sustained or that the ADSs can be converted and traded with sufficient market recognition and liquidity, if our shares and ADSs are prohibited from trading in the United States. A prohibition of being able to trade in the United States would substantially impair your ability to sell or purchase our ADSs when you wish to do so, and the risk and uncertainty associated with delisting would have a negative impact on the price of our ADSs. Also, such a prohibition would significantly affect our ability to raise capital on terms acceptable to us, or at all, which would have a material adverse impact on our business, financial condition, and prospects.
Proceedings instituted by the SEC against certain PRC-based accounting firms, including the auditor of our consolidated financial statements included in this annual report, could result in financial statements being determined to not be in compliance with the requirements of the Securities Exchange Act of 1934, as amended, or the Exchange Act.
In December 2012, the SEC brought administrative proceedings against five accounting firms in China, including the auditor of our consolidated financial statements included in this annual report, alleging that they had refused to produce audit work papers and other documents related to certain other China-based companies under investigation by the SEC. On January 22, 2014, an initial administrative law decision was issued, censuring these accounting firms and suspending four of these firms from practicing before the SEC for a period of six months. The decision is neither final nor legally effective unless and until reviewed and approved by the SEC. On February 12, 2014, four of these PRC-based accounting firms appealed to the SEC against this decision. In February 2015, each of the four PRC-based accounting firms agreed to a censure and to pay a fine to the SEC to settle the dispute and avoid suspension of their ability to practice before the SEC. The settlement requires the firms to follow detailed procedures to seek to provide the SEC with access to Chinese firms’ audit documents via the CSRC. If the firms fail to meet specified criteria, during a period of four years starting from the settlement date, the SEC retains authority to impose a variety of additional remedial measures on the firms depending on the nature of the failure. Additional remedies for any future noncompliance could include, as appropriate, an automatic six-month bar on a single firm’s performance of certain audit work, commencement of additional proceedings against a firm, or in extreme cases the resumption of the current proceeding against all four firms.
The audit committee is aware of the policy restriction and regularly communicated with our independent auditor to ensure compliance. If additional remedial measures are imposed on the China-based “big four” accounting firms, including our independent registered public accounting firm, in administrative proceedings brought by the SEC alleging the firms’ failure to meet specific criteria set by the SEC with respect to requests for the production of documents, we could be unable to timely file future financial statements in compliance with the requirements of the Exchange Act. The settlement did not require the firms to admit to any violation of law and preserves the firms’ legal defenses in the event the administrative proceeding is restarted.
In the event that the SEC restarts the administrative proceedings, depending upon the final outcome, listed companies in the United States with major PRC operations may find it difficult or impossible to retain auditors in respect of their operations in the PRC, which could result in financial statements being determined to not be in compliance with the requirements of the Exchange Act, including possible delisting. Moreover, any negative news about the proceedings against these audit firms may cause investor uncertainty regarding China-based, United States-listed companies and the market price of our ADSs may be adversely affected.
76
Table of Contents
If the auditor of our consolidated financial statements included in this annual report were denied, even temporarily, the ability to practice before the SEC and we were unable to timely find another registered public accounting firm to audit and issue an opinion on our financial statements, our financial statements could be determined not to be in compliance with the requirements of the Exchange Act. Such a determination could ultimately lead to our delisting from the Nasdaq Global Select Market or deregistration from the SEC, or both, which would substantially reduce or effectively terminate the trading of our ADSs in the United States.
Fluctuation in exchange rates could have a material and adverse effect on our results of operations and the value of your investment.
The conversion of Renminbi into foreign currencies, including U.S. dollars, is based on rates set by the People’s Bank of China and by the Board of Governors of the Federal Reserve System. The value of Renminbi against the U.S. dollar and other currencies is affected by changes in China’s political and economic conditions and by China’s foreign exchange policies, among other things. We cannot assure you that Renminbi will not appreciate or depreciate significantly in value against the U.S. dollar in the future. It is difficult to predict how market forces or PRC or U.S. government policy may impact the exchange rate between Renminbi and the U.S. dollar in the future.
Our revenues and costs are mostly denominated in RMB. Any significant revaluation of RMB may materially and adversely affect our cash flows, revenues, earnings and financial position, and the value of, and any dividends payable on, our ADSs in U.S. dollars. For example, to the extent that we need to convert U.S. dollars into RMB for our operations, appreciation of the RMB against the U.S. dollar would have an adverse effect on the RMB amount we would receive from the conversion. Conversely, if we decide to convert our RMB into U.S. dollars for the purpose of making payments for dividends on our ordinary shares or ADSs, repaying our U.S. dollar denominated notes or other payment obligations or for other business purposes, appreciation of the U.S. dollar against the RMB would have a negative effect on the U.S. dollar amount available to us. In addition, appreciation or depreciation in the value of the RMB relative to U.S. dollars would affect our financial results reported, regardless of any underlying change in our business or results of operations, as RMB is our reporting currency. For example, an appreciation of RMB against the U.S. dollar would result in foreign currency translation losses for financial reporting purposes when we translate our U.S. dollar denominated financial assets into RMB, our reporting currency, and foreign exchange losses reported in earnings for certain RMB denominated loans that overseas entities borrowed from our entities in mainland China. Conversely, a depreciation of RMB against the U.S. dollar would result in foreign currency translation losses for financial reporting purposes when we translate our U.S. dollar denominated notes and other indebtedness into RMB. Moreover, a significant depreciation of the RMB against the U.S. dollar may significantly reduce our earnings translated in the U.S. dollars, which in turn could adversely affect the price of our ADSs.
In 2023, we entered into some hedging transactions in an effort to reduce our exposure to foreign currency exchange risk. While we may decide to enter into more hedging transactions in the future, the availability and effectiveness of these hedges may be limited and we may not be able to adequately hedge our exposure or at all. In addition, our currency exchange losses may be magnified by the exchange control regulations of mainland China that restrict our ability to convert RMB into foreign currency. As a result, fluctuations in exchange rates may have a material adverse effect on your investment.
We face uncertainties with respect to indirect transfers of equity interests in mainland China resident enterprises by their non-mainland China holding companies. Enhanced scrutiny over acquisition transactions by the PRC tax authorities may have a negative impact on potential acquisitions we may pursue in the future.
In February 2015, the State Administration of Tax issued a Public Notice Regarding Certain Corporate Income Tax Matters on Indirect Transfer of Properties by Non-Tax Resident Enterprises, or Public Notice 7. Public Notice 7 extends its tax jurisdiction to not only indirect transfers but also transactions involving transfer of
77
Table of Contents
other taxable assets, through the offshore transfer of a foreign intermediate holding company. Public Notice 7 also brings challenges to both the foreign transferor and transferee (or other person who is obligated to pay for the transfer) of the taxable assets. Where a non-resident enterprise conducts an “indirect transfer” by transferring the taxable assets indirectly by disposing of the equity interests of an overseas holding company, the non-resident enterprise being the transferor, or the transferee, or the entity in mainland China which directly owned the taxable assets may report to the tax authority such indirect transfer. Using a “substance over form” principle, the PRC tax authority may re-characterize such indirect transfer as a direct transfer of the equity interests in the mainland China tax resident enterprise and other properties in mainland China. As a result, gains derived from such indirect transfer may be subject to mainland China enterprise income tax, and the transferee or other person who is obligated to pay for the transfer is obligated to withhold the applicable taxes, currently at a rate of up to 10% for the transfer of equity interests in a mainland China resident enterprise. However, Public Notice 7 provides safe harbors for internal group restructurings and the purchase and sale of equity through a public securities market. On October 17, 2017, the State Administration of Taxation issued the Announcement of the State Administration of Taxation on Issues Concerning the Withholding of Non-resident Enterprise Income Tax at Source, or SAT Bulletin 37, which came into effect on December 1, 2017. SAT Bulletin 37 further clarifies the practice and procedure of the withholding of non-resident enterprise income tax. Pursuant to Public Notice 7 and SAT Bulletin 37, both the transferor and the transferee may be subject to penalties under the tax laws of mainland China if the transferee fails to withhold the taxes and the transferor fails to pay the taxes.
We face uncertainties with respect to the reporting and consequences of private equity financing transactions, share exchange or other transactions involving the transfer of shares in our company by investors that are non-mainland China resident enterprises, or sale or purchase of shares in other non-mainland China resident companies or other taxable assets by us. Our company and other non-resident enterprises in our group may be subject to filing obligations or being taxed if our company and other non-resident enterprises in our group are transferors in such transactions, and may be subject to withholding obligations if our company and other non-resident enterprises in our group are transferees in such transactions, under Public Notice 7 and SAT Bulletin 37. For the transfer of shares in our company by investors that are non-mainland China resident enterprises, our mainland China subsidiaries may be requested to assist in the filing under Public Notice 7 and SAT Bulletin 37. As a result, we may be required to expend valuable resources to comply with Public Notice 7 and SAT Bulletin 37 or to request the relevant transferors from whom we purchase taxable assets to comply with these circulars, or to establish that our company and other non-resident enterprises in our group should not be taxed under these circulars. The PRC tax authorities have the discretion under Public Notice 7 and SAT Bulletin 37 to make adjustments to the taxable capital gains based on the difference between the fair value of the taxable assets transferred and the cost of investment. If the PRC tax authorities make adjustments to the taxable income of the transactions under Public Notice 7 and SAT Bulletin 37, our income tax costs associated with such transactions will be increased, which may have an adverse effect on our financial condition and results of operations. We have made acquisitions in the past and may conduct additional acquisitions in the future. We cannot assure you that the PRC tax authorities will not, at their discretion, adjust any capital gains and impose tax return filing obligations on us or require us to provide assistance to them for the investigation of any transactions we were involved in. Heightened scrutiny over acquisition transactions by the PRC tax authorities may have a negative impact on potential acquisitions we may pursue in the future.
Risks Related to Our ADSs and Class A Ordinary Shares
The trading price of our ADSs and/or our Class A ordinary shares has been and is likely to continue to be volatile regardless of our operating performance.
The trading price of our ADSs has been and is likely to continue to be volatile, and could fluctuate widely in response to a variety of factors, many of which are beyond our control. Likewise, the trading price of our Class A ordinary shares can be volatile for similar or different reasons. Factors impacting the price and trading volume of our listed securities include, but are not limited to, the following:
| • | actual or anticipated fluctuations in our quarterly results of operations and changes or revisions of our expected results, as well as our margins and profitability; |
78
Table of Contents
| • | changes in financial estimates by securities research analysts; |
| • | conditions in internet search and online marketing markets; |
| • | changes in the operating performance or market valuations of other internet search or internet companies; |
| • | announcements by us or our competitors or other internet companies of new product-and-service offerings, acquisitions, strategic partnerships, joint ventures, capital raisings or capital commitments; |
| • | success or failure of our new business initiatives or the development or growth of the new markets we enter into; |
| • | addition to or departure of key personnel; |
| • | public perception or negative news about our products or services or potential investments or acquisitions; |
| • | our share repurchase program; |
| • | fluctuations of exchange rates between RMB and the U.S. dollar; |
| • | litigation, government investigation or other legal or regulatory proceeding; and |
| • | general economic or political conditions in China or elsewhere in the world. |
In addition, the stock market in general, and the performance and fluctuation of the market prices for internet-related companies and other companies with operations mainly in China in particular, may affect the volatility in the prices of and trading volumes for our listed securities. The securities of some China-based companies that have listed their securities in the United States and/or Hong Kong have experienced significant volatility that often has been unrelated to the operating performance of such companies, including, in some cases, substantial declines in the trading prices of their securities. The trading performances of these companies’ securities may affect the attitudes of investors towards Chinese companies listed in the United States and/or Hong Kong in general, which consequently may impact the trading performance of our listed securities, regardless of our actual operating performance. In addition, any negative news or perceptions about inadequate corporate governance practices or fraudulent accounting, corporate structure or other matters of other Chinese companies may also negatively affect the attitudes of investors towards Chinese companies in general, including us, regardless of whether we have engaged in any inappropriate activities. In particular, the global financial crisis, the ensuing economic recessions and deterioration in the credit market in many countries have contributed and may continue to contribute to extreme volatility in the global stock markets. These broad market and industry fluctuations may adversely affect the market price of our listed securities. Volatility or a lack of positive performance in the price of our listed securities may also adversely affect our ability to retain key employees, most of whom have been granted options or other equity incentives.
We adopt different practices as to certain matters as compared with many other companies primarily listed on the Hong Kong Stock Exchange.
We completed our public offering in Hong Kong in March 2021 and the trading of our Class A ordinary shares on the Hong Kong Stock Exchange commenced on March 23, 2021 under the stock code “9888.” As a company listed on the Hong Kong Stock Exchange pursuant to Chapter 19C of the Hong Kong Listing Rules, we are not subject to certain provisions of the Hong Kong Listing Rules pursuant to Rule 19C.11, including, among others, rules on notifiable transactions, connected transactions, share option schemes, content of financial statements as well as certain other continuing obligations. In addition, in connection with the listing of our Class A ordinary shares on the Hong Kong Stock Exchange, we have applied for a number of waivers and/or exemptions from strict compliance with the Hong Kong Listing Rules, the SFO and the Companies (Winding Up and Miscellaneous Provisions) Ordinance and have applied for a ruling under the Takeovers Codes. As a result, we have adopted different practices as to those matters as compared with other companies primarily listed on the Hong Kong Stock Exchange that do not enjoy those exemptions or waivers.
79
Table of Contents
Furthermore, if 55% or more of the total worldwide trading volume, by dollar value, of our Class A ordinary shares and ADSs over our most recent fiscal year takes place on the Hong Kong Stock Exchange, the Hong Kong Stock Exchange will regard us as having a dual primary listing in Hong Kong and we will no longer enjoy certain exemptions or waivers from strict compliance with the requirements under the Hong Kong Listing Rules, the Companies (Winding Up and Miscellaneous Provisions) Ordinance, the Takeovers Codes and the SFO, which could result in us having to amend our corporate structure and articles of association and our incurring of incremental compliance costs. Notwithstanding the foregoing, in the event that the Hong Kong Stock Exchange deemed us as having a dual primary listing in Hong Kong, we will be permitted to retain our existing weighted voting rights structure and our variable interest entity structure.
Substantial future sales or perceived potential sales of our Class A ordinary shares and/or ADSs in the public market could cause the price of our Class A ordinary shares and/or ADSs to decline.
Sales of our Class A ordinary shares and/or ADSs in the public market, or the perception that these sales could occur, could cause the market price of our Class A ordinary shares and/or ADSs to decline. Such sales also might make it more difficult for us to sell equity or equity-related securities in the future at a time and price that we deem appropriate. If any existing shareholder or shareholders sell a substantial amount of our Class A ordinary shares and/or ADSs, the prevailing market price for our Class A ordinary shares and/or ADSs could be adversely affected. In addition, if we pay for our future acquisitions in whole or in part with additionally issued ordinary shares, your ownership interests in our company would be diluted and this, in turn, could have a material and adverse effect on the price of our Class A ordinary shares and/or ADSs.
If securities or industry analysts do not publish research or publish inaccurate or unfavorable research about our business, the market price for our Class A ordinary shares and/or ADSs and trading volume could decline.
The trading market for our Class A ordinary shares and/or ADSs will depend in part on the research and reports that securities or industry analysts publish about us or our business. If research analysts do not maintain adequate research coverage or if one or more of the analysts who covers us downgrades our Class A ordinary shares and/or ADSs or publishes inaccurate or unfavorable research about our business, the market price for our Class A ordinary shares and/or ADSs would likely decline. If one or more of these analysts cease coverage of us or fail to publish reports on us regularly, we could lose visibility in the financial markets, which, in turn, could cause the market price of or trading volume for our Class A ordinary shares and/or ADSs to decline.
Techniques employed by short sellers may drive down the market price of our listed securities.
Short selling is the practice of selling securities that a seller does not own but rather has borrowed from a third party with the intention of buying identical securities back at a later date to return to the lender. Short sellers hope to profit from a decline in the value of the securities between the sale of the borrowed securities and the purchase of the replacement shares, as short sellers expect to pay less in that purchase than they received in the sale. As it is in short sellers’ interest for the price of the security to decline, many short sellers publish, or arrange for the publication of, negative opinions and allegations regarding the relevant issuer and its business prospects in order to create negative market momentum and generate profits for themselves after selling a security short. These short attacks have, in the past, led to selling of shares in the market.
Public companies listed in the United States that have substantially all of their operations in China have been the subject of short selling. Much of the scrutiny and negative publicity has centered on allegations of, among other things, lack of effective internal control over financial reporting resulting in financial and accounting irregularities and mistakes, inadequate corporate governance policies or a lack of adherence thereto and, in many cases, allegations of fraud. As a result, many of these companies have conducted or are now conducting internal and external investigations into the allegations and, in the interim, are subject to shareholder lawsuits and/or SEC enforcement actions.
80
Table of Contents
iQIYI is currently and may in the future be subject to unfavorable allegations made by short sellers. See “Item 8.A. Financial Information—Consolidated Statements and Other Financial Information—Legal Proceedings.” We may also become the subject of other short seller attacks from time to time in the future and class actions or regulatory enforcement actions derivative of such short seller attacks or actions of a similar nature. Any such allegations may be followed by periods of instability in the market price of our Class A ordinary shares and/or ADSs and negative publicity. If and when we become the subject of any unfavorable allegations, whether such allegations are proven to be true or untrue, we may have to expend a significant amount of resources to investigate such allegations and/or defend ourselves, including in connection with class actions or regulatory enforcement actions derivative of such allegations. While we believe we would strongly defend against any such short seller attacks, we may be constrained in the manner in which we can proceed against the relevant short sellers by principles of freedom of speech, applicable state law or issues of commercial confidentiality. Such a situation could be costly and time-consuming, and could divert management’s attention from the day-to-day our operations. Even if such allegations are ultimately proven to be groundless, allegations against us could severely impact the market price of our securities and our business operations.
We cannot guarantee that any share repurchase program will be fully consummated or that any share repurchase program will enhance long-term shareholder value, and share repurchases could increase the volatility of the price of our Class A ordinary shares and/or ADSs and could diminish our cash reserves.
Our board of director have authorized a few share repurchase programs in recent years, some of which were not fully consummated:
| • | On June 26, 2018, our board of directors authorized a share repurchase program for the repurchase of up to US$1.0 billion of our ADSs or ordinary shares over 12 months from June 27, 2018 through June 26, 2019. |
| • | On May 16, 2019, our board of directors authorized a new share repurchase program for the repurchase of up to US$1.0 billion of our ADSs or ordinary shares, effective until July 1, 2020. |
| • | On May 13, 2020, our board of directors authorized a share repurchase program for the repurchase of up to US$1.0 billion of our ADSs or shares, effective until July 1, 2021. On August 6, 2020, our board of directors approved a change to the 2020 share repurchase program, increasing the repurchase authorization from US$1 billion to US$3 billion and extending the effective time through December 31, 2022. On December 8, 2020, our board of directors approved a further increase in the repurchase authorization from US$3 billion to US$4.5 billion. |
| • | In February 2023, our board of directors authorized a new share repurchase program, under which we may repurchase up to US$5.0 billion of our ADSs or shares, effective until December 31, 2025. |
Our board of directors also has the discretion to authorize additional share repurchase programs in the future. The share repurchase programs do not obligate us to repurchase any specific dollar amount or to acquire any specific number of ADSs and/or shares. We cannot guarantee that any share repurchase program will enhance long-term shareholder value. The share repurchase programs could affect the price of our listed securities and increase volatility and may be suspended or terminated at any time, which may result in a decrease in the trading price of our Class A ordinary shares and/or ADSs. Furthermore, share repurchases could increase the volatility of the price of our Class A ordinary shares and/or ADSs and could diminish our cash reserves.
Because we do not expect to pay dividends in the foreseeable future, you must rely on price appreciation of our Class A ordinary shares and/or ADSs for return on your investment.
We currently do not expect to pay any cash dividends in the foreseeable future. Therefore, you should not rely on an investment in our Class A ordinary shares and/or ADSs as a source for any future dividend income.
Our board of directors has complete discretion as to whether to distribute dividends. In addition, our shareholders may by ordinary resolution declare a dividend, but no dividend may exceed the amount
81
Table of Contents
recommended by our board of directors. In either case, the declaration of dividend will be subject to our memorandum and articles of association and certain restrictions under Cayman Islands law. Even if our board of directors decides to declare and pay dividends, the timing, amount and form of future dividends, if any, will depend on, among other things, our future results of operations and cash flow, our capital requirements and surplus, the amount of distributions, if any, received by us from our subsidiaries, our financial condition, contractual restrictions and other factors deemed relevant by our board of directors. Accordingly, the return on your investment in our Class A ordinary shares and/or ADSs will likely depend entirely upon any future price appreciation of our Class A ordinary shares and/or ADSs. There is no guarantee that our Class A ordinary shares and/or ADSs will appreciate in value or even maintain the price at which you purchased the Class A ordinary shares and/or ADSs. You may not realize a return on your investment in our Class A ordinary shares and/or ADSs and you may even lose your entire investment in our Class A ordinary shares and/or ADSs.
Holders of our ADSs may not have the same voting rights as the holders of our ordinary shares and may not receive voting materials in time to be able to exercise your right to vote.
Except as described in this annual report and in the deposit agreement, holders of our ADSs will not be able to exercise voting rights attached to the shares evidenced by our ADSs on an individual basis. Holders of our ADSs will appoint the depositary or its nominee as their representative to exercise the voting rights attached to the shares represented by the ADSs. Holders of our ADSs may not receive voting materials in time to instruct the depositary to vote, and it is possible that you, or persons who hold their ADSs through brokers, dealers or other third parties, will not have the opportunity to exercise a right to vote. Upon our written request, the depositary will mail to holders of our ADSs a shareholder meeting notice which contains, among other things, a statement as to the manner in which their voting instructions may be given, including an express indication that such instructions may be given or deemed given to the depositary to give a discretionary proxy to a person designated by us if no instructions are received by the depositary from ADS holders on or before the response date established by the depositary. However, no voting instruction will be deemed given and no such discretionary proxy will be given with respect to any matter as to which we inform the depositary that (i) we do not wish such proxy given, (ii) substantial opposition exists, or (iii) such matter materially and adversely affects the rights of shareholders.
Holders of our ADSs may not be able to participate in rights offerings and may experience dilution of their holdings as a result.
We may from time to time distribute rights to our shareholders, including rights to acquire our securities. Under the deposit agreement for the ADSs, the depositary will not offer those rights to ADS holders unless both the rights and the underlying securities to be distributed to ADS holders are either registered under the Securities Act of 1933, or exempt from registration under the Securities Act with respect to all holders of ADSs. We are under no obligation to file a registration statement with respect to any such rights or underlying securities or to endeavor to cause such a registration statement to be declared effective. In addition, we may not be able to take advantage of any exemptions from registration under the Securities Act. Accordingly, holders of our ADSs may be unable to participate in our rights offerings and may experience dilution in their holdings as a result.
Holders of our ADSs may not receive cash dividends, if any, if the depositary decides it is impractical to make them available to ADS holders.
The depositary will pay cash dividends on the ADSs only to the extent that we decide to distribute dividends on our Class A ordinary shares or other deposited securities, and we do not have any present plan to pay any cash dividends on our ordinary shares in the foreseeable future. To the extent that there is a distribution, the depositary of our ADSs has agreed to pay to ADS holders the cash dividends or other distributions it or the custodian receives on our Class A ordinary shares or other deposited securities after deducting its fees and expenses. ADS holders will receive these distributions in proportion to the number of Class A ordinary shares that their ADSs represent. However, the depositary may, at its discretion, decide that it is inequitable or impractical to make a
82
Table of Contents
distribution available to any holders of ADSs. In these cases, the depositary may decide not to distribute such property to holders of our ADSs.
Holders of our ADSs may be subject to limitations on transfer of your ADSs.
The ADSs are transferable on the books of the depositary. However, the depositary may close its transfer books at any time or from time to time when it deems expedient in connection with the performance of its duties. In addition, the depositary may refuse to deliver, transfer or register transfers of ADSs generally when our books or the books of the depositary are closed, or at any time if we or the depositary deems it advisable to do so because of any requirement of law or of any government or governmental body, or under any provision of the deposit agreement, or for any other reason.
Certain judgments obtained against us by our shareholders may not be enforceable.
We are incorporated in the Cayman Islands, and conduct most of our operations in mainland China through our subsidiaries and the variable interest entities in mainland China. A majority of our executive officers and directors do not reside in the United States or Hong Kong and some or all of the assets of these persons are not located in the United States or Hong Kong. As a result, it may not be possible to effect service of process within the United States, Hong Kong or elsewhere outside of mainland China upon our executive officers, including with respect to matters arising under U.S. federal securities laws or applicable state securities laws, Hong Kong laws or otherwise.
It may also be difficult or impossible for you to bring an action against us or against our directors and executive officers in the Cayman Islands or in mainland China in the event that you believe that your rights have been infringed under the securities laws or otherwise. Even if you are successful in bringing an action of this kind, the laws of the Cayman Islands and of mainland China may render you unable to enforce a judgment against our assets or the assets of our directors and executive officers.
Although there is no statutory enforcement in the Cayman Islands of judgments obtained in Hong Kong courts or federal or state courts of the United States (and the Cayman Islands are not a party to any treaties for the reciprocal enforcement or recognition of such judgments), the courts of the Cayman Islands will, at common law, recognize and enforce a foreign monetary judgment of a foreign court of competent jurisdiction without any re-examination of the merits of the underlying dispute based on the principle that a judgment of a competent foreign court imposes upon the judgment debtor an obligation to pay the liquidated sum for which such judgment has been given, provided such judgment (i) is given by a foreign court of competent jurisdiction, (ii) imposes on the judgment debtor a liability to pay a liquidated sum for which the judgment has been given, (iii) is final, (iv) is not in respect of taxes, a fine or a penalty, and (v) was not obtained in a manner and is not of a kind the enforcement of which is contrary to natural justice or the public policy of the Cayman Islands. However, the Cayman Islands courts are unlikely to enforce a judgment obtained from the U.S. courts or Hong Kong courts under civil liability provisions of the U.S. federal securities law or Hong Kong law if such judgment is determined by the courts of the Cayman Islands to give rise to obligations to make payments that are penal or punitive in nature. Because such a determination has not yet been made by a court of the Cayman Islands, it is uncertain whether such civil liability judgments from U.S. or Hong Kong would be enforceable in the Cayman Islands.
Our corporate affairs are governed by our memorandum and articles of association and by the Cayman Islands Companies Act (As Revised) and common law of the Cayman Islands. The rights of shareholders to take legal action against our directors and us, actions by minority shareholders and the fiduciary responsibilities of our directors to us under Cayman Islands law are to a large extent governed by the common law of the Cayman Islands. The common law of the Cayman Islands is derived in part from comparatively limited judicial precedent in the Cayman Islands as well as from English common law, which has persuasive, but not binding, authority on a court in the Cayman Islands. The rights of our shareholders and the fiduciary duties of our directors under
83
Table of Contents
Cayman Islands law are not as clearly established as they would be under statutes or judicial precedents in the United States. In particular, the Cayman Islands has a less developed body of securities laws as compared to the United States, and provides significantly less protection to investors. In addition, with respect to Cayman Islands companies, plaintiffs may face special obstacles, including but not limited to those relating to jurisdiction and standing, in attempting to assert derivative claims in state or federal courts of the United States.
The recognition and enforcement of foreign judgments are provided for under the PRC Civil Procedures Law. The courts of mainland China may recognize and enforce foreign judgments in accordance with the requirements of the PRC Civil Procedures Law based either on treaties between mainland China and the country where the judgment is made or on principles of reciprocity between jurisdictions. Mainland China does not have any treaties or other forms of reciprocity with the United States that provide for the reciprocal recognition and enforcement of foreign judgments. In addition, according to the PRC Civil Procedures Law, the courts of mainland China will not enforce a foreign judgment against us or our director and officers if they decide that the judgment violates the basic principles of the laws of mainland China or national sovereignty, security or public interest. As a result, it is uncertain whether and on what basis a court of mainland China would enforce a judgment rendered by a court in the United States.
As a result of all of the above, our public shareholders may have more difficulty in protecting their interests through actions against our management, directors or major shareholders than would shareholders of a corporation incorporated in a jurisdiction in the United States or in Hong Kong.
Since our company is a Cayman Islands exempted company, the rights of our shareholders may be more limited than those of shareholders of a company organized in the United States or Hong Kong.
Under the laws of some jurisdictions in the United States, majority and controlling shareholders generally have certain fiduciary responsibilities to the minority shareholders. Shareholder action must be taken in good faith, and actions by controlling shareholders which are obviously unreasonable may be declared null and void. Cayman Islands law protecting the interests of minority shareholders may not be as protective in all circumstances as the law protecting minority shareholders in some U.S. jurisdictions. In addition, the circumstances in which a shareholder of a Cayman Islands company may sue the company derivatively, and the procedures and defenses that may be available to the company, may result in the rights of shareholders of a Cayman Islands company being more limited than those of shareholders of a company organized in the United States.
Furthermore, our directors have the power to take certain actions without shareholder approval which would require shareholder approval under Hong Kong law and the laws of most U.S. jurisdictions. The directors of a Cayman Islands company, without shareholder approval, may implement a sale of any assets, property, part of the business, or securities of the company. Our ability to create and issue new classes or series of shares without shareholders’ approval could have the effect of delaying, deterring or preventing a change in control without any further action by our shareholders, including a tender offer to purchase our ordinary shares at a premium over then current market prices.
Furthermore, our articles of association are specific to us and include certain provisions that may be different from common practices in Hong Kong, such as the absence of requirements that the appointment, removal and remuneration of auditors must be approved by a majority of our shareholders.
Our dual-class ordinary share structure with different voting rights could discourage others from pursuing any change of control transactions that holders of our Class A ordinary shares and ADSs may view as beneficial.
Our ordinary shares are divided into Class A ordinary shares and Class B ordinary shares. Holders of Class A ordinary shares are entitled to one vote per share, while holders of Class B ordinary shares are entitled to
84
Table of Contents
ten votes per share. We issued Class A ordinary shares represented by our ADSs in our initial public offering. Our co-founder, chairman and chief executive officer, Robin Yanhong Li, who acquired our shares prior to our initial public offering, holds our Class B ordinary shares. Each Class B ordinary share is convertible into one Class A ordinary share at any time by the holder thereof, while Class A ordinary shares are not convertible into Class B ordinary shares under any circumstances. Upon any transfer of Class B ordinary shares by a holder thereof to any person or entity which is not an affiliate (as defined in our memorandum and articles of association) of such holder, such Class B ordinary shares will be automatically and immediately converted into the equal number of Class A ordinary shares. In addition, if at any time Robin Yanhong Li and his affiliates (as defined in our memorandum and articles of association) collectively own less than 5% of the total number of the issued and outstanding Class B ordinary shares, each issued and outstanding Class B ordinary share will be automatically and immediately converted into one Class A ordinary share, and we should not issue any Class B ordinary shares thereafter.
Due to the disparate voting powers attached to these two classes, certain shareholders have significant voting power over matters requiring shareholder approval, including election of directors and significant corporate transactions, such as a merger or sale of our company or our assets. This concentrated control could discourage or prevent others from pursuing any potential merger, takeover or other change of control transactions with our company, which could deprive our shareholders and ADS holders of an opportunity to receive a premium for their shares or ADSs as part of a sale of our company and might reduce the price of our Class A ordinary shares and/or ADSs.
Our articles of association contain anti-takeover provisions that could adversely affect the rights of holders of our ordinary shares and/or ADSs.
Our articles of association include certain provisions that could limit the ability of others to acquire control of our company, and therefore may deprive the holders of our ordinary shares and ADSs of the opportunity to sell their ordinary shares or ADSs at a premium over the prevailing market price by discouraging third parties from seeking to obtain control of our company in a tender offer or similar transactions. These provisions include the following:
| • | A dual-class ordinary share structure. |
| • | Our board of directors has the authority, without approval by the shareholders, to issue up to a total of 800,000,000 preferred shares in one or more series. Our board of directors may establish the number of shares to be included in each such series and may fix the designations, preferences, powers and other rights of the shares of a series of preferred shares. |
| • | Our board of directors has the right to elect directors to fill a vacancy created by the increase of the board of directors or the resignation, death or removal of a director, which prevents shareholders from having the sole right to fill vacancies on our board of directors. |
We are a foreign private issuer within the meaning of the rules under the U.S. Exchange Act, and as such we are exempt from certain provisions applicable to U.S. domestic public companies.
Because we qualify as a foreign private issuer under the U.S. Exchange Act, we are exempt from certain provisions of the securities rules and regulations in the United States that are applicable to U.S. domestic issuers, including:
| • | the rules under the U.S. Exchange Act requiring the filing with the SEC of quarterly reports on Form 10-Q or current reports on Form 8-K; |
| • | the sections of the U.S. Exchange Act regulating the solicitation of proxies, consents, or authorizations in respect of a security registered under the U.S. Exchange Act; |
85
Table of Contents
| • | the sections of the U.S. Exchange Act requiring insiders to file public reports of their stock ownership and trading activities and liability for insiders who profit from trades made in a short period of time; and |
| • | the selective disclosure rules by issuers of material nonpublic information under Regulation FD. |
We are required to file an annual report on Form 20-F within four months of the end of each fiscal year. In addition, we intend to publish our results on a quarterly basis as press releases, distributed pursuant to the rules and regulations of Nasdaq. Press releases relating to financial results and material events will also be furnished to the SEC on Form 6-K. However, the information we are required to file with or furnish to the SEC will be less extensive and less timely compared to that required to be filed with the SEC by U.S. domestic issuers. As a result, you may not be afforded the same protections or information that would be made available to you were you investing in a U.S. domestic issuer.
As a Cayman Islands exempted company listed on Nasdaq, we are subject to Nasdaq corporate governance listing standards. However, Nasdaq rules permit a foreign private issuer like us to follow the corporate governance practices of its home country. Certain corporate governance practices in the Cayman Islands, which is our home country, may differ significantly from Nasdaq corporate governance listing standards. For example, neither the Companies Act (As Revised) of the Cayman Islands nor our memorandum and articles of association requires a majority of our directors to be independent and we could include non-independent directors as members of our compensation committee and nominating committee, and our independent directors would not necessarily hold regularly scheduled meetings at which only independent directors are present. We convened an extraordinary general meeting in December 2021 to revise our memorandum and articles of association, so that we are required to convene an annual general meeting each year. Accordingly, we held annual general meetings in June 2022 and June 2023. If we choose to follow other home country practice in the future, our shareholders may be afforded less protection than they otherwise would under Nasdaq corporate governance listing standards applicable to U.S. domestic issuers.
We may be classified as a passive foreign investment company, or PFIC, which could result in adverse U.S. federal income tax consequence to U.S. Holders of our ADSs or ordinary shares.
A non-U.S. corporation, such as us, will be considered a PFIC for U.S. federal income tax purposes for any taxable year if either (i) at least 75% of its gross income is passive income or (ii) at least 50% of the value of its assets (generally determined on a quarterly basis) is attributable to assets that produce or are held for the production of passive income. The value of our assets is generally determined by reference to the market price of the ADSs and ordinary shares, which may fluctuate considerably. In addition, because PFIC status is a fact-intensive determination made on an annual basis, no assurance may be given with respect to our PFIC status for the current or any future taxable year.
Based on the market price of our ADSs and ordinary shares, the value of our assets, and the composition of our assets and income, we believe that we were not a PFIC for U.S. federal income tax purposes for our taxable year ended December 31, 2023. No assurance can be given that we will not be a PFIC in the current taxable year or foreseeable taxable years, because the determination of whether we will be a PFIC is a factual determination made annually that will depend, in part, upon the composition of our income and assets. Based on the nature of our business and activities, it is possible that the U.S. Internal Revenue Service may challenge our classification of certain income and assets as non-passive, which may result in our company being a PFIC. In addition, the composition of our income and assets will be affected by how, and how quickly, we use our liquid assets. Fluctuations in the market price of our ordinary shares and/or ADSs may also cause us to be a PFIC for the current or future taxable years because the value of our assets for purposes of the asset test, including the value of our goodwill and other unbooked intangibles, may be determined by reference to the market price of our ordinary shares and/or ADSs from time to time (which may be volatile). If our market capitalization declines, we may be classified as a PFIC for the current taxable year or future taxable years.
86
Table of Contents
If we were treated as a PFIC for any taxable year during which a U.S. Holder (as defined below) held an ADS or an ordinary share, certain adverse U.S. federal income tax consequences could apply to the U.S. Holder. Further, if we were classified as a PFIC for any year during which a U.S. Holder holds our ADSs or ordinary shares, we would generally continue to be treated as a PFIC for all succeeding years during which such U.S. Holder holds our ADSs or ordinary shares. U.S. Holders of our ADSs or ordinary shares are urged to consult their tax advisors concerning the United States federal income tax consequences if we are classified as a PFIC. See “Item 10.E. Additional Information—Taxation—U.S. Federal Income Tax Considerations—Passive Foreign Investment Company.”
The different characteristics of the capital markets in Hong Kong and the U.S. may negatively affect the trading prices of our Class A ordinary shares and/or ADSs.
We are subject to Hong Kong and Nasdaq listing and regulatory requirements concurrently. The Hong Kong Stock Exchange and Nasdaq have different trading hours, trading characteristics (including trading volume and liquidity), trading and listing rules, and investor bases (including different levels of retail and institutional participation). As a result of these differences, the trading prices of our Class A ordinary shares and our ADSs may not be the same, even allowing for currency differences. Fluctuations in the price of our ADSs due to circumstances peculiar to the U.S. capital markets could materially and adversely affect the price of our Class A ordinary shares, or vice versa. Certain events having significant negative impact specifically on the U.S. capital markets may result in a decline in the trading price of our Class A ordinary shares notwithstanding that such event may not impact the trading prices of securities listed in Hong Kong generally or to the same extent, or vice versa. Because of the different characteristics of the U.S. and Hong Kong capital markets, the historical market prices of our ADSs may not be indicative of the trading performance of our Class A ordinary shares.
Exchange between our Class A ordinary shares and our ADSs may adversely affect the liquidity and/or trading price of each other.
Subject to compliance with U.S. securities law and the terms of the deposit agreement, holders of our Class A ordinary shares may deposit Class A ordinary shares with the depositary in exchange for the issuance of our ADSs. Any holder of ADSs may also surrender ADSs and withdraw the underlying Class A ordinary shares represented by the ADSs pursuant to the terms of the deposit agreement for trading on the Hong Kong Stock Exchange. In the event that a substantial number of Class A ordinary shares are deposited with the depositary in exchange for ADSs or vice versa, the liquidity and trading price of our Class A ordinary shares on the Hong Kong Stock Exchange and our ADSs on Nasdaq may be adversely affected.
The time required for the exchange between Class A ordinary shares and ADSs might be longer than expected and investors might not be able to settle or effect any sale of their securities during this period, and the exchange of Class A ordinary shares into ADSs involves costs.
There is no direct trading or settlement between Nasdaq and the Hong Kong Stock Exchange on which our ADSs and our Class A ordinary shares are respectively traded. In addition, the time differences between Hong Kong and New York and unforeseen market circumstances or other factors may delay the deposit of Class A ordinary shares in exchange of ADSs or the withdrawal of Class A ordinary shares represented by the ADSs. Investors will be prevented from settling or effecting the sale of their securities during such periods of delay. In addition, there is no assurance that any exchange of Class A ordinary shares into ADSs (and vice versa) will be completed in accordance with the timelines investors may anticipate.
Furthermore, the depositary for the ADSs is entitled to charge holders fees for various services including for the issuance of ADSs upon deposit of Class A ordinary shares, cancelation of ADSs, distributions of cash dividends or other cash distributions, distributions of ADSs pursuant to share dividends or other free share distributions, distributions of securities other than ADSs and annual service fees. As a result, shareholders who exchange Class A ordinary shares into ADSs, and vice versa, may not achieve the level of economic return the shareholders may anticipate.
87
Table of Contents
We are exposed to risks associated with any potential spin-off of one or more of our businesses.
We are exposed to risks associated with any potential spin-off of one or more of our businesses. The Hong Kong Stock Exchange has granted us a waiver from strict compliance with the requirements in paragraph 3(b) of Practice Note 15 to the Hong Kong Listing Rules such that we are able to spin-off a subsidiary entity and list it on the Hong Kong Stock Exchange within three years after the listing of our Class A ordinary shares on the Hong Kong Stock Exchange. While we do not have any specific plans with respect to the timing or details of any potential spin-off listing on the Hong Kong Stock Exchange as at the date of this annual report, we continue to explore the ongoing financing requirements for our various businesses and may consider a spin-off listing on the Hong Kong Stock Exchange for one or more of those businesses within the three year period after the listing of our Class A ordinary shares on the Hong Kong Stock Exchange. As of the date of this annual report, we have not identified any target for a potential spin-off, as a result we do not have any information relating to the identity of any spin-off target or any other details of any spin off and accordingly, there is no material omission of any information relating to any possible spin-off in this document. The waiver granted by the Hong Kong Stock Exchange is conditional upon us confirming to the Hong Kong Stock Exchange in advance of any spin-off that it would not render the Company, excluding the businesses to be spun off, incapable of fulfilling either the eligibility or suitability requirements under Rules 19C.02 and 19C.05 of the Hong Kong Listing Rules based on the financial information of the entity or entities to be spun-off at the time of our company’s Listing (calculated cumulatively if more than one entity is spun-off). We cannot assure you that any spin-off will ultimately be consummated, whether within the three-year period after the listing of our Class A ordinary shares on the Hong Kong Stock Exchange or otherwise, and any such spin-off will be subject to market conditions at the time and approval by the listing committee of the Hong Kong Stock Exchange. In the event that we proceed with a spin-off, our company’s interest in the entity to be spun-off (and its corresponding contribution to the financial results of our company) will be reduced accordingly.
| Item 4. | Information on the Company |
| A. | History and Development of the Company |
Our company was incorporated in the Cayman Islands in January 2000. In December 2008, our shareholders approved a change in the name of our company from Baidu.com, Inc. to Baidu, Inc. In December 2021, our shareholders approved a change in the name of our company from Baidu, Inc. to the dual foreign name Baidu, Inc. 百度集團股份有限公司.
Since our inception, we have conducted our operations in mainland China principally through Baidu Online, our wholly owned subsidiary in Beijing, China. Since June 2001, we also have conducted part of our operations in mainland China through Baidu Netcom, a variable interest entity in Beijing, China, which holds the licenses and approvals necessary to operate our platform and provide internet content services, value-added telecommunication-based services, internet map services, online audio and video services and mobile application distribution businesses. In subsequent years, we have established additional subsidiaries inside and outside of mainland China and assisted in establishing additional variable interest entities in mainland China to conduct part of our operations.
On August 5, 2005, we listed our ADSs on The NASDAQ National Market (later renamed The Nasdaq Global Market) under the symbol “BIDU,” with each ADS representing one Class A ordinary share at the time. Our ADSs are currently traded on The Nasdaq Global Select Market.
On May 12, 2010, we effected a change of the ADS to Class A ordinary share ratio from 1 ADS representing 1 Class A ordinary share to 10 ADSs representing 1 Class A ordinary share. The ratio change had the same effect as a 10-for-1 ADS split.
In November 2012, we obtained the controlling interest in iQIYI, Inc., or iQIYI, a prior equity method investee, and have since then consolidated its financial results into our consolidated financial statements. In May
88
Table of Contents
2013, we acquired the online video business of PPStream Inc. and merged it with iQIYI, and since then have consolidated its financial results into our consolidated financial statements. iQIYI completed its initial public offering in March 2018 and iQIYI’s American Depositary Shares trade on the Nasdaq Global Select Market under the symbol “IQ.” We continue to control iQIYI and consolidate its financial results into our own in accordance with U.S. GAAP.
In April 2018, we entered into definitive agreements with certain investors relating to our divestiture of a majority equity stake in our financial services business, which provides consumer credit, wealth management and other financial services and had been renamed as Du Xiaoman. The divestiture was completed in August 2018, following which we held a minority equity interest in Du Xiaoman, which was accounted for as an equity method investment. We have deconsolidated the financial results of Du Xiaoman from our consolidated financial statements in accordance with U.S. GAAP.
We closed Series A financing of our smart living business, known as Smart Living Group, at a post-money valuation of approximately RMB20 billion (US$2.9 billion) in November 2020, and two rounds of Series B financing at a US$5.1 billion post-money valuation, in August 2021 and September 2022, respectively. SLG operates DuerOS voice assistant and DuerOS-powered smart devices. We continued to consolidate the financial results of SLG into our own in accordance with U.S. GAAP as a majority shareholder.
We entered into definitive agreements with JOYY in November 2020, which were subsequently amended and supplemented, including in February 2021, to acquire YY Live, which includes the YY mobile app, the YY.com website and PC YY, among other things, for an aggregate purchase price of approximately US$3.6 billion in cash, subject to certain adjustments. The closing of this acquisition was subject to certain conditions, including, among others, obtaining the necessary regulatory approvals from government authorities, and the share purchase agreement was subject to termination by either party if the closing did not occur by the long stop date. Despite our good faith efforts, the closing conditions provided for in the share purchase agreement had not been fully satisfied as of December 31, 2023, the long stop date, and on January 1, 2024, we exercised our contractual right to terminate the share purchase agreement. See “Item 3.D. Key Information—Risk Factors—Risks Related to Our Business and Industry—We face risks arising from our termination of the share purchase agreement for our proposed acquisition of YY Live.”
On March 1, 2021, our shareholders approved and effected a change to our authorized share capital by a 1-to-80 subdivision of shares. Concurrently, we effected a proportionate change in our ADS to Class A ordinary share ratio from 10 ADSs representing 1 Class A ordinary share to each ADS representing 8 Class A ordinary shares.
On March 23, 2021, our Class A ordinary shares commenced trading on the Main Board of the Hong Kong Stock Exchange under the stock code “9888.” We raised approximately US$3.1 billion in net proceeds from our global offering in connection with the listing in Hong Kong after deducting underwriting commissions, share issuance costs and the offering expenses.
We moved to our current corporate headquarters, which we have named Baidu Campus, in November 2009. Our principal executive offices are located at Baidu Campus, No. 10 Shangdi 10th Street, Haidian District, Beijing 100085, the People’s Republic of China. Our telephone number at this address is +86 (10) 5992-8888.
| B. | Business Overview |
Our mission is to make the complicated world simpler through technology.
We are a leading AI company with a strong internet foundation. We have been consistently investing in AI since 2010 to solidify our technology advancement, improve search capabilities and boost overall monetization. The breadth and depth of our AI capabilities provide the differentiating foundational technologies that power all of our businesses.
89
Table of Contents
We are in the midst of a broad-based platform shift driven by generative AI and foundation models, that is set to revolutionize every industry. To capture this opportunity, we launched ERNIE Bot, our conversational AI bot powered by ERNIE, our in-house foundation model, in the first quarter of 2023. We have used ERNIE Bot and ERNIE to reinvent our products and offerings in order to provide AI-native experiences. In October 2023, we launched ERNIE 4.0 (EB4), our most advanced foundation model.
We are one of the very few companies in the world that offers a full AI stack of four layers, including cloud infrastructure, deep learning framework developed in-house, large language models and applications. Our technological innovation in AI has been well recognized by the global community. For instance, according to IDC’s latest report on the technological abilities of AI models, issued in July 2023, ERNIE 3.5 (the current iteration of our foundation model at that time) excelled in many areas, such as algorithm, industry coverage, developer tools and ecosystem. EB4, our most advanced foundation model, is a GPT4-type of model, displaying human-level performance in understanding, content generation, complex reasoning and memory retention. These capabilities are crucial for developing AI-native applications and solutions. We have put our leading AI into innovative use to reinvent our products and offerings and to create new ones. For example, we are the first recipient of driverless licenses in China and the U.S. and we have been offering fully driverless ride-hailing services on open roads in Wuhan and Chongqing since August 2022.
Baidu was founded as a search engine business in 2000 with the belief that technology can change the way people discover and consume information. At the heart of Baidu search is its ability to better understand a users’ search queries and to answer these queries by matching the most relevant information in ranked search results. To achieve this, we continually innovate and develop new technologies and products that enhance Baidu search user experience. We began to use AI a decade ago to power these technologies in order to better match user search intent with the large amount of information on the internet. For instance, our natural language processing, an AI capability, enables the understanding of important details of a query, particularly in complex conversational queries. This helps optimize search results returned and increase the satisfaction rate of users. Years of tagging, understanding and intelligently processing all forms of content on the internet—text, images and videos—with AI has enabled us to further develop leading AI technologies and commercialize them through products and services for consumers, enterprises and the public sector. Our ability to continually invest heavily in research and development is made possible by the durable revenue that we generated as a leading Internet platform.
The PaddlePaddle developer community has grown to 10.7 million and has served 235,000 businesses, as of the end of 2023. Developers have created 860,000 models on PaddlePaddle by the end of 2023. The more developers and businesses use our AI models, tool kits and services, the better our AI capabilities become, which in turn further increases the attractiveness of our business communities. This network effect helps us obtain unique insights into different kinds of products and services that are in demand and have real-world application across different industries, setting a strong foundation for us to make investment decisions and lead with technology, products and services in the markets that we have entered.
Our businesses span across an ecosystem of hundreds of millions of users, millions of developers and hundreds of thousands of enterprises. Our usage of a strong technology foundation to support an open platform business model not only draws participants into our ecosystem, but also adds richness and vibrancy to our ecosystem, strengthening the long-term prospect and vitality of our business overall.
Over the past two decades, we have demonstrated a track record for long-term growth and strong profitability, which has enabled us to invest in a diversified portfolio of products and services with large total market opportunities and further improve our long-term growth prospects. Through years of investment in research, AI chip design, developer community, patents and talent development, we are applying AI to innovative use cases and new monetization opportunities. AI powers the businesses that are included in Baidu Core, which contributed over 70% of our total revenues during 2021, 2022 and 2023. Baidu Core mainly
90
Table of Contents
provides search-based, feed based, and other online marketing services, as well as products and services from new AI initiatives in the following three growth engines:
| • | Mobile Ecosystem: a portfolio of over one dozen apps, including Baidu App, ERNIE Bot, which serves as a versatile, multi-round conversational AI assistant on both PC and mobile, Haokan and Baidu Post, which provides an open platform that aggregates a wide range of third-party, long-tail content and services through our AI building blocks and which helps communities connect and share knowledge and information; |
| • | AI Cloud: including (i) enterprise and public sector cloud service, which offers a full suite of cloud services and solutions, including IaaS (infrastructure as a service), PaaS (platform as a service) and SaaS (software as a service), and is uniquely differentiated by our AI solutions and (ii) personal cloud service; and |
| • | Intelligent Driving & Other Growth Initiatives: consisting of (i) intelligent driving, including Apollo Go autonomous ride-hailing services, Baidu Apollo’s auto solutions (Apollo Self-Driving Solutions and DuerOS for Auto) and intelligent electric vehicles under a joint venture, Jidu Auto, that we established with Zhejiang Geely Holding Group (Geely), (ii) Xiaodu smart devices powered by DuerOS smart assistant, and (iii) AI chips. |
At the core of our Mobile Ecosystem is Baidu App, which is the No. 1 search-plus-feed app in China with an MAU of 667 million in December 2023. Unlike most mobile apps, which direct traffic to a closed ecosystem, Baidu App aggregates content and services from third-party apps and websites by means of our AI building blocks and directs traffic to third-party content and service providers with native-app like experience. Baidu App continues to grow our huge offering of third-party content and services by leveraging our network partners of Baijiahao (BJH) Accounts, Smart Mini Program and Managed Page under an open-platform model. Our decade-long experience with AI and the development of a powerful knowledge graph allow us to match user intent with long-tail, third-party content and services on our open platform.
Our Mobile Ecosystem also includes a portfolio of over one dozen apps in addition to Baidu App, such as Haokan and Baidu Post, providing a platform for people to discover and consume information through search and feed and to interact and engage with creators, publishers, service providers and merchants. This native-app like experience from user acquisition to user relationship management to closed loop transactions demonstrates our value to merchants, enabling them to perform user life-time management on our platform, and has made Baidu App a leading online marketing services provider for both search and feed. Within our Mobile Ecosystem, we serve more than half a million customers by enabling them to tap into our massive user base. We generate revenue primarily from providing search, feed and other marketing services, which account for a majority of our total revenues in 2021, 2022 and 2023. We have made extensive use of AI technologies to develop innovative marketing services, such as dynamic ads, which recommend products from our marketing customers most fitting to each search user. Our marketing cloud also provides innovative AI capabilities to our marketing customers, so that users can still make product inquiries during non-business hours. In addition, the user engagement and user logins that have developed on our platform are enabling us to diversify monetization beyond online marketing into other services, such as Baidu Health.
Our AI Cloud includes two parts: (i) enterprise and public sector cloud, and (ii) personal cloud. Our enterprise and public sector cloud offers a full suite of cloud services and solutions, including IaaS, PaaS, and SaaS, and is differentiated by our AI capabilities. We offer some integrated AI solutions for enterprises in China’s traditional industries and the public sector, helping them improve efficiency and productivity. Our solutions are specialized for certain use cases in traditional industries, including our quality inspection and patrol inspection solutions, ACE Smart Transportation and AI solutions for predicting water consumption and automatically adjusting water supply. Generative AI and foundation model have provided us with greater opportunities and strengthened our advantages in AI. We help enterprises train and fine-tune their customized models on our public cloud, and help them build AI applications, in particular, leveraging ERNIE API. Our cloud
91
Table of Contents
services cover various industries, including transportation, manufacturing, the public sector, energy and utilities, financial services, and internet/media.
Intelligent Driving & Other Growth Initiatives consists of promising businesses in development with huge market opportunities, and some are at early-stage commercialization with a growing customer base. We are a market leader in intelligent driving and smart devices, and we are pursuing these large growth opportunities by leveraging our unique AI capabilities, data insights and internally developed chips. Apollo Go, which provides autonomous ride-hailing service, is now open to the public in more than 10 cities in mainland China. In 2023, Apollo Go provided more than 3 million rides. The accumulated rides provided to the public by Apollo Go exceeded 5 million by January 2, 2024. In Beijing, Apollo Go has begun to charge fees for the autonomous ride-hailing services on open roads since November 25, 2021, and was granted the permits to charge fees for the driverless ride-hailing services on public roads on July 20, 2022, with no safety operator behind the steering wheel. Apollo Go received Beijing’s first license to test vehicles with no driver or safety operator in the car on December 30, 2022, and has charged fees since August 10, 2023, positioning Baidu as the first company to provide fully driverless ride-hailing service on public roads in the capital city. In Chongqing, Apollo Go has begun to charge fees for the autonomous ride-hailing services on open roads since February 18, 2022, and started offering fully driverless ride-hailing services on open roads and started charging passengers for fully driverless ride-hailing services on open roads on August 8, 2022. In Wuhan, Apollo Go started offering fully driverless ride-hailing services on open roads and received the permits to collect fees from the passengers on August 8, 2022. In the fourth quarter of 2023, the proportion of fully driverless orders within the overall order portfolio in Wuhan reached 45%. Apollo Go received permits to offer fully driverless ride-hailing services to the public in Shenzhen Pingshan in May 2023 and has been granted permission to provide fully driverless ride-hailing services to the public in four cities, including Beijing, Shenzhen, Wuhan and Chongqing. In addition, Apollo Go received permits to conduct fully driverless testing on open roads in Shanghai Pudong area in July 2023.
Our strong brand and market leadership in autonomous driving has been carried over to intelligent driving. Apollo is a well-recognized brand among automakers. We have partnered with many domestic and global automakers to power their passenger vehicles with Baidu Apollo’s auto solutions.
Xiaodu ranked No.1 in smart display shipments and smart speaker shipments in China for the first nine months of 2023, according to IDC and Canalys. We believe these initiatives will strengthen our revenue drivers for long-term growth.
iQIYI produces, aggregates and distributes a wide variety of professionally produced content, as well as a broad spectrum of other video content, in a variety of formats.
We believe we have built a large and strong portfolio of products and services to give Baidu the scale necessary to invest heavily in technology, while optimizing our future for sustainable long-term growth. We derive significant synergies by incorporating the AI developed for search into other parts of our business. For example, large daily use of our visual search and voice search may be used to improve Apollo sensing capability and DuerOS speech recognition capabilities.
Our operations are primarily conducted in mainland China. For the year ended December 31, 2023, more than 97% of our group’s total revenues were generated from mainland China, and as of December 31, 2023, more than 78% of our group’s total assets were based in mainland China.
Baidu Core
Baidu Core—Mobile Ecosystem
Baidu Mobile Ecosystem provides a platform for people to discover and consume information through search and feed and facilitate interaction and engagement among users, creators, service providers, and merchants, alike. In particular, our ecosystem allows merchants, creators, publishers and service providers to
92
Table of Contents
acquire users, interact with users by provide information, content, products and services, and transact with users. This marketing funnel approach from user acquisition to user engagement to monetization demonstrates our value to merchants, allowing them to build a life-time relationship of users. In addition, this platform-centric approach has enabled our Mobile Ecosystem to start diversifying commercialization beyond online marketing into other services.
Products and Services for Users
Baidu App. Our flagship app enables users to access our search, feed, content and other services through mobile devices. Baidu App offers twin-engine search and feed functions that leverage our AI-powered algorithms and deep user insight to offer users a compelling experience. Through the building blocks of BJH accounts, Smart Mini Program and Managed Page, Baidu App provides users with single log-on, native-app-like experience to a wide range of information and services dispersed across isolated mobile apps and HTML5 websites, as well as merchants a full suite of marketing cloud services. Baidu App’s spanning mobile ecosystem has resulted in more users logging in. In December 2023, MAUs of Baidu App reached 667 million.
| • | Baidu Search. Users can access our search and other services through Baidu’s properties and Baidu Union partners’ properties. In addition to text inputs, users can conduct AI-powered voice search and visual search. Voice search integrates speech recognition and search technologies to enhance the user experience by providing a more natural and convenient input modality. Visual search enables the use of smart phone cameras to capture images and retrieve related content and services on the internet. For example, users can take a photo of a plant or a pet, to identify the species. We also endeavor to improve the search experience, through other AI-powered products, such as Top 1, to satisfy user queries with the first displayed search result, which we believe will be an important capability with the adoption of smart devices with smaller screens. In addition, we offer vertical search, such as video search and online literature search to our users. |
| • | Baidu Feed. Baidu Feed provides users with personalized timeline based on their demographics and interests. Baidu Feed complements our core search product, leverages Baidu AI recommendation algorithms and monetization platform, and contributes to user engagement and retention, including content sharing, likes, and comments. Baidu Feed provides text-to-speech function to help users consume internet content hands free, as well as leverages its large traffic to distribute video content from Baijiahao, Haokan, iQIYI and third parties. |
| • | Baidu Health. Baidu Health helps users find the doctor and hospital that best suit their different healthcare needs through our AI building blocks. By doing so, Baidu Health provides doctors and hospitals more efficient online presence through Baidu Healthcare Wiki short-term videos, live streaming seminars and telemedicine, as well as providing them with hosted management tools to remain in contact with their patients efficiently, such as messaging, appointment, re-scheduling and monitoring of treatment plans. |
Haokan. Haokan offers a wide variety of user generated and professionally produced short videos, usually several minutes long, in coordination with MCNs (multiple channel network). Haokan allows users to upload, view, search, rate, share, favorite, comment, and follow. Video creators and curators can distribute their content to build a fan base and receive revenue share for their content contribution.
Internally Developed Knowledge-and-Information-Centric Products. Our content and services ecosystem also includes a comprehensive portfolio of knowledge and information products developed internally, in partnership with professionals, reputable organizations and other users. For example, we provided live streaming content from healthcare industry experts in 2020, to help users better understand and cope with the COVID-19 pandemic.
| • | Baidu Wiki. A leading wiki in China compiled by experts in specialized fields featuring high-quality columns and videos, such as Encyclopedia of Intangible Cultural Heritage, Digital Museum and Recorder of History. |
93
Table of Contents
| • | Baidu Knows. An online community where users can pose questions to other users, such as individuals, professionals, and enterprises. Baidu Knows leverages Baidu’s search capabilities to help users find answers to their questions on the internet fast and efficiently, while at the same time allow various partners of Baidu Knows to engage with their targeted users. |
| • | Baidu Experience. An online platform where users share daily knowledge and experience, providing practical tips and interesting perspectives in areas, such as software, lifestyle, and games, etc. |
| • | Baidu Post. A social media built on topical online communities. Users can post text, image, audio and video content and reply to original curation, forming valuable discussion groups. Baidu Post draws new users through close integration with search and user generated content, and has been a popular platform for celebrity fans, online game players, and online novel readers to share topical discussions, especially about current trends. |
| • | ERNIE Bot. Our new AI-native product, serves as a versatile, multi-round conversational AI assistant on both PC and mobile. Starting from November 1, 2023, EB4 has been open to the public through ERNIE Bot at a subscription fee. This marks us as the first company in China to implement user charges, distinguishing us from other models in the market. |
Products and Services for Partners
We attract numerous partners to our platform through our AI building blocks and Baidu Union, which help create opportunities for us to work with our partners in research and development and other business cooperation and establish long term business relationships.
AI Building Blocks. The app installation costs have been rising, causing app developers to take interest in offering their content and services on Baidu App with native-like app experience. Similarly, website owners are experiencing the challenge to grow their business while open in-app search queries are outgrowing browser search queries. To help app developers and website owners grow their business and leverage their traffic more efficiently with AI-powered tools and capabilities, we offer Smart Mini Program and Managed Page to our partners, respectively. We also offer BJH accounts to enable content providers to place their content on our publisher network and make their content searchable.
| • | Baijiahao (BJH Accounts). Our publisher network aggregates articles, photos, short videos, live videos, and augmented reality clips from MCNs, media outlets, and other professional sources, for distribution through search, feed, and short video products. |
| • | Smart Mini Program (SMP). App developers may share their content and services in Baidu App with native-app like experience through increasingly popular applets, known as Smart Mini Program. Users can now search for and access content and services that historically were only available in standalone apps within Baidu App, without having to download and maintain so many apps on their phones. |
| • | Managed Page. Managed Page is a hosted mobile alternative for website owners. Site owners may open an account on our platform, use our tools and services powered by AI and engage with users without having to maintain their own site and pay for server, software and bandwidth costs. Managed Page comes with industry-specific templates and is designed to provide users with more reliable and secure information. Managed Page reached 51% of Baidu Core 2023 online marketing revenue. |
Baidu Union. We match the promotional links of our online marketing services customers to the online properties of Baidu Union partners, which consists of a large number of partners, such as third-party websites, wap sites and mobile apps. Some Baidu Union partners, such as online portal websites and internet cafes, also embed our products and services, such as Baidu Search or a search function powered by Baidu Search, onto their online properties, which allows Baidu Union partners to provide high-quality, relevant search results to their users without incurring the cost of development and maintenance for advanced search capabilities and monetize their traffic through revenue sharing arrangements with us. Baidu Union partners may use our content
94
Table of Contents
recommendation system to provide feed content and ads to their users. We typically pay our Baidu Union partners a portion of the online marketing revenues based on pre-arranged agreements.
In addition, we also enter into arrangements with Baidu Union partners to provide our search engine in their browsers. We typically pay such Baidu Union partners a fee based on prearranged agreements.
Products and Services for Customers
We deliver online marketing services through our network of third-party agents and our direct sales team to a diverse customer base consisting of SMEs across industries, including healthcare, retail, e-commerce, entertainment and media, online games, business services, life services, and transportation. In 2023, we served around half a million enterprise customers, who are customers of our online marketing services.
Our online marketing services enable the delivery of comprehensive, rich, and diversified marketing offerings to fulfill customer needs. Our online marketing services include P4P (pay for performance) services and others. We generate revenues primarily from the sale of P4P online marketing services and other marketing services to our customers, which accounts for a majority of our total revenue for the years ended December 31, 2021, 2022 and 2023.
P4P. Our P4P services allow customers to bid for priority placement of paid sponsored links and reach users who search for information related to their products or services. We charge our customers on a cost-per-click basis. Customers may choose to purchase search, feed and other online marketing services and have the option to set daily allowances. As our partners adopt Smart Mini Programs and Managed Page, some of them have begun to use these properties as their landing page, in lieu of their own mobile apps and websites.
Search marketing services are mainly provided to customers through our proprietary online marketing system which drives monetization efficiency by improving relevance in paid search and optimizing value for our customers.
Feed marketing services usually comprise image-based or video-based advertising, appearing between the feed headlines or within the feed content. It is powered by Baidu AI in order to better match goods and services providers with their targeted audience while optimizing user experience.
Others. Our other marketing services comprise display-based marketing services and other online marketing services based on performance criteria other than cost per click (CPC). Customers can choose different mix of our service offerings to optimize their return on investment. Brand Zone allows customers to display integrated text, logo, image, and video in a structured and uniform manner on a prominent position of the search result page or in vertical search products, such as Baidu Knows. Programmatic marketing platform supports the placement of advertisement using standard, intelligent, or customized creativity, different purchasing methods (guaranteed delivery or real time bidding), and multiple payment methods.
Marketing cloud platform. Our marketing cloud platform integrates one-stop-shop media purchase with CRM (client relationship management) functionalities, to allow our customers to purchase brand and performance-based marketing services, build audience and user engagement, generate leads and maintain relationships with users, leveraging tools and services powered by Baidu AI. Our marketing cloud platform helps us better understand our customers’ needs and enable our customers to leverage Baidu’s AI to simplify their marketing process and improve the effectiveness of their marketing efforts.
Our Mobile Ecosystem, built upon Baidu App as well as a dozen other apps, offers a wide range of third-party content and services to hundreds of millions of users, typically free of charge. Our AI building blocks and other products and services for partners have attracted millions of partners to become participants in our Mobile Ecosystem and generate content and services onto our platform and to tap into our over-half-a-billion user base.
95
Table of Contents
The more partners we bring into our Mobile Ecosystem, the better we become at providing users with a more comprehensive reach and cover content and services in more diversified formats than competing products, which in turn attracts more users and partners to our Mobile Ecosystem. For our Mobile Ecosystem business, we generate a substantial majority of our revenues from the provision of online marketing services to our customers through both direct sales and third-party agents. We charge our customers periodically based on usage while requiring certain customers to pay a deposit. We also offer certain customers credit terms. In addition to offering ads on our platform, we serve promotional ads from our customers on the apps or website properties of Baidu Union partners. We also power the search engines of Baidu Union partners.
Baidu Core—AI Cloud
Our AI Cloud includes two parts: (i) enterprise and public sector cloud, and (ii) personal cloud. Our enterprise and public sector cloud offers a full suite of cloud services and solutions, including IaaS, PaaS and SaaS, and is differentiated by our AI capabilities. Enterprises and the public sector have been the growth engine for the cloud revenue. Combined with our effective marketing capabilities, we have been able to demonstrate the ability to cross-sell and up-sell additional products and services to existing customers, which in turn enables us to more efficiently grow our cloud business.
Our IaaS provides our customers the flexibility to quickly scale or cut back on their cloud computing needs without having to provide huge capital layout upfront. Our IaaS business benefited from multi-cloud strategies adopted by many of our customers.
We also provide enterprise customers with cloud solutions, usually consisting of PaaS and SaaS, that leverage the unique AI capabilities. For example, we enabled a client in the manufacturing sector to automate quality assurance checkpoints on its production line by leveraging our computer vision capabilities. This solution helped our client reduce labor cost and improve their operational efficiency.
In the transportation industry, we are a pioneer and industry leader in developing V2X (vehicle-to-everything) solutions, the infrastructure backbone to smart transportation, to cities in China to help them improve municipal traffic condition, air pollution and road safety, using Baidu AI technology. Our goal is to offer a comprehensive set of products, services, and tools to enable enterprises and public sector to improve productivity and operational efficiency through the use of Baidu AI and cloud infrastructure. In 2023, we experienced weak demand in smart transportation projects due to a challenging macro environment.
The industry know-how from our existing businesses, such as our Mobile Ecosystem and iQIYI, also provides valuable insights on how to tailor AI Cloud solutions to customers in the technology and media industries.
For the personal cloud, we offer Baidu Drive, which allows users to store and retrieve photos, videos, and other files on AI Cloud, along with other capabilities, such as group share and data transfer. Personal cloud service contributed a small portion of total cloud revenues.
Generative AI and large language model have brought us a lot of opportunities, which have strengthened our competitive advantages in cloud and increased our total addressable market. A growing number of enterprises are using ERNIE API to develop their own AI-native applications and solutions. We are also helping customers build their own models efficiently, by leveraging our unique four-layer AI infrastructure and our years of experience in building and using foundation models.
For AI Cloud, we generate revenue by providing cloud services and solutions to enterprise clients, consumers and the public sector directly or through solution integrators for a lump-sum fee or on a subscription basis. We also generate revenue from Baidu Drive from membership services provided to individual customers. Baidu Core’s cloud services revenue reached RMB18.7 billion (US$2.6 billion) in 2023, increasing by 6% from 2022.
96
Table of Contents
Baidu Core—Intelligent Driving & Other Growth Initiatives
Intelligent Driving & Other Growth Initiatives include developments with large total addressable markets and earlier-stage commercialization with a growing customer base, including Apollo intelligent driving and DuerOS smart assistant.
Intelligent Driving
Intelligent driving, including Apollo Go robotaxi fleets (autonomous ride-hailing service), Baidu Apollo auto solutions (Apollo Self-Driving Services and DuerOS for Auto) and intelligent EVs, leverage AI and other technologies to make a vehicle, or fleet of vehicles, more intelligent, all with the ultimate goal to be autonomous.
We are the market leader in autonomous driving in China in terms of number of rides Apollo Go completed. The industry definition for L4 autonomous driving is that the vehicles are capable to drive themselves without human interactions but will be restricted to known use cases, or in most environments and road conditions. Apollo Go has already received permits for providing driverless ride-hailing services on open roads and received the permits to collect fees from the passengers in Beijing, Shenzhen, Wuhan and Chongqing. A well-known research firm, names Apollo as one of the four global leaders in autonomous driving, recognizing us as the top-tier autonomous driving company from China.
In addition, the services and solutions of intelligent driving are compatible with our smart transportation solutions, which leverage each other to gain a better understanding of traffic and road conditions, as well as to improve cost efficiency. Our leadership in autonomous driving, industry know-how, operating experience, transportation ecosystem understanding (from our smart transportation projects and maps), and cost advantage give us strong competitive advantages in leading the development of the intelligent driving industry.
Apollo Go, our robotaxi. Robotaxi fleet operation represents a massive opportunity. Apollo Go is now available in more than 10 cities, including all the tier-1 cities (Beijing, Shanghai, Guangzhou, Shenzhen) and other major cities. Luobokuaipao, the mobile application of Apollo Go, is available for free download from all the major app stores in China. In 2023, Apollo Go provided more than 3 million rides. The accumulated rides provided to the public by Apollo Go exceeded 5 million by January 2, 2024.
In Beijing, Apollo Go has begun to charge fees for the autonomous ride-hailing services (with a safety operator behind the steering wheel) on open roads since November 25, 2021 and Apollo Go was granted the permits to charge fees for the driverless ride-hailing services (with a safety operator in the vehicles, but not behind the steering wheel) on public roads on July 20, 2022. On December 30, 2022, Apollo Go received Beijing’s first license to test vehicles with no driver or safety operator in the car. In Wuhan and Chongqing, Apollo Go started offering fully driverless ride-hailing services on open roads and received the permits to collect fees from the passengers on August 8, 2022. In the fourth quarter of 2023, the proportion of fully driverless orders within the overall order portfolio in Wuhan reached 45%, up from 40% in the third quarter of 2023.
Apollo Go also received permission to offer fully driverless ride-hailing services to the public in Shenzhen Pingshan area in the second quarter of 2023. Apollo Go has now been granted permission to provide fully driverless ride-hailing services to the public in four cities, Beijing, Shenzhen, Wuhan and Chongqing. Apollo Go received permits to conduct fully driverless testing on open roads in Shanghai Pudong area in July 2023.
In June 2021, we introduced Apollo Moon, our 5th generation Apollo robotaxi vehicle. In July 2022, we unveiled our 6th generation robotaxi vehicle Apollo RT6. RT6 is the first steering wheel-free, all electric model designed for fully driverless autonomous driving. Apollo RT6 is distinct from the previous generations that had otherwise been retrofitted on conventional vehicles.
Baidu established the Technology Ethics Committee in October 2023 to guide the practices of technology professionals.
97
Table of Contents
Baidu Apollo’s auto solutions (Apollo Self-Driving Services and DuerOS for Auto). We have been investing in autonomous driving technology to provide automakers with self-driving services. Under Apollo Self-Driving, we offer HD Map, AVP (automated valet parking) and ANP (Apollo navigation pilot). We introduced AVP (our automated valet parking) services in 2018, which allow a driver to get out of the car upon arrival at his or her destination and our solution would enable the vehicle to autopark, and to direct the vehicle to automatically drive to driver’s location out of the parking lot. In December 2020, we introduced ANP (Apollo navigation pilot) services, which leverage our autonomous driving capabilities. In the past years, Baidu Apollo’s auto solutions continued to gain traction among leading automakers. These products are in the early stage of monetization and their revenue contribution is insignificant.
Baidu Maps. A voice-enabled mobile app providing users with travel-related services, including POI (point of interest) search, route planning, precise navigation, taxi-hailing service and real-time traffic condition information. Baidu Maps also provides professional and stable map services to business partners across different sectors. In 2022, we integrated Baidu Map into our Intelligent Driving Group to create synergies between the Baidu Map app and the map solutions for the auto and transportation industries.
Intelligent EVs. We entered into a strategic partnership with Geely in January 2021 to form a new EV company JIDU. We provide intelligent driving capabilities, voice control system, cloud service and other AI related technologies to upgrade the passenger vehicles, and Geely, which holds the distinction of one of the best-selling Chinese automobile brands in past years, contributes its expertise in automobile engineering and manufacturing.
As of the date of this annual report, we have no control of Jidu Auto and accounted for the investment as an long-term investment.
Other Growth Initiatives
DuerOS Smart Assistant. DuerOS is a leading smart assistant for the Chinese language, which powers first-party Xiaodu home smart devices as well as third-party smart phones, children smart watches, smart TVs and smart cars. DuerOS is differentiated by its multi-round conversation AI capabilities, leveraging internally designed Baidu Honghu AI chip, as well as by DuerOS skills store, which offers thousands of skills in wide ranging genres, including short and long videos, online games, education services, video conferencing and other visually oriented activities. In August 2021 and September 2022, Xiaodu completed two rounds of Series B financing at a valuation of US$5.1 billion with us retaining super-majority shareholding. While we generate revenue primarily from the sale of our smart assistant devices to our customers directly and through our distribution network, Xiaodu services revenue, such as membership and advertising, already surpassed 15% of Xiaodu revenues. Xiaodu ranked No.1 in smart display shipments and smart speaker shipments in China for the first nine months of 2023, according to IDC and Canalys.
iQIYI
iQIYI is a leading provider of online entertainment video services in China. iQIYI’s platform features a variety of premium video content, in particular iQIYI original dramas and shows. iQIYI also expands its premium content offering through licenses and collaboration with third-party partners, which supplement its original content. As of December 31, 2023, iQIYI had over 40,000 professionally produced content titles in iQIYI’s comprehensive and diversified video content library, comprised of drama series, variety shows, films and others.
Since the beginning, iQIYI has always put content and users at the center, orienting each of its business strategies around delivering superior content quality and user-friendliness. Artistically crafted and imbued with industry expertise distilled from over a decade of operational experience, many iQIYI original titles have secured their places among the most successful IP franchises in the history of Chinese popular entertainment. Designed
98
Table of Contents
and refined by its engineers with a deep understanding of the evolving user preferences, iQIYI’s products continue to offer superior entertainment experience for users. With in-house studios spearheading its original content production, iQIYI is home to many acclaimed original drama series and variety show franchises, and has successfully serialized iQIYI’s original content into blockbuster sequels to accumulate and amplify IP value over time.
Professionally Produced Content.
iQIYI Original content
iQIYI’s original content includes content produced in-house and content produced in collaboration with quality third-party partners. iQIYI has a diversified portfolio that includes:
| • | original dramas, such as The Knockout (狂飙), Destined (长风渡) and Story of Kunning Palace (宁安如梦), which were launched in 2023 and broke its internal 10,000 iQIYI popularity index score; |
| • | variety shows, such as The Big Band (乐队的夏天), The Detectives’ Adventures (萌探探探案), The Rap of China (中国说唱巅峰对决), Super Sketch Show (一年一度喜剧大赛) and innovative new IP, Become A Farmer (种地吧); |
| • | movies, such as Tough Out (棒!少年), Break Through the Darkness (扫黑·决战), Northeastern Bro (东北恋哥), The Comeback (零号追杀) and Wolf Hiding (怒潮); and |
| • | animations, such as Deer Squad (无敌鹿战队), The World of Fantasy (灵域), Love Between Fairy and Devil (苍兰决) and The Great Ruler (大主宰年番). |
iQIYI obtains the IP through production, adaptation or purchase from third parties, while the partners, typically established entertainment production companies, are responsible for content development and production. iQIYI maintains a high degree of control during the content development and production process.
iQIYI also adapts high-quality video IP into multiple entertainment products, such as online games, animations, online literature, and derivative merchandise.
Licensed content.
In addition to original content, iQIYI also provides users with a selection of high-quality professionally produced content that is produced by and licensed from third parties. Leveraging iQIYI’s expertise in content selection, iQIYI has successfully debuted well-received titles such as the drama series iPartment (爱情公寓), In the Name of People (人民的名义), Go Go Squid (亲爱的,热爱的), My Heroic Husband (赘婿), A Lifelong Journey (人世间), A Journey to Love (一念关山) and the variety show Keep Running (奔跑吧). iQIYI’s licensed content library also features a rich collection of movies, animations, documentaries and other content.
iQIYI licensed video content is typically procured from third parties at fixed rates for a specified term. The average term of licenses varies depending on the type of content, with films having an average term of 11 years and drama series an average term of 14 years. Payments of licensing fees are generally made in installments upon signing of the contacts and during the license period. iQIYI also exchanges rights to distribute licensed content with other online video streaming services to enrich its content library. In certain cases, iQIYI has the right of first refusal to purchase new content produced by the licensor.
iQIYI leverages its content procurement team’s insights and its AI-based big data analytics capabilities to optimize content procurement. iQIYI has established strong partnerships with content providers to ensure access to high-quality content. These partners include leading domestic drama series production companies, film production companies and TV stations, “Big Five” Hollywood production studios, and top TV networks in the U.S.
99
Table of Contents
Other Video Content. iQIYI offers a broad base of other video content with all kinds of genres, formats, and running times, such as internet movies and dramas, mini variety shows and animations, and vertical or horizontal videos, as well as grassroot or influencer uploaded videos, edited video clips, and video blogs, or Vlogs, among others. iQIYI’s other video content expands its library and allows it to capture a broader user base, drive user engagement and enhance user stickiness.
iQIYI generates revenues primarily through membership services, online advertising and content distribution. iQIYI also generates revenues from other monetization methods, including online games, IP licensing, talent agency, online literature and other licensing.
Membership Services. iQIYI’s membership services generally provide subscribing members with a superior entertainment experience that is embodied in various membership privileges. iQIYI’s membership program is composed of multiple packages, each offered at a different price, and provides subscribing members with access to a large collection of content comprised of drama series, movies, animations, cartoons and online literature, earlier access to certain content aired on the iQIYI platform and a bundle of viewing functions and features. iQIYI’s members primarily include subscribing members and, to a lesser extent, users who gain access to our premium content library through paid video-on-demand service. The average daily number of subscribing members in 2023 was 111.9 million, as compared to 103.1 million in 2022. The average daily number of subscribing members excluding individuals with trial memberships was 111.2 million in 2023, as compared to 102.4 million in 2022.
Online Advertising. The prices of iQIYI’s advertising services depend upon various factors, including form and size of the advertising, level of sponsorship, popularity of the content or event in which the advertisements will be placed, and specific targeting requirements. iQIYI offers both brand advertising service and performance-based advertising service.
Content Distribution. iQIYI sub-licenses content within its authorized scope to TV stations and other internet video streaming services. iQIYI also enters into barter agreements to exchange internet broadcasting rights of licensed content with other internet video streaming services. The barter agreement provides the licensee with the right to broadcast the licensed content, and the licensor retains the right to continue broadcasting and/or sub-licensing the exchanged content. We distribute our selected content not only to third-party platforms in mainland China but also to regions outside of China. iQIYI also distributes theatrical movies invested by iQIYI to offline movie theaters.
Others. Other monetization models include online games, IP licensing, talent agency, online literature, other licensing and others.
Technology
We focus on technology and innovation. To stay at the forefront of the internet industry and to achieve long-term growth and success, we invest heavily in research and development. We have established several research labs in China and the United States, to enhance our research and development capabilities, including AI, quantum computing and other areas.
Baidu AI
We have been investing in AI since 2010, and we have opened up our AI platform to a large community of developers, which helps improve our AI capabilities and accelerate large-scale implementation of our AI. By doing so, we are turning the world’s most advanced AI capabilities into platforms for customers, developers and partners.
100
Table of Contents
Our AI capabilities consist of four layers and one module, as follows:
| • | a foundation layer, consisting of PaddlePaddle, our open source deep learning framework and platform, as software, Kunlun AI chips as hardware and databases as fuel; |
| • | a perception layer, aggregating internally developed algorithms for speech recognition and synthesis, computer vision and augmented reality & virtual reality; |
| • | a cognition layer, consisting of algorithms for natural language processing and knowledge graph; and |
| • | a platform layer, opening our technologies to partners and developers to develop a strong AI ecosystem. |
AI Capabilities. In 2022, Baidu released ERNIE 3.0 Titan, a pre-training language model with 260 billion parameters. ERNIE 3.0 Titan is trained on a vast knowledge graph and massive unstructured data.
Baidu released ERNIE Bot, our conversational AI bot powered by ERNIE, our in-house foundation model in the first quarter of 2023. This launch demonstrated our significant investments and achievements in AI over the past ten years. In 2023, Baidu continued to upgrade ERNIE. Baidu launched ERNIE 3.5 in May 2023 and launched ERNIE 4.0 (EB4) in October 2023. According to IDC’s latest report on the technological abilities of AI models, issued in July 2023, ERNIE 3.5 excels in many areas, such as algorithm, industry coverage, developer tools and ecosystem. We believe that EB4 is a GPT4-type of model, displaying human-level performance in understanding, content generation, complex reasoning and memory retention. These capabilities are crucial for developing AI-native applications and solutions. Baidu’s ERNIE 3.5 and EB4 have been accessible to users on the ERNIE Bot app. In addition, enterprise customers can use ERNIE 3.5 and EB4 via our cloud API and web-based product.
In terms of software and hardware integration, Baidu independently developed AI chip, Baidu Kunlun, optimized for voice, natural language processing, image and other AI technologies, is capable of supporting deep learning frameworks such as PaddlePaddle, and flexibly supports training and prediction, making AI models more efficient in computing and within the application. In addition, the Baidu Honghu chip was developed for far-field voice interaction, making voice interaction between people and cars, smart homes and other devices easier and more fluent. Separately, Baidu also works with partners to build hardware ecology. As of December 31, 2023, PaddlePaddle has been equipped with more than 50 chips.
PaddlePaddle. PaddlePaddle is Baidu’s deep learning framework developed in-house, which we open-sourced in 2016. PaddlePaddle aims to solve a real problem for the public service sector and traditional industries, and enables developers to implement AI technologies efficiently. PaddlePaddle provides: (i) a deep learning framework based on programming logic enabling both development flexibility and stability; (ii) the ultra-large-scale training capacity for real-time updates of trillion-level parameters of deep learning models; (iii) end-to-end deployment of high-performance inference engines designed for diverse platforms and devices; and (iv) open-source industry-grade models covering a wide range of applications. PaddlePaddle has boosted the diversification and scaling of AI applications. As of the end of 2023, PaddlePaddle developer community grew to 10.7 million and serves over 235,000 businesses. Developers, academic institutes, enterprises, government administrations and hardware OEMs works together on PaddlePaddle, allowing PaddlePaddle to cultivate various industry models. As a result, PaddlePaddle is well capable to run through the entire AI industry chain, from hardware adaptation to model training, inference deployment and application, consolidating the foundation of industrial intelligence and accelerating the pace of intelligent upgrading. In addition, Baidu has partnered with academics and industry to develop AI talents. EasyDL and BML (a full-featured AI development platform) are PaddlePaddle’s enterprise versions.
AI Chips. Baidu AI Chip, which was introduced in 2018, is a cloud-to-edge AI chip specifically designed for Baidu’s computing environment. As of December 31, 2023, both Baidu AI Chip I and Baidu AI Chip II have been in mass production. Baidu AI chips have been used for our search engine, cloud, and Xiaodu’s business
101
Table of Contents
needs, while powering our deep learning computing needs. For example, the Baidu AI Chip II optimizes our AI technologies such as voice, natural language processing and images and support deep learning frameworks such as Baidu’s open source deep learning platform, PaddlePaddle. The diverse range of uses enables Baidu AI Chip II to power different AI applications, such as internet core algorithms, smart cities and smart industry. Furthermore, Baidu AI Chip optimizes our AI capabilities on AI Cloud servers while improving cost efficiency. Baidu AI Chip completed its first-round of funding at a post-money valuation of US$2 billion in April 2021. In addition, we have also developed Baidu Honghu to power DuerOS smart devices and in-vehicle infotainment to improve speech recognition performance and provide a cost advantage in our AI offerings.
We have also developed a proprietary technological infrastructure which consists of technologies for search, marketing services, and large-scale systems. Our established infrastructure serves as the backbone for AI, mobile and PC platforms.
Mobile Ecosystem Technologies
Search Technologies
Our search is powered by a set of industry-leading technologies, including the following, among others:
Ranking. We compare search queries with the content on web pages to help determine relevance. We have significantly improved the relevancy, freshness and authority of ranking using our machine learning modules to analyze the rich content on the internet and user intent, to prioritize the search results. We began using machine learning in 2010, to better understand the semantics beyond simple text of the search keywords, and in 2013, we began to apply deep learning in our search ranking system, which is playing an increasingly important role. In 2019, we began to develop Top 1 (satisfying user with the first search result) by significantly enhancing the results of question parsing and analysis, answer matching, extraction, page content understanding and other aspects of our search engine, which has greatly improved user satisfaction with our search products.
Multi-modal search. We have greatly improved the accuracy of speech recognition in scenarios, such as long sentences, mixed Chinese and English, and strong accent, and thus significantly improve user satisfaction of our speech search. We have built a terminal visual interaction engine v1.0 for visual search and facilitated the implementation of convolutional neural network models, reducing the training costs through unsupervised or semi-supervised models.
Marketing Services Technologies. Our marketing services platform serves billions of relevant, targeted sponsored links each day based on search terms users enter or content they view on web pages or in our apps. Our key marketing services technologies include Phoenix Nest, a web-based auction system to enable customers to bid for keywords and automatically deliver relevant, targeted promotional links on Baidu’s properties and Baidu Union partners’ properties. Designed to generate more relevant results, Phoenix Nest helps customers to identify popular keywords and provides them with tools for budget management and marketing effectiveness measurement.
Large-Scale Systems and Technologies. Our large scale and massive amounts of user traffic require our systems to efficiently and effectively allocate resources among the products and services in our large product portfolio. Our key large-scale systems and technologies include our internally developed automated management platform for large size clusters, which enables us to intelligently manage and allocate resources and automatically debug and relocate services, thereby, allowing the huge volume of requests on Baidu search platform to function stably across multiple internet data centers and a large network of servers.
Research and Development
We have a team of experienced engineers who are based mostly in Beijing, Shanghai and Shenzhen, China. We also have development centers in Sunnyvale, California and Seattle, Washington. We compete aggressively
102
Table of Contents
for engineering and recruit most of our engineers locally and have established various recruiting and training programs with leading universities in China. We have also recruited experienced engineers globally.
In the years ended December 31, 2021, 2022 and 2023, our research and development expenditures were RMB24.9 billion, RMB23.3 billion and RMB24.2 billion (US$3.4 billion), representing 20%, 19% and 18% of our total revenues, respectively. Our research and development expenses primarily consist of salaries and benefits for research and development personnel, server depreciation expenses and server custody fees. We expense research and development costs as they are incurred, except for capitalized software development costs that fulfill the capitalization criteria.
Intellectual Property
We rely on a combination of patent, trademark, copyright and trade secret protection laws in mainland China and other jurisdictions, as well as confidentiality procedures and contractual provisions, to protect our intellectual property and our brand. We have over 20,000 issued patents in mainland China covering invention, utility model and design, and intend to apply for more patents to protect our core technologies and intellectual property. We also enter into confidentiality, non-compete and invention assignment agreements with our employees and consultants, and nondisclosure agreements with selected third parties. “百度,” our company’s name “Baidu” in Chinese, has been recognized as a well-known trademark in China by the Trademark Office of National Intellectual Property Administration. In addition to owning “
 ” and the related logos, we have applied for registration of various other trademarks. We also have registered certain trademarks in the United States, Australia, Brazil, Canada, Hong Kong, India, Indonesia, Japan, Malaysia, Mexico, New Zealand, Russia, Singapore, South Africa, South Korea, Thailand, the European Union and several other jurisdictions. In addition, we have registered our domain name baidu.com and certain other domain names with authorized registrars of ICANN (Internet Corporation for Assigned Names and Numbers). We have also successfully become designated Registry Operator for .baidu top-level domain names by ICANN.
Internet, technology and media companies are frequently involved in litigation based on allegations of infringement or other violations of intellectual property rights. Furthermore, the application of laws governing intellectual property rights in mainland China and abroad is uncertain and evolving and could involve substantial risks to us. See “Item 3.D. Key Information—Risk Factors—Risks Related to Our Business Industry—We may face intellectual property infringement claims and other related claims, which could be time-consuming and costly to defend and may result in an adverse impact over our operations” and “—We may be subject to patent infringement claims with respect to our P4P platform.”
Sales and Distribution
We offer products and services for Baidu Mobile Ecosystem through our network of third-party agents and our direct sales team. We typically enter into framework sales agreements with third-party agents, where third-party agents will sell online marketing services to customers such as SMEs, domestic businesses and multinational companies on our behalf. The sales agreements typically limit the industry focus of the third-party agents. The third-party agents provide our online marketing customers with numerous services, including identifying customers, collecting payments, assisting customers in setting up accounts with us, suggesting keywords to maximize return on investment and engaging in other marketing and educational services aimed at acquiring customers. We have direct sales presence in Beijing, Shanghai, Guangzhou, Shenzhen, and other cities, covering the major regional markets for our online marketing services and other services. We cover our key accounts through direct sales team and enter into agreements with such key accounts directly.
For AI Cloud, we sell our cloud solutions including IaaS, PaaS and SaaS to our enterprise clients directly or through solution integrators. We offer smart transportation solutions directly to provide tailored solutions to meet the specific needs of our clients.
For Intelligent Driving & Other Growth Initiatives, we sell our products and services to our clients directly and through our third-party agents.
103
Table of Contents
iQIYI’s brand advertising is sold through third-party advertising agencies, including members of American Association of Advertising Agencies, or 4As, and leading Chinese advertising agencies, as well as through a direct sales force. Feed advertising services is sold primarily through third-party advertising agencies, whose existing long-term relationships and network resources we strategically leverage, to increase our sales and expand our advertiser base.
Marketing
We focus on continually improving the quality of our products and services, as we believe satisfied users and customers are more likely to recommend our products and services to others. Through these efforts and the increased use of internet in China, we have built our brand with modest marketing expenditures.
We have implemented a number of marketing initiatives designed to promote our brand awareness among potential users, customers and Baidu Union partners. In addition to our brand positioning in the market, we have also initiated a series of marketing activities to promote our products and technologies among existing and potential users and customers, including, but not limited to, Baidu World Conference.
Competition
For Baidu Core business, our primary competitors are mainly internet companies and online marketing platforms in China. We compete with these entities for both users and customers on the basis of user traffic, cyber security, quality (relevance) of search (and other marketing and advertising) results, availability and user experience of products and services, distribution channels and the number of associated third-party websites. We also face competition from U.S.-based internet search providers providing Chinese language services and online marketing platforms, as well as traditional advertising media.
Online Marketing Platforms, Internet, Cloud and Smart Device Companies in China. Chinese internet companies, such as Alibaba, Tencent, ByteDance and Xiaomi offer a broad range of online services, including search, feed, cloud services and smart devices, as well as foundation models and a diversified of AI native applications powered by foundation models. These companies have widely recognized brand names in China and significant financial resources. Furthermore, some of these companies are private and are able to expend significant resources without consideration for near-term return on investment. We compete with these companies primarily for user traffic, user time, content, advertising budget, marketing resources and enterprise customers, in particular in the traditional industries and the public service sector. We leverage our AI technology, user traffic, product design and various marketing to enhance users’ reliance on and customers’ stickiness on our platforms and services.
U.S.-based Internet Search Providers and Online Marketing Platforms. U.S.-based internet search providers and online marketing platforms, such as Microsoft, Google and Facebook, have a strong global presence, well established brand names, more users and customers and significantly greater financial resources than we do. We may also continue to face competition from other existing competitors and new entrants in the markets of Chinese language search and online marketing.
Other Advertising Media. Other advertising media, such as newspapers, yellow pages, magazines, billboards, other forms of outdoor media, television, radio and mobile apps compete for a share of our customers’ marketing budgets.
AI Cloud. We compete with Huawei and Kingsoft cloud for our cloud offerings. In addition, we have observed that telecom providers have been growing their cloud business, which has resulted in some changes in China’s cloud industry.
Intelligent Driving. In the field of self-driving services, we compete with self-driving system providers and automakers, which are working on their in-house self-driving solutions. In the field of robotaxi services, we
104
Table of Contents
compete with other autonomous ride-hailing service providers. Our Apollo Go remains the largest autonomous ride-hailing service provider measured by the number of rides we competed.
iQIYI competes with Tencent Video, Youku, Mango TV and Bilibili for both users and advertising customers. iQIYI also competes with other internet media and entertainment services, such as internet and social platforms and short-form video platforms, as well as major television stations. iQIYI competes with these market players primarily on the basis of obtaining IP rights to popular content, conducting brand promotions and other marketing activities, and making investments in and acquisitions of business partners.
Our user traffic tends to be seasonal. For example, we generally experience less user traffic during public holidays and other special event periods in China. In addition, advertising and other marketing spending in China has historically been cyclical, reflecting overall economic conditions as well as budgeting and buying patterns. Our results of operations may fluctuate due to the cyclicality and seasonality in our business.
Our Environmental, Social and Governance (ESG) Initiatives
We are committed to corporate social responsibility and meeting society’s changing needs despite the challenging economic environment. We have established an internal environmental, social and governance communications and management mechanism to comprehensively improve our corporate governance and benefit society.
Following the UN’s 17 Sustainable Development Goals (SDGs), we have continually improved our corporate social responsibility initiatives under the guidance of our ESG framework. We appreciate the oversight, guidance and feedback from different parties and are committed to collaborating closely with domestic and international organizations to support broader industry-wide ESG practices, to explore multi-dimensional use cases for our technology, to empower traditional industries with our capabilities and to promote a healthier lifestyle and the long-term sustainability of our society. In June 2021, we announced our goal to become carbon neutral by 2030. In August 2022, Forbes China placed us on its 2022 China ESG 50 list. In 2023, Baidu established the Technology Ethics Committee to guide the practices of technology professionals.
Baidu released its annual ESG Report on May 12, 2023, which details Baidu’s latest ESG policies and sustainability initiatives.
Environmentally Sustainable Mindset
We are a strong supporter of the Ten Principles of the United Nations Global Compact and the UN’s 17 Sustainable Development Goals (SDGs). We are committed to the goal of achieving carbon neutrality by 2030 at the group operational level. To this end, we continue to pursue our emission reduction pathways in data centers, office buildings, carbon offsets, intelligent transportation, AI cloud and supply chain. Starting from 2020, we have taken measurements for all Scope 1, Scope 2, and Scope 3 emissions, inviting third-party professional institutions to verify and certify the results. These results are disclosed in our ESG report accordingly. We are committed to making Baidu a low-carbon, energy-efficient and eco-friendly company through concrete actions. For example, to improve energy efficiency, we implemented various power supply solutions including HVDC offline and BBU (Battery Back-up Unit) in our data centers. Furthermore, our data centers are equipped with large-scale water cooling systems with a free cooling module and OCU (Overhead Cooling Unit) supplemented by fine-tuning operation optimization. As a result of these measures, we optimized the power usage effectiveness (PUE) of our data centers and further reduced our carbon emissions. Baidu Yangquan Data Center was awarded the Carbon Neutral Data Center Leader (5A) certification, making it the first data center with the highest low-carbon level in China. We have also adopted various photovoltaic power generation technologies that increase the use of renewable energy in office buildings, as well as energy conservation measures, such as recycling heat energy and introducing electric commuter shuttle busses on our campus to make our offices more environmentally friendly.
105
Table of Contents
While we rigorously implement environmentally sustainable policies and initiatives, we are also committed to presenting our users with green products and services, fulfilling our social responsibilities and diligently promoting our green ideas to the general public. For example, we have built our intelligent and green transportation ecosystem, relying on intelligent connected vehicle technology to comprehensively upgrade vehicles, roads and modes of travel. Baidu’s V2X deployed in Beijing and smart signal control system adopted by Baoding help reduce carbon emissions by about 51,000 tons and 42 tons annually respectively. We provide enterprises with AI Cloud solutions, promoting the sustainable development in energy and textile industry. Baidu Maps provide users with low-carbon services, helping users to optimize their low-carbon routes, offering users with Navigation Services for New Energy Vehicles (NEVs), and launching the functionality of visualizing carbon footprints. Our efforts promote the spread of green consumption among users. We have received various awards in recognition of our ESG efforts.
Baidu earned a position in the China edition of the S&P Global Sustainability Yearbook, in recognition of its exceptional ESG scores. The selection stems from a comprehensive evaluation of 1,600 Chinese companies as part of the S&P Global 2022 Corporate Sustainability Assessment, underscoring Baidu’s sustainability practices.
Building Social Trust and Developing Talent
Cybersecurity and Privacy Protection. As a reputable hi-tech company serving a large community of users, we put data privacy protection and data security as our top priorities. In October 2021, we established a data management committee to further improve our policies and oversight over data management. Revolving around the dimensions of security, safety, and privacy, we built a research team filled with top-notch security experts. Focusing on our full stack of AI products and ecosystem, the team concentrates on cutting-edge technology, including vulnerability defense, AI security, security testing, privacy computing, etc., and developed and deployed multi-layer defense system. With their efforts, Baidu created a leading security technology system oriented for the AI-native cloud. We communicate with our users in an easy-to-understand manner to help them understand their rights under applicable laws and regulations. Through our data privacy and data security policies, users can learn about and control how their data is used and provide consent for data collection when necessary. We have put in place a comprehensive auditing mechanism across our business to keep track of the data privacy and data security actions taken throughout the lifecycle of our products and services. We utilize a complete set of data privacy and data security management systems that allow us to continually review and improve our processes. Guided by the principles of legal compliance, hierarchical protection, consistency of rights and responsibilities and continuous optimization, we have set up the mechanism for data security across the entire life cycle of products. This mechanism is designed to protect user privacy, validate the protection and legitimacy of data, and continuously maintain a secure state of operations. We have designed the General Privacy Policies and have drawn up specific privacy policies for individual products and services. We have also built an independent one-stop privacy protection platform, from which users can learn about our data privacy policies and provide feedback. We believe that we can make a complex world simpler through AI, but such vision can only be realized if AI is used properly.
In 2023, we inspected and cleared more than 86.45 million pieces of harmful information through all means. Through machine big data mining, it cracked down on more than 60.44 billion pieces of harmful information. The core data of content moderation were disclosed on the Comprehensive Governance of Information Security Report on a quarterly basis.
Outlook on Talent and Organizational Development. Our employees are our most important asset. To promote work-life balance for our employees, we have adopted flexible working arrangements and a system of paid leave and compensatory leave, in addition to statutory annual leave. Since 2019, we have been working with an insurance company to introduce commercial healthcare coverage for both our employees and their parents. We are an early adopter among Chinese internet companies to offer such customized coverage. Moreover, we provide a multitude of benefits to our employees and their family members, including pregnant and nursing employees. We cater for female employees via return-to-work celebrations after childbirth, a maternity room to
106
Table of Contents
give breastfeeding mothers privacy, gift bags on Women’s Day, and a women’s club that encourages communication and the organization of activities.
To better understand employees’ level of satisfaction, assist employees in addressing work challenges and improve our overall work environment, we conduct annual human capital assessment surveys with all of our employees. We also provide a variety of channels for employees to provide feedback and file complaints. We fully respect and value our employees’ suggestions and feedback.
We value training and development of our employees. We have developed a robust talent training system, Online Baidu School learning platform, which is aimed at elevating the caliber and job proficiency of AI professionals, and facilitating their comprehensive growth in pivotal areas such as practical skills, AI expertise and industry acumen. In 2023, the platform introduced 7 specialized domains focusing on the LLMs, alongside 210 courses, enriching our employees’ access to learning materials on AI and employees’ training hours. Particularly, female employees’ training hours reached 38.5 hours in 2023.
As a signatory to the United Nations Global Compact, Baidu observes international treaties such as the Universal Declaration of Human Rights, the UN Guiding Principles on Business and Human Rights, and the ILO Declaration on Fundamental Principles and Rights at Work, and has formulated the Baidu Human Rights Policy and indicators. In the Human Rights Policy, we state we are committed to and guarantee a respectful and dignified work environment for all employees. We provide equal opportunities for everyone in recruiting, hiring, training, promotion, and compensation and benefits, and strictly prohibit discrimination on the basis of gender, race, ethnicity, color, age, nationality, religion, physical disability, marital status, or other characteristics protected by law. We have zero-tolerance policies for any form of harassment, abuse, and coercion in the workplace and in any work-related environment outside the company. We protect all employees, especially women, from unfair treatment and retaliation. According to human rights tracking indicators, we regularly conduct assessments of the human rights impacts on ourselves and relevant parties.
Innovation and Practice in Social Responsibility
We care about the society that we live in, and we encourage our employees across different product lines to leverage Baidu AI technologies to make our community a better place for everyone. Baidu has made outstanding achievements in protecting vulnerable groups, including the elderly, deaf and hard-of-hearing (DHH) and minors. In March 2022, AI Cloud’s digital avatar platform XiLing launched an AI sign language platform, breaking down communication barriers for the deaf and hard-of-hearing with our automated sign language translation in place. Additionally, our Baidu App (Big Character Version) features a simpler and clearer interface and functions, designed to reduce accessibility barriers for the elderly. Furthermore, we continued to attach great importance to the protection of minors.
We have been committed to addressing social problems with honors social responsibility as a corporate citizen. In 2023, Baidu allocated RMB30 million to provide support for flood control and disaster relief efforts in Beijing, Tianjin, Hebei and other areas.
Building on our close communication and collaboration with all stakeholders, we will continue to benefit our society. As part of our efforts to create value for our society, we attach great importance to communication and engagement with our users, partners, social organizations and third-party agencies.
Regulations
We operate our business in an increasingly complex legal and regulatory environment. This section summarizes the principal laws and regulations of mainland China relating to our business.
In the opinion of Han Kun Law Offices, our PRC legal counsel, (i) the ownership structure relating to the variable interest entities complies with current laws and regulations of mainland China; (ii) subject to the
107
Table of Contents
disclosure and risks disclosed under “Item 3.D. Key Information—Risk Factors—Risks Related to Our Corporate Structure,” “—Risks Related to Doing Business in China” and “—Regulations,” our contractual arrangements with the variable interest entities and the nominee shareholders constituted legal, valid and binding obligation of all parties to these arrangements and the execution, delivery, and performance of the variable interest entities and the nominee shareholders do not violate (x) any provisions of the articles of association and business licenses of such variable interest entity and (y) any current laws or regulations of mainland China; and (iii) subject to the disclosure and risks disclosed under “Item 3.D. Key Information—Risk Factors—Risks Related to Our Corporate Structure,” “—Risks Related to Doing Business in China” and “—Regulations,” the business operations of the variable interest entities, as described herein, comply with current laws and regulations of mainland China in all material respects.
Our business is subject to evolving laws and regulatory requirements of mainland China, including, among others, the laws and regulations governing internet-related industry and AI-related industry. There are substantial uncertainties regarding the interpretation and application of existing or proposed PRC laws and regulations. We cannot assure you that the PRC regulatory authorities would find that our corporate structure and our business operations comply with PRC laws and regulations. If the PRC government finds us to be in violation of applicable PRC laws and regulations, we may be required to pay fines and penalties, obtain certain licenses or permits and change, suspend or discontinue our business operations until we comply with the applicable PRC laws and regulations.
Regulations on Corporate Governance
On December 29, 2023, the Standing Committee of the National People’s Congress promulgated the amended PRC Company Law, which will come into effect on July 1, 2024, to supersede the existing PRC Company Law which was amended in October 2018. The Amended PRC Company Law has made material amendments on corporate governance and shareholders rights of the PRC companies, including, among others, the statutory period for payment of registered capital, the setting of the board of directors and the board of supervisors, and transfer of equity interests in a company.
With respect to the period for payment of the registered capital, pursuant to the amended PRC Company Law, all shareholders of a PRC limited liability company shall fully pay up the registered capital subscribed for by such shareholders within five years since the date of establishment of such PRC limited liability company, unless otherwise provided by laws and regulations. With respect to any company established before the effective date of the amended PRC Company Law, the period of capital contribution provided in its articles of association shall be amended to meet the time limit provided in the Amended PRC Company Law if such period of capital contribution in its articles of association exceeds that as required by the amended PRC Company Law; with respect to any company whose period of capital contribution or amount of the registered capital are obviously abnormal, the competent government authority may require such company to adjust its period of capital contribution or amount of the registered capital in a timely manner. The amended PRC Company Law provides that the detailed implementation measures for the aforesaid provisions will be formulated by the State Council of the PRC. If any shareholder fails to make capital contributions on schedule and in full as provided in the articles of association, the company shall send a written notice requesting such shareholder to pay up all overdue registered capital within a grace period no less than sixty days from the issuance date of such notice. If, upon the expiration of the foregoing grace period, such shareholder still hasn’t fulfilled the obligation of capital contribution with respect to such overdue registered capital, the company may, upon adoption of the resolution of the board of directors, send a notice of forfeiture to such shareholder in writing. Since the issuance date of the foregoing notice, such shareholder shall forfeit the equity interests for which the capital contribution has not been paid up. The forfeited equity interests shall be transferred or cancelled in accordance with the applicable laws. On February 6, 2024, the SAMR issued a draft of the Provisions of the State Council on Implementing the Registered Capital Registration and Management System under the PRC Company Law for public comments until March 5, 2024, which further specify the detailed requirements and measures of the registration and management of registered capital under the amended PRC Company Law. Pursuant to such draft provisions,
108
Table of Contents
there shall be a three-year interim period from July 1, 2024 to June 30, 2027 for the existing companies to adjust their periods of capital contribution. If the period of capital contribution of a company established before the effective date of the amended PRC Company Law exceeds the period prescribed under the Amended PRC Company Law, such company shall make an adjustment within the foregoing interim period to meet the requirements under the Amended PRC Company Law. The adjusted period of capital contribution shall be recorded in such company’s articles of association and publicized through the national enterprise credit information publicity system in accordance with laws. If a limited liability company established before the effective date of the amended PRC Company Law fails to adjust its period of capital contribution during the interim period, the competent registration authority may require it to make adjustment within ninety days so that this company’s period of capital contribution shall not exceed five years commencing from July 1, 2027 in accordance with laws.
With respect to the board of directors and the board of supervisors, the amended PRC Company Law eliminates the upper limit on the number of the directors of a limited liability company, and stipulates that a limited liability company with more than 300 employees shall have an employee representative in its board of directors, unless this company has set up a board of supervisors with employee representative(s) as the member(s). In addition, after the effective date of the amended PRC Company Law, limited liability companies, joint stock limited companies with small scale or a small number of shareholders and wholly state-owned companies may set up an audit committee to replace the functions and powers of the board of supervisors, and such companies may not set the board of supervisors or any supervisor.
With respect to the transfer of equity interest of a limited liability company, the amended PRC Company law stipulates that the shareholders of a limited liability company may transfer the equity interest without the consent of other shareholders, provided that such shareholder shall notify other shareholders in writing with respect to transfer of such equity interest. Other shareholders will be regarded as giving up the right of first refusal if they fail to reply within 30 days after receiving the written notice. If a shareholder transfers the equity interest held by it, it shall notify the company in writing to request the company (i) to change the register of shareholders and (ii) to register the change with the competent enterprise registration authority. If the company refuses or fails to respond, the transferee and transferor may file a lawsuit with the competent court.
Regulations on Foreign Investment
On January 1, 2020, the PRC Foreign Investment Law and the Regulations for Implementation of the PRC Foreign Investment Law came into effect and became the principal laws and regulations governing foreign investment in mainland China, replacing the trio of prior laws regulating foreign investment in mainland China, namely, the Sino-foreign Equity Joint Venture Enterprise Law, the Sino-foreign Cooperative Joint Venture Enterprise Law and the Wholly Foreign-invested Enterprise Law, together with their implementation rules and ancillary regulations.
According to the PRC Foreign Investment Law, “foreign investment” refers to the investment activities conducted directly or indirectly in mainland China by foreign individuals, enterprises or other entities, including the following circumstances: (i) the establishment of foreign-invested enterprises in mainland China by foreign investors solely or jointly with other investors, (ii) a foreign investors’ acquisition of shares, equity interests, property portions or other similar rights and interests of enterprises in mainland China, (iii) investment in new projects in mainland China by foreign investors solely or jointly with other investors, and (iv) investments made by foreign investors through means stipulated in laws or administrative regulations or other methods prescribed by the State Council.
The PRC Foreign Investment Law has adopted a reformed system with respect to foreign investment administration, under which the PRC government applies national treatment to foreign investors in terms of investment entry and the foreign investor needs to comply with the requirements as provided in the negative list for foreign investment. The negative list will be issued by, amended or released upon approval by the State
109
Table of Contents
Council, from time to time. The negative list will consist of a list of industries in which foreign investments are prohibited and a list of industries in which foreign investments are restricted. Foreign investors will be prohibited from making investments in prohibited industries, while foreign investments must satisfy certain conditions stipulated in the negative list for investments in restricted industries. Foreign investments and domestic investments in industries outside the scope of the prohibited industries and restricted industries stipulated in the negative list will be treated equally. Any foreign-invested enterprise established prior to the effectiveness of the PRC Foreign Investment Law may maintain its original corporate forms for a period of five years after January 1, 2020.
The Regulations for Implementation of the PRC Foreign Investment Law restate certain principles of the PRC Foreign Investment Law and further provide that, among others, (1) if a foreign-invested enterprise established prior to the effective date of the PRC Foreign Investment Law fails to adjust its legal form or governance structure to comply with the provisions of the PRC Company Law or the PRC Partnership Enterprises Law as applicable and complete amendment registration before January 1, 2025, the enterprise registration authority will not process other registration matters of the foreign-invested enterprise and may publicize such non-compliance thereafter; (2) the provisions regarding equity interest transfer and distribution of profits and remaining assets as stipulated in the contracts among the joint venture parties of a foreign-invested enterprise established before the effective date of the PRC Foreign Investment Law may, after adjustment of the legal form and governing structure of such foreign-invested enterprise, remain binding upon the parties.
On December 30, 2019, the Ministry of Commerce and the SAMR jointly promulgated the Measures for Information Reporting on Foreign Investment, which became effective on January 1, 2020. Pursuant to the measures, where a foreign investor directly or indirectly carries out investment activities in mainland China, the foreign investor or the foreign-invested enterprise must submit the investment information to the competent commerce department for further handling.
In December 2020, the NDRC and the Ministry of Commerce promulgated the Measures for the Security Review of Foreign Investment, which came into effect on January 18, 2021. The NDRC and the Ministry of Commerce established a working mechanism office in charge of the security review of foreign investment. Such measures define foreign investment as direct or indirect investment by foreign investors in mainland China, which includes (i) investment in new onshore projects or establishment of wholly foreign owned onshore companies or joint ventures with foreign investors; (ii) acquiring equity or asset of onshore companies by merger and acquisition; and (iii) onshore investment by and through any other means. Investment in certain key areas with bearing on national security, such as important cultural products and services, important information technology and internet services and products, key technologies and other important areas with bearing on national security which results in the acquisition of de facto control of investee companies, must be filed with a specifically established office before such investment is carried out. What may constitute “onshore investment by and through any other means” or “de facto control” could be broadly interpreted under such measures. It is likely that control through contractual arrangement be regarded as de facto control based on provisions applied to security review of foreign investment in the free trade zone. Failure to make such filing may subject such foreign investor to rectification within prescribed period, and will be recorded as negative credit information of such foreign investor in the national credit information system, which would then subject such investors to joint punishment. If such investor fails to or refuses to undertake such rectification, it would be ordered to dispose of the equity or asset and to take any other necessary measures so as to return to the status quo and to erase the impact to national security.
Regulations on Value-Added Telecommunications Services and Internet Content Services
Value-added telecommunications services and Internet content services. The Telecommunications Regulations of the PRC promulgated by the PRC State Council in September 2000, which were most recently amended in February 2016, categorize all telecommunication businesses in mainland China as either basic or value-added. Pursuant to the Telecommunications Regulations, commercial operators of value-added
110
Table of Contents
telecommunications services must first obtain a Value-Added Telecommunication Business Operating License from the MIIT or its provincial level counterparts. The Administrative Measures for Telecommunication Business Operating License, promulgated by the MIIT with latest amendments becoming effective in September 2017, set forth the types of licenses required for value-added telecommunications services and the qualifications and procedures for obtaining such licenses. For example, a value-added telecommunications service operator providing commercial value-added services in multiple provinces is required to obtain an inter-regional license, whereas a value-added telecommunications service operator providing the same services in one province is required to obtain a local license. Baidu Netcom and some of the other variable interest entities in mainland China hold such Value-Added Telecommunication Business Operating Licenses.
Internet content services, or ICP services, are classified as one of the value-added telecommunication businesses. The Administrative Measures on Internet Information Services, promulgated by the PRC State Council in September 2000 and amended in January 2011, require companies engaged in the provision of commercial internet content services to obtain a Value-added Telecommunication Business Operation Permit for ICP services, or an ICP license from the government authorities before providing any commercial internet content services within mainland China. “Commercial internet content services” generally refer to provision of information service through public telecommunication network or internet for a fee. The Catalog of Classification of Telecommunications Services promulgated by the MIIT in December 2015 and amended in June 2019 further divides ICP services into information publication platform and delivery services, information search and inquiry services, information communities platform services, instant message services, and information security and management services. We do not believe our P4P services conducted by our certain mainland China subsidiaries are categorized as part of internet content services that require an ICP license under these regulations. Although Baidu Online conducts part of the P4P business by, among other things, examining and filtering P4P keywords, interacting with potential P4P customers, engaging in sales activities with our customers, P4P search results are displayed on the websites operated by Baidu Netcom, including baidu.com. Baidu Netcom, as the owner of our domain name baidu.com and holder of the necessary licenses and approvals, such as an ICP license, operates the website to list P4P search results and display other marketing and advertising content as an online marketing service provider.
In June 2020, the MIIT promulgated the Notice regarding Strengthening the Management of Call Center Business, which has strengthened the management on the admittance, codes, accessing, operation activities and certain other items.
Regulations on Content. National security considerations are an important factor in the regulation of internet content in the PRC. The National People’s Congress, the PRC’s national legislature, has enacted laws with respect to maintaining the security of internet operation and internet content. Under these laws and applicable regulations, violators may be subject to penalties, including criminal sanctions, for internet content that:
| • | opposes the fundamental principles stated in the PRC constitution; |
| • | compromises national security, divulges state secrets, subverts state power or damages national unity; |
| • | harms the dignity or interests of the state; |
| • | incites ethnic hatred or racial discrimination or damages inter-ethnic unity; |
| • | undermines the PRC’s religious policy or propagates heretical teachings or feudal superstitions; |
| • | disseminates rumors, disturbs social order or disrupts social stability; |
| • | disseminates obscenity or pornography, encourages gambling, violence, murder or fear or incites the commission of a crime; |
| • | insults or slanders a third party or infringes upon the lawful rights and interests of a third party; or |
| • | is otherwise prohibited by law or administrative regulations. |
111
Table of Contents
ICP operators are required to monitor their websites, including electronic bulletin boards. They may not post or disseminate any content that falls within the prohibited categories and must remove any such content from their websites. The PRC government may shut down the websites of ICP license holders that violate any of the above-mentioned content restrictions and revoke their ICP licenses. For instance, in 2017, the CAC issued a series of regulatory documents providing that an ICP operator is obligated to monitor contents displayed and disseminated by users on its platform. These regulations apply to online services, including (i) online forum and community service, which allows users to publish information and interact with other users on an online forum, post bar or other form of online communities, (ii) online follow-up comment service, which allows users to post threads, reply to original content, leave messages and engage in live commenting with texts, symbols, expressions, pictures, audio/video on a website, mobile app or other forms of interactive platform; (iii) online group chat information service, which allows users to communicate and exchange information in a cyberspace created by the users on an online platform; (iv) online official account information service, which allows users to post texts, pictures, audio/video and other information in the form of an official account registered by the user on a website, mobile app or other network platform. Pursuant to these regulations, a service provider is required to, among others, (x) register and verify the identity information of each user, and (y) in the case of publication or dissemination of prohibited contents on the platform, take prompt rectification measures, including removing and terminating transmission of the illegal content, restricting the user right of the offender, banning the user account and shutting down the relevant forum or channel, and report to the regulatory authority. On January 22, 2021, the CAC revised and promulgated the Administrative Provisions on the Information Services Provided through Official Accounts of Internet Users, which requires, among others, that information service platforms for public accounts are required to perform their responsibilities, establish systems such as those for the hierarchical or classified management of public accounts, ecological governance, copyright protection, and credit evaluation, and improve management measures such as public account registration verification, qualification examination, and disclosure of public account registrants. On November 16, 2022, the CAC amended and promulgated the Administrative Provisions on Internet Comment Posting Services, which came into effect on December 15, 2022. According to such provisions, the follow-up comment service providers must conduct standardized management of the follow-up comment service users and the producers and operators of official accounts according to the user service agreement. For the follow-up comment services users who release any illegal and negative information content, the service providers must take the measures including, among others, warning and reminding, refusing to release and deleting such illegal and negative information content, restricting such accounts’ functions, suspending such accounts updating, shutting down such accounts and prohibiting re-registration of such accounts in accordance with laws, and keep the relevant records. For the producers and operators of official accounts who fail to fulfill their management obligations resulting that any illegal and negative information content appears in the follow-up comments, the service providers must take such measures as warning and reminding, deleting such illegal and negative information, suspending the follow-up comment area functions till permanently shutting down the follow-up comment area, restricting such account functions, suspending such accounts updating, shutting down such accounts and prohibiting re-registration of such accounts in accordance with laws, and keep records and timely report such violations to the cyberspace administrations.
In addition, in November 2018, the CAC issued a notice to require ICP operators to conduct security assessments on their internet information services if their services include forums, blogs, microblogs, chat rooms, communication groups, public accounts, short videos, online live-streaming, information sharing, mini programs or such other functions that provide channels for the public to express opinions or have the capability of mobilizing the public to engage in specific activities. ICP operators must conduct self-assessment on, among others, the legality of new technology involved in the services and the effectiveness of security risk prevention measures, and file the assessment report to local competent internet information office and public security authority. At the end of 2019, the CAC issued the Provisions on the Management of Network Information Content Ecology, which became effective on March 1, 2020, to further strengthen the regulation and management of network information content. Pursuant to these provisions, each network information content service platform is required, among others, (i) not to disseminate any information prohibited by laws and regulations, such as information jeopardizing national security; (ii) to strengthen the examination of advertisements published on such network information content service platform; (iii) to promulgate management
112
Table of Contents
rules and platform convention and improve user agreement, such that such network information content service platform could clarify users’ rights and obligations and perform management responsibilities required by laws, regulations, rules and convention; (iv) to establish convenient means for complaints and reports; and (v) to prepare annual work report regarding its management of network information content ecology.
On September 15, 2021, the CAC promulgated the Opinions on Further Enforcing Responsibilities on Website Platforms as the Main Responsible Party for Information Content Management. In accordance with the Opinions, website platforms are required to perform specific responsibilities as the main responsible party for information content management, including, among others, enhancing the platform community rules, strengthening the regulation and management of accounts, improving the content vetting mechanism, improving the quality of information content, managing the dissemination of information content, and strengthening the management of key functions.
Restrictions on Foreign Ownership in Value-Added Telecommunications Services. Foreign ownership in value-added telecommunication services is governed by the State Council according to the Provisions on Administration of Foreign-Invested Telecommunications Enterprises, which were recently amended on March 29, 2022 and became effective on May 1, 2022. According to these provisions, a foreign investor’s beneficial equity ownership in an entity providing value-added telecommunications services in mainland China is generally not permitted to exceed 50% unless otherwise permitted by laws and regulations. Although these provisions deleted the prior requirement that major foreign investors holding equity in enterprises providing value-added telecommunications services in mainland China must have a good track record and operational experience in providing these services, the PRC government authorities have not promulgated any implementation rules in line with these new changes. Accordingly, there are uncertainties as to whether foreign investors without a good track record and operational experience in providing these services may qualify as major foreign investors in value-added telecommunications enterprises. Although the Special Administrative Measures (Negative List) for Foreign Investment Access (2021 Version) allow a foreign investor to own more than 50% of the total equity interest in an e-commerce business, a domestic multi-party communication business, an information storage and re-transmission business and a call center business, other requirements provided by these provisions still apply. We believe that it would be impracticable for us to acquire any equity interest in the variable interest entities without diverting management attention and resources. Moreover, we believe that our contractual arrangements with these entities and the individual nominee shareholders allow us to have the power to direct the activities of these entities that most significantly impact their economic performance. Accordingly, we currently do not plan to acquire any equity interest in any of the variable interest entities.
A Notice on Intensifying the Administration of Foreign Investment in Value-Added Telecommunications Services, issued by the MIIT in July 2006, prohibits domestic telecommunication service providers from leasing, transferring or selling Telecommunication Business Operating Licenses to any foreign investor in any form, or providing any resources, sites or facilities to any foreign investor for their illegal operation of a telecommunication business in mainland China. Pursuant to this notice, either the holder of a Value-Added Telecommunication Business Operating License or its shareholders must directly own the domain names and trademarks used by such license holder in its provision of value-added telecommunications services. The notice further requires each license holder to have the necessary facilities, including servers, for its approved business operations and to maintain the facilities in the regions covered by its license. If a license holder fails to comply with the requirements in the notice or cure any non-compliance, the MIIT or its local counterparts have the discretion to take measures against the license holder, including revoking its Value-added Telecommunication Business Operating License. Based on the Notice Regarding the Strengthening of Ongoing and Post Administration of Foreign Investment Telecommunication Enterprises issued by the MIIT in October 2020, the MIIT will not issue Examination Letter for Foreign Investment in Telecommunication Business. Foreign invested enterprises would need to submit relevant foreign investment materials to the MIIT for the establishment or change of telecommunication operating permits.
Due to the restrictions under these regulations of mainland China, we operate our websites mainly through the variable interest entities, such as Baidu Netcom. Baidu Netcom is a variable interest entity, and is considered
113
Table of Contents
a domestic entity in mainland China under laws of mainland China given that the nominee shareholders are citizens of mainland China.
Baidu Netcom and some of the other variable interest entities in mainland China hold Value-Added Telecommunication Business Operating Licenses. In compliance with the Notice of the MIIT on Intensifying the Administration of Foreign Investment in Value-Added Telecommunications Services, Baidu Netcom owns the necessary domain names and trademarks, including pending trademark applications, and has the necessary personnel and facilities to operate our websites.
Regulations on Mobile Internet Applications
In June 2016, the CAC promulgated the Administrative Provisions on Mobile Internet Application Information Services, which were most recently amended on June 14, 2022 and became effective on August 1, 2022. Pursuant to these provisions, a mobile internet app refers to an app software that runs on mobile smart devices to provide users with information services. Mobile internet app providers refer to the owners or operators of mobile internet apps which provide information services. Internet app distribution platforms refer to mobile internet information services providers which provide distribution services related to releasing, downloading and dynamic loading of internet apps.
Pursuant to these provisions, internet app providers must comply with the provisions on the scope of necessary personal information when engaging in personal information processing activities and should not compel users to agree to non-essential personal information collection or ban users from their basic functional services due to their refusal of providing unnecessary personal information. Internet app providers should not provide the relevant services to the users who fail to submit real identity information or use fraudulent identity information of other organizations or persons for fake registration. Internet app providers are also required to establish sound information content review and management mechanism, take sound management measures such as user registration, account management, information review, daily inspection and emergency disposal, and be staffed with professionals and technical ability appropriate to the service scale. Furthermore, internet app providers who launch new technologies, applications or functions with the attribute of public opinion or the capability of social mobilization should conduct security assessment in accordance with the applicable laws and regulations. If an internet app provider violates these regulations, internet app distribution platforms may issue warnings, suspend the release of its applications, or terminate the sale of its applications, and/or report the violations to government authorities, and the application provider may be imposed administrative penalty by the CAC and the competent authorities in accordance with the laws and regulations.
In December 2016, the MIIT promulgated the Interim Measures on the Administration of Pre-Installation and Distribution of Applications for Mobile Smart Terminals, which came into effect on July 1, 2017. The Interim Measures aim to enhance the administration of mobile apps, and require, among others, that mobile phone manufacturers and internet information service providers must ensure that a mobile app, as well as its ancillary resource files, configuration files and user data can be uninstalled by a user on a convenient basis, unless it is a basic function software, which refers to a software that supports the normal functioning of the hardware and operating system of a mobile smart device. On July 21, 2023, the MIIT promulgated the Notice of the Record-filing of Mobile Internet Apps, pursuant to which, operators of mobile internet apps which engage in internet information services within the territory of mainland China shall complete the record-filing formalities. Any operator shall not conduct the internet information services via mobile internet apps before the completion of the record-filing formalities with respect to such mobile internet apps.
Since 2021, the PRC government has taken steps to strengthen the supervision on the utilization of algorithm in the field of internet information service. On September 17, 2021, the CAC and eight other authorities jointly promulgated the Notice on Promulgation of the Guiding Opinions on Strengthening the Comprehensive Governance of Algorithm-Related Internet Information Services, which provides that, among others, enterprises must establish an algorithmic security responsibility system and a technology ethics vetting
114
Table of Contents
system, improve the algorithmic security management organization, strengthen risk prevention and control, and improve the capacity to respond to algorithmic security emergencies.
On September 20, 2023, the State Council promulgated the Regulation on the Protection of Minors in Cyberspace, or Cyberspace Regulation on Minors Protection, which became effective on January 1, 2024. Pursuant to the Cyberspace Regulation on Minors Protection, a network platform service provider with a substantial number of minor users or with a significant impact on the minor population shall fully fulfill the following obligations, including, among others, (i) fully considering the characteristics of the physical and mental development of minors when designing, researching, developing and operating network platform services, regularly assessing the impact of the protection of minors in cyberspace; (ii) providing a special mode or zone for minors to facilitate the minors to access products or services on the platform that are beneficial for their physical and mental well-being; (iii) establishing and improving a compliance system for the protection of minors in the cyberspace in accordance with the applicable laws and regulations, and establishing an independent body primarily composed of external members to supervise the protection of minors in the cyberspace; and (iv) terminating services to any product or service provider on the platform that gravely harms the physical and mental well-being of minors or otherwise infringe on their lawful rights and interests. Network services providers who provide the services of information publishing and instant messaging to minors shall require the minors or their guardians to provide the real identity information of the minors in accordance with laws. Network services providers who provide services such as online games, online live-streaming, online audio and video, and online social contact shall take measures to reasonably restrict the amount of single consumption and daily cumulative consumption of minors of different ages during the use of such services, and shall not provide minors with paid services which do not match their capacity for civil conduct. The personal information processors shall conduct compliance audit regarding their compliance with laws and regulations in the processing of the personal information of minors each year, and report the audit results to the cyberspace authority and other government authorities in a timely manner.
Regulations on Internet Information Search Service
In June 2016, the CAC promulgated the Administrative Provisions on Internet Information Search Services, which took effect on August 1, 2016. Pursuant to these provisions, internet information search service refers to the service whereby users can search for information that is collected from the internet and processed by computer technology. These provisions requires that an internet information search service provider must not publish any information or contents prohibited by law in the form of links, abstracts, snapshots, associative words, related search or recommendations or otherwise. If an internet information search service provider identifies any search results that contain any information, website or app that is prohibited by law, it must stop displaying the search results, record the infraction and report it to the government authority. In addition, an internet information search service provider is prohibited from seeking illegitimate interest by means of unauthorized disconnection of links, or provision of search results containing false information. If an internet information search service provider engages in paid search services, it must examine and verify the qualifications of its customers of the paid search services, specify the maximum percentage of search results as paid search results on a webpage, clearly distinguish paid search results from natural search results, and notably identify the paid search information item by item.
Regulations on Advertisements and Online Advertising
The PRC government regulates advertising, including online advertising, principally through the SAMR. The PRC Advertising Law, as amended on April 29, 2021, outlines the regulatory framework for the advertising industry and allows foreign investors to own up to all equity interests in PRC advertising companies.
We conduct our value-added telecommunication-based online advertising business through Baidu Netcom, which is one of the variable interest entities in mainland China and holds a business license that covers value-added telecommunication-based online advertising in its business scope. Our subsidiaries Baidu Times and Baidu
115
Table of Contents
China have also expanded their respective business license to cover advertising in their respective business scope.
Advertisers, advertising operators and advertising distributors are required by PRC advertising laws and regulations to ensure that the content of the advertisements they prepare or distribute is true and in full compliance with applicable laws and regulations. For example, pursuant to the PRC Advertising Law, advertisements must not contain terms such as “the state-level,” “the highest grade,” “the best” or other similar words. In addition, where a special government review is required for certain categories of advertisements before publishing, the advertisers, advertising operators and advertising distributors are obligated to confirm that such review has been performed and approvals have been obtained. Pursuant to the PRC Advertising Law, advertisements distributed on the internet should not affect the normal use of internet by users. Particularly, advertisements distributed on internet pages such as pop-up advertisements must indicate a conspicuous mark for “close” to ensure the close of such advertisements by one click. Where internet information service providers know or should know that illegal advertisements are being distributed using their services, they must prevent such advertisements from being distributed.
In addition to the above regulations, the Administrative Measures for Internet Advertising promulgated by the SAMR on February 25, 2023 and effective on May 1, 2023 also set forth certain compliance requirements for online advertising businesses. Pursuant to the Administrative Measures for Internet Advertising, an internet advertisement shall be identifiable as an advertisement by consumers. With respect to the promotion of goods or services in the form of paid listing, advertising distributors shall indicate them conspicuously as an advertisement to distinguish them from the natural search results. Publishing and distributing advertisements by means of internet shall not affect the normal internet access by users, and it is prohibited to insert advertisements in the form of paid listing into the search results of government service websites, webpages, internet apps, official accounts, etc. With respect to the internet advertisements which are published in the form of pop-up or otherwise, the advertisers and advertising distributors shall clearly mark the closure sign to ensure that such advertisements could be closed by one click. Furthermore, in accordance with the Administrative Measures for Internet Advertising, the advertising operators and distributors shall establish, improve and implement the registration, review and file management system of internet advertising business, which shall include, among others: (a) to examine and register advertisers’ real identity, address and effective contact information, establish, regularly check and update advertising archives, record and save the electronic data of advertising activities; and (b) to examine the relevant supporting documents and the content of the advertisements. With respect to the internet advertisements which are published by means of algorithmic recommendation or otherwise, the rules on the algorithmic recommendation service and the record of advertisement placement shall be included in the advertisement archives.
On August 28, 2023, the SMAR promulgated the draft Guideline on Regulatory Enforcement concerning the Identifiability of Internet Advertising for public comment. The draft guideline further specifies the criteria and requirements on the identifiability of internet advertisements. Pursuant to the draft guideline, the identifiability of internet advertisements refers to that commercial advertisements released through internet media shall enable consumers to recognize them as advertisements, and to distinguish them from other non-advertising information without misunderstanding. Internet advertising distributors may enhance the identifiability of internet advertisements by means of text annotation and voice prompts. Internet advertising distributors using text annotation shall clearly indicate “advertisement” and shall not use “sponsorship”, “promotion”, “recommendation” or “AD” as a substitute. If an internet advertisement is not identifiable, the internet advertising distributors shall be held responsible in accordance with laws; if an advertiser publishes an internet advertisement on its own, such advertiser shall be held responsible in accordance with laws.
Regulations on Artificial Intelligence
We engage in the research and development of artificial intelligence (AI) technology and products, specifically autonomous driving vehicles and generative AI. The PRC government has issued a series of
116
Table of Contents
guidelines to encourage and support the research and development of AI technology, such as the Three-Year Implementing Plan for Internet Plus Artificial Intelligence issued in May 2016, the Development Planning on the New Generation of Artificial Intelligence issued in July 2017 and the Development Plan for the Big Data Industry during the “14th Five-Year Plan” Period issued in November 2021.
Regulations on Autonomous Driving Vehicles. The MIIT, the Ministry of Public Security and the Ministry of Transport jointly promulgated the Administrative Rules of Road Testing and Demonstration Application of Intelligent Connected Vehicles (for Trial Implementation) on July 27, 2021, which became effective on September 1, 2021. Pursuant to these rules, a qualified entity to conduct road testing of intelligently connected vehicles must meet the following conditions, including, among others: (i) it must be an independent legal person registered within the territory of mainland China; (ii) it must have the capabilities concerning intelligently connected vehicles, such as the capabilities of manufacturing automobiles and spare parts thereof, the capabilities of research and development of technologies, or the capabilities of experiments and tests; (iii) it must be capable of paying civil compensation for potential damages caused by the road testing of intelligently connected vehicles; (iv) it must have the evaluation rules for the testing of self-driving functions of intelligently connected vehicles; (v) it must have the ability to conduct real-time remote monitoring of the vehicles on road testing; (vi) it must have the ability to record, analyze and reproduce the events related to road test vehicles; (vii) it must have the ability to guarantee the network security for tested vehicles and remote monitoring platforms; and (viii) other conditions specified in applicable laws, administrative regulations and rules. An eligible entity may apply to conduct experimental operation of intelligently connected vehicles in prescribed roads and areas. Prior to starting a road testing, a road-testing entity must submit a self-declaration on safety of the road testing, and such self-declaration should be confirmed by the competent government authority on the provincial or municipal level. The testing duration for a road testing should not exceed 18 months in principle, and should not exceed the validity period of the quality certificate of safety technical inspection and the insurance voucher of the tested vehicle. A road-testing entity or the experimental operation entity must submit a periodic report every 6 months to the competent government authority on the provincial or municipal level and provide a summary report within 1 month upon conclusion of the road testing or experimental operation. The entity responsible for the road testing or the experimental operation must report information on the traffic accidents during the road testing or experimental operation to the competent authorities on a monthly basis. In case of any traffic violation occurred during the road test or demonstration application, the traffic administrative department of the public security department must impose the penalties (including, among others, fines or warning) on the driver in accordance with the laws and regulations on road traffic safety. In the case of serious injuries or deaths of any person or serious damage of a vehicle, the entity responsible for the road testing or the experimental operation must report such accident to the competent government authority on the provincial or municipal level within 24 hours through the information system, and if such subject fails to report as required, its road testing or experimental operation activities may be suspended for 24 months. Some local governments, such as Beijing, Shanghai, Chongqing, Hunan and Tianjin, have issued local rules and regulations to regulate road testing of autonomous driving cars accordingly.
In addition, the PRC government has strengthened regulation of the network security and data security of the Internet of Vehicles (IoV) since 2021. On September 15, 2021, the MIIT issued the Circular on Strengthening the Network Security and Data Security of IoV. This Circular provides that all enterprises related to IoV must establish management systems for network security and data security, specify the responsible person and management bodies, and perform network security and data security-related protection responsibilities. The Circular also requires that all enterprises related to IoV must monitor, prevent, and promptly tackle cybersecurity risks and threats to ensure that data can be effectively protected and legally used and that the relevant IoV can be operated safely and stably. On March 7, 2022, the MIIT issued the Guidelines for the Construction of Network Security and Data Security Standard System for IoV, which specifies the safety standards and requirements covering terminal and facility security, network communication security, data security, application service security and security guarantee and support.
117
Table of Contents
On August 16, 2021, the CAC and four other authorities jointly promulgated the Several Provisions on Automotive Data Security Management (for Trial Implementation), which took effect on October 1, 2021. These provisions require that automotive data processors should avoid excessive collection and illegal use of data and adhere to certain protocols such as “no collection by default” and “data masking” when carrying out data processing activities. These provisions emphasize that if it is indeed necessary to provide any important data overseas due to the business needs of an automotive data processer, the automotive data processer must complete a prior security assessment on outbound data transfer and should not provide any important data overseas beyond the scope determined in such security assessment.
On April 28, 2021, the National Information Security Standardization Technical Committee issued a draft of the Safety Requirements for Data Collected by Internet of Vehicles (IoV), and on October 19, 2021, the National Information Security Standardization Technical Committee further issued the Security Requirements of Vehicle Collected Data (Draft for comments). The Security Requirements of Vehicle Collected Data (Draft for comments) specifies the security requirements on the transfer, storage, outbound transfer and other dispositions of vehicle collected data. Specifically, certain types of vehicle collected data, such as those collected through sensors within the vehicle cockpit and location and route data, should not be transferred outside mainland China. Besides, outbound transfer of operational data should be subject to the data cross-border transfer security assessment conducted by national cyberspace authorities.
On November 21, 2023, in order to encourage and regulate the application of autonomous vehicles in transport services, the Ministry of Transport issued the Guideline on Transport Safety and Service for Autonomous Vehicles (Trial Implementation). Pursuant to the guideline, transport service on roads using autonomous vehicles shall be carried out within designated areas and shall pass the road traffic safety assessment in accordance with laws. The operators using autonomous vehicles in urban public bus passenger transport business, taxi passenger transport business and general passenger and cargo transport business shall complete the registration as the market entities pursuant to the applicable laws, and the corresponding business categories shall be registered into their business scope. The autonomous vehicles engaged in road transport shall satisfy the requirements of the national standards and technical specifications, complete motor vehicle registration in accordance with laws, obtain motor vehicle license plates and motor vehicle driving licenses. The autonomous-driving transport operators shall assume the main responsibility of safety, and shall clearly inform other traffic participants of their autonomous-driving identity with eye-catching patterns, words or colors on the vehicle body.
On November 17, 2023, the MIIT, the Ministry of Transport, the Ministry of Public Security and the Ministry of Housing and Urban-Rural Development jointly issued the Notice of Launching the Pilot Program of Market Access and Road Passage for Intelligent Connected Vehicles. Pursuant to such notice, intelligent connected vehicles which have obtained the permits to run on roads shall carry out pilot road traffic in specified areas. Users of the pilot programs shall purchase insurance for their vehicles, apply for vehicle registration, monitor the operation status of vehicles and strengthen the guarantee for vehicle operation safety as required. Pilot automobile manufacturers shall assume the principal responsibility for the quality and production consistency of intelligent connected vehicles, shall be strictly prohibited from any unauthorized change of autopilot function and shall strictly complete the commitment of software upgrading management and record-filing. Pilot users shall assume the principal responsibilities in respect of road traffic safety, network security and data security, and establish sound safety management systems and measures, to ensure vehicle operation safety.
Regulations on Generative AI. Prior to 2022, the provisions on the generative AI technology are stipulated in the regulations and rules about internet information services dispersedly. For example, according to the Provisions on the Management of Network Information Content Ecology issued by the CAC at the end of 2019, a network information content service platform must not, among others, (i) utilize new technologies such as deep-learning and virtual reality to engage in activities prohibited by laws and regulations; (ii) engage in online traffic fraud, malicious traffic rerouting and other activities related to fraudulent account, illegal transaction account or maneuver of users’ account; or (iii) infringe a third party’s legitimate rights or seek illegal interests by way of interfering with information display. According to the Administrative Provisions on Online Audio-visual
118
Table of Contents
Information Services jointly issued by the CAC, the Ministry of Culture and Tourism and the NRTA on November 18, 2019, the production, release and dissemination of any unauthentic audio-visual information by use of any new applications and technologies bases on deep learning and virtual reality must be labeled in a prominent manner by the online audio-visual information service providers and users. Furthermore, any online audio-visual information service providers and users should not produce, release or disseminate false news by use of new applications and technologies based on deep learning and virtual reality.
Since the end of 2021, the PRC government authorities specially promulgated certain laws to regulate the algorithmic recommendation and deep synthesis technology which are closely related to the generative AI technology. On December 31, 2021, the CAC, the MIIT, the Ministry of Public Security and the SAMR jointly issued the Administration Provisions on Algorithmic Recommendation of Internet Information Services, which became effective on March 1, 2022. These provisions stipulates that algorithmic recommendation service providers must (i) fulfill their responsibilities for algorithm security, (ii) establish and strengthen management systems for algorithm mechanism examination, ethical review in technology, user registration, information release examination, protection of data security and personal information, anti-telecom and network fraud, security assessment and monitoring, emergency response to security incidents, etc., and (iii) formulate and publish rules governing algorithmic recommendation related service. The provider of algorithmic recommendation services should not use the services to (i) carry out any illegal activity which may endanger national security and social public interest, disturb economic order and social order, or infringe third parties’ legal interest, or (ii) spread any information prohibited by laws or regulations. Besides, it should not take advantage of algorithms to impose unreasonable restrictions on other information service providers, or hinder or obstruct the normal operation of their legal services. The providers of algorithmic recommendation services with the characteristics of public opinion or capacity of social mobilization must complete the filing with the CAC’s filing system within ten business days after the launch of its service.
On November 25, 2022, the CAC, MIIT and Ministry of Public Security jointly issued the Administrative Provisions on Deep Synthesis of Internet Information Services, which took effect on January 10, 2023. According to these provisions, deep synthesis technology refers to any technology that utilizes deep learning, virtual reality or any other generative or synthetic algorithm to produce text, images, audio, video, virtual scenes or other network information. These provisions emphasize that the providers of deep synthesis services, as the primary entities responsible for the information security, should not use deep synthesis services to engage in activities prohibited by laws and regulations. If the CAC and other competent government authorities find that the deep synthesis service has a serious information security risk, they can require the deep synthesis service providers and technical supporters to suspend information update, user account registration or other related services in accordance with their duties and applicable laws. Deep synthesis service providers and technical supporters shall take measures to rectify and eliminate hidden dangers and a violation of such provisions shall subject them to punishment in accordance with the laws and regulations. If the act of deep synthesis services providers and/or technical supporters constitutes a violation of the administration of public security, they shall be punished according to the laws related to the administration of public security. If the act constitutes a crime, such deep synthesis service provider and/or technical supporter shall be prosecuted for criminal responsibility.
On July 10, 2023, the CAC, MIIT, NDRC, Ministry of Public Security and other PRC government authorities jointly issued the Interim Measures on the Management of Generative AI Services, or the Generative AI Services Measures, which became effective on August 15, 2023. According to the Generative AI Services Measures, “generative AI technology” refers to models and related technology with the ability to generate text, images, audios, videos, or other content, and “generative AI service provider” refers to any organization or individual that utilizes generative AI technology to provide generative AI services (including the organizations or individuals providing such services through the provision of a programmable interface or other means). Generative AI service providers shall carry out pre-training, optimization training, and other training data processing activities in accordance with applicable laws and regulations, including, among others, (i) using data and basic models with lawful sources, (ii) not infringing the intellectual property rights owned by others, (iii) obtaining the prior consent from individuals in accordance with the applicable laws and regulations if the training
119
Table of Contents
data contains any personal information, and (iv) taking effective measures to improve the quality of training data and to enhance the authenticity, accuracy, objectivity and diversity of training data. Generative AI service providers shall also assume the responsibility as a producer of online information content and personal information processor in accordance with applicable laws, fulfill online information security obligations, enter into service agreements with the users, and label images, videos, and other contents generated by use of generative AI technology pursuant to the Administrative Provisions on Deep Synthesis of Internet Information Services. Any generative AI service provider with the characteristics of public opinion or capacity of social mobilization shall conduct security assessment, and complete the formalities for algorithm filing, change or deregistration in accordance with the Administration Provisions on Algorithmic Recommendation of Internet Information Services. The generative AI service providers who violate the Generative AI Services Measures will be punished in accordance with the applicable laws and regulations. If there is no provision in laws or regulations, the competent government authority shall, in accordance with its functions and duties, issue a warning to such generative AI services providers, circulate a notice of criticism and order such generative AI services providers to correct within a time limit. Those who refuse to make corrections or whose circumstances are serious shall be ordered to suspend the provision of relevant services. If the violation of the Generative AI Services Measures by such generative AI services providers constitutes an act violating the administration of public security, they shall be punished according to the laws related to the administration of public security. If the violation constitutes a crime, such generative AI service provider shall be prosecuted for criminal responsibility.
On September 7, 2023, the PRC Ministry of Science and Technology and other nine PRC government authorities jointly issued the Measures for Science and Technology Ethics Reviews (for Trial Implementation). According to these measures, organizations conducting life sciences, medicine, artificial intelligence or other science and technology activities, of which the research content involves sensitive areas of science and technology ethics, shall establish a science and technology ethics review committee, and the research and development of algorithm models, applications, and systems with the capability to mobilize public opinions and guide social consciousness shall be subject to the ethics review. Moreover, as one of the key contents of the ethics review, with respect to the science and technology activities involving data and algorithms, (i) the data collection, data storage, data processing, data use and other data handling activities, as well as the research and development of new data technologies, shall comply with relevant national data security and personal information protection laws and regulations, and there should be proper data security risk monitoring and contingency plans; and (ii) the design, implementation and application of algorithms, models and systems shall adhere to the principles of fairness, equity, transparency, reliability and controllability, and comply with relevant national requirements.
We had completed the necessary security assessment and algorithm filing in accordance with the Generative AI Services Measures and other applicable laws and regulations before we launched Ernie Bot to the public.
Regulations on News Display
Displaying news on a website and disseminating news through the internet is highly regulated in the PRC. The Provisional Measures for Administrating Internet Websites Carrying on the News Displaying Business, jointly promulgated by the State Council News Office and the MIIT in November 2000, require an ICP operator (other than a government authorized news unit) to obtain an approval from the State Council News Office to post news on its website or disseminate news through the internet. Furthermore, the disseminated news must come from government-approved sources pursuant to contracts between the ICP operator and the sources, copies of which must be filed with the government authorities.
In May 2017, the CAC issued the Provisions on the Administration of Internet News Information Services and their implementing rules, which became effective on June 1, 2017. Pursuant to these provisions and their implementing rules, if an entity intends to provide internet news information service, it is required to obtain an approval from the State Council News Office and receive an Internet News Information Service License. Internet news information service refers to editing, publishing and reprinting and the dissemination platform service of
120
Table of Contents
internet news through internet websites, mobile apps, forums, blogs, micro-blogs, official accounts, instant message tools, live-streaming and other similar means. Pursuant to these provisions, no internet news information service organizations may take the form of a foreign-invested enterprise, whether a joint venture or a wholly foreign-owned enterprise, and no cooperation between internet news information service organizations and foreign-invested enterprises is allowed prior to the security evaluation by the CAC. On March 12, 2022, the NDRC and the Ministry of Commerce issued the Negative List for Market Access (2022 Version), which specifies the prohibition of illegal engagement in news media business, and further emphasizes that non-state capital should not engage in the gathering, editing, broadcasting and distribution of news information.
Baidu Netcom obtained the Internet News Information Service License, which permits it to publish internet news pursuant to the PRC laws and regulations, in December 2006, and had the license renewed in October 2021.
Regulations on Internet Culture Activities
The Provisional Measures for the Internet Culture Administration, promulgated by the Ministry of Culture, the predecessor of the Ministry of Culture and Tourism, and with the latest amendment becoming effective in December 2017, require ICP operators engaging in “internet culture activities” to obtain a permit from the Ministry of Culture. The “internet culture activities” include, among other things, online dissemination of internet cultural products and the production, reproduction, importation, distribution and broadcasting of internet cultural products. In May 2019, the Ministry of Culture and Tourism issued the Circular regarding Adjusting the Scope of Approval of Internet Culture Business Permit and Further Regulating Approval Matters to adjust the applicable scope of the Internet Culture Business Permit. Pursuant to the circular, the Ministry of Culture and Tourism will no longer be the authority supervising the online game industry and therefore the business scope of an Internet Culture Business Permit issued by it and its local counterparts will only cover internet cultural products including online music, online plays or programs, online performance, online works of art, online cartoon and exhibition and online matches, but exclude online games. Imported internet cultural products are subject to content review by the Ministry of Culture and Tourism before they are disseminated online, while domestic internet cultural products must be filed with the local branch of the Ministry of Culture within 30 days following the online dissemination. Service providers are also required to conduct self-review of the content of internet cultural products before they are put on the internet or submitted to the Ministry of Culture for approvals or filings. Baidu Netcom was granted an Internet Culture Business Permit in April 2007, which was last renewed again in March 2023 and remains valid until April 2026. Some other entities in our group have also obtained an Internet Culture Business Permit.
The Several Suggestions on the Development and Administration of Internet Music, issued by the Ministry of Culture and becoming effective in November 2006, reiterate the requirement for an internet service provider to obtain the Internet Culture Business Permit to carry on any business of internet music products. In addition, foreign investors are prohibited from engaging in the internet culture business operation.
In October 2015, the Ministry of Culture promulgated a notice, which took effect on January 1, 2016, to further strengthen its regulation over online music, including requiring online platforms that allow users to upload self-created or performed music to set up real-time monitoring systems and requiring online music service providers to make quarterly filings of information related to their content self-review with the local counterpart of the Ministry of Culture from April 1, 2016.
The Regulations for the Administration of Audio and Video Products, as released by the State Council in December 2001 and last amended in November 2020, require that the publication, production, duplication, importation, wholesale, retail and renting of audio and video products are subject to a license issued by competent authorities.
Regulations on Internet Publishing
In February 2016, the State Administration of Press, Publication, Radio, Film and Television (currently known as the National Press and Publication Administration, or the NPPA), and the MIIT jointly issued the
121
Table of Contents
Administrative Provisions on Internet Publishing Service, which took effect on March 10, 2016. These provisions require that any entity engaged in the provision of online publications to the public via information networks obtain an Internet Publication License from the NPPA. Online publications refer to digital works with editing, production, processing and other publishing features, provided to the public via information networks, which mainly include: (i) informative and thoughtful text, pictures, maps, games, animation, audio and video digitizing books and other original digital works in fields such as literature, art and science, (ii) digital works consistent with the content of published books, newspapers, periodicals, audio-visual products and electronic publications, (iii) the network literature database or other digital works formed through aforementioned works by selecting, organizing, compiling and other means, and (iv) other types of digital works determined by the NPPA. The servers and storage facilities used by internet publishers must be located within the territory of mainland China. These provisions also provide that when an internet service provider provides manual intervention search ranking, advertising, promotion and other services to customers that provide internet publishing services, it is required to check and examine the Internet Publication Licenses obtained by the customers and the business scope of such licenses.
Regulations on Production and Operation of Audio/Video Programs
Under the Regulations on the Administration of Production of Radio and Television Programs issued by the State Administration of Radio, Film and Television, or the SARFT (currently known as NRTA) in July 2004 and recently partly amended in October 2020, any entities that engage in the production of radio and television programs are required to apply for a Permit for Production and Operation of Radio and TV Programs from the competent administrative authority. Entities with this permit must conduct their business operations in compliance with the approved scope of production and operation. On August 8, 2022, the NRTA released the Administrative Provisions on the Production and Operation of Radio, Television and Online Audio-visual Programs (Draft for Comment) to solicit public opinions by September 8, 2022, which provided explicitly that any overseas organization, foreign individual or foreign-invested enterprise should not conduct the business of programs production and operation. Such draft further proposed the self-discipline requirements for industry organizations and entities, rules on the prohibited content in the programs, regulations on film remuneration and prohibitions on false publicity of audience ratings and click-through rates. The Production and Operation of Radio, Television and Online Audio-visual Programs will supersede the Administration of Production of Radio and Television Programs upon it becoming effective.
On March 17, 2010, the SARFT issued the Internet Audio/Video Program Services Categories (Provisional), or the Provisional Categories, which were amended on March 10, 2017. The amended Provisional Categories classified internet audio/video programs into four categories, which are further divided into seventeen sub-categories.
In 2022, the PRC government authorities further strengthened the supervision on the network dramas (including network mini plays). On April 29, 2022, the NRTA issued the Circular on Matters regarding Administration on Service of Domestic Network Dramas Distribution License, which took effect on June 1, 2022. Pursuant to this circular, the PRC government adopts a licensing system to the distribution of domestic network dramas, and the distribution of domestic key network dramas is required to obtain the Network Dramas Distribution License issued by the competent government authorities of radio and television in accordance with the applicable laws. On November 14, 2022, the NRTA issued the Circular on Further Strengthening the Management of the Network Mini Plays and Implementing the Creation Improvement Plan, which became effective on the same date. Network mini plays refers to the network dramas with dozens of seconds to around 15 minutes running for each episode. Pursuant to this circular, the operators of network mini plays are required to obtain the Online Audio/Video Program Transmission License or be managed by the administrative authorities of radio and television in accordance with applicable regulations. All network mini plays to be transmitted online must have passed the content review by the administrative authorities of radio and television and must have obtained the Network Dramas Distribution License or completed the filing of internet audio and video programs in accordance with the regulations on network dramas.
122
Table of Contents
Regulations on Broadcasting Audio/Video Programs through the Internet
In December 2007, the SARFT and the MIIT jointly promulgated the Rules for the Administration of Internet Audio and Video Program Services, commonly known as “Document 56”, which took effect on January 31, 2008 and was further amended on August 28, 2015. Pursuant to Document 56, an online audio/video service provider must obtain an Online Audio/Video Program Transmission License, which has a term of three years, and operate in accordance with the scope of the business as stipulated in the license. Furthermore, Document 56 requires all online audio/ video service providers to be either wholly state-owned or state-controlled. According to some official answers to press inquiries published on the SARFT’s website in February 2008, officials from the SARFT and the MIIT clarified that online audio/video service providers that already had been operating lawfully prior to the issuance of Document 56 may re-register and continue to operate without becoming state-owned or controlled; provided that the providers have not engaged in any unlawful activities. This exemption will not be granted to online audio/video service providers established after Document 56 was issued. In addition, foreign-invested enterprises are not allowed to engage in the above-mentioned businesses. On March 16, 2018, the NRTA issued the Notice on Further Regulating the Transmission Orders of Internet Audio and Video Program, pursuant to which, among others, (i) online streaming platforms should not illegally capture, edit, or reprogram audio-video programs, (ii) the movie clips and prevue broadcasted on the platform must come from the licensed broadcasting and television programs; and (iii) the platform must verify qualifications of sponsors for programs on the platform and must refrain from accepting sponsorship or advertising from or cooperating in any other form with any unlicensed online audio/video service providers.
According to Document 56 and other laws and regulations, audio-video programs provided by the entities supplying internet audio-video program services should not contain any illegal content or other content prohibited by the laws and regulations, such as any content against the basic principles in the PRC Constitution, any content that damages the sovereignty of the country or national security, and any content that disturbs social order or undermine social stability. An audio-video program that has already been broadcast must be retained in full for at least 60 days. Movies, television programs and other media content used as internet audio-video programs must comply with the administrative regulations on programs broadcasts through radio, movie and television channels. Entities providing services related to internet audio-video programs should immediately delete the audio-video programs violating laws and regulations, keep relevant records, report to authorities and implement other regulatory requirements.
On October 31, 2018, the NRTA issued the Notice on Further Strengthening the Management of Radio and Television and Network Audiovisual Cultural Programs, or Notice 60. According to Notice 60, all radio and television broadcasting institutes, network audiovisual program service institutes and program production institutes must stick to the right political direction and strengthen value guidance; pursue people-centered creative orientation to curb bad tendencies such as pursuing celebrities, pan-entertainment and so on; persist in providing high-quality content, constantly innovate programs, and strictly control the remuneration of guests; and strengthen the governance of TV series, network series (including network movies) to promote the benign development of the industry; must strengthen the use and management of ratings (click-through rate) survey data and resolutely crack down on ratings (click-through rate) forgeries, etc.
On May 27, 2016, SAPPRFT issued the Notice on Relevant Issues concerning Implementing the Approval Works of Upgrading Mobile Internet Audio-Video Program Service. This notice provides that the mobile internet audio-video program services shall be deemed internet audio-video program service. Entities which have obtained the approvals to provide the internet audio-video program services may use mobile WAP websites or mobile applications to provide audio-video program services. Entities with regulatory approvals may operate mobile applications to provide the audio-video program services. The types of the programs should be within the permitted scope as provided in the licenses and such mobile applications are required to be filed with the NRTA and/or SFB.
On October 8, 2021, the Administrative Provisions on Minor-oriented Programs was revised by the NRTA and has become effective on the same date. According to these provisions, network audio-visual programs with
123
Table of Contents
minors as their main participants or recipients should not contain any contents which are harmful to the minors, such as violence, pornography, heresy, superstition, drug taking and other illegal contents. On November 18, 2019, the CAC, the Ministry of Culture and Tourism and the NRTA jointly issued the Administrative Provisions on Online Audio-visual Information Services, or Circular No. 3, which took effective on January 1, 2020. According to the Circular No. 3, Online Audio-visual Information Services refer to the services of producing, publishing and disseminating audio-visual information offered to the public via internet platforms, such as websites and application programs. Circular No. 3 requires that no individual or entity is allowed to (i) use the online audio-visual information services or related technologies to engage in any activities which may jeopardize national security, undermine social stability or infringe legitimate right of others; (ii) produce, publish or disseminate any audio-visual information prohibited by the laws and regulations, such as internet rumors. A provider of audio-visual information services must establish, maintain and optimize a rumors refuting regime, under which once it identifies that any user of audio-visual information services produces, publishes or disseminates any rumor by virtue of the technology of producing forged pictures or audio-visual information based on deep-learning or virtual reality, such provider must take measures to refute such rumors in a timely manner and file such situations with the competent authorities governing internet information, culture and tourism, and radio and television.
Baidu Netcom has renewed its Online Audio/Video Program Transmission License, which remains valid until July 2024. Beijing iQIYI has an Online Audio/Video Program Transmission License that is valid until October 2024. Another entity in our group has an Online Audio/Video Program Transmission License that is valid until March 2026.
Regulations on Live Streaming
In November 2016, the CAC promulgated the Administrative Provisions on Internet Live-streaming Service, which took effect on December 1, 2016. Pursuant to the Administrative Provisions, internet live-streaming service refers to continuous publishing of real-time information to the public on internet by means of video, audio, graphics, text or other forms, and an internet live-streaming service provider refers to an operator of the platform providing internet live-streaming service. In accordance with the administrative provisions, an internet live-streaming service provider must verify and register the identity information of publishers of live-streaming programs and users on its platform, and file the identity information of the publishers with the local government authority for record. Any internet live-streaming service provider engaging in news service must obtain internet news information service qualification and operate within the permitted scope of such qualification. In September 2016, the SAPPRFT issued the Circular on Strengthening Administration of Live-streaming Service of Network Audio/Video Programs. Pursuant to the circular, any entity that intends to engage in live audio/video broadcasting of major political, military, economic, social, cultural or sport events or activities, or live audio/video broadcasting of general social or cultural group activities, general sporting events or other organizational events, must obtain an Online Audio/Video Program Transmission License with a permitted operation scope covering the above business activities. Any entity or individual without qualification is prohibited from broadcasting live audio/radio programs involving news, variety shows, sports, interviews, commentary or other forms of programs through any online live-streaming platform or online live broadcasting booth, nor are they permitted to start a live broadcasting channel for any audio or radio programs. In addition, no entity or individual other than licensed radio stations or television stations are allowed to use “radio station,” “television station,” “broadcasting station,” “TV” or other descriptive terms exclusive to television and radio broadcasting organizations to engage in any business on the internet without approval. Furthermore, the CAC issued a notice in July 2017 which requires operators of internet news and information reproduction and broadcasting services, including commercial website apps that contain live-streaming features, and other internet live-streaming services, to file with the local CAC starting from July 15, 2017. The Circular on Tightening the Administration of Internet Live-Streaming Services jointly issued jointly by the MIIT, the CAC and several other government agencies in August 2018 reiterates the license requirements for online-streaming service providers and requires the operator to file with the local public security authority within 30 days after it commences the service online.
124
Table of Contents
The SAMR has promulgated the Guidance regarding Strengthening the Supervision over Marketing Activities by Internet Live-Streaming in November 2020 to further regulated marketing activities by internet live-streaming. The NRTA also issued a circular on the Strengthening Management of Live-Streaming of Internet Shows and Electronic Commerce in November 2020 to provide instruction to online marketing activities through live-streaming. Platforms providing live-streaming of internet show or electronic commerce must register with National Internet Video-audio Platform Information Management System no later than November 30, 2020. The overall ratio of front-line content reviewers to live-streaming rooms on such platforms should be no less than 1:50. The training for content reviewers should be strengthened and content reviewers who have passed the training should be registered in the Reviewer Information Management System. A platform must report the number of its live-streaming rooms, streamers and content reviewers to the provincial branch of the NRTA on a quarterly basis. internet show live-streaming platforms must tag content of live-streaming rooms and corresponding streamers by category. A streamer cannot change the category of the programs tagged in his or her live-streaming room without prior approval from the platform. Users that are minors or without real-name registration are prohibited from virtual tipping, and platforms must cap the amount of virtual tipping per time, per day, and per month. When the virtual tipping by a user reaches half of the daily/monthly limit, a consumption notification from the platform and a confirmation from the user by text messages or other means are required before the processing the next transaction. When the amount of virtual tipping by a user reaches the daily/ monthly limit, the platform must suspend the virtual tipping function for such user for that day or month. To host any electronic commerce promotion events such as E-commerce Festival, E-commerce Day or Promotion Day in the forms of live-streaming rooms, live performances, live variety shows and other live programs, the platforms should register the information of guests, streamers, content and settings with the local branch of NRTA 14 business days in advance. internet electronic commerce live-streaming platforms should conduct qualification examination and real-name authentication on businesses and individuals providing live-streaming marketing services and keep complete examination and authentication records, and should not enable imposters or businesses or individuals without qualification or real-name registration to conduct live-streaming marketing services.
On February 9, 2021, the CAC and six other authorities jointly promulgated the Guiding Opinions on Strengthening the Standardized Management of Online Live Streaming, which became effective on the same date. Pursuant to these opinions, online live streaming platforms are required to, among others, (i) establish and improve their system for standardized classified and hierarchical management of live streaming accounts, the management rules for online rewards services, and the management system for sales through live streaming, (ii) set limits on the maximum amount of rewards accepted by a live streamer during a single live stream, and (iii) set a reasonable upper limit for the value of a single virtual product and the amount of a single reward.
On March 12, 2022, the NDRC and the MOC issued the Negative List for Market Access (2022 Version), which provides that, among others, non-state capital should not engage in live streaming and broadcasting of events and activities involving politics, economy, military affairs, diplomatic affairs, major social events, culture, science and technology, public health, education and sports and such other activities and events related to political direction, public opinion orientation and value orientation. The scope of these restricted subject matters for live streaming and broadcasting is relatively broad and vague, and is subject to further clarifications and interpretations by the regulator.
On June 8, 2022, the NRTA and the Ministry of Culture and Tourism jointly released the Code of Conduct for Livestreaming Hosts, which came into effect on the same day. According to such code, online performance platforms, online audio-visual platforms and brokerage agencies must strictly perform their statutory obligations, establish and improve the entry, training, daily management, performance scoring files and “red and yellow card” management and other internal systems and norms on livestreaming hosts. The livestreaming hosts who violate the applicable regulations and rules should be warned, and the livestreaming hosts with serious problems and repeated indiscipline shall be included in the “blacklist” or “warning list” and be prohibited from conducting any livestreaming activities by use of any account of any platform.
125
Table of Contents
Regulations on Internet Map Services
According to the Administrative Rules of Surveying Qualification Certificate, as most recently amended by Ministry of Natural Resources on June 7, 2021, which became effective on July 1, 2021, the provision of internet map services by any non-surveying and mapping enterprise is subject to the approval of the competent departments of natural resources and requires a Surveying and Mapping Qualification Certificate. internet maps refer to maps called or transmitted through the internet. Pursuant to the Notice on Further Strengthening the Administration of Internet Map Services Qualification issued by the National Administration of Surveying, Mapping and Geo-information in December 2011, any entity without a Surveying and Mapping Qualification Certificate for internet map services is prohibited from providing any internet map services. According to the Provisions on the Administration of Examination of Maps most recently amended on July 24, 2019, subject to limited exceptions, an enterprise must first apply for an approval by the regulatory authority, if it intends to engage in any of the following activities: (i) publication, display, production, posting, import or export of a map or a product attached with a map, (ii) re-publication, re-display, re-production, re-posting, re-import or re-export of a map the content of which has been changed after it is approved, or other commercial products attached with such a map, and (iii) publication or display of a map or a product attached with a map overseas. The operator of an approved internet map is required to file the updated contents of the map with the regulatory authority semiannually, and re-apply for a new approval of the map when the two-year term of the existing approval expires.
Baidu Netcom provides online traffic information inquiry services as well as internet map services and has obtained a Surveying and Mapping Qualification Certificate for internet map services. Another entity in our group has also obtained the Surveying and Mapping Qualification Certificate. In accordance with the Provisions on the Administration of Examination of Maps, we have applied and will apply for examination and approval of the continuously iterative and updated maps that are used in our products.
Regulations on Intellectual Property Rights
The PRC has adopted legislation governing intellectual property rights, including patents, copyrights, trademarks, and domain names.
Patent. The PRC Patent Law provides for patentable inventions, utility models and designs, which must meet three conditions: novelty, inventiveness and practical applicability. The State Intellectual Property Office under the State Council is responsible for examining and approving patent applications. A patent is valid for a term of twenty years in the case of an invention and a term of ten years in the case of utility models and designs.
Copyright. The PRC Copyright Law and its implementation rules extend copyright protection to products disseminated over the internet and computer software. There is a voluntary registration system administered by the China Copyright Protection Center. Creators of protected works enjoy personal and property rights, including, among others, the right of disseminating the works through information networks.
Pursuant to the PRC regulations, rules and interpretations, ICP operators will be jointly liable with the infringer if they (a) participate in, assist in or abet infringing activities committed by any other person through the internet, (b) are or should be aware of the infringing activities committed by their website users through the internet, or (c) fail to remove infringing content or take other action to eliminate infringing consequences after receiving a warning with evidence of such infringing activities from the copyright holder. The court will determine whether an internet service provider should have known of their internet users’ infringing activities based on how obvious the infringing activities are by taking into consideration a number of factors, including (i) the information management capabilities that the provider should have based on the possibility that the services provided by it may trigger infringing acts, (ii) the degree of obviousness of the infringing content, (iii) whether it has taken the initiative to select, edit, modify or recommend the contents involved, (iv) whether it has taken positive and reasonable measures against infringing acts, and (v) whether it has set up convenient
126
Table of Contents
programs to receive notices of infringement and made timely and reasonable responses to the notices. Where an internet service provider has directly obtained economic benefits from any contents made available by an internet user, it should have a higher duty of care with respect to the internet user’s act of infringement of others’ copyrights. Advertisements placed for or other benefits particularly connected with specific contents may be deemed as direct economic benefits from such contents, but general advertising fees or service fees charged by an internet service provider for its internet services will not be included. In addition, where an ICP operator is clearly aware of the infringement of certain content against another’s copyright through the internet, or fails to take measures to remove relevant contents upon receipt of the copyright holder’s notice, and as a result, it damages the public interest, the ICP operator could be ordered to stop the tortious act and be subject to other administrative penalties such as confiscation of illegal income and fines. An ICP operator is also required to retain all infringement notices for a minimum of six months and to record the content, display time and IP addresses or the domain names related to the infringement for a minimum of 60 days.
Pursuant to the Copyright Law and its implementation rules, creators of protected works enjoy personal and property rights such as the right of disseminating the works through information networks. In addition, the Regulations for the Protection of Information Network Transmission Right promulgated by the State Council on May 18, 2006, and amended on January 30, 2013, specify the rules on a safe harbor for use of copyrights and copyright management technology. An internet service provider may be exempted from liabilities for providing links to infringing or illegal content or providing other internet services which are used by its users to infringe others’ copyright, if it does not know and does not have constructive knowledge that such content is infringing upon other parties’ rights or is illegal. However, if the legitimate owner of the content notifies the internet service provider and requests removal of the links to the infringing content, the internet service provider would be deemed to have constructive knowledge upon receipt of such notification, but would be exempted from liabilities if it removes or disconnects the links to the infringing content at the request of the legitimate owner. At the request of the alleged infringer, the internet service provider should immediately restore links to content previously disconnected upon receipt of initial non-infringing evidence.
We have adopted measures to mitigate copyright infringement risks. For example, our policy is to remove links to web pages and materials uploaded by the users if we know these web pages or materials contain materials that infringe upon third-party rights or if we are notified by the legitimate copyright holder of the infringement with proper evidence.
Software Products. The Regulation for the Protection of Computer Software promulgated by the State Council on December 20, 2001 and last amended on January 30, 2013. To further implementing this regulation, the Computer Software Copyright Registration Measures promulgated by the China Copyright Office on February 20, 2002, regulates software copyright registration, exclusive licensing contracts of software copyright and transfer agreements. Although such registration is not mandatory under applicable PRC laws, software copyright owners are encouraged to go through the registration process and registered software may receive better protection.
Trademark. The PRC Trademark Law and its implementation rules protect registered trademarks. The Trademark Office of National Intellectual Property Administration handles trademark registrations and grants a term of ten years to registered trademarks. Trademark license agreements should be filed with the Trademark Office of National Intellectual Property Administration for record. “百度” is recognized as a well-known trademark in China by the Trademark Office of National Intellectual Property Administration. In addition to owning “百度” and the related logos, we have applied for registration of various other trademarks.
Domain name. Domain names are protected under the Administrative Measures on the Internet Domain Names promulgated by the MIIT in August 2017, which became effective in November 2017. The MIIT is the major regulatory body responsible for the administration of the internet domain names of mainland China, and under the supervision of the MIIT, the China Internet Network Information Center is responsible for the daily administration of “.cn” domain names and Chinese domain names. According to the Circular on Administration
127
Table of Contents
of the Use of Domain Names for Internet Information Services issued by the MIIT in November 2017, only the internet information service provider itself or the shareholder(s), principal or senior management officer(s) of the internet information service provider are eligible to register the domain names used for the internet information services. We have registered baidu.cn, baidu.com.cn and certain other domain names with registrars accredited by the China Internet Network Information Center.
Regulations on Information Security
The National People’s Congress has enacted legislation that prohibits use of the internet that breaches the public security, disseminates socially destabilizing content or leaks state secrets. Breach of public security includes breach of national security and infringement on legal rights and interests of the state, society or citizens. Socially destabilizing content includes any content that incites defiance or violations of PRC laws or regulations or subversion of the PRC government or its political system, spreads socially disruptive rumors or involves cult activities, superstition, obscenities, pornography, gambling or violence. State secrets are defined broadly to include information concerning PRC national defense, state affairs and other matters as determined by the PRC authorities.
Pursuant to applicable regulations, ICP operators must complete mandatory security filing procedures and regularly update information security and monitoring systems for their websites with local public security authorities, and must also report any public dissemination of prohibited content.
In December 2015, the Standing Committee promulgated the PRC Anti-Terrorism Law, which took effect on January 1, 2016 and was amended on April 27, 2018. According to the PRC Anti-Terrorism Law, telecommunication service operators or internet service providers must (i) carry out pertinent anti-terrorism publicity and education to society; (ii) provide technical interfaces, decryption and other technical support and assistance for the competent departments to prevent and investigate terrorist activities; (iii) implement network security and information monitoring systems as well as safety and technical prevention measures to avoid the dissemination of terrorism information, delete the terrorism information, immediately halt its dissemination, keep relevant records and report to the competent departments once the terrorism information is discovered; and (iv) examine customer identities before providing services. Any violation of the PRC Anti-Terrorism Law may result in severe penalties, including substantial fines.
In November 2016, the Standing Committee promulgated the PRC Cyber Security Law, which took effect on June 1, 2017. In accordance with the Cyber Security Law, network operators must comply with applicable laws and regulations and fulfill their obligations to safeguard network security in conducting business and providing services. Network service providers must take technical and other necessary measures as required by laws, regulations and mandatory requirements to safeguard the operation of networks, respond to network security effectively, prevent illegal and criminal activities, and maintain the integrity, confidentiality and usability of network data. On September 12, 2022, the CAC released the Decision on Amending the PRC Cyber Security Law (Draft for Comments) to solicit public opinions by September 29, 2022, aiming to further protect the cybersecurity and effectively ensure the alignment between the PRC Cyber Security Law and other newly promulgated laws and regulations. On August 20, 2021, the Standing Committee of the National People’s Congress adopted the PRC Personal Information Protection Law, which took effect on November 1, 2021. The PRC Personal Information Protection Law integrated the scattered rules with respect to personal information rights and privacy protection.
For the further purposes of regulating data processing activities, safeguarding data security, promoting data development and utilization, protecting the lawful rights and interests of individuals and organizations, and maintaining national sovereignty, security, and development interests, on June 10, 2021, Standing Committee published the PRC Data Security Law, which took effect on September 1, 2021. The PRC Data Security Law requires data processing, which includes the collection, storage, use, processing, transmission, provision, publication of data, to be conducted in a legitimate and proper manner. The PRC Data Security Law provides for
128
Table of Contents
data security and privacy obligations on entities and individuals carrying out data activities. The PRC Data Security Law also introduces a data classification and hierarchical protection system based on the importance of data in economic and social development, and the degree of harm it may cause to national security, public interests, or legitimate rights and interests of individuals or organizations if such data are tampered with, destroyed, leaked, illegally acquired or illegally used. The appropriate level of protection measures is required to be taken for each respective category of data. For example, a processor of important data is required to designate the personnel and the management body responsible for data security, carry out regular risk assessments of its data processing activities and file the risk assessment reports with the competent authorities. State core data, i.e. data having a bearing on national security, the lifelines of national economy, people’s key livelihood and major public interests, should be subject to stricter management system. Moreover, the PRC Data Security Law provides a national security review procedure for those data activities which affect or may affect national security and imposes export restrictions on certain data and information. In addition, the PRC Data Security Law also provides that any organization or individual within the territory of mainland China should not provide any foreign judicial body and law enforcement body with any data without the approval of the competent PRC government authorities. As the laws and regulations on the data security and personal information protection of mainland China (including the PRC Data Security Law and the PRC Personal Information Protection Law) are evolving and there still exists uncertainties on the interpretation and implementation of such laws and regulations, we may be required to make further adjustments to our business practices to comply with such laws and regulations.
On July 6, 2021, certain PRC regulatory authorities issued Opinions on Strictly Cracking Down on Illegal Securities Activities, which, among others, provides for improving the laws and regulations on data security, cross-border data transmission, and confidential information management. It provided that efforts will be made to revise the regulations on strengthening the confidentiality and file management relating to the offering and listing of securities overseas, to implement the responsibility on information security of overseas listed companies, and to strengthen the standardized management of cross-border information provision mechanisms and procedures.
On December 28, 2021, the CAC issued the amended Cybersecurity Review Measures, which became effective on February 15, 2022 and replaced the Cybersecurity Review Measures promulgated in April 2020. The scope of review under the Cybersecurity Review Measures extends to critical information infrastructure operators that intend to purchase internet products and services and network platform operators engaging in data processing activities, which affect or may affect national security. According to Article 7 of the Measures, network platform operators who possess personal information of over a million users are required to apply to the Cybersecurity Review Office for cybersecurity reviews before listing in a foreign country. Besides, the Cybersecurity Review Measures also provide that if the authorities consider that certain network products and services and data processing activities affect or may affect national security, the authorities may initiate a cybersecurity review even if the operators do not have an obligation to report for a cybersecurity review under such circumstances. The Cybersecurity Review Measures also elaborate the factors to be considered when assessing the national security risks of the relevant activities, including among others, risks of core data, important data or a large amount of personal information being stolen, leaked, destroyed, and illegally used or illegally exited the country, risks of critical information infrastructure, core data, important data or a large amount of personal information data being affected, controlled and maliciously used by foreign governments after a listing, and risks associated with internet information security.
On November 14, 2021, the CAC released the Regulations on the Network Data Security (Draft for Comments), which were released for public comment before December 13, 2021 and has not been formally promulgated as of the date of this annual report. The draft regulations provide that data processors refer to individuals or organizations that autonomously determine the purpose and the manner of processing data. In accordance with the draft regulations, data processors are required to apply for a cybersecurity review for the following activities: (i) merger, reorganization or division of internet platform operators that have acquired a large number of data resources related to national security, economic development or public interests to the extent that affects or may affect national security; (ii) listing abroad of data processors which process over one
129
Table of Contents
million users’ personal information; (iii) listing in Hong Kong which affects or may affect national security; or (iv) other data processing activities that affect or may affect national security. Besides, data processors that are listed overseas must carry out an annual data security assessment. In addition to the cybersecurity review, the draft regulations requires that data processors processing “important data” or listed overseas should conduct an annual data security assessment by itself or commission a data security service provider to do so, and submit the assessment report of the preceding year to the municipal cybersecurity department by the end of January each year.
On July 30, 2021, the State Council issued the Regulations on Protection of Critical Information Infrastructure. Pursuant to these regulations, critical information infrastructure means the important network facilities or information systems of key industries or fields such as public communication and information service, energy, transportation, water conservation, finance, public services, e-government affairs and national defense science, and important network facilities or information systems which may endanger national security, people’s livelihood and public interest once there occur damage, malfunctioning or data leakage to them. These regulations provide that no individual or organization may carry out any illegal activity of intruding into, interfering with, or sabotaging any critical information infrastructures, or endanger the security of any critical information infrastructures. The regulations also require that critical information infrastructure operators must establish a cybersecurity protection system and accountability system, and that the main responsible person of a critical information infrastructure operator should take full responsibility for the security protection of the critical information infrastructures operated by it. In addition, administration departments of each important industry and sector should be responsible for formulating the rule of critical information infrastructure determination applicable to their respective industry or sector, and determine the critical information infrastructure operators in their industry or sector.
On July 12, 2021, the MIIT and two other authorities jointly issued the Provisions on the Administration of Security Vulnerabilities of Network Products. Such provisions state that, no organization or individual may abuse the security vulnerabilities of network products to engage in activities that endanger network security, or to illegally collect, sell, or publish the information on such security vulnerabilities. Anyone who is aware of the aforesaid offenses should not provide technical support, advertising, payment settlement and other assistance to the offenders. According to the Provisions, network product providers, network operators, and platforms collecting network product security vulnerabilities must establish and improve channels for receiving network product security vulnerability information and keep such channels available, and retain network product security vulnerability information reception logs for at least six months. The Provisions also bans provision of undisclosed vulnerabilities to overseas organizations or individuals other than to the product providers.
On July 7, 2022, the CAC promulgated the Measures for the Security Assessment of Cross-border Data Transfer, which became effective on September 1, 2022. In accordance with these measures, data processors will be subject to security assessment conducted by the CAC prior to any cross-border transfer of data if the transfer involves (i) important data; (ii) personal information transferred overseas by operators of critical information infrastructure or a data processor that has processed personal data of more than one million persons; (iii) personal information transferred overseas by a data processor who has already provided personal data of 100,000 persons or sensitive personal data of 10,000 persons overseas since January 1 of last year; or (iv) other circumstances as requested by the CAC. Furthermore, data processors are required to conduct self-assessment on the risks of cross-border data transfer prior to their applying for the security assessment and focus on assessment of the following significant matters, including, among others: (i) the legality and necessity of the purpose, scope and method of cross-border data transfer; (ii) the scale, scope, type and sensitivity of data transferred overseas, and risks to the national security, public interests or legitimate rights of individuals or organizations caused by such cross-border data transfer; (iii) the responsibilities and obligations that the overseas recipient of such data promises to undertake, and whether such overseas recipient’s management and technical measures and capabilities for performing its responsibilities and obligations can guarantee the security of cross-border data transfer; (iv) the risks that the data transferred overseas may be falsified, destroyed, divulged, lost, transferred, illegally obtained or illegally used during and after the cross-border transfer; (v) whether contracts or other
130
Table of Contents
legally binding documents entered into with the overseas recipient have fully stipulated the responsibilities and obligations to protect data security. In addition, any cross-border data transfer activities conducted in violation of the Measures for the Security Assessment of Cross-border Data Transfer before the effectiveness of such measures are required to be rectified within six months of the effectiveness date thereof.
In addition, the State Secrecy Bureau has issued provisions authorizing the blocking of access to any website it deems to be leaking state secrets or failing to comply with the legislation regarding the protection of state secrets during online information distribution. Specifically, internet companies in mainland China with bulletin boards, chat rooms or similar services must apply for specific approval prior to operating such services.
Furthermore, the Provisions on Technological Measures for Internet Security Protection, promulgated by the Ministry of Public Security and became effective in March 2006, require all ICP operators to keep records of certain information about its users (including user registration information, log-in and log-out time, IP address, content and time of posts by users) for at least 60 days and submit the above information as required by laws and regulations. The Decision on Strengthening Network Information Protection, which was promulgated by the PRC National People’s Congress in December 2012, states that ICP operators must request identity information from users when ICP operators provide information publication services to the users. If ICP operators come across prohibited information, they must immediately cease the transmission of such information, delete the information, keep relevant records, and report to the government authorities.
On October 21, 2019, the Supreme People’s Court and the Supreme People’s Procuratorate of the PRC jointly issued the Interpretations on Certain Issues Regarding the Applicable of Law in the Handling of Criminal Case Involving Illegal Use of Information Networks and Assisting Committing Internet Crimes, which came into effect on November 1, 2019, and further clarifies the meaning of Internet service provider and the severe situations of the relevant crimes.
Regulations on Internet Privacy
The PRC Constitution states that PRC law protects the freedom and privacy of communications of citizens and prohibits infringement of these rights. In recent years, PRC government authorities have enacted legislation on internet use to protect personal information from any unauthorized disclosure. The Decision on Strengthening Network Information Protection provides that electronic information that identifies a citizen or involves privacy of any citizen is protected by law and must not be unlawfully collected or provided to others. ICP operators collecting or using personal electronic information of citizens must specify the purposes, manners and scopes of information collection and uses, obtain consent of the relevant citizens, and keep the collected personal information confidential. ICP operators are prohibited from disclosing, tampering with, damaging, selling or illegally providing others with, collected personal information. ICP operators are required to take technical and other measures to prevent the collected personal information from any unauthorized disclosure, damage or loss. The Administrative Measures on Internet Information Services prohibit an ICP operator from insulting or slandering a third party or infringing upon the lawful rights and interests of a third party. According to the Provisions on Protection of Personal Information of Telecommunication and Internet Users, which was promulgated by the MIIT and became effective in September 2013, telecommunication business operators and ICP operators are responsible for the security of the personal information of users they collect or use in the course of their provision of services. Without obtaining the consent from the users, telecommunication business operators and ICP operators may not collect or use the users’ personal information. The personal information collected or used in the course of provision of services by the telecommunication business operators or ICP operators must be kept in strict confidence, and may not be divulged, tampered with or damaged, and may not be sold or illegally provided to others. The ICP operators are required to take certain measures to prevent any divulgence of, damage to, tampering with or loss of users’ personal information. In accordance with the PRC Cyber Security Law, network operators are required to collect and use personal information in compliance with the principles of legitimacy, properness and necessity, and strictly within the scope of authorization by the subject of personal information unless otherwise prescribed by laws or regulations. In the event of any
131
Table of Contents
unauthorized disclosure, damage or loss of collected personal information, network operators must take immediate remedial measures, notify the affected users and report the incidents to the authorities in a timely manner. If any user knows that a network operator illegally collects and uses his or her personal information in violation of laws, regulations or any agreement with the user, or the collected and stored personal information is inaccurate or wrong, the user has the right to request the network operator to delete or correct the relevant collected personal information.
The telecommunications authorities are further authorized to order ICP operators to rectify unauthorized disclosure. ICP operators are subject to legal liability, including warnings, fines, confiscation of illegal gains, revocation of licenses or filings, closing of websites, administrative punishment, criminal liabilities, or civil liabilities, if they violate the provisions on internet privacy. Pursuant to the Ninth Amendment to the Criminal Law issued by the Standing Committee in August 2015 and becoming effective in November 2015, the standards of crime of infringing citizens’ personal information were amended accordingly and the criminal culpability of unlawful collection, transaction, and provision of personal information has been reinforced. In addition, any ICP provider that fails to fulfill the obligations related to internet information security administration as required by applicable laws and refuses to rectify upon orders, will be subject to criminal liability for (i) any dissemination of illegal information in large scale; (ii) any severe effect due to the leakage of the client’s information; (iii) any serious loss of evidence of criminal activities; or (iv) other severe situations, and any individual or entity that (x) sells or provides personal information to others unlawfully, or (y) steals or illegally obtains any personal information, will be subject to criminal liability in severe situations. In addition, the Interpretations of the Supreme People’s Court and the Supreme People’s Procuratorate of the PRC on Several Issues Concerning the Application of Law in Handling Criminal Cases of Infringing Personal Information, effective in June 2017, have clarified certain standards for the conviction and sentencing in relation to personal information infringement. The PRC government has the power and authority to order ICP operators to turn over personal information if an internet user posts any prohibited content or engages in illegal activities on the internet. The PRC Civil Code further provides in a stand-alone chapter of right of personality and reiterate that the personal information of a natural person shall be protected by the law. Any organization or individual should legitimately obtain such personal information of others in due course on a need-to-know basis and ensure the safety and privacy of such information, and refrain from excessively handling or using such information.
With respect to the security of information collected and used by mobile apps, pursuant to the Announcement of Conducting Special Supervision against the Illegal Collection and Use of Personal Information by Apps, which was issued on January 23, 2019, app operators should collect and use personal information in compliance with the PRC Cyber Security Law and should be responsible for the security of personal information obtained from users and take effective measures to strengthen the personal information protection. Furthermore, app operators should not force their users to make authorization by means of bundling, suspending installation or in other default forms and should not collect personal information in violation of laws, regulations or breach of user agreements. Such regulatory requirements were emphasized by the Notice on the Special Rectification of Apps Infringing upon User’s Personal Rights and Interests, which was issued by the MIIT on October 31, 2019. On November 28, 2019, the CAC, the MIIT, the Ministry of Public Security and the SAMR jointly issued the Methods of Identifying Illegal Acts of Apps to Collect and Use Personal Information. This regulation further illustrates certain commonly-seen illegal practices of apps operators in terms of personal information protection, including “failure to publicize rules for collecting and using personal information,” “failure to expressly state the purpose, manner and scope of collecting and using personal information,” “collection and use of personal information without consent of users of such App,” “collecting personal information irrelevant to the services provided by such app in violation of the principle of necessity,” “provision of personal information to others without users’ consent,” “failure to provide the function of deleting or correcting personal information as required by laws” and “failure to publish information such as methods for complaints and reporting.” Among others, any of the following acts of an app operator will constitute “collection and use of personal information without consent of users”: (i) collecting an user’s personal information or activating the permission for collecting any user’s personal information without obtaining such user’s consent; (ii) collecting personal information or activating the permission for collecting the personal information of any user who explicitly refuses such
132
Table of Contents
collection, or repeatedly seeking for user’s consent such that the user’s normal use of such app is disturbed; (iii) any user’s personal information which has been actually collected by the app operator or the permission for collecting any user’s personal information activated by the app operator is beyond the scope of personal information which such user authorizes such app operator to collect; (iv) seeking for any user’s consent in a non-explicit manner; (v) modifying any user’s settings for activating the permission for collecting any personal information without such user’s consent; (vi) using users’ personal information and any algorithms to directionally push any information, without providing the option of non-directed pushing such information; (vii) misleading users to permit collecting their personal information or activating the permission for collecting such users’ personal information by improper methods such as fraud and deception; (viii) failing to provide users with the means and methods to withdraw their permission of collecting personal information; and (ix) collecting and using personal information in violation of the rules for collecting and using personal information promulgated by such app operator.
On August 22, 2019, the CAC promulgated the Children Information Protection Provisions, which took effect on October 1, 2019, requiring that before collecting, using, transferring or disclosing the personal information of a child, the internet service operator should inform the child’s guardians in a noticeable and clear manner and obtain their consents. Meanwhile, internet service operators should take measures like encryption when storing children’s personal information. On March 12, 2021, the CAC and three other authorities jointly issued the Rules on the Scope of Necessary Personal Information for Common Types of Mobile Internet Applications. The Rules specifies the scope of necessary personal information to be collected each for a variety of common mobile internet applications, such as maps and navigation apps, online ride-hailing apps, instant messaging apps, online community apps. Operators of such apps should not refuse to provide basic services to users on the ground of users’ refusal to provide their personal non-essential information.
On August 20, 2021, the Standing Committee adopted the PRC Personal Information Protection Law which took effect on November 1, 2021. The PRC Personal Information Protection Law integrates provisions from several rules with respect to personal information rights and privacy protection. According to the PRC Personal Information Protection Law, personal information refers to information related to identified or identifiable natural persons which is recorded by electronic or other means (excluding the anonymized information). The PRC Personal Information Protection Law provides the circumstances under which a personal information processor could process personal information, such as where the consent of the individual concerned is obtained and where it is necessary for the conclusion or performance of a contract to which such individual is a party to such contract. In addition, it imposes further obligations on a personal information processor that provides for basic internet platform services, has large amount of users, has complicated business activities, including, among others, formulating of an independent institution mainly comprising of outside members to supervise personal information processing activities, termination of provision of services for product or service providers on the platform whose personal information processing activities are in material violation of laws and regulations, and issuing personal information protection social responsibilities reports regularly. The PRC Personal Information Protection Law also requires, among others, that (i) the processing of personal information should have a clear and reasonable purpose which should be directly related to the processing purpose, in a method that has the least impact on personal rights and interests, and (ii) the collection of personal information should be limited to the minimum scope necessary to achieve the processing purpose to avoid the excessive collection of personal information. Different types of personal information and personal information processing will be subject to various rules on consent, transfer, and security. Entities handling personal information should bear responsibilities for their personal information handling activities, and adopt necessary measures to safeguard the security of the personal information they handle. The entities failing to comply could be ordered to correct, or suspend or terminate the provision of services, and face confiscation of illegal income, fines or other penalties.
On December 8, 2022, the MIIT issued the Administrative Measures on Industry and Information Technology Data Security (Trial Implementation), which took effect on January 1, 2023. According to such administrative measures, based on the degree of potential damage to national security, public interests or the legitimate rights and interests of individuals and organizations caused by tampering with, destruction, leakage or
133
Table of Contents
illegal acquisition or use of the data, industry and information technology data are classified into three categories, i.e., general data, important data and core data. Industry and information technology data processors are required to file the catalogs of their important data and core data with the local industrial government authorities for record. Furthermore, processors of important data and core data must, on their own or by entrusting third-party evaluation agencies, conduct risk assessment on their data processing activities at least once a year and submit risk assessment reports to the local industrial government authorities.
Regulations on Anti-Monopoly Matters related to Internet Platform Companies
The PRC Anti-monopoly Law, which was promulgated on August 1, 2008 and most recently amended on June 24, 2022, prohibits monopolistic conduct such as entering into monopoly agreements, abusing market dominance and concentration of undertakings conducted illegally that may have the effect of eliminating or restricting competition. The amended PRC Anti-monopoly Law increases the fines for illegal concentration of business operators to “no more than ten percent of its preceding year’s sales revenue if the concentration of business operator has or may have an effect of excluding or limiting competition; or a fine of up to RMB5 million if the concentration of business operator does not have an effect of excluding or limiting competition.” The amended PRC Anti-monopoly Law also proposes for the authority to investigate any concentration where there is evidence that such concentration has or may have the effect of eliminating or restricting competition, even if such concentration does not reach the filing threshold. In addition, the amended PRC Anti-monopoly Law introduces a “stop-clock mechanism” which may prolong the review process for the concentration.
On January 22, 2024, the State Council released the Provisions of the State Council on the Threshold for the Filing of Concentration of Undertakings mainly to optimize the filing standard. These provisions significantly adjust the revenue threshold of merger control filing to either one of the following two conditions: (i) the worldwide revenue of all business operators involved in the concentration exceeds RMB12 billion (increased from the previous threshold of RMB10 billion) collectively in the last fiscal year, and the revenue in mainland China of at least two business operators among them each exceeds RMB800 million (increased from the previous threshold of RMB400 million) in the last fiscal year; or (ii) the revenue in mainland China of all the business operators involved in the concentration exceeds RMB4 billion (increased from the current threshold of RMB2 billion) collectively in the last fiscal year, and the revenue in mainland China of at least two business operators among them each exceeds RMB800 million (increased from the current threshold of RMB400 million) in the last fiscal year. Furthermore, if there is evidence indicating that the concentration of business operator has or may have an effect of excluding or limiting competition, the anti-monopoly authority may order the operators to file for clearance, regardless of the threshold standard.
On February 7, 2021, the Anti-monopoly Commission of the State Council officially promulgated the Guidelines to Anti-Monopoly in the Field of Internet Platforms. Pursuant to an official interpretation from the Anti-monopoly Commission of the State Council, these guidelines mainly cover five aspects, including general provisions, monopoly agreements, abusing market dominance, concentration of undertakings, and abusing of administrative powers eliminating or restricting competition. These guidelines prohibit certain monopolistic acts of internet platforms so as to protect market competition and safeguard interests of consumers and undertakings participating in internet platform economy, including, without limitation, prohibiting platforms with dominant position from abusing their market dominance (such as discriminating customers in terms of pricing and other transactional conditions using big data and analytics, coercing counterparties into exclusivity arrangements through entering into written or oral agreements or using technology means to block competitors’ interface or reduce positions in search results of goods displays, using bundle services to sell different services or products, compulsory collection of unnecessary user data). In addition, the guidelines also reinforce antitrust merger review for internet platform related transactions to safeguard market competition.
134
Table of Contents
Regulations on Internet Drug Information Services
According to the Provisions on the Administration of Internet Drug Information Services, which were promulgated by the State Food and Drug Administration and most recently amended in November 2017, an enterprise publishing drug-related information must obtain a qualification certificate from the provincial-level food and drug administration before it applies for the ICP license or files with the MIIT or its local provincial-level counterpart. In addition, the Standing Committee further amended the Drug Administration Law on August 26, 2019, which became effective on December 1, 2019. An ICP service operator that provides information regarding drugs or medical devices must obtain an Internet Drug Information Service Qualification Certificate from the applicable provincial level administrative authority.
Baidu Netcom firstly obtained the Qualification Certificate for Internet Drug Information Services in November 2007. On December 21, 2021, to comply with the requirements of the competent government authorities in Beijing, Baidu Netcom obtained the Filing Certificate for Internet Drug and Medical Devices Information Services to replace the Qualification Certificate for Internet Drug Information Services, and such filing certificate of Baidu Netcom has been renewed on June 13, 2022. In addition, we have several other entities in our group that have obtained the Qualification Certificate for Internet Drug Information Services.
Regulations on Internet Healthcare
According to the Guiding Opinions on Vigorously Advancing the “Internet Plus” Action issued by the State Council on July 1, 2015, internet enterprises are encouraged to cooperate with medical institutions in establishing online medical information platforms, strengthen the integration of regional health care service resources, and make full use of the internet, Big Data and other means to improve the capability to prevent and control major diseases and unexpected public health incidents. The General Office of the State Council issued the Opinions on Promoting the Development of “Internet Plus Health Care” on April 25, 2018, which encouraged medical institutions to apply the internet and other information technologies to expand the space and content of medical services, and develop an online-offline integrated medical service model covering stages before, during and after diagnosis. The development of internet hospitals depending on medical institutions should be permitted. Medical institutions may use internet hospital as the second name and, based on physical hospitals, use internet technology to provide safe and appropriate medical services, allowing online re-diagnosis for some common diseases and chronic diseases. After reviewing documents of the medical records and profiles of patients, doctors should be allowed to prescribe online for some common diseases and chronic diseases.
According to the Measures for the Administration of Internet Hospitals (for Trial Implementation) issued on July 17, 2018, any entity applying for establishment of an internet hospital is required to submit an application to the competent registration authority of the physical medical institution supporting such internet hospital, and submit the application form, the feasibility research report on establishment of such internet hospital, the address of the physical medical institution supporting such internet hospital, and the agreement jointly signed by the applicant and the physical medical institution in relation to establishment of an internet hospital through cooperation. If a physical medical institution intends to establish an internet hospital information platform through cooperation with a third-party institution, the relevant cooperation agreement should be submitted to competent registration authority of such physical medical institution. The Measures for the Administration of Internet Hospitals (for Trial Implementation) also clarify that internet hospitals must adopt information security protection measures for Level 3 information system in accordance with the information security laws and regulations. Doctors can only provide follow-up diagnosis services through internet hospitals for patients that have been diagnosed with certain common diseases or chronic diseases, unless the patients are in physical hospitals and the doctors in the physical hospital invites other doctors to provide diagnosis services through internet hospital.
According to the Measures for the Administration of Internet Diagnosis and Treatment (for Trial Implementation) issued on July 17, 2018, internet diagnosis and treatment activities must be provided by the
135
Table of Contents
medical institutions that have obtained a “Practicing License for Medical Institution.” If a medical institution intends to establish an information and services platform for internet diagnosis and treatment activities through cooperation with a third-party institution, the relevant cooperation agreement should be submitted to competent registration authority of such medical institution. The internet-based diagnosis services provided by a medical institution must be consistent with its diagnosis and treatment subjects. Physicians and nurses carrying out internet diagnosis and treatment activities should be recorded and registered in the national electronic registration system of physicians and nurses. A medical institution must conduct electronic real-name verification for the medical staff members carrying out internet diagnosis and treatment activities.
Regulations on Online Games
Pursuant to the Administrative Provisions on Internet Publishing Service and the Circular on Mobile Game Publishing Service, the online games services provided on websites by online game operator partners may be deemed as a type of “online publication service,” and may be required to obtain an Internet Publication License from the NPPA. The required approval by the NNPA of each online game provided on our websites is handled by our online game operator partners.
In September 2009, the General Administration of Press and Publication (currently known as the NPPA) together with several other government agencies issued Notice Regarding the Consistent Implementation of the “Measures on Three Provisions” of the State Council and the Relevant Interpretations of the State Commission Office for Public Sector Reform and the Further Strengthening of the Administration of Examination and Approval of Online Games and the Examination and Approval of Imported Online Games, or the Circular 13, which explicitly prohibits foreign investors from participating in online game operating businesses through wholly-owned enterprises, equity joint ventures or cooperative joint ventures in mainland China. Circular 13 expressly prohibits foreign investors from gaining control over or participating in mainland China operating companies’ online game operations through indirect means, such as establishing joint venture companies, entering into contractual arrangements with or providing technical support to the operating companies, or through a disguised form, such as incorporating user registration, user account management or payment through game cards into online game platforms that are ultimately controlled or owned by foreign investors. Certain foreign companies offer online games provided by their game operator partners on websites or through smartphone app distribution platforms which are owned and operated by their variable interest entities under contractual agreements. If such contractual arrangements were deemed to be “indirect means” or “disguised form” under Circular 13, such contractual arrangements may be challenged by the NPPA or other government authorities. If we were found to be in violation of Circular 13 in the operation of our online game platform, the NNPA, in conjunction with the regulatory authorities, would have the power to investigate and deal with such violations, including in the most serious cases, suspending and revoking the relevant licenses and registrations.
In October 2019, the NPPA promulgated the Circular on Preventing Minors from Developing Online Game Addictions, which mandates that online game operators take, among others, the following measures to prevent minors from being addicted to online games: (i) the operator must ensure that its online game users use valid and true identity information to register their game accounts; (ii) the operator must strictly control the time slot and duration allowed for minors to log in and play online games to the extent that it should not provide any game service for the minors in any form from 10:00 PM each day to 8:00 AM the next day, and the length of time a minor spends in playing its online games must not exceed three hours accumulatively on each statutory holiday and one and a half hours on each business day; and (iii) the online game operator should not offer any paid services to minors that are not suitable for their civil capacity. According to such circular, these requirements are pre-conditions for an operator to publish and operate any online game.
On August 30, 2021, the NPPA issued the Circular of the National Press and Publication Administration on Further Strengthening Regulation to Effectively Prevent Online Gaming Additions among Minors, which became into effect on September 1, 2021. After the effective date of this Circular, online game companies must provide minors only with one hour of online game services at prescribed periods, namely between 8 pm and 9 pm on
136
Table of Contents
Fridays, Saturdays, Sundays and public holidays. The Circular reinstates that online game companies must strictly implement the real-name registration and login requirements for online game user accounts. All online games should be connected to the NPPA’s real-name verification system for anti-online game addiction purpose. Online game users should use real and valid identity information to register for game accounts and log in to online games. Online game companies should not provide gaming services in any form (including visitor experience mode) to users who have not registered or logged in with their real names.
On December 22, 2023, the NPPA issued the Draft Administrative Measures on Online Games for public comment until January 22, 2024, which stipulates, among others, (i) not only that the publishers of online games shall obtain the Internet Publication Licenses, the operators engaged in online game business operations such as online game operation and online game coin issuance and trading services shall also obtain the Internet Publication Licenses with the scope of the online game business operations; (ii) publishers and operators of the online game shall carry out the game publication and operation within one year from the date of obtaining the online game approval, or otherwise they shall timely explain the reasons in writing to the competent government authority; (iii) compulsory battles, inducement rewards for daily login, first recharge and continuous recharge, and rewards in large amounts in online game live-streaming shall be prohibited in online games; (iv) publishers and operators of online games shall not provide or connive at high-price trading of virtual items in the form of speculation or auction, shall set the limit of user recharge and publicize such limitations in the service rules of online games, and shall provide pop-up warning to users for irrational consumption behaviors; (v) online game publishers and operators shall submit written annual report to the competent government authority in accordance with applicable regulations, which shall include, among others, the implementation of online game management laws and policies, rewards and punishments, the performance of online game publishing and operation, the issuance and trade of online game coins, and the internal management of the current year.
Regulations on Online Game Virtual Currency
The Interim Administration Measures of Online Games, which has been repealed on July 10, 2019 (while no other regulation has been issued or promulgated as of the date of this annual report to replace this regulation) require companies that (i) issue online game virtual currency (including prepaid cards and/or pre-payment or prepaid card points) or (ii) offer online game virtual currency transaction services to apply for the Internet Culture Business Permit from provincial branches of the Ministry of Culture. The regulations prohibit companies that issue online game virtual currency from providing services that would enable the trading of such virtual currency. Any company that fails to submit the requisite application will be subject to sanctions, including, but not limited to, termination of operation, confiscation of incomes and fines. The regulations also prohibit online game operators from allocating virtual items or virtual currency to players based on random selection through lucky draw, wager or lottery that involve cash or virtual currency directly paid by the players. In addition, companies that issue online game virtual currency must comply with certain specific requirements. For example, online games virtual currency can only be used for products and services related to the issuance company’s own online games. Pursuant to the Circular on Regulating Online Game Operation and Strengthening Interim and Ex Post Supervision issued by the Ministry of Culture in December 2016, which took effect on May 1, 2017 and repealed on August 19, 2019, an online game operator must not allow online game virtual currency to exchange for legal currency or items, except in the case of termination of online game operation where the online game operator may refund the balance of online game virtual currency to players in the form of legal currency or in other means acceptable to the players. Moreover, pursuant to the circular, regulations applicable to online game virtual currency also apply to such other virtual items where the virtual items are issued by the online game operator, can be exchangeable for other virtual items or value-added services related to the games, and can be purchased with legal currency or online game virtual currency or exchanged for online game virtual currency.
On December 22, 2023, the NPPA issued the Draft Administrative Measures on Online Games for public comment, pursuant to which, one enterprise shall not engage in the issuance and trading service of online game currency at the same time. With respect to the issuance of online game coins, the Draft Administrative Measures on Online Games emphasizes again that: (i) online game coins shall only be used to the extent of the exchange of
137
Table of Contents
online game products and services provided by such issuers, and shall not be used for payment, purchase of physical items or exchange of products and services of other service providers; (ii) the issuance of online game coins shall not be issued for purpose of maliciously occupying players’ prepaid funds, and the standards for the issuance and purchase of online game coins shall be transparent and reasonable; and (iii) the service of exchanging online game coins for legal currency shall be prohibited. With respect to the trading service of online game coins, the Draft Administrative Measures on Online Games provides that, among others, (i) trading services shall not be provided for any unapproved online games; (ii) anonymous digital RMB wallets shall be prohibited from being provided to players; and (iii) technical measures shall be taken to effectively supervise the transaction process, and the transactions with illegal and suspicious behaviors shall be reported to the competent government authority in a timely manner to avoid convenience for online gambling, online fraud and other illegal behaviors. In addition, according to the Draft Administrative Measures on Online Games, virtual items issued by online game publishers and operators, which are directly purchased by players with legal currency, purchased or exchanged by players with online game coins, and which can be directly exchanged into other virtual items or value-added services in the games, shall be regulated as online game coins. Publishers and operators of online games shall not convert virtual items of online games obtained by players into legal currency.
Regulations on Overseas Offering and Listing
On July 6, 2021, the PRC government authorities issued Opinions on Strictly Cracking Down Illegal Securities Activities in Accordance with the Law. These opinions emphasized the need to strengthen the administration over illegal securities activities and the supervision on overseas listings by mainland China-based companies and proposed to take effective measures, such as promoting the construction of the regulatory systems to deal with the risks and incidents faced by mainland China-based overseas-listed companies.
On December 27, 2021, the NDRC and the MOC jointly issued the Special Administrative Measures (Negative List) for Foreign Investment Access (2021 Version), which became effective on January 1, 2022. Pursuant to such measures, if a domestic company engaging in the prohibited business stipulated in the 2021 negative list seeks an overseas offering and listing, it must obtain the approval from the competent government authorities. Besides, the foreign investors of the company should not be involved in the company’s operation and management, and their shareholding percentage are subject, mutatis mutandis, to the regulations on the domestic securities investments by foreign investors.
On February 17, 2023, the CSRC, as approved by the State Council, released the Trial Administrative Measures of Overseas Securities Offering and Listing by Domestic Companies and five supporting guidelines, or the Filing Rules collectively. According to the Filing Rules, domestic companies in mainland China that directly or indirectly offer or list their securities in an overseas market, are required to file with the CSRC. Specifically, the securities under the Filing Rules refer to stocks, depositary receipts, convertible corporate bonds, exchangeable bonds and other equity-linked securities to be issued and offered in overseas markets by domestic companies directly or indirectly, while a direct offering and listing refers to the overseas offering and listing of a joint-stock company incorporated in mainland China, and an indirect offering and listing refers to the overseas offering and listing of a domestic company which conducts its business operations primarily in mainland China, in the name of an offshore company and based on the underlying equities, assets, earnings or similar interests of the domestic company. In particular, the determination of an indirect offering and listing will be conducted on a “substance over form” basis, and an offering and listing should be considered as an indirect overseas offering and listing by a domestic company if the issuer meets both of the following conditions: (i) any of the revenue, profits, total assets or net assets of such domestic company in the most recent financial year account for more than 50% of the corresponding data in the issuer’s audited consolidated financial statements for the same period; and (ii) the majority of its business operations are conducted in mainland China or its principal place of business is located in mainland China, or the majority of senior management in charge of business operations are Chinese citizens or have domicile in the mainland China. According to the Filing Rules, an overseas offering and listing is prohibited under any of the following circumstances: (i) if the intended securities offering and listing is specifically prohibited by the laws, administrative regulations and national provisions; (ii) if the intended
138
Table of Contents
securities offering and listing may constitute a threat to or endangers national security as reviewed and determined by competent authorities under the State Council in accordance with law; (iii) the domestic companies or their controlling shareholders or actual controllers have committed corruption, bribery, embezzlement, misappropriation of property, or other criminal offenses disruptive to the order of the socialist market economy in the past three years; (iv) the domestic companies are currently under investigations in connection with suspicion of having committed criminal offenses or material violations of applicable laws and regulations, and there is still no explicit conclusion; (v) there are material ownership disputes over the shareholdings held by the controlling shareholder or the shareholder under the control of the controlling shareholder or the actual controllers.
According to the Filing Rules, the issuer or its affiliated domestic company, as the case may be, is required to file with the CSRC (i) with respect to its initial public offering and listing and its subsequent securities offering in an overseas market different from the market where it has listed, within three business days after its submission of listing application documents to the regulator in the place of intended listing, (ii) with respect to its follow-on offering in the same overseas market where it has listed (including issuance of any corporate convertible bonds, exchangeable bonds and other equity-linked securities, but excluding the offering for employees incentive, dividend distribution by shares and share split), within three business days after completion of such follow-on offering, (iii) with respect to listing by means of single or multiple acquisitions, share swap, transfers of shares and similar transactions, within three business days after its initial filing of the listing application or the first public announcement of the transaction, as case may be. Failure to comply with the filing requirements may result in an order of rectification, a warning and fines up to RMB10 million to the non-compliant domestic companies, and the directly responsible persons of the companies will be warned and fined between RMB500,000 and RMB5 million. Furthermore, if the controlling shareholder and the actual controller of the non-compliant companies organizes or instigates the breach, they will be fined between RMB1 million and RMB10 million. In addition to above filing requirements, the Filings Rules also requires an issuer to report to the CSRC within three business days after occurrence of any the following events: (i) its change of control; (ii) its being subject to investigation or sanctions by any overseas securities regulators or overseas authorities; (iii) its change of listing status or listing segment; (iv) voluntary or mandatory delisting; and (v) material change of its principal business operations to the extent that it ceases to be subject to the filing requirements of the Filing Rules.
On February 24, 2023, the CSRC, jointly with other government authorities, promulgated the revised Provisions on Strengthening Confidentiality and Archives Management of Overseas Securities Issuance and Listing by Domestic Enterprises, effective on March 31, 2023. According to these provisions, domestic companies, whether offering and listing securities overseas directly or indirectly, must strictly abide by the applicable laws and regulations, enhance the sense of confidentiality, improve the archives management system, and take necessary measures to implement the confidentiality and archives management responsibilities when providing or publicly disclosing, either directly or through their overseas listed entities, documents and materials to securities services providers such as securities companies and accounting firms or overseas regulators in the process of their overseas offering and listing. In the event that such documents or materials contain any information related to state secrets or government authorities work secrets, domestic companies must obtain the approval from competent government authorities according to the applicable laws, and file with the secrecy administrative department at the same level with the approving government authority; and in the event that such documents or materials, if divulged, will jeopardize national security or public interest, domestic companies should strictly fulfill the procedures stipulated by applicable laws and regulations. Furthermore, domestic companies should also provide a written statement about whether they have completed the approval or filing procedures as above when providing documents and materials to securities companies and securities service providers, and the securities companies and securities service providers should properly retain such written statements for inspection.
Securities companies and securities service providers shall also fulfill the applicable legal procedures according to the revised Provisions on Strengthening Confidentiality and Archives Management of Overseas
139
Table of Contents
Securities Issuance and Listing by Domestic Enterprises when providing overseas regulatory institutions and other institutions and individuals with documents or materials containing any state secrets or government authorities work secrets or other documents or materials that, if divulged, will jeopardize national security or public interest.
Regulations on Foreign Exchange
Foreign Currency Exchange. Pursuant to the Foreign Currency Administration Rules, as most recently amended in 2008, and various regulations issued by SAFE and other PRC government authorities, RMB is freely convertible to the extent of current account items, such as trade related receipts and payments, interest and dividends. Capital account items, such as direct equity investments, loans and repatriation of investment, unless expressly exempted by laws and regulations, still require prior approval from SAFE or its provincial branch for conversion of RMB into a foreign currency, such as U.S. dollars, and remittance of the foreign currency outside of mainland China.
In August 2008, SAFE issued the Circular on the Relevant Operating Issues Concerning the Improvement of the Administration of the Payment and Settlement of Foreign Currency Capital of Foreign-Invested Enterprises, or SAFE Circular 142, regulating the conversion by a foreign-invested enterprise of foreign currency-registered capital into RMB by restricting how the converted RMB may be used. In addition, SAFE promulgated Circular 45 on November 9, 2011 in order to clarify the application of SAFE Circular 142. Under SAFE Circular 142 and Circular 45, the RMB capital converted from foreign currency registered capital of a foreign-invested enterprise may only be used for purposes within the business scope approved by the applicable administrative authority and may not be used for equity investments within mainland China. In addition, SAFE strengthened its oversight of the flow and use of RMB capital converted from foreign currency registered capital of foreign-invested enterprises. The use of RMB capital may not be changed without SAFE’s approval, and RMB capital may not in any case be used to repay RMB loans if the proceeds of the loans have not been used.
To further reform the foreign exchange administration system in order to satisfy and facilitate the business and capital operations of foreign-invested enterprises, SAFE issued the Circular on the Relevant Issues Concerning the Launch of Reforming Trial of the Administration Model of the Settlement of Foreign Currency Capital of Foreign-Invested Enterprises in Certain Areas in July 2014, which became effective on August 4, 2014. This circular suspends the application of SAFE Circular 142 in certain areas and allows a foreign-invested enterprise registered in these areas with a business scope including “investment” to use the RMB capital converted from foreign currency registered capital for equity investments within mainland China. SAFE released the Notice on the Reform of the Administration Method for the Settlement of Foreign Exchange Capital of Foreign-invested Enterprises or SAFE Circular 19, in March 2015, which came into force and superseded SAFE Circular 142 on June 1, 2015. Circular 19 allows foreign-invested enterprises to settle their foreign exchange capital on a discretionary basis according to the actual needs of their business operation and provides the procedures for foreign-invested companies to use Renminbi converted from foreign currency-denominated capital for equity investment. Nevertheless, Circular 19 also reiterates the principle that Renminbi converted from foreign currency-denominated capital of a foreign-invested company may not be directly or indirectly used for purposes beyond its business scope.
In June 2016, SAFE issued the Circular on Reforming and Regulating Policies on the Control over Foreign Exchange Settlement of Capital Accounts, or Circular 16, which took effect on the same day. Compared to Circular 19, Circular 16 provides that discretionary foreign exchange settlement applies to foreign exchange capital, foreign debt offering proceeds and remitted foreign listing proceeds, and the corresponding Renminbi obtained from foreign exchange settlement are not restricted from extending loans to related parties or repaying the intercompany loans (including advances by third parties). However, there still exist substantial uncertainties with respect to the interpretation and implementation of Circular 16 in practice.
In November 2012, SAFE promulgated the Circular of Further Improving and Adjusting Foreign Exchange Administration Policies on Direct Investment, as amended, which substantially amends and simplifies the foreign
140
Table of Contents
exchange procedure. Pursuant to this circular, the opening of various special purpose foreign exchange accounts, such as pre-establishment expenses accounts, foreign exchange capital accounts and guarantee accounts, the reinvestment of RMB proceeds by foreign investors in mainland China, and remittance of foreign exchange profits and dividends by a foreign-invested enterprise to its foreign shareholders no longer require the approval or verification of SAFE, and multiple capital accounts for the same entity may be opened in different provinces, which was not possible previously. In addition, SAFE promulgated the Circular on Printing and Distributing the Provisions on Foreign Exchange Administration over Domestic Direct Investment by Foreign Investors and the Supporting Documents in May 2013, as amended, which specifies that the administration by SAFE or its local branches over direct investment by foreign investors in mainland China should be conducted by way of registration and banks should process foreign exchange business relating to the direct investment in mainland China based on the registration information provided by SAFE and its branches.
After a Notice on Further Simplifying and Improving Foreign Exchange Administration Policy on Direct Investment, or SAFE Notice 13, became effective on June 1, 2015, instead of applying for approvals regarding foreign exchange registrations of foreign direct investment and overseas direct investment from SAFE, entities and individuals will be required to apply for such foreign exchange registrations from qualified banks. The qualified banks, under the supervision of SAFE, directly examine the applications and conduct the registration.
On October 23, 2019, SAFE issued the Circular on Further Promoting Cross-border Trade and Investment Facilitation, or SAFE Circular 28. Among others, SAFE Circular 28 relaxes the prior restrictions and allows the foreign-invested enterprises without equity investment as in their approved business scope to use their capital obtained from foreign exchange settlement to make domestic equity investment as long as the investments are real and in compliance with the foreign investment-related laws and regulations. In addition, SAFE Circular 28 stipulates that qualified enterprises in certain pilot areas may use their capital income from registered capital, foreign debt and overseas listing, for the purpose of domestic payments without providing authenticity certifications to the relevant banks in advance for those domestic payments. Payments for transactions that take place within mainland China must be made in RMB. Foreign currency revenues received by companies in mainland China may be repatriated into mainland China or retained outside of mainland China in accordance with requirements and terms specified by SAFE.
Dividend Distribution. Wholly foreign-owned enterprises and Sino-foreign equity joint ventures in mainland China may pay dividends only out of their accumulated profits, if any, as determined in accordance with PRC accounting standards and regulations. Additionally, these foreign-invested enterprises may not pay dividends unless they set aside at least 10% of their respective accumulated profits after tax each year, if any, to fund certain reserve funds, until such time as the accumulative amount of such fund reaches 50% of the enterprise’s registered capital. In addition, these companies also may allocate a portion of their after-tax profits based on PRC accounting standards to employee welfare and bonus funds at their discretion. These reserves are not distributable as cash dividends.
Regulations governing abovementioned dividend distribution arrangements have been replaced by the PRC Foreign Investment Law and its implantation rules, which do not provide specific dividend distribution rules for foreign invested enterprises. However, the PRC Foreign Investment Law and its implementation rules provide that after the conversion from a wholly foreign-owned enterprise or sino-foreign equity joint venture to a foreign invested enterprise under the PRC Foreign Investment Law, distribution method of gains agreed in the joint venture agreements may continue to apply.
Foreign Exchange Registration of Offshore Investment by Domestic Residents of Mainland China. Pursuant to SAFE’s Notice on Relevant Issues Concerning Foreign Exchange Administration for Domestic Residents to Engage in Financing and Inbound Investment via Overseas Special Purpose Vehicles, or SAFE Circular No. 75, issued in October 2005, and a series of implementation rules and guidance, including the circular relating to operating procedures that came into effect in July 2011, Domestic residents of mainland China, including domestic resident natural persons or domestic companies, must register with local branches of SAFE in
141
Table of Contents
connection with their direct or indirect offshore investment in an overseas special purpose vehicle, or SPV, for the purposes of overseas equity financing activities, and to update such registration in the event of any significant changes with respect to that offshore company. SAFE promulgated the Circular on Relevant Issues Concerning Foreign Exchange Control on Domestic Residents’ Offshore Investment and Financing and Roundtrip Investment through Special Purpose Vehicles, or SAFE Circular No. 37, on July 4, 2014, which replaced SAFE Circular No. 75. SAFE Circular No. 37 requires domestic residents to register with local branches of SAFE in connection with their direct establishment or indirect control of an offshore entity, for the purpose of overseas investment and financing, with such domestic residents’ legally owned assets or equity interests in domestic enterprises or offshore assets or interests, referred to in SAFE Circular No. 37 as a “special purpose vehicle.” The term “control” under SAFE Circular No. 37 is broadly defined as the operation rights, beneficiary rights or decision-making rights acquired by the domestic residents in the offshore special purpose vehicles or domestic companies by such means as acquisition, trust, proxy, voting rights, repurchase, convertible bonds or other arrangements. SAFE Circular No. 37 further requires amendment to the registration in the event of any changes with respect to the basic information of the special purpose vehicle, such as changes in a domestic resident individual shareholder, name or operation period; or any significant changes with respect to the special purpose vehicle, such as an increase or decrease of capital contributed by domestic individuals, a share transfer or exchange, merger, division or other material event. If the shareholders of the offshore holding company who are domestic residents do not complete their registration with the local SAFE branches, the mainland China subsidiaries may be prohibited from distributing their profits and proceeds from any reduction in capital, share transfer or liquidation to the offshore company, and the offshore company may be restricted in its ability to contribute additional capital to its mainland China subsidiaries. Moreover, failure to comply with the SAFE registration and amendment requirements described above could result in liability under laws of mainland China for evasion of applicable foreign exchange restrictions. We have notified holders of ordinary shares of our company whom we know are domestic residents to register with the local SAFE branch and update their registrations as required under the SAFE regulations described above. After SAFE Notice 13 became effective on June 1, 2015, entities and individuals are required to apply for foreign exchange registration of foreign direct investment and overseas direct investment, including those required under SAFE Circular No. 37, with qualified banks, instead of SAFE. The qualified banks, under the supervision of SAFE, directly examine the applications and conduct the registration. We are aware that Mr. Robin Yanhong Li, our chairman, chief executive officer and principal shareholder, who is a domestic resident, has registered with the local SAFE branch. We, however, cannot provide any assurances that all of our shareholders who are domestic residents will file all applicable registrations or update previously filed registrations as required by these SAFE regulations. The failure or inability of our domestic resident shareholders to comply with the registration procedures may subject the domestic resident shareholders to fines and legal sanctions, restrict our cross-border investment activities, or limit our mainland China subsidiaries’ ability to distribute dividends to or obtain foreign exchange dominated loans from our company.
Under the Administration Measures on Individual Foreign Exchange Control issued by the People’s Bank of China in December 2006 and its implementation rules issued in January 2007 and revised in May 2016, all foreign exchange matters involved in employee share ownership plans and share option plans in which citizens of mainland China participate require approval from SAFE or its authorized branch. In February 2012, SAFE promulgated the Notices on Issues Concerning the Foreign Exchange Administration for Domestic Individuals Participating in Stock Incentive Plans of Overseas Publicly-Listed Companies. Under these notices, domestic residents who are granted stock options by an overseas publicly listed company are required, through a domestic agent or domestic subsidiary of such overseas publicly listed company, to register with SAFE and complete certain other procedures. We and our domestic resident employees who have been granted stock options are subject to these regulations. We have designated our mainland China subsidiary Baidu Online to handle the registration and other procedures required by these notices. Failure of the option holders to complete their SAFE registrations may subject these domestic employees to fines and legal sanctions and may also limit the ability of the overseas publicly listed company to contribute additional capital into its mainland China subsidiary and limit the mainland China subsidiary’s ability to distribute dividends.
142
Table of Contents
Regulation on Product Quality
Products made in mainland China are subject to the PRC Product Quality Law, which was promulgated on February 22, 1993 and most recently amended on December 29, 2018. According to the PRC Product Quality Law, a seller of a product should be responsible for repairing, replacing or returning the product with any of the following defects, and should compensate for the damages incurred by consumers who bought such defective product: (i) the product does not have the usability which such product should have and there are no prior indications about such situation; (ii) the actual quality of such product fails to comply with the standards specified on such product or the package of such product; and (iii) the actual quality of such product fails to meet the quality status specified by way of product specifications and samples. After the seller performs its obligation of repairing, replacing and returning the defective product and/or compensating for the customers’ damages, such seller is entitled to seek reimbursement from the manufacturer of such product, if it could be proved that the defect is caused by the manufacturer. According to the PRC Product Quality Law, a manufacturer of a product should be responsible to compensate for the damages to any person caused by the defect of such product, unless the manufacturer is able to prove that: (i) it did not circulate the product; (ii) the defect did not exist at the time when the product was circulated; or (iii) scientific or technologic knowledge at the time when such product was circulated was not such that it allowed the defect to be discovered.
Regulations on Tort Liability
The National People’s Congress adopted the PRC Civil Code on May 28, 2020, which came into effect on January 1, 2021 and revoked the PRC Tort Liability Law. The PRC Civil Code provides that internet users and internet service providers shall bear tortious liabilities in the event that they infringe upon other persons’ rights and interests through the internet. It has further elaborated on “safe harbor” rule with respect to an internet service provider from both the aspects of notice and counter notice, including (i) upon receiving notice from the right holder, promptly adopting necessary protective measures such as deletion, screening or disconnection of hyperlinks and reefing right holder’s notice to disputed internet user; and (ii) upon receiving counter-notice from the disputed internet user, referring such counter-notice to the claiming right holder and informing him/her to take other corresponding measures such as filing complaint with competent authorities or suit with courts. The PRC Civil Code has also provided that where the internet service provider knew or should have known the infringing acts of the internet user, it must be severally liable with such internet user. As for product liability, the PRC Civil Code provides additional mitigation measures such as stop selling of defective products and stipulated that the seller and manufacturer should also be liable for expanded damages caused by such defective products if no mitigation measures are provided or not sufficient. If a recall of defective product is required, the seller and the manufacturer should be responsible to undertake fees paid by infringed users.
Regulations on Labor
The PRC Labor Contract Law, which became effective in January 2008 and last amended in December 2012, and its implementation rules, impose more restrictions on employers and have been deemed to increase labor costs for employers, compared to the PRC Labor Law, which became effective in January 1995. For example, pursuant to the Labor Contract Law, an employer is obliged to sign a labor contract with an unlimited term with an employee if the employer continues to hire the employee after the expiration of two consecutive fixed-term labor contracts. The employer has to compensate the employee upon the expiration of a fixed-term labor contract, unless the employee refuses to renew such contract on terms the same as or more favorable to the employee than those contained in the expired contract. The employer also has to indemnify an employee if the employer terminates a labor contract without a cause permitted by law. In addition, under the Regulations on Paid Annual Leave for Employees, which became effective in January 2008, employees who have served more than one year for an employer are entitled to a paid vacation ranging from 5 to 15 days per year, depending on their length of service. Employees who waive such vacation time at the request of employers must be compensated for three times their regular salaries for each waived vacation day.
143
Table of Contents
In addition, according to the PRC Social Insurance Law and the Regulations on the Administration of Housing Provident Funds, employers in mainland China must provide employees with welfare schemes covering pension insurance, unemployment insurance, maternity insurance, work-related injury insurance, medical insurance and housing provident funds.
Regulations on Taxation
For a discussion of applicable tax regulations of mainland China, see “Item 5.A. Operating and Financial Review and Prospects—Operating Results—Taxation.”
| C. | Organizational Structure |
The following is a list of our principal subsidiaries and the variable interest entities as of the date of this annual report on Form 20-F:
| Name |
Place of Formation | Relationship | ||
| Baidu Holdings Limited |
British Virgin Islands |
Wholly owned subsidiary | ||
| Baidu (Hong Kong) Limited |
Hong Kong |
Wholly owned subsidiary | ||
| Baidu Online Network Technology (Beijing) Co., Ltd. |
Mainland China |
Wholly owned subsidiary | ||
| Baidu (China) Co., Ltd. |
Mainland China |
Wholly owned subsidiary | ||
| Baidu.com Times Technology (Beijing) Co., Ltd. |
Mainland China |
Wholly owned subsidiary | ||
| Dulian Network Technology (Hainan) Co., Ltd. |
Mainland China |
Wholly owned subsidiary | ||
| Beijing Baidu Netcom Science Technology Co., Ltd. |
Mainland China |
Variable interest entity | ||
| Beijing Perusal Technology Co., Ltd. |
Mainland China |
Variable interest entity | ||
| iQIYI, Inc. |
Cayman Islands |
Majority-owned subsidiary | ||
| Beijing QIYI Century Science & Technology Co., Ltd. |
Mainland China |
Majority-owned subsidiary | ||
| Beijing iQIYI Science & Technology Co., Ltd. |
Mainland China |
Variable interest entity | ||
| Beijing Duyou Information Technology Co., Ltd. |
Mainland China |
Wholly owned subsidiary |
144
Table of Contents
The following diagram illustrates our corporate structure, including our principal subsidiaries and the variable interest entities as of the date of this annual report on Form 20-F:
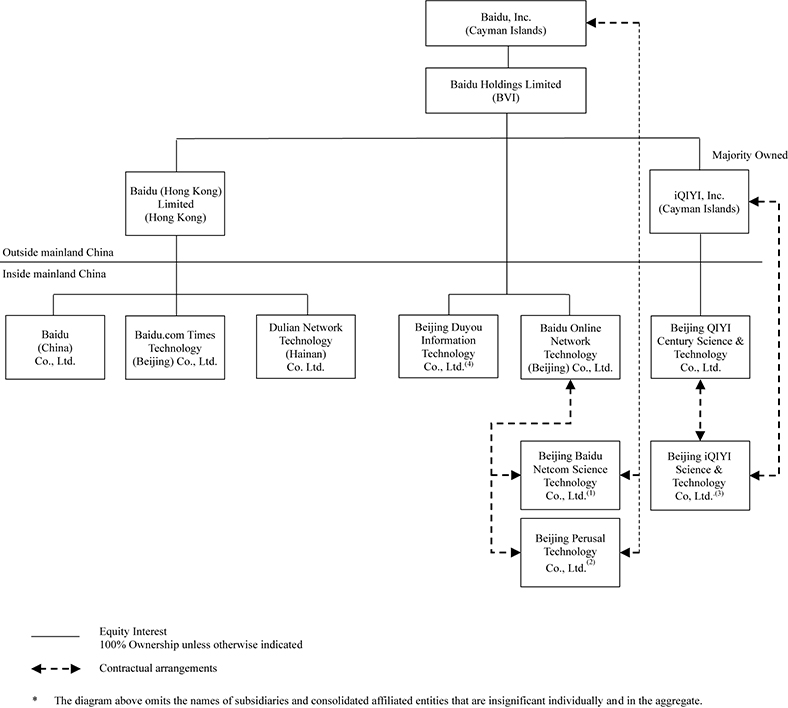
Notes:
| (1) | Beijing Baidu Netcom Science Technology Co., Ltd. is 99.5% owned by Mr. Robin Yanhong Li, our chairman and chief executive officer, and 0.5% owned by Ms. Shanshan Cui, an executive officer of ours. Please see “Item 6.E. Directors, Senior Management and Employees—Share Ownership” for details of Mr. Robin Yanhong Li’s beneficial ownership in our company. Ms. Shanshan Cui’s beneficial ownership of our company is less than 1% of our total issued and outstanding shares. |
| (2) | Beijing Perusal Technology Co., Ltd. is 50% owned by Ms. Shanshan Cui and 50% owned by Mr. Zhixiang Liang. Both Ms. Shanshan Cui and Mr. Zhixiang Liang are our employees, and their respective beneficial ownership in our company is less than 1% of our total issued and outstanding shares. |
| (3) | Beijing iQIYI Science & Technology Co., Ltd. is wholly-owned by Mr. Xiaohua Geng, senior vice president of iQIYI. Mr. Xiaohua Geng is not beneficially interested in any shares of our company. |
| (4) | Baidu Holdings Limited indirectly controls Beijing Duyou Information Technology Co., Ltd through its wholly owned subsidiaries. |
145
Table of Contents
Contractual Arrangements with the Variable Interest Entities and Other Consolidated Affiliated Entities and their Shareholders
The laws and regulations of mainland China restrict and impose conditions on foreign investment in, among other areas, internet content services, value-added telecommunication-based services, internet map services, online audio and video services and mobile application distribution businesses. Accordingly, we operate these businesses in mainland China through the variable interest entities. We have entered into a series of contractual arrangements with the variable interest entities and the nominee shareholders of the variable interest entities. These contractual arrangements:
| • | enable us to receive the economic benefits that could potentially be significant to the variable interest entities in consideration for the services provided by our subsidiaries; |
| • | effectively assigned all of the voting rights underlying the nominee shareholders’ equity interest in the variable interest entities to us; and |
| • | enable us to hold an exclusive option to purchase all or part of the equity interests in the variable interest entities when and to the extent permitted by the laws of mainland China. |
These contractual agreements among our company/iQIYI and our subsidiaries, the variable interest entities and their respective shareholders generally include proxy agreements or shareholder voting rights trust agreements, exclusive equity purchase and transfer option agreements or exclusive purchase option agreements, loan agreements, operating agreements or business operation agreements, exclusive technology consulting and services agreements, and equity pledge agreements, as the case may be. As for some of the variable interest entities, our subsidiaries have entered into additional business cooperation agreements, power of attorney, license agreements and/or commitment letters (as the case may be) with these variable interest entities and their respective nominee shareholders. We do not have any equity interests in the variable interest entities and these contractual agreements are not equivalent to equity ownership in the business of the variable interest entities. Despite the lack of equity majority ownership, as a result of the contractual arrangements, the shareholders of the variable interest entities effectively assigned all of their voting rights and economic interests underlying their equity interest in the variable interest entities to the primary beneficiaries of these companies, which gives our company/iQIYI the power to direct the activities that most significantly impact the variable interest entities’ economic performance. In addition, through the other exclusive agreements, which consist of exclusive equity purchase and transfer option agreements/exclusive purchase option agreements or commitment letters, operating agreements/business operation agreements, exclusive technology consulting and services agreements and license agreements, the primary beneficiaries, by themselves or by their wholly-owned subsidiaries in mainland China, demonstrate their ability and intention to continue to exercise the ability to absorb losses or receive economic benefits that could potentially be significant to the variable interest entities. The variable interest entities are subject to operating risks, which determine the variability of our company’s interest in those entities. Based on these contractual arrangements, we consolidate the variable interest entities as required by Accounting Standards Codification (ASC) Topic 810, Consolidation. The nominee shareholders of Baidu Netcom, Beijing Perusal and Beijing iQIYI, the variable interest entities, are directors or members of senior management of our company/ iQIYI. We/iQIYI consider such people suitable to act as the nominee shareholders of these variable interest entities because of, among other considerations, their contribution to our company/iQIYI, their competence and their length of service with and loyalty to our company/iQIYI. If the variable interest entities or the nominee shareholders fail to perform their respective obligations under the contractual arrangements, we could be limited in our ability to enforce the contractual arrangements that effectively assigned us the voting rights and/or economic interests in the variable interest entities. Furthermore, if we are unable to maintain such effective assignment, we would not be able to continue to consolidate the financial results of the variable interest entities in our financial statements. In 2021, 2022 and 2023, we derived 44%, 47% and 45% of our external revenues from the variable interest entities, respectively. Based on the book value of Baidu Netcom and Beijing Perusal and taking into account major adjustments for intra-group transactions, the revenue contribution of Baidu Netcom to us for each of the years ended December 31, 2021, 2022 and 2023 was 14%, 15% and 13%, respectively, and the revenue contribution of Beijing Perusal was all 0% for each of the same periods. For a
146
Table of Contents
detailed revenue contribution, see “Item 3.A. [Reserved]—Financial Information Related to the Variable interest Entities.” For a detailed description of the regulatory environment that necessitates the adoption of our corporate structure, see “Item 4.B. Information on the Company—Business Overview—Regulations.” For a detailed description of the risks associated with our corporate structure, see “Item 3.D. Key Information—Risk Factors—Risks Related to Our Corporate Structure.”
The following is a summary of the material provisions of the contractual arrangements relating to Baidu Netcom, Beijing Perusal and Beijing iQIYI.
Proxy Agreements/Shareholder Voting Rights Trust Agreements/Power of Attorney
Pursuant to the proxy agreement amongst our company and the nominee shareholders of Baidu Netcom, the nominee shareholders of Baidu Netcom agree to entrust all the rights to exercise their voting power and any other rights as shareholders of Baidu Netcom to the person(s) designated by our company. Each of the nominee shareholders of Baidu Netcom has executed an irrevocable power of attorney to appoint the person(s) designated by our company as their attorney-in-fact to vote on their behalf on all matters requiring shareholder approval. Any action taken by such attorney-in-fact in relation to the entrusted rights should be directed and approved by our company. The proxy agreement will be in effect for an unlimited term unless terminated in writing by our company. Each of the powers of attorney will be in effect for as long as the relevant nominee shareholder of Baidu Netcom holds any equity interests in Baidu Netcom.
Each of the proxy agreements or shareholder voting rights trust agreements amongst our company and the shareholders of Beijing Perusal and between Beijing QIYI Century and the shareholder of Beijing iQIYI contains substantially the same terms as those described above. Each of the proxy agreements or shareholder voting rights trust agreements will be in effect for an unlimited term unless terminated in writing by our company or other subsidiaries. Each of the powers of attorney or shareholder voting rights trust agreements will be in effect for as long as the shareholder of Beijing Perusal or Beijing iQIYI, holds any equity interests in Beijing Perusal or Beijing iQIYI, as the case may be.
Exclusive Equity Purchase and Transfer Option Agreement or Exclusive Purchase Option Agreements
Pursuant to the exclusive equity purchase and transfer option agreement by and among our company, Baidu Online, Baidu Netcom and the nominee shareholders of Baidu Netcom, the nominee shareholders of Baidu Netcom have irrevocably granted our company or its designated person(s) (including Baidu Online) an exclusive option to purchase, to the extent permitted under the laws of mainland China, all or part of the equity interests in Baidu Netcom for the cost of the initial contributions to the registered capital or the minimum amount of consideration permitted by applicable laws of mainland China. The nominee shareholders must remit to Baidu Online any amount that is paid by Baidu Online in connection with the purchased equity interest as requested by our company or its designated person(s) (including Baidu Online) to the extent permitted by the applicable laws. Our company or its designated person(s) have sole discretion to decide when to exercise the option, whether in part or in full amount. Any and all dividends and other capital distributions from Baidu Netcom to the nominee shareholders must be repaid to Baidu, Inc. in full amount. Our company or its designated person(s) (including Baidu Online) also have the exclusive right to cause the nominee shareholders of Baidu Netcom to transfer their equity interest in Baidu Netcom to our company or any designated third party. Our company will provide unlimited financial support to Baidu Netcom, if Baidu Netcom becomes in need of any form of reasonable financial support in the normal operation of business. If Baidu Netcom were to incur any loss and as a result cannot repay any loans from our company (through Baidu Online), our company will unconditionally forgive any such loans to Baidu Netcom upon provision by Baidu Netcom of sufficient proof for its loss and incapacity to repay. In addition, the shareholders of Baidu Netcom must appoint the candidates recommended by Baidu Online as their representatives on Baidu Netcom’s board of directors. The agreement will terminate upon the transfer by the nominee shareholders of Baidu Netcom of all their equity interests in Baidu Netcom to our company or its designated person(s) or upon expiration of the term of business of our company or Baidu Netcom.
147
Table of Contents
Each of the exclusive equity purchase and transfer option agreements/exclusive purchase option agreements amongst our company, Baidu Online, Beijing Perusal and its shareholders and iQIYI, Beijing QIYI Century, Beijing iQIYI and its shareholders contains substantially the same terms as those described above, except that the initial term of the amended and restated exclusive purchase option agreement amongst iQIYI, Beijing QIYI Century, Beijing iQIYI and its shareholder is ten years, which has been extended to November 22, 2032, and can be further renewed at iQIYI’s discretion.
Exclusive Technology Consulting and Services Agreement
Pursuant to the exclusive technology consulting and services agreement between Baidu Online and Baidu Netcom, Baidu Online has the exclusive right to provide Baidu Netcom technology consulting and services related to, among other things, the maintenance of servers, software development, design of advertisements, and e-commerce technical services. Baidu Online owns the intellectual property rights resulting from the performance of this agreement. Baidu Netcom agrees to pay service fees to Baidu Online and Baidu Online has the right to adjust the service fees at its sole discretion without the consent of Baidu Netcom. The agreement will be in effect for an unlimited term, until the term of business of one party expires and extension is denied by the approval authorities.
Each of the exclusive technology consulting and services agreements between Baidu Online and Beijing Perusal and Beijing QIYI Century and Beijing iQIYI contains substantially the same terms as those described above, except that the terms regarding the determinant of the service fees may differ and that the initial term of the exclusive technology consulting and services agreement between Beijing QIYI Century and Beijing iQIYI dated November 23, 2011 is ten years, and has been extended to November 23, 2031, and can be further renewed at the discretion of Beijing QIYI Century.
In 2021, 2022 and 2023, Baidu Netcom and Beijing Perusal did not pay any service fees to Baidu Online.
Operating Agreement or Business Operation Agreement
Pursuant to the operating agreement amongst Baidu Online, Baidu Netcom and the nominee shareholders of Baidu Netcom, Baidu Online provides guidance and instructions on Baidu Netcom’s daily operations, financial affairs and employment and dismissal of staff. In addition, Baidu Online agrees to guarantee Baidu Netcom’s performance under any agreements or arrangements relating to Baidu Netcom’s business arrangements with any third party. In return, Baidu Netcom agrees that without the prior consent of Baidu Online, Baidu Netcom will not engage in any transactions that could materially affect the assets, liabilities, rights or operations of Baidu Netcom, including, without limitation, incurrence or assumption of any indebtedness, sale or purchase of any assets or rights, incurrence of any encumbrance on any of its assets or intellectual property rights in favor of a third party or transfer of any agreements relating to its business operation to any third party. The agreement will be in effect for an unlimited term, until the term of business of one party expires and extension is denied by the approval authorities.
The operating agreement amongst Baidu Online, Beijing Perusal and its shareholders contains substantially the same terms as those described above.
Pursuant to the amended and restated business operation agreement dated January 30, 2013 amongst Beijing QIYI Century, Beijing iQIYI and its shareholder, Beijing QIYI Century provides guidance and instructions on Beijing iQIYI’s daily operations and financial affairs. In addition, Beijing QIYI Century agrees to guarantee Beijing iQIYI’s performance under any agreements or arrangements relating to Beijing iQIYI’s business arrangements with any third party. The agreement can only be unilaterally revoked by Beijing QIYI Century. The initial term of the agreement is ten years, which has been extended for another ten years to January 30, 2033, and can be further extended at Beijing QIYI Century’s discretion.
148
Table of Contents
Loan Agreements
Pursuant to loan agreements amongst Baidu Online and the nominee shareholders of Baidu Netcom, Baidu Online provided loans with an aggregate amount of RMB13.4 billion to the nominee shareholders of Baidu Netcom solely for the latter to fund the capitalization of Baidu Netcom. The loans can be repaid only with the proceeds from the sale of the nominee shareholders’ equity interest in Baidu Netcom to Baidu Online or its designated person(s). The term of the loan agreements with the two nominee shareholders of Baidu Netcom will expire on July 9, 2029 and August 19, 2029, respectively, and can be extended with the written consent of both parties before its expiration.
Pursuant to loan agreements amongst the shareholders of Beijing Perusal and Baidu Online, the amount of loans extended to the respective shareholders of Beijing Perusal is RMB3.2 billion. The term of the loan agreements will expire on March 30, 2028 and October 29, 2029, respectively, and can be extended with the written consent of both parties before its expiration. Each of the loan agreements amongst Baidu Online and the respective shareholders of Beijing Perusal, and Beijing QIYI Century and the shareholders of Beijing iQIYI, contains substantially the same terms as those described above, except that the amount of the loans and that the contract expiration date varies. The term of the loan agreement amongst Beijing QIYI Century and the shareholder of Beijing iQIYI will expire on June 23, 2031 and can be further extended upon the written notification from Beijing QIYI Century.
Equity Pledge Agreement
Pursuant to the equity pledge agreement amongst Baidu Online and the nominee shareholders of Baidu Netcom, the nominee shareholders of Baidu Netcom must pledge all of their equity interests in Baidu Netcom to Baidu Online to guarantee their obligations under the loan agreements and Baidu Netcom’s performance of its obligations under the exclusive technology consulting and service agreement. If Baidu Netcom or the nominee shareholders breach their respective contractual obligations, Baidu Online, as the pledgee, will be entitled to certain rights, including the right to sell the pledged equity interests. The nominee shareholders of Baidu Netcom agree not to dispose of the pledged equity interests or take any actions that would prejudice Baidu Online’s interest. The equity pledge agreement will terminate on the date when Baidu Netcom and its shareholders have completed all their respective obligations under the exclusive technology consulting and service agreement and the loan agreements, but such equity pledge will expire two years after expiration of the term of the obligations of Baidu Netcom and its shareholders under the exclusive technology consulting and service agreement and the loan agreements if they fail to fulfill such obligations thereunder.
Each of the equity pledge agreements amongst Baidu Online and the shareholders of Beijing Perusal and Beijing QIYI Century and the shareholder of Beijing iQIYI contains substantially the same terms, including its term to expiration, as those described above.
Business Cooperation Agreement
Pursuant to the business cooperation agreement between Beijing QIYI Century and Beijing iQIYI effective November 23, 2011, Beijing iQIYI agrees to provide Beijing QIYI Century with services, including internet information services, online advertising and other services reasonably necessary within the scope of Beijing QIYI Century’s business. Beijing iQIYI agrees to use technology services provided by Beijing QIYI Century on its platform, including, but not limited to, P2P download and video on-demand systems. Beijing QIYI Century agrees to pay specified service fees to Beijing iQIYI as consideration for the internet information services and other services provided by Beijing iQIYI. Beijing iQIYI has the right to waive the service fees at its discretion. The initial term of this agreement is ten years, which has been extended for another ten years to November 23, 2031, and can be further renewed at Beijing QIYI Century’s discretion.
149
Table of Contents
License Agreements
Baidu Online and Baidu Netcom have entered into a software license agreement and a web layout copyright license agreement. Pursuant to these license agreements, Baidu Online has granted to Baidu Netcom the right to use, including, but not limited to, a software license and a web layout copyright license. Baidu Netcom may only use the licenses in its own business operations. Baidu Online has the right to adjust the service fees at its sole discretion. The software license agreement and web layout copyright license agreement have been renewed since their original expiration and are in effect for an unlimited term, until the term of business of one party expires and extension is denied by the approval authorities.
The web layout copyright license agreements that Baidu Online has entered into with Beijing Perusal contain substantially the same terms as those between Baidu Online and Baidu Netcom described above. The agreement is in effect for an unlimited term, until the term of business of one party expires and extension is denied by the approval authorities.
Pursuant to the trademark license agreement and the software usage license agreement between Beijing QIYI Century and Beijing iQIYI effective November 23, 2011, Beijing QIYI Century granted a non-exclusive and non-transferable license, without sublicensing rights, to Beijing iQIYI to use its trademarks and software. Beijing iQIYI may only use the licenses in its own business operations. Beijing QIYI Century has the right to adjust the service fees at its sole discretion. The initial term of the two agreements is five years. The software usage license agreement may be extended upon the written consent of Beijing QIYI Century, and has been extended to December 1, 2031, and is further renewable at the discretion of Beijing QIYI Century. The trademark license agreement is automatically extended for successive one-year periods after its expiration unless Beijing QIYI Century early terminates the agreement in accordance with the provisions of the agreement.
Commitment Letters
Pursuant to the commitment letter dated January 30, 2013, under the condition that Beijing iQIYI remains as a variable interest entity of iQIYI under United States generally accepted accounting principles and the relevant contractual arrangements remain in effect, iQIYI commits to provide unlimited financial support to Beijing iQIYI, if Beijing iQIYI requires any form of reasonable financial support for its normal business operations. If Beijing iQIYI incurs any losses and as a result cannot repay its loans from iQIYI and Beijing QIYI Century, one of iQIYI’s subsidiaries, iQIYI and Beijing QIYI Century would unconditionally forgive their loans to Beijing iQIYI, if Beijing iQIYI provides sufficient proof for its loss and incapacity to repay.
The commitment letters executed by other iQIYI VIEs contain terms similar to the terms described above.
Through design of the aforementioned agreements, the nominee shareholders of these variable interest entities have effectively assigned their full voting rights to our company/iQIYI, which gives our company/iQIYI the power to direct the activities that most significantly impact the variable interest entities’ economic performance. Our company/iQIYI obtains the ability to approve decisions made by the variable interest entities and the ability to acquire the equity interests in the variable interest entities when permitted by the laws of mainland China. Our company/iQIYI is obligated to absorb losses of the variable interest entities that could potentially be significant to the variable interest entities through providing unlimited financial support to the variable interest entities or is entitled to receive economic benefits from the variable interest entities that could potentially be significant to the variable interest entities through the exclusive technology consulting and service fees. As a result of these contractual arrangements, our company/iQIYI is determined to be the primary beneficiary of these variable interest entities and we consolidate these variable interest entities through our company/iQIYI as required by Accounting Standards Codification Topic 810, Consolidation.
We have also entered into contractual arrangements with several other variable interest entities and their respective nominee shareholders, including iQIYI’s other variable interest entities and their respective nominee
150
Table of Contents
shareholders, through some of our subsidiaries other than Baidu Online and Beijing QIYI Century, which result in our company/iQIYI or relevant subsidiaries, as the case may be, being the primary beneficiaries of the relevant variable interest entities. As a result of these contractual arrangements, we consolidate these other variable interest entities through the subsidiaries as required by Accounting Standards Codification Topic 810, Consolidation. In addition, we have entered into similar contractual arrangements with consolidated affiliated entities and their shareholders in certain other jurisdictions.
| D. | Property, Plant and Equipment |
Our corporate headquarters, Baidu Campus, is located in Shangdi, Haidian district of Beijing. We own the office building of Baidu Campus and a nearby office building, Baidu Science Park, which is located in Malianwa, Haidian district of Beijing. Besides Beijing, we own and occupy office buildings in Shanghai and Shenzhen.
We also lease offices in Beijing, many other cities in mainland China and places outside of mainland China, including in the United States, Canada, Hong Kong, Malaysia, Japan, Thailand and Singapore.
Our servers are hosted at the internet data centers of major telecom operators, including China Telecom, China Unicom and China Mobile, in over ten selected cities across China. Our content delivery network covers most of the major cities in mainland China.
In 2022, we completed the second-phase construction of our cloud computing centers in Yangquan, Dingxing and Xushui, which all serve as our internet data centers in China.
| Item 4A. | Unresolved Staff Comments |
None.
| Item 5. | Operating and Financial Review and Prospects |
The following discussion of our financial condition and results of operations is based upon, and should be read in conjunction with, our audited consolidated financial statements and the related notes included in this annual report on Form 20-F. This report contains forward-looking statements. See “Forward-Looking Information.” In evaluating our business, you should carefully consider the information provided under the caption “Item 3.D. Key Information—Risk Factors” in this annual report on Form 20-F. We caution you that our businesses and financial performance are subject to substantial risks and uncertainties.
| A. | Operating Results |
Overview
We are a leading AI company with a strong internet foundation. We have been consistently investing in AI since 2010 to solidify our technology advancement, improve search capabilities and boost overall monetization. The breadth and depth of our AI capabilities provide the differentiating foundational technologies that power all of our businesses.
Our total revenues increased by 9% from RMB123.7 billion in 2022 to RMB134.6 billion (US$19.0 billion) in 2023, compared to a 1% decrease from RMB124.5 billion in 2021 to RMB123.7 billion in 2022. Our operating profit increased by 37% from RMB15.9 billion in 2022 to RMB21.9 billion (US$3.1 billion) in 2023, compared to a 51% increase from RMB10.5 billion in 2021 to RMB15.9 billion in 2022. Net income attributable to Baidu, Inc. increased by 169% from RMB7.6 billion in 2022 to RMB20.3 billion (US$2.9 billion) in 2023, compared to a 26% decrease from RMB10.2 billion in 2021 to RMB7.6 billion in 2022. Benefiting from a recovering macroeconomic environment and our continuous improvements of operational efficiency, we resumed revenue growth in 2023 with a significant increase in operating profit.
151
Table of Contents
Revenues
Baidu Core. Baidu Core revenues primarily comprise of (i) P4P online marketing services that include search and feed online marketing services; (ii) other online marketing services, including display advertisement and based on performance criteria other than CPC; (iii) cloud services; (iv) smart devices and services; (v) non-marketing consumer-facing services such as membership; and (vi) intelligent driving. We expect Baidu Core to continue to generate a majority of our revenues.
A majority of Baidu Core revenues are derived from online marketing services. Our P4P platform is an online marketplace that introduces internet search users to customers, who pay us a fee based on click-throughs for priority placement of their links in the search results. We also provide feed online marketing services to our customers. Our feed platform helps customers target relevant feed users, and customers pay us based on a CPC basis or advertisement displays of their products. In addition, we provide our customers with other performance-based and display-based online marketing services.
Our cloud services include enterprise and public sector cloud, and personal cloud. Our enterprise and public sector cloud offers a full suite of cloud services and solutions, including IaaS, PaaS, and SaaS, and is differentiated by our AI capabilities. Enterprises and the public sector have been the growth engine for our cloud revenue. For the personal cloud service, we offer Baidu Drive, which allows users to store and retrieve photos, videos, and other files on AI Cloud, along with other capabilities, such as group share and data transfer. Personal cloud service contributed a small portion of total cloud revenues.
Apart from the online marketing services and cloud services, Baidu Core also generates revenue by providing products and services ranging from smart devices and services, non-marketing consumer-facing services and intelligent driving.
iQIYI. iQIYI is a leading provider of online entertainment video services in mainland China. iQIYI remains focused on high-quality content and user experience. iQIYI provides its users with a variety of products and services encompassing online video, online games, online literature, animations and others. iQIYI derives a majority of its revenues from membership services and online marketing services.
iQIYI offers membership packages to provide its members with (i) access to streaming of a library of premium content, (ii) certain commercial skipping and other viewing privileges, and (iii) merchandise selection and privilege. Most of iQIYI’s online marketing services are in the form of brand advertising and performance-based advertising.
Operating Costs and Expenses
Our operating costs and expenses consist of cost of revenues, selling, general and administrative expenses, and research and development expenses. Share-based compensation expenses are allocated among these three categories, based on the nature of the work of the employees who have received share-based compensation.
Cost of Revenues
Our cost of revenues primarily consist of content costs, traffic acquisition costs, bandwidth costs, depreciation, cost of goods sold, salaries and benefits for operation and service personnel and other operational cost.
Selling, General and Administrative Expenses
Our selling, general and administrative expenses primarily consist of promotional and marketing expenses, salaries and benefits for our sales, marketing, general and administrative personnel, and legal, accounting and other professional services fees.
152
Table of Contents
Research and Development Expenses
Research and development expenses primarily consist of salaries and benefits for research and development personnel, server depreciation expenses and server custody fees. We expense research and development costs as they are incurred, except for capitalized software development costs that fulfill the capitalization criteria.
Taxation
Cayman Islands
Under the current laws of the Cayman Islands, we are not subject to tax on income or capital gains. Additionally, no Cayman Islands withholding tax will be imposed on dividend payments we make.
Hong Kong
Subsidiaries in Hong Kong are subject to Hong Kong profits tax rate of 16.5% and foreign-derived income is exempted from income tax. There is no withholding tax upon payment of dividends by the subsidiaries incorporated in Hong Kong to its shareholders.
Mainland China Enterprise Income Tax
Mainland China’s statutory enterprise income tax rate is 25%. An enterprise may benefit from a preferential tax rate of 15% under the EIT Law if it qualifies as a “High and New Technology Enterprise” strongly supported by the state. Pursuant to the Administrative Measures on the Recognition of High and New Technology Enterprises, as amended in January 2016, the provincial counterparts of the Ministry of Science and Technology, the Ministry of Finance and the State Administration of Taxation make a joint determination on whether an enterprise is qualified as a “High and New Technology Enterprise” under the EIT Law. In making such determination, these government agencies consider, among other factors, ownership of core technology, whether the key technology supporting the core products or services falls within the scope of high and new technology strongly supported by the state as specified in the administrative measures, the ratios of research and development personnel to total personnel, the ratio of research and development expenditures to annual sales revenues, the ratio of revenues attributed to high and new technology products or services to total revenues, and other measures set forth in the guidance. A “High and New Technology Enterprise” certificate is effective for a period of three years. Further, preferential enterprise income tax rates are available for qualified Software Enterprises whereby entities are entitled to full exemption from enterprise income tax for two years beginning from their first profitable calendar year and a 50% reduction for the subsequent three calendar years.
If our mainland China subsidiaries or the variable interest entities that have enjoyed preferential tax treatment no longer qualify for the preferential treatment, we will consider available options under applicable law that would enable us to qualify for alternative preferential tax treatment. To the extent we are unable to offset the impact of the expiration of existing preferential tax treatment with new tax exemptions, tax incentives or other tax benefits, the expiration of existing preferential tax treatment may cause our effective tax rate to increase. The amount of income tax payable by our mainland China subsidiaries and the variable interest entities in the future will depend on various factors, including, among other things, the results of operations and taxable income of, and the statutory tax rate applicable to, each of the entities. Our effective tax rate depends partially on the extent of the relative contribution of each of our subsidiaries and the variable interest entities to our consolidated taxable income.
Withholding Tax
Under the EIT Law and its implementation rules, dividends, interests, rent or royalties payable by a foreign-invested enterprise, such as our mainland China subsidiaries, to any of its non-resident enterprise investors, and proceeds from any such non-resident enterprise investor’s disposition of assets (after deducting the net value of
153
Table of Contents
such assets) are subject to enterprise income tax at the rate of 10%, namely withholding tax, unless the non-resident enterprise investor’s jurisdiction of incorporation has a tax treaty or arrangement with mainland China that provides for a reduced withholding tax rate or an exemption from withholding tax. The Notice on Several Preferential Policies regarding Enterprise Income Tax Law jointly promulgated by the Ministry of Finance and State Administration of Taxation in February 2008, clarifies that undistributed profits earned by foreign-invested enterprises prior to January 1, 2008 will be exempted from any withholding tax.
The British Virgin Islands, where Baidu Holdings Limited, the sole shareholder of certain of our mainland subsidiaries such as Baidu Online, was incorporated, does not have such a tax treaty with mainland China.
Hong Kong, where Baidu (Hong Kong) Limited, our wholly owned subsidiary and the sole shareholder of certain of our mainland China subsidiaries such as Baidu Times and Baidu China, was incorporated, has a tax arrangement with mainland China that provides for a lower withholding tax rate of 5% on dividends subject to certain conditions and requirements, such as the requirement that the Hong Kong resident enterprise own at least 25% of the mainland China enterprise distributing the dividend at all times within the 12-month period immediately preceding the distribution of dividends and be a “beneficial owner” of the dividends. However, pursuant to Circular on Issues Concerning Implementing Dividend Clauses of Tax Treaties, or SAT Circular 81, issued by the State Administration of Taxation in February 2009, if the PRC tax authorities determine, in their discretion, that a company benefits from the reduced withholding tax rate on dividends due to a structure or arrangement designed for the primary purpose of obtaining favorable tax treatment, the PRC tax authorities may adjust the preferential tax treatment. Moreover, pursuant to Circular on Several Issues regarding the “Beneficial Owner” in Tax Treaties, or SAT Circular 9, issued by the State Administration of Taxation in February 2018, which became effective from April 1, 2018 and superseded the SAT Circular 601 issued by the State Administration of Taxation in October 2009, a resident of a contracting state will not qualify for the benefits under the tax treaties or arrangements, if it is not the “beneficial owner” of the dividend, interest and royalty income. According to SAT Circular 9, a “beneficial owner” is required to have ownership and the right to dispose of the income or the rights and properties giving rise to the income, and generally engage in substantive business activities. An agent or conduit company will not be regarded as a “beneficial owner” and, therefore, will not qualify for treaty benefits. A conduit company normally refers to a company that is set up primarily for the purpose of evading or reducing taxes or transferring or accumulating profits. In addition, pursuant to Bulletin on Administrative Measures on Treaties Benefit for Non-resident Taxpayers, or SAT Circular 35, issued by the State Administration of Taxation in October 2019, non-resident enterprises are not required to obtain pre-approval from the tax authority in order to enjoy the reduced withholding tax rate. Instead, non-resident enterprises may, if they determine by self-assessment that the prescribed criteria to enjoy the tax treaty benefits are met, directly apply for the reduced withholding tax rate, and file necessary forms and supporting documents when performing tax filings, which will be subject to post-filing examinations by the tax authorities.
In 2020, certain of our mainland China subsidiaries have declared and distributed profits earned to Baidu (Hong Kong) Limited, the dividend payments are subject to withholding tax. We have made tax provisions based on the corresponding tax rate. If our mainland China subsidiaries further declare and distribute profits earned after January 1, 2008 to us in the future, the dividend payments will be subject to withholding tax, which will increase our tax liability and reduce the amount of cash available to our company. For the potential distributable profits to be distributed to our qualified Hong Kong incorporated subsidiary, the deferred tax liabilities are accrued at a 5% withholding tax rate. For more information on related risks, please see “Item 3.D. Key Information—Risk Factors—Risks Related to Doing Business in China—If our mainland China subsidiaries declare and distribute dividends to their respective offshore parent companies, we will be required to pay more taxes, which could have a material and adverse effect on our result of operations.”
Tax Residence
Under the EIT Law and its implementation rules, an enterprise established outside of mainland China with “de facto management body” within mainland China is considered a resident enterprise and will be subject to
154
Table of Contents
enterprise income tax at the rate of 25% on its worldwide income. The term “de facto management body” refers to “the establishment that exercises substantial and overall management and control over the production, business, personnel, accounts and properties of an enterprise.” Pursuant to SAT Circular 82, issued by the State Administration of Taxation in April 2009, an overseas registered enterprise controlled by a mainland China company or a mainland China company group will be classified as a “resident enterprise” with its “de facto management body” located within mainland China if the following requirements are satisfied: (i) the senior management and core management departments in charge of its daily operations are mainly located in mainland China; (ii) its financial and human resources decisions are subject to determination or approval by persons or bodies located in mainland China; (iii) its major assets, accounting books, company seals, and minutes and files of its board and shareholders’ meetings are located or kept in mainland China; and (iv) no less than half of the enterprise’s directors or senior management with voting rights reside in mainland China. The State Administration of Taxation issued additional rules to provide more guidance on the implementation of SAT Circular 82 in July 2011, and issued an amendment to SAT Circular 82 delegating the authority to its provincial branches to determine whether a Chinese-controlled overseas-incorporated enterprise should be considered a mainland China resident enterprise, in January 2014. Although the SAT Circular 82, the additional guidance and its amendment only apply to overseas registered enterprises controlled by mainland China enterprises and not those controlled by mainland China individuals or foreigners, the determining criteria set forth in the circular may reflect the State Administration of Taxation’s general position on how the “de facto management body” test should be applied in determining the tax resident status of offshore enterprises, regardless of whether they are controlled by mainland China enterprises, individuals or foreigners.
If our offshore entities are deemed mainland China resident enterprises, these entities may be subject to enterprise income tax at the rate of 25% on their global incomes, except that the dividends distributed by our mainland China subsidiaries may be exempt from enterprise income tax to the extent such dividends are deemed “dividends among qualified resident enterprises.” For more information on related risks, please see “Item 3.D. Key Information—Risk Factors—Risks Related to Doing Business in China—We may be deemed a mainland China resident enterprise under the EIT Law, which could subject us to mainland China’s taxation on our global income, and which may have a material and adverse effect on our results of operations.”
Should our offshore entities be deemed as mainland China resident enterprises, such changes could significantly increase our tax burden and materially and adversely affect our cash flow and profitability.
Mainland China Urban Maintenance and Construction Tax and Education Surcharge
Any entity, foreign-invested or purely domestic, or individual that is subject to consumption tax and value-added tax is also required to pay mainland China urban maintenance and construction tax. The rates of urban maintenance and construction tax are 7%, 5% or 1% of the amount of consumption tax and value-added tax actually paid depending on where the taxpayer is located. All entities and individuals who pay consumption tax and value-added tax are also required to pay education surcharges at a rate of 3%, and local education surcharges at a rate of 2%, of the amount of value-added tax and consumption tax actually paid.
155
Table of Contents
Results of Operations
The following table sets forth a summary of our consolidated results of operations for the periods indicated. The period-to-period comparisons of results of operations should not be relied upon as indicative of future performance.
| Year ended December 31, | ||||||||||||||||
| 2021 | 2022 | 2023 | ||||||||||||||
| RMB | RMB | RMB | US$ | |||||||||||||
| (in millions) | ||||||||||||||||
| Consolidated Statements of Comprehensive Income Data |
||||||||||||||||
| Revenues: |
||||||||||||||||
| Online marketing services |
80,695 | 74,711 | 81,203 | 11,437 | ||||||||||||
| Others |
43,798 | 48,964 | 53,395 | 7,521 | ||||||||||||
|
|
|
|
|
|
|
|
|
|||||||||
| Total revenues |
124,493 | 123,675 | 134,598 | 18,958 | ||||||||||||
|
|
|
|
|
|
|
|
|
|||||||||
| Operating costs and expenses(1): |
||||||||||||||||
| Cost of revenues |
64,314 | 63,935 | 65,031 | 9,159 | ||||||||||||
| Selling, general and administrative |
24,723 | 20,514 | 23,519 | 3,314 | ||||||||||||
| Research and development |
24,938 | 23,315 | 24,192 | 3,407 | ||||||||||||
|
|
|
|
|
|
|
|
|
|||||||||
| Total operating costs and expenses |
113,975 | 107,764 | 112,742 | 15,880 | ||||||||||||
|
|
|
|
|
|
|
|
|
|||||||||
| Operating profit |
10,518 | 15,911 | 21,856 | 3,078 | ||||||||||||
|
|
|
|
|
|
|
|
|
|||||||||
| Total other income (loss), net |
260 | (5,799 | ) | 3,342 | 472 | |||||||||||
|
|
|
|
|
|
|
|
|
|||||||||
| Income before income taxes |
10,778 | 10,112 | 25,198 | 3,550 | ||||||||||||
|
|
|
|
|
|
|
|
|
|||||||||
| Income taxes |
3,187 | 2,578 | 3,649 | 514 | ||||||||||||
|
|
|
|
|
|
|
|
|
|||||||||
| Net income |
7,591 | 7,534 | 21,549 | 3,036 | ||||||||||||
|
|
|
|
|
|
|
|
|
|||||||||
| Less: Net (loss) income attributable to non-controlling interests |
(2,635 | ) | (25 | ) | 1,234 | 175 | ||||||||||
|
|
|
|
|
|
|
|
|
|||||||||
| Net income attributable to Baidu, Inc. |
10,226 | 7,559 | 20,315 | 2,861 | ||||||||||||
|
|
|
|
|
|
|
|
|
|||||||||
|
|
||||||||||||||||
| Year ended December 31, | ||||||||||||||||
| 2021 | 2022 | 2023 | ||||||||||||||
| RMB | RMB | RMB | US$ | |||||||||||||
| (in millions) | ||||||||||||||||
| (1) Share-based compensation expenses are allocated in operating costs and expenses as follows: |
| |||||||||||||||
| Cost of revenues |
399 | 409 | 590 | 83 | ||||||||||||
| Selling, general and administrative |
1,840 | 1,750 | 1,678 | 236 | ||||||||||||
| Research and development |
4,817 | 4,629 | 4,077 | 575 | ||||||||||||
|
|
|
|
|
|
|
|
|
|||||||||
| Total |
7,056 | 6,788 | 6,345 | 894 | ||||||||||||
|
|
|
|
|
|
|
|
|
|||||||||
Year Ended December 31, 2023 Compared to Year Ended December 31, 2022
Consolidated revenues. Our total revenues in 2023 were RMB134.6 billion (US$19.0 billion), increasing by 9% from 2022.
Our online marketing revenues for Baidu Core in 2023 were RMB75.1 billion (US$10.6 billion), increasing by 8% from 2022, primarily due to an increase of service demand from our customers in certain industries, including travelling, e-commerce, healthcare, and entertainment and media, which in turn benefited from the recovery of general economy and the macroeconomic environment for these industries.
Our online marketing revenues for iQIYI in 2023 were RMB6.2 billion (US$877 million), increasing by 17% from 2022, as a result of the growth of performance-based advertising business and, to a lesser extent, the growth in the brand advertising business.
156
Table of Contents
Other revenues in 2023 were RMB53.4 billion (US$7.5 billion), increasing by 9% from 2022, mainly driven by cloud and other AI-powered businesses. For a detailed description, see “—Segment Revenues.”
Consolidated operating costs and expenses. Our total operating costs and expenses increased by RMB4.9 billion, or 5%, from RMB107.8 billion in 2022 to RMB112.7 billion (US$15.9 billion) in 2023.
Cost of Revenues. Our cost of revenues increased by RMB1.1 billion, or 2%, from RMB63.9 billion in 2022 to RMB65.0 billion (US$9.2 billion) in 2023, primarily due to the following factors:
| • | An increase of RMB1.1 billion in traffic acquisition costs, which reflected increasing union revenues. |
| • | Total other cost of revenues remained essentially unchanged compared to 2022. The growth of cost of revenues was slower than the growth of revenues due to our continuous improvement of operational efficiency, including optimizing gross margin of AI Cloud business, SLG, iQIYI, etc. |
Selling, General and Administrative Expenses. Our selling, general and administrative expenses increased by RMB3.0 billion, or 15%, from RMB20.5 billion in 2022 to RMB23.5 billion (US$3.3 billion) in 2023, primarily due to an increase in channel spending and promotional marketing expenses.
Research and Development Expenses. Our research and development expenses increased by RMB877 million, or 4%, from RMB23.3 billion in 2022 to RMB24.2 billion (US$3.4 billion) in 2023, primarily due to an increase in server depreciation expenses and server custody fees which support Gen-AI research and development inputs.
Operating profit. As a result of the foregoing, we generated an operating profit of RMB21.9 billion (US$3.1 billion) in 2023, a 37% increase from RMB15.9 billion in 2022.
Total other income (loss), net. Our total other income, net was RMB3.3 billion (US$472 million), compared to total other loss, net of RMB5.8 billion in 2022, mainly due to a fair value gain of RMB198 million (US$28 million) from long-term investments in 2023, compared to a fair value loss of RMB3.9 billion in 2022, as well as a decrease of RMB2.2 billion in impairment of long-term investments.
Income taxes. Our income tax expense was RMB3.6 billion (US$514 million) in 2023, representing a 42% increase from RMB2.6 billion in 2022, primarily due to an increase in profit before tax.
Net income attributable to Baidu, Inc. As a result of the foregoing, net income attributable to Baidu, Inc. increased from RMB7.6 billion in 2022 to RMB20.3 billion (US$2.9 billion) in 2023.
Year Ended December 31, 2022 Compared to Year Ended December 31, 2021
Consolidated revenues. Our total revenues in 2022 were RMB123.7 billion, decreasing by 1% from 2021.
Our online marketing revenues for Baidu Core in 2022 were RMB69.5 billion, decreasing by 6% from 2021 primarily due to the resurgence of COVID-19 in certain cities in China.
Our online marketing revenues for iQIYI in 2022 were RMB5.3 billion, decreasing by 25% from 2021, as a result of the challenging macroeconomic environment, pandemic resurgence, and iQIYI’s strategy leading to a fewer number of variety shows launched.
Other revenues in 2022 were RMB49.0 billion, increasing by 12% from 2021, mainly driven by cloud and other AI-powered businesses. For a detailed description, see “—Segment Revenues.”
Consolidated operating costs and expenses. Our total operating costs and expenses decreased by RMB6.2 billion, or 5%, from RMB114.0 billion in 2021 to RMB107.8 billion in 2022.
157
Table of Contents
Cost of Revenues. Our cost of revenues decreased by RMB379 million from RMB64.3 billion in 2021 to RMB63.9 billion in 2022, primarily due to the following factors:
| • | A decrease of RMB4.1 billion in content costs, which related to less recorded expense of produced content and licensed copyrights. |
| • | An increase of RMB1.1 billion in traffic acquisition costs, as a result of the increase in traffic and average unit price. |
| • | An increase of RMB1.1 billion in bandwidth costs and depreciation costs, which related to development of AI cloud business. |
| • | An increase of RMB1.5 billion in other operational cost, which mainly included an increase of cost of goods sold and other costs related to new AI business of RMB514 million, an increase of RMB406 million in sales tax and surcharges and an increase of RMB365 million in salaries and benefits and staff-related expense. |
Selling, General and Administrative Expenses. Our selling, general and administrative expenses decreased by RMB4.2 billion from RMB24.7 billion in 2021 to RMB20.5 billion in 2022, primarily due to a decrease in channel spending, promotional marketing and personnel-related expenses.
Research and Development Expenses. Our research and development expenses decreased by RMB1.6 billion from RMB24.9 billion in 2021 to RMB23.3 billion in 2022, primarily due to a decrease in personnel related expenses.
Operating profit. As a result of the foregoing, we generated an operating profit of RMB15.9 billion in 2022, a 51% increase from RMB10.5 billion in 2021.
Total other loss, net. Our total other loss, net was RMB5.8 billion in 2022, which mainly included fair value losses of RMB3.9 billion and impairment losses of RMB3.0 billion from long-term investments. Our total other income, net was RMB260 million in 2021, which included fair value gains of RMB3.1 billion and impairment losses of RMB4.3 billion from long-term investments.
Income taxes. Our income tax expense was RMB2.6 billion in 2022, representing a 19% decrease from RMB3.2 billion in 2021, primarily due to deferred tax benefit recognized on fair value loss of long-term investments in 2022 whereas deferred tax expense recognized on fair value gain of long-term investments in 2021.
Net income attributable to Baidu, Inc. As a result of the foregoing, net income attributable to Baidu, Inc. decreased from RMB10.2 billion in 2021 to RMB7.6 billion in 2022.
158
Table of Contents
Segment Revenues
The following table sets forth our revenues by segment and the year-over-year change rate for the periods indicated, with each segment revenues including inter-segment revenues:
| Year ended December 31, | ||||||||||||||||||||||||
| 2021 | 2022 | 2023 | ||||||||||||||||||||||
| RMB | RMB | YoY% | RMB | US$ | YoY% | |||||||||||||||||||
| (In millions, except percentages) | ||||||||||||||||||||||||
| Baidu Core |
||||||||||||||||||||||||
| Online marketing services |
73,919 | 69,522 | (6 | ) | 75,112 | 10,579 | 8 | |||||||||||||||||
| Cloud services |
15,070 | 17,721 | 18 | 18,718 | 2,636 | 6 | ||||||||||||||||||
| Others |
6,174 | 8,188 | 33 | 9,635 | 1,358 | 18 | ||||||||||||||||||
|
|
|
|
|
|
|
|
|
|
|
|
|
|||||||||||||
| Subtotal |
95,163 | 95,431 | 0 | 103,465 | 14,573 | 8 | ||||||||||||||||||
|
|
|
|
|
|
|
|
|
|
|
|
|
|||||||||||||
| iQIYI |
||||||||||||||||||||||||
| Online advertising services |
7,067 | 5,332 | (25 | ) | 6,224 | 877 | 17 | |||||||||||||||||
| Membership services |
16,714 | 17,711 | 6 | 20,314 | 2,861 | 15 | ||||||||||||||||||
| Content distribution |
3,007 | 2,562 | (15 | ) | 2,459 | 346 | (4 | ) | ||||||||||||||||
| Others |
3,766 | 3,393 | (10 | ) | 2,876 | 405 | (15 | ) | ||||||||||||||||
|
|
|
|
|
|
|
|
|
|
|
|
|
|||||||||||||
| Subtotal |
30,554 | 28,998 | (5 | ) | 31,873 | 4,489 | 10 | |||||||||||||||||
|
|
|
|
|
|
|
|
|
|
|
|
|
|||||||||||||
| Intersegment eliminations |
(1,224 | ) | (754 | ) | (38 | ) | (740 | ) | (104 | ) | (2 | ) | ||||||||||||
|
|
|
|
|
|
|
|
|
|
|
|
|
|||||||||||||
| Total revenue |
124,493 | 123,675 | (1 | ) | 134,598 | 18,958 | 9 | |||||||||||||||||
|
|
|
|
|
|
|
|
|
|
|
|
|
|||||||||||||
Baidu Core
2023 compared to 2022
Baidu Core revenue was RMB103.5 billion (US$14.6 billion) in 2023, increasing by 8% compared to RMB95.4 billion in 2022.
Online marketing revenues of Baidu Core in 2023 were RMB75.1 billion (US$10.6 billion) in 2023, increasing by RMB5.6 billion, or 8%, compared to RMB69.5 billion in 2022, primarily due to an increase of service demand from our customers in certain industries, including travelling, e-commerce, healthcare, and entertainment and media, which in turn benefited from the recovery of general economy and macroeconomic environment in these industries. We leverage our AI technology, user traffic, product design and various marketing to enhance users’ reliance on and customers’ stickiness on our platforms and services.
The number of our active online marketing customers increased from approximately 520,000 in 2022 to approximately 532,000 in 2023, and the average revenue per customer increased from approximately RMB134,000 in 2022 to approximately RMB141,000 (US$19,000) in 2023. The increase was primarily due to the recovery of general economy and macroeconomic environment in various industries.
Revenues from Baidu Core’s cloud services and others are included in “Others” in the consolidated statements of comprehensive income.
Cloud services revenue of Baidu Core in 2023 were RMB18.7 billion (US$2.6 billion), increasing by RMB1.0 billion, or 6%, compared to RMB17.7 billion in 2022, mainly due to an increase in scale for IaaS, standardizing AI cloud solutions and applications for scale, and an increase in subscription for personal cloud service, partially offset by a decrease in smart transportation revenue.
Baidu Core’s other revenues in 2023 were RMB9.6 billion (US$1.4 billion), increasing by RMB1.4 billion, or 18%, compared to RMB8.2 billion in 2022, mainly due to increase in Apollo Self-Driving Services and Xiaodu smart devices and services.
159
Table of Contents
2022 compared to 2021
Baidu Core revenue was RMB95.4 billion in 2022, which is basically flat from RMB95.2 billion in 2021.
Online marketing revenues of Baidu Core in 2022 were RMB69.5 billion, decreasing by RMB4.4 billion, or 6%, compared to RMB73.9 billion in 2021, primarily due to the resurgence of COVID-19 in certain cities in China.
The number of our active online marketing customers decreased from approximately 535,000 in 2021 to approximately 520,000 in 2022, and the average revenue per customer decreased from approximately RMB138,000 in 2021 to approximately RMB134,000 in 2022. The decrease was primarily due to the resurgence of COVID-19 in certain cities in China.
Revenues from Baidu Core’s cloud services and others are included in “Others” in the consolidated statements of comprehensive income.
Cloud services revenue of Baidu Core in 2022 were RMB17.7 billion, increasing by RMB2.6 billion, or 18%, compared to RMB15.1 billion in 2021, mainly due to increase in scale for both IaaS and cloud solution projects, standardizing AI cloud solutions and applications for scale, and increase in subscription for personal cloud service.
Baidu Core’s other revenues in 2022 were RMB8.2 billion, increasing by RMB2.0 billion, or 33%, compared to RMB6.2 billion in 2021.
iQIYI
2023 compared to 2022
iQIYI revenue was RMB31.9 billion (US$4.5 billion) in 2023, increasing by RMB2.9 billion, or 10%, from RMB29.0 billion in 2022.
iQIYI online advertising services revenue are included in “Online marketing revenue” in the consolidated statements of comprehensive income.
iQIYI’s online advertising revenues in 2023 were RMB6.2 billion (US$877 million), increasing by RMB892 million, or 17%, from RMB5.3 billion in 2022, primarily driven by the growth of performance-based advertising business and, to a lesser extent, the growth in the brand advertising business. Average brand advertising revenue per brand advertiser increased by 14% from RMB3.8 million in 2022 to RMB4.3 million (US$0.6 million) in 2023. iQIYI tracks the average brand advertising revenue per brand advertiser as a key indicator to evaluate advertising services business and adapt sales strategy, advertisement solutions and content scheduling accordingly.
Revenue from iQIYI membership services, content distribution, and others are included in “Others” in the consolidated statements of comprehensive income.
Membership revenue of iQIYI in 2023 were RMB20.3 billion (US$2.9 billion), increasing by RMB2.6 billion, or 15%, from RMB17.7 billion in 2022, primarily driven by the growth in iQIYI’s average revenue per membership during a month, or monthly ARM, the average daily number of total subscribing members of the year and iQIYI’s continuous efforts in refining operations to improve user experience and monetization capabilities. iQIYI’s monthly ARM in 2023 increased by 6% to RMB15.13 in 2023, as compared to RMB14.31 in 2022. In addition, the average daily number of total subscribing members in 2023 was 111.9 million, as compared to 103.1 million in 2022. The average daily number of subscribing members excluding individuals with trial memberships was 111.2 million in 2023, as compared to 102.4 million in 2022. iQIYI tracks monthly ARM and average daily number of total subscribing members as key indicators for membership revenue growth.
160
Table of Contents
iQIYI’s content distribution revenue decreased by RMB103 million, or 4%, from RMB2.6 billion in 2022 to RMB2.5 billion (US$346 million) in 2023, primarily attributable to the decrease in barter transactions, partially offset by the increase in cash transactions and revenue from distribution of theatrical movies invested by iQIYI during 2023.
iQIYI’s other revenue in 2023 were RMB2.9 billion (US$405 million), decreasing by RMB517 million, or 15%, from RMB3.4 billion in 2022, primarily due to the deconsolidation of live broadcasting business.
2022 compared to 2021
iQIYI revenue was RMB29.0 billion in 2022, decreasing by RMB1.6 billion, or 5%, from RMB30.6 billion in 2021.
iQIYI online advertising services revenue are included in “Online marketing revenue” in the consolidated statements of comprehensive income.
iQIYI’s online advertising revenues in 2022 were RMB5.3 billion, decreasing by RMB1.8 billion, or 25%, from RMB7.1 billion in 2021, as a result of the challenging macroeconomic environment, pandemic resurgence, and fewer number of variety shows being launched. Average brand advertising revenue per brand advertiser decreased by 21% from RMB4.9 million in 2021 to RMB3.8 million in 2022. iQIYI track the average brand advertising revenue per brand advertiser as a key indicator to evaluate advertising services business and adapt sales strategy, advertisement solutions and content scheduling accordingly.
Revenue from iQIYI membership services, content distribution, and others are included in “Others” in the consolidated statements of comprehensive income.
Membership revenue of iQIYI in 2022 were RMB17.7 billion, increasing by RMB1.0 billion, or 6%, from RMB16.7 billion in 2021. The average daily number of total subscribing members in 2022 was 103.1 million, as compared to 101.6 million in 2021. The average daily number of subscribing members excluding individuals with trial memberships was 102.4 million in 2022, as compared to 100.7 million in 2021. In addition, average revenue per membership during a month, or monthly ARM, in 2022 increased by 4% to RMB14.31, as compared to RMB13.71 in 2021. iQIYI tracks the number of average daily subscribing members and monthly ARM as key indicators for membership revenue growth, and has been cultivating users’ willingness to pay. iQIYI is dedicated to providing more premium content through diversified approaches, as it did in the past by launching theme-based drama theaters, members only content and the PVOD mode, to expand its subscribing member base, nurture members’ willingness to pay and diversify its routes to membership monetization to drive membership services revenue.
iQIYI’s content distribution revenue decreased by RMB445 million, or 15%, from RMB3.0 billion in 2021 to RMB2.6 billion in 2022, primarily attributable to the decrease in barter transactions during the year.
iQIYI’s other revenue in 2022 were RMB3.4 billion, decreasing by RMB373 million, or 10%, from RMB3.8 billion in 2021, primarily due to the deterioration of performance in various business lines and the adjustment in business operation model of certain business lines, partially offset by the revenue derived from third-party cooperation.
161
Table of Contents
Segment Operating Costs and Expenses
The following table sets forth our operating costs and expenses by segment and the year-over-year change rate for the periods indicated, with each segment operating costs and expenses including inter-segment costs and expenses:
| Year ended December 31, | ||||||||||||||||||||||||
| 2021 | 2022 | 2023 | ||||||||||||||||||||||
| RMB | RMB | YoY% | RMB | US$ | YoY% | |||||||||||||||||||
| (In millions, except percentages) | ||||||||||||||||||||||||
| Operating Costs and Expenses: |
||||||||||||||||||||||||
| Baidu Core |
80,021 | 80,897 | 1 | 84,640 | 11,922 | 5 | ||||||||||||||||||
| iQIYI |
35,033 | 27,686 | (21 | ) | 28,884 | 4,068 | 4 | |||||||||||||||||
Baidu Core. Operating costs and expenses of Baidu Core mainly consist of personnel-related costs, traffic acquisition costs, marketing and promotion spending, depreciation expenses, costs of goods sold, content costs, bandwidth cost and other costs related to new AI business.
Cost of revenues. The cost of revenues of Baidu Core increased by 1% from RMB42.4 billion in 2022 to RMB42.6 billion (US$6.0 billion) in 2023, primarily due to the following factors:
| • | An increase of RMB487 million in traffic acquisition costs, which arose from increasing union revenues. |
| • | A total decrease of RMB273 million in other cost of revenues due to our continuous improvement of operational efficiency, including optimizing gross margin of AI Cloud business, SLG, etc. |
The cost of revenues of Baidu Core increased by 12% from RMB37.8 billion in 2021 to RMB42.4 billion in 2022, primarily due to an increase in traffic acquisition costs, bandwidth costs, depreciation costs, cost of goods sold and other costs related to the new AI business, personnel-related costs and content costs.
Selling, general and administrative expenses. The selling, general and administrative expenses of Baidu Core increased by 15% from RMB17.1 billion in 2022 to RMB19.6 billion (US$2.8 billion) in 2023, primarily due to an increase in channel spending and promotional marketing expenses.
The selling, general and administrative expenses of Baidu Core decreased by 15% from RMB20.0 billion in 2021 to RMB17.1 billion in 2022, primarily due to a decrease in channel spending and promotional marketing expenses.
Research and development expenses. The research and development expenses of Baidu Core increased by 5% from RMB21.4 billion in 2022 to RMB22.4 billion (US$3.2 billion) in 2023, primarily due to an increase in server depreciation expenses and server custody fees which support Gen-AI research and development inputs.
The research and development expenses of Baidu Core decreased by 3% from RMB22.1 billion in 2021 to RMB21.4 billion in 2022, primarily due to a decrease of personnel-related expenses.
iQIYI. Operating costs and expenses of iQIYI mainly consist of content costs, personnel-related costs, bandwidth costs, marketing and promotion spending, and payment platform charges.
Cost of revenues. The cost of revenues of iQIYI increased by 4% from RMB22.3 billion in 2022 to RMB23.1 billion (US$3.3 billion) in 2023.
The cost of revenues of iQIYI decreased by 19% from RMB27.5 billion in 2021 to RMB22.3 billion in 2022, primarily due to a decrease in content costs.
162
Table of Contents
Selling, general and administrative expenses. The selling, general and administrative expenses of iQIYI increased by 16% from RMB3.5 billion in 2022 to RMB4.0 billion (US$565 million) in 2023, primarily due to increased marketing and promotional expenses, which was due to the higher spending on user acquisition channels and content promotions.
The selling, general and administrative expenses of iQIYI decreased by 27% from RMB4.7 billion in 2021 to RMB3.5 billion in 2022, primarily due to disciplined marketing spending and a decline in personnel-related compensation expenses.
Research and development expenses. The research and development expenses of iQIYI decreased by 7% from RMB1.9 billion in 2022 to RMB1.8 billion (US$249 million) in 2023, primarily due to decreased personnel compensation expenses.
The research and development expenses of iQIYI decreased by 32% from RMB2.8 billion in 2021 to RMB1.9 billion in 2022, primarily due to a decrease in personnel-related expenses.
Inflation
Inflation in China has not materially impacted our results of operations. According to the National Bureau of Statistics of China, the annual average percent changes in the consumer price index in mainland China for 2021, 2022 and 2023 were 0.9%, 2.0% and 0.2%, respectively. The year-over-year percent change in the consumer price index for January 2022, 2023 and 2024 was an increase of 0.9%, an increase of 2.1%, and a decrease of 0.8%, respectively. Although we have not been materially affected by inflation in the past, we can provide no assurance that we will not be affected in the future by higher rates of inflation in China. For example, certain operating costs and expenses, such as employee compensation and office operating expenses, may increase as a result of higher inflation. Additionally, because a substantial portion of our assets consists of cash and cash equivalents and short-term investments, high inflation could significantly reduce the value and purchasing power of these assets. We are not able to hedge our exposure to higher inflation in China.
Critical Accounting Policies and Estimates
We prepare financial statements in accordance with U.S. GAAP, which requires us to make judgments, estimates and assumptions that affect the reported amounts of our assets and liabilities and the disclosure of our contingent assets and liabilities at the end of each fiscal period and the reported amounts of revenues and expenses during each fiscal period. We continually evaluate these judgments and estimates based on our own historical experience, knowledge and assessment of current business and other conditions, our expectations regarding the future based on available information and assumptions that we believe to be reasonable, which together form our basis for making judgments about matters that are not readily apparent from other sources. Since the use of estimates is an integral component of the financial reporting process, our actual results could differ from those estimates. Some of our accounting policies require a higher degree of judgment than others in their application.
The selection of critical accounting policies, the judgments and other uncertainties affecting application of those policies and the sensitivity of reported results to changes in conditions and assumptions are factors that should be considered when reviewing our financial statements. For further information on our critical accounting policies, see Note 2 to our consolidated financial statements. We believe the following accounting policies involve the most significant judgments and estimates used in the preparation of our financial statements.
Fair Value Measurements of Non-Marketable Equity Securities
We measure certain financial instruments at fair value on a nonrecurring basis, consisting primarily of our non-marketable equity securities. These investments are accounted for under the measurement alternative and are
163
Table of Contents
measured at cost, less impairment, subject to upward and downward adjustments resulting from observable price changes for identical or similar investments of the same issuer. These adjustments require quantitative assessments of the fair value of equity investments, primarily using a market approach, which requires the use of unobservable inputs, such as selection of comparable companies and multiples, expected volatility, discount for lack of marketability and probability of exit events as it relates to liquidation and redemption preferences when applicable. Non-marketable equity securities are also evaluated for impairment, based on qualitative factors including the companies’ financial and liquidity position and access to capital resources, among others. When indicators of impairment exist, we also prepare quantitative measurements of the fair value of our equity investments using market approach with unobservable inputs. Our estimates of these inputs require subjective management judgment and are inherently uncertain. The fair value information is sensitive to changes in the unobservable inputs used to determine fair value and such changes could result in the fair value at the reporting date to be different from the fair value presented. When our assessment indicates that an impairment exists, we write down the investment to its fair value.
Amortization of content assets
Based on factors including historical and estimated future viewership consumption patterns, our content assets (licensed copyrights and produced content) are amortized using an accelerated method by content categories over the shorter of each content’s contractual period or estimated useful lives within ten years, beginning with the month of first availability. We review factors that impact the amortization of the content assets on a regular basis, such as the estimates of future viewership consumption patterns and estimated useful lives. Our estimates related to these factors require complex and subjective management judgment and any changes in our estimates of future viewership consumption patterns and estimated useful lives may cause us to realize different amounts of amortization in future periods.
Consolidation of Variable Interest Entities
In order to comply with the laws and regulations of mainland China limiting foreign ownership of or imposing conditions on internet content services, value-added telecommunication-based services, online audio and video services, and mobile application distribution businesses, we operate our websites and conduct our internet content services, value-added telecommunication-based services, online audio and video services, and mobile application distribution businesses through the variable interest entities in mainland China by means of contractual arrangements. We have entered into certain exclusive agreements with the variable interest entities directly or through our subsidiaries, which obligate us to absorb losses of the variable interest entities’ that could potentially be significant to the variable interest entities or entitle the primary beneficiaries to receive economic benefits from the variable interest entities that could potentially be significant to the variable interest entities. In addition, we have entered into certain agreements with the variable interest entities and the nominee shareholders of variable interest entities directly or through our subsidiaries, which enable us to direct the activities that most significantly affect the economic performance of the variable interest entities. Based on these contractual arrangements, we consolidate the variable interest entities as required by ASC Topic 810, Consolidation, because we hold the variable interests of the variable interest entities directly or through the subsidiaries, which are the primary beneficiaries of the variable interest entities. We will reconsider the initial determination of whether a legal entity is a variable interest entity upon certain events listed in ASC 810-10-35-4 occurring. We will also continuously reconsider whether we are the primary beneficiaries of the variable interest entities as facts and circumstances change. See “Item 3.D. Key Information—Risk Factors—Risks Related to Our Corporate Structure.”
Segment Reporting
As of December 31, 2021, 2022 and 2023, we had two reportable segments, Baidu Core and iQIYI. Baidu Core mainly provides search-based, feed-based, and other online marketing services, cloud services, products and other services from our new AI initiatives. iQIYI is an online entertainment service provider that offers original, professionally produced and partner-generated content on its platform.
164
Table of Contents
Our chief executive officer, who has been identified as the chief operating decision maker, reviews the operating results of Baidu Core and iQIYI, to allocate resources and assess our performance. Accordingly, the financial statements include segment information which reflects the current composition of the reportable segments in accordance with ASC Topic 280, Segment Reporting.
Revenue Recognition
Our revenues are derived principally from online marketing service and others. Revenue is recognized when control of promised goods or services is transferred to our customers in an amount of consideration to which an entity expects to be entitled to in exchange for those goods or services. Revenue is recorded net of value-added tax.
For arrangements that include multiple promised goods or services, we would evaluate all of the performance obligations in the arrangement to determine whether each performance obligation is distinct. For arrangements with multiple distinct performance obligations, each distinct performance obligation is separately accounted for and the total consideration is allocated to each performance obligation based on their relative standalone selling price at contract inception. We generally determine standalone selling prices based on the prices charged to customers on a standalone basis or estimates it using an expected cost plus margin approach. For arrangement with multiple components that are not distinct within the context of the contract because they have significant integration and the customer can only benefit from these promised goods or services in conjunction with one another, we account for them as one performance obligation.
Our revenue recognition policies by types are as follows:
| (1) | Online marketing services |
Performance-based online marketing services
Our P4P platform enables customers to bid for priority placement of paid sponsored links and reach users who search for information related to their products or services. P4P online marketing customers can choose from search-based and feed-based online marketing services, and select criteria for their purchase, such as daily spending limit and user profile targeted. Revenue is recognized when all of the revenue recognition criteria are met, which is generally when a user clicks on one of the customer-sponsored links or feed-based marketing.
To the extent we provide online marketing services based on performance criteria other than CPC, revenue is recognized when the specified performance criteria are met along with the satisfaction of other applicable revenue recognition criteria.
Baidu Union online marketing services
Baidu Union is a program through which we expand distribution of its customers’ sponsored links or advertisements by leveraging the traffic of Baidu Union partners’ online properties. We acquire traffic from Baidu Union partners and are responsible for service fulfillment and pricing. The services which we provided to customers through Baidu Union partners’ online properties include CPC, other performance-based online marketing services and online display advertising services. These services are provided in the same way to customers as those through Baidu’s own platforms or properties. As the principal, we recognize revenue from Baidu Union on a gross basis. Payments made to Baidu Union partners are recorded as traffic acquisition costs, which are included in “Cost of revenues” in the consolidated statements of comprehensive income.
Online display advertising services
We provide online display advertising services to our customers by integrating text description, image and/ or video, and displaying the advertisement in the search result, in Baidu Feed or on other properties. We
165
Table of Contents
recognize revenue on a pro rata basis over the contractual term for cost per time advertising arrangements, commencing on the start date of the display advertisement, or based on the number of times that the advertisement has been displayed for cost per thousand impressions advertising arrangements.
Collection
Certain customers of online marketing services are required to pay a deposit before using our services and are sent automated reminders to replenish their accounts when the balance falls below a designated amount. The deposits received are recorded as “Customer deposits and deferred revenue” on the consolidated balance sheets. The amounts due to us are deducted from the deposited amounts when users click on the paid sponsored links in the search results or other performance criteria have been satisfied. In addition, we offer payment terms to some customers based on their historical marketing placements and credibility. In addition, we offer payment terms to third-party agents and advertisers based on their historical marketing placements and credibility, consistently with industry practice.
Payment terms and conditions vary by customer and are based on the billing schedule established in our contracts or purchase orders with customers, but we generally provide credit terms to customers within one year; therefore, we have determined that our contracts do not include a significant financing component.
Sales incentives
We provide major sales incentives to third-party agents, which are identified as customers, that entitle them to receive price reduction on the online marketing services by meeting certain cumulative consumption requirements. We account for these incentives granted to customers as variable consideration and net them against revenue. The amount of variable consideration is measured based on the expected value of incentives to be provided to customers.
| (2) | Others |
Video Membership services
We offer membership services to subscribing members with various privileges, which primarily include access to exclusive and ad-free streaming of premium content 1080P/4K high definition video, eXave Max, Dolby Audio, and accelerated downloads and others. When the receipt of membership fees is for services to be delivered over a period of time, the receipt is initially recorded as “Customer deposits and deferred revenue” and revenue is recognized ratably over the membership period as services are rendered. Membership services revenue also includes fees earned from subscribing members for on-demand content purchases and early access to premium content. We are the principal in our relationships where partners, including consumer electronics manufacturers (TVs and cell phones), mobile operators, internet service providers and online payment agencies, provide access to the membership services or payment processing services as we retain control over its service delivery to its subscribing members. Typically, payments made to the partners, are recorded as “Cost of revenues.” For the sale of the right to other membership services through strategic cooperation with other parties, we recognize revenue on a net basis when we do not control the specified services before they are transferred to the customer.
Content distribution
We generate revenues from sub-licensing content assets within the authorized scope for cash or through nonmonetary exchanges mainly with other online video broadcasting companies, as well as from the release of feature films for exhibition in theaters. For cash sub-licensing transactions, we are entitled to receive the sub-license fee under the sub-licensing arrangements and do not have any future obligation once we have provided the underlying content to the sub-licensee (which is provided at or before the beginning of the
166
Table of Contents
sub-license period). The sub-licensing of content assets represents a license of functional intellectual property which grants a right to use our content assets, and is recognized at the point in time when the content asset is made available for the customer’s use and benefit.
We also enter into nonmonetary transactions to exchange online broadcasting rights of content assets with other online video broadcasting companies from time to time. The exchanged content assets provide rights for each party to broadcast the content assets received on its own platform only. Each transferring party retains the right to continue broadcasting the exclusive content on its own platform and/or sublicense the rights to the content it surrendered in the exchange. We account for these nonmonetary exchanges based on the fair value of the asset received. Barter revenues are recognized in accordance with the same revenue recognition criteria above. We estimate the fair value of the content assets received using a market approach based on various factors, including the purchase price of similar non-exclusive and/or exclusive contents, broadcasting schedule, cast and crew, theme, popularity, and box office. The transaction price of barter transaction is calculated on an individual content asset basis. For a significant barter transaction, we further review the fair value by analyzing against the cost of the content assets bartered out and/or engage a third-party valuation firm to assess the reasonableness of its fair value. The attributable cost of sublicensing transactions, whether for cash or through nonmonetary exchanges, is recognized as cost of revenues through the amortization of the sublicensing right component of the exclusive content assets.
Cloud service
We provide enterprise and public sector cloud services and personal cloud services, generally on either a subscription or consumption basis. For enterprise and public sector cloud services, we offer a full suite of cloud services and solutions, including IaaS (infrastructure as a service), PaaS (platform as a service) and SaaS (software as a service). For personal cloud services, we offer Baidu Drive membership services provided to individual customers. Revenue related to enterprise and public sector cloud services provided on a subscription basis is recognized ratably over the contract period. Revenue related to enterprise and public sector cloud services provided on a consumption basis, such as the amount of storage used in a period, is recognized based on the customer’s utilization of such resources. Revenue related to personal cloud services is recognized ratably over the membership period as services are rendered and the receipt of membership fees for services to be delivered over a period of time is initially recorded as “Customer deposits and deferred revenue.”
We provide cloud solutions for our customers in specific industries, such as smart transportation, finance, manufacturing, energy, telecom and media. Revenue related to cloud solutions which mainly include significant integrated hardware, software licensing and installation service, is recognized over time if one of the following criteria is met: (i) the customer simultaneously receives and consumes the benefits as we perform; (ii) our performance creates or enhances an asset that the customer controls as the asset is created or enhanced; or (iii) the asset delivered has no alternative use and we have an enforceable right to payment for performance completed to date. For performance obligations satisfied over time, we recognize revenue over time by measuring the progress toward complete satisfaction of a performance obligation. Otherwise, revenue is recognized at a point in time when a customer obtains control of a promised asset or service and we satisfy our performance obligation.
Baidu Apollo Auto Solutions
Revenue related to Baidu Apollo auto solutions (Apollo Self-Driving Services and DuerOS for Auto), which mainly includes software licensing revenues are recognized when earned in accordance with the terms of the underlying agreement. Generally, revenue is recognized at a point in time when the intellectual property is made available for the customer’s use and benefit.
167
Table of Contents
Sales of hardware
We mainly sell Xiaodu smart device hardware products via third-party agents or directly to end customers. Revenue from the sales of hardware is recognized when control of the goods is transferred to customers, which generally occurs when the products are delivered and accepted by our customers. Revenue is recorded net of sales incentives and return allowance.
Contract assets and contract liabilities
Payment terms and conditions vary by customer and are based on the billing schedule established in our contracts or purchase orders with customers, although terms generally include a requirement of payment within one year.
Timing of revenue recognition may differ from the timing of invoicing to customers. For certain services customers are required to pay before the services are delivered to the customer. When either party to a revenue contract has performed, we recognize a contract asset or a contract liability on the consolidated balance sheets, depending on the relationship between the entity’s performance and the customer’s payment.
Contract liabilities were mainly related to fees for membership services to be provided over the membership period, which were included in “Customer deposits and deferred revenue” on the consolidated balance sheets. Contract assets mainly represent unbilled amounts related to our rights to consideration for advertising services and cloud services delivered and were included in “Other current assets, net” on the consolidated balance sheets.
We do not disclose the value of unsatisfied performance obligations for (i) contracts with an original expected length of one year or less and (ii) contracts for which we recognize revenue at the amount to which it has the right to invoice for services performed.
Share-based Compensation
We account for share-based compensation in accordance with ASC Topic 718, Compensation-Stock Compensation. We have elected to recognize share-based compensation using the straight-line method for all share-based awards issued with no performance conditions. For awards with performance conditions, compensation cost is recognized on an accelerated basis if it is probable that the performance condition will be achieved.
Forfeitures are estimated based on historical experience and are periodically reviewed. Cancellation of an award accompanied by the concurrent grant of a replacement award is accounted for as a modification of the terms of the cancelled award, or modified awards. The compensation costs associated with the modified awards are recognized if either the original vesting condition or the new vesting condition is achieved. Total recognized compensation cost for the awards is at least equal to the fair value of the awards at the grant date unless at the date of the modification the performance or service conditions of the original awards are not expected to be satisfied. The incremental compensation cost is measured as the excess of the fair value of the replacement award over the fair value of the cancelled award at the cancellation date. Therefore, in relation to the modified awards, we recognize share-based compensation over the vesting periods of the replacement award, which comprises (i) the amortization of the incremental portion of share-based compensation over the remaining vesting term, and (ii) any unrecognized compensation cost of the original award, using either the original term or the new term, whichever results in higher expenses for each reporting period.
Income Taxes
We recognize income taxes under the liability method. Deferred income taxes are recognized for differences between the financial reporting and tax bases of assets and liabilities at enacted tax rates in effect for the years in
168
Table of Contents
which the differences are expected to reverse. We record a valuation allowance against the amount of deferred tax assets that we determine is not more-likely-than-not to be realized. The effect on deferred taxes of a change in tax rates is recognized in earnings in the period that includes the enactment date. For reconciliation of tax computed by applying the respective statutory income tax rate to pre-tax income, please see “Income taxes” under Note 17 to our audited consolidated financial statements.
Deferred income taxes are recognized on the undistributed earnings of subsidiaries, which are presumed to be transferred to the parent company and are subject to withholding taxes, unless there is sufficient evidence to show that the subsidiary has invested or will invest the undistributed earnings indefinitely or that the earnings will be remitted in a tax-free liquidation.
We apply the provisions of ASC Topic 740, Income Taxes (“ASC 740”) in accounting for uncertainty in income taxes. ASC 740 clarifies the accounting for uncertainty in income taxes by prescribing the recognition threshold a tax position is required to meet before being recognized in the financial statements. We have elected to classify interest and penalties related to an uncertain tax position (if and when required) as part of income tax expense in the consolidated statements of comprehensive income.
Long-term investments
Our long-term investments consist of equity method investments, equity investments with readily determinable fair value, equity investments without readily determinable fair value, equity investments in private equity funds, other investments accounted for at fair value and available-for-sale debt investments.
Investments in entities in which we can exercise significant influence but does not own a majority equity interest or control are accounted for using the equity method of accounting in accordance with ASC Topic 323, Investments-Equity Method and Joint Ventures. Under the equity method, we initially record its investment at cost and the difference between the cost of the equity investee and the amount of the underlying equity in the net assets of the equity investee is accounted for as if the investee were a consolidated subsidiary. We subsequently adjust the carrying amount of our investment to recognize our proportionate share of each equity investee’s net income or loss into earnings after the date of investment and its share of each equity investee’s movement in accumulated other comprehensive income or loss is recognize in other comprehensive (loss) income. When calculating our proportionate share of each equity investee’s net income or loss, we adjust the net income or loss of equity investee to include accretion of preferred stock that is classified in temporary equity in the investee’s financial statements into earnings. We will discontinue applying the equity method if an investment (plus additional financial support provided to the investee, if any) has been reduced to zero. When we have other investments in the equity-method investee and we are not required to advance additional funds to the investee, we would continue to report its share of equity method losses in our statements of comprehensive (loss) income after our equity-method investment in ordinary shares has been reduced to zero, to the extent of and as an adjustment to the adjusted basis of our other investments in the investee. Such losses are first applied to those investments of a lower liquidation preference before being further applied to the investments of a higher liquidation preference. We adopted a one-quarter lag in reporting for our share of equity income (loss) to a majority of our equity method investees.
We evaluate the equity method investments for impairment at each reporting date, or more frequently if events or changes in circumstances indicate that the carrying amount of the investment might not be recoverable. Factors considered by us when determining whether an investment has been other-than-temporarily-impaired, includes, but are not limited to, the length of the time and the extent to which the market value has been less than cost, the financial condition and near-term prospects of the investee, and our intent and ability to retain the investment until the recovery of its cost. An impairment loss on the equity method investments is recognized in earnings when the decline in value is determined to be other-than-temporary and is allocated to the individual net assets underlying equity method investments in the following order: 1) reduce any equity method goodwill to zero; 2) reduce the individual basis differences related to the investee’s long-lived assets pro rata based on their
169
Table of Contents
amounts relative to the overall basis difference at the impairment date and 3) reduce the individual basis difference of the investee’s remaining assets in a systematic and rational manner.
For equity investments in private equity funds, over which we do not have the ability to exercise significant influence, are measured using the net asset value per share based on the practical expedient in ASC Topic 820, Fair Value Measurements and Disclosures (“ASC 820”), or NAV practical expedient.
For equity securities without readily determinable fair value and do not qualify for the NAV practical expedient of the investment, we elected to use the measurement alternative to measure those investments at cost, less any impairment, plus or minus changes resulting from observable price changes in orderly transactions for identical or similar investments of the same issuer, if any. Significant judgments are required to determine (i) whether observable price changes are orderly transactions and identical or similar to an investment held by us, and (ii) the selection of appropriate valuation methodologies and underlying assumptions, including expected volatility and the probability of exit events as it relates to liquidation and redemption features used to measure the price adjustments for the difference in rights and obligations between instruments. Equity securities with readily determinable fair values are measured at fair value, and any changes in fair value are recognized in “Others, net” in the consolidated statements of comprehensive (loss) income.
For equity investments measured at fair value with changes in fair value recorded in earnings, we do not assess whether those securities are impaired. For equity investments that we elect to use the measurement alternative, we make a qualitative assessment considering impairment indicators to evaluate whether investments are impaired at each reporting date. Impairment indicators considered include, but are not limited to, a significant deterioration in the earnings performance or business prospects of the investee, including factors that raise significant concerns about the investee’s ability to continue as a going concern, a significant adverse change in the regulatory, economic, or technologic environment of the investee and a significant adverse change in the general market condition of either the geographical area or the industry in which the investee operates. If a qualitative assessment indicates that the investment is impaired, we estimate the investment’s fair value in accordance with the principles of ASC 820. If the fair value is less than the investment’s carrying value, we recognize an impairment loss in earnings equal to the difference between the carrying value and fair value.
In accordance with ASC Subtopic 946-320, Financial Services—Investment Companies, Investments—Debt and Equity Securities, our consolidated investment company accounts for long-term equity investments in unlisted companies at fair value. These investments were initially recorded at their transaction price net of transaction costs, if any. Fair values of these investments are re-measured at each reporting date in accordance with ASC 820.
Available-for-sale debt investments are convertible debt instruments issued by private companies and investments in preferred shares that are redeemable at our option, which are measured at fair value. Interest income is recognized in earnings. All other changes in the carrying amount of these debt investments are recognized in other comprehensive (loss) income.
Long-term time deposits and held-to-maturity investments
Long-term time deposits and held-to-maturity securities were mainly deposits in commercial banks and wealth management products issued by commercial banks and other financial institutions with maturities of greater than one year.
Investments in debt securities with maturities of greater than one year that we have positive intent and ability to hold to maturity are classified as long-term held-to-maturity investments and stated at amortized cost less allowance for credit losses.
170
Table of Contents
Licensed Copyrights, net
Licensed copyrights consist of professionally-produced content such as films, drama series, variety shows and other video content acquired from external parties. The license fees are capitalized and, unless prepaid, a corresponding liability is recorded when the cost of the content is known, the content is accepted by us in accordance with the conditions of the license agreement and the content is available for its first showing on our platforms. Licensed copyrights are presented on the consolidated balance sheets as current and non-current, based on estimated time of usage.
Our licensed copyrights include the right to broadcast and, in some instances, the right to sublicense. The broadcasting right, refers to the right to broadcast the content on its own platforms and the sublicensing right, refers to the right to sublicense the underlying content to external parties. When licensed copyrights include both broadcasting and sublicensing rights, the content costs are allocated to these two rights upon initial recognition, based on the relative proportion of the estimated total revenues that will be generated from each right over its estimated useful lives.
For the right to broadcast the contents on its own platforms that generates online advertising and membership services revenues, the content costs are amortized based on factors including historical and estimated future viewership patterns, using an accelerated method by content categories over the shorter of each content’s contractual period or estimated useful lives within ten years, beginning with the month of first availability. Content categories accounting for most of our content include newly released drama series, newly released films, animations, library drama series and library films. Estimates of future viewership consumption patterns and estimated useful lives are reviewed periodically, at least on an annual basis and revised, if necessary. Revisions to the amortization patterns are accounted for as a change in accounting estimate prospectively in accordance with ASC Topic 250, Accounting Changes and Error Corrections.
For the right to sublicense the content to external parties that generates direct content distribution revenues, the content costs are amortized based on its estimated usage pattern and recorded as cost of revenues.
Produced Content, net
We produce original content in-house and in collaboration with external parties. Produced content primarily consists of films, episodic series, variety shows and animations. The costs incurred in the physical production of original content include direct production costs, production overhead and acquisition costs. Produced content also includes cash expenditures made to acquire a proportionate share of certain rights to films including profit sharing, distribution and/or other rights. Exploitation costs are expensed as incurred. Participation costs are accrued using the individual-film-forecast-computation method, which recognizes the costs in the same ratio as the associated ultimate revenue. Production costs for original content that are predominantly monetized in a film group are capitalized. Production costs for original content predominantly monetized on its own are capitalized to the extent that they are recoverable from total revenues that are expected to be earned, or ultimate revenue; otherwise, they are expensed as cost of revenues.
Ultimate revenue estimates include revenue expected to be earned from all sources, including exhibition, licensing, or exploitation of produced content if we have demonstrated a history of earning such revenue. We estimate ultimate revenue to be earned during the estimated useful lives of produced content based on anticipated release patterns and historical results of similar produced content, which are identified based on various factors, including cast and crew, target audience and popularity. The capitalized production costs are reported separately as noncurrent assets with caption of “Produced content, net” on the consolidated balance sheets.
Based on factors including historical and estimated future viewership consumption patterns, we amortize produced content that is predominantly monetized in a film group. For produced content that is monetized on its own, we consider historical and estimated usage patterns to determine the pattern of amortization. Based on the
171
Table of Contents
estimated patterns, we amortize produced content using an accelerated method over its estimated useful lives within ten years, beginning with the month of first availability and such costs are included in “Cost of revenues” in the consolidated statements of comprehensive income.
Impairment of licensed copyrights and produced content
Our business model is mainly subscription and advertising based, as such the majority of our content assets (licensed copyrights and produced content) are predominantly monetized with other content assets, whereas a smaller portion of our content assets are predominantly monetized at a specific title level such as variety shows and investments in a proportionate share of certain film rights including profit sharing, distribution and/or other rights. Because the identifiable cash flows related to content launched on our mainland China platform are largely independent of the cash flows of other content launched on our overseas platform, we have identified two separate film groups. We review our film groups and individual content for impairment when there are events or changes in circumstances that indicate the fair value of a film group or individual content may be less than its unamortized costs. Examples of such events or changes in circumstances include, a significant adverse change in technological, regulatory, legal, economic, or social factors, that could affect the fair value of the film group or the public’s perception of a film or the availability of a film for future showings, a significant decrease in the number of subscribers or forecasted subscribers, or the loss of a major distributor, a change in the predominant monetization strategy of a film that is currently monetized on its own, actual costs substantially in excess of budgeted costs, substantial delays in completion or release schedules, or actual performance subsequent to release failing to meet expectations set before release such as a significant decrease in the amount of ultimate revenue expected to be recognized.
When such events or changes in circumstances are identified, we assess whether the fair value of an individual content (or film group) is less than its unamortized film costs, determines the fair value of an individual content (or film group) and recognizes an impairment charge for the amount by which the unamortized capitalized costs exceed the individual content’s (or film group’s) fair value. We mainly use a discounted cash flow approach to determine the fair value of an individual content or film group, of which the most significant inputs include the forecasted future revenues, costs and operating expenses attributable to an individual content or the film group and the discount rate. An impairment loss attributable to a film group is allocated to individual licensed copyrights and produced content within the film group on a pro rata basis using the relative carrying values of those assets as we cannot estimate the fair value of individual contents in the film group without undue cost and effort.
Business Combinations
We account for our business combinations using the acquisition method in accordance with ASC Topic 805, Business Combinations. The acquisition method requires that the consideration transferred to be allocated to the assets, including separately identifiable assets and liabilities we acquired, based on their estimated fair values. The consideration transferred in an acquisition is measured as the aggregate of the fair values at the date of exchange of the assets given, liabilities incurred, and equity instruments issued as well as the contingent considerations as of the acquisition date. The costs directly attributable to the acquisition are expensed as incurred. Identifiable assets, liabilities and contingent liabilities acquired or assumed are measured separately at their fair value as of the acquisition date, irrespective of the extent of any noncontrolling interests. The excess of (i) the total of cost of acquisition, fair value of the noncontrolling interests and acquisition date fair value of any previously held equity interests in the acquiree over (ii) the fair value of the identifiable net assets of the acquiree, is recorded as goodwill. If the cost of acquisition is less than the fair value of the net assets of the subsidiary acquired, the difference is recognized directly in earnings.
In a business combination achieved in stages, we re-measured our previously held equity interest in the acquiree immediately before obtaining control at its acquisition-date fair value and the re-measurement gain or loss, if any, is recognized in “Others, net” in the consolidated statements of comprehensive (loss) income.
172
Table of Contents
The determination and allocation of fair values to the identifiable assets acquired, liabilities assumed and noncontrolling interests are based on various assumptions and valuation methodologies requiring considerable judgment from management. The most significant variables in these valuations are discount rates, the number of years on which to base the cash flow projections, as well as the assumptions and estimates used to determine the cash inflows and outflows. We determine discount rates to be used based on the risk inherent in the related activity’s current business model and industry comparisons.
| B. | Liquidity and Capital Resources |
As of December 31, 2023, we had RMB205.4 billion (US$28.9 billion) in cash, cash equivalents, restricted cash and short-term investments, and the variable interest entities had RMB10.0 billion (US$1.4 billion) of cash, cash equivalents, restricted cash, and short-term investments. The cash and cash equivalents consist of cash on hand and investments in interest-bearing demand deposit accounts, time deposits, money market funds and other liquid investments which have original maturities of three months or less. The restricted cash primarily consists of amounts deposited and held in escrow for the proposed acquisition of YY Live, the share purchase agreement for which has been terminated. The short-term investments primarily consist of fixed-rate and adjustable-rate debt investments with original maturity of less than one year.
We believe that our current cash, cash equivalents, restricted cash and short-term investments and anticipated cash flow from operations will be sufficient to meet our anticipated cash needs, including our cash needs for working capital, capital expenditures and debt repayment, for at least the next 12 months. We may, however, require additional cash due to changing business conditions or other future developments, including any investments or acquisitions we may decide to pursue, and we may incur additional indebtedness (such as loans, convertible senior notes and notes) in the future.
Furthermore, cash transfers from our mainland China subsidiaries to their parent companies outside of mainland China are subject to PRC government control of currency conversion. Shortages in the availability of foreign currency may restrict the ability of our mainland China subsidiaries and the variable interest entities to remit sufficient foreign currency to pay dividends or other payments to their parent companies outside of mainland China or our company, or otherwise satisfy their foreign currency denominated obligations. See “Item 3.D. Key Information—Risk Factors—Risks Related to Doing Business in China—Governmental control of currency conversion may affect the value of your investment.” As of December 31, 2023, our mainland China subsidiaries and the variable interest entities held RMB168.1 billion (US$23.7 billion) of cash, cash equivalents, restricted cash, and short-term investments, RMB217 million (US$31 million) of which were in the form of foreign currencies. As of December 31, 2023, we have made long-term loans in an aggregate principal amount of RMB19.2 billion (US$2.7 billion) to the nominee shareholders of the variable interest entities. As of the date of this annual report, we do not have any repayment schedule with respect to such loans to the nominee shareholders of the variable interest entities.
Equity financing
Baidu, Inc. raised approximately US$3.1 billion in net proceeds from its global offering in connection with the listing in Hong Kong in March 2021 after deducting underwriting commissions, share issuance costs and the offering expenses.
iQIYI raised an aggregate amount of US$285 million through private investments of ordinary shares in March 2022. iQIYI received net proceeds of US$500 million through a public offering of ordinary shares in the form of ADSs in January 2023.
Short-term loans
The total outstanding balance of our short-term loans as of December 31, 2021, 2022 and 2023 was RMB4.2 billion, RMB5.3 billion and RMB10.3 billion (US$1.4 billion), respectively, which consisted of RMB
173
Table of Contents
denominated borrowings made by our subsidiaries from financial institutions in mainland China and were repayable within one year. The total outstanding balance of iQIYI’s short-term loans as of December 31, 2021, 2022 and 2023 was RMB4.1 billion, RMB3.3 billion and RMB3.6 billion (US$503 million), respectively. The total outstanding balance of Baidu Core’s short-term loans as of December 31, 2022 and 2023 amounted to RMB2.0 billion and RMB6.7 billion (US$942 million), respectively.
As of December 31, 2021, 2022 and 2023, the repayments of primarily all of the iQIYI’s short-term loans are guaranteed by subsidiaries of iQIYI and collateralized either by an office building of one of iQIYI’s VIEs with a carrying amount of RMB535 million, RMB522 million and RMB509 million (US$72 million), respectively, or restricted cash balances totaling US$5 million, nil and nil, respectively.
As of December 31, 2021, 2022 and 2023, the weighted average interest rates for the outstanding borrowings were 4.80%, 3.42% and 2.82%, respectively, and the aggregate amounts of unused lines of credit for short-term loans were RMB2.8 billion, RMB2.6 billion and RMB12.8 billion (US$1.8 billion), respectively.
Long-term loans
In April 2021, we entered into a five-year US$3.0 billion term and revolving facilities agreement with a group of 22 arrangers. The facilities consist of a US$1.5 billion five-year bullet maturity term loan and a US$1.5 billion five-year revolving facility. The facility was priced at 85 basis points over LIBOR and is intended for the general corporate purposes. In June 2021, we drew down US$1.5 billion term loan and US$500 million revolving loan under the facility commitment. In June 2023, the facilities were modified and priced at 93 basis points over SOFR (secured overnight financing rate). In connection with the drawdowns and the modification, we entered into and restructured the two interest rate swap agreements, pursuant to which each of the loans would be settled with a fixed annual interest rate of 1.71% during the respective terms of the loans.
Debt securities issuances
We have conducted the following rounds of debt securities issuances, which remain outstanding as of the date of this annual report:
| • | In June 2015, we issued an aggregate of US$500 million senior unsecured notes due in 2025, or the 2025 Ten-year Notes, with stated annual interest rate of 4.125%. The net proceeds from the sale of the notes were used for general corporate purposes. As of December 31, 2023, the total carrying value and estimated fair value were US$500 million and US$492 million, respectively, with respect to the 2025 Ten-year Notes. The estimated fair values were based on quoted prices for our publicly-traded debt securities as of December 31, 2023. We are not subject to any financial covenants or other significant restrictions under the 2025 Ten-year Notes. In 2023, we paid an aggregate of US$21 million in interest payments related to the 2025 Ten-year Notes. |
| • | In July 2017, we issued an aggregate of US$600 million senior unsecured notes due in 2027, or the 2027 Ten-year Notes, with stated annual interest rate of 3.625%. The net proceeds from the sale of the notes were used to repay existing indebtedness and for general corporate purposes. As of December 31, 2023, the total carrying value and estimated fair value were US$600 million and US$576 million, respectively, with respect to the 2027 Ten-year Notes. The estimated fair values were based on quoted prices for our publicly-traded debt securities as of December 31, 2023. We are not subject to any financial covenants or other significant restrictions under the notes. In 2023, we paid an aggregate of US$22 million in interest payments related to the 2027 Ten-year Notes. |
| • | In March 2018, we issued an aggregate of US$1.0 billion senior unsecured notes due in 2023, or the 2023 Notes, with stated annual interest rate of 3.875%, and an aggregate of US$500 million senior unsecured notes due in 2028, or the 2028 March Notes, with stated annual interest rate of 4.375%. The net proceeds from the sale of the notes were used to repay existing indebtedness and for general |
174
Table of Contents
| corporate purposes. In September 2023, the 2023 Notes were fully repaid when they became due. As of December 31, 2023, the total carrying value and estimated fair value of the 2028 March Notes were US$500 million and US$491 million, respectively. The estimated fair values were based on quoted prices for our publicly-traded debt securities as of December 31, 2023. We are not subject to any financial covenants or other significant restrictions under the 2028 March Notes. In 2023, we paid an aggregate of US$61 million in interest payments related to these notes. |
| • | In November 2018, we issued an aggregate of US$600 million senior unsecured notes due in 2024, or the 2024 November Notes, with stated annual interest rate of 4.375%, and an aggregate of US$400 million senior unsecured notes due in 2028, or the 2028 November Notes, with stated annual interest rate of 4.875%. In December 2018, we issued an aggregate of US$250 million senior unsecured notes due in 2024, or the 2024 December Notes, with stated annual interest rate of 4.375%, which constitute a further issuance of, and be fungible with and be consolidated and form a single series with the 2024 November Notes. The net proceeds from the sale of the notes were used to repay existing indebtedness and for general corporate purposes. As of December 31, 2023, the total carrying value and estimated fair value were US$600 million and US$596 million, respectively, with respect to the 2024 November Notes, US$400 million and US$400 million, respectively, with respect to the 2028 November Notes, and US$250 million and US$249 million, respectively, with respect to the 2024 December Notes. The estimated fair values were based on quoted prices for our publicly-traded debt securities as of December 31, 2023. We are not subject to any financial covenants or other significant restrictions under the notes. In 2023, we paid an aggregate of US$57 million in interest payments related to these notes. |
| • | In April 2020, we issued an aggregate of US$600 million senior unsecured notes due in 2025, or the 2025 Five-year Notes, with stated annual interest rate of 3.075%, and an aggregate of US$400 million senior unsecured notes due in 2030, or the 2030 April Notes, with stated annual interest rate of 3.425%. The net proceeds from the sale of the notes were used to repay existing indebtedness and for general corporate purposes. As of December 31, 2023, the total carrying value and estimated fair value were US$600 million and US$583 million, respectively, with respect to the 2025 Five-Year Notes, US$400 million and US$363 million, respectively, with respect to the 2030 April Notes. The estimated fair values were based on quoted prices for our publicly-traded debt securities as of December 31, 2023. We are not subject to any financial covenants or other significant restrictions under the notes. In 2023, we paid an aggregate of US$32 million in interest payments related to these notes. |
| • | In October 2020, we issued an aggregate of US$650 million senior unsecured notes due in 2026, or the 2026 Notes, with stated annual interest rate of 1.720%, and an aggregate of US$300 million senior unsecured notes due in 2030, or the 2030 October Notes, with stated annual interest rate of 2.375%. The net proceeds from the sale of the notes are to be used to repay existing indebtedness. As of December 31, 2023, the total carrying value and estimated fair value were US$650 million and US$603 million, respectively, with respect to the 2026 Notes, and US$300 million and US$253 million, respectively, with respect to the 2030 October Notes. The estimated fair values were based on quoted prices for our publicly-traded debt securities as of December 31, 2023. We are not subject to any financial covenants or other significant restrictions under the notes. In 2023, we paid an aggregate of US$18 million in interest payments related to these notes. |
| • | In August 2021, we issued an aggregate of US$300 million senior unsecured notes due in 2027, or the 2027 Five-year Notes, with stated annual interest rate of 1.625%, and an aggregate of US$700 million senior unsecured notes due in 2031, or the 2031 Notes, with stated annual interest rate of 2.375%. The net proceeds from the sale of the notes are to be used for general corporate purposes, including repayment of certain existing indebtedness. As of December 31, 2023, the total carrying value and estimated fair value were US$300 million and US$272 million, respectively, with respect to the 2027 Five-year Notes, and US$700 million and US$578 million, respectively, with respect to the 2031 Notes. The estimated fair values were based on quoted prices for our publicly-traded debt securities as of December 31, 2023. We are not subject to any financial covenants or other significant restrictions |
175
Table of Contents
| under the notes. In 2023, we paid an aggregate of US$22 million in interest payments related to these notes. |
Under the terms of the indentures governing the 2025 Ten-year Notes, the 2027 Ten-year Notes and the 2028 March Notes, events of default include, among others, there occurring with respect to any of our indebtedness or indebtedness of our principal controlled entities, an event of default resulting in accelerated maturity or a failure to pay principal, interest or premium when due, and that the outstanding principal amount under payment default or accelerated maturity equals or exceeds the greater of US$100 million and 2.5% of our total equity. Under such indentures, principal controlled entities refer to entities as to which one or more of the following conditions is/are satisfied: (i) its total revenue or consolidated total revenue attributable to our company is at least 5% of our consolidated total revenue, (ii) its net profit or consolidated net profit attributable to our company is at least 5% of our consolidated net profit; or (iii) its net assets or consolidated net assets attributable to our company are at least 10% of our consolidated net assets. For example, iQIYI constitutes a principal controlled entity under such indentures.
Under the terms of the indentures governing the 2024 November Notes, the 2024 December Notes (consolidated into and form a single series with the 2024 November Notes), the 2028 November Notes, the 2025 Five-year Notes, the 2030 April Notes, the 2026 Notes, the 2030 October Notes, the 2027 Five-year Notes and the 2031 Notes, events of default include, among others, there occurring with respect to any of our company’s indebtedness, an event of default resulting in accelerated maturity or a failure to pay principal, interest or premium when due, and that the outstanding principal amount under payment default or accelerated maturity equals or exceeds the greater of US$100 million and 2.5% of our total equity.
If any such event of default were to take place, the holders of those notes may declare the principal of notes to be due and payable prior to the stated maturity. Under the terms of the indentures governing the various notes, a declaration of acceleration of the relevant series of notes will be automatically annulled if such event of default is remedied or cured by our company or any of our company’s principal controlled entities, in the case of the 2025 Ten-year Notes, the 2027 Ten-year Notes and the 2028 March Notes, or our company, in the case of the 2024 November Notes, the 2024 December Notes, the 2028 November Notes, the 2025 Five-year Notes, the 2030 April Notes, the 2026 Notes, the 2030 October Notes, the 2027 Five-year Notes and the 2031 Notes, or waived by the holders of the relevant notes within 30 days after the declaration of acceleration with respect thereto and if the annulment of the acceleration of those notes would not conflict with any judgment or decree of a court of competent jurisdiction. As of December 31, 2023, there was no such event of default.
iQIYI convertible notes
iQIYI has conducted the following issuances of convertible notes, which remain outstanding as of the date of this annual report:
| • | On March 29, 2019, iQIYI issued US$1.2 billion convertible senior notes, or the iQIYI 2025 Convertible Notes. The iQIYI 2025 Convertible Notes are senior, unsecured obligations of iQIYI, and interest is payable semi-annually in cash at a rate of 2.00% per annum on October 1 and April 1 of each year, beginning on October 1, 2019. The iQIYI 2025 Convertible Notes will mature on April 1, 2025 unless redeemed, repurchased or converted prior to such date. |
The initial conversion rate of the iQIYI 2025 Convertible Notes is 33.0003 of iQIYI’s ADS per US$1,000 principal amount of the iQIYI 2025 Convertible Notes (which is equivalent to an initial conversion price of approximately US$30.30 per ADS). Prior to October 1, 2024, the iQIYI 2025 Convertible Notes will be convertible at the option of the holders only upon the following circumstances: (1) during any calendar quarter commencing after the calendar quarter ending on June 30, 2019, if the last reported sale price of ADSs for at least 20 trading days (whether or not consecutive) during a period of 30 consecutive trading days ending on, and including, the last trading day of the immediately preceding calendar quarter is greater than or equal to 130% of the conversion
176
Table of Contents
price; (2) during the five business day period after any ten consecutive trading day period in which the trading price per US$1,000 principal amount of notes was less than 98% of the product of the last reported sale price of the ADSs and the conversion rate on each such trading day; (3) if iQIYI calls the notes for a tax redemption; or (4) upon the occurrence of specified corporate events. Thereafter, the iQIYI 2025 Convertible Notes will be convertible at the option of the holders at any time until the close of business on the second scheduled trading day immediately preceding the maturity date. The conversion rate is subject to adjustment in some events but is not adjusted for any accrued and unpaid interest. In addition, following a make-whole fundamental change that occurs prior to the maturity date or following iQIYI’s delivery of a notice of a tax redemption, iQIYI will increase the conversion rate for a holder who elects to convert its notes in connection with such a corporate event or such tax redemption. Upon conversion, iQIYI will pay or deliver to such converting holders, as the case may be, cash, ADSs, or a combination of cash and ADSs, at its election.
The holders may require iQIYI to repurchase all or a portion of the iQIYI 2025 Convertible Notes for cash on April 1, 2023, or upon a fundamental change, at a repurchase price equal to 100% of the principal amount, plus accrued and unpaid interest.
In connection with the issuance of the iQIYI 2025 Convertible Notes, iQIYI purchased capped call options on iQIYI’s ADS with certain counterparties at a price of US$85 million. The counterparties agreed to sell to iQIYI up to approximately 40 million of iQIYI’s ADSs upon iQIYI’s exercise of the capped call. The exercise price is equal to the iQIYI 2025 Convertible Notes’ initial conversion price and the cap price is US$40.02 per ADS, subject to certain adjustments under the terms of the capped call transactions. The capped call transactions are expected to reduce potential dilution to existing holders of the ordinary shares and ADSs of iQIYI upon conversion of the iQIYI 2025 Convertible Notes and/or offset any potential cash payments that iQIYI is required to make in excess of the principal amount of any converted notes, as the case may be, with such reduction and/or offset subject to a cap.
| • | On December 21, 2020, iQIYI issued US$800 million convertible senior notes and offered an additional US$100 million principal amount simultaneously, pursuant to the underwriters’ option to purchase additional notes. On January 8, 2021, the additional US$100 million principal amount was issued pursuant to the underwriters’ exercise of their option. The convertible senior notes issued on December 21, 2020 and January 8, 2021, or collectively, the iQIYI 2026 Convertible Notes, are senior, unsecured obligations of iQIYI, and interest is payable semi-annually in cash at a rate of 4.00% per annum on June 15 and December 15 of each year, beginning on June 15, 2021. The iQIYI 2026 Convertible Notes will mature on December 15, 2026 unless redeemed, repurchased or converted prior to such date. |
The initial conversion rate of the iQIYI 2026 Convertible Notes is 44.8179 of iQIYI’s ADS per US$1,000 principal amount of the iQIYI 2026 Convertible Notes (which is equivalent to an initial conversion price of approximately US$22.31 per ADS). Prior to June 15, 2026, the iQIYI 2026 Convertible Notes will be convertible at the option of the holders only upon the following circumstances: (1) during any calendar quarter commencing after the calendar quarter ending on March 31, 2021, if the last reported sale price of ADSs for at least 20 trading days (whether or not consecutive) during a period of 30 consecutive trading days ending on, and including, the last trading day of the immediately preceding calendar quarter is greater than or equal to 130% of the conversion price; (2) during the five business day period after any ten consecutive trading day period in which the trading price per US$1,000 principal amount of notes was less than 98% of the product of the last reported sale price of the ADSs and the conversion rate on each such trading day; (3) if iQIYI calls the notes for a tax redemption; or (4) upon the occurrence of specified corporate events. Thereafter, the iQIYI 2026 Convertible Notes will be convertible at the option of the holders at any time until the close of business on the second scheduled trading day immediately preceding the maturity date. The conversion rate is subject to adjustment in some events but is not adjusted for any accrued and unpaid interest. In addition, following a make-whole fundamental change that occurs prior to the maturity date
177
Table of Contents
or following iQIYI’s delivery of a notice of a tax redemption, iQIYI will increase the conversion rate for a holder who elects to convert its notes in connection with such a corporate event or such tax redemption. Upon conversion, iQIYI will pay or deliver to such converting holders, as the case may be, cash, ADSs, or a combination of cash and ADSs, at its election.
The holders may require iQIYI to repurchase all or a portion of the iQIYI 2026 Convertible Notes for cash on August 1, 2024, or upon a fundamental change, at a repurchase price equal to 100% of the principal amount, plus accrued and unpaid interest.
| • | On December 30, 2022, iQIYI issued US$500 million convertible senior notes, pursuant to the definitive agreements entered into with PAGAC IV-1 (Cayman) Limited, PAG Pegasus Fund LP and/or their affiliates, or collectively, the Investors, in August 2022. IQIYI also offered an additional US$50 million principal amount simultaneously pursuant to the Investors’ option to purchase additional notes. On February 24, 2023, the additional US$50 million principal amount was issued pursuant to the Investors’ exercise of their option. The convertible senior notes issued on December 30, 2022 and February 24, 2023, or collectively, the iQIYI PAG Convertible Notes, are senior, secured obligations of iQIYI by certain collateral arrangements, and interest is payable quarterly in cash at a rate of 6.00% per annum on January 1, April 1, July 1 and October 1 of each year, beginning on April 1, 2023. The iQIYI PAG Convertible Notes will mature on the fifth anniversary of the issuance date unless redeemed, repurchased or converted prior to such date. |
The iQIYI PAG Convertible Notes will be convertible at the holder’s option at any time prior to the close of business on the second scheduled trading day immediately preceding the maturity date and subject to the terms of the iQIYI PAG Convertible Notes, at an initial conversion rate of 216.9668 ADS per US$1,000 principal amount of the iQIYI PAG Convertible Notes (which is equivalent to an initial conversion price of approximately US$4.61 per ADS). Following a make-whole fundamental change that occurs prior to the maturity date, iQIYI will increase the conversion rate for a holder who elects to convert its notes in connection with such make-whole fundamental change.
Holders of the iQIYI PAG Convertible Notes have the right to require iQIYI to repurchase for cash all or part of their Notes at a repurchase price equal to 120% and 130% of the principal amount of the iQIYI PAG Convertible Notes on or shortly after the third anniversary of the issuance date and the fifth anniversary of the issuance date, respectively. Upon the closing of the transaction, the Investors have appointed the executive chairman of PAG as a member to the board of directors, a member of the compensation committee and a non-voting member of the audit committee of iQIYI pursuant to their rights in the definitive agreements. For the year ended December 31, 2023, the amount of interest cost recognized of iQIYI PAG Convertible Notes was RMB473 million (US$67 million). The repayments of iQIYI PAG Convertible Notes are guaranteed by equity interests of certain subsidiaries of iQIYI and collateralized by partial cash consideration related to certain contracts for which RMB840 million (US$118 million) cash consideration has been charged as of December 31, 2023 and recorded as long-term restricted cash.
| • | On March 7, 2023, iQIYI issued US$600 million convertible senior notes, or the iQIYI 2028 Convertible Notes. The iQIYI 2028 Convertible Notes are senior, unsecured obligations of iQIYI, and interest is payable quarterly in cash at a rate of 6.50% per annum on March 15, June 15, September 15 and December 15 of each year, beginning on June 15, 2023. The iQIYI 2028 Convertible Notes will mature on March 15, 2028 unless redeemed, repurchased or converted prior to such date. |
The initial conversion rate of the iQIYI 2028 Convertible Notes is 101.4636 of iQIYI’s ADS per US$1,000 principal amount of the iQIYI 2028 Convertible Notes (which is equivalent to an initial conversion price of approximately US$9.86 per ADS). Prior to September 15, 2027, the iQIYI 2028 Convertible Notes will be convertible at the option of the holders only upon the following circumstances: (1) during any calendar quarter commencing after the calendar quarter ending on June 30, 2023 (and only during such calendar quarter), if the last reported sale price of ADSs for at least 20 trading days (whether or not consecutive) during a period of 30 consecutive trading days
178
Table of Contents
ending on, and including, the last trading day of the immediately preceding calendar quarter is greater than or equal to 130% of the conversion price; (2) during the five business day period after any ten consecutive trading day period in which the trading price per US$1,000 principal amount of notes was less than 98% of the product of the last reported sale price of the ADSs and the conversion rate on each such trading day; (3) if iQIYI calls the notes for a tax redemption or an optional redemption; or (4) upon the occurrence of specified corporate events. Thereafter, the iQIYI 2028 Convertible Notes will be convertible at the option of the holders at any time until the close of business on the second scheduled trading day immediately preceding the maturity date. The conversion rate is subject to adjustment in some events but is not adjusted for any accrued and unpaid interest. In addition, following a make-whole fundamental change that occurs prior to the maturity date or following iQIYI’s delivery of a notice of a tax redemption, iQIYI will increase the conversion rate for a holder who elects to convert its notes in connection with such a corporate event or such tax redemption. Upon conversion, iQIYI will pay or deliver to such converting holders, as the case may be, cash, ADSs, or a combination of cash and ADSs, at its election.
The holders may require iQIYI to repurchase all or a portion of the iQIYI 2028 Convertible Notes for cash on March 16, 2026, or upon a fundamental change, at a repurchase price equal to 100% of the principal amount, plus accrued and unpaid interest. On or after March 20, 2026, iQIYI may redeem for cash all or part of the iQIYI 2028 Convertible Notes, at its option, if the last reported sale price of ADSs has been at least 130% of the conversion price then in effect on (i) each of at least 20 trading days (whether or not consecutive) during the period of 30 consecutive trading days ending on, and including, the trading day immediately prior to the date iQIYI provides the optional redemption notice and (ii) the trading day immediately preceding the date iQIYI provides the optional redemption notice.
If any event of default are to take place, the trustee or the holders of at least 25% in aggregate principal amount may declare the whole principal of (or, in the case of the iQIYI PAG Convertible Notes, 120% or 130% of the principal amount for such notes, as the case may be, depending on the date of occurrence of the event of default), and accrued and unpaid interest on, all the outstanding convertible senior notes to be due and payable immediately, subject to certain exceptions and conditions under the respective indenture. iQIYI may also be required to pay additional interest.
If any fundamental change are to take place, holders of the notes will have the right, at their option, to require iQIYI to repurchase all of their notes or any portion of the principal amount (or, in the case of the iQIYI PAG Convertible Notes, 120% or 130% of the principal amount for such notes, as the case may be, depending on the date of occurrence of the fundamental change), and accrued and unpaid interests. In the event of a fundamental change, iQIYI may also be required to issue additional ADSs upon conversion of its convertible notes. As of December 31, 2023, there was no such event of default or fundamental change.
We may use the net proceeds from our issuance and sale of the notes to fund the operations of our mainland China subsidiaries by making additional capital contributions to our existing mainland China subsidiaries, injecting capital to establish new mainland China subsidiaries and/or providing loans to our mainland China subsidiaries. Such transfer of funds from Baidu, Inc. or any of our offshore subsidiaries to our mainland China subsidiaries is subject to the PRC regulatory restrictions and procedures: (i) capital increase of the existing mainland China subsidiaries and establishment of new mainland China subsidiaries must be registered with the local branch of SAMR and reported to the Ministry of Commerce via the online enterprise registration system, and registered with local banks authorized by SAFE; and (ii) loans to any of our mainland China subsidiaries must not exceed the statutory limit and must be filed with SAFE. See “Item 3.D. Key Information—Risk Factors—Risks Related to Doing Business in China—Mainland China’s regulation of loans to and direct investment in entities in mainland China by offshore holding companies and governmental control of currency conversion may delay or prevent us from making loans to our mainland China subsidiaries, the variable interest entities and certain related parties, or making additional capital contributions to our mainland China subsidiaries, which could adversely affect our ability to fund and expand our business.”
179
Table of Contents
As of December 31, 2021, 2022 and 2023, we had RMB66.3 billion, RMB60.5 billion and RMB55.2 billion (US$7.8 billion) in long-term loans and notes payables (including current portion of RMB10.5 billion, RMB6.9 billion and RMB6.0 billion (US$849 million)), RMB12.7 billion, RMB17.9 billion and RMB10.9 billion (US$1.5 billion) in long-term convertible notes (including current portion of nil, RMB8.3 billion and RMB2.8 billion (US$395 million)), RMB8.4 billion, RMB7.6 billion and RMB8.1 billion (US$1.1 billion) in lease liabilities (including current portion of RMB2.9 billion, RMB2.8 billion and RMB3.1 billion (US$438 million)) and had RMB4.2 billion, RMB5.3 billion and RMB10.3 billion (US$1.4 billion) in short-term loans, respectively. Our long-term loans and notes payable, long-term convertible notes and short-term loans include those of iQIYI hereinafter. As of December 31, 2021, 2022 and 2023, iQIYI had nil, nil and RMB100 million (US$14 million) in long-term loans payables (including current portion of nil, nil, and RMB2 million), RMB12.7 billion, RMB17.9 billion and RMB10.9 billion (US$1.5 billion) in long-term convertible notes (including current portion of nil, RMB8.3 billion and RMB2.8 billion (US$395 million)), RMB797 million, RMB612 million and RMB625 million (US$88 million) in lease liabilities (including current portion of RMB172 million, RMB104 million and RMB101 million (US$14 million)) and had RMB4.1 billion, RMB3.3 billion and RMB3.6 billion (US$503 million) in short-term loans, respectively.
Accounting for Convertible Senior Notes
We adopted ASU No. 2020-06, Accounting for Convertible Instruments and Contracts in an Entity’s Own Equity by using a modified retrospective transition method through a cumulative-effect adjustment on January 1, 2022. After the adoption of ASU 2020-06, as the iQIYI 2023 Convertible Notes, the iQIYI 2025 Convertible Notes, the iQIYI 2026 Convertible Notes, the iQIYI 2028 Convertible Notes and the iQIYI PAG Convertible Notes, or collectively, the iQIYI Notes, were not issued at a substantial premium, all of the proceeds received from the issuance of the iQIYI Notes are recorded as a liability on the consolidated balance sheet in accordance with ASC 470-20. That is, no portion of the proceeds from issuing the iQIYI Notes are attributed to the conversion option at inception. The difference between the principal amount of each of the iQIYI Notes and net proceeds from the issuance is considered debt discount and is amortized at their respective effective interest rates to accrete the carrying value of the iQIYI Notes to its face value (120% of the principal amount for iQIYI PAG Convertible Notes) on the respective put dates of the iQIYI Notes. For the year ended December 31, 2023, the effective interest rates of the iQIYI 2026 Convertible Notes, the iQIYI PAG Convertible Notes and the iQIYI 2028 Convertible Notes were 4.53%, 12.05%, 7.15%, respectively.
The cost of the 2023 Capped Call and 2025 Capped Call of US$68 million and US$85 million were recorded as a reduction of our company’s additional paid-in capital and non-controlling interests on the consolidated balance sheets with no subsequent changes in fair value recorded.
In 2023, the net proceeds from the issuance of the iQIYI 2028 Convertible Notes was US$590 million, after deducting underwriting discounts and offering expenses of US$10 million from the initial proceeds of US$600 million.
In 2021 and 2023, iQIYI repurchased the iQIYI 2023 Convertible Notes and the iQIYI 2025 Convertible Notes with aggregate principal amount of US$747 million and US$1.2 billion (equivalent to RMB8.5 billion), respectively, as requested by the holders. In 2023, iQIYI repurchased the iQIYI 2026 Convertible Notes and the iQIYI 2028 Convertible Notes with the aggregate principal amount of US$504 million (equivalent to RMB3.6 billion) and US$26 million (equivalent to RMB185 million), respectively, upon separate and individually privately negotiated agreements with certain holders. Following settlement of the repurchase, a difference between the net carrying amount of the repurchased iQIYI notes and the repurchased price was recognized as extinguishment gain and reported in “Others, net” in the consolidated statements of comprehensive income.
180
Table of Contents
The carrying amount of the iQIYI Notes as of December 31, 2022 and 2023 were as follows:
| As of December 31, 2022 | As of December 31, 2023 | |||||||||||
| RMB | RMB | US$ | ||||||||||
| (In millions) | ||||||||||||
| Principal |
17,986 | 10,801 | 1,522 | |||||||||
| Less: unamortized discount and debt issuance costs |
112 | (145 | ) | (20 | ) | |||||||
|
|
|
|
|
|
|
|||||||
| Net carrying amount |
17,874 | 10,946 | 1,542 | |||||||||
|
|
|
|
|
|
|
|||||||
For the years ended December 31, 2021, 2022 and 2023, the amounts of interest cost recognized were as follows:
| For the years ended December 31, | ||||||||||||||||
| 2021 | 2022 | 2023 | 2023 | |||||||||||||
| (In millions) | ||||||||||||||||
| RMB | RMB | RMB | US$ | |||||||||||||
| Contractual interest expense |
557 | 404 | 644 | 91 | ||||||||||||
| Amortization of the discount and issuance costs |
559 | 66 | 292 | 41 | ||||||||||||
|
|
|
|
|
|
|
|
|
|||||||||
| Total |
1,116 | 470 | 936 | 132 | ||||||||||||
|
|
|
|
|
|
|
|
|
|||||||||
As of December 31, 2023, the iQIYI 2026 Convertible Notes, iQIYI PAG Convertible Notes and iQIYI 2028 Convertible Notes will be accreted up to the principal amount of US$396 million, US$660 million (120% of the principal amount of iQIYI PAG Convertible Notes) and US$574 million over a remaining period of 0.59 year, 2.00 years and 2.21 years, respectively. The amount repayable within the next twelve months are classified as “Convertible senior notes, current portion” on the consolidated balance sheets.
The aggregate amounts upon scheduled maturities of US$2 million, US$396 million and US$1.3 billion (equivalent to RMB17 million, RMB2.8 billion and RMB9.2 billion, respectively) of the iQIYI Notes will be repaid when they become due in 2025, 2026 and 2028, respectively, assuming there is no conversion of the iQIYI Notes, no redemption of the iQIYI Notes prior to their maturities, the convertible senior notes bondholders hold the iQIYI Notes until their maturities and iQIYI elects to fully settle the iQIYI Notes in cash.
Cash Flows
As of December 31, 2021, 2022 and 2023, we had RMB190.9 billion, RMB185.3 billion and RMB205.4 billion (US$28.9 billion) in cash, cash equivalents, restricted cash and short-term investments. As of December 31, 2022 and 2023, we had RMB750 million and RMB840 million (US$118 million) in long-term restricted cash, which was included in “Other non-current assets” in the consolidated balance sheet.
We entered into definitive agreements with JOYY in November 2020, which were subsequently amended and supplemented, including in February 2021, to acquire YY Live for an aggregate purchase price of approximately US$3.6 billion in cash, subject to certain adjustments. The closing of this acquisition is subject to certain conditions, including, among others, obtaining necessary regulatory approvals from government authorities, and the share purchase agreement is subject to termination by either party if the closing does not occur by the long stop date. As of December 31, 2023, the long stop date, the closing conditions provided for in the share purchase agreement had not been fully satisfied. On January 1, 2024, we exercised our contractual right to terminate the share purchase agreement. We have paid an aggregate of US$1.9 billion, after considering working capital adjustment of US$0.1 billion, to JOYY and its designated escrow account, and deposited an aggregate of US$1.6 billion into several escrow accounts, in accordance with the terms and schedule set forth in the share repurchase agreement. See “Item 3.D. Key Information—Risk Factors—Risks Related to Our Business and Industry—We face risks arising from our termination of the share purchase agreement for our proposed acquisition of YY Live.”
181
Table of Contents
The following table sets forth a summary of our cash flows for the years indicated:
| Year ended December 31, | ||||||||||||||||
| 2021 | 2022 | 2023 | ||||||||||||||
| RMB | RMB | RMB | US$ | |||||||||||||
| (in millions) | ||||||||||||||||
| Net cash provided by operating activities |
20,122 | 26,170 | 36,615 | 5,157 | ||||||||||||
| Net cash used in investing activities |
(31,444 | ) | (3,944 | ) | (50,397 | ) | (7,098 | ) | ||||||||
| Net cash provided by (used in) financing activities |
23,396 | (6,390 | ) | (14,162 | ) | (1,995 | ) | |||||||||
| Effect of exchange rate changes on cash, cash equivalents and restricted cash |
(943 | ) | 1,729 | 282 | 40 | |||||||||||
|
|
|
|
|
|
|
|
|
|||||||||
| Net increase (decrease) in cash, cash equivalents and restricted cash |
11,131 | 17,565 | (27,662 | ) | (3,896 | ) | ||||||||||
|
|
|
|
|
|
|
|
|
|||||||||
| Cash, cash equivalents and restricted cash at beginning of the year |
36,540 | 47,671 | 65,236 | 9,188 | ||||||||||||
| Cash, cash equivalents and restricted cash at end of the year |
47,671 | 65,236 | 37,574 | 5,292 | ||||||||||||
Operating Activities
Net cash provided by operating activities increased to RMB36.6 billion (US$5.2 billion) in 2023 from RMB26.2 billion in 2022. This increase was primarily due to an increase of RMB14.0 billion (US$2.0 billion) in net income and a net decrease of RMB3.7 billion (US$521 million) in changes in working capital, partially offset by an increase of RMB7.8 billion (US$1.1 billion) in investment and interest income and a decrease of RMB1.6 billion (US$231 million) in amortization and impairment of assets.
Net cash provided by operating activities increased to RMB26.2 billion in 2022 from RMB20.1 billion in 2021. This increase was primarily due to a decrease of RMB7.9 billion in investment and interest income and a net decrease of RMB1.9 billion in changes in working capital, partially offset by a decrease of RMB3.1 billion in amortization and impairment of licensed copyrights and produced content.
Investing Activities
Net cash used in investing activities was RMB50.4 billion (US$7.1 billion) in 2023, consisting primarily of RMB198.7 billion (US$28.0 billion) in purchase of held-to-maturity investments, RMB11.2 billion (US$1.6 billion) in acquisition of fixed assets, RMB3.3 billion (US$470 million) in purchase of available-for-sale investments, RMB1.5 billion (US$209 million) in purchase of equity investments, RMB152.9 billion (US$21.5 billion) in maturities of held-to-maturity investments, RMB6.9 billion (US$1.0 billion) in proceeds from disposal of equity investments, RMB3.9 billion (US$556 million) in repayments of loans provided to related parties and RMB2.2 billion (US$304 million) in sales and maturities of available-for-sale investments.
Net cash used in investing activities was RMB3.9 billion in 2022, consisting primarily of RMB173.9 billion in purchase of held-to-maturity investments, RMB8.3 billion in acquisition of fixed assets, RMB7.6 billion in purchase of available-for-sale investments, RMB3.6 billion in purchase of equity investments, RMB178.8 billion in maturities of held-to-maturity investments, RMB9.3 billion in sales and maturities of available-for-sale investments and RMB2.0 billion in proceeds from disposal of equity investments.
Net cash used in investing activities was RMB31.4 billion in 2021, consisting primarily of RMB171.5 billion in purchase of held-to-maturity investments, RMB25.6 billion in purchase of available-for-sale investments, RMB156.7 billion in maturities of held-to-maturity investments, RMB25.9 billion in sales and maturities of available-for-sale investments, RMB10.9 billion in acquisition of fixed assets, RMB12.0 billion in a prepayment of the proposed JOYY businesses acquisition and RMB9.9 billion in proceeds from disposal of equity investments.
182
Table of Contents
Financing Activities
Net cash used in financing activities was RMB14.2 billion (US$2.0 billion) in 2023, consisting primarily of repayment of RMB11.7 billion (US$1.7 billion) for convertible senior notes by iQIYI, repayment of RMB11.0 billion (US$1.6 billion) for short-term loans, repayment of RMB7.3 billion (US$1.0 billion) for long-term loans and RMB4.8 billion (US$671 million) used to repurchase our shares, offset by RMB15.9 billion (US$2.2 billion) proceeds from short-term loans, RMB4.4 billion (US$622 million) net proceeds from the issuance of convertible notes by iQIYI and RMB3.5 billion (US$488 million) proceeds from issuance of shares of our subsidiaries.
Net cash used in financing activities was RMB6.4 billion in 2022, consisting primarily of repayment of RMB11.5 billion for long-term loans, offset by RMB3.4 billion of net proceeds from the issuance of convertible notes by iQIYI and RMB1.2 billion of net proceeds from short-term loans.
Net cash provided by financing activities was RMB23.4 billion in 2021, consisting primarily of RMB19.9 billion net proceeds from the listing on the Hong Kong Stock Exchange, RMB12.7 billion proceeds from long-term loans and RMB6.4 billion net proceeds from our issuance of long-term notes offset by RMB7.6 billion used to repurchase our shares and repayment of RMB7.3 billion for long-term loans.
Capital Expenditures
We made capital expenditures of RMB10.9 billion, RMB8.3 billion and RMB11.2 billion (US$1.6 billion) in 2021, 2022 and 2023, representing 9%, 7% and 8% of our total revenues, respectively. In the years of 2021, 2022 and 2023, our capital expenditures were primarily attributable to the purchase of servers, network equipment and other computer hardware to increase our network infrastructure capacity and support Gen-AI research and development inputs. We funded our capital expenditures primarily with net cash flows generated from operating activities.
Our capital expenditures may increase in the future as our business continues to grow, in connection with the expansion and improvement of our network infrastructure and the construction of additional office buildings and cloud-computing based data centers. We currently plan to fund these expenditures with our current cash, cash equivalents, restricted cash, short-term investments and anticipated cash flow generated from our operating activities.
Material Cash Requirements
Our material cash requirements as of December 31, 2023 and any subsequent interim period primarily include payments due for our short-term debt obligations, long-term debt obligations, operating lease obligations, purchase obligations and investment commitment obligations.
Our long-term debt obligations primarily consist of long-term loans, notes payable and convertible notes and estimated interest payments.
Our operating lease obligations primarily represent our obligations for leasing internet data center facilities and office premises, which include all future cash outflows under ASC Topic 842, Leases under Note 16 to our audited consolidated financial statements.
Our purchase obligations include purchase obligations for fixed assets, purchase obligations for bandwidth and property management fees, and purchase obligations for content assets.
Purchase obligations for content assets consist primarily of expenditures for content assets under non-cancelable agreements for licensed copyrights and produced content.
183
Table of Contents
Our investment commitment obligations primarily relate to capital contributions obligation under certain arrangements which do not have contractual maturity date.
We intend to fund our existing and future material cash requirements primarily with anticipated cash flows from operations, our existing cash balance and other financing alternatives. We will continue to make cash commitments, including capital expenditures, to support the growth of our business.
We have not entered into any financial guarantees or other commitments to guarantee the payment obligations of any third parties. We have not entered into any off-balance sheet derivative instruments. Furthermore, we do not have any retained or contingent interest in assets transferred to an unconsolidated entity that serves as credit, liquidity or market risk support to such entity. We do not have any variable interest in any unconsolidated entity that provides financing, liquidity, market risk or credit support to us or engages in leasing, hedging or research and development services with us.
The following table sets forth our contractual obligations by specified categories as of December 31, 2023:
| Payment Due by Period | ||||||||||||||||||||
| Total | Less Than 1 Year |
1-3 Years | 3-5 Years | More than 5 Years |
||||||||||||||||
| (In RMB millions) | ||||||||||||||||||||
| Short-term debt obligations |
10,257 | 10,257 | — | — | — | |||||||||||||||
| Long-term debt obligations |
75,240 | 8,139 | 32,850 | 23,710 | 10,541 | |||||||||||||||
| Operating lease obligations |
8,791 | 3,182 | 3,962 | 1,323 | 324 | |||||||||||||||
| Purchase obligations for fixed assets |
5,177 | 5,160 | 9 | 8 | — | |||||||||||||||
| Purchase obligations for bandwidth and property management fees |
807 | 653 | 122 | 11 | 21 | |||||||||||||||
| Purchase obligations for content assets |
14,778 | 8,627 | 5,117 | 833 | 201 | |||||||||||||||
| Investment commitment obligations |
1,402 | N/A | N/A | N/A | N/A | |||||||||||||||
|
|
|
|
|
|
|
|
|
|
|
|||||||||||
| Total |
116,452 | 36,018 | 42,060 | 25,885 | 11,087 | |||||||||||||||
|
|
|
|
|
|
|
|
|
|
|
|||||||||||
Other than as discussed above, we did not have any significant capital and other commitments, long-term obligations or guarantees as of December 31, 2023. The iQIYI 2026 Convertible Notes are senior, unsecured obligations of iQIYI, and interest is payable semi-annually in cash at a rate of 4.00% per annum on June 15 and December 15 of each year, beginning on June 15, 2021. The iQIYI 2026 Convertible Notes will mature on December 15, 2026, unless repurchased, redeemed or converted prior to such date. The holders may require iQIYI to repurchase all or a portion of the iQIYI 2026 Convertible Notes for cash on August 1, 2024, or upon a fundamental change.
Holding Company Structure
Baidu, Inc. is a holding company with no operations of its own. We conduct our operations in mainland China primarily through our subsidiaries and the variable interest entities in mainland China. As a result, although other means are available for us to obtain financing at the holding company level, Baidu, Inc.’s ability to pay dividends to the shareholders and to service any debt it may incur may depend upon dividends paid by our mainland China subsidiaries and license and service fees paid by the variable interest entities in mainland China. If any of our subsidiaries incurs debt on its own behalf in the future, the instruments governing such debt may restrict its ability to pay dividends to Baidu, Inc. In addition, our mainland China subsidiaries and the variable interest entities are required to make appropriations to certain statutory reserve funds, which are not distributable as cash dividends except in the event of a solvent liquidation of the companies.
Our mainland China subsidiaries, being foreign-invested enterprises established in mainland China, are required to make appropriations to certain statutory reserves, namely, a general reserve fund, an enterprise
184
Table of Contents
expansion fund, a staff welfare fund and a bonus fund, all of which are appropriated from net profit as reported in their PRC statutory accounts. Each of our mainland China subsidiaries is required to allocate at least 10% of its after-tax profits to a general reserve fund until such fund has reached 50% of its respective registered capital. Appropriations to the enterprise expansion fund and staff welfare and bonus funds are at the discretion of the board of directors of the mainland China subsidiaries.
The variable interest entities must make appropriations from their after-tax profits as reported in their PRC statutory accounts to non-distributable reserve funds, namely a statutory surplus fund, a statutory public welfare fund and a discretionary surplus fund. Each of the variable interest entities is required to allocate at least 10% of its after-tax profits to the statutory surplus fund until such fund has reached 50% of its respective registered capital. Appropriations to the statutory public welfare fund and the discretionary surplus fund are at the discretion of the variable interest entities.
Under the laws and regulations of mainland China, our mainland China subsidiaries and the variable interest entities are subject to certain restrictions with respect to paying dividends or otherwise transferring any of their net assets to us. The amounts restricted include the paid-up capital and the statutory reserve funds of our mainland China subsidiaries and the net assets of the variable interest entities in which we have no legal ownership, totaling RMB45.9 billion, RMB47.3 billion and RMB48.0 billion (US$6.8 billion) as of December 31, 2021, 2022 and 2023, respectively.
| C. | Research and Development |
We have a team of experienced engineers who are based mostly in Beijing, Shanghai and Shenzhen, China. We also have development centers in Sunnyvale, California and Seattle, Washington. We compete aggressively for engineering and recruit most of our engineers locally and have established various recruiting and training programs with leading universities in China. We have also recruited experienced engineers globally.
In the years ended December 31, 2021, 2022 and 2023, our research and development expenditures were RMB24.9 billion, RMB23.3 billion and RMB24.2 billion (US$3.4 billion), representing 20%, 19% and 18% of our total revenues, respectively. Our research and development expenses primarily consist of salaries and benefits for research and development personnel, server depreciation expenses and server custody fees. We expense research and development expenditures as they are incurred, except for capitalized software development costs that fulfill the capitalization criteria.
| D. | Trend Information |
Other than as disclosed elsewhere in this annual report, we are not aware of any trends, uncertainties, demands, commitments or events for the year ended December 31, 2023 that are reasonably likely to have a material and adverse effect on our total revenues, income, profitability, liquidity or capital resources, or that would cause the disclosed financial information to be not necessarily indicative of future results of operations or financial conditions.
| E. | Critical Accounting Estimates |
For our critical accounting estimates, see “Item 5. Operating and Financial Review and Prospects—A. Operating Results—Critical Accounting Policies and Estimates.”
| Item 6. | Directors, Senior Management and Employees |
| A. | Directors and Senior Management |
185
Table of Contents
The following table sets forth information regarding our directors and executive officers as of the date of this annual report.
| Directors and Executive Officers |
Age | Position/Title | ||||
| Robin Yanhong Li |
55 | Chairman of the Board of Directors and Chief Executive Officer | ||||
| James Ding |
58 | Independent Director | ||||
| Brent Callinicos |
58 | Independent Director | ||||
| Yuanqing Yang |
59 | Independent Director | ||||
| Jixun Foo |
55 | Independent Director | ||||
| Sandy Ran Xu |
47 | Independent Director | ||||
| Rong Luo |
42 | Chief Financial Officer | ||||
| Haifeng Wang |
52 | Chief Technology Officer | ||||
| Dou Shen |
44 | Executive Vice President | ||||
| Victor Zhixiang Liang |
50 | Senior Vice President | ||||
| Shanshan Cui |
48 | Senior Vice President | ||||
Robin Yanhong Li is our co-founder, chief executive officer and chairman of our board of directors, overseeing our overall strategy and business operations. Mr. Li has been serving as the chairman since our inception in January 2000 and as our chief executive officer since February 2004. Mr. Li served as our president from February 2000 to December 2003. Prior to founding our company, Mr. Li worked as an engineer for Infoseek, a pioneer in the search industry, and as a senior consultant for IDD Information Services. Mr. Li currently serves on the board of New Oriental Education & Technology Group Inc., a private educational services provider in China (NYSE: EDU; SEHK: 9901). Mr. Li received a bachelor’s degree in information science from Peking University and a master’s degree in computer science from the State University of New York at Buffalo.
James Ding has served as our independent director since our initial public offering in August 2005. Mr. Ding brings a deep understanding of the internet and artificial intelligence industry, which is relevant to and continuously supported the growth and evolution of our principal business since his appointment. He also brings extensive experience as a high tech entrepreneur and chief executive officer of a Nasdaq-listed company. Mr. Ding is a valuable member of the Company’s board of directors and continues to make important contribution to our company. He is also a member of our audit committee and corporate governance and nominating committee, and the chairman of our compensation committee. Mr. Ding is currently a managing director of GSR Ventures, which focuses on early stage companies in the artificial intelligence, big data, information technology related healthcare, virtual reality/augmented reality and new media sectors. Prior to that, Mr. Ding served as a co-chairman of the board of directors of AsiaInfo-Linkage Inc., a former Nasdaq-listed company, from July 2010 to January 2014. Mr. Ding also served as the chairman of the board of AsiaInfo from April 2003 to July 2010, and has served as a member of the board since AsiaInfo’s inception in 1993. Mr. Ding served as the chief executive officer and president of AsiaInfo from 1999 to 2003 and as senior vice president and chief technology officer of AsiaInfo from 1993 to 1999. Mr. Ding currently serves as director of the board of AsiaInfo (which is currently listed on the Hong Kong Stock Exchange as AsiaInfo Technologies Limited with stock code 1675 and played an important role in the design and development of China’s internet infrastructure). Mr. Ding received a master’s degree in information science from the University of California, Los Angeles and a bachelor’s degree in chemistry from Peking University in China.
Brent Callinicos has served as our independent director since October 2015, and as the chairman of our audit committee since April 2016. Mr. Callinicos served as the chief operating officer and the chief financial officer of Virgin Hyperloop One from January 2017 to January 2018. Prior to that, Mr. Callinicos served as the chief financial officer of Uber Technologies Inc. from September 2013 to March 2015, and then as an advisor for 18 additional months. Prior to joining Uber, he worked at Google from January 2007 to September 2013, where he last served as vice president, treasurer and chief accountant. He also led green energy investments and
186
Table of Contents
financial services at Google Inc. From 1992 to 2007, he served in a variety of increasingly senior roles at Microsoft Corporation, where he last served as corporate vice-president and divisional chief financial officer of the Platforms and Services Division, and oversaw Microsoft’s Worldwide Licensing and Pricing and Microsoft Financing. He currently serves on the board of directors of PVH Corp. (NYSE: PVH), and Rubicon Technologies, Inc. (NYSE: RBT) and Acorns. Mr. Callinicos is a certified public accountant. Mr. Callinicos received a bachelor’s degree from the University of North Carolina at Chapel Hill and an M.B.A. degree from the Kenan-Flagler School of Business at Chapel Hill.
Yuanqing Yang has served as our independent director since October 2015. Mr. Yang is also a member of our compensation committee and the chairman of our corporate governance and nominating committee. Mr. Yang is currently the chairman and chief executive officer of Lenovo Group Limited (SEHK: 992), a director of Sureinvest Holdings Limited and a director of Taikang Insurance Group. He also serves as a member of the International Advisory Council of the Brookings Institution. Mr. Yang has more than 30 years of experience in information and communications technology industry. Mr. Yang joined Lenovo in 1989 and Lenovo has transformed from a device provider to a solution and service provider under his leadership. Mr. Yang holds a master’s degree in computer science from the University of Science and Technology of China and a bachelor’s degree in computer science and engineering from Shanghai Jiao Tong University.
Jixun Foo has served as our independent director since July 2019. Mr. Foo is also a member of our audit committee and our compensation committee. Mr. Foo currently serves as the Managing Partner at GGV Capital Asia. Mr. Foo joined GGV in 2006 and has spent the last 20 years working with entrepreneurs in the travel and transportation, social media and commerce, and enterprise services sectors. Prior to joining GGV, Mr. Foo was a director at Draper Fisher Jurvetson ePlanet Ventures, where he led investments in Asia. Mr. Foo also previously led investments under the finance and investment division of the National Science and Technology Board of Singapore and served as an R&D project group leader at Hewlett Packard. Mr. Foo currently serves on the boards of XPeng Inc. (NYSE: XPEV), Bombardier Inc. (TSX: BBD) and a number of private companies, including Hello. Mr. Foo graduated from the National University of Singapore with a First-Class Honors degree in Engineering, and received an M.Sc. in Management of Technology from the National University of Singapore’s Graduate School of Business.
Sandy Ran Xu has served as our independent director since January 2024. Ms. Xu has served as chief executive officer and executive director of JD.com since May 2023. Prior to her current role, Ms. Xu served as chief financial officer of JD.com from June 2020 to May 2023. Prior to joining JD.com, Ms. Xu was an audit partner and spent nearly 20 years with PricewaterhouseCoopers Zhong Tian LLP, Beijing office and PricewaterhouseCoopers, San Jose office. Ms. Xu currently also serves as a director of Yonghui Superstores Co., Ltd. Ms. Xu was a Certified Public Accountant in both China and the United States. Ms. Xu received her bachelor’s degree with a double major in information science and economics from Peking University.
Rong Luo has served as our chief financial officer since November 2021. Prior to joining us, Mr. Luo served as the chief financial officer of TAL Education Group, an NYSE listed company, from November 2014 to October 2021 and played several key management roles. Prior to that, Mr. Luo was the chief financial officer of eLong Inc. from 2013 to 2014. Before that, Mr. Luo held different financial management positions at Lenovo Group and Microsoft. Mr. Luo holds bachelor’s degrees in both information management and systems and economics from Peking University, a master’s degree in management science and engineering from Tsinghua University, and a Ph.D. degree in management science from Peking University.
Haifeng Wang has served as our chief technology officer since May 2019. Dr. Wang joined Baidu in 2010 and was promoted to vice president in 2013. Dr. Wang oversaw our core search products from 2014 to 2017. He was promoted to senior vice president in 2018. Prior to Baidu, Dr. Wang served as the chief research scientist at Toshiba’s R&D Center. Dr. Wang is the director of the National Engineering Research Center of Deep Learning Technology and Application. Dr. Wang is an IEEE fellow, and a fellow (and former president) of the Association
187
Table of Contents
for Computational Linguistics (ACL) and the founding chair of ACL’s Asia-Pacific chapter. Dr. Wang obtained his bachelor’s, master’s, and Ph.D. degrees in computer science from the Harbin Institute of Technology.
Dr. Dou Shen received a Ph.D. from the Hong Kong University of Science and Technology, and currently serves as executive vice president of Baidu and the president of Baidu AI Cloud Group. Dr. Shen currently serves as a director of iQIYI, Inc. (Nasdaq: IQ), COSCO Shipping Holdings Co., Ltd. (SHA: 601919) and China United Network Communications Limited (SHA: 600050). Dr. Shen joined Baidu in 2012 and has served various management roles, including web search, display advertising, the financial services group and mobile products. Dr. Shen has published more than 40 papers in international conferences and journals, and held multiple patents on internet search and computational advertising. Currently, he serves as the vice president of SIGKDD China Chapter.
Victor Zhixiang Liang joined Baidu in June 2005, and became senior vice president and general counsel in June 2011. Mr. Liang leads our overall legal functions. Mr. Liang also served as an executive assistant to the CEO from January 2013 to February 2018. Prior to joining Baidu, he worked at Davis Polk & Wardwell LLP, as a visiting attorney at their New York Office. Mr. Liang received an LL.M. degree from Yale Law School and law degrees from the University of New South Wales and Peking University.
Shanshan Cui currently serves as our senior vice president in charge of human resources and administrative functions since May 2019. Ms. Cui joined us in January 2000 overseeing the search technology group, and is a founding member of the company. Ms. Cui left Baidu in July 2010 to pursue personal interests and rejoined Baidu in December 2017, initially serving as Secretary General to our Organizational Culture Committee. In this capacity, Ms. Cui oversaw employee culture and organization effectiveness, implementing initiatives, such as OKR (objectives & key results) management, throughout the company. Ms. Cui received a bachelor’s degree in computer science from Beijing Institute of Technology and a master’s degree in computer science from the University of Chinese Academy of Sciences.
| B. | Compensation |
In 2023, we paid an aggregate of RMB25 million (US$4 million) in cash compensation and granted 2,395,968 restricted Class A ordinary shares to our executive officers that are in office as of the date of this annual report as a group. During the same period, we also paid an aggregate of approximately RMB1.2 million (US$174 thousand) in cash compensation to our non-executive directors as a group. Our mainland China subsidiaries and the variable interest entities are required by law to make contributions equal to certain percentages of each employee’s salary for his or her pension insurance, medical insurance, housing fund, unemployment insurance and other statutory benefits. Other than the above-mentioned statutory contributions mandated by applicable laws of mainland China, we have not set aside or accrued any amount to provide pension, retirement or other similar benefits to our executive officers and directors. No executive officer is entitled to any severance benefits upon termination of his or her employment with our company except as required under applicable laws of mainland China.
Our board of directors and shareholders approved the issuance of up to 403,200,000 ordinary shares upon exercise of awards granted under our 2000 option plan. Our 2000 option plan terminated in January 2010 upon the expiration of its ten-year term. At the annual general meeting held on December 16, 2008, our shareholders approved a 2008 share incentive plan, which has reserved an additional 274,302,160 Class A ordinary shares for awards to be granted pursuant to its terms. Our 2008 share incentive plan terminated in December 2018 upon the expiration of its ten-year term. On July 20, 2018, our board of directors approved a 2018 share incentive plan, which has reserved an additional 275,516,000 Class A ordinary shares (taking into account the Share Subdivision) for awards to be granted pursuant to its terms. In August 2023, our board of directors approved a 2023 share incentive plan, which has reserved an additional 281,230,346 Class A ordinary shares for awards to be granted pursuant to its terms. As of December 31, 2023, options to purchase an aggregate of 51,735,584 Class A ordinary shares and an aggregate of 353,852,576 restricted Class A ordinary shares had been granted under the 2008, 2018 and 2023 share incentive plans.
188
Table of Contents
The following table summarizes, as of December 31, 2023, the outstanding options and restricted Class A ordinary shares that we had granted to our current directors and executive officers and to other individuals as a group.
| Name |
Ordinary Shares Underlying Outstanding Options |
Exercise Price (US$/Share) |
Grant Date | Expiration Date | ||||||||
| Robin Yanhong Li |
193,200 | 21.566 | February 24, 2014 | February 24, 2024 | ||||||||
| 958,160 | 26.834 | February 11, 2015 | February 11, 2025 | |||||||||
| 3,512,320 | 25.863 | April 16, 2015 | April 16, 2025 | |||||||||
| 211,040 | 19.778 | February 25, 2016 | February 25, 2026 | |||||||||
| 724,800 | 21.888 | October 27, 2016 | October 27, 2026 | |||||||||
| 469,120 | 23.251 | February 22, 2017 | February 22, 2027 | |||||||||
| 329,440 | (1) | — | February 5, 2020 | N/A | ||||||||
| 422,960 | (1) | — | February 8, 2021 | N/A | ||||||||
| 1,086,040 | (1) | — | February 14, 2022 | N/A | ||||||||
| 1,368,392 | (1) | — | August 9, 2023 | N/A | ||||||||
| James Ding |
* | (1) | — | February 14, 2022 | N/A | |||||||
| Brent Callinicos |
* | (1) | — | February 14, 2022 | N/A | |||||||
| Yuanqing Yang |
* | (1) | — | February 14, 2022 | N/A | |||||||
| Jixun Foo |
* | (1) | — | February 14, 2022 | N/A | |||||||
| Rong Luo |
* | 20.178 | November 8, 2021 | November 8, 2031 | ||||||||
| * | (1) | — | November 8, 2021 | N/A | ||||||||
| * | (1) | — | August 9, 2023 | N/A | ||||||||
| Haifeng Wang |
* | 23.483 | April 27, 2017 | April 27, 2027 | ||||||||
| * | 12.486 | August 8, 2019 | August 8, 2029 | |||||||||
| * | (1) | — | February 5, 2020 | N/A | ||||||||
| * | (1) | — | February 8, 2021 | N/A | ||||||||
| * | (1) | — | February 14, 2022 | N/A | ||||||||
| * | (1) | — | August 9, 2023 | N/A | ||||||||
| Dou Shen |
* | 12.486 | August 8, 2019 | August 8, 2029 | ||||||||
| * | (1) | — | February 5, 2020 | N/A | ||||||||
| * | (1) | — | February 8, 2021 | N/A | ||||||||
| * | (1) | — | February 14, 2022 | N/A | ||||||||
| * | (1) | — | August 9, 2023 | N/A | ||||||||
| Victor Zhixiang Liang |
* | (1) | — | February 5, 2020 | N/A | |||||||
| * | (1) | — | February 8, 2021 | N/A | ||||||||
| * | (1) | — | February 14, 2022 | N/A | ||||||||
| * | (1) | — | August 9, 2023 | N/A | ||||||||
| Shanshan Cui |
* | (1) | — | February 5, 2020 | N/A | |||||||
| * | (1) | — | February 8, 2021 | N/A | ||||||||
| * | (1) | — | February 14, 2022 | N/A | ||||||||
| * | (1) | — | August 9, 2023 | N/A | ||||||||
| Other individuals as a group |
98,286,800 | — | — | — | ||||||||
| * | The options and restricted shares in aggregate held by each of these directors and officers represent less than 1% of our total outstanding shares. The options held by these directors and officers represent less than 1% of our outstanding shares. |
| (1) | Restricted shares. |
The following paragraphs summarize the key terms of our 2008 share incentive plan adopted on December 16, 2008, our 2018 share incentive plan adopted on July 20, 2018 and our 2023 share incentive plan adopted in August 2023:
2008 Share Incentive Plan
The following paragraphs summarize the key terms of our 2008 share incentive plan.
189
Table of Contents
Types of Awards. We may grant the following types of awards under our 2018 share incentive plan:
| • | options (incentive share options, or ISO); |
| • | restricted shares; |
| • | restricted share units; and |
| • | any other form of awards granted to a participant pursuant to the 2008 plan. |
Plan Administration. The compensation committee of our board of directors administers our 2008 share incentive plan, but may delegate to a committee of one or more members of our board of directors the authority to grant or amend awards to participants other than independent directors and executive officers. The compensation committee will determine the provisions and terms and conditions of each award grant, including, but not limited to, the exercise price, the grant price or purchase price, any restrictions or limitations on the award, any schedule for lapse of forfeiture restrictions or restrictions on the exercisability of an award, and accelerations or waivers thereof, any provisions related to non-competition and recapture of gain on an award, based in each case on such considerations as the committee in its sole discretion determines. The compensation committee has the sole power and discretion to cancel, forfeit or surrender an outstanding award (whether or not in exchange for another award or combination or awards).
Award Agreement. Awards granted under our 2008 share incentive plan are evidenced by an award agreement that sets forth the terms, conditions and limitations for each award which may include the term of an award, the provisions applicable in the event the participant’s employment or service ends, and our authority to unilaterally or bilaterally amend, modify, suspend, cancel or rescind an award.
Eligibility. We may grant awards to employees, directors and consultants of our company or any of our related entities, which include our subsidiaries or any entities in which we hold a substantial ownership interest. However, we may grant ISOs only to our employees and employees of our majority-owned subsidiaries.
Acceleration of Awards upon Corporate Transactions. The outstanding awards will accelerate (i) upon occurrence of a change-of-control corporate transaction where any person acquires at least 50% of the total combined voting power of our outstanding securities or the incumbent board members no longer constitute at least 50% of our board, or (ii) upon occurrence of any other change-of-control corporate transaction in which the successor entity does not assume our outstanding awards under our 2008 share incentive plan; provided that the plan participant remains an employee, consultant or member of our board of directors on the effective date of the corporate transaction. In such event, each outstanding award will become fully exercisable and all forfeiture restrictions on such award will lapse immediately prior to the specified effective date of the corporate transaction.
If the successor entity assumes our outstanding awards and later terminates the grantee’s employment or service without cause within 12 months of the corporate transaction, or if the grantee resigns voluntarily with good reason, the outstanding awards automatically will become fully vested and exercisable. The compensation committee may also, in its sole discretion, upon or in anticipation of a corporate transaction, accelerate awards, purchase the awards from the plan participants, replace the awards, or provide for the payment of the awards in cash.
Exercise Price and Term of Awards. The exercise price per share subject to an option may be amended or adjusted in the absolute discretion of the compensation committee, the determination of which shall be final, binding and conclusive. To the extent not prohibited by applicable laws or exchange rules, a downward adjustment of the exercise prices of options mentioned in the preceding sentence shall be effective without the approval of our shareholders or the approval of the affected grantees. If we grant an ISO to an employee, who, at the time of that grant, owns shares representing more than 10% of the voting power of all classes of our share capital, the exercise price cannot be less than 110% of the fair market value of our ordinary shares on the date of
190
Table of Contents
that grant. The compensation committee will determine the time or times at which an option may be exercised in whole or in part, including exercise prior to vesting. The term may not exceed ten years from the date of the grant, except that five years is the maximum term of an ISO granted to an employee who holds more than 10% of the voting power of our share capital.
Restricted Shares and Restricted Share Units. The compensation committee is also authorized to make awards of restricted shares and restricted share units. Except as otherwise determined by the compensation committee at the time of the grant of an award or thereafter, upon termination of employment or service during the applicable restriction period, restricted shares that are at the time subject to restrictions shall be forfeited or repurchased in accordance with the respective award agreements.
Vesting Schedule. The compensation committee determines, and the award agreement specifies, the vesting schedule of options and other awards granted. The compensation committee determines the time or times at which an option may be exercised in whole or in part, including exercise prior to vesting, and also determines any conditions that must be satisfied before all or part of an option may be exercised. At the time of grant for restricted share units, the compensation committee specifies the date on which the restricted share units become fully vested and non-forfeitable, and may specify such conditions to vesting as it deems appropriate.
Amendment and Termination. With the approval of our board of directors, the compensation committee may at any time amend, suspend or terminate our 2008 share incentive plan. Amendments to our 2008 share incentive plan are subject to shareholder approval, to the extent required by law, or by stock exchange rules or regulations. Any amendment, suspension or termination of our 2008 share incentive plan must not adversely affect in any material way awards already granted without written consent of the recipient of such awards. Unless terminated earlier, our 2008 share incentive plan shall continue in effect for a term of ten years from the date of adoption.
2018 Share Incentive Plan
The following paragraphs summarize the key terms of our 2018 share incentive plan.
Types of Awards. We may grant the following types of awards under our 2018 share incentive plan:
| • | options (incentive share options, or ISO); |
| • | restricted shares; |
| • | restricted share units; and |
| • | any other form of awards granted to a participant pursuant to the 2018 plan. |
Plan Administration. The compensation committee of our board of directors administers our 2018 share incentive plan, but may delegate to a committee of one or more members of our board of directors the authority to grant or amend awards to participants other than independent directors and executive officers. The compensation committee will determine the provisions and terms and conditions of each award grant, including, but not limited to, the exercise price, the grant price or purchase price, any restrictions or limitations on the award, any schedule for lapse of forfeiture restrictions or restrictions on the exercisability of an award, and accelerations or waivers thereof, any provisions related to non-competition and recapture of gain on an award, based in each case on such considerations as the committee in its sole discretion determines. The compensation committee has the sole power and discretion to cancel, forfeit or surrender an outstanding award (whether or not in exchange for another award or combination or awards).
Award Agreement. Awards granted under our 2018 share incentive plan are evidenced by an award agreement that sets forth the terms, conditions and limitations for each award which may include the term of an award, the provisions applicable in the event the participant’s employment or service ends, and our authority to unilaterally or bilaterally amend, modify, suspend, cancel or rescind an award.
191
Table of Contents
Eligibility. We may grant awards to employees, directors and consultants of our company or any of our related entities, which include our subsidiaries or any entities in which we hold a substantial ownership interest. However, we may grant ISOs only to our employees and employees of our majority-owned subsidiaries.
Acceleration of Awards upon Corporate Transactions. The outstanding awards will accelerate (i) upon occurrence of a change-of-control corporate transaction where any person acquires at least 50% of the total combined voting power of our outstanding securities or the incumbent board members no longer constitute at least 50% of our board, or (ii) upon occurrence of any other change-of-control corporate transaction in which the successor entity does not assume our outstanding awards under our 2018 share incentive plan; provided that the plan participant remains an employee, consultant or member of our board of directors on the effective date of the corporate transaction. In such event, each outstanding award will become fully exercisable and all forfeiture restrictions on such award will lapse immediately prior to the specified effective date of the corporate transaction.
If the successor entity assumes our outstanding awards and later terminates the grantee’s employment or service without cause within 12 months of the corporate transaction, or if the grantee resigns voluntarily with good reason, the outstanding awards automatically will become fully vested and exercisable. The compensation committee may also, in its sole discretion, upon or in anticipation of a corporate transaction, accelerate awards, purchase the awards from the plan participants, replace the awards, or provide for the payment of the awards in cash.
Exercise Price and Term of Awards. The exercise price per share subject to an option may be amended or adjusted in the absolute discretion of the compensation committee, the determination of which shall be final, binding and conclusive. To the extent not prohibited by applicable laws or exchange rules, a downward adjustment of the exercise prices of options mentioned in the preceding sentence shall be effective without the approval of our shareholders or the approval of the affected grantees. If we grant an ISO to an employee, who, at the time of that grant, owns shares representing more than 10% of the voting power of all classes of our share capital, the exercise price cannot be less than 110% of the fair market value of our ordinary shares on the date of that grant. The compensation committee will determine the time or times at which an option may be exercised in whole or in part, including exercise prior to vesting. The term may not exceed ten years from the date of the grant, except that five years is the maximum term of an ISO granted to an employee who holds more than 10% of the voting power of our share capital.
Restricted Shares and Restricted Share Units. The compensation committee is also authorized to make awards of restricted shares and restricted share units. Except as otherwise determined by the compensation committee at the time of the grant of an award or thereafter, upon termination of employment or service during the applicable restriction period, restricted shares that are at the time subject to restrictions shall be forfeited or repurchased in accordance with the respective award agreements.
Vesting Schedule. The compensation committee determines, and the award agreement specifies, the vesting schedule of options and other awards granted. The compensation committee determines the time or times at which an option may be exercised in whole or in part, including exercise prior to vesting, and also determines any conditions that must be satisfied before all or part of an option may be exercised. At the time of grant for restricted share units, the compensation committee specifies the date on which the restricted share units become fully vested and non-forfeitable, and may specify such conditions to vesting as it deems appropriate.
Amendment and Termination. With the approval of our board of directors, the compensation committee may at any time amend, suspend or terminate our 2018 share incentive plan. To the extent our company decides to not to follow home country practice, amendments to our 2018 share incentive plan are subject to shareholder approval, to the extent required by law, or by stock exchange rules or regulations. Any amendment, suspension or termination of our 2018 share incentive plan must not adversely affect in any material way awards already granted without written consent of the recipient of such awards. Unless terminated earlier, our 2018 share incentive plan shall continue in effect for a term of ten years from the date of adoption.
192
Table of Contents
2023 Share Incentive Plan
The following paragraphs summarize the key terms of our 2023 share incentive plan.
Types of Awards. We may grant the following types of awards under our 2023 share incentive plan:
| • | options (incentive share options, or ISO); |
| • | restricted shares; |
| • | restricted share units; and |
| • | any other form of awards granted to a participant pursuant to the 2023 plan. |
Plan Administration. The compensation committee of our board of directors administers our 2023 share incentive plan, but may delegate to a committee of one or more members of our board of directors the authority to grant or amend awards to participants other than independent directors and executive officers. The compensation committee will determine the provisions and terms and conditions of each award grant, including, but not limited to, the exercise price, the grant price or purchase price, any restrictions or limitations on the award, any schedule for lapse of forfeiture restrictions or restrictions on the exercisability of an award, and accelerations or waivers thereof, any provisions related to non-competition and recapture of gain on an award, based in each case on such considerations as the committee in its sole discretion determines. The compensation committee has the sole power and discretion to cancel, forfeit or surrender an outstanding award (whether or not in exchange for another award or combination or awards).
Award Agreement. Awards granted under our 2023 share incentive plan are evidenced by an award agreement that sets forth the terms, conditions and limitations for each award which may include the term of an award, the provisions applicable in the event the participant’s employment or service ends, and our authority to unilaterally or bilaterally amend, modify, suspend, cancel or rescind an award.
Eligibility. We may grant awards to employees, directors and consultants of our company or any of our related entities, which include our subsidiaries or any entities in which we hold a substantial ownership interest. However, we may grant ISOs only to our employees and employees of our majority-owned subsidiaries.
Acceleration of Awards upon Corporate Transactions. The outstanding awards will accelerate (i) upon occurrence of a change-of-control corporate transaction where any person acquires at least 50% of the total combined voting power of our outstanding securities or the incumbent board members no longer constitute at least 50% of our board, or (ii) upon occurrence of any other change-of-control corporate transaction in which the successor entity does not assume our outstanding awards under our 2023 share incentive plan; provided that the plan participant remains an employee, consultant or member of our board of directors on the effective date of the corporate transaction. In such event, each outstanding award will become fully exercisable and all forfeiture restrictions on such award will lapse immediately prior to the specified effective date of the corporate transaction.
If the successor entity assumes our outstanding awards and later terminates the grantee’s employment or service without cause within 12 months of the corporate transaction, or if the grantee resigns voluntarily with good reason, the outstanding awards automatically will become fully vested and exercisable. The compensation committee may also, in its sole discretion, upon or in anticipation of a corporate transaction, accelerate awards, purchase the awards from the plan participants, replace the awards, or provide for the payment of the awards in cash.
Exercise Price and Term of Awards. The exercise price per share subject to an option may be amended or adjusted in the absolute discretion of the compensation committee, the determination of which shall be final, binding and conclusive. To the extent not prohibited by applicable laws or exchange rules, a downward adjustment of the exercise prices of options mentioned in the preceding sentence shall be effective without the
193
Table of Contents
approval of our shareholders or the approval of the affected grantees. If we grant an ISO to an employee, who, at the time of that grant, owns shares representing more than 10% of the voting power of all classes of our share capital, the exercise price cannot be less than 110% of the fair market value of our ordinary shares on the date of that grant. The compensation committee will determine the time or times at which an option may be exercised in whole or in part, including exercise prior to vesting. The term may not exceed ten years from the date of the grant, except that five years is the maximum term of an ISO granted to an employee who holds more than 10% of the voting power of our share capital.
Restricted Shares and Restricted Share Units. The compensation committee is also authorized to make awards of restricted shares and restricted share units. Except as otherwise determined by the compensation committee at the time of the grant of an award or thereafter, upon termination of employment or service during the applicable restriction period, restricted shares that are at the time subject to restrictions shall be forfeited or repurchased in accordance with the respective award agreements.
Vesting Schedule. The compensation committee determines, and the award agreement specifies, the vesting schedule of options and other awards granted. The compensation committee determines the time or times at which an option may be exercised in whole or in part, including exercise prior to vesting, and also determines any conditions that must be satisfied before all or part of an option may be exercised. At the time of grant for restricted share units, the compensation committee specifies the date on which the restricted share units become fully vested and non-forfeitable, and may specify such conditions to vesting as it deems appropriate.
Amendment and Termination. With the approval of our board of directors, the compensation committee may at any time amend, suspend or terminate our 2023 share incentive plan. To the extent our company decides to not to follow home country practice, amendments to our 2023 share incentive plan are subject to shareholder approval, to the extent required by law, or by stock exchange rules or regulations. Any amendment, suspension or termination of our 2023 share incentive plan must not adversely affect in any material way awards already granted without written consent of the recipient of such awards. Unless terminated earlier, our 2023 share incentive plan shall continue in effect for a term of ten years from the date of adoption.
| C. | Board Practices |
Board of Directors
Our board of directors has six directors. A director is not required to hold any shares in the company by way of qualification. A director may vote with respect to any contract, proposed contract or arrangement in which he is materially interested. A director may exercise all the powers of the company to borrow money, mortgage its undertakings, property and uncalled capital, and issue debentures or other securities whenever money is borrowed or as security for any obligation of the company or of any third party. The remuneration to be paid to the directors is determined by the board of directors. There is no age limit requirement for directors.
Committees of the Board of Directors
We have three committees under the board of directors: an audit committee, a compensation committee and a corporate governance and nominating committee. We have adopted a charter for each of the three committees.
Audit Committee
Our audit committee consists of Brent Callinicos, James Ding and Jixun Foo, all of whom satisfy the “independence” requirements of Rule 5605(a)(2) of the Nasdaq Stock Market Rules and Rule 10A-3 under the Exchange Act. Our board of directors has determined that Mr. Callinicos is an audit committee financial expert as defined in the instructions to Item 16A of the Form 20-F. The audit committee oversees our accounting and
194
Table of Contents
financial reporting processes and the audits of the financial statements of our company. The audit committee is responsible for, among other things:
| • | appointing, retaining and overseeing the work of the independent auditors, including resolving disagreements between the management and the independent auditors relating to financial reporting; |
| • | pre-approving all auditing and non-auditing services permitted to be performed by the independent auditors; |
| • | reviewing annually the independence and quality control procedures of the independent auditors; |
| • | reviewing and approving all proposed related party transactions; |
| • | discussing the annual audited financial statements with the management; |
| • | meeting separately with the independent auditors to discuss critical accounting policies, management letters, recommendations on internal controls, the auditor’s engagement letter and independence letter and other material written communications between the independent auditors and the management; and |
| • | attending to such other matters that are specifically delegated to our audit committee by our board of directors from time to time. |
In 2023, our audit committee held meetings or passed resolutions by unanimous written consent six times.
Compensation Committee
Our compensation committee consists of James Ding, Yuanqing Yang and Jixun Foo, all of whom satisfy the “independence” requirements of Rule 5605(a)(2) of the Nasdaq Stock Market Rules. The compensation committee assists the board in reviewing and approving our compensation structure, including all forms of compensation relating to our directors and executive officers. Our chief executive officer may not be present at any committee meeting while his compensation is deliberated. The compensation committee is responsible for, among other things:
| • | reviewing and approving, or recommending to the board for its approval, the compensation for our chief executive officer and other executive officers; |
| • | reviewing and recommending to the board for determination with respect to the compensation of our non-employee directors; |
| • | reviewing periodically and approving any incentive compensation or equity plans, programs or similar arrangements; and |
| • | selecting compensation consultant, legal counsel or other adviser only after taking into consideration all factors relevant to that person’s independence from management. |
In 2023, our compensation committee held meetings or passed resolutions by unanimous written consent six times.
Corporate Governance and Nominating Committee
Our corporate governance and nominating committee consists of Yuanqing Yang and James Ding, both of whom satisfy the “independence” requirements of Rule 5605(a) (2) of the Nasdaq Stock Market Rules. The corporate governance and nominating committee assists the board of directors in selecting individuals qualified to become our directors and in determining the composition of the board and its committees. The corporate governance and nominating committee is responsible for, among other things:
| • | recommending to the board nominees for election or re-election to the board or for appointments to fill any vacancies; |
195
Table of Contents
| • | reviewing annually the performance of each incumbent director in determining whether to recommend such director for an additional term; |
| • | overseeing the board in the board’s annual review of its own performance and the performance of the management; and |
| • | considering, preparing and recommending to the board such policies and procedures with respect to corporate governance matters as may be required or required to be disclosed under the applicable laws or otherwise considered to be material. |
In 2023, our corporate governance and nominating committee passed resolutions by unanimous written consent two times.
Terms of Directors and Executive Officers
All directors hold office until their successors have been duly appointed and qualified. None of our directors is subject to a fixed term of office. In addition, the service agreements between us and the directors do not provide benefits upon termination of their services. Director nomination is subject to the approval of our corporate governance and nominating committee. Our shareholders may remove any director by ordinary resolution and may in like manner appoint another person in his stead. A valid ordinary resolution requires a majority of the votes cast at a shareholder meeting that is duly constituted and meets the quorum requirement. Officers are appointed by and serve at the discretion of the board of directors.
Board Diversity
| Board Diversity Matrix (As of January 31, 2024) |
||||||||||||||||
| Country of Principal Executive Offices: |
People’s Republic of China | |||||||||||||||
| Foreign Private Issuer |
Yes | |||||||||||||||
| Disclosure Prohibited Under Home Country Law |
No | |||||||||||||||
| Total Number of Directors |
6 | |||||||||||||||
| Female | Male | Non-Binary | Did Not Disclose Gender |
|||||||||||||
| Part I: Gender Identity |
||||||||||||||||
| Directors |
1 | 5 | N/A | N/A | ||||||||||||
| Part II: Demographic Background |
||||||||||||||||
| Underrepresented Individual in Home Country Jurisdiction |
0 | |||||||||||||||
| LGBTQ+ |
0 | |||||||||||||||
| D. | Employees |
We had approximately 45,500, 41,300 and 39,800 full time employees as of December 31, 2021, 2022 and 2023, respectively. As of December 31, 2023, we had approximately 21,800 employees in research and development, 8,800 employees in sales and marketing, 6,000 employees in operation and service, and 3,200 employees in management and administration. As of December 31, 2023, we had approximately 26,300 employees in Beijing, 13,300 employees outside of Beijing but within China (for the avoidance of doubt, including Hong Kong, Macau and Taiwan), and approximately 200 employees outside of China. We also hire temporary employees and contractors from time to time. Our employees are not covered by any collective bargaining agreement. We consider our relations with our employees to be generally good. However, as our operations and employee base further expand, we cannot assure you that we will always be able to maintain good relations with all of our employees. See “Item 3.D. Key Information—Risk Factors—Risks Related to Our Business and Industry—We may not be able to manage our expanding operations effectively.”
196
Table of Contents
| E. | Share Ownership |
The following table sets forth information with respect to the beneficial ownership of our ordinary shares as of January 31, 2024 by:
| • | each of our directors and executive officers; and |
| • | each person known to us to own beneficially more than 5% of each class of our issued and outstanding shares. |
The calculations in the table below are based on 2,805,219,752 ordinary shares, consisting of 2,280,439,432 Class A ordinary shares and 524,780,320 Class B ordinary shares issued and outstanding as of January 31, 2024.
Beneficial ownership is determined in accordance with the rules and regulations of the SEC. In computing the number of shares beneficially owned by a person and the percentage ownership and voting power percentage of that person, we have included shares and associated votes that the person has the right to acquire within 60 days, including through the exercise of any option, warrant or other right or the conversion of any other security. These shares and associated votes, however, are not included in the computation of the percentage ownership of any other person.
See “—B. Compensation” for more details on options and restricted shares granted to our directors and executive officers.
| Class A Ordinary Shares |
Class B Ordinary Shares |
Total Ordinary Shares |
% of Total Ordinary Shares |
% of Aggregate Voting Power† |
||||||||||||||||
| Directors and Executive Officers: |
||||||||||||||||||||
| Robin Yanhong Li(1) |
72,882,496 | 439,200,000 | 512,082,496 | 18.2 | 59.3 | |||||||||||||||
| James Ding |
* | — | * | * | * | |||||||||||||||
| Brent Callinicos |
* | — | * | * | * | |||||||||||||||
| Yuanqing Yang |
* | — | * | * | * | |||||||||||||||
| Jixun Foo |
* | — | * | * | * | |||||||||||||||
| Sandy Ran Xu |
* | — | * | * | * | |||||||||||||||
| Rong Luo |
* | — | * | * | * | |||||||||||||||
| Haifeng Wang |
* | — | * | * | * | |||||||||||||||
| Dou Shen |
* | — | * | * | * | |||||||||||||||
| Victor Zhixiang Liang |
* | — | * | * | * | |||||||||||||||
| Shanshan Cui |
* | — | * | * | * | |||||||||||||||
| All Directors and Executive Officers as a Group(2) |
78,387,112 | 439,200,000 | 517,587,112 | 18.5 | 59.3 | |||||||||||||||
| Principal Shareholders: |
||||||||||||||||||||
| Handsome Reward Limited(3) |
12,764,032 | 439,200,000 | 451,964,032 | 16.1 | 58.5 | |||||||||||||||
| BlackRock, Inc.(4) |
128,640,168 | — | 128,640,168 | 4.6 | 1.5 | |||||||||||||||
Notes:
| † | For each person and group included in this column, percentage of voting power is calculated by dividing the voting power beneficially owned by such person or group by the voting power of all of our Class A ordinary shares and Class B ordinary shares as a single class. Each holder of Class A ordinary shares is entitled to one vote per share and each holder of our Class B ordinary shares is entitled to 10 votes per share on all matters submitted to them for a vote. Our Class A ordinary shares and Class B ordinary shares vote together as a single class on all matters submitted to a vote of our shareholders and other matters as may otherwise be required by law. Each Class B ordinary share is convertible at any time by the holder thereof into one Class A ordinary share. |
| * | Less than 1% of our total outstanding ordinary shares. |
197
Table of Contents
| ** | Except for James Ding, Yuanqing Yang, Brent Callinicos, Jixun Foo and Sandy Ran Xu, the business address of our directors and executive officers is c/o Baidu, Inc., Baidu Campus, Shangdi 10th Street, Haidian District, Beijing 100085, PRC. The business address of James Ding is STE. 5620, China World Trade Center Tower III, No.1 Jianguomenwai Street, Chaoyang District, Beijing, 100004, China. The business address of Yuanqing Yang is Builindg 1, No. 10 Courtyard Xibeiwang East Road, Beijing, China. The business address of Brent Callinicos is 23935 Cherry, Chapel Hill, NC, 27517, United States of America. The business address of Jixun Foo is #21-02 Guoco Midtown, 128 Beach Road, 189773, Singapore. The business address of Sandy Ran Xu is 14/F, JD Tower A, 18 Kechuang 11th Street, Beijing, 101111, China. |
| (1) | Includes (i) 3,013,200 Class A Ordinary Shares directly held by Mr. Robin Yanhong Li on record, (ii) 3,146,232 Class A ordinary shares in the form of ADSs held by Mr. Robin Yanhong Li in the brokerage account of the administrator of our employee stock option program, (iii) 540,920 Class A Ordinary Shares issuable to Mr. Robin Yanhong Li upon vesting of restricted shares within 60 days after January 31, 2024, (iv) 439,200,000 Class B ordinary shares held on record by Handsome Reward Limited, a British Virgin Islands company wholly owned by Mr. Robin Yanhong Li, (v) 6,333,376 Class A ordinary shares in the form of ADSs held by Handsome Reward Limited in the brokerage account of the administrator of our employee stock option program, (vi) 6,068,640 Class A ordinary shares issuable to Handsome Reward Limited upon exercise of options within 60 days after the date of January 31, 2024, (vii) 362,016 Class A Ordinary Shares issuable to Handsome Reward Limited upon vesting of restricted shares within 60 days after January 31, 2024, and (viii) 53,418,112 Class A ordinary shares in the form of ADSs held by certain employees who have granted Mr. Li irrevocable voting proxies with respect to these shares on their behalf as of January 31, 2024. This excludes 3,732,240 Class A ordinary shares, 85,480,000 Class B ordinary shares, and 41,860 ADSs in the brokerage account of the administrator of our employee stock option program, all of which are owned by Ms. Melissa Ma, Mr. Robin Yanhong Li’s wife, as of January 31, 2024, and Mr. Robin Yanhong Li disclaims beneficial ownership of all of such shares. |
| (2) | Includes 53,418,112 Class A ordinary shares in the form of ADSs held by certain employees who have granted Mr. Robin Yanhong Li irrevocable voting proxies with respect to these shares on their behalf as of January 31, 2024. |
| (3) | Includes (i) 439,200,000 Class B ordinary shares held by Handsome Reward Limited, a British Virgin Islands company wholly owned and controlled by Mr. Robin Yanhong Li, (ii) 6,333,376 Class A ordinary shares in the form of ADSs held by Handsome Reward Limited in the brokerage account of the administrator of our employee stock option program, (iii) 6,068,640 Class A Ordinary Shares issuable to Handsome Reward Limited upon exercise of options within 60 days after the date of January 31, 2024, and (iv) 362,016 Class A Ordinary Shares issuable to Handsome Reward Limited upon vesting of restricted shares within 60 days after January 31, 2024. |
| (4) | Includes 128,640,168 Class A ordinary shares beneficially owned by BlackRock, Inc., over which BlackRock, Inc. has sole dispositive power, as of December 31, 2023. BlackRock, Inc. is a Delaware corporation listed on the NYSE. The principal business address of BlackRock, Inc. is 50 Hudson Yards, New York, NY 10001, United States of America. The calculation of BlackRock’s voting power is based on 116,610,874 Class A ordinary shares, over which BlackRock, Inc. has sole voting power, as of December 31, 2023. The above information is based on the Schedule 13G/A filed by BlackRock, Inc. on February 1, 2024. The percentage of total ordinary shares and the percentage of aggregate voting power for BlackRock Inc. are calculated based on the number of our company’s total outstanding shares as of January 31, 2024 and assuming BlackRock Inc.’s shareholding does not change since December 31, 2023. |
As of January 31, 2024, to our knowledge, approximately 38.0% of our total issued and outstanding ordinary shares were held by three record shareholders in the United States, including approximately 37.7% held by The Bank of New York Mellon, the depositary of our ADS program. The number of beneficial owners of ADSs in the United States is likely to be much larger than the number of record holders of our ordinary shares in the United States. For instance, BlackRock Inc. is an ADS holder in the United States that beneficially owns 128,640,168 Class A ordinary shares as of December 31, 2023 according to the Schedule 13G/A filed by it, but is not a record holder of our ordinary shares. Please see footnote (4) of the above table for more details. We are not aware of any arrangement that may, at a subsequent date, result in a change of control of our company.
198
Table of Contents
Weighted Voting Rights Structure
Under our weighted voting rights structure, our share capital comprises Class A ordinary shares and Class B ordinary shares. Each Class A ordinary share entitles the holder to exercise one vote, and each Class B ordinary share entitles the holder to exercise 10 votes, respectively, on all matters subject to the vote at general meetings of our company. We issued Class A ordinary shares represented by our ADSs in our initial public offering in 2005.
Pursuant to our articles of association, the directors of our board may, from time to time subject to their fiduciary duties to act in the best interests of our company and for a proper purpose, cause our company to issue preferred shares and determine, among others, their conversion rights, which may include conversion to Class A and/or Class B ordinary shares. Such rights are subject to the approval and discretion of the board.
Each Class B ordinary share is convertible into one Class A ordinary share at any time by the holder thereof. See “Item 3.D. Key Information—Risk Factors—Risks Related to Our ADSs and Class A Ordinary shares—Our dual-class ordinary share structure with different voting rights could discourage others from pursuing any change of control transactions that holders of our Class A ordinary shares and ADSs may view as beneficial.” Upon the conversion of all the issued and outstanding Class B ordinary shares as at January 31, 2024 into Class A ordinary shares, our company would issue 524,780,320 Class A ordinary shares, representing approximately 18.7% of the total number of issued and outstanding Class A ordinary shares as at January 31, 2024 (without taking into account any allotment and issuance of Shares pursuant to the exercise of options or the vesting of share awards that have been or may be granted from time to time and any issuance or repurchase of Shares and/or ADSs that we may make).
Each Class B ordinary share is convertible into one Class A ordinary share at any time by the holder thereof. If at any time Robin Yanhong Li and his Affiliates (as defined in our articles of association) collectively own less than 5% of the total number of the issued and outstanding Class B Ordinary Shares, each issued and outstanding Class B Ordinary Share shall be automatically and immediately converted into one Class A ordinary share, and no Class B Ordinary Shares shall be issued by our company thereafter.
Class B ordinary shares shall also be automatically and immediately converted into an equal number of Class A ordinary shares:
| (1) | upon any sale, pledge, transfer, assignment or disposition of such Class B ordinary shares by a holder thereto to any person or entity which is not an Affiliate (as defined in our articles of association) of such holder; or |
| (2) | where, within 6 months after by a transfer by a holder of Class B ordinary shares to an Affiliate of such holder, there is a change of the beneficial ownership of the Class B ordinary shares held by the Affiliate. |
199
Table of Contents
Apart from the aforementioned (1) and (2), a change in the beneficial ownership of Class B ordinary shares shall not cause a conversion of Class B ordinary shares to Class A ordinary shares.
| Number of Class A Ordinary Shares |
Number of Class B Ordinary Shares |
Approximate percentage of voting rights(3) |
||||||||||
| As at January 31, 2024, WVR beneficiaries were the following: |
||||||||||||
| Robin Yanhong Li(1) |
72,882,496 | 439,200,000 | 59.3 | % | ||||||||
| Melissa Ma |
4,067,120 | 85,480,000 | 11.4 | % | ||||||||
| Integrity Partners V, LLC(2) |
— | 100,320 | 0.0 | % | ||||||||
| Total |
76,949,616 | 524,780,320 | 70.7 | % | ||||||||
Notes:
| (1) | Includes 53,418,112 Class A ordinary shares in the form of ADSs held by certain employees who have granted Mr. Li irrevocable voting proxies with respect to these shares on their behalf as of January 31, 2024. As a result, the voting power held by Mr. Robin Yanhong Li represented 59.3% of the total outstanding voting power of our company as of January 31, 2024. |
| (2) | To our knowledge, Integrity Partners V, LLC holds 100,320 Class B ordinary shares of our company and was not a record shareholder of any Class A ordinary shares as at January 31, 2024. Integrity Partners V, LLC is affiliated with an early stage investor that invested in our company before our U.S. IPO in 2005. |
| (3) | On the basis that Class A ordinary shares entitle the shareholder to one vote per share and Class B ordinary shares entitle the shareholder to 10 votes per share. |
Mr. Robin Yanhong Li, the chairman and chief executive officer of our company, owns shares in his personal capacity and through Handsome Reward Limited. Ms. Melissa Ma is the spouse of Mr. Li and holds shares in her personal capacity. To the best knowledge of our company, Integrity and its ultimate beneficial owner are independent third parties of and are not core connected persons of our company, and its ultimate beneficial owner does not have a role in our company’s business and operations.
| F. | Disclosure of a Registrant’s Action to Recover Erroneously Awarded Compensation |
Not applicable.
| Item 7. | Major Shareholders and Related Party Transactions |
| A. | Major Shareholders |
Please refer to “Item 6.E. Directors, Senior Management and Employees—Share Ownership.”
| B. | Related Party Transactions |
See “Item 4.C. Information on the Company—Organizational Structure—Contractual Arrangements with the Variable Interest Entities and Other Consolidated Affiliated Entities and their Shareholders.”
Our subsidiaries, the variable interest entities, and the subsidiaries of the variable interest entities have engaged, during the ordinary course of business, in a number of customary transactions with each other. All of these inter-company balances have been eliminated in consolidation.
See “Item 3.D. Key Information—Risk Factors—Risks Related to Our Business Industry—Termination or other changes of related party transactions in the ordinary course of business may have an adverse impact on our
200
Table of Contents
results of operations and financial performance” for risks associated with the termination or other changes of related party transactions.
Loan transactions with Du Xiaoman
In August 2018, we completed the divestiture of Du Xiaoman, following which we recognized our non-controlling equity interest in Du Xiaoman as an equity method investment and Du Xiaoman became a related party.
In 2018, we provided three term loans to Du Xiaoman in an aggregate amount of RMB3.8 billion with terms ranging from two to five years for working capital purposes. These loans bear interest rates ranging from 4.28% to 5.00% in 2018, and 0% to 5.00% since 2019. Du Xiaoman repaid one term loan in the principal amount of RMB500 million in October 2020. In December 2023, Du Xiaoman repaid the other two term loans in an aggregate principal amount of RMB3.3 billion. After this repayment, all of the term loans to Du Xiaoman had been fully repaid.
In 2018, Du Xiaoman provided us with two term loans in an aggregate amount of RMB3.4 billion with terms of three and five years, respectively, for general corporate purposes. The interest rates for these loans were 3.78% and 4.28%, respectively, in 2018, and have been adjusted to 0% since 2019 based on the amended agreements. The two term loans had been fully repaid to Du Xiaoman in December 2023.
As of February 29, 2024, the amount of outstanding loans between us and Du Xiaoman was insignificant.
Loan transactions with Jidu Auto
In 2022, we provided three term loans to Jidu Auto in an aggregate principal amount of RMB600 million (US$87 million) with term of one year for working capital purposes. The interest rates for these loans were 3.465%. Jidu Auto had fully repaid the three term loans in January 2023. Jidu Auto is a joint venture that we established with Zhejiang Geely Holding Group (Geely). As of February 29, 2024, there was no outstanding loan between us and Jidu Auto.
Other related party transactions
Related Party A
In 2021, 2022 and 2023, related party transactions with Related Party A, which is one of our equity investees, were in the total amount of RMB315 million, RMB158 million and RMB540 million (US$76 million), respectively, and mainly comprised of the online marketing services that we provided to Related Party A.
Related Party B
In 2021, 2022 and 2023, related party transactions with Related Party B, which is one of our equity investees, were in the total amount of RMB888 million, RMB889 million and RMB924 million (US$130 million), respectively, and comprised of the online marketing services, cloud services and other services that we provided to Related Party B.
Related Party C
In 2021, 2022 and 2023, related party transactions with Related Party C, over which we can significantly influence its management or operating policies, were in the total amount of RMB 2.0 billion, RMB2.2 billion and RMB1.8 billion (US$256 million), respectively, and mainly comprised of online marketing services sold to the party.
201
Table of Contents
Related Party D
In 2021, 2022 and 2023, related party transactions with Related Party D, which is one of our equity investees, were in the total amount of RMB123 million, RMB257 million and RMB338 million (US$48 million), respectively, and mainly comprised of intelligent driving services and other services that we provided to Related Party D.
Other related parties
In 2021, 2022 and 2023, with the approval from our board of directors, we reimbursed Mr. Robin Yanhong Li the fees and expenses incurred in connection with his use of an aircraft beneficially owned by his family member for our business purposes. The hourly rate for use of the aircraft was determined based on an analysis of market rates for the charter of comparable aircrafts. The service charges for the use of the aircraft for 2021, 2022 and 2023 were insignificant.
Share Options and Restricted Shares Grants
Please refer to “Item 6.B. Directors, Senior Management and Employees—Compensation.”
| C. | Interests of Experts and Counsel |
Not applicable.
| Item 8. | Financial Information |
| A. | Consolidated Statements and Other Financial Information |
We have appended consolidated financial statements filed as part of this annual report.
Legal Proceedings
From time to time, we have been involved in litigation, administrative proceedings or other disputes regarding, among other things, copyright and trademark infringement, defamation, unfair competition, labor disputes, contract disputes and anti-monopoly inquiries. Our search results provide links to materials, and our P4P, Baidu Wenku, Baidu Post, Baidu Wiki, Baidu Knows, Baidu Feed, Baidu Drive, iQIYI and certain other products or services may contain materials, in which others may allege to own copyrights, trademarks or image rights or which others may claim to be defamatory or objectionable.
In 2023, 2,775 complaints were filed against us before various courts in China, and the aggregate amount of the damages sought in these complaints totals approximately RMB1.2 billion (US$162 million). As of December 31, 2023, 2,946 cases against us were pending before various courts in China. The aggregate amount of damages sought under these pending cases is approximately RMB1.6 billion (US$230 million). As of December 31, 2023, 7 cases against us were pending before various courts outside China. Some of these proceedings are in a preliminary stage with undetermined damages sought.
For many of the above-mentioned legal proceedings, we are currently unable to estimate the reasonably possible loss or a range of reasonably possible loss as the proceedings are in the early stages, or there is a lack of clear or consistent interpretation of laws specific to the industry-specific complaints among different jurisdictions. As a result, there is considerable uncertainty regarding the timing or ultimate resolution of such proceedings, which includes eventual loss, fine, penalty or business impact, if any, and therefore, an estimate for the reasonably possible loss or a range of reasonably possible loss cannot be made. With respect to the limited number of proceedings for which we are able to estimate the reasonably possible loss or the range of reasonably possible loss, such estimates are immaterial. However, we believe that such proceedings, individually and in the aggregate, when finally resolved, are not reasonably likely to have a material and adverse effect on our results of operations, financial position and cash flows.
202
Table of Contents
Baidu and iQIYI have been named as defendants in several putative federal securities class actions alleging that defendants made material misstatements and omissions regarding certain reported financial and operational results. Starting in April 2020, iQIYI and certain of its current and former officers and directors were named as defendants in several putative federal securities class actions purportedly brought on behalf of alleged classes of iQIYI shareholders. After one action was voluntarily dismissed by plaintiffs in June 2020, the remaining actions were consolidated in the U.S. District Court for the Eastern District of New York in May 2021, under the caption In re iQIYI, Inc. Securities Litigation, No. 1:20-CV-01830, or the iQIYI Action. In June 2021, lead plaintiffs in the iQIYI Action filed the consolidated amended complaint, naming iQIYI, its current and former officers, underwriters in its initial public offering, our company and certain of our officers as defendants. Similarly, starting in August 2020, we and certain of our current officers were named as defendants in two federal securities class actions brought by a purported class of Baidu shareholders in the U.S. District Court for the Eastern District of New York, which were consolidated under the caption In re Baidu Inc. Securities Litigation, 20-cv-03794, or the Baidu Action. In June 2022, lead plaintiffs in the Baidu Action filed the consolidated amended complaint, naming iQIYI, certain of its officers, our company and certain of our officers as defendants.
The operative complaints in the iQIYI and Baidu Actions both allege that the defendants made material misstatements and omissions in documents filed with the SEC and in other public statements regarding certain reported financial and operational results in violation of the federal securities laws. Although parties in the iQIYI Action completed briefing on defendants’ motions to dismiss the consolidated amended complaint on September 29, 2021, in light of the common questions of law and fact at issue in the iQIYI and Baidu Actions, the court terminated the motion to dismiss without prejudice and ordered motion-to-dismiss briefing for the two cases under a new coordinated briefing schedule. The coordinated motion-to-dismiss briefing was completed in March 2023. On February 26, 2024, following oral argument on the motions to dismiss, the court held defendants’ motions in abeyance, granted plaintiffs leave to file amended consolidated complaints, and ordered the supplemental briefing on the amended consolidated complaints to be completed by April 22, 2024. Both the iQIYI and Baidu Actions otherwise remain in the preliminary stage.
We and iQIYI will have to defend against these putative securities class action lawsuits, as applicable, including any appeals of such lawsuits should our or iQIYI’s initial defense be unsuccessful. Because all of the ongoing securities class actions against iQIYI or us are in their preliminary stages, we cannot predict the timing, outcome or consequences of these class actions. In the event that our or iQIYI’s initial defense of these lawsuits is unsuccessful, we cannot assure you that we or iQIYI will prevail in any appeal. Any adverse outcome of these cases, including any plaintiff’s appeal of a judgment in these lawsuits, could have a material adverse effect on our or iQIYI’s business, financial condition, results of operation, cash flows and reputation. The litigation process may utilize a significant portion of our or iQIYI’s resources and divert management’s attention from the day-to-day operations, all of which could harm our business.
Dividend Policy
Baidu, Inc., our holding company in the Cayman Islands, has never declared or paid any dividends on our ordinary shares, nor do we have any present plan to pay any cash dividends on our ordinary shares in the foreseeable future. We currently intend to retain most, if not all, of our available funds and any future earnings to operate and expand our business.
Our board of directors has complete discretion as to whether to distribute dividends, subject to Cayman Islands law. In addition, our shareholders may by ordinary resolution declare a dividend, but no dividend may exceed the amount recommended by our directors. Under Cayman Islands law, a Cayman Islands company may pay a dividend out of either profit or share premium account, provided that in no circumstances may a dividend be paid if this would result in the company being unable to pay its debts as they fall due in the ordinary course of business. Even if our board of directors decides to pay dividends, the form, frequency and amount of our dividends will depend upon our future operations and earnings, capital requirements and surplus, financial condition, contractual restrictions and other factors that our board of directors may deem relevant. If we pay any
203
Table of Contents
dividends, our depositary will distribute such dividends to our ADS holders to the same extent as holders of our ordinary shares, subject to the terms of the deposit agreement, including the fees and expenses payable thereunder. Cash dividends on our ordinary shares, if any, will be paid in U.S. dollars.
| B. | Significant Changes |
Except as disclosed elsewhere in this annual report, we have not experienced any significant changes since the date of our audited consolidated financial statements included in this annual report.
| Item 9. | The Offer and Listing |
| A. | Offering and Listing Details |
Our ADSs have been listed on The Nasdaq Global Market since August 5, 2005. Our ADSs currently trade on The Nasdaq Global Select Market under the symbol “BIDU.” Prior to May 12, 2010, one ADS represented one Class A ordinary share. On May 12, 2010, we effected a change of the ADS to Class A ordinary share ratio from 1 ADS representing 1 Class A ordinary share to 10 ADSs representing 1 Class A ordinary share. The ratio change has the same effect as a 10-for-1 ADS split. On March 1, 2021, our shareholders approved and effected a change to our authorized share capital by 1-to-80 subdivision of shares. Concurrently, we effected a proportionate change in ADS to Class A ordinary share ratio from 10 ADSs representing 1 Class A ordinary share to each ADS representing 8 Class A ordinary shares.
Our Class A ordinary shares have been listed on the Hong Kong Stock Exchange since March 23, 2021 under the stock code “9888.” On June 19, 2023, the launch of our Renminbi counter supporting the new Hong Kong Dollar-RMB Dual Counter Model program by the Hong Kong Stock Exchange became effective under the stock code “89888”.
| B. | Plan of Distribution |
Not applicable.
| C. | Markets |
Our ADSs have been listed on Nasdaq since August 5, 2005 under the symbol “BIDU.”
Our Class A ordinary shares have been listed on the Hong Kong Stock Exchange since March 23, 2021 under the stock code “9888.”
On June 19, 2023, we launched our RMB counter under the stock code “89888” to support the Hong Kong Dollar-RMB Dual Counter Model program established by the Hong Kong Stock Exchange.
| D. | Selling Shareholders |
Not applicable.
| E. | Dilution |
Not applicable.
| F. | Expenses of the Issue |
Not applicable.
204
Table of Contents
| Item 10. | Additional Information |
| A. | Share Capital |
Not applicable.
| B. | Memorandum and Articles of Association |
The following are summaries of material provisions of our fifth amended and restated memorandum and articles of association, as well as the Companies Act (As Revised) insofar as they relate to the material terms of our ordinary shares.
Registered Office and Objects
The Registered Office of our company is at the offices of Maples Corporate Services Limited, PO Box 309, Ugland House, Grand Cayman, KY1-1104, Cayman Islands or at such other place as our board of directors may from time to time decide. The objects for which our company is established are unrestricted and we have full power and authority to carry out any object not prohibited by the Companies Act (As Revised), as amended from time to time, or any other law of the Cayman Islands.
Board of Directors
See “Item 6.C. Directors, Senior Management and Employees—Board Practices—Board of Directors.”
Ordinary Shares
General. Our ordinary shares are divided into Class A ordinary shares and Class B ordinary shares. Holders of Class A ordinary shares and Class B ordinary shares have the same rights except for voting and conversion rights. All of our issued and outstanding ordinary shares are fully paid and non-assessable. Certificates representing the ordinary shares are issued in registered form. Our shareholders who are nonresidents of the Cayman Islands may freely hold and vote their shares.
Dividends. The holders of our ordinary shares are entitled to such dividends as may be declared by our board of directors subject to the Companies Act.
Conversion. Each Class B ordinary share is convertible into one Class A ordinary share at any time by the holder thereof. Class A ordinary shares are not convertible into Class B ordinary shares under any circumstances. Upon any transfer of Class B ordinary shares by a holder thereof to any person or entity which is not an affiliate of such holder (as defined in our articles of association), such Class B ordinary shares shall be automatically and immediately converted into the equal number of Class A ordinary shares. In addition, if at any time our chairman and chief executive officer, Robin Yanhong Li, and his affiliates collectively own less than 5% of the total number of the issued and outstanding Class B ordinary shares, each issued and outstanding Class B ordinary share shall be automatically and immediately converted into one share of Class A ordinary share, and we shall not issue any Class B ordinary shares thereafter.
Voting Rights. All of our shareholders have the right to receive notice of shareholders’ meetings and to attend, speak and vote at such meetings. In respect of matters requiring shareholders’ vote, each Class A ordinary share is entitled to one vote, and each Class B ordinary share is entitled to 10 votes. A shareholder may participate at a shareholders’ meeting in person, by proxy or by telephone conference or other communications equipment by means of which all the shareholders participating in the meeting can communicate with each other. At any shareholders’ meeting, a resolution put to the vote of the meeting shall be decided on a poll conducted by the chairman of the meeting.
205
Table of Contents
A quorum for a shareholders’ meeting consists of one or more shareholders holding at least one third of the paid up voting share capital present in person or by proxy or, if a corporation or other non-natural person, by its duly authorized representative. We shall hold a general meeting of shareholders as our annual general meeting and shall specify the meeting as such in the notices calling it. Our board of directors may call extraordinary general meetings, and they must on shareholders’ requisition convene an extraordinary general meeting. A shareholder requisition is a requisition of shareholders holding at the date of deposit of the requisition not less than ten percent (10%) of the voting power represented by the issued shares of our company which as at that date carries the right of voting at general meetings of our company, on a one vote per share basis. At least 21 clear days’ notice shall be given of any annual general meeting, and at least 14 clear days’ notice shall be given of any extraordinary general meeting.
An ordinary resolution to be passed by the shareholders requires the affirmative vote of a simple majority of the votes attaching to the ordinary shares cast in a general meeting, while a special resolution requires the affirmative vote of no less than two-thirds of the votes attaching to the ordinary shares cast in a general meeting. A special resolution is required for matters such as a change of name. Holders of the ordinary shares may effect certain changes by ordinary resolution, including consolidating and dividing all or any of our share capital into shares of larger amount than our existing share capital and canceling any shares.
Transfer of Shares. Subject to the restrictions of our memorandum and articles of association, as applicable, any of our shareholders may transfer any or all of his or her ordinary shares by an instrument of transfer in the usual or common form or any other form approved by our board of directors.
Our board of directors may, in their absolute discretion (except with respect to a transfer from a shareholder to its affiliate(s)), decline to register any transfer of shares without assigning any reason thereof. If our board of directors refuses to register a transfer they shall notify the transferee within two months of such refusal.
Notwithstanding the foregoing, if a transfer complies with the holder’s transfer obligations and restrictions set forth under applicable law (including but not limited to U.S. securities law provisions related to insider trading) and our articles of association, our board of directors shall promptly register such transfer. Further, any director is authorized to confirm in writing addressed to the registered office to authorize a share transfer and to instruct that the register of members be updated accordingly; provided that the transfer complies with the holder’s transfer obligations and restrictions set forth under applicable law and our articles of association and such holder is not the director who authorizes the transfer or an entity affiliated with such director. Any director is authorized to execute a share certificate in respect of such shares for and on behalf of our company.
The registration of transfers may be suspended at such time and for such periods as our board of directors may from time to time determine; provided, however, that the registration of transfers shall not be suspended for more than 45 days in any year.
Liquidation. On a return of capital on winding up or otherwise (other than on conversion, redemption or purchase of shares), assets available for distribution among the holders of ordinary shares may be distributed among the holders of the ordinary shares as determined by the liquidator, subject to sanction of a special resolution of our company. If our assets available for distribution are insufficient to repay all of the paid-up capital, the assets will be distributed so that the losses are borne by our shareholders proportionately to the capital paid up, or which ought to have been paid up, at the commencement of the winding up on the shares held by such shareholders respectively.
Calls on Shares and Forfeiture of Shares. Our board of directors may from time to time make calls upon shareholders for any amounts unpaid on their shares in a notice served to such shareholders at least 14 days prior to the specified time and place of payment. The shares that have been called upon and remain unpaid on the specified time are subject to forfeiture.
206
Table of Contents
Redemption of Shares. Subject to the provisions of the Companies Act and our articles of association, we may issue shares on terms that are subject to redemption, at our option or at the option of the holders, on such terms and in such manner as our board of directors may determine.
Repurchase of Shares. Subject to the provisions of the Companies Act and our articles of association, our board of directors may authorize repurchase of our shares in accordance with the manner of purchase specified in our articles of association without seeking shareholder approval.
Variations of Rights of Shares. All or any of the special rights attached to any class of shares may, subject to the provisions of the Companies Act, be varied either with the written consent of the holders of a majority of the issued shares of that class or with the sanction of a special resolution passed at a general meeting of the holders of the shares of that class.
Inspection of Books and Records. No holders of our ordinary shares who is not a director shall have any right of inspecting any of our accounts, books or documents except as conferred by the Companies Act or authorized by the directors or by us in general meeting. However, we will make this annual report, which contains our audited financial statements, available to shareholders and ADS holders. See “Item 10.H. Additional Information—Documents on Display.”
Preferred Shares
Our board of directors has the authority, without shareholder approval, to issue up to a total of 800,000,000 preferred shares in one or more series. Our board of directors may establish the number of shares to be included in each such series and may set the designations, preferences, powers and other rights of the shares of a series of preferred shares. While the issuance of preferred shares provides us with flexibility in connection with possible acquisitions or other corporate purposes, it could, among other things, have the effect of delaying, deferring or preventing a change of control transaction and could adversely affect the market price of our ADSs. We have no current plan to issue any preferred shares.
Differences in Corporate Law
The Companies Act (As Revised) is derived, to a large extent, from the older Companies Acts of England but does not follow recent United Kingdom statutory enactments, and accordingly there are significant differences between the Companies Act (As Revised) and the current Companies Act of England.
In addition, the Companies Act (As Revised) differs from laws applicable to United States corporations and their shareholders. Set forth below is a summary of certain significant differences between the provisions of the Companies Act (As Revised) applicable to us and the laws applicable to United States corporations and companies incorporated in the State of Delaware.
Mergers and Similar Arrangements
The Companies Act (As Revised) permits mergers and consolidations between Cayman Islands companies and between Cayman Islands companies and non-Cayman Islands companies. For these purposes, (1) “merger” means the merging of two or more constituent companies and the vesting of their undertaking, property and liabilities in one of such companies as the surviving company and (2) a “consolidation” means the combination of two or more constituent companies into a consolidated company and the vesting of the undertaking, property and liabilities of such companies in the consolidated company.
In order to effect such a merger or consolidation, the directors of each constituent company must approve a written plan of merger or consolidation, which must then be authorized by (1) a special resolution of the shareholders of each constituent company, and (2) such other authorization, if any, as may be specified in such
207
Table of Contents
constituent company’s articles of association. The written plan of merger or consolidation must be filed with the Registrar of Companies together with a declaration as to the solvency of the consolidated or surviving company, a list of the assets and liabilities of each constituent company and an undertaking that a copy of the certificate of merger or consolidation will be given to the members and creditors of each constituent company and that notification of the merger or consolidation will be published in the Cayman Islands Gazette. Dissenting shareholders have the right to be paid the fair value of their shares (which, if not agreed between the parties, will be determined by the Cayman Islands court) if they follow the required procedures, subject to certain exceptions. Court approval is not required for a merger or consolidation which is effected in compliance with these statutory procedures.
A merger between a Cayman parent company and its Cayman subsidiary or subsidiaries does not require authorization by a resolution of shareholders of that Cayman subsidiary if a copy of the plan of merger is given to every member of that Cayman subsidiary to be merged unless that member agrees otherwise. For this purpose a company is a “parent” of a subsidiary if it holds issued shares that together represent at least 90% of the votes at a general meeting of the subsidiary.
The consent of each holder of a fixed or floating security interest over a constituent company is required unless this requirement is waived by a court in the Cayman Islands.
Save in certain limited circumstances, a shareholder of a Cayman constituent company who dissents from the merger or consolidation is entitled to payment of the fair value of his shares (which, if not agreed between the parties, will be determined by the Cayman Islands court) upon dissenting to the merger or consolidation, provide the dissenting shareholder complies strictly with the procedures set out in the Companies Act. The exercise of dissenter rights will preclude the exercise by the dissenting shareholder of any other rights to which he or she might otherwise be entitled by virtue of holding shares, save for the right to seek relief on the grounds that the merger or consolidation is void or unlawful.
Separate from the statutory provisions relating to mergers and consolidations, the Companies Act (As Revised) also contains statutory provisions that facilitate the reconstruction and amalgamation of companies by way of schemes of arrangement, provided that the arrangement is approved by (a) 75% in value of the shareholders or class of shareholders, as the case may be, or (b) a majority in number representing 75% in value of the creditors or each class of creditors, as the case may be, with whom the arrangement is to be made, that are, in each case, present and voting either in person or by proxy at a meeting, or meetings, convened for that purpose. The convening of the meetings and subsequently the arrangement must be sanctioned by the Grand Court of the Cayman Islands. While a dissenting shareholder has the right to express to the court the view that the transaction ought not to be approved, the Grand Court can be expected to approve the arrangement if it determines that:
| • | the statutory provisions as to the required majority vote have been met; |
| • | the shareholders have been fairly represented at the meeting in question and the statutory majority are acting bona fide without coercion of the minority to promote interests adverse to those of the class; |
| • | the arrangement is such that may be reasonably approved by an intelligent and honest man of that class acting in respect of his interest; and |
| • | the arrangement is not one that would more properly be sanctioned under some other provision of the Companies Act. |
The Companies Act (As Revised) also contains a statutory power of compulsory acquisition which may facilitate the “squeeze out” of dissentient minority shareholder upon a tender offer. When a tender offer is made and accepted by holders of 90% of the shares affected within four months, the offeror may, within a two-month period commencing on the expiration of such four-month period, require the holders of the remaining shares to transfer such shares to the offeror on the terms of the offer. An objection can be made to the Grand Court of the
208
Table of Contents
Cayman Islands but this is unlikely to succeed in the case of an offer which has been so approved unless there is evidence of fraud, bad faith or collusion.
If an arrangement and reconstruction by way of scheme of arrangement is thus approved, the dissenting shareholder would have no rights comparable to appraisal rights, which would otherwise ordinarily be available to dissenting shareholders of Delaware corporations, providing rights to receive payment in cash for the judicially determined value of the shares.
Shareholders’ Suits
In principle, we will normally be the proper plaintiff to sue for a wrong done to us as a company, and as a general rule a derivative action may not be brought by a minority shareholder. However, based on English authorities, which would in all likelihood be of persuasive authority in the Cayman Islands, the Cayman Islands court can be expected to follow and apply the common law principles (namely the rule in Foss v. Harbottle and the exceptions thereto) so that a non-controlling shareholder may be permitted to commence a class action against or derivative actions in the name of our company to challenge actions where:
| • | an act which is ultra vires or illegal and is therefore incapable of ratification by the shareholders; |
| • | the act complained of, although not ultra vires, could only be effected duly if authorized by more than a simple majority vote that has not been obtained; and |
| • | an act which constitute a fraud against the minority where the wrongdoer are themselves in control of the company. |
Indemnification of Directors and Executive Officers and Limitation of Liability
Cayman Islands law does not limit the extent to which a company’s memorandum and articles of association may provide for indemnification of officers and directors, except to the extent any such provision may be held by the Cayman Islands courts to be contrary to public policy, such as to provide indemnification against civil fraud or the consequences of committing a crime.
Our memorandum and articles of association permit indemnification of officers and directors for losses, damages, costs and expenses incurred in their capacities as such unless such losses or damages arise from dishonesty or fraud of such directors or officers. This standard of conduct is generally the same as permitted under the Delaware General Corporation Law for a Delaware corporation.
In addition, we have entered into indemnification agreements with our directors and executive officers that provide such persons with additional indemnification beyond that provided in our memorandum and articles of association.
Insofar as indemnification for liabilities arising under the Securities Act may be permitted to our directors, officers or persons controlling us under the foregoing provisions, we have been informed that in the opinion of the SEC, such indemnification is against public policy as expressed in the Securities Act and is therefore unenforceable.
Directors’ Fiduciary Duties
Under Delaware corporate law, a director of a Delaware corporation has a fiduciary duty to the corporation and its shareholders. This duty has two components: the duty of care and the duty of loyalty. The duty of care requires that a director act in good faith, with the care that an ordinarily prudent person would exercise under similar circumstances. Under this duty, a director must inform himself of, and disclose to shareholders, all material information reasonably available regarding a significant transaction.
209
Table of Contents
The duty of loyalty requires that a director acts in a manner he or she reasonably believes to be in the best interests of the corporation. He or she must not use his corporate position for personal gain or advantage. This duty prohibits self-dealing by a director and mandates that the best interest of the corporation and its shareholders take precedence over any interest possessed by a director, officer or controlling shareholder and not shared by the shareholders generally.
In general, actions of a director are presumed to have been made on an informed basis, in good faith and in the honest belief that the action taken was in the best interests of the corporation. However, this presumption may be rebutted by evidence of a breach of one of the fiduciary duties. Should such evidence be presented concerning a transaction by a director, the director must prove the procedural fairness of the transaction and that the transaction was of fair value to the corporation.
As a matter of Cayman Islands law, a director of a Cayman Islands company is in the position of a fiduciary with respect to the company and therefore it is considered that he or she owes the following duties to the company:
| • | a duty to act in good faith in the best interests of the company, |
| • | a duty not to make a personal profit based on his or her position as director (unless the company permits him or her to do so), |
| • | a duty not to put himself or herself in a position where the interests of the company conflict with his or her personal interest or his or her duty to a third party, and |
| • | a duty to exercise powers for the purpose for which such powers were intended. |
A director of a Cayman Islands company owes to the company a duty of care, diligence and skill. It was previously considered that a director need not exhibit in the performance of his or her duties a greater degree of skill than may reasonably be expected from a person of his or her knowledge and experience. However, English and Commonwealth courts have moved towards an objective standard with regard to the required skill and care and these authorities are likely to be followed in the Cayman Islands.
Shareholder Action by Written Consent
Under the Delaware General Corporation Law, a corporation may eliminate the right of shareholders to act by written consent by amendment to its certificate of incorporation. Cayman Islands law and our currently effective memorandum and articles of association provide that our shareholders may approve corporate matters by way of a unanimous written resolution signed by or on behalf of all shareholders who would have been entitled to vote on such matter at a general meeting without a meeting being held.
Shareholder Proposals
Under the Delaware General Corporation Law, a shareholder has the right to put any proposal before the annual meeting of shareholders, provided it complies with the notice provisions in the governing documents. A special meeting may be called by the board of directors or any other person authorized to do so in the governing documents, but shareholders may be precluded from calling special meetings.
The Companies Act (As Revised) does not provide shareholders with an express right to put forth any proposal before a general meeting of the shareholders. However, the Companies Act (As Revised) may provide shareholders with limited rights to requisition a general meeting but such rights must be stipulated in the articles of association of the company.
Any one or more shareholders holding not less than one-tenth of the voting rights on a one vote per share basis, in the share capital of the company at the date of deposit of the requisition shall at all times have the right,
210
Table of Contents
by written requisition to the board of directors or the secretary of the company, to require an extraordinary general meeting to be called by the board of directors for the transaction of any business specified in such requisition.
Cumulative Voting
Under the Delaware General Corporation Law, cumulative voting for election of directors is not permitted unless the corporation’s certificate of incorporation specifically provides for it. Cumulative voting potentially facilitates the representation of minority shareholders on a board of directors since it permits the minority shareholder to cast all the votes to which the shareholder is entitled on a single director, which increases the shareholder’s voting power with respect to electing such director.
There are no prohibitions relating to cumulative voting under the laws of the Cayman Islands, but our memorandum and articles of association do not provide for cumulative voting. As a result, our shareholders are not afforded any less protections or rights on this issue than shareholders of a Delaware corporation.
Removal of Directors
Under the Delaware General Corporation Law, a director of a corporation with a classified board may be removed only for cause with the approval of a majority of the issued and outstanding shares entitled to vote, unless the certificate of incorporation provides otherwise. Under our memorandum and articles of association, directors may be removed with or without cause, by an ordinary resolution of our shareholders at any time before the expiration of his term of office notwithstanding anything in our memorandum and articles of association or in any agreement between our company and such director (but without prejudice to any claim for damages under any such agreement).
Transactions with Interested Shareholders
The Delaware General Corporation Law contains a business combination statute applicable to Delaware public corporations whereby, unless the corporation has specifically elected not to be governed by such statute by amendment to its certificate of incorporation, it is prohibited from engaging in certain business combinations with an “interested shareholder” for three years following the date that such person becomes an interested shareholder. An interested shareholder generally is a person or a group who or which owns or owned 15% or more of the target’s outstanding voting shares within the past three years.
This statute has the effect of limiting the ability of a potential acquirer to make a two-tiered bid for the target in which all shareholders would not be treated equally. The statute does not apply if, prior to the date on which such shareholder becomes an interested shareholder, the board of directors approves either the business combination or the transaction which resulted in the person becoming an interested shareholder. This encourages any potential acquirer of a Delaware corporation to negotiate the terms of any acquisition transaction with the target’s board of directors.
Cayman Islands law has no comparable statute. As a result, we cannot avail ourselves of the types of protections afforded by the Delaware business combination statute. However, although Cayman Islands law does not regulate transactions between a company and its significant shareholders, it does provide that such transactions must be entered into bona fide in the best interests of the company and for a proper purpose and not with the effect of constituting a fraud on the minority shareholders.
Restructuring
A company may present a petition to the Grand Court of the Cayman Islands for the appointment of a restructuring officer on the grounds that the company:
| (a) | is or is likely to become unable to pay its debts; and |
211
Table of Contents
| (b) | intends to present a compromise or arrangement to its creditors (or classes thereof) either pursuant to the Companies Act, the law of a foreign country or by way of a consensual restructuring. |
The Grand Court may, among other things, make an order appointing a restructuring officer upon hearing of such petition, with such powers and to carry out such functions as the court may order. At any time (i) after the presentation of a petition for the appointment of a restructuring officer but before an order for the appointment of a restructuring officer has been made, and (ii) when an order for the appointment of a restructuring officer is made, until such order has been discharged, no suit, action or other proceedings (other than criminal proceedings) shall be proceeded with or commenced against the company, no resolution to wind up the company shall be passed, and no winding up petition may be presented against the company, except with the leave of the court. However, notwithstanding the presentation of a petition for the appointment of a restructuring officer or the appointment of a restructuring officer, a creditor who has security over the whole or part of the assets of the company is entitled to enforce the security without the leave of the court and without reference to the restructuring officer appointed.
Dissolution; Winding Up
Under the Delaware General Corporation Law, unless the board of directors approves the proposal to dissolve, dissolution must be approved by shareholders holding 100% of the total voting power of the corporation. Only if the dissolution is initiated by the board of directors may it be approved by a simple majority of the corporation’s outstanding shares. Delaware law allows a Delaware corporation to include in its certificate of incorporation a supermajority voting requirement in connection with dissolutions initiated by the board.
Under Cayman Islands law, a company may be wound up by either an order of the courts of the Cayman Islands or by a special resolution of its members or, if the company is unable to pay its debts as they fall due, by an ordinary resolution of its members. The court has authority to order winding up in a number of specified circumstances including where it is, in the opinion of the court, just and equitable to do so.
Variation of Rights of Shares
Under the Delaware General Corporation Law, a corporation may vary the rights of a class of shares with the approval of a majority of the outstanding shares of such class, unless the certificate of incorporation provides otherwise. Under Cayman Islands law and our memorandum and articles of association, if our share capital is divided into more than one class of shares, we may vary the rights attached to any class with the sanction of a special resolution passed by a majority of not less than three-fourths of the votes cast at a separate meeting of the holders of the shares of that class.
Amendment of Governing Documents
Under the Delaware General Corporation Law, a corporation’s governing documents may be amended with the approval of a majority of the outstanding shares entitled to vote, unless the certificate of incorporation provides otherwise.
Under Cayman Islands law, our memorandum and articles of association may only be amended with a special resolution of our shareholders.
Rights of Non-resident or Foreign Shareholders
There are no limitations imposed by our memorandum and articles of association on the rights of non-resident or foreign shareholders to hold or exercise voting rights on our shares.
In addition, there are no provisions in our memorandum and articles of association governing the ownership threshold above which shareholder ownership must be disclosed.
212
Table of Contents
Inspection of Books and Records
Under the Delaware General Corporation Law, any shareholder of a corporation may for any proper purpose inspect or make copies of the corporation’s stock ledger, list of shareholders and other books and records.
Shareholders of Cayman Islands exempted companies like us have no general right under Cayman Islands law to inspect corporate records (other than the memorandum and articles of association, the register of mortgages and charges and any special resolutions passed by our shareholders) or obtain copies of the list of shareholders of these companies. Under Cayman Islands law, the names of our current directors can be obtained from a search conducted at the Registrar of Companies. However, we intend to provide our shareholders with annual reports containing audited financial statements.
| C. | Material Contracts |
We have not entered into any material contracts other than in the ordinary course of business and other than those described in “Item 4. Information on the Company” or elsewhere in this annual report on Form 20-F.
| D. | Exchange Controls |
See “Item 4.B. Information on the Company—Business Overview—Regulations—Regulations on Foreign Exchange.”
| E. | Taxation |
The following summary of the material Cayman Islands, People’s Republic of China and U.S. federal income tax consequences of an investment in our ADSs or ordinary shares is based upon the laws and interpretations thereof in effect as of the date of this annual report, all of which are subject to change. This summary does not deal with all possible tax consequences relating to an investment in our ADSs or ordinary shares, such as the tax consequences under state, local and other tax laws.
Cayman Islands Tax Considerations
According to Maples and Calder (Hong Kong) LLP, our Cayman Islands counsel, the Cayman Islands currently levies no taxes on individuals or corporations based upon profits, income, gains or appreciation and there is no taxation in the nature of inheritance tax or estate duty. There are no other taxes likely to be material to shareholders or ADS holders levied by the Government of the Cayman Islands except for stamp duties which may be applicable on instruments executed in, or brought within, the jurisdiction of the Cayman Islands. The Cayman Islands is not party to any double tax treaties that are applicable to any payments made to or by our company. There are no exchange control regulations or currency restrictions in the Cayman Islands.
Mainland China Tax Considerations
If we are considered a mainland China resident enterprise under the EIT Law, our shareholders and ADS holders who are deemed non-resident enterprises may be subject to the 10% enterprise income tax on the dividends payable by us or any gains realized from the transfer of our shares or ADSs, if such income is deemed derived from mainland China; provided that (i) such foreign enterprise investor has no establishment or premises in mainland China, or (ii) it has establishment or premises in mainland China but its income derived from mainland China has no real connection with such establishment or premises. Furthermore, if we are considered a mainland China resident enterprise and the PRC tax authorities consider the dividends we pay with respect to our shares or ADSs and the gains realized from the transfer of our shares or ADSs to be income derived from sources within mainland China, it is also possible that such dividends and gains earned by non-resident individuals may be subject to the 20% mainland China individual income tax. It is uncertain whether, if we are considered a mainland China resident enterprise, holders of our shares or ADSs would be able to claim the benefit of tax treaties or arrangements entered into between mainland China and other jurisdictions.
213
Table of Contents
If we are required under the tax law of mainland China to withhold mainland China income tax on our dividends payable to our non-resident shareholders and ADS holders, or if any gains realized from the transfer of our shares or ADSs by our non-resident shareholders and ADS holders are subject to the enterprise income tax or the individual income tax, your investment in our shares or ADSs could be materially and adversely affected.
U.S. Federal Income Tax Considerations
The following discussion is a summary of U.S. federal income tax considerations under present law of the ownership and disposition of the ADSs or ordinary shares. This summary applies only to investors that are U.S. Holders (as defined below) and that hold the ADSs or ordinary shares as capital assets (generally, property held for investment) under the U.S. Internal Revenue Code of 1986, as amended. This discussion is based on the existing federal tax laws of the United States as in effect on the date of this annual report on Form 20-F and on U.S. Treasury regulations in effect or, in some cases, proposed, as of the date of this annual report on Form 20-F, as well as judicial and administrative interpretations thereof available on or before such date. All of the foregoing authorities are subject to differing interpretations or change, which change could apply retroactively and there can be no assurance that the U.S. Internal Revenue Service or a court will not take a contrary position.
The following discussion does not deal with the tax consequences to any particular investor or to persons in special tax situations such as:
| • | banks; |
| • | financial institutions; |
| • | insurance companies; |
| • | broker dealers; |
| • | pension plans; |
| • | cooperatives; |
| • | holders that are not U.S. Holders; |
| • | real estate investment trusts; |
| • | persons that elect to mark their securities to market; |
| • | tax-exempt entities; |
| • | persons liable for the alternative minimum tax; |
| • | regulated investment companies; |
| • | certain expatriates or former long-term residents of the United States; |
| • | governments or agencies or instrumentalities thereof; |
| • | persons holding an ADS or ordinary share as part of a straddle, hedging, conversion, constructive sale, or integrated transaction; |
| • | persons that actually or constructively own ADSs or ordinary shares representing 10% or more of our stock (by vote or value); |
| • | persons holding ADSs or ordinary shares through partnerships or other pass-through entities; |
| • | persons who are required to recognize income for U.S. federal income tax purposes no later than when such income is taken into account in applicable financial statements; |
| • | persons whose functional currency is other than the U.S. dollar; or |
| • | persons who acquired our ADSs or ordinary shares pursuant to the exercise of any employee share option or otherwise as compensation. |
214
Table of Contents
U.S. Holders are urged to consult their tax advisors about the application of the U.S. federal tax rules to their particular circumstances as well as the state, local and foreign tax, Medicare tax and non-income tax (such as the U.S. federal estate or gift tax) consequences to them of ownership and disposition of our ADSs or ordinary shares.
The discussion below of the U.S. federal income tax consequences will apply if you are a “U.S. Holder.” You are a “U.S. Holder” if you are the beneficial owner of our ADSs or ordinary shares and you are, for U.S. federal income tax purposes,
| • | a citizen or individual resident of the United States; |
| • | a corporation (or other entity subject to tax as a corporation for U.S. federal income tax purposes) that is created or organized in or under the laws of the United States, any State or the District of Columbia; |
| • | an estate whose income is subject to U.S. federal income taxation regardless of its source; or |
| • | a trust that (i) is subject to the supervision of a court within the United States and the control of one or more U.S. persons or (ii) has a valid election in effect under applicable U.S. Treasury regulations to be treated as a U.S. person. |
This discussion does not consider the tax treatment of partnerships or other pass-through entities that hold the ADSs or ordinary shares, or of persons who hold the ADSs or ordinary shares through such entities. If a partnership (or other entity classified as a partnership for U.S. federal income tax purposes) is the beneficial owner of the ADSs or ordinary shares, the U.S. federal income tax treatment of a partner in the partnership will generally depend on the status of the partner and the activities of the partnership. Partners in a partnership holding our ordinary shares or ADSs should consult their tax advisors regarding the United States federal income tax considerations relating to the ownership or disposition of our ordinary shares or ADSs.
The discussion below assumes that the representations contained in the deposit agreement are true and that the obligations in the deposit agreement and any related agreement will be complied with in accordance with their terms. If you hold our ADSs, you will be treated as the holder of the underlying ordinary shares represented by those ADSs for U.S. federal income tax purposes.
This discussion does not address any aspect of U.S. federal non-income tax laws, such as gift or estate tax laws, minimum tax considerations, or state, local or foreign tax laws or the Medicare tax on certain net investment income. The IRS may disagree with the discussion herein, and its determination may be upheld by a court.
Taxation of Dividends and Other Distributions on the ADSs or Ordinary Shares
Subject to the passive foreign investment company rules discussed below, the gross amount of all our distributions to you with respect to the ADSs or ordinary shares will be included in your gross income as dividend income on the date actually or constructively received by the depositary, in the case of our ADSs, or by you, in the case of ordinary shares, but only to the extent that the distribution is paid out of our current or accumulated earnings and profits (computed under U.S. federal income tax principles). Because we do not intend to determine our earnings and profits on the basis of U.S. federal income tax principles, any distribution paid will generally be treated as a “dividend” for U.S. federal income tax purposes. Dividends paid by us will not be eligible for the dividends-received deduction allowed to corporations in respect of dividends received from U.S. corporations.
With respect to non-corporate U.S. Holders (including individual U.S. Holders), dividends may be taxed at the lower applicable capital gains rate provided that (i) the ADSs or ordinary shares are readily tradable on an established securities market in the United States or we are eligible for the benefit of the income tax treaty between the United States and mainland China, or the Treaty, (ii) we are not a passive foreign investment
215
Table of Contents
company (as discussed below) for either our taxable year in which the dividend was paid or for the preceding taxable year, (iii) certain holding period requirements are met and (iv) such non-corporate U.S. Holders are not under an obligation to make related payments with respect to positions in substantially similar or related property. For this purpose, ADSs listed on the Nasdaq Global Select Market will generally be considered to be readily tradable on an established securities market in the United States. Even if our ADSs are listed on Nasdaq, there can be no assurance that our ADSs will be considered readily tradable on an established securities market in future years. You should consult your tax advisor regarding the availability of the lower rate for dividends paid with respect to our ADSs or ordinary shares.
For U.S. foreign tax credit purposes, dividends paid on the ADSs or ordinary shares will generally be treated as income from foreign sources and will generally constitute passive category income. If mainland China withholding taxes apply to dividends paid to you with respect to the ADSs or ordinary shares, you may be able to obtain a reduced rate of mainland China withholding taxes under the Treaty. In addition, subject to certain conditions and limitations, mainland China withholding taxes on dividends that are non-refundable under the Treaty may be treated as foreign taxes eligible for credit against your U.S. federal income tax liability. If you do not elect to claim a foreign tax credit, you may instead claim a deduction for U.S. federal income tax purposes in respect of such withholding, but only for a year in which you elect to do so for all creditable foreign income taxes. You should consult your tax advisor regarding the availability of the foreign tax credit under your particular circumstances.
Sale, Exchange or Other Disposition of the ADSs or Ordinary Shares
Subject to the passive foreign investment company rules discussed below, you will generally recognize gain or loss on any sale, exchange or other taxable disposition of an ADS or ordinary share equal to the difference between the amount realized for the ADS or ordinary share and your tax basis in the ADS or ordinary share. The gain or loss will generally be capital gain or loss. If you are a non-corporate U.S. Holder, including an individual U.S. Holder, who has held the ADS or ordinary share for more than one year, you will generally be eligible for reduced capital gains tax rates. The deductibility of capital losses is subject to limitations. Any such gain or loss that you recognize will generally be treated as U.S. source income or loss for foreign tax credit limitation purposes, which will generally limit the availability of foreign tax credits. However, in the event we are deemed to be a mainland China “resident enterprise” under mainland China tax law, we may be eligible for the benefits of the Treaty. In such event, if mainland China tax were to be imposed on any gain from the disposition of the ADSs or ordinary shares, a U.S. Holder that is eligible for the benefits of the Treaty may elect to treat such gain as mainland China source income. U.S. Holders should consult their tax advisors regarding the creditability of any mainland China tax.
Passive Foreign Investment Company
A non-U.S. corporation, such as us, is considered a PFIC for any taxable year if either (i) at least 75% of its gross income is passive income, or (ii) at least 50% of the value of its assets (based on an average of the quarterly values of the assets during a taxable year) is attributable to assets that produce or are held for the production of passive income, or the asset test. We will be treated as owning our proportionate share of the assets and earning our proportionate share of the income of any other corporation in which we own, directly or indirectly, at least 25% (by value) of the shares. Although the law in this regard is not entirely clear, we treat the variable interest entities as being owned by us for U.S. federal income tax purposes because we control their management decisions and we are entitled to receive economic benefits that could potentially be significant to them and, as a result, we consolidate their results of operations in our consolidated U.S. GAAP financial statements. If it were determined, however, that we are not the owner of the variable interest entities for U.S. federal income tax purposes, we would likely be treated as a PFIC for our current taxable year and for subsequent taxable years.
Assuming that we are the owner of the VIEs for U.S. federal income tax purposes, and based on the market price of our ADSs and ordinary shares, the value of our assets, and the composition of our assets and income, we
216
Table of Contents
believe that we were not a PFIC for our taxable year ended December 31, 2023. No assurance can be given that we will not be a PFIC in the current taxable year or foreseeable taxable years, because the determination of whether we will be a PFIC is a factual determination made annually that will depend, in part, upon the composition of our income and assets. Based on the nature of our business and activities, it is possible that the U.S. Internal Revenue Service may challenge our classification of certain income and assets as non-passive, which may result in our company being a PFIC. The composition of our income and assets will also be affected by how, and how quickly, we use our liquid assets. In addition, fluctuations in the market price of our ordinary shares and/or ADSs may cause us to be a PFIC for the current or future taxable years because the value of our assets for purposes of the asset test, including the value of our goodwill and other unbooked intangibles, may be determined by reference to the market price of our ordinary shares and/or ADSs from time to time (which may be volatile). If our market capitalization declines, we may be classified as a PFIC for the current taxable year or future taxable years. Under circumstances where our revenue from activities that produce passive income significantly increase relative to our revenue from activities that produce non-passive income, or where we determine not to deploy significant amounts of cash for active purposes, our risk of becoming classified as a PFIC may substantially increase. If we are a PFIC for any year during which you hold the ADSs or ordinary shares, we will generally continue to be treated as a PFIC for all succeeding years during which you hold such ADSs or ordinary shares even if we cease to be a PFIC in subsequent years, unless certain elections are made.
If we are a PFIC for any year during which you hold the ADSs or ordinary shares, we will generally continue to be treated as a PFIC for all succeeding years during which you hold such ADSs or ordinary shares. However, if we cease to be a PFIC, you may avoid some of the adverse effects of the PFIC regime by making a deemed sale election with respect to the ADSs or ordinary shares, as applicable, provided that you have not made a mark-to-market election, as described below.
If we are a PFIC for any taxable year during which you hold our ADSs or ordinary shares, you will be subject to special tax rules with respect to any “excess distribution” that you receive and any gain you realize from a sale or other disposition (including a pledge under proposed regulations) of the ADSs or ordinary shares, unless you make a mark-to-market election as discussed below. Distributions you receive in a taxable year that are greater than 125% of the average annual distributions you received during the shorter of the three preceding taxable years or your holding period for the ADSs or ordinary shares will be treated as an excess distribution. Under these special tax rules:
| • | the excess distribution or gain will be allocated ratably over your holding period for the ADSs or ordinary shares, |
| • | the amount allocated to the current taxable year, and any taxable year prior to the first taxable year in which we became a PFIC, will be treated as ordinary income, and |
| • | the amount allocated to each of the other taxable years would be subject to tax at the highest rate of tax in effect for you for such year and would be increased by an additional tax equal to interest on the resulting tax deemed deferred with respect to each such other taxable year. |
The tax liability for amounts allocated to years prior to the year of disposition or “excess distribution” cannot be offset by any net operating losses for such years, and gains (but not losses) realized on the sale of the ADSs or ordinary shares cannot be treated as capital, even if you hold the ADSs or ordinary shares as capital assets.
If we are a PFIC for any taxable year during which you hold our ADSs or ordinary shares and any of our non-U.S. subsidiaries is also a PFIC (i.e., a lower-tier PFIC), you will be treated as owning a proportionate amount (by value) of the shares of the lower-tier PFIC and would be subject to the rules described above on certain distributions by a lower-tier PFIC and a disposition of shares of a lower-tier PFIC even though you would not receive the proceeds of those distributions or dispositions. You are advised to consult your tax advisors regarding the application of the PFIC rules to any of our subsidiaries.
217
Table of Contents
Alternatively, a U.S. Holder of “marketable stock” (as defined below) in a PFIC may make a mark-to-market election for such stock of a PFIC to elect out of the tax treatment discussed above. The mark-to-market election is available only for “marketable stock,” which is stock that is traded in other than de minimis quantities on at least 15 days during each calendar quarter, or “regularly traded,” on a qualified exchange or other market, as defined in applicable Treasury regulations. Our ADSs, but not our ordinary shares, are listed on the Nasdaq Global Select Market, which is a qualified exchange for these purposes. Our ordinary shares are listed on the Hong Kong Stock Exchange, which we expect to meet the requirements of a qualified exchange or market for these purposes. We anticipate that our ADSs and ordinary shares should qualify as being regularly traded, but no assurances may be given in this regard. Assuming that the ADSs and ordinary shares are regularly traded, if you are a holder of our ADSs or ordinary shares, it is expected that the mark-to-market election would be available to you were we a PFIC. If you make a valid mark-to-market election for the ADSs or ordinary shares, you will generally include in income each year an amount equal to the excess, if any, of the fair market value of the ADSs as of the close of your taxable year over your adjusted basis in such ADSs or ordinary shares. You are allowed a deduction for the excess, if any, of the adjusted basis of the ADSs or ordinary shares over their fair market value as of the close of the taxable year. Such deductions, however, are allowable only to the extent of any net mark-to-market gains on the ADSs or ordinary shares included in your income for prior taxable years. Amounts included in your income under a mark-to-market election, as well as gain on the actual sale or other disposition of the ADSs or ordinary shares, are treated as ordinary income. Ordinary loss treatment also applies to the deductible portion of any mark-to-market loss on the ADSs or ordinary shares, as well as to any loss realized on the actual sale or disposition of the ADSs or ordinary shares, to the extent that the amount of such loss does not exceed the net mark-to-market gains previously included for such ADSs. Your basis in the ADSs or ordinary shares will be adjusted to reflect any such income or loss amounts. If you make such a mark-to-market election in respect of a corporation classified as a PFIC and such corporation ceases to be classified as a PFIC, you will not be required to take into account the gain or loss described above during any period that such corporation is not classified as a PFIC.
Because, as a technical matter, a mark-to-market election cannot be made for any lower-tier PFICs that we may own, a U.S. Holder may continue to be subject to the general PFIC rules described above with respect to such U.S. Holder’s indirect interest in any investments held by us that are treated as an equity interest in a PFIC for U.S. federal income tax purposes.
Alternatively, a U.S. Holder may avoid the PFIC tax consequences described above in respect to its ADSs and ordinary shares by making a timely “qualified electing fund,” or QEF, election. To comply with the requirements of a QEF election, a U.S. Holder must receive certain information from us. Because we do not intend to provide such information, however, such election will not be available to you with respect to the ADSs or ordinary shares.
If you hold our ADSs or ordinary shares in any year in which we are a PFIC, you will be required to file an annual information report containing such information as the U.S. Treasury may require.
You are urged to consult your tax advisor regarding the reporting requirements that may apply and the U.S. federal income tax consequences of holding and disposing of our ADSs or ordinary shares if we are treated as a PFIC, including the possibility of making a mark-to-market election and the unavailability of the election to treat us as a qualified electing fund.
| F. | Dividends and Paying Agents |
Not applicable.
| G. | Statement by Experts |
Not applicable.
218
Table of Contents
| H. | Documents on Display |
We are subject to the periodic reporting and other informational requirements of the Exchange Act, and are required to file reports and other information with the SEC. Specifically, we are required to file annually a Form 20-F within four months after the end of each fiscal year, which is December 31. All information filed with the SEC can be obtained over the internet at the SEC’s website at www.sec.gov. As a foreign private issuer, we are exempt from the rules under the Exchange Act prescribing the furnishing and content of quarterly reports and proxy statements, and officers, directors and principal shareholders are exempt from the reporting and short-swing profit recovery provisions contained in Section 16 of the Exchange Act.
We will furnish The Bank of New York Mellon, the depositary of our ADSs, with our annual reports, which will include a review of operations and annual audited consolidated financial statements prepared in conformity with U.S. GAAP, and all notices of shareholders’ meetings and other reports and communications that are made generally available to our shareholders. The depositary will make such notices, reports and communications available to holders of ADSs and, upon our request, will mail to all record holders of ADSs the information contained in any notice of a shareholders’ meeting received by the depositary from us.
In accordance with Nasdaq Stock Market Rule 5250(d), we will post this annual report on Form 20-F on our website at http://ir.baidu.com. In addition, we will provide hardcopies of our annual report free of charge to shareholders and ADS holders upon request.
| I. | Subsidiary Information |
Not applicable.
| J. | Annual Report to Security Holders |
We intend to submit the annual report provided to security holders in electronic format pursuant to the Rules Governing the Listing of Securities on The Stock Exchange of Hong Kong Limited as an exhibit to a current report on Form 6-K.
| Item 11. | Quantitative and Qualitative Disclosures about Market Risk |
Interest Rate Risk
Our exposure to interest rate risk primarily relates to excess cash invested in short-term instruments, long-term investments and bank facilities that have a floating rate of interest.
Investments in both fixed rate and floating rate interest earning instruments carry a degree of interest rate risk. Fixed rate investments may have their fair market value adversely impacted due to a rise in interest rates, while floating rate investments may produce less income than expected if interest rates fall. Due in part to these factors, our future investment income may fall short of expectations due to changes in interest rates, or we may suffer losses in principal if we have to sell securities which have declined in market value due to changes in interest rates. For example, as of December 31, 2023, we had RMB168.7 billion (US$23.8 billion) short-term investments, with a weighted average duration of 0.4 year. A hypothetical one percentage point (100 basis-point) increase in interest rates would have resulted in a decrease of RMB712 million (US$100 million) in the fair value of our short-term investments as of December 31, 2023. We have not been, and do not expect to be, exposed to material interest rate risks relating to our investment in short-term instruments, and therefore have not used any derivative financial instruments to manage such interest risk exposure. Our exposure to interest rate risk also arises from our bank facilities that have a floating rate of interest. The costs of floating rate borrowings may be affected by the fluctuations in the interest rates. We manage this risk through the use of interest rate swap contracts. In connection with the loan facilities entered into in April 2021, we entered into two interest rate swap agreements, as amended, which effectively convert the term loans from a variable interest rate to a fixed rate, thereby managing our exposure to changes in market interest rates under the term loans. See “Item 5.B. Operating and Financial Review and Prospects—Liquidity and Capital Resources.”
219
Table of Contents
Foreign Exchange Risk
Most of our revenues and costs are denominated in RMB, while a portion of our cash and cash equivalents, restricted cash, short-term investments, long-term investments, long-term time deposits and held-to-maturity investments, long-term loans, notes payable and convertible senior notes are denominated in U.S. dollars. Any significant revaluation of RMB against the U.S. dollar may materially affect our cash flows, revenues, earnings and financial position, and the value of, and any dividends payable on, our ADS in U.S. dollars. See “Item 3.D. Key Information—Risk Factors—Risks Related to Doing Business in China—Fluctuation in exchange rates could have a material and adverse effect on our results of operations and the value of your investment.” In addition, we have operations in Japan. We may need to make capital injections into our Japan operations by converting U.S. dollars into Japanese Yen, and we have JPY-denominated revenue and expenses that we may need to translate into U.S. dollars, which will expose us to the fluctuations in the exchange rate between the U.S. dollar and the Japanese Yen. In 2023, we entered into some hedging transactions in an effort to reduce our exposure to foreign currency exchange risk. The value of your investment in our ADSs or Class A ordinary shares will be affected by the exchange rate between the U.S. dollar and the Renminbi or the Hong Kong dollar and the Renminbi, as applicable, because the value of our business is effectively denominated in RMB, while our ADSs or Class A ordinary shares will be traded in U.S. dollars or Hong Kong dollars, as applicable.
The conversion of Renminbi into foreign currencies, including U.S. dollars, is based on rates set by the People’s Bank of China. The Renminbi has fluctuated against the U.S. dollar, at times significantly and unpredictably. It is difficult to predict how market forces or PRC or U.S. government policy may impact the exchange rate between Renminbi and U.S. dollar in the future.
To the extent that we need to convert U.S. dollars into Renminbi for our operations, appreciation of the Renminbi against the U.S. dollar would have an adverse effect on the RMB amount we receive from the conversion. Conversely, if we decide to convert Renminbi into U.S. dollars for the purpose of making payments for dividends on our ordinary shares or ADSs, repaying indebtedness denominated in U.S. dollars, or for other business purposes, appreciation of the U.S. dollar against the Renminbi would have a negative effect on the U.S. dollar amounts available to us.
As of December 31, 2023, we had RMB-denominated cash and cash equivalents, restricted cash and short-term investments of RMB171.7 billion, and U.S. dollar-denominated cash and cash equivalents, restricted cash and short-term investments of US$4.6 billion. Assuming we had converted RMB171.7 billion into U.S. dollars at the exchange rate of RMB7.0999 for US$1.00 as of December 29, 2023, our U.S. dollar cash balance would have been US$28.8 billion. If the RMB had depreciated by 10% against the U.S. dollar, our U.S. dollar cash balance would have been US$26.4 billion instead. In addition, we had U.S. dollar-denominated long-term loans (including current portion), notes payable (including current portion) and convertible senior notes (including current portion) of US$9.3 billion as of December 31, 2023. A hypothetical 10% increase in the exchange rate of the U.S. dollar against the RMB would have resulted in an increase of RMB6.6 billion (US$932 million) in the value of our U.S. dollar-denominated long-term loans (including current portion), notes payable (including current portion) and convertible senior notes (including current portion) as of December 31, 2023.
| Item 12. | Description of Securities Other than Equity Securities |
| A. | Debt Securities |
Not applicable.
| B. | Warrants and Rights |
Not applicable.
| C. | Other Securities |
Not applicable.
220
Table of Contents
| D. | American Depositary Shares |
Fees and Charges Our ADS holders May Have to Pay
The Bank of New York Mellon is the depositary of our ADS program. A holder of ADSs may have to pay certain fees of The Bank of New York Mellon, as depositary, and certain taxes, registration and transfer charges and fees and governmental charges and fees. The depositary collects fees for delivery and surrender of ADSs directly from holders depositing shares or surrendering ADSs for the purpose of withdrawal or from intermediaries acting for them or to whom ADSs are issued (including, without limitation, issuances pursuant to a stock dividend or stock split declared by us or an exchange of stock regarding the ADSs or deposited shares or a distribution of ADSs). The depositary collects fees for making distributions to holders by deducting those fees from the amounts distributed or by selling a portion of distributable property to pay the fees. The depositary may collect its annual fee for depositary services by deductions from cash distributions or by directly billing holders or by charging the book-entry system accounts of participants acting for them. The depositary may generally refuse to deliver ADSs or deposited shares or to forward any distributions until its fees for those services are paid. The Depositary’s Office is located at 240 Greenwich Street, New York, New York 10286.
| Persons depositing or withdrawing shares must pay: |
For: | |
| US$5.00 or less per 100 ADSs (or portion thereof) |
• Issuance of ADSs, including issuances resulting from a distribution of shares or rights or other property | |
| US$5.00 or less per 100 ADS (or portion thereof) |
• Cancellation of ADSs for the purpose of withdrawal, including if the deposit agreement terminates | |
| US$0.02 or less per ADS (or portion thereof) |
• Any cash distribution to ADS holders | |
| A fee equivalent to the fee that would be payable if securities distributed to ADS holders had been shares and the shares had been deposited for issuance of ADSs |
• Distribution of securities distributed to holders of deposited securities which are distributed by the depositary to ADS holders | |
| US$0.02 or less per ADS (or portion thereof) per calendar year (to the extent that a fee of $0.02 was not charged as a result of any cash distribution during that calendar year) |
• Depositary services | |
| Expenses of the depositary |
• Cable, telex and facsimile transmissions (when expressly provided in the deposit agreement)
• Converting foreign currency to U.S. dollars | |
| Registration fees |
• Transfer and registration of shares on our share register to or from the name of the depositary or its nominee or the custodian or its nominee when you deposit or withdraw shares | |
| Taxes and other governmental charges the depositary or the custodian have to pay on any ADS or share underlying an ADS, for example, stock transfer taxes, stamp duty or withholding taxes |
• As necessary | |
| Expenses of depositary incurred in the conversion of foreign currency |
• As necessary | |
| Any charges incurred by the depositary or its agents for servicing the deposited securities |
• As necessary | |
221
Table of Contents
Fees and Other Payments Made by the Depositary to Us
The depositary has agreed to reimburse us certain expenses annually and we incur expenses related to the establishment and maintenance of the ADR program, including expenses related to our listing in the U.S. and Hong Kong, compliance, and investor relations activities. In 2024, we expect to receive certain insignificant amount of reimbursement from the depositary.
Conversion between Class A ordinary shares and ADSs
Dealings and Settlement of Class A Ordinary Shares in Hong Kong
Our Class A ordinary shares commenced trading on the Hong Kong Stock Exchange in board lots of 50 Class A ordinary shares on March 23, 2021. Dealings in our Class A ordinary shares on the Hong Kong Stock Exchange are conducted in Hong Kong dollars.
The transaction costs of dealings in our Class A ordinary shares on the Hong Kong Stock Exchange include:
| • | Hong Kong Stock Exchange trading fee of 0.00565% of the consideration of the transaction, charged to each of the buyer and seller; |
| • | Securities and Futures Commission of Hong Kong, or SFC, transaction levy of 0.0027% of the consideration of the transaction, charged to each of the buyer and seller; |
| • | Accounting and Financial Reporting Council of Hong Kong transaction levy of 0.00015% of the consideration of the transaction, charged to each of the buyer and seller; |
| • | transfer deed stamp duty of HK$5.00 per transfer deed (if applicable), payable by the seller; |
| • | ad valorem stamp duty at a total rate of 0.26% of the value of the transaction, with 0.1% payable by each of the buyer and the seller; |
| • | stock settlement fee, which is currently 0.002% of the gross transaction value, subject to a minimum fee of HK$2.00 and a maximum fee of HK$100.00 per side per trade; |
| • | brokerage commission, which is freely negotiable with the broker; and |
| • | the Hong Kong share registrar will charge between HK$2.50 to HK$20.00, depending on the speed of service (or such higher fee as may from time to time be permitted under the Hong Kong Listing Rules), for each transfer of ordinary shares from one registered owner to another, each share certificate canceled or issued by it and any applicable fee as stated in the share transfer forms used in Hong Kong. |
Investors must settle their trades executed on the Hong Kong Stock Exchange through their brokers directly or through custodians. For an investor who has deposited his or her Class A ordinary shares in his or her stock account or in his or her designated CCASS participant’s stock account maintained with CCASS, settlement will be effected in CCASS in accordance with the General Rules of CCASS and CCASS Operational Procedures in effect from time to time. For an investor who holds the physical certificates, settlement certificates and the duly executed transfer forms must be delivered to his or her broker or custodian before the settlement date.
Conversion between Class A Ordinary Shares Trading in Hong Kong and ADSs
In connection with the initial public offering of Class A ordinary shares in Hong Kong, we have established a branch register of members in Hong Kong, or the Hong Kong share register, which will be maintained by our Hong Kong share registrar, Computershare Hong Kong Investor Services Limited. Our principal register of members, or the Cayman share register, will continue to be maintained by our principal share registrar, Maples Fund Services (Cayman) Limited.
All Class A ordinary shares offered in the initial public offering in Hong Kong are registered on the Hong Kong share register in order to be listed and traded on the Hong Kong Stock Exchange. As described in further detail below, holders of Class A ordinary shares registered on the Hong Kong share register will be able to deposit these ordinary shares into ADSs, and vice versa.
222
Table of Contents
Depositing Class A Ordinary Shares Trading in Hong Kong for delivery of ADSs
An investor who holds Class A ordinary shares registered in Hong Kong and who intends to convert them to ADSs to trade on Nasdaq must deposit or have his or her broker deposit the Class A ordinary shares with the depositary’s Hong Kong custodian, The Hong Kong and Shanghai Banking Corporation Limited, Hong Kong, or the custodian, in exchange for ADSs.
A deposit of Class A ordinary shares trading in Hong Kong in exchange for ADSs involves the following procedures:
| • | If Class A ordinary shares have been deposited with CCASS, the investor must transfer Class A ordinary shares to the depositary’s account with the custodian within CCASS by following the CCASS procedures for transfer and submit and deliver a duly completed and signed ADS delivery form to the custodian via his or her broker. |
| • | If Class A ordinary shares are held outside CCASS, the investor must arrange for the registration of a transfer of his or her Class A ordinary shares into the depositary’s name and the delivery of a share certificate evidencing such registration to the custodian and must sign and deliver an ADS delivery form to the depositary, as well as any applicable required documentation as required by the depositary. Investor shall contact the depositary for applicable documentation, if any, prior to depositing Class A ordinary shares for issuance into ADSs. |
| • | Upon payment of its fees and expenses and of any taxes or charges, such as stamp taxes or stock transfer taxes or fees, if applicable, the depositary will issue the corresponding number of ADSs and will deliver the ADSs as instructed in the ADS delivery form. |
For Class A ordinary shares deposited in CCASS for issuance of ADSs, under normal circumstances, the above steps may take approximately two business days turnaround time, or more, provided that the investor has provided timely and complete instructions. Additional time will be required if the ADSs are to be issued in registered form in the books and records of the depositary. For Class A ordinary shares held outside CCASS in physical form, the above steps may take 14 business days, or more, to complete. Temporary delays may arise. For example, the transfer books of the depositary may from time to time be closed to ADS issuances. The investor will be unable to deposit Class A ordinary shares and receive ADSs until the procedures are completed.
Surrender of ADSs for Delivery of Class A Ordinary Shares Trading in Hong Kong
An investor who holds ADSs and wishes to receive Class A ordinary shares that trade on the Hong Kong Stock Exchange must cancel the ADSs the investor holds and withdraw Class A ordinary shares from our ADS program and cause his or her broker or other financial institution to trade such Class A ordinary shares on the Hong Kong Stock Exchange.
An investor that holds ADSs indirectly through a broker or other financial institution should follow the procedure of the broker or financial institution and instruct the broker to arrange for cancelation of the ADSs, and transfer of the underlying Class A ordinary shares from the depositary’s account with the custodian within the CCASS system to the investor’s Hong Kong stock account.
For investors holding ADSs directly, the following steps must be taken:
| • | To withdraw Class A ordinary shares from our ADS program, an investor who holds ADSs must turn in such ADSs at the office of the depositary (and the applicable ADR(s) if the ADSs are held in certificated form), and send an instruction to cancel such ADSs to the depositary. Those instructions must have a Medallion signature guarantee. |
| • | Upon payment of its fees and expenses and of any taxes or charges, such as stamp taxes or stock transfer taxes or fees, if applicable, the depositary will instruct the custodian to deliver Class A ordinary shares underlying the canceled ADSs to the CCASS account designated by an investor. |
223
Table of Contents
| • | If an investor prefers to receive Class A ordinary shares outside CCASS, he or she must so indicate in the instruction delivered to the depositary. |
For Class A ordinary shares to be received in CCASS, under normal circumstances, the above steps may take approximately two business days turnaround time, or more, provided that the investor has provided timely and complete instructions. For Class A ordinary shares to be received outside CCASS in physical form, the above steps may take 14 business days, or more, to complete. The investor will be unable to receive the Class A ordinary shares until the procedures are completed.
Temporary delays may arise. For example, the transfer books of the depositary may from time to time be closed to ADS cancellations. In addition, completion of the above steps and procedures for delivery of Class A ordinary shares in a CCASS account is subject to there being a sufficient number of Class A ordinary shares on the Hong Kong share register to facilitate a withdrawal from the ADS program directly into the CCASS system. Further, completion of the above steps and procedures for delivery of Class A ordinary shares outside CCASS is subject to there being a sufficient number of Class A ordinary shares on the Cayman share register to facilitate a withdrawal from the ADS program outside CCASS. We are not under any obligation to maintain or increase the number of Class A ordinary shares on the Hong Kong or Cayman share register, as the case may be, to facilitate such withdrawals.
Depositary Requirements
Before the depositary delivers ADSs or permits withdrawal of Class A ordinary shares, the depositary may require:
| • | production of satisfactory proof of the identity and genuineness of any signature or other information it deems necessary; and |
| • | compliance with procedures it may establish, from time to time, consistent with the deposit agreement, including completion and presentation of transfer documents. |
The depositary may refuse to deliver, transfer, or register issuances, transfers and cancelations of ADSs generally when the transfer books of the depositary or our Hong Kong or Cayman share registrar are closed or at any time if the depositary or we determine it advisable to do so.
All costs attributable to the transfer of Class A ordinary shares to effect a withdrawal from or deposit of Class A ordinary shares into our ADS program will be borne by the investor requesting the transfer or deposit. In particular, holders of ordinary shares and ADSs should note that the Hong Kong share registrar will charge between HK$2.50 to HK$20, depending on the speed of service (or such higher fee as may from time to time be permitted under the Hong Kong Listing Rules), for each transfer of Class A ordinary shares from one registered owner to another, each share certificate canceled or issued by it and any applicable fee as stated in the share transfer forms used in Hong Kong. In addition, holders of Class A ordinary shares and ADSs must pay up to US$5.00 per 100 ADSs (or portion thereof) for each issuance of ADSs and each cancelation of ADSs, as the case may be, in connection with the deposit of Class A ordinary shares into, or withdrawal of ordinary shares from, the ADS facility.
PART II
| Item 13. | Defaults, Dividend Arrearages and Delinquencies |
None.
| Item 14. | Material Modifications to the Rights of Security Holders and Use of Proceeds. |
None.
224
Table of Contents
| Item 15. | Controls and Procedures |
Evaluation of Disclosure Controls and Procedures
Our management, with the participation of our chief executive officer and chief financial officer, has performed an evaluation of the effectiveness of our disclosure controls and procedures (as defined in Rule 13a-15(e) under the Exchange Act) as of the end of the period covered by this report, as required by Rule 13a-15(b) under the Exchange Act.
Based upon that evaluation, our management has concluded that, as of December 31, 2023, our disclosure controls and procedures were effective in ensuring that the information required to be disclosed by us in the reports that we file and furnish under the Exchange Act was recorded, processed, summarized and reported, within the time periods specified in the SEC’s rules and forms, and that the information required to be disclosed by us in the reports that we file or submit under the Exchange Act is accumulated and communicated to our management, including our chief executive officer and chief financial officer, to allow timely decisions regarding required disclosure.
Management’s Annual Report on Internal Control over Financial Reporting
Our management is responsible for establishing and maintaining adequate internal control over financial reporting, as defined in Rule 13a-15(f) under the Exchange Act. Our management evaluated the effectiveness of our internal control over financial reporting, as required by Rule 13a-15(c) of the Exchange Act, based on criteria established in the framework in Internal Control-Integrated Framework (2013) issued by the Committee of Sponsoring Organizations of the Treadway Commission. Based on this evaluation, our management has concluded that our internal control over financial reporting was effective as of December 31, 2023.
Because of its inherent limitations, internal control over financial reporting may not prevent or detect misstatements. In addition, projections of any evaluation of effectiveness of our internal control over financial reporting to future periods are subject to the risk that controls may become inadequate because of changes in conditions, or that the degree of compliance with the policies and procedures may deteriorate.
Our independent registered public accounting firm, Ernst & Young Hua Ming LLP, has audited the effectiveness of our internal control over financial reporting as of December 31, 2023, as stated in its report, which appears on page F-5 of this annual report on Form 20-F.
Changes in Internal Control over Financial Reporting
There were no changes in our internal controls over financial reporting that occurred during the period covered by this annual report on Form 20-F that have materially affected, or are reasonably likely to materially affect, our internal control over financial reporting.
| Item 16A. | Audit Committee Financial Expert |
Our board of directors has determined that Mr. Brent Callinicos, an independent director (under the standards set forth in Nasdaq Stock Market Rule 5605(a)(2) and Rule 10A-3 under the Exchange Act) and chairman of our audit committee, is an audit committee financial expert.
| Item 16B. | Code of Ethics |
In July 2005, our board of directors adopted a code of business conduct and ethics that applies to our directors, officers, employees and advisors. We have posted a copy of our code of business conduct and ethics on our website at http://ir.baidu.com.
225
Table of Contents
| Item 16C. | Principal Accountant Fees and Services |
The following table sets forth the aggregate fees by categories specified below in connection with certain professional services rendered by Ernst & Young Hua Ming LLP, our principal external auditors, for the periods indicated.
| 2022 (RMB in thousands) |
2023 (RMB in thousands) |
|||||||
| Audit fees(1) |
35,786 | 48,436 | ||||||
| Audit-related fees(2) |
6,499 | 3,630 | ||||||
| (1) | “Audit fees” means the aggregate fees billed in each of the fiscal years listed for professional services rendered by our principal auditors for the audit of our annual statements and assistance with and review of documents filed with the SEC. |
| (2) | “Audit-related Fees” in each of the fiscal years listed, represents the aggregate fees billed for the assurance and related services that are reasonably related to the offering of iQIYI’s ADSs / convertible senior notes and review of our financial statements that are not reported under “Audit Fees.” |
All audit and non-audit services provided by our independent auditors must be pre-approved by our audit committee. Our audit committee has adopted a combination of two approaches in pre-approving proposed services: general pre-approval and specific pre-approval. With general approval, the engagement to render services is entered into pursuant to pre-approval policies and procedures established by the audit committee. The policies and procedures are detailed as to the particular service (not broad categories), and the audit committee is informed of each specific service quarterly. With specific approval, the audit committee pre-approves the specific engagement to be rendered. Unless a type of service has received general pre-approval, it will require specific pre-approval by our audit committee. Any proposed services exceeding pre-approved cost levels or budgeted amounts will also require specific pre-approval by our audit committee.
Requests or applications to provide services that require specific approval by our audit committee will be submitted to the audit committee by both our independent auditors and our chief financial officer and must include an assessment as to whether, in their view, the request or application is consistent with the SEC’s rules on auditor independence.
| Item 16D. | Exemptions from the Listing Standards for Audit Committees |
Not applicable.
| Item 16E. | Purchases of Equity Securities by the Issuer and Affiliated Purchasers |
In February 2023, our board of directors authorized a share repurchase program, under which we may repurchase up to US$5.0 billion of our ADSs or shares, effective until December 31, 2025. The table below is a summary of our repurchases in 2023, which were all conducted in the open market pursuant to such share repurchase program.
| Period |
Total Number of ADSs Purchased |
Average Price Paid Per ADS |
Total Number of ADSs Purchased as Part of the Share Repurchase Program |
Approximate Dollar Value of ADSs that May Yet Be Purchased Under the Share Repurchase Program |
||||||||||||
| March 2023 |
1,470,468 | $ | 132.37 | 1,470,468 | US$ | 4,805,354,695 | ||||||||||
| June 2023 |
253,155 | $ | 121.52 | 253,155 | US$ | 4,774,590,219 | ||||||||||
| August 2023 |
3,675 | $ | 129.65 | 3,675 | US$ | 4,774,113,746 | ||||||||||
| September 2023 |
863,566 | $ | 130.35 | 863,566 | US$ | 4,661,551,068 | ||||||||||
| October 2023 |
97,878 | $ | 131.51 | 97,878 | US$ | 4,648,678,789 | ||||||||||
| November 2023 |
1,851,200 | $ | 122.99 | 1,851,200 | US$ | 4,420,996,857 | ||||||||||
| December 2023 |
792,683 | $ | 113.53 | 792,683 | US$ | 4,331,002,294 | ||||||||||
| Total |
5,332,625 | $ | 125.45 | 5,332,625 | US$ | 4,331,002,294 | ||||||||||
226
Table of Contents
| Item 16F. | Change in Registrant’s Certifying Accountant |
Not applicable.
| Item 16G. | Corporate Governance |
Nasdaq Stock Market Rule 5615(a)(3) permits foreign private issuers like us to follow “home country practice” in certain corporate governance matters. In July 2018 and August 2023, our board of directors approved the 2018 share incentive plan and the 2023 share incentive plan, respectively. We relied on home country practice exemption and did not convene a shareholder meeting to approve the 2018 and 2023 share incentive plans. Maples and Calder (Hong Kong) LLP, our Cayman Islands counsel, has provided a letter to the Nasdaq Stock Market certifying that under Cayman Islands law, we are not required to obtain shareholder approval in respect of the adoption of a stock option or other equity compensation arrangement, or an amendment to the stock option or other equity compensation plan.
Other than the practice described above, there are no significant differences between our corporate governance practices and those followed by U.S. domestic companies under Nasdaq Stock Market Rules.
| Item 16H. | Mine Safety Disclosure |
Not applicable.
| Item 16I. | Disclosure Regarding Foreign Jurisdictions that Prevent Inspections |
Not applicable.
| Item 16J. | Insider Trading Policies |
Not applicable.
| Item 16K. | Cybersecurity |
Risk Management and Strategy
We have implemented comprehensive cybersecurity risk assessment procedures to ensure effectiveness in cybersecurity management, strategy and governance and reporting cybersecurity risks. We have also integrated cybersecurity risk management into our overall enterprise risk management system.
We have developed a comprehensive cybersecurity threat defense system to address both internal and external threats. This system encompasses various levels, including network, host and application security and incorporates systematic security capabilities for threat defense, monitoring, analysis, response, deception and countermeasures. We strive to manage cybersecurity risks and protect sensitive information through various methods, including technical safeguards, procedural requirements, an intensive monitoring program on our corporate network, continuous testing of our security posture both internally and with outside vendors, a robust incident response program, a review of the effectiveness of our security system with reference to applicable security standards by qualified third parties and regular cybersecurity awareness training for employees. Both our Security Department and Operation and Maintenance Department continuously monitor the performance of our apps, platforms and infrastructure to enable us to respond quickly to potential problems, including potential cybersecurity threats.
As of the date of this annual report, we have not experienced any material cybersecurity incidents or identified any material cybersecurity threats that have affected or are reasonably likely to materially affect us, our business strategy, results of operations or financial condition.
227
Table of Contents
Governance
The corporate governance and nominating committee of our board of directors is responsible for overseeing the Company’s cybersecurity risk management and be informed on risks from cybersecurity threats. The corporate governance and nominating committee shall review, approve and maintain oversight of the disclosure (i) on Form 6-K for material cybersecurity incidents (if any) and (ii) related to cybersecurity matters in the periodic reports (including annual report on Form 20-F) of the Company. In addition, at the management level, we have established the Data Management Committee, which consists of seven top executives, including the person in charge of our Security Department who has experience in dealing with confidentiality-related cybersecurity issues, and is chaired by our senior vice president and general counsel, to oversee and manage cybersecurity related matters and formulate policies as necessary. Our Data Management Committee reports to our corporate governance and nominating committee on a quarterly basis regarding its assessment, identification and management on material risks from cybersecurity threats happened in the ordinary course of our business operations. If a cybersecurity incident occurs, our data management committee will promptly organize relevant personnel for internal assessment and, depending on the situation, seek the opinions of external experts and legal advisors. If it is determined that the incident could potentially be a material cybersecurity event, our data management committee will promptly report the investigation and assessment results to our corporate governance and nominating committee and our corporate governance and nominating committee will decide on the relevant response measures and whether any disclosure is necessary. If such disclosure is determined to be necessary, our data management committee shall promptly prepare disclosure material for review and approval by our corporate governance and nominating committee before it is disseminated to the public.
PART III
| Item 17. | Financial Statements |
We have elected to provide financial statements pursuant to Item 18.
| Item 18. | Financial Statements |
The consolidated financial statements of Baidu, Inc., its subsidiaries and the variable interest entities are included at the end of this annual report.
| Item 19. | Exhibits |
| Exhibit |
Description of Document | |
| 1.1 | ||
| 2.1 | ||
| 2.2 | ||
| 2.3 | ||
228
Table of Contents
| Exhibit |
Description of Document | |
| 2.4 | ||
| 2.5 | ||
| 2.6 | ||
| 2.7 | ||
| 2.8 | ||
| 2.9 | ||
| 2.10 | ||
| 2.11 | ||
| 2.12 | ||
| 2.13 | ||
| 2.14 | ||
| 2.15 | ||
| 2.16 | ||
| 2.17 | ||
| 2.18 | ||
| 2.19 | ||
| 2.20 | ||
229
Table of Contents
| Exhibit |
Description of Document | |
| 2.21 | ||
| 2.22 | ||
| 2.23 | ||
| 2.24 | ||
| 2.25 | ||
| 2.26 | ||
| 2.27 | ||
| 2.28 | ||
| 2.29 | Description of the Registrant’s US$750,000,000 3.00% Notes Due 2020 and US$500,000,000 4.13% Notes Due 2025 (incorporated herein by reference to (i) the section titled “Description of Debt Securities” in the Registrants’ registration statement on Form F-3 (File No. 333-184757) filed with the Securities and Exchange Commission on November 5, 2012 and (ii) the section titled “Description of the Notes” in the prospectus supplement, in the form filed by the Registrant with the Securities and Exchange Commission on June 22, 2015 pursuant to Rule 424(b) under the Securities Act of 1933, as amended) | |
| 2.30 | Description of the Registrant’s US$900,000,000 2.88% Notes Due 2022 and US$600,000,000 3.63% Notes Due 2027 (incorporated herein by reference to (i) the section titled “Description of Debt Securities” in the Registrants’ registration statement on Form F-3 (File No. 333-218972) filed with the Securities and Exchange Commission on June 26, 2017 and (ii) the section titled “Description of the Notes” in the prospectus supplement, in the form filed by the Registrant with the Securities and Exchange Commission on June 28, 2017 pursuant to Rule 424(b) under the Securities Act of 1933, as amended) | |
| 2.31 | Description of the Registrant’s US$1,000,000,000 3.88% Notes Due 2023 and US$500,000,000 4.38% Notes Due 2028 (incorporated herein by reference to (i) the section titled “Description of Debt Securities” in the Registrants’ registration statement on Form F-3 (File No. 333-218972) filed with the Securities and Exchange Commission on June 26, 2017 and (ii) the section titled “Description of the Notes” in the prospectus supplement, in the form filed by the Registrant with the Securities and Exchange Commission on March 22, 2018 pursuant to Rule 424(b) under the Securities Act of 1933, as amended) | |
230
Table of Contents
| Exhibit |
Description of Document | |
| 2.32 | Description of the Registrant’s US$600,000,000 4.38% Notes Due 2024 and US$400,000,000 4.88% Notes Due 2028 (incorporated herein by reference to (i) the section titled “Description of Debt Securities” in the Registrants’ registration statement on Form F-3 (File No. 333-218972) filed with the Securities and Exchange Commission on June 26, 2017 and (ii) the section titled “Description of the Notes” in the prospectus supplement, in the form filed by the Registrant with the Securities and Exchange Commission on November 8, 2018 pursuant to Rule 424(b) under the Securities Act of 1933, as amended) | |
| 2.33 | Description of the Registrant’s US$300,000,000 1.625% Notes Due 2027 and US$700,000,000 2.375% Notes Due 2031 (incorporated herein by reference to (i) the section titled “Description of Debt Securities” in the Registrants’ registration statement on Form F-3 (File No. 333-249314) filed with the Securities and Exchange Commission on October 5, 2020 and (ii) the section titled “Description of the Notes” in the prospectus supplement, in the form filed by the Registrant with the Securities and Exchange Commission on August 19, 2021 pursuant to Rule 424(b) under the Securities Act of 1933, as amended) | |
| 4.1 | ||
| 4.2 | ||
| 4.3 | ||
| 4.4 | ||
| 4.5 | ||
| 4.6 | ||
| 4.7 | ||
| 4.8 | ||
| 4.9 | ||
231
Table of Contents
| Exhibit |
Description of Document | |
| 4.10 | ||
| 4.11 | ||
| 4.12 | ||
| 4.13 | ||
| 4.14 | ||
| 4.15 | ||
| 4.16 | ||
| 4.17 | ||
| 4.18 | ||
| 4.19 | ||
| 4.20 | ||
232
Table of Contents
| Exhibit |
Description of Document | |
| 4.21 | ||
| 4.22 | ||
| 4.23 | ||
| 4.24 | ||
| 4.25 | ||
| 4.26 | ||
| 4.27 | ||
| 4.28 | ||
| 4.29 | ||
| 4.30 | ||
| 4.31 | ||
233
Table of Contents
| Exhibit |
Description of Document | |
| 4.32 | ||
| 4.33 | ||
| 4.34 | ||
| 4.35 | ||
| 4.36 | ||
| 4.37 | ||
| 4.38 | ||
| 4.39 | ||
| 4.40 | ||
| 4.41 | ||
| 4.42 | ||
| 4.43 | ||
234
Table of Contents
| Exhibit |
Description of Document | |
| 4.44 | ||
| 4.45 | ||
| 4.46 | ||
| 4.47 | ||
| 4.48 | ||
| 4.49 | ||
| 4.50 | ||
| 4.51 | ||
| 4.54 | ||
| 4.55 | ||
| 4.56 | ||
| 4.58 | ||
235
Table of Contents
| Exhibit |
Description of Document | |
| 4.59 | ||
| 4.60 | ||
| 4.61 | ||
| 4.62 | ||
| 4.63 | ||
| 4.64 | ||
| 4.65 | ||
| 4.66 | ||
| 4.67 | ||
| 4.69 | ||
| 4.70 | ||
| 4.71 | ||
236
Table of Contents
| Exhibit |
Description of Document | |
| 4.72 | ||
| 4.73 | ||
| 4.74 | ||
| 4.75 | ||
| 4.76 | ||
| 4.77 | ||
| 4.78 | ||
| 4.79 | ||
| 4.80 | ||
| 4.81 | ||
| 4.82 | ||
| 4.83 | ||
237
Table of Contents
| Exhibit |
Description of Document | |
| 4.84 | ||
| 4.85 | ||
| 4.86 | ||
| 4.87 | ||
| 4.88 | ||
| 4.89 | ||
| 4.90 | ||
| 4.91 | ||
| 4.92 | ||
| 4.93 | ||
| 4.94 | ||
| 4.95 | ||
238
Table of Contents
| Exhibit |
Description of Document | |
| 4.96 | ||
| 4.97 | ||
| 4.98 | ||
| 4.99 | ||
| 4.100 | ||
| 4.101 | ||
| 4.102 | ||
| 4.103 | ||
| 4.104 | ||
| 4.105 | ||
| 4.106 | ||
| 4.107 | ||
239
Table of Contents
| Exhibit |
Description of Document | |
| 4.108 | ||
| 4.109 | ||
| 4.110* | ||
| 8.1* | List of Principal Subsidiaries and Variable Interest Entities | |
| 11.1 | ||
| 12.1* | ||
| 12.2* | ||
| 13.1** | ||
| 13.2** | ||
| 15.1* | ||
| 15.2* | ||
| 15.3* | ||
| 97* | ||
| 101.INS* | Inline XBRL Instance Document—this instance document does not appear in the Interactive Data File because its XBRL tags embedded within the Inline XBRL document | |
| 101.SCH* | Inline XBRL Taxonomy Extension Schema Document | |
| 101.CAL* | Inline XBRL Taxonomy Extension Calculation Linkbase Document | |
| 101.DEF* | Inline XBRL Taxonomy Extension Definition Linkbase Document | |
| 101.LAB* | Inline XBRL Taxonomy Extension Label Linkbase Document | |
| 101.PRE* | Inline XBRL Taxonomy Extension Presentation Linkbase Document | |
| 104 | Cover Page Interactive Data File (embedded within the Inline XBRL document) | |
| * | Filed herewith |
| ** | Furnished herewith |
240
Table of Contents
SIGNATURES
The registrant hereby certifies that it meets all of the requirements for filing its annual report on Form 20-F and that it has duly caused and authorized the undersigned to sign this annual report on its behalf.
| Baidu, Inc. | ||
| By: |
/s/ Robin Yanhong Li | |
| Name: Robin Yanhong Li | ||
| Title: Chairman and Chief Executive Officer | ||
Date: March 15, 2024
241
Table of Contents
| Page(s) | ||||
F-2-F- 6 |
||||
F- 7 |
||||
F- 8 |
||||
F- 9 -F-10 |
||||
F- 11 -F-12 |
||||
F-1 3 -F-92 |
||||
| Description of the Matter |
As described in Notes 2, 4 and 26 to the consolidated financial statements, as of December 31, 2023, the Company’s consolidated balance of equity method investments and equity investments accounted for using the measurement alternative was RMB20,789 million (US$2,927 million) and RMB8,093 million (US$1,140 million), respectively. For the year ended December 31, 2023, the Company recognized impairment losses of RMB62 million (US$9 million) and RMB753 million (US$106 million) for equity method investments and equity investments accounted for using the measurement alternative, respectively. |
The Company evaluates its equity method investments for impairment at each reporting date, or more frequently if events or changes in circumstances indicate that the carrying amount of the investment might not be recoverable. Factors considered by the Company when determining whether an equity method investment has been other-than-temporarily-impaired, include, but are not limited to, the length of the time and the extent to which the market value has been less than cost, the financial condition and near-term prospects of the investee and the Company’s intent and ability to retain the investment until the recovery of its cost. An impairment loss is recognized in earnings when the decline in value is determined to be other-than-temporary. For equity investments accounted for using the measurement alternative, the Company makes a qualitative assessment considering impairment indicators to evaluate whether investments are impaired at each reporting date. If a qualitative assessment indicates that an investment is impaired, the Company estimates the investment’s fair value and recognizes an impairment loss if the fair value is less than the investment’s carrying value. |
Auditing the Company’s impairment assessment was complex and highly judgmental due to the significant judgment involved in (i) management’s assessment of whether indicators of impairment existed, and if so, determining whether (ii) a decline in value of equity method investments was other-than-temporary and (iii) investments in equity investments accounted for using the measurement alternative were impaired. In addition, auditing the fair value of the Company’s investments in investees without observable market prices was highly judgmental due to the subjectivity of the |
How We Addressed the Matter in Our Audit |
We obtained an understanding, evaluated the design and tested the operating effectiveness of controls over the Company’s impairment review processes for equity method investments and equity investments accounted for using the measurement alternative. For example, we tested controls over management’s identification and review of impairment indicators for these investments, and as necessary, management’s review of the subsequent determination of whether impairment existed and the measurement of fair value. |
To test the impairment assessment of equity method investments and equity investments accounted for using the measurement alternative, we performed audit procedures that included, among others, evaluating management’s assessment as to whether indicators of impairment existed and investments were impaired by considering the financial condition and operating results of the investees, as well as other relevant market information. For equity method investments, we also evaluated management’s determination as to whether an indicated impairment was other-than-temporary, considering factors such as the duration and magnitude of the decline in value and the Company’s intent and ability to retain the investment until the recovery of its cost. We tested the completeness, accuracy and relevance of the underlying data used by management in the valuation models to determine fair value. With the assistance of our internal valuation specialists, we evaluated the appropriateness of the valuation methodologies used by management to determine the fair value of investments and tested the unobservable inputs used in the valuation methodologies by comparing certain assumptions to industry, business and market data/information available from third-party sources. We also independently developed our unobservable inputs and compared them to the Company’s results, and involved our internal valuation specialists to assist with the application of these procedures. |
As of December 31, |
||||||||||||||||
Notes |
2022 |
2023 |
2023 |
|||||||||||||
RMB |
RMB |
US$ |
||||||||||||||
ASSETS |
||||||||||||||||
Current assets: |
||||||||||||||||
Cash and cash equivalents |
||||||||||||||||
Restricted cash |
||||||||||||||||
Short-term investments, net of allowance of RMB |
4 | |||||||||||||||
Accounts receivable, net of allowance of RMB |
8 | |||||||||||||||
Amounts due from related parties |
24 | |||||||||||||||
Other current assets, net |
9 | |||||||||||||||
Total current assets |
||||||||||||||||
Non-current assets: |
||||||||||||||||
Fixed assets, net |
10 | |||||||||||||||
Licensed copyrights, net |
6 | |||||||||||||||
Produced content, net |
7 | |||||||||||||||
Intangible assets, net |
11 | |||||||||||||||
Goodwill |
11 | |||||||||||||||
Long-term investments, net |
4 | |||||||||||||||
Long-term time deposits and held-to-maturity |
5 | |||||||||||||||
Amounts due from related parties |
24 | |||||||||||||||
Deferred tax assets, net |
17 | |||||||||||||||
Operating lease right-of-use |
16 | |||||||||||||||
Other non-current assets |
9 | |||||||||||||||
Total non-current assets |
||||||||||||||||
Total assets |
||||||||||||||||
LIABILITIES, REDEEMABLE NONCONTROLLING INTERESTS AND EQUITY |
||||||||||||||||
Current liabilities |
1 | |||||||||||||||
Short-term loans |
13 | |||||||||||||||
Accounts payable and accrued liabilities |
12 | |||||||||||||||
Customer deposits and deferred revenue |
||||||||||||||||
Deferred income |
||||||||||||||||
Long-term loans, current portion |
13 | |||||||||||||||
Convertible senior notes, current portion |
15 | |||||||||||||||
Notes payable, current portion |
14 | |||||||||||||||
Amounts due to related parties |
24 | |||||||||||||||
Operating lease liabilities |
16 | |||||||||||||||
Total current liabilities |
||||||||||||||||
Non-current liabilities |
1 | |||||||||||||||
Deferred income |
||||||||||||||||
Deferred revenue |
||||||||||||||||
Amounts due to related parties |
24 | |||||||||||||||
Long-term loans |
13 | |||||||||||||||
Notes payable |
14 | |||||||||||||||
Convertible senior notes |
15 | |||||||||||||||
Deferred tax liabilities |
17 | |||||||||||||||
Operating lease liabilities |
16 | |||||||||||||||
Other non-current liabilities |
||||||||||||||||
Total non-current liabilities |
||||||||||||||||
Total liabilities |
||||||||||||||||
Commitments and contingencies |
19 | |||||||||||||||
Redeemable noncontrolling interests |
20 | |||||||||||||||
Equity |
||||||||||||||||
Class A Ordinary Shares, par value US$ |
21 | |||||||||||||||
Class B Ordinary Shares, par value US$ |
21 | |||||||||||||||
Additional paid-in capital |
||||||||||||||||
Treasury stock |
21 | ( |
) | ( |
) | ( |
) | |||||||||
Retained earnings |
21 | |||||||||||||||
Accumulated other comprehensive income (loss) |
21 | ( |
) | ( |
) | |||||||||||
Total Baidu, Inc. shareholders’ equity |
||||||||||||||||
Noncontrolling interests |
||||||||||||||||
Total equity |
||||||||||||||||
Total liabilities, redeemable noncontrolling interests and equity |
||||||||||||||||
For the Years Ended December 31, |
||||||||||||||||||||
Notes |
2021 |
2022 |
2023 |
2023 |
||||||||||||||||
RMB |
RMB |
RMB |
US$ |
|||||||||||||||||
| Revenues: |
||||||||||||||||||||
| Online marketing services |
||||||||||||||||||||
| Others |
||||||||||||||||||||
| |
|
|
|
|
|
|
|
|||||||||||||
| Total revenues |
25 | |||||||||||||||||||
| |
|
|
|
|
|
|
|
|||||||||||||
| Operating costs and expenses: |
||||||||||||||||||||
| Cost of revenues |
||||||||||||||||||||
| Selling, general and administrative |
||||||||||||||||||||
| Research and development |
||||||||||||||||||||
| |
|
|
|
|
|
|
|
|||||||||||||
| Total operating costs and expenses |
||||||||||||||||||||
| |
|
|
|
|
|
|
|
|||||||||||||
| Operating profit |
||||||||||||||||||||
| |
|
|
|
|
|
|
|
|||||||||||||
| Other income (loss): |
||||||||||||||||||||
| Interest income |
||||||||||||||||||||
| Interest expense |
( |
) | ( |
) | ( |
) | ( |
) | ||||||||||||
| Foreign exchange gain (loss), net |
( |
) | ||||||||||||||||||
| Share of losses from equity method investments |
4 | ( |
) | ( |
) | ( |
) | ( |
) | |||||||||||
| Others, net |
( |
) | ( |
) | ||||||||||||||||
| |
|
|
|
|
|
|
|
|||||||||||||
| Total other income (loss), net |
( |
) |
||||||||||||||||||
| |
|
|
|
|
|
|
|
|||||||||||||
| Income before income taxes |
||||||||||||||||||||
| Income taxes |
17 | |||||||||||||||||||
| |
|
|
|
|
|
|
|
|||||||||||||
| Net income |
||||||||||||||||||||
| |
|
|
|
|
|
|
|
|||||||||||||
| Less: net (loss) income attributable to noncontrolling interests |
( |
) | ( |
) | ||||||||||||||||
| |
|
|
|
|
|
|
|
|||||||||||||
| Net income attributable to Baidu, Inc. |
||||||||||||||||||||
| |
|
|
|
|
|
|
|
|||||||||||||
| Earnings per share for Class A and Class B ordinary shares: |
22 | |||||||||||||||||||
| Basic |
||||||||||||||||||||
| Diluted |
||||||||||||||||||||
| Earnings per ADS (1 ADS equals |
22 | |||||||||||||||||||
| Basic |
||||||||||||||||||||
| Diluted |
||||||||||||||||||||
| Weighted average number of Class A and Class B ordinary shares outstanding (in millions) : |
22 | |||||||||||||||||||
| Basic |
||||||||||||||||||||
| Diluted |
||||||||||||||||||||
| Other comprehensive (loss) income: |
21 |
|||||||||||||||||||
| Foreign currency translation adjustments |
( |
) | ( |
) | ( |
) | ( |
) | ||||||||||||
| Unrealized losses on available-for-sale |
( |
) | ( |
) | ( |
) | ( |
) | ||||||||||||
| Unrealized gains (losses) on derivatives |
( |
) | ( |
) | ||||||||||||||||
| |
|
|
|
|
|
|
|
|||||||||||||
| Other comprehensive (loss) income, net of tax |
( |
) |
( |
) |
( |
) | ||||||||||||||
| |
|
|
|
|
|
|
|
|||||||||||||
| Comprehensive income |
||||||||||||||||||||
| |
|
|
|
|
|
|
|
|||||||||||||
| Less: comprehensive (loss) income attributable to noncontrolling interests |
( |
) | ( |
) | ||||||||||||||||
| |
|
|
|
|
|
|
|
|||||||||||||
| Comprehensive income attributable to Baidu, Inc. |
||||||||||||||||||||
| |
|
|
|
|
|
|
|
|||||||||||||
For the Years Ended December 31, |
||||||||||||||||
2021 |
2022 |
2023 |
2023 |
|||||||||||||
RMB |
RMB |
RMB |
US$ |
|||||||||||||
Cash flows from operating activities: |
||||||||||||||||
Net income |
||||||||||||||||
Adjustments to reconcile net income to net cash provided by operating activities: |
||||||||||||||||
Depreciation of fixed assets and computer parts |
||||||||||||||||
Amortization and impairment of intangible assets |
||||||||||||||||
Deferred income tax, net |
( |
) | ( |
) | ( |
) | ( |
) | ||||||||
Share-based compensation |
||||||||||||||||
Allowance for credit losses |
||||||||||||||||
Investment and interest (income) loss |
( |
) | ( |
) | ( |
) | ||||||||||
Amortization of licensed copyrights |
||||||||||||||||
Amortization and impairment of produced content |
||||||||||||||||
Impairment of long-term investments and other assets |
||||||||||||||||
Share of losses from equity method investments |
||||||||||||||||
Gain on disposal of subsidiaries or business |
( |
) | ( |
) | ( |
) | ( |
) | ||||||||
Gain on disposal of fixed assets |
( |
) | ( |
) | ( |
) | ( |
) | ||||||||
Barter transaction revenue |
( |
) | ( |
) | ( |
) | ( |
) | ||||||||
Accretion on convertible senior notes and others |
||||||||||||||||
Other non-cash expenses (income) |
( |
) | ( |
) | ||||||||||||
Changes in operating assets and liabilities, net of effects of acquisitions and disposals: |
||||||||||||||||
Accounts receivable |
( |
) | ( |
) | ||||||||||||
Amounts due from related parties |
( |
) | ( |
) | ( |
) | ||||||||||
Licensed copyrights |
( |
) | ( |
) | ( |
) | ( |
) | ||||||||
Produced content |
( |
) | ( |
) | ( |
) | ( |
) | ||||||||
Other assets |
( |
) | ( |
) | ( |
) | ||||||||||
Customer deposits and deferred revenue |
( |
) | ||||||||||||||
Accounts payable and accrued liabilities and other non-current liabilities |
( |
) | ( |
) | ( |
) | ||||||||||
Deferred income |
( |
) | ||||||||||||||
Amounts due to related parties |
( |
) | ( |
) | ( |
) | ||||||||||
Net cash provided by operating activities |
||||||||||||||||
Cash flows from investing activities: |
||||||||||||||||
Acquisition of fixed assets |
( |
) | ( |
) | ( |
) | ( |
) | ||||||||
Acquisition of businesses, net of cash acquired |
( |
) | ( |
) | ( |
) | ( |
) | ||||||||
Acquisition of intangible assets |
( |
) | ( |
) | ( |
) | ( |
) | ||||||||
Purchases of time deposits and held-to-maturity |
( |
) | ( |
) | ( |
) | ( |
) | ||||||||
Maturities of time deposits and held-to-maturity |
||||||||||||||||
Purchases of available-for-sale |
( |
) | ( |
) | ( |
) | ( |
) | ||||||||
Sales and maturities of available-for-sale |
||||||||||||||||
Purchases of equity investments |
( |
) | ( |
) | ( |
) | ( |
) | ||||||||
Proceeds from disposal of equity investments |
||||||||||||||||
Disposal of subsidiaries’ shares |
||||||||||||||||
Loans provided to third parties |
( |
) | ( |
) | ( |
) | ||||||||||
Loans provided to related parties |
( |
) | ( |
) | — | |||||||||||
Repayment of loans provided to third parties |
— | — | ||||||||||||||
Repayment of loans provided to related parties |
||||||||||||||||
Prepayments made for the acquisition of businesses |
( |
) | — | — | ||||||||||||
Other investing activities |
||||||||||||||||
Net cash used in investing activities |
( |
) |
( |
) |
( |
) |
( |
) | ||||||||
For the Years Ended December 31, |
||||||||||||||||
2021 |
2022 |
2023 |
2023 |
|||||||||||||
RMB |
RMB |
RMB |
US$ |
|||||||||||||
Cash flows from financing activities: |
||||||||||||||||
Proceeds from short-term loans |
||||||||||||||||
Repayments of short-term loans |
( |
) | ( |
) | ( |
) | ( |
) | ||||||||
Proceeds from long-term loans |
||||||||||||||||
Repayments of long-term loans and borrowings from third party investors |
( |
) | ( |
) | ( |
) | ( |
) | ||||||||
Repayment of loans borrowed from related parties |
( |
) | ( |
) | ||||||||||||
Proceeds from issuance of long-term notes, net of issuance costs |
— | — | ||||||||||||||
Proceeds from issuance of convertible senior notes, net of issuance costs |
||||||||||||||||
Repayments or redemption of convertible senior notes |
( |
) | ( |
) | ( |
) | ||||||||||
Proceeds from issuance of subsidiaries’ shares |
||||||||||||||||
Repurchase of ordinary shares |
( |
) | ( |
) | ( |
) | ( |
) | ||||||||
Proceeds from exercise of share options |
||||||||||||||||
Proceeds from issuance of redeemable noncontrolling interests |
||||||||||||||||
Acquisition of redeemable noncontrolling interests and noncontrolling interests in a subsidiary |
( |
) | ( |
) | — | — | ||||||||||
Proceeds from Hong Kong listing, net of issuance costs |
— | — | ||||||||||||||
Return of equity to noncontrolling interest shareholders |
( |
) | — | — | ||||||||||||
Other financing activities |
( |
) | ( |
) | ( |
) | ( |
) | ||||||||
Net cash provided by/(used in) financing activities |
( |
) |
( |
) |
( |
) | ||||||||||
Effect of exchange rate changes on cash, cash equivalents and restricted cash |
( |
) | ||||||||||||||
Net increase/(decrease) in cash, cash equivalents and restricted cash |
( |
) |
( |
) | ||||||||||||
Cash, cash equivalents and restricted cash at the beginning of the year |
||||||||||||||||
Cash, cash equivalents and restricted cash at the end of the year |
||||||||||||||||
Supplemental disclosures: |
||||||||||||||||
Interest paid |
||||||||||||||||
Income taxes paid |
||||||||||||||||
Non-cash investing and financing activities: |
||||||||||||||||
Acquisition of fixed assets included in accounts payable and accrued liabilities |
||||||||||||||||
Reconciliation of cash, cash equivalents and restricted cash: |
||||||||||||||||
Cash and cash equivalents |
||||||||||||||||
Restricted cash |
||||||||||||||||
Long-term restricted cash |
— | |||||||||||||||
Total cash, cash equivalents and restricted cash shown in the statements of cash flows |
||||||||||||||||
Attributable to Baidu, Inc. |
||||||||||||||||||||||||||||||||||||
Ordinary shares |
Treasury Stock |
|||||||||||||||||||||||||||||||||||
Number of shares |
Amount |
Number of shares |
Amount |
Additional paid-in capital |
Retained earnings |
Accumulated other comprehensive income (loss) |
Noncontrolling interests |
Total shareholders’ equity |
||||||||||||||||||||||||||||
RMB |
RMB |
RMB |
RMB |
RMB |
RMB |
RMB |
||||||||||||||||||||||||||||||
| Balances at December 31, 2020 |
||||||||||||||||||||||||||||||||||||
| Net income |
— | — | ( |
) | ||||||||||||||||||||||||||||||||
| Other comprehensive loss |
— | — | ( |
) | ( |
) | ||||||||||||||||||||||||||||||
| Issuance of ordinary shares, net of issuance costs |
||||||||||||||||||||||||||||||||||||
| Issuance of shares by the Company’s subsidiaries to noncontrolling interests |
— | — | ||||||||||||||||||||||||||||||||||
| Acquisition of redeemable noncontrolling interests and noncontrolling interests |
— | — | ( |
) | ||||||||||||||||||||||||||||||||
| Exercise of share-based awards |
||||||||||||||||||||||||||||||||||||
| Share-based compensation |
— | — | ||||||||||||||||||||||||||||||||||
| Dividends paid and payable by the Company’s subsidiaries |
— | — | ( |
) | ( |
) | ||||||||||||||||||||||||||||||
| Accretion of redeemable noncontrolling interests |
— | — | ( |
) | ( |
) | ( |
) | ||||||||||||||||||||||||||||
| Repurchase of ordinary shares |
( |
) | ( |
) | ( |
) | ||||||||||||||||||||||||||||||
| Reclassification from mezzanine equity to ordinary shares |
— | — | — | — | — | — | — | |||||||||||||||||||||||||||||
| Equity component of convertible senior notes issued by iQIYI, net of issuance costs |
— | — | ||||||||||||||||||||||||||||||||||
| Others |
— | — | ||||||||||||||||||||||||||||||||||
| |
|
|
|
|
|
|
|
|
|
|
|
|
|
|
|
|
|
|||||||||||||||||||
| Balances at December 31, 2021 |
( |
) |
( |
) |
||||||||||||||||||||||||||||||||
| |
|
|
|
|
|
|
|
|
|
|
|
|
|
|
|
|
|
|||||||||||||||||||
| Cumulative effect of accounting change |
— | — | ( |
) | ( |
) | ( |
) | ||||||||||||||||||||||||||||
| Net income |
— | — | ( |
) | ||||||||||||||||||||||||||||||||
| Other comprehensive income |
— | — | ( |
) | ||||||||||||||||||||||||||||||||
| Issuance of shares by the Company’s subsidiaries to noncontrolling interests |
— | — | ||||||||||||||||||||||||||||||||||
| Acquisition of noncontrolling interests |
— | — | ( |
) | ( |
) | ( |
) | ||||||||||||||||||||||||||||
| Exercise of share-based awards |
( |
) | ( |
) | ||||||||||||||||||||||||||||||||
| Share-based compensation |
— | — | ||||||||||||||||||||||||||||||||||
| Dividends paid and payable by the Company’s subsidiaries |
— | — | ( |
) | ( |
) | ||||||||||||||||||||||||||||||
| Accretion of redeemable noncontrolling interests |
— | — | ( |
) | ( |
) | ( |
) | ||||||||||||||||||||||||||||
| Disposal of subsidiaries’ shares |
— | — | ||||||||||||||||||||||||||||||||||
| Repurchase of ordinary shares |
( |
) | ( |
) | ( |
) | ||||||||||||||||||||||||||||||
| Others |
— | — | ( |
) | ( |
) | ||||||||||||||||||||||||||||||
| |
|
|
|
|
|
|
|
|
|
|
|
|
|
|
|
|
|
|||||||||||||||||||
| Balances at December 31, 2022 |
( |
) |
||||||||||||||||||||||||||||||||||
| |
|
|
|
|
|
|
|
|
|
|
|
|
|
|
|
|
|
|||||||||||||||||||
Attributable to Baidu, Inc. |
||||||||||||||||||||||||||||||||||||
Ordinary shares |
Treasury Stock |
|||||||||||||||||||||||||||||||||||
Number of shares |
Amount |
Number of shares |
Amount |
Additional paid-in capital |
Retained earnings |
Accumulated other comprehensive income (loss) |
Noncontrolling interests |
Total shareholders’ equity |
||||||||||||||||||||||||||||
RMB |
RMB |
RMB |
RMB |
RMB |
RMB |
RMB |
||||||||||||||||||||||||||||||
| Balances at December 31, 2022 |
( |
) |
||||||||||||||||||||||||||||||||||
| Net income |
— | — | ||||||||||||||||||||||||||||||||||
| Other comprehensive loss |
— | — | ( |
) | ( |
) | ( |
) | ||||||||||||||||||||||||||||
| Issuance of shares by the Company’s subsidiaries to noncontrolling interests |
||||||||||||||||||||||||||||||||||||
| Exercise of share-based awards |
( |
) | ( |
) | ||||||||||||||||||||||||||||||||
| Share-based compensation |
||||||||||||||||||||||||||||||||||||
| Dividends paid and payable by the Company’s subsidiaries |
( |
) | ( |
) | ||||||||||||||||||||||||||||||||
| Accretion of redeemable noncontrolling interests |
( |
) | ( |
) | ( |
) | ||||||||||||||||||||||||||||||
| Repurchase of ordinary shares |
( |
) | ( |
) | ( |
) | ||||||||||||||||||||||||||||||
| Others |
( |
) | ( |
) | ||||||||||||||||||||||||||||||||
| |
|
|
|
|
|
|
|
|
|
|
|
|
|
|
|
|
|
|||||||||||||||||||
| Balances at December 31, 2023 |
( |
) |
( |
) |
||||||||||||||||||||||||||||||||
| |
|
|
|
|
|
|
|
|
|
|
|
|
|
|
|
|
|
|||||||||||||||||||
| Balances at December 31, 2023, in US$ |
( |
) |
( |
) |
||||||||||||||||||||||||||||||||
| |
|
|
|
|
|
|
|
|
|
|
|
|
|
|||||||||||||||||||||||
1. |
ORGANIZATION AND BASIS OF PRESENTATION |
| • | Beijing Baidu Netcom Science Technology Co., Ltd. (“Baidu Netcom”), controlled by the Company; |
| • | Beijing Perusal Technology Co., Ltd. (“Beijing Perusal”), controlled by the Company; |
| • | Beijing iQIYI Science & Technology Co., Ltd. (“Beijing iQIYI”), and other VIEs controlled by iQIYI, Inc. (“iQIYI VIEs”); and |
| • | Other VIEs controlled by the Company or the Company’s subsidiaries. |
As of December 31, |
||||||||||||
2022 |
2023 |
2023 |
||||||||||
RMB |
RMB |
US$ |
||||||||||
(In millions) |
||||||||||||
| Assets |
||||||||||||
| Cash and cash equivalents |
||||||||||||
| Short-term investments, net |
||||||||||||
| Accounts receivable, net |
||||||||||||
| Others |
||||||||||||
| |
|
|
|
|
|
|||||||
| Total current assets |
||||||||||||
| |
|
|
|
|
|
|||||||
| Fixed assets, net |
||||||||||||
| Intangible assets, net |
||||||||||||
| Licensed copyrights, net |
||||||||||||
| Produced content, net |
||||||||||||
| Long-term investments, net |
||||||||||||
| Long-term time deposits and held-to-maturity |
||||||||||||
| Operating lease right-of-use |
||||||||||||
| Others |
||||||||||||
| |
|
|
|
|
|
|||||||
| Total non-current assets |
||||||||||||
| |
|
|
|
|
|
|||||||
| Total |
||||||||||||
| |
|
|
|
|
|
|||||||
| Liabilities |
||||||||||||
| Accounts payable and accrued liabilities |
||||||||||||
| Customer deposits and deferred revenue |
||||||||||||
| Operating lease liabilities |
||||||||||||
| Others |
||||||||||||
| |
|
|
|
|
|
|||||||
| Total current third-party liabilities |
||||||||||||
| |
|
|
|
|
|
|||||||
| Operating lease liabilities |
||||||||||||
| Others |
||||||||||||
| |
|
|
|
|
|
|||||||
| Total non-current third-party liabilities |
||||||||||||
| |
|
|
|
|
|
|||||||
| Amounts due to the other entities within Baidu (1) |
||||||||||||
| |
|
|
|
|
|
|||||||
| Total |
||||||||||||
| |
|
|
|
|
|
|||||||
| (1) | It represents the elimination of intercompany balances among Baidu, Inc., its subsidiaries and the VIEs and VIEs’ subsidiaries. |
For the years ended December 31, |
||||||||||||||||
2021 |
2022 |
2023 |
2023 |
|||||||||||||
RMB |
RMB |
RMB |
US$ |
|||||||||||||
(In millions) |
||||||||||||||||
Total revenues |
||||||||||||||||
Net (loss) income |
( |
) | ||||||||||||||
Net cash provided by operating activities |
||||||||||||||||
Net cash used in investing activities |
( |
) | ( |
) | ( |
) | ( |
) | ||||||||
Net cash provided by/(used in) financing activities |
( |
) | ( |
) | ( |
) | ||||||||||
2. |
SUMMARY OF SIGNIFICANT ACCOUNTING POLICIES |
| Office building |
– | |
| Office building related facility, machinery and equipment |
– | |
| Computer equipment |
– | |
| Office equipment |
– | |
| Vehicles |
– | |
| Leasehold improvements |
– |
| Trademarks |
– | |
| Technology |
– | |
| Intellectual property right |
– | |
| Online literature |
– | |
| Others |
– |
3. |
BUSINESS COMBINATIONS |
4. |
INVESTMENTS |
As of December 31, 2022 |
||||||||||||||||||||||||
Cost or Amortized cost less allowance for credit losses |
Gross unrecognized holding gains |
Gross unrecognized holding losses |
Gross unrealized gains |
Gross unrealized losses |
Fair value |
|||||||||||||||||||
RMB |
RMB |
RMB |
RMB |
RMB |
RMB |
|||||||||||||||||||
(In millions) |
||||||||||||||||||||||||
Held-to-maturity |
( |
) | — | — | ||||||||||||||||||||
Available-for-sale |
— | — | — | |||||||||||||||||||||
As of December 31, 2023 |
||||||||||||||||||||||||||||
Cost or Amortized cost less allowance for credit losses |
Gross unrecognized holding gains |
Gross unrecognized holding losses |
Gross unrealized gains |
Gross unrealized losses |
Fair value |
|||||||||||||||||||||||
RMB |
RMB |
RMB |
RMB |
RMB |
RMB |
US$ |
||||||||||||||||||||||
(In millions) |
||||||||||||||||||||||||||||
Held-to-maturity |
( |
) | — | — | ||||||||||||||||||||||||
Available-for-sale |
— | — | — | |||||||||||||||||||||||||
As of December 31, |
||||||||||||
2022 |
2023 |
2023 |
||||||||||
RMB |
RMB |
US$ |
||||||||||
(In millions) |
||||||||||||
Equity investments at fair value with readily determinable fair value |
||||||||||||
Equity investments without readily determinable fair value using the NAV practical expedient |
||||||||||||
Equity investments without readily determinable fair value using the measurement alternative |
||||||||||||
Available-for-sale |
||||||||||||
Equity method investments |
||||||||||||
Investments accounted for at fair value |
||||||||||||
Total long-term investments |
||||||||||||
As of December 31, 2022 |
As of December 31, 2023 |
As of December 31, 2023 |
||||||||||
RMB |
RMB |
US$ |
||||||||||
(In millions) |
||||||||||||
Initial cost basis |
||||||||||||
Cumulative unrealized gains |
||||||||||||
Cumulative unrealized losses (including impairment) |
( |
) | ( |
) | ( |
) | ||||||
Total carrying value |
||||||||||||
For the years ended December 31, |
||||||||||||||||
2021 |
2022 |
2023 |
2023 |
|||||||||||||
RMB |
RMB |
RMB |
US$ |
|||||||||||||
(In millions) |
||||||||||||||||
Gross unrealized gains |
||||||||||||||||
Gross unrealized losses (including impairment) (i) |
( |
) | ( |
) | ( |
) | ( |
) | ||||||||
Net unrealized losses on equity securities held |
( |
) | ( |
) | ( |
) | ( |
) | ||||||||
Net realized gains on equity securities sold |
— | |||||||||||||||
Total net (losses) gains recognized |
( |
) | ( |
) | ||||||||||||
| (i) | Gross unrealized losses (downward adjustments excluding impairment) were RMB |
As of December 31, |
||||||||||||
2022 |
2023 |
2023 |
||||||||||
RMB |
RMB |
US$ |
||||||||||
(In millions) |
||||||||||||
Current assets |
||||||||||||
Non-current assets |
||||||||||||
Current liabilities |
||||||||||||
Non-current liabilities |
||||||||||||
Noncontrolling interests |
||||||||||||
For the years ended December 31, |
||||||||||||||||
2021 |
2022 |
2023 |
2023 |
|||||||||||||
RMB |
RMB |
RMB |
US$ |
|||||||||||||
(In millions) |
||||||||||||||||
Total revenues |
||||||||||||||||
Gross profit |
||||||||||||||||
Income from operations |
||||||||||||||||
Net income (loss) |
( |
) | ||||||||||||||
Net income (loss) attributable to the investees |
( |
) | ||||||||||||||
As of December 31, 2022 |
||||||||||||||||
Cost or Amortized cost |
Gross unrealized gains |
Gross unrealized losses |
Fair value |
|||||||||||||
RMB |
RMB |
RMB |
RMB |
|||||||||||||
(In millions) |
||||||||||||||||
Equity investments at fair value with readily determinable fair value |
( |
) | ||||||||||||||
Available-for-sale |
( |
) | ||||||||||||||
Investments accounted for at fair value |
( |
) | ||||||||||||||
As of December 31, 2023 |
||||||||||||||||||||
Cost or Amortized cost |
Gross unrealized gains |
Gross unrealized losses |
Fair value |
|||||||||||||||||
RMB |
RMB |
RMB |
RMB |
US$ |
||||||||||||||||
(In millions) |
||||||||||||||||||||
Equity investments at fair value with readily determinable fair value |
( |
) | ||||||||||||||||||
Available-for-sale |
( |
) | ||||||||||||||||||
Investments accounted for at fair value |
( |
) | ||||||||||||||||||
As of December 31, |
||||||||||||
2022 |
2023 |
2023 |
||||||||||
RMB |
RMB |
US$ |
||||||||||
(In millions) |
||||||||||||
Due in 1 year through 5 years |
||||||||||||
Not due at a single maturity date |
||||||||||||
Total |
||||||||||||
5. |
LONG-TERM TIME DEPOSITS AND HELD-TO-MATURITY |
As of December 31, 2022 |
||||||||||||||||
Cost or Amortized cost |
Gross unrecognized holding gains |
Gross unrecognized holding losses |
Fair value |
|||||||||||||
RMB |
RMB |
RMB |
RMB |
|||||||||||||
(In millions) |
||||||||||||||||
Long-term time deposits and held-to-maturity |
( |
) | ||||||||||||||
As of December 31, 2023 |
||||||||||||||||||||
Cost or Amortized cost |
Gross unrecognized holding gains |
Gross unrecognized holding losses |
Fair value |
|||||||||||||||||
RMB |
RMB |
RMB |
RMB |
US$ |
||||||||||||||||
(In millions) |
||||||||||||||||||||
Long-term time deposits and held-to-maturity |
( |
|||||||||||||||||||
As of December 31, |
||||||||||||
2022 |
2023 |
2023 |
||||||||||
RMB |
RMB |
US$ |
||||||||||
(In millions) |
||||||||||||
Due in 1 year through 2 years |
||||||||||||
Due in 2 years through 3 years |
||||||||||||
Due in 3 years through 5 years |
||||||||||||
Total |
||||||||||||
6. |
LICENSED COPYRIGHTS, NET |
As of December 31, 2022 |
||||||||||||||||
Gross carrying value |
Accumulated amortization |
Impairment amount |
Net carrying value |
|||||||||||||
RMB |
RMB |
RMB |
RMB |
|||||||||||||
(In millions) |
||||||||||||||||
| Licensed copyrights |
||||||||||||||||
| —Broadcasting rights |
( |
) | ( |
) | ||||||||||||
| —Sublicensing rights |
( |
) | ||||||||||||||
| |
|
|
|
|
|
|
|
|||||||||
| ( |
) | ( |
) | |||||||||||||
| |
|
|
|
|
|
|
|
|||||||||
| Less: current portion: |
||||||||||||||||
| —Broadcasting rights |
( |
) | ( |
) | ||||||||||||
| —Sublicensing rights |
( |
) | ||||||||||||||
| |
|
|
|
|
|
|
|
|||||||||
| ( |
) | ( |
) | |||||||||||||
| |
|
|
|
|
|
|
|
|||||||||
| Licensed copyrights—non-current |
||||||||||||||||
| —Broadcasting rights |
( |
) | ( |
) | ||||||||||||
| —Sublicensing rights |
||||||||||||||||
| |
|
|
|
|
|
|
|
|||||||||
| ( |
) | ( |
) | |||||||||||||
| |
|
|
|
|
|
|
|
|||||||||
As of December 31, 2023 |
||||||||||||||||||||
Gross carrying value |
Accumulated amortization |
Impairment amount |
Net carrying value |
|||||||||||||||||
RMB |
RMB |
RMB |
RMB |
US$ |
||||||||||||||||
(In millions) |
||||||||||||||||||||
| Licensed copyrights |
||||||||||||||||||||
| —Broadcasting rights |
( |
) | ( |
) | ||||||||||||||||
| —Sublicensing rights |
( |
) | ||||||||||||||||||
| |
|
|
|
|
|
|
|
|
|
|||||||||||
| ( |
) | ( |
) | |||||||||||||||||
| |
|
|
|
|
|
|
|
|
|
|||||||||||
| Less: current portion: |
||||||||||||||||||||
| —Broadcasting rights |
( |
) | ( |
) | ||||||||||||||||
| —Sublicensing ri ghts |
( |
) | ||||||||||||||||||
| |
|
|
|
|
|
|
|
|
|
|||||||||||
| ( |
) | ( |
) | |||||||||||||||||
| |
|
|
|
|
|
|
|
|
|
|||||||||||
| Licens ed copyrights—non-current |
||||||||||||||||||||
| —Broadcasting rights |
( |
) | ( |
) | ||||||||||||||||
| —Sublicensing rights |
||||||||||||||||||||
| |
|
|
|
|
|
|
|
|
|
|||||||||||
| ( |
) | ( |
) | |||||||||||||||||
| |
|
|
|
|
|
|
|
|
|
|||||||||||
RMB |
US$ |
|||||||
(In millions) |
||||||||
| Within 1 year |
||||||||
| Between 1 and 2 years |
||||||||
| Between 2 and 3 years |
||||||||
7. |
PRODUCED CONTENT, NET |
As of December 31, |
||||||||||||
2022 |
2023 |
2023 |
||||||||||
RMB |
RMB |
US$ |
||||||||||
(In millions) |
||||||||||||
| Released, less amortization and impairment |
||||||||||||
| — Predominantly monetized with other content |
||||||||||||
| — Predominantly monetized on its own |
||||||||||||
| |
|
|
|
|
|
|||||||
| In production, less impairment |
||||||||||||
| — Predominantly monetized with other content |
||||||||||||
| — |
||||||||||||
| |
|
|
|
|
|
|||||||
| In development, less impairment |
||||||||||||
| — Predominantly monetized with other content |
||||||||||||
| — Predominantly monetized on its own |
||||||||||||
| |
|
|
|
|
|
|||||||
| |
|
|
|
|
|
|||||||
| Total |
||||||||||||
| |
|
|
|
|
|
|||||||
RMB |
US$ |
|||||||
(In millions) |
||||||||
| Within 1 year |
||||||||
| Between 1 and 2 years |
||||||||
| Between 2 and 3 years |
||||||||
8. |
ACCOUNTS RECEIVABLE |
As of December 31, |
||||||||||||
2022 |
2023 |
2023 |
||||||||||
RMB |
RMB |
US$ |
||||||||||
(In millions) |
||||||||||||
Accounts receivable |
||||||||||||
Allowance for credit losses |
( |
) | ( |
) | ( |
) | ||||||
2021 |
2022 |
2023 |
2023 |
|||||||||||||
RMB |
RMB |
RMB |
US$ |
|||||||||||||
(In millions) |
||||||||||||||||
Balance as of January 1 |
||||||||||||||||
Amounts charged to expenses |
||||||||||||||||
Amounts written off |
( |
) | ( |
) | ( |
) | ( |
) | ||||||||
Balance as of December 31 |
||||||||||||||||
9. |
OTHER ASSETS |
As of December 31, |
||||||||||||
2022 |
2023 |
2023 |
||||||||||
RMB |
RMB |
US$ |
||||||||||
(In millions) |
||||||||||||
Contract assets, net (i) |
||||||||||||
VAT prepayments |
||||||||||||
Inventories |
||||||||||||
Receivables from online payment agencies |
||||||||||||
Advances to suppliers |
||||||||||||
Licensed copyrights (Note 6) |
||||||||||||
Prepaid expenses |
||||||||||||
Deposits |
||||||||||||
Others (ii) |
||||||||||||
Total other current assets |
||||||||||||
Long-term prepaid expenses |
||||||||||||
Long-term restricted cash (iii) |
||||||||||||
Others |
||||||||||||
Total other non-current assets |
||||||||||||
| (i) | The allowance for credit losses on contract assets was RMB |
| (ii) | The balance as of December 31, 2023 includes a non-trade loan and interest receivables due from PAG with the principal of US$ which will due on July 1, 2024 if iQIYI requires repayment, or otherwise will due on the date which PAG and its affiliates cease to hold any portion of the iQIYI PAG Convertible Notes. PAG released certain collateral secured by iQIYI under the iQIYI PAG Convertible Notes (Note 15) and pledged to iQIYI a portion of the iQIYI PAG Convertible Notes, each in an amount equivalent to the amount of this non-trade loan. |
| (iii) | Long-term restricted cash represents collateral to repayments of the iQIYI PAG Convertible Notes (Note 15). |
10. |
FIXED ASSETS |
As of December 31, |
||||||||||||
2022 |
2023 |
2023 |
||||||||||
RMB |
RMB |
US$ |
||||||||||
(In millions) |
||||||||||||
Computer equipment |
||||||||||||
Office building |
||||||||||||
Office building related facility, machinery and equipment |
||||||||||||
Vehicles |
||||||||||||
Office equipment |
||||||||||||
Leasehold improvements |
||||||||||||
Construction in progress |
||||||||||||
Accumulated depreciation and impairment |
( |
) | ( |
) | ( |
) | ||||||
11. |
GOODWILL AND INTANGIBLE ASSETS |
Baidu Core excluding SLG |
SLG |
iQIYI |
Total |
|||||||||||||
RMB |
RMB |
RMB |
RMB |
|||||||||||||
(In millions) |
||||||||||||||||
| Balance at December 31, 2021 |
||||||||||||||||
| |
|
|
|
|
|
|
|
|||||||||
| Goodwill disposed |
( |
) | ( |
) | ( |
) | ||||||||||
| Balance at December 31, 2022 |
||||||||||||||||
| |
|
|
|
|
|
|
|
|||||||||
| Goodwill acquired (Note 3) |
||||||||||||||||
| Goodwill disposed |
( |
) | ( |
) | ||||||||||||
| Balance at December 31, 2023 |
||||||||||||||||
| |
|
|
|
|
|
|
|
|||||||||
| Balance at December 31, 2023, in US$ |
||||||||||||||||
| |
|
|
|
|
|
|
|
|||||||||
As of December 31, 2022 |
||||||||||||||||
Gross carrying value |
Accumulated impairment |
Accumulated amortization |
Net carrying value |
|||||||||||||
RMB |
RMB |
RMB |
RMB |
|||||||||||||
(In millions) |
||||||||||||||||
| Trademarks |
( |
) | ( |
) | ||||||||||||
| Technology |
( |
) | ( |
) | ||||||||||||
| Intellectual property right |
( |
) | ( |
) | ||||||||||||
| Online literature |
( |
) | ||||||||||||||
| Others |
( |
) | ( |
) | ||||||||||||
| |
|
|
|
|
|
|
|
|||||||||
| ( |
) | ( |
) | |||||||||||||
| |
|
|
|
|
|
|
|
|||||||||
As of December 31, 2023 |
||||||||||||||||||||
Gross carrying value |
Accumulated impairment |
Accumulated amortization |
Net carrying value |
|||||||||||||||||
RMB |
RMB |
RMB |
RMB |
US$ |
||||||||||||||||
(In millions) |
||||||||||||||||||||
| Trademarks |
( |
) | ( |
) | ||||||||||||||||
| Technology |
( |
) | ( |
) | ||||||||||||||||
| Intellectual property right |
( |
) | ( |
) | ||||||||||||||||
| Online literature |
( |
) | ||||||||||||||||||
| Others |
( |
) | ( |
) | ||||||||||||||||
| |
|
|
|
|
|
|
|
|
|
|||||||||||
| ( |
) | ( |
) | |||||||||||||||||
| |
|
|
|
|
|
|
|
|
|
|||||||||||
RMB |
US$ |
|||||||
(In millions) |
||||||||
| For the years ending December 31, |
||||||||
| 2024 |
||||||||
| 2025 |
||||||||
| 2026 |
||||||||
| 2027 |
||||||||
| 2028 |
||||||||
12. |
ACCOUNTS PAYABLE AND ACCRUED LIABILITIES |
As of December 31, |
||||||||||||
2022 |
2023 |
2023 |
||||||||||
RMB |
RMB |
US$ |
||||||||||
(In millions) |
||||||||||||
| Accrued operating expenses |
||||||||||||
| Content acquisition costs |
||||||||||||
| Traffic acquisition costs |
||||||||||||
| Accrued payroll and welfare |
||||||||||||
| Tax payable |
||||||||||||
| Bandwidth costs |
||||||||||||
| Payables for purchasing inventory |
||||||||||||
| Accruals for purchases of fixed assets |
||||||||||||
| Payable for investments |
||||||||||||
| Funds collected on behalf of service providers |
||||||||||||
| Users’ and third party agents’ deposits |
||||||||||||
| Interest payable |
||||||||||||
| Payable to merchants |
||||||||||||
| Others |
||||||||||||
| |
|
|
|
|
|
|||||||
| Total accounts payable and accrued liabilities |
||||||||||||
| |
|
|
|
|
|
|||||||
13. |
LOANS PAYABLE |
14. |
NOTES PAYABLE |
| Issue date |
Principal amount (US$ million) |
Mature date |
Effective interest rate |
|||||||||
| 2022 Ten-year Notes |
%* | |||||||||||
| 2025 Ten-year Notes |
% | |||||||||||
| 2022 Five-year Notes |
%* | |||||||||||
| 2027 Ten-year Notes |
% | |||||||||||
| 2023 Notes |
%* | |||||||||||
| 2028 March Notes |
% | |||||||||||
| 2024 Notes |
% | |||||||||||
| 2024 Notes |
% | |||||||||||
| 2028 November Notes |
% | |||||||||||
| 2025 Five-year Notes |
% | |||||||||||
| 2030 April Notes |
% | |||||||||||
| 2026 Notes |
% | |||||||||||
| 2030 October Notes |
% | |||||||||||
| 2027 Five-year Notes |
% | |||||||||||
| 2031 Notes |
% | |||||||||||
| * | The 2022 Five-year Notes, 2022 Ten-year Notes and 2023 Notes were fully repaid when they became due. |
As of December 31, |
||||||||||||
2022 |
2023 |
2023 |
||||||||||
RMB |
RMB |
US$ |
||||||||||
(In millions) |
||||||||||||
| Principal amount |
||||||||||||
| Unamortized discount and debt issuance costs |
( |
) | ( |
) | ( |
) | ||||||
| |
|
|
|
|
|
|||||||
| |
|
|
|
|
|
|||||||
RMB |
US$ |
|||||||
(In millions) |
||||||||
| For the years ending December 31, |
||||||||
| 2024 |
||||||||
| 2025 |
||||||||
| 2026 |
||||||||
| 2027 |
||||||||
| 2028 |
||||||||
| Thereafter |
||||||||
15. |
CONVERTIBLE SENIOR NOTES |
As of December 31, |
||||||||||||
2022 |
2023 |
2023 |
||||||||||
RMB |
RMB |
US$ |
||||||||||
(In millions) |
||||||||||||
Principal |
||||||||||||
Less: unamortized discount and debt issuance costs |
( |
) | ( |
) | ||||||||
Net carrying amount |
||||||||||||
For the years ended December 31, |
||||||||||||||||
2021 |
2022 |
2023 |
2023 |
|||||||||||||
RMB |
RMB |
RMB |
US$ |
|||||||||||||
(In millions) |
||||||||||||||||
Contractual interest expense |
||||||||||||||||
Amortization of the discount and issuance costs |
||||||||||||||||
Total |
||||||||||||||||
16. |
LEASES |
For the years ended December 31, |
||||||||||||
2022 |
2023 |
2023 |
||||||||||
RMB |
RMB |
US$ |
||||||||||
(In millions) |
||||||||||||
Cash payments for operating leases |
||||||||||||
ROU assets obtained in exchange for operating lease liabilities |
||||||||||||
Operating leases |
||||||||
RMB |
US$ |
|||||||
(In millions) |
||||||||
Year ending December 31, |
||||||||
2024 |
||||||||
2025 |
||||||||
2026 |
||||||||
2027 |
||||||||
2028 |
||||||||
Thereafter |
||||||||
Total future lease payments |
||||||||
Less: Imputed interest |
||||||||
Total lease liability balance |
||||||||
17. |
INCOME TAXES |
For the years ended December 31, |
||||||||||||||||
2021 |
2022 |
2023 |
2023 |
|||||||||||||
RMB |
RMB |
RMB |
US$ |
|||||||||||||
(In millions) |
||||||||||||||||
Mainland China |
||||||||||||||||
Non-Mainland China |
( |
) | ( |
) | ( |
) |
( |
) | ||||||||
For the years ended December 31, |
||||||||||||||||
2021 |
2022 |
2023 |
2023 |
|||||||||||||
RMB |
RMB |
RMB |
US$ |
|||||||||||||
(In millions) |
||||||||||||||||
Current income tax |
||||||||||||||||
Income tax refund due to reduced tax rate |
( |
) | — | — | ||||||||||||
Adjustments of deferred tax assets due to change in tax rates |
||||||||||||||||
Deferred income tax benefit |
( |
) | ( |
) | ( |
) |
( |
) | ||||||||
For the years ended December 31, |
||||||||||||||||
2021 |
2022 |
2023 |
2023 |
|||||||||||||
RMB |
RMB |
RMB |
US$ |
|||||||||||||
(In millions, except for per share data) |
||||||||||||||||
Expected taxation at PRC statutory tax rate |
||||||||||||||||
Effect of differing tax rates in different jurisdictions |
||||||||||||||||
Non-taxable income |
( |
) | ( |
) | ( |
) | ( |
) | ||||||||
Non-deductible expenses |
||||||||||||||||
Research and development super-deduction |
( |
) | ( |
) | ( |
) | ( |
) | ||||||||
Effect of PRC preferential tax rates and tax holiday |
( |
) | ( |
) | ( |
) | ( |
) | ||||||||
Effect of tax rate changes on deferred taxes |
||||||||||||||||
Reversal of prior year’s income taxes |
( |
) | ( |
) | ( |
) | ( |
) | ||||||||
PRC withholding tax |
||||||||||||||||
Change in valuation allowance |
( |
) | ( |
) | ||||||||||||
Taxation for the year |
||||||||||||||||
Effective tax rate |
% | % | ||||||||||||||
Effect of preferential tax rates inside the PRC on basic earnings per Class A and Class B ordinary share |
||||||||||||||||
As of December 31, |
||||||||||||
2022 |
2023 |
2023 |
||||||||||
RMB |
RMB |
US$ |
||||||||||
(In millions) |
||||||||||||
Deferred tax assets: |
||||||||||||
Allowance for credit losses |
||||||||||||
Accrued expenses, payroll and others |
||||||||||||
Fixed assets depreciation and intangible assets amortization |
||||||||||||
Net operating loss carry-forwards |
||||||||||||
Less: valuation allowance |
( |
) | ( |
) |
( |
) | ||||||
Deferred tax assets, net |
||||||||||||
As of December 31, |
||||||||||||
2022 |
2023 |
2023 |
||||||||||
RMB |
RMB |
US$ |
||||||||||
(In millions) |
||||||||||||
Deferred tax liabilities: |
||||||||||||
Long-lived assets arising from acquisitions |
||||||||||||
Withholding tax on PRC subsidiaries’ undistributed earnings |
||||||||||||
Tax on capital gains |
||||||||||||
Others |
||||||||||||
| |
|
|
||||||||||
18. |
EMPLOYEE DEFINED CONTRIBUTION PLAN |
19. |
COMMITMENTS AND CONTINGENCIES |
RMB |
US$ |
|||||||
(In millions) |
||||||||
2024 |
||||||||
2025 |
||||||||
2026 |
||||||||
2027 |
||||||||
2028 |
||||||||
Thereafter |
||||||||
RMB |
US$ |
|||||||
(In millions) |
||||||||
2024 |
||||||||
2025 |
||||||||
2026 |
||||||||
2027 |
||||||||
2028 |
||||||||
Thereafter |
||||||||
20. |
REDEEMABLE NONCONTROLLING INTERESTS |
2021 |
2022 |
2023 |
2023 |
|||||||||||||
RMB |
RMB |
RMB |
US$ |
|||||||||||||
(In millions) |
||||||||||||||||
| Balance as of January 1 |
||||||||||||||||
| Issuance of subsidiary shares |
||||||||||||||||
| Accretion of redeemable noncontrolling interests |
||||||||||||||||
| Disposal of subsidiaries’ shares |
— | ( |
) | |||||||||||||
| Reclassification of ordinary shares from mezzanine equity to ordinary shares |
( |
) | ||||||||||||||
| Repurchase of redeemable noncontrolling interests |
( |
) | ||||||||||||||
| |
|
|
|
|
|
|
|
|||||||||
| Balance as of December 31 |
||||||||||||||||
| |
|
|
|
|
|
|
|
|||||||||
21. |
SHAREHOLDERS’ EQUITY |
As of December 31, |
||||||||||||
2022 |
2023 |
2023 |
||||||||||
RMB |
RMB |
US$ |
||||||||||
(In millions) |
||||||||||||
PRC statutory reserve funds |
||||||||||||
Unreserved retained earnings |
||||||||||||
Total retained earnings |
||||||||||||
Foreign currency translation adjustments |
Unrealized gains (losses) on available-for-sale investments |
Unrealized gains (losses) on derivatives |
Total |
|||||||||||||
RMB |
RMB |
RMB |
RMB |
|||||||||||||
(In millions) |
||||||||||||||||
Balance at December 31, 2020 |
( |
) |
— |
|||||||||||||
Other comprehensive (loss) income before reclassification |
( |
) | ( |
) | ( |
) | ||||||||||
Net current-period other comprehensive (loss) income |
( |
) | ( |
) | ( |
) | ||||||||||
Other comprehensive (loss) income attribute to noncontrolling interests and redeemable noncontrolling interests |
( |
) | — | ( |
) | |||||||||||
Balance at December 31, 2021 |
( |
) |
( |
) | ||||||||||||
Cumulative effect of accounting change |
— | — | ||||||||||||||
Other comprehensive (loss) income before reclassification |
( |
) | ( |
) | ||||||||||||
Net current-period other comprehensive (loss) income |
( |
) | ( |
) | ||||||||||||
Other comprehensive income (loss) attribute to noncontrolling interests and redeemable noncontrolling interests |
( |
) | — | |||||||||||||
Balance at December 31, 2022 |
( |
) |
||||||||||||||
Other comprehensive loss before reclassification |
( |
) | ( |
) | ( |
) | ( |
) | ||||||||
Amounts reclassified from accumulated other comprehensive income |
( |
) | ( |
) | — | ( |
) | |||||||||
Net current-period other comprehensive loss |
( |
) | ( |
) | ( |
) | ( |
) | ||||||||
Other comprehensive income attribute to noncontrolling interests and redeemable noncontrolling interests |
— | |||||||||||||||
Balance at December 31, 2023 |
( |
) |
( |
) | ||||||||||||
Balance at December 31, 2023, in US$ |
( |
) |
( |
) | ||||||||||||
For the years ended December 31, |
||||||||||||||||
2021 |
2022 |
2023 |
2023 |
|||||||||||||
RMB |
RMB |
RMB |
US$ |
|||||||||||||
(In millions) |
||||||||||||||||
Unrealized (losses) gains on available-for-sale |
||||||||||||||||
Other comprehensive (loss) income before reclassification |
( |
) | ( |
) | ( |
) | ||||||||||
Net current-period other comprehensive (loss) income |
( |
) | ( |
) | ( |
) | ||||||||||
22. |
EARNINGS PER SHARE |
For the years ended December 31, |
||||||||||||||||
2021 |
2022 |
2023 |
2023 |
|||||||||||||
RMB |
RMB |
RMB |
US$ |
|||||||||||||
(In millions, including number of shares, except for per share data) |
||||||||||||||||
Net income attributable to Baidu, Inc. |
||||||||||||||||
Accretion of the redeemable noncontrolling interests |
( |
) | ( |
) | ( |
) | ( |
) | ||||||||
Numerator for basic EPS computation |
||||||||||||||||
Impact of diluted securities of subsidiaries and equity method investees |
— | — | ( |
) | ( |
) | ||||||||||
Numerator for diluted EPS computation |
||||||||||||||||
For the years ended December 31, |
||||||||||||||||||||||||||||||||
2021 |
2022 |
2023 |
2023 |
|||||||||||||||||||||||||||||
Class A |
Class B |
Class A |
Class B |
Class A |
Class A |
Class B |
Class B |
|||||||||||||||||||||||||
RMB |
RMB |
RMB |
RMB |
RMB |
US$ |
RMB |
US$ |
|||||||||||||||||||||||||
| (In millions, including number of shares and ADS, except for per share and per ADS data) |
||||||||||||||||||||||||||||||||
| Earnings per share—basic: |
||||||||||||||||||||||||||||||||
| Numerator |
||||||||||||||||||||||||||||||||
| Allocation of net income attributable to Baidu, Inc. |
||||||||||||||||||||||||||||||||
| |
|
|
|
|
|
|
|
|
|
|
|
|
|
|
|
|||||||||||||||||
| Denominator |
||||||||||||||||||||||||||||||||
| Weighted average ordinary shares outstanding |
||||||||||||||||||||||||||||||||
| |
|
|
|
|
|
|
|
|
|
|
|
|
|
|
|
|||||||||||||||||
| Denominator used for basic EPS |
||||||||||||||||||||||||||||||||
| |
|
|
|
|
|
|
|
|
|
|
|
|
|
|
|
|||||||||||||||||
| Earnings per share—basic |
||||||||||||||||||||||||||||||||
| |
|
|
|
|
|
|
|
|
|
|
|
|
|
|
|
|||||||||||||||||
| Earnings per share—diluted: |
||||||||||||||||||||||||||||||||
| Numerator |
||||||||||||||||||||||||||||||||
| Allocation of net income attributable to Baidu, Inc. for diluted computation |
||||||||||||||||||||||||||||||||
| Reallocation of net income attributable to Baidu, Inc. as a result of conversion of Class B to Class A shares |
||||||||||||||||||||||||||||||||
| |
|
|
|
|
|
|
|
|
|
|
|
|
|
|
|
|||||||||||||||||
| Numerator for diluted EPS calculation |
||||||||||||||||||||||||||||||||
| |
|
|
|
|
|
|
|
|
|
|
|
|
|
|
|
|||||||||||||||||
| Denominator |
||||||||||||||||||||||||||||||||
| Weighted average ordinary shares outstanding |
||||||||||||||||||||||||||||||||
| Conversion of Class B to Class A ordinary shares |
||||||||||||||||||||||||||||||||
| Share-based awards |
||||||||||||||||||||||||||||||||
| |
|
|
|
|
|
|
|
|
|
|
|
|
|
|
|
|||||||||||||||||
| Denominator used for diluted EPS |
||||||||||||||||||||||||||||||||
| |
|
|
|
|
|
|
|
|
|
|
|
|
|
|
|
|||||||||||||||||
| Earnings per share—diluted |
||||||||||||||||||||||||||||||||
| |
|
|
|
|
|
|
|
|
|
|
|
|
|
|
|
|||||||||||||||||
| Earnings per ADS (1 ADS equals 8 Class A ordinary shares): |
||||||||||||||||||||||||||||||||
| Denominator used for earnings per ADS—basic |
||||||||||||||||||||||||||||||||
| |
|
|
|
|
|
|
|
|||||||||||||||||||||||||
| Denominator used for earnings per ADS—diluted |
||||||||||||||||||||||||||||||||
| |
|
|
|
|
|
|
|
|||||||||||||||||||||||||
| Earnings per ADS—basic |
||||||||||||||||||||||||||||||||
| |
|
|
|
|
|
|
|
|||||||||||||||||||||||||
| Earnings per ADS—diluted |
||||||||||||||||||||||||||||||||
| |
|
|
|
|
|
|
|
|||||||||||||||||||||||||
23. |
SHARE-BASED AWARDS PLAN |
Number of share options |
Weighted average exercise price (US$) |
Weighted average remaining contractual life (Years) |
Aggregate intrinsic value (US$ in millions) |
|||||||||||||
| Incentive share options |
||||||||||||||||
| Outstanding, December 31, 2022 |
||||||||||||||||
| |
|
|
|
|
|
|
|
|||||||||
| Granted |
||||||||||||||||
| Exercised |
( |
) | ||||||||||||||
| Forfeited/Cancelled |
( |
) | ||||||||||||||
| |
|
|
|
|
|
|
|
|||||||||
| Outstanding, December 31, 2023 |
||||||||||||||||
| |
|
|
|
|
|
|
|
|||||||||
| Vested and expected to vest at December 31, 2023 |
||||||||||||||||
| |
|
|
|
|
|
|
|
|||||||||
| Exercisable at December 31, 2023 |
||||||||||||||||
| |
|
|
|
|
|
|
|
|||||||||
For the years ended December 31, |
||||||||
2021 |
2022 |
|||||||
| Risk-free interest rate |
||||||||
| Dividend yield |
||||||||
| Expected volatility range |
||||||||
| Expected life (in years) |
||||||||
Number of shares |
Weighted average grant date fair value (US$) |
|||||||
| Restricted Shares |
||||||||
| Unvested, December 31, 2022 |
||||||||
| |
|
|
|
|||||
| Granted |
||||||||
| Vested |
( |
) | ||||||
| Forfeited/Cancelled |
( |
) | ||||||
| |
|
|
|
|||||
| Unvested, December 31, 2023 |
||||||||
| |
|
|
|
|||||
Number of share options |
Weighted average exercise price (US$) |
Weighted average remaining contractual life (Years) |
Aggregate Intrinsic value (US$ in millions) |
|||||||||||||
| Outstanding, December 31, 2022 |
||||||||||||||||
| |
|
|
|
|
|
|
|
|
|
|
|
|
|
|
|
|
| Granted |
||||||||||||||||
| Forfeited/Expired |
( |
) | ||||||||||||||
| Exercised |
( |
) | ||||||||||||||
| |
|
|
|
|
|
|
|
|||||||||
| Outstanding, December 31, 2023 |
||||||||||||||||
| |
|
|
|
|
|
|
|
|||||||||
| Vested and expected to vest at December 31, 2023 |
||||||||||||||||
| |
|
|
|
|
|
|
|
|||||||||
| Exercisable at December 31, 2023 |
||||||||||||||||
| |
|
|
|
|
|
|
|
|||||||||
For the years ended December 31, |
||||||||||||||||
2021 |
2022 |
2023 |
2023 |
|||||||||||||
RMB |
RMB |
RMB |
US$ |
|||||||||||||
(In millions) |
||||||||||||||||
| Cost of revenues |
||||||||||||||||
| Selling, general and administrative |
||||||||||||||||
| Research and development |
||||||||||||||||
| |
|
|
|
|
|
|
|
|||||||||
| |
|
|
|
|
|
|
|
|||||||||
24. |
RELATED PARTY TRANSACTIONS |
For the years ended December 31, |
||||||||||||||||
2021 |
2022 |
2023 |
2023 |
|||||||||||||
RMB |
RMB |
RMB |
US$ |
|||||||||||||
(In millions) |
||||||||||||||||
| Revenues: |
||||||||||||||||
| Related Party A |
||||||||||||||||
| Related Party B |
||||||||||||||||
| Related Party D |
||||||||||||||||
| Related Party E (i) |
||||||||||||||||
| Other Investees |
||||||||||||||||
| |
|
|
|
|
|
|
|
|||||||||
| Total |
||||||||||||||||
| |
|
|
|
|
|
|
|
|||||||||
| (i) | The transactions mainly represent revenues arising from services including online marketing services and cloud services the Company provided to Related Party E. Related Party E ceases to be a related party from February 2021 as the Company does not have significant influence over Related Party E after its public listing. |
As of December 31, |
||||||||||||
2022 |
2023 |
2023 |
||||||||||
RMB |
RMB |
US$ |
||||||||||
(In millions) |
||||||||||||
Amounts due from related parties, current: |
||||||||||||
Related Party B (i) |
||||||||||||
Related Party C (ii) |
||||||||||||
Related Party D (iii) |
||||||||||||
Other related parties (iv) |
||||||||||||
Total |
||||||||||||
Amounts due from related parties, non-current: |
||||||||||||
Related Party B (i) |
||||||||||||
Other related parties (v) |
||||||||||||
Total |
||||||||||||
Amounts due to related parties, current: |
||||||||||||
Related Party B (vi) |
||||||||||||
Related Party F (vii) |
||||||||||||
Other related parties (viii) |
||||||||||||
Total |
||||||||||||
Amounts due to related parties, non-current: |
||||||||||||
Related Party F (vii) |
||||||||||||
Other related parties (ix) |
||||||||||||
Total |
||||||||||||
| (i) | The balance represents non-trade loans due from Related Party B with interest rates ranging from |
| (ii) | The balance mainly represents receivables arising from providing online marketing services to Related Party C. |
| (iii) | The balance mainly represents non-trade loans due from Related Party D with interest rates of |
| (iv) | The balance mainly represents amounts arising from content distribution services, cloud services and other services the Company provided to its investees in ordinary course of business. |
| (v) | The balance mainly represents prepayments for licensed copyrights to be received from the Company’s equity investees. |
| (vi) | The balance represents non-trade loans due to Related Party B with interest rates of nil, which were fully settled in December 2023, and amounts arising from purchasing services from Related Party B in the ordinary course of business. |
| (vii) | The balance mainly represents deferred revenue in relation to licenses of intellectual property to be provided to Related Party F. |
| (viii) | The balance mainly represents amounts arising from services including advertising services and licensing of content assets provided by the Company’s investees and non-trade amounts payable for acquiring the equity interest of the Company’s investees. |
| (ix) | The balance mainly represents deferred revenue relating to the future services to be provided by the Company to investees. |
25. |
SEGMENT REPORTING |
For the year ended December 31, 2021 |
||||||||||||||||
Baidu Core |
iQIYI |
Intersegment eliminations |
Consolidated |
|||||||||||||
RMB |
RMB |
RMB |
RMB |
|||||||||||||
(In millions) |
||||||||||||||||
| Total revenues |
( |
) |
||||||||||||||
| |
|
|
|
|
|
|
|
|||||||||
| Operating costs and expenses: |
||||||||||||||||
| Cost of revenues |
( |
) | ||||||||||||||
| Selling, general and administrative |
( |
) | ||||||||||||||
| Research and development |
||||||||||||||||
| |
|
|
|
|
|
|
|
|||||||||
| Total operating costs and expenses |
( |
) |
||||||||||||||
| |
|
|
|
|
|
|
|
|||||||||
| Operating profit (loss) |
( |
) |
( |
) |
||||||||||||
| |
|
|
|
|
|
|
|
|||||||||
| Total other income (loss), net |
( |
) |
||||||||||||||
| |
|
|
|
|
|
|
|
|||||||||
| Income (loss) before income taxes |
( |
) |
( |
) |
||||||||||||
| Income taxes |
||||||||||||||||
| |
|
|
|
|
|
|
|
|||||||||
| Net income (loss) |
( |
) |
( |
) |
||||||||||||
| |
|
|
|
|
|
|
|
|||||||||
| Less: net income (loss) attributable to noncontrolling interests |
( |
) | ( |
) | ||||||||||||
| |
|
|
|
|
|
|
|
|||||||||
| Net income (loss) attributable to Baidu, Inc. |
( |
) |
||||||||||||||
| |
|
|
|
|
|
|
|
|||||||||
For the year ended December 31, 2022 |
||||||||||||||||
Baidu Core |
iQIYI |
Intersegment eliminations |
Consolidated |
|||||||||||||
RMB |
RMB |
RMB |
RMB |
|||||||||||||
(In millions) |
||||||||||||||||
| Total revenues |
( |
) |
||||||||||||||
| |
|
|
|
|
|
|
|
|||||||||
| Operating costs and expenses: |
||||||||||||||||
| Cost of revenues |
( |
) | ||||||||||||||
| Selling, general and administrative |
( |
) | ||||||||||||||
| Research and development |
||||||||||||||||
| |
|
|
|
|
|
|
|
|||||||||
| Total operating costs and expenses |
( |
) |
||||||||||||||
| |
|
|
|
|
|
|
|
|||||||||
| Operating profit |
||||||||||||||||
| |
|
|
|
|
|
|
|
|||||||||
| Total other loss, net |
( |
) |
( |
) |
( |
) | ||||||||||
| |
|
|
|
|
|
|
|
|||||||||
| Income (loss) before income taxes |
( |
) |
||||||||||||||
| Income taxes |
||||||||||||||||
| |
|
|
|
|
|
|
|
|||||||||
| Net income (loss) |
( |
) |
||||||||||||||
| |
|
|
|
|
|
|
|
|||||||||
| Less: net income (loss) attributable to noncontrolling interests |
( |
) | ( |
) | ||||||||||||
| |
|
|
|
|
|
|
|
|||||||||
| Net income (loss) attributable to Baidu, Inc. |
( |
) |
||||||||||||||
| |
|
|
|
|
|
|
|
|||||||||
For the year ended December 31, 2023 |
||||||||||||||||||||||||||||||||
Baidu Core |
iQIYI |
Intersegment eliminations |
Consolidated |
|||||||||||||||||||||||||||||
RMB |
US$ |
RMB |
US$ |
RMB |
US$ |
RMB |
US$ |
|||||||||||||||||||||||||
(In millions) |
||||||||||||||||||||||||||||||||
| Total revenues |
( |
) |
( |
) |
||||||||||||||||||||||||||||
| |
|
|
|
|
|
|
|
|
|
|
|
|
|
|
|
|||||||||||||||||
| Operating costs and expenses: |
||||||||||||||||||||||||||||||||
| Cost of revenues |
( |
) | ( |
) | ||||||||||||||||||||||||||||
| Selling, general and administrative |
( |
) | ( |
) | ||||||||||||||||||||||||||||
| Research and development |
||||||||||||||||||||||||||||||||
| Total operating costs and expenses |
( |
) |
( |
) |
||||||||||||||||||||||||||||
| |
|
|
|
|
|
|
|
|
|
|
|
|
|
|
|
|||||||||||||||||
| Operating profit |
||||||||||||||||||||||||||||||||
| |
|
|
|
|
|
|
|
|
|
|
|
|
|
|
|
|||||||||||||||||
| Total other income (loss), net |
( |
) |
( |
) |
||||||||||||||||||||||||||||
| |
|
|
|
|
|
|
|
|
|
|
|
|
|
|
|
|||||||||||||||||
| Income before income taxes |
||||||||||||||||||||||||||||||||
| |
|
|
|
|
|
|
|
|
|
|
|
|
|
|
|
|||||||||||||||||
| Income taxes |
||||||||||||||||||||||||||||||||
| |
|
|
|
|
|
|
|
|
|
|
|
|
|
|
|
|||||||||||||||||
| Net income |
||||||||||||||||||||||||||||||||
| |
|
|
|
|
|
|
|
|
|
|
|
|
|
|
|
|||||||||||||||||
| Less: net income attributable to noncontrolling interests |
||||||||||||||||||||||||||||||||
| |
|
|
|
|
|
|
|
|
|
|
|
|
|
|
|
|||||||||||||||||
| Net income (loss) attributable to Baidu, Inc. |
( |
) |
( |
) |
||||||||||||||||||||||||||||
| |
|
|
|
|
|
|
|
|
|
|
|
|
|
|
|
|||||||||||||||||
For the years ended December 31, |
||||||||||||||||
2021 |
2022 |
2023 |
2023 |
|||||||||||||
RMB |
RMB |
RMB |
US$ |
|||||||||||||
(In millions) |
||||||||||||||||
| Online marketing services |
||||||||||||||||
| Cloud services (i) |
||||||||||||||||
| Others (i) |
||||||||||||||||
| |
|
|
|
|
|
|
|
|||||||||
| Baidu Core Subtotal |
||||||||||||||||
| |
|
|
|
|
|
|
|
|||||||||
| Membership services (i) |
||||||||||||||||
| Online advertising services (ii) |
||||||||||||||||
| Content distribution (i) |
||||||||||||||||
| Others (i) |
||||||||||||||||
| |
|
|
|
|
|
|
|
|
|
|
|
|
|
|
|
|
| iQIYI Subtotal |
||||||||||||||||
| |
|
|
|
|
|
|
|
|
|
|
|
|
|
|
|
|
| Intersegment eliminations |
( |
) | ( |
) | ( |
) | ( |
) | ||||||||
| |
|
|
|
|
|
|
|
|||||||||
| Total revenues |
||||||||||||||||
| |
|
|
|
|
|
|
|
|||||||||
(i) |
The revenues were presented as “Others” in the consolidated statements of comprehensive income. |
(ii) |
The revenues were presented as “Online marketing services” in the consolidated statements of comprehensive income. |
26. |
FAIR VALUE MEASUREMENTS |
| Level 1 |
– |
Observable inputs that reflect quoted prices (unadjusted) for identical assets or liabilities in active markets. | ||
| Level 2 |
– |
Include observable inputs other than quoted prices included in Level 1, such as quoted prices for similar assets and liabilities in active markets, quoted prices for identical or similar assets and liabilities in markets that are not active, or other inputs that are observable or can be corroborated by observable market data. | ||
| Level 3 |
– |
Unobservable inputs which are supported by little or no market activity. |
Fair value measurement or disclosure at December 31, 2022 using |
||||||||||||||||
Total fair value at December 31, 2022 |
Quoted prices in active markets for identical assets (Level 1) |
Significant other observable inputs (Level 2) |
Significant unobservable inputs (Level 3) |
|||||||||||||
RMB |
RMB |
RMB |
RMB |
|||||||||||||
(In millions) |
||||||||||||||||
Fair value disclosure (i) |
||||||||||||||||
Cash equivalents: |
||||||||||||||||
Time deposits |
||||||||||||||||
Money market funds |
||||||||||||||||
Short-term investments: |
||||||||||||||||
Held-to-maturity |
||||||||||||||||
Long-term investments: |
||||||||||||||||
Long-term time deposits and held-to-maturity |
||||||||||||||||
Notes payable, current portion |
||||||||||||||||
Convertible senior notes, current portion |
||||||||||||||||
Notes payable, non-current portion |
||||||||||||||||
Convertible senior notes, non-current portion |
||||||||||||||||
Fair value measurements on a recurring basis |
||||||||||||||||
Short-term investments: |
||||||||||||||||
Available-for-sale |
||||||||||||||||
Long-term investments: |
||||||||||||||||
Equity investments at fair value with readily determinable fair value |
||||||||||||||||
Equity investments without readily determinable fair value using NAV practical expedient (ii) |
||||||||||||||||
Investments accounted for at fair value |
||||||||||||||||
Available-for-sale |
||||||||||||||||
Other non-current assets: |
||||||||||||||||
Total assets measured at fair value |
||||||||||||||||
Amounts due to related parties, current: |
||||||||||||||||
Financial liability |
||||||||||||||||
Total liabilities measured at fair value |
||||||||||||||||
Fair value measurement or disclosure at December 31, 2023 using |
||||||||||||||||||||
Total fair value at December 31, 2023 |
Quoted prices in active markets for identical assets (Level 1) |
Significant other observable inputs (Level 2) |
Significant unobservable inputs (Level 3) |
|||||||||||||||||
RMB |
US$ |
RMB |
RMB |
RMB |
||||||||||||||||
(In millions) |
||||||||||||||||||||
Fair value disclosure (i) |
||||||||||||||||||||
Cash equivalents: |
||||||||||||||||||||
Time deposits |
||||||||||||||||||||
Short-term investments: |
||||||||||||||||||||
Held-to-maturity |
||||||||||||||||||||
Long-term investments: |
||||||||||||||||||||
Long-term time deposits and held-to-maturity |
||||||||||||||||||||
Notes payable, current portion |
||||||||||||||||||||
Convertible senior notes, current portion |
||||||||||||||||||||
Notes payable, non-current portion |
||||||||||||||||||||
Convertible senior notes, non-current portion |
||||||||||||||||||||
Fair value measurements on a recurring basis |
||||||||||||||||||||
Short-term investments: |
||||||||||||||||||||
Available-for-sale |
||||||||||||||||||||
Long-term investments: |
||||||||||||||||||||
Equity investments at fair value with readily determinable fair value |
||||||||||||||||||||
Equity investments without readily determinable fair value using NAV practical expedient (ii) |
||||||||||||||||||||
Investments accounted for at fair value |
||||||||||||||||||||
Available-for-sale |
||||||||||||||||||||
Other non-current assets: |
||||||||||||||||||||
Total assets measured at fair value |
||||||||||||||||||||
Amounts due to related parties, current: |
||||||||||||||||||||
Financial liability |
||||||||||||||||||||
Total liabilities measured at fair value |
||||||||||||||||||||
| (i) | Fair value disclosure shows financial instruments which are not measured at fair value in the consolidated balance sheets, but for which the fair value is estimated for disclosure purposes. |
| (ii) | Investments are measured at fair value using NAV as a practical expedient. These investments have not been classified in the fair value hierarchy. The fair value amounts presented in this table are intended to permit reconciliation of the fair value hierarchy to the amounts presented in the consolidated balance sheet. |
Amounts |
||||
RMB |
||||
(In millions) |
||||
Balance at December 31, 2021 |
||||
Additions |
||||
Disposals |
( |
) | ||
Foreign currency translation adjustments |
||||
Balance at December 31, 2022 |
||||
Additions |
||||
Disposals |
( |
) | ||
Foreign currency translation adjustments |
||||
Balance at December 31, 2023 |
||||
Balance at December 31, 2023, in US$ |
||||
Amounts |
||||
RMB |
||||
(In millions) |
||||
Balance at December 31, 2021 |
||||
Additions |
||||
Conversion from equity investment |
||||
Share of losses in excess of equity method investment in ordinary shares |
( |
) | ||
| ( |
) | |||
Accrued interest |
||||
Foreign currency translation adjustments |
||||
Balance at December 31, 2022 |
||||
Additions |
||||
Disposals |
( |
) | ||
Conversion |
||||
Share of losses in excess of equity method investment in ordinary shares |
( |
) | ||
| ( |
) | |||
Accrued interest |
||||
Foreign currency translation adjustments |
( |
) | ||
Balance at December 31, 2023 |
||||
Balance at December 31, 2023, in US$ |
||||
Total Balance |
Quoted Prices in Active Markets for Identical Assets (Level 1) |
Significant Other Observable Inputs (Level 2) |
Significant Unobservable Inputs (Level 3) |
Fair Value Adjustment |
Impairment |
|||||||||||||||||||||||||||||||
RMB |
US$ |
RMB |
RMB |
RMB |
RMB |
US$ |
RMB |
US$ |
||||||||||||||||||||||||||||
(In millions) |
||||||||||||||||||||||||||||||||||||
Fair value measurements on a non-recurring basis |
||||||||||||||||||||||||||||||||||||
As of December 31, 2022 |
||||||||||||||||||||||||||||||||||||
Long-term investments (i) |
( |
) |
||||||||||||||||||||||||||||||||||
Produced content monetized on its own (ii) |
( |
) |
||||||||||||||||||||||||||||||||||
As of December 31, 2023 |
||||||||||||||||||||||||||||||||||||
Long-term investments (i) |
— |
( |
) |
( |
) | |||||||||||||||||||||||||||||||
Produced content monetized on its own (ii) |
( |
) |
( |
) | ||||||||||||||||||||||||||||||||
| (i) | Due to declined financial performances and changes in business circumstances of certain investees, the Group recognized impairment charges of long-term investments in the consolidated statements of comprehensive income during the years ended December 31, 2022 and 2023. For equity securities accounted for under the measurement alternative, when there are observable price changes in orderly transactions for identical or similar investments of the same issuer, the investments are re-measured to fair value. |
| (ii) | Due to adverse changes in the expected performance of certain produced content and the reduced amount of ultimate revenue expected to be recognized, iQIYI performed an assessment to determine whether the fair value was less than unamortized content costs. iQIYI uses a discounted cash flow approach to estimate the fair value of the produced content titles predominantly monetized on its own. The significant unobservable inputs (level 3) include forecasted future revenues, production costs required to complete the content and exploitation and participation costs. iQIYI considers the historical performance of similar content, the forecasted performance and/or preliminary actual performance subsequent to the release of the produced content in estimating the fair value. Based on the above assessment, certain produced content predominantly monetized on its own were determined to be impaired and re-measured to the fair value as of each quarter end. Impairment charges of RMB |
recognized for produced content predominantly monetized on its own and was recognized as cost of revenues in the consolidated statements of comprehensive income for the years ended December 31, 2021, 2022 and 2023, respectively. |