UNITED STATES
SECURITIES AND EXCHANGE COMMISSION
Washington, D.C. 20549
FORM 10-K
| ANNUAL REPORT PURSUANT TO SECTION 13 OR 15(d) OF THE SECURITIES EXCHANGE ACT OF 1934 | |||||||||||
| For the fiscal year ended | February 3, 2024 | ||||||||||
| or | |||||||||||
| TRANSITION REPORT PURSUANT TO SECTION 13 OR 15(d) OF THE SECURITIES EXCHANGE ACT OF 1934 | |||||||||||
| For the transition period from __________ to __________ | |||||||||||
Commission File Number 001-08897
(Exact name of registrant as specified in its charter)
(State or other jurisdiction of incorporation or organization) (I.R.S. Employer Identification No.)
(Address of principal executive offices) (Zip Code)
(614 ) 278-6800
(Registrant’s telephone number, including area code)
| Securities registered pursuant to Section 12(b) of the Act: | ||||||||
| Title of each class | Trading Symbol(s) | Name of each exchange on which registered | ||||||
| Indicate by check mark if the registrant is a well-known seasoned issuer, as defined in Rule 405 of the Securities Act. | Yes | ☐ | ☑ | |||||||||||
| Indicate by check mark if the registrant is not required to file reports pursuant to Section 13 or Section 15(d) of the Act. | Yes | ☐ | ☑ | |||||||||||
| Indicate by check mark whether the registrant (1) has filed all reports required to be filed by Section 13 or 15(d) of the Securities Exchange Act of 1934 during the preceding 12 months (or for such shorter period that the registrant was required to file such reports), and (2) has been subject to such filing requirements for the past 90 days. | ☑ | No | ☐ | |||||||||||
| Indicate by check mark whether the registrant has submitted electronically every Interactive Data File required to be submitted and posted pursuant to Rule 405 of Regulation S-T (§ 232.405 of this chapter) during the preceding 12 months (or for such shorter period that the registrant was required to submit such files). | ☑ | No | ☐ | |||||||||||
| Indicate by check mark whether the registrant is a large accelerated filer, an accelerated filer, a non-accelerated filer, a smaller reporting company, or an emerging growth company. See the definitions of “large accelerated filer,” “accelerated filer,” “smaller reporting company,” and "emerging growth company" in Rule 12b-2 of the Exchange Act. | ||||||||||||||||||||||||||
| Large accelerated filer | ☐ | ☑ | Non-accelerated filer ☐ | Smaller reporting company | Emerging growth company | |||||||||||||||||||||
| If an emerging growth company, indicate by check mark if the registrant has elected not to use the extended transition period for complying with any new or revised financial accounting standards provided pursuant to Section 13(a) of the Exchange Act. | ☐ | |||||||||||||
| Indicate by check mark whether the registrant has filed a report on and attestation to its management’s assessment of the effectiveness of its internal control over financial reporting under Section 404(b) of the Sarbanes-Oxley Act (15 U.S.C. 7262(b)) by the registered public accounting firm that prepared or issued its audit report. | ||||||||||||||
| If securities are registered pursuant to Section 12(b) of the Act, indicate by check mark whether the financial statements of the registrant included in the filing reflect the correction of an error to previously issued financial statements. | ||||||||||||||
| Indicate by check mark whether any of those error corrections are restatements that required a recovery analysis of incentive-based compensation received by any of the registrant’s executive officers during the relevant recovery period pursuant to §240.10D-1(b). | ☐ | |||||||||||||
| Indicate by check mark whether the registrant is a shell company (as defined in Rule 12b-2 of the Exchange Act). | Yes | No | ☑ | |||||||||||
The aggregate market value of the Common Shares held by non-affiliates of the Registrant (assuming for these purposes that all executive officers and directors are “affiliates” of the Registrant) was $294,902,033 on July 28, 2023, the last business day of the Registrant’s most recently completed second fiscal quarter (based on the closing price of the Registrant’s Common Shares on such date as reported on the New York Stock Exchange).
The number of the Registrant’s common shares, $0.01 par value, outstanding as of April 12, 2024, was 29,512,551 .
Documents Incorporated by Reference
Portions of the Registrant’s Proxy Statement for its 2024 Annual Meeting of Shareholders are incorporated by reference into Part III of this Annual Report on Form 10-K.
BIG LOTS, INC.
FORM 10-K
FOR THE FISCAL YEAR ENDED FEBRUARY 3, 2024
TABLE OF CONTENTS
| Part I | Page | ||||||||||
| Item 1. | |||||||||||
| Item 1A. | |||||||||||
| Item 1B. | |||||||||||
| Item 1C. | |||||||||||
| Item 2. | |||||||||||
| Item 3. | |||||||||||
| Item 4. | |||||||||||
| Part II | |||||||||||
| Item 5. | |||||||||||
| Item 6. | |||||||||||
| Item 7. | |||||||||||
| Item 7A. | |||||||||||
| Item 8. | |||||||||||
| Item 9. | |||||||||||
| Item 9A. | |||||||||||
| Item 9B. | |||||||||||
| Item 9C. | |||||||||||
| Part III | |||||||||||
| Item 10. | |||||||||||
| Item 11. | |||||||||||
| Item 12. | |||||||||||
| Item 13. | |||||||||||
| Item 14. | |||||||||||
| Part IV | |||||||||||
| Item 15. | |||||||||||
| Item 16. | |||||||||||
1
Part I
Item 1. Business
The Company
Big Lots, Inc., an Ohio corporation, through its wholly owned subsidiaries is a home discount retailer operating in the United States (“U.S.”). At February 3, 2024, we operated a total of 1,392 stores and an e-commerce platform. Our mission is to help people Live BIG and Save LOTS. Our vision is to be the BIG difference for a better life by delivering unmistakable value to customers, building a “best places to grow” culture, rewarding shareholders with top tier growth and returns, and doing good in local communities.
Our principal executive offices are located at 4900 E. Dublin-Granville Road, Columbus, Ohio 43081, and our telephone number is (614) 278‑6800.
Unless this Annual Report on Form 10-K (“Form 10-K”) otherwise indicates or the context otherwise requires, the terms the “Company,” “we,” “us,” and “our” refer to Big Lots, Inc. and its subsidiaries.
Similar to many other retailers, our fiscal year ends on the Saturday nearest to January 31, which results in some fiscal years consisting of 52 weeks and some fiscal years consisting of 53 weeks. Unless otherwise stated, references to years in this Form 10-K relate to fiscal years rather than to calendar years. The following table summarizes our fiscal year calendar and the number of weeks in each fiscal year:
| Fiscal Year | Number of Weeks | Year Begin Date | Year End Date | |||||||||||||||||
| 2024 | 52 | February 4, 2024 | February 1, 2025 | |||||||||||||||||
| 2023 | 53 | January 29, 2023 | February 3, 2024 | |||||||||||||||||
| 2022 | 52 | January 30, 2022 | January 28, 2023 | |||||||||||||||||
| 2021 | 52 | January 31, 2021 | January 29, 2022 | |||||||||||||||||
| 2020 | 52 | February 2, 2020 | January 30, 2021 | |||||||||||||||||
| 2019 | 52 | February 3, 2019 | February 1, 2020 | |||||||||||||||||
We manage our business on the basis of one segment: discount retailing. We use the following six merchandise categories, which are consistent with our internal management and reporting of merchandise net sales: Food; Consumables; Soft Home; Hard Home and Other; Furniture; and Seasonal. The Food category includes our beverage & grocery; specialty foods; and candy & snacks departments. The Consumables category includes our health, beauty and cosmetics; plastics; paper; pet; infant; stationery; and chemical departments. The Soft Home category includes our apparel; hosiery; jewelry; frames; fashion bedding; utility bedding; bath; window; decorative textile; and area rugs departments. The Hard Home and Other category includes our small appliances; table top; food preparation; home maintenance; home organization; toys; and electronics departments; and other offerings. The Furniture category includes our upholstery; mattress; ready-to-assemble; home décor; and case goods departments. The Seasonal category includes our lawn & garden; summer; Christmas; and other holiday departments.
In 2023, we realigned certain departments within select merchandise categories to be consistent with the realignment of our merchandising team and changes to our management reporting. In order to provide comparative information, we have reclassified our results into the new alignment for all periods presented. See the reclassifications section of Note 1 to the consolidated financial statements for further discussion.
We periodically assess, and make minor adjustments to, our product hierarchy, which can impact the roll-up of our merchandise categories. Our financial reporting process utilizes the most current product hierarchy in reporting net sales by merchandise category for all periods presented. Therefore, there may be minor reclassifications of net sales by merchandise category compared to previously reported amounts.
2
Merchandising
Our merchandising strategy primarily focuses on product sourcing, particularly closeout sourcing and global sourcing. We implement our merchandising strategy through (1) Bargains and Extreme Bargains, by seeking to deliver unmatched value in all of our merchandise categories through high quality closeouts on name brand items, affordable opening price points and low prices on our own brand assortment and (2) complementing our bargain offerings with an assortment of essentials, by seeking to offer a reliable assortment of simple-to-shop staple products that we believe our customers rely on and that bring consistency to our product mix. We evaluate our product offerings to ensure we are providing quality and unmistakable value, and exceeding our customer’s expectations. We believe that focusing on our customers’ expectations will improve our ability to provide a more relevant and desirable assortment of offerings in our merchandise categories.
We utilize traditional sourcing methods in purchasing imported and domestic products. We also take advantage of closeout channels to enhance our ability to offer products that provide unmistakable value to our customers, which we refer to as “Extreme Bargains.” Further, we offer products that we believe provide a good value at lower prices, which we refer to as “Bargains.” We generally source closeouts from production overruns, packaging changes, discontinued products, order cancellations, liquidations, returns, and other disruptions in the supply chains of manufacturers, but also from engineered closeouts and other sourcing options. We have increased our sourcing and purchasing of high quality closeout merchandise directly from manufacturers and other vendors, typically at prices lower than those paid by traditional discount retailers, to enhance our ability to deliver unmistakable value. We believe our strong vendor relationships support this sourcing model, and we intend to continue to grow our Bargain merchandise offerings during 2024.
Our global sourcing team and overseas vendor relationships continue to represent important components of our merchandising strategy. We expect our import partners to responsibly source goods that our merchandising teams identify as having our desired mix of quality and value. During 2023, we purchased approximately 21% of our merchandise, at cost, directly from overseas vendors, including approximately 13% from vendors located in China. Additionally, a significant amount of our domestically-purchased merchandise is manufactured abroad. As a result, a significant portion of our merchandise supply is subject to certain risks described in “Item 1A. Risk Factors” of this Form 10-K.
Advertising and Marketing
We believe that our brand image is an important part of why our customers choose to shop Big Lots. We also believe our brand image is important to the value proposition that we convey through all of our customer touchpoints. We employ an integrated approach for our marketing touchpoints and investments consisting of: (1) paid media, including television, print, digital, social media, internet, e-mail, and payment card-linked marketing; (2) earned media, including public relations and organic social media; and (3) owned media, including our website, customer loyalty programs, and in-store signage. Total advertising expense as a percentage of total net sales was 1.9%, 1.8%, and 1.6% in 2023, 2022, and 2021, respectively.
We have conducted extensive consumer research to enhance our understanding of why customers shop us and the reasons why others do not shop us. We have used this research to refine our brand positioning and implement changes to our messaging across all marketing touchpoints. Our research shows that our customers believe we excel in four key areas or brand pillars: unmistakable value, surprising products, easy shopping, and a delightful experience. Accordingly, our marketing strategy is grounded in these brand pillars. Our marketing tactics are intended to: (1) communicate bargains and extreme bargains; (2) drive incremental visits from new and existing customers; (3) increase our brand awareness, brand consideration and customers; and (4) drive personalized marketing based on our customer data platform. Our consumer research also influences how we merchandise our stores, invest in omnichannel capabilities, design our shopping experience, and invest in our business.
Our customer data is an important marketing tool that allows us to communicate with our customers in a cost-effective, personalized, and relevant manner, including through e-mail delivery of our circulars, announcement of flash sales, and product-specific promotions. At February 3, 2024, our customer loyalty program, which we call the “BIG Rewards Program,” included approximately 20 million active members who had made a purchase in our stores in the last 12 months, compared to approximately 21 million active members at January 28, 2023. In addition to the customer communications mentioned above, our BIG Rewards Program rewards our customers for making frequent and high-ticket purchases and offers a special birthday reward. We utilize insights gained through the BIG Rewards Program to evaluate the effectiveness of our promotions, tailor promotions to our customers’ shopping habits, and gain consumer insights. Our research shows that membership in the BIG Rewards Program helps drive net sales, and we have incentivized our store associates to encourage customer enrollment into the program.
3
We believe our approach to retailing differentiates us from the competition and allows us to make a difference in the communities we serve. Our community-oriented approach to retailing includes “doing good as we do well,” which means supporting both local and national causes that aid the communities in which we do business. We invest in point-of-sale campaigns in each of our geographic regions, the beneficiaries of which are selected based on their impacts on local customers and associates. We serve the community on a national level through our Big Lots Foundation, which focuses on healthcare, housing, hunger, and education. In addition, we are pleased to support our local community in Columbus, OH through our partnership with Nationwide Children’s Hospital, to which the Company committed $40 million and the Big Lots Foundation committed $10 million to the Big Lots Behavioral Health Pavilion, a state-of-the-art medical facility dedicated to child and adolescent mental and behavioral health, which opened in 2020.
Competition
We operate in the highly competitive retail industry. We face strong sales competition from other general merchandise, discount, home, food, furniture, arts and crafts, and dollar store retailers, which operate in traditional brick and mortar stores and/or online. Additionally, we compete with a number of companies for retail site locations and, distribution site locations, to attract and retain quality employees, and to acquire our broad merchandising assortment from vendors. We operate an e-commerce platform which faces additional competition for customers, fulfillment capabilities, and technological innovation from a wider range of retailers in a highly competitive marketplace.
Real Estate
The following table compares the number of our stores in operation at the beginning and end of each of the last five fiscal years:
| 2023 | 2022 | 2021 | 2020 | 2019 | |||||||||||||||||||||||||
| Stores open at the beginning of the year | 1,425 | 1,431 | 1,408 | 1,404 | 1,401 | ||||||||||||||||||||||||
| Stores opened during the year | 15 | 56 | 50 | 24 | 54 | ||||||||||||||||||||||||
| Stores closed during the year | (48) | (62) | (27) | (20) | (51) | ||||||||||||||||||||||||
| Stores open at the end of the year | 1,392 | 1,425 | 1,431 | 1,408 | 1,404 | ||||||||||||||||||||||||
For additional information regarding our real estate strategy, see the discussion under the caption “Operating Strategy - Real Estate” in the accompanying “Item 7. Management’s Discussion and Analysis of Financial Condition and Results of Operations” (“MD&A”) in this Form 10-K.
4
The following table details our U.S. stores by state at February 3, 2024:
| Alabama | 29 | Maine | 5 | Ohio | 102 | ||||||||||||||||||
| Arizona | 34 | Maryland | 27 | Oklahoma | 20 | ||||||||||||||||||
| Arkansas | 12 | Massachusetts | 23 | Oregon | 14 | ||||||||||||||||||
| California | 109 | Michigan | 46 | Pennsylvania | 73 | ||||||||||||||||||
| Colorado | 14 | Minnesota | 2 | Rhode Island | 1 | ||||||||||||||||||
| Connecticut | 16 | Mississippi | 12 | South Dakota | 1 | ||||||||||||||||||
| Delaware | 5 | Missouri | 25 | South Carolina | 38 | ||||||||||||||||||
| Florida | 107 | Montana | 3 | Tennessee | 47 | ||||||||||||||||||
| Georgia | 51 | Nebraska | 3 | Texas | 116 | ||||||||||||||||||
| Idaho | 6 | Nevada | 13 | Utah | 7 | ||||||||||||||||||
| Illinois | 29 | New Hampshire | 6 | Vermont | 4 | ||||||||||||||||||
| Indiana | 45 | New Jersey | 27 | Virginia | 43 | ||||||||||||||||||
| Iowa | 3 | New Mexico | 12 | Washington | 26 | ||||||||||||||||||
| Kansas | 7 | New York | 64 | West Virginia | 16 | ||||||||||||||||||
| Kentucky | 40 | North Carolina | 75 | Wisconsin | 12 | ||||||||||||||||||
| Louisiana | 19 | North Dakota | 1 | Wyoming | 2 | ||||||||||||||||||
| Total stores | 1,392 | ||||||||||||||||||||||
| Number of states | 48 | ||||||||||||||||||||||
Of our 1,392 stores, 31% operate in four states: California, Texas, Florida, and Ohio, and net sales from stores in these states represented 32% of our 2023 net sales. We have a concentration in these states based on their size, population, and customer base.
Warehouse and Distribution
While certain of our merchandise vendors deliver directly to our stores, the large majority of our inventory is staged and delivered from our distribution centers to facilitate prompt and efficient distribution and transportation of merchandise to our stores and help maximize our sales and inventory turnover.
The majority of our merchandise offerings are processed for retail sale and distributed to our stores from five regional distribution centers located in Alabama, California, Ohio, Oklahoma, and Pennsylvania.
We selected the locations of our regional distribution centers to help manage transportation costs and to minimize the distance from our distribution centers to our stores.
In addition to our regional distribution centers that handle store merchandise, we operate two other warehouses within our Ohio distribution center. One warehouse distributes fixtures and supplies to our stores and our five regional distribution centers and the other warehouse serves as a fulfillment center for our direct-ship e-commerce operations. To supplement our e-commerce fulfillment center, we also fulfill direct-ship e-commerce orders from 66 of our store locations, which we strategically selected based on geographic location, size, and other relevant factors. We also fulfill some of our e-commerce orders using supplier direct fulfillment, a process in which the customer purchases merchandise through our e-commerce platform, but the merchandise is shipped directly from the supplier to the customer. Supplier direct fulfillment is primarily used for bulky items that are more costly to warehouse and ship. We also direct-ship a limited assortment out of our distribution center in California to fulfill some of our e-commerce orders. We continue to evaluate our e-commerce fulfillment capabilities to reduce shipping times and expenses.
In 2021 and 2022, we opened four small-format forward distribution centers (“FDC”) located in Georgia, Pennsylvania, Washington, and Indiana to divert processing and logistics for bulk goods out of our regional distribution centers into our FDCs and to increase the efficiency and capacity of our regional distribution centers, which were designed to efficiently process cartons as opposed to bulk goods. In 2023, we ceased all business operations at our FDCs, subleased our Georgia and Indiana FDC locations to third-party tenants, and terminated the lease for the FDC located in Lacey, WA. We ceased all business operations at our FDCs due to the decline in sales volume, and to reduce operational expenses and right size our warehouse and
5
distribution network. We are actively marketing the remaining FDC site in Pennsylvania for sublease, which has a remaining lease term of approximately 2.7 years. For additional information regarding our warehouses and distribution facilities and related initiatives, see the discussion under the caption “Warehouse and Distribution” in “Item 2. Properties” of this Form 10-K.
We will continue to evaluate our supply chain needs based on projected purchasing volumes and adjust the capacity of our distribution and fulfillment network accordingly.
Seasonality
We have historically experienced seasonal fluctuations in our sales and profitability, with a larger percentage of our net sales and operating profit realized in our fourth fiscal quarter, which includes the Christmas holiday selling season. Our quarterly net sales and operating profit (loss) can be affected by the timing of new store openings and store closings, advertising, and certain holidays. We historically receive a higher proportion of merchandise, carry higher inventory levels, and incur higher outbound shipping and payroll expenses as a percentage of sales in our third fiscal quarter in anticipation of increased sales activity during our fourth fiscal quarter. Performance during our fourth fiscal quarter typically reflects a leveraging effect which has a favorable impact on our operating results because net sales are higher and certain of our costs, such as rent and depreciation, are fixed and do not vary as sales levels escalate. If our sales performance is significantly better or worse during the Christmas holiday selling season, we would expect a more pronounced impact on our annual financial results than if our sales performance is significantly better or worse in a different season.
The seasonality of our net sales in the last three years was generally aligned with our historical seasonality. The seasonality of our operating results, however, differed significantly due to our recording an operating loss in the first, second, and fourth quarters of 2023 and every quarter of 2022, compared to only one quarter in 2021. This change in the seasonality of our operating results is primarily attributable to inflationary and macroeconomic pressures experienced throughout 2022 and 2023, which resulted in decreased net sales, decreased gross margin as a percentage of net sales, and increased selling and administrative expenses. For additional information regarding our operating results, see the discussion under the caption “Results of Operations” in the accompanying MD&A in this Form 10-K.
The following table sets forth the seasonality of net sales and operating profit (loss) for 2023, 2022, and 2021 by fiscal quarter:
| First | Second | Third | Fourth | |||||||||||
| Fiscal Year 2023 | ||||||||||||||
| Net sales as a percentage of full year | 23.8 | % | 24.1 | % | 21.7 | % | 30.4 | % | ||||||
Operating (loss) profit as a percentage of full year (a) | (67.4) | (31.5) | 5.1 | (6.2) | ||||||||||
| Fiscal Year 2022 | ||||||||||||||
| Net sales as a percentage of full year | 25.1 | % | 24.6 | % | 22.0 | % | 28.3 | % | ||||||
Operating loss as a percentage of full year (b) | (5.2) | (41.7) | (50.0) | (3.1) | ||||||||||
| Fiscal Year 2021 | ||||||||||||||
| Net sales as a percentage of full year | 26.4 | % | 23.7 | % | 21.7 | % | 28.2 | % | ||||||
| Operating profit (loss) as a percentage of full year | 51.1 | 22.5 | (1.7) | 28.1 | ||||||||||
(a) The first, third, and fourth quarters of 2023 included asset impairment charges of $84.5 million, $55.3 million, and $11.7 million, respectively. The first quarter of 2023 included $53.6 million in lease exit costs associated with our prior synthetic lease for our Apple Valley, CA distribution center (“AVDC”). The first, second, third, and fourth quarters of 2023 included contract termination costs and expenses related to closure of our FDCs of $8.6 million, $9.0 million, $2.8 million, and $2.2 million, respectively. The second, third, and fourth quarters of 2023 included fees related to a cost reduction and productivity initiative (“Project Springboard”) of $5.4 million, $14.4 million, and $11.5 million, respectively. For additional information regarding “Project Springboard,” see the discussion under the caption “Project Springboard” within the “Operating Strategy” section within the accompanying MD&A in this Form 10-K. The third quarter of 2023 included a gain on sale of real estate and related expenses of $204.7 million related to the sale and leaseback of 23 owned stores and AVDC.
(b) The second, third, and fourth quarters of 2022 included asset impairment charges of $24.1 million, $21.7 million, and $22.6 million, respectively. The fourth quarter of 2022 also included a gain on sale of real estate and related expenses of $16.8 million related to the sale of 20 owned store locations and one unoccupied land parcel.
6
Human Capital
At February 3, 2024, we had approximately 30,300 active associates comprised of 10,000 full-time and 20,300 part‑time associates. Approximately 67% of the associates we employed during 2023 were employed on a part-time basis. Temporary associates hired for the holiday selling season increased the total number of associates to a peak of approximately 32,200 in 2023. We are not a party to any labor agreements. We require all of our associates to adhere to our Code of Business Conduct and Ethics and workplace safety protocols.
We believe our associates are among our most important resources. We evaluate our human capital management at our stores, distribution centers, and corporate headquarters on the basis of associate engagement, diversity, equity, and inclusion, compensation and benefits, talent development and health and safety.
Associate Engagement
We send an associate engagement survey to each of the associates in our corporate headquarters and to our field and distribution center leadership on an annual basis to assess our associate engagement and obtain the thoughts of those associates regarding manager effectiveness, performance enablement, and our diversity and inclusion efforts. In 2023, 91% of the associates surveyed responded to the survey with a 76% favorable engagement rate. Based on results of the annual survey, our leaders create action plans to address areas where our associates have told us we can improve.
Diversity, Equity, and Inclusion
We recognize the value of creating a diverse, equitable, and inclusive workplace. As a result, diversity, equity, and inclusion (“DEI”) is a significant component of our human capital management. As part of our commitment to DEI, we established a Diversity, Equity, and Inclusion Council (“DEI Council”) in 2020 to lead the development and advancement of our DEI strategy. The DEI Council is comprised of associates from our stores, distribution centers, and corporate headquarters who represent various job levels, locations, ages, genders, languages, work shifts, races, sexual orientations, and leadership styles. Additionally, our Diversity, Equity, and Inclusion Executive Advisory Committee, which is comprised of senior leaders, provides guidance to the DEI Council, approves our DEI strategy and promotes its achievement throughout our organization. In 2022 and 2023, we integrated our conscious inclusion program into the onboarding process for all of our associates, which we developed to build awareness of our DEI strategy, educate our associates on how we can improve DEI, and further promote the already strong culture of belonging and empowerment for all associates.
Compensation and Benefits
We offer a competitive compensation and benefits package to our eligible associates including, among other benefits, incentive compensation, performance-based merit pay, paid holidays, paid vacation, 401(k) match, and healthcare coverage, including medical, dental, and vision insurance with health savings account and flexible savings account options. Our compensation and benefits packages are designed to attract and retain high-performing talent. Additionally, we provide our associates with a company discount on our merchandise and our associates redeemed over $22 million in corporate discounts in 2023.
Talent Development
Talent development is critical to developing the high-performance culture that we seek to foster. Each of our associates participates in an annual goal-setting process and completes an annual performance review, which is followed by periodic discussions throughout the year to assess progress. Each of our managers also completes an individual development plan on an annual basis to set and track long-term goals. Additionally, our business leaders participate in a succession planning process that serves as a tool for identifying and developing high-potential individuals within our organization as well as ensuring business continuity. We also offer a robust catalog of training and development programs to our associates through our Big Lots University training tool, which covers topics including, but not limited to, workplace harassment, safety, ethics, leadership, and job skills. All associates are responsible for upholding the Company’s Code of Business Conduct and Ethics and Human Rights Policy which form the foundation of our policies and practices and ethical business culture.
Health and Safety
The health and safety of our associates is of the utmost importance. We have implemented comprehensive safety protocols in each of our stores, distribution centers, and corporate offices to ensure the safety of associates, customers, and other visitors in each facility. We require each of our associates to complete safety training courses relevant to their jobs, which we track using e-learning tools to ensure compliance. In addition to traditional safety training, we require all of our associates to participate in aggressor/active shooter training and we require our store associates to participate in argumentative and de-escalating conversations training. We reinforce safety standards with re-training requirements and regular, engaging communications.
7
Environmental, Social and Governance Practices
The Board has primary responsibility for overseeing environmental, health and safety, corporate social responsibility, corporate governance, sustainability and other public policy matters relevant to the Company (“ESG Matters”), including overseeing the management of risks relating to ESG matters. The Board executes its oversight duties in part by assigning responsibility to committees of the Board to oversee the management of ESG Matters and ESG risks that fall within their respective areas. Our Nominating / Corporate Governance Committee assists the Board in fulfilling the Board’s oversight responsibility relating to the evaluation of ESG risk and has responsibility under its charter to oversee ESG Matters. Our Environmental, Social and Governance Committee supports the Company’s ongoing commitment to ESG Matters. The Environmental, Social and Governance Committee takes a leadership role in (1) developing the Company’s general strategy with respect to ESG Matters, (2) overseeing the development of policies and practices relating to ESG Matters based on such strategy and the integration of such policies and practices into the Company’s business operations and strategy, (3) overseeing communications with employees, investors and stakeholders regarding ESG Matters and (4) monitoring and assessing developments relating to, and improving the Company’s understanding of, ESG Matters. The Environmental, Social and Governance Committee is comprised of our Chief Legal and Governance Officer, our Chief Financial and Administrative Officer and the leaders of our Compliance/Social, Diversity, Equity & Inclusion, Investor Relations, Public Relations and Sustainability functions. The duties and responsibilities of the Environmental, Social and Governance Committee are further described in its charter, which is available in the Investor Relations section of our website (www.biglots.com) under the “Corporate Governance” caption.
Our vision is to be the BIG difference for a better life, and we deliver on that vision by building stronger communities where all families can thrive. Through our culture of philanthropy, we remain dedicated to making a positive impact on the places we call home. The Big Lots Foundation is focused on improving the lives of families and children facing challenges in four key areas—hunger, housing, healthcare, and education—which we believe are the most basic needs of any community. We carry out our philanthropy strategy through key programs and relationships, including national point-of-sale donation campaigns that engage our customers and associates around the country to raise dollars and awareness for causes that impact all of us; Big Lots Foundation giving to invest in organizations that are fulfilling the Big Lots Foundation’s mission in communities where our stakeholders live and work; volunteerism and community engagement that empowers our associates to give their time and talents to the causes they care about most; and in-kind donations of our products to nonprofit partners, which allows us to support local communities and reduce our environmental impact. To date, the Big Lots Foundation has donated approximately $25.0 million to help fulfil our philanthropic vision.
In April 2023, we published our second corporate social responsibility report, titled “BIG Cares,” which addressed our environmental, social and governance policies, initiatives and achievements. A copy of this report is available on our website (www.biglots.com). The contents of our website, including the Big Cares reports, are not incorporated into, or otherwise made a part of, this Form 10-K.
Available Information
We make available, free of charge, through the “Investors” section of our website (www.biglots.com) under the “SEC Filings” caption, our Annual Reports on Form 10-K, Quarterly Reports on Form 10-Q, Current Reports on Form 8-K, and amendments to those reports filed or furnished pursuant to Section 13 or 15(d) of the Securities Exchange Act of 1934, as amended (“Exchange Act”), as well as our definitive proxy materials filed pursuant to section 14 of the Exchange Act, as soon as reasonably practicable after we file such material with, or furnish it to, the Securities and Exchange Commission (“SEC”). These filings are also available on the SEC’s website at http://www.sec.gov. The contents of our website, including the Big Cares report, are not incorporated into, or otherwise made a part of, this Form 10-K.
8
Item 1A. Risk Factors
The statements in this item describe material risks to our business and should be considered carefully. In addition, these statements constitute cautionary statements under the Private Securities Litigation Reform Act of 1995.
This Form 10-K contains forward-looking statements that set forth anticipated results based on management’s plans and assumptions. From time to time, we provide forward-looking statements in other materials we release to the public and in oral statements that may be made by us. Such forward-looking statements give our current expectations or forecasts of future events. They do not relate strictly to historical or current facts. Such statements are commonly identified by using words such as “anticipate,” “estimate,” “continue,” “could,” “approximate,” “expect,” “objective,” “goal,” “project,” “intend,” “plan,” “believe,” “will,” “should,” “may,” “target,” “forecast,” “guidance,” “outlook,” and similar expressions in connection with any discussion of future operating or financial performance. In particular, forward-looking statements include statements relating to future actions, future performance, or results of current and anticipated products, sales efforts, expenses, interest rates, the outcome of contingencies, such as legal proceedings and financial results.
We cannot guarantee that any forward-looking statement will be realized. Achievement of future results is subject to risks, uncertainties, and potentially inaccurate assumptions. If known or unknown risks or uncertainties materialize, or should underlying assumptions prove inaccurate, actual results could differ materially from past results or those anticipated, estimated, or projected results set forth in the forward-looking statements. You should bear this in mind as you consider forward-looking statements made or to be made by us.
You are cautioned not to place undue reliance on forward-looking statements, which speak only as of the date made. We undertake no obligation to publicly update forward-looking statements, whether as a result of new information, future events, or otherwise. You are advised, however, to consult any further disclosures we make on related subjects in our future Annual Reports on Form 10-K, Quarterly Reports on Form 10-Q and Current Reports on Form 8-K filed with the SEC.
The following cautionary discussion of material risks, uncertainties, and assumptions relevant to our businesses describes factors that, individually or in the aggregate, we believe could cause our actual results to differ materially from expected and historical results. Additional risks not presently known to us or that we presently believe to be immaterial also may adversely impact us. Should any risks or uncertainties develop into actual events, these developments could have material adverse effects on our business, financial condition, results of operations, and liquidity. Consequently, all forward-looking statements made or to be made by us are qualified by these cautionary statements, and there can be no assurance that the results or developments we anticipate will be realized or that they will have the expected effects on our business or operations. This discussion is provided as permitted by the Private Securities Litigation Reform Act of 1995.
Our ability to achieve the results contemplated by forward-looking statements is subject to a number of factors, any one or a combination of which could materially affect our business, financial condition, results of operations, and liquidity. These factors may include, but are not limited to:
Operational and Supply Chain Risks
Our strategy depends on initiatives designed to increase sales and improve the efficiencies, costs and effectiveness of our operations. Failure to achieve these goals could affect our performance adversely.
We have implemented a cost reduction and productivity initiative that we refer to as “Project Springboard,” with the goal of improving our operating income by over $200 million by reducing our cost of goods sold, improving gross margin and reducing selling and administrative expenses. The initiatives intended to reduce cost of goods sold are expected to be achieved primarily through reduced input costs as a result of improved purchasing practices and competitive bidding processes, among other improvements. The gross margin improvements are primarily expected to be achieved through optimization of our inventory allocation processes and improved marketing, pricing, and promotion, among other improvements. The selling and administrative expense savings are expected to be achieved through optimization of store payroll, improved efficiency in our supply chain, procurement improvements, and other workforce efficiencies. We may not meet or exceed our operating performance targets and goals if our strategies and initiatives are unsuccessful. Our ability to execute and/or refine our operating and strategic plans, as necessary, including cost savings initiatives, could impact our ability to meet our operating performance targets. Additionally, we must effectively adjust our operating and strategic plans over time to adapt to the evolving marketplace. See the discussion under the caption “Operating Strategy” within MD&A in this Form 10-K for additional information concerning our operating strategy.
9
Our arrangements with our suppliers and vendors may be materially and adversely affected by changes in our financial results or financial position or changes in consumer demand, which could materially and adversely affect our business.
Substantially all of our merchandise suppliers and vendors sell to us on open account purchase terms. There is a risk that our suppliers and vendors could respond to any actual or apparent decrease in, or any concern with, our financial results or liquidity by requiring or conditioning their sale of merchandise to us on more stringent or more costly payment terms, such as by requiring earlier or advance payment of invoices, payment upon delivery or other assurances or credit support or by choosing not to sell merchandise to us on a timely basis or at all. In addition, if demand for our products declines, the volume of merchandise we purchase from suppliers may decrease, which could result in smaller discounts from our vendors or the elimination of such discounts. Our arrangements with our suppliers and vendors may also be impacted by media reports regarding our financial position or other factors relating to our business. Our need for additional liquidity could materially increase and our supply of inventory could be materially disrupted if any of our key suppliers or vendors, or a significant portion of our other suppliers or vendors, takes one or more of the actions described above, which could result in increased operating costs and decreased net sales, customer satisfaction and profits.
We are subject to payments-related risks that could increase our operating costs, expose us to fraud, subject us to potential liability, and potentially disrupt our business.
We accept payments using a variety of methods, including credit cards, debit cards, credit accounts, our private label credit cards, gift cards, direct debit from a customer’s bank account, consumer invoicing, and physical bank checks, and we may offer different payment options over time. These payment options subject us to many compliance requirements, including, but not limited to, compliance with payment card association operating rules, data security rules, certification requirements, rules governing electronic funds transfers, and Payment Card Industry Data Security Standards. They also subject us to potential fraud by criminal elements seeking to discover and take advantage of security vulnerabilities that may exist in some of these payment systems. For certain payment methods, including credit and debit cards, we pay interchange and other fees, which may increase over time and raise our operating costs and lower profitability. We rely on third parties to provide payment processing services, including the processing of credit cards, debit cards, electronic checks, gift cards and promotional financing, and our business may be disrupted if these companies become unwilling or unable to provide these services to us. If we fail to comply with these rules or requirements or adequately encrypt payment transaction data, or if our data security systems are breached or compromised, we may be liable for card issuing banks’ costs, become subject to fines and higher transaction fees, and lose our ability to accept credit and debit card payments from our customers, process electronic funds transfers, or facilitate other types of online payments, and our business and operating results could be adversely affected.
Disruption to our distribution network, the capacity of our distribution centers, and our timely receipt of merchandise inventory could adversely affect our operating performance.
We rely on our ability to replenish depleted merchandise inventory through deliveries to our distribution centers and from the distribution centers to our stores by various means of transportation, including shipments by sea, rail and truck carriers. A decrease in the capacity of carriers, labor strikes or shortages, or disruptions in the transportation industry could negatively affect our distribution network, our timely receipt of merchandise and/or our transportation costs. In addition, disruptions to the U.S. and international transportation infrastructure from wars or conflicts (including the Russian invasion of Ukraine and the Israel-Hamas war), political unrest, terrorism, natural disasters (including extreme weather), pandemic diseases, governmental budget constraints and other significant events that lead to delays or interruptions of service could adversely affect our business. Although the Israel-Hamas war has not yet had a material impact on our business or operations, the expansion of the geographic or economic scope of the conflict could create supply chain inefficiencies, increase shipping costs and delay shipments of merchandise, any of which could have an adverse impact in our ability to receive merchandise. In addition, a fire, earthquake, or other disaster (including extreme weather) at one of our distribution centers could disrupt our timely receipt, processing and shipment of merchandise to our stores which could adversely affect our business. Additionally, as we seek to expand our operations through sales growth and advancement of our online retail capabilities, we may face increased or unexpected demands on distribution center operations, as well as new demands on our distribution network.
We rely on manufacturers located in foreign countries, including China, for significant amounts of merchandise, including a significant amount of our domestically-purchased merchandise. Our business may be materially adversely affected by risks associated with international trade, including the impact of tariffs and/or sanctions imposed by the U.S. with respect to certain consumer goods imported from China.
Global sourcing of many of the products we sell is an important factor in driving higher operating profit. During 2023, we purchased approximately 21% of our products, at cost, directly from overseas vendors, including 13% from vendors located in China. Additionally, a significant amount of our domestically-purchased merchandise is manufactured abroad. Our ability to
10
identify qualified vendors and to access products in a timely and efficient manner is a significant challenge, especially with respect to goods sourced outside of the U.S. Global sourcing and foreign trade involve numerous risks and uncertainties beyond our control, including increased shipping costs, increased import duties, more restrictive quotas, loss of most favored nation trading status, currency and exchange rate fluctuations, work stoppages, transportation delays, economic uncertainties such as inflation, foreign government regulations, political unrest, pandemic diseases, natural disasters, war, terrorism, trade restrictions and tariffs (including retaliation by the U.S. against foreign practices or by foreign countries against U.S. practices), the financial stability of vendors, or merchandise quality issues. U.S. policy on trade restrictions frequently changes and may result in new laws, regulations, or treaties that increase the costs of importing goods and/or limit the scope of available foreign vendors. These and other issues affecting our international vendors could materially adversely affect our business and financial performance.
The majority of our products and components of our products imported from China are currently subject to tariffs and proposed tariffs. As a result, we are continually evaluating the potential impact of the effective and proposed tariffs on our supply chain, costs, sales, and profitability, and are considering strategies to mitigate such impact, including reviewing sourcing options, exploring first sale valuation strategies, filing requests for exclusion from the tariffs with the U.S. Trade Representative for certain product lines, and working with our vendors and merchants. Given the volatility and uncertainty regarding the scope and duration of these tariffs, as well as the potential for additional trade actions by the U.S. or other countries, the impact on our operations and results is uncertain and could be significant. We can provide no assurance that any strategies we implement to mitigate the impact of such tariffs or other trade actions will be successful. To the extent that our supply chain, costs, sales, or profitability are negatively affected by the tariffs or other trade actions, our business, financial condition and results of operations may be materially adversely affected.
Our inability to properly manage our inventory levels and offer merchandise that meets changing customer demands may materially impact our business and financial performance.
We must maintain sufficient inventory levels to successfully operate our business. However, we also must seek to avoid accumulating excess inventory to maintain appropriate in-stock levels based on evolving customer demands. We obtain approximately 21% of our merchandise directly from vendors outside of the U.S. These foreign vendors often require us to order merchandise and enter into purchase order contracts for the purchase of such merchandise well in advance of the time we offer these products for sale. As a result, we may experience difficulty in rapidly responding to a changing retail environment, which makes us vulnerable to changes in price and in consumer preferences. In addition, we attempt to maximize our operating profit and operating efficiency by delivering proper quantities of merchandise to our stores in a timely manner. If we do not accurately anticipate future demand for a particular product or the time it will take to replenish inventory levels, our inventory levels may not be appropriate and our results of operations may be negatively impacted.
In addition, maintaining sufficient inventory levels involves relying on our vendors to timely deliver merchandise in the quantities we ordered. In November 2022, United Furniture Industries, Inc. (“UFI”) unexpectedly and without notice to us ceased operations and terminated its employees. Furniture products supplied by UFI to the Company represented approximately 6% of our merchandise purchases in 2022. By the end of 2023, we have fully mitigated the impact of UFI’s closure, but the closure did have an adverse impact on our operations in both 2022 and 2023. We cannot provide any assurance that our vendors will timely deliver the merchandise we have ordered from them and their failure to do so could adversely impact our results of operations.
If we are unable to successfully appeal to and engage with our target consumers, our business and financial performance may be materially and adversely affected.
We operate in the consumer retail industry through brick-and-mortar stores and digitally through an e-commerce platform. As a result, our success depends on, among other things, our ability to identify and successfully market products through various channels that appeal to our current and future target customer segments, align our offerings with consumer preferences and maintain favorable perceptions of our brand image by our target customers. If we are unable to successfully appeal to and engage with our target customers, our business and results of operations may be materially and adversely affected.
If we are unable to maintain or upgrade our information technology or computer systems or if such systems are damaged or cease to function properly, our operations may be disrupted or become less efficient.
We depend on a variety of information technology and computer systems for the efficient functioning of our business. We rely on certain hardware, telecommunications and software vendors to maintain and periodically upgrade many of these systems so that we can continue to support our business. Various components of our information technology and computer systems, including hardware, networks, and software, are licensed to us by third party vendors. We rely extensively on our information
11
technology and computer systems to process transactions, summarize results, and manage our business, including management and distribution of our inventory. Our information technology and computer systems are subject to damage or interruption from power outages, computer and telecommunications failures, computer viruses, cyberattacks or other security breaches, obsolescence, catastrophic events and extreme weather conditions such as fires, floods, earthquakes, tornados and hurricanes, acts of war or terrorism, and usage errors by our employees or our contractors. In recent years, we have begun using vendor-hosted solutions for certain of our information technology and computer systems, which are more exposed to telecommunication failures.
If our information technology or computer systems are damaged or cease to function properly, we may have to make a significant investment to fix or replace them, and we may suffer loss of critical data and interruptions or delays in our operations as a result. Any material interruption experienced by our information technology or computer systems could negatively affect our business and results of operations. Costs and potential interruptions associated with the implementation of new or upgraded systems and technology or with maintenance or adequate support of our existing systems could disrupt or reduce the efficiency of our business.
If we are unable to retain existing and/or secure suitable new store locations under favorable lease terms, our financial performance may be negatively affected.
We lease almost all of our stores, and a significant number of the store leases expire or are up for renewal each year, as noted below in “Item 2. Properties” and in MD&A in this Form 10-K. Our strategy to improve our financial performance includes increasing sales while managing the occupancy cost of each of our stores. A primary component of our sales growth strategy is increasing our comparable store sales, which requires renewing many leases each year. Additional components of our sales growth strategy include opening new store locations, either as an expansion in an existing market or as an entrance into a new market, and relocating certain existing stores to new locations within existing markets. If we are unable to negotiate favorable lease renewals and/or new store leases under unfavorable lease terms or at all, our financial position, results of operations, and liquidity may be negatively affected.
Shareholder activism could result in potential operational disruption, divert our resources and management’s attention and have an adverse effect on our business.
Shareholder activism, which may arise in various forms and situations, could divert management’s attention from its current strategies, require us to incur substantial legal, consulting, and public relations fees, and could result in potential operational disruption. Further, any perceived uncertainties as to our future direction and control could result in the loss of potential business opportunities and may make it more difficult to attract and retain qualified employees, any of which could adversely affect our business and operating results. Any perceived uncertainties could also adversely affect the price and volatility of our stock.
Market and Competitive Risks
Further deterioration in general economic conditions, disposable income levels, and other conditions, such as inflation, unseasonable weather, pandemic diseases, or global events, could lead to reduced consumer demand for our merchandise, and materially adversely affect our revenues and gross margin.
Our results of operations are directly and materially impacted by the health of the U.S. economy. Our business and financial performance may be adversely impacted by current and future economic conditions, including factors that may restrict or otherwise negatively impact consumer financing, disposable income levels, unemployment levels, energy costs and interest rates, recession, inflation, and other matters, such as tax reform, natural disasters, climate change, pandemic diseases, wars, or terrorist activities, that influence consumer spending. Specifically, our Soft Home, Hard Home and Other, Furniture and Seasonal merchandise categories are threatened when disposable income levels are negatively impacted by economic conditions. In 2022 and 2023, the U.S. experienced historically high inflation, which together with general economic conditions, negatively impacted disposable income levels, the discretionary spending of our customers and our business and results of operation. If inflation remains at historically high levels and/or general economic conditions further deteriorate, disposable income levels, discretionary spending and our business and results of operations could be materially adversely affected.
Additionally, the net sales of cyclical product offerings in our Seasonal category may be threatened when we experience extended periods of unseasonable or extreme weather, including unseasonable weather caused by climate change. Inclement weather can also negatively impact our Furniture category, as many customers transport the product home personally. In particular, the economic conditions and weather patterns of four states (California, Texas, Florida, and Ohio) are important as approximately 31% of our current stores operate and 32% of our 2023 net sales occurred in these states.
12
If we are unable to compete effectively in the highly competitive discount retail industry, our business and results of operations may be materially adversely affected.
The discount retail industry, which includes both traditional brick and mortar stores and online marketplaces, is highly competitive. As discussed in Item 1 of this Form 10-K, we compete for customers, products, employees, real estate, and other aspects of our business with a number of other companies. Some of our competitors have broader distribution (e.g., more stores and/or a more established online presence), and/or greater financial, marketing, and other resources than us. It is possible that increased competition, significant discounting, improved performance by our competitors, an inability to distinguish our brand from our competitors, or failure to effectively promote our brand image to younger generations may reduce our market share, gross margin, and operating margin, and may materially adversely affect our business and results of operations.
If we are unable to compete effectively in the omnichannel retail marketplace, our business and results of operations may be materially adversely affected.
Competition from other retailers in the online retail marketplace is intense and growing. Certain of our competitors, including several pure online retailers, have established online operations that we compete against for customers and products. It is possible that the competition in the online retail space may reduce our market share, gross margin, and operating margin, and may materially adversely affect our business and results of operations in other ways. Our operations include an e-commerce platform with multiple fulfillment options to enhance our omnichannel experience. Operating an e-commerce platform is a complex, rapidly evolving and expensive undertaking. We must keep pace with changing customer expectations and new developments. There is no guarantee that the resources we have applied to this effort will increase revenues or improve operating performance. If our online retailing initiatives do not meet our customers’ expectations, the initiatives may reduce our customers’ desire to purchase goods from us both online and at our brick and mortar stores and may materially adversely affect our business and results of operations.
In addition, customers routinely use technology and digital platforms to rapidly compare products and prices and purchase products, among other things. Once purchased, customers seek various delivery options for those products. Customers often expect quick, timely, and low-price or free delivery and/or convenient pickup options. We must anticipate and adapt to these purchasing process changes.
Further, more online sales with direct fulfillment or curbside pickup may reduce the amount of in-store traffic, which could reduce the opportunities for cross-selling of merchandise in-store and could reduce our overall sales.
Fluctuation in commodity prices, including but not limited to diesel fuel and other fuels used by utilities to generate power, could materially adversely impact our gross margin and operating profit.
Transporting merchandise, supplies, fixtures, and other materials to and from our distribution centers and stores requires significant volumes of diesel fuel and other fuels. As a result, fluctuations in the prices of diesel fuel and other fuels, including increases in fuel prices, directly impact the carrying cost of inventory, the cost of outbound transportation from our distribution centers to our stores, and the cost to transport other materials and supplies. Additionally, we consume significant volumes of electricity and natural gas to heat, cool, and operate equipment in our stores and distribution centers. Our utility providers depend on various fuels to generate and transport electricity and natural gas, the cost of which is typically passed through to us as the consumer. A rise in the cost of diesel fuels and other fuels, including fuels used to generate and transport electricity and natural gas could materially adversely impact our gross margins and our operating profit.
Cybersecurity Risks
If we are unable to secure customer, employee, vendor and/or company data, our systems could be compromised, our reputation could be damaged, and we could be subject to penalties or lawsuits.
In the normal course of business, we process and collect relevant data about our customers, employees and vendors. The protection of our customer, employee, vendor and company data and information is critical to us. We have implemented policies, procedures and technologies designed to safeguard our customers’ debit and credit card information and other private data, our employees’ and vendors’ private data, and our records and intellectual property. We utilize third-party service providers in connection with certain technology related activities, including credit card processing, website hosting, data encryption and software support. We require these providers to take appropriate measures to secure such data and information and assess their ability to do so.
13
Despite our policies, technologies and other information security measures, we cannot be certain that our information technology systems or the information technology systems of our third-party service providers are preventing, containing, or detecting, or will be able to prevent, contain or detect all cyberattacks, cyberterrorism, or security breaches. As evidenced by other retailers who have suffered serious security breaches, we may be vulnerable to data security breaches and data loss, including cyberattacks. A material breach of our security measures or our third-party service providers’ security measures, the misuse of our customer, employee, vendor and company data or information or our failure to comply with applicable privacy and information security laws and regulations could result in the exposure of sensitive data or information, attract a substantial amount of negative media attention, damage our customer or employee relationships and our reputation and brand, distract the attention of management from their other responsibilities, subject us to government enforcement actions, private litigation, penalties and costly response measures, and result in lost sales and a reduction in the market value of our common shares. While we have taken actions to mitigate our financial and operational risk, in the event we experience a material data or information security breach, our protection may not be sufficient to cover the impact to our business.
In addition, the data and information security and privacy regulatory environment is increasingly demanding, as new and revised requirements are frequently imposed across our business. Compliance, or failure to comply, with more demanding privacy and information security laws and standards may result in significant expense due to increased investment in technology, development of new operational processes, and exposure to litigation or regulatory action.
Human Capital Risks
If we are unable to attract, train, and retain highly qualified associates while also controlling our labor costs, our financial performance may be negatively affected.
Our customers expect a positive shopping experience, which is driven by a high level of customer service from our associates and a quality presentation of our merchandise. Additionally, our customers expect merchandise to be in stock in our stores and online, which is partially driven by the timely delivery of merchandise from our distribution centers to our stores. To grow our operations and meet the needs and expectations of our customers, we must attract, train, and retain a large number of highly qualified associates, and also control labor costs. We compete with other retail businesses for many of our associates and many of our store and distribution center positions have historically had high turnover rates, which can increase training and retention costs. In addition, our ability to control labor costs is subject to numerous external factors, including the availability of a sufficient number of qualified persons in the work force, prevailing wage rates, the impact of federal, state, or local minimum wage legislation, the impact of legislation or regulations governing labor relations or benefits, and health insurance costs.
We have experienced significant turnover in our senior management team, and our loss of additional members of our senior management team or our failure to attract and retain qualified personnel, skilled workers and key officers could have an adverse effect on us.
We have recently experienced significant turnover in our senior management team and have promoted employees to fill certain key roles. Our business may be adversely affected by such turnover and the transitions in our senior management team and turnover at the senior management level may create instability within the Company, which could disrupt and impede our day-to-day operations, internal controls and our ability to fully implement our business plan and growth strategy. In addition, management transition inherently causes some loss of institutional knowledge, which can negatively affect strategy and execution, and our results of operations and financial condition could be negatively impacted as a result. Competition for key management personnel is intense. If we fail to successfully attract, train and retain senior management with the appropriate expertise, we could experience increased employee turnover and harm to our business, results of operations, cash flow and financial condition. Like most businesses, our employees are important to our success and we are dependent in part on our ability to retain the services of our key management, operational, compliance, finance, administrative and store associate personnel.
Regulatory and Legal Liability Risks
Changes in federal or state legislation and regulations, including the effects of legislation and regulations on product safety and hazardous materials, could increase our cost of doing business and adversely affect our operating performance.
New federal or state legislation, including new product safety and hazardous material laws and regulations, may negatively impact our operations, increase our cost of doing business and adversely affect our operating performance. Changes in product safety legislation or regulations may lead to product recalls and the disposal or write-off of merchandise, as well as fines or penalties and reputational damage. If our merchandise and food products do not meet applicable governmental safety standards
14
or our customers’ expectations regarding quality or safety, we could experience lost sales, increased costs, reputational damage, and increased legal risk.
In addition, if we discard or dispose of our merchandise, particularly merchandise which is non-salable, inconsistently with applicable waste management standards, we could expose ourselves to certain fines and litigation costs related to hazardous material regulations. Our inability to comply on a timely basis with regulatory requirements, execute product recalls in a timely manner, or consistently implement waste management standards, may result in fines or penalties which could have a material adverse effect on our financial results. In addition, negative customer perceptions regarding the safety of the products we sell could cause us to lose market share to our competitors. If this occurs, it may be difficult for us to regain lost sales.
We are subject to periodic litigation and regulatory proceedings, including Fair Labor Standards Act, state wage and hour, and shareholder class action lawsuits, which may adversely affect our business and financial performance.
From time to time, we are involved in litigation and regulatory actions, including various collective, class action or shareholder derivative lawsuits that may be brought against us for alleged violations of the Fair Labor Standards Act, state wage and hour laws, sales tax and consumer protection laws, False Claims Act, federal securities laws and environmental and hazardous waste regulations among others. Due to the inherent uncertainties of litigation, we may not be able to accurately determine the impact on us of any future adverse outcome of such proceedings. The ultimate resolution of these matters could have a material adverse impact on our financial condition, results of operations, and liquidity. In addition, regardless of the outcome, these proceedings could result in substantial cost to us and require us to devote substantial attention and resources to defend ourselves. For a description of certain current legal proceedings, see Note 9 to the accompanying consolidated financial statements.
We may be adversely affected by legal, regulatory or market responses to climate change.
Growing concern over climate change has led policy makers in the U.S. to consider the enactment of legislative and regulatory proposals that would impose mandatory requirements on greenhouse gas emissions. Such laws, if enacted, are likely to impact our business in a number of ways. For example, we use natural gas, diesel fuel, gasoline and electricity in conducting our operations. Increased government regulations to limit carbon dioxide and other greenhouse gas emissions may result in increased compliance costs and legislation or regulation affecting energy inputs, which could materially affect our profitability. Compliance with any new or more stringent laws or requirements, or stricter interpretations of existing laws, could require additional expenditures by us or our suppliers. Our inability to appropriately respond to such changes could adversely impact our business, financial condition, results of operations or cash flows.
Our current insurance program may expose us to unexpected costs and negatively affect our financial performance.
Our insurance coverage is subject to deductibles, self-insured retentions, limits of liability and similar provisions that we believe are prudent based on our overall operations. We may incur certain types of losses that we cannot insure or that we believe are not economically reasonable to insure, such as losses due to acts of war, employee and certain other crime, some natural disasters, and pandemic diseases. If we incur these losses and they are material, our financial condition and results of operations could suffer. Certain material events may result in sizable losses for the insurance industry and adversely impact the availability of adequate insurance coverage or result in excessive premium increases. To offset negative cost trends in the insurance market, we may elect to self-insure, accept higher deductibles or reduce the amount of coverage in response to these market changes. In addition, we self-insure a significant portion of expected losses under our workers’ compensation, general liability, including automobile, and group health insurance programs. Unanticipated changes in any applicable actuarial assumptions and management estimates underlying our recorded liabilities for these self-insured losses, including potential increases in medical and indemnity costs, could result in significantly different expenses than expected under these programs, which could have a material adverse effect on our financial condition and results of operations. Although we continue to maintain property insurance for catastrophic events, we are self-insured for losses up to the amount of our deductibles. If we experience a greater number of self-insured losses than we anticipate, our financial performance could be adversely affected.
Financial Risks
If we are unable to comply with the terms of the 2022 Credit Agreement and/or the Term Loan Facility, our capital resources, financial condition, results of operations, and liquidity may be materially adversely affected.
We borrow funds under our $900 million five-year asset-based revolving credit facility (as amended, the “2022 Credit Agreement”), from time to time depending on operating or other cash flow requirements. In addition, on April 18, 2024 we entered into a Credit Agreement (the “Term Loan Facility”) that provides for a “first in, last out” delayed draw term loan facility in an aggregate committed amount of up to $200 million.
15
The 2022 Credit Agreement and the Term Loan Facility contain customary affirmative and negative covenants (including, where applicable, restrictions on our ability to, among other things, incur additional indebtedness, pay dividends, redeem or repurchase stock, prepay certain indebtedness, make certain loans and investments, dispose of assets, enter into restrictive agreements, engage in transactions with affiliates, modify organizational documents, incur liens and consummate mergers and other fundamental changes) and events of default, including a cross default to other material indebtedness. In addition, both the 2022 Credit Agreement and the Term Loan Facility require us to comply with an Excess Availability Covenant (as defined in Note 13 to the accompanying consolidated financial statements). These covenants could impose significant operating and financial limitations and restrictions on us, including restrictions on our ability to enter into particular transactions that we believe are advisable or necessary for our business. Our ability to comply with these covenants and other provisions in the 2022 Credit Agreement and/or the Term Loan Facility may be affected by changes in our operating and financial performance, current general business and economic conditions or changes in those conditions, adverse regulatory developments, or other events beyond our control. A violation of these covenants would result in a default under the 2022 Credit Agreement and/or the Term Loan Facility, which would permit the lenders to restrict our ability to further access the 2022 Credit Agreement and/or the Term Loan Facility for loans and, if applicable, letters of credit and could require the immediate repayment of any outstanding loans under the 2022 Credit Agreement and/or the Term Loan Facility. Our failure to comply with these covenants may have a material adverse effect on our business, financial condition, results of operations, and liquidity. If we are unable to borrow under the 2022 Credit Agreement and/or the Term Loan Facility, we may not have the necessary cash resources for our operations and, if any event of default occurs under the 2022 Credit Agreement and/or the Term Loan Facility, there is no assurance that we would have the cash resources available to repay such accelerated obligations, refinance such indebtedness on commercially reasonable terms, or at all, or cash collateralize our letters of credit, which would have a material adverse effect on our business, financial condition, results of operations and liquidity.
In addition, our ability to borrow under the 2022 Credit Agreement and the Term Loan Facility is limited by the amount of the applicable borrowing base under each facility. The borrowing base under the Term Loan Facility is calculated based on specified percentages of eligible inventory (including in-transit inventory), credit card receivables, real estate, fixtures, machinery and equipment, subject to customary exceptions and reserves. The borrowing base under the 2022 Credit Agreement is calculated based on specified percentages of eligible inventory (including in-transit inventory) and credit card receivables, subject to customary exceptions and reserves, including the Term Pushdown Reserve (as defined in Note 13 to the accompanying consolidated financial statements).
Any negative impact on the elements of our borrowing bases, including a further decline in our business, could reduce our borrowing capacity under the 2022 Credit Agreement and/or the Term Loan Facility, which could have a material adverse effect on our business, financial condition, results of operations, and liquidity.
We may be unable to generate sufficient cash flow to satisfy our debt service obligations, which could have a material adverse effect on our business, financial condition and results of operations.
Our ability to make principal and interest payments when due, or refinance our indebtedness will depend on, among other things, our ability to generate cash in the future and other factors that affect our financial and operating performance including economic conditions and other financial, competitive, legislative, regulatory, tax and other factors, many of which are beyond our control. If our business does not generate sufficient cash flow from operations, in the amounts projected (which are based on a number of assumptions which involve significant judgments and estimates of future performance, borrowing capacity and credit availability) or at all, or if future borrowings are not available to us in amounts sufficient to fund our liquidity needs, our business, financial condition and results of operations could be materially adversely affected. There can be no assurance that our cash flow from operations and other internal and external sources of liquidity will at all times be sufficient for our cash requirements. If we cannot generate sufficient cash flow from operations to make scheduled principal and interest payments, we may need to refinance all or a portion of our indebtedness on or before maturity, sell assets, delay capital expenditures, seek additional debt or equity or take other actions. There can be no assurance that any of these actions would be successful. In addition, our ability to obtain any additional financing or refinance any of our indebtedness would depend on many factors, including our existing level of indebtedness and restrictions imposed by our indebtedness, historical business performance, financial projections, the value and sufficiency of collateral, prospects and creditworthiness, external economic conditions and general liquidity in the credit and capital markets. The terms of the 2022 Credit Agreement, the Term Loan Facility, or future debt agreements may also restrict us from effecting any of these alternatives without an amendment or consent which may not be obtainable. Further, changes in the credit and capital markets, including market disruptions and interest rate fluctuations, may increase the cost of financing, make it more difficult to obtain favorable terms, or further limit or restrict our access to these sources of future liquidity. Our inability to obtain additional financing or refinance any of our indebtedness on commercially reasonable terms or at all or to effect any other action relating to our indebtedness on satisfactory terms or at all could have a material adverse effect on our business, financial condition and results of operations.
16
Because we do not intend to pay cash dividends in the near term, stockholders may not receive any return on investment unless they are able to sell their common stock for a price greater than their purchase price, and we cannot guarantee that we will continue to repurchase our common stock pursuant to our stock repurchase program.
The continued operation and expansion of our business will require substantial funding. Accordingly, we do not anticipate that we will pay any cash dividends on shares of our common stock in the near term. Any determination to pay dividends in the future will be at the discretion of our Board of Directors and will depend upon results of operations, financial condition, contractual restrictions, including those under agreements governing our existing indebtedness, any potential future indebtedness we may incur, restrictions imposed by applicable law and other factors our Board of Directors deems relevant. Accordingly, if stockholders purchase shares of our common stock, a gain on investment will depend on an increase in the price of our stock, which may never occur.
Furthermore, although our Board of Directors has authorized a share repurchase program, we are not obligated to make any purchases under the program and we may discontinue it at any time. For example, during Fiscal 2020 we temporarily suspended our share repurchase program in response to uncertainty caused by the COVID-19 pandemic. We have not made any repurchases under our share repurchase program since the fourth quarter of 2021.
A continued increase in operating losses or failure to achieve forecasted results may impair our ability to realize the value of our long-lived assets.
We are required by accounting rules to periodically assess our property and equipment, operating lease right-of-use assets, and intangible assets for impairment and recognize an impairment loss, if necessary. In performing these assessments, we use our historical financial performance to determine whether we have potential impairments or valuation concerns and as evidence to support our assumptions about future financial performance. A significant decline in our financial performance could negatively affect the results of our assessments of the recoverability of our property and equipment, operating lease right-of-use assets, deferred tax assets, and our intangible assets and trigger the impairment of these assets. For example, we incurred $68.4 million and $148.5 million of impairments relating to underperforming stores in 2022 and 2023, respectively. Impairment charges taken against property and equipment, operating lease right-of-use assets, and intangible assets could be material and could have a material adverse impact on our capital resources, financial condition, results of operations, and liquidity. In 2023, we also recorded a valuation allowance of $146.0 million against our deferred tax assets (see Note 8 - Income Taxes for more information on the valuation allowance). Failure to achieve forecasted results could have a material adverse impact on the recoverability of these deferred tax assets.
Other Risks
We also may be subject to a number of other factors which may, individually or in the aggregate, materially adversely affect our business, capital resources, financial condition, results of operations and liquidity. These factors include, but are not limited to:
•Changes in governmental laws, case law and regulations, including changes that increase our effective tax rate, comprehensive tax reform, or other matters related to taxation;
•Changes in accounting standards, including new interpretations and updates to current standards;
•Events or circumstances could occur which could create bad publicity for us or for the types of merchandise offered in our stores which may negatively impact our business results including our sales;
•Infringement of our intellectual property, including the Big Lots trademarks, could dilute their value; and
•Other risks described from time to time in our filings with the SEC.
Item 1B. Unresolved Staff Comments
None.
17
Item 1C. Cybersecurity
Risk Management and Strategy
The Company has developed an information security program for assessing, identifying and managing material risks from cybersecurity threats. The program includes policies and procedures that govern how the Company’s security measures and controls are developed, implemented, and maintained. The Company conducts a cybersecurity risk assessment, based on a method and guidance from a recognized national standards organization, at least annually. The Company selects the security controls it uses to address cybersecurity risks based on its annual risk assessment, additional risk-based analysis performed by the Company and its evaluation of various factors, including the likelihood and severity of risk, the impact on the Company and others if a risk materializes, the feasibility and cost of controls, and the impact of controls on operations and others. Security controls used by the Company include endpoint threat detection and response (EDR), identity and access management (IAM), privileged access management (PAM), logging and monitoring involving the use of security information and event management (SIEM), multi-factor authentication (MFA), firewalls and intrusion detection and prevention, and vulnerability and patch management.
The Company engages third-party security firms to provide or operate some of these security controls and technology systems. For example, third parties conduct assessments such as vulnerability scans and penetration testing. The Company uses a variety of processes to address cybersecurity threats related to the use of third-party technology and services, including pre-acquisition diligence, imposition of contractual obligations, and performance monitoring.
The Company has a written incident response plan and periodically conducts tabletop exercises to enhance incident response preparedness. The Company also maintains business continuity and disaster recovery plans to prepare for a potential disruption in technology. The Company is a member of an industry cybersecurity intelligence and risk sharing organization. Employees undergo security awareness training when hired and at least semi-annually thereafter.
The Company has an Enterprise Risk Management (ERM) function to address enterprise risks, including cybersecurity. ERM is led by our Enterprise Risk Council, which consists of members of the CEO’s staff. The Risk Council oversees the design and execution of the ERM function to allow for the identification, assessment, prioritization, management, monitoring and reporting of material risks. This includes an annual risk assessment and quarterly updates of the risk profile given current operating conditions. The Risk Council meets quarterly and provides reporting to the Board of Directors and relevant Board Committees given the nature of specific risks identified, which includes cybersecurity risk.
The Company may not be able to fully, continuously, and effectively implement security controls as intended. As described above, we utilize a risk-based approach and judgment to determine the security controls we implement and it is possible that we may not implement appropriate controls if we do not recognize or underestimate a particular risk. In addition, security controls, no matter how well designed or implemented, may only mitigate and not fully eliminate risks. Events, when detected by security tools or third parties, may not always be immediately understood or acted upon.
Governance.
Our Chief Information Security Officer (CISO) has primary responsibility for the development, operation, and maintenance of our information security program, including assessing and managing risk from cybersecurity threats. The Company’s CISO has 30 years of information technology experience, with 17 years focused specifically on information security and risk management. He combines organizational management and leadership skills with a high degree of technical knowledge, the result of hands-on information technology and security experience.
The CISO provides regular security updates to key members of our management team, quarterly Audit Committee briefings, and ad-hoc security updates if a situation requires. Security Risk Assessment results are provided to both the Enterprise Risk Council as well as the Audit Committee as part of the quarterly briefings. The Board of Directors has delegated oversight of the information security program to the Audit Committee.
The Company is not aware of any cybersecurity threat or any material cybersecurity data breach to date, including as a result of any previous cybersecurity incidents, that has materially affected or is reasonably likely to materially affect us, including our business strategy, results of operations, or financial condition.
18
Item 2. Properties
Retail Operations
All of our stores are located in the U.S., predominantly in strip shopping centers, and have an average store size of approximately 33,477 square feet, of which an average of 23,177 is selling square feet. Our physical facilities used for our retail operations, warehouse and distribution, and corporate offices are suitable for the purposes for which they were designed. For additional information about the properties in our retail operations, see the discussion under the caption “Real Estate” in “Item 1. Business” and under the caption “Operating Strategy - Real Estate” in MD&A in this Form 10-K.
The average capital expenditures invested to open a new store in a leased facility during 2023 was approximately $1.0 million, which includes the cost of construction and fixtures, excludes any landlord-provided funding, and reflects the benefit of lower capital expenditures at certain of our stores where our landlord completed construction. All of our stores are leased, except for one store we own in each of California, New Mexico, and Ohio.
Additionally, we own two closed sites which we are not currently operating and are available for sale. Since these owned sites are no longer operating as active stores, they are excluded from our store counts at February 3, 2024. In the third quarter of 2023, we completed the sale of 23 owned store locations in sale and leaseback transactions (see Note 10 to the accompanying consolidated financial statements for additional information on the sale of real estate). In 2023, separate from the sale and leaseback transactions, the Company completed the sale of three owned store locations that were classified as held for sale at the end of fiscal 2022 (see Note 2 to the accompanying consolidated financial statements for more information on the sale of real estate).
Store leases generally obligate us for fixed monthly rental payments plus the payment, in most cases, of our applicable portion of real estate taxes, common area maintenance costs (“CAM”), and property insurance. Some leases require the payment of a percentage of sales in addition to minimum rent. Such payments generally are required only when sales exceed a specified level. Our typical store lease is for an initial minimum term of approximately ten years with multiple five-year renewal options. 20 of our store leases have sales termination clauses that allow us to exit the location at our option if we do not achieve certain sales volume results. An additional 21 store leases have generic early termination clauses that allow us to exit the location upon providing sufficient notice to the landlord.
The following table summarizes the number of store lease expirations in each of the next five fiscal years and the total thereafter. As stated above, many of our store leases have renewal options. The table also includes the number of leases that are scheduled to expire each year that do not have a renewal option. The table includes leases for five stores with more than one lease (e.g., store lease and land lease) and one lease for a store not yet open, and excludes two month-to-month leases.
| Fiscal Year: | Expiring Leases | Leases Without Options | |||||||||
| 2024 | 172 | 31 | |||||||||
| 2025 | 212 | 31 | |||||||||
| 2026 | 245 | 46 | |||||||||
| 2027 | 171 | 40 | |||||||||
| 2028 | 214 | 39 | |||||||||
| Thereafter | 377 | 24 | |||||||||
Warehouse and Distribution
At February 3, 2024, we leased and operated approximately 9.0 million square feet of distribution center and warehouse space in five regional distribution facilities strategically located across the U.S. The regional distribution centers utilize warehouse management technology, which we believe enables accurate and efficient processing of merchandise from vendors to our retail stores. The combined output of our regional distribution centers was approximately 1.7 million merchandise cartons per week in 2023. Certain vendors deliver merchandise directly to our stores when it supports our operational goal to deliver merchandise from our vendors to the sales floor in the most efficient manner. We operate an e-commerce fulfillment center out of our Columbus, OH warehouse. To supplement our Columbus, OH e-commerce fulfillment center, we fulfill direct-ship e-commerce orders from 66 of our store locations, which we strategically selected based on geographic location, size, and other relevant
19
factors. In addition, we began direct shipping a limited assortment out of our distribution center in California to further supplement e-commerce orders.
Distribution centers and warehouse space, and the corresponding square footage of the regional distribution centers, by location at February 3, 2024, were as follows:
| Location | Year Opened | Total Square Footage | Number of Stores Served | ||||||||
| (Square footage in thousands) | |||||||||||
| Columbus, OH | 1989 | 3,559 | 338 | ||||||||
| Montgomery, AL | 1996 | 1,411 | 315 | ||||||||
| Tremont, PA | 2000 | 1,295 | 302 | ||||||||
| Durant, OK | 2004 | 1,297 | 227 | ||||||||
| Apple Valley, CA | 2019 | 1,416 | 210 | ||||||||
| Total | 8,978 | 1,392 | |||||||||
During 2023, we ceased all business operations at our FDCs and subleased our McDonough, GA and Merrillville, IN FDC locations. We terminated the lease for the FDC located in Lacey, WA and are actively marketing the remaining FDC for sublease.
For more information regarding our warehouse and distribution centers, see the discussion under the caption “Warehouse and Distribution” in “Item 1. Warehouse and Distribution” of this Form 10-K. We will continue to evaluate our supply chain needs based on projected purchasing volumes and adjust the capacity of our distribution and fulfillment network accordingly.
Corporate Office
We own a facility in Columbus, Ohio that serves as our corporate headquarters.
Item 3. Legal Proceedings
For information regarding certain legal proceedings to which we have been named a party or are subject, see Note 9 to the accompanying consolidated financial statements.
Item 4. Mine Safety Disclosures
None.
20
Supplemental Item. Information about our Executive Officers
Our executive officers at April 18, 2024 were as follows:
| Name | Age | Offices Held | Officer Since | ||||||||
| Bruce K. Thorn | 56 | President and Chief Executive Officer | 2018 | ||||||||
| Jonathan E. Ramsden | 59 | Executive Vice President, Chief Financial Officer and Chief Administrative Officer | 2019 | ||||||||
| Ronald A. Robins, Jr. | 60 | Executive Vice President, Chief Legal and Governance Officer, General Counsel and Corporate Secretary | 2015 | ||||||||
| Michael A. Schlonsky | 57 | Executive Vice President, Chief Human Resources Officer | 2000 | ||||||||
Bruce K. Thorn is our President and Chief Executive Officer. Before joining Big Lots in September 2018, he served as President and Chief Operating Officer of Tailored Brands, Inc., a specialty retailer of men’s tailored clothing and formal wear, from 2015 to 2018. Mr. Thorn also held various enterprise-level roles with PetSmart, Inc., most recently as Executive Vice President, Store Operations, Services and Supply Chain, as well as leadership positions with Gap, Inc., Cintas Corp, LESCO, Inc. and The United States Army. Mr. Thorn also serves on the board of directors of Caleres, Inc.
Jonathan E. Ramsden is responsible for financial reporting and controls, financial planning and analysis, treasury, risk management, tax, internal audit, investor relations, real estate, asset protection, and merchandise planning and allocation. Mr. Ramsden joined us in August 2019 as Executive Vice President, Chief Financial Officer and Chief Administrative Officer. Prior to joining us, Mr. Ramsden served for over seven years with Abercrombie & Fitch Co., an apparel retailer, as Chief Financial Officer and then later Chief Operating Officer. Additionally, Mr. Ramsden spent 10 years as Chief Financial Officer of TBWA Worldwide, a global marketing services group, after having served as Controller of TBWA’s parent, Omnicom Group Inc.
Ronald A. Robins, Jr. is responsible for legal affairs, corporate governance and related matters. Mr. Robins was promoted to Executive Vice President in September 2019, and now serves as the Chief Legal and Governance Officer. Prior to that, Mr. Robins served as Senior Vice President, General Counsel and Corporate Secretary since joining us. Prior to joining us, Mr. Robins was a partner at Vorys, Sater, Seymour and Pease LLP and also previously served as General Counsel, Chief Compliance Officer, and Secretary of Abercrombie & Fitch Co.
Michael A. Schlonsky is responsible for talent management and oversight of human resources. He was promoted to Executive Vice President in August 2015, and now serves as the Chief Human Resources Officer. He was promoted to Senior Vice President, Human Resources in August 2012 and promoted to Vice President, Associate Relations and Benefits in 2010. Prior to that, Mr. Schlonsky was promoted to Vice President, Associate Relations and Risk Management in 2005. Mr. Schlonsky joined us in 1993 as Staff Counsel and was promoted to Director, Risk Management in 1998, and to Vice President, Risk Management and Administrative Services in 2000.
21
Our other key employees at April 18, 2024 were as follows:
| Name | Age | Offices Held | ||||||
| John Alpaugh | 58 | Senior Vice President, Chief Marketing Officer | ||||||
| Kristen Cox | 53 | Senior Vice President, Chief Stores Officer | ||||||
| Juan Guerrero | 54 | Senior Vice President, Chief Supply Chain Officer | ||||||
| Kevin Kuehl | 56 | Senior Vice President, General Merchandise Manager of Home and Global Sourcing | ||||||
| Seth Marks | 51 | Senior Vice President, Extreme Value Sourcing, General Merchandise Manager of Food and Consumables | ||||||
| Shelly Trosclair | 58 | Senior Vice President, General Merchandise Manager of Furniture and Seasonal | ||||||
| Matthew Weger | 53 | Senior Vice President, Chief Digital and Technology Officer | ||||||
John Alpaugh is responsible for marketing. Mr. Alpaugh joined the Company in September 2022 as Senior Vice President, Chief Marketing Officer. Prior to joining us, Mr. Alpaugh spent eight years as the CEO of CyberMark, a digital marketing solutions provider to multi-location businesses. Prior to CyberMark, he spent 16 years at Petsmart, where he served in several leadership roles in marketing, specialty merchandising, and strategic planning, and ultimately served four years as Senior Vice President and Chief Marketing Officer. He brings more than 20 years of experience in brand positioning and launch, enterprise strategy, customer insights and analytics, e-commerce, market research, and budget management.
Kristen Cox is responsible for store operations and customer engagement. Ms. Cox joined the Company in December 2023 as Senior Vice President, Chief Stores Officer. Prior to joining us, Ms. Cox spent the last six and a half years at Burlington Stores, an off-price department store retailer, where she most recently served as Senior Vice President of Human Resources for all stores and Senior Vice President of Northeast and Midwest stores. Ms. Cox also previously served as the Executive Vice President of Stores for Macy’s Inc. capping a total of 14 years in leadership positions.
Juan Guerrero is responsible for supply chain and logistics. Mr. Guerrero joined the Company in August 2023 as Senior Vice President, Chief Supply Chain Officer. Prior to joining us, Mr. Guerrero spent three years as the Senior Vice President, Supply Chain, for Bed Bath & Beyond. Prior to Bed Bath & Beyond, Mr. Guerrero spent two years as the Senior Vice President, Supply Chain of FleetPride. Prior to FleetPride, Mr. Guerrero held several leadership positions in supply chain for Office Depot, Starbucks, and Bloomin’ Brand, a global restaurant company which owns the casual and fine dining chains Outback Steakhouse and Carrabba’s Italian Grill among others.
Kevin Kuehl is responsible for global sourcing for our Home categories. Mr. Kuehl currently serves as the Senior Vice President, General Merchandise Manager of Home and global sourcing. He was promoted to Senior Vice President, General Merchandise Manager in 2019 and promoted to Vice President, Home Textiles in 2014. Prior to joining us, Mr. Kuehl spent four years at Baltic Lien, a textile products company, where he served as President, Home Fashions. Prior to Baltic Linen, he held several leadership roles in merchandising at Sears and Bed Bath & Beyond.
Seth Marks is responsible for the newly created role of extreme value sourcing and is responsible for the Food and Consumables merchandise categories. Mr. Marks leads the strategic deal sourcing initiatives focused on procuring extreme bargains. Mr. Marks rejoined the Company in December 2023 as Senior Vice President, Extreme Value Sourcing. Mr. Marks previously served as our Vice President, Merchandising from 2004 to 2007. Prior to rejoining us, Mr. Marks was the Chief Merchandising Officer of Channel Control Merchants a procurer, processor, and distributor of secondary merchandise. Prior to Channel Control Merchants, he served as CEO of Hilco Wholesale Solutions, the world’s largest liquidation firm, and in senior leadership roles at Overstock.com and Sears Holdings.
Shelly Trosclair is responsible for the Furniture and Seasonal merchandise categories. Ms. Trosclair was recently promoted to Senior Vice President, General Merchandise Manager of Furniture and Seasonal. Ms. Trosclair joined the Company in January 2023 as Vice President, Furniture and Decor. Prior to joining us, Ms. Trosclair spent four years at Tuesday Morning, a home discount goods retailer, where she was most recently served as Senior Vice President, General Merchandise Manager. Prior to Tuesday Morning, she held several leadership roles in merchandising at Ollie’s Bargain Outlet and Burlington Stores, Inc.
Matthew Weger is responsible for technology development, technology platforms, technology infrastructure, information security, and e-commerce. Mr. Weger joined the Company in August 2022 as Senior Vice President, Chief Technology Officer. Prior to joining us, Mr. Weger spent three years as the Chief Information Officer of Abercrombie & Fitch Co., an apparel retailer. Prior to Abercrombie & Fitch Co., he spent twelve years at Safelite Group, a vehicle glass services company, where he served in several leadership roles in information technology.
22
Part II
Item 5. Market for Registrant’s Common Equity, Related Stockholder Matters and Issuer Purchases of Equity Securities
Our common shares are listed on the New York Stock Exchange (“NYSE”) under the symbol “BIG.”
The following table sets forth information regarding our repurchase of common shares during the fourth fiscal quarter of 2023:
| (In thousands, except price per share data) | |||||||||||||||||
| Period | (a) Total Number of Shares Purchased (1)(2) | (b) Average Price Paid per Share (1)(2) | (c) Total Number of Shares Purchased as Part of Publicly Announced Plans or Programs | (d) Approximate Dollar Value of Shares that May Yet Be Purchased Under the Plans or Programs | |||||||||||||
| October 29, 2023 - November 25, 2023 | — | $ | 4.01 | — | $ | 159,425 | |||||||||||
| November 26, 2023 - December 23, 2023 | — | 7.62 | — | 159,425 | |||||||||||||
| December 24, 2023 - February 3, 2024 | 3 | 6.55 | — | 159,425 | |||||||||||||
| Total | 3 | $ | 6.16 | — | $ | 159,425 | |||||||||||
(1) In November 2023, December 2023, and January 2024, in connection with the vesting of certain outstanding restricted stock units, we acquired 549, 50, and 2,797 of our common shares, respectively, which were withheld to satisfy minimum statutory income tax withholdings.
(2) On December 1, 2021, our Board of Directors authorized the repurchase of up to $250 million of our common shares (the “2021 Repurchase Authorization”). During the fourth quarter of 2023, we had no repurchases under the 2021 Repurchase Authorization. At February 3, 2024, the 2021 Repurchase Authorization has $159.4 million of remaining authorization. The 2021 Repurchase Authorization has no scheduled termination date.
At the close of trading on the NYSE on April 12, 2024, there were approximately 893 registered holders of record of our common shares.
23
The following graph and table compares, for the five fiscal years ended February 3, 2024, the cumulative total shareholder return for our common shares, the S&P 500 Index, and the S&P 500 Retailing Index. Measurement points are the last trading day of each of our fiscal years ended February 1, 2020, January 30, 2021, January 29, 2022, January 28, 2023 and February 3, 2024. The graph and table assume that $100 was invested on February 2, 2019, in each of our common shares, the S&P 500 Index, and the S&P 500 Retailing Index and reinvestment of any dividends. The stock price performance on the following graph and table is not necessarily indicative of future stock price performance.
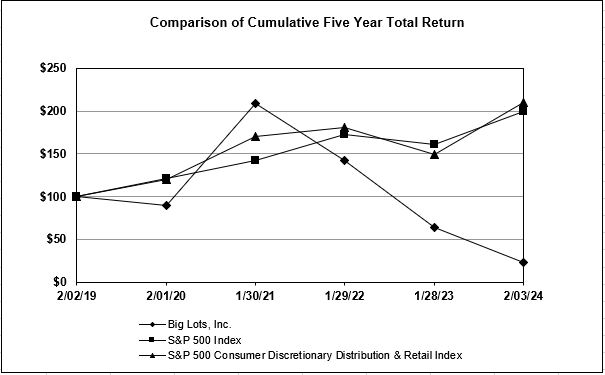
| Base Period | ||||||||||||||||||||
| January | February | January | January | January | February | |||||||||||||||
| Company / Index | 2019 | 2020 | 2021 | 2022 | 2023 | 2024 | ||||||||||||||
| Big Lots, Inc. | $ | 100.00 | $ | 90.13 | $ | 208.77 | $ | 142.58 | $ | 63.48 | $ | 22.42 | ||||||||
| S&P 500 Index | 100.00 | 121.56 | 142.53 | 172.46 | 161.03 | 199.42 | ||||||||||||||
| S&P 500 Retailing Index | $ | 100.00 | $ | 120.61 | $ | 170.52 | $ | 180.58 | $ | 149.54 | $ | 210.02 | ||||||||
Item 6. [Reserved]
24
Item 7. Management’s Discussion and Analysis of Financial Condition and Results of Operations
Overview
The discussion and analysis presented below should be read in conjunction with the accompanying consolidated financial statements and related notes. Please refer to “Item 1A. Risk Factors” of this Form 10-K for a discussion of forward-looking statements and certain risk factors that may have a material adverse effect on our business, financial condition, results of operations, and liquidity.
Our fiscal year ends on the Saturday nearest to January 31, which results in some fiscal years with 52 weeks and some with 53 weeks. Fiscal year 2023 was comprised of 53 weeks, and fiscal years 2022 and 2021 were comprised of 52 weeks. Fiscal year 2024 will be comprised of 52 weeks.
Operating Results Summary
The following are the results from 2023 that we believe are key indicators of our financial condition and results of operations when compared to 2022.
•Net sales decreased $746.2 million, or 13.6%.
•Comparable sales for stores open at least fifteen months, plus our e-commerce operations, decreased $706.3 million, or 13.5%.
•The 53rd week increased net sales by approximately $66.9 million in 2023.
•Gross margin dollars decreased $226.9 million and gross margin rate increased 70 basis points to 35.7% of net sales. The impact of the 53rd week contributed approximately $22.6 million of additional gross margin dollars in 2023.
•Selling and administrative expenses increased $101.6 million to $2,141.9 million. As a percentage of net sales, selling and administrative expenses increased 810 basis points to 45.4% of net sales. Included within the increase in selling and administrative expenses were additional payroll, utilities, maintenance, repairs, and other estimated expenses associated with the 53rd week of approximately $16.1 million in 2023.
•Included within our selling and administrative expenses were non-cash store asset impairment charges and a gain on extinguishment of a lease liability resulting from a lease cancellation related to a previously impaired store of $148.6 million in 2023 compared to $68.4 million, in 2022. Non-cash store asset impairment charges in 2023 increased our diluted loss per share by approximately $4.40 per share. Non-cash store asset impairment charges in 2022 increased our diluted loss per share by approximately $1.79 per share.
•Also included within our selling and administrative expenses in 2023 were lease exit costs associated with our prior synthetic lease of $53.6 million, professional fees related to cost reduction and productivity initiatives of $31.4 million, and contract termination costs and other related expenses associated with the closure of our FDCs of $15.5 million.
•The selling and administrative expenses noted above increased our operating loss by $249.1 million in 2023.
•The Company completed a sale and leaseback transaction with respect to the AVDC and 23 owned store locations in 2023, as well as the sale of three owned store locations that were classified as held for sale at the end of fiscal 2022. These transactions were recorded within the gain on sale of real estate in our consolidated statements of operations and comprehensive loss and resulted in a gain on sale of real estate and related expenses of $212.5 million.
•The Company received aggregate net proceeds, before taxes, on the sales of the AVDC and 23 owned store locations of $332.1 million that were recorded within cash proceeds from sale of property and equipment in our consolidated statement of cash flows.
•Operating loss was $387.4 million in 2023, compared to an operating loss of $261.5 million in 2022.
•Diluted loss per share was ($16.53) in 2023, compared to diluted loss per share of $(7.30) in 2022.
•Long-term debt increased $104.9 million from $301.4 million at the end of 2022 to $406.3 million at the end of 2023. The Company ended 2023 with $281.3 million available under the 2022 Credit Agreement, subject to certain borrowing base limitations, compared to $376.9 million at the end of 2022.
•Inventory decreased $194.6 million, or 17.0%, to $953.3 million.
25
The following table compares components of our consolidated statements of operations as a percentage of net sales:
| 2023 | 2022 | 2021 | |||||||||
| Net sales | 100.0 | % | 100.0 | % | 100.0 | % | |||||
| Cost of sales (exclusive of depreciation expense shown separately below) | 64.3 | 65.0 | 61.0 | ||||||||
| Gross margin | 35.7 | 35.0 | 39.0 | ||||||||
| Selling and administrative expenses | 45.4 | 37.3 | 32.8 | ||||||||
| Depreciation expense | 3.1 | 2.8 | 2.3 | ||||||||
| Gain on sale of real estate | (4.5) | (0.4) | (0.0) | ||||||||
| Operating (loss) profit | (8.2) | (4.8) | 3.9 | ||||||||
| Interest expense | (0.9) | (0.4) | (0.2) | ||||||||
| Other income (expense) | 0.0 | 0.0 | 0.0 | ||||||||
| (Loss) income before income taxes | (9.2) | (5.1) | 3.8 | ||||||||
| Income tax (benefit) expense | 1.1 | (1.3) | 0.9 | ||||||||
| Net (loss) income | (10.2) | % | (3.9) | % | 2.9 | % | |||||
See the discussion below under the caption “2023 Compared To 2022” for additional information regarding the specific components of our operating results. See “Item 7. Management’s Discussion and Analysis of Financial Condition and Results of Operations” included in our Form 10-K for the year ended January 28, 2023 for a comparison of our operating results for 2022 to our operating results for 2021, which was filed with the SEC on March 28, 2023.
In 2023, we recognized a lease payment related to the exit from our prior synthetic lease of $53.6 million. The lease payment increased our operating loss by $53.6 million and increased our diluted loss per share by approximately $1.36 per share. Additionally, in 2023, we recognized termination costs and related expenses for the closure of our FDCs of $23.6 million. These termination costs and related expenses increased our operating loss by $23.6 million and our diluted loss per share by approximately $0.64 per share. In 2023, we also recognized non-cash store asset impairments of $148.6 million related to underperforming stores in our chain, which included impairments of both operating lease right-of-use assets and property and equipment. The store asset impairment charges increased our operating loss by $148.6 million and our diluted loss per share by approximately $4.40 per share. In 2023, we also recognized a gain on sale of real estate and related expenses of $212.5 million related to the sale and leaseback transactions for the AVDC and 23 owned store locations as well as the sale of three owned store locations that were classified as held for sale at the end of fiscal 2022. The gain on sale of real estate and related expenses decreased our operating loss by $212.5 million and our diluted loss per share by approximately 7.22 per share. In 2023, we also recognized professional fees related to Project Springboard, our cost reduction and productivity initiative, of $31.4 million. The professional fees related to Project Springboard increased our operating loss by $31.4 million and our diluted loss per share by approximately $1.03 per share. In 2023, we also recognized a valuation allowance on deferred tax assets of $146.0 million. The valuation on deferred tax assets increased our income tax expense by $146.0 million and our diluted loss per share by approximately $5.01 per share. See Note 2, Note 4, Note 5, Note 8 and Note 10 to the accompanying consolidated financial statements for additional information on store asset impairment charges, the lease payment related to the exit of our prior synthetic lease, valuation allowance on deferred tax assets and gain on sale of real estate and related expenses in 2023.
In 2022, we recognized non-cash store asset impairments of $68.4 million related to underperforming stores in our chain, which included impairments of both operating lease right-of-use assets and property and equipment. The store asset impairment charges increased our operating loss by $68.4 million and increased our diluted loss per share by approximately $1.79 per share.
In 2022, we also recognized a gain on sale of real estate and related expenses of $16.8 million related to the sale of 20 owned store locations and one unoccupied land parcel. The gain on sale of real estate and related expenses decreased our diluted loss per share by approximately $0.44 per share. See Note 2, Note 4 and Note 9 to the accompanying consolidated financial statements for additional information on the store asset impairment charges and gain on sale of real estate and related expenses in 2022.
26
In 2021, we recognized non-cash store asset impairments of $5.0 million related to underperforming stores in our chain, which included impairments of both operating lease right-of-use assets and property and equipment. The store asset impairment charges decreased our operating profit by $5.0 million and decreased our diluted earnings per share by approximately $0.11 per share. See Note 2 and Note 9 to the accompanying consolidated financial statements for additional information on the store asset impairment charges in 2021.
Operating Strategy
In 2019, the Company completed a comprehensive review of its operating strategy. The outcome of the review was a multi-year plan for a strategic transformation, which we refer to as “Operation North Star.” While the three primary objectives of Operation North Star have remained the same, our strategic focus under Operation North Star has evolved into five key actions to return our business to growth and prosperity.
Operation North Star
Operation North Star has three primary objectives:
•Drive profitable long-term growth;
•Fund the journey; and
•Create long-term shareholder value.
Five Key Actions
•Own Bargains:
◦Grow penetration of assortments that are Bargains and Extreme Bargains to grow gross margin and lower opening price points for customers; and
◦Continue to increase gross margin within all categories through our cost reduction and productivity initiative that we refer to as “Project Springboard.”
•Communicate Unmistakable Value:
◦Launch new marketing efforts to communicate Bargains and Extreme Bargains;
◦Strengthen our comparable price ticketing;
◦Acquire new customers by optimizing marketing campaigns and maximizing every dollar; and
◦Enhance customer segmented marketing to increase our return on investment.
•Increase Store Relevance:
◦Accelerate innovation in merchandising to grow relevance and drive customer frequency; and
◦Leverage learnings from our tests of alternative merchandise presentations to enhance inventory allocation and optimize assortment mix across our fleet of stores.
•Win Customers for Life with our Omnichannel Efforts:
◦Simplify our in-store and online shopping experience to provide an easier and more pleasant experience;
◦Launch order-in-store capabilities; and
◦Inspire our customers with fresh merchandise.
•Drive Productivity:
•Deliver “Project Springboard” benefits to reduce costs and improve gross margin;
•Drive inventory turn improvements to reduce working capital investment;
•Improve profitability of stores to ensure healthy long-term growth;
•Strengthen our available liquidity;
•Encourage a culture of frugality; and
•Continuously analyze our purchasing habits and vendor agreements to ensure we are maximizing our buying power and making cost-effective decisions.
Project Springboard
In 2023, we launched a cost reduction and productivity initiative that we refer to as “Project Springboard,” with the goal of improving our operating income by over $200 million. Project Springboard is expected to deliver the improvement of operating income results with 40% of the improvement from reduced cost of goods sold, 40% from other gross margin improvements, and 20% from reductions within selling and administrative expenses. The initiatives intended to reduce cost of goods sold are expected to be achieved primarily through reduced input costs as a result of improved purchasing practices and competitive bidding processes, among other improvements. The other gross margin improvements are primarily expected to be achieved through optimization of our inventory allocation processes and improved marketing, pricing, and promotion, among other improvements. The selling and administrative expense savings are expected to be achieved through optimization of store payroll, improved efficiency in our supply chain, procurement improvements, and other workforce efficiencies. We are confident in the progress of Project Springboard and expect a significant amount of savings to be realized in 2024 and beyond.
27
Operation North Star Progress
In 2023, we successfully completed the following actions under our Operation North Star strategy:
•Increased our Bargain penetration to above 60 percent of our product assortment to enhance the excitement of our products through closeouts, great deals, and fun, unique products;
•Launched our clear comparable price ticketing to communicate unmistakable value to our customer;
•Achieved structural savings by reducing capital expenditures by approximately 60 percent;
•Launched Project Springboard to identify and drive structural savings and growth opportunities; and
•Drove productivity through gross margin rate growth, expense reduction, and effective investments.
Next Steps
In 2024, we plan to implement the following initiatives to achieve our Operation North Star goals:
•Own Extreme Bargains by increasing both Bargain and Extreme Bargains penetration to enhance our product assortment and drive sales and margin improvement;
•Communicate unmistakable value through innovative tools and new campaigns;
•Grow store relevance by optimizing assortment allocation to capture customer demand;
•Improve customer experience through enhancements within our online platform and our in-store experience; and
•Drive productivity through positive sales comps, gross margin growth, and expense reduction.
Merchandising
Our merchandising strategy primarily focuses on product sourcing, particularly closeout sourcing and global sourcing. We implement our merchandising strategy through (1) Bargains and Extreme Bargains, by seeking to deliver unmatched value in all of our merchandise categories through high quality closeouts on name brand items, affordable opening price points and low prices on our own brand assortment and (2) complementing our bargain offerings with an assortment of essentials, by seeking to offer a reliable assortment of simple-to-shop staple products that we believe our customers rely on and that bring consistency to our product mix. We evaluate our product offerings to ensure we are providing quality and unmistakable value, and exceeding our customer’s expectations. We believe that focusing on our customers’ expectations will improve our ability to provide a more relevant and desirable assortment of offerings in our merchandise categories.
We believe we can grow gross margin through our Extreme Bargain sourcing and enhanced global sourcing across a broader base of vendors on our big-ticket seasonal and furniture products. We acquired the Broyhill® brand in 2018 and launched our Broyhill® brand product offerings in late 2019, with initial product offerings in our Furniture, Seasonal, Soft Home, and Hard Home and Other merchandise categories. We believe the Broyhill® assortment, which is available both in stores and online, strengthens our home assortment with a high-quality product offering at a value-based price that customers find attractive. Our Broyhill®- related net sales were approximately 8.3% of total sales in 2023 compared to approximately 12.4% of total sales in 2022, which exceeds on a relative basis the Company’s decrease in net sales in 2023. The significant decrease in Broyhill® related net sales in 2023 was due, in large part, to the closure of our largest supplier of Broyhill® products in the fourth quarter of 2022, which impacted the availability of Broyhill® merchandise in our stores in the first half of 2023. We fully replenished our availability of Broyhill® merchandise during the second half of 2023 by restoring our Broyhill® supply chain with new vendors, who we believe are more reliable.
We believe our merchandising strategies for our Furniture, Seasonal, and Soft Home merchandise categories position us to provide great Bargains and Extreme Bargains in our Furniture, Home and Seasonal categories:
•Our Furniture category primarily focuses on being a destination for our core customer’s home furnishing needs, such as upholstery, mattresses, case goods, and ready-to-assemble. In Furniture, we believe our competitive advantage is attributable to our sourcing relationships, in-store availability, delivery options, and everyday value offerings. A significant portion of our offering in this category consists of replenishable products sold under our own brands or sourced from recognized brand-name manufacturers. Within our own brands portfolio, the Broyhill® branded product offerings feature high quality and compelling value, which continues to attract new furniture customers as well as provide existing customers with an incentive to step up to the higher-end offering. Our long-standing relationships with brand-name manufacturers, most notably in our mattresses and upholstery departments, allow us to work directly with the manufacturers to create product offerings exclusively for us, and provide a high-quality product at a competitive price. Additionally, we believe our “buy today, take home today” practice of carrying in-stock inventory of our core furniture offerings, which enables our customer to take home their purchase at the end of their shopping experience, positively differentiates us from our competition. As an omnichannel retailer, we also encourage our customer to shop and buy our products online anytime and anywhere, and we invite customers into our stores to touch and feel the quality and comfort of our products. We believe that offering a focused assortment, which is displayed in furniture vignettes, provides customers a solution for decorating their home when combined with our home décor
28
offerings. To supplement our merchandising and presentation strategies, we also provide multiple third-party financing options for our customers, including options for those who may be more challenged for approval in traditional credit channels. Our financing partners are solely responsible for the credit approval decisions and carry the financial risk.
•Our Seasonal category strengthens our home offerings with our patio furniture, gazebos, summer fun, Christmas trim, and other seasonally relevant departments. We believe we have a competitive advantage in this category by offering a broad assortment of trend-right products with a strong value proposition in our own brands. Our stores focus on displaying assembled seasonal products to showcase our quality and value, with boxed stock located nearby, so it is easy for our customers to purchase and take home the product. Much of this merchandise is sourced on an import basis, which allows us to maintain our competitive pricing advantage, and it is being complemented by both closeouts and engineered closeouts. Additionally, our Seasonal category offers unique product through a mix of departments and curation of categories that meet our customer’s seasonal needs. We continually work with our vendors to expand the product assortment in our Seasonal category to respond to our customers’ evolving wants and needs.
•Our Soft Home category complements our Furniture and Seasonal categories in making our stores a destination for a broader range of home needs. Over the past several years, we have enhanced our assortment in Soft Home by allocating more selling space to the category to support a wider range of replenishable, fashion-based products. We have also grown our assortments of closeouts in Soft Home to bring unmistakable value and unique finds to our customers. We believe that we have a competitive advantage in Soft Home as a result of our trend-right, focused assortment with improved quality and perceived value, and our ability to furnish our customers’ homes with décor that complements an in-store furniture purchase. We have worked to develop a “solutions” approach to complete a room through expanded assortment offerings and our cross-merchandising efforts, particularly color palette coordination, when combining our Soft Home offerings with our Furniture and Seasonal categories. We believe that this approach helps our customers envision how the product can work in their homes and enhances our brand image.
We believe the Food, Consumables, and Hard Home and Other merchandise categories offer convenience, solutions and value:
•Our Food and Consumables categories focus on providing customers with a mix of Bargains and Extreme Bargains, which are worth making a special trip for because of their exceptional value, together with everyday essentials to provide a consistent and convenient assortment. We believe we possess a competitive advantage in the Food and Consumables categories based on our sourcing capabilities for closeout merchandise. Manufacturers and vendors have closeout merchandise for a variety of different reasons, including other retailers canceling orders or going out of business, production overruns, or marketing or packaging changes. Our vendor relationships, along with our size and purchasing power, afford us the opportunity to consistently source and deliver high quality closeouts. In addition to our closeout business, we maintain a “never out” product assortment to offer consistency in key convenience areas where our customers desire consistently available everyday product offerings, such as over-the-counter medications. This essentials assortment is a mix of name brand products and opening price point products, which enables us to serve our customers seeking both value and the name brands they rely on in key categories.
•We believe that our Hard Home and Other category serves as a convenient adjacency to our other merchandise categories including Extreme Bargain opportunities within these categories. Over the past several years, including with our recent reduction of apparel offerings in 2023, we have intentionally narrowed our assortments in this category and reallocated space from this category to our other home products categories. This category focuses on value, and savings in comparison to competitors, in areas such as food preparation, table top, home maintenance, small appliances, toys and electronics.
Our merchandising management team is aligned with our merchandise categories, and its primary goal is to increase our total company comparable sales (“comp” or “comps”), which includes stores open at least fifteen months, plus our e-commerce operations. Our review of the performance of the members of our merchandise management team focuses on comps by merchandise category as we believe this key metric will drive our long-term net sales. By focusing on strengthening our home product and furniture offerings, and managing our convenience categories, we believe our merchandise management team can effectively address the changing shopping behaviors of our customers. We believe continuously evaluating our assortment within each merchandise category will lead to long-term comp growth.
Marketing
See the “Advertising and Marketing” discussion in Item 1. Business for a discussion on our Marketing strategy.
29
Shopping Experience
One of the core objectives of Operation North Star is to drive our merchandising innovation pipeline by responsibly investing in store presentation initiatives that create an easy shopping experience for our customers.
We have implemented a presentation solution called “The Lot” in nearly all of our stores over the past three years. We designed The Lot to display items from various merchandise categories placed in vignettes to promote life’s occasions, such as Fall tailgating. We are reinvigorating The Lot to showcase Extreme Bargains and other Bargain products that we offer in one convenient experience. The Lot provides us with a unique testing ground for Extreme Bargains as we continually rotate product assortment offered by The Lot.
In addition to our efforts to improve our in-store shopping experience, Operation North Star focuses on improving our e-commerce shopping experience and growing e-commerce net sales by removing barriers, providing an easier and more pleasant experience, and expanding the items available for purchase online. Over the last few years, we have increased our “extended aisle” assortments on our e-commerce platform, which offer additional fabric and color options on products in our Furniture and Seasonal categories, including items only available online. In 2019, we launched our buy online, pick up in store (“BOPIS”) program nationwide, which has nearly doubled our merchandise offerings available online. Following the launch of our BOPIS program, we launched curbside pickup to supplement our BOPIS service, reduced shipping times by expanding our distribution network to include ship-from-store capabilities at 66 stores around the country, and introduced same-day delivery of all items available in our stores through our partnerships with Instacart® and Bunggi®. In 2021, we launched new payment types on our website including Apple Pay, Google Pay, PayPal, and “Pay in 4.” In 2022, we further enhanced our e-commerce shopping experience by removing friction at checkout, enhancing personalization with product recommendations, expanding our online product assortment, accelerating our use of supplier direct fulfillment, and by partnering with Shipt and Door Dash to add new fulfillment options for our customers. In 2023, we added an additional partnership with Uber Eats to further enhance our customers’ direct fulfillment options.
Lastly, we continue to offer a private label credit card and our Easy Leasing lease-to-own solutions for customer financing, as well as protection plans on merchandise across stores and online. Our private label credit card provides access to revolving credit, through a third party, for use on both larger ticket items and daily purchases. Our Easy Leasing lease-to-own program provides a single use opportunity for access to third-party financing. Our protection plan program provides a method for obtaining multi-year warranty coverage for furniture, seasonal, mattresses, small appliances, large area rugs, and electronics purchased in-store or online.
Real Estate
Real estate development is a key component of our Operation North Star strategy, which includes our objective of capitalizing on our strengths in rural and small-town markets and maintaining a prudent approach to store openings and closures in the near term. The following table compares the number of our stores in operation at the end of each of the last five fiscal years, and the associated square footage:
| (In thousands, except store counts and average store size) | 2023 | 2022 | 2021 | 2020 | 2019 | ||||||||||||
| Stores open at end of the fiscal year | 1,392 | 1,425 | 1,431 | 1,408 | 1,404 | ||||||||||||
| Total gross square footage | 46,600 | 47,470 | 47,120 | 46,008 | 45,453 | ||||||||||||
| Total selling square footage | 32,263 | 32,897 | 32,736 | 32,016 | 31,705 | ||||||||||||
| Average store size - selling square feet | 23,177 | 23,086 | 22,876 | 22,739 | 22,582 | ||||||||||||
In 2023, we decreased our net store count by 33 stores, which included the sale of 26 owned store locations. The decrease in our net store count was the result of management of underperforming store locations where the facts and circumstances supported closure of the location. Although our store count decreased year-over-year, the average size of the stores that we opened or relocated over the past several years slightly exceeds our averages in prior years. As a result, our overall average selling square footage has increased since 2019. In 2024, we expect to open approximately three new stores and close a number of stores to be determined as we progress through the year.
Looking beyond 2024, when we believe our capital resources and liquidity allow for investment in store growth, we anticipate a return to growth in our net new store count, particularly within rural and small-town markets. Our real estate team has identified more than 500 markets across the U.S. where we believe we can successfully open stores. Our new store selection process
30
includes a thorough review of proforma estimated results prior to entering a lease to help ensure the economic quality of our store openings, as well as a post-opening review that we use to improve our proforma estimates in the future.
Although we strategically close stores when our analyses indicate we are unable to continue operating profitable locations, we actively work toward reducing our store closures. To reduce store closures, we have implemented a store intervention program over the last three years that assesses underperforming stores. The store intervention program reviews various store performance metrics to identify underperforming stores for review, develops action plans for improvement, and then works with various business leaders and teams to implement the action plans. Action plans most often include changes in merchandising, marketing, staffing, and training, but can also include working with landlords and/or local officials to renegotiate rents or improve conditions surrounding the store, such as ingress/egress issues that have materialized since the store opened.
As discussed in “Item 2. Properties,” of this Form 10-K, we have 172 store leases that will expire in 2024, 141 of which have renewal options. The balance of our 2024 closings will result from a lack of renewal options or from our belief that a location’s sales and operating profit volume are not strong enough to warrant additional investment in the location. In our evaluation of underperforming locations for lease renewal, we assess historical performance, potential rent increases, and projected performance, along with other qualitative and quantitative information, to determine if we believe we can return the location to performance in-line with, or better than, the chain. As part of our evaluation of potential store closings, we consider our ability to transfer sales from a closing store to other nearby locations and generate a better overall financial result for the geographic market.
31
2023 COMPARED TO 2022
Net Sales
Net sales by merchandise category (in dollars and as a percentage of total net sales), net sales change (in dollars and percentage), and comps in 2023 compared to 2022 were as follows:
| (In thousands) | 2023 | 2022 | Change | Comps | ||||||||||||||||||||||||||||
| Furniture | $ | 1,180,349 | 25.0 | % | $ | 1,409,298 | 25.8 | % | $ | (228,949) | (16.2) | % | (17.3) | % | ||||||||||||||||||
| Consumables | 859,968 | 18.2 | 924,780 | 16.9 | (64,812) | (7.0) | (5.2) | |||||||||||||||||||||||||
| Seasonal | 758,327 | 16.1 | 961,446 | 17.6 | (203,119) | (21.1) | (20.9) | |||||||||||||||||||||||||
| Soft Home | 754,495 | 16.0 | 859,418 | 15.7 | (104,923) | (12.2) | (12.2) | |||||||||||||||||||||||||
| Food | 680,821 | 14.4 | 754,982 | 13.8 | (74,161) | (9.8) | (8.9) | |||||||||||||||||||||||||
| Hard Home and Other | 488,139 | 10.3 | 558,405 | 10.2 | (70,266) | (12.6) | (12.7) | |||||||||||||||||||||||||
| Net sales | $ | 4,722,099 | 100.0 | % | $ | 5,468,329 | 100.0 | % | $ | (746,230) | (13.6) | % | (13.5) | % | ||||||||||||||||||
We periodically assess and make minor adjustments to our product hierarchy, which can impact the roll-up of our merchandise categories. In 2023, we realigned our merchandise categories and eliminated our Apparel, Electronics, & Other merchandise category. We have reallocated the departments that previously comprised Apparel, Electronics, & Other into the following merchandise categories: Hard Home and Other, Soft Home, Consumables, and Food. See the reclassifications discussion in Note 1 to the accompanying consolidated financial statements for additional information.
Net sales decreased $746.2 million, or 13.6%, to $4,722.1 million in 2023, compared to $5,468.3 million in 2022. The decrease in net sales was primarily driven by an overall comp decrease of 13.5%, which decreased net sales by $706.3 million, and an additional decrease of $40.0 million in net sales from our non-comparable stores. While our net store count decreased compared to 2022, we experienced increased net sales in our new and relocated stores compared to our closed stores. Our decreased comps and net sales in 2023 were primarily due to decreased demand. The decrease was partially offset by an additional week of sales, as 2023 was comprised of 53 weeks, which increased net sales by $66.9 million. The decrease in demand was significantly impacted by macro economic pressures on our customers, which has negatively impacted the discretionary spending of our customers, particularly with respect to large-ticket Furniture and Seasonal products. We believe the macro economic pressures led to the majority of the decrease in comps in 2023 with the remainder of the decrease driven by promotions, weather, the shortage of our Broyhill® branded product during the first half of 2023, and the other factors noted below. Our comps are calculated based on the results of all stores that were open at least fifteen months, plus our e-commerce net sales.
In 2023, we experienced decreased comps and net sales in all of our merchandise categories. Our home products categories - Furniture, Seasonal, Soft Home, and Hard Home and Other - were most impacted, as purchases from these categories are generally more discretionary. In the first half of 2023, the shortage of our Broyhill® branded product negatively impacted comps and sales for our home product categories, particularly Furniture. In second half of 2023, however, our in-stock levels of Broyhill® branded products returned to normal levels and we experienced an improvement in Furniture sales trends versus the first half of the year.
As discussed above, we believe that macroeconomic pressures significantly reduced our customer’s discretionary spending, which led to the decreased net sales and comps in all our home products categories. We believe our Seasonal net sales and comps in 2023, particularly our lawn & garden and summer departments, were also adversely impacted by later-arriving warm weather in many parts of the U.S. in the first quarter of 2023. Additionally, our Seasonal sales and comps were significantly impacted by the aggressive category-specific promotional activity in 2022, which we did not repeat to the same degree in 2023.
To improve our home product net sales, we will continue to introduce more closeout offerings in these categories and lower our opening price points as we execute our “own bargains” merchandising strategy. We expect that 75% of products in our merchandise mix following the implementation of this strategy will consist of Bargains (good value relative to our competitors), including an expanded assortment of Extreme Bargains (synonymous with closeouts), with the remaining merchandise mix consisting of Essentials (staple product offerings that bring consistency to our mix of products). We will also continue to offer high value products with higher price points that we believe will attract customers from higher income households such as our Broyhill® branded home products.
32
While our Food and Consumables categories experienced decreased comps and net sales in 2023, these categories performed marginally better than our home products categories in 2023 as this category is less sensitive to changes in discretionary spending. While all departments within our Food category experienced a decrease in comp and net sales in 2023, our candy and snacks departments experienced the most significant decline. We believe these departments were significantly impacted by the lack of Bargain and Extreme Bargain product assortments. Our health, beauty and cosmetics departments within our Consumables category drove the most significant sales and comp decrease in 2023, as the purchases from these departments are more discretionary. Partially offsetting the decreases in net sales and comps was our infant department, which experienced increased net sales and comps in 2023 driven by a new, name brand Bargain assortment.
Gross Margin
Gross margin dollars decreased $226.9 million, or 11.9%, to $1,686.6 million in 2023, compared to $1,913.5 million in 2022. The decrease in gross margin dollars was primarily due to a decrease in net sales, which decreased gross margin dollars by $261.1 million, partially offset by an increase in gross margin rate, which increased gross margin dollars by $34.2 million. Gross margin as a percentage of net sales increased approximately 70 basis points to 35.7% in 2023 compared to 35.0% in 2022. The gross margin rate increase was primarily due to lower markdowns and lower inbound freight costs partially offset by an increase in shrink in 2023 compared to 2022. The lower markdowns were driven by decreased promotions in 2023 compared to 2022. Inbound freight costs declined due to lower ocean carriage rates, lower fuel costs, and decreased inbound volume compared to 2022. The increase in shrink was primarily due to sales deleverage, as both unit and dollar shrink improved compared to 2022.
Selling and Administrative Expenses
Selling and administrative expenses were $2,141.9 million in 2023, compared to $2,040.3 million in 2022. The increase of $101.6 million, or 5.0%, was primarily attributable to an increase in store asset impairment charges of $80.2 million, a lease payment related to the exit from our prior synthetic lease of $53.6 million, an increase in professional fees related to Project Springboard of $31.4 million, and termination costs and related expenses for the exit from our FDCs of $15.5 million, partially offset by decreases in store payroll of $18.3 million, store occupancy costs of $18.0 million, other distribution and transportation costs of $28.3 million, and credit card and bank fees of $7.6 million. The decrease in store payroll and store occupancy costs were driven by a net decrease in store count compared to 2022. The decrease in store payroll was also driven by an overall reduction in store headcount and payroll hours. The decrease in store occupancy expense was primarily the result of a lower year-over-year store count and operating lease right-of-use asset impairments recorded in the trailing twelve months, which decreased amortization expense on operating lease right-of-use assets, partially offset by increased lease expense associated with lease renewals and the sale and leaseback transactions completed in 2023. The decrease in credit card and bank fees was primarily driven by the decreased sales volume compared to 2022, partially offset by additional credit card and bank fees incurred by the Company due to the 53rd week in 2023. The decrease in distribution and transportation costs, excluding expenses related to the exit from our FDCs and the payment related to the exit from our prior synthetic lease, was driven primarily by the cessation of our FDC operations resulting in the absence of FDC operational costs in the second half of 2023 and decreased fuel costs and outbound transportation rates in 2023 compared to 2022.
As a percentage of net sales, selling and administrative expenses increased by 810 basis points to 45.4% in 2023 compared to 37.3% in 2022.
Depreciation Expense
Depreciation expense decreased $10.4 million to $144.5 million in 2023 compared to $154.9 million in 2022. The decrease was driven by asset impairment charges taken in the last twelve months and decreased capital expenditures in the last twelve months, partially offset by accelerated depreciation expense of $8.0 million related to the cessation of our FDC operations.
Depreciation expense as a percentage of net sales increased by 30 basis points compared to 2022.
Operating Loss
Operating loss was $387.4 million in 2023 compared to operating loss of $261.5 million in 2022. The increase in operating loss was primarily driven by the items discussed in the “Net Sales,” “Gross Margin,” “Selling and Administrative Expenses,” and “Depreciation Expense” sections above. In summary, the increase in operating loss was driven by the decrease in net sales and the increases in selling and administrative expenses, partially offset by an increase in gross margin rate and a decrease in depreciation expense. Additionally, we estimate our operating loss was decreased by approximately $6.2 million as a result of the addition of the 53rd week in 2023. Our estimate is based on the gross margin generated from the 53rd week, less estimated variable costs such as labor, utilities, repairs, maintenance, and other expenses.
33
Interest Expense
Interest expense increased $24.5 million to $44.8 million in 2023 compared to $20.3 million in 2022. The increase in interest expense was driven by higher total average borrowings (including finance leases and the sale and leaseback financing liability) and an increase in our weighted average interest rate. We had total average borrowings of $599.3 million in 2023 compared to $421.3 million in 2022. The increase in total average borrowings was driven by increased borrowings under the 2022 Credit Agreement throughout 2023 compared to 2022. The increase in our weighted average interest rate throughout 2023 was due to higher year-over-year SOFR rates under our 2022 Credit Agreement compared to our weighted average interest rate in 2022.
Other Income (Expense)
Other income (expense) was $0.0 million in 2023, compared to $1.4 million in 2022. The change was primarily driven by the absence of diesel fuel derivatives in 2023 compared to the gains on our diesel fuel derivatives in 2022.
Income Taxes
Our effective income tax rate in 2023 and 2022 was (11.5)% and 24.9%, respectively. The change in the effective income tax rate was driven by a full valuation allowance of $146.0 million recorded on our deferred assets, partially offset by the effect of carry-back employment related tax credits and state net operating losses to prior fiscal periods.
Known Trends and Guidance
In 2023, the U.S. economy continued to face macroeconomic challenges including high inflation, which has adversely impacted the buying power of our customers. We expect to return to comp sales growth in 2024 and to significantly improve our gross margin in 2024 compared to 2023.
Capital Resources and Liquidity
On September 21, 2022, we entered into the 2022 Credit Agreement, a five-year asset-based revolving credit facility in an aggregate committed amount of up to $900 million (the “Commitments”) that expires on September 21, 2027. In connection with our entry into the 2022 Credit Agreement, we paid bank fees and other expenses in the aggregate amount of $3.4 million, which are being amortized over the term of the 2022 Credit Agreement.
On April 18, 2024, we entered into the First Amendment to Credit Agreement (the “ABL Amendment”), which amended the 2022 Credit Agreement to, among other things, (1) permit the Term Loan Facility, (2) expand the scope of collateral to include non-working capital assets and a mortgage on the Company’s corporate headquarters located in Columbus, Ohio, (3) revise the borrowing base formula therein to include the Term Pushdown Reserve (as defined in Note 13 to the accompanying consolidated financial statements), (4) increase the interest rate spreads and replace CDOR with CORRA, (5) replace the fixed charge coverage ratio covenant with an Excess Availability Covenant (as defined in Note 13 to the accompanying consolidated financial statements), and (6) make other changes to the 2022 Credit Agreement to conform with the Term Loan Facility (see Note 13 to the accompanying consolidated financial statements for additional information on the ABL Amendment transaction).
Revolving loans under the 2022 Credit Agreement are available in an aggregate amount equal to the lesser of (1) the aggregate Commitments and (2) a borrowing base consisting of eligible credit card receivables and eligible inventory (including in-transit inventory), subject to customary exceptions and reserves, including the Term Pushdown Reserve (the “ABL Borrowing Base”). The 2022 Credit Agreement includes a swing loan sublimit of 10% of the then applicable aggregate Commitments and a $90 million letter of credit sublimit. Loans made under the 2022 Credit Agreement may be prepaid without penalty. Borrowings under the 2022 Credit Agreement are available for general corporate purposes, working capital and to repay certain of our indebtedness as of closing. All obligations under the 2022 Credit Agreement are guaranteed by the Loan Parties (other than the Borrowers) and, after giving effect to the ABL Amendment, our obligations under the 2022 Credit Agreement are secured by (a) a first priority lien on substantially all of the Loan Parties’ working capital assets, including credit card receivables and inventory, and (b) a second priority lien on substantially all of the Loan Parties’ non-working capital personal property assets, including fixtures, machinery, equipment, and intellectual property, and a second priority mortgage on the Company’s corporate headquarters located in Columbus, Ohio, in each case subject to certain permitted liens. The pricing and certain fees under the 2022 Credit Agreement fluctuate based on our borrowing availability under the 2022 Credit Agreement. The 2022 Credit Agreement allows us to select our interest rate for each borrowing from multiple interest rate options. The interest rate options are generally derived from the prime rate, adjusted daily simply SOFR or one, three or six month adjusted Term SOFR. We also pay an unused commitment fee of 0.20% per annum on the unused Commitments. The 2022 Credit Agreement contains an environmental, social and governance (“ESG”) provision, which may provide favorable pricing and fee adjustments if we meet ESG performance criteria to be established by a future amendment to the 2022 Credit Agreement.
The 2022 Credit Agreement contains customary affirmative and negative covenants (including, where applicable, restrictions on our ability to, among other things, incur additional indebtedness, pay dividends, redeem or repurchase stock, prepay certain indebtedness, make certain loans and investments, dispose of assets, enter into restrictive agreements, engage in transactions
34
with affiliates, modify organizational documents, incur liens and consummate mergers and other fundamental changes) and events of default, including a cross default to other material indebtedness. In addition, after giving effect to the ABL Amendment, the 2022 Credit Agreement requires us to comply with an Excess Availability Covenant (as defined in Note 13 to the accompanying consolidated financial statements). A violation of these covenants would result in a default under the 2022 Credit Agreement which would permit the lenders to restrict our ability to further access the 2022 Credit Agreement for loans and letters of credit and could require the immediate repayment of any outstanding loans under the 2022 Credit Agreement. At February 3, 2024, we were in compliance with the covenants of the 2022 Credit Agreement.
On April 18, 2024, the Company entered into the Term Loan Facility, among the Company and Big Lots Stores, LLC, as borrowers (the “Borrowers”), all other domestic subsidiaries of the Company as guarantors (together with the Borrowers, the “Loan Parties”), 1903P Loan Agent, LLC, (the “Term Loan Agent”), as administrative agent and collateral agent, and the other lenders named therein (see Note 13 to the accompanying consolidated financial statements for additional information on the Term Loan Facility transaction). The Term Loan Facility provides for a “first in, last out” delayed draw term loan facility in an aggregate committed amount up to $200 million. At commencement of the Term Loan Facility, the Company drew down $50.0 million in total borrowings under the Term Loan Facility.
Loans under the Term Loan Facility are available in an aggregate amount equal to the lesser of (1) the aggregate Commitments and (2) a borrowing base calculated based on specified percentages of eligible inventory, credit card receivables, real estate, fixtures, machinery and equipment, subject to customary exceptions and reserves (the “Term Loan Borrowing Base”). If at any time the amounts borrowed under the Term Loan Facility exceed the Term Loan Borrowing Base, the Company is required to maintain a reserve against the ABL Borrowing Base in an amount equal to such excess (“the Term Pushdown Reserve”). Borrowings under the Term Loan Facility are available for general corporate purposes, working capital and to repay a portion of our indebtedness outstanding under the 2022 Credit Agreement.
All amounts of the Term Loan Facility outstanding on the maturity date will be due and payable on September 21, 2027. The Term Loan Facility contains certain mandatory prepayments, including as a result of certain sales or disposition of certain assets, the incurrence of certain additional debt, certain issuances of additional equity and receipt of certain extraordinary receipts, subject to certain exceptions and, in the case of certain sales or other dispositions, reinvestment rights. In certain instances, mandatory prepayments are subject to a prepayment fee. Subject to compliance with applicable provisions of the 2022 Credit Agreement, voluntary prepayments under the Term Loan Facility are permitted at any time upon notice and subject to meeting certain tests under the 2022 Credit Agreement and, in certain instances, a prepayment fee.
Amounts borrowed under the Term Loan Facility bear interest at a variable rate indexed to SOFR plus a pricing margin ranging from 9.25% to 10.00% per annum, based on our total borrowings under the Term Loan Facility. Interest payments under the Term Loan Facility are due on the first day of each calendar month. At commencement, the interest rate on the outstanding Term Loan Facility borrowings was 15.2%.
The Term Loan Facility requires the Borrowers to comply with an Excess Availability Covenant (as defined in Note 13 to the accompanying consolidated financial statements). In addition, the Term Loan Facility contains customary covenants and restrictions on the Company’s and its subsidiaries’ activities, including, but not limited to, limitations on the incurrence of additional indebtedness, liens, negative pledges, guarantees, investments, loans, asset sales, mergers, acquisitions, prepayment of other debt, distributions, dividends, the repurchase of capital stock, transactions with affiliates, the ability to change the nature of its business or its fiscal year, and permitted activities of the Company.
The Term Loan Facility contains customary events of default that include, among other things, non-payment defaults, inaccuracy of representations and warranties, covenant defaults, cross default to material indebtedness, bankruptcy and insolvency defaults, material judgment defaults, ERISA defaults, structural defaults under the loan documents and a change of control default. The occurrence of an event of default could result in the acceleration of our obligations under the Term Loan Facility. Under certain circumstances, a default interest rate will apply on any amount payable under the Term Loan Facility during the existence of an event of default at a per annum rate equal to 2.00% above the applicable interest rate for any principal and 2.00% above the rate applicable for base rate loans for any other interest.
All obligations under the Term Loan Facility are guaranteed by the Loan Parties (other than the Borrowers) and secured by (a) a second priority lien on substantially all of the Loan Parties’ working capital assets, including credit card receivables and inventory, and (b) a first priority lien on substantially all of the Loan Parties’ non-working capital personal property assets, including fixtures, machinery, equipment, and intellectual property, and a first priority mortgage on the Company’s corporate headquarters located in Columbus, Ohio, in each case, subject to certain permitted liens.
35
As of February 3, 2024, we had a Borrowing Base (as defined under the 2022 Credit Agreement) of $739.5 million under the 2022 Credit Agreement. At February 3, 2024, we had $406.1 million in borrowings outstanding under the 2022 Credit Agreement and $52.1 million committed to outstanding letters of credit, leaving $281.3 million available under the 2022 Credit Agreement, subject to certain borrowing base limitations as discussed above. At February 3, 2024, we had $207.4 million available under the 2022 Credit Agreement, net of the borrowing base limitations discussed above.
The primary source of our liquidity is cash flows from operations and borrowings under the 2022 Credit Agreement and the Term Loan Facility. Our net (loss) income and, consequently, our cash (used in) provided by operating activities are impacted by net sales volume, seasonal sales patterns, and operating (loss) profit margins. Historically, our cash provided by operations typically peaks in the fourth quarter of each fiscal year due to net sales generated during the holiday selling season. Generally, our working capital requirements peak late in our third fiscal quarter or early in our fourth fiscal quarter as we build our inventory levels prior to the holiday selling season. We have historically funded those requirements with cash provided by operations and borrowings under our credit facility. Cash requirements include, among other things, capital expenditures, working capital needs, interest payments, and other contractual commitments.
The Company incurred net losses and used cash in operating activities in 2022 and 2023. Accordingly, the Company has taken a number of actions in 2023 and 2024 to reduce costs, enhance its financial flexibility and increase liquidity, including entering into the Term Loan Facility. Based on historical and expected financial results and actions that we have taken in 2023 and 2024, we believe that we have or, if necessary, have the ability to obtain, adequate resources to fund our anticipated cash requirements, including ongoing and seasonal working capital requirements, proposed capital expenditures, new projects, and currently maturing obligations for the next 12 months.
During 2023, the Company simultaneously terminated the 2023 Synthetic Lease for the AVDC and completed the sale of the AVDC and 23 owned store locations in sale and leaseback transactions (see Note 10 to the accompanying consolidated financial statements for additional information on the sale and leaseback transactions). The aggregate sales price received in the sale and leaseback transactions was $305.7 million, which we used to pay transaction expenses, pay off the 2023 Synthetic Lease and repay borrowings under the 2022 Credit Agreement.
In addition, the Company has taken significant steps to reduce costs and improve gross margin by increasing sales and reducing the cost of goods sold, which we expect will, over time, return the Company to profitability and result in its operating activities providing cash. In 2023, we closed all four FDCs to reduce costs and align our supply chain capabilities with our current business volume. We also launched a cost reduction and productivity initiative that we refer to as “Project Springboard,” with the goal of improving our operating income by over $200 million. Project Springboard is expected to deliver the improvement of operating income results with 40% of the improvement coming from reductions in the cost of goods sold, 40% from improved gross margin, and 20% from reductions in selling and administrative expenses. The initiatives intended to reduce cost of goods sold are expected to be achieved primarily through reduced input costs as a result of improved purchasing practices and competitive bidding processes, among other improvements. The gross margin improvements are primarily expected to be achieved through optimization of our inventory allocation processes and improved marketing, pricing, and promotion, among other improvements. The selling and administrative expense savings are expected to be achieved through optimization of store payroll, improved efficiency in our supply chain, procurement improvements, and other workforce efficiencies.
At February 3, 2024 our material cash requirements, which are comprised of written purchase orders, cancellable and noncancellable contractual commitments, and other obligations, were $1,138.9 million for the upcoming fiscal year and $4,168.2 million in total. Excluding operating lease and finance lease obligations disclosed in the Note 5 to the accompanying consolidated financial statements, our material cash requirements at February 3, 2024 were $748.4 million for the upcoming fiscal year and $1,382.0 million in total. The material cash requirements disclosed above include merchandise purchase orders of $421.0 million. The cancellable and noncancellable contractual commitments include purchase commitments related to distribution and transportation, information technology, advertising, energy procurement, and store security, supply, and maintenance commitments. At February 3, 2024, our noncancellable commitments were immaterial.
On December 1, 2021, our Board of Directors authorized the repurchase of up to $250 million of our common shares under the 2021 Repurchase Authorization. Pursuant to the 2021 Repurchase Authorization, we may repurchase shares in the open market and/or in privately negotiated transactions at our discretion, subject to market conditions, our compliance with the terms of the 2022 Credit Agreement, and other factors. The 2021 Repurchase Authorization has no scheduled termination date. During 2022 and 2023, we did not purchase any shares under the 2021 Repurchase Authorization. As of February 3, 2024, we had $159.4 million available for future repurchases under the 2021 Repurchase Authorization.
Common shares acquired through share repurchase authorizations are available to meet obligations under our equity compensation plans and for general corporate purposes.
36
In 2023, we paid $9.8 million in dividends compared to $37.0 million in 2022. The decrease in dividends paid was due to the suspension of the Company’s quarterly cash dividend on May 23, 2023 by our Board of Directors, which resulted in one quarterly dividend paid in 2023 compared to four quarterly dividends paid in 2022. The declaration of any future dividends will be at the discretion of our Board of Directors and will depend on our financial condition, results of operations, capital requirements, compliance with applicable laws and agreements and any other factors deemed relevant by our Board of Directors. See Note 6 to the accompanying consolidated financial statements for additional information on dividends declared and paid.
The following table compares the primary components of our cash flows from 2023 to 2022:
| (In thousands) | 2023 | 2022 | Change | ||||||||||||||
| Net cash used in operating activities | $ | (251,960) | $ | (144,286) | $ | (107,674) | |||||||||||
| Net cash provided by (used in) investing activities | 279,511 | (108,940) | 388,451 | ||||||||||||||
| Net cash (used in) provided by financing activities | $ | (25,870) | $ | 244,234 | $ | (270,104) | |||||||||||
Cash used in operating activities increased by $107.7 million to $252.0 million in 2023 compared to $144.3 million in 2022. The increase in cash used in operating activities was primarily due to an increase in net loss after adjusting for non-cash activities such as non-cash valuation allowance on deferred tax assets, non-cash impairment charge, non-cash lease expense, gain on disposition of property and equipment and the change in operating lease liabilities related to the refinance of the AVDC synthetic lease in the first quarter of 2023. This increase was partially offset by the combined impact of the change in inventory and accounts payable, driven by a year-over-year decrease in inventory purchase volumes, change in other current liabilities driven by an increase in bonus accruals for 2023 compared to 2022, and change in income tax receivables due to the increased net loss for 2023.
Cash provided by (used in) investing activities increased $388.5 million to cash provided by investing activities of $279.5 million in 2023 compared to cash used in investing activities of $108.9 million in 2022. The increase was driven by cash proceeds from sale of property and equipment, which was primarily due to the sale and leaseback transactions completed in the third quarter of 2023, and a decrease in capital expenditures. The decrease in capital expenditures was primarily due to decreased investments in new stores and other strategic initiatives.
Cash (used in) provided by financing activities decreased by $270.1 million to cash used in financing activities of $25.9 million in 2023 compared to cash provided by financing activities of $244.2 million in 2022. The decrease was driven by a reduction in net proceeds from long-term debt, partially offset by a decrease in dividends paid due to suspension of the Company’s quarterly dividend program after the first quarter of 2023, a decrease in payment for treasury shares acquired, repayment of the failed sale-leaseback financing liability related to the Apple Valley, CA distribution center, and payment of other financing liabilities. The decrease in payment for treasury shares acquired was due to a decrease in shares withheld for income taxes related to the vesting of share-based awards.
CRITICAL ACCOUNTING POLICIES AND ESTIMATES
The preparation of financial statements in conformity with accounting principles generally accepted in the United States of America (“GAAP”) requires management to make estimates, judgments, and assumptions that affect the reported amounts of assets and liabilities at the date of the financial statements and the reported amounts of revenues and expenses during the reporting period, as well as the related disclosure of contingent assets and liabilities at the date of the financial statements. The use of estimates, judgments, and assumptions creates a level of uncertainty with respect to reported or disclosed amounts in our consolidated financial statements or accompanying notes. On an ongoing basis, management evaluates its estimates, judgments, and assumptions, including those that management considers critical to the accurate presentation and disclosure of our consolidated financial statements and accompanying notes. Management bases its estimates, judgments, and assumptions on historical experience, current trends, and various other factors that management believes are reasonable under the circumstances. Because of the inherent uncertainty in using estimates, judgments, and assumptions, actual results may differ from these estimates.
Our significant accounting policies, including the recently adopted accounting standards and recent accounting standards - future adoptions, if any, are described in Note 1 to the accompanying consolidated financial statements. We believe the following estimates, assumptions, and judgments are the most critical to understanding and evaluating our reported financial results. Management has reviewed these critical accounting estimates and related disclosures with the Audit Committee of our Board of Directors.
37
Merchandise Inventories
Merchandise inventories are valued at the lower of cost or market using the average cost retail inventory method. Market is determined based on the estimated net realizable value, which generally is the merchandise selling price at or near the end of the reporting period. The average cost retail inventory method requires management to make judgments and contains estimates, such as the amount and timing of markdowns to clear slow-moving inventory and the allowance for shrinkage, which may impact the ending inventory valuation and current or future gross margin. These estimates are based on historical experience and current information.
When management determines the salability of merchandise inventories is diminished, markdowns for clearance activity and the related cost impact are recorded at the time the price change decision is made. Factors considered in the determination of markdowns include current and anticipated demand, customer preferences, the age of merchandise, and seasonal trends. Timing of holidays within fiscal periods, weather, and customer preferences could cause material changes in the amount and timing of markdowns from year to year.
The allowance for shrinkage is recorded as a reduction to inventories, charged to cost of sales, and calculated as a percentage of sales for the period from the last physical inventory date to the end of the reporting period. Such estimates are based on both our current year and historical inventory results. Physical inventory counts are typically taken at each store once per year. During calendar 2023, we primarily relied on our own associates to perform physical inventory counts and utilized a third-party for small markets with a limited number of associates available for counting. During calendar 2024, we expect to continue using our own store associates for a majority of physical inventory counts, while using third-party services for smaller markets. During calendar 2023, the majority of physical counts occurred between January and July. During calendar 2024, we expect the majority of physical counts to occur between January and June. As physical inventories are completed, actual results are recorded and new go-forward allowance for shrinkage rates are established based on historical results at the individual store level. Thus, the allowance for shrinkage rates is adjusted throughout the January to June inventory cycle based on actual results. The allowance for shrinkage at February 3, 2024 and January 28, 2023 was $47.0 million and $40.9 million, respectively. The increase of $6.1 million was driven by lower aggregate sales since the last physical inventory for each store and a higher estimated shrinkage rate for 2023 compared to 2022. At February 3, 2024, a 10% difference in our shrink accrual would have affected gross margin, operating (loss) profit and (loss) income before income taxes by approximately $4.7 million. While it is not possible to quantify the impact from each cause of shrinkage, we have asset protection programs and policies aimed at minimizing shrinkage.
Store Level Long-Lived Assets
Our store level long-lived assets primarily consist of property and equipment - net and operating lease right-of-use assets. If the net book value of a store’s long-lived assets is not recoverable by the expected undiscounted future cash flows of the store, we estimate the fair value of the store’s assets and recognize an impairment charge for the excess net book value of the store’s long-lived assets over its fair value (categorized as Level 3 under the fair value hierarchy). Fair value at the store level is typically based on projected discounted cash flows over the remaining lease term.
We determine the fair value using a discounted cash flow approach that requires significant judgment with respect to sales growth and gross margin rates based upon annual forecasts and longer-range plans. These forecasts and plans are used for internal reporting purposes and are also used as the basis for external communication and guidance issued to outside parties about future business trends.
Fair value estimates used in our impairment review of long-lived assets were determined using a future cash flow model involving several assumptions. Changes in our assumptions could materially impact our fair value estimates. Assumptions critical to our fair value estimates were: (i) projected sales growth rates and (ii) gross margin rates. These and other assumptions are impacted by macroeconomic conditions and expectations of management and may change in the future based on specific facts and circumstances. While we believe the assumptions used to estimate the future cash flows are reasonable, there can be no assurance that the expected future cash flows will be realized. As a result, impairment charges that possibly would have been recognized in earlier periods may not be recognized until later periods if actual results deviate unfavorably from earlier estimates. The use of different assumptions would increase or decrease discounted cash flows or sales projections and, therefore, could change impairment determinations.
The Company uses judgment in its determination of the existence of impairment indicators at the store level, which is primarily based on operating performance. We assess the impairment of long-lived assets, primarily property and equipment and operating lease assets, whenever events or changes in circumstances indicate that the carrying value may not be recoverable. Our assessment of changes in circumstances requires significant judgment. Factors we consider important which could trigger an impairment review include the following:
38
•Significant changes in the manner of our use of assets or the strategy for the overall business;
•Significant negative industry or economic trends; and
•Significant changes resulting in a greater loss than forecasted during a period.
39
Insurance and Insurance-Related Reserves
We are self-insured for certain losses relating to property, general liability, workers’ compensation, and employee medical, dental, and prescription drug benefit claims, a portion of which is funded by employees. We purchase stop-loss coverage from third party insurance carriers to limit individual or aggregate loss exposures in these areas. Accrued insurance liabilities and related expenses are based on actual claims reported and estimates of claims incurred but not reported. The estimated loss accruals for claims incurred but not paid are determined by applying actuarially-based calculations taking into account historical claims payment results and known trends such as claims frequency and claims severity. Management makes estimates, judgments, and assumptions with respect to the use of these actuarially-based calculations, including but not limited to, estimated health care cost trends, estimated lag time to report and pay claims, average cost per claim, network utilization rates, network discount rates, and other factors. Our insurance and insurance-related reserves at February 3, 2024 and January 28, 2023 were $90.8 million and $94.5 million, respectively. The decrease of $3.7 million was driven by both workers' compensation and general liability reserves. The decrease in workers’ compensation was due to decreases in incurred development within the year. The decrease in general liability reserves was due to an increase in settlement activity in 2023 compared to 2022, partially offset by an increase in incurred development within the year. A 10% change in our self-insured liabilities at February 3, 2024 would have affected selling and administrative expenses, operating (loss) profit, and income (loss) before income taxes by approximately $7.6 million.
40
Item 7A. Quantitative and Qualitative Disclosures About Market Risk
Interest Rate Risk
We are subject to market risk from exposure to changes in interest rates on investments that we make from time to time and on borrowings under the 2022 Credit Agreement. We had $406.1 million in borrowings under the 2022 Credit Agreement at February 3, 2024. An increase of 1% in our variable interest rate on our estimated future borrowings would have an impact of approximately $4.1 million on our result of operations.
41
ITEM 8. FINANCIAL STATEMENTS AND SUPPLEMENTARY DATA
REPORT OF INDEPENDENT REGISTERED PUBLIC ACCOUNTING FIRM
To the shareholders and the Board of Directors of Big Lots, Inc.
Opinion on Internal Control over Financial Reporting
We have audited the internal control over financial reporting of Big Lots, Inc. and subsidiaries (the “Company”) as of February 3, 2024, based on criteria established in Internal Control — Integrated Framework (2013) issued by the Committee of Sponsoring Organizations of the Treadway Commission (COSO). In our opinion, the Company maintained, in all material respects, effective internal control over financial reporting as of February 3, 2024, based on criteria established in Internal Control — Integrated Framework (2013) issued by COSO.
We have also audited, in accordance with the standards of the Public Company Accounting Oversight Board (United States) (PCAOB), the consolidated financial statements as of and for the year ended February 3, 2024, of the Company and our report dated April 18, 2024, expressed an unqualified opinion on those financial statements.
Basis for Opinion
The Company’s management is responsible for maintaining effective internal control over financial reporting and for its assessment of the effectiveness of internal control over financial reporting, included in the accompanying Management’s Report on Internal Control Over Financial Reporting. Our responsibility is to express an opinion on the Company’s internal control over financial reporting based on our audit. We are a public accounting firm registered with the PCAOB and are required to be independent with respect to the Company in accordance with the U.S. federal securities laws and the applicable rules and regulations of the Securities and Exchange Commission and the PCAOB.
We conducted our audit in accordance with the standards of the PCAOB. Those standards require that we plan and perform the audit to obtain reasonable assurance about whether effective internal control over financial reporting was maintained in all material respects. Our audit included obtaining an understanding of internal control over financial reporting, assessing the risk that a material weakness exists, testing and evaluating the design and operating effectiveness of internal control based on the assessed risk, and performing such other procedures as we considered necessary in the circumstances. We believe that our audit provides a reasonable basis for our opinion.
Definition and Limitations of Internal Control over Financial Reporting
A company's internal control over financial reporting is a process designed to provide reasonable assurance regarding the reliability of financial reporting and the preparation of financial statements for external purposes in accordance with generally accepted accounting principles. A company’s internal control over financial reporting includes those policies and procedures that (1) pertain to the maintenance of records that, in reasonable detail, accurately and fairly reflect the transactions and dispositions of the assets of the company; (2) provide reasonable assurance that transactions are recorded as necessary to permit preparation of financial statements in accordance with generally accepted accounting principles, and that receipts and expenditures of the company are being made only in accordance with authorizations of management and directors of the company; and (3) provide reasonable assurance regarding prevention or timely detection of unauthorized acquisition, use, or disposition of the company’s assets that could have a material effect on the financial statements.
Because of its inherent limitations, internal control over financial reporting may not prevent or detect misstatements. Also, projections of any evaluation of effectiveness to future periods are subject to the risk that controls may become inadequate because of changes in conditions, or that the degree of compliance with the policies or procedures may deteriorate.
/s/ DELOITTE & TOUCHE LLP
Columbus, Ohio
April 18, 2024
42
REPORT OF INDEPENDENT REGISTERED PUBLIC ACCOUNTING FIRM
To the shareholders and the Board of Directors of Big Lots, Inc.
Opinion on the Financial Statements
We have audited the accompanying consolidated balance sheets of Big Lots, Inc. and subsidiaries (the “Company”) as of February 3, 2024 and January 28, 2023, the related consolidated statements of operations and comprehensive income, shareholders' equity, and cash flows, for each of the three years in the period ended February 3, 2024, and the related notes (collectively referred to as the "financial statements"). In our opinion, the financial statements present fairly, in all material respects, the financial position of the Company as of February 3, 2024 and January 28, 2023, and the results of its operations and its cash flows for each of the three years in the period ended February 3, 2024, in conformity with accounting principles generally accepted in the United States of America.
We have also audited, in accordance with the standards of the Public Company Accounting Oversight Board (United States) (PCAOB), the Company’s internal control over financial reporting as of February 3, 2024, based on criteria established in Internal Control — Integrated Framework (2013) issued by the Committee of Sponsoring Organizations of the Treadway Commission and our report dated April 18, 2024, expressed an unqualified opinion on the Company's internal control over financial reporting.
Basis for Opinion
These financial statements are the responsibility of the Company's management. Our responsibility is to express an opinion on the Company's financial statements based on our audits. We are a public accounting firm registered with the PCAOB and are required to be independent with respect to the Company in accordance with the U.S. federal securities laws and the applicable rules and regulations of the Securities and Exchange Commission and the PCAOB.
We conducted our audits in accordance with the standards of the PCAOB. Those standards require that we plan and perform the audit to obtain reasonable assurance about whether the financial statements are free of material misstatement, whether due to error or fraud. Our audits included performing procedures to assess the risks of material misstatement of the financial statements, whether due to error or fraud, and performing procedures that respond to those risks. Such procedures included examining, on a test basis, evidence regarding the amounts and disclosures in the financial statements. Our audits also included evaluating the accounting principles used and significant estimates made by management, as well as evaluating the overall presentation of the financial statements. We believe that our audits provide a reasonable basis for our opinion.
Critical Audit Matters
The critical audit matters communicated below are matters arising from the current-period audit of the financial statements that were communicated or required to be communicated to the audit committee and that (1) relate to accounts or disclosures that are material to the financial statements and (2) involved our especially challenging, subjective, or complex judgments. The communication of critical audit matters does not alter in any way our opinion on the financial statements, taken as a whole, and we are not, by communicating the critical audit matters below, providing separate opinions on the critical audit matters or on the accounts or disclosures to which they relate.
Inventory Valuation Reserves - Refer to Note 1 to the financial statements
Critical Audit Matter Description
Merchandise inventories are valued at the lower of cost or market using the average cost retail inventory method. The average cost retail inventory method requires management to make judgments and contains estimates, including the amount and timing of markdowns to clear slow-moving inventory and an estimated allowance for shrinkage, referred to as inventory valuation reserves, which may impact ending inventory valuation.
When management determines the salability of merchandise inventories is diminished, markdowns for clearance activity and the related cost impact are recorded at the time the price change decision is made. Factors considered in the determination of markdowns include current and anticipated demand, and customer preferences.
43
The inventory allowance for shrinkage is recorded as a reduction to inventories, charged to cost of sales, and calculated as a percentage of sales for the period from the last physical inventory date to the end of the reporting period.
Given the significant estimates and assumptions management utilizes to quantify inventory valuation reserves which include markdowns and the allowance for shrinkage, a high degree of auditor judgment and an increased extent of effort is required when performing audit procedures to evaluate the methodology and reasonableness of the estimates and assumptions. For markdowns, such estimates are based on the timing and completeness of recorded markdowns. For the allowance for shrinkage, such estimates are based on a combination of historical shrinkage experience and current year physical inventory results.
How the Critical Audit Matter Was Addressed in the Audit
Our audit procedures related to the measurement of inventory valuation reserves included the following, among others:
•We tested the effectiveness of controls over the completeness and measurement of inventory valuation reserves.
•We evaluated the methods and assumptions used by management to estimate markdowns by:
◦Reviewing management’s approved permanent markdowns at year end and comparing markdowns recorded after year end to the markdowns reserve at year end.
◦Comparing monthly markdown expense and the markdown reserve to historical results.
◦Comparing inventory sell through for the first period subsequent to year end to historical sell through results to evaluate the salability of merchandise inventories at year end.
•We evaluated the methods and assumptions used by management to estimate the allowance for shrinkage by:
◦Attending a selection of store physical inventories and recalculating the shrinkage for locations using the results of the store physical inventory counts observed.
◦Comparing the methodology and inputs used by management to historical results and trends in the prior years and current year.
◦Comparing management’s prior year assumptions of expected shrinkage to actual shrinkage incurred during the current year to evaluate the appropriateness of the allowance for shrinkage.
Insurance Valuation Reserves for General Liability and Workers’ Compensation - Refer to Notes 1 and 9 to the financial statements
Critical Audit Matter Description
The Company is self-insured for certain losses relating to general liability and workers’ compensation. Accrued insurance liabilities are referred to as insurance reserves. General liability and workers’ compensation insurance reserves are based on actual claims reported and estimates of claims incurred but not reported. The estimated loss accruals for claims incurred but not paid are determined by applying actuarially-based calculations taking into account historical claims payment results and known trends such as claims frequency and claims severity.
Given the significant estimates and assumptions in determination of the selected actuarial models management utilizes to quantify insurance reserves, a high degree of auditor judgment and increased extent of effort is required, including the need to involve our actuarial specialists, when performing audit procedures to evaluate whether insurance reserves were appropriately valued.
How the Critical Audit Matter Was Addressed in the Audit
Our audit procedures related to the general liability and workers’ compensation insurance reserves (“insurance reserves”) included the following, among others:
•We tested the effectiveness of controls related to insurance reserves.
•We evaluated the methods and assumptions used by management to estimate the insurance reserves by:
◦Testing the underlying data that served as the basis of the actuarial analysis, including historical claims, to test that the inputs to the actuarial estimate were reasonable.
◦Comparing management’s prior-year assumptions of expected loss to actuals incurred during the current year to evaluate the appropriateness of assumptions used to determine the insurance reserves.
•With the assistance of our actuarial specialists, we developed independent estimates of the insurance reserves, including loss and industry claim development factors, and compared our estimates to management’s estimates. Further, the actuarial specialists:
◦Assessed the actuarial models used by management for consistency with the generally accepted actuarial standards;
44
◦Evaluated management’s ability to estimate the insurance reserves by comparing its historical estimates with actual loss payments;
◦Evaluated the significant assumptions underlying management’s actuarial estimates used to determine the insurance reserves.
Impairment of Store Level Long-Lived Assets – Refer to Notes 1, 2, and 5 to the financial statements
Critical Audit Matter Description
Management assesses impairment of long-lived assets within each store level asset group, which primarily consist of property and equipment – net and operating lease right-of-use assets, whenever events or changes in circumstances indicate that the carrying amount of each asset group may not be recoverable. Some stores may generate negative cash flow or experience other events that indicate the carrying value of their long-lived assets may not be recoverable, indicating a risk that their long-lived assets might be impaired. This requires management to consider historic profitability among other store specific factors when evaluating its stores for impairment to determine whether an impairment triggering event has occurred.
If the net book value of a store’s long-lived assets is not recoverable by the expected undiscounted cash flow projections of the store, management estimates the fair value of the store’s assets and recognizes an impairment charge for the excess net book value of the store’s long-lived assets over its fair value. Fair value at the store level is typically based on discounted cash flow projections over the remaining lease term.
Management exercises significant judgment in identifying whether events or changes in circumstances indicate that store level long-lived asset carrying amounts may not be recoverable, and in the determination of assumptions used in the cash flow projections used to estimate the fair value of the store level long-lived assets. As a result, a high degree of auditor judgment and an increased extent of effort is required.
How the Critical Audit Matter Was Addressed in the Audit
Our audit procedures related to management’s identification of impairment triggering events and the determination of significant cash flow projections assumptions used to estimate fair value for store level long-lived assets included the following, among others:
•We tested the effectiveness of controls related to the impairment of long-lived assets.
•We evaluated the methodology and assumptions used by management to identify triggering events by:
◦Inspecting management’s triggering event analysis to determine if contrary evidence existed as to the completeness of the population of potentially impaired stores.
◦Identifying store level factors to be considered in the triggering event analysis by:
▪Analyzing the duration of cash flow projections used to assess store profitability;
▪Evaluating the allocation of long-lived assets to individual asset groups, as well as the identification of store level cash flow projections attributable to each asset group;
▪Comparing individual store level current and historical operating results to the general ledger to assess the reliability of information used;
▪Reading board of director meeting minutes, while considering available industry information and macroeconomic trends.
•We evaluated the methodology used by management in the determination of significant cash flow projections assumptions used to estimate fair value, specifically comparable sales projections and gross margin assumptions, by:
◦Evaluating the consistency of significant assumptions used in the future cash flow projections to management’s internal operating and long-range plan, including those communicated to the Company’s Board of Directors.
◦Evaluating significant assumptions used by management, specifically the comparable sales projections and gross margin assumptions, which includes:
▪Comparing projected levels to historical levels achieved by the Company;
▪Comparing forecasted results to available industry and macroeconomic forecasts.
/s/ DELOITTE & TOUCHE LLP
April 18, 2024
We have served as the Company’s auditor since 1989.
45
| BIG LOTS, INC. AND SUBSIDIARIES Consolidated Statements of Operations and Comprehensive (Loss) Income (In thousands, except per share amounts) | ||
| 2023 | 2022 | 2021 | |||||||||
| Net sales | $ | $ | $ | ||||||||
| Cost of sales (exclusive of depreciation expense shown separately below) | |||||||||||
| Gross margin | |||||||||||
| Selling and administrative expenses | |||||||||||
| Depreciation expense | |||||||||||
| Gain on sale of real estate | ( | ( | ( | ||||||||
| Operating (loss) profit | ( | ( | |||||||||
| Interest expense | ( | ( | ( | ||||||||
| Other income (expense) | |||||||||||
| (Loss) income before income taxes | ( | ( | |||||||||
| Income tax expense (benefit) | ( | ||||||||||
| Net (loss) income and comprehensive (loss) income | $ | ( | $ | ( | $ | ||||||
| Earnings (loss) per common share: | |||||||||||
| Basic | $ | ( | $ | ( | $ | ||||||
| Diluted | $ | ( | $ | ( | $ | ||||||
The accompanying notes are an integral part of these consolidated financial statements.
46
| BIG LOTS, INC. AND SUBSIDIARIES Consolidated Balance Sheets (In thousands, except par value) | ||
| January 28, 2023 | |||||||||||
| ASSETS | |||||||||||
| Current assets: | |||||||||||
| Cash and cash equivalents | $ | $ | |||||||||
| Inventories | |||||||||||
| Other current assets | |||||||||||
| Total current assets | |||||||||||
| Operating lease right-of-use assets | |||||||||||
| Property and equipment - net | |||||||||||
| Deferred income taxes | |||||||||||
| Other assets | |||||||||||
| Total assets | $ | $ | |||||||||
| LIABILITIES AND SHAREHOLDERS’ EQUITY | |||||||||||
| Current liabilities: | |||||||||||
| Accounts payable | $ | $ | |||||||||
| Current operating lease liabilities | |||||||||||
| Property, payroll, and other taxes | |||||||||||
| Accrued operating expenses | |||||||||||
| Insurance reserves | |||||||||||
| Accrued salaries and wages | |||||||||||
| Income taxes payable | |||||||||||
| Total current liabilities | |||||||||||
| Long-term debt | |||||||||||
| Noncurrent operating lease liabilities | |||||||||||
| Deferred income taxes | |||||||||||
| Insurance reserves | |||||||||||
| Unrecognized tax benefits | |||||||||||
| Other liabilities | |||||||||||
| Shareholders’ equity: | |||||||||||
Preferred shares - authorized | |||||||||||
Common shares - authorized | |||||||||||
Treasury shares - | ( | ( | |||||||||
| Additional paid-in capital | |||||||||||
| Retained earnings | |||||||||||
| Total shareholders’ equity | |||||||||||
| Total liabilities and shareholders’ equity | $ | $ | |||||||||
The accompanying notes are an integral part of these consolidated financial statements.
47
| BIG LOTS, INC. AND SUBSIDIARIES Consolidated Statements of Shareholders’ Equity (In thousands) | ||
| Common | Treasury | Additional Paid-In Capital | Retained Earnings | ||||||||||||||||||||
| Shares | Amount | Shares | Amount | Total | |||||||||||||||||||
| Balance - January 30, 2021 | $ | $ | ( | $ | $ | $ | |||||||||||||||||
| Comprehensive income | — | — | |||||||||||||||||||||
Dividends declared ($ | — | — | ( | ( | |||||||||||||||||||
| Purchases of common shares | ( | ( | ( | ||||||||||||||||||||
| Restricted shares vested | ( | ( | |||||||||||||||||||||
| Performance shares vested | ( | ( | |||||||||||||||||||||
| Other | |||||||||||||||||||||||
| Share-based employee compensation expense | — | — | |||||||||||||||||||||
| Balance - January 29, 2022 | ( | ||||||||||||||||||||||
| Comprehensive loss | — | — | ( | ( | |||||||||||||||||||
Dividends declared ($ | — | — | ( | ( | |||||||||||||||||||
| Purchases of common shares | ( | ( | ( | ||||||||||||||||||||
| Restricted shares vested | ( | ( | |||||||||||||||||||||
| Performance shares vested | ( | ( | |||||||||||||||||||||
| Share-based employee compensation expense | — | — | |||||||||||||||||||||
| Balance - January 28, 2023 | ( | ||||||||||||||||||||||
| Comprehensive loss | — | — | ( | ( | |||||||||||||||||||
Dividends declared ($ | — | — | ( | ( | |||||||||||||||||||
| Purchases of common shares | ( | ( | ( | ||||||||||||||||||||
| Restricted shares vested | ( | ( | |||||||||||||||||||||
| Share-based employee compensation expense | — | — | |||||||||||||||||||||
| Balance - February 3, 2024 | $ | $ | ( | $ | $ | $ | |||||||||||||||||
The accompanying notes are an integral part of these consolidated financial statements.
48
| BIG LOTS, INC. AND SUBSIDIARIES Consolidated Statements of Cash Flows (In thousands) | ||
| 2023 | 2022 | 2021 | |||||||||||||||
| Operating activities: | |||||||||||||||||
| Net (loss) income | $ | ( | $ | ( | $ | ||||||||||||
| Adjustments to reconcile net (loss) income to net cash (used in) provided by operating activities: | |||||||||||||||||
| Depreciation and amortization expense | |||||||||||||||||
| Non-cash lease expense | |||||||||||||||||
| Deferred income taxes | ( | ||||||||||||||||
| Non-cash share-based compensation expense | |||||||||||||||||
| Non-cash impairment charge | |||||||||||||||||
| (Gain) loss on disposition of property and equipment | ( | ( | |||||||||||||||
| Unrealized loss (gain) on fuel derivatives | ( | ||||||||||||||||
| Loss on extinguishment of debt | |||||||||||||||||
| Change in assets and liabilities: | |||||||||||||||||
| Inventories | ( | ||||||||||||||||
| Accounts payable | ( | ( | |||||||||||||||
| Operating lease liabilities | ( | ( | ( | ||||||||||||||
| Current income taxes | ( | ||||||||||||||||
| Other current assets | ( | ||||||||||||||||
| Other current liabilities | ( | ( | |||||||||||||||
| Other assets | ( | ( | |||||||||||||||
| Other liabilities | ( | ( | ( | ||||||||||||||
| Net cash (used in) provided by operating activities | ( | ( | |||||||||||||||
| Investing activities: | |||||||||||||||||
| Capital expenditures | ( | ( | ( | ||||||||||||||
| Cash proceeds from sale of property and equipment | |||||||||||||||||
| Other | ( | ( | ( | ||||||||||||||
| Net cash provided by (used in) investing activities | ( | ( | |||||||||||||||
| Financing activities: | |||||||||||||||||
| Net proceeds from (repayments of) long-term debt | ( | ||||||||||||||||
| Net repayments of sale and leaseback financing | ( | ( | |||||||||||||||
| Repayment of failed sale-leaseback liability | ( | ||||||||||||||||
| Payment of finance lease obligations | ( | ( | ( | ||||||||||||||
| Dividends paid | ( | ( | ( | ||||||||||||||
| Payments for other financing liabilities | ( | ||||||||||||||||
| Payment for treasury shares acquired | ( | ( | ( | ||||||||||||||
| Payments for debt issuance costs | ( | ( | |||||||||||||||
| Payments to extinguish debt | ( | ||||||||||||||||
| Other | |||||||||||||||||
| Net cash (used in) provided by financing activities | ( | ( | |||||||||||||||
| Increase (decrease) in cash and cash equivalents | ( | ( | |||||||||||||||
| Cash and cash equivalents: | |||||||||||||||||
| Beginning of year | |||||||||||||||||
| End of year | $ | $ | $ | ||||||||||||||
The accompanying notes are an integral part of these consolidated financial statements.
49
| BIG LOTS, INC. AND SUBSIDIARIES Notes to Consolidated Financial Statements | ||
NOTE 1 – BASIS OF PRESENTATION AND SUMMARY OF SIGNIFICANT ACCOUNTING POLICIES
Description of Business
We are a home discount retailer in the United States (“U.S.”). At February 3, 2024 , we operated 1,392 stores in 48 states and an e-commerce platform. Our mission is to help people Live BIG and Save LOTS. Our vision is to be the BIG difference for a better life by delivering unmistakable value to customers, building a “best places to grow” culture, rewarding shareholders with consistent growth and top tier returns, and doing good in local communities.
Basis of Presentation
The consolidated financial statements include Big Lots, Inc. and all of its subsidiaries, have been prepared in accordance with accounting principles generally accepted in the United States of America (“GAAP”), and include all of our accounts. We consolidate all majority-owned and controlled subsidiaries. All intercompany accounts and transactions have been eliminated.
Management Estimates
The preparation of financial statements in conformity with GAAP requires management to make estimates, judgments, and assumptions that affect the reported amounts of assets and liabilities at the date of the financial statements and the reported amounts of revenues and expenses during the reporting period, as well as the related disclosure of contingent assets and liabilities at the date of the financial statements. The use of estimates, judgments, and assumptions creates a level of uncertainty with respect to reported or disclosed amounts in our consolidated financial statements and accompanying notes. On an ongoing basis, management evaluates its estimates, judgments, and assumptions, including those that management considers critical to the accurate presentation and disclosure of our consolidated financial statements and accompanying notes. Management bases its estimates, judgments, and assumptions on historical experience, current trends, and various other factors that it believes are reasonable under the circumstances. Because of the inherent uncertainty in using estimates, judgments, and assumptions, actual results may differ from these estimates.
Fiscal Periods
Our fiscal year ends on the Saturday nearest to January 31, which results in fiscal years consisting of 52 or 53 weeks. Unless otherwise stated, references to years in this report relate to fiscal years rather than calendar years. Fiscal year 2023 (“2023”) was comprised of the 53 weeks that began on January 29, 2023 and ended on February 3, 2024. Fiscal year 2022 (“2022”) was comprised of the 52 weeks that began on January 30, 2022 and ended on January 28, 2023. Fiscal year 2021 (“2021”) was comprised of the 52 weeks that began on January 31, 2021 and ended on January 29, 2022.
Segment Reporting
We manage our business based on one segment, discount retailing. Our entire operation is located in the U.S.
Cash and Cash Equivalents
Cash and cash equivalents primarily consist of amounts on deposit with financial institutions, outstanding checks, and credit and debit card receivables. We review cash and cash equivalent balances on a bank by bank basis to identify book overdrafts. Book overdrafts occur when the aggregate amount of outstanding checks and electronic fund transfers exceed the cash deposited at a given bank. We reclassify book overdrafts, if any, to accounts payable on our consolidated balance sheets. Amounts due from banks for credit and debit card transactions, including private label credit card transactions, are typically settled in less than three days, and at February 3, 2024 and January 28, 2023, totaled $29.6 million and $24.7 million, respectively.
Merchandise Inventories
Merchandise inventories are valued at the lower of cost or market using the average cost retail inventory method. Cost includes any applicable inbound shipping and handling costs associated with the receipt of merchandise into our distribution centers (see the discussion below under the caption “Selling and Administrative Expenses” for additional information regarding outbound shipping and handling costs to our stores). Market is determined based on the estimated net realizable value, which generally is the merchandise selling price. Under the average cost retail inventory method, inventory is segregated into classes of merchandise having similar characteristics at its current retail selling value. Current retail selling values are converted to a cost basis by applying an average cost factor to each specific merchandise class’s retail selling value. Cost factors represent the average cost-to-retail ratio computed using beginning inventory and all fiscal year-to-date purchase activity specific to each merchandise class.
50
Under the average cost retail inventory method, permanent sales price markdowns result in cost reductions in inventory. Our permanent sales price markdowns are typically related to end of season clearance events and are recorded as a charge to cost of sales in the period of management’s decision to initiate sales price reductions with the intent not to return the price to regular retail. Promotional markdowns are recorded as a charge to net sales in the period the merchandise is sold. Promotional markdowns are typically related to specific marketing efforts with respect to products maintained continuously in our stores or products that are only available in limited quantities but represent substantial value to our customers. Promotional markdowns are principally used to drive higher sales volume during a defined promotional period.
We record a reduction to inventories and charge to cost of sales for an allowance for shrinkage. The allowance for shrinkage is calculated as a percentage of sales for the period from the last physical inventory date to the end of the reporting period. Such estimates are based on a combination of our historical experience and current year physical inventory results.
We record a reduction to inventories and charge to cost of sales for any excess or obsolete inventory. The excess or obsolete inventory is estimated based on a review of our aged inventory and takes into account any items that have already received a cost reduction as a result of the permanent markdown process discussed above. We estimate the reduction for excess or obsolete inventory based on historical sales trends, age and quantity of product on hand, and anticipated future sales.
Property and Equipment - Net
Depreciation and amortization expense of property and equipment are recorded on a straight‑line basis using estimated service lives. The estimated service lives of our depreciable property and equipment by major asset category were as follows:
| Land improvements | 15 years | ||||
| Buildings | 40 years | ||||
| Leasehold improvements | 5 - 10 years | ||||
| Store fixtures and equipment | 2 - 7 years | ||||
| Distribution and transportation fixtures and equipment | 5 - 15 years | ||||
| Office and computer equipment | 3 - 5 years | ||||
| Computer software costs | 3 - 8 years | ||||
Leasehold improvements are amortized on a straight-line basis using the shorter of their estimated service lives or the lease term.
Assets acquired under leases which meet the criteria of a finance lease are capitalized in property and equipment - net and amortized over the estimated service life of the asset or the applicable lease term, whichever is shorter.
Depreciation estimates are revised prospectively to reflect the remaining depreciation or amortization of the asset over the shortened estimated service life when a decision is made to dispose of property and equipment prior to the end of its previously estimated service life. The cost of assets sold or retired and the related accumulated depreciation are removed from the accounts with any resulting gain or loss included in selling and administrative expenses. Major repairs that extend service lives are capitalized. Maintenance and repairs are charged to expense as incurred. Capitalized interest was not significant in any period presented.
51
Long-Lived Assets
Our long-lived assets primarily consist of property and equipment - net and operating lease right-of-use assets. In order to determine if impairment indicators are present for store property and equipment and operating lease right-of-use assets, we review historical operating results at the store level. If the net book value of a store’s long-lived assets is not recoverable by the expected undiscounted future cash flows of the store, we estimate the fair value of the store’s assets and recognize an impairment charge for the excess net book value of the store’s long-lived assets over its fair value (categorized as Level 3 under the fair value hierarchy). Fair value at the store level is typically based on projected discounted cash flows over the remaining lease term.
We determine the fair value using a discounted cash flow approach that requires significant judgment with respect to sales growth and gross margin rates, based upon annual forecasts and longer-range plans. These forecasts and plans are used for internal reporting purposes and are also used as the basis for external communication and guidance issued to outside parties about future business trends.
Fair value estimates used in our impairment review of long-lived assets were determined using a future cash flow model involving several assumptions. Changes in our assumptions could materially impact our fair value estimates. Assumptions critical to our fair value estimates were: (i) projected sales growth rates and (ii) gross margin rates. These and other assumptions are impacted by macro economic conditions and expectations of management and may change in the future based on specific facts and circumstances. While we believe the assumptions used to estimate the future cash flows are reasonable, there can be no assurance that the expected future cash flows will be realized. As a result, impairment charges that possibly would have been recognized in earlier periods may not be recognized until later periods if actual results deviate unfavorably from earlier estimates. The use of different assumptions would increase or decrease discounted cash flows or sales projections and, therefore, could change impairment determinations.
Intangible Assets
In 2018, we acquired the Broyhill® trademark and trade name. This trademark and trade name have indefinite lives. We test the trademark and trade name for impairment annually or whenever circumstances indicate that the carrying value of the asset may not be recoverable. We estimate the fair value of these intangible assets based on an income approach. We perform our annual impairment testing during our fourth fiscal quarter of each year.
Savings Plans
Income Taxes
We account for income taxes under the asset and liability method, which requires the recognition of deferred tax assets and liabilities for the expected future tax consequences of events that have been included in the consolidated financial statements. Under this method, deferred tax assets and liabilities are determined based on the differences between the financial statement basis and tax basis of assets and liabilities using enacted law and tax rates in effect for the year in which the differences are expected to reverse. The effect of a change in tax rates on deferred tax assets and liabilities is recognized in income in the period that includes the enactment date.
We assess the adequacy and need for a valuation allowance for deferred tax assets. In making such assessment, we consider all available positive and negative evidence, including scheduled reversals of deferred tax liabilities, projected future taxable income, tax planning strategies and recent financial operations. We have established a valuation allowance to reduce our deferred tax assets to the balance that is more likely than not to be realized.
In 2023, based upon a triggering event that resulted from a three-year cumulative loss before income taxes, we recorded a valuation allowance against all of our deferred tax assets. See Note 8 - Income Taxes for additional details.
We recognize interest and penalties related to unrecognized tax benefits within the income tax expense line in the accompanying consolidated statements of operations and comprehensive (loss) income. Accrued interest and penalties are included within the related tax liability line in the accompanying consolidated balance sheets.
52
The effective income tax rate in any period may be materially impacted by the overall level of income (loss) before income taxes, the jurisdictional mix and magnitude of income (loss), changes in the income tax laws (which may be retroactive to the beginning of the fiscal year), subsequent recognition, de-recognition and/or measurement of an uncertain tax benefit, changes in a deferred tax valuation allowance, and adjustments of a deferred tax asset or liability for enacted changes in tax laws or rates.
Insurance and Insurance-Related Reserves
We are self-insured for certain losses relating to property, general liability, workers’ compensation, and employee medical, dental, and prescription drug benefit claims, a portion of which is paid by employees. We purchase stop-loss coverage to limit significant exposure in these areas. Accrued insurance-related liabilities and related expenses are based on actual claims filed and estimates of claims incurred but not reported and are reliably determinable. The accruals are determined by applying actuarially-based calculations.
Fair Value of Financial Instruments
The fair value hierarchy prioritizes the inputs to valuation techniques used to measure fair value. The hierarchy, as defined below, gives the highest priority to unadjusted quoted prices in active markets for identical assets or liabilities and the lowest priority to unobservable inputs.
Level 1, defined as observable inputs such as unadjusted quoted prices in active markets for identical assets or liabilities.
Level 2, defined as observable inputs other than Level 1 inputs. These include quoted prices for similar assets or liabilities in an active market, quoted prices for identical assets and liabilities in markets that are not active, or other inputs that are observable or can be corroborated by observable market data for substantially the full term of the assets or liabilities.
Level 3, defined as unobservable inputs in which little or no market data exists, therefore requiring an entity to develop its own assumptions.
The carrying value of accounts receivable and accounts payable approximates fair value because of the relatively short maturity of these items.
Revenue Recognition
We recognize sales revenue at the time the customer takes possession of the merchandise (i.e., the point at which we transfer the goods). Sales are recorded net of discounts (i.e., the amount of consideration we expect to receive for the goods) and estimated returns and exclude any sales tax. The reserve for merchandise returns is estimated based on our prior return experience.
We sell gift cards in our stores, online, and through third-party retailers, and issue merchandise credits, typically as a result of customer returns, on stored value cards. We do not charge administrative fees on unused gift card or merchandise credit balances and our gift cards and merchandise credits do not expire. We recognize sales revenue related to gift cards and merchandise credits (1) when the gift card or merchandise credit is redeemed in a sales transaction by the customer or (2) as breakage occurs. We recognize gift card and merchandise credit breakage when we estimate that the likelihood of the card or credit being redeemed by the customer is remote and we determine that we do not have a legal obligation to remit the value of unredeemed cards or credits to the relevant regulatory authority. We estimate breakage based upon historical redemption patterns. The liability for the unredeemed cash value of gift cards and merchandise credits is recorded in accrued operating expenses in our consolidated balance sheets.
We offer price hold contracts and buy now pick up later arrangements on merchandise. Revenue for price hold contracts and buy now pick up later arrangements is recognized when the customer makes the final payment and takes possession of the merchandise. Amounts paid by customers under price hold contracts and buy now pick up later arrangements are recorded in accrued operating expenses in our consolidated balance sheets until a sale is consummated.
We recognize sales revenue for direct-to-customer transactions on our e-commerce platform at the time the merchandise is shipped (i.e., the point at which we transfer the goods). We also offer buy online, pick up in store services on our e-commerce platform. Revenue for buy online, pick up in store transactions is recognized when the customer takes possession of the merchandise at the store.
Cost of Sales
Cost of sales includes the cost of merchandise, net of cash discounts and rebates, markdowns, and inventory shrinkage, and the cost of shipping direct-to-customer e-commerce orders. Cost of merchandise includes related inbound freight to our distribution centers, duties, and commissions. We classify warehousing, distribution and outbound transportation costs to our stores as
53
selling and administrative expenses. Due to this classification, our gross margin rates may not be comparable to those of other retailers that include warehousing, distribution and outbound transportation costs to stores in cost of sales.
Selling and Administrative Expenses
Selling and administrative expenses include store expenses (such as payroll and occupancy costs) and costs related to warehousing, distribution, outbound transportation to our stores, advertising, purchasing, insurance, non-income taxes, accepting credit/debit cards, and overhead. Our selling and administrative expense rates may not be comparable to those of other retailers that include warehousing, distribution, and outbound transportation costs to stores in cost of sales. Distribution and outbound transportation costs included in selling and administrative expenses were $360.1 million, $331.8 million, and $310.4 million for 2023, 2022, and 2021, respectively.
Leases and Rent Expense
We determine if an arrangement contains a lease at inception of the agreement. Our leased property consists of our retail stores, distribution centers, store security, and other office equipment. Certain of our store and distribution center leases have rent escalations and/or have tenant allowances or other lease incentives, which are fixed in nature and included in our calculation of right-of-use assets and lease liabilities. Certain of our store leases provide for contingent rents, which are recorded as variable costs and not included in our calculation of right-of-use assets and lease liabilities. Many of our leases obligate us to pay for our applicable portion of real estate taxes, common area maintenance costs (“CAM”), and property insurance, which are recorded as variable costs and not included in our calculation of right-of-use assets and lease liabilities, except for certain fixed CAM and insurance charges that are not variable. Many of our leases contain provisions for options to renew, extend the original term for additional periods, or terminate the lease if certain sales thresholds are not attained. We have assessed the reasonable certainty of these provisions to determine the appropriate lease term. Our lease agreements do not contain material residual value guarantees, restrictions, or covenants other than temporary restrictions under the sale and leaseback transactions completed in 2023, which are described in in Note 10 - Gain on Sale of Real Estate.
Advertising Expense
Advertising costs, which are expensed as incurred, consist primarily of television and print advertising, digital, social media, internet and e-mail marketing and advertising, payment card-linked marketing and in-store point-of-purchase signage and presentations. Advertising expenses are included in selling and administrative expenses. Advertising expenses were $91.5 million, $98.3 million, and $97.7 million for 2023, 2022, and 2021, respectively.
Share-Based Compensation
Share-based compensation expense is recognized in selling and administrative expense in our consolidated statements of operations and comprehensive (loss) income for all awards that we expect to vest.
Non-vested Restricted Stock Units
We expense our non-vested restricted stock units (“RSUs”) with graded vesting as a single award with an average estimated life over the entire term of the award. The expense for the non-vested restricted stock units is recorded on a straight-line basis over the vesting period.
Performance Share Units
Compensation expense for performance share units (“PSUs”) is recorded based on fair value of the award on the grant date and the estimated achievement of financial performance objectives. From an accounting perspective, the grant date is established once all financial performance targets have been set. We monitor the estimated achievement of the financial performance objectives at each reporting period and will potentially adjust the estimated expense on a cumulative basis. The expense for PSUs is recorded on a straight-line basis from the grant date through the end of the performance period.
In 2022 and 2023, we awarded performance share units with a performance condition to certain members of senior management, which vest based on the achievement of total shareholder return (“TSR”) targets relative to a peer group over a -year performance period and require the grantee to remain employed by us through the end of the performance period (“TSR PSUs”). The TSR PSUs will vest on the first trading day after we file our Annual Report on Form 10-K for the last fiscal
54
year in the performance period. We use a Monte Carlo simulation to estimate the fair value of the TSR PSUs on the grant date and recognize expense over the service period. The TSR PSUs have a contractual period of years.
In 2023, we awarded PSUs to certain members of management, which will vest if minimum financial performance objectives are achieved over a -year performance period and the grantee remains employed by us during the performance period. The financial performance objectives will be established for each fiscal year within the -year performance period and are generally approved by the Human Capital and Compensation Committee of our Board of Directors (the “Committee”) during the first quarter of the respective fiscal year. See Note 7 - Share Based Plans for a more detailed description.
Earnings per Share
Basic earnings per share is based on the weighted-average number of shares outstanding during each period. Diluted earnings per share is based on the weighted-average number of shares outstanding during each period and the additional dilutive effect of RSUs, PSUs, TSR PSUs, and SVCA PSUs calculated using the treasury stock method.
Supplemental Cash Flow Disclosures
The following table provides supplemental cash flow information for 2023, 2022, and 2021:
| (In thousands) | 2023 | 2022 | 2021 | ||||||||||||||
| Supplemental disclosure of cash flow information: | |||||||||||||||||
| Cash paid for interest | $ | $ | $ | ||||||||||||||
| Cash paid for income taxes, excluding impact of refunds | |||||||||||||||||
| Gross proceeds from long-term debt | |||||||||||||||||
| Gross payments of long-term debt | |||||||||||||||||
| Gross repayments of financing from sale and leaseback | |||||||||||||||||
| Cash paid for operating lease liabilities | |||||||||||||||||
| Non-cash activity: | |||||||||||||||||
| Assets acquired under finance leases | |||||||||||||||||
| Accrued property and equipment | |||||||||||||||||
| Operating lease right-of-use assets obtained in exchange for operating lease liabilities | $ | $ | $ | ||||||||||||||
Reclassifications
Our six merchandise categories are as follows: Food; Consumables; Soft Home; Hard Home and Other; Furniture; and Seasonal. The Food category includes our beverage & grocery; specialty foods; and candy & snacks departments. The Consumables category includes our health, beauty and cosmetics; plastics; paper; pet; infant; stationery; and chemical departments. The Soft Home category includes our apparel; hosiery; jewelry; frames; fashion bedding; utility bedding; bath; window; decorative textile; and area rugs departments. The Hard Home and Other category includes our small appliances; table top; food preparation; home maintenance; home organization; toys; and electronics departments; and other offerings. The Furniture category includes our upholstery; mattress; ready-to-assemble; home décor; and case goods departments. The Seasonal category includes our lawn & garden; summer; Christmas; and other holiday departments.
In the fourth quarter of 2023, we realigned our merchandise categories and eliminated our Apparel, Electronics, & Other merchandise category. We have reallocated the departments that previously comprised Apparel, Electronics, & Other into the following merchandise categories: Hard Home and Other, Soft Home, Consumables, and Food.
We periodically assess, and make minor adjustments to, our product hierarchy, which can impact the roll-up of our merchandise categories. Our financial reporting process utilizes the most current product hierarchy in reporting net sales by merchandise category for all periods presented. Therefore, in addition to the realignment noted above, there may be minor reclassifications of net sales by merchandise category compared to previously reported amounts.
In addition, certain amounts in our Consolidated Financial Statements for the year ended January 28, 2023 were adjusted to conform to our 2023 presentation. The Company believes these reclassifications are immaterial.
55
Recently Adopted Accounting Standards
In the third quarter of 2021, the Company adopted Accounting Standards Update (“ASU”) 2020-04 Reference Rate Reform. This ASU provides optional expedients and exceptions for applying generally accepted accounting principles to contracts, hedging relationships, leases, and other transactions affected by the potential fallback of LIBOR. The Company adopted ASU 2020-04 in connection with its entry into a new credit facility (see Note 3 to the consolidated financial statements) that includes language to address LIBOR fallback and in connection with an amendment to the lease for AVDC including similar LIBOR fallback language. The impact of the adoption was immaterial to the consolidated financial statements.
In September 2022, the Financial Accounting Standards Board (“FASB”) issued ASU 2022-04, Enhanced Disclosures about the Supplier Finance Programs. ASU 2022-04 requires buyers in supplier finance programs to disclose qualitative and quantitative information about their supplier finance programs. The Company adopted this ASU in fiscal year 2023, except for the disclosure of rollforward activity, which is effective on a prospective basis beginning in fiscal year 2024. See Note 12, Supplier Financing for disclosure related to the Company’s supplier financing program obligations.
Recent Accounting Pronouncements
In November 2023, the FASB issued ASU 2023-07, Segment Reporting (Topic 280) - Improvements to Reportable Segment Disclosures, which updates reportable segment disclosure requirements primarily through enhanced disclosures about significant segment expenses. The amendments are effective for fiscal years beginning after December 15, 2023, and for interim periods within fiscal years beginning after December 15, 2024. Early adoption is permitted. The amendments should be applied retrospectively to all prior periods presented in the financial statements. Management is currently evaluating this ASU to determine its impact on the Company's disclosures.
In December 2023, the FASB issued ASU 2023-09, Income Taxes (Topic 740): Improvements to Income Tax Disclosures, which expands the requirements for income tax disclosures in order to provide greater transparency. The amendments are effective for fiscal years beginning after December 15, 2024. Early adoption is permitted. The amendments should be applied prospectively. Management is currently evaluating this ASU to determine its impact on the Company's disclosures.
NOTE 2 – PROPERTY AND EQUIPMENT - NET
Property and equipment - net consist of:
| (In thousands) | January 28, 2023 | |||||||
| Land and land improvements | $ | $ | ||||||
| Buildings and leasehold improvements | ||||||||
| Fixtures and equipment | ||||||||
| Computer software costs | ||||||||
| Construction-in-progress | ||||||||
| Property and equipment - cost | ||||||||
| Less accumulated depreciation and amortization | ||||||||
| Property and equipment - net | $ | $ | ||||||
Property and equipment - cost includes $31.2 million and $24.6 million at February 3, 2024 and January 28, 2023, respectively, to recognize assets from finance leases. Accumulated depreciation and amortization includes $22.5 million and $20.8 million at February 3, 2024 and January 28, 2023, respectively, related to finance leases.
During 2023, 2022, and 2021, respectively, we invested $63.1 million, $159.4 million, and $160.8 million of cash in capital expenditures and we recorded $144.5 million, $154.9 million, and $142.6 million of depreciation expense.
In 2022, land and building-related assets for 25 owned store locations and one unoccupied land parcel with an aggregate carrying value of $30.6 million were classified as held for sale on the consolidated balance sheets. In the fourth quarter of 2022, we sold $29.4 million of these assets that we classified as held for sale in connection with the sale of 20 owned properties and one land parcel (see Note 10 to the accompanying consolidated financial statements for additional information on the sale of real estate).
56
In 2023, we disposed of $123.1 million of property and equipment - cost in connection with the sale of the AVDC and 23 owned store locations in sale and leaseback transactions (see Note 10 to the accompanying consolidated financial statements for additional information on the sale and leaseback transactions).
In 2023, separate from the aforementioned sale and leaseback transactions noted above, the Company completed the sale of three owned store locations that were classified as held for sale at the end of fiscal 2022, with an aggregate net book value of $3.6 million. The net cash proceeds on the sale of real estate were $11.3 million and resulted in a gain after related expenses of $7.7 million, which was recorded in gain on sale of real estate in the accompanying consolidated statements of operations and comprehensive (loss) income.
We incurred $32.4 million, $17.9 million, and $0.9 million in asset impairment charges, recorded within property and equipment - net (see Note 5 to the accompanying consolidated financial statements for more information regarding operating lease right-of-use assets impairments), in 2023, 2022, and 2021, respectively. We impaired the value of property and equipment assets at 354 , 155 , and eight stores as a result of our long-lived asset impairment review in 2023, 2022, and 2021, respectively.
NOTE 3 – DEBT
Bank Credit Facility
On September 21, 2022, we entered into a -year asset-based revolving credit facility (“2022 Credit Agreement”) in an aggregate committed amount of up to $900 million (the “Commitments”) that expires on September 21, 2027. In connection with our entry into the 2022 Credit Agreement, we paid bank fees and other expenses in the aggregate amount of $3.4 million, which are being amortized over the term of the 2022 Credit Agreement.
The 2022 Credit Agreement replaced the $600 million -year unsecured credit facility we entered into on September 22, 2021 (“2021 Credit Agreement”). The 2021 Credit Agreement was scheduled to expire on September 22, 2026, but was terminated concurrent with our entry into the 2022 Credit Agreement. We did not incur any material early termination penalties in connection with the termination of the 2021 Credit Agreement.
Revolving loans under the 2022 Credit Agreement are available in an aggregate amount equal to the lesser of (1) the aggregate Commitments and (2) a borrowing base consisting of eligible credit card receivables and eligible inventory (including in-transit inventory), subject to customary exceptions and reserves. Under the 2022 Credit Agreement, we may obtain additional Commitments on no more than five occasions in an aggregate amount of up to $300 million, subject to agreement by the lenders to increase their respective Commitments and certain other conditions. The 2022 Credit Agreement includes a swing loan sublimit of 10 % of the then applicable aggregate Commitments and a $90 million letter of credit sublimit. Loans made under the 2022 Credit Agreement may be prepaid without penalty. Borrowings under the 2022 Credit Agreement are available for general corporate purposes, working capital and to repay certain of our indebtedness. Our obligations under the 2022 Credit Agreement are secured by our working capital assets (including inventory, credit card receivables and other accounts receivable, deposit accounts, and cash), subject to customary exceptions. The pricing and certain fees under the 2022 Credit Agreement fluctuate based on our availability under the 2022 Credit Agreement. The 2022 Credit Agreement allows us to select our interest rate for each borrowing from multiple interest rate options. The interest rate options are generally derived from the prime rate or one, three or six month adjusted Term SOFR. We will also pay an unused commitment fee of 0.20 % per annum on the unused Commitments. The 2022 Credit Agreement contains an environmental, social and governance (“ESG”) provision, which may provide favorable pricing and fee adjustments if we meet ESG performance criteria to be established by a future amendment to the 2022 Credit Agreement.
The 2022 Credit Agreement contains customary affirmative and negative covenants (including, where applicable, restrictions on our ability to, among other things, incur additional indebtedness, pay dividends, redeem or repurchase stock, prepay certain indebtedness, make certain loans and investments, dispose of assets, enter into restrictive agreements, engage in transactions with affiliates, modify organizational documents, incur liens and consummate mergers and other fundamental changes) and events of default. In addition, the 2022 Credit Agreement requires us to maintain a fixed charge coverage ratio of not less than 1.0 if (1) certain events of default occur and continue or (2) borrowing availability under the 2022 Credit Agreement is less than the greater of (a) 10 % of the Maximum Credit Amount (as defined in the 2022 Credit Agreement) or (b) $67.5 million. A violation of these covenants could result in a default under the 2022 Credit Agreement which could permit the lenders to restrict our ability to further access the 2022 Credit Agreement for loans and letters of credit and require the immediate repayment of any outstanding loans under the 2022 Credit Agreement. As of February 3, 2024, the fixed charge coverage ratio was not applicable under the 2022 Credit Agreement.
As of February 3, 2024 , we had a Borrowing Base (as defined under the 2022 Credit Agreement) of $739.5 million under the 2022 Credit Agreement. At February 3, 2024 , we had $406.1 million in borrowings outstanding under the 2022 Credit
57
Agreement and $52.1 million committed to outstanding letters of credit, leaving $281.3 million available under the 2022 Credit Agreement, subject to certain borrowing base limitations as discussed above. At February 3, 2024 , we had $207.4 million available under the 2022 Credit Agreement, net of the borrowing base limitations discussed above.
Secured Insurance Premium Financing Obligation
In the second quarter of 2023, we entered into three individual financing agreements (“2023 Term Notes”) in an aggregate amount of $16.2 million, which are secured by unearned prepaid insurance premiums. The 2023 Term Notes will expire between January 2024 and May 2024 . We are required to make monthly payments over the term of the 2023 Term Notes and are permitted to prepay, subject to penalties, at any time. The 2023 Term Notes carry annual interest rates ranging from 7.1 % to 8.5 %. The Company did not receive any cash in connection with its entry into the 2023 Term Notes.
In 2023, we entered into an immaterial financing arrangement for server and software equipment, which is included within the 2023 term notes balance noted within the table below.
Debt was recorded in our consolidated balance sheets as follows:
Instrument (In thousands) | February 3, 2024 | January 28, 2023 | ||||||||||||
| 2022 Credit Agreement | $ | $ | ||||||||||||
| 2023 Term Notes | ||||||||||||||
| Total debt | $ | $ | ||||||||||||
| Less current portion of long-term debt (included in Accrued operating expenses) | $ | $ | — | |||||||||||
| Long-term debt | $ | $ | ||||||||||||
NOTE 4 – Synthetic Lease
Synthetic Lease
The 2023 Synthetic Lease related to our Apple Valley, CA distribution center was terminated and paid off on August 25, 2023 in connection with the closing of the sale and leaseback transactions described in more detail in Note 10 - Gain on Sale of Real Estate.
On March 15, 2023 , AVDC, LLC (“Lessee”), a wholly-owned indirect subsidiary of the Company, Bankers Commercial Corporation (“Lessor”), the rent assignees parties thereto (“Rent Assignees” and, together with Lessor, “Participants”), MUFG Bank, Ltd., as collateral agent for the Rent Assignees (in such capacity, “Collateral Agent”), and MUFG Bank, Ltd., as administrative agent for the Participants, entered into a Participation Agreement (the “Participation Agreement”), pursuant to which the Participants funded $100 million to Wachovia Service Corporation (“Prior Lessor”) to finance Lessor’s purchase of the land and building related to our Apple Valley, CA distribution center (“Leased Property”) from the Prior Lessor.
Also on March 15, 2023 , we entered into a Lease Agreement and supplement to the Lease Agreement (collectively, the “Lease” and together with the Participation Agreement and related agreements, the “2023 Synthetic Lease”) pursuant to which the Lessor leased the Leased Property to Lessee for an initial term of 60 months. The Lease could have been extended for up to an additional five years, in one-year or longer annual periods, with each renewal subject to approval by the Participants. GAAP treatment of the synthetic lease refinancing transaction required us to treat the assignment of the purchase option from Prior Lessor to Lessor as a deemed acquisition of the Leased Property due to the Company’s control of the Leased Property under GAAP at the time the assigned purchase option was exercised. Accordingly, the Company applied sale and leaseback accounting to the transfer of the property from the Prior Lessor to the Lessor. The transaction met the criteria of a “failed sale-leaseback” under GAAP, which required us to record an asset for the deemed acquisition and an equivalent financing liability that represents the cost to acquire the Leased Property. As the 2023 Synthetic Lease was terminated on August 25, 2023, the previously recorded asset and financing liability were sold as part of the sale and leaseback transactions described in more detail in Note 10 - Gain on Sale of Real Estate.
Concurrently with Lessor’s purchase of the Leased Property from Prior Lessor, the participation agreement and lease agreement associated with our former synthetic lease arrangement, in each case entered into on November 30, 2017, and most recently
58
NOTE 5 – LEASES
Our leased property consists of our retail stores, distribution centers, store security, and other office equipment.
As of February 3, 2024 , we have four long-term distribution center leases including financing liabilities as a result of the sale and leaseback transactions completed in 2020. The current portion of the financing liability was recorded in accrued operating expenses in our consolidated balance sheets. The noncurrent portion of the financing liability was recorded in other liabilities in our consolidated balance sheets. Interest expense is recognized on the financing liability using the effective interest method and the financing liability will be accreted over the duration of the lease agreements. All current and future payments to the buyer-lessor will be allocated between the financing liability and the lease liabilities.
In the fourth quarter of 2022, we completed the sale of 20 owned properties and one land parcel. As part of the consideration in the sale, the leases for two previously leased stores were cancelled at no additional cost. As a result of these lease cancellations, we derecognized $4.0 million in operating lease right-of-use assets and $5.9 million in operating lease liabilities resulting in a net gain on extinguishment of lease liabilities of $1.9 million (see Note 10 to the accompanying consolidated financial statements for additional information on the transaction).
In the third quarter of 2023, we simultaneously terminated the 2023 Synthetic Lease for the AVDC, took title to the AVDC property, and completed sale and leaseback transactions for the AVDC and 23 owned store locations (“Sale and leaseback Stores”). The transactions, which were completed with the same buyer-lessor of our four other regional distribution centers, also included a five-year extension of the lease for our Columbus, OH distribution center (“CODC”). The leases for the Sale and leaseback Stores will have an initial term of 20 years and multiple extension options. At lease commencement, we determined that none of the extension options were reasonably certain to be exercised. Therefore, none of the extension options were included in the computation of the operating lease liabilities and operating lease right-of-use assets. At commencement of the leases, we recorded aggregate operating lease liabilities of $224.2 million and aggregate operating lease right-of-use assets of $260.6 million, the latter of which included prepaid rent of $36.5 million. The weighted average discount rate for the leases was 10.6 %. All of the leases are absolute net. Additionally, all of the leases include a right of first refusal beginning after the fifth year of the initial term which allows us to purchase the leased property if the buyer-lessor receives a bona fide purchase offer from a third-party. For additional information regarding the sale and leaseback transactions, see Note 10 to the accompanying consolidated financial statements.
Leases were recorded in our consolidated balance sheets as follows:
Leases (In thousands) | Balance Sheet Location | January 28, 2023 | |||||||||
| Assets | |||||||||||
| Operating | Operating lease right-of-use assets | $ | $ | ||||||||
| Finance | Property and equipment - net | ||||||||||
| Total right-of-use assets | $ | $ | |||||||||
| Liabilities | |||||||||||
| Current | |||||||||||
| Operating | Current operating lease liabilities | $ | $ | ||||||||
| Finance | Accrued operating expenses | ||||||||||
| Noncurrent | |||||||||||
| Operating | Noncurrent operating lease liabilities | ||||||||||
| Finance | Other liabilities | ||||||||||
| Total lease liabilities | $ | $ | |||||||||
59
The components of lease costs were as follows:
Lease cost (In thousands) | Statements of Operations and Comprehensive (Loss) Income Location | 2023 (1) | 2022 | 2021 | ||||||||||
| Operating lease cost | Selling and administrative expenses | $ | $ | |||||||||||
| Finance lease cost | ||||||||||||||
| Amortization of leased assets | Depreciation | |||||||||||||
| Interest on lease liabilities | Interest expense | |||||||||||||
| Short-term lease cost | Selling and administrative expenses | |||||||||||||
| Variable lease cost | Selling and administrative expenses | |||||||||||||
| Total lease cost | $ | $ | $ | |||||||||||
(1) Included in the 2023 operating lease cost and recorded within selling and administrative expenses of the statements of operations and comprehensive (loss) and income was a termination fee of $53.6 million related to the refinancing of the 2023 Synthetic Lease.
In 2023, 2022, and 2021, our operating lease cost above included $0.0 million , $1.8 million and $1.1 million, respectively, of right-of-use asset impairment charges related to store closures prior to lease termination date. In 2023, 2022, and 2021, our operating lease cost above excluded $119.0 million, $50.5 million, and $4.1 million respectively, of right-of-use asset impairment charges related to our long-lived asset impairment review for underperforming stores.
Maturity of our lease liabilities at February 3, 2024 , was as follows:
Fiscal Year (In thousands) | Operating Leases | Finance Leases | |||||||||
| 2024 | $ | $ | |||||||||
| 2025 | |||||||||||
| 2026 | |||||||||||
| 2027 | |||||||||||
| 2028 | |||||||||||
| Thereafter | |||||||||||
| Total lease payments | $ | $ | |||||||||
| Less amount to discount to present value | $ | ( | $ | ( | |||||||
| Present value of lease liabilities | $ | $ | |||||||||
Lease term and discount rate for our operating leases were as follows:
| January 28, 2023 | ||||||||
| Weighted average remaining lease term (years) | ||||||||
| Weighted average discount rate | % | % | ||||||
Our weighted average discount rate represents our estimated incremental borrowing rate, assuming a secured borrowing, based on the remaining lease term at the time of adoption of the standard, lease commencement, or the period in which the lease term expectation was modified. Our finance leases, and the associated remaining lease term and discount rate, are insignificant.
60
NOTE 6 – SHAREHOLDERS’ EQUITY
Earnings per Share
There were no adjustments required to be made to weighted-average common shares outstanding for purposes of computing basic and diluted earnings per share for all periods presented. At February 3, 2024 , “TSR PSUs” (see Note 7 for a more detailed description of these awards), shareholder value creation awards (“SVCA PSUs” - see Note 7 for a more detailed description of these awards), and RSUs with a minimum performance requirement (see Note 7 for a more detailed description of these awards) were excluded from our computation of earnings (loss) per share because the minimum applicable performance conditions had not been attained. Antidilutive RSUs, PSUs, SVCA PSUs, and TSR PSUs are excluded from the calculation because they decrease the number of diluted shares outstanding under the treasury stock method. The aggregate number of RSUs, PSUs, SVCA PSUs, and TSR PSUs that were antidilutive, as determined under the treasury stock method, were 1.5 million for 2023, 0.4 million for 2022 and 0.2 million for 2021. Due to the net loss in 2023 and 2022, any potentially dilutive shares were excluded from the denominator in computing diluted earnings (loss) per common share for 2023 and 2022.
A reconciliation of the number of weighted-average common shares outstanding used in the basic and diluted earnings per share computations is as follows:
| (In thousands) | 2023 | 2022 | 2021 | ||||||||
| Weighted-average common shares outstanding: | |||||||||||
| Basic | |||||||||||
| Dilutive effect of share-based awards | |||||||||||
| Diluted | |||||||||||
Share Repurchases
On December 1, 2021, our Board of Directors authorized the repurchase of up to $250 million of our common shares (“2021 Repurchase Authorization”). Pursuant to the 2021 Repurchase Authorization, we may repurchase shares in the open market and/or in privately negotiated transactions at our discretion, subject to market conditions and other factors. The 2021 Repurchase Authorization has no scheduled termination date. In 2023, no shares were repurchased under the 2021 Repurchase Authorization. As of February 3, 2024 , we had $159.4 million available for future repurchases under the 2021 Repurchase Authorization.
Common shares acquired through repurchase authorizations are held in treasury at cost and are available to meet obligations under equity compensation plans and for general corporate purposes.
In addition to shares repurchased under the repurchase authorizations, purchases of common shares reported in the consolidated statements of shareholders’ equity and the consolidated statements of cash flows include shares repurchased to satisfy income tax withholdings associated with the vesting of share-based awards. In 2022 and 2023, purchases of common shares reported in the consolidated statements of shareholders’ equity and consolidated statements of cash flows were solely comprised of shares repurchased to satisfy income tax withholdings associated with the vesting of share-based awards.
61
Dividends
The Company declared and paid cash dividends per common share during the periods presented as follows:
| Dividends Per Share | Amount Declared | Amount Paid | |||||||||||||||
| 2022: | (In thousands) | (In thousands) | |||||||||||||||
| First quarter | $ | $ | $ | ||||||||||||||
| Second quarter | |||||||||||||||||
| Third quarter | |||||||||||||||||
| Fourth quarter | |||||||||||||||||
| Total | $ | $ | $ | ||||||||||||||
| 2023: | |||||||||||||||||
| First quarter | $ | $ | $ | ||||||||||||||
| Second quarter | ( | ||||||||||||||||
| Third quarter | ( | ||||||||||||||||
| Fourth quarter | ( | ||||||||||||||||
| Total | $ | $ | $ | ||||||||||||||
The amount of dividends declared may vary from the amount of dividends paid in a period due to the vesting of share-based awards. Furthermore, dividends declared may fluctuate on a periodic basis due to the forfeiture of unpaid dividends associated with unvested share-based awards. Forfeitures of unpaid dividends result in a reversal of amounts previously declared which may produce a negative balance during the period. On May 23, 2023 , our Board of Directors suspended the Company’s quarterly cash dividend. The payment of any future dividends will be at the discretion of our Board of Directors and will depend on our financial condition, results of operations, capital requirements, compliance with applicable laws and agreements and any other factors deemed relevant by our Board of Directors.
NOTE 7 – SHARE-BASED PLANS
Our shareholders approved the Big Lots 2020 Long-Term Incentive Plan (“2020 LTIP”) in June 2020. The 2020 LTIP authorizes the issuance of incentive and nonqualified stock options, restricted stock, restricted stock units, deferred stock units, performance shares, PSUs, stock appreciation rights, cash-based awards, and other share-based awards. We have issued RSUs, SVCA PSUs, PSUs, and TSR PSUs under the 2020 LTIP. The number of common shares available for issuance under the 2020 LTIP as originally approved by our shareholders consisted of an initial allocation of 3,600,000 common shares plus any common shares subject to the 1,360,943 outstanding awards as of February 1, 2020 under the Big Lots 2017 Long-Term Incentive Plan (“2017 LTIP”) that, on or after February 1, 2020, cease for any reason to be subject to such awards (other than by reason of exercise or settlement). The Human Capital and Compensation Committee of our Board of Directors (“Committee”), which is charged with administering the 2020 LTIP, has the authority to determine the terms of each award under the 2020 LTIP.
In 2023, our shareholders approved the amended and restated 2020 LTIP which became effective on May 23, 2023 . The amended and restated 2020 LTIP increased the aggregate number of Common Shares available for grant under the 2020 LTIP by 1,250,000 shares and limited the recycling of Common Shares withheld to satisfy tax withholding obligations on equity awards.
Our former equity compensation plan, the 2017 LTIP, approved by our shareholders in May 2017, was terminated on June 10, 2020. The 2017 LTIP authorized the issuance of incentive and nonqualified stock options, restricted stock, restricted stock units, deferred stock awards, PSUs, stock appreciation rights, cash-based awards, and other share-based awards. We have issued RSUs, and PSUs under the 2017 LTIP.
Share-based compensation expense was $11.6 million, $14.8 million, and $39.6 million in 2023, 2022, and 2021, respectively.
62
Non-vested Restricted Stock
The following table summarizes the non-vested RSUs activity for fiscal years 2021, 2022, and 2023:
| Number of Shares | Weighted Average Grant-Date Fair Value Per Share | |||||||
| Outstanding non-vested restricted stock at January 30, 2021 | $ | |||||||
| Granted | ||||||||
| Vested | ( | |||||||
| Forfeited | ( | |||||||
| Outstanding non-vested restricted stock at January 29, 2022 | $ | |||||||
| Granted | ||||||||
| Vested | ( | |||||||
| Forfeited | ( | |||||||
| Outstanding non-vested restricted stock at January 28, 2023 | $ | |||||||
| Granted | ||||||||
| Vested | ( | |||||||
| Forfeited | ( | |||||||
| Outstanding non-vested restricted stock at February 3, 2024 | $ | |||||||
The non-vested RSUs granted in 2021, 2022, and 2023 generally vest, and are expensed, on a ratable basis over three years from the grant date of the award, if the grantee remains employed by us through the vesting dates and in the case of the RSUs granted in 2021 and 2022, if a threshold financial performance objective is achieved. The financial performance objective was achieved for the 2021 RSUs. We estimated the attainment of the financial performance objective associated with certain RSUs granted in 2022 will fall below the minimum required performance threshold. The RSUs granted in 2023 are not subject to any financial performance objective.
Performance Share Units
We awarded PSUs to certain members of management in 2021, 2022 and 2023, which will vest if certain financial performance objectives are achieved over a -year performance period and the grantee remains employed by us through that performance period. The financial performance objectives for each fiscal year within the -year performance period are generally approved by the Committee during the first quarter of the respective fiscal year.
As a result of the process used to establish the financial performance objectives, we will only meet the requirements for establishing a grant date for PSUs issued in 2021 and 2022 when we communicate the financial performance objectives for the third fiscal year of the award to the award recipients, which will then trigger the service inception date, the fair value of the awards, and the associated expense recognition period. If we meet the applicable threshold financial performance objectives over the -year performance period and the grantee remains employed by us through the end of the performance period, the PSUs will vest on the first trading day after we file our Annual Report on Form 10-K for the last fiscal year in the performance period.
The financial performance objectives for 2023 were established in the third quarter of 2023, which resulted in the establishment of the service inception date, the fair value of the awards, and the associated expense recognition period for the 2021 PSUs.
The number of shares distributed upon vesting of the 2021 PSUs depended on the average performance attained during the three-year performance period compared to the financial performance objectives established by the Committee, and may result in the distribution of an amount of shares that is greater or less than the number of 2021 PSUs granted, as defined in the award agreement. The performance period for the 2021 PSUs ended on February 3, 2024 , and it was determined that we did not meet the financial performance objectives applicable to the 2021 PSUs. As a result, the 2021 PSUs will be forfeited on the first trading day after the filing of this Form 10-K and no share-based compensation expense has been recognized with respect to the 2021 PSUs.
In 2023, we issued PSUs to certain members of management, which will vest if minimum financial performance objectives are achieved over a -year performance period and the grantee remains employed by us during the performance period. The
63
financial performance objectives will be established for each fiscal year within the -year performance period and are generally approved by the Committee during the first quarter of the respective fiscal year.
As a result of the process used to establish the financial performance objectives, we met the requirements for establishing a grant date and subsequently the service inception date, fair value of the awards, and associated expense recognition period for the first tranche of 2023 PSUs after the Committee established the 2023 fiscal year financial performance objectives in the third quarter of 2023. If we meet the applicable threshold financial performance objectives for any of the three tranches and the grantee remains employed by us through the end of the performance period, the PSUs will vest on the first trading day after we file our Annual Report on Form 10-K for the last fiscal year in the -year performance period. The 2023 financial performance objectives established in the third quarter of 2023 applied to the 2021 PSU awards, 2022 PSU awards, and 2023 PSU awards.
The number of shares distributed upon vesting of the 2023 PSUs depends on the average performance attained during the -year performance period compared to the financial performance objectives established by the Committee, and may result in the distribution of an amount of shares that is equal to or less than the number of 2023 PSUs granted. As of February 3, 2024 the performance period for the first tranche of the 2023 PSU awards ended and it was determined that the threshold financial performance objectives had been achieved. As a result, the shares previously granted for the first tranche of the 2023 PSU awards will vest on the first trading day after filing of this Form 10-K, subject to completion of the requisite service period.
In 2022 and 2023, in addition to PSUs, we also awarded TSR PSUs to certain members of management, which vest based on the achievement of TSR targets relative to a peer group over a -year performance period and require the grantee to remain employed by us through the end of the performance period. If we meet the applicable performance thresholds over the -year performance period and the grantee remains employed by us through the end of the performance period, the TSR PSUs will vest on the first trading day after we file our Annual Report on Form 10-K for the last fiscal year in the performance period. We use a Monte Carlo simulation to estimate the fair value of the TSR PSUs on the grant date and recognize expense over the service period. The TSR PSUs have a contractual period of years.
The number of shares distributed upon vesting of the TSR PSUs depends on the average performance attained during the -year performance period compared to the performance targets established by the Committee, and may result in the distribution of an amount of shares that is greater or less than the number of TSR PSUs granted, as defined in the award agreement. As of February 3, 2024 , we have granted 171,378 TSR PSU shares, which will be expensed over the requisite service period.
In 2023, we also awarded SVCA PSUs to certain members of management, which vest based on the achievement of multiple share price performance goals over a -year contractual term and require the grantee to remain employed by us through the end of the contractual term. We use a Monte Carlo simulation to estimate the fair value of the SVCA PSUs on the grant date and recognize expense ratably over the service period. If we meet the applicable performance thresholds over the -year performance period and the grantee remains employed by us through the end of the contractual term, the SVCA PSUs will vest at the end of the contractual term. If the share price performance goals applicable to the SVCA PSUs are not achieved prior to expiration, the unvested portion of the awards will be forfeited.
We have begun, or expect to begin, recognizing expense related to PSUs, TSR PSUs, and SVCA PSUs as follows:
| Issue Year | PSU Category | Outstanding Units at February 3, 2024 | Actual Grant Date | Expected Valuation (Grant) Date | Actual or Expected Expense Period | ||||||||||||
| 2021 | PSU | August 2023 | Fiscal 2023 | ||||||||||||||
| 2022 | TSR PSU | Fiscal 2022 | Fiscal 2022 - 2024 | ||||||||||||||
| 2022 | PSU | March 2024 | Fiscal 2024 | ||||||||||||||
| 2023 | PSU ("FY23 Tranche") | August 2023 | Fiscal 2023 - 2025 | ||||||||||||||
| 2023 | PSU ("FY24 Tranche") | March 2024 | Fiscal 2024 - 2025 | ||||||||||||||
| 2023 | PSU ("FY25 Tranche") | March 2025 | Fiscal 2025 | ||||||||||||||
| 2023 | TSR PSU | March 2023 | Fiscal 2023 - 2025 | ||||||||||||||
| 2023 | SVCA PSU | March 2023 | Fiscal 2023 - 2025 | ||||||||||||||
| Total | |||||||||||||||||
In 2023, 2022, and 2021, we recognized $1.8 million, $1.0 million and $25.2 million, respectively, in share-based compensation expense related to PSUs, TSR PSUs, and SVCA PSUs.
64
The following table summarizes the activity related to PSUs, TSR PSUs, and SVCA PSUs for 2021, 2022, and 2023:
| Number of Shares | Weighted Average Grant-Date Fair Value Per Share | |||||||
| Outstanding PSUs and TSR PSUs at January 30, 2021 | $ | |||||||
| Granted | ||||||||
| Vested | ( | |||||||
| Forfeited | ( | |||||||
| Outstanding PSUs and TSR PSUs at January 29, 2022 | $ | |||||||
| Granted | ||||||||
| Vested | ( | |||||||
| Forfeited | ( | |||||||
| Outstanding PSUs and TSR PSUs at January 28, 2023 | $ | |||||||
| Granted | ||||||||
| Vested | ||||||||
| Forfeited | ( | |||||||
| Outstanding PSUs, TSR PSUs, and SVCA PSUs at February 3, 2024 | $ | |||||||
Board of Directors’ Awards
In 2021, 2022, and 2023 we granted (1) the chairman of our Board of Directors an annual RSU award having a grant date fair value of approximately $245,000 145,000
During 2023, 2022, and 2021, the following activity occurred under our share-based compensation plans:
| (In thousands) | 2023 | 2022 | 2021 | ||||||||
| Total fair value of restricted stock vested | |||||||||||
| Total fair value of PSU, TSR PSUs, and SVCA PSUs vested | $ | $ | $ | ||||||||
The total unearned compensation cost related to all share-based awards outstanding, excluding PSUs issued in 2022 and the second and third tranches of the 2023 PSUs, at February 3, 2024 was approximately $16.9 million. This compensation cost is expected to be recognized through January 2027 based on existing vesting terms with the weighted-average remaining expense recognition period being approximately 1.9 years from February 3, 2024 .
65
NOTE 8 – INCOME TAXES
The provision for income taxes was comprised of the following:
| (In thousands) | 2023 | 2022 | 2021 | ||||||||
| Current: | |||||||||||
| U.S. Federal | $ | ( | $ | ( | $ | ||||||
| U.S. State and local | ( | ( | |||||||||
| Total current tax (benefit) expense | ( | ( | |||||||||
| Deferred: | |||||||||||
| U.S. Federal | ( | ||||||||||
| U.S. State and local | ( | ||||||||||
| Total deferred tax expense (benefit) | ( | ||||||||||
Income tax provision (a) | $ | $ | ( | $ | |||||||
(a) The income tax provision for 2023 is not directly comparable to the income tax provision for 2021 and 2022 due to the valuation allowance recorded on our deferred tax assets in 2023 due to a triggering event that resulted from a three-year cumulative loss before income taxes.
Reconciliation between the statutory federal income tax rate and the effective income tax rate was as follows:
| 2023 | 2022 | 2021 | |||||||||
| Statutory federal income tax rate | % | % | % | ||||||||
| Effect of: | |||||||||||
| State and local income taxes, net of federal tax benefit | |||||||||||
| Work opportunity tax and other employment tax credits | ( | ||||||||||
| Executive compensation limitations - permanent difference | ( | ( | |||||||||
| Share-based compensation | ( | ( | ( | ||||||||
| Change in valuation allowance | ( | ||||||||||
| Other, net | ( | ||||||||||
Effective income tax rate (a) | ( | % | % | % | |||||||
(a) The reconciliation between the statutory federal income tax rate and effective income tax rate for 2023 and 2022 are not directly comparable to the reconciliation for 2021 due to the loss before income taxes in 2023 and 2022 compared to the income before income taxes in 2021. Further, the reconciliation between the statutory federal income tax rate and the effective income tax rate for 2023 is not directly comparable to the reconciliations for 2021 and 2022 due to the valuation allowance recorded on our deferred tax assets in 2023.
Income tax payments and refunds were as follows:
| (In thousands) | 2023 | 2022 | 2021 | ||||||||
| Income taxes refunded | $ | ( | $ | ( | $ | ( | |||||
| Income taxes paid | |||||||||||
| Net income taxes (refunded) paid | $ | ( | $ | ( | $ | ||||||
66
Deferred taxes reflect the net tax effects of temporary differences between carrying amounts of assets and liabilities for financial reporting purposes and the amounts used for income tax, including income tax uncertainties. Significant components of our deferred tax assets and liabilities were as follows:
| (In thousands) | February 3, 2024 | January 28, 2023 | ||||||
| Deferred tax assets: | ||||||||
| Lease liabilities, net of lease incentives | $ | $ | ||||||
| Net operating losses, tax credits, and other carryforwards | ||||||||
| Sale and leaseback financing liability | ||||||||
| Uniform inventory capitalization | ||||||||
| Workers’ compensation and other insurance reserves | ||||||||
| Depreciation and fixed asset basis differences | ||||||||
| Compensation related | ||||||||
| Research and development costs capitalized for tax | ||||||||
| Accrued state taxes | ||||||||
| Accrued operating liabilities | ||||||||
| Other | ||||||||
| Valuation allowances, net of federal tax benefit | ( | ( | ||||||
| Total deferred tax assets | ||||||||
| Deferred tax liabilities: | ||||||||
| Right-of-use assets, net of amortization | ||||||||
| Accelerated depreciation and fixed asset basis differences | ||||||||
| Deferred gain on like-kind exchange | ||||||||
| Lease construction reimbursements | ||||||||
| Prepaid expenses | ||||||||
| Workers’ compensation and other insurance reserves | ||||||||
| Synthetic lease obligation | ||||||||
| Other | ||||||||
| Total deferred tax liabilities | ||||||||
| Net deferred tax assets (liabilities) | $ | ( | $ | |||||
Our deferred tax assets and deferred tax liabilities, netted by tax jurisdiction, are summarized in the table below:
| (In thousands) | February 3, 2024 | January 28, 2023 | ||||||
| U.S. Federal | $ | ( | $ | |||||
| U.S. State and local | ( | |||||||
| Net deferred tax assets (liabilities) | $ | ( | $ | |||||
The following table summarizes changes in the valuation allowance:
| (In thousands) | 2023 | 2022 | 2021 | ||||||||
| Valuation allowance - beginning of year | $ | $ | $ | ||||||||
| Additions charged to income tax benefit | 9 | — | |||||||||
| Allowances taken or written off | ( | ( | |||||||||
| Other adjustments | |||||||||||
| Valuation allowance - end of year | $ | $ | $ | ||||||||
The increase in the valuation allowance during 2023 is primarily related to the valuation allowance recorded on our deferred tax assets in 2023 due to a triggering event that resulted from a three-year cumulative loss before income taxes.
67
We have the following income tax loss and credit carryforwards at February 3, 2024 (amounts are shown net of tax excluding the federal income tax effect of the state and local items):
| (In thousands) | ||||||||||||||
| U.S. Federal: | ||||||||||||||
| Federal net operating loss carryforward | $ | Indefinite carryforward | ||||||||||||
| Other carryforwards | Predominately indefinite carryforward | |||||||||||||
| Employment tax credits | Expires 2045 | |||||||||||||
| Total U.S. Federal | ||||||||||||||
| U.S. State and local: | ||||||||||||||
| State and local net operating loss carryforwards | Various carryforward periods ranging from 5 to 20 years including some jurisdictions with no expirations | |||||||||||||
| Other state credits | Expires fiscal years through 2026 | |||||||||||||
| Total U.S. State and local | ||||||||||||||
| Total net operating losses, tax credits, and other carryforwards | $ | |||||||||||||
The following is a tabular reconciliation of the total amounts of unrecognized tax benefits for 2023, 2022, and 2021:
| (In thousands) | 2023 | 2022 | 2021 | ||||||||
| Unrecognized tax benefits - beginning of year | $ | $ | $ | ||||||||
| Gross increases - tax positions in current year | |||||||||||
| Gross increases - tax positions in prior period | |||||||||||
| Gross decreases - tax positions in prior period | ( | ( | |||||||||
| Settlements | ( | ( | |||||||||
| Lapse of statute of limitations | ( | ( | ( | ||||||||
| Unrecognized tax benefits - end of year | $ | $ | $ | ||||||||
At the end of 2023 and 2022, the total amount of unrecognized tax benefits that, if recognized, would affect the effective income tax rate is $3.5 million and $4.9 million, respectively, after considering the federal tax benefit of state and local income taxes of $0.9 million and $1.1 million, respectively. Unrecognized tax benefits of $2.7 million and $1.6 million in 2023 and 2022, respectively, relate to tax positions for which the ultimate deductibility is highly certain but for which there is uncertainty about the timing of such deductibility. The uncertain timing items could result in the acceleration of the payment of cash to the taxing authority to an earlier period.
We recognized an expense (benefit) associated with interest and penalties on unrecognized tax benefits of approximately $0.3 million, $(0.8 ) million, and $(1.1 ) million during 2023, 2022, and 2021, respectively, as a component of income tax expense. The amount of accrued interest and penalties recognized in the accompanying consolidated balance sheets at February 3, 2024 and January 28, 2023 was $2.1 million and $1.8 million, respectively.
We are subject to U.S. federal income tax, and income tax of multiple state and local jurisdictions. The statute of limitations for assessments on our federal income tax returns for periods prior to 2020 has lapsed. In addition, the state income tax returns filed by us are subject to examination generally for periods beginning with 2018, although state income tax carryforward attributes generated prior to 2018 and non-filing positions may still be adjusted upon examination. We have various state returns in the process of examination or administrative appeal.
We have estimated the reasonably possible expected net change in unrecognized tax benefits through February 3, 2024 , based on expected cash and noncash settlements or payments of uncertain tax positions and lapses of the applicable statutes of limitations for unrecognized tax benefits. The estimated net decrease in unrecognized tax benefits for the next 12 months is approximately $2.0 million. Actual results may differ materially from this estimate.
68
NOTE 9 – COMMITMENTS, CONTINGENCIES AND LEGAL PROCEEDINGS
California Wage and Hour Matters
We have settled and/or reached settlement agreements, including final approval by the courts, in wage and hour class actions in California that were pending against the Company. These cases were brought by various current and/or former California associates alleging various violations of California wage and hour laws. During the fourth quarter of 2023, we made the final settlement payments for these California wage and hour matters and as of February 3, 2024, we have no outstanding accruals.
We intend to defend ourselves vigorously against the allegations levied in the remaining individual and representative lawsuits.
Other Matters
We are involved in other legal actions and claims arising in the ordinary course of business. We currently believe that each such action and claim will be resolved without a material effect on our financial condition, results of operations, or liquidity. However, litigation involves an element of uncertainty. Future developments could cause these actions or claims to have a material effect on our financial condition, results of operations, and liquidity.
We are self-insured for certain losses relating to property, general liability, workers’ compensation, and employee medical, dental, and prescription drug benefit claims, a portion of which is paid by employees, and we have purchased stop-loss coverage in order to limit significant exposure in these areas. Accrued insurance liabilities are actuarially determined based on claims filed and estimates of claims incurred but not reported. We use letters of credit, which amounted to $52.1 million at February 3, 2024, as collateral to back certain of our self-insured losses with our claims administrators.
NOTE 10 - GAIN ON SALE OF REAL ESTATE
In the fourth quarter of 2022, we completed the sale of 20 owned store locations and one unoccupied land parcel with an aggregate net book value of $29.4 million. The net cash proceeds on these sales of real estate were $47.8 million and resulted in a gain of $18.6 million on sale of real estate. We incurred $1.8 million of additional selling and administrative expenses in connection with the sale, which primarily consisted of consulting services and employee related costs. Additionally, as part of the sale of real estate, two leased locations were terminated at no additional costs resulting in a gain on extinguishment of lease liabilities of $1.9 million, which was included in the gain on sale of real estate after related expenses and recorded within the gain on sale of real estate in our consolidated statements of operations and comprehensive (loss) income. The extinguishment of these lease liabilities resulted in non-cash consideration of $5.9 million related to cancellation of future cash payments of these lease liabilities.
We also incurred a $1.7 million charge of accelerated depreciation expense in connection with the sale of real estate resulting from the disposal of fixtures and equipment at these stores related to the real estate. This charge was recorded within depreciation expense in our consolidated statements of operations and comprehensive (loss) income. See Note 4 to the accompanying consolidated financial statements for information on these lease cancellations and Note 2 for information on the sale of real estate and disposal of fixtures and equipment as a result of the sale.
In the third quarter of 2023, we simultaneously terminated the 2023 Synthetic Lease for the AVDC, took title to the AVDC property, and completed sale and leaseback transactions for the AVDC and Sale and leaseback Stores. The aggregate sale price for the transactions was $305.7 million. The transactions, which were completed with the same buyer-lessor of our four other regional distribution centers, also included a five-year extension of the lease for our Columbus, OH distribution center (“CODC”). The Company allocated $9.4 million of the cash consideration received to the extension of the lease for CODC and recorded the consideration as a lease incentive. Due to sale-leaseback accounting requirements, the remaining cash received was compared, on an individual property basis, to the fair market value of the properties. As a result, the cash received in the transactions was allocated between proceeds on the sale of the AVDC, the Sale and leaseback Stores, prepaid rent, and financing proceeds. The aggregate net proceeds, before taxes, on the sales of the AVDC and the Sale and leaseback Stores were $332.1 million. The aggregate net proceeds include $36.5 million in net proceeds in excess of the aggregate sale price due to properties sold below market, which resulted in a corresponding increase in prepaid rent. The prepaid rent was recorded in the operating lease right-of-use assets in our consolidated balance sheets. The aggregate net proceeds exclude $0.6 million received in the aggregate sale price due to properties sold above market value, which was recorded as a financing liability. The noncurrent portion of the financing liability was recorded in other liabilities in our consolidated balance sheets. Interest expense will be recognized on the financing liability using the effective interest method and the financing liability will be accreted over the duration of the lease agreements. Future payments to the buyer-lessor will be allocated between the financing liability and
69
the lease liabilities. Straight-line rent expense will be recognized over the duration of the lease agreements. Additionally, we incurred $4.2 million of additional selling and administrative expenses in connection with the transactions, which primarily consisted of commissions and consulting services.
The aggregate gross cash consideration received in these transactions was used to pay transaction expenses, fully pay off the 2023 Synthetic Lease for approximately $101 million, and repay borrowings under the 2022 Credit Agreement. Additionally, the purchase and sale agreement restricts us from drawing on the 2022 Credit Agreement for any purpose other than working capital, general corporate, operational requirements or capital expenditures for 180 days following the closing of the transactions unless our availability under the 2022 Credit Agreement exceeds $500 million as of the end of a quarterly reporting period.
Our aggregate initial annual cash payments to the buyer-lessor for the AVDC and the Sale and leaseback Stores are approximately $24 million and the payments will escalate two percent annually. Aggregate annual straight-line rent expense for the 24 leases is approximately $30 million after the impact of 2023 right-of-use asset impairment charges and annual straight-line rent expense over the remainder of the CODC lease will increase by approximately $2 million. Aggregate initial annual interest expense on the financing liability is immaterial.
NOTE 11 – BUSINESS SEGMENT DATA
We use the following six merchandise categories, which are consistent with our internal management and reporting of merchandise net sales: Food; Consumables; Soft Home; Hard Home and Other; Furniture; and Seasonal. The Food category includes our beverage & grocery; specialty foods; and candy & snacks departments. The Consumables category includes our health, beauty and cosmetics; plastics; paper; pet; infant; stationery; and chemical departments. The Soft Home category includes our apparel; hosiery; jewelry; frames; fashion bedding; utility bedding; bath; window; decorative textile; and area rugs departments. The Hard Home and Other category includes our small appliances; table top; food preparation; home maintenance; home organization; toys; and electronics departments; and other offerings. The Furniture category includes our upholstery; mattress; ready-to-assemble; home décor; and case goods departments. The Seasonal category includes our lawn & garden; summer; Christmas; and other holiday departments.
In the fourth quarter of 2023, we realigned our merchandise categories and eliminated our Apparel, Electronics, & Other merchandise category. We reallocated the departments that previously comprised Apparel, Electronics, & Other into the following merchandise categories: Hard Home and Other, Soft Home, Consumables, and Food. See the reclassifications section of Note 1 to the consolidated financial statements for further discussion.
We periodically assess, and make minor adjustments to, our product hierarchy, which can impact the roll-up of our merchandise categories. Our financial reporting process utilizes the most current product hierarchy in reporting net sales by merchandise category for all periods presented. Therefore, there may be minor reclassifications of net sales by merchandise category compared to previously reported amounts.
The following table presents net sales data by merchandise category:
| (In thousands) | 2023 | 2022 | 2021 | |||||||||||||||||
| Furniture | $ | $ | $ | |||||||||||||||||
| Consumables | ||||||||||||||||||||
| Seasonal | ||||||||||||||||||||
| Soft Home | ||||||||||||||||||||
| Food | ||||||||||||||||||||
| Hard Home and Other | ||||||||||||||||||||
| Net sales | $ | $ | $ | |||||||||||||||||
70
NOTE 12 – SUPPLIER FINANCE PROGRAM
As of February 3, 2024 , we facilitated a voluntary supply chain finance (“SCF”) program through a participating financial institution. This SCF program enables our suppliers to sell their receivables due from the Company to a participating financial institution at their discretion. As of February 16, 2024, the participating financial institution suspended funding and we have chosen to suspend the program until such time that unsecured funding is available.
As of February 3, 2024 and January 28, 2023, the SCF program had $30.0 million and $55.0 million of revolving capacity, respectively. We are not a party to the agreements between the participating financial institution and the suppliers in connection with the SCF program. The range of payment terms we negotiate with our suppliers is consistent, irrespective of whether a supplier participates in the SCF program. No guarantees are provided by the Company or any of our subsidiaries under the SCF program.
The amounts payable to the participating financial institution for suppliers who voluntarily participate in the SCF program are included within the on our consolidated balance sheets. Amounts under the SCF program included within accounts payable were $17.8 million and $35.4 million as of February 3, 2024 and January 28, 2023, respectively. Payments made under the SCF program to the financial institution, like payments of other accounts payable, are a reduction to our operating cash flow.
NOTE 13 – SUBSEQUENT EVENT
On April 18, 2024 , the Company entered into a Credit Agreement (the “Term Loan Facility”) among the Company and Big Lots Stores, LLC, as borrowers (the “Borrowers”), all other domestic subsidiaries of the Company as guarantors (together with the Borrowers, the “Loan Parties”), 1903P Loan Agent, LLC (the “Term Loan Agent”), as administrative agent and collateral agent, and the other lenders named therein. The Term Loan Facility provides for a “first in, last out” delayed draw term loan facility in an aggregate committed amount up to $200 million. At commencement of the Term Loan Facility, the Company drew down $50 million in total borrowings under the Term Loan Facility.
Loans under the Term Loan Facility are available in an aggregate amount equal to the lesser of (1) the aggregate Commitments and (2) a borrowing base calculated based on specified percentages of eligible inventory, credit card receivables, real estate, fixtures, machinery and equipment, subject to customary exceptions and reserves (the “Term Loan Borrowing Base”). If at any time the amounts borrowed under the Term Loan Facility exceed the Term Loan Borrowing Base, the Company is required to maintain a reserve against the borrowing base under the 2022 Credit Agreement in an amount equal to such excess (“the Term Pushdown Reserve”). Borrowings under the Term Loan Facility are available for general corporate purposes, working capital and to repay a portion of our indebtedness outstanding under the 2022 Credit Agreement.
All amounts of the Term Loan Facility outstanding on the maturity date will be due and payable in full on September 21, 2027 . The Term Loan Facility contains certain mandatory prepayments, including as a result of certain sales or disposition of certain assets, the incurrence of certain additional debt, certain issuances of additional equity and receipt of certain extraordinary receipts, subject to certain exceptions and, in the case of certain sales or other dispositions, reinvestment rights. In certain instances, mandatory prepayments are subject to a prepayment fee. Subject to compliance with relevant provisions of the 2022 Credit Agreement, voluntary prepayments under the Term Loan Facility are permitted at any time upon proper notice and subject to meeting certain tests under the 2022 Credit Agreement and, in certain instances, a prepayment fee.
Amounts borrowed under the Term Loan Facility bear interest at a variable rate indexed to SOFR plus a pricing margin ranging from 9.25 % to 10.00 % per annum, based on our total borrowings under the Term Loan Facility. Interest payments under the Term Loan Facility are due on the first day of each calendar month. At commencement, the interest rate on the outstanding Term Loan Facility borrowings was 15.2 %.
The Term Loan Facility requires the Borrowers to maintain minimum excess availability under the 2022 Credit Agreement (“Excess Availability Covenant”) of at least the greater of (i) $80.0 million or (ii) 10 % of the lesser of the aggregate commitments under the 2022 Credit Agreement (currently $900.0 million) and the borrowing base under the 2022 Credit Agreement (the “Maximum Credit Amount”) (without giving effect to the Term Pushdown Reserve). In addition, the Term Loan Facility contains customary covenants and restrictions on the Company’s and its subsidiaries’ activities, including, but not limited to, limitations on the incurrence of additional indebtedness, liens, negative pledges, guarantees, investments, loans, asset sales, mergers, acquisitions, prepayment of other debt, distributions, dividends, the repurchase of capital stock, transactions with affiliates, the ability to change the nature of its business or its fiscal year, and permitted activities of the Company.
71
The Term Loan Facility contains customary events of default that include, among other things, non-payment defaults, inaccuracy of representations and warranties, covenant defaults, cross default to material indebtedness, bankruptcy and insolvency defaults, material judgment defaults, ERISA defaults, structural defaults under the loan documents and a change of control default. The occurrence of an event of default could result in the acceleration of our obligations under the Term Loan Facility. Under certain circumstances, a default interest rate will apply on any amount payable under the Term Loan Facility during the existence of an event of default at a per annum rate equal to 2.00% above the applicable interest rate for any principal and 2.00% above the rate applicable for base rate loans for any other interest.
All obligations under the Term Loan Facility are guaranteed by the Loan Parties (other than the Borrowers) and secured by (a) a second priority lien on substantially all of the Loan Parties’ working capital assets, including credit card receivables and inventory, and (b) a first priority lien on substantially all of the Loan Parties’ non-working capital personal property assets, including fixtures, machinery, equipment, and intellectual property, and a first priority mortgage on the Company’s corporate headquarters located in Columbus, Ohio, in each case, subject to certain permitted liens.
The Company will record deferred financing costs associated with the issuance of the Term Loan Facility. These costs will be amortized over the respective contractual terms of the Term Loan Facility.
Amendment to 2022 Credit Agreement
On April 18, 2024, concurrent with our entry into the Term Loan Facility, the Company entered into the First Amendment to the 2022 Credit Agreement (the “ABL Amendment”). The ABL Amendment amends the 2022 Credit Agreement to, among other things, (1) permit the Term Loan Facility, (2) expand the scope of collateral to include non-working capital assets and a mortgage on the Company’s corporate headquarters located in Columbus, Ohio, (3) revise the borrowing base formula therein to include the Term Pushdown Reserve, (4) increase the interest rate spreads and replace CDOR with CORRA, (5) replace the fixed charge coverage ratio covenant with the Excess Availability Covenant, and (6) make other changes to the 2022 Credit Agreement to conform with the Term Loan Facility.
72
Item 9. Changes in and Disagreements With Accountants on Accounting and Financial Disclosure
None.
Item 9A. Controls and Procedures
Evaluation of Disclosure Controls and Procedures
Our management, with the participation of our Principal Executive Officer and Principal Financial Officer, has evaluated the effectiveness of our disclosure controls and procedures, as that term is defined in Rules 13a-15(e) and 15d-15(e) of the Securities Exchange Act of 1934, as amended (“Exchange Act”), as of the end of the period covered by this report. Based on that evaluation, our Principal Executive Officer and Principal Financial Officer have each concluded that such disclosure controls and procedures were effective as of the end of the period covered by this report.
Management’s Report on Internal Control over Financial Reporting
Management is responsible for establishing and maintaining adequate internal control over financial reporting (as defined in Rules 13a-15(f) and 15d-15(f) under the Exchange Act) for us. Our internal control over financial reporting is designed to provide reasonable assurance regarding the reliability of financial reporting and the preparation of financial statements in accordance with accounting principles generally accepted in the United States of America.
Management assessed the effectiveness of our internal control over financial reporting as of February 3, 2024. In making its assessment, management used the criteria set forth by the Committee of Sponsoring Organizations of the Treadway Commission in Internal Control - Integrated Framework (2013 Framework). Based on this assessment, management, including our Principal Executive Officer and Principal Financial Officer, concluded that we maintained effective internal control over financial reporting as of February 3, 2024.
Our independent registered public accounting firm, Deloitte & Touche LLP, has issued an attestation report on our internal control over financial reporting. The report appears in the Financial Statements and Supplementary Data section of this Form 10-K.
Changes in Internal Control over Financial Reporting
There were no changes in our internal control over financial reporting that occurred during our most recent fiscal quarter that have materially affected, or are reasonably likely to materially affect, our internal control over financial reporting.
Item 9B. Other Information
Insider Trading Arrangements
During the three months ended February 3, 2024 , no director or officer of the Company adopted or terminated a “Rule 10b5-1 trading arrangement” or “non-Rule 10b5-1 trading arrangement,” as such terms are defined in Item 408(a) of Regulation S-K.
Item 9C. Disclosure Regarding Foreign Jurisdictions that Prevent Inspections
Not applicable.
73
Part III
Item 10. Directors, Executive Officers and Corporate Governance
The information contained under the captions “Proposal One: Election of Directors,” “Governance,” “Stock Ownership” and “Delinquent Section 16(a) Reports” in our definitive Proxy Statement for our 2024 annual meeting of shareholders (“2024 Proxy Statement”), with respect to directors, shareholder nomination procedures, the code of ethics, the Audit Committee, our audit committee financial experts, Section 16(a) beneficial ownership reporting compliance and delinquent Section 16(a) reports, is incorporated herein by reference in response to this item. The information contained in Part I of this Form 10-K under the caption “Supplemental Item. Information about our Executive Officers,” with respect to executive officers, is incorporated herein by reference in response to this item.
In the “Investors” section of our website (www.biglots.com) under the “Corporate Governance” and “SEC Filings” captions, the following information relating to our corporate governance may be found: Corporate Governance Guidelines; charters of our Board of Directors’ Audit, Capital Allocation Planning, Human Capital and Compensation, and Nominating/Corporate Governance Committees, and our Environmental, Social and Governance Committee; Code of Business Conduct and Ethics; Code of Ethics for Financial Officers; Chief Executive Officer and Chief Financial Officer certifications related to our SEC filings; the means by which shareholders may communicate with our Board of Directors; and transactions in our securities by our directors and executive officers. The Code of Business Conduct and Ethics applies to all of our associates, including our directors and our principal executive officer, principal financial officer, and principal accounting officer. The Code of Ethics for Financial Professionals applies to our Chief Executive Officer and all other Senior Financial Officers (as that term is defined therein) and contains provisions specifically applicable to the individuals serving in those positions. We intend to satisfy the requirement under Item 5.05 of Form 8-K regarding disclosure of any amendments to, and any waivers from, our Code of Business Conduct and Ethics (to the extent applicable to our directors and executive officers (including our principal executive officer, principal financial officer, and principal accounting officer)) and our Code of Ethics for Financial Professionals in the “Investors” section of our website (www.biglots.com) under the “Corporate Governance” caption. We will provide any of the foregoing information without charge upon written request to our Corporate Secretary addressed to our principal executive offices at 4900 E. Dublin-Granville Road, Columbus, Ohio 43081.
Item 11. Executive Compensation
The information contained under the caption “Governance” with respect to Compensation Committee interlocks and insider participation and under the captions “Director Compensation,” “Executive Compensation” and “Compensation Committee Report” in the 2024 Proxy Statement is incorporated herein by reference in response to this item.
74
Item 12. Security Ownership of Certain Beneficial Owners and Management and Related Stockholder Matters
Equity Compensation Plan Information
The following table summarizes information as of February 3, 2024, relating to our equity compensation plans pursuant to which our common shares may be issued.
| Number of securities to be issued upon exercise of outstanding options, warrants, and rights (#) | Weighted-average exercise price of outstanding options, warrants, and rights ($) | Number of securities remaining available for future issuance under equity compensation plans (excluding securities reflected in column (a)) (#) | |||||||||||||||||||||
| Plan Category | (a) | (b) | (c) | ||||||||||||||||||||
| Equity compensation plans approved by security holders | 3,409,988 | (1) | — | (2) | 1,317,691 | (3) | |||||||||||||||||
| Equity compensation plans not approved by security holders | — | — | — | ||||||||||||||||||||
| Total | 3,409,988 | — | (2) | 1,317,691 | |||||||||||||||||||
| (1) | Includes performance share units and restricted stock units granted under the Amended and Restated 2020 LTIP, 2020 LTIP and the 2017 LTIP. | ||||||||||||||||||||||
| (2) | The weighted average exercise price does not take into account the performance share units and the restricted stock units granted under the Amended and Restated 2020 LTIP, 2020 LTIP and 2017 LTIP. | ||||||||||||||||||||||
| (3) | The common shares available for issuance under the Amended and Restated 2020 LTIP are limited to 1,317,691 common shares. There are no common shares available for issuance under any of the other shareholder-approved plans. | ||||||||||||||||||||||
The 2017 LTIP was approved by our shareholders in May 2017 and was terminated in June 2020. The 2020 LTIP was approved by our shareholders in June 2020. The Amended and Restated 2020 LTIP was approved by our shareholders in May 2023. See Note 7 to the accompanying consolidated financial statements.
The information contained under the caption “Stock Ownership” in the 2024 Proxy Statement, with respect to the security ownership of certain beneficial owners and management, is incorporated herein by reference in response to this item.
Item 13. Certain Relationships and Related Transactions, and Director Independence
The information contained under the caption “Governance” in the 2024 Proxy Statement, with respect to the determination of director independence and related person transactions, is incorporated herein by reference in response to this item.
Item 14. Principal Accountant Fees and Services
The information contained under the captions “Audit Committee Disclosure” in the 2024 Proxy Statement, with respect to our audit and non-audit services pre-approval policy and the fees paid to our independent registered public accounting firm, Deloitte & Touche LLP, is incorporated herein by reference in response to this item.
75
Part IV
Item 15. Exhibits and Financial Statement Schedules
Index to Consolidated Financial Statements, Financial Statement Schedules and Exhibits
(a) Documents filed as part of this report:
(1) Financial Statements
| Reports of Independent Registered Public Accounting Firm | |||||
| Consolidated Statements of Operations and Comprehensive (Loss) Income | |||||
| Consolidated Balance Sheets | |||||
Consolidated Statements of Shareholders’ Equity | |||||
| Consolidated Statements of Cash Flows | |||||
| Notes to Consolidated Financial Statements | |||||
All other financial statements not listed in the preceding index are omitted because they are not required or are not applicable or because the information required to be set forth therein either was not material or is included in the consolidated financial statements or notes thereto.
(2) Financial Statement Schedules
All schedules are omitted because they are not required or are not applicable or because the information required to be set forth therein either was not material or is included in the consolidated financial statements or notes thereto.
(3) Exhibits. Exhibits marked with an asterisk (*) are filed herewith. Certain portions of the exhibits marked with a pound sign (#) have been excluded from the exhibit pursuant to Item 601(b)(10)(iv) of Regulation S-K. Copies of exhibits will be furnished upon written request and payment of our reasonable expenses in furnishing the exhibits. Exhibits 10.1 through 10.30 are management contracts or compensatory plans or arrangements.
| Exhibit No. | Document | ||||
| Agreement of Merger (incorporated herein by reference to Exhibit 2 to our Form 10-Q for the quarter ended May 5, 2001) (File No. 1-8897). | |||||
| Amended Articles of Incorporation (incorporated herein by reference to Exhibit 3(a) to our Form 10-Q for the quarter ended May 5, 2001) (File No. 1-8897). | |||||
| Amendment to the Amended Articles of Incorporation of Big Lots, Inc. (incorporated herein by reference to Exhibit 3.1 to our Form 8-K dated May 27, 2010) (File No. 1-8897). | |||||
| Amended Code of Regulations of Big Lots, Inc. (incorporated herein by reference to Exhibit 4.3 to our Form S-8 dated June 10, 2020). | |||||
| Specimen Common Share Certificate (incorporated herein by reference to Exhibit 4(a) to our Form 10-K for the year ended February 2, 2002) (File No. 1-8897). | |||||
Description of Big Lots, Inc.’s Securities Registered Pursuant to Section 12 of the Securities Exchange Act of 1934 (Incorporated herein by reference to Exhibit 4.2 to our Form 10-K for the year ended January 30, 2021). | |||||
| Big Lots 2017 Long-Term Incentive Plan (incorporated herein by reference to Appendix A to our definitive proxy statement on Schedule 14A relating to the 2017 Annual Meeting of Shareholders filed April 11, 2017). | |||||
| Form of Big Lots 2017 Long-Term Incentive Plan Restricted Stock Units Award Agreement (incorporated herein by reference to Exhibit 10.1 to our Form 10-Q for the quarter ended April 29, 2017). | |||||
| Form of Big Lots 2017 Long-Term Incentive Plan Performance Share Units Award Agreement (incorporated herein by reference to Exhibit 10.2 to our Form 10-Q for the quarter ended April 29, 2017). | |||||
| Form of Big Lots 2017 Long-Term Incentive Plan Restricted Stock Units Retention Award Agreement (incorporated herein by reference to Exhibit 10.1 to our Form 10-Q for the quarter ended August 4, 2018). | |||||
76
| Exhibit No. | Document | ||||
| Form of Big Lots 2017 Long-Term Incentive Plan Deferral Election Form and Deferred Stock Units Award for Non-Employee Directors (incorporated herein by reference to Exhibit 10.1 to our Form 10-Q for the quarter ended October 28, 2017). | |||||
| Form of Big Lots 2017 Long-Term Incentive Plan Performance Share Units Award Agreement (incorporated herein by reference to Exhibit 10.1 to our Form 8-K dated April 3, 2020). | |||||
| Big Lots 2020 Long-Term Incentive Plan (incorporated herein by reference to Appendix A to the Registrant’s definitive proxy statement on Schedule 14A relating to the 2020 Annual Meeting of Shareholders of the Registrant filed with the Commission on May 1, 2020 (File No. 1-8897)). | |||||
| Amended and Restated Big Lots 2020 Long-Term Incentive Plan (incorporated herein by reference to Exhibit 10.1 to our Form 8-K dated May 30, 2023). | |||||
| Form of Big Lots 2020 Long-Term Incentive Plan Restricted Stock Units Award Agreement for Non-Employee Directors (incorporated herein by reference to Exhibit 10.3 to our Form 10-Q for the quarter ended May 2, 2020). | |||||
| Form of Big Lots 2020 Long-Term Incentive Plan Restricted Stock Units Award Agreement (incorporated herein by reference to Exhibit 10.4 to our Form 10-Q for the quarter ended May 2, 2020). | |||||
| Form of Big Lots 2020 Long-Term Incentive Plan Deferral Election Form and Deferred Stock Unit Award Agreement for Non-Employee Directors (incorporated herein by reference to Exhibit 10.5 to our Form 10-Q for the quarter ended May 2, 2020). | |||||
| Form of Big Lots 2020 Long-Term Incentive Plan Restricted Performance Share Units Award Agreement (incorporated herein by reference to Exhibit 10.6 to our Form 10-Q for the quarter ended May 2, 2020). | |||||
| Form of Big Lots 2020 Long-Term Incentive Plan Performance Share Units Award Agreement (incorporated herein by reference to Exhibit 10.1 to our Form 8-K dated March 9, 2021). | |||||
| Form of Big Lots 2020 Long-Term Incentive Plan Restricted Stock Units Award Agreement (incorporated herein by reference to Exhibit 10.2 to our Form 8-K dated March 9, 2021). | |||||
| Form of Big Lots 2020 Long-Term Incentive Plan Performance Share Units Award Agreement (incorporated herein by reference to Exhibit 10.14 to our Form 10-K dated March 29, 2022). | |||||
| Form of Big Lots 2020 Long-Term Incentive Plan Restricted Stock Units Award Agreement (incorporated herein by reference to Exhibit 10.6 to our Form 10-Q dated September 6, 2022). | |||||
| Form of Big Lots 2020 Long-Term Incentive Plan Performance Share Units Award Agreement (incorporated herein by reference to Exhibit 10.3 to our Form 8-K dated March 16, 2023). | |||||
| Form of Big Lots 2020 Long-Term Incentive Plan Performance Share Units Award Agreement (incorporated herein by reference to Exhibit 10.4 to our Form 8-K dated March 16, 2023). | |||||
| Big Lots 2019 Bonus Plan (incorporated herein by reference to Exhibit 10.1 to our Form 8-K dated March 5, 2019). | |||||
| Big Lots Savings Plan (incorporated herein by reference to Exhibit 10.8 to our Form 10-K for the year ended January 29, 2005) (File No. 1-8897). | |||||
| Big Lots Supplemental Savings Plan, as amended and restated effective December 31, 2015 (incorporated herein by reference to Exhibit 10.25 to our Form 10-K for the year ended January 30, 2016). | |||||
| Big Lots Executive Benefit Plan (incorporated herein by reference to Exhibit 10(m) to our Form 10-K for the year ended January 31, 2004) (File No. 1-8897). | |||||
| First Amendment to Big Lots Executive Benefit Plan (incorporated herein by reference to Exhibit 10.11 to our Form 10-Q for the quarter ended November 1, 2008) (File No. 1-8897). | |||||
| Offer Letter with Bruce Thorn (incorporated herein by reference to Exhibit 10.1 to our Form 8-K dated August 21, 2018). | |||||
| Second Amended and Restated Employment Agreement with Lisa M. Bachmann (incorporated herein by reference to Exhibit 10.2 to our Form 8-K dated April 29, 2013). | |||||
| Form of Indemnification Agreement (incorporated herein by reference to Exhibit 10.12 to our Form 10-Q for the quarter ended November 1, 2008) (File No. 1-8897). | |||||
| Big Lots Executive Severance Plan (incorporated herein by reference to Exhibit 10.1 to our Form 8-K dated August 28, 2014). | |||||
| Form of Big Lots Executive Severance Plan Acknowledgment and Agreement (incorporated by reference to Exhibit 10.2 to our Form 8-K dated August 28, 2014). | |||||
| Big Lots, Inc. Executive Severance Agreement (incorporated herein by reference to Exhibit 10.2 to our Form 10-Q dated June 8, 2022). | |||||
| Big Lots, Inc. Senior Executive Severance Agreement (incorporated herein by reference to Exhibit 10.3 to our Form 10-Q dated June 8, 2022). | |||||
77
| Exhibit No. | Document | ||||
| Credit Agreement, dated August 31, 2018, by and among Big Lots, Inc. and Big Lots Stores, Inc., as borrowers, the Guarantors named therein, and the Banks named therein (incorporated herein by reference to Exhibit 10.1 to our Form 8-K dated August 29, 2018). | |||||
| Security Agreement between Big Lots Stores, Inc. and Big Lots Capital, Inc. (incorporated herein by reference to Exhibit 10.2 to our Form 8-K dated October 29, 2004) (File No. 1-8897). | |||||
| Stock Purchase Agreement between KB Acquisition Corporation and Consolidated Stores Corporation (incorporated herein by reference to Exhibit 2(a) to our Form 10-Q for the quarter ended October 28, 2000) (File No. 1-8897). | |||||
| Acquisition Agreement between Big Lots, Inc. and Liquidation World Inc. (incorporated herein by reference to Exhibit 10.1 to our Form 8-K dated May 26, 2011) (File No. 1-8897). | |||||
| AVDC Participation Agreement incorporated herein by reference to Exhibit 10.40 to our Form 10-K for the year ended February 3, 2018) (File No. 1-8897). | |||||
| AVDC Lease Agreement (Real Property) (incorporated herein by reference to Exhibit 10.41 to our Form 10-K for the year ended February 3, 2018) (File No. 1-8897). | |||||
| AVDC Construction Agency Agreement (incorporated herein by reference to Exhibit 10.42 to our Form 10-K for the year ended February 3, 2018) (File No. 1-8897). | |||||
| Settlement Agreement dated April 22, 2020, by and among Big Lots, Inc., Ancora Advisors, LLC, Ancora Merlin Institutional, LP, Ancora Merlin, LP, Ancora Catalyst Institutional, LP, Ancora Catalyst, LP, Ancora Catalyst SPV I LP, Ancora Catalyst SPV I SPC Ltd. - Segregated Portfolio C, Macellum Advisors GP, LLC, Macellum Management, LP, and Macellum Opportunity Fund LP. (incorporated herein by reference to Exhibit 10.1 to our Form 8-K dated April 22, 2020). | |||||
| Agreement for Purchase and Sale of Real Property, as amended, between Durant DC, LLC and BIGDUOK001 LLC relating to the registrant’s distribution center located in Durant, Oklahoma. (incorporated herein by reference to Exhibit 10.1 to our Form 10-Q for the quarter ended August 1, 2020). | |||||
| Lease Agreement, as amended, between Big Lots Stores, Inc. and BIGCOOH002, LLC relating to the registrant’s distribution center located in Columbus, OH (incorporated herein by reference to Exhibit 10.1 to our Form 10-Q for the quarter ended October 31, 2020). | |||||
| Second Amended and Restated Credit Agreement, dated September 22, 2021, by and among Big Lots, Inc. and Big Lots Stores, Inc., as borrowers, the Guarantors named therein, and the Banks named therein (incorporated by reference to Exhibit 10.3 to our Form 10-Q for the quarter ended November 1, 2021). | |||||
| Third Amendment to Operative Documents, dated September 22, 2021, by and among AVDC, Inc., as lessee, the guarantors thereto, Wachovia Service Corporation, as lessor, Wells Fargo Bank, N.A., as agent, and the lease participant parties thereto (incorporated herein by reference to Exhibit 10.2 to our Form 8-K dated September 27, 2021). | |||||
| Fourth Amendment to Operative Documents, dated September 21, 2022, by and among AVDC, Inc., as lessee, the guarantors thereto, Wachovia Service Corporation, as lessor, Wells Fargo Bank, N.A., as agent, and the lease participants named therein (incorporated herein by reference to Exhibit 10.8 to our Form 10-Q dated December 7, 2022). | |||||
| First Amendment to Second Amended and Restated Credit Agreement, dated December 16, 2021, by and among Big Lots, Inc. and Big Lots Stores, Inc., as borrowers, the Guarantors named therein, and the Banks named therein (incorporated herein by reference to Exhibit 10.37 to our Form 10-K dated March 29, 2022). | |||||
| Credit Facility Consent Letter (incorporated herein by reference to Exhibit 10.1 to our Form 8-K dated July 29, 2022). | |||||
| Synthetic Lease Consent Letter (incorporated herein by reference to Exhibit 10.2 to our Form 8-K dated July 29, 2022). | |||||
| Credit Agreement, dated September 21, 2022, by and among Big Lots, Inc. and the other Borrowers named therein, the Guarantors named therein, and the Banks named therein (incorporated herein by reference to Exhibit 10.7 to our Form 10-Q dated December 7, 2022). | |||||
| Participation Agreement, dated March 15, 2023, by and among AVDC, LLC, the Lessee, and the Banks named therein (incorporated herein by reference to Exhibit 10.1 to our Form 8-K dated March 16, 2023). | |||||
| Lease Agreement, dated March 15, 2023, by and among AVDC, LLC, the Lessee, and the Banks named therein (incorporated herein by reference to Exhibit 10.2 to our Form 8-K dated March 16, 2023). | |||||
Lease Agreement dated August 25, 2023, between BLBO Tenant, LLC and Big AVCA Owner LLC relating to the registrant’s distribution center located in Apple Valley, California (incorporated herein by reference to Exhibit 10.1 to our Form 8-K dated August 31, 2023). | |||||
Lease Amendment dated August 25, 2023, between Big Lots Stores, LLC and BigCOOH002 LLC relating to the registrant’s distribution center located in Columbus, Ohio (incorporated herein by reference to Exhibit 10.2 to our Form 8-K dated August 31, 2023). | |||||
78
| Exhibit No. | Document | ||||
| Agreement for Purchase and Sale of Real Property, dated July 30, 2023, by and among Big Lots, Inc. as the Seller and the Buyers named therein. (incorporated herein by reference to Exhibit 10.7 to our Form 10-Q dated September 6, 2023). | |||||
| First Amendment to the Agreement for Purchase and Sale of Real Property, dated July 31, 2023, by and among Big Lots, Inc. as the Seller and the Buyers named therein. (incorporated herein by reference to Exhibit 10.8 to our Form 10-Q dated September 6, 2023). | |||||
| Second Amendment to the Agreement for Purchase and Sale of Real Property, dated August 4, 2023, by and among Big Lots, Inc. as the Seller and the Buyers named therein. (incorporated herein by reference to Exhibit 10.9 to our Form 10-Q dated September 6, 2023). | |||||
| Third Amendment to the Agreement for Purchase and Sale of Real Property, dated August 15, 2023, by and among Big Lots, Inc. as the Seller and the Buyers named therein. (incorporated herein by reference to Exhibit 10.10 to our Form 10-Q dated September 6, 2023). | |||||
| Fourth Amendment to the Agreement for Purchase and Sale of Real Property, dated September 22, 2023, by and among Big Lots, Inc. as the Seller and the Buyers named therein. (incorporated herein by reference to Exhibit 10.11 to our Form 10-Q dated December 6, 2023). | |||||
| Subsidiaries. | |||||
| Consent of Deloitte & Touche LLP. | |||||
| Power of Attorney for James R. Chambers, Sandra Y. Campos, Sebastian J. DiGrande, Marla C. Gottschalk, Cynthia T. Jamison, Christopher J. McCormick, Kimberley A. Newton, Nancy A. Reardon, Wendy L. Schoppert, and Maureen B. Short. | |||||
| Certification of Principal Executive Officer pursuant to Section 302 of the Sarbanes-Oxley Act of 2002. | |||||
| Certification of Principal Financial Officer pursuant to Section 302 of the Sarbanes-Oxley Act of 2002. | |||||
| Certification of Principal Executive Officer pursuant to Section 906 of the Sarbanes-Oxley Act of 2002. | |||||
| Certification of Principal Financial Officer pursuant to Section 906 of the Sarbanes-Oxley Act of 2002. | |||||
| Big Lots, Inc. Mandatory Recoupment Policy. | |||||
| XBRL Taxonomy Definition Linkbase Document | |||||
| XBRL Taxonomy Presentation Linkbase Document | |||||
| XBRL Taxonomy Labels Linkbase Document | |||||
| XBRL Taxonomy Calculation Linkbase Document | |||||
| 101.Sch | XBRL Taxonomy Schema Linkbase Document | ||||
| 101.Ins | XBRL Taxonomy Instance Document - the instance document does not appear in the Interactive Date File because its XBRL tags are embedded within the Inline XBRL document | ||||
| 104 | Cover Page Interactive Data File (formatted as Inline XBRL and contained in Exhibit 101). | ||||
Item 16. Form 10-K Summary
None.
79
Signatures
Pursuant to the requirements of Section 13 or 15(d) of the Securities Exchange Act of 1934, the Registrant has duly caused this report to be signed on its behalf by the undersigned, thereunto duly authorized, on this 18th day of April 2024.
| BIG LOTS, INC. | |||||
| By: /s/ Bruce K. Thorn | |||||
| Bruce K. Thorn | |||||
| President and Chief Executive Officer | |||||
| (Principal Executive Officer) | |||||
Pursuant to the requirements of the Securities Exchange Act of 1934, this report has been signed below by the following persons on behalf of the Registrant and in the capacities indicated on the 18th day of April 2024.
| By: /s/ Bruce K. Thorn | By: /s/ Jonathan E. Ramsden | |||||||
| Bruce K. Thorn | Jonathan E. Ramsden | |||||||
| President and Chief Executive Officer | Executive Vice President, Chief Financial and Administrative Officer | |||||||
| (Principal Executive Officer) | (Principal Financial Officer, Principal Accounting Officer and Duly Authorized Officer) | |||||||
| /s/ Sandra Y. Campos * | /s/ Christopher J. McCormick * | |||||||
| Sandra Y. Campos | Christopher J. McCormick | |||||||
| Director | Director | |||||||
| /s/ James R. Chambers * | /s/ Kimberly A. Newton * | |||||||
| James R. Chambers | Kimberley A. Newton | |||||||
| Director | Director | |||||||
| /s/ Sebastian J. DiGrande * | /s/ Nancy A. Reardon * | |||||||
| Sebastian J. DiGrande | Nancy A. Reardon | |||||||
| Director | Director | |||||||
| /s/ Marla C. Gottschalk * | /s/ Wendy L. Schoppert * | |||||||
| Marla C. Gottschalk | Wendy L. Schoppert | |||||||
| Director | Director | |||||||
| /s/ Cynthia T. Jamison * | /s/ Maureen B. Short * | |||||||
| Cynthia T. Jamison | Maureen B. Short | |||||||
| Director | Director | |||||||
* The above named Directors of the Registrant execute this report by Ronald A. Robins, Jr., their attorney-in-fact, pursuant to the power of attorney executed by the above-named Directors all in the capacities indicated and on the 5th day of March 2024, and filed herewith.
| By: /s/ Ronald A. Robins, Jr. | |||||
| Ronald A. Robins, Jr. | |||||
| Attorney-in-Fact | |||||
80