| UNITED STATES SECURITIES AND EXCHANGE COMMISSION Washington, D.C. 20549 | ||||||||||||||||||||||||||||||||||||||||||||||||||||||||||||||||||||
| FORM | ||||||||||||||||||||||||||||||||||||||||||||||||||||||||||||||||||||
| (Mark One) | ||||||||||||||||||||||||||||||||||||||||||||||||||||||||||||||||||||
| ANNUAL REPORT PURSUANT TO SECTION 13 OR 15(d) OF THE SECURITIES EXCHANGE ACT OF 1934 | ||||||||||||||||||||||||||||||||||||||||||||||||||||||||||||||||||||
For the fiscal year ended | ||||||||||||||||||||||||||||||||||||||||||||||||||||||||||||||||||||
| OR | ||||||||||||||||||||||||||||||||||||||||||||||||||||||||||||||||||||
| TRANSITION REPORT PURSUANT TO SECTION 13 OR 15(d) OF THE SECURITIES EXCHANGE ACT OF 1934 | ||||||||||||||||||||||||||||||||||||||||||||||||||||||||||||||||||||
For the transition period from ___________________________ to _________________________________ | ||||||||||||||||||||||||||||||||||||||||||||||||||||||||||||||||||||
| Commission file number | ||||||||||||||||||||||||||||||||||||||||||||||||||||||||||||||||||||
| (Exact name of registrant as specified in its charter) | ||||||||||||||||||||||||||||||||||||||||||||||||||||||||||||||||||||
(State or other jurisdiction of incorporation) | (I.R.S. Employer Identification No.) | |||||||||||||||||||||||||||||||||||||||||||||||||||||||||||||||||||
| (Address of principal executive offices) | (Zip Code) | |||||||||||||||||||||||||||||||||||||||||||||||||||||||||||||||||||
| Registrant's telephone number, including area code | ||||||||||||||||||||||||||||||||||||||||||||||||||||||||||||||||||||
| Securities registered pursuant to Section 12(b) of the Act: | ||||||||||||||||||||||||||||||||||||||||||||||||||||||||||||||||||||
| Title of Each Class | Trading Symbols | Name of Each Exchange on Which Registered | ||||||||||||||||||||||||||||||||||||||||||||||||||||||||||||||||||
| Securities registered pursuant to Section 12(g) of the Act: NONE | ||||||||||||||||||||||||||||||||||||||||||||||||||||||||||||||||||||
| Indicate by check mark if the registrant is a well-known seasoned issuer, as defined in Rule 405 of the Securities Act. | ||||||||||||||||||||||||||||||||||||||||||||||||||||||||||||||||||||
| ☒ | ☐ | No | ||||||||||||||||||||||||||||||||||||||||||||||||||||||||||||||||||
| Indicate by check mark if the registrant is not required to file reports pursuant to Section 13 or Section 15(d) of the Act. | ||||||||||||||||||||||||||||||||||||||||||||||||||||||||||||||||||||
| ☐ | Yes | ☒ | ||||||||||||||||||||||||||||||||||||||||||||||||||||||||||||||||||
| Indicate by check mark whether the registrant: (1) has filed all reports required to be filed by Section 13 or 15(d) of the Securities Exchange | ||||||||||||||||||||||||||||||||||||||||||||||||||||||||||||||||||||
| Act of 1934 during the preceding 12 months (or for such shorter period that the registrant was required to file such reports), and (2) has been | ||||||||||||||||||||||||||||||||||||||||||||||||||||||||||||||||||||
| subject to such filing requirements for the past 90 days. | ☒ | ¨ No | ||||||||||||||||||||||||||||||||||||||||||||||||||||||||||||||||||
| Indicate by check mark whether the registrant has submitted electronically every Interactive Data File required to be submitted pursuant to | ||||||||||||||||||||||||||||||||||||||||||||||||||||||||||||||||||||
| Rule 405 of Regulation S-T during the preceding 12 months (or for such shorter period that the registrant was required to submit such files). | ||||||||||||||||||||||||||||||||||||||||||||||||||||||||||||||||||||
| ☒ | ¨ No | |||||||||||||||||||||||||||||||||||||||||||||||||||||||||||||||||||
Indicate by check mark whether the registrant is a large accelerated filer, an accelerated filer, a non-accelerated filer, smaller reporting company, or an emerging growth company. See the definitions of “large accelerated filer,” “accelerated filer,” “smaller reporting company,” and “emerging growth company” in Rule 12b-2 of the Exchange Act. | ||||||||||||||||||||||||||||||||||||||||||||||||||||||||||||||||||||
| ☒ | Accelerated filer | ☐ | ||||||||||||||||||||||||||||||||||||||||||||||||||||||||||||||||||
| Non-accelerated file | ☐ | Smaller reporting company | ||||||||||||||||||||||||||||||||||||||||||||||||||||||||||||||||||
| Emerging growth company | ||||||||||||||||||||||||||||||||||||||||||||||||||||||||||||||||||||
| If an emerging growth company, indicate by check mark if the registrant has elected not to use the extended transition period for complying with any new or revised financial accounting standards provided pursuant to Section 13(a) of the Exchange Act. | ☐ | |||||||||||||||||||||||||||||||||||||||||||||||||||||||||||||||||||
| Indicate by check mark whether the registrant has filed a report on and attestation to its management's assessment of the effectiveness of its internal control over financial reporting under Section 404(b) of the Sarbanes-Oxley Act (15 U.S.C. 7262(b)) by the registered public accounting firm that prepared or issued its audit report. | ||||||||||||||||||||||||||||||||||||||||||||||||||||||||||||||||||||
If securities are registered pursuant to Section 12(b) of the Act, indicate by check mark whether the financial statements of the registrant included in the filing reflect the correction of an error to previously issued financial statements. | ||||||||||||||||||||||||||||||||||||||||||||||||||||||||||||||||||||
Indicate by check mark whether any of those error corrections are restatements that required a recovery analysis of incentive-based compensation received by any of the registrant’s executive officers during the relevant recovery period pursuant to §240.10D-1(b). | ☐ | |||||||||||||||||||||||||||||||||||||||||||||||||||||||||||||||||||
| Indicate by check mark whether the registrant is a shell company (as defined in Rule 12b-2 of the Exchange Act). | Yes | ☒ No | ||||||||||||||||||||||||||||||||||||||||||||||||||||||||||||||||||
As of June 30, 2023, the last business day of the registrant's most recently completed second fiscal quarter, the aggregate market value of the Registrant's Class A Common Stock held by non-affiliates was approximately $7,746,096,434 and the aggregate market value of the registrant's Class B Common Stock held by non-affiliates was approximately $49,750,401 .
As of February 13, 2024, there were 23,422,506 shares of Class A Common Stock and 5,095,930 shares of Class B Common Stock outstanding.
| Documents Incorporated by Reference | ||||||||||||||||||||||||||||||||||||||||||||||||||||||||||||||||||||
| Document | Form 10-K Parts | |||||||||||||||||||||||||||||||||||||||||||||||||||||||||||||||||||
| (1) | ||||||||||||||||||||||||||||||||||||||||||||||||||||||||||||||||||||
registrant's 2024 Annual Meeting of Stockholders (specified portions) | ||||||||||||||||||||||||||||||||||||||||||||||||||||||||||||||||||||
BIO-RAD LABORATORIES, INC.
FORM 10-K DECEMBER 31, 2023
TABLE OF CONTENTS
2
INFORMATION RELATING TO FORWARD-LOOKING STATEMENTS
Other than statements of historical fact, statements made in this report include forward-looking statements, within the meaning of the Private Securities Litigation Reform Act of 1995. These forward-looking statements include, without limitation, statements we make regarding our future financial performance, operating results, plans and objectives. Forward-looking statements generally can be identified by the use of forward-looking terminology, such as “believe,” “expect,” “anticipate,” “may,” “will,” “intend,” “estimate,” “continue,” or similar expressions or the negative of those terms or expressions. Such statements involve risks and uncertainties, which could cause actual results to vary materially from those expressed in or indicated by the forward-looking statements. We have based these forward-looking statements on our current expectations and projections about future events. However, actual results may differ materially from those currently anticipated depending on a variety of risk factors including, but not limited to, the risks relating to our international operations, supply chain issues, global economic and geopolitical conditions, our ability to develop and market new or improved products, our ability to compete effectively, foreign currency exchange fluctuations, reductions in government funding or capital spending of our customers, international legal and regulatory risks, product quality and liability issues, our ability to integrate acquired companies, products or technologies into our company successfully, changes in the healthcare industry, natural disasters and other catastrophic events beyond our control, and other risks and uncertainties identified under “Part 1, Item 1A, Risk Factors” of this Annual Report. We caution you not to place undue reliance on forward-looking statements, which reflect an analysis only and speak only as of the date hereof. We undertake no obligation to publicly update or revise any forward-looking statements, whether as a result of new information, future events, or otherwise, except as required by law.
PART I.
| ITEM 1. BUSINESS | ||
General
Bio-Rad Laboratories, Inc. (referred to in this report as “Bio-Rad,” “we,” “us,” and “our”) is a multinational manufacturer and worldwide distributor of our own life science research and clinical diagnostics products. Bio-Rad manufactures and supplies the life science research, healthcare, analytical chemistry and other markets with a broad range of products and systems used to separate complex chemical and biological materials and to identify, analyze and purify their components.
We have direct distribution channels in over 35 countries outside the United States through subsidiaries whose focus is sales, customer service and product distribution. In some locations outside and inside these 35 countries, sales efforts are supplemented by distributors and agents.
Description of Business
Business Segments
Bio-Rad operates in two industry segments designated as Life Science and Clinical Diagnostics. Both segments operate worldwide. Our Life Science segment and our Clinical Diagnostics segment generated 44% and 56%, respectively, of our consolidated net sales for the year ended December 31, 2023. We generated approximately 42% of our consolidated net sales for the year ended December 31, 2023 from the U.S. and approximately 58% from our international locations, with Europe being our largest international region .
Life Science Segment
Our Life Science segment is at the forefront of discovery, creating advanced tools to answer complex biological questions. These instruments, systems, reagents, and consumables are typically used to separate, purify, characterize, or quantitate biological materials such as cells, proteins, and nucleic acids in the research laboratory or the biopharmaceutical manufacturing and quality control process, for food safety and science education and literacy. Many of our products are used in established research techniques, biopharmaceutical production processes and food
3
testing regimes. We are focused on the translational research market segment where our products help accelerate the timelines from discovery in the lab to use in the clinic and with patients. We are a leader in the life sciences market and develop, manufacture and market a broad portfolio of many thousands of products that serve a global customer base. We focus on specific segments of the life sciences market in proteomics (the study of proteins), genomics (the study of genes), biopharmaceutical production, cellular biology and food safety. We estimate that the worldwide sales for products in the markets we serve is approximately $19 billion. Our principal life science customers include universities and medical schools, industrial research organizations, government agencies, pharmaceutical manufacturers, biotechnology researchers, food producers and food testing laboratories.
Clinical Diagnostics Segment
Our Clinical Diagnostics segment designs, manufactures, markets and supports test systems, informatics systems, test kits and specialized quality controls that serve clinical laboratories in the global diagnostics market. Our products currently address specific niches within the in vitro diagnostics (IVD) test market, and we seek to focus on the higher margin, higher growth segments of this market.
We supply several thousand products that cover more than 300 clinical diagnostic tests to the IVD test market. We estimate that the worldwide sales for products in the markets we serve is approximately $16 billion. IVD tests are conducted outside the human body and are used to identify and measure substances in a patient’s tissue, blood or urine. Our products consist of reagents, instruments and software, typically provided to our customers as an integrated package to allow them to generate reproducible test results. Revenue in this business is highly recurring, as laboratories typically standardize test methodologies, which are dependent on a particular supplier’s equipment, reagent and consumable products. An installed base of diagnostic test systems therefore typically creates a recurring source of revenue through the sale of test kits for each sample analyzed on an installed system. Our principal clinical diagnostic customers include hospital laboratories, diagnostic reference laboratories, transfusion laboratories and physician office laboratories.
Raw Materials and Components
We utilize a wide variety of chemicals, biological materials, electronic components, machined metal parts, optical parts, computing and peripheral devices. Most of these materials and components are available from numerous sources, and while we experienced challenges as a result of the impact of COVID-19 on our suppliers' operations, we are now experiencing more normal supply levels of raw materials and components used in the production of our products. For more discussion relating to the impacts of the COVID-19 pandemic and the difficulty of securing adequate supplies, please see “Item 1A, Risk Factors” of this Annual Report. In certain instances, we acquire components and materials from a sole supplier. Due to the regulatory environment in which we operate, we may be unable to quickly establish additional or replacement sources for some components or materials.
Patents, Trademarks and Licenses
We own over 2,300 U.S. and international patents and numerous trademarks. We also hold licenses under U.S. and foreign patents owned by third parties and pay royalties on the sales of certain products under these licenses. In addition, we also receive royalties for licenses of our intellectual property. We view these patents, trademarks and license agreements as valuable assets; however, we believe that our ability to develop and manufacture our products depends primarily on our knowledge, technology and special skills rather than our patent, trademark and licensing positions.
Seasonal Operations
Our business is not inherently seasonal. However, the European custom of concentrating vacation during the summer months usually tempers third quarter sales volume and operating income.
Sales and Marketing
4
We conduct our worldwide operations through an extensive direct sales force, employing approximately 810 direct sales and sales management personnel around the world. Our sales force typically consists of experienced industry professionals with scientific training, and we maintain a separate specialized sales force for each of our segments. We believe that this direct sales approach allows us to sell a broader range of our products that creates more brand awareness and long-term relationships with our customers.
We also use a range of sales and marketing intermediaries (SMIs) in our international markets. The types of SMIs we utilize are distributors, agents, brokers and resellers. We have programs and policies in place with our SMIs requiring their compliance with all applicable laws, including adhering to our anti-corruption standards to ensure a transparent sale to our customers.
Our customer base is broad and diversified. Our worldwide customer base includes (1) prominent university and research institutions; (2) hospital, public health and commercial laboratories; (3) other leading diagnostic manufacturers; and (4) leading companies in the biotechnology, pharmaceutical, chemical and food industries.
Our sales are affected by a number of external factors. For example, a number of our customers, particularly in the Life Science segment, are substantially dependent on government grants and research contracts for their funding.
Competition
The markets served by our product groups are highly competitive. Our competitors range in size from start-ups to large multinational corporations with significant resources and reach. We seek to compete primarily in market segments where the technology and efficacy of our products offer customers specific advantages over the competition.
Our Life Science segment does not face the same competitors for all of its products due to the breadth of its product lines. Major competitors in this market include Becton Dickinson, Danaher, Merck Millipore and Thermo Fisher Scientific. We compete primarily based on meeting performance specifications and offering comprehensive solutions.
Major competitors for our products in the Clinical Diagnostics segment include Roche, Abbott Laboratories, Siemens, Danaher, Thermo Fisher Scientific, Becton Dickinson, bioMérieux, Ortho Clinical Diagnostics, Tosoh, Immucor and DiaSorin. We compete across a variety of attributes including quality, service and product portfolio.
Research and Development
We conduct extensive research and development activities in all areas of our business. Research and development has played a major role in Bio-Rad’s growth and is expected to continue to do so in the future. Our research teams are continuously developing new products and new applications for existing products. In our development of new products and applications, we interact with scientific and medical professionals at pharma and bio-pharma companies, universities, hospitals and medical schools, and within our industry. In addition, we regularly invest in companies that are engaged in the development of new technologies that either complement or expand our existing portfolio of products. We have approximately 1,110 employees worldwide focused on research and development, including degreed scientists, engineers, software developers and other technical support staff.
Regulatory Matters
The development, testing, manufacturing, marketing, post-market surveillance, distribution, advertising and labeling of certain of our products (primarily diagnostic and donor screening products) are subject to regulation in the United States by the Center for Devices and Radiological Health (CDRH) and/or the Center for Biologics Evaluation and Research (CBER) of the U.S. Food and Drug Administration (FDA) and in other jurisdictions by state and foreign government authorities. FDA regulations require that some new products have pre-marketing notification (“510(k)”) or approval (“PMA” or Biologics License Application – “BLA”) by the FDA and require certain products to be manufactured in accordance with FDA’s “good manufacturing practice” regulations, to be extensively tested and to
5
be properly labeled to disclose test results and performance claims and limitations. The FDA’s 510(k) clearance process requires regulatory competence to execute and usually takes four to nine months, but it can take longer. The FDA’s PMA and BLA processes require extensive regulatory competence to execute and may take one to two years.
A clinical trial is generally required to support a PMA or BLA application and is sometimes required for a 510(k) clearance or a de novo authorization. Conducting clinical trials is a complex and costly activity and frequently requires the use of outsourced resources that specialize in planning and conducting the clinical trial for the medical device manufacturer.
The European Union (“EU”) has adopted the EU in-vitro Diagnostics Regulation (the “EU IVDR”), which imposes stricter requirements for the marketing and sale of in-vitro diagnostics products (as compared to the predecessor in-vitro Diagnostics Directive (IVDD)), including in the areas of clinical evaluation requirements, quality systems, economic operators and post-market surveillance. Bio-Rad's IVD products currently meet the applicable requirements of the EU IVDR.
Our manufacturing facilities, as well as those of certain suppliers, are subject to periodic inspections by the FDA and other regulatory bodies to verify compliance with regulatory requirements. Similar inspections are performed by Notified Bodies to verify compliance to applicable ISO standards (e.g. ISO 13485:2016), requirements under the Medical Device Single Audit Program ("MDSAP") applicable to regulatory requirements of Australia, Brazil, Canada, Japan and the U.S. and/or medical device regulations and requirements from the countries in which we distribute product and other specified audits by regulatory authorities. If a regulatory body were to find that we or certain suppliers have failed to comply with applicable regulations (e.g. recordkeeping, reporting of adverse events), it could institute a wide variety of enforcement actions, ranging from issuance of a warning or untitled letter to more severe sanctions, such as mandatory product recalls or seizures, civil penalties, consent decrees, injunctions, criminal prosecution, operating restrictions, partial suspension or shutdown of production, refusal to permit importation or exportation, refusal to grant, or delays in granting, clearances or approvals or withdrawal or suspension of existing clearances or approvals. Any of these actions could have an adverse effect on our business.
We are also subject to additional regulation and enforcement by the federal government and by authorities in the states and foreign jurisdictions in which we conduct our business. Such laws include, without limitation, state and federal anti-kickback, fraud and abuse, false claims, privacy and security and physician sunshine laws and regulations. If our operations are found to be in violation of any such laws or any other governmental regulations that apply to us, we may be subject to penalties, including, without limitation, civil and criminal penalties, damages, fines, the curtailment or restructuring of our operations, and exclusion from participation in federal and state healthcare programs and imprisonment.
Sales of our products will depend, in part, on the extent to which our products or diagnostic tests using our products will be covered by third-party payors, such as government health care programs, commercial insurance and managed healthcare organizations. These third-party payors are increasingly adjusting reimbursements for certain medical products and services. In addition, the U.S. government, state legislatures and foreign governments have continued implementing cost containment programs, including price controls and restrictions on reimbursement. Adoption of price controls and cost-containment measures, and adoption of more restrictive policies in jurisdictions with existing controls and measures, could further limit our net revenue and results. Decreases in third-party reimbursement for our products or diagnostic tests using our products, or a decision by a third-party payor to not cover our products could reduce or eliminate utilization of our products and have a material adverse effect on our sales, results of operations and financial condition. In addition, healthcare reform measures have been and will be adopted in the future, any of which could limit the amounts that governments will pay for healthcare products and services, which could result in reduced demand for our products or additional pricing pressures.
As a multinational manufacturer and distributor of sophisticated instrumentation, we must meet a wide array of electromagnetic compatibility and safety compliance requirements to satisfy regulations in the United States, the European Union and other jurisdictions.
6
Our operations are subject to federal, state, local and foreign environmental laws and regulations that govern activities such as transportation of goods, emissions to air and discharges to water, as well as handling and disposal practices for solid, hazardous and medical wastes. In addition to environmental laws that regulate our operations, we are also subject to environmental laws and regulations that create liabilities and clean-up responsibility for spills, disposals or other releases of hazardous substances into the environment as a result of our operations or otherwise impacting real property that we own or operate. The environmental laws and regulations could also subject us to claims by third parties for damages resulting from any spills, disposals or releases resulting from our operations or at any of our properties.
These regulatory requirements vary widely among countries.
Human Capital Resources
At Bio-Rad, we consider our employees to be our most valuable asset, and critical to the effective development, manufacture, sale, distribution and servicing of our vast array of products and services. Our employees are essential to satisfying our customers’ needs for products to advance science and healthcare. At December 31, 2023, we had approximately 8,030 employees, the overwhelming majority of which are full-time employees. Our employees are located throughout the world with roughly 47% in the Americas, 36% in Europe, the Middle-East and Africa, and 17% in Asia Pacific. Our employees work in over 140 locations in 36 different countries around the world.
Diversity, Equity and Inclusion
At Bio-Rad, we recognize that diversity is a strength. Our differences offer new and unique ideas and perspectives to our organization. We foster a work culture that embraces the diverse experience and knowledge of every employee, creating an inclusive culture regardless of race, gender, age, sexual orientation, disability, or nationality. We have been purposeful in our efforts to hire, develop and retain diverse talent as well as in our efforts to create an inclusive culture. We actively encourage employee engagement and regularly solicit feedback regarding job satisfaction, career growth and development, collaboration, empowerment, ethics, and manager effectiveness. We use employee input to help our managers make focused and strategic commitments to improve and sustain engagement in their teams. Bio-Rad requires that all management and employees participate in ongoing training intended to increase awareness of the importance of a diverse and inclusive culture.
Compensation and Benefits
We provide a competitive total rewards program consisting of broad-based salary and bonus plans as well as annual stock grants to senior management level employees. These programs combine to recognize and reward employees based on individual, group, and overall company performance. We provide competitive health and welfare programs which include medical, dental, vision and life insurance, a 401(k) plan, an employee stock purchase program, local pension plans, profit sharing, employee assistance, child and elder care programs, employee recognition and a host of other localized programs tied to the unique needs of our employees. Pay equity is an integral part of our compensation strategy. We have established ongoing processes and protocols to help us pay each individual employee appropriately based on the employee's skills, performance, experience, location, market practices, etc., regardless of race, gender, and other non-performance related attributes. Starting in 2023, we introduced an upgraded and streamlined mental health/Employee Assistance Program solution tailored to the need and preference of employees and families. In addition, we added a fertility benefit giving employees access to a suite of services including pregnancy resources, in vitro fertilization (“IVF”), adoption, donor and surrogate services resources.
Health, Wellness and Safety
The health and welfare of our employees is of the highest importance to Bio-Rad. We prioritize, manage, and carefully track safety performance at all locations globally and integrate sound safety practices in every aspect of our operations. We provide work site hazard evaluations, workplace safety surveys, safety equipment selection, safety program reviews, chemical exposure monitoring, safety training, and disposal of hazardous chemical and infectious waste.
7
Training and Talent Development
We provide training programs for managers and employees to support their growth and development. Our management series of courses cover essential management and leadership learning to provide our managers with the necessary skills and experience needed to more effectively lead and develop their teams. In addition, available courses for employees help them to be more effective at work, enhance interpersonal effectiveness, and help them achieve their full potential. We also support employees’ professional development by providing a reimbursement program for qualified educational expenses.
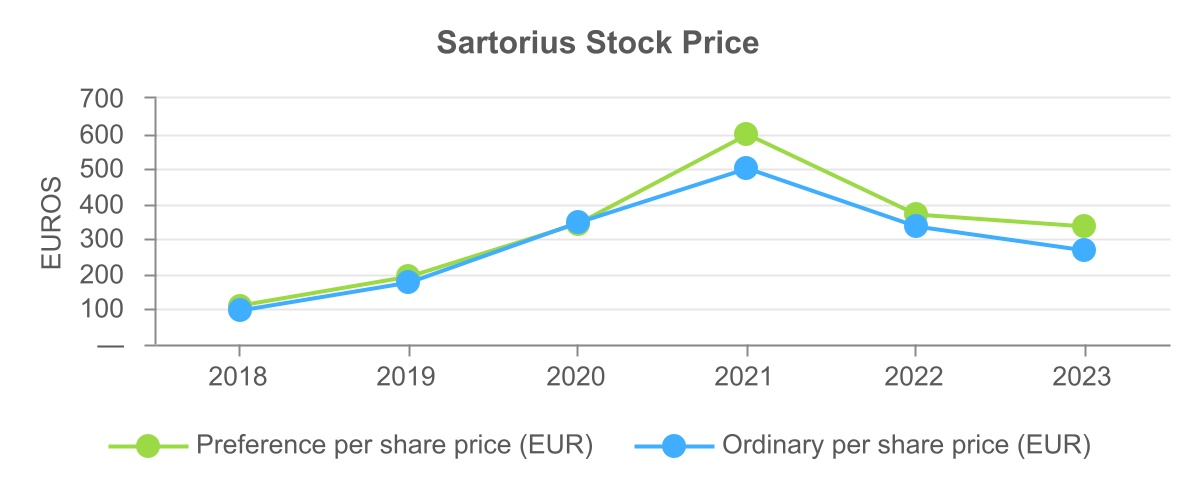
Investment in Sartorius AG
Sartorius AG ("Sartorius") is an international laboratory and process technology provider for the biotech, pharmaceutical, and food industries. It operates in two divisions – Bioprocess Solutions Division and Lab Products & Services Division. Sartorius is headquartered in Gottingen, Niedersachsen, Germany and has voting ordinary shares as well as non-voting preference shares listed on XETRA and the Frankfurt Stock Exchanges.
As of December 31, 2023, we own 12,987,900 ordinary voting shares and 9,588,908 preference shares of Sartorius, representing approximately 38% of the outstanding ordinary shares (excluding treasury shares) and 28% of the preference shares of Sartorius. As of December 31, 2023, the fair value of the investment in Sartorius was $7,331.9 million. We account for our investment in Sartorius at fair market value and do not include any of the financial information summarized below in our consolidated financial statements.
The following summarizes certain financial data of Sartorius as of and for the year ended December 31, 2022, (in millions).
December 31, 2022 (1) | |||||
| Current assets | € | 2,023.2 | |||
| Non-current assets | 4,954.6 | ||||
| Current liabilities | 1,803.4 | ||||
| Non-current liabilities | 2,515.5 | ||||
| Equity | 2,658.9 | ||||
Year Ended December 31, 2022 (1) | |||||
| Sales revenue | € | 4,174.7 | |||
| Gross profit on sales | 2,196.5 | ||||
| Earnings before interest and taxes (EBIT) | 1,064.8 | ||||
| Net profit | 913.1 | ||||
| Cash flow from operating activities | 734.2 | ||||
| Cash flow from investing activities | (1,129.9) | ||||
| Cash flow from financing activities | 209.9 | ||||
(1) As disclosed in Sartorius AG's consolidated financial statements for the year ended December 31, 2022, prepared in accordance with the International Financial Reporting Standards (IFRS), the International Financial Reporting Interpretations Committee (IFRIC) Standards, and the International Accounting Standards Board (IASB) as required to be applied by the European Union, and based upon information publicly disclosed by Sartorius. Bio-Rad does not assume, and by way of referencing the financial data of Sartorius above shall not be deemed to assume, any responsibility or liability for any errors or omissions in the information publicly disclosed by Sartorius.
8
Refer to Sartorius’ 2022 Annual Report for further details, which can be found at https://www.sartorius.com/en/company/investor-relations/sartorius-ag-investor-relations. The Sartorius website and any information disclosed thereon are not incorporated by reference into this report.
The following graph reflects the changes in the Sartorius share price over the most recent five annual periods:
Available Information
Bio-Rad files annual, quarterly, and current reports, proxy statements, and other documents with the Securities and Exchange Commission (SEC) under the Securities Exchange Act of 1934, as amended. The SEC maintains an Internet website that contains reports, proxy and information statements, and other information regarding issuers, including Bio-Rad, that file electronically with the SEC. The public can obtain any documents that we file with the SEC at http://www.sec.gov.
Bio-Rad’s website address is www.bio-rad.com. We make available, free of charge through our website, our Form 10-Ks, 10-Qs and 8-Ks, and any amendments to these forms, as soon as reasonably practicable after filing with the SEC. The information on our website is not part of this Annual Report on Form 10-K.
9
ITEM 1A. RISK FACTORS
In evaluating our business and whether to invest in any of our securities, you should carefully read the following risk factors in addition to the other information contained in this report. We believe that any of the following risks could have a material effect on our business, results of operations or financial condition, our industry or the trading price of our common stock. We operate in a continually changing business environment, and new risks and uncertainties emerge from time to time. We cannot predict these new risks and uncertainties, nor can we assess the extent to which any such new risks and uncertainties or the extent to which the risks and uncertainties set forth below may adversely affect our business, results of operations, financial condition, our industry, the value of our equity holdings, or the trading price of our common stock. Please carefully consider the following discussion of significant factors, events and uncertainties that make an investment in our securities risky and provide important information for the understanding of the “forward-looking” statements discussed this report. Additional or unforeseen effects from the COVID-19 pandemic and the global economic climate may give rise to or amplify many of these risks discussed below.
Business, Economic, Legal and Industry Risks
Our international operations expose us to additional costs and legal and regulatory risks, which could have a material adverse effect on our business, results of operations and financial condition.
We have significant international operations. We have direct distribution channels in over 35 countries outside the United States, and during the twelve months ended December 31, 2023 our foreign entities generated 58% of our net sales. Compliance with complex foreign and U.S. laws and regulations that apply to our international operations increases our cost of doing business. These numerous and sometimes conflicting laws and regulations include, among others, data privacy requirements, labor relations laws, tax laws, unfair competition regulations, import and trade restrictions, tariffs, duties, quotas and other trade barriers, export requirements, U.S. laws such as the Foreign Corrupt Practices Act ("FCPA") and other U.S. federal laws and regulations established by the office of Foreign Asset Control, foreign laws such as the UK Bribery Act 2010 or other foreign laws which prohibit corrupt payments to governmental officials or certain payments or remunerations to customers. In addition, changes in laws or regulations potentially could be disruptive to our operations and business relationships in the affected regions.
Given the high level of complexity of the foreign and U.S. laws and regulations that apply to our international operations, we may inadvertently breach some provisions, for example, through fraudulent or negligent behavior of individual employees, our failure to comply with certain formal documentation requirements, or otherwise. In addition, we operate in some countries in which the business environment is subject to a higher risk of corruption. Our success depends, in part, on our ability to anticipate these risks and manage these challenges through policies, procedures and internal controls. However, we have a dispersed international sales organization, and we use distributors and agents in many of our international operations. This structure makes it more difficult for us to ensure that our international selling operations comply with laws and regulations, and our global policies and procedures.
Violations of these laws and regulations could result in fines, criminal sanctions against us, our officers or our employees, requirements to obtain export licenses, cessation of business activities in sanctioned countries, implementation of compliance programs, and prohibitions on the conduct of our business. Violations of laws and regulations also could result in prohibitions on our ability to offer our products in one or more countries and could materially damage our reputation, our brand, our international expansion efforts, our ability to attract and retain employees, or our business, results of operations and financial condition. See also our risk factors regarding the COVID-19 pandemic, government regulations, and global economic conditions below.
The industries and market segments in which we operate are highly competitive, and we may not be able to compete effectively.
The life science and clinical diagnostics markets are each highly competitive. Some of our competitors have greater financial resources than we do, making them better equipped to license technologies and intellectual property from third parties or to fund research and development, manufacturing and marketing efforts, or to source high-demand
10
materials and components. Moreover, competitive and regulatory conditions in many markets in which we operate restrict our ability to fully recover, through price increases, higher costs of acquired goods and services resulting from inflation and other drivers of cost increases. Many public tenders have become more competitive due to governments lengthening the commitments of their public tenders to multiple years, which reduce the number of tenders in which we can participate annually. Because the value of these multiple-year tenders is so high, our competitors have been more aggressive with their pricing. Our failure to compete effectively and/or pricing pressures resulting from competition could adversely affect our business, results of operations and financial condition.
We may not be able to grow our business because of our failure to develop new or improved products.
Our future growth depends in part on our ability to continue to improve our product offerings and develop and introduce new products that integrate technological advances. If we are unable to integrate technological advances into our product offerings or to design, develop, manufacture and market new products successfully and in a timely manner, our business, results of operations and financial condition will be adversely affected. Supply chain disruptions, including those caused by the COVID-19 pandemic, have caused some delays to our ability to develop and introduce new products. We have experienced product launch delays in the past and may do so in the future. We cannot assure you that our product and process development efforts will be successful or that new products we introduce will achieve market acceptance. Failure to launch successful new products or improvements to existing products may cause our products to become obsolete, which could harm our business, results of operations and financial condition.
Global economic and geopolitical conditions could adversely affect our operations.
In recent years, we have been faced with challenging global economic conditions. U.S. and international markets have experienced inflationary pressures, and inflation rates in the U.S. and in other countries in which we operate have been at elevated levels. Our raw material costs have increased, and we are not always able to recover these increased costs from our customers. Russia’s invasion of Ukraine and sanctions against Russia also are causing disruptions to global economic conditions and are negatively impacting our business in Russia. The escalation, in October 2023, of the conflict between Israel and Hamas also has caused some disruptions to the global business environment (including impacting international logistics), the stability of the Middle East region and our business in that region. It is unknown how long any of these disruptions will continue and whether such disruptions will become more severe. In addition, we expect moderating economic growth and changing government policies in China will continue to affect our commercial opportunities in the country. The bank failures in March 2023 and the resulting volatility in the banking sector did cause and could continue to cause disruptions to global economic conditions and may impact access to cash and other financial resources by our customers and suppliers. A deterioration in the global economic environment may result in a decrease in demand for our products, increased competition, downward pressure on prices for our products and longer sales cycles. A weakening of macroeconomic conditions is also adversely affecting our suppliers, which could continue to result in interruptions in the supply of components and raw materials necessary for our products and raw material cost increases. Additionally, the United States and other countries, such as China and India, have imposed tariffs on certain goods. Further escalation of tariffs or other trade barriers could adversely impact our profitability and/or our competitiveness. See also our risk factors regarding our international operations above and regarding the COVID-19 pandemic and government regulations below.
Reductions in government funding and the capital spending programs of our customers could have a material adverse effect on our business, results of operations or financial condition.
Our customers include universities, clinical diagnostics laboratories, government agencies, hospitals and pharmaceutical, biotechnology and chemical companies. The capital spending programs of these institutions and companies have a significant effect on the demand for our products. Such programs are based on a wide variety of factors, including the resources available to make such purchases, the availability of funding from grants by governments or government agencies, the spending priorities for various types of equipment and the policies regarding capital expenditures during industry downturns or recessionary periods. If funding to our customers were to decrease, or if our customers were to decrease or reallocate their budgets in a manner adverse to us, our business, results of operations or financial condition could be materially and adversely affected.
11
A reduction or interruption in the supply of components and raw materials has adversely affected and could continue to adversely affect our manufacturing operations and related product sales.
The manufacture of our products requires the timely delivery of sufficient amounts of quality components and materials. We manufacture our products in numerous manufacturing facilities around the world. We acquire our components and materials from many suppliers in various countries. We work closely with our suppliers to ensure the continuity of supply, but we cannot guarantee these efforts will always be successful. Further, while we seek to diversify our sources of components and materials, in certain instances we acquire components and materials from a sole supplier. The COVID-19 pandemic created delays and shortages in the supply of components and raw materials. These shortages, along with challenges in ramping up new production facilities, caused a backlog of sales orders, some of which we consider to be significant, and delays in certain new product development activities. Some of the backlog of sales orders continued into 2023, but has now moderated to a more typical level. We have experienced raw material cost increases, some of which will likely continue. In addition, due to the regulatory environment in which we operate, we may need to cease use of certain essential components and materials and be unable to establish acceptable replacement sources for such components or materials. When our supply is reduced or interrupted or of poor quality, and we are unable to develop alternative sources for such supply, our ability to manufacture our products in a timely or cost-effective manner is adversely affected, which affects our ability to sell our products. See also our risk factor regarding the COVID-19 pandemic below.
Pandemics or disease outbreaks, such as the COVID-19 pandemic, have affected and could materially adversely affect our business, operations, financial condition and results of operations.
The COVID-19 pandemic has had, and similar outbreaks could again have, an adverse effect on the United States and global economies, as well as on aspects of our business, operations and financial condition and those of third parties on whom we rely. If a new pandemic were to occur, we expect that parts of our business could again suffer negative impacts, and that our customers, suppliers, logistics providers, and the global economy could also be negatively impacted.
Breaches of our information systems could have a material adverse effect on our business and results of operations.
We have experienced and expect to continue to experience attempts by individuals and organizations to attack and penetrate our layered security controls, like the December 2019 Cyberattack that was previously discussed in Item 7 of our Annual Report for the period ended December 31, 2019. Through our sales and eCommerce channels, we collect and store confidential information that customers provide to, among other things, purchase products or services, enroll in promotional programs and register on our web site. We also acquire and retain information about suppliers and employees in the normal course of business. Such information on our systems includes personally identifiable information and, in limited instances, protected health information. We also create and maintain proprietary information that is critical to our business, such as our product designs and manufacturing processes. Despite recent initiatives to improve our technology systems, such as our enterprise resource planning implementation and the centralization of our global information technology organization, we could experience a significant data security breach. The Company is also subject to phishing and other fraud schemes including fraudulent vendor communications with requests for payments and fraudulent attempts to redirect payments to improper bank accounts, some of which have been successful. While the Company has adopted training and process changes to limit the success of such fraudulent activity, the Company will be unable to stop all such fraudulent activity which may lead to unrecoverable payments to criminal accounts. Because the techniques used to obtain unauthorized access, disable or degrade service, or sabotage systems change frequently and often are not recognized until launched against a target, we may not be able to anticipate all of these techniques or to implement adequate preventive measures. Computer hackers have attempted to penetrate and will likely continue to attempt to penetrate our and our vendors’ information systems and, if successful, could misappropriate confidential customer, supplier, employee or other business information, such as our intellectual property. Third parties could also gain control of our systems and use them for criminal purposes while appearing to be us. As a result, we could lose existing customers, have difficulty attracting new customers, be exposed to claims from customers and suppliers, financial institutions, payment card associations, employees and other persons, have regulatory sanctions or penalties imposed, incur additional expenses or lose revenues as a result of a data privacy breach, or suffer other adverse consequences. Our operations and ability to process sales orders, particularly through our eCommerce channels,
12
could also be disrupted, as they were in the December 2019 Cyberattack. Any significant breakdown, intrusion, interruption, corruption, or destruction of our systems, as well as any data breaches, could have a material adverse effect on our business and results of operations. See also our risk factors regarding our information technology systems below.
If our information technology systems are disrupted, or if we fail to successfully implement, manage and integrate our information technology and reporting systems, our business, results of operations and financial condition could be harmed.
Our information technology (IT) systems are an integral part of our business, and a significant disruption of our IT systems (which increasingly include cloud-based systems provided by third party vendors) could have a material adverse effect on our business, results of operations and financial condition. We depend on our IT systems to process orders, manage inventory, pay our vendors and collect accounts receivable. Our IT systems also allow us to efficiently purchase products from our suppliers and ship products to our customers on a timely basis, maintain cost-effective operations and provide customer service. We cannot assure you that our contingency plans will allow us to operate at our current level of efficiency.
Our ability to implement our business plan in a rapidly evolving market requires effective planning, reporting and analytical processes. We expect that we will need to continue to improve and further integrate our IT systems, reporting systems and operating procedures by training and educating our employees with respect to these improvements and integrations on an ongoing basis in order to effectively run our business. We may suffer interruptions in service, loss of data or reduced functionality when we upgrade or change systems or migrate to cloud-based systems. If we fail to successfully manage and integrate our IT systems, reporting systems and operating procedures, it could adversely affect our business, results of operations and financial condition. See also our risk factors regarding our data security above and events beyond our control below.
We are subject to foreign currency exchange fluctuations, which could have a material adverse effect on our results of operations and financial condition.
A significant portion of our operations and sales are outside of the United States. When we make purchases and sales in currencies other than the U.S. dollars, we are exposed to fluctuations in foreign currencies relative to the U.S. dollar that may adversely affect our results of operations and financial condition. Our international sales are largely denominated in local currencies. As a result, the strengthening of the U.S. dollar negatively impacts our consolidated net sales expressed in U.S. dollars. Conversely, when the U.S. dollar weakens, our expenses at our international sites increase. In addition, the volatility of other currencies may negatively impact our operations outside of the United States and increase our costs to hedge against currency fluctuations. In addition, we hold investments and a loan receivable that are subject to foreign exchange fluctuations. We cannot assure you that future shifts in currency exchange rates will not have a material adverse effect on our results of operations and financial condition.
Changes in the market value of our position in Sartorius AG materially impact our financial results.
Changes in the market value of our position in Sartorius AG will continue to materially impact our consolidated statements of income (loss) and other financial statements. A decline in the market value of our position in Sartorius AG will result in decreases in net income due to write-downs in the value of the equity securities. An increase in the market value of our position in Sartorius AG will result in a favorable impact to net income independent of the actual operating performance of our business. Depending on the extent of the decline or of the increase in the market value of our position in Sartorius AG, these negative or positive impacts on us could be material.
Our share price may change significantly based upon changes in the market value of our position in Sartorius AG, independent of the actual performance of our business. Additionally, non-operating income for a period may be significantly impacted by any distribution of dividends by Sartorius AG, particularly when the dividends amount varies in comparison to prior year periods.
13
The value of our position in Sartorius AG might cause us to be deemed an investment company under the Investment Company Act of 1940.
As a result of the market value of our position in Sartorius AG, we might be deemed to be an “investment company” under Section 3(a)(1)(C) of the Investment Company Act of 1940, as amended (the “Investment Company Act”) The Company does not believe it is an investment company primarily in reliance on Section 3(b)(1) of the Investment Company Act because we are “primarily engaged” in a business other than that of investing, reinvesting, owning, holding or trading in securities. Rather, we are primarily engaged in the development, manufacturing and marketing of products for the life science research and clinical diagnostic markets, and we believe that our historical development, our public representations of policy, the activity of our officers and directors, the nature of our present assets, the sources of our present income, and the public perception of the nature of our business all support the conclusion that we are an operating company and not an investment company. Although we have discussed this issue with the staff of the SEC and we are comfortable with our position, if it is determined later that the Company may not rely on Section 3(b)(1) or any other exemption under the Investment Company Act and the Company were deemed to be an unregistered investment company, such determination would have a material adverse effect on our business as we would need to register as an investment company and be subject to the regulations of the Investment Company Act which are designed to restrict and regulate mutual funds rather than operating companies. It could also call into question the validity of all contracts to which the Company is a party. If it appeared likely that we would be deemed to be an investment company, we may modify our position in Sartorius AG in order to avoid such determination.
We may incur losses in future periods due to write-downs in the value of financial instruments.
We have positions in a variety of financial instruments including asset backed securities and other similar investments. Financial markets are volatile and the markets for these securities can be illiquid. The value of these securities will continue to be impacted by external market factors including default rates, changes in the value of the underlying property, such as residential or commercial real estate, rating agency actions, the prices at which observable market transactions occur and the financial strength of various entities, such as financial guarantors who provide insurance for the securities. Should we need to convert these positions to cash, we may not be able to sell these instruments without significant losses due to current debtor financial conditions, low trading volume of the securities, or other market considerations.
As discussed further in the Notes to Consolidated Financial Statements, in Note 2. Fair Value Measurements, under the heading “Level 3 Fair Value Investments”, we made a loan of 400 million Euros to Sartorius-Herbst Beteiligungen II GmbH in November 2021 that is secured by the pledge of certain trust interests which upon termination of the trust represent the right to receive Sartorius ordinary shares (the "Loan"). Prior to a termination of the trust, the trust interests, which are provided as collateral for the Loan, are not tradable on the capital markets and may, in case of an enforcement, have to be sold with a significant discount to the value of the underlying shares.
We also have positions in equity securities, including our position in Sartorius AG. Financial markets are volatile and the markets for these equity securities can be illiquid as well. A decline in the market value of our investments in equity securities could result in significant losses due to write-downs in the value of the equity securities. Also, if we need to convert these positions to cash, we may not be able to sell these equity securities without significant losses. In addition, a significant decline in the value of the Sartorius ordinary shares would reduce the value of the collateral for the Loan discussed in the previous paragraph, and in such circumstances the value of the collateral may be insufficient to cover the repayment of the Loan, and Sartorius-Herbst Beteiligungen II GmbH will likely have no other assets from which to repay the Loan. Furthermore, the change in the market value of Sartorius ordinary shares will have an impact on the value appreciation rights acquired in connection with the Loan discussed in the previous paragraph.
Recent and planned changes to our organizational structure could negatively impact our business.
We made significant changes to our organizational structure over the past few years, including the reorganization of aspects of our European operations that was announced in February 2021 and restructurings that management approved in 2023. These changes may have unintended consequences, such as distraction of our management and employees, labor unrest, business disruption, disruption of supply, attrition of our workforce, inability to attract or retain key employees, and reduced employee morale or productivity.
14
Risks relating to intellectual property rights may negatively impact our business.
We rely on a combination of copyright, trade secret, patent and trademark laws and third-party nondisclosure agreements to protect our intellectual property rights and products. However, we cannot assure you that our intellectual property rights will not be challenged, invalidated, circumvented or rendered unenforceable, or that meaningful protection or adequate remedies will be available to us. Unauthorized third parties have attempted to copy our intellectual property, reverse engineer or obtain and use information that we regard as proprietary, or have developed equivalent technologies independently, and may do so in the future. Additionally, third parties have asserted patent, copyright and other intellectual property rights to technologies that are important to us and may do so in the future. If we are unable to license or otherwise access protected technology used in our products, or if we lose our rights under any existing licenses, we could be prohibited from manufacturing and marketing such products. From time to time, we also must enforce our patents or other intellectual property rights or defend ourselves against claimed infringement of the rights of others through litigation. As a result, we could incur substantial costs, be forced to redesign our products, or be required to pay damages or royalties to an infringed party. Any of the foregoing matters could adversely impact our business, results of operations and financial condition.
Changes in the healthcare industry could have an adverse effect on our business, results of operations and financial condition.
There have been, and will continue to be, significant changes in the healthcare industry in an effort to reduce costs. These changes include:
•The trend towards managed care, together with healthcare reform of the delivery system in the United States and efforts to reform in Europe, has resulted in increased pressure on healthcare providers and other participants in the healthcare industry to reduce selling prices. Consolidation among healthcare providers and consolidation among other participants in the healthcare industry has resulted in fewer, more powerful groups, whose purchasing power gives them cost containment leverage. In particular, there has been a consolidation of laboratories and a consolidation of blood transfusion centers. These industry trends and competitive forces place constraints on the levels of overall pricing and thus could have a material adverse effect on our gross margins for products we sell in clinical diagnostic markets.
•Third party payors, such as Medicare and Medicaid in the United States, have reduced their reimbursements for certain medical products and services. Our Clinical Diagnostics business is impacted by the level of reimbursement available for clinical tests from third party payors. In the United States payment for many diagnostic tests furnished to Medicare fee-for-service beneficiaries is made based on the Medicare Clinical Laboratory Fee Schedule (CLFS), a fee schedule established and adjusted from time to time by the Centers for Medicare and Medicaid Services (CMS). Some commercial payors are guided by the CLFS in establishing their reimbursement rates. Laboratories and clinicians may decide not to order or perform certain clinical diagnostic tests if third party payments are inadequate, and we cannot predict whether third party payors will offer adequate reimbursement for tests utilizing our products to make them commercially attractive. Legislation, such as the Patient Protection and Affordable Care Act, as amended by the Health Care and Education Reconciliation Act (PPACA) and the Middle Class Tax Relief and Job Creation Act of 2012, has reduced the payments for clinical laboratory services paid under the CLFS. In addition, the Protecting Access to Medicare Act of 2014 (PAMA) has made significant changes to the way Medicare will pay for clinical laboratory services, which has further reduced reimbursement rates.
To the extent that the healthcare industry seeks to address the need to contain costs stemming from reform measures such as those contained in the PPACA and the PAMA, or in future legislation, by limiting the number of clinical tests being performed or the amount of reimbursement available for such tests, our business, results of operations and financial condition could be adversely affected. If these changes in the healthcare markets in the United States and Europe continue, we could be forced to alter our approach in selling, marketing, distributing and servicing our products.
15
We are subject to substantial government regulation, and any changes in regulation or violations of regulations by us could adversely affect our business, prospects, results of operations or financial condition.
Some of our products (primarily our Clinical Diagnostic products), production processes and marketing are subject to U.S. federal, state and local, and foreign regulation, including by the FDA in the United States and its foreign counterparts. The FDA regulates our Clinical Diagnostic products as medical devices, and we are subject to significant regulatory clearances or approvals to market our Clinical Diagnostic products and other requirements including, for example, recordkeeping and reporting requirements, such as the FDA’s medical device reporting regulations and reporting of corrections and removals. The FDA has broad regulatory and enforcement powers. If the FDA determines that we have failed to comply with applicable regulatory requirements, it can impose a variety of enforcement actions ranging from public warning letters, fines, injunctions, consent decrees and civil penalties to suspension or delayed issuance of approvals, seizure or recall of our products, total or partial shutdown of production, withdrawal of approvals or clearances already granted, and criminal prosecution.
The FDA can also require us to repair, replace or refund the cost of devices that we manufactured or distributed. In addition, the FDA may change its clearance and approval policies, adopt additional regulations or revise existing regulations, or take other actions, which may prevent or delay approval or clearance of our products or impact our ability to modify our currently approved or cleared products on a timely basis. Any delay in, or failure to receive or maintain, clearance or approval for our products or changes in regulation could prevent us from generating revenue from these products and adversely affect our business operations and financial results. Additionally, the FDA and other regulatory authorities have broad enforcement powers. Regulatory enforcement or inquiries, or other increased scrutiny on us, could affect the perceived safety and efficacy of our products and dissuade our customers from using our products.
The FDA has issued a proposed rule pursuant to which it may begin enforcing its medical device requirements, including premarket submission requirements, applicable to certain clinical diagnostic products referred to as laboratory developed tests. Changes in the FDA approach could negatively impact our customers who use our Life Science products for laboratory developed tests.
Many foreign governments have similar rules and regulations regarding the importation, registration, labeling, sale and use of our products. Such agencies may also impose new requirements that may require us to modify or re-register products already on the market or otherwise impact our ability to market our products in those countries. The EU in-vitro Diagnostics Regulation (the “EU IVDR”) includes broad changes regarding in vitro diagnostic devices and medical devices. The EU IVDR required us to modify or re-register some products, and we expect will continue to result in additional costs for ongoing compliance. In addition, Russia has enacted more stringent medical product registration and labeling regulations, China has enacted stricter labeling requirements, and we expect other countries, such as Brazil and India, to impose more regulations that impact our product registrations. The United Kingdom's withdrawal from the EU is resulting in additional regulatory requirements associated with goods manufactured and sold in the United Kingdom and additional complexities and delays with respect to goods, raw materials and personnel moving between the United Kingdom and the EU. In addition, new government administrations may interpret existing regulations or practices differently. Due to these evolving and diverse requirements, we face uncertain product approval timelines, additional time and effort to comply, as well as the potential for reduced sales and/or fines for noncompliance. Increasing protectionism in such countries also impedes our ability to compete with local companies. We may not be able to participate in certain public tenders in China, India and Russia because of increasing measures to restrict access to such tenders for companies without local manufacturing capabilities. Such regulations could adversely affect our business, results of operations and financial condition. See also our risk factors regarding our international operations and regarding global economic and geopolitical conditions above.
We are also subject to government regulation of the use and handling of a number of materials and controlled substances. The U.S. Drug Enforcement Administration establishes registration, security, recordkeeping, reporting, storage, distribution and other requirements for controlled substances pursuant to the Controlled Substances Act of 1970. Failure to comply with present or future laws and regulations could result in substantial liability to us, suspension or cessation of our operations, restrictions on our ability to expand at our present locations or require us to make significant capital expenditures or incur other significant expenses.
16
We cannot assure you that we will be able to integrate acquired companies, products or technologies into our company successfully, or that we will be able to realize the anticipated benefits from the acquisitions.
As part of our overall business strategy, we pursue acquisitions of and investments in complementary companies, products and technologies. The benefits of any acquisition or investment may prove to be less than anticipated and may not outweigh the costs reported in our financial statements. Completing any potential future acquisitions could cause significant diversion of our management’s time and resources. If we acquire or invest in new companies, products or technologies, we may be required to assume contingent liabilities or record impairment charges for goodwill and other intangible assets over time. Goodwill and non-amortizable intangible assets are subject to impairment testing, and potential periodic goodwill impairment charges, amortization expenses related to certain intangible assets, and other write-offs could harm our operating results. Impairment tests are highly sensitive to changes in assumptions and minor changes to assumptions could result in impairment losses. If the results forecast in our impairment tests are not achieved, or business trends vary from the assumptions used in forecasts, or external factors change detrimentally, future impairment losses may occur, as they have occurred in the past. Increased antitrust enforcement and greater government scrutiny of mergers in the healthcare sector may impact our ability to consummate acquisitions. We cannot assure you that we will successfully overcome these risks or any other problems we encounter in connection with any acquisitions or investments, and any such acquisitions or investments could adversely affect our business, results of operations and financial condition.
Product quality and liability issues could harm our reputation and negatively impact our business, results of operations and financial condition.
We must adequately address quality issues associated with our products, including defects in our engineering, design and manufacturing processes, as well as defects in third-party components included in our products. Our instruments, reagents and consumables are complex, and identifying the root cause of quality issues, especially those affecting reagents or third-party components, is difficult. We may incur significant costs and expend substantial time in researching and remediating such issues. Quality issues could also delay our launching or manufacturing of new products. In addition, quality issues, unapproved uses of our products, or inadequate disclosure of risks related to our products, could result in product recalls or product liability or other claims being brought against us. In responding to shortages, we may source components from alternative suppliers and distributors. Quality issues associated with components from these alternative sources may lead to product failures and associated costs notwithstanding our efforts to detect and remediate such quality issues. These issues could harm our reputation, impair our relationship with existing customers and harm our ability to attract new customers, which could negatively impact our business, results of operations and financial condition.
Lack of key personnel could hurt our business.
Our products are very technical in nature, and we operate in a complex and competitive business environment. In general, only highly qualified and well-trained scientists, technicians and other specialized individuals have the necessary skills to develop, market and sell our products, and many of our manufacturing positions require very specialized knowledge and skills. In addition, the global nature of our business also requires that we have sophisticated and experienced staff to comply with increasingly complex international laws and regulations. We face intense competition for these professionals from our competitors, customers, marketing partners and other companies throughout our industry. If we do not offer competitive compensation and benefits, we may fail to retain or attract a sufficient number of qualified personnel, which could impair our ability to properly run our business.
We may have higher than anticipated tax liabilities.
We are subject to income taxes in the United States and many foreign jurisdictions. We report our results of operations based on our determination of the amount of taxes owed in various tax jurisdictions in which we operate. The determination of our worldwide provision for income taxes and other tax liabilities requires estimation, judgment and calculations where the ultimate tax determination may not be certain. Determination of our tax liabilities is subject to review or examination by tax authorities in various tax jurisdictions. Tax authorities have disagreed with our judgment in the past and may disagree with positions we take in the future resulting in assessments of additional taxes. Any adverse outcome of such review or examination could have a negative impact on our operating results and financial condition.
17
Economic and political pressures to increase tax revenues in various jurisdictions may make resolving tax disputes more difficult. In recent years, the tax authorities in Europe have disagreed with our tax positions related to hybrid debt, research and development credits, transfer pricing and indirect taxes, among others. We regularly assess the likelihood of the outcome resulting from these examinations to determine the adequacy of our provision for income taxes. Although we believe our tax estimates are reasonable, the final determination of tax audits and any related litigation could be materially different from our historical income tax provisions and accruals.
Changes in tax laws or rates, changes in the interpretation of tax laws or changes in the jurisdictional mix of our earnings could adversely affect our financial position and results of operations.
On December 22, 2017, the U.S. enacted comprehensive tax legislation commonly referred to as the Tax Cuts and Jobs Act (the “Tax Act”) which made a number of substantial changes to how the United States imposes income tax on multinational corporations. The U.S Treasury, Internal Revenue Service and other standard setting bodies continue to issue guidance and interpretation relating to the Tax Act. As future guidance is issued, we may make adjustments to amounts previously reported that could materially impact our financial statements.
On August 16, 2022, President Biden signed into law the Inflation Reduction Act of 2022, which includes an Alternative Minimum Tax based on the Adjusted Financial Statement Income of Applicable Corporations. We do not believe the Inflation Reduction Act will have a material impact on our income tax provision and cash taxes, but we continue to monitor U.S. Department of the Treasury guidance and regulations.
The tax effect of our position in Sartorius AG and the jurisdictional mix of our earnings could continue to materially affect our financial results and cash flow. In addition, the adoption of some or all of the recommendations set forth in the Organization for Economic Co-operation and Development’s project on “Base Erosion and Profit Shifting” (BEPS) by tax authorities in the countries in which we operate, could negatively impact our effective tax rate. These recommendations focus on payments from affiliates in high tax jurisdictions to affiliates in lower tax jurisdictions and the activities that give rise to a taxable presence in a particular country.
On October 8, 2021, the OECD announced that 136 countries have agreed on a two-pillar framework that would dramatically alter the taxation of multinational enterprises and require that all profits to be subject to a global minimum tax rate of 15%. On December 15, 2022, the European Union formally adopted the Pillar Two Directive and EU member states were expected to enact the Pillar Two Directive by December 31, 2023. Other countries are taking similar actions. We do not believe Pillar 2 legislation will have a material impact on our income tax provision and cash taxes.
Environmental, health and safety regulations and enforcement proceedings may negatively impact our business, results of operations and financial condition.
Our operations are subject to federal, state, local and foreign environmental laws and regulations that govern such activities as transportation of goods, materials that we use in our products, emissions to air and discharges to water, as well as handling and disposal practices for solid, hazardous and medical wastes. In addition to environmental laws that regulate our operations, we are also subject to environmental laws and regulations that create liability and responsibility for spills, disposals or other releases of hazardous substances into the environment as a result of our operations or otherwise impacting real property that we own or operate. The environmental laws and regulations also subject us to claims by third parties for damages resulting from any spills, disposals or releases resulting from our operations or at any of our properties. We must also comply with various health and safety regulations in the United States and abroad in connection with our operations.
We may in the future incur capital and operating costs to comply with currently existing laws and regulations, and possible new statutory enactments, and these expenditures may be significant. We have incurred, and may in the future incur, fines related to environmental matters and/or liability for costs or damages related to spills or other releases of hazardous substances into the environment at sites where we have operated, or at off-site locations where we have sent hazardous substances for disposal. We cannot assure you, however, that such matters or any future obligations to comply with environmental or health and safety laws and regulations will not adversely affect our business, results of operations or financial condition.
18
In addition, there is an increasing focus by U.S. and international regulators, investors, customers, and other stakeholders on environmental, social and governance (ESG) matters. Complying with new laws or regulations concerning sustainability matters, climate related matters or other ESG matters will result in increased compliance costs and create additional non-compliance risks. Failure to adequately meet our stakeholder’s expectations or comply with any such laws or regulations may result in loss of business, reputational damage, an inability to attract customers, an inability to attract and retain top talent, and a negative impact on our business, results of operations and financial condition.
We also have announced certain sustainability goals, which require ongoing investment and operational changes. Our efforts may not achieve their intended outcomes, and we may not achieve such goals, which could negatively impact our reputation and business.
Our current and future debt and related covenants may restrict our future operations.
We have substantial debt and have the ability to incur additional debt. As of December 31, 2023, we had approximately $1.2 billion of outstanding long-term indebtedness, primarily consisting of the 3.300% Senior Notes due in March 2027 and the 3.700% Senior Notes due in March 2032 as further discussed in Note 6 of the consolidated financial statements. In addition, we have a revolving credit facility that provides for up to $200.0 million in borrowing capacity, $0.2 million of which was utilized for domestic standby letters of credit as of December 31, 2023. Our incurrence of substantial amounts of debt may have important consequences. For instance, it could:
•make it more difficult for us to satisfy our financial obligations, including those relating to our outstanding debt;
•require us to dedicate a substantial portion of our cash flow from operations to the payment of interest and principal due under our debt, which will reduce funds available for other business purposes;
•increase our vulnerability to general adverse economic and industry conditions;
•limit our flexibility in planning for, or reacting to, changes in our business and the industries in which we operate;
•place us at a competitive disadvantage compared with some of our competitors that have less debt; and
•limit our ability to obtain additional financing required to fund working capital and capital expenditures and for other general corporate purposes.
Our existing credit facility, our Senior Notes and agreements we may enter in the future, contain or may contain covenants imposing restrictions on our business. These restrictions may affect our ability to operate our business and may limit our ability to take advantage of potential business opportunities as they arise. Existing covenants place restrictions on our ability to, among other things: incur additional debt; acquire other businesses or assets through merger or purchase; create liens; enter into transactions with affiliates; sell assets; and in the case of some of our subsidiaries, guarantee debt. Our existing credit facility also requires that we comply with a maximum consolidated leverage ratio test. Our ability to comply with these covenants may be affected by events beyond our control, including prevailing economic, financial and industry conditions. The breach of any of these restrictions could result in a default. An event of default under our debt agreements would permit some of our lenders to declare all amounts borrowed from them to be due and payable, together with accrued and unpaid interest.
We are subject to healthcare laws and regulations and could face substantial penalties if we are unable to fully comply with such laws.
We are subject to healthcare regulation and enforcement by both the U.S. federal government and the U.S. states and foreign governments in which we conduct our business. These healthcare laws and regulations include, for example:
•the U.S. federal Anti-Kickback Statute, which prohibits, among other things, persons or entities from soliciting, receiving, offering or providing remuneration, directly or indirectly, in return for or to induce either the referral of an individual for, or the purchase order or recommendation of, any item or services for which payment may be made under a federal healthcare program such as the Medicare and Medicaid programs;
19
•U.S. federal false claims laws, which prohibit, among other things, individuals or entities from knowingly presenting, or causing to be presented, claims for payment from Medicare, Medicaid, or other third-party payors that are false or fraudulent. In addition, the U.S. federal government may assert that a claim including items or services resulting from a violation of the federal Anti-Kickback Statute constitutes a false or fraudulent claim for purposes of the false claims statutes;
•the U.S. Physician Payment Sunshine Act, which requires certain manufacturers of drugs, biologics, devices and medical supplies to record any transfers of value to U.S. physicians and U.S. teaching hospitals;
•the Health Insurance Portability and Accountability Act ("HIPAA"), as amended by the Health Information Technology for Economic and Clinical Health Act, which governs the conduct of certain electronic healthcare transactions and protects the security and privacy of protected health information; and
•state or foreign law equivalents of each of the U.S. federal laws above, such as anti-kickback and false claims laws, which may apply to items or services reimbursed by any third-party payor, including commercial insurers.
These laws will continue to impose administrative, cost and compliance burdens on us. The shifting compliance environment and the need to build and maintain robust systems to comply with multiple jurisdictions with different compliance and/or reporting requirements increases the possibility that a healthcare company may violate one or more of these requirements. In addition, any action against us for violation of these laws, even if we successfully defend against it, could cause us to incur significant legal expenses and divert our management’s attention from the operation of our business. If our operations are found to be in violation of any of the laws described above or any other governmental regulations that apply to us, we may be subject to penalties, including civil and criminal penalties, damages, fines, exclusion from the Medicare and Medicaid programs, and the curtailment or restructuring of our operations, any of which could adversely affect our ability to operate our business, results of operations and financial condition.
Risks Related to Being a Public Company
Our failure to establish and maintain effective internal control over financial reporting could result in material misstatements in our financial statements, our failure to meet our reporting obligations and cause investors to lose confidence in our reported financial information, which in turn could cause the trading price of our common stock to decline.
Maintaining effective disclosure controls and procedures and internal controls over financial reporting are necessary for us to produce reliable financial statements. Material weaknesses in our internal control over financial reporting have adversely affected us in the past and could affect us in the future and the results of our periodic management evaluations and annual auditor attestation reports regarding the effectiveness of our internal control over financial reporting required by Section 404 of the Sarbanes-Oxley Act of 2002. Any failure to maintain or implement new or improved internal controls, or any difficulties that we may encounter in their maintenance or implementation, could result in additional material weaknesses, result in material misstatements in our consolidated financial statements and cause us to fail to meet our reporting obligations. This could cause us to lose public confidence and could cause the trading price of our common stock to decline.
General Business Risks
Natural disasters, climate related events, terrorist attacks, acts of war or other events beyond our control may cause damage or disruption to us and our employees, facilities, information systems, security systems, vendors and customers, which could significantly impact our business, results of operations and financial condition.
We have significant manufacturing and distribution facilities, including in the United States, France, Switzerland, Germany and Singapore. In particular, the western United States has experienced a number of earthquakes, wildfires, floods, landslides and other natural disasters in recent years. These occurrences could damage or destroy
20
our facilities which may result in interruptions to our business and losses that exceed our insurance coverage. In addition, lack of fuel resources due to geo-political instability (such as Russia’s reduction in energy resources supplied to Western Europe), electricity outages, the inability to operate our production and distribution facilities due to power grid failures or lack of fuel, and strikes or other labor unrest at any of our sites or surrounding areas could cause disruption to our business. Acts of terrorism, bioterrorism, violence or war (such as Russia's invasion of Ukraine and the conflict between Israel and Hamas), weather-related events, or public health issues such as the outbreak of a contagious disease like COVID-19 could also affect the markets in which we operate, our business operations and strategic plans. Political unrest may affect our sales in certain regions, such as in Southeast Asia, the Middle East and Eastern Europe. Any of these events could adversely affect our business, results of operations and financial condition.
Risks Related to Our Common Stock
A significant majority of our voting stock is held by the Schwartz family, which could lead to conflicts of interest.
We have two classes of voting stock: Class A Common Stock and Class B Common Stock. With a few exceptions, holders of Class A and Class B Common Stock vote as a single class. When voting as a single class, each share of Class A Common Stock is entitled to one-tenth of a vote, while each share of Class B Common Stock has one vote. In the election or removal of directors, the classes vote separately and the holders of Class A Common Stock are entitled to elect 25% of the Board of Directors, with holders of Class B Common Stock electing the remaining directors. As a result of the Schwartz family's ownership of our Class A and Class B Common Stock, they are able to elect a majority of our directors, effect fundamental changes in our direction and control matters affecting us, including the determination of business opportunities that may be suitable for our company. The Schwartz family may exercise its control over us according to interests that are different from other investors’ or debtors’ interests. In particular, this concentration of ownership and voting power may have the effect of delaying or preventing a change in control of our company.
The forum selection provision in our bylaws could increase costs to bring a claim, discourage claims or limit the ability of the Company’s stockholders to bring a claim in a judicial forum viewed by the stockholders as more favorable for disputes with the Company or the Company’s directors, officers or other employees.
Our bylaws provide that unless we consent in writing to the selection of an alternative forum, the Court of Chancery of the State of Delaware (or, if the Court of Chancery does not have jurisdiction, another state court located within the State of Delaware or, if no state court located within the State of Delaware has jurisdiction, the federal district court for the District of Delaware) shall be the sole and exclusive forum for (i) any derivative action or proceeding brought on behalf of the Company, (ii) any action asserting a claim of breach of a fiduciary duty owed by any director, officer or other employee of the Company to the Company or the Company’s stockholders, (iii) any action arising pursuant to any provision of the General Corporation Law of the State of Delaware, the Certificate of Incorporation or the Bylaws (in each case, as may be amended from time to time) or (iv) any action asserting a claim against the Company or any of its directors, officers or other employees governed by the internal affairs doctrine of the State of Delaware. This choice of forum provision may increase costs to bring a claim, discourage claims or limit a stockholder’s ability to bring a claim in a judicial forum that it finds favorable for disputes with the Company or the Company’s directors, officers or other employees, which may discourage such lawsuits against the Company or the Company’s directors, officers and other employees. Alternatively, if a court were to find the choice of forum provision contained in the Company’s bylaws to be inapplicable or unenforceable in an action, the Company may incur additional costs associated with resolving such action in other jurisdictions.
Application of the choice of forum provision may be limited in some instances by applicable law. Section 27 of the Exchange Act creates exclusive federal jurisdiction over all suits brought to enforce any duty or liability created by the Exchange Act or the rules and regulations thereunder. As a result, the choice of forum provision will not apply to actions arising under the Exchange Act or the rules and regulations thereunder. Section 22 of the Securities Act creates concurrent jurisdiction for federal and state courts over suits brought to enforce any duty or liability created by the Securities Act or the rules and regulations thereunder, subject to a limited exception for certain “covered class actions.” There is uncertainty, particularly in light of current litigation, as to whether a court would enforce the choice of forum provision with respect to claims under the Securities Act. Our stockholders will not be deemed, by operation of the Company’s choice of forum provision, to have waived claims arising under the federal securities laws and the rules and regulations thereunder.
21
| ITEM 1B. UNRESOLVED STAFF COMMENTS | ||
| None. | ||
ITEM 1C. CYBERSECURITY | ||
Cybersecurity Risk Management and Strategy
We have developed and implemented a cybersecurity risk management program intended to protect the confidentiality, integrity, and availability of our critical systems and information. Our cybersecurity risk management program includes a cybersecurity incident response plan.
We design and assess our program based on the National Institute of Standards and Technology Cybersecurity Framework Special Publication 800-53, 800-61, rev 2 and Center for Internet Security, Critical Security Controls (CIS Controls). This does not imply that we meet any particular technical standards, specifications, or requirements, only that we use the National Institute of Standards and Technology Cybersecurity Framework as a guide to help us identify, assess, and manage cybersecurity risks relevant to our business.
Our cybersecurity risk management program is part of our overall enterprise risk management program, and shares common methodologies, reporting channels and governance processes that apply across the enterprise risk management program to other legal, compliance, strategic, operational, and financial risk areas.
Our cybersecurity risk management program includes:
•risk assessments designed to help identify material cybersecurity risks to our critical systems, information, products, services, and our broader enterprise IT environment;
•a security team principally responsible for managing (1) our cybersecurity risk assessment processes, (2) our security controls, and (3) our response to cybersecurity incidents;
•the use of external service providers, where appropriate, to assess, test or otherwise assist with aspects of our security controls;
•cybersecurity awareness training of our employees, incident response personnel, and senior management;
•a cybersecurity incident response plan that includes procedures for responding to cybersecurity incidents; and
•a third-party risk management process for critical service providers, suppliers, and vendors.
We have not identified risks from known cybersecurity threats, including as a result of any prior cybersecurity incidents in the past three fiscal years, that have materially affected or are reasonably likely to materially affect us, including our operations, business strategy, results of operations, or financial condition. For more information about our cybersecurity related risks, see Part 1, Item 1A, Risk Factors under the risks titled "Breaches of our information systems could have a material adverse effect on our business and results of operations" and "If our information technology systems are disrupted, or if we fail to successfully implement, manage and integrate our information technology and reporting systems, our business, results of operations and financial condition could be harmed."
Cybersecurity Governance
Our Board considers cybersecurity risk as part of its risk oversight function and has delegated to the Legal and Regulatory Compliance Committee (Committee) oversight of cybersecurity and other information technology risks. The Committee oversees management’s implementation of our cybersecurity risk management program.
22
The Committee receives quarterly reports from management on our cybersecurity risks. In addition, management updates the Committee, as necessary, regarding any material cybersecurity incidents, as well as any incidents with lesser impact potential.
The Committee reports to the full Board regarding its activities, including those related to cybersecurity. The full Board also receives briefings from management on our cyber risk management program. Board members receive presentations or reports on cybersecurity topics from our SVP Global Technology & Systems, who is our Chief Information Security Officer (CISO), internal security staff or external experts as part of the Board’s continuing education on topics that impact public companies.
Our management team, including, our Chief Information Security Officer, Chief Privacy Officer, General Counsel, Director of Information Security & IT Compliance, Corporate Treasurer, and Internal Audit Senior Director, is responsible for assessing and managing our material risks from cybersecurity threats. The team has primary responsibility for our overall cybersecurity risk management program and supervises both our internal cybersecurity personnel and our retained external cybersecurity consultants. Our management team includes a wealth of expertise in navigating the complex landscape of cybersecurity, with a robust background in cyber risk management and incident response. With a collective experience that spans several decades, our team has successfully addressed and mitigated diverse cyber threats, ranging from sophisticated attacks to emerging vulnerabilities. Members of our management team hold industry-recognized certifications, including but not limited to CISSP, CISA, and CEH, underscoring their commitment to continuous professional development and adherence to the highest standards in the field.
Our management team supervises efforts to prevent, detect, mitigate, and remediate cybersecurity risks and incidents through various means, which may include briefings from internal security personnel; threat intelligence and other information obtained from governmental, public or private sources, including external consultants engaged by us; and alerts and reports produced by security tools deployed in the IT environment.
| ITEM 2. PROPERTIES | ||
We own our corporate headquarters located in Hercules, California. The principal manufacturing and research locations for each segment are as follows:
23
| Segment | Location | Owned/Leased | ||||||
| Life Science | Boulder, Colorado | Leased | ||||||
| Oxford, England | Leased | |||||||
| Neuried, Germany | Leased | |||||||
| Shanghai, China | Leased | |||||||
| Suzhou, China | Leased | |||||||
| Clinical Diagnostics | Irvine, California | Leased | ||||||
| Greater Seattle Area, Washington | Leased | |||||||
| Warsaw, Poland | Leased | |||||||
| Cressier, Switzerland | Owned/Leased | |||||||
| Dreieich, Germany | Owned/Leased | |||||||
| Shared | Greater San Francisco Bay Area, California | Owned/Leased | ||||||
| Ann Arbor, Michigan | Leased | |||||||
| Greater Paris Area, France | Leased | |||||||
| Lille, France | Owned | |||||||
| Leipzig, Germany | Leased | |||||||
| Singapore, Singapore | Leased | |||||||
Most manufacturing and research facilities also house administration, sales and distribution activities. In addition, we lease office and warehouse facilities in a variety of locations around the world. The facilities are used principally for sales, service, distribution and administration for both segments.
| ITEM 3. LEGAL PROCEEDINGS | ||
We are a party to various claims, legal actions and complaints arising in the ordinary course of business. While we do not believe, at this time, that any ultimate liability resulting from any of these matters will have a material adverse effect on our results of operations, financial position or liquidity, we cannot give any assurance regarding the ultimate outcome of these matters and their resolution could be material to our operating results for any particular period, depending on the level of income for the period.
| ITEM 4. MINE SAFETY DISCLOSURES | ||
Not applicable.
PART II.
ITEM 5. MARKET FOR REGISTRANT’S COMMON EQUITY, RELATED STOCKHOLDER MATTERS AND ISSUER PURCHASES OF EQUITY SECURITIES
Information Concerning Common Stock
Bio-Rad’s Class A and Class B Common Stock are listed on the New York Stock Exchange with the ticker symbols BIO and BIO.B, respectively.
24
On February 13, 2024, we had 147 holders of record of Class A Common Stock and 85 holders of record of Class B Common Stock. Bio-Rad has never paid a cash dividend and has no present plans to pay cash dividends.
In November 2017, the Board of Directors authorized a share repurchase program ("2017 Share Repurchase Program"), granting the Company authority to repurchase, on a discretionary basis, up to $250.0 million of outstanding shares of our common stock. In both July 2020 and July 2022, the Board of Directors authorized increasing the 2017 Share Repurchase Program to allow the Company to purchase up to an additional $200.0 million of stock, for a total authorization of $650.0 million of stock. As of December 31, 2023, the Company had repurchased $650.0 million under the 2017 Share Repurchase Program, which completed the level of authorized purchases under that share repurchase program. In July 2023, the board of directors authorized a new share repurchase program ("2023 Share Repurchase Program") granting the Company authority to repurchase, on a discretionary basis, up to $500 million of the outstanding shares of the Company’s common stock. As of December 31, 2023, $278.7 million remained available under the 2023 Share Repurchase Program.
The following table contains information on the shares of our common stock that we purchased or otherwise acquired during the three months ended December 31, 2023.
| Period | Total Number of Shares Purchased | Average Price Paid per Share | Total Number of Shares Purchased as Part of Publicly Announced Plans or Programs | Maximum Number (or Approximate Dollar Value) of Shares that May yet be Purchased Under the Plans or Programs (in millions) | ||||||||||||||||
| October 1 to October 31, 2023 | — | — | — | $ | 487.7 | |||||||||||||||
| November 1 to November 30, 2023 | 659,416 | $ | 303.30 | — | $ | 278.7 | ||||||||||||||
| December 1 to December 31, 2023 | — | — | — | $ | 278.7 | |||||||||||||||
See Item 12 of Part III of this report for the security ownership of certain beneficial owners and management and for securities authorized for issuance under equity compensation plans.
Stock Performance Graph
The following graph compares the cumulative stockholder returns over the past five years for our Class A Common Stock, the S&P 500 Index and S&P 500 Life Sciences Tools & Services Index, assuming $100 invested on December 31, 2018, and reinvestment of dividends if paid:
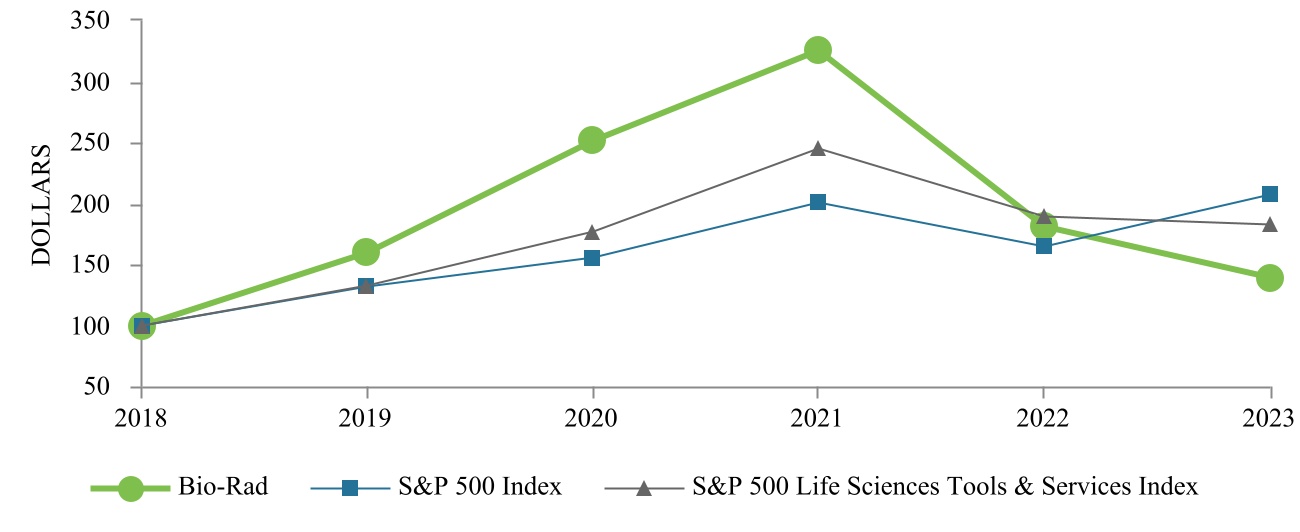
25
This stock performance graph shall not be deemed incorporated by reference by any general statement incorporating by reference into any filing under the Securities Act or the Exchange Act, and shall not otherwise be deemed filed under these Acts.
ITEM 6. RESERVED
ITEM 7. MANAGEMENT’S DISCUSSION AND ANALYSIS OF FINANCIAL CONDITION AND RESULTS OF OPERATIONS
This discussion should be read in conjunction with the information contained in our consolidated financial statements and the accompanying notes which are an integral part of the statements. Refer to Item 7, Management’s Discussion and Analysis of Financial Condition and Results of Operations located in our Annual Report on Form 10-K for the fiscal year ended December 31, 2022, filed on February 17, 2023, for the discussion of the comparison of the fiscal year ended December 31, 2022 to the fiscal year ended December 31, 2021.
Overview. We are a multinational manufacturer and worldwide distributor of our own life science research and clinical diagnostics products. Our business is organized into two reportable segments, Life Science and Clinical Diagnostics, with the mission to provide scientists with specialized tools needed for biological research and health care specialists with products needed for clinical diagnostics.
We sell more than 12,000 products and services to a diverse client base comprised of scientific research, healthcare, education and government customers worldwide. We do not disclose quantitative information about our different products and services as it is impractical to do so based primarily on the numerous products and services that we sell and the global markets that we serve.
We manufacture and supply our customers with a range of reagents, apparatus and equipment to separate complex chemical and biological materials and to identify, analyze and purify components. As our customers require standardization for their experiments and test results, much of our revenues are recurring in nature.
We rely on the support of many governments for both research and healthcare. The current global economic outlook is still uncertain as the need to control government social spending by many governments limits opportunities for growth. Approximately 42% of our 2023 consolidated net sales are derived from the United States and approximately 58% are derived from international locations, with Europe being our largest international region. The international sales are largely denominated in local currencies such as the Euro, Swiss Franc, Japanese Yen, Chinese Yuan and British Sterling. As a result, our consolidated net sales expressed in dollars benefit when the U.S. dollar weakens and suffer when the dollar strengthens. When the dollar strengthens, we benefit from lower cost of sales from our own international manufacturing sites, and from lower international operating expenses. We regularly discuss our changes in revenue and expense categories in terms of both changing foreign exchange rates and in terms of a currency neutral basis, if notable, to explain the impact currency has on our results.
We are impacted by global economic conditions and our business was negatively impacted by the recent economic constraints in China and the ongoing challenges impacting the biopharma market and small biotech companies. We expect that these conditions will continue to negatively impact our business in 2024.
Critical Accounting Policies and Estimates
The accompanying discussion and analysis of our financial condition and results of operations are based upon our consolidated financial statements, which have been prepared in accordance with U.S. generally accepted accounting principles (GAAP). The preparation of financial statements in conformity with GAAP requires management to make estimates and assumptions that affect the reported amounts of assets, liabilities and contingencies as of the date of the financial statements and reported amounts of revenues and expenses during the reporting periods. We evaluate our estimates on an on-going basis. We base our estimates on historical experience and on other assumptions that are believed to be reasonable under the circumstances, the results of which form the basis for making judgments about the carrying values of assets and liabilities that are not readily apparent from other sources.
26
However, future events may cause us to change our assumptions and estimates, which may require adjustment. Actual results could differ from these estimates. We have determined that for the periods reported in this Annual Report on Form 10-K the following accounting policies and estimates are critical in understanding our financial condition and results of operations.
Accounting for Income Taxes
We operate in multiple jurisdictions and our profits are taxed pursuant to the tax laws of these jurisdictions. Our effective income tax rate may be affected by the changes in or interpretations of tax laws and tax agreements in any given jurisdiction, utilization of net operating loss and tax credit carryforwards, changes in geographical mix of income and expense, and changes in our assessment of matters such as the ability to realize deferred tax assets. As a result of these considerations, we must estimate income taxes in each of the jurisdictions in which we operate. This process involves estimating current tax exposure together with assessing temporary differences resulting from the different treatment of items for tax and accounting purposes. These differences result in deferred tax assets and liabilities, which are included in the consolidated balance sheet.
We assess the likelihood that our deferred tax assets will be recovered from future taxable income, considering all available evidence such as historical levels of income, expectations and risks associated with estimates of future taxable income and ongoing prudent and feasible tax strategies. When we determine that it is not more likely than not that we will realize all or part of our deferred tax assets, an adjustment is charged to earnings in the period when such determination is made. Likewise, if we later determine that it is more likely than not that all or a part of our deferred tax assets would be realized, the previously provided valuation allowance would be reversed.
We make certain estimates and judgments about the application of tax laws, the expected resolution of uncertain tax positions and other matters surrounding the recognition and measurement of uncertain tax benefits. In the event that uncertain tax positions are resolved for amounts different than our estimates, or the related statutes of limitations expire without the assessment of additional income taxes, we will be required to adjust the amounts of the related assets and liabilities in the period in which such events occur. Such adjustments may have a material impact on our income tax provision and our results of operations.
Impairment of Goodwill
We conduct a goodwill impairment analysis annually in the fourth quarter or more frequently if indicators of impairment exist or if a decision is made to sell or exit a business. We test goodwill at the reporting unit level. Significant judgments are involved in determining if an indicator of impairment has occurred.
We first may assess qualitative factors to determine if it is more likely than not that the fair value of a reporting unit is less than its carrying amount as a basis for determining whether it is necessary to perform the quantitative goodwill impairment test included in U.S. GAAP. To the extent our assessment identifies adverse conditions, or if we elect to bypass the qualitative assessment, goodwill is tested at the reporting unit level using a quantitative impairment test. We generally estimate the fair value of the reporting units in goodwill impairment assessments using an income approach, which includes an analysis of the future cash flows expected to be generated and the risk associated with achieving such cash flows. This approach requires significant management judgment including the discount rate that is applied to the discretely forecasted future cash flows to calculate the present value of those cash flows and the estimate of future cash flows attributable to the reporting unit. Actual results may differ from management’s estimates. There were no impairments for the years ended December 31, 2023, 2022 and 2021.
Revenue Recognition
We recognize revenue from operations through the sale of products, services, license of intellectual property and rental of instruments.
27
We enter into contracts that can include various combinations of products and services, which are generally accounted for as distinct performance obligations. The transaction consideration is allocated between separate performance obligations of an arrangement based on the stand-alone selling price (“SSP”) for each distinct product or service.
We recognize revenue from product sales at the point in time when we have satisfied our performance obligation by transferring control of the product to the customer. We use judgment to evaluate whether and when control has transferred and consider the right to payment, legal title, physical possession, risks and rewards of ownership, and customer acceptance if it is not a formality, as indicators to determine the transfer of control to the customer.
Fair Value Measurements
We elected the fair value option under ASC 825, Financial Instruments for accounting of the Loan to Sartorius-Herbst Beteiligungen II GmbH to simplify the accounting. The Loan includes certain value appreciation rights that are due upon repayment of the Loan. The fair value of the Loan and value appreciation right is estimated under the income approach using a discounted cash flow, and option pricing model, respectively. The significant assumptions used to estimate fair value of the Loan include an estimate of the discount rate and cash flows of the Loan and the significant assumptions used to estimate the fair value of the value appreciation right include volatility, the risk-free interest rate, expected life (in years) and expected dividend. The inputs are subject to estimation uncertainty and actual amounts realized may materially differ. An increase in the expected volatility may result in a significantly higher fair value, whereas a decrease in expected life may result in a significantly lower fair value. All subsequent changes in fair value of the Loan and value appreciation right, including accrued interest are recognized in (Gains) losses from change in fair market value of equity securities and loan receivable in our consolidated statements of income (loss).
Results of Operations - Sales, Gross Margins and Expenses
Comparison of the Year Ended December 31, 2023 to the Year Ended December 31, 2022
The following shows cost of goods sold, gross profit, expense items and net income as a percentage of net sales:
| 2023 | 2022 | ||||||||||
| Net sales | 100.0 | % | 100.0 | % | |||||||
| Cost of goods sold | 46.6 | 44.1 | |||||||||
| Gross profit | 53.4 | 55.9 | |||||||||
| Selling, general and administrative expense | 31.5 | 29.5 | |||||||||
| Research and development expense | 9.3 | 9.2 | |||||||||
Net loss | (23.9) | (129.5) | |||||||||
Net sales
Percentage sales growth in currency neutral amounts are calculated by translating prior period sales in each local currency using the current period monthly average foreign exchange rates for that currency and comparing that to current period sales.
Net sales (sales) for the year ended December 31, 2023 were $2.67 billion, compared to $2.80 billion for the year ended December 31, 2022, a decrease of 4.7%. COVID-related sales were approximately $3.6 million for the year ended December 31, 2023 compared to approximately $109.2 million for the year ended December 31, 2022. On a currency neutral basis, for the year ended December 31, 2023 sales decreased by approximately 4.1% compared to
28
the same period in 2022. Currency neutral sales decreased mainly in APAC and EMEA. Excluding COVID-related sales, sales decreased 0.4% on a currency neutral basis from the year ended December 31, 2022. Sales of our Life Sciences segment in 2023 were negatively impacted by demand constraints from biopharma and small biotech customers in the biopharma market and the economic environment in China. In addition, the Russia sanctions impacted both our Life Science and Clinical Diagnostics segments.
The Life Science segment sales for the year ended December 31, 2023 were $1.18 billion, a decrease of 12.5% compared to the year ended December 31, 2022. On a currency neutral basis, sales decreased 12.0% compared to the year ended December 31, 2022. The currency neutral sales decrease was mainly in Asia Pacific and EMEA. COVID-related sales were $2.9 million in the year ended December 31, 2023 compared to approximately $105.2 million in the year ended December 31, 2022. Excluding COVID-related sales, sales decreased 4.9% on a currency neutral basis driven primarily by lower process chromatography, qPCR and Western blotting products, as a result of demand constraints from biopharma and small biotech customers, the economic environment in China, and Russia sanctions.
The Clinical Diagnostics segment sales for the year ended December 31, 2023 were $1.49 billion, an increase of 2.6% compared to the year ended December 31, 2022. On a currency neutral basis, sales increased 3.2% compared to the year ended December 31, 2022. COVID-related sales were $0.7 million in the year ended December 31, 2023 compared to approximately $4.0 million in the year ended December 31, 2022. Excluding COVID-related sales, sales increased 3.4% on a currency neutral basis. The currency neutral sales increase was primarily driven by an increased demand for our diagnostic testing systems, primarily diabetes, blood typing, and quality control products, especially in Asia Pacific and EMEA, partially offset by a decline in our infectious disease products and lower sales due to Russia sanctions.
Gross margin
Consolidated gross margin was 53.4% for the year ended December 31, 2023 compared to 55.9% for the year ended December 31, 2022. Gross margin for the Life Science segment and Clinical Diagnostics segment for the year ended December 31, 2023 decreased by approximately 4.1 percentage points and 0.7 percentage points, respectively, from the year ended December 31, 2022. The decrease in gross margin was primarily driven by product mix, increased material costs and inventory reserves.
Selling, general and administrative expense
Consolidated selling, general and administrative expense (SG&A) increased to $841.7 million or 31.5% of sales for the year ended December 31, 2023 compared to $827.8 million or 29.5% of sales for the year ended December 31, 2022. The increase to SG&A expense was primarily driven by restructuring costs as well as higher facility-related expenses, partially offset by lower employee-related expenses.
Research and development expense
Consolidated research and development (R&D) expense decreased to $247.4 million or 9.3% of sales for the year ended December 31, 2023 compared to $256.9 million or 9.2% of sales for the year ended December 31, 2022. The decrease in R&D expense in the year ended December 31, 2023 compared to the year ended December 31, 2022 was primarily due to a change in the fair value of contingent consideration, partially offset by higher restructuring costs and continued investment in research and development.
Results of Operations – Non-operating
Interest expense
Interest expense for the years ended December 31, 2023 and 2022 was $49.4 million and $38.1 million, respectively, an increase of $11.3 million compared to the prior year period. The increase was primarily due to the sale in March 2022 of the $1.2 billion Senior Notes.
Foreign currency exchange gains and losses
29
Foreign currency exchange (gains) and losses consist primarily of foreign currency transaction gains and losses on intercompany net receivables and payables and the change in fair value of our forward foreign exchange contracts used to manage our foreign currency exchange risk. Foreign currency exchange net gains were $7.3 million and $0.2 million for the years ended December 31, 2023 and December 31, 2022, respectively. Gains and losses are primarily due to the estimating process inherent in the timing of product shipments and intercompany debt payments, market volatility, and the change in the fair value of our foreign exchange contracts.
Change in fair market value of equity securities and loan receivable
(Gains) losses from change in fair market value of equity securities and loan receivable was a loss of $1.25 billion and $5.19 billion for the years ended December 31, 2023 and 2022, respectively. The change in the fair market value primarily resulted from the recognition of lower holding losses of $1.26 billion compared to holding losses of $5.07 billion in the year ended December 31, 2022 on our position in Sartorius AG. In addition, lower losses from the change in fair market value of our loan receivable of $6.8 million in the year ended December 31, 2023, compared to holding losses of $100.6 million in the year ended December 31, 2022 contributed to the change.
Other income, net
Other income, net includes investment and dividend income, interest income on our cash and cash equivalents, short-term investments and long-term marketable securities. Other income, net for the year ended December 31, 2023 increased to $106.4 million compared to $44.6 million for the year ended December 31, 2022. The increase was primarily due to higher interest rates favorably impacting our investments resulting from cash invested from the $1.2 billion Senior Notes issued in March 2022. The increase to Other income, net also resulted from a $3 million higher dividend from Sartorius AG in 2023 compared to 2022, and from no credit loss or other than temporary impairment in 2023 compared to a credit loss of $8 million and other than temporary impairment losses of $12 million in 2022.
Effective tax rate
Our effective tax rates were 25.0% and 22.9% for the years ended December 31, 2023 and 2022, respectively. The effective tax rates for the years ended December 31, 2023 and 2022 were primarily driven by the unrealized gain/loss in equity securities that was taxed at 22.3% and 22.5%, respectively, as well as the geographical mix of earnings.
Our income tax returns are routinely audited by U.S. federal, state and foreign tax authorities. We are currently under examination by many of these tax authorities. There are differing interpretations of tax laws and regulations, and as a result, significant disputes may arise with these tax authorities involving issues of the timing and amount of deductions and allocations of income among various tax jurisdictions.
We record liabilities for unrecognized tax benefits related to uncertain tax positions. We do not believe the
resolution of our uncertain tax positions will have a material adverse effect on our consolidated financial statements, although an adverse resolution of one or more of these uncertain tax positions in any period may have a material impact on the results of operations for that period.
As of December 31, 2023, based on the expected outcome of certain examinations or as a result of the expiration of
statutes of limitation for certain jurisdictions, we believe that within the next twelve months it is reasonably possible
that our previously unrecognized tax benefits could decrease by approximately $17.2 million.
On August 16, 2022, President Biden signed into law the Inflation Reduction Act of 2022, which includes an Alternative Minimum Tax based on the Adjusted Financial Statement Income of Applicable Corporations. Based on our initial evaluation, we do not believe the Inflation Reduction Act will have a material impact on our income tax provision and cash taxes. We continue to monitor the changes in tax laws and regulations to evaluate their potential impact on our business.
30
Liquidity and Capital Resources
Bio-Rad operates and conducts business globally, primarily through subsidiary companies established in the markets in which we trade. Goods are manufactured in a small number of locations, and are then shipped to local distribution facilities around the world. Our product mix is diversified, and certain products compete largely on product efficacy, while others compete on price. Gross margins are generally sufficient to exceed normal operating costs, and funding for research and development of new products, as well as routine outflows for capital expenditures, interest and taxes. In addition to the annual positive cash flow from operating activities, additional liquidity is readily available via the sale of short-term investments and access to our $200.0 million unsecured revolving credit facility (Credit Agreement, as amended) that we entered into in April 2019, and to a lesser extent international lines of credit. Borrowings under the Credit Agreement, as amended, are available on a revolving basis and can be used to make permitted acquisitions, for working capital and for other general corporate purposes. We had no outstanding borrowings under the 2019 Credit Agreement, as amended, as of December 31, 2023, however, $0.2 million was utilized for domestic standby letters of credit that reduced our borrowing availability. In March 2022, we issued $400 million aggregate principal amount of 3.3% Senior Notes due 2027, and $800 million aggregate principal amount of 3.7% Senior Notes due 2032. Net cash proceeds from the bond issuance after deducting the underwriting discount and estimated offering expenses was $1.186 billion. Interest on the Notes is payable semiannually in arrears on March 15 and September 15 of each year until the principal is paid or made available for payment. Management believes that this availability, together with cash flow from operations, will be adequate to meet our current objectives for operations, research and development, capital additions for manufacturing and distribution, plant and equipment, information technology systems and acquisitions of reasonable proportion to our existing total available capital.
At December 31, 2023, we had available $1.6 billion in cash, cash equivalents and short-term investments, of which approximately 16% was held in our foreign subsidiaries. The amount of funds held in the United States can fluctuate due to the timing of receipts and payments in the ordinary course of business and due to other reasons, such as acquisitions and borrowings. As part of our ongoing liquidity assessments, we regularly monitor the mix of domestic and foreign cash flows (both inflows and outflows).
It is generally our intention to repatriate certain foreign earnings to the extent that such repatriations are not restricted by local laws or accounting rules, and there are no substantial incremental costs.
On February 13, 2024, we entered into a new $200.0 million unsecured revolving credit facility with a group of financial institutions. Borrowings under the credit agreement are on a revolving basis and can be used to make acquisitions, for working capital and for other general corporate purposes. The credit agreement requires Bio-Rad to comply with certain financial ratios and covenants, among other things. The new credit facility replaces the credit facility which expires April 2024.
Cash Flows from Operations
Net cash provided by operations was $374.9 million and $194.4 million for the years ended December 31, 2023 and 2022, respectively. The increase in operating cash flows was primarily due to lower cash paid to suppliers and employees, higher dividend proceeds, and lower income tax paid, partially offset by higher interest paid, lower cash received from customers, and lower proceeds from foreign exchange contracts.
Cash Flows from Investing Activities
Our investing activities have consisted primarily of cash used for purchases of marketable securities and investments, and acquisitions.
Net cash provided by investing activities was $20.2 million compared to net cash used for investing activities of $1,207.6 million for the years ended December 31, 2023 and 2022, respectively, primarily due to the timing of our purchases, maturities and sales of marketable securities and investments as a result of the cash proceeds from the sale of Senior Notes issued in March 2022.
31
Cash Flows from Financing Activities
Our financing activities have consisted primarily of cash from the issuance of senior notes.
Net cash used in financing activities was $425.6 million compared to net cash provided by financing activities of $973.6 million for the years ended December 31, 2023 and 2022, respectively, primarily attributable to the sale in March 2022 of the Senior Notes which yielded net cash proceeds of $1,186.2 million. The change also resulted from higher payments for share repurchases in 2023.
Treasury Shares
During the year ended December 31, 2023, 160,811 shares of Class A treasury stock with an aggregate total cost of $64.1 million were reissued to fulfill grants to employees under our restricted stock program and our Employee Stock Purchase Program. Upon reissuing the Class A treasury stock, Additional paid-in capital was reduced by $49.7 million from share reissuance activity during the year.
During the year ended December 31, 2022, 135,744 shares of Class A treasury stock with an aggregate total cost of $58.4 million were reissued to fulfill grants to employees under our restricted stock program and our Employee Stock Purchase Program. Upon reissuing the Class A treasury stock, Additional paid-in capital was reduced by $51.8 million from share reissuance activity during the year.
The re-issuance of the treasury stock for the years ended December 31, 2023 and 2022 did not require cash payments or receipts and therefore did not affect liquidity.
During the year ended December 31, 2023, we repurchased 1,267,757 shares of Class A common stock for $428.7 million under our share repurchase programs, compared to the repurchase of 496,692 shares of our common stock for $215.7 million during the year ended December 31, 2022. As of December 31, 2023, $278.7 million of stock remained available for repurchases under the Company's 2023 Share Repurchase Program. We designated these repurchased shares as treasury stock.
Contractual Obligations
The following summarizes certain of our contractual obligations as of December 31, 2023 and the effect such obligations are expected to have on our cash flows in future periods (in millions):
32
| Payments Due by Period | ||||||||||||||||||||||||||||||||
| Less Than | 1-3 | 3-5 | More than | |||||||||||||||||||||||||||||
| Contractual Obligations | Total | One Year | Years | Years | 5 Years | |||||||||||||||||||||||||||
Long-term debt, including current portion (1) | $ | 1,210.1 | $ | 0.5 | $ | 1.0 | $ | 401.0 | $ | 807.6 | ||||||||||||||||||||||
Interest payments (1) | $ | 301.7 | $ | 44.0 | $ | 87.9 | $ | 64.1 | $ | 105.7 | ||||||||||||||||||||||
Operating lease obligations (2) | $ | 236.3 | $ | 46.6 | $ | 78.4 | $ | 45.8 | $ | 65.5 | ||||||||||||||||||||||
Purchase obligations (3) | $ | 122.6 | $ | 96.4 | $ | 26.1 | $ | 0.1 | $ | — | ||||||||||||||||||||||
Long-term liabilities (4) | $ | 121.7 | $ | 4.3 | $ | 36.5 | $ | 10.5 | $ | 70.4 | ||||||||||||||||||||||
(1) These amounts represent expected cash payments, primarily from Senior Notes, which are included in our December 31, 2023 consolidated balance sheet. See Note 6 of the consolidated financial statements for additional information about our debt. | ||||||||||||||||||||||||||||||||
(2) Operating lease obligations are described in Note 17 of the consolidated financial statements. | ||||||||||||||||||||||||||||||||
(3) Purchase obligations include agreements to purchase goods or services that are enforceable and legally binding to Bio-Rad and that specify all significant terms. Purchase obligations exclude agreements that are cancelable without penalty. Recognition of purchase obligations occurs when products or services are delivered to Bio-Rad generally within Accounts payable or Other current liabilities. | ||||||||||||||||||||||||||||||||
(4) These amounts primarily represent recognized long-term obligations for other post-employment benefits and long-term deferred revenue. Excluded from this table are tax liabilities for uncertain tax positions and contingencies in the amount of $76.5 million. We are not able to reasonably estimate the timing of future cash flows of these tax liabilities, therefore, our income tax obligations are excluded from the table above. See Note 7 of the consolidated financial statements for additional information about our income taxes. | ||||||||||||||||||||||||||||||||
Recent Accounting Pronouncements Adopted
See Note 1 to the consolidated financial statements for recent accounting pronouncements adopted and to be adopted.
ITEM 7A. QUANTITATIVE AND QUALITATIVE DISCLOSURES ABOUT MARKET RISK
Financial Risk Management
The main goal of Bio-Rad’s financial risk management program is to reduce the variance in expected cash flows arising from unexpected foreign exchange rate and interest rate changes. Financial exposures are managed through operational means and by using various financial instruments, including cash and investments, borrowings, and forward and spot foreign exchange contracts. No derivative financial instruments are entered into for the purpose of trading or speculation. Company policy requires that all derivative positions are undertaken to manage the risks arising from underlying business activities. We do not have derivative contracts that are designated for hedge accounting treatment. As a result, all derivative instruments are carried at fair value on the balance sheet and changes in fair value are included in reported earnings.
Foreign Exchange Risk. We operate and conduct business in many countries and are exposed to movements in foreign currency exchange rates. We face transactional currency exposures that arise when we enter into transactions denominated in currencies other than U.S. dollars. Additionally, our consolidated net equity is impacted by the conversion of the net assets of our international subsidiaries for which the functional currency is not the U.S. dollar.
Foreign currency exposures are managed and hedged on a centralized basis. This allows for natural offsets and netting of foreign exchange exposures across entities. Where possible, we seek to manage our foreign exchange risk in part through operational means, including matching same-currency revenues to same-currency costs, and same-currency assets to same-currency liabilities. We enter into foreign currency forward contracts to hedge the gains and losses arising from remeasurement of non-US dollar denominated monetary assets and liabilities, primarily cash,
33
accounts receivables and accounts payables. The majority of forward contracts expire within 90 days or less. We record the change in value of our foreign currency denominated cash, receivables and payables as a Foreign exchange (gain) loss on our consolidated statements of income (loss) along with the change in fair market value of the forward exchange contract used as an economic hedge of those assets or liabilities.
Our forward contract holdings at year-end were analyzed to determine their sensitivity to fluctuations in foreign currency exchange rates. All other variables were held constant. Market risk associated with derivative holdings is the potential change in fair value of derivative positions arising from an adverse movement in foreign exchange rates. A hypothetical 10% depreciation / appreciation of foreign currencies relative to the U.S. dollar would result in an unrealized gain / loss of $41.4 million on our derivative position as of December 31, 2023. The gains or losses on foreign currency forward contracts resulting from changes in currency exchange rates are expected to approximately offset remeasurement losses or gains on the exposures being hedged.
Interest Rate Risk. Bio-Rad centrally manages the short-term cash surpluses and maintains a diversified portfolio of high-quality fixed income securities, such as U.S. Treasury, U.S. government agency securities, corporate notes and bonds, and asset backed securities. A sharp rise in interest rates could have a material adverse impact on the fair value of our fixed-income investment portfolio. Conversely, declines in interest rates could have a material adverse impact on interest income for our investment portfolio. A hypothetical increase or decrease in interest rates by 50 and 100 basis points would have resulted in a decrease or increase in the fair value of our net investment position of approximately $4.5 million and $8.9 million, respectively, as of December 31, 2023.
As of December 31, 2023, we had $1.20 billion in principal amount of fixed-rate long-term debt outstanding. Interest rate changes affect the fair value of our notes but do not impact our financial position, cash flows or results of operations due to the fixed nature of the debt obligations.
Share price movement risk associated with our investment in Sartorius. We face financial statement exposure resulting from changes in the market value of our position in Sartorius. A 10% depreciation / appreciation on the quoted stock prices for ordinary and preference shares of Sartorius at December 31, 2023, would result in an approximate loss / gain of $0.73 billion reported in the financial statement line (Gains) losses from change in fair market value of equity securities and loan receivable in our consolidated statements of income (loss) for the year ended December 31, 2023.
34
ITEM 8. FINANCIAL STATEMENTS AND SUPPLEMENTARY DATA
| Index to Consolidated Financial Statements | ||||||||
| Page | ||||||||
Consolidated Balance Sheets at December 31, 2023 and 2022 | ||||||||
December 31, 2023 | ||||||||
period ended December 31, 2023 | ||||||||
December 31, 2023 | ||||||||
in the period ended December 31, 2023 | ||||||||
35
Report of Independent Registered Public Accounting Firm
To the Stockholders and Board of Directors
Bio-Rad Laboratories, Inc.:
Opinion on the Consolidated Financial Statements
We have audited the accompanying consolidated balance sheets of Bio-Rad Laboratories, Inc. and subsidiaries (the Company) as of December 31, 2023 and 2022, the related consolidated statements of income (loss), comprehensive income (loss), changes in stockholders’ equity, and cash flows for each of the years in the three‑year period ended December 31, 2023, and the related notes (collectively, the consolidated financial statements). In our opinion, the consolidated financial statements present fairly, in all material respects, the financial position of the Company as of December 31, 2023 and 2022, and the results of its operations and its cash flows for each of the years in the three-year period ended December 31, 2023, in conformity with U.S. generally accepted accounting principles.
We also have audited, in accordance with the standards of the Public Company Accounting Oversight Board (United States) (PCAOB), the Company's internal control over financial reporting as of December 31, 2023, based on criteria established in Internal Control - Integrated Framework (2013) issued by the Committee of Sponsoring Organizations of the Treadway Commission, and our report dated February 16, 2024 expressed an unqualified opinion on the effectiveness of the Company's internal control over financial reporting.
Basis for Opinion
These consolidated financial statements are the responsibility of the Company’s management. Our responsibility is to express an opinion on these consolidated financial statements based on our audits. We are a public accounting firm registered with the PCAOB and are required to be independent with respect to the Company in accordance with the U.S. federal securities laws and the applicable rules and regulations of the Securities and Exchange Commission and the PCAOB.
We conducted our audits in accordance with the standards of the PCAOB. Those standards require that we plan and perform the audit to obtain reasonable assurance about whether the consolidated financial statements are free of material misstatement, whether due to error or fraud. Our audits included performing procedures to assess the risks of material misstatement of the consolidated financial statements, whether due to error or fraud, and performing procedures that respond to those risks. Such procedures included examining, on a test basis, evidence regarding the amounts and disclosures in the consolidated financial statements. Our audits also included evaluating the accounting principles used and significant estimates made by management, as well as evaluating the overall presentation of the consolidated financial statements. We believe that our audits provide a reasonable basis for our opinion.
Critical Audit Matter
The critical audit matter communicated below is a matter arising from the current period audit of the consolidated financial statements that was communicated or required to be communicated to the audit committee and that: (1) relates to accounts or disclosures that are material to the consolidated financial statements and (2) involved our especially challenging, subjective, or complex judgments. The communication of a critical audit matter does not alter in any way our opinion on the consolidated financial statements, taken as a whole, and we are not, by communicating the critical audit matter below, providing a separate opinion on the critical audit matter or on the accounts or disclosures to which it relates.
Evaluation of the sufficiency of audit evidence over net sales
As discussed in Notes 1 and 15 to the consolidated financial statements, the Company recorded $2.7 billion of net sales for the year ended December 31, 2023. The Company is a multinational manufacturer and worldwide distributor of its own life science research products and clinical diagnostics products. The Company recognizes revenue through the sale of products, services, license of intellectual property and rental of instruments.
36
We identified the evaluation of the sufficiency of audit evidence over net sales as a critical audit matter. Evaluating the sufficiency of audit evidence obtained required subjective auditor judgment because of the Company’s global geographical dispersion and multiple revenue streams. This included determining the Company locations and revenue streams for which procedures were performed as well as the level of supervision and review to perform over the selected locations.
The following are the primary procedures we performed to address this critical audit matter. We applied auditor judgment to determine the nature and extent of procedures to be performed over net sales. For each location for which procedures were performed, we evaluated the design and tested the operating effectiveness of certain internal controls related to the Company’s net sales processes for the selected revenue streams. We assessed the recorded net sales by selecting a sample of revenue transactions during the year and comparing the amounts recognized by the Company to relevant underlying documentation such as contracts and shipping documents or other third-party evidence. We evaluated the sufficiency of the audit evidence obtained by assessing the results of procedures performed, including the appropriateness of the nature and extent of such evidence over net sales.
| /s/ KPMG LLP | ||
| We have served as the Company's auditor since 2013. | ||
| Santa Clara, California | ||
| February 16, 2024 | ||
37
Report of Independent Registered Public Accounting Firm
To the Stockholders and Board of Directors
Bio‑Rad Laboratories, Inc.:
Opinion on Internal Control Over Financial Reporting
We have audited Bio-Rad Laboratories, Inc. and subsidiaries' (the Company) internal control over financial reporting as of December 31, 2023, based on criteria established in Internal Control – Integrated Framework (2013) issued by the Committee of Sponsoring Organizations of the Treadway Commission. In our opinion, the Company maintained, in all material respects, effective internal control over financial reporting as of December 31, 2023, based on criteria established in Internal Control – Integrated Framework (2013) issued by the Committee of Sponsoring Organizations of the Treadway Commission.
We also have audited, in accordance with the standards of the Public Company Accounting Oversight Board (United States) (PCAOB), the consolidated balance sheets of the Company as of December 31, 2023 and 2022, the related consolidated statements of income (loss), comprehensive income (loss), changes in stockholders' equity, and cash flows for each of the years in the three-year period ended December 31, 2023, and the related notes (collectively, the consolidated financial statements), and our report dated February 16, 2024 expressed an unqualified opinion on those consolidated financial statements.
Basis for Opinion
The Company’s management is responsible for maintaining effective internal control over financial reporting and for its assessment of the effectiveness of internal control over financial reporting, included in the accompanying Management's Report on Internal Control Over Financial Reporting. Our responsibility is to express an opinion on the Company’s internal control over financial reporting based on our audit. We are a public accounting firm registered with the PCAOB and are required to be independent with respect to the Company in accordance with the U.S. federal securities laws and the applicable rules and regulations of the Securities and Exchange Commission and the PCAOB.
We conducted our audit in accordance with the standards of the PCAOB. Those standards require that we plan and perform the audit to obtain reasonable assurance about whether effective internal control over financial reporting was maintained in all material respects. Our audit of internal control over financial reporting included obtaining an understanding of internal control over financial reporting, assessing the risk that a material weakness exists, and testing and evaluating the design and operating effectiveness of internal control based on the assessed risk. Our audit also included performing such other procedures as we considered necessary in the circumstances. We believe that our audit provides a reasonable basis for our opinion.
Definition and Limitations of Internal Control Over Financial Reporting
A company’s internal control over financial reporting is a process designed to provide reasonable assurance regarding the reliability of financial reporting and the preparation of financial statements for external purposes in accordance with generally accepted accounting principles. A company’s internal control over financial reporting includes those policies and procedures that (1) pertain to the maintenance of records that, in reasonable detail, accurately and fairly reflect the transactions and dispositions of the assets of the company; (2) provide reasonable assurance that transactions are recorded as necessary to permit preparation of financial statements in accordance with generally accepted accounting principles, and that receipts and expenditures of the company are being made only in accordance with authorizations of management and directors of the company; and (3) provide reasonable assurance regarding prevention or timely detection of unauthorized acquisition, use, or disposition of the company’s assets that could have a material effect on the financial statements.
Because of its inherent limitations, internal control over financial reporting may not prevent or detect misstatements. Also, projections of any evaluation of effectiveness to future periods are subject to the risk that controls may become inadequate because of changes in conditions, or that the degree of compliance with the policies or procedures may deteriorate.
| /s/ KPMG LLP | ||
| Santa Clara, California | ||
| February 16, 2024 | ||
38
BIO-RAD LABORATORIES, INC.
Consolidated Balance Sheets
(In thousands, except share data)
| December 31, | |||||||||||
| 2023 | 2022 | ||||||||||
| ASSETS | |||||||||||
| Current assets: | |||||||||||
| Cash and cash equivalents | $ | $ | |||||||||
| Short-term investments | |||||||||||
Restricted investments | |||||||||||
Accounts receivable, less allowance for credit losses of $ | |||||||||||
| Inventory | |||||||||||
| Prepaid expenses | |||||||||||
| Other current assets | |||||||||||
| Total current assets | |||||||||||
| Property, plant and equipment, net | |||||||||||
| Operating lease right-of-use assets | |||||||||||
| Goodwill, net | |||||||||||
| Purchased intangibles, net | |||||||||||
| Other investments | |||||||||||
| Other assets | |||||||||||
| Total assets | $ | $ | |||||||||
The accompanying notes are an integral part of these consolidated financial statements.
39
BIO-RAD LABORATORIES, INC.
Consolidated Balance Sheets
(continued)
(In thousands, except share data)
| December 31, | |||||||||||
| 2023 | 2022 | ||||||||||
| LIABILITIES AND STOCKHOLDERS’ EQUITY | |||||||||||
| Current liabilities: | |||||||||||
| Accounts payable | $ | $ | |||||||||
| Accrued payroll and employee benefits | |||||||||||
Current maturities of long-term debt and notes payable | |||||||||||
| Income and other taxes payable | |||||||||||
| Current operating lease liabilities | |||||||||||
| Other current liabilities | |||||||||||
| Total current liabilities | |||||||||||
| Long-term debt, net of current maturities | |||||||||||
| Deferred income taxes | |||||||||||
| Operating lease liabilities | |||||||||||
| Other long-term liabilities | |||||||||||
| Total liabilities | |||||||||||
| Commitments and contingent liabilities | |||||||||||
| Stockholders’ equity: | |||||||||||
Class A common stock, $ | |||||||||||
Class B common stock, $ | |||||||||||
| Additional paid-in capital | |||||||||||
Class A treasury stock at cost, | ( | ( | |||||||||
| Retained earnings | |||||||||||
Accumulated other comprehensive loss | ( | ( | |||||||||
| Total stockholders’ equity | |||||||||||
| Total liabilities and stockholders’ equity | $ | $ | |||||||||
The accompanying notes are an integral part of these consolidated financial statements.
40
BIO-RAD LABORATORIES, INC.
Consolidated Statements of Income (Loss)
(In thousands, except per share data)
| Year Ended December 31, | ||||||||||||||||||||
| 2023 | 2022 | 2021 | ||||||||||||||||||
| Net sales | $ | $ | $ | |||||||||||||||||
| Cost of goods sold | ||||||||||||||||||||
| Gross profit | ||||||||||||||||||||
| Selling, general and administrative expense | ||||||||||||||||||||
| Research and development expense | ||||||||||||||||||||
| Income from operations | ||||||||||||||||||||
| Interest expense | ||||||||||||||||||||
| Foreign currency exchange (gains) losses, net | ( | ( | ||||||||||||||||||
| (Gains) losses from change in fair market value of equity securities and loan receivable | ( | |||||||||||||||||||
| Other income, net | ( | ( | ( | |||||||||||||||||
| Net income (loss) before income taxes | ( | ( | ||||||||||||||||||
| Benefit from (Provision for) income taxes | ( | |||||||||||||||||||
| Net income (loss) | $ | ( | $ | ( | $ | |||||||||||||||
| Basic earnings (loss) per share: | ||||||||||||||||||||
| Net income (loss) per basic share | $ | ( | $ | ( | $ | |||||||||||||||
| Weighted average common shares - basic | ||||||||||||||||||||
| Diluted earnings (loss) per share: | ||||||||||||||||||||
| Net income (loss) per diluted share | $ | ( | $ | ( | $ | |||||||||||||||
| Weighted average common shares - diluted | ||||||||||||||||||||
The accompanying notes are an integral part of these consolidated financial statements.
41
BIO-RAD LABORATORIES, INC.
Consolidated Statements of Comprehensive Income (Loss)
(In thousands)
| Year Ended December 31, | |||||||||||||||||
| 2023 | 2022 | 2021 | |||||||||||||||
| Net income (loss) | $ | ( | $ | ( | $ | ||||||||||||
| Other comprehensive income (loss), net of tax: | |||||||||||||||||
| Foreign currency translation adjustments | ( | ( | |||||||||||||||
| Foreign other post-employment benefits adjustments | ( | ||||||||||||||||
| Net unrealized holding gains (losses) on available-for-sale (AFS) investments | ( | ( | |||||||||||||||
| Other comprehensive income (loss), net of tax | ( | ( | |||||||||||||||
| Comprehensive income (loss) | $ | ( | $ | ( | $ | ||||||||||||
The accompanying notes are an integral part of these consolidated financial statements.
42
BIO-RAD LABORATORIES, INC.
Consolidated Statements of Cash Flows
(In thousands)
| Year Ended December 31, | |||||||||||||||||
| 2023 | 2022 | 2021 | |||||||||||||||
Cash flows from operating activities: | |||||||||||||||||
| Cash received from customers | $ | $ | $ | ||||||||||||||
| Cash paid to suppliers and employees | ( | ( | ( | ||||||||||||||
| Interest paid, net | ( | ( | ( | ||||||||||||||
| Income tax payments, net | ( | ( | ( | ||||||||||||||
| Dividend proceeds and miscellaneous receipts, net | |||||||||||||||||
| Proceeds from forward foreign exchange contracts, net | |||||||||||||||||
| Net cash provided by operating activities | |||||||||||||||||
| Cash flows from investing activities: | |||||||||||||||||
| Payments for purchases of property, plant and equipment | ( | ( | ( | ||||||||||||||
| Proceeds from dispositions of property, plant and equipment | |||||||||||||||||
| Proceeds from divestiture of a division | |||||||||||||||||
| Payments for acquisitions, net of cash received | ( | ( | |||||||||||||||
Payments for purchases of intangible assets | ( | ||||||||||||||||
| Payments for investment in loan receivable | ( | ||||||||||||||||
| Payments for purchases of marketable securities and investments | ( | ( | ( | ||||||||||||||
| Proceeds from sales of marketable securities and investments | |||||||||||||||||
| Proceeds from maturities of marketable securities and investments | |||||||||||||||||
| Net cash provided by (used in) investing activities | ( | ( | |||||||||||||||
| Cash flows from financing activities: | |||||||||||||||||
| Proceeds from issuance of Notes, net of debt financing costs | |||||||||||||||||
| Payments on long-term borrowings | ( | ( | ( | ||||||||||||||
| Proceeds from issuance of common stock and from reissuance of treasury stock under the employee stock purchase plan and upon exercise of stock options | |||||||||||||||||
| Tax payments from net share settlement | ( | ( | ( | ||||||||||||||
| Payments for purchases of treasury stock | ( | ( | ( | ||||||||||||||
| Payments of contingent consideration | ( | ( | |||||||||||||||
| Net cash (used in) provided by financing activities | ( | ( | |||||||||||||||
| Effect of foreign exchange rate changes on cash | ( | ||||||||||||||||
| Net decrease in cash, cash equivalents and restricted cash | ( | ( | ( | ||||||||||||||
| Cash, cash equivalents and restricted cash at beginning of year | |||||||||||||||||
| Cash, cash equivalents and restricted cash at end of year | $ | $ | $ | ||||||||||||||
The following table provides a reconciliation of cash, cash equivalents and restricted cash reported within the consolidated balance sheets that agrees to the same amounts shown in the consolidated statements of cash flows (in thousands):
| Year Ended December 31, | |||||||||||||||||
| 2023 | 2022 | 2021 | |||||||||||||||
| Cash and cash equivalents | $ | $ | $ | ||||||||||||||
| Restricted cash included in Other current assets | |||||||||||||||||
| Restricted cash included in Other assets | |||||||||||||||||
| Total cash, cash equivalents and restricted cash shown in the consolidated statements of cash flows | $ | $ | $ | ||||||||||||||
These restricted cash items are primarily related to performance guarantees and other restricted deposits.
The accompanying notes are an integral part of these consolidated financial statements.
43
BIO-RAD LABORATORIES, INC.
Consolidated Statements of Changes in Stockholders’ Equity
(In thousands)
| Common Stock | Additional Paid-in Capital | Treasury Stock | Retained Earnings | Accumulated Other Comprehensive Income (Loss) | Total Stockholders' Equity | |||||||||||||||||||||||||||||||||
| Balance at December 31, 2020 | ( | |||||||||||||||||||||||||||||||||||||
| Net income | — | — | — | — | ||||||||||||||||||||||||||||||||||
| Other comprehensive loss, net of tax | — | — | — | — | ( | ( | ||||||||||||||||||||||||||||||||
| Issuance of common stock | — | ( | — | — | ( | |||||||||||||||||||||||||||||||||
| Stock compensation expense | — | — | — | |||||||||||||||||||||||||||||||||||
| Purchase of treasury stock | — | — | ( | — | — | ( | ||||||||||||||||||||||||||||||||
| Reissuance of treasury stock | — | ( | ( | — | ( | |||||||||||||||||||||||||||||||||
| Balance at December 31, 2021 | ( | ( | ||||||||||||||||||||||||||||||||||||
| Net loss | — | — | — | ( | — | ( | ||||||||||||||||||||||||||||||||
| Other comprehensive loss, net of tax | — | — | — | — | ( | ( | ||||||||||||||||||||||||||||||||
| Issuance of common stock | — | ( | — | ( | ||||||||||||||||||||||||||||||||||
| Stock compensation expense | — | — | — | — | ||||||||||||||||||||||||||||||||||
| Purchase of treasury stock | — | — | ( | — | — | ( | ||||||||||||||||||||||||||||||||
| Reissuance of treasury stock | — | ( | — | |||||||||||||||||||||||||||||||||||
| Balance at December 31, 2022 | $ | $ | $ | ( | $ | $ | ( | $ | ||||||||||||||||||||||||||||||
| Net loss | — | — | — | ( | — | ( | ||||||||||||||||||||||||||||||||
| Other comprehensive loss, net of tax | — | — | — | — | ||||||||||||||||||||||||||||||||||
| Stock compensation expense | — | — | — | — | ||||||||||||||||||||||||||||||||||
| Purchase of treasury stock | — | — | ( | — | — | ( | ||||||||||||||||||||||||||||||||
| Reissuance of treasury stock | — | ( | ( | — | ||||||||||||||||||||||||||||||||||
| Shares withheld related to net share settlement of equity awards | — | ( | — | — | — | ( | ||||||||||||||||||||||||||||||||
| Excise tax on stock repurchase | — | — | ( | — | — | ( | ||||||||||||||||||||||||||||||||
| Balance at December 31, 2023 | $ | $ | $ | ( | $ | $ | ( | $ | ||||||||||||||||||||||||||||||
The accompanying notes are an integral part of these consolidated financial statements.
44
BIO-RAD LABORATORIES, INC.
Notes to Consolidated Financial Statements
1. SIGNIFICANT ACCOUNTING POLICIES
Basis of Presentation
The consolidated financial statements include the accounts of Bio-Rad Laboratories, Inc. and all of our wholly and majority owned subsidiaries (referred to in this report as “Bio-Rad,” “we,” “us” and “our”) after elimination of intercompany balances and transactions. The preparation of financial statements in conformity with U.S. generally accepted accounting principles requires management to make estimates and assumptions that affect the amounts reported in the financial statements and accompanying notes. Actual results could differ from those estimates.
Use of Estimates
The preparation of the consolidated financial statements requires management to make estimates and assumptions that affect the reported amounts of assets and liabilities and the disclosure of contingencies at the date of the financial statements as well as the reported amounts of revenues and expenses during the reporting periods. Bio-Rad bases its estimates on historical experience and on various other market-specific and other relevant assumptions that are believed to be reasonable under the circumstances, the results of which form the basis for making judgments about the carrying values of assets and liabilities that are not readily apparent from other sources. Such estimates include, but are not limited to, revenue recognition, the valuation of inventory, the valuation of acquired intangible assets, valuation of accounts receivable, estimation of warranty reserve, estimation of legal reserves, the recognition and measurement of current and deferred income tax assets and fair value measurement of the Loan receivable. Actual results could differ materially from those estimates.
Cash and Cash Equivalents
Short-term Restricted Investments
Short-term restricted investments of $5.6
Available-for-Sale Investments
Available-for-sale investments consist of corporate obligations, municipal securities, asset backed securities and U.S. government sponsored agencies. Management classifies investments at the time of purchase and reevaluates such classification at each balance sheet date. Investments with maturities beyond one year may be classified as short-term based on their liquid nature and because such marketable securities represent the investment of cash that is available for current operations. Available-for-sale investments are reported at fair value based on quoted market prices and other observable market data. Unrealized gains and losses are reported as a component of other comprehensive income (loss), net of any related tax effect. Realized gains and losses and other-than-temporary impairments on investments are included in Other income, net (see Note 11).
Concentration of Credit Risk
Financial instruments that potentially subject us to concentration of credit risk consist primarily of cash and cash equivalents, investments, foreign exchange contracts, trade accounts receivable and loans receivable. Cash and cash
45
equivalents and investments are placed with various highly rated major financial institutions located in different geographic regions.
The forward contracts used in managing our foreign currency exposures have an element of risk in that the counterparties may be unable to meet the terms of the agreements. We attempt to minimize this risk by limiting the counterparties to a diverse group of highly-rated domestic and international financial institutions. In the event of non-performance by these counterparties, the carrying values of our financial instruments represent the maximum amount of loss we would have incurred as of our fiscal year-end.
Credit risk for trade accounts receivable is generally limited due to the large number of customers and their dispersion across many geographic areas. We manage our accounts receivable credit risk through ongoing credit evaluation of our customers' financial conditions. We generally do not require collateral from our customers.
Loans receivable represent the Loan extended to SHB and is collateralized by the pledge of certain trust interests under the Sartorius family trust ("Trust"), which upon termination of the Trust represent the right to receive Sartorius ordinary shares. The collateral is subject to market volatility based on fluctuation in value of the Sartorius ordinary shares.
Accounts Receivable and Allowance for Credit Losses
We record trade accounts receivable at the net invoice value and such receivables are non-interest bearing. We consider receivables past due based on the contractual payment terms. Amounts later determined and specifically identified to be uncollectible are charged or written off against the allowance for credit losses.
Any adjustments made to our historical loss experience reflect current differences in asset-specific risk characteristics, including, for example, accounts receivable by customer type (public or government entity versus private entity) and by geographic location of the customer.
Changes in our allowance for credit losses were as follows (in millions):
| December 31, | 2023 | 2022 | 2021 | ||||||||
| Beginning balance | $ | $ | $ | ||||||||
| Provision for expected credit losses | |||||||||||
| Write-offs charged against the allowance | ( | ( | ( | ||||||||
| Recoveries collected | |||||||||||
| Ending balance | $ | $ | $ | ||||||||
Inventory
Inventories are valued at the lower of cost and net realizable value and include material, labor and overhead costs. Cost is determined using standard costs, which approximate actual costs, and are relieved from inventory on a first-in, first-out or average cost basis. We classify our inventories based on our historical and anticipated levels of sales; any inventory in excess of its normal operating cycle (1 – 3 years depending on our product line) is classified as long-term on our consolidated balance sheets. The long-term inventory was immaterial as of December 31, 2023 and 2022.
Property, Plant and Equipment
Property, plant and equipment are stated at cost, less accumulated depreciation and amortization. Additions and improvements are capitalized, and maintenance and repairs are expensed as incurred. Included in property, plant and equipment are buildings and equipment acquired under capital lease arrangements, reagent rental equipment and capitalized software, including costs for software developed or obtained for internal use.
46
Depreciation is computed on a straight-line basis over the estimated useful lives of the assets. The estimated useful lives of property, plant and equipment are generally as follows: buildings, 10 -50 years; leasehold improvements, the life of the improvements or the term of the lease, whichever is shorter; reagent rental equipment, 1 -5 years; equipment, 3 -12 years; and computer software, 3 -5 years.
When property and equipment is retired or otherwise disposed of, the cost and accumulated depreciation are relieved from the accounts and the net gain or loss is included in operating expenses.
Internal-Use Software Development Costs
Costs incurred in the development of internal use software during the application development stage are capitalized and included in Property, plant and equipment, net on the consolidated balance sheets. Such capitalized costs include costs directly associated with the development of the applications. Capitalization of such costs begins when the preliminary project stage is complete and ceases at the point the project is substantially complete and is ready for its intended purpose. Internal-use software is amortized on a straight-line basis over the estimated useful life of between 3-5 years. Costs incurred during the preliminary project stage, as well as maintenance and training costs, are expensed as incurred.
Leases
We determine if an arrangement is a lease at inception. Operating leases are included in Operating lease right-of-use (“ROU”) assets, Current operating lease liabilities, and Operating lease liabilities in our consolidated balance sheets. Finance leases are included in Property, plant and equipment, Current maturities of long-term debt, and Long-term debt, net of current maturities in our consolidated balance sheets.
Intangible Assets
Our intangible assets principally include goodwill, acquired technology / know how, license, tradenames, customer relationships, and in-process research and development. Intangible assets with finite lives, which include acquired technology / know how, tradenames, licenses and customer relationships, are carried at cost and amortized using the straight-line method over their estimated useful lives.
The estimated useful lives used in computing amortization of intangible assets are as follows:
47
Customer relationships/lists | |||||
Know how | |||||
Developed product technology | |||||
Licenses | |||||
Tradenames | |||||
Covenants not to compete | |||||
Intangible assets with indefinite lives, which include only goodwill and in-process research and development assets, are recorded at cost and evaluated at least annually for impairment.
Impairment of Long-Lived Assets
We review long-lived assets, such as property, plant and equipment and finite-lived intangible assets, for impairment whenever events indicate that the carrying amounts might not be recoverable. Recoverability of property, plant and equipment, and other finite-lived intangible assets are measured by comparing the projected undiscounted net cash flows associated with those assets to their carrying values. If an asset is considered impaired, it is written down to its fair value, which is determined based on the asset's projected discounted cash flows or appraised value, depending on the nature of the asset. For purposes of recognition of impairment for assets held for use, we group assets and liabilities at the lowest level for which cash flows are separately identifiable.
There were no
Impairment of Goodwill
Goodwill represents the excess of the purchase price over the fair value of the net tangible and identifiable intangible assets acquired in each business combination. We conduct an impairment analysis for goodwill annually in the fourth quarter or more frequently if indicators of impairment exist or if a decision is made to sell or exit a business. Significant judgments are involved in determining if an indicator of impairment has occurred. Such indicators may include deterioration in general economic conditions, negative developments in equity and credit markets, adverse changes in the markets in which an entity operates, increases in input costs that have a negative effect on earnings and cash flows, or a trend of negative or declining cash flows over multiple periods, among others. The fair value that could be realized in an actual transaction may differ from that used to evaluate the impairment of goodwill.
We first may assess qualitative factors to determine if it is more likely than not that the fair value of a reporting unit is less than its carrying amount as a basis for determining whether it is necessary to perform the quantitative goodwill impairment test included in U.S. GAAP. To the extent our assessment identifies adverse conditions, or if we elect to bypass the qualitative assessment, goodwill is tested at the reporting unit level using a quantitative impairment test.
We determined that there are two reporting units, which are the same as our operating segments namely Life Science and Clinical Diagnostics. We generally estimate the fair value of the reporting units in goodwill impairment assessments using an income approach, which includes an analysis of the future cash flows expected to be generated and the risk associated with achieving such cash flows. This approach requires significant management judgment including the discount rate that is applied to the discretely forecasted future cash flows to calculate the present value of those cash flows and the estimate of future cash flows attributable to the reporting unit. Actual results may differ from management’s estimates. We elected to perform a quantitative assessment of goodwill during the fourth quarter of 2023 and concluded that the fair value of the reporting units exceeded the carrying amount and that goodwill is not impaired. There were no impairments for the years ended December 31, 2023, 2022 and 2021.
Impairment of Indefinite-Lived Intangible Assets
48
Income Taxes
We account for income taxes under the asset and liability method, which requires the recognition of deferred tax assets and liabilities for the expected future tax consequences of events that have been included in the financial statements. Under this method, deferred tax assets and liabilities reflect the tax effects of net operating losses, tax credits, and temporary differences between the carrying amounts of assets and liabilities for financial reporting purposes and the amounts used for income tax purposes. They are determined using enacted tax rates in effect for the year in which such temporary differences are expected to reverse. The effect of a change in tax rates on deferred tax assets and liabilities is recognized in income in the period that includes the enactment date.
We record deferred tax assets to the extent we believe these assets will more likely than not be realized. In making such determination, we consider all available positive and negative evidence, including scheduled reversals of deferred tax liabilities, projected future taxable income, tax planning strategies and recent financial operations. When we establish or reduce the valuation allowance against our deferred tax assets, our provision for income taxes will increase or decrease, respectively, in the period that determination to change the valuation allowance is made.
We recognize the tax benefit from an uncertain tax position only if it is more likely than not that the tax position will be sustained on examination by the taxing authorities based on the technical merits of the position. The tax benefits recognized in the financial statements on a particular tax position are measured based on the largest benefit that has a greater than a 50% likelihood of being realized upon settlement. The amount of unrecognized tax benefits is adjusted as appropriate for changes in facts and circumstances, such as significant amendments to existing tax law, new regulations or interpretations by the taxing authorities, new information obtained during a tax examination, or resolution of an examination. We recognize both accrued interest and penalties, where appropriate, related to unrecognized tax benefits in the provision for income taxes.
Revenue Recognition
We recognize revenue from operations through the sale of products, services, license of intellectual property and rental of instruments. Revenue from contracts with customers is recognized upon transfer of control of promised products or services to customers in an amount that reflects the consideration we expect to receive in exchange for those products or services. Revenue is recognized net of any taxes collected from customers (sales tax, value added tax, etc.), which are subsequently remitted to government authorities.
We enter into contracts that can include various combinations of products and services, which are generally accounted for as distinct performance obligations. A product or service is considered distinct if it is separately identifiable from other deliverables in the arrangement and if a customer can benefit from such product or service on its own or with other resources that are readily available to the customer. The transaction consideration is allocated between separate performance obligations of an arrangement based on the stand-alone selling price (“SSP”) for each distinct product or service.
We recognize revenue from product sales at the point in time when we have satisfied our performance obligation by transferring control of the product to the customer. We use judgment to evaluate whether and when control has
49
transferred and consider the right to payment, legal title, physical possession, risks and rewards of ownership, and customer acceptance if it is not a formality, as indicators to determine the transfer of control to the customer. For products that include installation, the product and installation are separate performance obligations. The product revenue is recognized when control has transferred to the customer, generally upon delivery, and installation service revenue is recognized when the product installation is completed.
Service revenues on extended warranty contracts are recognized ratably over the life of the service agreement as a stand-ready performance obligation. For arrangements that include a combination of products and services, the transaction price is allocated to each performance obligation based on stand-alone selling prices. The method used to determine the stand-alone selling prices for product and service revenues is based on the observable prices when the product or services have been sold separately.
We recognize revenues for a functional license of intellectual property at a point in time when the control of the license and technology transfers to the customer. For license agreements that include sales or usage-based royalty payments to us, we recognize revenue at the later of (i) when the related sale of the product occurs, or (ii) when the performance obligation to which some or all of the royalty has been allocated has been satisfied, or partially satisfied.
The primary purpose of our invoicing terms is to provide customers with simple and predictable methods of purchasing our products and services, not to either provide or receive financing to or from our customers. We record contract liabilities when cash payments are received or due in advance of our performance.
We do not disclose the value of unsatisfied performance obligations for contracts with an original expected length of one year or less. Our payment terms vary by the type and location of our customer, and the products and services offered. The term between invoicing and when payment is due is not significant.
In addition, we offer a reagent rental program which provides our customers the ability to use an instrument and consumables (reagents) on a per test basis. These agreements may also include maintenance of the instruments placed at customer locations as well as initial training. We initially determine if a reagent rental arrangement contains a lease at contract commencement. Where we have determined that such an arrangement contains a lease, we then determine the lease classification. Our reagent rental arrangements are predominantly classified as operating leases and any sales-type leases have historically been immaterial and we do not enter into direct finance leases.
We concluded that the use of the instrument (referred to as “lease elements”) in our reagent rental agreements is not governed by the revenue recognition guidance of ASC 606 but instead is addressed by the lease guidance in ASC 842. Accordingly, we first allocate the transaction price between the lease elements and the non-lease elements based on relative standalone selling prices. Our reagent rental arrangements are predominantly comprised of variable lease payments that fluctuate depending on the volume of reagents purchased, as such arrangements generally do not contain any fixed or minimum lease payments. Maintenance services and reagent sales are allocated to the non-lease elements and recognized as income over time as control is transferred. Maintenance services are recognized ratably over the period whereas reagents revenue is recognized upon transfer of control when either (i) the consumables are delivered or (ii) the consumables are consumed by the customer.
Revenue attributed to the lease elements of our reagent rental arrangements represented approximately 3 % of total revenue in 2023, 3 % of total revenue in 2022 and 2 % of total revenue in 2021. Such revenue forms part of the Net sales in our consolidated statements of income (loss).
Contract costs:
As a practical expedient, we expense as incurred costs to obtain contracts as the amortization period would have been one year or less. These costs include our internal sales force and certain partner sales incentive programs and are recorded within Selling, general and administrative expense in our consolidated statements of income (loss).
50
Disaggregation of Revenue:
We warrant certain equipment against defects in design, materials and workmanship, generally for a period of one year. We estimate the cost of warranties at the time the related revenue is recognized based on historical experience, specific warranty terms and customer feedback. These costs are recorded within Cost of goods sold in our consolidated statements of income (loss).
Warranty liabilities are included in Other current liabilities and Other long-term liabilities in the consolidated balance sheets. Change in our warranty liability were as follows (in millions):
| 2023 | 2022 | 2021 | ||||||||||||||||||
| January 1 | $ | $ | $ | |||||||||||||||||
| Provision for warranty | ||||||||||||||||||||
| Actual warranty costs | ( | ( | ( | |||||||||||||||||
| December 31 | $ | $ | $ | |||||||||||||||||
Shipping and Handling
We classify all freight costs billed to customers as Net sales. Related freight costs are recognized upon transfer of control of the promised products to customers as a fulfillment cost and included in Cost of goods sold.
Research and Development
Foreign Currency
Balance sheet accounts of international subsidiaries are translated at the current exchange rates as of the end of each accounting period. Income statement items are translated at average exchange rates for the period. The resulting translation adjustments are recorded as a separate component of stockholders’ equity.
Foreign currency transaction gains and losses are included in Foreign currency exchange (gains) losses, net in the consolidated statements of income (loss). Transaction gains and losses result primarily from fluctuations in exchange rates when intercompany receivables and payables are denominated in currencies other than the functional currency of our subsidiary that recorded the transaction.
Forward Foreign Exchange Contracts
As part of distributing our products, we regularly enter into intercompany transactions. We enter into forward foreign exchange contracts to manage foreign exchange risk of future movements in exchange rates that affect foreign currency denominated intercompany receivables and payables. We do not use derivative financial instruments for speculative or trading purposes, nor do we seek hedge accounting treatment for any of our contracts. As a result, these contracts, generally with maturity dates of 90 days or less and denominated primarily in currencies of industrial countries, are recorded as an asset or liability measured at their fair value at each balance sheet date.
51
Share-Based Compensation Plans
Share-based compensation expense for all share-based payment awards granted is determined based on the grant-date fair value. We recognize these compensation costs over the requisite service period of the award, which is generally the vesting term of the share-based payment awards. Forfeitures are recognized as they occur. These plans are described more fully in Note 10.
Earnings (Loss) Per Share
We compute net income (loss) per share of Class A Common Stock (Class A) and Class B Common Stock (Class B) using the two-class method required for participating securities. Our participating securities include Class A and Class B. Each share of Class A and Class B participates equally in earnings and losses, but may not participate equally in dividend distributions. No dividends were distributed or declared during any of the periods presented. Earnings (loss) is attributable equally to each share of Class A and Class B common stock and is determined based on the weighted average number of the respective class of common stock outstanding for the year.
Accordingly, basic earnings (loss) per share is computed by dividing net income (loss) attributable to Bio-Rad by the weighted average number of common shares outstanding for that period. Diluted earnings per share takes into account the effect of dilutive instruments, such as stock options, restricted stock and performance stock, and uses the average share price for the period in determining the number of potential common shares that are to be added to the weighted average number of shares outstanding. Potential common shares are excluded from the diluted earnings (loss) per share calculation if the effect of including such securities would be anti-dilutive.
The weighted average number of common shares outstanding used to calculate basic and diluted earnings (loss) per share, and the anti-dilutive shares that are excluded from the diluted earnings (loss) per share calculation are as follows (in thousands):
| Year Ended December 31, | ||||||||||||||||||||
| 2023 | 2022 | 2021 | ||||||||||||||||||
| Basic weighted average shares common outstanding | ||||||||||||||||||||
| Effect of potentially dilutive stock options, restricted | ||||||||||||||||||||
| stock and performance stock awards | ||||||||||||||||||||
| Diluted weighted average common shares outstanding | ||||||||||||||||||||
| Anti-dilutive shares | ||||||||||||||||||||
Fair Value of Financial Instruments
For certain financial instruments, including cash and cash equivalents, short-term investments, accounts receivable, marketable securities, accounts payable and foreign exchange contracts, the carrying amounts approximate fair value.
The estimated fair value of financial instruments is based on the exchange price that would be received for an asset or paid to transfer a liability (an exit price) using available market information or other appropriate valuation methodologies in the principal or most advantageous market for the asset or liability in an orderly transaction between market participants. Estimates are not necessarily indicative of the amounts that could be realized in a current market exchange as considerable judgment is required in interpreting market data used to develop estimates of fair value. The use of different market assumptions or estimation techniques could have a material effect on the estimated fair value (see Note 2).
52
Variable Interest Entities
We enter into relationships with or make investments in other entities that may be variable interest entities ("VIE"). A VIE is consolidated in the financial statements if we are the primary beneficiary. The primary beneficiary has the power to direct activities that most significantly impact the economic performance of the VIE and has the obligation to absorb losses or the right to receive benefits from the VIE that could potentially be significant to the VIE.
In 2021, we extended a loan to a VIE, Sartorius-Herbst Beteiligungen II GmbH ("SHB"), a private limited company incorporated under the laws of Germany (See Note 2). We have not consolidated this entity because we do not have the power to direct the activities that most significantly impact the VIE’s economic performance related to repayment of the loan or cash management of the SHB and, thus, we are not considered the primary beneficiary of the VIE. We believe that our maximum exposure to loss as a result of our involvement with the VIE is limited to the receivable due to us from the VIE under the terms of the loan.
Equity Investments
Investments in publicly traded companies in which we do not have the ability to exercise significant influence are reported at fair value, with unrealized gains and losses reported as a component of (gains) losses from change in fair market value of equity securities and loan receivable in our consolidated statements of income (loss). Companies in which we do not have a controlling financial interest, but over which we have significant influence, are accounted for using the equity method. Our share of the after-tax earnings of equity method investees is included in Other income, net in our consolidated statements of income (loss). Investments in privately held companies in which we do not have the ability to exercise significant influence are accounted for using the cost method with adjustments for observable changes in price or impairments (see Note 2). We monitor our relationships with investees when changes occur that could affect whether we have the ability to exercise significant influence.
Recent Accounting Pronouncements to be Adopted
In November 2023, the Financial Accounting Standards Board ("FASB") issued ASU 2023-07, “Improvements to Reportable Segment Disclosures.” The ASU includes enhanced disclosure requirements, primarily related to significant segment expenses that are regularly provided to and used by the chief operating decision maker (CODM). The amendments are to be applied retrospectively to all prior periods presented in the financial statements. ASU 2023-07 is effective for fiscal years beginning after December 15, 2023, with early adoption permitted. We are currently evaluating the effect of adopting this pronouncement on our financial statements and disclosures.
In December 2023, the FASB issued ASU 2023-09, "Income Taxes (Topic 740): Improvements to Income Tax Disclosures". The ASU includes enhanced disclosure requirements, primarily related to the rate reconciliation and income taxes paid information. The amendments are to be applied prospectively in the financial statements. ASU 2023-09 is effective for fiscal years beginning after December 15, 2024, with early adoption permitted. We are currently evaluating the effect of adopting this pronouncement on our financial statements and disclosures.
2. FAIR VALUE MEASUREMENTS AND INVESTMENTS
We determine the fair value of an asset or liability based on the assumptions that market participants would use in pricing the asset or liability in an orderly transaction between market participants at the measurement date. The identification of market participant assumptions provides a basis for determining what inputs are to be used for pricing each asset or liability. A fair value hierarchy has been established which gives precedence to fair value measurements calculated using observable inputs over those using unobservable inputs. This hierarchy prioritizes the inputs into three broad levels as follows:
•Level 1: Quoted prices in active markets for identical instruments
53
•Level 2: Other significant observable inputs (including quoted prices in active markets for similar instruments)
•Level 3: Significant unobservable inputs (including assumptions in determining the fair value of certain investments)
Financial assets and liabilities carried at fair value and measured on a recurring basis as of December 31, 2023 are classified in the hierarchy as follows (in millions):
| Level 1 | Level 2 | Level 3 | Total | ||||||||||||||||||||
| Financial assets carried at fair value: | |||||||||||||||||||||||
| Cash equivalents: | |||||||||||||||||||||||
| Commercial paper | $ | $ | $ | $ | |||||||||||||||||||
| Time deposits | |||||||||||||||||||||||
| U.S. government sponsored agencies | |||||||||||||||||||||||
| Money market funds | |||||||||||||||||||||||
| Total cash equivalents (a) | |||||||||||||||||||||||
| Restricted investments (b) | |||||||||||||||||||||||
| Equity Securities (c) | |||||||||||||||||||||||
| Loan under the fair value option (d) | |||||||||||||||||||||||
| Available-for-sale investments: | |||||||||||||||||||||||
| Corporate debt securities | |||||||||||||||||||||||
| U.S. government sponsored agencies | |||||||||||||||||||||||
| Foreign government obligations | |||||||||||||||||||||||
| Municipal obligations | |||||||||||||||||||||||
| Asset-backed securities | |||||||||||||||||||||||
| Total available-for-sale investments (e) | |||||||||||||||||||||||
| Forward foreign exchange contracts (f) | |||||||||||||||||||||||
| Total financial assets carried at fair value | $ | $ | $ | $ | |||||||||||||||||||
| Financial liabilities carried at fair value: | |||||||||||||||||||||||
| Forward foreign exchange contracts (g) | $ | $ | $ | $ | |||||||||||||||||||
| Contingent consideration (h) | |||||||||||||||||||||||
| Total financial liabilities carried at fair value | $ | $ | $ | $ | |||||||||||||||||||
Financial assets and liabilities carried at fair value and measured on a recurring basis as of December 31, 2022 are classified in the hierarchy as follows (in millions):
54
| Level 1 | Level 2 | Level 3 | Total | ||||||||||||||||||||
| Financial assets carried at fair value: | |||||||||||||||||||||||
| Cash equivalents: | |||||||||||||||||||||||
| Commercial paper | $ | $ | $ | $ | |||||||||||||||||||
| Time deposits | |||||||||||||||||||||||
| Asset-backed securities | |||||||||||||||||||||||
| U.S. government sponsored agencies | |||||||||||||||||||||||
| Money market funds | |||||||||||||||||||||||
| Total cash equivalents (a) | |||||||||||||||||||||||
| Restricted investments (b) | |||||||||||||||||||||||
| Equity securities (c) | |||||||||||||||||||||||
| Loan under the fair value option (d) | |||||||||||||||||||||||
| Available-for-sale investments: | |||||||||||||||||||||||
| Corporate debt securities | |||||||||||||||||||||||
| U.S. government sponsored agencies | |||||||||||||||||||||||
| Foreign government obligations | |||||||||||||||||||||||
| Municipal obligations | |||||||||||||||||||||||
| Asset-backed securities | |||||||||||||||||||||||
| Total available-for-sale investments (e) | |||||||||||||||||||||||
| Forward foreign exchange contracts (f) | |||||||||||||||||||||||
| Total financial assets carried at fair value | $ | $ | $ | $ | |||||||||||||||||||
| Financial liabilities carried at fair value: | |||||||||||||||||||||||
| Forward foreign exchange contracts (g) | $ | $ | $ | $ | |||||||||||||||||||
| Contingent consideration (h) | |||||||||||||||||||||||
| Total financial liabilities carried at fair value | $ | $ | $ | $ | |||||||||||||||||||
(a) Cash equivalents are included in Cash and cash equivalents in the consolidated balance sheets.
(b) Restricted investments are included in the following accounts in the consolidated balance sheets (in millions):
| December 31, 2023 | December 31, 2022 | ||||||||||
| Restricted investments | $ | $ | |||||||||
| Other investments | |||||||||||
| Total | $ | $ | |||||||||
(c) Equity securities are included in the following accounts in the consolidated balance sheets (in millions):
| December 31, 2023 | December 31, 2022 | ||||||||||
| Short-term investments | $ | $ | |||||||||
| Other investments | |||||||||||
| Total | $ | $ | |||||||||
(d) The Loan under the fair value option is included in Other investments in the consolidated balance sheets.
55
(e) Available-for-sale investments are included in Short-term investments in the consolidated balance sheets.
(f) Forward foreign exchange contracts in an asset position are included in Other current assets in the consolidated balance sheets.
(g) Forward foreign exchange contracts in a liability position are included in Other current liabilities in the consolidated balance sheets.
(h) Contingent considerations in a liability position are included in Other long-term liabilities in the consolidated balance sheets. The changes in the fair value of contingent consideration included in Research and development expense and Selling, general and administrative expense amounted to $14.0 million and $4.1 million in the consolidated statements of income (loss) for the year ended December 31, 2023, respectively. No conditions triggering payment of the contingent consideration were met as of December 31, 2023.
Level 1 Fair Value Measurements
As of December 31, 2023, we own 12,987,900 ordinary voting shares and 9,588,908 preference shares of Sartorius AG (Sartorius), of Goettingen, Germany, a process technology supplier to the biotechnology, pharmaceutical, chemical and food and beverage industries. We own approximately 38 % of the outstanding ordinary shares (excluding treasury shares) and 28 % of the preference shares of Sartorius as of December 31, 2023. The Sartorius family trust (Sartorius family members are beneficiaries of the trust) holds a majority interest of the outstanding ordinary shares of Sartorius. We do not have the ability to exercise significant influence over the operating and financial policies of Sartorius primarily because we do not have any representative or designee on Sartorius' board of directors and have tried and failed to obtain access to operating or financial information necessary to apply the equity method of accounting.
The change in fair market value of our investment in Sartorius for the twelve months ended December 31, 2023 was a loss of $1,259.4 million and is recorded in our consolidated statements of income (loss).
Level 2 Fair Value Measurements
To estimate the fair value of Level 2 debt securities as of December 31, 2023 and 2022, our primary pricing provider uses Refinitiv as the primary pricing source. Our pricing process allows us to select a hierarchy of pricing sources for securities held. If Refinitiv does not price a Level 2 security that we hold, then the pricing provider will utilize our custodian supplied pricing as the secondary pricing source.
Available-for-sale investments consist of the following (in millions):
| December 31, 2023 | |||||||||||||||||||||||||||||
| Amortized Cost | Unrealized Gains | Unrealized Losses | Allowances for Credit Losses | Estimated Fair Value | |||||||||||||||||||||||||
| Short-term investments: | |||||||||||||||||||||||||||||
| Corporate debt securities | $ | $ | $ | ( | $ | ||||||||||||||||||||||||
| Municipal obligations | ( | ||||||||||||||||||||||||||||
| Asset-backed securities | ( | ||||||||||||||||||||||||||||
| U.S. government sponsored agencies | ( | ||||||||||||||||||||||||||||
| Foreign government obligations | ( | ||||||||||||||||||||||||||||
| $ | $ | $ | ( | $ | $ | ||||||||||||||||||||||||
56
The following is a summary of the amortized cost and estimated fair value of our debt securities at December 31, 2023 by contractual maturity date (in millions):
| Amortized Cost | Estimated Fair Value | ||||||||||
| Mature in less than one year | $ | $ | |||||||||
| Mature in one to five years | |||||||||||
| Mature in more than five years | |||||||||||
| Total | $ | $ | |||||||||
Available-for-sale investments consist of the following (in millions):
| December 31, 2022 | |||||||||||||||||||||||
| Amortized Cost | Unrealized Gains | Unrealized Losses | Estimated Fair Value | ||||||||||||||||||||
| Short-term investments: | |||||||||||||||||||||||
| Corporate debt securities | $ | $ | $ | ( | $ | ||||||||||||||||||
| Municipal obligations | ( | ||||||||||||||||||||||
| Asset-backed securities | ( | ||||||||||||||||||||||
| U.S. government sponsored agencies | ( | ||||||||||||||||||||||
| Foreign government obligations | ( | ||||||||||||||||||||||
| Total | $ | $ | $ | ( | $ | ||||||||||||||||||
As of December 31, 2023 there were no significant continuous unrealized losses greater than 12 months.
Our evaluation of credit losses for available-for-sale investments included the extent to which the fair value is less than the amortized cost basis, adverse conditions specifically related to the debt security, an industry or geographic area, and any changes in the rating of a security by a rating agency. Credit loss impairments are limited to the amount that the fair value of an instrument is less than its amortized cost basis.
At December 31, 2023, we have concluded that all payments related to our available-for-sale investments are expected to be made in full and on time at par value. The diminution of value in the intervening period is due to market conditions such as illiquidity and interest rate movements and not due to significant, inherent credit concerns surrounding the issuer. As a result, we have no allowances for credit losses on our available-for-sale investments portfolio as of December 31, 2023.
Included in Other current assets are $11.9 million and $11.6 million of interest receivable as of December 31, 2023 and December 31, 2022, respectively, primarily associated with securities in our available-for-sale investments portfolio. Associated interest on these securities is typically payable semi-annually. Due to the short-term nature of our interest receivable asset, we have made an accounting policy election not to measure an allowance for credit losses for accrued interest receivable. We consider any uncollected interest receivable that is overdue greater than one year to be impaired for purposes of write-off. For the year ended December 31, 2023, we have not written off any uncollected interest receivable.
As part of distributing our products, we regularly enter into intercompany transactions. We enter into forward foreign exchange contracts to manage foreign exchange risk of future movements in foreign exchange rates that affect foreign currency denominated intercompany receivables and payables. We do not use derivative financial instruments for speculative or trading purposes. We do not seek hedge accounting treatment for these contracts. As a result, these contracts, generally with maturity dates of 90 days or less, are recorded at their fair value at each balance sheet date. The notional amounts provide one measure of foreign exchange exposures as of December 31, 2023 and do not represent the amount of Bio-Rad's exposure to loss. The estimated fair value of these contracts
57
was derived using the spot rates and forward points from Refinitiv on the last business day of the quarter. The resulting gains or losses from foreign exchange contracts offset gains or losses from foreign currency remeasurement of the related receivables and payables, both of which are included in Foreign currency exchange (gains) losses, net in the consolidated statements of income (loss).
The following is a summary of our forward foreign currency exchange contracts (in millions):
| December 31, | |||||
| 2023 | |||||
Contracts maturing in January through March 2024 to sell foreign currency: | |||||
| Notional value | $ | ||||
| Unrealized gain/(loss) | $ | ( | |||
Contracts maturing in January through March 2024 to purchase foreign currency: | |||||
| Notional value | $ | ||||
| Unrealized gain/(loss) | $ | ||||
Included in Other investments in the consolidated balance sheet are investments without readily determinable fair value measured at cost with adjustments for observable price changes or impairments. The carrying value of these investments was $6.5 million as of December 31, 2023 and 2022.
Also included in Other investments in the consolidated balance sheet are our equity method investments, for which our share of the equity method investees earnings is included in Other income, net in our consolidated statements of income (loss). The carrying value of these investments, net of impairments, was $32.3 million and $26.7 million as of December 31, 2023 and December 31, 2022, respectively.
The carrying value and fair value of our long-term debt were as follows (in millions):
| December 31, 2023 | December 31, 2022 | |||||||||||||||||||||||||
Carrying Value | Fair Value | Carrying Value | Fair Value | |||||||||||||||||||||||
Senior notes | $ | $ | $ | $ | ||||||||||||||||||||||
Other long-term debt | ||||||||||||||||||||||||||
Total | $ | $ | $ | $ | ||||||||||||||||||||||
The fair value of our long-term debt was determined based on quoted market prices and on borrowing rates available to the company at the respective period ends, which represent level 2 measurements.
Level 3 Fair Value Investments
During the fourth quarter of 2021, we extended a collateralized loan to Sartorius-Herbst Beteiligungen II Gmbh ("SHB"), a private limited company incorporated under the laws of Germany, with a principal amount of €400 million due on January 31, 2029, subject to certain events which could trigger payment prior to maturity (“Loan”). SHB used the Loan proceeds to partially finance the acquisition of interests under the Sartorius family trust (“Trust”) from a beneficiary of the Trust. The Loan is collateralized by the pledge of certain of the Trust interests, which upon termination of the Trust in mid-2028 represent the right to receive Sartorius ordinary shares. Interest on the loan is payable annually in arrears at 1.5 % per annum, and the entire principal amount is due at maturity. In addition to contractual interest, we are entitled to certain value appreciation rights associated with the acquired Trust interests, which upon termination of the Trust represent the right to receive Sartorius ordinary shares, that is due upon repayment of the Loan. We elected the fair value option under ASC 825, Financial Instruments for accounting of the Loan to SHB to simplify the accounting. The fair value of the Loan and value appreciation right is estimated under the income approach using a discounted cash flow, and option pricing model, respectively, which results in a fair value measurement categorized in Level 3. The significant assumptions used to estimate fair value of the Loan include an estimate of the discount rate and cash flows of the Loan and the significant assumptions used
58
to estimate the fair value of the value appreciation right include volatility, the risk-free interest rate, expected life (in years) and expected dividend. The inputs are subject to estimation uncertainty and actual amounts realized may materially differ. An increase in the expected volatility may result in a significantly higher fair value, whereas a decrease in expected life may result in a significantly lower fair value. All subsequent changes in fair value of the Loan and value appreciation right, including accrued interest are recognized in (Gains) losses from change in fair market value of equity securities and loan receivable in our consolidated statements of income (loss). The overall change in fair market value reflected in (Gains) losses from change in fair market value of equity securities and loan receivable during the twelve months ended December 31, 2023 was a loss of $6.8 million, which includes a $24.5 million gain from change in fair market value of the Loan and a $31.3 million loss from change in fair market value of the value appreciation right. The decrease in the fair market value of the value appreciation right was due to a decline in the value of the Sartorius ordinary shares. As of December 31, 2023, the €400.0 million principal amount of the loan is still due on January 31, 2029.
The following table provides a reconciliation of the Level 3 Loan measured at estimated fair value (in millions):
| December 31, 2022 | $ | ||||
| Net decrease in estimated fair market value of the loan included in Gains (losses) in fair market value of equity securities and loan receivable | ( | ||||
| Foreign currency adjustments gains (losses), net | |||||
| December 31, 2023 | $ | ||||
3. GOODWILL AND OTHER PURCHASED INTANGIBLE ASSETS
Changes to goodwill by segment were as follows (in millions):
| 2023 | 2022 | ||||||||||||||||||||||||||||||||||||||||
| Life Science | Clinical Diagnostics | Total | Life Science | Clinical Diagnostics | Total | ||||||||||||||||||||||||||||||||||||
| Balances as of January 1: | |||||||||||||||||||||||||||||||||||||||||
| Goodwill | $ | $ | $ | $ | $ | $ | |||||||||||||||||||||||||||||||||||
| Accumulated impairment losses and write-offs | ( | ( | ( | ( | ( | ( | |||||||||||||||||||||||||||||||||||
| Goodwill, net | |||||||||||||||||||||||||||||||||||||||||
Acquisitions | |||||||||||||||||||||||||||||||||||||||||
| Foreign currency adjustments | |||||||||||||||||||||||||||||||||||||||||
| Period increase, net | |||||||||||||||||||||||||||||||||||||||||
| Balances as of December 31: | |||||||||||||||||||||||||||||||||||||||||
| Goodwill | |||||||||||||||||||||||||||||||||||||||||
| Accumulated impairment losses and write-offs | ( | ( | ( | ( | ( | ( | |||||||||||||||||||||||||||||||||||
| Goodwill, net | $ | $ | $ | $ | $ | $ | |||||||||||||||||||||||||||||||||||
Information regarding our identifiable purchased intangible assets with finite and indefinite lives is as follows (in millions):
59
| December 31, 2023 | |||||||||||||||||||||||
| Weighted-Average Amortization Period (years) | Purchase Price | Accumulated Amortization | Net Carrying Amount | ||||||||||||||||||||
| Customer relationships/lists | $ | $ | ( | $ | |||||||||||||||||||
| Know how | ( | ||||||||||||||||||||||
| Developed product technology | ( | ||||||||||||||||||||||
| Licenses | ( | ||||||||||||||||||||||
| Tradenames | ( | ||||||||||||||||||||||
| Covenants not to compete | ( | ||||||||||||||||||||||
| Total finite-lived intangible assets | ( | ||||||||||||||||||||||
| In-process research and development | — | ||||||||||||||||||||||
| Total purchased intangible assets | $ | $ | ( | $ | |||||||||||||||||||
| December 31, 2022 | |||||||||||||||||||||||
| Weighted-Average Amortization Period (years) | Purchase Price | Accumulated Amortization | Net Carrying Amount | ||||||||||||||||||||
| Customer relationships/lists | $ | $ | ( | $ | |||||||||||||||||||
| Know how | ( | ||||||||||||||||||||||
| Developed product technology | ( | ||||||||||||||||||||||
| Licenses | ( | ||||||||||||||||||||||
| Tradenames | ( | ||||||||||||||||||||||
| Covenants not to compete | ( | ||||||||||||||||||||||
| Total finite-lived intangible assets | ( | ||||||||||||||||||||||
| In-process research and development | — | ||||||||||||||||||||||
| Total purchased intangible assets | $ | $ | ( | $ | |||||||||||||||||||
Amortization expense related to purchased intangible assets for the years ended December 31, 2023, 2022 and 2021 was $23.8 million, $24.9 million and $28.4 million, respectively. Estimated future amortization expense (based on existing purchased finite-lived intangible assets) for the years ending December 31, 2024, 2025, 2026, 2027, 2028 and thereafter is $21.3 million, $19.3 million, $14.4 million, $12.0 million, $12.0 million, and $43.3 million, respectively.
60
4. INVENTORY
Following are the components of Inventory at December 31, 2023 and December 31, 2022 (in millions):
| December 31, 2023 | December 31, 2022 | ||||||||||||||||
| Inventory: | |||||||||||||||||
| Raw materials | $ | $ | |||||||||||||||
| Work in process | |||||||||||||||||
| Finished goods | |||||||||||||||||
| Total Inventory | $ | $ | |||||||||||||||
5. PROPERTY, PLANT AND EQUIPMENT, NET
Following are the components of Property, plant and equipment at December 31, 2023 and December 31, 2022 (in millions):
| December 31, 2023 | December 31, 2022 | |||||||||||||
Property, plant and equipment: | ||||||||||||||
Land and improvements | $ | $ | ||||||||||||
Building and leasehold improvements | ||||||||||||||
Equipment | ||||||||||||||
Total property, plant and equipment | ||||||||||||||
Less: accumulated depreciation and amortization | ( | ( | ||||||||||||
Property, plant and equipment, net | $ | $ | ||||||||||||
6. NOTES PAYABLE AND LONG-TERM DEBT
The principal components of long-term debt are as follows (in millions):
| December 31, 2023 | December 31, 2022 | ||||||||||
| $ | $ | ||||||||||
| Less unamortized discounts and debt issuance costs | ( | ( | |||||||||
| Long-term debt less unamortized discounts and debt issuance costs | |||||||||||
| Finance leases and other debt | |||||||||||
| Less current maturities | ( | ( | |||||||||
| Long-term debt | $ | $ | |||||||||
Under domestic and international lines of credit, standby letters of credit and guarantee arrangements, we had $208.0 million available for borrowing and usage as of December 31, 2023, which was reduced by $4.3 million that was utilized for standby letters of credit and guarantee arrangements issued by our banks to support our obligations.
61
Senior Notes due 2027 and 2032
In March 2022, pursuant to an indenture we issued $400.0 million in principal amount of Senior Notes due March 2027 (the “2027 Notes”) and $800.0 million in principal amount of Senior Notes due March 2032 (the “2032 Notes” and, together with the 2027 Notes, the “Notes”). The issuance of the 2027 Notes yielded net cash proceeds of $395.7 million at an effective rate of 3.5346 % and the issuance of the 2032 Notes yielded net cash proceeds of $790.5 million at an effective rate of 3.8429 %. The 2027 Notes and the 2032 Notes pay a fixed rate of interest of 3.3 % and 3.7 % per annum, respectively. Interest on the Notes is payable semi-annually in arrears on March 15 and September 15 of each year until the principal is paid or made available for payment. We have the option to redeem the Notes at any time, in whole or in part, at a redemption price calculated in accordance with the indenture, plus accrued and unpaid interest thereon to the redemption date. In the event of a change of control, the holders may require us to repurchase for cash all or a portion of their notes at a purchase price equal to 101 % of the principal amount of the notes, plus accrued and unpaid interest, if any. Our obligations under the Notes are unsecured senior obligations that rank equally in right of payment with all of our other existing and future unsecured, unsubordinated debt. The Notes include covenants that limit our ability to, among other things, (i) grant specified liens, (ii) engage in specified sale and leaseback transactions, (iii) consolidate or merge with or into other companies or (iv) sell all or substantially all of our assets. We were in compliance with these covenants as of December 31, 2023.
Credit Agreement
In April 2019, Bio-Rad entered into a $200.0 million unsecured revolving credit facility ("Credit Agreement"). Borrowings under the Credit Agreement are on a revolving basis and can be used to make permitted acquisitions, for working capital and for other general corporate purposes. Since 2019, Bio-Rad entered into Amendments No. 1, 2, 3, and 4 (“Amendment”) to the Credit Agreement to add LIBOR replacement language, expand the definition of EBITDA, increase certain financial baskets, clarify the definitions of certain terms related to cash in the Leverage Ratio calculation, clarify the intended timing for the delivery of quarterly and annual financials and the related compliance certificates as required by the Credit Agreement, and to replace the reference interest borrowing rate from LIBOR to Term SOFR. We had no outstanding borrowings under the Credit Agreement as of December 31, 2023; however, $0.2 million was utilized for domestic standby letters of credit that reduced our borrowing availability as of December 31, 2023. The Credit Agreement matures in April 2024. If we had borrowed against our Credit Agreement, the borrowing rate would have been 6.698 % at December 31, 2023, which is based on the 3-month LIBOR.
The Credit Agreement requires Bio-Rad to comply with certain financial ratios and covenants, among other things. These ratios and covenants include a leverage ratio test and an interest coverage test, as well as certain restrictions on our ability to declare or pay dividends, incur debt, guarantee debt, enter into transactions with affiliates, merge or consolidate, sell assets, make investments and create liens. We were in compliance with all of these ratios and covenants as of December 31, 2023 and 2022.
Maturities of finance leases and other debt at December 31, 2023 were as follows (in millions):
| 2024 | $ | ||||
| 2025 | |||||
| 2026 | |||||
| 2027 | |||||
| 2028 | |||||
| 2029 and thereafter | |||||
| Total Maturities of finance leases and other debt | $ | ||||
62
7. INCOME TAXES
The U.S. and international components of income before taxes are as follows (in millions):
| Year Ended December 31, | ||||||||||||||||||||
| 2023 | 2022 | 2021 | ||||||||||||||||||
| U.S. | $ | ( | $ | ( | $ | |||||||||||||||
| International | ( | ( | ||||||||||||||||||
| Income (loss) before taxes | $ | ( | $ | ( | $ | |||||||||||||||
The (benefit from) provision for income taxes consists of the following (in millions):
| Year Ended December 31, | ||||||||||||||||||||
| 2023 | 2022 | 2021 | ||||||||||||||||||
| Current tax expense: | ||||||||||||||||||||
| U.S. Federal | $ | $ | $ | |||||||||||||||||
| State | ||||||||||||||||||||
| International | ||||||||||||||||||||
| Current tax expense | ||||||||||||||||||||
| Deferred tax (benefit) expense: | ||||||||||||||||||||
| U.S. Federal | ( | ( | ||||||||||||||||||
| State | ( | ( | ||||||||||||||||||
| International | ( | ( | ||||||||||||||||||
| Deferred tax expense | ( | ( | ||||||||||||||||||
| Non-current tax expense (benefit) | ( | |||||||||||||||||||
| (Benefit from) provision for income taxes | $ | ( | $ | ( | $ | |||||||||||||||
The reconciliation between our effective tax rate on income before taxes and the statutory tax rate is as follows:
| Year Ended December 31, | ||||||||||||||||||||
| 2023 | 2022 | 2021 | ||||||||||||||||||
| U. S. statutory tax rate | % | % | % | |||||||||||||||||
| Impact of foreign operations | ( | ( | ( | |||||||||||||||||
| U.S. taxation of foreign income | ||||||||||||||||||||
| State taxes | ||||||||||||||||||||
| Other | ( | ( | ||||||||||||||||||
| (Benefit from) provision for income taxes | % | % | % | |||||||||||||||||
On December 22, 2017, the U.S. enacted comprehensive tax legislation (the “Tax Act”). The Tax Act made broad and complex changes to the U.S. tax code, including the imposition of a one-time mandatory deemed repatriation tax (“Transition Tax”) on certain earnings accumulated offshore since 1986 and the reduction of the corporate tax rate from 35% to 21% for U.S. taxable income, resulting in a one-time remeasurement of U.S. federal deferred tax assets and liabilities. The Tax Act also amended Internal Revenue Code Section 174 requiring capitalization of research and experimentation expenditures. The capitalized expenses are amortized over a period of 5 or 15 years.
On August 16, 2022, President Biden signed into law the Inflation Reduction Act of 2022, which includes an Alternative Minimum Tax based on the Adjusted Financial Statement Income of Applicable Corporations. We do not believe the Inflation Reduction Act will have a material impact on our income tax provision and cash taxes. We continue to monitor the developments in tax laws and regulations to evaluate their potential impact on our business.
63
Our effective income tax rates were 25.0 %, 22.9 % and 21.9 % for the years ended December 31, 2023, 2022 and 2021, respectively. The effective tax rates for the years ended December 31, 2023, 2022 and 2021 were primarily driven by the unrealized gain/loss in equity securities that was taxed at 22.3 %, 22.5 % and 22.4 %, respectively, as well as the geographic mix of earnings.
Many jurisdictions in which we operate have statutory tax rates that differ from the U.S. statutory tax rate of 21%. Our effective tax rate is impacted, either favorably or unfavorably, by many factors including, but not limited to the jurisdictional mix of income before tax, changes to statutory tax rates, changes in tax laws or regulations, tax audits and settlements, and generation of tax credits.
Deferred tax assets and liabilities reflect the tax effects of losses, credits, and temporary differences between the carrying amounts of assets and liabilities for financial reporting purposes and the amounts used for income tax purposes. Significant components of deferred tax assets and liabilities are as follows (in millions):
| December 31, | ||||||||||||||
| 2023 | 2022 | |||||||||||||
| Deferred tax assets: | ||||||||||||||
| Bad debt, inventory and warranty accruals | $ | $ | ||||||||||||
| Other post-employment benefits, vacation and other reserves | ||||||||||||||
| Tax credit and net operating loss carryforwards | ||||||||||||||
| Lease obligations | ||||||||||||||
| Other | ||||||||||||||
| Total gross deferred tax assets | ||||||||||||||
| Valuation allowance | ( | ( | ||||||||||||
| Total deferred tax assets | ||||||||||||||
| Deferred tax liabilities: | ||||||||||||||
| Property and equipment | ||||||||||||||
| Lease assets | ||||||||||||||
| Investments and intangible assets | ||||||||||||||
| Total deferred tax liabilities | ||||||||||||||
| Net deferred tax liabilities | $ | ( | $ | ( | ||||||||||
The realization of deferred tax assets is dependent upon the generation of sufficient taxable income of the appropriate character in future periods. We regularly assess our ability to realize our deferred tax assets and establish a valuation allowance if it is more likely than not that some portion, or all, of our deferred tax assets will not be realized. In assessing the realizability of our deferred tax assets, we weigh all available positive and negative evidence. Due to the weight of objectively verifiable negative evidence, we believe that it is more likely than not that certain of our federal, state and foreign deferred tax assets will not be realized as of December 31, 2023, and have maintained a valuation allowance on such deferred tax assets.
The valuation allowance for deferred tax assets is as follows (in millions):
| December 31, | |||||||||||||||||||||||||||||||||||||||||||||||||||||
| 2023 | 2022 | 2021 | |||||||||||||||||||||||||||||||||||||||||||||||||||
| Beginning balance | $ | $ | $ | ||||||||||||||||||||||||||||||||||||||||||||||||||
| Additions charged to expenses | |||||||||||||||||||||||||||||||||||||||||||||||||||||
| Deductions from reserves | ( | ||||||||||||||||||||||||||||||||||||||||||||||||||||
| Ending balance | $ | $ | $ | ||||||||||||||||||||||||||||||||||||||||||||||||||
64
As of December 31, 2023, our federal, state and foreign net operating loss carryforwards were approximately $18.2 million, $30.0 million and $301.4 million, respectively. Of our foreign net operating losses, $144.5 million may be carried forward indefinitely. The majority of the remaining foreign net operating losses, if not utilized, will begin to expire in 2024. Our federal and state net operating loss carryforwards, if not utilized, will begin to expire in 2028. As of December 31, 2023, our federal and state tax credit carryforwards were approximately $7.7 million and $74.6 million, respectively. Our federal tax credits, if not utilized, will begin to expire in 2029, and our state tax credits, generally, may be carried forward indefinitely.
Federal and state tax laws impose restrictions on the utilization of net operating loss and certain tax credit carryforwards in the event of a change in our ownership as defined by the Internal Revenue Code Sections 382 and 383. Under Section 382 and 383 of the Internal Revenue Code, substantial changes in our ownership and the ownership of acquired companies may limit the amount of net operating loss and research and development credit carryforwards that are available to offset taxable income. The annual limitation would not automatically result in the loss of net operating loss or research and development credit carryforwards but may limit the amount available in any given future period.
Our income tax returns are audited by U.S. federal, state and foreign tax authorities. We are currently under examination by many of these tax authorities. The tax years open to examination include the years 2012 and forward for the U.S. and certain foreign jurisdictions including France, Germany, India and Switzerland. There are differing interpretations of tax laws and regulations, and as a result, significant disputes may arise with these tax authorities involving issues of the timing and amount of deductions and allocations of income among various tax jurisdictions. We evaluate our exposures associated with our tax filing positions on a quarterly basis.
We record liabilities for unrecognized tax benefits related to uncertain tax positions. We do not believe any currently pending uncertain tax positions will have a material adverse effect on our consolidated financial statements, although an adverse resolution of one or more of these uncertain tax positions in any period may have a material impact on the results of operations for that period.
The following is a tabular reconciliation of the total amounts of unrecognized tax benefits (in millions):
| 2023 | 2022 | 2021 | ||||||||||||||||||
| Unrecognized tax benefits – January 1 | $ | $ | $ | |||||||||||||||||
| Additions to tax positions related to prior years | ||||||||||||||||||||
| Reductions to tax positions related to prior years | ( | ( | ( | |||||||||||||||||
| Additions to tax positions related to the current year | ||||||||||||||||||||
| Settlements | ( | ( | ( | |||||||||||||||||
| Lapse of statute of limitations | ( | ( | ( | |||||||||||||||||
| Foreign currency adjustments | ( | |||||||||||||||||||
| Unrecognized tax benefits – December 31 | $ | $ | $ | |||||||||||||||||
We recognize accrued interest and penalties related to unrecognized tax benefits as income tax expense. Related to the unrecognized tax benefits noted above, the cumulative amount of accrued interest and penalties as of December 31, 2023, 2022 and 2021 was $9.6 million, $6.7 million and $11.8 million, respectively. We accrued interest and penalties of $2.8 million, $(1.1 ) million, and $(2.5 ) million for the years ended December 31, 2023, 2022, and 2021, respectively. The total unrecognized tax benefits and interest and penalties of $94.3 million as of December 31, 2023 was partially offset by deferred tax assets of $17.8 million and prepaid taxes of $2.7 million, for a net amount of $73.8 million.
As of December 31, 2023, based on the expected outcome of certain examinations or as a result of the expiration of statutes of limitation for certain jurisdictions, we believe that within the next twelve months it is reasonably possible that our previously unrecognized tax benefits could decrease by approximately $17.2 million. Substantially all such amounts will impact our effective income tax rate if recognized.
65
It is generally our intention to repatriate certain foreign earnings to the extent that such repatriations are not restricted by local laws or accounting rules, and there are no substantial incremental costs. The determination of the amount of the unrecognized deferred tax liability for foreign earnings that are indefinitely reinvested is not practicable to estimate.
8. STOCKHOLDERS' EQUITY
Bio-Rad’s issued and outstanding stock consists of Class A Common Stock (Class A) and Class B Common Stock (Class B). Each share of Class A and Class B common stock participates equally in the earnings and losses of Bio-Rad, and each share is identical to the next in all respects except as follows. Class A common stock has limited voting rights compared to Class B. Each share of Class A is entitled to one tenth of a vote on most matters, whereas each share of Class B is always entitled to one vote. Additionally, Class A stockholders are entitled to elect 25 % of the directors, with Class B stockholders electing the remaining directors. Cash dividends may be paid on Class A shares without paying a cash dividend on Class B shares. In contrast, no cash dividend may be paid on Class B shares unless at least an equal cash dividend is paid on Class A shares. Class B shares are convertible at any time into Class A shares on a one-for-one basis at the option of the stockholder. The founders of Bio-Rad, the Schwartz family, collectively hold a majority of Bio-Rad’s voting stock. As a result, the Schwartz family is able to exercise control over Bio-Rad.
Changes to Bio-Rad's issued common stock shares are as follows (in thousands):
| Class A Shares | Class B Shares | ||||||||||
| Balance at January 1, 2021 | |||||||||||
| Class B to Class A conversions | ( | ||||||||||
| Issuance of common stock | |||||||||||
| Balance at December 31, 2021 | |||||||||||
| Class B to Class A conversions | ( | ||||||||||
| Issuance of common stock | |||||||||||
| Balance at December 31, 2022 | |||||||||||
| Class B to Class A conversions | ( | ||||||||||
| Issuance of common stock | |||||||||||
| Balance at December 31, 2023 | |||||||||||
Treasury Shares
The share repurchase activity under the share repurchase programs through open market transactions for the years ended December 31, 2023, 2022 and 2021 are summarized as follows:
| Number of Shares Purchased | Weighted-Average Price per Share | Total Shares Repurchased To Date | Remaining Authorized Value (in millions) | |||||||||||
| March 1, 2021 - March 31, 2021 | $ | $ | ||||||||||||
| May 1, 2022 - May 31, 2022 | $ | $ | ||||||||||||
| November 1, 2022 - November 30, 2022 | $ | $ | ||||||||||||
| May 1, 2023 – May 31, 2023 | $ | $ | ||||||||||||
| September 1, 2023 – September 30, 2023 | $ | $ | ||||||||||||
| November 1, 2023 – November 30, 2023 | $ | $ | ||||||||||||
For the years ended December 31, 2023 and 2022, we used 160,811 and 135,744 , respectively, of the repurchased shares in connection with the vesting of restricted stock units and our Employee Stock Purchase Program. As of December 31, 2023, the Company had repurchased $650.0 million under the 2017 Share Repurchase Program,
66
which completed the level of authorized purchases under that share repurchase program. In July 2023, the board of directors authorized a new share repurchase program ("2023 Share Repurchase Program") granting the Company authority to repurchase, on a discretionary basis, up to $500 million of the outstanding shares of the Company's common stock. As of December 31, 2023, $278.7 million remained available for repurchases under the 2023 Share Repurchase Program.
9. ACCUMULATED OTHER COMPREHENSIVE INCOME (LOSS)
Accumulated other comprehensive income (loss) included in our consolidated balance sheets and consolidated statements of changes in stockholders' equity consists of the following components (in millions):
| Foreign currency translation adjustments | Foreign other post-employment benefits adjustments | Net unrealized holding gains (losses) on available-for-sale investments | Total Accumulated other comprehensive income (loss) | |||||||||||
| Balances as of January 1, 2022 | $ | ( | $ | ( | $ | $ | ( | |||||||
| Other comprehensive (loss) income, before reclassifications | ( | ( | ( | |||||||||||
| Amounts reclassified from accumulated other comprehensive income (loss) | ||||||||||||||
| Income tax effects | ( | |||||||||||||
| Other comprehensive income (loss), net of income taxes | ( | ( | ( | |||||||||||
| Balances as of December 31, 2022 | $ | ( | $ | $ | ( | $ | ( | |||||||
| Other comprehensive income (loss), before reclassifications | ( | |||||||||||||
| Amounts reclassified from accumulated other comprehensive income (loss) | ||||||||||||||
| Income tax effects | ( | ( | ( | ( | ||||||||||
| Other comprehensive income (loss), net of income taxes | ( | |||||||||||||
| Balances as of December 31, 2023 | $ | ( | $ | ( | $ | $ | ( | |||||||
All amounts reclassified out of accumulated other comprehensive income (loss) were reclassified into Other income, net in the consolidated statements of income (loss). Reclassification adjustments are calculated using the specific identification method.
10. SHARE-BASED COMPENSATION/EQUITY AWARDS AND PURCHASE PLANS
Equity Award Plan
The 2017 Incentive Award Plan (2017 Plan) authorizes the grant of stock options, restricted stock, restricted stock units, performance-based stock units and other types of equity awards to officers and certain other employees. Stock options are granted at exercise prices not less than the fair market value of the underlying common stock on the date of grant and have a maximum term of 10 years. We may issue stock options for either Class A or Class B common stock. Prior to September 2020, equity awards granted vest in increments of 20 % per year on the yearly anniversary date of the grant. Starting in September 2020, equity awards granted vest in increments of 25 % per year on the yearly anniversary date of the grant.
67
A total of 2,108,724 shares have been reserved for issuance of equity awards under the 2017 Plan and may be of either Class A or Class B common stock. At December 31, 2023, there were 1,112,483 shares available to be granted.
Performance-based Stock awards
Bio-Rad grants certain executive officers Performance-based stock unit (PSU) awards, which are administered under the 2017 Plan. PSUs generally vest over a three-year performance period based on achievement of specific performance goals. Based on the extent to which the targets are achieved, vested shares may range from zero to 200 percent of the target award.
We consider the dilutive impact of PSUs in our diluted net income per share calculation only to the extent that the performance conditions would have been met if the reporting period was the end of the performance period.
Employee Stock Purchase Plans
Our 2011 Employee Stock Purchase Plan ("2011 ESPP" or "ESPP") provides that eligible employees may contribute up to the greater of 10 % of their compensation or $25,000 annually towards the quarterly purchase of our Class A common stock. The employees’ purchase price is 85 % of the lesser of the fair market value of the stock on the first business day or the last business day of each calendar quarter. The Board of Directors have authorized the sale of 1,300,000 shares of Class A common stock under the 2011 ESPP.
Share-Based Compensation
Included in our share-based compensation expense is the cost related to stock option grants, ESPP stock purchases and restricted stock unit awards, including performance-based stock awards. Share-based compensation expense is allocated in the consolidated statements of income (loss) as follows (in millions):
| Year ended December 31, | ||||||||||||||||||||
| 2023 | 2022 | 2021 | ||||||||||||||||||
| Cost of goods sold | $ | $ | $ | |||||||||||||||||
| Selling, general and administrative expense | ||||||||||||||||||||
| Research and development expense | ||||||||||||||||||||
| Share-based compensation expense | $ | $ | $ | |||||||||||||||||
The income tax benefit related to share-based compensation expense was $9.8 million, $8.8 million and $7.4 million for the years ended December 31, 2023, 2022 and 2021, respectively. We did not capitalize any share-based compensation expense as it was immaterial.
The tax benefit from equity awards vested or exercised during the years ended December 31, 2023, 2022 and 2021 was $1.3 million, $4.0 million and $18.5 million, respectively.
For equity awards, we amortize the grant date fair value on a straight-line basis over the requisite service periods of the awards, which are generally the vesting periods. We recognize forfeitures as they occur.
Stock Options
No stock options were granted during the years ended December 31, 2023 and 2022. The weighted-average fair value of stock options granted was estimated using a Black-Scholes option-pricing model with the following weighted-average assumptions for the year ended December 31, 2021:
68
| Year Ended December 31, | ||||||||
| 2021 | ||||||||
| Expected volatility | % | |||||||
| Risk-free interest rate | % | |||||||
| Expected life (in years) | ||||||||
| Expected dividend | ||||||||
| Weighted-average fair value of options granted | $ | |||||||
Expected volatility is based on the historical volatilities of our common stock for a period equal to the stock option’s expected life. The risk-free interest rate is based on the U.S. Treasury yield curve in effect at the time of the grant. The expected life represents the number of years that we estimate, based primarily on historical experience, that the options will be outstanding prior to exercise. We do not anticipate paying any cash dividends in the future and therefore use an expected dividend yield of zero .
The following table summarizes stock option activity:
| Shares | Weighted- Average Exercise Price | Weighted- Average Remaining Contractual Term (in years) | Aggregate Intrinsic Value (in millions) | |||||||||||||||||||||||
| Outstanding, January 1, 2023 | $ | |||||||||||||||||||||||||
| Granted | $ | |||||||||||||||||||||||||
| Exercised | ( | $ | ||||||||||||||||||||||||
| Forfeited | ( | $ | ||||||||||||||||||||||||
| Outstanding, December 31, 2023 | $ | $ | ||||||||||||||||||||||||
| Unvested, December 31, 2023 | $ | $ | ||||||||||||||||||||||||
| Exercisable, December 31, 2023 | $ | $ | ||||||||||||||||||||||||
Intrinsic value for stock options is defined as the difference between the current market value and the exercise price. The total intrinsic value on the date of exercise of stock options exercised during the years ended December 31, 2023, 2022 and 2021 was $20.2 million, $15.2 million and $33.0 million, respectively.
As of December 31, 2023, there was $2.1 million of total unrecognized compensation expense from stock options. This amount is expected to be recognized in the future over a remaining weighted-average period of approximately one year .
69
Restricted Stock Units - Service & Performance-based
Restricted stock units are rights to receive shares of company stock. The fair value of a restricted stock unit is the market value as determined by the closing price of the stock on the day of grant.
The following tables summarize restricted stock units and performance-based stock units activity:
Restricted Stock Units | Weighted- Average Grant-Date Fair Value | Weighted-Average Remaining Contractual Term (in years) | Aggregate Intrinsic Value (in millions) | |||||||||||||||||||||||
| Outstanding, January 1, 2023 | $ | |||||||||||||||||||||||||
| Granted | $ | |||||||||||||||||||||||||
| Vested | ( | $ | ||||||||||||||||||||||||
| Forfeited | ( | $ | ||||||||||||||||||||||||
| Outstanding, December 31, 2023 | $ | $ | ||||||||||||||||||||||||
Performance-based Stock Units | Weighted- Average Grant-Date Fair Value | Weighted-Average Remaining Contractual Term (in years) | Aggregate Intrinsic Value (in millions) | |||||||||||||||||||||||
| Outstanding, January 1, 2023 | $ | |||||||||||||||||||||||||
| Granted | $ | |||||||||||||||||||||||||
| Vested | $ | |||||||||||||||||||||||||
| Forfeited | ( | $ | ||||||||||||||||||||||||
| Outstanding, December 31, 2023 | $ | $ | ||||||||||||||||||||||||
The total fair value of restricted stock units and performance-based stock units vested for the years ended December 31, 2023, 2022 and 2021 was $44.7 million, $54.5 million and $104.4 million, respectively. As of December 31, 2023, there was approximately $138.1 million of total unrecognized compensation expense related to restricted stock units. This amount is expected to be recognized over a remaining weighted-average period of approximately three years .
Employee Stock Purchase Plans
The fair value of the employees’ purchase rights under the 2011 ESPP was estimated using a Black-Scholes model with the following weighted-average assumptions:
| Year Ended December 31, | |||||||||||||||||
| 2023 | 2022 | 2021 | |||||||||||||||
| Expected volatility | % | % | % | ||||||||||||||
| Risk-free interest rate | % | % | % | ||||||||||||||
| Expected life (in years) | |||||||||||||||||
| Expected dividend | |||||||||||||||||
| Weighted-average fair value | |||||||||||||||||
| of purchase rights | $ | $ | $ | ||||||||||||||
70
The assumptions are primarily based on historical data. Volatility is based on the historical volatilities of our common stock for a period equal to the expected life of the purchase rights. The risk-free interest rate is based on the U.S. Treasury yield curve in effect at the time of the grant. We do not anticipate paying any cash dividends in the future and therefore use an expected dividend yield of zero .
We sold 56,985 shares for total employee contributions of $17.8 million, 44,480 shares for total employee contributions of $17.6 million and 31,639 shares for total employee contributions of $17.0 million under the 2011 ESPP to employees for the years ended December 31, 2023, 2022 and 2021, respectively. At December 31, 2023, 418,879 shares remain authorized and available for issuance under the 2011 ESPP.
11. OTHER INCOME, NET
Other income, net includes the following components (in millions):
| Year Ended December 31, | ||||||||||||||||||||
| 2023 | 2022 | 2021 | ||||||||||||||||||
| Interest and investment income | $ | ( | $ | ( | $ | ( | ||||||||||||||
| Net realized gains on investments | ( | ( | ( | |||||||||||||||||
| Other-than-temporary impairment losses on investments | ||||||||||||||||||||
| Current expected credit losses on loans to equity method investees | ||||||||||||||||||||
| Gain on divestiture of a division | ( | |||||||||||||||||||
Escrow receipts on prior acquisition | ( | |||||||||||||||||||
Other income | ( | ( | ( | |||||||||||||||||
Other income, net | $ | ( | $ | ( | $ | ( | ||||||||||||||
71
12. SUPPLEMENTAL CASH FLOW INFORMATION
The reconciliation of net income (loss) to net cash provided by operating activities is as follows (in millions):
| Year Ended December 31, | ||||||||||||||||||||
| 2023 | 2022 | 2021 | ||||||||||||||||||
| Net income (loss) | $ | ( | $ | ( | $ | |||||||||||||||
| Adjustments to reconcile net income (loss) | ||||||||||||||||||||
| to net cash provided by operating activities | ||||||||||||||||||||
| Depreciation and amortization | ||||||||||||||||||||
| Reduction in the carrying amount of right-of-use assets | ||||||||||||||||||||
| Share-based compensation | ||||||||||||||||||||
| Other-than-temporary impairment losses on investments | ||||||||||||||||||||
| Current expected credit losses on loans | ||||||||||||||||||||
| (Gains) losses from change in fair market value of equity securities and loan receivable | ( | |||||||||||||||||||
| Gain on divestiture of a division | ( | ( | ||||||||||||||||||
| Payments for operating lease liabilities | ( | ( | ( | |||||||||||||||||
| Changes in fair value of contingent consideration | ( | |||||||||||||||||||
| (Increase) decrease in accounts receivable | ( | ( | ||||||||||||||||||
| (Increase) decrease in inventories | ( | ( | ||||||||||||||||||
| (Increase) decrease in other current assets | ( | ( | ||||||||||||||||||
| Increase (decrease) in accounts payable and other current liabilities | ( | ( | ||||||||||||||||||
| Decrease in income taxes payable | ( | ( | ( | |||||||||||||||||
| Increase (decrease) in deferred income taxes | ( | ( | ||||||||||||||||||
| Increase in other long-term assets | ( | ( | ( | |||||||||||||||||
| Increase (decrease) in other long-term liabilities | ( | |||||||||||||||||||
| Other | ||||||||||||||||||||
| Net cash provided by operating activities | $ | $ | $ | |||||||||||||||||
| Non-cash investing activities: | ||||||||||||||||||||
| Purchased property, plant and equipment | $ | $ | $ | |||||||||||||||||
| Purchased marketable securities and investments | $ | $ | $ | |||||||||||||||||
72
13. COMMITMENTS AND CONTINGENT LIABILITIES
Deferred Profit Sharing Retirement Plan
We have a profit sharing plan covering substantially all U.S. employees. Contributions are made at the discretion of management. As of December 31, 2023 and 2022, the liability related to the U.S. profit sharing plan was $1.9 million and $1.2 million, respectively. The contribution expense was $20.2 million, $19.1 million and $18.4 million for the years ended December 31, 2023, 2022 and 2021, respectively.
Purchase Obligations
As of December 31, 2023, we had purchase obligations that have not been recognized on our balance sheet of $122.6 million, which include agreements to purchase goods or services that are enforceable and legally binding to Bio-Rad and that specify all significant terms and exclude agreements that are cancelable without penalty. Recognition of purchase obligations occurs when products or services are delivered to Bio-Rad, generally within Accounts payable or Other current liabilities.
The annual future fixed and determinable portion of our purchase obligations that have not been recognized on our balance sheet as of December 31, 2023 were as follows in millions:
| 2024 | $ | ||||
| 2025 | |||||
| 2026 | |||||
| 2027 | |||||
| 2028 | |||||
2029 and thereafter | |||||
Long-Term Liabilities
As of December 31, 2023, we had obligations that have been recognized on our balance sheet of $121.7 million, which primarily represent long-term deferred revenue and other post-employment benefits. Excluded are tax liabilities for uncertain tax positions and contingencies. We are not able to reasonably estimate the timing of future cash flows of these tax liabilities, therefore, our income tax obligations are excluded.
The annual future fixed and determinable portion of our obligations that have been recognized on our balance sheet as of December 31, 2023 were as follows in millions:
| 2024 | $ | ||||
| 2025 | |||||
| 2026 | |||||
| 2027 | |||||
| 2028 | |||||
2029 and thereafter | |||||
Letters of Credit/Guarantees
In the ordinary course of business, we are at times required to post letters of credit/guarantees. The letters of credit/guarantees are issued by financial institutions to guarantee our obligations to various parties. We were contingently liable for $4.3 million of standby letters of credit/guarantees with financial institutions as of December 31, 2023.
73
Other Post-Employment Benefits
In several foreign locations we are statutorily required to provide retirement benefits or a lump sum termination indemnity to our employees upon termination for virtually any reason. These plans are accounted for as defined benefit plans and the associated net benefit obligation as of December 31, 2023 and 2022 of $62.2 million and $46.8 million, respectively, has been included in Accrued payroll and employee benefits and Other long-term liabilities in the Consolidated Balance Sheets. Most plans are not required to be funded, and as such, there is no trust or other device used to accumulate assets or settle these obligations. However, some of these plans require funding based on local laws in which there is a trust or other device administered by an external plan manager that is used to accumulate assets to assist in settling these obligations. The following disclosures include such plans, which are located in France, Switzerland, Germany, Korea, India, Thailand, Italy, Dubai and Japan.
Obligations and Funded Status
The following table sets forth the change in benefit obligations, fair value of plan assets and amounts recognized in the Consolidated Balance Sheets for the plans (in millions):
74
| Change in benefit obligation: | 2023 | 2022 | ||||||
| Benefit obligation at beginning of year | $ | $ | ||||||
| Service cost | ||||||||
| Interest cost | ||||||||
| Plan participants' contributions | ||||||||
| Actuarial (gain) loss | ( | |||||||
| Gross benefits paid | ( | |||||||
| Plan amendments | ( | ( | ||||||
Acquisitions | ||||||||
| Settlements | ( | ( | ||||||
| Foreign currency adjustments | ( | |||||||
| Benefit obligation at end of year | ||||||||
| Change in plan assets: | ||||||||
| Fair value of plan assets at beginning year | ||||||||
| Actual return on plan assets | ||||||||
| Employer contributions | ||||||||
| Plan participants' contributions | ||||||||
| Gross benefits paid | ||||||||
Acquisitions | ||||||||
| Settlements | ( | ( | ||||||
| Foreign currency adjustments | ( | |||||||
| Fair value of plan assets at end of year | ||||||||
| Underfunded status of plans | ( | ( | ||||||
| Amounts recognized in the consolidated balance sheets: | ||||||||
| Current liabilities (Accrued payroll and employee benefits) | ( | ( | ||||||
| Noncurrent liabilities (Other long-term liabilities) | ( | ( | ||||||
| Net liability, end of fiscal year | $ | ( | $ | ( | ||||
Components of Net Periodic Benefit Cost
The following sets forth the net periodic benefit cost (income) for the periods indicated (in millions):
| 2023 | 2022 | 2021 | |||||||||
| Service costs | $ | $ | $ | ||||||||
| Interest costs | |||||||||||
| ( | ( | ( | |||||||||
| Amortization of actuarial losses | ( | ||||||||||
| Amortization of prior service costs | ( | ( | |||||||||
| Curtailments | ( | ||||||||||
| Settlements | ( | ||||||||||
| Net periodic benefit costs | $ | $ | $ | ||||||||
75
Assumptions
The above actuarial net gains were primarily based on financial, demographic and experience assumptions.
The weighted-average assumptions used in computing the benefit obligations were as follows:
| 2023 | 2022 | |||||||
| Discount rate | % | % | ||||||
| Compensation rate increase | % | % | ||||||
The weighted-average assumptions used in computing the net periodic benefit costs were as follows:
| 2023 | 2022 | 2021 | |||||||||
| Discount rate | % | % | % | ||||||||
| Expected long-term rate of return on plan assets | % | % | % | ||||||||
The accumulated benefit obligation (ABO), an estimate based on the assumption if these plans were to be terminated immediately, as of December 31, 2023 and 2022 was $114.8 million and $114.9 million, respectively. The ABO and fair value of plan assets for these plans with ABO in excess of plan assets were $22.6 million and $32.5 million as of December 31, 2023 and 2022, respectively.
In some foreign locations we have service award plans that are paid based upon the number of years of employment. Under these plans, the liability as of December 31, 2023 and 2022 was $2.4 million and $2.5 million, respectively, and has been included in Accrued payroll and employee benefits and Other long-term liabilities in the Consolidated Balance Sheets.
Concentrations of Labor Subject to Collective Bargaining Agreements
14. LEGAL PROCEEDINGS
15. SEGMENT INFORMATION
Bio-Rad is a multinational manufacturer and worldwide distributor of its own life science research products and clinical diagnostics products. We have two reportable segments: Life Science and Clinical Diagnostics. These reportable segments are strategic business lines that offer more than 12,000 different products and services and require different marketing strategies. We do not disclose quantitative information about our different products and services as it is impractical to do so based primarily on the numerous products and services that we sell and the global markets that we serve.
76
The Life Science segment develops, manufactures, and markets instruments, systems, reagents, and consumables used for biological research, biopharmaceutical production processes and food testing regimes. These products are sold to universities and medical schools, industrial research organizations, government agencies, pharmaceutical manufacturers, biotechnology researchers, food producers and food testing laboratories.
The Clinical Diagnostics segment designs, manufactures, markets and supports test systems, informatics systems, test kits and specialized quality controls that serve clinical laboratories in the global diagnostics market. These products are primarily sold to hospital laboratories, diagnostic reference laboratories, transfusion laboratories, and physician office laboratories.
Other Operations represent a small miscellaneous operation from a prior acquisition, which was sold during 2023 with no material impact on the consolidated statements of income (loss).
Segment results are presented in the same manner as we present our operations internally to make operating decisions and assess performance. The accounting policies of the segments are the same as those described in Significant Accounting Policies (see Note 1). Our chief operating decision maker ("CODM") views all operating expenses including depreciation and amortization and corporate overhead as directly supporting the strategies of our segments and these costs are fully allocated to our reportable segments. The CODM evaluates the performance of our segments and allocates resources primarily based on operating income, which represents revenues reduced by product costs and operating expenses.
Information regarding industry segments at December 31, 2023, 2022, and 2021 and for the years then ended is as follows (in millions):
| Life Science | Clinical Diagnostics | Other Operations | |||||||||||||||||||||
| Net sales | 2023 | $ | $ | $ | |||||||||||||||||||
| 2022 | |||||||||||||||||||||||
| 2021 | |||||||||||||||||||||||
| Depreciation and amortization | 2023 | $ | $ | $ | |||||||||||||||||||
| 2022 | |||||||||||||||||||||||
| 2021 | |||||||||||||||||||||||
| Operating profit (loss) | 2023 | $ | $ | $ | ( | ||||||||||||||||||
| 2022 | ( | ||||||||||||||||||||||
| 2021 | ( | ||||||||||||||||||||||
| Segment assets | 2023 | $ | $ | $ | |||||||||||||||||||
| 2022 | |||||||||||||||||||||||
| 2021 | |||||||||||||||||||||||
77
The following reconciles total operating profit to consolidated income (loss) before income taxes (in millions):
| Year Ended December 31, | |||||||||||||||||
| 2023 | 2022 | 2021 | |||||||||||||||
| Total operating profit | $ | $ | $ | ||||||||||||||
| Interest expense | ( | ( | ( | ||||||||||||||
| Foreign currency exchange gains (losses), net | ( | ||||||||||||||||
| Gains (losses) from change in fair market value of equity securities and loan receivable | ( | ( | |||||||||||||||
| Other income, net | |||||||||||||||||
| Consolidated income (loss) before income taxes | $ | ( | $ | ( | $ | ||||||||||||
The following reconciles total segment assets to consolidated total assets (in millions):
| December 31, | ||||||||||||||
| 2023 | 2022 | |||||||||||||
| Total segment assets | $ | $ | ||||||||||||
| Cash, short-term investments and other current assets | ||||||||||||||
| Property, plant and equipment, net, and operating lease right-of-use assets | ||||||||||||||
| Goodwill, net | ||||||||||||||
| Other long-term assets | ||||||||||||||
| Total assets | $ | $ | ||||||||||||
The following presents net sales to external customers by geographic region based primarily on the location of the use of the product or service (in millions):
| Year Ended December 31, | ||||||||||||||||||||
| 2023 | 2022 | 2021 | ||||||||||||||||||
| United States | $ | $ | $ | |||||||||||||||||
| Europe | ||||||||||||||||||||
| Asia | ||||||||||||||||||||
| Other (primarily Canada and Latin America) | ||||||||||||||||||||
| Total net sales | $ | $ | $ | |||||||||||||||||
The following presents Property, plant and equipment, net, Operating lease right-of-use assets and Other assets, excluding deferred income taxes, by geographic region based upon the location of the asset (in millions):
| December 31, | ||||||||||||||
| 2023 | 2022 | |||||||||||||
| United States | $ | $ | ||||||||||||
| Europe | ||||||||||||||
| Asia | ||||||||||||||
| Other (primarily Canada and Latin America) | ||||||||||||||
| Total Property, plant and equipment, net, Operating lease right-of-use assets and Other assets, excluding deferred income taxes | $ | $ | ||||||||||||
78
16. RESTRUCTURING COSTS
In February 2021, we announced our strategy-driven restructuring plan in furtherance of our ongoing program to improve operating performance. The restructuring plan primarily impacted our operations in EMEA and included the elimination of certain positions, the consolidation of certain functions, and the relocation of certain manufacturing operations from EMEA to APAC. The restructuring plan was implemented in phases and is substantially complete as of December 31, 2023. The timing of the remaining employee termination benefit payments is in accordance with statutory requirements. The adjustments to expense recorded were primarily due to changes in the estimates of employee termination benefits. From February 2021 to December 31, 2023, total restructuring-related expenses were $70.7 million.
The following table summarizes the activity of our February 2021 plan restructuring reserves (in millions):
| 2023 | 2022 | |||||||||||||||||||||||||||||||||||||
| Life Science | Clinical Diagnostics | Total | Life Science | Clinical Diagnostics | Total | |||||||||||||||||||||||||||||||||
| Balances as of January 1 | $ | $ | $ | $ | $ | $ | ||||||||||||||||||||||||||||||||
| Adjustment to expense | ||||||||||||||||||||||||||||||||||||||
| Cash payments | ( | ( | ( | ( | ( | ( | ||||||||||||||||||||||||||||||||
| Foreign currency adjustments | ( | ( | ( | |||||||||||||||||||||||||||||||||||
| Balances as of December 31 | $ | $ | $ | $ | $ | $ | ||||||||||||||||||||||||||||||||
Management approved three new restructuring plans in February 2023, June 2023, and October 2023 to implement identified opportunities to further streamline and improve operating performance.
Our February 2023 plan was implemented in phases and is substantially complete as of December 31, 2023. The timing of the remaining employee termination benefit payments is in accordance with statutory requirements. From February 2023 to December 31, 2023, total restructuring-related expenses were $14.2 million, representing estimated termination benefits to employees.
The following table summarizes the activity of our February 2023 plan restructuring reserves (in millions):
| Life Science | Clinical Diagnostics | Total | ||||||||||||||||||
Balances as of January 1, 2023 | $ | $ | $ | |||||||||||||||||
| Charged to expense - employee termination benefits | ||||||||||||||||||||
| Cash payments | ( | ( | ( | |||||||||||||||||
| Foreign currency adjustments | ||||||||||||||||||||
Balances as of December 31, 2023 | $ | $ | $ | |||||||||||||||||
Our June 2023 restructuring plan is substantially complete as of December 31, 2023. The timing of the remaining employee termination benefit payments is in accordance with statutory requirements. From June 2023 to December 31, 2023, total restructuring-related expenses were $8.1 million, representing estimated termination benefits to employees.
The following table summarizes the activity of our June 2023 plan restructuring reserves (in millions):
79
| Life Science | Clinical Diagnostics | Total | ||||||||||||||||||
Balances as of January 1, 2023 | $ | $ | $ | |||||||||||||||||
| Charged to expense - employee termination benefits | ||||||||||||||||||||
| Cash payments | ( | ( | ( | |||||||||||||||||
| Foreign currency adjustments | ||||||||||||||||||||
Balances as of December 31, 2023 | $ | $ | $ | |||||||||||||||||
Our October 2023 restructuring plan is expected to be substantially complete in early 2024. From October 2023 to December 31, 2023, total restructuring-related expenses were $3.5 million, representing estimated termination benefits to employees.
The following table summarizes the activity of our October 2023 plan restructuring reserves (in millions):
| Life Science | Clinical Diagnostics | Total | ||||||||||||||||||
Balances as of January 1, 2023 | $ | $ | $ | |||||||||||||||||
| Charged to expense - employee termination benefits | ||||||||||||||||||||
| Cash payments | ( | ( | ( | |||||||||||||||||
| Foreign currency adjustments | ||||||||||||||||||||
Balances as of December 31, 2023 | $ | $ | $ | |||||||||||||||||
Combined, the liability of $23.8 million as of December 31, 2023 consisted of $22.9 million recorded in Accrued payroll and employee benefits and $0.9 million recorded in Other long-term liabilities in the consolidated balance sheets. Restructuring-related expense is allocated in the consolidated statements of income (loss) as follows (in millions):
| Year ended December 31, | ||||||||||||||||||||
| 2023 | 2022 | 2021 | ||||||||||||||||||
| Cost of goods sold | $ | $ | $ | |||||||||||||||||
| Selling, general and administrative expense | ||||||||||||||||||||
| Research and development expense | ||||||||||||||||||||
Restructuring expense | $ | $ | $ | |||||||||||||||||
17. LEASES
We have operating leases and to a lesser extent finance leases, for buildings, vehicles and equipment. Our leases have remaining lease terms of 1 year to 15 years, which includes our determination to exercise renewal options.
The components of lease expense were as follows (in millions):
80
| Year Ended December 31, | |||||||||||
| 2023 | 2022 | 2021 | |||||||||
| Operating lease cost | $ | $ | $ | ||||||||
| Finance lease cost: | |||||||||||
| Amortization of right-to-use assets | $ | $ | $ | ||||||||
| Interest on lease liabilities | |||||||||||
| Total finance lease cost | $ | $ | $ | ||||||||
Operating lease cost includes original reduction in the carrying amount of right-of-use assets, the impact of remeasurements, modifications, impairments and abandonments.
Our short-term leases are expensed as incurred, reflecting leases with a lease term of one year or less, and are not significant for the years ended December 31, 2023, 2022 and 2021. Operating lease variable cost is primarily comprised of reimbursed actual common area maintenance, property taxes and insurance, which are immaterial for the years ended December 31, 2023, 2022 and 2021.
Supplemental cash flow information related to leases were as follows (in millions):
| Year Ended December 31, | |||||||||||
| 2023 | 2022 | 2021 | |||||||||
| Cash paid for amounts included in the measurement of lease liabilities: | |||||||||||
| Operating cash flows from operating leases | $ | $ | $ | ||||||||
| Operating cash flows from finance leases | $ | $ | $ | ||||||||
| Financing cash flows from finance leases | $ | $ | $ | ||||||||
| Right-of-use assets obtained in exchange for lease obligations: | |||||||||||
| Operating leases | $ | $ | $ | ||||||||
| Finance leases | $ | $ | $ | ||||||||
Supplemental balance sheet information related to leases were as follows (in millions):
| December 31, | ||||||||
| 2023 | 2022 | |||||||
| Operating Leases | ||||||||
| Operating lease right-of-use assets | $ | $ | ||||||
| Current operating lease liabilities | $ | $ | ||||||
| Operating lease liabilities | ||||||||
| Total operating lease liabilities | $ | $ | ||||||
Finance leases are included in Property, plant and equipment, Current maturities of long-term debt, and Long-term debt and notes payable, net of current maturities.
81
| December 31, | ||||||||
2023 | 2022 | |||||||
| Finance Leases | ||||||||
| Property, plant and equipment, gross | $ | $ | ||||||
| Less: accumulated depreciation and amortization | ( | ( | ||||||
| $ | $ | |||||||
| $ | $ | |||||||
| Total finance lease liabilities | $ | $ | ||||||
| December 31, | ||||||||
| 2023 | 2022 | |||||||
| Weighted Average Remaining Lease Term | ||||||||
| Operating leases - in years | ||||||||
| Finance leases - in years | ||||||||
| Weighted Average Discount Rate | ||||||||
| Operating leases | % | % | ||||||
| Finance leases | % | % | ||||||
Maturities of lease liabilities were as follows (in millions):
| Year Ending December 31, | Operating Leases | Finance Leases | |||||||||
2024 | $ | $ | |||||||||
2025 | |||||||||||
2026 | |||||||||||
2027 | |||||||||||
2028 | |||||||||||
| Thereafter | |||||||||||
| Total lease payments | |||||||||||
| Less imputed interest | ( | ( | |||||||||
| Total | $ | $ | |||||||||
The value of our operating lease portfolio is principally for facilities with longer durations than the lesser value vehicles and other equipment with shorter terms and higher-turn over.
As of December 31, 2023, operating leases that have not commenced are not material.
18. QUARTERLY FINANCIAL DATA (UNAUDITED)
The following tables provide unaudited condensed consolidated quarterly financial data for all of the periods in the years ended December 31, 2023 and 2022.
Summarized quarterly financial data for the years ended December 31, 2023 and 2022 are as follows (in millions, except per share data):
82
| First Quarter | Second Quarter | Third Quarter | Fourth Quarter | |||||||||||||||||||||||
| 2023 | ||||||||||||||||||||||||||
| Net sales | $ | $ | $ | $ | ||||||||||||||||||||||
| Gross profit | ||||||||||||||||||||||||||
| Net income (loss) | ( | |||||||||||||||||||||||||
| Basic earnings (loss) per share | ( | |||||||||||||||||||||||||
| Diluted earnings (loss) per share | ( | |||||||||||||||||||||||||
| 2022 | ||||||||||||||||||||||||||
| Net sales | $ | $ | $ | $ | ||||||||||||||||||||||
| Gross profit | ||||||||||||||||||||||||||
Net income (loss) | ( | ( | ( | |||||||||||||||||||||||
| Basic earnings (loss) per share | ( | ( | ( | |||||||||||||||||||||||
| Diluted earnings (loss) per share | ( | ( | ( | |||||||||||||||||||||||
19. SUBSEQUENT EVENTS
ITEM 9. CHANGES IN AND DISAGREEMENTS WITH ACCOUNTANTS ON ACCOUNTING AND FINANCIAL DISCLOSURE
Not applicable.
ITEM 9A. CONTROLS AND PROCEDURES
(a)Evaluation of Disclosure Controls and Procedures
We maintain “disclosure controls and procedures”, as such term is defined in Rules 13a-15(e) and 15d-15(e) under the Securities Exchange Act of 1934, as amended (“Exchange Act”), that are designed to ensure that information required to be disclosed by us in reports that we file or submit under the Exchange Act is recorded, processed, summarized, and reported within the time periods specified in Securities and Exchange Commission rules and forms, and that such information is accumulated and communicated to our management, including our Chief Executive Officer ("CEO") and Chief Financial Officer ("CFO"), as appropriate, to allow for timely decisions regarding required disclosure. In designing and evaluating our disclosure controls and procedures, management recognized that disclosure controls and procedures, no matter how well conceived and operated, can provide only reasonable, not absolute, assurance that the objectives of the disclosure controls and procedures are met. Additionally, in designing disclosure controls and procedures, our management necessarily was required to apply its judgment in evaluating the cost-benefit relationship of possible disclosure controls and procedures. The design of any disclosure controls and procedures also is based in part upon certain assumptions about the likelihood of future events, and there can be no assurance that any design will succeed in achieving its stated goals under all potential future conditions.
83
Subject to the limitations noted above, our management, with the participation of our CEO and CFO, has evaluated the effectiveness of the design and operation of our disclosure controls and procedures as of the end of the year covered by this Annual Report on Form 10-K. Based on that evaluation, our CEO and CFO concluded that our disclosure controls and procedures were effective to meet the objective for which they were designed and operate at the reasonable assurance level.
(b) Management’s Report on Internal Control Over Financial Reporting
Our management is responsible for establishing and maintaining adequate internal control over financial reporting for the Company as defined in Rule 13a-15(f) or 15(d)-15(f) of the Exchange Act. Our internal control over financial reporting is a process designed to provide reasonable assurance regarding the reliability of financial reporting and the preparation of consolidated financial statements for external purposes in accordance with U.S. generally accepted accounting principles, and includes those policies and procedures that: (i) pertain to the maintenance of records that, in reasonable detail, accurately and fairly reflect the transactions and dispositions of the Company’s assets; (ii) provide reasonable assurance that transactions are recorded as necessary to permit preparation of consolidated financial statements in accordance with U.S. generally accepted accounting principles, and that our receipts and expenditures are being made only in accordance with authorizations of our management and directors; and (iii) provide reasonable assurance regarding prevention or timely detection of unauthorized acquisition, use or disposition of our assets that could have a material effect on our consolidated financial statements.
Our management assessed the effectiveness of the Company’s internal control over financial reporting as of December 31, 2023 using the criteria established in Internal Control - Integrated Framework (2013) issued by the Committee of Sponsoring Organizations of the Treadway Commission ("COSO"). Based on this assessment and those criteria, management concluded that our internal control over financial reporting was effective as of December 31, 2023. Our internal control over financial reporting has been audited by KPMG, LLP, an independent registered public accounting firm, as stated in their report, which appears in Part II, Item 8 of this Form 10-K.
(c) Changes in Internal Control over Financial Reporting
Management continuously reviews disclosure controls and procedures, and internal control over financial reporting, and accordingly may, from time to time, make changes aimed at enhancing their effectiveness to ensure that its systems evolve with its business. There were no changes in our internal controls over financial reporting (as defined in Rules 13a-15(f) and 15(d)-15(f) under the Exchange Act) during the quarter ended December 31, 2023 that have materially affected, or are reasonably likely to materially affect, our internal control over financial reporting.
(d) Inherent Limitations on Effectiveness of Internal Controls
Because of its inherent limitations, our internal control over financial reporting may not prevent or detect misstatements. Also, projections of any evaluation of effectiveness to future periods are subject to the risk that controls may become inadequate because of changes in conditions, or that the degree of compliance with the policies or procedures may deteriorate.
ITEM 9B. OTHER INFORMATION
During the three months ended December 31, 2023, no director or officer of the Company adopted or terminated a “Rule 10b5-1 trading arrangement” or “non-Rule 10b5-1 trading arrangement,” as each term is defined in Item 408(a) of Regulation S-K
ITEM 9C. DISCLOSURE REGARDING FOREIGN JURISDICTIONS THAT PREVENT INSPECTIONS
Not applicable.
84
PART III.
ITEM 10. DIRECTORS, EXECUTIVE OFFICERS AND CORPORATE GOVERNANCE
Part of the information required to be furnished pursuant to this item is incorporated by reference from portions of Bio-Rad’s definitive proxy statement to be mailed to stockholders in connection with our 2024 annual meeting of stockholders (the “2024 Proxy Statement”) under “Executive Officers,” “Election of Directors,” “Committees of the Board of Directors” and “Section 16(a) Beneficial Ownership Reporting Compliance.”
Bio-Rad’s Board of Directors has determined that each of Jeffrey L. Edwards, Gregory K. Hinckley and Melinda Litherland is an “audit committee financial expert,” as defined in Item 407(d)(5) of Regulation S-K. Each of Jeffrey L. Edwards, Gregory K. Hinckley and Melinda Litherland is also an “independent” director, as determined in accordance with the independence standards set forth in Rule 10A-3 under the Securities Exchange Act of 1934, as amended, and Section 303A.02 of the New York Stock Exchange (NYSE) Listed Company Manual.
We have adopted a code of business ethics and conduct that applies to our principal executive officer, principal financial officer, controller (or persons performing similar functions), all other employees and our directors. It is available through the Corporate Governance section of our website (www.bio-rad.com). We will also provide a copy of the code of ethics to any person, without charge, upon request, by writing to us at “Bio-Rad Laboratories, Inc., Investor Relations, 1000 Alfred Nobel Drive, Hercules, CA 94547.” We intend to satisfy any disclosure requirement under Item 5.05 of Form 8-K regarding an amendment to, or waiver from, a provision of the code of ethics by posting such information on the Corporate Governance section of our website (www.bio-rad.com) within four business days following the date of the amendment or waiver.
ITEM 11. EXECUTIVE COMPENSATION
The information required to be furnished pursuant to this item is incorporated by reference from portions of the 2024 Proxy Statement under “Compensation Discussion and Analysis,” “Summary Compensation Table,” “Grants of Plan-Based Awards,” “Outstanding Equity Awards at Fiscal Year-End,” “Option Exercises and Stock Vested Table,” “Pension Benefits,” “Nonqualified Deferred Compensation Plans,” “Potential Payments on Termination or Change in Control,” “Director Compensation,” “Compensation Committee Interlocks and Insider Participation” and "Pay Ratio Disclosure.” In addition, the information from a portion of the 2024 Proxy Statement under “Compensation Committee Report” is incorporated herein by reference and furnished on this Form 10-K and shall not be deemed “filed” for purposes of Section 18 of the Securities and Exchange Act of 1934, nor shall it be deemed incorporated by reference in any filing under the Securities Act of 1933.
ITEM 12. SECURITY OWNERSHIP OF CERTAIN BENEFICIAL OWNERS AND MANAGEMENT AND RELATED STOCKHOLDER MATTERS
Part of the information required to be furnished pursuant to this item is incorporated by reference from a portion of the 2024 Proxy Statement under “Principal and Management Stockholders.”
85
Equity Compensation Plan Information as of December 31, 2023 | ||||||||||||||||||||||||||
| Plan category | Number of securities to be issued upon exercise of outstanding options, warrants and rights | Weighted-average exercise price of outstanding options, warrants and rights | Number of securities remaining available for future issuance under equity compensation plans (excluding securities reflected in column (a)) | |||||||||||||||||||||||
| (a) | (b)(3) | (c) | ||||||||||||||||||||||||
Equity compensation plans approved by | ||||||||||||||||||||||||||
security holders (1) | 457,520 | $ | 410.50 | 1,531,362 | (2) | |||||||||||||||||||||
Equity compensation plans not approved by | ||||||||||||||||||||||||||
| security holders | — | — | — | |||||||||||||||||||||||
| Total | 457,520 | $ | 410.50 | 1,531,362 | ||||||||||||||||||||||
(1)Consists of the Bio-Rad Laboratories, Inc. 2007 Incentive Award Plan, the Bio-Rad Laboratories, Inc. 2017 Incentive Award Plan, and the Bio-Rad Laboratories, Inc. 2011 Employee Stock Purchase Plan.
(2)Consists of 1,112,483 shares available under the Bio-Rad Laboratories, Inc. 2017 Incentive Award Plan and 418,879 shares available under the Bio-Rad Laboratories, Inc. 2011 Employee Stock Purchase Plan.
(3)Excludes Restricted Stock Units and Performance Stock Units.
ITEM 13. CERTAIN RELATIONSHIPS AND RELATED TRANSACTIONS, AND DIRECTOR
INDEPENDENCE
The information required to be furnished pursuant to this item is incorporated by reference from portions of the 2024 Proxy Statement under “Transactions with Related Persons” and “Committees of the Board of Directors.”
ITEM 14. PRINCIPAL ACCOUNTANT FEES AND SERVICES
Our independent registered public accounting firm is "KPMG LLP , Santa Clara, CA , Auditor Firm ID: 185 "
The information required to be furnished by this item is incorporated by reference from a portion of the 2024 Proxy Statement under “Report of the Audit Committee of the Board of Directors.”
PART IV.
| ITEM 15. EXHIBITS AND FINANCIAL STATEMENT SCHEDULES | ||||||||
| (a)1 | Index to Financial Statements – See Item 8 of Part II of this report “Financial Statements and | |||||||
| 2 | Schedule II Valuation and Qualifying Accounts | |||||||
| All financial statement schedules are omitted because they are not required, or the required information is included in the consolidated financial statements or the notes thereto. | ||||||||
| 3. | Index to Exhibits | |||||||
| The exhibits listed below in the accompanying Index to Exhibits are filed or incorporated by reference as part of this report. | ||||||||
86
BIO-RAD LABORATORIES, INC. INDEX TO EXHIBITS ITEM 15(a)3 | |||||
Exhibit 32.1 is furnished herewith and should not be deemed to be “filed under the Securities Exchange Act of 1934.” | |||||
| Exhibit No. | |||||
| 3.1 | |||||
| 3.1.1 | |||||
| 3.2 | |||||
| 4.1 | |||||
| 4.2 | |||||
| 4.3 | |||||
| 4.4 | |||||
| 4.5 | |||||
| 10.1 | Credit Agreement, dated as of April 15, 2019, by and among Bio-Rad Laboratories, Inc., the lenders referred to therein, JPMorgan Chase Bank, N.A., as administrative agent, Bank of America, N.A., HSBC Bank USA National Association, and Mug Bank, Ltd., as co-syndication agents, and Citibank, N.A., and Wells Fargo Bank, N.A., National Association as co-documentation agents. (8) | ||||
| 10.1.1 | |||||
| 10.1.2 | |||||
| 10.1.3 | |||||
| 10.1.4 | |||||
| 10.2 | |||||
| 10.3 | |||||
87
10.3.1 | |||||
| 10.4 | |||||
| 10.5 | |||||
10.5.1 | |||||
10.5.2 | |||||
| 10.6 | |||||
10.6.1 | |||||
10.6.2 | |||||
10.6.3 | |||||
10.6.4 | |||||
10.6.5 | |||||
| 10.7 | |||||
| 10.8 | |||||
| 10.9 | |||||
| 10.10 | |||||
| 21.1 | |||||
| 23.1 | |||||
| 31.1 | |||||
| 32.1 | |||||
| 97 | |||||
| 101.INS | The instance document does not appear in the interactive data file because its XBRL tags are embedded within the inline XBRL document. | ||||
| 101.SCH | Inline XBRL Taxonomy Extension Schema Document | ||||
| 101.CAL | Inline XBRL Taxonomy Extension Calculation Linkbase Document | ||||
88
| 101.DEF | Inline XBRL Taxonomy Extension Definition Linkbase Document | ||||
| 101.LAB | Inline XBRL Taxonomy Extension Labels Linkbase Document | ||||
| 101.PRE | Inline XBRL Taxonomy Extension Presentation Linkbase Document | ||||
| 104 | The cover page Interactive Data File is formatted in Inline XBRL and is contained in Exhibits 101 | ||||
| (1) | Incorporated by reference to Exhibits to Bio-Rad’s Form 10-K filing for the fiscal year ended December 31, 2010. | ||||
| (2) | Incorporated by reference to Exhibit 3.1 to Bio-Rad’s Form 8-K filed on October 27, 2017. | ||||
| (3) | Incorporated by reference to Exhibit 4.1 to Bio-Rad’s Form 10-K filing for the fiscal year ended December 31, 2019. | ||||
| (4) | Incorporated by reference to Exhibit 4.1 to Bio-Rad’s Form 8-K filed on March 2, 2022 | ||||
| (5) | Incorporated by reference to Exhibit 4.2 to Bio-Rad’s Form 8-K filed on March 2, 2022. | ||||
| (6) | Incorporated by reference to Exhibit 4.3 to Bio-Rad’s Form 8-K filed on March 2, 2022. | ||||
| (7) | Incorporated by reference to Exhibit 4.4 to Bio-Rad’s Form 8-K filed on March 2, 2022. | ||||
| (8) | Incorporated by reference to Exhibit 10.1 to Bio-Rad’s Form 8-K filed on April 16, 2019. | ||||
| (9) | Incorporated by reference to Exhibit 10.1 to Bio-Rad’s Form 8-K filed on November 18, 2021. | ||||
| (10) | Incorporated by reference to Exhibit 10.1 to Bio-Rad’s Form 8-K filed on April 20, 2022. | ||||
| (11) | Incorporated by reference to Exhibit 10.1.3 to Bio-Rad’s Form 10-K filing for the fiscal year ended December 31, 2022. | ||||
| (12) | Incorporated by reference to Exhibit 10.1 to Bio-Rad’s Form 10-Q filing for the quarter ended June 30, 2023. | ||||
| (13) | Incorporated by reference to Exhibit 10.1 to Bio-Rad’s Form 8-K filed on February 14, 2024. | ||||
| (14) | Incorporated by reference to Exhibit 10.9 to Bio-Rad's Form 10-Q filing for the quarter ended June 30, 2011. | ||||
| (15) | Incorporated by reference to Exhibit 10.2 to Bio-Rad’s Form 10-Q filing for the quarter ended March 31, 2017. | ||||
| (16) | Incorporated by reference to Exhibit 10.6 to Bio-Rad’s Form 10-Q filing for the quarter ended September 30, 1997. | ||||
| (17) | Incorporated by reference to Exhibit 4.1 to Bio-Rad’s Form S-8 filed on July 30, 2007. | ||||
| (18) | Incorporated by reference to Exhibit 10.8.1 to Bio-Rad’s Form 10-Q filing for the quarter ended September 30, 2009. | ||||
| (19) | Incorporated by reference to Exhibit 10.1 to Bio-Rad’s Form 10-Q filing for the quarter ended March 31, 2014. | ||||
| (20) | Incorporated by reference to Exhibit 10.1 to Bio-Rad’s Form 10-Q filing for the quarter ended March 31, 2017. | ||||
89
| (21) | Incorporated by reference to Exhibit 10.1 to Bio-Rad’s Form 10-Q filing for the quarter ended September 30, 2017. | ||||
| (22) | Incorporated by reference to Exhibit 10.2 to Bio-Rad’s Form 10-Q filing for the quarter ended September 30, 2017. | ||||
| (23) | Incorporated by reference to Exhibit 10.1 to Bio-Rad’s Form 10-Q filing for the quarter ended September 30, 2020. | ||||
| (24) | Incorporated by reference to Exhibit 10.2 to Bio-Rad’s Form 10-Q filing for the quarter ended September 30, 2020. | ||||
| (25) | Incorporated by reference to Exhibit 10.1 to Bio-Rad’s Form 10-Q filing for the quarter ended September 30, 2022. | ||||
| (26) | Incorporated by reference to Exhibit 10.1 to Bio-Rad’s 8-K filed on April 2, 2019. | ||||
| (27) | Incorporated by reference to Exhibit 10.1 to Bio-Rad’s 8-K filed on April 22, 2019. | ||||
| (28) | Incorporated by reference to Exhibit 10.1 to Bio-Rad’s Form 10-Q for the quarter ended June 30, 2017. | ||||
| (29) | Incorporated by reference to Exhibit 10.9 to Bio-Rad’s Form 10-K filing for the fiscal year ended December 31, 2021. | ||||
| * | Indicates a management contract or compensatory plan or arrangement. | ||||
Item 16. FORM 10-K SUMMARY
None.
SIGNATURES
Pursuant to the requirements of Section 13 or 15(d) of the Securities Exchange Act of 1934, the registrant has duly caused this report to be signed on its behalf by the undersigned, thereunto duly authorized.
| BIO-RAD LABORATORIES, INC. | |||||
| By: | /s/ Norman Schwartz | ||||
Norman Schwartz | |||||
President and Chief Executive Officer | |||||
| Date: | February 16, 2024 | ||||
Pursuant to the requirements of the Securities Exchange Act of 1934, this report has been signed below by the following persons on behalf of the registrant and in the capacities and on the dates indicated.
90
| /s/ Norman Schwartz | Chairman of the Board, President and Chief Executive Officer, Principal Executive Officer, Principal Financial Officer | February 16, 2024 | ||||||
| (Norman Schwartz) | ||||||||
/s/ Tania Devilliers | Senior Director, Corporate Controller, | February 16, 2024 | ||||||
(Tania Devilliers) | Interim Principal Accounting Officer | |||||||
| Other Directors: | ||||||||
| /s/ Jeffrey L. Edwards | Director | February 16, 2024 | ||||||
| (Jeffrey L. Edwards) | ||||||||
| /s/ Gregory K. Hinckley | Director | February 16, 2024 | ||||||
| (Gregory K. Hinckley) | ||||||||
| /s/ Melinda Litherland | Director | February 16, 2024 | ||||||
| (Melinda Litherland) | ||||||||
| /s/ Arnold A. Pinkston | Director | February 16, 2024 | ||||||
| (Arnold A. Pinkston) | ||||||||
| /s/ Allison Schwartz | Director | February 16, 2024 | ||||||
| (Allison Schwartz) | ||||||||
91