UNITED STATES
SECURITIES AND EXCHANGE COMMISSION
Washington, D.C. 20549
_____________________________
FORM 10-K
_____________________________
For the fiscal year ended February 3 , 2024
For the transition period from _________ to _________
Commission File No. 001-38559
_____________________________

(Exact name of registrant as specified in its charter)
_____________________________
State or other jurisdiction of
incorporation or organization
(Address of principal executive offices)
(I.R.S. Employer
Identification No.)
(Zip Code)
Registrant’s telephone number, including area code: (774 ) 512-7400
Securities registered pursuant to Section 12(b) of the Act:
| Title of each class | Trading symbol (s) | Name of each exchange on which registered | ||||||
_____________________________
Securities registered pursuant to Section 12(g) of the Act: None.
_____________________________
Indicate by check mark if the registrant is a well-known seasoned issuer, as defined in Rule 405 of the Securities Act. Yes x No o
Indicate by check mark if the registrant is not required to file reports pursuant to Section 13 or 15(d) of the Act. Yes o No x
Indicate by check mark whether the registrant (1) has filed all reports required to be filed by Section 13 or 15(d) of the Securities Exchange Act of 1934 during the preceding 12 months (or for such shorter period that the registrant was required to file such reports), and (2) has been subject to such filing requirements for the past 90 days. Yes x No o
Indicate by check mark whether the registrant has submitted electronically every Interactive Data File required to be submitted pursuant to Rule 405 of Regulation S-T (§232.405 of this chapter) during the preceding 12 months (or for such shorter period that the registrant was required to submit such files). Yes x No o
Indicate by check mark whether the registrant is a large accelerated filer, an accelerated filer, a non-accelerated filer, a smaller reporting company, or an emerging growth company. See the definitions of "large accelerated filer," "accelerated filer," "smaller reporting company" and "emerging growth company" in Rule 12b-2 of the Exchange Act.
| x | Accelerated Filer | o | ||||||||||||
| Non-accelerated filer | o | Smaller reporting company | ||||||||||||
| Emerging growth company | ||||||||||||||
If an emerging growth company, indicate by check mark if the registrant has elected not to use the extended transition period for complying with any new or revised financial accounting standards provided pursuant to Section 13(a) of the Exchange Act. o
Indicate by check mark whether the registrant has filed a report on and attestation to its management’s assessment of the effectiveness of its internal control over financial reporting under section 404(b) of the Sarbanes-Oxley Act (15 U.S.C. 7262(b)) by the registered public accounting firm that prepared or issued its audit report. x
If securities are registered pursuant to Section 12(b) of the Act, indicate by check mark whether the financial statements of the registrant included in the filing reflect the correction of an error to previously issued financial statements. ☐
Indicate by check mark whether any of those error corrections are restatements that required a recovery analysis of incentive-based compensation received by any of the registrant’s executive officers during the relevant recovery period pursuant to §240.10D-1(b). ☐
Indicate by check mark whether the registrant is a shell company (as defined in Rule 12b-2 of the Exchange Act). Yes ☐ No x
The aggregate market value of the voting and non-voting common equity held by non-affiliates computed by reference to the closing price, as reported by the New York Stock Exchange, at which the common equity was last sold as of July 29, 2023, the last business day of the registrant’s most recently completed second fiscal quarter, was approximately $8,800,000,000 . For purposes of this calculation, the registrant has excluded the market value of all shares of its voting common equity reported as beneficially owned by the executive officers and directors of the registrant; such exclusion shall not be deemed to constitute an admission that any such person is an affiliate of the registrant. The registrant has no non-voting common equity.
The number of outstanding shares of common stock of the registrant as of March 6, 2024 was 132,961,162 .
DOCUMENTS INCORPORATED BY REFERENCE
Part III of this Annual Report on Form 10-K incorporates by reference portions of the registrant’s Definitive Proxy Statement for its 2024 Annual Meeting of Shareholders, which the registrant anticipates will be filed with the Securities and Exchange Commission no later than 120 days after the end of its 2023 fiscal year pursuant to Regulation 14A.
1
Table of Contents
| Page No | ||||||||
2
FORWARD-LOOKING STATEMENTS
This Annual Report on Form 10-K contains forward-looking statements. We intend such forward-looking statements to be covered by the safe harbor provisions for forward-looking statements contained in Section 27A of the Securities Act of 1933, as amended (the "Securities Act"), and Section 21E of the Securities Exchange Act of 1934, as amended (the "Exchange Act"). All statements other than statements of historical facts contained in this Annual Report on Form 10-K should be considered forward-looking statements, including, without limitation, statements regarding our future results of operations and financial position, business strategy, transformation, strategic priorities and future progress, including expectations regarding deferred revenue, lease commencement dates, impact of infrastructure investments on our operating model and selling, general and administrative expenses, sales of gasoline and gross profit margin rates, share repurchases, and new club and gas station openings, as well as statements that include terms such as "may", "will", "should", "expect", "plan", "anticipate", "could", "intend", "project", "believe", "estimate", "predict", "continue", "forecast", "would", or the negative of these terms or other similar expressions. The forward-looking statements in this Annual Report on Form 10-K are only predictions. We have based these forward-looking statements largely on our current expectations and projections about future events and financial trends that we believe may affect our business, financial condition and results of operations. These forward-looking statements involve known and unknown risks, uncertainties and other important factors that may cause our actual results, performance or achievements to be materially different from any future results, performance or achievements expressed or implied by the forward-looking statements, including, but not limited to:
•uncertainties in the financial markets including, without limitation, as a result of disruptions and instability in the banking and financial services industries or as a result of wars and global political conflicts, and the effect of certain economic conditions or events on consumer and small business spending patterns and debt levels;
•risks related to our dependence on having a large and loyal membership;
•domestic and international economic conditions, including volatility in inflation or interest rates, supply chain disruptions, construction delays and exchange rates;
•our ability to procure the merchandise we sell at the best possible prices;
•the effects of competition in, and regulation of, the retail industry;
•our dependence on vendors to supply us with quality merchandise at the right time and at the right price;
•risks related to our indebtedness;
•changes in laws related to, or the governments administration of, the Supplemental Nutrition Assistance Program or its electronic benefit transfer systems;
•the risks and uncertainties related to the impact of any future pandemic, epidemic or outbreak of any other highly infectious disease on the U.S., regional and global economies and on our business, financial condition and results of operations;
•risks related to climate change and natural disasters;
•our ability to identify and respond effectively to consumer trends, including our ability to successfully maintain a relevant omnichannel experience for our members;
•risks related to cybersecurity, which may be heightened due to our e-commerce business, including our ability to protect the privacy of member or business information and the security of payment card information;
•risks relating to our ability to attract and retain a qualified management team and other team members;
•risks relating to our ability to implement our growth strategy by opening new clubs, and gasoline stations; and
•the other risk factors identified in our filings with the Securities and Exchange Commission, including those set forth under "Item 1A. Risk Factors" and "Item 7. Management's Discussion and Analysis of Financial Condition and Results of Operations" in this Annual Report on Form 10-K.
3
Given these uncertainties, you should not place undue reliance on any forward-looking statements. Except as required by applicable law, we assume no obligation to update these forward-looking statements, even if new information becomes available in the future, and you should not rely upon these forward-looking statements after the date of this Annual Report on Form 10-K.
TRADEMARKS
BJ’s Wholesale Club®, BJ’s®, Wellsley Farms®, Berkley Jensen®, My BJ’s Perks®, BJ’s Easy Renewal®, BJ’s Gas®, BJ's One®, BJ's One+®, BJ’s Perks Elite®, BJ’s Perks Plus®, Inner Circle®, Same-Day-Select®, ExpressPay® and BJ’s Perks Rewards® are all registered trademarks of BJ's Wholesale Club, Inc. Other trademarks, trade names and service marks appearing in this Annual Report on Form 10-K are the property of their respective owners. We do not intend our use or display of those other parties’ trademarks, trade names or service marks to imply, and such use or display should not be construed to imply, a relationship with, or endorsement or sponsorship of us by, these other parties. Solely for convenience, trademarks, trade names and service marks referred to in this Annual Report on Form 10-K may appear without the ®, ™ or SM symbols, but such references are not intended to indicate, in any way, that we will not assert, to the fullest extent under applicable law, our rights or the right of the applicable licensor to these trademarks, trade names and service marks.
This section contains forward-looking statements. You should refer to the explanation of the qualifications and limitations on forward-looking statements in the Forward-Looking Statements section above.
MARKET AND INDUSTRY DATA
This Annual Report on Form 10-K includes estimates regarding market and industry data that we prepared based on our management’s knowledge and experience in the markets in which we operate, together with information obtained from various sources, including publicly available information, industry reports and publications, surveys, our customers, distributors, suppliers, trade and business organizations and other contacts in the markets in which we operate.
In this Annual Report on Form 10-K, we make reference to consistently offering 25% or more savings on a representative basket of manufacturer-branded groceries compared to typical supermarket competitors. The following is how we verify that we provide our members this value:
•We periodically identify the four supermarket chains (or banners) most prevalent in our clubs’ primary trade areas (the "Supermarket Competitors").
•We create a "basket" of 100 popular manufacturer-branded grocery food and non-food items, each of which was among our top-selling national brand items in its category and was also carried, in varying pack sizes, in supermarkets. We believe this basket is representative of manufacturer-branded grocery items because of their popular appeal and recognition—as evidenced by both presence and sales volume—in our clubs and at the Supermarket Competitors.
•We hire an independent third-party company to research multiple (a minimum of six) sites for each of the Supermarket Competitors, which are located in the trade areas of one or more of our clubs, no less frequently than once every two weeks. The third-party comparison shoppers record the prices of each item in the basket carried by the Supermarket Competitor, in the closest pack size to the size BJ’s carries, and then they calculate the price on a unit-price basis. We compare unit prices to ensure a common denominator for price comparisons. We direct the measurement company to ignore coupons and exclude items that were on promotion by us or by a Supermarket Competitor, as promotional prices do not represent everyday values in our view.
•To calculate the Supermarket Competitors’ average price for the items in the basket, we average the measured prices of the items at each Supermarket Competitor store sampled, create an average measured unit price for each item at each Supermarket Competitor, compare those to our chain average unit price, and arrive at a relative percentage difference for each Supermarket Competitor. We then average these percentage differences for the Supermarket Competitors. The average difference is consistently more than 25%.
We will only include an item in the basket if it is carried by at least two of the four Supermarket Competitors. This means that over time we may replace items in the basket with different comparable items, if we are consistently unable to get prices for comparison on an item, to be sure we continue to offer the same relative savings.
4
We also use a rolling average of measured prices. At a minimum, we will use an average of two consecutive periodic or monthly measurements of prices at both BJ’s (using our chain average price) and the Supermarket Competitors. We may use up to 52 consecutive weeks, or 12 consecutive months, of price data for comparison. We make our savings claim using price data that are not more than 60 days old, as to the most recent price measurement in the data set.
The Supermarket Competitors do not include non-traditional sellers of groceries, such as drugstores, online sellers, superstores, convenience stores, other membership clubs or mass market retailers.
In presenting this information, we have made certain assumptions that we believe to be reasonable based on such data and other similar sources and on our knowledge of, and our experience to date in, the markets for the products we distribute. Market share data is subject to change and may be limited by the availability of raw data, the voluntary nature of the data gathering process and other limitations inherent in any statistical survey of market shares. In addition, customer preferences are subject to change. Accordingly, you are cautioned not to place undue reliance on such market share data. References herein to the markets in which we conduct our business refer to the geographic metropolitan areas in which our clubs are located.
DEFINED TERMS
As used in this Annual Report on Form 10-K, unless the context otherwise requires:
•"The Company", "BJ’s", "we", "us" and "our" mean BJ’s Wholesale Club Holdings, Inc. and, unless the context otherwise requires, its consolidated subsidiaries;
•"IPO" means our initial public offering of shares of our common stock completed on July 2, 2018;
•"ABL Facility" means the Company’s senior secured asset based revolving credit and term facility that was terminated on July 28, 2022;
•"ABL Revolving Facility" means the Company's revolving credit facility entered into on July 28, 2022;
•"ABL Revolving Commitment" means the aggregate committed amount of $1.2 billion under the ABL Revolving Facility;
•"First Lien Term Loan" means the Company’s senior secured first lien term loan facility that was amended on October 12, 2023;
•"Third Amendment" means the Company’s third amendment to the senior secured former first lien term loan facility that was entered into on January 5, 2023;
•"Fourth Amendment" means the Company’s fourth amendment to the senior secured former first lien term loan facility that was entered into on October 12, 2023;
•"NQDC Plan" means the BJ's Wholesale Club, Inc. Non-Qualified Deferred Compensation Plan;
•"fiscal year 2021" means the 52 weeks ended January 29, 2022;
•"fiscal year 2022" means the 52 weeks ended January 28, 2023;
•"fiscal year 2023" means the 53 weeks ended February 3, 2024;
•"fiscal year 2024" means the 52 weeks ending February 1, 2025;
•"GAAP" means generally accepted accounting principles in the United States of America;
•"ESPP" means the Company's Employee Stock Purchase Plan;
•"SOFR" means the Secured Overnight Financing Rate;
•"LIBOR" means the London Interbank Offered Rate; and
5
•"the Acquisition" means the Company's acquisition of the assets and operations of four distribution centers and the related private transportation fleet from Burris Logistics, LLC on May 2, 2022.
BASIS OF PRESENTATION
We report on the basis of a 52- or 53-week fiscal year, which ends on the Saturday closest to January 31. Accordingly, references herein to "fiscal year 2024" relate to the 52-weeks ending February 1, 2025, references herein to "fiscal year 2023" relate to the 53-weeks ended February 3, 2024, references herein to "fiscal year 2022" relate to the 52-weeks ended January 28, 2023 and references herein to "fiscal year 2021" relate to the 52-weeks ended January 29, 2022. In this Annual Report on Form 10-K, unless otherwise noted, when we compare a metric (such as comparable club sales) between one period and a "prior period," we are comparing it to the analogous period from the prior fiscal year.
6
PART I
Item 1. Business
General
BJ’s Wholesale Club is a leading operator of membership warehouse clubs concentrated primarily on the eastern half of the United States. We deliver significant value to our members, consistently offering 25% or more savings on a representative basket of manufacturer-branded groceries compared to traditional supermarket competitors. We provide a curated assortment focused on groceries, continuously refreshed general merchandise, gasoline and other ancillary services, coupon books, and promotions to deliver a differentiated shopping experience that is further enhanced by our omnichannel capabilities.
Since pioneering the warehouse club model in New England in 1984, we have grown our footprint to 243 large-format, high volume warehouse clubs and 174 gas stations spanning 20 states as of fiscal year end 2023. In our core New England market, which has high population density and generates a disproportionate part of U.S. gross domestic product ("GDP"), we operate more than three times the number of clubs compared to the next largest warehouse club competitor. In addition to shopping in our clubs, members are able to shop when and how they want through our website, bjs.com, and our highly rated mobile app, which allows them to use our buy-online-pickup-in-club ("BOPIC") service, curbside delivery, same-day home delivery or traditional ship-to-home service, as well as through the DoorDash and Instacart marketplaces where members receive the same preferential pricing as in-club shoppers by linking their membership. We also offer Same-Day Select, which offers BJ’s members the ability to pay a one-time fee for either unlimited or twelve same-day grocery deliveries over a one-year period.
Our goal is to offer our members significant value and a meaningful return in savings on their annual membership fee. We have over 7 million members paying annual fees to gain access to savings on groceries and general merchandise and services. The annual membership fee for our Club Card membership is generally $55, and the annual membership fee for our Club+ membership, which offers additional value-enhancing features, is generally $110. We believe that members can save over ten times their $55 Club Card membership fee versus what they would otherwise pay at traditional supermarket competitors when they spend $2,500 or more per year at BJ’s on manufacturer-branded groceries. In addition to providing significant savings on a representative basket of manufacturer-branded groceries, we accept all manufacturer coupons and also carry our own exclusive brands that enable members to save on price without compromising on quality. Our two private label brands, Wellsley Farms® and Berkley Jensen®, represent approximately $4.1 billion in annual sales. Our customers recognize the relevance of our value proposition across economic environments, as demonstrated by over 25 consecutive years of membership fee income growth. Our membership fee income was $420.7 million for fiscal year 2023.
On May 2, 2022, the Company completed its acquisition of the assets and operations of four distribution centers and the related private transportation fleet from Burris Logistics (the "Acquisition"), which brings substantially all of the end-to-end perishable supply chain in-house. See "Note 20. Acquisitions" of our consolidated financial statements included in this Annual Report on Form 10-K for additional information regarding the Acquisition.
Industry Overview
Warehouse clubs offer a relatively narrow assortment of food and general merchandise items within a wide range of product categories. In order to achieve high sales volumes and rapid inventory turnover, merchandise selections are generally limited to items that are brand name leaders in their categories alongside an assortment of private label brands. Since warehouse clubs sell a diversified selection of product categories, they attract customers from a wide range of other wholesale and retail distribution channels, such as supermarkets, supercenters, internet retailers, gasoline stations, hard discounters, department and specialty stores and operators selling a narrow range of merchandise. These higher cost distribution channels have traditionally been unable to match the low prices offered by warehouse clubs over long periods of time.
Warehouse clubs eliminate many of the merchandise handling costs associated with traditional multiple-step distribution channels by purchasing full truckloads of merchandise directly from manufacturers and by storing merchandise on the sales floor rather than in central warehouses. By operating no-frills, self-service warehouse facilities, warehouse clubs have fixturing and operating costs substantially below those of traditional retailers. Because of their higher sales volumes and rapid inventory turnover, warehouse clubs generate cash from the sale of a large portion of their inventory before they are required to pay merchandise vendors. As a result, a greater percentage of the inventory is financed through vendor payment terms than by working capital. Two broad groups of customers, individual households and small businesses, have been attracted to the savings made possible by the high sales volumes and operating efficiencies achieved by warehouse clubs. Customers at warehouse clubs are generally limited to members who pay an annual fee.
7
Our Clubs
As of February 3, 2024, we operated 243 clubs ranging in size from 44,000 square feet to 177,000 square feet. We aim to locate our larger clubs in high density, high traffic locations that are difficult to replicate. We design our smaller format clubs to serve markets whose population is not sufficient to support a larger club or that are in locations, such as urban areas, where there is inadequate real estate space for a larger club. Including space for parking, the amount of land required for a BJ’s club generally ranges from ten acres to fourteen acres. Our clubs are located in both free-standing locations and shopping centers.
Our ability to achieve profitable operations depends upon high sales volumes and the efficient operation of our warehouse clubs. We buy most of our merchandise directly from manufacturers and route it to cross-docking consolidation points (distribution centers) or directly to our clubs. Our Company-operated distribution centers receive large shipments from manufacturers and quickly ship these goods to individual clubs, generally within 24 hours. This process creates freight volume and handling efficiencies, substantially reducing many costs associated with traditional multiple-step distribution channels, including distributors’ commissions and the cost of storing merchandise in central distribution facilities. We work closely with manufacturers to minimize the amount of handling required once merchandise is received at a club. Merchandise for sale is generally displayed on pallets containing large quantities of each item, thereby reducing labor required for handling, stocking and restocking. Back-up merchandise is generally stored in steel racks above the sales floor.
A summary of our club locations by state as of February 3, 2024 is set forth in the table below:
| Market | Club Count | |||||||
| New York | 49 | |||||||
| Florida | 37 | |||||||
| Massachusetts | 25 | |||||||
| New Jersey | 23 | |||||||
| Pennsylvania | 19 | |||||||
| Virginia | 14 | |||||||
| Connecticut | 13 | |||||||
| Maryland | 12 | |||||||
| North Carolina | 9 | |||||||
| Ohio | 8 | |||||||
| New Hampshire | 7 | |||||||
| Georgia | 6 | |||||||
| Michigan | 5 | |||||||
| Delaware | 4 | |||||||
| Rhode Island | 4 | |||||||
| Maine | 3 | |||||||
| Tennessee | 2 | |||||||
| Alabama | 1 | |||||||
| Indiana | 1 | |||||||
| South Carolina | 1 | |||||||
Segments
Our retail operations, which include retail club and other sales procured from our clubs and distribution centers, represent substantially all of our consolidated total revenues, and are our only reportable segment. Substantially all of our identifiable assets are located in the United States. We do not have significant sales outside the United States, nor does any customer represent more than 10% of total revenues for any period presented.
Merchandising
We service our existing members and attract new members by providing a broad range of high quality, brand name and private label merchandise at prices that are consistently lower than the prices of traditional retailers, including discount retailers, supermarkets, supercenters and specialty retail operations. We limit the items offered in each product line to fast selling styles,
8
sizes and colors, carrying approximately 7,000 core active stock keeping units ("SKUs"). We may add additional temporary SKUs from time to time to keep up with demand.
By contrast, supermarkets normally carry an average of 40,000 SKUs, and supercenters may stock 100,000 SKUs or more. We work closely with manufacturers to develop packaging and sizes that are best suited for selling through the warehouse club format in order to minimize handling costs and ensure value to our members.
We group our merchandise offerings into two divisions: grocery and general merchandise and services.
•Grocery: consists of our meat, produce, dairy, bakery, deli and frozen products, packaged foods, beverages, detergents, disinfectants, paper products, beauty care, adult and baby care and pet foods, which constituted approximately 86% of our merchandise sales for fiscal year 2023.
•General merchandise and services: consists of electronics, apparel, seasonal goods, small appliances, televisions, optical, tires, and gift cards, which constituted approximately 14% of our merchandise sales for fiscal year 2023.
BJ’s consumer-focused private label products, sold under Wellsley Farms® and Berkley Jensen® brands, comprised approximately 26% of our total net sales, excluding gasoline, in fiscal year 2023. These products are primarily premium quality and generally are priced below the branded competing product. We focus both on a group of core private label products that compete with national brands that have among the highest market share and yield higher margins and on differentiated products that drive member loyalty.
We also offer a number of specialty services that are designed to enable members to complete more of their shopping at our clubs and to encourage more frequent trips to the clubs. Many of these services are provided by outside operators under license from us. Specialty services include full-service optical centers; tire installation services; a propane tank filling service; home improvement services; travel services; cell phone kiosks; and product protection plans.
As of February 3, 2024, we had 174 gasoline stations in operation at or near our clubs. The gas stations are generally self-service, with some locations accepting cash. We generally maintain our gas prices below the average retail prices in each market as a means of illustrating a favorable price image to existing and prospective members.
Omnichannel Offerings
We have built a robust omnichannel portfolio which consists of BJs.com, BerkleyJensen.com, Wellsleyfarms.com, as well as the BJ’s mobile app. We have made it easier for members to purchase, review products, digitally add coupons to their membership card and view annual member savings. BJs.com showcases our club assortment available to members along with review ratings and coupons for added savings. The above omnichannel portfolio offers our members convenient ways to shop, including our BOPIC service, curbside delivery, same-day home delivery or traditional ship-to-home service. Our app delivers personalized promotions, improved shopping experiences, and an efficient gateway to our fulfillment options. Our members appreciate the convenience of the BJ’s mobile app, as evidenced by millions of downloads since fiscal year 2019, as well as ExpressPay®, which allows members to skip checkout lines when they shop in club by paying with their phones. In the fourth quarter of fiscal year 2022, we announced the launch of our retail media program, BJ’s Media Edge™. The program offers brands a comprehensive advertising solution to connect with BJ’s members.
Membership
Paid membership is an essential element of the warehouse club concept. In addition to providing a source of revenue which permits us to offer low prices, membership reinforces customer loyalty. We have a large base of more than 7 million paid memberships as of February 3, 2024. Our target customers care about value, quality and convenience and shop at warehouse clubs for their family needs. Our target customers are a price sensitive demographic with large household sizes, representing the largest segment of warehouse club shoppers in BJ’s trade areas.
During fiscal year 2023, we rebranded our memberships and co-branded credit card. Historically, we've offered two core types of memberships: the Club Card (formerly Inner Circle®) memberships and business memberships. We generally charged $55 per year for a primary Club Card membership that included one additional card for a household member. Primary members could purchase up to three supplemental memberships for $30 each. A primary business membership typically cost $55 per year and included one free supplemental membership. Business members could purchase up to eight additional supplemental business memberships at $30 each. U.S. military personnel—active and veteran—who enrolled at a BJ’s club location could do so for a reduced membership fee.
9
Our higher tier membership was rebranded from BJ’s Perks Rewards® to Club+, which offers members the opportunity to earn 2% cash back on most in-club and bjs.com purchases and 5-cent per gallon discount on gasoline. The annual fee for a Club+ membership is generally $110 per year. We also launched our new BJ's One™ and BJ's One+™ Mastercard® credit cards (formerly the My BJ’s Perks® program). These cards provide members with the opportunity to earn up to 5% cash back on purchases made at our clubs or online at bjs.com and up to a 15-cent per gallon discount on gasoline when paying with a BJ's One™ or BJ's One+™ Mastercard® at our BJ’s Gas locations. Since fiscal year 2014, we have grown co-branded Mastercard® holders by over 1000%. In fiscal year 2023, Club+ members and co-branded Mastercard® members accounted for 38% of members and 49% of merchandise spend (excluding gas and membership fee income), compared to 38% of members and 48% of merchandise spend (excluding gas and membership fee income) in fiscal year 2022.
Advertising and Public Relations
We promote customer awareness of our clubs primarily through social media, direct mail, public relations efforts, radio advertising, community involvement, new club marketing programs and various publications sent to our members periodically throughout the year. These methods result in lower marketing expenses compared to typical retailers.
Competition
We compete with a wide range of national, regional and local retailers and wholesalers selling food and/or general merchandise in our markets, including supermarkets, supercenters, general merchandise chains, specialty chains, gasoline stations and other warehouse clubs, some of which have significantly greater financial and marketing resources than BJ’s. Major competitors that operate warehouse clubs include Costco Wholesale Corporation and Sam’s Clubs (a division of Wal-Mart Stores, Inc.), both of which operate on a multi-national basis.
We believe price is the major competitive factor in the markets in which we compete. Other competitive factors include club location, merchandise selection, member services and name recognition. We believe our efficient, low-cost form of distribution gives us a significant competitive advantage over more traditional channels of retail distribution.
Intellectual Property
We believe that, to varying degrees, our trademarks, trade names, copyrights, proprietary processes, trade secrets, patents, trade dress, domain names and similar intellectual property add significant value to our business and are important to our success. We have invested significantly in the development and protection of our well-recognized brands, including our private label brands, Wellsley Farms® and Berkley Jensen®. We believe that products sold under our private label brands are high quality, offered to our members at prices that are generally lower than those for comparable national brand products and help lower costs, differentiate our merchandise offerings from other retailers and generally earn higher margins. We expect to continue to increase the sales penetration of our private label items.
We rely on trademark and copyright laws, trade-secret protection, and confidentiality, license and other agreements with our suppliers, employees and others to protect our intellectual property rights. However, trademarks are generally valid and may be renewed indefinitely as long as they are in use and their registrations are properly maintained.
Government Regulation
Compliance with various governmental regulations has an impact on our business, including our capital expenditures, earnings and competitive position, which can be material. We incur costs to monitor, and take actions to comply with, governmental regulations that are applicable to our business, which include, among others, federal securities laws and regulations, applicable to exchange requirements, labor and employment laws, laws governing truth-in-advertising, privacy laws, environmental laws, safety regulations and other laws, including consumer protection regulations that regulate retailers and govern the promotion and sale of merchandise and the operation of clubs, warehouses and Company-operated and contracted distribution center facilities.
Our clubs are also subject to various local, state and federal laws, regulations and administrative practices affecting our business. We must comply with provisions regulating health and sanitation standards, food labeling, equal employment, minimum wages, environmental protection, licensing for the sale of food and, in many clubs, licensing for beer and wine or other alcoholic beverages. Our operations, including the manufacturing, processing, formulating, packaging, labeling and advertising of products are subject to regulation by various federal agencies, including the Food and Drug Administration (the "FDA"), the Federal Trade Commission (the "FTC"), the U.S. Department of Agriculture (the "USDA"), the Consumer Product Safety Commission and the Environmental Protection Agency. We rely on contractual provisions to ensure compliance by our vendors.
10
See "Item 1A. Risk Factors" for a discussion of material risks to us, including, to the extent material, to our competitive position, relating to governmental regulations, and see "Item 7. Management’s Discussion and Analysis of Financial Condition and Results of Operations" together with our audited consolidated financial statements and related notes thereto for a discussion of material information relevant to an assessment of our financial condition and results of operations, including, to the extent material, the effects that compliance with governmental regulations may have upon our capital expenditures and earnings.
Food
The FDA has comprehensive authority to regulate the safety of food and food ingredients (other than meat, poultry, catfish and certain egg products), as well as dietary supplements under the Federal Food, Drug, and Cosmetic Act (the "FDCA"). Similarly, the USDA’s Food Safety Inspection Service is the public health agency responsible for ensuring that the nation’s commercial supply of meat, poultry, catfish and certain egg products is safe, wholesome and correctly labeled and packaged under the Federal Meat Inspection Act and the Poultry Products Inspection Act.
Congress amended the FDCA in 2011 through passage of the Food Safety Modernization Act, which greatly expanded the FDA’s regulatory obligations over all actors in the supply chain. Such regulations mandate that risk-based preventive controls be observed by the majority of food producers. This authority applies to all domestic food facilities and, by way of imported food supplier verification requirements, to all foreign facilities that supply food products.
The FDA also exercises broad jurisdiction over the labeling and promotion of food. Labeling is a broad concept that, under certain circumstances, extends to product-related claims and representations made on a company’s website or similar printed or graphic medium. All foods, including dietary supplements, must bear labeling that provides consumers with essential information with respect to standards of identity, net quantity, nutrition facts, ingredient statement and allergen disclosures. The FDA also regulates the use of structure/function claims, health claims and nutrient content claims.
Dietary Supplements
The FDA has comprehensive authority to regulate the safety of dietary supplements, dietary ingredients, labeling and current good manufacturing practices. Congress amended the FDCA in 1994 through passage of the Dietary Supplement Health and Education Act (the "DSHEA"), which greatly expanded the FDA’s regulatory authority over dietary supplements. Through DSHEA, dietary supplements became their own regulated commodity while also allowing structure/function claims on products. However, no statement on a dietary supplement may expressly or implicitly represent that it will diagnose, cure, mitigate, treat or prevent a disease.
Food and Dietary Supplement Advertising
The FTC exercises jurisdiction over the advertising of foods and dietary supplements. The FTC has the power to institute monetary sanctions and the imposition of consent decrees and penalties that can severely limit a company’s business practices.
Compliance
As is common in our industry, we rely on our suppliers and contract manufacturers, including those of our private label products, to ensure that the products they manufacture and sell to us comply with all applicable regulatory and legislative requirements. We do not directly manufacture any goods. In general, we seek certifications of compliance, representations and warranties, indemnification or insurance from our suppliers and contract manufacturers. However, even with adequate insurance and indemnification, any claims of non-compliance could significantly damage our reputation and consumer confidence in products we sell. In addition, the failure of such products to comply with applicable regulatory and legislative requirements could prevent us from marketing the products or require us to recall or remove such products from our clubs. In order to comply with applicable statutes and regulations, our suppliers and contract manufacturers have from time to time reformulated, eliminated or relabeled certain of their products, and we have revised certain provisions of our sales and marketing program.
We monitor changes in these laws and believe that we are in material compliance with applicable laws.
Seasonality
Our business is moderately seasonal in nature. Historically, our business has generally realized a slightly higher portion of net sales, operating income, and cash flows from operations in the second and fourth fiscal quarters, attributable primarily to the impact of the summer and year-end holiday season, respectively. Our quarterly results have been, and will continue to be, affected by the timing of new club openings and their associated pre-opening expenses. As a result of these factors, our
11
financial results for any single quarter or for periods of less than a year are not necessarily indicative of the results that may be achieved for a full fiscal year.
Employees and Human Capital Resources
As of February 3, 2024, we had over 34,000 full-time and part-time employees, whom we refer to as team members. None of our team members are represented by a union. We consider our relations with our team members to be good.
Team Member Engagement. We provide all team members with the opportunity to share their opinions and feedback on our culture through a survey that is performed every year. Results of the survey are measured and analyzed to enhance the team member experience, promote retention of team members, drive change, and leverage the overall success of our Company.
Diversity. We strive to foster a work environment that includes and embraces diversity of background and perspective, including, but not limited to, with respect to age, gender, race, place of residence and specialized experience. As of the end of fiscal year 2023, 43% of our total workforce were women and 53% were minorities. During fiscal year 2023, 40% of our new hires were women and 62% of our new hires were minorities. We have a zero-tolerance policy on discrimination and harassment and have several systems under which team members can report incidents confidentially or anonymously and without fear of reprisal. We have an Inclusion & Diversity Council which is comprised of a cross-functional team representing diversity of backgrounds, ethnicity, gender, and self-identification. This council is responsible for identifying and driving actions and initiatives to advance the Company’s inclusion and diversity mission.
Total Rewards. We believe our team members are the key to our success and we offer competitive programs to meet the needs of our colleagues and their families. Our programs include annual bonuses, 401(k) plans, stock awards, an employee stock purchase plan, paid time off, flexible work schedules, family leave, team member assistance programs, and more, based on eligibility criteria. We take the health and wellness of our team members seriously. We provide our eligible team members with access to a variety of innovative, flexible and convenient health and wellness programs. Additionally, the Company provides resources, such as an onsite chiropractor, a health clinic and access to a fitness center for team members. Such programs are designed to support team members’ physical and mental health by providing tools and resources to help them improve or maintain their health status and encourage engagement in healthy behaviors. The Company also provides team members with comprehensive medical benefits, dental, and behavioral and mental wellness benefits.
Team Member Development. Training and development programs for our team members help retain and advance them into future roles with the Company. We provide online and on-the-job training through innovative delivery tools which are easy to use and focused on the core skills needed to be successful at the Company. We provide several management and leadership programs that develop and educate our leaders so they can provide the best work environment and growth opportunities to all our team members.
Community Involvement. We have a long and proud history of investing in the communities where we live and work. BJ’s Charitable Foundation (the "Foundation") was established with the mission to enrich every community we serve. The Foundation supports nonprofit organizations that primarily benefit the underprivileged in the areas of hunger prevention and education. Throughout the year, the Foundation makes multiple direct donations from the Company to support food banks and pantry programs in communities that our clubs serve.
Corporate Information
BJ’s Wholesale Club Holdings Inc. was incorporated on February 23, 2018. On July 2, 2018, BJ’s Wholesale Club Holdings, Inc. became a publicly traded entity in connection with its IPO and listing on the New York Stock Exchange ("NYSE") under the ticker symbol "BJ." Our principal operating subsidiary is BJ’s Wholesale Club, Inc., which is a wholly owned subsidiary of BJ's Wholesale Club Holdings.
We make available on our website (http://www.bjs.com), or through a link posted on our website, free of charge, our Annual Reports on Form 10-K, quarterly reports on Form 10-Q, current reports on Form 8-K, and amendments to those reports filed or furnished pursuant to Section 13(a) or 15(d) of the Exchange Act as soon as reasonably practicable after we electronically file such material with, or furnish it to, the Securities and Exchange Commission (the "SEC"). In addition, the SEC maintains an internet site that contains these reports, proxy and information statements, and other information regarding issuers that file electronically with the SEC (http://www.sec.gov).
The information on our website or that can be accessed through our website is not incorporated by reference and should not be considered to be a part of this Annual Report on Form 10-K.
12
Information About our Executive Officers
The following are the executive officers of BJ’s Wholesale Club as of March 18, 2024:
| Name | Age | Office and Business Experience | ||||||
| Robert W. Eddy | 51 | Robert W. Eddy is chairman and chief executive officer of the Company. He has served as president and chief executive officer of the Company since April 2021. He joined the Company's board as a director in April 2021 and was appointed chairman of the board in June 2023. Mr. Eddy joined the Company in 2007 and during his tenure served in various executive financial roles for the Company including as senior vice president finance, executive vice president, chief financial officer, and executive vice president, chief financial and administrative officer. Prior to joining BJ’s, Mr. Eddy served retail and consumer products companies as a member of the audit and business advisory practice of PricewaterhouseCoopers LLP. In addition to his role at BJ’s, Mr. Eddy currently serves as a member of the board of directors of DICK’s Sporting Goods, Inc (NYSE: DKS). He also serves as a member of the board of directors and executive committee of the National Retail Federation and the Boston Children’s Hospital Trust. From 2013 to 2017, Mr. Eddy chaired the Financial Executives Council of the National Retail Federation. He is also a member of the college advisory board for Babson College. Mr. Eddy is a graduate of Babson College and attended Phillips Academy in Andover, Massachusetts as well. | ||||||
| Laura L. Felice | 42 | Laura L. Felice has served as BJ’s executive vice president, chief financial officer since April 2021. From November 2016 to April 2021, Ms. Felice served as senior vice president, controller and was responsible for the integrity of our financial records. Before joining BJ’s, Ms. Felice worked at Clarks Americas, Inc., a British shoe manufacturer and retailer, from 2008 to 2016 in various roles of increasing responsibility, including serving as the senior vice president of finance from November 2015 to November 2016. In that role, she led all aspects of commercial finance for the Americas region distribution channels. Additionally, Ms. Felice worked at PricewaterhouseCoopers LLP, serving retail and consumer product companies from 2003 to 2008. She is a certified public accountant and currently serves as a board member, vice chair and finance committee chair for the Massachusetts Society of CPAs. Ms. Felice also currently serves as a board member of Broadstone Net Lease, LLC (NYSE: BNL). She holds a master’s degree of accounting and a bachelor’s degree with a double major in finance and accounting from Boston College. | ||||||
| Paul Cichocki | 54 | Paul Cichocki has served as BJ’s executive vice president, chief commercial officer since April 2021 and oversees merchandising, membership, marketing and analytics. From April 2020 to April 2021, Mr. Cichocki served as executive vice president, membership, analytics and business transformation and was responsible for the strategy and vision for the Company’s membership, marketing and analytics divisions. Prior to joining BJ’s, Mr. Cichocki worked at Bain & Company, a management consulting firm, from 1997 to April 2020 where he spent over 20 years supporting clients across a broad range of industries, including retail, consumer products, financial services and food and beverage. Prior to Bain & Company, Mr. Cichocki worked as an operating manager at Frito-Lay, a snack manufacturing division of PepsiCo., from 1991 to 1995. Mr. Cichocki attended Harvard Business School, where he earned a master of business administration with distinction. He is also a graduate from the University of Massachusetts, where he received a bachelor’s degree in operations management with high honors. | ||||||
| Jeff Desroches | 46 | Jeff Desroches joined BJ's in 2001 and has served as our executive vice president, chief operations officer since April 2018. In his role, Mr. Desroches leads all operations, club team members, regional field staff, and has oversight of policies and procedures at all the Company’s clubs and fuel stations as well as omni fulfillment, supply chain and asset protection. During his tenure at BJ’s, Mr. Desroches has served as regional asset protection manager, vice president of asset protection and senior vice president of supply chain. Prior to BJ’s, Mr. Desroches held various operational and warehousing roles at Service Merchandise Company, Inc., a retail chain, from 1993 to 2000 and Kmart Corporation, a discount department store chain, from 2000 to 2001. He holds a bachelor’s degree in criminal justice and law enforcement administration from American Intercontinental University. | ||||||
13
| Anjana Harve | 51 | Anjana Harve is executive vice president, chief information officer of the Company. Ms. Harve was named to this position in September 2023 and is responsible for the strategic leadership and direction of the Company’s information technology organization. Prior to joining BJ’s, from January 2021 to April 2023, she served as global chief information officer at Fresenius Medical Care, the world’s leading provider of products and services for individuals with renal diseases, where she led information technology, privacy assurance, cyber, digital and data security across key business units. She also held the position of North America chief information officer at Fresenius from March 2020 to January 2021. From October 2018 to March 2020, she served as chief information officer at Hill-Rom, a medical technology provider. Prior to these positions, Mr. Harve also held various technology and other senior management positions during her career, including at Novartis, a Swiss multinational pharmaceutical corporation, and Shire, also a multinational pharmaceutical corporation. Ms. Harve holds a bachelor’s degree in computer science engineering from Bangalore University in India and a master of business administration from the Wharton School at University of Pennsylvania. | ||||||
| Graham N. Luce | 54 | Graham N. Luce has served BJ’s executive vice president, general counsel and secretary since March 2023. He provides senior management with strategic advice on company initiatives, complex business transactions and litigation as well as counsel on all corporate governance-related matters. He joined the Company in April 2015 as senior vice president, general counsel and secretary and served in that role until March 2023. Prior to joining the Company, Mr. Luce worked at Bain & Company, a management consulting firm, from 2000 to 2015 and Goodwin Procter LLP, a global law firm, from 1995 to 2000. He holds a juris doctor from Boston University School of Law and bachelor’s degrees in political science and electrical engineering from Tufts University. | ||||||
| Monica Schwartz | 49 | Monica Schwartz has served as BJ’s executive vice president, chief digital officer since October 2021 and is responsible for driving the Company’s vision and strategy for its e-commerce and omnichannel efforts. She joined the Company in August 2020 and previously served as our senior vice president, chief digital officer from August 2020 to October 2021. Ms. Schwartz most recently served as vice president, online merchandising at The Home Depot, Inc., a home improvement retailer, from December 2017 to September 2019 and was responsible for its e-commerce site and driving innovation. Prior to that, she served as the executive vice president of digital at Nine West Group, a fashion retailer, from 2015 to 2017. From 2014 to 2015, Ms. Schwartz served as chief global digital officer at Stuart Weitzman Holdings, LLC, a women’s footwear and handbag retailer. From 2012 to 2014, she served as executive director, e-commerce at David Yurman Enterprises, LLC, a jewelry design company. Prior to that, she held positions of increasing responsibility at E-bay, Inc., an e-commerce corporation, from 2007 to 2012. From 2005 to 2007, she held positions with Countrywide Financial Corporation, a financial services company, and from 1998 to 2001 she held positions with MediaHippo, an interactive media agency. She holds a master of business administration at the University of California, Los Angeles Anderson School of Management and a bachelor’s degree in fine arts from Miami University. | ||||||
| William C. Werner | 46 | William C. Werner has served as BJ’s executive vice president, strategy and development since April 2021 and is responsible for building the Company’s market expansion and key strategic initiatives. Mr. Werner served in several other roles throughout his tenure at BJ’s, including as senior vice president, strategic planning and investor relations from November 2016 to April 2021, senior vice president, finance from 2013 to November 2016 and as the Company’s vice president, accounting and financial reporting from 2012 to 2013. Prior to joining BJ’s, Mr. Werner was a director in the deals practice at PricewaterhouseCoopers LLP, a multinational professional services firm, from 2007 to 2012. He holds a bachelor’s degree with a double major in mathematics and accounting from the College of the Holy Cross. | ||||||
14
Item 1A. Risk Factors
Set forth below are the risks that we believe are material to our investors and they should be carefully considered. These risks are not all of the risks that we face and other factors not presently known to us or that we currently believe are immaterial may also affect our business, financial condition, results of operations and/or stock price if they occur. This section contains forward-looking statements. You should refer to the explanation of the qualifications and limitations on forward-looking statements in the Forward-Looking Statements section above and should also refer to our quarterly reports on Form 10-Q and current reports on Form 8-K for any material updates to these risk factors.
Risks Relating to Our Business
Our business may be affected by issues that affect consumer spending.
Our results of operations are affected by the level of consumer spending and, therefore, by changes in the economic factors that impact consumer spending. Certain economic conditions or events, such as a contraction in the financial markets; high rates of inflation or deflation; high unemployment levels; decreases in consumer disposable income; unavailability of consumer credit; higher consumer debt levels; higher tax rates and other changes in tax laws; fluctuations in interest rates; higher fuel, energy and other commodity costs; weakness in the housing market; higher insurance and health care costs; and product cost increases resulting from an increase in commodity prices or supply chain issues, could reduce or shift consumer spending generally, which could cause our customers to spend less or to shift their spending to our competitors. Reduced consumer spending may result in reduced demand for our items and may also require increased selling and promotional expenses. Issues or trends that affect consumer spending broadly could affect spending by our members disproportionately. A reduction or shift in consumer spending could negatively impact our business, results of operations and financial condition.
We depend on having a large and loyal membership, and any harm to our relationship with our members could have a material adverse effect on our business, net sales and results of operations.
We depend on having a large and loyal membership. The extent to which we achieve growth in our membership base and sustain high renewal rates materially influences our profitability. Further, our net sales are directly affected by the number of our members, the number of members and holders of our co-branded credit cards, the frequency with which our members shop at our clubs and the amount they spend on those trips, which means the loyalty and enthusiasm of our members directly impacts our net sales and operating income. Accordingly, anything that would harm our relationship with our members and lead to lower membership renewal rates or reduced spending by members in our clubs could materially adversely affect our net sales, membership fee income and results of operations.
Factors that could adversely affect our relationship with our members include: our failure to remain competitive in our pricing relative to our competitors; our failure to provide the expected quality of merchandise; our failure to offer the mix of products that our members want to purchase; events that harm our reputation or the reputation of our private brands; our failure to provide the convenience that our members may expect over time, including with respect to technology, delivery and physical location of our clubs; increases to our membership fees; and increased competition from stores, clubs or internet retailers that have a more attractive mix of price, quality and convenience. In addition, we constantly need to attract new members to replace our members who fail to renew and to grow our membership base. If we fail to attract new members, our membership fee income and net sales could suffer.
Our business plan and operating results depend on our ability to procure the merchandise we sell at the best possible prices.
Our business plan depends on our ability to procure the merchandise we sell at the best possible prices. Because we price our merchandise aggressively, the difference between the price at which we sell a given item and the cost at which we purchase it is often much smaller than it would be for our non-club competitors. Further, it is often not possible for us to reflect increases in our cost of goods by increasing our prices to members. Accordingly, small changes in the prices at which we purchase our goods for resale can have a substantial impact on our operating profits. If we are unable to purchase goods at attractive prices relative to our competitors, our growth could suffer. If the prices we pay for goods increase, our operating profit and results of operations could suffer, and if we are forced to increase our prices to our members, our member loyalty could suffer.
We depend on vendors to supply us with quality merchandise at the right time and at the right price.
We depend heavily on our ability to purchase merchandise in sufficient quantities at competitive prices and in a timely fashion. We source our merchandise from a wide variety of domestic and international vendors. Finding qualified vendors who meet our standards and acquiring merchandise in a timely and efficient manner are significant challenges, especially with respect to vendors located and merchandise sourced outside the United States. We have no assurances of continued supply,
15
pricing or access to new products, and, in general, any vendor could at any time change the terms upon which it sells to us or discontinue selling to us. In addition, member demand may lead to insufficient in-stock quantities of our merchandise.
Competition may adversely affect our profitability.
The retail industry is highly competitive. We compete primarily against other warehouse club operators and grocery and general merchandise retailers, including supermarkets and supercenters, and gasoline stations. Given the value and bulk purchasing orientation of our customer base, we compete to a lesser extent with internet retailers, hard discounters, department and specialty stores and other operators selling a narrow range of merchandise. Some of these competitors, including two major warehouse club operators - Sam’s Club (a division of Wal-Mart Stores, Inc.) and Costco Wholesale Corporation - operate on a multi-national basis and have significantly greater financial and marketing resources than BJ’s. These retailers and wholesalers compete in a variety of ways, including with respect to price, services offered to customers, distribution strategy, merchandise selection and availability, location, convenience, store hours and the attractiveness and ease of use of websites and mobile applications. The evolution of retailing through online and mobile channels has also improved the ability of customers to comparison shop with digital devices, which has enhanced competition. We cannot guarantee that we will be able to compete successfully with existing or future competitors. Our inability to respond effectively to competitive factors may have an adverse effect on our profitability as a result of lost market share, lower sales or increased operating costs, among other things.
Changes in laws related to the Supplemental Nutrition Assistance Program ("SNAP"), to the governmental administration of SNAP or to SNAP’s EBT systems could adversely impact our results of operations.
Under SNAP, we are currently authorized to accept EBT payments, or food stamps, at our clubs as tender for eligible items. Changes in state and federal laws governing the SNAP program, including reductions in program benefits, restrictions on program eligibility, or rules on where and for what EBT cards may be used, could reduce sales at our clubs. For example, in February 2023, the federal government ceased pandemic-related emergency food benefits, reducing consumer dollars. Later that year, additional changes in the program’s administration were made to enact new work requirements for those ages 50 to 54. Any such program changes or reductions in funding for the SNAP program overall could alter consumer shopping habits resulting in decreased sales at our clubs and thereby materially and adversely affect our business, financial condition and results of operations.
Natural disasters and other incidents beyond our control could negatively affect our business, financial condition and results of operations.
Our business could be severely impacted by natural disasters, such as hurricanes or earthquakes, or other incidents beyond our control, such as global or regional pandemics, epidemics or outbreaks of infectious diseases, terrorism, war/conflict, geopolitical tensions or events, riots, acts of violence and other crimes (including looting or vandalism), particularly in locations where our centralized operating systems and administrative personnel are located. For example, our operations are concentrated primarily on the eastern half of the United States, and any adverse weather event or natural disaster, such as a hurricane or heavy snowstorm, could have a material adverse effect on a substantial portion of our operations. Such natural disasters or other incidents beyond our control could result in, among other things, physical damage to one or more of our properties; the temporary closure of one or more of our clubs, Company-operated or contracted distribution centers or our home office facility; the temporary lack of an adequate work force in a market; a temporary or long-term disruption in merchandise distribution, including issues with the transport of goods to or from overseas; the temporary reduction in the availability of products in our clubs and online or a reduction in demand for certain of our products, each of which could have a negative adverse effect on our business, financial condition, cash flows and results of operations.
Disruptions in our merchandise distribution could adversely affect sales and member satisfaction.
We depend on the orderly operation of our merchandise receiving and distribution process through our Company-operated distribution centers. All of our end-to-end perishable supply chain has been contained in-house since mid-2022. Although we believe that our receiving and distribution process is efficient, unforeseen disruptions in operations due to fires, tornadoes, hurricanes, earthquakes or other catastrophic events, labor issues, war or other civil unrest, or other shipping problems (which may include, but are not limited to, strikes, slowdowns or work stoppages at the ports of entry for the merchandise that we import) may result in delays in the delivery of merchandise to our clubs, which could adversely affect sales and the satisfaction of our members. In addition, increases in distribution costs (including, but not limited to, trucking and freight costs) could adversely affect our expenses, which could adversely affect our operating profit and results of operations.
16
We may not timely identify or respond effectively to consumer trends, which could negatively affect our relationship with our members, the demand for our products and services and our market share.
It is difficult to predict consistently and successfully the products and services our members will demand over time. Our success depends, in part, on our ability to identify and respond to evolving trends in demographics and member preferences. Failure to timely identify or respond effectively to changing consumer tastes, preferences (including those relating to environmental, social and governance issues) and spending patterns could lead us to offer our members a mix of products or a level of pricing that they do not find attractive. This could negatively affect our relationship with our members, leading them to reduce both their visits to our clubs and the amount they spend, and potentially impacting their decision to renew their membership. Such a result would adversely affect the demand for our products and services and our market share. If we are not successful at predicting our sales trends and adjusting accordingly, we may also have excess inventory, which could result in additional markdowns and reduce our operating performance. This could have an adverse effect on margins and operating income.
We are subject to payment-related risks, including risks to the security of payment card information.
We accept payments using an increasing variety of methods, including cash, checks, our co-branded credit cards and a variety of other credit and debit cards, as well as Paypal, Apple Pay®, Google Pay, EBT payments and Buy Now, Pay Later financed through Citizens Pay™. Our efficient operation, like that of most retailers, requires the transmission of information permitting cashless payments. As we offer new payment options to our members, we may be subject to additional rules, regulations and compliance requirements, along with the risk of higher fraud losses. For certain payment methods, we pay interchange and other related card acceptance fees, along with additional transaction processing fees. We rely on third parties to provide secure and reliable payment transaction processing services, including the processing of credit and debit cards, and our co-branded credit card, and it could disrupt our business if these companies become unwilling or unable to provide these services to us. We are also subject to payment card association and network operating rules, including data security rules, certification requirements and rules governing electronic funds transfers, which could change over time. For example, we are subject to Payment Card Industry Data Security Standards, which contain stringent compliance guidelines and standards with regard to our security surrounding the physical and electronic storage, processing and transmission of individual cardholder data. We are also subject to a consent decree entered by the FTC in 2005 in connection with a complaint alleging that we had failed to adequately safeguard members’ personal data. Under the consent decree, we are required to maintain a comprehensive information security program that is reasonably designed to protect the security, confidentiality, availability and integrity of personal information collected from or about our members. In addition, if our third-party processor systems are breached or compromised, we may be subject to substantial fines, remediation costs, litigation and higher transaction fees and lose our ability to accept credit or debit card payments from our members, and our reputation, business and operating results could also be materially adversely affected.
Our security measures have been breached in the past and may be undermined in the future due to the actions of outside parties, including nation-state sponsored actors, team member error, internal or external malfeasance, or otherwise, and, as a result, an unauthorized party may obtain access to our data systems and misappropriate, alter, or destroy business and personal information, including payment card information. Such information may also be placed at risk, and has been compromised in the past, through our use of outside vendors, which may have data security systems that differ from those that we maintain or which are more vulnerable to breach. Any such incident could result in significant legal and financial exposure, damage to our reputation and harm to our relationship with our members, any of which could have an adverse effect on our business.
Our co-brand credit card program may be affected by economic and regulatory conditions.
Deterioration in economic conditions could adversely affect our co-brand credit card program, including the volume of new credit accounts, the amount of credit card balances and the ability of credit card holders to pay their balances. These conditions could result in the Company receiving lower payments under the co-branded credit card program. Additionally, new laws or regulations on credit card operations may impose certain requirements and limitations on credit card providers. Compliance with these regulations may negatively impact the operation of our co-branded credit card program, resulting in lower revenue streams derived from our co-branded credit card program.
We rely extensively on information technology to process transactions, compile results and manage our businesses. Failure or disruption of our primary and back-up systems could adversely affect our businesses.
Given the very high volume of transactions we process each year, it is important that we maintain uninterrupted operation of our business-critical computer systems and infrastructure. Our systems, including our back-up systems, are subject to damage or interruption from power outages, computer and telecommunications failures, computer viruses, internal or external security incidents, including tampering with hardware and breaches of our transaction processing or other systems that could
17
result in the compromise of confidential customer or team member data, ransomware or other malware attacks, social engineering, catastrophic events such as fires, earthquakes, tornadoes and hurricanes and errors by our team members. Phishing attacks have emerged as particularly pervasive, including as a means for ransomware attacks, which have increased in both frequency and breadth. If our systems or infrastructure are damaged or cease to function properly, we may have to make significant investments to fix or replace them, and we may suffer serious interruptions in our operations, which might not be short-lived, in the interim. Any material interruption to these systems or infrastructure could have a material adverse effect on our business and results of operations. In addition, the cost of securing our systems against failure or attack is considerable, and increases in these costs, particularly in the wake of a security incident, could be material.
Global or regional pandemics, epidemics or outbreaks of infectious disease, could have an adverse effect on our business, financial condition and results of operations.
The extent to which global or regional pandemics, epidemics or outbreaks of any highly infectious disease, including the emergence of additional COVID-19 variants, impacts our business, operations and financial condition will depend on future developments, which are highly uncertain and cannot be predicted with confidence, including the scope, severity and duration of such pandemic, the actions taken to contain the pandemic or mitigate its impact and the direct and indirect economic effects of the pandemic and containment measures, among others. Any global or regional pandemic, epidemic or outbreak of any highly infection disease, including the emergence of additional COVID-19 variants, may materially adversely affect our business, financial condition and results of operations, and may have the effect of heightening many of the risks described in this "Risk Factors" section, including:
•a complete or partial closure of, or a decrease in member traffic at, one or more of our clubs, due to government restrictions or the spread of disease among our team members or employees at a specific location;
•any difficulties and delays in obtaining products from our distributors and suppliers, delivering products to our clubs and adequately staffing our clubs and distribution centers;
•a decrease in consumer discretionary spending and confidence or changes in our members’ needs; and
•any inability to continue to provide our team members with appropriate compensation and protective measures and any limited access to our management, support staff and professional advisors.
Union attempts to organize our team members could disrupt our business.
In the past, unions have attempted to organize our team members at certain of our clubs and distribution centers. Our management and team members may be required to devote their time to respond to union activities, which could be distracting to our operations. Future union activities, including organizing efforts, slow-downs or work stoppages could negatively impact our business and results of operations. Changes in labor laws or regulations that promote union activity could also adversely impact our business. For example, in 2023, a unit in one of our clubs held a vote to unionize, however, the election results favored non-unionization.
Our comparable club sales and quarterly operating results may fluctuate significantly.
Our comparable club sales may be adversely affected for many reasons, including new club openings by our competitors, the opening of our own new clubs that may cannibalize existing club sales, cycling against strong sales in the prior year, by new clubs entering our comparable club base, by price reductions in response to competition, and by high rates of inflation or deflation.
Our quarterly operating results may be adversely affected by a number of factors including losses in new clubs, price changes in response to competitors’ prices, increases in operating costs, volatility in gasoline, energy and commodity prices, increasing penetration of sales of our private label brands (Wellsley Farms® and Berkley Jensen®), federal budgetary and tax policies, weather conditions, including natural disasters, local economic conditions and the timing of new club openings and related start-up costs.
Changes in our product mix or in our revenues from gasoline sales could negatively impact our revenue and results of operations.
Certain of our key performance indicators, including net sales, operating income and comparable club sales, could be negatively impacted by changes to our product mix or in the price of gasoline. For example, we continue to add private label products to our assortment of product offerings at our clubs, sold under our Wellsley Farms® and Berkley Jensen® private labels. We generally price these private label products lower than the manufacturer branded products of comparable quality that
18
we also offer. Accordingly, a shift in our sales mix in which we sell more units of our private label products and fewer units of our manufacturer branded products would have an adverse impact on our overall net sales. Also, as we continue to add gas stations to our club base and increase our sales of gasoline, our profit margins could be adversely affected. Since gasoline generates lower profit margins than the remainder of our business, we could expect to see our overall gross profit margin rates decline as sales of gasoline increase. Alternatively, if our gasoline sales decrease over the long term our profit margins may increase, though our net sales would decrease. In addition, gasoline prices have been historically volatile and may fluctuate widely due to changes in domestic and international supply and demand. Accordingly, significant changes in gasoline prices may substantially affect our net sales notwithstanding that the profit margin and unit sales for gasoline are largely unchanged, and this effect may increase as gasoline sales make up a larger portion of our revenue. Furthermore, our gasoline sales are influenced by the overall market demand for gasoline products. A decrease in overall market demand for gasoline products may result in lower gasoline sales at our gas stations negatively affecting our net sales.
Research analysts and stockholders may recognize and react to the foregoing changes to our key performance indicators and believe that they indicate a decline in our performance, and this could occur regardless of whether or not the underlying cause has an adverse impact on our profitability. If we suffer an adverse change to our key performance indicators, this could adversely affect the trading price of our common stock.
Product recalls could adversely affect our sales and results of operations.
If our merchandise offerings, including food and general merchandise products, do not meet applicable safety standards or our members’ expectations regarding safety, we could experience lost sales and increased costs and be exposed to legal and reputational risk. The sale of these items involves the risk of health-related illness or injury to our members. Such illnesses or injuries could result from tampering by unauthorized third parties, product contamination or spoilage, including the presence of foreign objects, substances, chemicals, other agents, or residues introduced during the growing, manufacturing, storage, handling and transportation phases, or faulty design. We are dependent on our vendors, including vendors located outside the United States, to ensure that the products we buy comply with all relevant safety standards. While all our vendors must comply with applicable product safety laws, it is possible that a vendor will fail to comply with these laws or otherwise fail to ensure the safety of its products. Further, while our vendors generally must agree to indemnify us in the case of loss, it is possible that a vendor will fail to fulfill that obligation.
If a recall does occur, we have procedures in place to notify our clubs and, if appropriate, the members who have purchased the goods in question. We determine the appropriateness of a recall on a case-by-case basis, based, in part, on the size of the recall, the severity of the potential impact to a member and our ability to contact the purchasers of the products in question. While we are subject to governmental inspections and regulations, and work to comply in all material respects with applicable laws and regulations, it is possible that consumption or use of our products could cause a health-related illness or injury in the future and that we will be subject to claims, lawsuits or government investigations relating to such matters. This could result in costly product recalls and other liabilities that could adversely affect our business and results of operations. Even if a product liability claim is unsuccessful or is not fully pursued, negative publicity could adversely affect our reputation with existing and potential members, as well as our corporate and brand image, including that of our Wellsley Farms® and Berkley Jensen® private labels, and could have long-term adverse effects on our business.
If we do not successfully maintain a relevant omnichannel experience for our members, our results of operations could be adversely impacted.
Omnichannel retailing is rapidly evolving, with the use of digital platforms by consumers continuing to increase, and we must keep pace with changing member expectations and new developments by our competitors. Our members are increasingly using mobile phones, tablets and other devices to shop and to interact with us through social media, with digitally-enabled comparable sales growth of 28.0% as of the fourth quarter of fiscal year 2023. We continue to make technology investments in our website and mobile application. If we are unable to make, improve or develop relevant member-facing technology in a timely manner, our ability to compete and our results of operations could be adversely affected.
We depend on the financial performance of our operations in the New York metropolitan area.
Our financial and operational performance is dependent on our operations in the New York metropolitan area, which accounted for 23% of net sales in fiscal year 2023. The New York metropolitan area is the city and suburbs of New York City, which includes Long Island and the Mid- and Lower Hudson Valley in the state of New York. It also includes north and central New Jersey, three counties in western Connecticut and five counties in northeastern Pennsylvania. We consider 44 of our clubs to be located in the New York metropolitan area. Any substantial slowing or sustained decline in these operations could materially adversely affect our business and financial results. Declines in financial performance of our operations in the New York metropolitan area could arise from, among other things, slower growth or declines in our comparable club sales;
19
negative trends in operating expenses, including increased labor, healthcare and energy costs; failing to meet targets for club openings; cannibalization of existing locations by new clubs; shifts in sales mix toward lower gross margin products; changes or uncertainties in economic conditions in this market, including higher levels of unemployment, depressed home values and natural disasters; regional economic problems; changes in local regulations; terrorist attacks; and failure to consistently provide a high quality and well-assorted mix of products to retain our existing member base and attract new members.
Our growth strategy to open new clubs involves risks.
Our long-term sales and income growth are dependent, to a certain degree, on our ability to open new clubs and gasoline stations in both existing markets and new markets. Opening new clubs is expensive and involves substantial risks that may prevent us from receiving an appropriate return on that investment. We may not be successful in opening new clubs and gasoline stations on the schedule we have planned or at all, and the clubs and gasoline stations we open may not be successful. Our expansion is dependent on finding suitable locations, which may be affected by local regulations, political opposition, construction and development costs, and competition from other retailers for particular sites. If prospective landlords find it difficult to obtain credit, we may need to own more new clubs rather than lease them. Owned locations require more initial capital than leased locations and therefore, the need to own new locations could constrain our growth. If we are able to secure new sites and open new locations, these locations may not be profitable for many reasons. For example, we may not be able to hire, train and retain a suitable work force to staff these locations or to integrate new clubs successfully into our existing infrastructure, either of which could prevent us from operating the clubs in a profitable manner. In addition, entry into new markets may bring us into competition with new or existing competitors with a stronger, more well-established market presence. We may also improperly judge the suitability of a particular site. Any of these factors could cause a site to lose money or otherwise fail to provide an adequate return on investment. If we fail to open new clubs as quickly as we have planned, our growth will suffer. If we open sites that we do not or cannot operate profitably, then our financial condition and results from operations could suffer.
Because we compete to a substantial degree on price, changes affecting the market prices of the goods we sell could adversely affect our net sales and operating profit.
It is an important part of our business plan that we offer value to our members, including offering prices that are substantially below certain of our competitors. Accordingly, we carefully monitor the market prices of the goods we sell in order to maintain our pricing advantage. If our competitors substantially lower their prices, we would be forced to lower our prices, which could adversely impact our margins and results of operations. In addition, the market price of the goods we sell can be influenced by general economic conditions. For example, if we experience a general deflation in the prices of the goods we sell, this would reduce our net sales and potentially adversely affect our operating income. Additionally, inflation can adversely affect us by increasing the costs of materials, labor and other costs. If we are unable to increase our prices to offset the effects of inflation, our business, results of operations and financial condition could be adversely affected.
Any harm to the reputation of our private label brands could have a material adverse effect on our results of operations.
We sell many products under our private label brands, Wellsley Farms® and Berkley Jensen®. Maintaining consistent product quality, competitive pricing and availability of these products is essential to developing and maintaining member loyalty to these brands. These products generally carry higher margins than manufacturer branded products of comparable quality carried in our clubs and represent a growing portion of our overall sales. If our private label brands experience a loss of member acceptance or confidence, our net sales and operating results could be adversely affected.
We may not be able to protect our intellectual property adequately, which, in turn, could harm the value of our brand and adversely affect our business.
We rely on our proprietary intellectual property, including trademarks, to market, promote and sell our products in our clubs. Our ability to implement our business plan successfully depends in part on our ability to build further brand recognition using our trademarks, service marks, proprietary products and other intellectual property, including our name and logos and the unique character and atmosphere of our clubs. We monitor and protect against activities that might infringe, dilute or otherwise violate our trademarks and other intellectual property, and rely on trademark and other laws of the United States.
We may be unable to prevent third parties from using our intellectual property without our authorization. To the extent we cannot protect our intellectual property, unauthorized use and misuse of our intellectual property could harm our competitive position and have a material adverse effect on our financial condition, cash flows or results of operations. Additionally, adequate remedies may not be available in the event of an unauthorized use or disclosure of our trade secrets or other intellectual property.
20
Additionally, we cannot be certain that we do not, or will not in the future, infringe on the intellectual property rights of third parties. From time to time, we have been subject to claims of third parties that we have infringed upon their intellectual property rights and we face the risk of such claims in the future. Even if we are successful in these proceedings, any intellectual property infringement claims against us could be costly, time-consuming and harmful to our reputation, and could divert the time and attention of our management and other personnel, or result in injunctive or other equitable relief that may require us to make changes to our business, any of which could have a material adverse effect on our financial condition, cash flows or results of operations. With respect to any third-party intellectual property that we use or wish to use in our business (whether or not asserted against us in litigation), we may not be able to enter into licensing or other arrangements with the owner of such intellectual property at a reasonable cost or on reasonable terms.
Our business is moderately seasonal and weak performance during one of our historically strong seasonal periods could have a material adverse effect on our operating results for the entire fiscal year.
Our business is moderately seasonal, with a meaningful portion of our sales dedicated to seasonal and holiday merchandise, resulting in the realization of higher portions of net sales, operating income and cash flows in the second and fourth fiscal quarters. Due to the importance of our peak sales periods, which include the spring and year-end holiday seasons, the second and fourth fiscal quarters have historically contributed, and are expected to continue to contribute, significantly to our operating results for the entire fiscal year. In anticipation of seasonal increases in sales activity during these periods, we incur significant additional expense prior to and during our peak seasonal periods, which we may finance with additional short-term borrowings. These expenses may include the acquisition of additional inventory, seasonal staffing needs and other similar items. As a result, any factors negatively affecting us during these periods, including adverse weather and unfavorable economic conditions, could have a material adverse effect on our results of operations for the entire fiscal year.
Implementation of technology initiatives could disrupt our operations in the near term and fail to provide the anticipated benefits.
As our business grows, we continue to make significant technology investments both in our operations and in our administrative functions. The costs, potential problems and interruptions associated with the implementation of technology initiatives could disrupt or reduce the efficiency of our operations in the near term. They may also require us to divert resources from our core business to ensure that implementation is successful. In addition, new or upgraded technology might not provide the anticipated benefits, in part because it might take longer than expected to realize the anticipated benefits, it may cost more than anticipated, and the technology might fail.
Inventory shrinkage could have a material adverse effect on our business, financial condition and results of operations.
We are subject to the risk of inventory loss and theft. Our inventory shrinkage rates have not been material, or fluctuated significantly in recent years, although it is possible that rates of inventory loss and theft in the future will exceed our estimates and that our measures will be ineffective in reducing our inventory shrinkage. Although some level of inventory shrinkage is an unavoidable cost of doing business, if we experience higher rates of inventory shrinkage or incur increased security costs to combat inventory theft, for example as a result of increased use of self-checkout technologies, it could have a material adverse effect on our business, results of operations and financial condition.
We are subject to risks associated with leasing substantial amounts of space.
We lease most of our retail properties, five of our eight Company-operated distribution centers and our home office. The profitability of our business is dependent on operating our current club base with favorable margins, opening and operating new clubs at a reasonable profit, renewing leases for clubs in desirable locations and, if necessary, identifying and closing underperforming clubs. We enter leases for a significant number of our club locations for varying terms. Typically, a large portion of a club’s operating expense is the cost associated with leasing the location.
We are typically responsible for taxes, utilities, insurance, repairs and maintenance for our leased retail properties. Our net lease cost for fiscal years 2023, 2022 and 2021 totaled $372.6 million, $368.0 million and $340.3 million, respectively. Our future minimum rental commitments for all operating leases in existence as of February 3, 2024 was $324.0 million for fiscal year 2024 and a total of $3.2 billion thereafter. We expect that certain new clubs may be leased to us, which will further increase our lease costs and require significant capital expenditures. We depend on cash flows from operations to pay our lease expenses and to fulfill our other cash needs. If our business does not generate sufficient cash flow from operating activities, and sufficient funds are not otherwise available to us from borrowings under our senior secured asset based revolving credit and term facility (the "ABL Revolving Facility") or other sources, we may not be able to service our lease expenses or fund our other liquidity and capital needs, which would materially affect our business.
21
The operating leases for our retail properties, distribution centers and corporate office expire at various dates through fiscal year 2045. Several leases have renewal options for various periods of time at our discretion. When leases for our clubs with ongoing operations expire, we may be unable to negotiate renewals, either on commercially acceptable terms, or at all. Further, if we attempt to relocate a club for which the lease has expired, we may be unable to find a new location for that club on commercially acceptable terms or at all, and the relocation of a club might not be successful for other reasons. Any of these factors could cause us to close clubs in desirable locations, which could have an adverse impact on our results of operations.
Over time, current club locations may not continue to be desirable because of changes in demographics within the surrounding area or a decline in shopping traffic, including traffic generated by other nearby clubs or a general shift away from in-store to digital shopping. We may not be able to terminate a particular lease if or when we would like to do so. If we decide to close clubs, we are generally required to continue to pay rent and operating expenses for the balance of the lease term, which could be expensive. Even if we are able to assign or sublease vacated locations where our lease cannot be terminated, we may remain liable on the lease obligations if the assignee or sublessee does not perform.
Non-compliance with privacy and information security laws, especially as it relates to maintaining the security of member-related personal information, may damage our business and reputation with members, or result in our incurring substantial additional costs and becoming subject to litigation.
The collection, use and processing of individually identifiable data, including personal health information, by our business is regulated at the federal and state levels. New privacy and information security laws and regulations continue to be passed or proposed and interpretations of existing laws change. As such, compliance with them may result in cost increases due to necessary system changes and the development of new administrative processes and may add additional complexity to our operations, require additional investment of resources in compliance programs, impact our business strategies and the availability of previously useful data and could result in increased compliance costs and/or changes in business practices and policies, as well as increase the risk of potential liability. If we fail to comply with these laws and regulations or experience a data security incident, our reputation could be damaged, possibly resulting in lost future business, and we could be subjected to additional legal or financial risk, including the imposition of fines or other penalties, as a result of non-compliance.
As most retailers and wholesale club operators do, we and certain of our service providers receive certain individually identifiable information, including personal health information, about our members. In addition, our online operations at bjs.com depend upon the secure transmission of confidential information over public networks. A compromise or failure of our security systems or those of some of our business partners that results in our members’ personal information being obtained by unauthorized persons could adversely affect our reputation with our members and others, as well as our operations, results of operations, financial condition and liquidity, and could result in litigation against us or the imposition of penalties. In addition, a security incident could require that we expend significant additional resources related to the security of information systems and could result in a disruption of our operations.
Federal, state, regional and local laws and regulations relating to the cleanup, investigation, use, storage, discharge and disposal of hazardous materials, hazardous and non-hazardous wastes and other environmental matters could adversely impact our business, financial condition and results of operations.
We are subject to a wide variety of federal, state, regional and local laws and regulations relating to the use, storage, discharge and disposal of hazardous materials, hazardous and non-hazardous wastes and other environmental matters. Failure to comply with these laws could result in harm to our members, team members or others; significant costs to satisfy environmental compliance, remediation or compensatory requirements, private party claims; or the imposition of severe penalties or restrictions on operations by governmental agencies or courts, all of which could adversely affect our business, financial condition, cash flows and results of operations. In addition, the risk of substantial costs and liabilities, including for the investigation and remediation of past or present contamination at our current or former properties (whether or not caused by us), are inherent in our operations, particularly with respect to our gasoline stations. There can be no assurance that substantial costs and liabilities for an investigation and remediation of contamination will not be incurred.
Our e-commerce business faces distinct risks, such as website disruptions, security incidents, delivery delays and hardware and software failures, and our failure to successfully manage it could have a negative impact on our profitability.
As our e-commerce business grows, we increasingly encounter the risks and difficulties that internet-based businesses face. The successful operation of our e-commerce business, and our ability to provide a positive shopping experience that will generate orders and drive subsequent visits depend on efficient and uninterrupted operation of our order-taking and fulfillment operations. Risks associated with our e-commerce business include, but are not limited to: uncertainties associated with our website, including changes in required technology interfaces, website downtime and other technical failures, costs and technical issues as we upgrade our website software, inadequate system capacity, computer viruses, human error, security incidents;
22
disruptions in telecommunications service or power outages; reliance on third parties for computer hardware and software and delivery of merchandise to our customers; rapid changes in technology; credit or debit card fraud and other payment processing related issues; changes in applicable federal and state regulations; liability for online content; cybersecurity and consumer privacy concerns and regulation; and reliance on third parties for same-day home delivery.
Problems in any of these areas could result in a reduction in sales; increased costs; sanctions or penalties; and damage to our reputation and brands. Further, if we invest substantial amounts in developing our e-commerce capabilities, these factors or others could prevent those investments from being effective.
In addition, we must keep up-to-date with competitive technology trends, including the use of new or improved technology, which may increase our costs and which may not increase sales or attract customers. If we are unable to allow real-time and accurate visibility into product availability when customers are ready to purchase, fulfill our customers’ orders quickly and efficiently use the fulfillment and payment methods they demand, provide a convenient and consistent experience for our customers regardless of the ultimate sales channel or manage our online sales effectively, our ability to compete and our results of operations could be adversely affected.
Furthermore, if our e-commerce business successfully grows, it may do so in part by attracting existing customers, rather than new customers, who choose to purchase products from us online rather than from our physical locations, thereby detracting from the financial performance of our clubs.
We are subject to a number of risks because we import some of our merchandise.
We imported approximately 3% of our merchandise directly from foreign countries such as China, Vietnam, Bangladesh and India during fiscal year 2023. In addition, many of our domestic vendors purchase a portion of their products from foreign sources.
Foreign sourcing subjects us to a number of risks generally associated with doing business abroad, including lead times, labor issues, shipping and freight constraints, product and raw material issues, political and economic conditions, government policies, tariffs and restrictions, epidemics and natural disasters.
If any of these or other factors were to cause supply disruptions or delays, our inventory levels may be reduced or the cost of our products may increase unless and until alternative supply arrangements could be made. We may have limited advance warning of such a disruption, which could impair our ability to purchase merchandise from alternative sources, or alternative sources might not be available. Merchandise purchased from alternative sources may be of lesser quality or more expensive than the merchandise we currently purchase abroad. Any shortages of merchandise (especially seasonal and holiday merchandise), even if temporary, could result in missed opportunities, reducing our sales and profitability. It could also result in our customers seeking and obtaining the products in question from our competitors.
In addition, reductions in the value of the U.S. dollar or increases in the value of foreign currencies could ultimately increase the prices that we pay for our products. We have not hedged our currency risk in the past and do not currently anticipate doing so in the future. All of our products manufactured overseas and imported into the United States are subject to duties collected by U.S. Customs and Border Protection. Increases in these duties would increase the prices we pay for these products, and we may not be able to fully recapture these costs in our pricing to customers. Further, we may be subjected to additional tariffs or penalties if we or our suppliers are found to be in violation of U.S. laws and regulations applicable to the importation of our products (including, but not limited to, prohibitions against entering merchandise by means of material negligently-made false statements or omissions). To the extent that any foreign manufacturers from whom we purchase products directly or indirectly employ business practices that vary from those commonly accepted in the United States, we could be hurt by any resulting negative publicity or, in some cases, potential claims of liability.
Because of our international sourcing, we could be adversely affected by violations of the U.S. Foreign Corrupt Practices Act and similar worldwide anti-bribery and anti-kickback laws.
We sourced approximately 3% of our merchandise abroad during fiscal year 2023. The U.S. Foreign Corrupt Practices Act and other similar laws and regulations generally prohibit companies and their intermediaries from making improper payments to non-U.S. officials for the purpose of obtaining or retaining business. While our policies mandate compliance with these anti-bribery laws, we cannot ensure that we will be successful in preventing our team members or other agents from taking actions in violation of these laws or regulations. Such violations, or allegations of such violations, could disrupt our business and result in a material adverse effect on our financial condition, cash flows and results of operations.
23
Factors associated with climate change could adversely affect our business.
We use natural gas, propane, diesel oil, refrigerants and electricity in our distribution and sale operations. Increased government regulations relating to climate change, including regulations designed to limit carbon dioxide and other greenhouse gas emissions may result in increased compliance costs and legislation or regulation affecting energy inputs, which could materially affect our profitability. Climate change could affect our ability to procure needed commodities at costs and in the quantities that we currently experience. We also sell a substantial amount of gasoline, the demand for which could be impacted by concerns about climate change and which could face increased regulation Additionally, climate change may be associated with extreme weather conditions and increased frequency of such conditions, such as more intense hurricanes, thunderstorms, tornadoes and snow or ice storms, as well as rising sea levels, which could cause significant physical and monetary damage to our clubs, including those we recently opened in Florida and Alabama, two states which have experienced such extreme weather conditions in the past several years. See “Natural disasters and other incidents beyond our control could negatively affect our business, financial condition and results of operations.” for more information.
Changes in accounting standards and subjective assumptions, estimates and judgments by management related to complex accounting matters could significantly affect our financial condition and results of operations.
We apply accounting principles and related pronouncements, implementation guidelines and interpretations to a wide range of matters that are relevant to our business, including, but not limited to self-insurance reserves, are highly complex and involve subjective assumptions, estimates and judgments by our management. Changes in these rules or their interpretation or changes in underlying assumptions, estimates or judgments by our management could significantly change our reported or expected financial performance.
Provisions for losses related to self-insured risks are generally based upon independent actuarial determined estimates. The assumptions underlying the ultimate costs of existing claim losses can be highly unpredictable, which can affect the liability recorded for such claims. For example, variability in health care cost inflation rates inherent in these claims can affect the amounts recognized. Similarly, changes in legal trends and interpretations, as well as changes in the nature and method of how claims are settled can impact ultimate costs. Although our estimates of liabilities incurred do not anticipate significant changes from historical trends for these variables, any changes could have a considerable effect upon future claim costs and currently recorded liabilities and could materially impact our consolidated financial statements.
Goodwill and identifiable intangible assets represent a significant portion of our total assets, and any impairment of these assets could adversely affect our results of operations.
Our goodwill and indefinite-lived intangible assets, which consist of goodwill and our trade name, represented a significant portion of our total assets as of February 3, 2024. Accounting rules require the evaluation of our goodwill and indefinite-lived intangible assets for impairment at least annually, or more frequently when events or changes in circumstances indicate that the carrying value of such assets may not be recoverable. Such indicators are based on market conditions and the operational performance of our business.
To test goodwill for impairment, we may initially use a qualitative approach to determine whether conditions exist to indicate that it is more likely than not that the fair value of a reporting unit is less than its carrying value. If our management concludes, based on its assessment of relevant events, facts and circumstances, that it is more likely than not that a reporting unit’s carrying value is greater than its fair value, then a quantitative analysis will be performed to determine if there is any impairment. We may initially also elect to perform a quantitative analysis. We estimate the reporting unit’s fair value by estimating the future cash flows of the reporting units to which the goodwill relates, and then we discount the future cash flows at a market-participant-derived weighted-average cost of capital. The estimates of fair value of the reporting unit is based on the best information available as of the date of the assessment. If the carrying value of the reporting unit exceeds its estimated fair value, then goodwill is impaired and is written down to the implied fair value amount.
To test our other indefinite-lived asset, our trade name, for impairment, we determine the fair value of our trade name using the relief-from-royalty method, which estimates the present value of royalty income that could be hypothetically earned by licensing the brand name to a third party over its remaining useful life. If, in conducting an impairment evaluation, we determine that the carrying value of an asset exceeded its fair value, we would be required to record a non-cash impairment charge for the difference between the carrying value and the fair value of the asset.
If a significant amount of our goodwill and identifiable intangible assets was deemed to be impaired, our business, financial condition and results of operations could be materially adversely affected.
24
We are a holding company with no operations of our own, and we depend on our subsidiaries for cash.
We are a holding company and do not have any material assets or operations other than ownership of the equity interests of our subsidiaries. Our operations are conducted almost entirely through our subsidiaries, and our ability to generate cash to meet our obligations or to pay dividends, if any, is highly dependent on the earnings of, and receipt of funds from, our subsidiaries through dividends or intercompany loans. The ability of our subsidiaries to generate sufficient cash flow from operations to allow us and them to make scheduled payments on our debt obligations will depend on their future financial performance, which will be affected by a range of economic, competitive and business factors, many of which are outside of our control. We cannot assure our stockholders that the cash flow and earnings of our operating subsidiaries will be adequate for our subsidiaries to service their debt obligations. If our subsidiaries do not generate sufficient cash flow from operations to satisfy corporate obligations, we may have to undertake alternative financing plans (such as refinancing), restructure debt, sell assets, reduce or delay capital investments, or seek to raise additional capital. We cannot assure our stockholders that any such alternative refinancing would be possible, that any assets could be sold, or, if sold, of the timing of the sales and the amount of proceeds realized from those sales, that additional financing could be obtained on acceptable terms, if at all, or that additional financing would be permitted under the terms of our various debt instruments then in effect. Our inability to generate sufficient cash flow to satisfy our obligations, or to refinance our obligations on commercially reasonable terms, could have a material adverse effect on our business, financial condition and results of operations.
Furthermore, we and our subsidiaries may incur substantial additional indebtedness in the future that may severely restrict or prohibit our subsidiaries from making distributions, paying dividends, if any, or making loans to us.
Risks Relating to Our Indebtedness
We face risks related to our indebtedness.
As of February 3, 2024, our total outstanding debt was $717.4 million. Our leverage could expose us to interest rate risk associated with our variable rate debt and prevent us from meeting our obligations under our ABL Revolving Facility and First Lien Term Loan. Our indebtedness could have important consequences to us, including: limiting our ability to deduct interest in the taxable period in which it is incurred in light of the Tax Cuts and Jobs Act and exposing us to the risk of increased interest rates as substantially all of our borrowings are at variable rates.
The occurrence of any one of these events could have an adverse effect on our business, financial condition, results of operations and ability to satisfy our obligations under our indebtedness.
We and our subsidiaries may be able to incur substantial additional indebtedness in the future, subject to the restrictions contained in the credit agreements governing our ABL Revolving Facility and First Lien Term Loan.
The ABL Revolving Facility and First Lien Term Loan impose significant operating and financial restrictions on us and our subsidiaries that may prevent us from pursuing certain business opportunities and restrict our ability to operate our business.
The credit agreements governing our ABL Revolving Facility and First Lien Term Loan contain covenants that restrict our, and our subsidiaries’, ability to take various actions, such as: incur or guarantee additional indebtedness or issue certain disqualified or preferred stock; pay dividends or make other distributions on, or redeem or purchase, any equity interests or make other restricted payments; make certain acquisitions or investments; create or incur liens; transfer or sell assets; incur restrictions on the payments of dividends or other distributions from our restricted subsidiaries; alter the business that we conduct; enter into transactions with affiliates; and consummate a merger or consolidation or sell, assign, transfer, lease or otherwise dispose of all or substantially all of our assets.
The restrictions in the credit agreements governing our ABL Revolving Facility and First Lien Term Loan also limit our ability to plan for or react to market conditions, meet capital needs or otherwise restrict our activities or business plans and adversely affect our ability to finance our operations, enter into acquisitions or to engage in other business activities that could be in our interest.
In addition, our ability to borrow under the ABL Revolving Facility is limited by the amount of our borrowing base. Any negative impact on the elements of our borrowing base, such as accounts receivable and inventory could reduce our borrowing capacity under the ABL Revolving Facility.
25
We may be unable to generate sufficient cash flow to satisfy our debt service obligations, which could have a material adverse effect on our business, financial condition and results of operations.
Our ability to make principal and interest payments on and to refinance our indebtedness will depend on our ability to generate cash in the future and is subject to general economic, financial, competitive, legislative, regulatory, tax and other factors that are beyond our control. If our business does not generate sufficient cash flow from operations, in the amounts projected or at all, or if future borrowings are not available to us in amounts sufficient to fund our other liquidity needs, our business financial condition and results of operations could be materially adversely affected. If we cannot generate sufficient cash flow from operations to make scheduled principal and interest payments in the future, we may need to refinance all or a portion of our indebtedness on or before maturity, sell assets, delay capital expenditures or seek additional equity. The terms of our existing or future debt agreements, including the First Lien Term Loan and the ABL Revolving Facility, may also restrict us from affecting any of these alternatives. Further, changes in the credit and capital markets, including market disruptions and interest rate fluctuations, may increase the cost of financing, make it more difficult to obtain favorable terms, or restrict our access to these sources of future liquidity. Our ABL Revolving Facility is scheduled to mature on July 28, 2027 and our First Lien Term Loan Facility is scheduled to mature on February 3, 2029. See "Liquidity and Capital Resources." If we are unable to refinance any of our indebtedness on commercially reasonable terms or at all or to effect any other action relating to our indebtedness on satisfactory terms or at all, it could have a material adverse effect on our business, financial condition and results of operations.
Risks Relating to Ownership of our Common Stock
The market price of our common stock may fluctuate significantly.
The market price of our common stock depends on various factors that may be unrelated to our operating performance or prospects. We cannot assure you that the market price of our common stock will not fluctuate or decline significantly in the future. A number of factors could negatively affect, or result in fluctuations in, the price or trading volume of our common stock, including: quarterly variations in our operating results compared to market expectations; changes in the preferences of our customers; low comparable club sales growth compared to market expectations; delays in the planned openings of new clubs; the failure of securities analysts to cover the Company or changes in financial estimates by the analysts who cover us, our competitors or the grocery or retail industries in general and the wholesale club segment in particular; economic, legal and regulatory factors unrelated to our performance; changes in consumer spending or the housing market; or increased competition or stock price performance of our competitors.
As a result of these factors, you may not be able to resell your shares at or above the price at which you purchased them. In addition, our stock price may be volatile. The stock market in general has experienced extreme price and volume fluctuations that have often been unrelated or disproportionate to the operating performance of companies like us. Accordingly, these broad market fluctuations, as well as general economic, political and market conditions, such as recessions or interest rate changes, may significantly reduce the market price of the common stock, regardless of our operating performance. In the past, following periods of market volatility, stockholders have instituted securities class action litigation. If we were to become involved in securities litigation, it could result in substantial costs and divert resources and our management’s attention from other business concerns, regardless of the outcome of such litigation.
Our ability to raise capital in the future may be limited.
Our business and operations may consume resources faster than we anticipate. In the future, we may need to raise additional funds through the issuance of new equity securities, debt or a combination of both. Additional financing may not be available on favorable terms, or at all. If adequate funds are not available on acceptable terms, we may be unable to fund our capital requirements. If we issue new debt securities, the debt holders would have rights senior to common stockholders to make claims on our assets, and the terms of any debt could restrict our operations, including our ability to pay dividends on our common stock. If we issue additional equity securities, existing stockholders will experience dilution, and the new equity securities could have rights senior to those of our common stock. Because our decision to issue securities in any future offering will depend on market conditions and other factors beyond our control, we cannot predict or estimate the amount, timing or nature of our future offerings. Thus, our stockholders bear the risk of our future securities offerings reducing the market price of our common stock and diluting their interest.
26
We cannot guarantee that we will repurchase our common stock pursuant to our share repurchase program or that our share repurchase program will enhance long-term stockholder value. Share repurchases could also increase the volatility of the price of our common stock and could diminish our cash reserves.
The timing and amount of repurchases of shares of our common stock, if any, will depend upon several factors, including market and business conditions, the trading price of our common stock, our cost of capital and the nature of other investment opportunities. The Inflation Reduction Act of 2022 imposes a non-deductible 1% excise tax on the fair market value of stock repurchases, net of stock issuances, commencing in 2023 that exceed $1 million in a taxable year, which will make our share repurchase program more expensive to us. Our share repurchase program may be limited, suspended or discontinued at any time without prior notice. In addition, repurchases of our common stock pursuant to our share repurchase program could affect our stock price and increase its volatility. The existence of our share repurchase program could cause our stock price to be higher than it would be in the absence of such a program and could potentially reduce the market liquidity for our stock. Additionally, our share repurchase program could diminish our cash reserves, which may impact our ability to finance future growth and to pursue possible future strategic opportunities and acquisitions. There can be no assurance that any share repurchases will enhance stockholder value because the market price of our common stock may decline below the levels at which we repurchased shares of stock. Although our share repurchase program is intended to enhance long-term stockholder value, there is no assurance that it will do so and short-term stock price fluctuations could reduce the effectiveness of the program. Our share repurchase program may be suspended or terminated at any time without notice.
If securities or industry analysts do not publish or cease publishing research or reports about us, or if they issue unfavorable commentary about us or our industry or downgrade our common stock, the price of our common stock could decline.
The trading market for our common stock depends in part on the research and reports that third-party securities analysts publish about us and our industry. One or more analysts could downgrade our common stock or issue other negative commentary about us or our industry. In addition, we may be unable or slow to attract research coverage. Alternatively, if one or more of these analysts cease coverage of us, we could lose visibility in the market. As a result of one or more of these factors, the trading price of our common stock could decline.
Some provisions of our charter documents and Delaware law may have anti-takeover effects that could discourage an acquisition of us by others, even if an acquisition would be beneficial to our stockholders and may prevent attempts by our stockholders to replace or remove our current management.
Provisions in our amended and restated certificate of incorporation and our amended and restated bylaws, as well as provisions of the Delaware General Corporation Law (the "DGCL"), could make it more difficult for a third party to acquire us or increase the cost of acquiring us, even if doing so would benefit our stockholders, including transactions in which stockholders might otherwise receive a premium for their shares. These provisions include: allowing the total number of directors to be determined exclusively (subject to the rights of holders of any series of preferred stock to elect additional directors) by resolution of our board of directors and granting to our board of directors the sole power to fill any vacancy on the board; limiting the ability of stockholders to remove directors without cause; authorizing the issuance of "blank check" preferred stock by our board of directors, without further stockholder approval, to thwart a takeover attempt; prohibiting stockholder action by written consent (and, thus, requiring that all stockholder actions be taken at a meeting of our stockholders); eliminating the ability of stockholders to call a special meeting of stockholders; establishing advance notice requirements for nominations for election to the board of directors or for proposing matters that can be acted upon at annual stockholder meetings; requiring the approval of the holders of at least two-thirds of the voting power of all outstanding stock entitled to vote thereon, voting together as a single class, to amend or repeal our certificate of incorporation or bylaws; and electing not to be governed by Section 203 of the DGCL.
These anti-takeover defenses could discourage, delay or prevent a transaction involving a change in control of our Company. These provisions could also discourage proxy contests and make it more difficult for other stockholders to elect directors of their choosing and cause us to take corporate actions other than those our stockholders desire.
We are exposed to risks relating to evaluations of controls required by Section 404 of the Sarbanes-Oxley Act.
We are required to comply with Section 404 of the Sarbanes-Oxley Act, which requires management assessments of the effectiveness of internal control over financial reporting and disclosure controls and procedures. If we are unable to maintain effective internal control over financial reporting or disclosure controls and procedures, our ability to record, process and report financial information accurately and to prepare financial statements within required time periods could be adversely affected, which could subject us to litigation or investigations requiring management resources and payment of legal and other expenses, negatively affect investor confidence in our financial statements, restrict access to capital markets and adversely impact our stock price.
27
We do not currently expect to pay any cash dividends.
We currently anticipate that we will retain future earnings for the operation and expansion of our business and do not expect to pay any cash dividends on shares of our common stock in the foreseeable future. We are a holding company, and substantially all of our operations are carried out by our operating subsidiaries. Any inability on the part of our subsidiaries to make payments to us could have a material adverse effect on our business, financial condition and results of operations. Under our ABL Revolving Facility and First Lien Term Loan, our operating subsidiaries are significantly restricted in their ability to pay dividends or otherwise transfer assets to us, and we expect these limitations to continue in the future. Our ability to pay dividends may also be limited by the terms of any future credit agreement or any future debt or preferred equity securities of ours or of our subsidiaries. Accordingly, realization of a gain on your investment will depend on the appreciation of the price of our common stock, which may never occur. Stockholders seeking cash dividends in the foreseeable future should not purchase our common stock.
Our amended and restated certificate of incorporation designates the Court of Chancery of the State of Delaware as the exclusive forum for certain litigation that may be initiated by our stockholders, which could limit our stockholders’ ability to obtain a favorable judicial forum for disputes with us.
Our amended and restated certificate of incorporation provides that the Court of Chancery of the State of Delaware will be the sole and exclusive forum for (i) any derivative action or proceeding brought on our behalf, (ii) any action asserting a claim of breach of a fiduciary duty owed to us or our stockholders by any of our directors, officers, employees or agents, (iii) any action asserting a claim against us arising under any provisions of the DGCL, our amended and restated certificate of incorporation or our amended and restated bylaws, or (iv) any action asserting a claim against us that is governed by the internal affairs doctrine. This forum selection provision will not apply to any causes of action arising under the Securities Act of 1933, as amended, or the Exchange Act. As a stockholder in our Company, you are deemed to have notice of and have consented to the provisions of our amended and restated certificate of incorporation related to choice of forum. The choice of forum provision in our amended and restated certificate of incorporation may limit your ability to obtain a favorable judicial forum for disputes with us.
General Risk Factors
Our success depends on our ability to attract and retain a qualified management team and other team members while controlling our labor costs.
We are dependent upon several key management and other team members. If we were to lose the services of one or more of our key team members, this could have a material adverse effect on our operations. Our continued success also depends upon our ability to attract and retain highly qualified team members to meet our future growth needs while controlling related labor costs. Our ability to control labor costs is subject to numerous external factors, including healthcare costs and prevailing wage rates, which may be affected by, among other factors, competitive wage pressure, minimum wage laws and general economic conditions. If we experience competitive labor markets, either regionally or in general, we may have to increase our wages in order to attract and retain highly qualified team members, which could increase our selling, general and administrative expenses ("SG&A") and adversely affect our operating income. We compete with other retail and non-retail businesses for these employees and invest significant resources in training them. There is no assurance that we will be able to attract or retain highly qualified team members to operate our business.
Insurance claims could adversely impact our results of operations.
We use a combination of insurance and self-insurance plans to provide for potential liability for workers’ compensation, general liability, property, cyber, trucking liability, fiduciary liability and employee and retiree health care. Liabilities associated with the risk retained by the Company are estimated based on historical claims experience and other actuarial assumptions believed to be reasonable under the circumstances. Our results of operations could be adversely impacted if actual future occurrences and claims differ from our assumptions and historical trends.
Certain legal proceedings could adversely impact our results of operations.
We are involved in a number of legal proceedings involving employment issues, personal injury, product liability, consumer matters, intellectual property claims and other litigation. Certain of these lawsuits, if decided adversely to us or settled by us, may result in material liability. See the notes to our audited financial statements included elsewhere in this Annual Report on Form 10-K for additional information. Further, we are unable to predict whether unknown claims may be brought against us that could become material.
28
We could be subject to additional income tax liabilities.
We compute our income tax provision based on enacted federal and state tax rates. As tax rates vary among jurisdictions, a change in earnings attributable to the various jurisdictions in which we operate could result in an unfavorable change in our overall tax provision. Additionally, changes in the enacted tax rates, adverse outcomes in tax audits, including potential future transfer pricing disputes, or any change in the pronouncements relating to accounting for income taxes could have a material adverse effect on our financial condition and results of operations.
Adverse developments affecting the financial services industry, such as actual events or concerns involving liquidity, defaults, or non-performance by financial institutions or transactional counterparties, could adversely affect the Company’s current and projected business operations and its financial condition and results of operations.
Actual events involving limited liquidity, defaults, non-performance or other adverse developments that affect financial institutions, transactional counterparties or other companies in the financial services industry or the financial services industry generally, or concerns or rumors about any events of these kinds or other similar risks, have in the past and may in the future lead to market-wide liquidity problems. For example, on March 10, 2023, Silicon Valley Bank (“SVB”) was closed by the California Department of Financial Protection and Innovation, which appointed the Federal Deposit Insurance Corporation (“FDIC”) as receiver. Although we are not a borrower or party to any such instruments with SVB or any other financial institution currently in receivership, if any of our lenders or counterparties to any such instruments were to be placed into receivership, we may be unable to access such funds. In addition, if any of our customers, suppliers or other parties with whom we conduct business are unable to access funds pursuant to such instruments or lending arrangements with such a financial institution, such parties’ ability to pay their obligations to us or to enter into new commercial arrangements requiring additional payments to us could be adversely affected. Furthermore, while we did not hold any cash directly at SVB, we regularly maintain cash balances at third-party financial institutions more than the FDIC insurance limit and there is no guarantee that the federal government would guarantee all depositors if such financial institutions were to fail, as they did with SVB depositors, in the event of further bank closures and continued instability in the global banking system. Any future adverse developments in the global banking system could directly or indirectly negatively impact our results of operations.
In addition, an economic downturn or investor concerns regarding the U.S. or international financial systems could result in less favorable commercial financing terms, including higher interest rates or costs and tighter financial and operating covenants, or systemic limitations on access to credit and liquidity sources, thereby making it more difficult for us to acquire financing on acceptable terms or at all. Any decline in available funding generally or our or our customers or suppliers access to cash and liquidity resources could, among other risks, adversely impact our liquidity or ability to meet our operating demands or result in breaches of our financial and/or contractual obligations.
Item 1B. Unresolved Staff Comments
None.
Item 1C. Cybersecurity
Cyber Risk Management and Strategy
At BJ’s, we recognize the importance of information security practices designed to protect the confidentiality, integrity, and availability of company information and the personal information that our members share with us. We have implemented a cybersecurity program in accordance with our risk profile and business that is informed by recognized industry standards and frameworks, and incorporates elements of the same, including elements of the National Institute of Standards and Technology Cybersecurity Framework (“NIST CSF”), International Organization for Standardization (“ISO”) 27001 and Payment Card Industry Data Security Standard (“PCI DSS”) standards.
Our cybersecurity risk assessment program includes a number of components, including information security program assessments, audits and maturity assessments, that are conducted periodically by both internal and external resources. Our internal audit function also conducts regular assessments of different systems to provide the audit committee with information on our cybersecurity risk management processes.
As part of our cybersecurity risk management program, we take a risk-based approach to the evaluation of third-party vendors, and apply mitigations and processes based on our evaluation of the sensitivity of the data accessed by the vendor and the maturity of the vendor’s programs. Our vendor evaluation procedures include, as appropriate, the completion of a vendor security questionnaire and our implementation of vendor monitoring programs. We have not identified any cybersecurity incidents or threats that have materially affected us or are reasonably likely to materially affect us, including our business
29
strategy, results of operations, or financial condition. However, like other companies in our industry, we and our third-party vendors have from time-to-time experienced threats and security incidents that could affect our information or systems.
Governance Related to Cybersecurity Risks
Our Chief Information Officer (“CIO”) is responsible for the strategic leadership and direction of the Company’s information technology organization. Prior to joining BJ’s in 2023, our current CIO served as global chief information officer at a public healthcare company, where she led information technology, privacy assurance, cyber, digital and data security across key business units. She has also held various chief information officer and technology leadership roles at several other healthcare companies and a multinational pharmaceutical corporation, along with other senior management positions during her career.
The CIO and the VP of IT Security and Compliance regularly report to senior management and the board on the governance aspects of our data security program. The CIO and the VP of IT Security and Compliance are also members of our information security steering committee, which is comprised of executives throughout the Company who oversee areas such as finance, operations, legal, human resources, strategy and development, digital, and commercial. This committee meets regularly to, as relevant, discuss oversight of the Company’s cybersecurity program, program enhancements and new risks or threats that the Company might be facing.
The board of directors has overall responsibility for risk oversight, including, as part of regular board meetings, general oversight of executives’ management of risks relevant to the Company. The VP of IT Security and Compliance provides an annual cybersecurity update to the board. While the full board has overall responsibility for risk oversight, it is supported in this function by various committees, including principally its audit committee.
The audit committee, pursuant to its charter, is responsible for overseeing risk management processes related to cybersecurity. The audit committee assists the board in fulfilling its risk oversight responsibilities by periodically reviewing our enterprise risk management program. Through its meetings with management, including the compliance and information technology functions, the audit committee reviews and discusses significant areas of our business and summarizes the key areas of risk and relevant mitigating factors for the board.
Item 2. Properties
We operated 243 warehouse club locations as of February 3, 2024, of which 204 are leased under long-term leases and 19 are owned. We own the buildings at the remaining 20 locations, which are subject to long-term ground leases. A listing of the number of Company locations in each state is shown under "Part I. Item 1. Business."
The Company’s leases require long-term rental payments subject to various adjustments. Generally, the Company is required to pay insurance, real estate taxes and other operating expenses and, in some cases, additional rentals based on a percentage of sales in excess of certain thresholds, or other factors. Many of the leases require escalating payments during the lease term. Rent expense for such leases is recognized on a straight-line basis over the lease term. The initial primary term of the Company’s operating leases for properties ranges from 2 to 44 years, with most of these leases having an initial primary term of approximately 20 years. The initial primary term of the Company’s finance leases for properties is 20 years.
We transitioned to a new home office in Marlborough, Massachusetts in fiscal year 2022. The home office, which is referred to as our "Club Support Center" occupies a total of 188,000 square feet. The lease expires on August 31, 2042. We terminated the lease on our prior home office in Westborough, Massachusetts in January of fiscal year 2022.
We operate three cross-dock distribution centers for non-perishable items and also have four perishable item distribution centers which were acquired from Burris Logistics in the second quarter of fiscal year 2022. Our cross-dock distribution centers for non-perishable items are leased under lease agreements expiring between 2031 and 2033, and range between 480,000 and 630,000 square feet in size. One of the perishable distribution centers is leased under an lease agreement expiring October 31, 2028 and the remaining three facilities are owned. The perishable distribution centers range between 114,000 and 252,000 square feet in size.
We operate another cross-dock distribution center primarily for business-to-business transactions, which occupies a total of approximately 100,000 square feet. Our lease agreement for this center expires in 2029.
See "Note 6. Leases" of our consolidated financial statements included in this Annual Report on Form 10-K for additional information with respect to our leases.
30
Item 3. Legal Proceedings
We are subject to various litigation, claims and other proceedings that arise from time to time in the ordinary course of business. We believe these actions are routine and incidental to the business. While the outcome of these actions cannot be predicted with certainty, management does not believe that any will have a material adverse impact on our business.
Item 4. Mine Safety Disclosures
Not applicable.
31
PART II
Item 5. Market for Registrant’s Common Equity, Related Stockholder Matters and Issuer Purchases of Equity Securities
Market Information
Our common stock trades on the NYSE under the symbol "BJ". As of the end of business on March 6, 2024, the trading price of our common stock closed at $72.15 per share.
Holders
As of March 6, 2024, there were approximately four record holders of our common stock. This number does not include beneficial owners whose shares were held in street name.
Dividends
We do not currently expect to pay any cash dividends on our common stock for the foreseeable future. Instead, we intend to retain future earnings, if any, for the future operation and expansion of our business and the repayment of debt or repurchase of common stock. Any determination to pay dividends in the future will be at the discretion of our board of directors and will depend upon our results of operations, cash requirements, financial condition, contractual restrictions, restrictions imposed by applicable laws and other factors that our board of directors may deem relevant.
Performance Graph
The following graph illustrates a comparison of the cumulative total return on our common stock with the cumulative total return for (i) the S&P 500 Index and (ii) the S&P 500 Retail Index for the period from February 2, 2019 through February 3, 2024. The graph assumes an investment of $100 in our common stock and in each index at market close on February 2, 2019
32
and the reinvestment of all dividends. The comparisons in the table are not intended to forecast or be indicative of possible future performance of our common stock.
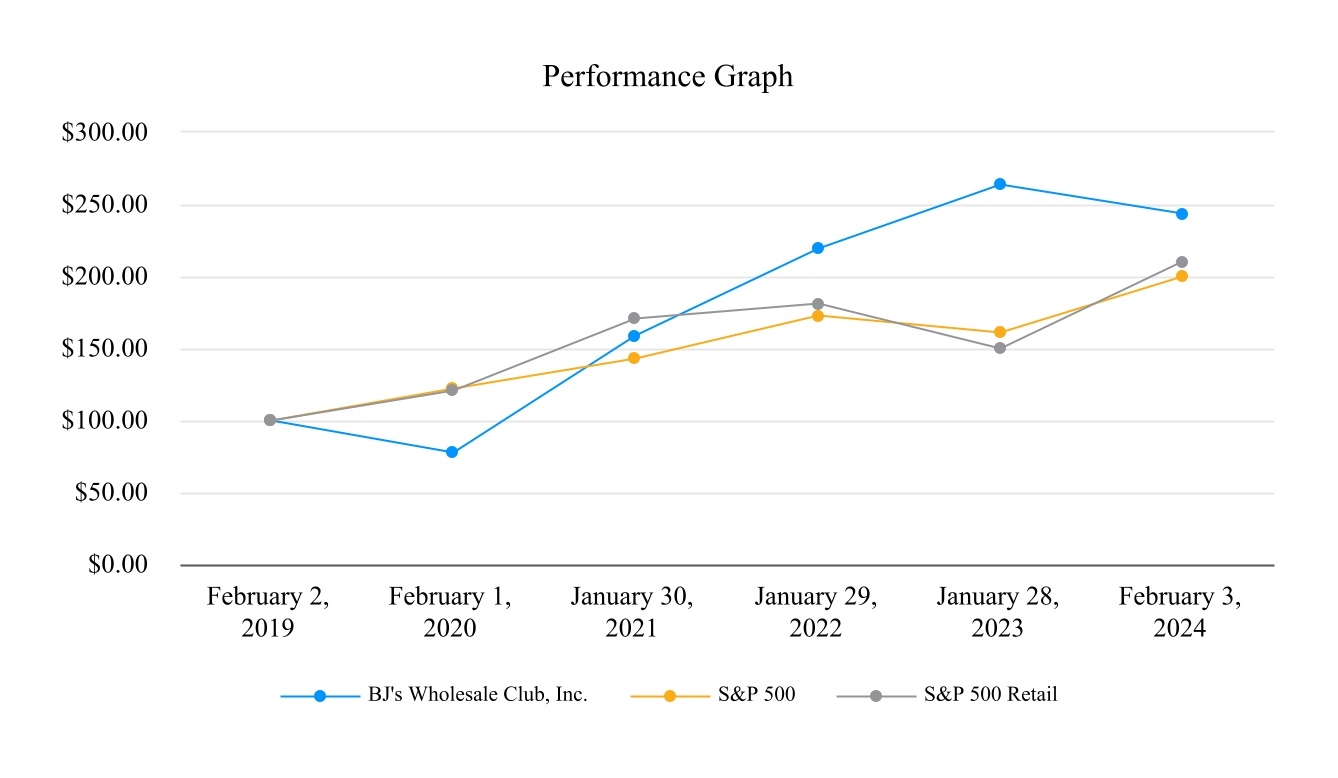
| February 2, 2019 | February 1, 2020 | January 30, 2021 | January 29, 2022 | January 28, 2023 | February 3, 2024 | ||||||||||||||||||||||||||||||
| BJ’s Wholesale Club, Inc. | $ | 100.00 | $ | 77.52 | $ | 158.93 | $ | 218.85 | $ | 263.32 | $ | 243.71 | |||||||||||||||||||||||
| S&P 500 | 100.00 | 121.56 | 142.53 | 172.46 | 161.03 | 199.42 | |||||||||||||||||||||||||||||
| S&P 500 Retail | 100.00 | 120.61 | 170.52 | 180.58 | 149.54 | 210.02 | |||||||||||||||||||||||||||||
Issuer Purchases of Equity Securities
The following table sets forth information regarding our purchases of shares of our common stock during the fourth quarter of fiscal year 2023:
| Period | Total Number of Shares Purchased (1) | Average Price Paid per Share(2) | Total Number of Shares Purchased as Part of Publicly Announced Plans or Programs | Approximate Dollar Value of Shares that May Yet Be Purchased Under the Plans or Programs (3) (in thousands) | ||||||||||||||||||||||
| October 29, 2023 to November 25, 2023 | 248,996 | $ | 68.06 | 246,000 | $ | 225,208 | ||||||||||||||||||||
| November 26, 2023 to December 30, 2023 | 176,952 | 65.09 | 176,952 | 213,691 | ||||||||||||||||||||||
| December 31, 2023 to February 3, 2024 | 374,104 | 65.21 | 374,104 | 189,294 | ||||||||||||||||||||||
| Total | 800,052 | 797,056 | ||||||||||||||||||||||||
(1)Includes 2,996 shares of common stock for the period October 29, 2023 to November 25, 2023 surrendered to the Company by employees to satisfy their tax withholding obligations in connection with the vesting of restricted stock awards. See "Note 12. Treasury Shares and Share Repurchase Programs" in the Notes to Audited Consolidated Financial Statements included in this Annual Report on Form 10-K.
33
(2)Excludes the impact of excise tax imposed on share repurchases pursuant to the Inflation Reduction Act.
(3)As disclosed by the Company on November 18, 2021, the Company’s board of directors approved a share repurchase program (the "2021 Repurchase Program") on November 16, 2021, that allows the Company to repurchase up to $500.0 million of its outstanding common stock. The 2021 Repurchase Program expires in January 2025.
Recent Sales of Unregistered Securities
None.
Securities Authorized for Issuance Under Equity Compensation Plans
The following table provides information as of February 3, 2024, regarding our common stock that may be issued under the BJ’s Wholesale Club Holdings, Inc. 2018 Incentive Award Plan (the "2018 Incentive Award Plan"), the Fourth Amended and Restated 2011 Stock Option Plan of BJ’s Wholesale Club Holdings, Inc., as amended (the "2011 Stock Option Plan"), the 2012 Director Stock Option Plan of BJ’s Wholesale Club Holdings, Inc., as amended (the "2012 Director Stock Option Plan") and the BJ’s Wholesale Club Holdings, Inc. Employee Stock Purchase Plan.
| Plan category: | Number of Securities to be Issued Upon Exercise of Outstanding Options, Warrants, and Rights (a) | Weighted-average Exercise Price of Outstanding Options, Warrants, and Rights (b) | Number of Securities Remaining Available for Future Issuance Under Equity Compensation Plans (Excluding Securities Reflected in Column (a)) (c) | |||||||||||||||||
| Equity compensation plans approved by stockholders | ||||||||||||||||||||
2018 Incentive Award Plan (1) | 2,315,809 | (2) | $ | 20.84 | (3) | 4,925,874 | ||||||||||||||
| 2011 Stock Option Plan | 24,741 | 6.89 | — | |||||||||||||||||
| 2012 Director Stock Option Plan | 11,813 | 7.00 | — | |||||||||||||||||
ESPP (4) | — | 2,407,504 | (5) | |||||||||||||||||
| Total equity compensation plans approved by stockholders | 2,352,363 | 7,333,378 | ||||||||||||||||||
| Equity compensation plans not approved by stockholders | — | — | ||||||||||||||||||
| Total equity compensation plans approved and not approved by stockholders | 2,352,363 | 7,333,378 | ||||||||||||||||||
(1)In connection with our IPO, we adopted the 2018 Incentive Award Plan and will not make future grants or awards under the 2011 Stock Option Plan or the 2012 Director Stock Option Plan. The shares available for grant under the 2018 Incentive Award Plan includes 985,369 shares of common stock that, as of July 2, 2018, remained available for issuance, collectively, under the 2011 Stock Option Plan and the 2012 Director Stock Option Plan.
(2)Includes (i) 21,726 shares of common stock issuable pursuant to restricted stock units outstanding, (ii) 1,618,318 shares of common stock issuable upon the exercise of outstanding options, and (iii) 675,765 shares of common stock issuable pursuant to performance stock units as of February 3, 2024.
(3)Because there is no exercise price associated with the restricted stock units and performance stock units, such units are not included in the weighted-average exercise price calculation.
(4)Does not include purchase rights accruing under the ESPP because the purchase price (and therefore the number of shares to be purchased) will not be determined until the end of the purchase period.
(5)The aggregate number of shares of common stock reserved for issuance under our ESPP is equal to the sum of (i) 973,014 shares and (ii) an annual increase on the first day of each calendar year beginning in 2019 and ending in 2028 equal to the lesser of (A) 486,507 shares, (B) 0.5% of the shares outstanding (on an as converted basis) on the last day
34
of the immediately preceding fiscal year and (C) such smaller number of shares as determined by the board of directors.
Item 6. Reserved
Not applicable.
Item 7. Management’s Discussion and Analysis of Financial Condition and Results of Operations
The following discussion and analysis is intended to promote understanding of the results of operations and financial condition of the Company and is provided as a supplement to, and should be read in conjunction with, our audited consolidated financial statements and related notes thereto included in Item 8. in this Annual Report on Form 10-K. The following discussion contains forward-looking statements that reflect our plans, estimates and assumptions. Our actual results could differ materially from those discussed in the forward-looking statements. Factors that could cause such differences are discussed in "Item 1A. Risk Factors".
We report on the basis of a 52- or 53-week fiscal year, which ends on the Saturday closest to the last day of January. Accordingly, references herein to "fiscal year 2023", "fiscal year 2022" and "fiscal year 2021" relate to the 53-weeks ended February 3, 2024 and to the 52-weeks ended January 28, 2023 and January 29, 2022, respectively.
Overview
BJ’s Wholesale Club is a leading operator of membership warehouse clubs concentrated primarily on the eastern half of the United States. We deliver significant value to our members, consistently offering 25% or more savings on a representative basket of manufacturer-branded groceries compared to traditional supermarket competitors. We provide a curated assortment focused on groceries, continuously refreshed general merchandise, gasoline and other ancillary services, coupon books, and promotions to deliver a differentiated shopping experience that is further enhanced by our omnichannel capabilities.
Since pioneering the warehouse club model in New England in 1984, we have grown our footprint to 244 large-format, high volume warehouse clubs and 175 gas stations spanning 20 states as of the date of this filing. In our core New England market, which has high population density and generates a disproportionate part of U.S. GDP, we operate more than three times the number of clubs compared to the next largest warehouse club competitor. In addition to shopping in our clubs, members are able to shop when and how they want through our website, bjs.com, and our highly rated mobile app, which allows them to use our BOPIC service, curbside delivery, same-day home delivery or traditional ship-to-home service, as well as through the DoorDash and Instacart marketplaces where members receive the same preferential pricing as in-club shoppers by linking their membership. We also offer Same-Day Select, which offers BJ’s members the ability to pay a one-time fee for either unlimited or twelve same-day grocery deliveries over a one-year period.
Our goal is to offer our members significant value and a meaningful return in savings on their annual membership fee. We have over 7 million members paying annual fees to gain access to savings on groceries and general merchandise and services. The annual membership fee for our Club Card membership is generally $55, and the annual membership fee for our Club+ membership, which offers additional value-enhancing features, is generally $110. We believe that members can save over ten times their $55 Club Card membership fee versus what they would otherwise pay at traditional supermarket competitors when they spend $2,500 or more per year at BJ’s on manufacturer-branded groceries. In addition to providing significant savings on a representative basket of manufacturer-branded groceries, we accept all manufacturer coupons and also carry our own exclusive brands that enable members to save on price without compromising on quality. Our two private label brands, Wellsley Farms® and Berkley Jensen®, represent approximately $4.1 billion in annual sales. Our customers recognize the relevance of our value proposition across economic environments, as demonstrated by over 25 consecutive years of membership fee income growth. Our membership fee income was $420.7 million for fiscal year 2023.
Our business is moderately seasonal in nature. Historically, our business has realized a slightly higher portion of net sales, operating income, and cash flows from operations in the second and fourth fiscal quarters, attributable primarily to the impact of the summer and year-end holiday season, respectively. Our quarterly results have been, and will continue to be, affected by the timing of new club openings and their associated pre-opening expenses. As a result of these factors, our financial results for any single quarter or for periods of less than a year are not necessarily indicative of the results that may be achieved for a full fiscal year.
35
Factors Affecting Our Business
Overall economic trends
The overall economic environment and related changes in consumer behavior have a significant impact on our business. In general, positive conditions in the broader economy promote customer spending in our clubs, while economic weakness, which generally results in a reduction of customer spending, may have a different or more extreme effect on spending at our clubs. Macroeconomic factors that can affect customer spending patterns, and thereby our results of operations, include, among others, employment rates, changes to the Supplemental Nutrition Assistance Program (SNAP), government stimulus programs, tax legislation, business conditions, changes in the housing market, the availability of credit, interest rates and inflation, tax rates and fuel and energy costs. In addition, unemployment rates and benefits may cause us to experience higher labor costs.
Size and loyalty of membership base
The membership model is a critical element of our business. Members drive our results of operations through their membership fee income and their purchases. The majority of members renew within six months following their renewal date. Therefore, our renewal rate is a trailing calculation that captures renewals during the period seven to eighteen months prior to the reporting date. We have grown our membership fee income each year for over 25 consecutive years and the quality of our membership mix is strong as evidenced by our higher tier penetration growth in fiscal year 2023. Our membership fee income totaled $420.7 million in fiscal year 2023. Our tenured membership renewal rate, a key indicator of membership engagement, satisfaction and loyalty, was 90% at the end of fiscal year 2023.
Effective sourcing and distribution of products and consumer demands
Our net sales and gross profit are affected by our ability to purchase our products in sufficient quantities at competitive prices. Further, our ability to maintain our appeal to existing customers and attract new customers primarily depends on our ability to originate, develop and offer a compelling product assortment responsive to customer preferences. As a result, our level of net sales could be adversely affected due to constraints in our supply chain, including our inability to procure and stock sufficient quantities of some merchandise in a manner that is able to match market demand from our customers.
Infrastructure investment
Our historical operating results reflect the impact of our ongoing investments to support our growth. We have made significant investments in our business that we believe have laid the foundation for continued profitable growth. We believe that expanding our club footprint, bringing substantially all of our end-to-end perishable supply chain in-house, enhancing our information systems, including our distribution center and transportation management systems, and investing in hardware and digitally enabled shopping capabilities for convenience, such as BOPIC, curbside pickup, and same-day home delivery will enable us to replicate our profitable club format and provide a differentiated shopping experience. We expect these infrastructure investments to support our successful operating model across our club operations.
Gasoline prices
The market price of gasoline impacts our net sales and comparable club sales, and large fluctuations in the price of gasoline may produce a short-term impact on our margins. Retail gasoline prices are driven by daily crude oil and wholesale commodity market changes and are volatile, as they are influenced by factors that include changes in demand and supply of oil and refined products, global geopolitical events, regional market conditions, and supply interruptions caused by severe weather conditions. Typically, the change in crude oil prices impacts the purchase price of wholesale petroleum fuel products, which in turn impacts retail gasoline prices at the pump. During times when prices are particularly volatile, differences in pricing and procurement strategies between the Company and its competitors may lead to temporary margin contraction or expansion, depending on whether prices are rising or falling, and this impact could affect our overall results for a fiscal quarter.
In addition, the relative level of gasoline prices from period to period may lead to differences in our net sales between those periods. Further, because we generally attempt to maintain a fairly stable gross profit per gallon, this variance in net sales, which may be substantial, may or may not have a significant impact on our operating income.
36
Inflation and deflation trends
Our financial results can be directly impacted by substantial changes in product costs due to commodity cost fluctuations or general inflation, disinflation, or deflation, which could lead to a reduction in our sales, as well as greater margin pressure, as costs may not be able to be passed on to consumers. Changes in commodity prices and changes in inflation rates have impacted several categories of our business in fiscal year 2023 and may continue to do so. Inflationary volatility can be attributed to macro economic factors including supply chain disruptions, government stimulus, interest rates, and other factors. In response to general inflationary volatility, we seek to minimize the impact of such events by sourcing our merchandise from different vendors, changing our product mix or increasing our pricing when necessary.
Results of Operations
Information pertaining to fiscal year 2022 was included in the Company’s Annual Report on Form 10-K for the year ended January 28, 2023 in Part II. "Item 7. Management’s Discussion and Analysis of Financial Position and Results of Operations," which was filed with the SEC on March 16, 2023.
The following tables summarize key components of our results of operations for the periods indicated:
| Statement of Operations Data | Fiscal Year Ended | ||||||||||
| (dollars in thousands, except per share amounts) | February 3, 2024 | January 28, 2023 | |||||||||
| Net sales | $ | 19,548,011 | $ | 18,918,435 | |||||||
| Membership fee income | 420,678 | 396,730 | |||||||||
| Total revenues | 19,968,689 | 19,315,165 | |||||||||
| Cost of sales | 16,326,129 | 15,883,677 | |||||||||
| Selling, general and administrative expenses | 2,822,513 | 2,668,569 | |||||||||
| Pre-opening expenses | 19,628 | 24,933 | |||||||||
| Operating income | 800,419 | 737,986 | |||||||||
| Interest expense, net | 64,527 | 47,462 | |||||||||
| Income from continuing operations before income taxes | 735,892 | 690,524 | |||||||||
| Provision for income taxes | 212,240 | 176,262 | |||||||||
| Income from continuing operations | 523,652 | 514,262 | |||||||||
| Income (loss) from discontinued operations, net of income taxes | 89 | (1,085) | |||||||||
| Net income | $ | 523,741 | $ | 513,177 | |||||||
| Weighted-average shares outstanding—basic | 133,047 | 134,017 | |||||||||
Basic EPS (a) | $ | 3.94 | $ | 3.83 | |||||||
| Weighted-average shares outstanding—diluted | 135,118 | 136,473 | |||||||||
Diluted EPS (a) | $ | 3.88 | $ | 3.76 | |||||||
| Operational Data: | |||||||||||
| Total clubs at end of period | 243 | 235 | |||||||||
Comparable club sales (b) | (1.0) | % | 13.4 | % | |||||||
Merchandise comparable club sales (b) | 1.7 | % | 6.5 | % | |||||||
Adjusted EBITDA (b) (c) | $ | 1,082,129 | $ | 1,009,209 | |||||||
| Net cash provided by operating activities | 718,883 | 788,165 | |||||||||
Adjusted free cash flow (b) | 264,118 | 417,628 | |||||||||
| Membership renewal rate | 90 | % | 90 | % | |||||||
(a) Basic and diluted EPS are calculated using net income.
(b) See "Fiscal Year 2023 Compared to Fiscal Year 2022," "Non-GAAP Financial Measures" and "Liquidity and Capital Resources" within "Item 7. Management’s Discussion and Analysis of Financial Condition and Results of Operations" for definitions.
(c) Adjusted EBITDA for the fiscal year ended January 28, 2023 has been recast to exclude adjustments for pre-opening expenses and non-cash rent expense to conform to the current period definition.
37
Fiscal Year 2023 Compared to Fiscal Year 2022
Net Sales
Net sales are derived from direct retail sales to our customers, net of merchandise returns and discounts. Fluctuations in net sales are impacted by opening new clubs and comparable club sales.
Net sales for fiscal year 2023 were $19.5 billion, a 3.3% increase from net sales reported for fiscal year 2022 of $18.9 billion. The increase was due primarily to strength in the grocery division and an increase of eight clubs, partially offset by lower gasoline sales.
Comparable Club Sales and Merchandise Comparable Club Sales
We believe net sales is an important driver of our profitability, particularly comparable club sales. Comparable club sales, a key performance indicator, also known as same-store sales in the retail industry, includes all clubs that were open for at least 13 months at the beginning of the period and were in operation during the entirety of both periods being compared, including relocated clubs and expansions. Comparable club sales allow us to evaluate how our club base is performing by measuring the change in period-over-period net sales in clubs that have been open for the applicable period.
Various factors affect comparable club sales, including customer preferences and trends, product sourcing, promotional offerings and pricing, shopping frequency from new and existing members and the amount they spend on each visit, weather and holiday shopping period timing and length. Sales comparisons can be influenced by certain factors that are beyond our control such as changes in the cost of gasoline and macro-economic factors such as inflation. The higher comparable club sales, the more we can leverage certain of our selling, general and administrative ("SG&A") expenses, reducing them as a percentage of sales and enhancing profitability.
| Fiscal Year Ended February 3, 2024 | |||||
| Comparable club sales | (1.0) | % | |||
| Less: Impact from gasoline sales | (2.7) | % | |||
| Merchandise comparable club sales | 1.7 | % | |||
Merchandise comparable club sales increased by 1.7% in fiscal year 2023 driven by an increase in sales of groceries of approximately 3.5%, partially offset by a decrease in sales of general merchandise and services of approximately 8.2%.
Sales of groceries increased during fiscal year 2023 as demand for paper products, beverages, candy, snacks, fresh fruit and vegetables, dairy and bakery categories increased compared to fiscal year 2022, partially offset by a decrease in demand for meat and seafood categories.
General merchandise and service sales decreased during fiscal year 2023 due to decreased demand for home goods and seasonal merchandise, as well as lower ancillary income, compared to fiscal year 2022.
The impact of gasoline sales is a result of lower retail prices during fiscal year 2023 as compared to fiscal year 2022, as total gallons sold grew year-over-year.
Membership fee income
We continue to see growth in the size of our membership base and continued quality.
Membership fee income was $420.7 million in fiscal year 2023, compared to $396.7 million in fiscal year 2022, a 6.0% increase. The increase was primarily driven by membership renewals, new members, and penetration of higher-tier membership levels, evidencing the strength of our membership quality.
Cost of sales
Cost of sales consists primarily of the direct cost of merchandise and gasoline sold at our clubs, including costs associated with operating our distribution centers, including payroll, payroll benefits, occupancy costs, and depreciation; freight expenses associated with moving merchandise from vendors to our distribution centers and from distribution centers to our clubs; and vendor allowances, rebates, and cash discounts.
38
Cost of sales was $16.3 billion, or 83.5% of net sales, in fiscal year 2023, compared to $15.9 billion, or 84.0% of net sales, in fiscal year 2022. Merchandise gross margin rate, which excludes gasoline sales and membership fee income, increased 50 basis points compared to fiscal year 2022. Merchandise margins were positively impacted by our category management process, moderated supply chain costs, and the mix of sales.
Selling, general, and administrative expenses
SG&A consists of various expenses related to supporting and facilitating the sale of merchandise in our clubs, including the following: payroll and payroll benefits for team members; rent, depreciation, and other occupancy costs for retail and corporate locations; share-based compensation, advertising expenses; tender costs, including credit and debit card fees; amortization of intangible assets; and consulting, legal, insurance, acquisition and integration costs, and other professional services expenses.
SG&A includes both fixed and variable components and, therefore, is not directly correlated with net sales. We expect that our SG&A will increase in future periods due to investments to spur comparable club sales growth and our expanding footprint as we open new clubs. In addition, any future increases in wages, stock-based grants or modifications will increase our SG&A.
SG&A increased by 5.8% to $2.8 billion in fiscal year 2023 from $2.7 billion in fiscal year 2022. The year-over-year increase in SG&A was primarily driven by increased labor, occupancy, and depreciation expenses as a result of new club and gas station openings, as well as other continued investments to drive strategic priorities, such as the restructuring of certain corporate functions. Our growth profile this year was weighted toward owned clubs as opposed to leased clubs, elevating our depreciation expense. We expect to continue to invest in member engagement, marketing and digital strategies.
Pre-opening expenses
Pre-opening expenses include startup costs for new clubs and costs for relocated clubs. Expenses will vary based on the number of club openings, geography of the club, whether the club is owned or leased, and timing of the opening relative to our period end.
Pre-opening expenses were $19.6 million in fiscal year 2023 compared to $24.9 million in fiscal year 2022. Pre-opening expenses decreased due to timing of spend for club openings year-over-year.
Interest expense, net
Interest expense, net was $64.5 million for fiscal year 2023 compared to $47.5 million for fiscal year 2022. The increase was primarily due to rising interest rates year-over-year on outstanding borrowings.
Provision for income taxes
The Company’s effective income tax rate from continuing operations was 28.8% for fiscal year 2023 and 25.5% for fiscal year 2022. The increases in the effective tax rate and income tax expense were driven by lower tax benefits from stock-based compensation as well as an immaterial adjustment to certain deferred tax assets related to prior periods.
Non-GAAP Financial Measures
The accompanying Consolidated Financial Statements, including the related notes, are presented in accordance with generally accepted accounting principles ("GAAP"). In addition to relevant GAAP measures we also provide non-GAAP measures, including adjusted EBITDA, comparable club sales, adjusted free cash flow, adjusted net income, and adjusted net income per diluted share ("adjusted EPS") because management believes these metrics are useful to investors and analysts by excluding items that we do not believe are indicative of our core operating performance. These measures are customary for our industry and commonly used by competitors. These non-GAAP financial measures should not be reviewed in isolation or considered as an alternative to any other performance measure derived in accordance with GAAP and should not be construed as an inference that our future results will be unaffected by unusual or non-recurring items. In addition, adjusted EBITDA, comparable club sales, adjusted free cash flow, adjusted net income, and adjusted EPS may not be comparable to similarly titled measures used by other companies in our industry or across different industries.
Adjusted Net Income
The adjusted net income and adjusted EPS metrics are important measures used by management to compare the performance of core operating results between periods. We define adjusted net income as net income as reported, adjusted for
39
non-recurring, infrequent, or unusual charges, net of the tax impact of such adjustments. We define adjusted EPS as adjusted net income divided by the weighted-average diluted shares outstanding.
We believe adjusted net income and adjusted EPS are useful metrics to investors and analysts because they present more accurate year-over-year comparisons for our net income and net income per diluted share because adjusted items are not the result of our normal operations.
| Fiscal Year Ended | |||||||||||
| (in thousands, except per share amounts) | February 3, 2024 | January 28, 2023 | |||||||||
| Net income as reported | $ | 523,741 | $ | 513,177 | |||||||
| Adjustments: | |||||||||||
Acquisition and integration costs (a) | — | 12,324 | |||||||||
Home office transition costs (b) | — | 14,706 | |||||||||
| Loss on termination and impairment of discontinued operations club lease | — | 662 | |||||||||
Charges related to debt (c) | 1,830 | 3,256 | |||||||||
Restructuring (d) | 13,940 | — | |||||||||
Other adjustments (e) | (786) | (165) | |||||||||
Tax impact of adjustments to net income (f) | (4,188) | (8,718) | |||||||||
| Adjusted net income | $ | 534,537 | $ | 535,242 | |||||||
| Weighted-average diluted shares outstanding | 135,118 | 136,473 | |||||||||
Adjusted EPS (g) | $ | 3.96 | $ | 3.92 | |||||||
(a) | Represents costs related to the acquisition and integration of assets of Burris Logistics, including due diligence, legal, and other consulting expenses. | ||||
(b) | Represents incremental rent expense, termination fee, other non-recurring lease costs, and write-off of impaired assets as the Company transitioned home office locations in fiscal 2022. | ||||
(c) | Represents the expensing of fees, deferred fees, and original issue discount associated with the extinguishment of the ABL Facility in fiscal 2022 and amendment of the senior secured first lien term loan in fiscal 2022 and 2023. | ||||
(d) | Represents charges related to the restructuring of certain corporate functions including, costs for severance, retention, outplacement, and consulting fees. | ||||
(e) | Other non-cash items related to the reclassification into earnings of accumulated other comprehensive income/ loss associated with the de-designation of hedge accounting and other adjustments. | ||||
(f) | Represents the tax effect of the above adjustments at a statutory tax rate of approximately 28%. | ||||
(g) | Adjusted EPS is measured using weighted-average diluted shares outstanding. | ||||
Adjusted EBITDA
Adjusted EBITDA is defined as income from continuing operations before interest expense, net, provision for income taxes and depreciation and amortization, adjusted for the impact of certain other items, including stock-based compensation expense; acquisition and integration costs; home office transition costs; restructuring and other adjustments.
40
The following is a reconciliation of our income from continuing operations to Adjusted EBITDA and Adjusted EBITDA as a percentage of net sales for the periods presented:
| Fiscal Year Ended | |||||||||||
| February 3, 2024 | January 28, 2023 | ||||||||||
(In thousands) | |||||||||||
Income from continuing operations | $ | 523,652 | $ | 514,262 | |||||||
Interest expense, net | 64,527 | 47,462 | |||||||||
Provision for income taxes | 212,240 | 176,262 | |||||||||
Depreciation and amortization | 227,696 | 200,934 | |||||||||
Stock-based compensation expense | 39,021 | 42,617 | |||||||||
Acquisition and integration costs (a) | — | 12,324 | |||||||||
Home office transition costs (b) | — | 14,706 | |||||||||
Restructuring (c) | 13,940 | — | |||||||||
Other adjustments (d) | 1,053 | 642 | |||||||||
Adjusted EBITDA (e) | $ | 1,082,129 | $ | 1,009,209 | |||||||
Adjusted EBITDA as a percentage of net sales | 5.5 | % | 5.3 | % | |||||||
__________
(a) | Represents costs related to the acquisition and integration of assets from Burris Logistics, including due diligence, legal, and other consulting expenses. | ||||
(b) | Represents incremental rent expense, termination fee, other non-recurring lease costs, and write-off of impaired assets as the Company transitioned home office locations in fiscal 2022. | ||||
(c) | Represents charges related to the restructuring of certain corporate functions, including costs for severance, retention, outplacement, and consulting fees. | ||||
(d) | Other non-cash items, including non-cash accretion on asset retirement obligations and obligations associated with our post-retirement medical plan. | ||||
(e) | Adjusted EBITDA for the fiscal year ended January 28, 2023 has been recast to exclude adjustments for pre-opening expenses and non-cash rent expense to conform to the current period definition. | ||||
Liquidity and Capital Resources
Our primary sources of liquidity are cash flows generated from club operations and borrowings from our ABL Revolving Facility. As of February 3, 2024, cash and cash equivalents totaled $36.0 million and we had $802.3 million of unused capacity under our ABL Revolving Facility. Our principal liquidity needs for the next twelve months and beyond are to fund normal recurring operational expenses and anticipated capital expenditures; fund possible acquisitions; fund share repurchases and meet debt service and principal repayment obligations. We believe that our current resources, together with anticipated cash flows from operations and borrowing capacity under our ABL Revolving Facility, will be sufficient to finance our operations for at least the next twelve months.
During fiscal year 2023, we repurchased 1,958,218 shares under the 2021 Repurchase Program for a total purchase price of $130.2 million.
We do not have any off-balance sheet arrangements that have, or are, in the opinion of management, reasonably likely to have, a current or future material effect on our results of operations or financial position. We do, however, enter into letters of credit and purchase obligations in the normal course of our operations.
41
Summary of Cash Flows
A summary of our cash flows from operating, investing and financing activities is presented in the following table:
| Fiscal Year Ended | |||||||||||
| February 3, 2024 | January 28, 2023 | ||||||||||
| (In thousands) | |||||||||||
| Net cash provided by operating activities | $ | 718,883 | $ | 788,165 | |||||||
| Net cash used in investing activities | (454,765) | (747,058) | |||||||||
| Net cash used in financing activities | (261,984) | (52,628) | |||||||||
| Net increase (decrease) in cash and cash equivalents | $ | 2,134 | $ | (11,521) | |||||||
Net Operating Cash Flows
Net cash provided by operating activities was $718.9 million for fiscal year 2023, compared to $788.2 million for fiscal year 2022. The $69.3 million decrease was primarily due to $95.3 million related to accounts payable as a result of timing of inventory receipts and payments, as well as commodity and fuel costs; $49.4 million of lease-related activity primarily due to prepaid rent based on the timing of year-end; $28.7 million related to an increase in merchandise inventory due to the increase in club counts and fuel stations; and $18.7 million related to prepaid expenses and other current assets driven by prepaid advertising and IT maintenance contracts due to the timing of year-end. The decrease in net operating cash flows was partially offset by a $71.7 million reduction in accounts receivable due to favorable timing of vendor and customer cash receipts, as well as a $10.6 million increase in net income, inclusive of increases of $26.8 million of depreciation and amortization expense and $27.5 million of deferred income tax expense.
Our net cash from operating activities can fluctuate from period to period due to several factors, including: the timing and mix of sales, which are typically higher in the second and fourth quarters due to seasonality; the timing of inventory purchases as the Company prepares for holiday seasons, lease-related activity, income tax and other payments.
Net Investing Cash Flows
Cash used in investing activities was $454.8 million in fiscal year 2023, compared to $747.1 million in fiscal year 2022. The decrease is primarily due to $376.5 million of cash outflows in the prior year related to the Acquisition, partially offset by an increase in capital spending, net of proceeds from sale-leaseback transactions, of $84.2 million as our growth profile in fiscal year 2023 was weighted toward owned clubs as opposed to leased clubs.
Net Financing Cash Flows
Cash used in financing activities in fiscal year 2023 was $262.0 million, compared to $52.6 million in fiscal year 2022. The increase in cash used in fiscal year 2023 is primarily due to a $491.0 million reduction in net proceeds from our ABL Revolving Facility, partially offset by a net decrease of $253.0 million of principal payments on long-term debt, a decrease of $17.1 million for the acquisition of treasury stock, and an increase of $11.3 million of proceeds from financing obligations compared to the prior year.
Adjusted Free Cash Flow
We present adjusted free cash flow because we use it to report to our board of directors and we believe it assists investors and analysts in evaluating our liquidity. Adjusted free cash flow should not be considered as an alternative to cash flows from operations as a liquidity measure. We define adjusted free cash flow as net cash provided by operating activities less additions to property and equipment, net of disposals, plus proceeds from sale-leaseback transactions.
42
The following is a reconciliation of our net cash provided by operating activities to adjusted free cash flow for the periods presented:
Fiscal Year Ended | |||||||||||
| February 3, 2024 | January 28, 2023 | ||||||||||
(In thousands) | |||||||||||
Net cash provided by operating activities | $ | 718,883 | $ | 788,165 | |||||||
Less: Additions to property and equipment, net of disposals | (467,075) | (397,803) | |||||||||
Plus: Proceeds from sale-leaseback transactions | 12,310 | 27,266 | |||||||||
Adjusted free cash flow | $ | 264,118 | $ | 417,628 | |||||||
Adjusted free cash flow decreased to $264.1 million for fiscal year 2023 compared to $417.6 million for fiscal year 2022. The decrease is primarily the result of lower cash flows from operating activities primarily due to unfavorable fluctuations in working capital, an increase in capital spending as we open new clubs, and lower proceeds from sale-leaseback transactions.
Debt and Borrowing Capacity
Our primary sources of borrowing capacity are the ABL Revolving Facility and the First Lien Term Loan, which are further discussed in "Note 7. Debt and Credit Arrangements" of our consolidated financial statements included in this Annual Report on Form 10-K.
On July 28, 2022, the Company entered into the ABL Revolving Facility with an aggregate ABL Revolving Commitment of $1.2 billion pursuant to that certain credit agreement with Bank of America, N.A., as administrative agent and collateral agent, and other lenders party thereto. The maturity date of the ABL Revolving Facility is July 28, 2027. As part of this transaction, the Company extinguished the ABL Facility.
On January 5, 2023, the Company amended the First Lien Term Loan to extend the maturity date from February 3, 2024 to February 3, 2027 and transition the interest rate, from LIBOR to SOFR and change the applicable margin from LIBOR plus 200 – 225 basis points per annum to SOFR plus 275 basis points per annum. In connection with the amendment the Company paid approximately $151.9 million of the principal amount.
On January 28, 2023, there was $405.0 million outstanding in loans under the ABL Revolving Facility and $11.5 million in outstanding letters of credit. The interest rate on the revolving credit facility was 5.63%.
On January 28, 2023, the interest rate for the First Lien Term Loan was 7.11% and there was $450.0 million outstanding.
On October 12, 2023, the Company amended the First Lien Term Loan to extend the maturity date from February 3, 2027 to February 3, 2029 and reduce applicable margin in respect of the interest rate, effective immediately, from SOFR plus 275 basis points per annum to SOFR plus 200 basis points per annum. Prior to the amendment, the Company repaid $50.0 million of the principal amount outstanding under the First Lien Term Loan.
At February 3, 2024, there was $319.0 million outstanding in loans under the ABL Revolving Facility and $18.2 million in outstanding letters of credit. The interest rate on the revolving credit facility was 6.44%, and unused capacity was $802.3 million.
At February 3, 2024, the interest rate for the First Lien Term Loan was 7.33% and there was $400.0 million outstanding.
Material Cash Commitments
Refer to the descriptions of our material cash commitments, financing arrangements, and contractual obligations outlined below within the following notes to our consolidated financial statements.
See “Note 6. Leases” for future operating lease and finance lease commitments. Lease liabilities exclude legally binding minimum lease payments for certain real estate and gas station leases that have not yet commenced. The liabilities do not include variable costs such as increases in rental payments based on an index or a percentage of sales, insurance, real estate taxes, and other operating expenses.
See “Note 7. Debt and Credit Arrangements” for future payments on the ABL Revolving Facility and First Lien Term Loan, including outstanding borrowings and applicable interest rates.
43
See “Note 17. Other Non-current Liabilities” for long-term liabilities for which it is not reasonably possible for us to predict when they may be paid, including insurance reserves and asset retirement obligations, as well as financing obligations arising from sale-leaseback transactions.
We also have cancellable and non-cancellable purchase obligations under purchase orders for merchandise, agreements for capital items, gasoline, products and services used in our business, information technology, executive employment, and other agreements.
Critical Accounting Policies and Estimates
The preparation of our financial statements in conformity with accounting principles generally accepted in the United States requires management to make estimates and assumptions that affect the reported amounts of assets and liabilities and the disclosure of contingent liabilities at the date of the financial statements and the reported amounts of revenues and expenses during the reporting period. We review our estimates on an ongoing basis and make judgments about the carrying value of assets and liabilities based on a number of factors. These factors include historical experience and assumptions made by management that are believed to be reasonable under the circumstances. Although management believes the judgment applied in preparing estimates is reasonable based on circumstances and information known at the time, actual results could vary materially from estimates based on assumptions used in the preparation of our consolidated financial statements. This section summarizes critical accounting policies and the related judgments involved in their application.
Workers’ Compensation and General Liability Self-insurance Reserves
We are primarily self-insured for workers’ compensation and general liability claims. Amounts in excess of certain levels, which range from $0.3 million to $1.0 million per occurrence for workers' compensation and general liability, and up to $2.0 million per occurrence for auto liability, are insured as a risk reduction strategy to mitigate the impact of catastrophic losses on net income. Reported reserves for claims are derived from estimated ultimate costs based upon individual claim file reserves and estimates for incurred but not reported claims. The estimates are developed utilizing actuarial methods and are based on historical claims experience and other actuarial assumptions related to loss development factors. The inherent uncertainty of future loss projections could cause actual claims to differ from our estimates. When historical losses are not a good measure of future liability, we base our estimates of ultimate liability on our interpretation of current law, claims filed to date and other relevant factors which are subject to change. These accruals, if any, are included as insurance reserves in accrued expenses and other current liabilities and other non-current liabilities in the Company’s consolidated balance sheets.
Recent Accounting Pronouncements
See "Note 2. Summary of Significant Accounting Policies" of our consolidated financial statements included in this Annual Report on Form 10-K for additional information regarding recently issued accounting pronouncements.
Item 7A. Quantitative and Qualitative Disclosures About Market Risk
The primary market risk we are exposed to is interest rate risk and changes in rates will impact our net interest expense and our cash flow from operations. Substantially all of our borrowings carry variable interest rates, and we expect that some of our future outstanding debt will have variable interest rates. Accordingly, we seek to limit the impact of interest rate changes on earnings and cash flows and to lower our overall borrowing costs and may use interest rate caps and/or swap agreements in the future to manage our interest rate risks relating to such variable rate debt. Increases in interest rates can result in increased interest expense under our variable rate debt as well as when any of our fixed rate debt matures and needs to be refinanced and an increase in interest rates could have a material impact on our cash flow.
As of February 3, 2024, our total debt outstanding was $719.0 million, which included $319.0 million under our ABL Revolving Facility and $400.0 million under our First Lien Term Loan at interest rates of 6.44% and 7.33%, respectively. See "Note 7. Debt and Credit Arrangements" of our consolidated financial statements included in this Annual Report on Form 10-K for additional information. A 100 basis point change in prevailing market rates would cause annual interest costs to change by approximately $7.2 million.
44
Item 8. Financial Statements and Supplementary Data
INDEX TO FINANCIAL STATEMENTS
| Page | |||||
Report of Independent Registered Public Accounting Firm (PCAOB ID | |||||
45
Report of Independent Registered Public Accounting Firm
To the Board of Directors and Stockholders of BJ’s Wholesale Club Holdings, Inc.
Opinions on the Financial Statements and Internal Control over Financial Reporting
We have audited the accompanying consolidated balance sheets of BJ’s Wholesale Club Holdings, Inc. and its subsidiaries (the “Company”) as of February 3, 2024 and January 28, 2023, and the related consolidated statements of operations and comprehensive income, of stockholders' equity and of cash flows for each of the three years in the period ended February 3, 2024, including the related notes (collectively referred to as the “consolidated financial statements”). We also have audited the Company's internal control over financial reporting as of February 3, 2024, based on criteria established in Internal Control - Integrated Framework (2013) issued by the Committee of Sponsoring Organizations of the Treadway Commission (COSO).
In our opinion, the consolidated financial statements referred to above present fairly, in all material respects, the financial position of the Company as of February 3, 2024 and January 28, 2023, and the results of its operations and its cash flows for each of the three years in the period ended February 3, 2024 in conformity with accounting principles generally accepted in the United States of America. Also in our opinion, the Company maintained, in all material respects, effective internal control over financial reporting as of February 3, 2024, based on criteria established in Internal Control - Integrated Framework (2013) issued by the COSO.
Basis for Opinions
The Company's management is responsible for these consolidated financial statements, for maintaining effective internal control over financial reporting, and for its assessment of the effectiveness of internal control over financial reporting, included in Management's Report on Internal Control Over Financial Reporting appearing under Item 9A. Our responsibility is to express opinions on the Company’s consolidated financial statements and on the Company's internal control over financial reporting based on our audits. We are a public accounting firm registered with the Public Company Accounting Oversight Board (United States) (PCAOB) and are required to be independent with respect to the Company in accordance with the U.S. federal securities laws and the applicable rules and regulations of the Securities and Exchange Commission and the PCAOB.
We conducted our audits in accordance with the standards of the PCAOB. Those standards require that we plan and perform the audits to obtain reasonable assurance about whether the consolidated financial statements are free of material misstatement, whether due to error or fraud, and whether effective internal control over financial reporting was maintained in all material respects.
Our audits of the consolidated financial statements included performing procedures to assess the risks of material misstatement of the consolidated financial statements, whether due to error or fraud, and performing procedures that respond to those risks. Such procedures included examining, on a test basis, evidence regarding the amounts and disclosures in the consolidated financial statements. Our audits also included evaluating the accounting principles used and significant estimates made by management, as well as evaluating the overall presentation of the consolidated financial statements. Our audit of internal control over financial reporting included obtaining an understanding of internal control over financial reporting, assessing the risk that a material weakness exists, and testing and evaluating the design and operating effectiveness of internal control based on the assessed risk. Our audits also included performing such other procedures as we considered necessary in the circumstances. We believe that our audits provide a reasonable basis for our opinions.
Definition and Limitations of Internal Control over Financial Reporting
A company’s internal control over financial reporting is a process designed to provide reasonable assurance regarding the reliability of financial reporting and the preparation of financial statements for external purposes in accordance with generally accepted accounting principles. A company’s internal control over financial reporting includes those policies and procedures that (i) pertain to the maintenance of records that, in reasonable detail, accurately and fairly reflect the transactions and dispositions of the assets of the company; (ii) provide reasonable assurance that transactions are recorded as necessary to permit preparation of financial statements in accordance with generally accepted accounting principles, and that receipts and expenditures of the company are being made only in accordance with authorizations of management and directors of the company; and (iii) provide reasonable assurance regarding prevention or timely detection of unauthorized acquisition, use, or disposition of the company’s assets that could have a material effect on the financial statements.
Because of its inherent limitations, internal control over financial reporting may not prevent or detect misstatements. Also, projections of any evaluation of effectiveness to future periods are subject to the risk that controls may become inadequate because of changes in conditions, or that the degree of compliance with the policies or procedures may deteriorate.
46
Critical Audit Matters
The critical audit matter communicated below is a matter arising from the current period audit of the consolidated financial statements that were communicated or required to be communicated to the audit committee and that (i) relate to accounts or disclosures that are material to the consolidated financial statements and (ii) involved our especially challenging, subjective, or complex judgments. The communication of critical audit matters does not alter in any way our opinion on the consolidated financial statements, taken as a whole, and we are not, by communicating the critical audit matter below, providing a separate opinion on the critical audit matter or on the accounts or disclosures to which they relate.
Workers’ Compensation and General Liability Reserves
As described in Notes 2, 16 and 17 to the consolidated financial statements, the Company is primarily self-insured for workers’ compensation and general liability claims. As of February 3, 2024, workers’ compensation and general liability reserves were a significant portion of insurance reserves of $112.3 million within other non-current liabilities and a significant portion of insurance reserves of $60.1 million within accrued expenses and other current liabilities. The reported reserves for workers’ compensation and general liability claims are derived from estimated ultimate costs based upon individual claim file reserves and estimates for incurred but not reported claims. The estimates are developed utilizing actuarial methods and are based on historical claims experience and other actuarial assumptions related to the loss development factors.
The principal considerations for our determination that performing procedures relating to workers’ compensation and general liability reserves is a critical audit matter are (i) the significant judgment by management when developing the estimated workers’ compensation and general liability reserves; (ii) a high degree of auditor judgment, subjectivity, and effort in performing procedures and in evaluating audit evidence related to the actuarial methods and significant assumptions related to loss development factors; and (iii) the audit effort involved the use of professionals with specialized skill and knowledge.
Addressing the matter involved performing procedures and evaluating audit evidence in connection with forming our overall opinion on the consolidated financial statements. These procedures included testing the effectiveness of controls relating to management’s estimate of workers’ compensation and general liability reserves, including controls over the actuarial methods and significant assumptions related to the loss development factors. These procedures also included, among others (i) the involvement of professionals with specialized skill and knowledge to assist in developing an independent estimate for the accrual for workers’ compensation and general liability reserves and (ii) comparing the independent estimate to management’s estimate to evaluate the reasonableness of management’s estimate. Developing the independent estimate involved (i) testing the completeness and accuracy of underlying data provided by management and (ii) independently developing the loss development factors and applying actuarial methods.
/s/ PricewaterhouseCoopers LLP
March 18, 2024
We have served as the Company’s auditor since 1996.
47
BJ’S WHOLESALE CLUB HOLDINGS, INC.
CONSOLIDATED BALANCE SHEETS
(Amounts in thousands, except par value)
| February 3, 2024 | January 28, 2023 | ||||||||||
| ASSETS | |||||||||||
| Current assets: | |||||||||||
| Cash and cash equivalents | $ | $ | |||||||||
| Accounts receivable, net | |||||||||||
| Merchandise inventories | |||||||||||
| Prepaid expenses and other current assets | |||||||||||
| Total current assets | |||||||||||
| Operating lease right-of-use assets, net | |||||||||||
| Property and equipment, net | |||||||||||
| Goodwill | |||||||||||
| Intangibles, net | |||||||||||
| Deferred income taxes | |||||||||||
| Other assets | |||||||||||
| Total assets | $ | $ | |||||||||
| LIABILITIES | |||||||||||
| Current liabilities: | |||||||||||
| Short-term debt | $ | $ | |||||||||
| Current portion of operating lease liabilities | |||||||||||
| Accounts payable | |||||||||||
| Accrued expenses and other current liabilities | |||||||||||
| Total current liabilities | |||||||||||
| Long-term operating lease liabilities | |||||||||||
| Long-term debt | |||||||||||
| Deferred income taxes | |||||||||||
| Other non-current liabilities | |||||||||||
| STOCKHOLDERS’ EQUITY | |||||||||||
Preferred stock; $ | |||||||||||
Common stock; $ | |||||||||||
| Additional paid-in capital | |||||||||||
| Retained earnings | |||||||||||
| Accumulated other comprehensive income | |||||||||||
Treasury stock, at cost, | ( | ( | |||||||||
| Total stockholders’ equity | |||||||||||
| Total liabilities and stockholders’ equity | $ | $ | |||||||||
The accompanying notes are an integral part of the consolidated financial statements.
48
BJ’S WHOLESALE CLUB HOLDINGS, INC.
CONSOLIDATED STATEMENTS OF OPERATIONS AND COMPREHENSIVE INCOME
(Amounts in thousands, except per share amounts)
| Fiscal Year Ended | |||||||||||||||||
| February 3, 2024 | January 28, 2023 | January 29, 2022 | |||||||||||||||
| Net sales | $ | $ | $ | ||||||||||||||
| Membership fee income | |||||||||||||||||
| Total revenues | |||||||||||||||||
| Cost of sales | |||||||||||||||||
| Selling, general and administrative expenses | |||||||||||||||||
| Pre-opening expenses | |||||||||||||||||
| Operating income | |||||||||||||||||
| Interest expense, net | |||||||||||||||||
| Income from continuing operations before income taxes | |||||||||||||||||
| Provision for income taxes | |||||||||||||||||
| Income from continuing operations | |||||||||||||||||
| Income (loss) from discontinued operations, net of income taxes | ( | ( | |||||||||||||||
| Net income | $ | $ | $ | ||||||||||||||
| Income per share attributable to common stockholders—basic: | |||||||||||||||||
| Income from continuing operations | $ | $ | $ | ||||||||||||||
| Income (loss) from discontinued operations | ( | ||||||||||||||||
| Net income | $ | $ | $ | ||||||||||||||
| Income per share attributable to common stockholders—diluted: | |||||||||||||||||
| Income from continuing operations | $ | $ | $ | ||||||||||||||
| Income (loss) from discontinued operations | ( | ||||||||||||||||
| Net income | $ | $ | $ | ||||||||||||||
| Weighted-average number of shares outstanding: | |||||||||||||||||
| Basic | |||||||||||||||||
| Diluted | |||||||||||||||||
| Other comprehensive (loss) income: | |||||||||||||||||
Postretirement medical plan adjustment, net of income tax (benefit) expense of $( | $ | ( | $ | $ | ( | ||||||||||||
| Amounts reclassified from accumulated other comprehensive income, net of tax | ( | ( | |||||||||||||||
Unrealized gain on cash flow hedge, net of income tax of $ | |||||||||||||||||
| Total other comprehensive (loss) income | ( | ||||||||||||||||
| Total comprehensive income | $ | $ | $ | ||||||||||||||
The accompanying notes are an integral part of the consolidated financial statements.
49
BJ’S WHOLESALE CLUB HOLDINGS, INC.
CONSOLIDATED STATEMENTS OF STOCKHOLDERS’ EQUITY
(Amount in thousands)
| Common Stock | Additional Paid-in Capital | Retained Earnings (Accumulated Deficit) | Accumulated Other Comprehensive Income (Loss) | Treasury Stock | Total Stockholders’ Equity | |||||||||||||||||||||||||||||||||||||||||||||
| Shares | Amount | Shares | Amount | |||||||||||||||||||||||||||||||||||||||||||||||
| Balance, January 30, 2021 | $ | $ | $ | ( | $ | ( | ( | $ | ( | $ | ||||||||||||||||||||||||||||||||||||||||
| Net income | — | — | — | — | — | — | ||||||||||||||||||||||||||||||||||||||||||||
| Other comprehensive income, net of tax | — | — | — | — | — | — | ||||||||||||||||||||||||||||||||||||||||||||
| Dividends paid | — | — | ( | — | — | — | — | ( | ||||||||||||||||||||||||||||||||||||||||||
| Common stock issued under stock incentive plans | ( | — | — | — | — | |||||||||||||||||||||||||||||||||||||||||||||
| Common stock issued under ESPP | — | — | — | — | ||||||||||||||||||||||||||||||||||||||||||||||
| Stock-based compensation expense | — | — | — | — | — | — | ||||||||||||||||||||||||||||||||||||||||||||
| Exercise of stock options | — | — | — | — | — | — | ||||||||||||||||||||||||||||||||||||||||||||
| Acquisition of treasury stock | — | — | — | — | — | ( | ( | ( | ||||||||||||||||||||||||||||||||||||||||||
| Balance, January 29, 2022 | $ | $ | $ | $ | ( | $ | ( | $ | ||||||||||||||||||||||||||||||||||||||||||
| Net income | — | — | — | — | — | — | ||||||||||||||||||||||||||||||||||||||||||||
| Other comprehensive income, net of tax | — | — | — | — | — | — | ||||||||||||||||||||||||||||||||||||||||||||
| Dividends paid | — | — | ( | — | — | — | — | ( | ||||||||||||||||||||||||||||||||||||||||||
| Common stock issued under stock incentive plans | ( | — | — | — | — | |||||||||||||||||||||||||||||||||||||||||||||
| Common stock issued under ESPP | — | — | — | — | ||||||||||||||||||||||||||||||||||||||||||||||
| Stock-based compensation expense | — | — | — | — | — | — | ||||||||||||||||||||||||||||||||||||||||||||
| Exercise of stock options | — | — | — | — | — | — | ||||||||||||||||||||||||||||||||||||||||||||
| Acquisition of treasury stock | — | — | — | — | — | ( | ( | ( | ||||||||||||||||||||||||||||||||||||||||||
| Balance, January 28, 2023 | $ | $ | $ | $ | ( | $ | ( | $ | ||||||||||||||||||||||||||||||||||||||||||
| Net income | — | — | — | — | — | — | ||||||||||||||||||||||||||||||||||||||||||||
| Other comprehensive loss, net of tax | — | — | — | — | ( | — | — | ( | ||||||||||||||||||||||||||||||||||||||||||
| Dividends paid | — | — | ( | — | — | — | — | ( | ||||||||||||||||||||||||||||||||||||||||||
| Common stock issued under stock incentive plans | ( | — | — | — | — | |||||||||||||||||||||||||||||||||||||||||||||
| Common stock issued under ESPP | — | — | — | — | ||||||||||||||||||||||||||||||||||||||||||||||
| Stock-based compensation expense | — | — | — | — | — | — | ||||||||||||||||||||||||||||||||||||||||||||
| Exercise of stock options | — | — | — | — | — | — | ||||||||||||||||||||||||||||||||||||||||||||
| Acquisition of treasury stock | — | — | — | — | — | ( | ( | ( | ||||||||||||||||||||||||||||||||||||||||||
| Balance, February 3, 2024 | $ | $ | $ | $ | ( | $ | ( | $ | ||||||||||||||||||||||||||||||||||||||||||
The accompanying notes are an integral part of the consolidated financial statements.
50
BJ’S WHOLESALE CLUB HOLDINGS, INC.
CONSOLIDATED STATEMENTS OF CASH FLOWS
(Amounts in thousands)
| Fiscal Year Ended | |||||||||||||||||
| February 3, 2024 | January 28, 2023 | January 29, 2022 | |||||||||||||||
| CASH FLOWS FROM OPERATING ACTIVITIES | |||||||||||||||||
| Net income | $ | $ | $ | ||||||||||||||
| Adjustments to reconcile net income to net cash provided by operating activities: | |||||||||||||||||
| Depreciation and amortization | |||||||||||||||||
| Amortization of debt issuance costs and accretion of original issue discount | |||||||||||||||||
| Debt extinguishment and refinancing charges | |||||||||||||||||
| Stock-based compensation expense | |||||||||||||||||
| Deferred income tax provision (benefit) | ( | ( | |||||||||||||||
| Changes in operating leases and other non-cash items | ( | ||||||||||||||||
| Increase (decrease) in cash due to changes in: | |||||||||||||||||
| Accounts receivable, net | ( | ( | |||||||||||||||
| Merchandise inventories | ( | ( | ( | ||||||||||||||
| Prepaid expenses and other current assets | ( | ( | |||||||||||||||
| Other assets | ( | ( | ( | ||||||||||||||
| Accounts payable | ( | ||||||||||||||||
| Accrued expenses and other current liabilities | |||||||||||||||||
| Other non-current liabilities | ( | ||||||||||||||||
| Net cash provided by operating activities | |||||||||||||||||
| CASH FLOWS FROM INVESTING ACTIVITIES | |||||||||||||||||
| Additions to property and equipment, net of disposals | ( | ( | ( | ||||||||||||||
| Proceeds from sale-leaseback transactions | |||||||||||||||||
| Acquisitions | ( | ||||||||||||||||
| Net cash used in investing activities | ( | ( | ( | ||||||||||||||
| CASH FLOWS FROM FINANCING ACTIVITIES | |||||||||||||||||
| Proceeds from the issuance of long-term debt | |||||||||||||||||
| Payments on long-term debt | ( | ( | ( | ||||||||||||||
| Proceeds from revolving lines of credit | |||||||||||||||||
| Payments on revolving lines of credit | ( | ( | ( | ||||||||||||||
| Debt issuance costs paid | ( | ( | |||||||||||||||
| Dividends paid | ( | ( | ( | ||||||||||||||
| Net cash received from stock option exercises | |||||||||||||||||
| Net cash received from ESPP | |||||||||||||||||
| Acquisition of treasury stock | ( | ( | ( | ||||||||||||||
| Proceeds from financing obligations | |||||||||||||||||
| Other financing activities | ( | ( | ( | ||||||||||||||
| Net cash used in financing activities | ( | ( | ( | ||||||||||||||
| Net increase (decrease) in cash and cash equivalents | ( | ||||||||||||||||
| Cash and cash equivalents, beginning of period | |||||||||||||||||
| Cash and cash equivalents, end of period | $ | $ | $ | ||||||||||||||
| Supplemental cash flow information: | |||||||||||||||||
| Interest paid | $ | $ | $ | ||||||||||||||
| Income taxes paid | |||||||||||||||||
| Non-cash financing and investing activities: | |||||||||||||||||
| Property additions included in accrued expenses | |||||||||||||||||
| Treasury stock repurchases included in accrued expenses | |||||||||||||||||
The accompanying notes are an integral part of the consolidated financial statements.
51
BJ’S WHOLESALE CLUB HOLDINGS, INC.
NOTES TO AUDITED CONSOLIDATED FINANCIAL STATEMENTS
1. Description of Business
BJ’s Wholesale Club Holdings, Inc. and its wholly-owned subsidiaries (the "Company" or "BJ’s") is a leading operator of membership warehouse clubs concentrated primarily in the eastern half of the United States. The Company provides a curated assortment focused on grocery, general merchandise, gasoline and other ancillary services, coupons, and promotions to offer a differentiated shopping experience that is further enhanced by its omnichannel capabilities. As of February 3, 2024, BJ’s operated 243 warehouse clubs and 174 gas stations in 20 states.
2. Summary of Significant Accounting Policies
Basis of Presentation
The consolidated financial statements have been prepared in conformity with accounting principles generally accepted in the United States of America ("GAAP"). The consolidated financial statements include the Company and its subsidiaries. All intercompany balances and transactions have been eliminated in consolidation.
The Company's business, as is common with the business of retailers generally, is subject to seasonal influences. The Company’s sales and operating income have typically been highest in the fourth quarter holiday season and lowest in the first quarter of each fiscal year.
Fiscal Year
The Company follows the National Retail Federation's fiscal calendar and reports financial information on a 52- or 53-week year ending on the Saturday closest to January 31. Fiscal year 2023 ("2023") consists of the 53 weeks ended February 3, 2024, fiscal year 2022 ("2022") consists of the 52 weeks ended January 28, 2023, and fiscal year 2021 ("2021") consists of the 52 weeks ended January 29, 2022. Fiscal year 2024 ("2024") will consist of the 52 weeks ended February 1, 2025.
Estimates Included in Financial Statements
The preparation of financial statements in conformity with GAAP requires management to make estimates and assumptions that affect the reported amounts of assets, liabilities, and stockholders’ equity, and the disclosure of contingent assets and liabilities at the date of the financial statements and the reported amounts of revenues and expenses during the reporting period. The significant estimates relied upon in preparing these consolidated financial statements, include but are not limited to, estimating workers’ compensation and general liability self-insurance reserves. Actual results could differ from those estimates.
Segment Reporting
Concentration Risk
The Company's clubs are primarily located in the eastern half of the United States. Sales from the New York metropolitan area comprised approximately 23 %, 21 %, and 23 % of net sales in fiscal years 2023, 2022, and 2021, respectively.
Financial instruments that potentially subject the Company to concentrations of credit risk principally consist of cash held in financial institutions to the extent account balances exceed the amount insured by the Federal Deposit Insurance Corporation ("FDIC"). The Company considers the credit risk associated with these financial instruments to be minimal. Cash is held by financial institutions with high credit ratings and the Company has not historically sustained any credit losses associated with its cash balances.
52
Cash and Cash Equivalents
Highly liquid investments with a maturity of three months or less at the time of purchase are considered to be cash equivalents. Book overdrafts not subject to offset with other accounts with the same financial institution are classified as accounts payable.
Accounts Receivable
Accounts receivable consists primarily of credit card receivables and receivables from vendors related to rebates and coupons and is stated net of allowances for credit losses of $2.3 million and $4.4 million at February 3, 2024 and January 28, 2023, respectively. The determination of the allowance for credit losses is based on BJ’s historical experience applied to an aging of accounts and a review of individual accounts with a known potential for write-off.
Merchandise Inventories
Inventories are stated at the lower of cost, determined under the average cost method, or net realizable value. The Company recognizes the write-down of slow-moving or obsolete inventory in cost of sales when such write-downs are probable and estimable. The Company writes down inventory for estimated shrinkage for the period between physical inventories based on historical results of physical inventories, shrinkage trends, or other judgments management believes to be reasonable under the circumstances.
Property and Equipment
Property and equipment are recorded at cost and depreciated over their estimated useful lives using the straight-line method. Property and equipment which is not ready for its intended use is recorded as construction in progress. Buildings and improvements are generally depreciated over estimated useful lives of 33 years. Interest and other capitalizable costs related to the development of buildings is capitalized during the construction period. Leasehold costs and improvements are amortized over the shorter of the remaining lease term, which includes renewal periods that are reasonably assured, or the asset’s estimated useful life. Furniture, fixtures and equipment are depreciated over their estimated useful lives, ranging from to ten years .
Certain costs incurred in connection with developing or obtaining computer software for internal use are capitalized. Capitalized software costs are included in furniture, fixtures, and equipment and are amortized on a straight-line basis over the estimated useful life of the software, which is generally three years . Software costs not meeting the criteria for capitalization are expensed as incurred.
Expenditures for betterments and major improvements that significantly enhance the value and increase the estimated useful life of the assets are capitalized and depreciated over the new estimated useful life. Repairs and maintenance costs on all assets are expensed as incurred.
Deferred Issuance Costs
The Company defers costs directly associated with acquiring third-party financing. Debt issuance costs related to the Company's term loan are recorded as a direct deduction of the carrying amount of long-term debt, while debt issuance costs associated with the ABL Revolving Facility are recorded within other assets in the consolidated balance sheets. Debt issuance costs are amortized over the respective terms of the related financing arrangements on a straight-line basis, which is materially consistent with the effective interest method. Amortization of deferred debt issuance costs of $0.9 million, $1.7 million, and $2.2 million in fiscal years 2023, 2022, and 2021, respectively, is included in interest expense, net in the consolidated statements of operations and comprehensive income.
Goodwill and Indefinite-Lived Intangible Assets
Goodwill and indefinite-lived trade name intangible assets are not subject to amortization. The Company assesses the recoverability of its goodwill and trade name annually in the fourth quarter or whenever events or changes in circumstances indicate they may be impaired. The Company has determined it has one reporting unit for goodwill impairment testing purposes and assessed the recoverability as of December 30, 2023.
The Company may assess its goodwill for impairment initially using a qualitative approach ("step zero") to determine whether conditions exist to indicate that it is more likely than not that the fair value of a reporting unit is less than its carrying value. If management concludes, based on its assessment of relevant events, facts and circumstances that it is more likely than not that a reporting unit’s carrying value is greater than its fair value, then a quantitative analysis will be performed to
53
determine if there is any impairment. The Company may also elect to initially perform a quantitative analysis instead of starting with step zero. The quantitative assessment for goodwill requires comparing the carrying value of a reporting unit, including goodwill, to its fair value. If the fair value of the reporting unit exceeds its carrying amount, goodwill is not considered to be impaired and no further testing is required. If the carrying amount of the reporting unit exceeds its fair value, an impairment charge is recorded to write down goodwill to its implied fair value and is recorded as a component of selling, general and administrative expenses ("SG&A") in the consolidated statements of operations and comprehensive income. The Company assessed the recoverability of goodwill in fiscal years 2023, 2022 and 2021 and determined that there was no
The Company assesses the recoverability of its trade name whenever there are indicators of impairment, or at least annually in the fourth quarter. If the recorded carrying value of the trade name exceeds its estimated fair value, the Company records a charge to write the intangible asset down to its estimated fair value as a component of SG&A. The Company assessed the recoverability of the BJ’s trade name and determined that its estimated fair value exceeded its carrying value and that no
Test for Recoverability of Long-Lived Assets
Asset Retirement Obligations
An asset retirement obligation represents a legal obligation associated with the retirement of a tangible long-lived asset that is incurred upon the acquisition, construction, development or normal operation of that long-lived asset. The Company recognizes asset retirement obligations in the period in which they are placed in service, if a reasonable estimate of fair value can be made. The asset retirement obligation is subsequently adjusted for changes in fair value. The associated estimated asset retirement costs are capitalized in leasehold improvements and depreciated over their useful lives. The Company’s asset retirement obligations relate to the future removal of gasoline tanks, solar panels, and related assets installed at leased clubs. See Note 15 for further information on the amounts accrued.
Workers’ Compensation and General Liability Self-insurance Reserves
The Company is primarily self-insured for workers’ compensation, general liability claims, and auto liability claims. Amounts in excess of certain levels, which range from $0.3 million to $1.0 million per occurrence for workers' compensation and general liability, and up to $2.0 million per occurrence for auto liability, are insured as a risk reduction strategy to mitigate the financial impact of catastrophic losses. Reported reserves for claims are derived from estimated ultimate costs based upon individual claim file reserves and estimates for incurred but not reported claims. The estimates are developed utilizing actuarial methods and are based on historical claims experience and other actuarial assumptions related to loss development factors. The inherent uncertainty of future loss projections could cause actual claims to differ from the Company's estimates. When historical losses are not a good measure of future liability, the Company bases its estimates of ultimate liability on its interpretation of current law, claims filed to date, and other relevant factors which are subject to change. Accruals for such claims, if any, are included in accrued expenses and other current liabilities and other non-current liabilities in the consolidated balance sheets.
Revenue Recognition - Performance Obligations
The Company identifies each distinct performance obligation to transfer goods (or bundle of goods) or services. The Company recognizes revenue as it satisfies a performance obligation by transferring control of the goods or services to the customer.
Net sales
The Company recognizes net sales at clubs and gas stations when the customer takes possession of the goods and tenders payment. Sales tax is recorded as a liability at the point-of-sale. Revenue is recorded at the point-of-sale based on the
54
transaction price, net of any applicable discounts, sales tax and expected refunds. For e-commerce sales, the Company recognizes sales when control of the merchandise is transferred to the customer, which is typically at the time of shipment.
Rewards programs
The Company’s BJ’s Perks Rewards membership program which was in place in fiscal 2022 and the first month of fiscal year 2023, allowed participating members to earn 2 % cash back, up to a maximum of $500 per year, on qualified purchases made at BJ’s. The Company also offered a co-branded credit card program, the My BJ’s Perks program, which allowed My BJ’s Perks Mastercard credit card holders to earn up to a 10 cent-per-gallon discount on gasoline, up to 5 % cash back on eligible purchases made in BJ’s clubs or online at bjs.com, and up to 2 % cash back on purchases made with the card outside of BJ’s. Cash back was in the form of electronic awards issued in $10 increments that could be used online or in-club and expired 6 months from the date issued.
In the first quarter of fiscal year 2023, the Company rebranded the rewards program. The former BJ's Perks Rewards membership program is now the Club+ program, whereby participating members earn 2 % cash back, up to a maximum of $500 per year, on qualified purchases made at BJs and a 5 cent-per-gallon discount at BJ's gas locations. Cash back is in the form of electronic awards issued to each member once $10 in rewards have been earned.
The Company's co-branded credit card program is now the BJ's One and BJ's One+ program, which allows cardholders with the opportunity to earn up to 5 % cash back on purchases made in BJ's clubs or online at bjs.com and up to a 15 cent-per-gallon discount on gasoline when paying with a BJ's One or BJ's One+ Mastercard at BJ’s gas locations. Cash back is in the form of electronic awards issued to each member monthly on their credit card statement date. Earned rewards under these two programs do not expire.
The Company accounts for these transactions as multiple-element arrangements and allocates the transaction price to separate performance obligations using their relative fair values. The Company includes the fair value of award dollars earned in deferred revenue at the time the award dollars are earned. Earned awards may be redeemed on future purchases made at the Company. The Company recognizes revenue related to earned awards when customers redeem such awards as part of a purchase at one of the Company’s clubs or on the Company’s website or mobile app. The Company recognizes royalty revenue related to the outstanding My BJ's Perks and BJ's One and BJ's One+ credit card programs based upon actual customer activities, such as reward redemptions. Additionally, the Company deferred revenue for funds received related to marketing and other integration costs in connection with the new co-brand credit card program and will recognize these funds into revenue as performance obligations are satisfied.
Membership
The Company charges a membership fee to its customers, which allows customers to shop in the Company’s clubs, shop on the Company’s website, and purchase gasoline at the Company’s gas stations for the duration of the membership, which is generally 12 months. In addition, members have access to other ancillary services, coupons, and promotions. As the Company has the obligation to provide access to its clubs, website, and gas stations for the duration of the membership term, the Company recognizes membership fees on a straight-line basis over the life of the membership.
Gift Card Programs
The Company sells BJ’s gift cards that allow customers to redeem the cards for future purchases equal to the amount of the face value of the gift card. Revenue from gift card sales is recognized upon redemption of the gift cards and control of the purchased goods or services is transferred to the customer.
Warranty Programs
The Company passes on any manufacturers’ warranties to members. In addition, BJ’s includes an extended warranty on tires sold at the clubs, under which BJ’s customers receive tire repair services or tire replacement in certain circumstances. This warranty is included in the sale price of the tire and it cannot be declined by the customers. The Company is fully liable for claims under the tire warranty program. As the primary obligor in these arrangements, associated revenue is recognized on the date of sale and an estimated warranty obligation is accrued based on claims experience. The liability for future claims under this program is not material to the financial statements.
Extended warranties are also offered on certain types of products such as electronics and jewelry. These warranties are provided by a third party at fixed prices to BJ’s. No liability is retained to satisfy warranty claims under these arrangements. The Company is not the primary obligor under these warranties, and as such net revenue is recorded on these arrangements at
55
the time of sale. Revenue from warranty sales is included in net sales in the consolidated statements of operations and comprehensive income.
Determine the Transaction Price
The transaction price is the amount of consideration the Company expects to receive under the arrangement. The Company is required to include estimated variable consideration, if any, in the determination of the transaction price. The Company may offer sales incentives to customers, including discounts. The Company has significant experience with return patterns and relies on this experience to estimate expected returns when determining the transaction price.
Returns and Refunds
The Company’s products are generally sold with a right of return and may provide other credits or incentives, which are accounted for as variable consideration when estimating the amount of revenue to recognize. The Company records an allowance for returns based on current period revenues and historical returns experience. The Company analyzes actual historical returns, current economic trends, changes in sales volume and acceptance of the Company’s products when evaluating the adequacy of the sales returns allowance in any accounting period.
The sales returns reserve, which reduces sales and cost of sales for the estimated impact of returns, was $5.4 million, $6.1 million, and $6.7 million in fiscal years 2023, 2022, and 2021, respectively. Actual sales returns were $220.7 million, $228.9 million, and $215.7 million in fiscal years 2023, 2022 and 2021, respectively.
Customer Discounts
Discounts given to customers are usually in the form of coupons and instant markdowns and are recognized as redeemed and recorded in contra-revenue accounts, as they are part of the transaction price of the merchandise sale. Manufacturer coupons that are available for redemption at all retailers are not reduced from the sale price of merchandise.
Agent Relationships
The Company enters into certain agreements with service providers that offer goods and services to the Company’s members. These service providers sell goods and services including home improvement services and cell phones to the Company’s customers. In exchange, the Company receives payments in the form of commissions and other fees. The Company evaluates the relevant criteria to determine whether they serve as the principal or agent in these contracts with customers, in determining whether it is appropriate in these arrangements to record the gross amount of merchandise sales and related costs, or the net amount earned as commissions. When the Company is considered the principal in a transaction, revenue is recorded gross; otherwise, revenue is recorded on a net basis. Commissions received from these service providers are considered variable consideration and are constrained until the third-party customer makes a purchase from one of the service providers.
Significant Judgments
Standalone Selling Prices
For arrangements that contain multiple performance obligations, the Company allocates the transaction price to each performance obligation on a relative standalone selling price basis.
Policy Elections
In addition to those previously disclosed, the Company made the following accounting policy elections and practical expedients:
Portfolio Approach
The Company uses the portfolio approach when multiple contracts or performance obligations are involved in the determination of revenue recognition.
Taxes
The Company excludes from the transaction price any taxes collected from customers that are remitted to taxing authorities.
56
Shipping and Handling Charges
Charges that are incurred before and after the customer obtains control of goods are deemed to be fulfillment costs.
Time Value of Money
The Company’s payment terms are less than one year from the transfer of goods. Therefore, the Company does not adjust promised amounts of consideration for the effects of the time value of money.
Disclosure of Remaining Performance Obligations
The Company does not disclose the aggregate amount of the transaction price allocated to remaining performance obligations for contracts that are one year or less in term. Additionally, the Company does not disclose the aggregate amount of the transaction price allocated to remaining performance obligations when the transaction price is allocated entirely to a wholly unsatisfied performance obligation or to a wholly unsatisfied promise to transfer a good or service that forms part of a series of distinct goods or services.
Cost of Sales
The Company’s cost of sales includes the direct costs of sold merchandise, which includes customs, taxes, duties and inbound shipping costs, inventory shrinkage and adjustments and reserves for excess, aged and obsolete inventory. Cost of goods sold also includes certain distribution center costs and allocations of certain indirect costs, such as occupancy, depreciation, amortization, labor and benefits.
Presentation of Sales Tax Collected from Customers and Remitted to Governmental Authorities
In the ordinary course of business, sales tax is collected on items purchased by the members that are taxable in the jurisdictions when the purchases occur. These taxes are then remitted to the appropriate taxing authority. These taxes collected are excluded from revenues in the financial statements.
Vendor Rebates and Allowances
The Company receives various types of cash consideration from vendors, principally in the form of rebates, based on purchasing or selling certain volumes of product; time-based rebates or allowances, which may include product placement allowances or exclusivity arrangements covering a predetermined period of time; price protection rebates; allowances for retail price reductions on certain merchandise; and salvage allowances for product that is damaged, defective or becomes out-of-date.
Such vendor rebates and allowances are recognized based on a systematic and rational allocation of the cash consideration offered to the underlying transaction that results in progress by BJ’s toward earning the rebates and allowances, provided the amounts to be earned are probable and reasonably estimable. Otherwise, rebates and allowances are recognized only when predetermined milestones are met. The Company recognizes product placement allowances as a reduction of cost of sales in the period in which the product placement is completed. Time-based rebates or allowances are recognized as a reduction of cost of sales over the performance period on a straight-line basis. All other vendor rebates and allowances are recognized as a reduction of cost of sales when the merchandise is sold or otherwise disposed.
Cash consideration is also received for advertising products in publications sent to BJ’s members. Such cash consideration is recognized as a reduction of SG&A to the extent it represents a reimbursement of specific, incremental and identifiable SG&A costs incurred by BJ’s to sell the vendors’ products. If the cash consideration exceeds the costs being reimbursed, the excess is characterized as a reduction of cost of sales. Cash consideration for advertising vendors’ products is recognized in the period in which the advertising takes place.
Manufacturers’ Incentives Tendered by Consumers
Consideration from manufacturers’ incentives, such as rebates or coupons, is recorded gross in net sales when the incentive is generic and can be tendered by a consumer at any reseller and the Company receives direct reimbursement from the manufacturer, or clearinghouse authorized by the manufacturer, based on the face value of the incentive. If these conditions are not met, such consideration is recorded as a decrease in cost of sales.
57
Leases
In accordance with ASC 842, the Company determines if an arrangement is a lease at inception or modification of a contract and classifies each lease as either an operating or finance lease at commencement. Leases that are economically similar to the purchase of assets are generally classified as finance leases; otherwise, the leases are classified as operating leases. The Company only reassesses lease classification subsequent to commencement upon a change to the expected lease term or modification of the contract.
Right-of-use assets (“lease assets”) represent the right to use an underlying asset for the lease term, and lease liabilities represent the obligation to make lease payments arising from the lease. Operating lease assets and liabilities are recognized at the commencement date based on the present value of lease payments over the lease term, which reflect options to extend or terminate the lease when it is reasonably certain those options will be exercised. Options to extend have varying rates and terms for each lease. Generally, the Company’s leases do not provide a readily determinable implicit rate, and therefore, the Company uses a collateralized incremental borrowing rate ("IBR") as of the lease commencement date to determine the present value of lease payments. The IBR is based on a yield curve that approximates the Company’s credit rating and market risk profile. The lease asset also reflects any prepaid rent, initial direct costs incurred, and lease incentives received.
Lease liabilities are accounted for using the effective interest method, regardless of classification, while the amortization of lease assets varies depending upon classification. Operating lease classification results in a straight-line expense recognition pattern over the lease term and recognizes lease expense as a single expense component, which results in amortization of a lease asset equal to the difference between lease expense and interest expense. Conversely, finance lease classification results in a front-loaded expense recognition pattern over the lease term, which amortizes a lease asset by recognizing interest expense and straight-line amortization expense as separate components of lease expense.
Certain of the Company’s lease agreements provide for lease payments based on future sales volumes at the leased locations, or include rental payments adjusted periodically based on inflation or an index, which are not measurable at lease commencement. The Company recognizes such variable amounts in the period incurred. For leases with lease payments based on future sales volumes, variable lease expense is recognized when it becomes probable that the specified sales target will be achieved. The Company’s lease agreements do not contain any material residual value guarantees or material restrictive covenants.
The Company is generally obligated for the cost of property taxes, insurance, and maintenance relating to its leases, which are often variable lease payments. Such costs are presented as occupancy costs for finance and operating leases included in SG&A in the consolidated statement of operations and comprehensive income.
Leases with an initial term of twelve months or less are not recorded on the consolidated balance sheets and the related lease expense is recognized on a straight-line basis over the lease term.
Pre-opening Expenses
Pre-opening expenses consist of direct incremental costs of opening or relocating a facility and are expensed as incurred.
Advertising Costs
Advertising costs generally consist of efforts to acquire new members and typically include media advertising (some of which is vendor-funded). BJ’s expenses advertising as incurred as a component of SG&A. Advertising expenses were approximately 0.6 %, 0.6 % and 0.5 % of net sales in fiscal years 2023, 2022 and 2021, respectively.
Stock-based Compensation
The fair value of service-based employee awards is recognized as compensation expense on a straight-line basis over the requisite service period of the award, which is typically three years . The fair value of the performance-based awards is recognized as compensation expense ratably over the service period of each performance tranche, which is typically three years . Prior to fiscal year 2021, the Company granted stock-based option awards. The fair value of the stock-based option awards was determined using the Black-Scholes option pricing model. Determining the fair value of options at the grant date required judgment, including estimating the expected term that stock options would be outstanding prior to exercise and the associated volatility.
58
Earnings Per Share
Basic income per share is calculated by dividing net income available to common stockholders by the weighted-average number of shares of common stock outstanding for the period. Basic income from continuing operations per share is calculated by dividing income from continuing operations by the weighted-average number of shares of common stock outstanding for the period. Basic income (loss) from discontinued operations per share is calculated by dividing income (loss) from discontinued operations by the weighted-average number of shares of common stock outstanding for the period.
Diluted income per share is calculated by dividing net income available to common stockholders by the diluted weighted-average number of shares of common stock outstanding for the period. Diluted income from continuing operations per share is calculated by dividing income from continuing operations by the diluted weighted-average number of shares of common stock outstanding for the period. Diluted income (loss) from discontinued operations per share is calculated by dividing income (loss) from discontinued operations by the diluted weighted-average number of shares of common stock outstanding for the period.
Income Taxes
The Company accounts for income taxes using the asset and liability method. Under this method, deferred tax assets and liabilities are recognized for the expected future tax consequences of temporary differences between the financial statement carrying values and their respective tax bases, using enacted tax rates expected to be applicable in the years in which the temporary differences are expected to reverse. Changes in deferred tax assets and liabilities are recorded in the provision for income taxes. The Company evaluates the realizability of its deferred tax assets and establishes a valuation allowance when it is more likely than not that all or a portion of the deferred tax assets will not be realized.
The timing and amounts of deductible and taxable items and the probability of sustaining uncertain tax positions requires significant judgment. The Company records the benefits of uncertain tax positions in its consolidated financial statements only after determining a more-likely-than-not probability that the uncertain tax positions will withstand challenge from tax authorities. The Company periodically reassesses these probabilities and records any changes in the financial statements as appropriate.
Derivative Financial Instruments
All derivatives are recognized as either assets or liabilities in the consolidated balance sheets and measured at fair value. If the derivative is designated as a cash flow hedge, the effective portions of changes in the fair value of the derivative are recorded as a component of accumulated other comprehensive income in the consolidated balance sheets and are recognized in the consolidated statements of operations when the hedged item affects earnings. Any portion of the change in fair value that is determined to be ineffective is immediately recognized in earnings as SG&A. Derivative gains or losses included in accumulated other comprehensive income are released into earnings at the time the hedged transaction occurs as a component of SG&A.
Fair Value of Financial Instruments
Certain assets and liabilities are carried at fair value in accordance with GAAP. Fair value is defined as the exchange price that would be received for an asset or paid to transfer a liability (an exit price) in the principal or most advantageous market for the asset or liability in an orderly transaction between market participants on the measurement date.
The Company uses a three-level hierarchy that prioritizes the inputs used to measure fair value. This hierarchy requires entities to maximize the use of observable inputs and minimize the use of unobservable inputs. Financial assets and liabilities carried at fair value are to be classified and disclosed in one of the following three levels of the fair value hierarchy, of which the first two are considered observable and the last is considered unobservable:
•Level 1 - Quoted market prices in active markets for identical assets or liabilities.
•Level 2 - Observable inputs other than quoted market prices included in Level 1 such as quoted market prices for markets that are not active or other inputs that are observable or can be corroborated by observable market data.
•Level 3 - Unobservable inputs that are supported by little or no market activity and that are significant to the fair value of the assets or liabilities, including certain pricing models, discounted cash flow methodologies and similar techniques that use significant unobservable inputs.
59
Comprehensive Income
Comprehensive income is a measure of net income and all other changes in equity that result from transactions other than with equity holders, and would normally be recorded in the consolidated statements of stockholders’ equity and the consolidated statements of comprehensive income. Other comprehensive income consists of unrealized gains and losses from derivative instruments designated as cash flow hedges and postretirement medical plan adjustments.
Treasury Stock
The Company accounts for treasury stock under the cost method based on the fair market value of the shares on the dates of repurchase plus any direct costs incurred. Treasury stock is presented as a reduction to stockholders’ equity and is included in authorized and issued shares but excluded from outstanding shares.
Restructuring Charges
Charges for restructuring programs generally include targeted actions involving employee severance, related benefit costs, and other termination charges. Employee severance and related benefit costs for employees with no further service period are accounted for under the Company’s ongoing benefit arrangements. These charges are accrued during the period when management commits to a plan of termination and it becomes probable that employees will be entitled to benefits at amounts that can be reasonably estimated. For employees with a remaining service period, the related costs are accrued over the period if greater than 60 days. Restructuring costs are recorded in SG&A in the consolidated statements of operations.
Recently Issued Accounting Pronouncements and Policies
In December 2023, the Financial Accounting Standards Board ("FASB") issued Accounting Standards Update (ASU) 2023-09, Income Taxes (Topic 740): Improvements to Income Tax Disclosures. ASU 2023-09 will require public companies to disclose, on an annual basis, a tabular reconciliation, using both percentages and amounts, broken out into specific categories with certain reconciling items at or above 5% of the statutory tax, further broken out by nature and/or jurisdiction. ASU 2023-09 requires all entities to disclose, on an annual basis, the amount of income taxes paid (net of refunds received), disaggregated between federal, state/local and foreign, and amounts paid to an individual jurisdiction when 5% or more of the total income taxes paid. The new standard is effective for fiscal years beginning after December 15, 2024, on a prospective basis. Early adoption and retrospective application are permitted. The Company is currently evaluating the impact the adoption of this new pronouncement will have on financial statement disclosures.
In November 2023, the FASB issued ASU 2023-07, Segment Reporting (Topic 280): Improvements to Reportable Segment Disclosures, which expands the segment reporting disclosures and requires disclosure of segment expenses that are regularly provided to the chief operating decision maker ("CODM") and included within each reported measure of segment profit or loss, amounts and description of its composition for other segment items, and interim disclosure of a reportable segment’s profit or loss and assets. Additionally, the amendments require the disclosure of the title and position of the CODM and an explanation of how the CODM uses the reported measure(s) of segment profit or loss in assessing performance and deciding how to allocate resources. The new standard is effective for fiscal years beginning after December 15, 2023, and interim periods within fiscal years beginning after December 15, 2024, on a retrospective basis. Early adoption is permitted. The Company is currently evaluating the impact the adoption of this new pronouncement will have on financial statement disclosures.
Recently Adopted Accounting Pronouncements and Policies
3. Related Party Transactions
One of the Company’s suppliers, Advantage Solutions Inc., was determined to be a related party of the Company through June 17, 2022 in fiscal year 2022, as well as in fiscal year 2021. Advantage Solutions Inc. is a provider of in-club product demonstration and sampling services. Currently, the Company engages them from time to time to provide ancillary support services, including temporary club labor, as needed. The Company incurred approximately $3.1 million, and $2.9 million of costs payable to Advantage Solutions for services rendered during fiscal years 2022 and 2021, respectively. The demonstration and sampling service fees are fully funded by merchandise vendors who participate in the program.
60
4. Revenue Recognition
(a) Performance Obligations
The Company identifies each distinct performance obligation to transfer goods (or bundle of goods) or services. Refer to Note 2 for a description of the Company's performance obligations including net sales, rewards programs, membership and gift card programs.
The following table summarizes the Company’s point-of-sale transactions at clubs and gas stations, excluding sales tax, as a percentage of both net sales and total revenues:
| Fiscal Year Ended | |||||||||||||||||
| February 3, 2024 | January 28, 2023 | January 29, 2022 | |||||||||||||||
| Point-of-sale transactions, excluding sales tax, as a percent of net sales | % | % | % | ||||||||||||||
| Point-of-sale transactions, excluding sales tax, as a percent of total revenues | % | % | % | ||||||||||||||
(b) Contract Balances
The following tables summarizes the Company's deferred revenue balance related to outstanding performance obligations for contracts with customers:
| February 3, 2024 | January 28, 2023 | ||||||||||
| Current: | |||||||||||
| Rewards programs: | |||||||||||
| Earned award dollars | $ | $ | |||||||||
| Royalty revenue | |||||||||||
| Co-brand marketing & integration | |||||||||||
| Total rewards programs | |||||||||||
| Membership | |||||||||||
| Gift card programs | |||||||||||
| E-commerce sales | |||||||||||
| Long-term: | |||||||||||
| Rewards programs: | |||||||||||
| Co-brand marketing & integration | |||||||||||
| Total deferred revenue | $ | $ | |||||||||
Current and long-term deferred revenue balances are included within accrued expenses and other current liabilities and other non-current liabilities, respectively, in the consolidated balance sheets.
61
The following tables summarizes the Company's revenue recognized during the period that was included in the opening deferred balance as of January 28, 2023:
| Fiscal Year Ended | |||||
| February 3, 2024 | |||||
| Rewards programs: | |||||
| Earned award dollars | $ | ||||
| Royalty revenue | |||||
| Co-brand marketing & integration | |||||
| Total rewards programs | |||||
| Membership | |||||
| Gift card programs | |||||
| E-commerce sales | |||||
| Total revenue | $ | ||||
(c) Transaction Price Allocated to Remaining Performance Obligations
Performance obligations related to earned award dollars, royalty revenue, and membership fees are typically satisfied over a period of twelve months or less. Funds received related to marketing and other integration costs in connection with our co-brand credit card program are recognized as performance obligations are satisfied. The timing and recognition of gift card redemptions varies depending on consumer behavior and spending patterns.
(d) Disaggregation of Revenue
The Company’s club retail operations, which include retail club and other sales procured from our clubs and distribution centers, represent substantially all of its consolidated total revenues, and are the Company’s only reportable segment. Substantially all of the Company’s identifiable assets are located in the United States. The Company does not have significant sales outside the United States, nor does any customer represent more than 10% of total revenues for any period presented.
The following table summarizes the Company’s percentage of net sales disaggregated by category:
| Fiscal Year Ended | |||||||||||||||||
| February 3, 2024 | January 28, 2023 | January 29, 2022 | |||||||||||||||
| Grocery | % | % | % | ||||||||||||||
| General Merchandise and Services | % | % | % | ||||||||||||||
| Gasoline and Other | % | % | % | ||||||||||||||
62
5. Property and Equipment, Net
The following table summarizes the Company's property and equipment as of February 3, 2024 and January 28, 2023 (in thousands):
| Fiscal Year Ended | |||||||||||
| February 3, 2024 | January 28, 2023 | ||||||||||
| Land and buildings | $ | ||||||||||
| Leasehold costs and improvements | |||||||||||
| Furniture, fixtures, and equipment | |||||||||||
| Construction in progress | |||||||||||
| Total property and equipment, gross | |||||||||||
| Less: accumulated depreciation and amortization | ( | ( | |||||||||
| Total property and equipment, net | $ | ||||||||||
Depreciation expense was $219.8 million, $191.7 million, and $170.1 million in fiscal years 2023, 2022, and 2021, respectively.
6. Leases
The Company has operating and finance leases for certain of the Company's clubs, transportation vehicles, and equipment; and operating leases for certain distribution centers, stand-alone gas stations, and the Club Support Center.
The initial primary term of the Company’s operating leases ranges from 2 to 44 years, with most of these leases having an initial term of 20 years. The initial primary term of the Company’s finance leases ranges from 2 years to 20 years, with most of these leases having an initial term of 7 years.
The following table summarizes the Company’s finance and operating lease assets and lease liabilities as of February 3, 2024 and January 28, 2023 (in thousands):
| February 3, 2024 | January 28, 2023 | Consolidated Balance Sheet Classification | |||||||||||||||
| Assets: | |||||||||||||||||
| Operating lease assets | $ | $ | Operating lease right-of-use assets, net | ||||||||||||||
| Finance lease assets | Property and equipment, net | ||||||||||||||||
| Less: finance lease amortization | ( | ( | Property and equipment, net | ||||||||||||||
| Total lease assets | $ | $ | |||||||||||||||
| Liabilities: | |||||||||||||||||
| Current: | |||||||||||||||||
| Operating lease liabilities | $ | $ | Current portion of operating lease liabilities | ||||||||||||||
| Finance lease liabilities | |||||||||||||||||
| Long-term: | |||||||||||||||||
| Operating lease liabilities | Long-term operating lease liabilities | ||||||||||||||||
| Finance lease liabilities | |||||||||||||||||
| Total lease liabilities | $ | $ | |||||||||||||||
In fiscal year 2022, the Company recorded a lease asset impairment charge of $1.2 million included in loss from discontinued operations, net of taxes within the consolidated statements of operations and comprehensive income. There were no
63
The following table is a summary of the components of net lease costs for fiscal years 2023, 2022, and 2021 (in thousands):
| Fiscal Year Ended | |||||||||||||||||
| February 3, 2024 | January 28, 2023 | January 29, 2022 | |||||||||||||||
| Finance lease cost: | |||||||||||||||||
Amortization of lease assets(a) | $ | $ | $ | ||||||||||||||
Interest on lease liabilities(b) | |||||||||||||||||
| Total finance lease costs | |||||||||||||||||
Operating lease cost(a) | |||||||||||||||||
Variable lease cost(a) | |||||||||||||||||
Sublease income(a) | ( | ( | ( | ||||||||||||||
| Net lease costs | $ | $ | $ | ||||||||||||||
(a) Amortization of finance lease assets, operating lease cost, variable lease cost, and sublease income are primarily included in selling, general, and administrative expenses in the consolidated statements of operations and comprehensive income. Variable lease cost primarily consists of increases in rental payments based on an index, and for fiscal year 2022, includes $4.8 million of costs incurred to purchase assets deemed to be owned by the lessor of the Company’s Club Support Center.
(b) Interest recognized on finance lease liabilities is included in interest expense, net in the consolidated statements of operations and comprehensive income.
The weighted-average remaining lease term and weighted-average discount rate for operating and finance leases as of February 3, 2024 and January 28, 2023 were as follows:
| February 3, 2024 | January 28, 2023 | ||||||||||
| Weighted-average remaining lease term (in years) - operating leases | |||||||||||
| Weighted-average remaining lease term (in years) - finance leases | |||||||||||
| Weighted-average discount rate - operating leases | % | % | |||||||||
| Weighted-average discount rate - finance leases | % | % | |||||||||
64
Cash paid for amounts included in the measurement of lease liabilities were as follows (in thousands):
| Fiscal Year Ended | |||||||||||||||||
| February 3, 2024 | January 28, 2023 | January 29, 2022 | |||||||||||||||
| Operating cash flows paid for operating leases | $ | $ | $ | ||||||||||||||
| Operating cash flows paid for interest portion of finance leases | |||||||||||||||||
| Financing cash flows paid for principal portion of finance leases | |||||||||||||||||
Supplemental cash flow information related to lease assets and lease liabilities were as follows (in thousands):
| Fiscal Year Ended | |||||||||||||||||
| February 3, 2024 | January 28, 2023 | January 29, 2022 | |||||||||||||||
| Operating lease liabilities arising from obtaining right-of-use assets and other non-cash lease-related operating items | $ | $ | $ | ||||||||||||||
| Financing lease liabilities arising from obtaining right-of-use assets | |||||||||||||||||
Future lease commitments to be paid by the Company as of February 3, 2024 were as follows (in thousands):
| Fiscal Year | Operating Leases | Finance Leases | |||||||||
| 2024 | $ | $ | |||||||||
| 2025 | |||||||||||
| 2026 | |||||||||||
| 2027 | |||||||||||
| 2028 | |||||||||||
| Thereafter | |||||||||||
| Total future minimum lease payments | |||||||||||
| Less: imputed interest | ( | ( | |||||||||
| Present value of lease liabilities | $ | $ | |||||||||
As of February 3, 2024, the Company had certain executed real estate and gas station leases that have not yet commenced and therefore are not reflected in the tables above. These leases are expected to commence primarily in fiscal year 2024 with lease terms ranging from 7 years to 25 years. We estimate future lease commitments for these leases to be approximately $395.1 million.
Sale-leaseback Transactions
During the fiscal year ended February 3, 2024, the Company completed two sale-leaseback transactions for buildings constructed by the Company on land owned by the buyer-lessors. In connection with these transactions, the Company sold assets with a total fair value of $26.2 million and received proceeds of $18.5 million. The difference between the fair value of assets sold and proceeds received was deemed prepaid rent and included in the operating lease asset at lease commencement.
Failed Sale-leaseback Transactions
During the fiscal year ended February 3, 2024, the Company constructed three buildings on land owned by certain of the Company’s lessors. The associated leases were deemed to be financing leases, resulting in the Company accounting for the transactions as failed sale-leasebacks. In connection with these transactions, the Company recorded financing obligations totaling $26.4 million, which represented cash received of $20.6 million and receivables of $5.8 million as of February 3, 2024. The net book value of the associated building assets is included in property and equipment, net in the consolidated balance sheets. The current portion of the financing obligations is included in accrued expenses and other current liabilities, while the long-term portion is included in other non-current liabilities in the consolidated balance sheets.
65
7. Debt and Credit Arrangements
Debt consisted of the following at February 3, 2024 and January 28, 2023 (in thousands):
| February 3, 2024 | January 28, 2023 | ||||||||||
| ABL Revolving Facility | $ | $ | |||||||||
| First Lien Term Loan | |||||||||||
| Unamortized original issue discount and debt issuance costs | ( | ( | |||||||||
| Less: Short-term debt | ( | ( | |||||||||
| Long-term debt | $ | $ | |||||||||
ABL Revolving Facility
On July 28, 2022, the Company entered into the ABL Revolving Facility with an ABL Revolving Commitment of $1.2 billion pursuant to that certain credit agreement (the "Credit Agreement") with Bank of America, N.A., as administrative agent and collateral agent, and the other lenders party thereto. The maturity date of the ABL Revolving Facility is July 28, 2027. In connection with this transaction, the Company extinguished the ABL Facility.
Revolving loans under the ABL Revolving Facility are available in an aggregate amount equal to the lesser of the aggregate ABL Revolving Commitment or a borrowing base based on the value of certain inventory, accounts and credit card receivables, subject to specified advance rebates and reserves as set forth in the Credit Agreement. Indebtedness under the ABL Revolving Facility is secured by substantially all of the assets (other than real estate) of the Company and its subsidiaries, subject to customary exceptions. As amended, interest on the ABL Revolving Facility is calculated either at SOFR plus a range of 100 to 125 basis points or a base rate plus 0 to 25 basis points, based on excess availability. The Company will also pay an unused commitment fee of 20 basis points per annum on the unused ABL Revolving Commitment. Each borrowing is for a period of , , or six months , as selected by the Company, or for such other period that is twelve months or less requested by the Company and consented to by the lenders and administrative agent.
The ABL Revolving Facility places certain restrictions (i.e., covenants) upon the Borrower’s, and its subsidiaries’, ability to, among other things, incur additional indebtedness, pay dividends and make certain loans, investments and divestitures. The ABL Revolving Facility contains customary events of default (including payment defaults, cross-defaults to certain of our other indebtedness, breach of representations and covenants and change of control). The occurrence of an event of default under the ABL Revolving Facility would permit the lenders to accelerate the indebtedness and terminate the ABL Revolving Facility.
As of January 28, 2023, there was $405.0 million outstanding in loans under the ABL Revolving Facility and $11.5 million in outstanding letters of credit. The interest rate on the revolving credit facility was 5.63 %.
As of February 3, 2024, there was $319.0 million outstanding in loans under the ABL Revolving Facility and $18.2 million in outstanding letters of credit. The interest rate on the revolving credit facility was 6.44 %, and unused capacity was $802.3 million.
First Lien Term Loan
On October 12, 2023, the Company entered into an amendment (the "Fourth Amendment") to the First Lien Term Loan Credit Agreement, with Nomura Corporate Funding Americas, LLC, as administrative agent and collateral agent and the lenders party thereto. Deutsche Bank Securities Inc. acted as the left lead arranger and bookrunner, and Nomura Securities International, Inc., BofA Securities, Inc. and Wells Fargo Securities LLC acted as joint lead arrangers and joint bookrunners of the Fourth Amendment.
The Fourth Amendment, among other things, extended the maturity date with respect to the term loans outstanding under the First Lien Term Loan Credit Agreement from February 3, 2027 to February 3, 2029. In addition, the Fourth Amendment reduced applicable margin in respect of the interest rate from SOFR plus 275 basis points per annum to SOFR plus 200 basis points per annum.
Voluntary prepayments are permitted. Principal payments must be made on the First Lien Term Loan pursuant to an annual excess cash flow calculation when the net leverage ratio exceeds 3.50 to 1.00. As of February 3, 2024, the Company's net leverage ratio did not exceed 3.50 to 1.00, and therefore, no incremental principal payments were required. The First Lien Term Loan is subject to certain affirmative and negative covenants but no financial covenants. It is secured on a senior basis by certain "fixed assets" of the Company and on a junior basis by certain "liquid" assets of the Company.
66
During fiscal year 2021, the Company used $100.0 million of cash and cash equivalents to pay $100.0 million of the principal amount outstanding on the First Lien Term Loan. In connection with the payment, the Company expensed $0.7 million of previously capitalized debt issuance costs and original issue discount.
During fiscal year 2022, total fees incurred in connection with the Third Amendment were approximately $3.2 million. The Company expensed $0.6 million of previously capitalized debt issuance costs and original issue discount and expensed $2.0 million of new third-party fees. The Company deferred $1.2 million of new debt issuance costs and original issue discount.
As of January 28, 2023, there was $450.0 million outstanding on the First Lien Term Loan, which reflected the Company’s repayment of approximately $151.9 million of the principal amount outstanding under the First Lien Term Loan Credit Agreement during the fourth quarter of fiscal year 2022 prior to the Third Amendment. The interest rate was 7.11 %.
During fiscal year 2023, total fees incurred in connection with the Fourth Amendment were approximately $1.7 million. The Company expensed $1.4 million of previously capitalized debt issuance costs and original issue discount and expensed $0.4 million of new third-party fees. The Company deferred $1.3 million of new debt issuance costs.
As of February 3, 2024, there was $400.0 million outstanding under the First Lien Term Loan, which reflects the Company’s previous repayment of $50.0 million of the principal amount outstanding under the First Lien Term Loan Credit Agreement during the third quarter of fiscal year 2023 prior to the Fourth Amendment. The interest rate was 7.33 % as of fiscal year end.
Future minimum payments
Scheduled future minimum principal payments on debt as of February 3, 2024 are as follows (in thousands):
| Fiscal Year: | Principal Payments | ||||
| 2024 | $ | ||||
| 2025 | |||||
| 2026 | |||||
| 2027 | |||||
| 2028 | |||||
| Thereafter | |||||
| Total | $ | ||||
8. Interest Expense, Net
The following details the components of interest expense for the periods presented (in thousands):
| Fiscal Year Ended | |||||||||||||||||
| February 3, 2024 | January 28, 2023 | January 29, 2022 | |||||||||||||||
| Interest on debt | $ | $ | $ | ||||||||||||||
| Interest on financing obligations | |||||||||||||||||
| Debt extinguishment and refinancing charges | |||||||||||||||||
| Amortization of debt issuance costs | |||||||||||||||||
| Accretion of original issue discount | |||||||||||||||||
| Capitalized interest | ( | ( | ( | ||||||||||||||
| (Gain) loss on cash flow hedge | ( | ( | |||||||||||||||
| Interest expense, net | $ | $ | $ | ||||||||||||||
67
9. Goodwill and Intangible Assets
The carrying value of goodwill and the change in the balance for the fiscal years ended February 3, 2024 and January 28, 2023 is as follows (in thousands):
Intangible assets consist of the following (in thousands):
| February 3, 2024 | |||||||||||||||||
| Gross Carrying Amount | Accumulated Amortization | Net Carrying Amount | |||||||||||||||
| Intangible Assets Not Subject to Amortization: | |||||||||||||||||
| BJ’s trade name | $ | $ | — | $ | |||||||||||||
| Intangible Assets Subject to Amortization: | |||||||||||||||||
| Member relationships | ( | ||||||||||||||||
| Private label brands | ( | ||||||||||||||||
| Total intangible assets | $ | $ | ( | $ | |||||||||||||
| January 28, 2023 | |||||||||||||||||
| Gross Carrying Amount | Accumulated Amortization | Net Carrying Amount | |||||||||||||||
| Intangible Assets Not Subject to Amortization: | |||||||||||||||||
| BJ’s trade name | $ | $ | — | $ | |||||||||||||
| Intangible Assets Subject to Amortization: | |||||||||||||||||
| Member relationships | ( | ||||||||||||||||
| Private label brands | ( | ||||||||||||||||
| Total intangible assets | $ | $ | ( | $ | |||||||||||||
The Company records amortization expense of intangible assets as a component of SG&A. Member relationships are amortized over 15.3 years and private label brands were amortized over 12 years. Member relationships will primarily be amortized through fiscal year 2026.
68
The Company recorded amortization expense of $7.9 million, $9.2 million and $10.5 million as a component of SG&A for fiscal years 2023, 2022, and 2021, respectively. The Company estimates that amortization expense related to intangible assets will be as follows in each of the next five fiscal years (in thousands):
| Fiscal Year | Amortization Expense | ||||
| 2024 | $ | ||||
| 2025 | |||||
| 2026 | |||||
| 2027 | |||||
| 2028 | |||||
| Thereafter | |||||
| Total | $ | ||||
10. Commitments and Contingencies
The Company is involved in various legal proceedings that are typical of a retail business. In accordance with applicable accounting guidance, an accrual will be established for legal proceedings if and when those matters present loss contingencies that are both probable and estimable. The Company does not believe the resolution of any current proceedings will result in a material impact to the consolidated financial statements.
11. Stock Incentive Plans
On June 13, 2018, the Company’s board of directors adopted, and its stockholders approved, the BJ’s Wholesale Club Holdings, Inc. 2018 Incentive Award Plan (the "2018 Plan"). The 2018 Plan provides for the grant of stock options, restricted stock, dividend equivalents, stock payments, restricted stock units, performance shares, other incentive awards, stock appreciation rights, and cash awards. Prior to the adoption of the 2018 Plan, the Company granted stock-based compensation to employees and non-employee directors, respectively, under the Fourth Amended and Restated 2011 Stock Option Plan of BJ’s Wholesale Club Holdings, Inc., as amended (the "2011 Plan"), and the 2012 Director Stock Option Plan of BJ’s Wholesale Club Holdings, Inc., as amended (the "2012 Director Plan"). No further grants will be made under 2011 Plan or the 2012 Director Plan.
The 2018 Plan authorizes the issuance of 13,148,058 shares, including 985,369 shares that were reserved but not issued under the 2011 Plan and the 2012 Director Plan. If an award under the 2018 Plan, 2011 Plan, or 2012 Director Plan is forfeited, expires or is settled for cash, any shares subject to such award may, to the extent of such forfeiture, expiration or cash settlement, be used again for new grants under the 2018 Plan. Additionally, shares tendered or withheld to satisfy grant or exercise price, or tax withholding obligations associated with an award under the 2018 Plan, the 2011 Plan, or the 2012 Director Plan will be added to the shares authorized for grant under the 2018 Plan. The following shares may not be used again for grant under the 2018 Plan: (1) shares subject to a stock appreciation right ("SAR"), that are not issued in connection with the stock settlement of the SAR on its exercise and (2) shares purchased on the open market with the cash proceeds from the exercise of options under the 2018 Plan, 2011 Plan, or 2012 Director Plan. As of February 3, 2024, there were 4,925,874 shares available for future issuance under the 2018 Plan.
On April 16, 2021, the Compensation Committee approved a modification to the equity awards agreements under the 2011 Plan, 2012 Director Plan, and 2018 Plan. In the event that an employee is terminated due to death or disability, the modified equity award agreements provide for: (i) full vesting of all time-based awards, including restricted stock awards and stock options, (ii) pro-rata vesting of all performance-based awards, including performance share units, based on actual performance as of the end of the applicable performance period, pro-rated based on the period of employment during the applicable performance period, and (iii) the extension of the post-termination exercise window for vested stock options. In fiscal 2021, the Company recognized $17.5 million of stock-based compensation expense due to the accelerated vesting of equity awards, related to the passing of a former executive. There was no
The Company recognized $39.0 million, $42.6 million, and $53.8 million of total stock-based compensation for fiscal years 2023, 2022, and 2021, respectively, inclusive of expense related to the ESPP. As of February 3, 2024, there was approximately $42.5 million of unrecognized compensation cost, most of which is expected to be recognized over the next three years .
69
Stock option awards were generally granted with a vesting period of three years . All options have a contractual term of ten years . No options were granted during fiscal years 2023, 2022, or 2021. The fair value of options granted prior to fiscal year 2021 was estimated using the Black-Scholes option pricing model.
Presented below is a summary of the stock option activity and weighted-average exercise prices for the fiscal year ended February 3, 2024:
| (Options in thousands) | Number of Securities to be Issued Upon Exercise of Outstanding Options | Weighted- average Exercise Price | Weighted-average Remaining Contractual Life (in years) | ||||||||||||||
| Outstanding, beginning of period | $ | ||||||||||||||||
| Exercised | ( | ||||||||||||||||
| Outstanding, vested, and exercisable, end of period | |||||||||||||||||
The total intrinsic value of options exercised in fiscal years 2023, 2022 and 2021 was $7.2 million, $25.1 million, and $55.2 million, respectively. The Company received a tax benefit related to these option exercises of approximately $2.0 million, $7.0 million, and $15.5 million in fiscal years 2023, 2022, and 2021, respectively. As of February 3, 2024, the total intrinsic value of options vested was $72.8 million.
Presented below is a summary of our non-vested restricted shares, restricted stock units and performance stock and weighted-average grant-date fair values for the fiscal year ended February 3, 2024:
| Restricted Stock | Restricted Stock Units | Performance Stock | |||||||||||||||||||||||||||||||||
| (Shares in thousands) | Shares | Weighted-average Grant-Date Fair Value | Shares | Weighted-average Grant-Date Fair Value | Shares(a) | Weighted-average Grant-Date Fair Value | |||||||||||||||||||||||||||||
| Outstanding, beginning of period | $ | $ | $ | ||||||||||||||||||||||||||||||||
Granted(b) | |||||||||||||||||||||||||||||||||||
| Forfeited | ( | ( | ( | ||||||||||||||||||||||||||||||||
| Vested | ( | ( | ( | ||||||||||||||||||||||||||||||||
| Outstanding, end of period | |||||||||||||||||||||||||||||||||||
(a) Shares presented reflect a 100 % payout, however, the actual payout for the fiscal year 2021 grants, which primarily vest in the first quarter of fiscal year 2024, is expected to be 200 %. Actual payout for performance stock awards granted in fiscal years 2022 and 2023, which primarily vest in fiscal year 2025 and 2026, respectively, could be below 100 200
(b) Includes 320 incremental Performance Stock awards granted in fiscal year 2020 with a weighted-average grant date fair value of $33.59 , that vested in the first quarter of fiscal year 2023 at greater than 100 % of target based on performance.
The fair value as of the vesting date was $31.4 million, $1.2 million and $48.6 million for restricted stock, restricted stock units, and performance stock, respectively.
2018 Employee Stock Purchase Plan
On June 14, 2018, the Company’s board of directors adopted and and its stockholders approved the BJ's Wholesale Club Holdings, Inc. 2018 ESPP, which became effective the day prior to the first day of public trading of the Company's equity securities. The aggregate number of shares of common stock that was be reserved for issuance under our ESPP was be equal to the sum of (i) 973,014 shares and (ii) an annual increase on the first day of each calendar year beginning in 2019 and ending in 2028 equal to the lesser of (A) 486,507 shares, (B) 0.5 % of the shares outstanding (on an as converted basis) on the last day of the immediately preceding fiscal year and (C) such smaller number of shares as determined by the board of directors. The offering under the ESPP commenced on January 1, 2019. The amount of expense recognized in the fiscal years 2023, 2022, and 2021, was $1.4 million, $1.1 million and $0.8 million, respectively. As of February 3, 2024, there were 2,407,504 shares available for issuance under the ESPP.
70
12. Treasury Shares and Share Repurchase Programs
Treasury Shares Acquired on Restricted Stock Awards and Performance Stock Awards
Shares reacquired to satisfy tax withholding obligations upon the vesting of restricted stock awards and performance stock awards in fiscal year 2023, 2022, and 2021 were 373,875 shares, 264,167 shares, and 376,758 shares, respectively. These reacquired shares were recorded as $28.3 million, $18.0 million, and $16.8 million of treasury stock in fiscal years 2023, 2022, and 2021, respectively.
Share Repurchase Programs
On December 19, 2019, the Company’s board of directors authorized the repurchase of up to $250.0 million of the Company’s outstanding common stock from time to time as market conditions warrant (the "2019 Repurchase Program"). The 2019 Repurchase Program was fully exhausted on November 17, 2021.
On November 16, 2021, the Company’s board of directors approved a share repurchase program (the "2021 Repurchase Program"), effective immediately, that allows the Company to repurchase up to $500.0 million of its outstanding common stock. The 2021 Repurchase Program expires in January 2025. The Company initiated the 2019 Repurchase Program and the 2021 Repurchase Program to mitigate potentially dilutive effects of stock options and shares of restricted stock granted by the Company, in addition to enhancing stockholder value.
As of February 3, 2024, $189.3 million remained available to purchase under the 2021 Repurchase Program. The Company repurchased 1,958,218 , 2,234,708 , and 3,331,956 shares of common stock totaling $130.2 million, $152.5 million and $179.2 million in fiscal years 2023, 2022, and 2021, respectively.
13. Income Taxes
The provision for income taxes from continuing operations includes the following (in thousands):
| Fiscal Year Ended | |||||||||||||||||
| February 3, 2024 | January 28, 2023 | January 29, 2022 | |||||||||||||||
| Federal: | |||||||||||||||||
| Current | $ | $ | $ | ||||||||||||||
| Deferred | |||||||||||||||||
| State: | |||||||||||||||||
| Current | |||||||||||||||||
| Deferred | ( | ( | |||||||||||||||
| Total income tax provision | $ | $ | $ | ||||||||||||||
A reconciliation of the statutory federal income tax rate with the Company’s effective income tax rate is as follows:
| Fiscal Year Ended | |||||||||||||||||
| February 3, 2024 | January 28, 2023 | January 29, 2022 | |||||||||||||||
| Statutory federal income tax rates | % | % | % | ||||||||||||||
| State income taxes, net of federal tax benefit | |||||||||||||||||
| Work opportunity and solar energy tax credit | ( | ( | ( | ||||||||||||||
| Charitable contributions | ( | ( | ( | ||||||||||||||
| Prior year adjustments | |||||||||||||||||
| Excess tax benefit related to stock-based compensation | ( | ( | ( | ||||||||||||||
| Other | |||||||||||||||||
| Effective income tax rate | % | % | % | ||||||||||||||
71
Significant components of the Company’s deferred tax assets and liabilities as of February 3, 2024 and January 28, 2023 are as follows (in thousands):
| February 3, 2024 | January 28, 2023 | ||||||||||
| Deferred tax assets: | |||||||||||
| Operating lease liability | $ | $ | |||||||||
| Self-insurance reserves | |||||||||||
| Compensation and benefits | |||||||||||
| Financing obligations | |||||||||||
| Environment clean up reserve | |||||||||||
| Startup costs | |||||||||||
| Other | |||||||||||
| Total deferred tax assets | $ | $ | |||||||||
| Deferred tax liabilities: | |||||||||||
| Operating lease right-of-use assets | $ | $ | |||||||||
| Property and equipment | |||||||||||
| Intangible assets | |||||||||||
| Debt costs | |||||||||||
| Other | |||||||||||
| Total deferred tax liabilities | |||||||||||
| Net deferred tax liabilities | $ | ( | $ | ( | |||||||
The ultimate realization of deferred tax assets is dependent upon the Company’s ability to generate sufficient taxable income during the periods in which the temporary differences become deductible. The Company has determined that it is more likely than not that the results of future operations and the reversals of existing taxable temporary differences will generate sufficient taxable income to realize the deferred tax assets. Therefore, no valuation allowance has been recorded. In making this determination, the Company considered historical levels of income as well as projections for future periods.
A reconciliation of the beginning and ending amount of unrecognized tax benefits is as follows (in thousands):
| Fiscal Year Ended | |||||||||||
| February 3, 2024 | January 28, 2023 | ||||||||||
| Balance, beginning of period | $ | $ | |||||||||
| Additions for tax positions taken during the current year | |||||||||||
| Lapses in statute of limitations | ( | ( | |||||||||
| Balance, end of period | $ | $ | |||||||||
The total amount of unrecognized tax benefits, reflective of federal tax benefits at both February 3, 2024 and January 28, 2023 that, if recognized, would favorably affect the effective tax rate was $2.3 million and $1.2 million, respectively.
As of February 3, 2024, management has determined it is reasonably possible that the total amount of unrecognized tax benefits could decrease within the next twelve months by $0.3 million, due to the expiration of statute of limitations and expected resolution of state tax audits. The Company’s tax years from 2019 forward remain open and are subject to examination by the Internal Revenue Service or various state taxing jurisdictions.
The Company classifies interest expense and any penalties related to income tax uncertainties as a component of income tax expense. The Company recognized $0.1 no interest income or expense for fiscal year 2021. As of February 3, 2024 and January 28, 2023, the Company had $0.2 million and $0.1 million, respectively, of accrued interest related to income tax uncertainties.
72
14. Retirement Plans
Under the Company's 401(k) savings plans, participating employees may make pretax contributions up to 50 % of covered compensation subject to federal limits. The Company matches employee contributions at 50 % of the first six percent of covered compensation. The Company’s expense under these plans was $15.2 million, $13.7 million and $11.1 million for fiscal years 2023, 2022, and 2021, respectively.
The Company had a non-contributory defined contribution retirement plan for certain key employees, which was terminated in fiscal year 2023. Under this plan, the Company funded annual retirement contributions for the designated participants on an after-tax basis. The Company’s contributions equaled 5 % of the participants’ base salary. Historically, participants became fully vested in their contribution accounts at the end of the fiscal year in which they completed full fiscal years of service. Upon termination of the plan, all remaining contributions became fully vested. Expense under this plan was $0.5 million, $3.7 million and $1.8 million in fiscal years 2023, 2022, and 2021, respectively. As of February 3, 2024, the remaining $2.2 million due to participants was included in accrued expenses and other current liabilities in the consolidated balance sheets.
Effective January 1, 2024, the Company offers certain qualifying individuals the ability to participate in the NQDC Plan. The NQDC Plan allows employees to defer up to 50 % of the participant's annual base salary as well as up to 100 % of any annual bonus award. The Company may also elect to provide a discretionary contribution to the NQDC Plan to certain executives, which will become 100 % vested on the third anniversary of a participant's date of hire. A participant will be 100 % vested at all times in their elective deferral account within the NQDC Plan. The Company credits the amounts deferred with earnings and holds investments to offset the Company's liabilities under the NQDC Plan. As of February 3, 2024, all investments were held in mutual funds. The NQDC Plan liability and total investments are included in other non-current liabilities and other assets, respectively, in the consolidated balance sheets and were not material as of February 3, 2024. Additionally, expense under this plan was not material for fiscal year 2023.
15. Asset Retirement Obligations
The following is a summary of activity relating to the liability for asset retirement obligations, which the Company will incur primarily in connection with the expected future removal of gasoline tanks, solar panels and the related infrastructure. The following is included in other non-current liabilities on the consolidated balance sheets (in thousands):
| Fiscal Year Ended | |||||||||||||||||
| February 3, 2024 | January 28, 2023 | January 29, 2022 | |||||||||||||||
| Balance, beginning of period | $ | $ | $ | ||||||||||||||
| Accretion expense | |||||||||||||||||
| Liabilities incurred during the year | |||||||||||||||||
| Balance, end of period | $ | $ | $ | ||||||||||||||
73
16. Accrued Expenses and Other Current Liabilities
The major components of accrued expenses and other current liabilities are as follows (in thousands):
| February 3, 2024 | January 28, 2023 | ||||||||||
| Deferred membership fee income | $ | $ | |||||||||
| Outstanding checks and payables | |||||||||||
| Employee compensation and benefits | |||||||||||
| Sales, property, use and other taxes | |||||||||||
| Insurance reserves | |||||||||||
| Fixed asset accruals and property-related costs | |||||||||||
| Rewards programs and related deferred revenues | |||||||||||
| Deferred revenues and vendor income | |||||||||||
| Professional services and advertising | |||||||||||
| Legal, sales, and membership fee reserves | |||||||||||
| Gift cards | |||||||||||
| Other | |||||||||||
| Total accrued expenses and other current liabilities | $ | $ | |||||||||
The following table summarizes membership fee income activity for each of the last two fiscal years (in thousands):
| Fiscal Year Ended | |||||||||||
| February 3, 2024 | January 28, 2023 | ||||||||||
| Deferred membership fee income, beginning of period | $ | $ | |||||||||
| Cash received from members | |||||||||||
| Revenue recognized in earnings | ( | ( | |||||||||
| Deferred membership fee income, end of period | $ | $ | |||||||||
17. Other Non-current Liabilities
The major components of other non-current liabilities are as follows (in thousands):
| February 3, 2024 | January 28, 2023 | ||||||||||
| Insurance reserves | $ | $ | |||||||||
| Asset retirement obligations | |||||||||||
| Deferred revenues | |||||||||||
| Other | |||||||||||
| Total other non-current liabilities | $ | $ | |||||||||
18. Fair Value Measurements
Assets and Liabilities Measured at Fair Value on a Recurring Basis
The fair values of the Company’s derivative instruments were based on quotes received from third-party banks and represent the estimated amount the Company would pay to terminate the agreements taking into consideration current interest rates as well as the creditworthiness of the counterparties. These inputs were considered to be Level 2. All derivative instruments expired in the first quarter of fiscal year 2022.
74
Financial Assets and Liabilities
The fair value of the Company's long-term debt is estimated based on current market rates for our specific debt instrument. Judgment is required to develop these estimates. As such, the estimated fair value of long-term debt is classified within Level 2, as defined under U.S. GAAP.
The gross carrying amount and fair value of the Company’s debt at February 3, 2024 are as follows (in thousands):
| Carrying Amount | Fair Value | ||||||||||
| ABL Revolving Facility | $ | $ | |||||||||
| First Lien Term Loan | |||||||||||
| Total Debt | $ | $ | |||||||||
The gross carrying amount and fair value of the Company’s debt at January 28, 2023 are as follows (in thousands):
| Carrying Amount | Fair Value | ||||||||||
| ABL Revolving Facility | $ | $ | |||||||||
| First Lien Term Loan | |||||||||||
| Total Debt | $ | $ | |||||||||
Assets and Liabilities Measured at Fair Value on a Non-recurring Basis
The Company measures certain non-financial assets and liabilities, including long-lived assets, at fair value on a non-recurring basis. See Note 2 for further information.
The Company believes that the carrying amounts of its other financial instruments, including cash, accounts receivable, and accounts payable approximate their fair values due to the short-term maturities of these instruments.
19. Earnings Per Share
The table below reconciles basic weighted-average common shares outstanding to diluted weighted-average common shares outstanding for fiscal years 2023, 2022, and 2021 (in thousands):
| Fiscal Year Ended | |||||||||||||||||
| February 3, 2024 | January 28, 2023 | January 29, 2022 | |||||||||||||||
| Weighted-average shares of common stock outstanding, used for basic computation | |||||||||||||||||
| Plus: Incremental shares of potentially dilutive securities: | |||||||||||||||||
| Weighted-average shares of common stock and dilutive potential shares of common stock outstanding | |||||||||||||||||
The table below summarizes awards that were excluded from the computation of diluted earnings for fiscal years 2023, 2022, and 2021 as their inclusion would have been anti-dilutive (in thousands):
| Fiscal Year Ended | |||||||||||||||||
| February 3, 2024 | January 28, 2023 | January 29, 2022 | |||||||||||||||
| Stock-based awards | |||||||||||||||||
20. Acquisitions
On May 2, 2022, the Company completed the Acquisition to bring substantially all of its end-to-end perishable supply chain in-house. The total consideration paid by the Company in connection with the Acquisition was approximately $375.6 million, excluding transaction costs. The Company did no t record any transaction costs for the fiscal year ended February 3, 2024. For the fiscal year ended January 28, 2023, the Company recorded transaction and integration costs related to the Acquisition of $12.3 million. These costs are included in selling, general and administrative expenses in the consolidated statements of operations and comprehensive income.
75
The following table summarizes the consideration paid and the final fair values of the assets acquired and liabilities assumed in connection with the Acquisition (in thousands):
| As of May 2, 2022 | |||||
| Fair Value | |||||
| Assets: | |||||
| Property and equipment, net | $ | ||||
| Merchandise inventories | |||||
| Goodwill | |||||
| Operating lease right-of-use assets, net | |||||
| Prepaid expenses and other current assets | |||||
| Intangibles, net | |||||
| Total assets | |||||
| Liabilities | |||||
| Long-term operating lease liabilities | ( | ||||
| Accrued expenses and other current liabilities | ( | ||||
| Total liabilities | ( | ||||
| Total consideration paid, including working capital adjustments | $ | ||||
Goodwill represents the excess of the purchase price over the net identifiable assets acquired and liabilities assumed. Goodwill is primarily attributable to the assembled workforce and bringing the Company's perishable supply chain in-house. Goodwill deductible for tax purposes is $84.7 million.
The Acquisition was accounted for as a business combination using the acquisition method with the Company as the accounting acquirer in accordance with ASC 805. Under this method of accounting, the purchase price is allocated to the assets acquired and liabilities assumed of the acquiree based upon their estimated fair values at the acquisition date.
For the fiscal year ended January 28, 2023, the Acquisition generated an incremental $66.8 million in revenue. It is impracticable to provide historical supplemental pro forma financial information along with earnings during the period subsequent to the Acquisition due to a variety of factors, including access to historical information and the operations of acquiree being integrated within the Company shortly after closing and not operating as discrete entities within the Company’s organizational structure.
76
21. Condensed Financial Information of Registrant (Parent Company Only)
BJ’S WHOLESALE CLUB HOLDINGS, INC.
(PARENT COMPANY ONLY)
CONDENSED BALANCE SHEETS
(Amounts in thousands)
| February 3, 2024 | January 28, 2023 | ||||||||||
| ASSETS | |||||||||||
| Investment in subsidiaries | $ | $ | |||||||||
| STOCKHOLDERS’ EQUITY | |||||||||||
Preferred stock; $ | $ | $ | |||||||||
Common stock; $ | |||||||||||
| Additional paid-in capital | |||||||||||
| Retained earnings | |||||||||||
Treasury stock, at cost, | ( | ( | |||||||||
| Total stockholders’ equity | $ | $ | |||||||||
BJ’S WHOLESALE CLUB HOLDINGS, INC.
(PARENT COMPANY ONLY)
CONDENSED STATEMENTS OF OPERATIONS AND COMPREHENSIVE INCOME
(Amounts in thousands, except per share amounts)
| Fiscal Year Ended | |||||||||||||||||
| February 3, 2024 | January 28, 2023 | January 29, 2022 | |||||||||||||||
| Equity in net income of subsidiaries | $ | $ | $ | ||||||||||||||
| Net income | |||||||||||||||||
| Net income per share: | |||||||||||||||||
| Basic | $ | $ | $ | ||||||||||||||
| Diluted | |||||||||||||||||
| Weighted-average number of shares outstanding: | |||||||||||||||||
| Basic | |||||||||||||||||
| Diluted | |||||||||||||||||
A statement of cash flows has not been presented as BJ’s Wholesale Club Holdings, Inc. did not have any cash as of, or for, the years ended February 3, 2024, January 28, 2023, or January 29, 2022.
Basis of Presentation
These condensed parent company-only financial statements have been prepared in accordance with Rule 12-04, Schedule I of Regulation S-X, as the restricted net assets of the subsidiaries of BJ’s Wholesale Club Holdings, Inc. (as defined in Rule 4-08(e)(3) of Regulation S-X) exceed 25% of the consolidated net assets of the Company. The ability of BJ’s Wholesale Club Holdings, Inc.’s operating subsidiaries to pay dividends may be restricted due to terms of the subsidiaries’ First Lien Term Loan and ABL Revolving Facility, as defined in Note 7. For example, the covenants of the ABL Revolving Facility restrict the payment of dividends to, among other exceptions, (i) a greater of $135.0 million or 15.0 % of trailing 12 months EBITDA general basket, (ii) a basket for unlimited dividends and distributions if there is no specified event of default and either (x) (A) availability under the ABL Revolving Facility is not less than 17.5 % of the lesser of the commitments under the ABL Revolving Facility and the borrowing base under the ABL Revolving Facility for the 30 consecutive day period ending immediately prior to such dividend or distribution and (B) availability under the ABL Revolving Facility is not less than 17.5 % of the lesser of the commitments under the ABL Revolving Facility and the borrowing base under the ABL Revolving Facility on the date of such dividend or distribution or (y) (A) availability under the ABL Revolving Facility is not less than 12.5 % of the lesser of the commitments under the ABL Revolving Facility and the borrowing base under the ABL Revolving Facility for
77
the 30 consecutive day period ending immediately prior to such dividend or distribution, (B) availability under the ABL Revolving Facility is not less than 12.5 % of the lesser of the commitments under the ABL Revolving Facility and the borrowing base under the ABL Revolving Facility on the date of such dividend or distribution and (C) the fixed charge coverage ratio as of the end of the most recently ended fiscal quarter for which financial statements are available is not less than 1.00 to 1.00, and (iii) ) a basket for up to 7.0 % per annum of the market capitalization of BJ’s Wholesale Club Holdings, Inc if there is no event of default. The covenants of the First Lien Term Loan restrict the payment of dividends and distributions to, among other exceptions, (i) a $25.0 million general basket, (ii) a basket for unlimited dividends and distributions if no event of default exists and the pro-forma total net leverage ratio is less than or equal to 4.25 to 1.00, (iii) a "growing" basket based on, among other things, retained excess cash flow subject to no event of default and compliance with a pro-forma interest coverage ratio of greater than or equal to 2.00 to 1.00, and (iv) a basket for 6.0 % per annum of the net cash proceeds received from such qualified IPO that are contributed to the borrower in cash. As of February 3, 2024, the amount of net income free of such restrictions and available for payment by BJ’s Wholesale Club Holdings, Inc. as dividends, was $523.7 million, and the total amount of restricted net assets of consolidated subsidiaries of BJ’s Wholesale Club Holdings, Inc. was $108.7 million.
All subsidiaries of BJ’s Wholesale Club, Inc. are consolidated. These condensed parent company financial statements have been prepared using the same accounting principles and policies described in the notes to the consolidated financial statements, with the only exception being that the parent company accounts for its subsidiaries using the equity method.
78
Item 9. Changes in and Disagreements with Accountants on Accounting and Financial Disclosure
None.
Item 9A. Controls and Procedures
Disclosure Controls and Procedures
We maintain disclosure controls and procedures that are designed to ensure that information required to be disclosed in the Company’s reports under the Exchange Act is recorded, processed, summarized and reported within the time periods specified in the SEC’s rules and forms and that such information is accumulated and communicated to the Company’s management, including the Company’s Chief Executive Officer and Chief Financial Officer, as appropriate, to allow timely decisions regarding required disclosures. Any controls and procedures, no matter how well designed and operated, can provide only reasonable assurance of achieving the desired control objectives. The Company’s management, with the participation of the Company’s Chief Executive Officer and Chief Financial Officer, has evaluated the effectiveness of the design and operation of the Company’s disclosure controls and procedures as of the end of the period covered by this Annual Report on Form 10-K. Based upon that evaluation, the Company’s Chief Executive Officer and Chief Financial Officer concluded that, as of February 3, 2024, the Company’s disclosure controls and procedures were effective to accomplish their objectives at the reasonable assurance level.
Changes in Internal Control over Financial Reporting
There were no changes in our internal control over financial reporting identified in management’s evaluation pursuant to Rules 13a-15(d) or 15d-15(d) of the Exchange Act during the most recently completed fiscal quarter that materially affected, or are reasonably likely to materially affect, our internal control over financial reporting.
Management’s Report on Internal Control Over Financial Reporting
The management of the Company is responsible for establishing and maintaining adequate internal control over financial reporting as defined in Exchange Act Rules 13a-15(f) and 15d-15(f). The Company’s internal control over financial reporting was designed to provide reasonable assurance regarding the reliability of financial reporting and the preparation of the Company’s financial statements for external purposes in accordance with accounting principles generally accepted in the United States. Our internal control over financial reporting includes those policies and procedures that:
•pertain to the maintenance of records that, in reasonable detail, accurately and fairly reflect the transactions and dispositions of our assets;
•provide reasonable assurance that transactions are recorded as necessary to permit preparation of financial statements in accordance with accounting principles generally accepted in the United States, and that receipts and expenditures are being made only in accordance with authorizations of our management and directors; and
•provide reasonable assurance regarding prevention or timely detection of unauthorized acquisition, use or disposition of our assets that could have a material effect on the financial statements.
Because of its inherent limitations, internal control over financial reporting may not prevent or detect misstatements. Also, projections of any evaluation of effectiveness to future periods are subject to the risk that controls may become inadequate because of changes in conditions, or that the degree of compliance with the policies or procedures may deteriorate.
Management assessed the effectiveness of the Company’s internal control over financial reporting as of February 3, 2024. In making its assessment of internal control over financial reporting, management used the criteria issued by the Committee of Sponsoring Organizations of the Treadway Commission (COSO) in Internal Control-Integrated Framework (2013). Based on the results of this assessment, management, including our Chief Executive Officer and our Chief Financial Officer, has concluded that, as of February 3, 2024, our internal control over financial reporting was effective.
The effectiveness of the Company’s internal control over financial reporting as of February 3, 2024 has been audited by PricewaterhouseCoopers LLP, an independent registered public accounting firm, as stated in their report which appears herein.
79
Item 9B. Other Information
On December 22, 2023 , Mr. Robert W. Eddy , president, chief executive officer of the Company, adopted a trading arrangement with respect to the sale of securities of the Company’s common stock that is intended to satisfy the affirmative defense conditions of Securities Exchange Act Rule 10b5-1(c) (a “Rule 10b5-1 Trading Plan”). Mr. Eddy’s Rule 10b5-1 Trading Plan, which has a term of eight months , provides for the sale of up to 99,000 shares of common stock pursuant to the terms of the plan.
On January 11, 2024 , Mr. Joseph McGrail , senior vice president, controller of the Company, adopted a Rule 10b5-1 Trading Plan. Mr. McGrail’s Rule 10b5-1 Trading Plan, which has a term of six months , provides for the sale of up to 1,000 shares of common stock pursuant to the terms of the plan.
Item 9C. Disclosure Regarding Foreign Jurisdictions that Prevent Inspections
Not applicable.
80
PART III
The information required by Items 10-14 will be set forth in our Definitive Proxy Statement for our 2024 Annual Meeting of Shareholders, to be filed pursuant to Regulation 14A under the Exchange Act not later than 120 days after the end of the fiscal year covered by this report (the "2024 Proxy Statement"), and is incorporated herein by reference.
Item 10. Directors, Executive Officers and Corporate Governance
The information required by this item, other than the information about our executive officers contained in the discussion entitled "Information about our Executive Officers" in Part I of this Annual Report on Form 10-K, is incorporated by reference to the 2024 Proxy Statement.
Item 11. Executive Compensation
The information required by this item is incorporated by reference to the 2024 Proxy Statement.
Item 12. Security Ownership of Certain Beneficial Owners and Management and Related Stockholder Matters
The information required by this item is incorporated by reference to the 2024 Proxy Statement.
Item 13. Certain Relationships and Related Transactions, and Director Independence
The information required by this item is incorporated by reference to the 2024 Proxy Statement.
Item 14. Principal Accountant Fees and Services
The information required by this item is incorporated by reference to the 2024 Proxy Statement.
81
PART IV
Item 15. Exhibits and Financial Statement Schedules
(1) Financial Statements
We include this portion of Item 15 under Item 8 of this Annual Report on Form 10-K.
(2) Financial Statement Schedules
All schedules are omitted as the required information is either not present, not present in material amounts or presented within the consolidated financial statements or related notes.
(3) Exhibits
The following list of exhibits includes exhibits submitted with this Annual Report on Form 10-K as filed with the SEC and those incorporated by reference to other filings.
82
| Exhibit Number | Exhibit Description | |||||||
| 3.1 | ||||||||
| 3.1.1 | ||||||||
| 3.1.2 | ||||||||
| 3.2 | ||||||||
| 4.1 | ||||||||
| 10.1 | ||||||||
| 10.1.1 | ||||||||
| 10.2 | ||||||||
| 10.2.1 | ||||||||
| 10.2.2 | Second Refinancing Amendment to First Lien Term Loan Credit Agreement, by and among BJ’s Wholesale Club, Inc., the Company, the lenders party thereto from time to time and Nomura Corporate Funding Americas, LLC, as administrative agent and as collateral agent, dated as of January 29, 2020 (previously filed as Exhibit 10.2.2 to the Company's Annual Report on Form 10-K (File No. 001-38559 ) on March 16, 2023 and incorporated herein by reference). | |||||||
| 10.2.3 | ||||||||
| 10.2.4 | ||||||||
| 10.3 | ||||||||
| 10.4# | ||||||||
| 10.5# | ||||||||
| 10.6# | ||||||||
83
| 10.7# | ||||||||
| 10.8# | ||||||||
| 10.9# | ||||||||
| 10.9.1# | ||||||||
| 10.10# | ||||||||
| 10.10.1# | ||||||||
| 10.11# | ||||||||
| 10.12# | ||||||||
| 10.13# | ||||||||
| 10.14# | ||||||||
| 10.15# | ||||||||
| 10.15.1# | ||||||||
| 10.16 | ||||||||
| 10.17 | ||||||||
| 21.1 | ||||||||
| 23.1 | ||||||||
| 31.1 | ||||||||
| 31.2 | ||||||||
| 32.1 | ||||||||
| 32.2 | ||||||||
| 97 | ||||||||
| 101.INS | Inline XBRL Instance Document | |||||||
| 101.SCH | Inline XBRL Taxonomy Extension Schema Document (filed herewith) | |||||||
| 101.CAL | Inline XBRL Taxonomy Extension Calculation Linkbase Document (filed herewith) | |||||||
| 101.DEF | Inline XBRL Taxonomy Extension Definition Linkbase Document (filed herewith) | |||||||
| 101.LAB | Inline XBRL Taxonomy Extension Label Linkbase Document (filed herewith) | |||||||
| 101.PRE | Inline XBRL Taxonomy Extension Linkbase Document (filed herewith) | |||||||
84
| 104 | Cover Page Interactive Data File (formatted as Inline XBRL with applicable taxonomy extension information contained in Exhibits 101.*) (filed herewith). | |||||||
| # | Represents management compensation plan, contract or arrangement. | ||||
Item 16. Form 10-K Summary
None.
85
SIGNATURES
Pursuant to the requirements of Section 13 or 15(d) of the Securities Exchange Act of 1934, the Registrant has duly caused this report to be signed on its behalf by the undersigned, thereunto duly authorized.
| BJ’S WHOLESALE CLUB HOLDINGS, INC. | |||||
| /s/ Robert W. Eddy | |||||
| Robert W. Eddy | |||||
| President & Chief Executive Officer | |||||
| Dated: March 18, 2024 | |||||
Pursuant to the requirements of the Securities Exchange Act of 1934, this report has been signed below by the following persons on behalf of the Registrant and in the capacities indicated.
86
| /s/ Robert W. Eddy | |||||
Robert W. Eddy Chairman, President & Chief Executive Officer (Principal Executive Officer) | |||||
| Date: March 18, 2024 | |||||
| /s/ Laura L. Felice | |||||
Laura L. Felice Executive Vice President, Chief Financial Officer (Principal Financial Officer) | |||||
| Date: March 18, 2024 | |||||
| /s/ Joseph McGrail | |||||
Joseph McGrail Senior Vice President, Controller (Principal Accounting Officer) | |||||
| Date: March 18, 2024 | |||||
| /s/ Christopher J. Baldwin | |||||
Christopher J. Baldwin Director | |||||
| Date: March 18, 2024 | |||||
| /s/ Darryl Brown | |||||
Darryl Brown Director | |||||
| Date: March 18, 2024 | |||||
| /s/ Maile Clark | |||||
Maile Clark Director | |||||
| Date: March 18, 2024 | |||||
| /s/ Michelle Gloeckler | |||||
Michelle Gloeckler Director | |||||
| Date: March 18, 2024 | |||||
| /s/ Steven L. Ortega | |||||
Steven L. Ortega Director | |||||
| Date: March 18, 2024 | |||||
| /s/ Ken Parent | |||||
Ken Parent Director | |||||
| Date: March 18, 2024 | |||||
| /s/ Christopher H. Peterson | |||||
Christopher H. Peterson Director | |||||
| Date: March 18, 2024 | |||||
| /s/ Cathy Marie Robinson | |||||
Cathy Marie Robinson Director | |||||
| Date: March 18, 2024 | |||||
87
| /s/ Robert Steele | |||||
Robert Steele Director | |||||
| Date: March 18, 2024 | |||||
88