UNITED STATES
SECURITIES AND EXCHANGE COMMISSION
Washington, D.C. 20549
FORM 10-Q
(Mark One)
For the quarterly period ended March 31, 2024
OR
For the transition period from to
Commission File Number: 1-36691
(Exact name of registrant as specified in its charter)
| (State or other jurisdiction of incorporation or organization) | (I.R.S. Employer Identification No.) | ||||
(Address of principal executive offices) (Zip Code)
Registrant's telephone number, including area code: (203 ) 299-8000
Former name, former address and former fiscal year, if changed since last report: N/A
_____________________________________________________________________________________________
Securities registered pursuant to Section 12(b) of the Act:
| Title of Each Class: | Trading Symbol(s) | Name of each exchange on which registered: | ||||||||||||
Indicate by check mark whether the registrant (1) has filed all reports required to be filed by Section 13 or 15(d) of the Securities Exchange Act of 1934 during the preceding 12 months (or for such shorter period that the registrant was required to file such reports), and (2) has been subject to such filing requirements for the past 90 days. Yes ☒ No ☐
Indicate by check mark whether the registrant has submitted electronically every Interactive Data File required to be submitted pursuant to Rule 405 of Regulation S-T (§232.405 of this chapter) during the preceding 12 months (or for such shorter period that the registrant was required to submit such files). Yes ☒ No ☐
Indicate by check mark whether the registrant is a large accelerated filer, an accelerated filer, a non-accelerated filer, a smaller reporting company, or an emerging growth company. See the definitions of "large accelerated filer," "accelerated filer," "smaller reporting company," and "emerging growth company" in Rule 12b-2 of the Exchange Act.
☒ | Accelerated filer | ☐ | Non-accelerated filer | ☐ | |||||||||||||
| Smaller reporting company | Emerging growth company | ||||||||||||||||
If an emerging growth company, indicate by check mark if the registrant has elected not to use the extended transition period for complying with any new or revised financial accounting standards provided pursuant to Section 13(a) of the Exchange Act. ☐
Indicate by check mark whether the registrant is a shell company (as defined in Rule 12b-2 of the Exchange Act). Yes ☐ No ☒
Number of shares of Common Stock outstanding at April 25, 2024:
| Common Stock, par value $0.008 per share | ||||||||
| (Class) | (Number of Shares) | |||||||
Booking Holdings Inc.
Form 10-Q
For the Three Months Ended March 31, 2024
| PART I - FINANCIAL INFORMATION | |||||
| Item 1. Financial Statements | |||||
Consolidated Balance Sheets at March 31, 2024 (Unaudited) and December 31, 2023 | |||||
Consolidated Statements of Operations (Unaudited) For the Three Months Ended March 31, 2024 and 2023 | |||||
Consolidated Statements of Comprehensive Income (Unaudited) For the Three Months Ended March 31, 2024 and 2023 | |||||
Consolidated Statements of Changes in Stockholders' (Deficit) Equity (Unaudited) For the Three Months Ended March 31, 2024 and 2023 | |||||
Consolidated Statements of Cash Flows (Unaudited) For the Three Months Ended March 31, 2024 and 2023 | |||||
| Notes to Unaudited Consolidated Financial Statements | |||||
| Item 2. Management's Discussion and Analysis of Financial Condition and Results of Operations | |||||
| Item 3. Quantitative and Qualitative Disclosures About Market Risk | |||||
| Item 4. Controls and Procedures | |||||
| PART II - OTHER INFORMATION | |||||
| Item 1. Legal Proceedings | |||||
| Item 1A. Risk Factors | |||||
| Item 2. Unregistered Sales of Equity Securities and Use of Proceeds | |||||
| Item 6. Exhibits | |||||
| SIGNATURES | |||||
3
PART I — FINANCIAL INFORMATION
Item 1. Financial Statements
Booking Holdings Inc.
CONSOLIDATED BALANCE SHEETS
(In millions, except share and per share data)
| March 31, 2024 | December 31, 2023 | |||||||||||||
| (Unaudited) | ||||||||||||||
| ASSETS | ||||||||||||||
| Current assets: | ||||||||||||||
| Cash and cash equivalents | $ | $ | ||||||||||||
Short-term investments (Available-for-sale debt securities: Amortized cost of $ | ||||||||||||||
Accounts receivable, net (Allowance for expected credit losses of $ | ||||||||||||||
| Prepaid expenses, net | ||||||||||||||
| Other current assets | ||||||||||||||
| Total current assets | ||||||||||||||
| Property and equipment, net | ||||||||||||||
| Operating lease assets | ||||||||||||||
| Intangible assets, net | ||||||||||||||
| Goodwill | ||||||||||||||
| Long-term investments | ||||||||||||||
| Other assets, net | ||||||||||||||
| Total assets | $ | $ | ||||||||||||
| LIABILITIES AND STOCKHOLDERS' DEFICIT | ||||||||||||||
| Current liabilities: | ||||||||||||||
| Accounts payable | $ | $ | ||||||||||||
| Accrued expenses and other current liabilities | ||||||||||||||
| Deferred merchant bookings | ||||||||||||||
| Short-term debt | ||||||||||||||
| Total current liabilities | ||||||||||||||
| Deferred income taxes | ||||||||||||||
| Operating lease liabilities | ||||||||||||||
| Long-term U.S. transition tax liability | ||||||||||||||
| Other long-term liabilities | ||||||||||||||
| Long-term debt | ||||||||||||||
| Total liabilities | ||||||||||||||
Commitments and contingencies (see Note 13) | ||||||||||||||
| Stockholders' deficit: | ||||||||||||||
Common stock, $ Authorized shares: Issued shares: | ||||||||||||||
Treasury stock: | ( | ( | ||||||||||||
| Additional paid-in capital | ||||||||||||||
| Retained earnings | ||||||||||||||
| Accumulated other comprehensive loss | ( | ( | ||||||||||||
| Total stockholders' deficit | ( | ( | ||||||||||||
| Total liabilities and stockholders' deficit | $ | $ | ||||||||||||
See Notes to Unaudited Consolidated Financial Statements.
4
Booking Holdings Inc.
UNAUDITED CONSOLIDATED STATEMENTS OF OPERATIONS
(In millions, except share and per share data)
| Three Months Ended March 31, | ||||||||||||||
| 2024 | 2023 | |||||||||||||
| Merchant revenues | $ | $ | ||||||||||||
| Agency revenues | ||||||||||||||
| Advertising and other revenues | ||||||||||||||
| Total revenues | ||||||||||||||
| Operating expenses: | ||||||||||||||
| Marketing expenses | ||||||||||||||
| Sales and other expenses | ||||||||||||||
Personnel, including stock-based compensation of $ | ||||||||||||||
| General and administrative | ||||||||||||||
| Information technology | ||||||||||||||
| Depreciation and amortization | ||||||||||||||
| Total operating expenses | ||||||||||||||
| Operating income | ||||||||||||||
| Interest expense | ( | ( | ||||||||||||
| Interest and dividend income | ||||||||||||||
| Other income (expense), net | ( | |||||||||||||
| Income before income taxes | ||||||||||||||
| Income tax expense | ||||||||||||||
| Net income | $ | $ | ||||||||||||
| Net income applicable to common stockholders per basic common share | $ | $ | ||||||||||||
| Weighted-average number of basic common shares outstanding (in 000's) | ||||||||||||||
| Net income applicable to common stockholders per diluted common share | $ | $ | ||||||||||||
| Weighted-average number of diluted common shares outstanding (in 000's) | ||||||||||||||
See Notes to Unaudited Consolidated Financial Statements.
5
Booking Holdings Inc.
UNAUDITED CONSOLIDATED STATEMENTS OF COMPREHENSIVE INCOME
(In millions)
| Three Months Ended March 31, | ||||||||||||||
| 2024 | 2023 | |||||||||||||
| Net income | $ | $ | ||||||||||||
| Other comprehensive loss, net of tax | ( | |||||||||||||
| Comprehensive income | $ | $ | ||||||||||||
See Notes to Unaudited Consolidated Financial Statements.
6
Booking Holdings Inc.
UNAUDITED CONSOLIDATED STATEMENTS OF CHANGES IN STOCKHOLDERS' (DEFICIT) EQUITY
(In millions, except share data)
| Common Stock | Treasury Stock | Additional Paid-in Capital | Retained Earnings | Accumulated Other Comprehensive Loss | Total | |||||||||||||||||||||||||||||||||||||||||||||
| Three Months Ended March 31, 2024 | Shares (in 000's) | Amount | Shares (in 000's) | Amount | ||||||||||||||||||||||||||||||||||||||||||||||
| Balance, December 31, 2023 | $ | ( | $ | ( | $ | $ | $ | ( | $ | ( | ||||||||||||||||||||||||||||||||||||||||
| Net income | — | — | — | — | — | — | ||||||||||||||||||||||||||||||||||||||||||||
| Other comprehensive loss, net of tax | — | — | — | — | — | — | ( | ( | ||||||||||||||||||||||||||||||||||||||||||
| Exercise of stock options and vesting of restricted stock units and performance share units | — | — | — | — | ||||||||||||||||||||||||||||||||||||||||||||||
| Stock-based compensation | — | — | — | — | — | — | ||||||||||||||||||||||||||||||||||||||||||||
| Repurchase of common stock | — | — | ( | ( | — | — | — | ( | ||||||||||||||||||||||||||||||||||||||||||
| Dividends | — | — | — | — | — | ( | — | ( | ||||||||||||||||||||||||||||||||||||||||||
| Balance, March 31, 2024 | $ | ( | $ | ( | $ | $ | $ | ( | $ | ( | ||||||||||||||||||||||||||||||||||||||||
| Three Months Ended March 31, 2023 | ||||||||||||||||||||||||||||||||||||||||||||||||||
| Balance, December 31, 2022 | $ | ( | $ | ( | $ | $ | $ | ( | $ | |||||||||||||||||||||||||||||||||||||||||
| Net income | — | — | — | — | — | — | ||||||||||||||||||||||||||||||||||||||||||||
| Exercise of stock options and vesting of restricted stock units and performance share units | — | — | — | — | ||||||||||||||||||||||||||||||||||||||||||||||
| Stock-based compensation | — | — | — | — | — | — | ||||||||||||||||||||||||||||||||||||||||||||
| Repurchase of common stock | — | — | ( | ( | — | — | — | ( | ||||||||||||||||||||||||||||||||||||||||||
| Balance, March 31, 2023 | $ | ( | $ | ( | $ | $ | $ | ( | $ | |||||||||||||||||||||||||||||||||||||||||
See Notes to Unaudited Consolidated Financial Statements.
7
Booking Holdings Inc.
UNAUDITED CONSOLIDATED STATEMENTS OF CASH FLOWS
(In millions)
| Three Months Ended March 31, | ||||||||||||||
| 2024 | 2023 | |||||||||||||
| OPERATING ACTIVITIES: | ||||||||||||||
| Net income | $ | $ | ||||||||||||
| Adjustments to reconcile net income to net cash provided by operating activities: | ||||||||||||||
| Depreciation and amortization | ||||||||||||||
| Provision for expected credit losses and chargebacks | ||||||||||||||
| Deferred income tax benefit | ( | ( | ||||||||||||
| Net losses on equity securities | ||||||||||||||
| Stock-based compensation expense | ||||||||||||||
| Operating lease amortization | ||||||||||||||
| Unrealized foreign currency transaction (gains) losses related to Euro-denominated debt | ( | |||||||||||||
| Changes in assets and liabilities: | ||||||||||||||
| Accounts receivable | ( | |||||||||||||
| Prepaid expenses and other current assets | ( | |||||||||||||
| Deferred merchant bookings and other current liabilities | ||||||||||||||
| Other | ( | |||||||||||||
| Net cash provided by operating activities | ||||||||||||||
| INVESTING ACTIVITIES: | ||||||||||||||
| Proceeds from sale and maturity of investments | ||||||||||||||
| Additions to property and equipment | ( | ( | ||||||||||||
| Other investing activities | ( | ( | ||||||||||||
| Net cash provided by investing activities | ||||||||||||||
| FINANCING ACTIVITIES: | ||||||||||||||
| Proceeds from the issuance of long-term debt | ||||||||||||||
| Payment on maturity of debt | ( | |||||||||||||
| Payments for repurchase of common stock | ( | ( | ||||||||||||
| Dividends paid | ( | |||||||||||||
| Proceeds from exercise of stock options | ||||||||||||||
| Other financing activities | ( | ( | ||||||||||||
| Net cash provided by (used in) financing activities | ( | |||||||||||||
| Effect of exchange rate changes on cash and cash equivalents and restricted cash and cash equivalents | ( | |||||||||||||
| Net increase in cash and cash equivalents and restricted cash and cash equivalents | ||||||||||||||
| Total cash and cash equivalents and restricted cash and cash equivalents, beginning of period | ||||||||||||||
| Total cash and cash equivalents and restricted cash and cash equivalents, end of period | $ | $ | ||||||||||||
| SUPPLEMENTAL CASH FLOW INFORMATION: | ||||||||||||||
| Cash paid during the period for income taxes | $ | $ | ||||||||||||
| Cash paid during the period for interest | $ | $ | ||||||||||||
See Notes to Unaudited Consolidated Financial Statements.
8
Booking Holdings Inc.
Notes to Unaudited Consolidated Financial Statements
1. BASIS OF PRESENTATION
Management of Booking Holdings Inc. (the "Company") is responsible for the Unaudited Consolidated Financial Statements included in this document. The Unaudited Consolidated Financial Statements have been prepared in accordance with accounting principles generally accepted in the United States of America ("U.S. GAAP") and include all normal and recurring adjustments that management of the Company considers necessary for a fair presentation of its financial position and operating results. The Company prepared the Unaudited Consolidated Financial Statements following the requirements of the Securities and Exchange Commission for interim reporting. As permitted under those rules, the Company condensed or omitted certain footnotes or other financial information that are normally required by U.S. GAAP for annual financial statements. These Unaudited Consolidated Financial Statements should be read in combination with the Consolidated Financial Statements in the Company's Annual Report on Form 10-K for the year ended December 31, 2023.
The Unaudited Consolidated Financial Statements include the accounts of the Company and its wholly-owned subsidiaries, including acquired businesses from the dates of acquisition. All intercompany accounts and transactions have been eliminated in consolidation. The functional currency of the Company's subsidiaries is generally the respective local currency. For international operations, assets and liabilities are translated into U.S. Dollars at the rate of exchange existing at the balance sheet date. Income statement amounts are translated at monthly average exchange rates applicable for the period. Translation gains and losses are included as a component of "Accumulated other comprehensive loss" in the accompanying Consolidated Balance Sheets. Foreign currency transaction gains and losses are included in "Other income (expense), net" in the Unaudited Consolidated Statements of Operations.
Revenues, expenses, assets, and liabilities can vary during each quarter of the year. Therefore, the results and trends in these interim financial statements may not be the same as those for any subsequent quarter or the full year.
Reclassification
Certain amounts from prior periods have been reclassified to conform to the current period presentation. These include the reclassification of certain indirect taxes, primarily digital services taxes, between "General and administrative" expenses and "Sales and other expenses" in the Unaudited Consolidated Statement of Operations. See Notes 2 and 21 to the Consolidated Financial Statements in the Company's Annual Report on Form 10-K for the year ended December 31, 2023.
Recent Accounting Pronouncements
See "Recent Accounting Pronouncements Adopted" and "Other Recent Accounting Pronouncements" in Note 2 to the Consolidated Financial Statements in the Company's Annual Report on Form 10-K for the year ended December 31, 2023.
Improved guidance to help determine transactions to be accounted for as share-based payment arrangements
In March 2024, the Financial Accounting Standards Board issued an Accounting Standards Update adding illustrative guidance to help entities determine whether profits interest and similar awards should be accounted for as share-based payment arrangements within the scope of the Accounting Standards Codification ("ASC") 718, Compensation - Stock Compensation. The update is effective for annual and interim financial statements beginning with the fiscal year 2025. The Company is currently evaluating the impact of the update on its Consolidated Financial Statements.
9
2. REVENUE
Disaggregation of Revenue
Geographic Information
The Company's revenues from its businesses outside of the U.S. consists of the results of Booking.com, Agoda, and Rentalcars.com in their entirety and the results of the KAYAK and OpenTable businesses located outside of the U.S. This classification is independent of where the consumer resides, where the consumer is physically located while using the Company's services, or the location of the travel service provider or restaurant. For example, a reservation made through Booking.com (which is domiciled in the Netherlands) at a hotel in New York by a consumer in the United States is part of the results of the Company's businesses outside of the U.S. The Company's geographic information on revenues is as follows (in millions):
| Outside of the U.S. | ||||||||||||||||||||||||||
| United States | The Netherlands | Other | Total Company | |||||||||||||||||||||||
| Total revenues for the three months ended March 31, | ||||||||||||||||||||||||||
| 2024 | $ | $ | $ | $ | ||||||||||||||||||||||
| 2023 | $ | $ | $ | $ | ||||||||||||||||||||||
Revenue by Type of Service
Approximately 89 88 % of the Company's revenues for the three months ended March 31, 2024 and 2023, respectively, relate to online accommodation reservation services. Revenues from all other sources of online travel reservation services and advertising and other revenues each individually represent less than 10
Incentive Programs
At March 31, 2024 and December 31, 2023, liabilities of $120 million and $149 million, respectively, were included in "Accrued expenses and other current liabilities" in the Consolidated Balance Sheets for incentives granted to consumers, including referral bonuses, rebates, credits, discounts, and loyalty programs.
Deferred Merchant Bookings
Cash payments received from travelers in advance of the Company completing its performance obligations are included in "Deferred merchant bookings" in the Company's Consolidated Balance Sheets and are comprised principally of amounts estimated to be payable to travel service providers as well as the Company's estimated future revenue for its commission or margin and fees. The amounts are mostly subject to refunds for cancellations.
10
3. STOCK-BASED COMPENSATION
The Company maintains equity incentive plans that include broad-based grants of restricted stock units, performance share units granted to officers and certain other employees, and stock options granted to certain employees.
Restricted stock units and performance share units granted by the Company during the three months ended March 31, 2024 had an aggregate grant-date fair value of $594 million. Restricted stock units and performance share units that vested during the three months ended March 31, 2024 had an aggregate fair value at vesting of $699 million. At March 31, 2024, there was $1.1 billion of estimated total future stock-based compensation expense related to unvested restricted stock units and performance share units to be recognized over a weighted-average period of 2.2 years.
The following table summarizes the activity in restricted stock units and performance share units for employees and non-employee directors during the three months ended March 31, 2024:
| Restricted Stock Units | Performance Share Units | |||||||||||||||||||||||||
| Shares | Weighted-average Grant-date Fair Value | Shares | Weighted-average Grant-date Fair Value | |||||||||||||||||||||||
Unvested at December 31, 2023 (1) | $ | $ | ||||||||||||||||||||||||
Granted (2) | $ | $ | ||||||||||||||||||||||||
| Vested | ( | $ | ( | $ | ||||||||||||||||||||||
Performance shares adjustment (3) | $ | |||||||||||||||||||||||||
| Forfeited | ( | $ | ( | $ | ||||||||||||||||||||||
| Unvested at March 31, 2024 | $ | $ | ||||||||||||||||||||||||
(1) Excludes 4,399 performance share units awarded during the year ended December 31, 2022 for which the grant date under ASC 718, Compensation - Stock Compensation, was not established as of December 31, 2023. Among other conditions, for the grant date to be established, a mutual understanding is required to be reached between the Company and the employee of the key terms and conditions of the award, including the performance targets. The performance targets for each of the annual performance periods under the award are set at the beginning of the respective year.
(2) Includes 4,399 performance share units awarded during the year ended December 31, 2022 for which the grant date under ASC 718 was established.
(3) Probable outcome for performance-based awards is updated based upon changes in actual and forecasted operating results or expected achievement of performance goals, as applicable, and the impact of modifications.
The following table summarizes the activity in stock options during the three months ended March 31, 2024:
| Employee Stock Options | Number of Shares | Weighted-average Exercise Price | Aggregate Intrinsic Value (in millions) | Weighted-average Remaining Contractual Term (in years) | ||||||||||||||||||||||
| Balance, December 31, 2023 | $ | $ | ||||||||||||||||||||||||
Exercised | ( | $ | $ | |||||||||||||||||||||||
| Balance, March 31, 2024 | $ | $ | ||||||||||||||||||||||||
| Exercisable at March 31, 2024 | $ | $ | ||||||||||||||||||||||||
11
4. NET INCOME PER SHARE
The Company computes basic net income per share by dividing net income applicable to common stockholders by the weighted-average number of common shares outstanding during the period. Diluted net income per share is based upon the weighted-average number of common and common equivalent shares outstanding during the period. Only dilutive common equivalent shares that decrease the net income per share are included in the computation of diluted net income per share.
Common equivalent shares related to stock options, restricted stock units, and performance share units are calculated using the treasury stock method. Performance share units are included in the weighted-average common equivalent shares based on the number of shares that would be issued if the end of the reporting period were the end of the performance period, if the result would be dilutive.
A reconciliation of the weighted-average number of shares outstanding used in calculating diluted net income per share is as follows (in thousands):
| Three Months Ended March 31, | ||||||||||||||
| 2024 | 2023 | |||||||||||||
| Weighted-average number of basic common shares outstanding | ||||||||||||||
Weighted-average dilutive stock options, restricted stock units, and performance share units | ||||||||||||||
| Assumed conversion of convertible senior notes | ||||||||||||||
Weighted-average number of diluted common and common equivalent shares outstanding | ||||||||||||||
5. INVESTMENTS
The following table summarizes the Company's investments by major security type at March 31, 2024 (in millions):
| Cost | Gross Unrealized Gains /Upward Adjustments | Gross Unrealized Losses /Downward Adjustments | Carrying Value | |||||||||||||||||||||||
| Short-term investments: | ||||||||||||||||||||||||||
| Debt securities: | ||||||||||||||||||||||||||
| International government securities | $ | $ | $ | $ | ||||||||||||||||||||||
U.S. government securities | ||||||||||||||||||||||||||
| Corporate debt securities | ( | |||||||||||||||||||||||||
| Total short-term investments | $ | $ | $ | ( | $ | |||||||||||||||||||||
| Long-term investments: | ||||||||||||||||||||||||||
| Equity securities: | ||||||||||||||||||||||||||
| Equity securities with readily determinable fair values | $ | $ | $ | ( | $ | |||||||||||||||||||||
| Equity securities of private entities | ( | |||||||||||||||||||||||||
| Total long-term investments | $ | $ | $ | ( | $ | |||||||||||||||||||||
12
The following table summarizes the Company's investments by major security type at December 31, 2023 (in millions):
| Cost | Gross Unrealized Gains/Upward Adjustments | Gross Unrealized Losses/Downward Adjustments | Carrying Value | |||||||||||||||||||||||
| Short-term investments: | ||||||||||||||||||||||||||
| Debt securities: | ||||||||||||||||||||||||||
| International government securities | $ | $ | $ | $ | ||||||||||||||||||||||
U.S. government securities (1) | ( | |||||||||||||||||||||||||
| Corporate debt securities | ( | |||||||||||||||||||||||||
| Total short-term investments | $ | $ | $ | ( | $ | |||||||||||||||||||||
| Long-term investments: | ||||||||||||||||||||||||||
| Equity securities: | ||||||||||||||||||||||||||
| Equity securities with readily determinable fair values | $ | $ | $ | ( | $ | |||||||||||||||||||||
| Equity securities of private entities | ( | |||||||||||||||||||||||||
| Total long-term investments | $ | $ | $ | ( | $ | |||||||||||||||||||||
(1) Includes investments in U.S. municipal bonds.
The Company has classified its investments in debt securities as available-for-sale debt securities. The aggregate unrealized gains and losses on the available-for-sale debt securities, net of tax, are included in "Accumulated other comprehensive loss" in the Consolidated Balance Sheets. The Company's investments in available-for-sale debt securities at March 31, 2024 had investment grade credit quality ratings. At March 31, 2024, investments in international government securities principally included debt securities issued by the governments of Germany, Norway, Canada, and Sweden.
Equity securities with readily determinable fair values include the Company's investments in DiDi Global Inc. ("DiDi") and Grab Holdings Limited ("Grab"), with fair values of $150 million and $133 million, respectively, at March 31, 2024, and $155 million and $143 million, respectively, at December 31, 2023. Net unrealized (losses) gains related to these investments are included in "Other income (expense), net" in the Unaudited Consolidated Statements of Operations for the three months ended March 31, 2024 and 2023. During the three months ended March 31, 2023, the Company sold its entire investment in Meituan for $1.7 billion, resulting in a loss of $149 million included in "Other income (expense), net" in the Unaudited Consolidated Statement of Operations for the three months ended March 31, 2023. The cost basis of the Company's investment in Meituan was $450 million.
The Company's investments in equity securities of private entities at March 31, 2024 and December 31, 2023
include the investment in Yanolja Co., Ltd., ("Yanolja") which had a carrying value of $98
6. FAIR VALUE MEASUREMENTS
There are three levels of inputs to valuation techniques used to measure fair value:
Level 1: Quoted prices in active markets that are accessible by the Company at the measurement date for identical assets and liabilities.
Level 2: Inputs that are observable, either directly or indirectly. Such prices may be based upon quoted prices for identical or comparable securities in active markets or inputs not quoted on active markets, but corroborated by market data.
Level 3: Unobservable inputs are used when little or no market data is available.
13
Financial assets and liabilities measured at fair value on a recurring basis at March 31, 2024 are classified in the categories described in the table below (in millions):
| Level 1 | Level 2 | Total | ||||||||||||||||||
Recurring fair value measurements (1) | ||||||||||||||||||||
| ASSETS: | ||||||||||||||||||||
| Cash equivalents and restricted cash equivalents: | ||||||||||||||||||||
| Money market fund investments | $ | $ | $ | |||||||||||||||||
| Certificates of deposit | ||||||||||||||||||||
| Short-term investments: | ||||||||||||||||||||
| International government securities | ||||||||||||||||||||
| U.S. government securities | ||||||||||||||||||||
| Corporate debt securities | ||||||||||||||||||||
| Long-term investments: | ||||||||||||||||||||
| Equity securities | ||||||||||||||||||||
| Derivatives: | ||||||||||||||||||||
| Foreign currency exchange derivatives | ||||||||||||||||||||
| Total assets at fair value | $ | $ | $ | |||||||||||||||||
| LIABILITIES: | ||||||||||||||||||||
| Foreign currency exchange derivatives | $ | $ | $ | |||||||||||||||||
(1) The Company did not have any Level 3 fair value measurements at March 31, 2024.
Financial assets and liabilities measured at fair value on a recurring basis at December 31, 2023 and nonrecurring fair value measurements are classified in the categories described in the table below (in millions):
| Level 1 | Level 2 | Level 3 | Total | |||||||||||||||||||||||
Recurring fair value measurements | ||||||||||||||||||||||||||
| ASSETS: | ||||||||||||||||||||||||||
| Cash equivalents and restricted cash equivalents: | ||||||||||||||||||||||||||
| Money market fund investments | $ | $ | $ | $ | ||||||||||||||||||||||
| Certificates of deposit | ||||||||||||||||||||||||||
| Short-term investments: | ||||||||||||||||||||||||||
| International government securities | ||||||||||||||||||||||||||
| U.S. government securities | ||||||||||||||||||||||||||
| Corporate debt securities | ||||||||||||||||||||||||||
| Long-term investments: | ||||||||||||||||||||||||||
| Equity securities | ||||||||||||||||||||||||||
| Derivatives: | ||||||||||||||||||||||||||
| Foreign currency exchange derivatives | ||||||||||||||||||||||||||
| Total assets at fair value | $ | $ | $ | $ | ||||||||||||||||||||||
| LIABILITIES: | ||||||||||||||||||||||||||
| Foreign currency exchange derivatives | $ | $ | $ | $ | ||||||||||||||||||||||
| Nonrecurring fair value measurements | ||||||||||||||||||||||||||
Investment in equity securities of a private entity (1) | $ | $ | $ | $ | ||||||||||||||||||||||
(1) During the year ended December 31, 2023, the investment in Yanolja was written down to its estimated fair value.
14
Investments
See Note 5 for additional information related to the Company's investments.
The Company's investments in debt securities are measured using "Level 2" inputs as the Company has access to quoted prices for identical or comparable securities, but does not have visibility into the volume and frequency of trading for these investments. A market approach is used for recurring fair value measurements and the valuation techniques use inputs that are observable, or can be corroborated by observable data, in an active marketplace.
The Company's investments measured using Level 3 inputs primarily consist of investments in privately-held entities. Fair values of these securities are estimated using a variety of valuation methodologies, including both the market and income approaches.
Derivatives
The Company reports the fair values of its derivative assets and liabilities on a gross basis in the Consolidated Balance Sheets in "Other current assets" and "Accrued expenses and other current liabilities," respectively. As of March 31, 2024 and December 31, 2023, the Company did not designate any derivatives as hedges for accounting purposes.
The table below provides estimated fair values of foreign currency exchange derivatives outstanding at March 31, 2024 and December 31, 2023 (in millions).
| March 31, 2024 | December 31, 2023 | |||||||||||||
| Estimated fair value of derivative assets | $ | $ | ||||||||||||
| Estimated fair value of derivative liabilities | $ | $ | ||||||||||||
For the Company's foreign currency exchange derivatives outstanding as of March 31, 2024 and December 31, 2023, the notional amounts of the foreign currency purchases were $6.3 billion and $4.9 billion, respectively, and the notional amounts of the foreign currency sales were $3.1 billion and $4.2 billion, respectively. The notional amount of a foreign currency forward contract is the contracted amount of foreign currency to be exchanged and is not recorded in the balance sheets.
The effect of foreign currency exchange derivatives recorded in "Other income (expense), net" in the Unaudited Consolidated Statements of Operations for the three months ended March 31, 2024 and 2023 is as follows (in millions):
| Three Months Ended March 31, | ||||||||||||||
| 2024 | 2023 | |||||||||||||
| Losses on foreign currency exchange derivatives | $ | $ | ||||||||||||
Other Financial Assets and Liabilities
At March 31, 2024 and December 31, 2023, the Company's cash consisted of bank deposits. Cash equivalents principally include money market fund investments and certificates of deposit and their carrying value generally approximates the fair value as they are readily convertible to known amounts of cash. Other financial assets and liabilities, including restricted cash, accounts payable, accrued expenses, and deferred merchant bookings, are carried at cost which approximates their fair values because of the short-term nature of these items. Accounts receivable and other financial assets measured at amortized cost are carried at cost less an allowance for expected credit losses to present the net amount expected to be collected (see Note 7). See Note 9 for the estimated fair value of the Company's outstanding senior notes, including the estimated fair value of the Company's convertible senior notes.
15
7. ACCOUNTS RECEIVABLE AND OTHER FINANCIAL ASSETS
Accounts receivable in the Consolidated Balance Sheets at March 31, 2024 and December 31, 2023 includes receivables from customers of $1.8 billion and $1.9 billion, respectively, and receivables from payment processors and networks of $1.5 billion and $1.3 billion, respectively. The remaining balance principally relates to receivables from marketing affiliates. The amounts mentioned above are stated on a gross basis, before deducting the allowance for expected credit losses.
Significant judgments and assumptions are required to estimate the allowance for expected credit losses and such assumptions may change in future periods, particularly the assumptions related to the business prospects and financial condition of customers and marketing affiliates, including macroeconomic conditions, inflationary pressures, potential recession, and the Company's ability to collect the receivable or recover prepayments.
The following table summarizes the activity of the allowance for expected credit losses on receivables (in millions):
| Three Months Ended March 31, | ||||||||||||||
| 2024 | 2023 | |||||||||||||
| Balance, beginning of year | $ | $ | ||||||||||||
| Provision charged to earnings | ||||||||||||||
| Write-offs and adjustments | ( | ( | ||||||||||||
| Foreign currency translation adjustments | ( | |||||||||||||
| Balance, end of period | $ | $ | ||||||||||||
8. INTANGIBLE ASSETS AND GOODWILL
The Company's intangible assets at March 31, 2024 and December 31, 2023 consist of the following (in millions):
| March 31, 2024 | December 31, 2023 | ||||||||||||||||||||||||||||||||||||||||
| Gross Carrying Amount | Accumulated Amortization | Net Carrying Amount | Gross Carrying Amount | Accumulated Amortization | Net Carrying Amount | Amortization Period | |||||||||||||||||||||||||||||||||||
| Trade names | $ | $ | ( | $ | $ | $ | ( | $ | |||||||||||||||||||||||||||||||||
| Supply and distribution agreements | ( | ( | |||||||||||||||||||||||||||||||||||||||
| Other intangible assets | ( | ( | Up to | ||||||||||||||||||||||||||||||||||||||
| Total intangible assets | $ | $ | ( | $ | $ | $ | ( | $ | |||||||||||||||||||||||||||||||||
The balance of goodwill as of March 31, 2024 and December 31, 2023 is stated net of cumulative impairment charges of $2.0
16
9. DEBT
Revolving Credit Facility
See Note 12 to the Consolidated Financial Statements in the Company's Annual Report on Form 10-K for the year ended December 31, 2023 for information related to the Company’s five-year unsecured revolving credit facility that extends a revolving line of credit of up to $2 billion to the Company. At March 31, 2024 and December 31, 2023, there were no borrowings outstanding and $21 million and $18 million, respectively, of letters of credit issued under the revolving credit facility.
Outstanding Debt
Outstanding debt at March 31, 2024 and December 31, 2023 consists of the following (in millions):
| March 31, 2024 | December 31, 2023 | |||||||||||||||||||||||||
Outstanding Principal Amount | Carrying Value (1) | Outstanding Principal Amount | Carrying Value (1) | |||||||||||||||||||||||
| $ | $ | $ | $ | |||||||||||||||||||||||
| Total outstanding debt | $ | $ | $ | $ | ||||||||||||||||||||||
| Short-term debt | $ | $ | $ | $ | ||||||||||||||||||||||
| Long-term debt | $ | $ | $ | $ | ||||||||||||||||||||||
(1) The carrying values differ from the outstanding principal amounts due to unamortized debt discounts and debt issuance costs of $98 million and $65 million as of March 31, 2024 and December 31, 2023, respectively.
(2) Included in "Short-term debt" in the Unaudited Consolidated Balance Sheet as of March 31, 2024.
(3) Included in "Short-term debt" in the Consolidated Balance Sheet as of December 31, 2023.
Fair Value of Debt
At March 31, 2024 and December 31, 2023, the estimated fair value of the outstanding debt was approximately $17.9 billion and $15.2 billion, respectively, and was considered a "Level 2" fair value measurement (see Note 6). Fair value was estimated based upon actual trades at the end of the reporting period or the most recent trade available as well as the Company's stock price at the end of the reporting period. The estimated fair value of the Company's debt in excess of the outstanding principal amount at March 31, 2024 and December 31, 2023 primarily relates to the conversion premium on the convertible senior notes due in May 2025.
17
Convertible Senior Notes
In April 2020, the Company issued $863 million aggregate principal amount of convertible senior notes due in May 2025 with an interest rate of 0.75 % (the "May 2025 Notes"). The May 2025 Notes are convertible, subject to certain conditions, into the Company's common stock at a current conversion price of $1,881.47 per share. The May 2025 Notes are convertible, at the option of the holder, prior to November 1, 2024, upon the occurrence of specific events, including but not limited to a change in control, or if the closing sales price of the Company's common stock for at least 20 trading days in the period of 30 consecutive trading days ending on the last trading day of the immediately preceding calendar quarter is more than 130 % of the conversion price in effect for the notes on the last trading day of the immediately preceding quarter. In the event that all or substantially all of the Company's common stock is acquired on or prior to the maturity of the May 2025 Notes in a transaction in which the consideration paid to holders of the Company's common stock consists of all or substantially all cash, the Company would be required to make additional payments in the form of additional shares of common stock to the holders of the May 2025 Notes in an aggregate value ranging from $0 to $235 million depending upon the date of the transaction and the then current stock price of the Company. Starting on November 1, 2024, holders will have the right to convert all or any portion of the May 2025 Notes, regardless of the Company's stock price. The May 2025 Notes may not be redeemed by the Company prior to maturity. The holders may require the Company to repurchase the May 2025 Notes for cash in certain circumstances. Interest on the May 2025 Notes is payable on May 1 and November 1 of each year. If the note holders exercise their option to convert, the Company delivers cash to repay the principal amount of the notes and delivers shares of common stock or cash, at its option, to satisfy the conversion value in excess of the principal amount. At March 31, 2024 and December 31, 2023, the estimated fair value of the May 2025 Notes was $1.7 billion and $1.6 billion, respectively, and was considered a "Level 2" fair value measurement (see Note 6). Based on the closing sales prices of the Company's common stock for the prescribed measurement periods, the May 2025 Notes were convertible at the option of the holder starting the second calendar quarter of 2023 and continue to be convertible during the second calendar quarter of 2024.
Other Senior Notes
The following table summarizes the information related to other senior notes issued in March 2024:
| Other Senior Notes | Effective Interest Rate (1) | Timing of Interest Payments | ||||||||||||
| Annually in March | ||||||||||||||
| Annually in March | ||||||||||||||
| Annually in March | ||||||||||||||
| Annually in March | ||||||||||||||
(1) Represents the coupon interest rate adjusted for deferred debt issuance costs, premiums or discounts existing at the origination of the debt.
The proceeds from the issuance of these senior notes are available for general corporate purposes, including to repurchase shares of our common stock and to redeem or repay outstanding indebtedness.
In March 2023, the Company repaid $500 million on the maturity of the Senior Notes due March 2023 and paid the applicable accrued and unpaid interest relating to these notes.
Interest expense related to other senior notes consists primarily of coupon interest expense of $118 million and $92 million for the three months ended March 31, 2024 and 2023, respectively.
The Company designates certain portions of the aggregate principal value of the Euro-denominated debt as a hedge of the foreign currency exposure of the net investment in certain Euro functional currency subsidiaries. For the three months ended March 31, 2024 and 2023, the carrying value of the portion of Euro-denominated debt, designated as a net investment hedge, ranged from $2.3 billion to $3.1 billion and from $5.9 billion to $6.4 billion, respectively.
18
10. TREASURY STOCK AND DIVIDENDS
At December 31, 2023, the Company had a total remaining authorization of $13.7 billion related to a program authorized by the Company's Board of Directors ("the Board") in 2023 to repurchase up to $20 billion of the Company's common stock. At March 31, 2024, the Company had a total remaining authorization of $12.2 billion to repurchase its common stock. The Company expects to complete the share repurchases under the remaining authorization by the end of 2026, assuming no major downturn in the travel market. Additionally, the Board has given the Company the general authorization to repurchase shares of its common stock withheld to satisfy employee withholding tax obligations related to stock-based compensation.
The following table summarizes the Company's stock repurchase activities during the three months ended March 31, 2024 and 2023 (in millions, except for shares, which are reflected in thousands):
| Three Months Ended March 31, | ||||||||||||||||||||||||||
| 2024 | 2023 | |||||||||||||||||||||||||
| Shares | Amount | Shares | Amount | |||||||||||||||||||||||
| Authorized stock repurchase programs | $ | $ | ||||||||||||||||||||||||
| General authorization for shares withheld on stock award vesting | ||||||||||||||||||||||||||
| Total | $ | $ | ||||||||||||||||||||||||
Stock repurchases of $47 million in March 2024 were settled in April 2024.
For the three months ended March 31, 2024 and 2023, the Company remitted employee withholding taxes of $286 million and $158 million, respectively, to the tax authorities, which may differ from the aggregate cost of the shares withheld for taxes for each period due to the timing in remitting the taxes. The cash remitted to the tax authorities is included in financing activities in the Unaudited Consolidated Statements of Cash Flows.
The Company recorded an estimated excise tax liability for share repurchases of $108 million and $96 million as of March 31, 2024 and December 31, 2023, respectively. The excise tax liability is included in "Accrued expenses and other current liabilities" in the Consolidated Balance Sheets.
In March 2024, the Company paid cash dividends of $299 million. The quarterly cash dividend of $8.75 per share of common stock was declared by the Board in February 2024 and paid to stockholders of record as of the close of business on March 8, 2024. In May 2024, the Board declared a cash dividend of $8.75 per share of common stock, payable on June 28, 2024 to stockholders of record as of the close of business on June 7, 2024.
11. INCOME TAXES
Income tax expense consists of U.S. and international income taxes, determined using an estimate of the Company's annual effective tax rate, which is based upon the applicable tax rates and tax laws of the countries in which the income is generated. A deferred tax liability is recognized for all taxable temporary differences, and a deferred tax asset is recognized for all deductible temporary differences and operating loss and tax credit carryforwards. A valuation allowance is provided when it is more likely than not that some portion or all of a deferred tax asset will not be realized. The Company considers many factors when assessing the likelihood of future realization of the deferred tax assets, including its recent cumulative earnings experience by taxing jurisdiction, expectations of future income, tax planning strategies, the carryforward periods available for tax reporting purposes, and other relevant factors.
The Company's effective tax rates for the three months ended March 31, 2024 and 2023 were 17.1 % and 12.4 %, respectively. The Company's 2024 effective tax rate differs from the U.S. federal statutory tax rate of 21 21
The Company's effective tax rate for the three months ended March 31, 2024 was higher than the effective tax rate for the three months ended March 31, 2023, primarily due to certain lower discrete tax benefits, higher U.S. federal and state tax
associated with the Company’s international earnings, and a decrease in the benefit of the Netherlands Innovation Box Tax, partially offset by certain lower non-deductible expenses.
19
During the three months ended March 31, 2024 and 2023, a majority of the Company's income was reported in the Netherlands, where Booking.com is based. According to Dutch corporate income tax law, income generated from qualifying innovative activities is taxed at a rate of 9 25.8
The aggregate amount of unrecognized tax benefits for all matters at March 31, 2024 and December 31, 2023 was $68 million and $67 million, respectively. As of March 31, 2024, net unrecognized tax benefits of $48 million, if recognized, would impact the effective tax rate. As of March 31, 2024 and December 31, 2023, total gross interest and penalties accrued was $7
12. CHANGES IN ACCUMULATED OTHER COMPREHENSIVE LOSS BY COMPONENT
The table below present the changes in the balances of accumulated other comprehensive loss ("AOCI") by component for the three months ended March 31, 2024 and 2023 (in millions):
| Foreign currency translation adjustments | Net unrealized (losses) gains on available-for-sale securities | Total AOCI, net of tax | ||||||||||||||||||||||||||||||||||||||||||||||||||||||
| Foreign currency translation | Net investment hedges (1) | Total, net of tax | Before tax | Tax | Total, net of tax | |||||||||||||||||||||||||||||||||||||||||||||||||||
| Before tax | Tax (2) | Before tax | Tax | |||||||||||||||||||||||||||||||||||||||||||||||||||||
| Three Months Ended March 31, 2024 | ||||||||||||||||||||||||||||||||||||||||||||||||||||||||
| Balance, December 31, 2023 | $ | ( | $ | $ | $ | ( | $ | ( | $ | ( | $ | $ | ( | $ | ( | |||||||||||||||||||||||||||||||||||||||||
Other comprehensive (loss) income ("OCI") for the period | ( | ( | ( | ( | ( | ( | ||||||||||||||||||||||||||||||||||||||||||||||||||
| Balance, March 31, 2024 | $ | ( | $ | $ | $ | ( | $ | ( | $ | ( | $ | $ | ( | $ | ( | |||||||||||||||||||||||||||||||||||||||||
| Three Months Ended March 31, 2023 | ||||||||||||||||||||||||||||||||||||||||||||||||||||||||
| Balance, December 31, 2022 | $ | ( | $ | $ | $ | ( | $ | ( | $ | ( | $ | $ | ( | $ | ( | |||||||||||||||||||||||||||||||||||||||||
| OCI for the period | ( | ( | ( | ( | ||||||||||||||||||||||||||||||||||||||||||||||||||||
| Balance, March 31, 2023 | $ | ( | $ | $ | $ | ( | $ | ( | $ | ( | $ | $ | ( | $ | ( | |||||||||||||||||||||||||||||||||||||||||
(1) Net investment hedges balance at March 31, 2024 and earlier dates presented above, includes accumulated net losses from fair value adjustments of $35 53
(2) The tax benefits relate to foreign currency translation adjustments to the Company's one-time deemed repatriation tax liability recorded at December 31, 2017 and foreign earnings for periods after December 31, 2017 that are subject to U.S. federal and state income tax, resulting from the enactment of the U.S. Tax Cuts and Jobs Act.
13. COMMITMENTS AND CONTINGENCIES
Competition and Consumer Protection Reviews
Online travel platforms have been the subject of investigations or inquiries by national competition authorities ("NCAs") or other governmental authorities regarding competition law matters, consumer protection issues, or other areas of concern. The Company is and has been involved in many such investigations. For example, the Company is involved in investigations related to whether Booking.com's contractual parity arrangements with accommodation providers are anti-competitive because they require partners to provide Booking.com with rates, conditions, and availability at least as favorable as those offered to other online travel companies ("OTCs") or by the partner itself. To resolve certain of the parity-related investigations, the Company has from time to time made commitments regarding future business practices or activities, such as agreeing to narrow the scope of its parity clauses. These investigations have resulted in fines and the Company could incur additional fines and/or be restricted in certain of its business practices in the future.
20
In October 2022, the Comisión Nacional de los Mercados y la Competencia in Spain (the "CNMC") opened an investigation into whether certain practices by Booking.com may produce adverse effects for hotels and other OTCs. In January 2024, the CNMC notified Booking.com of its draft decision to impose a fine of 486 million Euros and to restrict certain business practices such as those relating to parity provisions and criteria that Booking.com can use to determine how to rank hotels in its display to customers. The amount of the draft fine is based on Booking.com’s historical revenues and it is possible the final amount may be increased when the decision is finalized, which is expected by July 2024. Booking.com does not agree with the rationale stated in the draft decision and certain of the restrictions sought to be imposed, and is continuing to engage with the CNMC prior to the decision being finalized. If the draft decision were to become final, Booking.com plans to challenge aspects of the fine, decision, and/or restrictions. Although the Company disagrees with the rationale stated in the draft decision, the Company accrued a loss of 486 million Euros ($530 million) during the year ended December 31, 2023 with the related liability included in "Accrued expenses and other current liabilities" in the Consolidated Balance Sheets as of March 31, 2024 and December 31, 2023. In addition, in September 2017, the Swiss Price Surveillance Office opened an investigation into the level of commissions of Booking.com in Switzerland and the investigation is ongoing. If there is an adverse outcome and Booking.com is unsuccessful in any appeal, Booking.com may be required to make other commitments, such as reducing its commissions in Switzerland. In July 2023, the Polish Office of Competition and Consumer Protection opened an investigation into Booking.com's identification of private and professional hosts and its messaging in relation to obligations owed to consumers. In March 2024, the Italian Competition Authority opened an investigation into whether certain practices by Booking.com may produce adverse effects for hotels and other online travel agencies. If any of the investigations were to find that Booking.com practices violated the respective laws, Booking.com may face significant fines, restrictions on its business practices, and/or be required to make other commitments.
The Company is and has been involved in investigations or inquiries by NCAs or other governmental authorities involving consumer protection matters, including in the United Kingdom and the European Union. The Company has previously made certain voluntary commitments to competition authorities to resolve investigations or inquiries that have included showing prices inclusive of all mandatory taxes and charges, providing information about the effect of money earned on search result rankings on or before the search results page and making certain adjustments to how discounts and statements concerning popularity or availability are shown to consumers. In the future, it is possible new jurisdictions could engage the Company in discussions to implement changes to its business in those countries. The Company is unable to predict what, if any, effect any future similar commitments will have on its business, industry practices or online commerce more generally. To the extent that any other investigations or inquiries result in additional commitments, fines, damages or other remedies, the Company's business, financial condition, and results of operations could be harmed.
The Company is unable to predict how any current or future investigations or litigation may be resolved or the long-term impact of any such resolution on its business. For example, competition and consumer-law-related investigations, legislation, or issues could result in private litigation and the Company is currently involved in such litigation. More immediate results could include, among other things, the imposition of fines, payment of damages, commitments to change certain business practices, or reputational damage, any of which could harm the Company's business, results of operations, brands, or competitive position.
Tax Matters
Between December 2018 and August 2021, the Italian tax authorities issued assessments on Booking.com's Italian subsidiary totaling approximately 251 million Euros ($271 million) for the tax years 2013 through 2018, asserting that its transfer pricing policies were inadequate. The Company believes Booking.com has been and continues to be in compliance with Italian tax law. In September 2020, the Italian tax authorities approved the opening of a mutual agreement procedure ("MAP") between Italy and the Netherlands for the 2013 tax year and the Italian tax authorities subsequently approved the inclusion of the tax years 2014 through 2018 in the MAP. Based on the Company's expectation that the Italian assessments for 2013 through 2018, and any transfer pricing assessments received for subsequent open years, will be settled through the MAP process, and after considering potential resolution amounts, 33 36 15 million Euros ($17 million). As of March 31, 2024, the Company made prepayments of 74 million Euros ($80 million) to the Italian tax authorities to forestall collection enforcement pending the appeal phase of the case. The payments do not constitute an admission that the Company owes the taxes and will be refunded (with interest) to the Company to the extent that the Company prevails. The payments are included in "Other assets, net" in the Consolidated Balance Sheets at March 31, 2024 and December 31, 2023.
21
The Company is also involved in other tax-related audits, investigations, and litigation relating to income taxes, value-added taxes, travel transaction taxes (e.g., hotel occupancy taxes), withholding taxes, and other taxes. Any taxes or assessments in excess of the Company's tax provisions, including the resolution of any tax proceedings or litigation, could have a material adverse impact on the Company's results of operations, cash flows, and financial condition. In some cases, assessments may be
significantly in excess of the Company’s tax provisions, particularly in instances where the Company does not agree with the
tax authority’s assessment of how the tax laws may apply to the Company’s business.
Other Matters
Beginning in 2014, Booking.com B.V. received several letters from the Netherlands Pension Fund for the Travel Industry (Reiswerk) ("BPF") claiming that it was required to participate in the mandatory pension scheme of the BPF with retroactive effect to 1999, which has a higher contribution rate than the pension scheme in which it is currently participating. BPF instituted legal proceedings and in 2016 the District Court of Amsterdam rejected all of BPF's claims. BPF appealed the decision to the Court of Appeal, and, in May 2019, the Court of Appeal also rejected all of BPF's claims, in each case by ruling that Booking did not meet the definition of a travel intermediary for purposes of the mandatory pension scheme. BPF then appealed to the Netherlands Supreme Court. In April 2021, the Supreme Court overturned the previous decision of the Court of Appeal and held that Booking.com B.V. met the definition of a travel intermediary for the purposes of the mandatory pension scheme. The Supreme Court ruled only on the qualification of Booking.com B.V. as a travel intermediary for the purposes of the mandatory pension scheme and did not rule on the various other defenses brought forward by the Company against BPF's claims. The Supreme Court referred the matter to another Court of Appeal to assess the other defenses brought forward by the Company. In January 2024, that Court of Appeal ruled that Booking.com B.V. is required to participate in the mandatory pension scheme of the BPF with retroactive effect to 1999. The Company has filed an appeal of the decision to the Netherlands Supreme Court. Although the Company disagrees with the decision, it accrued a loss of 253 million Euros ($276 million), included in "Personnel" expenses in the Consolidated Statement of Operations for the year ended December 31, 2023. During the three months ended March 31, 2024, the Company recorded additional estimated expenses for the period of 19 million Euros ($21 million), included in "Personnel" expenses in the Unaudited Consolidated Statement of Operations. The related liability is included in "Accrued expenses and other current liabilities" in the Consolidated Balance Sheets as of March 31, 2024 and December 31, 2023. On a go-forward basis, Booking.com B.V. expects to begin paying pension premiums to the BPF scheme or to increase contributions to employees under its existing pension scheme.
From time to time, the Company notifies the competent data protection authority, such as the Dutch data protection authority in accordance with its obligations under the General Data Protection Regulation, of certain incidental and accidental personal data security incidents. Should, for example, the Dutch data protection authority decide these incidents were the result of inadequate technical and organizational security measures or practices, it could decide to impose a fine.
The Company has been, is currently, and expects to continue to be, subject to legal proceedings and claims in the ordinary course of business, including claims of alleged infringement of third-party intellectual property rights. Such claims, even if not meritorious, could result in the expenditure of significant financial and managerial resources, divert management's attention from the Company's business objectives and adversely affect the Company's business, reputation, results of operations, financial condition, and cash flows.
The Company accrues for certain legal contingencies where it is probable that a loss has been incurred and the amount can be reasonably estimated. Such accrued amounts are not material to the Company's balance sheets and provisions recorded have not been material to the Company's results of operations or cash flows.
Other Contractual Obligations and Contingencies
The Company had $953 million and $533 million of standby letters of credit and bank guarantees issued on behalf of the Company as of March 31, 2024 and December 31, 2023, respectively, including those issued under the revolving credit facility. These are obtained primarily for regulatory purposes. See Note 9 for information related to letters of credit issued under the revolving credit facility.
Booking.com offers partner liability insurance that provides protection to certain accommodation partners ("home partners") in instances where a reservation has been made via Booking.com. The partner liability insurance may provide those home partners (both owners and property managers) coverage up to $1 million equivalent per occurrence, subject to limitations and exclusions, against third-party lawsuits, claims for bodily injury, or third-party personal property damage that occurred during a stay booked through Booking.com. Booking.com retains certain financial risks related to this insurance offering, which is underwritten by third-party insurance companies.
22
14. OTHER INCOME (EXPENSE), NET
The components of other income (expense), net for the three months ended March 31, 2024 and 2023 were as follows (in millions):
| Three Months Ended March 31, | ||||||||||||||
| 2024 | 2023 | |||||||||||||
Foreign currency transaction gains (losses) (1) | $ | $ | ( | |||||||||||
Net losses on equity securities (2) | ( | ( | ||||||||||||
Other | ||||||||||||||
| Other income (expense), net | $ | $ | ( | |||||||||||
(1) Foreign currency transaction gains (losses) include gains of $167 million and losses of $26 million for the three months ended March 31, 2024 and 2023, respectively, related to Euro-denominated debt and accrued interest that were not designated as net investment hedges (see Note 9).
15. OTHER
Unaudited Consolidated Statements of Cash Flows: Additional Information
As of March 31, 2024 and December 31, 2023, cash and cash equivalents reported in the Consolidated Balance Sheets differs from the amounts of total cash and cash equivalents and restricted cash and cash equivalents as shown in the Unaudited Consolidated Statements of Cash Flows due to restricted cash and cash equivalents, primarily related to the Company's travel-related insurance business, which are included in "Other current assets" in the Consolidated Balance Sheets.
Noncash investing activity related to additions to property and equipment, including stock-based compensation and accrued liabilities, was $16 million and $18 million for the three months ended March 31, 2024 and 2023, respectively. See Note 10 for additional information on noncash financing activity related to the excise tax on share repurchases.
23
Item 2. Management's Discussion and Analysis of Financial Condition and Results of Operations
The following discussion should be read in conjunction with our Annual Report on Form 10-K for the year ended December 31, 2023, including Part I, Item 1A "Risk Factors," as well as our Unaudited Consolidated Financial Statements and accompanying notes and the Section entitled "Special Note Regarding Forward-Looking Statements" in this Quarterly Report on Form 10-Q. The information on our websites is not a part of this Quarterly Report and is not incorporated herein by reference.
We evaluate certain operating and financial measures on both an as-reported and constant-currency basis. We calculate constant currency based on the predominant transactional currency in each country, converting our current-year period results in currencies other than U.S. Dollars using the corresponding prior-year period monthly average exchange rates. Foreign exchange rate fluctuations did not have a material impact on our year-over-year growth in gross bookings, revenues, and operating expenses for the three months ended March 31, 2024. Since our expenses are generally denominated in foreign currencies on a basis similar to our revenues, our operating margins have not been significantly impacted by currency fluctuations.
Overview
Our mission is to make it easier for everyone to experience the world. We aim to provide consumers with a best-in-class experience offering the travel choices they want, with tailored language, payment, and other options, seamlessly connecting them with our travel service provider partners. We offer these services through five primary consumer-facing brands: Booking.com, Priceline, Agoda, KAYAK, and OpenTable.
We derive substantially all of our revenues from enabling consumers to make travel service reservations. We also earn revenues from advertising services, restaurant reservations and restaurant management services, and other services, such as travel-related insurance services. See Note 2 to our Unaudited Consolidated Financial Statements for more information.
Trends
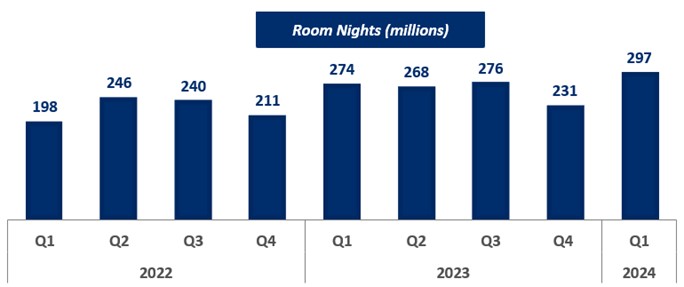
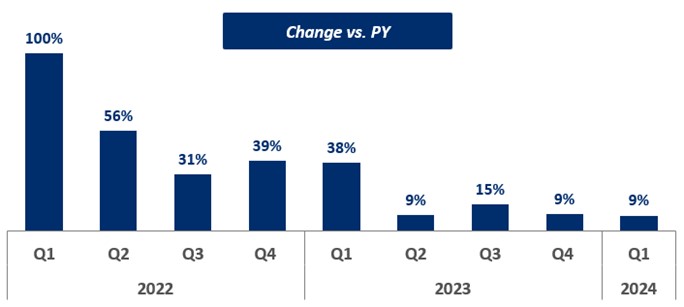
In 2023, global room nights increased 17% year-over-year driven primarily by the continued recovery from the COVID-19 pandemic in Asia and strong travel demand in Europe. In 2023, we saw the booking window expand compared to 2022, which benefited year-over-year room night growth in 2023.
In the first quarter of 2024, global room nights increased 9% year-over-year driven primarily by healthy travel demand in Europe and Asia. In the first quarter of 2024, the booking window expanded compared to the first quarter of 2023, which benefited year-over-year room night growth in the first quarter of 2024.
24
Quarterly Room Nights and Change versus the prior year
The cancellation rate in the first quarter of 2024 was in line with the prior year. We have observed generally stable cancellation rates in recent years, though we have seen periods of elevated cancellation rates from time to time. Because we recognize revenue from bookings when the traveler checks in, our reported revenue is not at risk of being reversed due to cancellations. Increases in cancellation rates can negatively impact our marketing efficiency as a result of incurring performance marketing expense at the time a booking is made even though that booking could be canceled in the future if it was booked under a flexible cancellation policy.
Our global average daily rates ("ADRs") increased approximately 1% on a constant currency basis in the first quarter of 2024 as compared to the first quarter of 2023, driven primarily by higher ADRs in Europe. The increase in our global ADRs in the first quarter of 2024 as compared to the first quarter of 2023, was negatively impacted by approximately one percentage point from changes in geographical mix in our business driven primarily by a higher mix of room nights from Asia, which is a lower ADR region. The year-over-year increase in our global ADRs has resulted in our accommodation gross bookings growing faster than our room nights in the first quarter of 2024. It is difficult to predict what the trend in industry ADRs will be in the future.
25
We focus on relentless innovation to grow our business by providing a best-in-class user experience with intuitive, easy-to-use online platforms that aim to exceed the expectations of online consumers. We have a long-term strategy to create an ideal traveler experience, offering our customers relevant options and connections at the times and in the language they want them, making trips booked with us seamless, easy, and valuable. We refer to this as the "Connected Trip." The goal of our Connected Trip vision is to offer a differentiated and personalized online travel planning, booking, payment, and in-trip experience for each trip, enhanced by a robust loyalty program that provides value to travelers and partners across all trips. We believe these efforts will help improve traveler loyalty, frequency, and mix of direct bookings over time. We believe these improvements will benefit revenue growth and marketing efficiency in the future, however, to the extent our non-accommodation services have lower margins and increase as a percentage of our total business, our operating margins may be negatively affected.
We believe that our mobile app is an important platform for experiencing the Connected Trip since the app travels with the traveler. The mix of our room nights booked on a mobile app in the first quarter of 2024 was approximately 51%, up versus approximately 46% in the first quarter of 2023. The significant majority of room nights booked on our mobile apps are direct, and we continue to see favorable repeat direct booking behavior from consumers in our mobile apps, which allow us more opportunities to engage directly with consumers. The revenue earned on a transaction on a mobile app may be less than a typical desktop transaction as we see different consumer purchasing patterns across devices. For example, accommodation reservations made on a mobile app typically are for shorter lengths of stay and have lower accommodation ADRs.
As part of our strategy to provide more payment options to consumers and travel service providers, increase the number and variety of our accommodations, and enable our long-term Connected Trip strategy, Booking.com increasingly processes transactions on a merchant basis, where it facilitates payments from travelers for the services provided. This allows Booking.com to process transactions for travel service providers and to increase its ability to offer secure and flexible transaction terms to consumers, such as the form and timing of payment. We believe that expanding these types of service offerings will benefit consumers and travel service providers, as well as our gross bookings, room night, and earnings growth rates. However, this results in additional expenses for personnel, payment processing, chargebacks (including those related to fraud), and other expenses related to these transactions, which are recorded in "Personnel" expenses and "Sales and other expenses" in our Consolidated Statements of Operations, as well as associated incremental revenues (e.g., payment card rebates), which are recorded in "Merchant revenues." To the extent more of our business is generated on a merchant basis, we incur a greater level of these merchant-related expenses, which negatively impacts our operating margins despite increases in associated incremental revenues. The mix of our total gross bookings generated on a merchant basis was 59% in the first quarter of 2024, an increase from 51% in the first quarter of 2023.
We have established widely-used and recognized brands through marketing and promotional campaigns. Our total marketing expenses, which are comprised of performance and brand marketing expenses that are substantially variable in nature, were $1.6 billion in the first quarter of 2024, up 6% versus the first quarter of 2023 as a result of the healthy demand environment and our efforts to invest in marketing, partially offset by a year-over-year improvement in performance marketing returns on investment ("ROIs") and a higher share of room nights booked by consumers coming directly to our platforms. Our performance marketing expense, which represents a substantial majority of our marketing expenses, is primarily related to the use of online search engines (primarily Google), affiliate marketing, and meta-search services to generate traffic to our platforms. Our brand marketing expense is primarily related to costs associated with producing and airing digital branding and television advertising.
Marketing efficiency, expressed as marketing expense as a percentage of gross bookings, and performance marketing ROIs are impacted by a number of factors that are subject to variability and are in some cases outside of our control, including ADRs, costs per click, cancellation rates, foreign currency exchange rates, our ability to convert paid traffic to booking customers, and the timing and effectiveness of our brand marketing campaigns. In recent years, we observed periods of stable or increasing ROIs. Although it is difficult to predict how performance marketing ROIs will change in the future, ROIs could be negatively impacted by increased levels of competition and other factors. When evaluating our performance marketing spend, we typically consider several factors for each channel, such as the customer experience on the advertising platform, the incremental traffic we receive, and anticipated repeat rates. Marketing efficiency can also be impacted by the extent to which consumers come directly to our platforms for bookings. Marketing expenses as a percentage of total gross bookings in the first quarter of 2024 were lower than in the first quarter of 2023 due to higher performance marketing ROIs and an increase in the share of room nights booked by consumers coming directly to our platforms. Performance marketing ROIs were higher in the first quarter of 2024 versus the first quarter of 2023 due in part to our ongoing efforts to improve the efficiency of our marketing spend. See Part I, Item 1A, Risk Factors - "We face risks relating to our marketing efforts" and "We are dependent on travel service providers, restaurants, search platforms, and other third parties" in our Annual Report on Form 10-K for the year ended December 31, 2023.
26
Booking.com had approximately 3.5 million properties on its website at March 31, 2024, consisting of over 450,000 hotels, motels, and resorts and over 3.0 million alternative accommodation properties (including homes, apartments, and other unique places to stay), representing an increase from over 2.8 million properties at March 31, 2023. The year-over-year increase in total properties was driven by an increase in alternative accommodation properties.
The mix of Booking.com's room nights booked for alternative accommodation properties in the first quarter of 2024 was approximately 36%, up versus approximately 33% in the first quarter of 2023. We have observed a longer-term trend of an increasing mix of room nights booked for alternative accommodation properties as consumer demand for these types of properties has grown, and as we have increased the number and variety of them on Booking.com. We may experience lower profit margins due to additional costs, such as increased customer service or certain partner related costs, related to offering alternative accommodations on our platforms. As our alternative accommodation business has grown, these different characteristics have negatively impacted our profit margins and this trend may continue.
Although we believe that providing an extensive collection of properties, excellent customer service, and an intuitive, easy-to-use consumer experience are important factors influencing a consumer's decision to make a reservation, for many consumers, the price of the travel service is the primary factor determining whether a consumer will book. Discounting and couponing (i.e., merchandising) occurs across all of the major regions in which we operate, particularly in Asia. In some cases, our competitors are willing to make little or no profit on a transaction or offer travel services at a loss in order to gain market share. As a result, it is increasingly important to offer travel services, such as accommodation reservations, at a competitive price, whether through discounts, coupons, closed-user group rates or loyalty programs, increased flexibility in cancellation policies, or otherwise. These initiatives have resulted and, in the future, may result in lower ADRs and lower revenue as a percentage of gross bookings.
Many taxing authorities are increasingly focused on ways to increase tax revenues and have targeted large multinational technology companies in these efforts. As a result, many countries and some U.S. states have implemented or are considering the adoption of a digital services tax or similar tax that imposes a tax on revenue earned from digital advertisements or the use of online platforms, even when there is no physical presence in the jurisdiction. Currently, rates for these taxes range from 1.5% to 10% of revenue deemed generated in the jurisdiction. The digital services taxes currently in effect, which we record in "Sales and other expenses" in the Unaudited Consolidated Statements of Operations, have negatively impacted our results of operations. For more information, see Part I, Item 1A, Risk Factors - "We may have exposure to additional tax liabilities" in our Annual Report on Form 10-K for the year ended December 31, 2023.
Increased regulatory focus on online businesses, including online travel businesses like ours, could result in increased compliance costs or otherwise adversely affect our business. For example, the Digital Markets Act ("DMA") and Digital Services Act ("DSA") give regulators in the EU more instruments to investigate and regulate digital businesses and impose new rules and requirements on platforms designated as "gatekeepers" under the DMA and online platforms more generally, with separate rules for "Very Large Online Platforms" (VLOP) under the DSA. In early 2023, Booking.com received a VLOP designation notice from the European Commission. The Company met the quantitative notification criteria set forth in the DMA and notified the European Commission of that fact. Certain of the DMA’s requirements will become enforceable later in 2024. As a result of the DMA, compliance costs may increase and changes to our products or business practices may be required. For information regarding risks related to the DMA and DSA, please see Part I, Item 1A, Risk Factors - "Our business is subject to various competition/anti-trust, consumer protection, and online commerce laws and regulations around the world, and as the size of our business grows, scrutiny of our business by legislators and regulators in these areas may intensify" in our Annual Report on Form 10-K for the year ended December 31, 2023. For more information on the impacts of regulations on our business, see Note 13 to our Unaudited Consolidated Financial Statements.
27
Our businesses outside of the U.S. (see Note 2 to our Unaudited Consolidated Financial Statements for information related to revenue by geographic area) represent a substantial majority of our financial results, but because we report our results in U.S. Dollars, we face exposure to movements in foreign currency exchange rates as the financial results and the financial condition of our businesses outside of the U.S. are translated from local currency (principally Euros and British Pounds Sterling) into U.S. Dollars. As a result of the movements in foreign currency exchange rates, both the absolute amounts of and percentage changes in our foreign-currency-denominated net assets, gross bookings, revenues, operating expenses, and net income as expressed in U.S. Dollars are affected. Movements in foreign currency exchange rates did not have a material impact on our total gross bookings or revenue growth in the first quarter of 2024 as compared to the first quarter of 2023. Since our expenses are generally denominated in foreign currencies on a basis similar to our revenues, our operating margins have not been significantly impacted by currency fluctuations. We generally enter into derivative instruments to minimize the impact of foreign currency exchange rate fluctuations. We enter into foreign currency forward contracts to hedge our exposure to the impact of movements in foreign currency exchange rates on our transactional balances denominated in currencies other than the functional currency. See Note 6 to our Unaudited Consolidated Financial Statements for additional information related to our derivative contracts. In addition, we designate certain portions of the aggregate principal value of our Euro-denominated debt as a hedge of the foreign currency exposure of the net investment in certain Euro functional currency subsidiaries. Foreign currency transaction gains or losses on the Euro-denominated debt that is not designated as a hedging instrument for accounting purposes are recognized in "Other income (expense), net" in the Unaudited Consolidated Statements of Operations (see Notes 9 and 14 to our Unaudited Consolidated Financial Statements). Such foreign currency transaction gains or losses are dependent on the amount of net assets of the Euro functional currency subsidiaries, the amount of the Euro-denominated debt that is designated as a hedge, and fluctuations in foreign currency exchange rates. For more information, see Part I, Item 1A, Risk Factors - "We are exposed to fluctuations in foreign currency exchange rates" in our Annual Report on Form 10-K for the year ended December 31, 2023.
Other Factors
Over the long term, we intend to continue to invest in marketing and promotion, technology, and personnel within parameters consistent with attempts to improve long-term operating results, even if those expenditures create pressure on operating margins. In recent years, our investments in initiatives to drive future growth added pressure on operating margins. We also intend to broaden the scope of our business, including exploring strategic alternatives such as acquisitions.
The competition for technology talent in our industry is intense. As a result of the competitive labor market and inflationary pressure on compensation, our personnel expenses to attract and retain key talent have increased, which has adversely affected our results of operations and may adversely affect our results of operations in the future. See Part I, Item 1A, Risk Factors - "We rely on the performance of highly skilled employees; and, if we are unable to retain or motivate key employees or hire, retain, and motivate well-qualified employees, our business would be harmed" in our Annual Report on Form 10-K for the year ended December 31, 2023.
Outlook
For the second quarter of 2024, we expect:
•the year-over-year growth in room nights will be between 4% and 6%;
•the year-over-year growth in gross bookings will be between 3% and 5%;
•the year-over-year growth in revenues will be between 4% and 6%; and
•operating income will be slightly lower than in the second quarter of 2023 due in part to the negative impact from the shift in Easter timing versus last year.
28
Critical Accounting Estimates
Management's Discussion and Analysis of Financial Condition and Results of Operations is based upon our Unaudited Consolidated Financial Statements, which have been prepared in accordance with accounting principles generally accepted in the United States ("U.S. GAAP"). Certain of our accounting estimates are particularly important to our financial position and results of operations and require us to make difficult and subjective judgments, often as a result of the need to make estimates of matters that are inherently uncertain. We use our judgment to determine the appropriate assumptions to be used in the determination of certain estimates and we evaluate our estimates on an ongoing basis. Estimates are based on historical experience, terms of existing contracts, our observance of trends in the travel industry, and on various other assumptions that we believe to be reasonable under the circumstances. Our actual results may differ from these estimates under different assumptions or conditions. Matters that involve significant estimates and judgments of management include the valuation of investments in private entities, the valuation of goodwill and other long-lived assets, income taxes, and contingencies. For a discussion of our critical accounting estimates, see the "Critical Accounting Estimates" section of the Management's Discussion and Analysis of Financial Condition and Results of Operations in our Annual Report on Form 10-K for the year ended December 31, 2023.
Recent Accounting Pronouncements
See Note 1 to our Unaudited Consolidated Financial Statements, which is incorporated by reference into this Item 2, for details regarding recent accounting pronouncements.
29
Results of Operations
Three Months Ended March 31, 2024 compared to the Three Months Ended March 31, 2023
Operating and Statistical Metrics
Our financial results are driven by certain operating metrics that encompass the booking and other business activity generated by our travel and travel-related services. See "Results of Operations" in Part II, Item 7, Management's Discussion and Analysis of Financial Condition and Results of Operations in our Annual Report on Form 10-K for the year ended December 31, 2023 for additional information on our Operating and Statistical Metrics, including room nights, rental car days, airline tickets, and merchant and agency gross bookings.
Room nights, rental car days, and airline tickets reserved through our services for the three months ended March 31, 2024 and 2023 were as follows:
| Three Months Ended March 31, | Increase (Decrease) | |||||||||||||||||||
| (in millions) | 2024 | 2023 | ||||||||||||||||||
| Room nights | 297 | 274 | 8.5 | % | ||||||||||||||||
| Rental car days | 21 | 19 | 10.7 | % | ||||||||||||||||
| Airline tickets | 11 | 8 | 33.1 | % | ||||||||||||||||
Room nights reserved through our services increased for the three months ended March 31, 2024 compared to the three months ended March 31, 2023, driven primarily by healthy travel demand in Europe and Asia. Rental car days reserved through our services increased for the three months ended March 31, 2024 compared to the three months ended March 31, 2023, driven primarily by year-over-year growth in rental car demand, which benefited from lower average daily car rental prices. Airline tickets reserved through our services increased for the three months ended March 31, 2024 compared to the three months ended March 31, 2023, driven primarily by the expansion of Booking.com's flight offering.
Gross bookings resulting from reservations of room nights, rental car days, and airline tickets made through our merchant and agency categories for the three months ended March 31, 2024 and 2023 were as follows (numbers may not total due to rounding):
| Three Months Ended March 31, | Increase (Decrease) | |||||||||||||||||||
| (in millions) | 2024 | 2023 | ||||||||||||||||||
| Merchant gross bookings | $ | 25,761 | $ | 19,927 | 29.3 | % | ||||||||||||||
| Agency gross bookings | 17,774 | 19,500 | (8.9) | % | ||||||||||||||||
| Total gross bookings | $ | 43,535 | $ | 39,427 | 10.4 | % | ||||||||||||||
Merchant gross bookings increased and agency gross bookings decreased for the three months ended March 31, 2024 compared to the three months ended March 31, 2023, due to the ongoing shift from agency bookings to merchant bookings at Booking.com.
The year-over-year increase in total gross bookings during the three months ended March 31, 2024 was due primarily to the increase in room nights, the increase in accommodation ADRs of approximately 1%, and the positive impact from year-over-year growth in gross bookings from reservations for airline tickets.
Gross bookings resulting from reservations of airline tickets increased 27% year-over-year during the three months ended March 31, 2024 due to airline ticket growth, partially offset by lower airline ticket prices. Gross bookings resulting from reservations of rental car days decreased 2% year-over-year during the three months ended March 31, 2024 due primarily to lower average daily car rental prices, partially offset by rental car days growth.
30
Revenues
Online travel reservation services
Substantially all of our revenues are generated by providing online travel reservation services, which facilitate online travel purchases from travel service providers by travelers. See "Results of Operations" in Part II, Item 7, Management's Discussion and Analysis of Financial Condition and Results of Operations in our Annual Report on Form 10-K for the year ended December 31, 2023 for additional information on our revenues, including merchant and agency revenues.
Advertising and other revenues
See "Results of Operations" in Part II, Item 7, Management's Discussion and Analysis of Financial Condition and Results of Operations in our Annual Report on Form 10-K for the year ended December 31, 2023 for additional information on our advertising and other revenues.
| Three Months Ended March 31, | Increase (Decrease) | |||||||||||||||||||
| (in millions) | 2024 | 2023 | ||||||||||||||||||
| Merchant revenues | $ | 2,388 | $ | 1,752 | 36.3 | % | ||||||||||||||
| Agency revenues | 1,763 | 1,782 | (1.1) | % | ||||||||||||||||
| Advertising and other revenues | 264 | 244 | 8.5 | % | ||||||||||||||||
| Total revenues | $ | 4,415 | $ | 3,778 | 16.9 | % | ||||||||||||||
| % of Total gross bookings | 10.1 | % | 9.6 | % | ||||||||||||||||
Merchant revenues increased while agency revenues decreased slightly for the three months ended March 31, 2024 compared to the three months ended March 31, 2023 due to the ongoing shift from agency revenues to merchant revenues at Booking.com. Advertising and other revenues increased for the three months ended March 31, 2024 compared to the three months ended March 31, 2023 due primarily to growth in our OpenTable and KAYAK businesses. The year-over-year growth in total revenues benefited from the shift in the timing of the Easter holiday relative to last year.
Total revenues as a percentage of gross bookings was 10.1% for the three months ended March 31, 2024, up from 9.6% for the three months ended March 31, 2023 due primarily to a more positive impact from differences in the timing of booking versus travel, mostly driven by the shift in the timing of the Easter holiday relative to last year, in the three months ended March 31, 2024 and an increase in revenue related to facilitated payments, partially offset by an increase in the mix of airline ticket gross bookings.
Operating Expenses
Marketing Expenses
| Three Months Ended March 31, | Increase (Decrease) | |||||||||||||||||||
| (in millions) | 2024 | 2023 | ||||||||||||||||||
| Marketing expenses | $ | 1,610 | $ | 1,517 | 6.1 | % | ||||||||||||||
| % of Total gross bookings | 3.7 | % | 3.8 | % | ||||||||||||||||
| % of Total revenues | 36.5 | % | 40.2 | % | ||||||||||||||||
Marketing expenses consist primarily of the costs of:
•search engine keyword purchases;
•affiliate programs;
•referrals from meta-search websites;
•offline and online brand marketing; and
•other performance-based marketing.
31
Our marketing expenses, which are substantially variable in nature, increased year-over-year in the first quarter of 2024 to help drive additional gross bookings and revenues. Marketing expenses as a percentage of total gross bookings decreased year-over-year in the first quarter of 2024 due to year-over-year increases in performance marketing ROIs and in the mix of direct traffic. Performance marketing ROIs were higher in the first quarter of 2024 versus the first quarter of 2023, due in part to our ongoing efforts to improve the efficiency of our marketing spend.
Sales and Other Expenses
| Three Months Ended March 31, | Increase (Decrease) | |||||||||||||||||||
| (in millions) | 2024 | 2023 | ||||||||||||||||||
| Sales and other expenses | $ | 678 | $ | 570 | 19.0 | % | ||||||||||||||
| % of Total gross bookings | 1.6 | % | 1.4 | % | ||||||||||||||||
| % of Total revenues | 15.4 | % | 15.1 | % | ||||||||||||||||
Sales and other expenses consist primarily of:
•credit card and other payment processing fees associated with merchant transactions;
•fees paid to third parties that provide call center and other customer services;
•digital services taxes and other similar taxes;
•chargeback provisions and fraud prevention expenses associated with merchant transactions;
•provisions for expected credit losses, mostly related to accommodation commission receivables; and
•customer relations costs.
Sales and other expenses, which are substantially variable in nature, increased year-over-year in the first quarter of 2024 due primarily to an increase in merchant transaction costs of $73 million. Merchant transactions increased year-over-year in the first quarter of 2024 due to the ongoing shift from agency transactions to merchant transactions at Booking.com.
Personnel
| Three Months Ended March 31, | Increase (Decrease) | |||||||||||||||||||
| (in millions) | 2024 | 2023 | ||||||||||||||||||
| Personnel | $ | 826 | $ | 722 | 14.5 | % | ||||||||||||||
| % of Total revenues | 18.7 | % | 19.1 | % | ||||||||||||||||
Personnel expenses consist primarily of:
•salaries, bonuses, and stock-based compensation;
•payroll taxes; and
•employee health and other benefits.
Personnel expenses increased year-over-year in the first quarter of 2024 due to an increase in salary expenses of $55 million and increased stock-based compensation expense of $31 million. The year-over-year increase in personnel expenses was impacted by a 7% increase in employee headcount from approximately 22,400 as of March 31, 2023 to 24,000 as of March 31, 2024.
32
General and Administrative
| Three Months Ended March 31, | Increase (Decrease) | |||||||||||||||||||
| (in millions) | 2024 | 2023 | ||||||||||||||||||
| General and administrative | $ | 186 | $ | 262 | (29.1) | % | ||||||||||||||
| % of Total revenues | 4.2 | % | 6.9 | % | ||||||||||||||||
General and administrative expenses consist primarily of:
•fees for certain outside professionals;
•occupancy and office expenses;
•certain travel transaction taxes; and
•personnel-related expenses such as travel, relocation, recruiting, and training expenses.
General and administrative expenses decreased year-over-year in the first quarter of 2024 primarily due to a decrease in certain travel transaction taxes, which was impacted by a $39 million accrual related to the potential settlement of certain indirect tax matters in the first quarter of 2023, as well as a year-over-year decrease in occupancy and office expenses.
Information Technology
| Three Months Ended March 31, | Increase (Decrease) | |||||||||||||||||||
| (in millions) | 2024 | 2023 | ||||||||||||||||||
| Information technology | $ | 187 | $ | 137 | 36.8 | % | ||||||||||||||
| % of Total revenues | 4.2 | % | 3.6 | % | ||||||||||||||||
Information technology expenses consist primarily of:
•software license and system maintenance fees;
•cloud computing costs and outsourced data center costs;
•payments to contractors; and
•data communications and other expenses associated with operating our services.
Information technology expenses increased year-over-year in the first quarter of 2024 due to increased cloud computing costs and outsourced data center costs, increased software license and system maintenance fees, as well as increased costs related to payments to contractors.
Depreciation and Amortization
| Three Months Ended March 31, | Increase (Decrease) | |||||||||||||||||||
| (in millions) | 2024 | 2023 | ||||||||||||||||||
| Depreciation and amortization | $ | 137 | $ | 120 | 14.1 | % | ||||||||||||||
| % of Total revenues | 3.1 | % | 3.2 | % | ||||||||||||||||
Depreciation and amortization expenses consist of:
•amortization of intangible assets with determinable lives;
•amortization of internally-developed and purchased software;
•depreciation of computer equipment; and
•depreciation of leasehold improvements, furniture and fixtures, and office equipment.
Depreciation and amortization expenses increased year-over-year in the first quarter of 2024 due primarily to increased depreciation of computer equipment, as well as amortization expense related to internally-developed and purchased software.
33
Interest and Dividend Income and Interest Expense
The following table presents the changes in interest and dividend income and interest expense for the three months ended March 31, 2024 and 2023:
| Three Months Ended March 31, | Increase (Decrease) | |||||||||||||||||||
| (in millions) | 2024 | 2023 | ||||||||||||||||||
| Interest and dividend income | $ | 243 | $ | 228 | 6.4 | % | ||||||||||||||
| Interest expense | (219) | (194) | 12.9 | % | ||||||||||||||||
Interest and dividend income increased for the three months ended March 31, 2024, compared to the three months ended March 31, 2023, primarily due to the impact of higher interest on cash management activities, partially offset by a decrease in interest income related to our investments in debt securities. Interest expense increased for the three months ended March 31, 2024, compared to the three months ended March 31, 2023, primarily due to the issuance of senior notes in May 2023 and March 2024, partially offset by the maturities of senior notes during March 2023.
Other Income (Expense), Net
The following table sets forth the composition of "Other income (expense), net" for the three months ended March 31, 2024 and 2023:
| Three Months Ended March 31, | ||||||||||||||
| (in millions) | 2024 | 2023 | ||||||||||||
| Foreign currency transaction gains (losses) | $ | 136 | $ | (53) | ||||||||||
| Net losses on equity securities | (16) | (133) | ||||||||||||
| Other | 2 | 5 | ||||||||||||
| Other income (expense), net | $ | 122 | $ | (181) | ||||||||||
See Note 5 to our Unaudited Consolidated Financial Statements for additional information related to net losses on equity securities.
Foreign currency transaction gains (losses) for the three months ended March 31, 2024 includes gains of $167 million related to our Euro-denominated debt and accrued interest that were not designated as net investment hedges and losses of $85 million on derivative contracts. Foreign currency transaction gains (losses) for the three months ended March 31, 2023 includes losses of $26 million related to our Euro-denominated debt and accrued interest that were not designated as net investment hedges and losses of $17 million on derivative contracts.
Income Taxes
| Three Months Ended March 31, | Increase (Decrease) | |||||||||||||||||||
| (in millions) | 2024 | 2023 | ||||||||||||||||||
| Income tax expense | $ | 161 | $ | 37 | 326.8 | % | ||||||||||||||
% of Income before income taxes | 17.1 | % | 12.4 | % | ||||||||||||||||
Our 2024 effective tax rate differs from the U.S. federal statutory tax rate of 21%, primarily due to the benefit of the Netherlands Innovation Box Tax (discussed below), partially offset by higher international tax rates, certain non-deductible expenses, and U.S. federal and state tax associated with our international earnings. Our 2023 effective tax rate differed from the U.S. federal statutory tax rate of 21%, primarily due to the benefit of the Netherlands Innovation Box Tax, partially offset by higher international tax rates and certain non-deductible expenses.
Our effective tax rate for the three months ended March 31, 2024 is higher compared to the effective tax rate for the three months ended March 31, 2023, primarily due to certain lower discrete tax benefits, higher U.S. federal and state tax associated with our international earnings, and a decrease in the benefit of the Netherlands Innovation Box Tax, partially offset by certain lower non-deductible expenses.
34
During the three months ended March 31, 2024 and 2023, a majority of our income was reported in the Netherlands, where Booking.com is based. Under Dutch corporate income tax law, income generated from qualifying innovative activities is taxed at a rate of 9% ("Innovation Box Tax") rather than the Dutch statutory rate of 25.8%. A portion of Booking.com's earnings during the three months ended March 31, 2024 and 2023 qualified for Innovation Box Tax treatment, which had a beneficial impact on the effective tax rates for these periods. For additional information relating to Booking.com's Innovation Box Tax treatment, including associated risks, please see Part I, Item 1A, Risk Factors - "We may not be able to maintain our 'Innovation Box Tax' benefit" in our Annual Report on Form 10-K for the year ended December 31, 2023.
Liquidity and Capital Resources
Our primary source of funds for operations is the cash flow that we generate from operations. We use our cash for a variety of needs, including ongoing investments in our business, share repurchases, dividends, repayment of debt, and capital expenditures. Our continued access to sources of liquidity depends on multiple factors. See Part I, Item 1A, Risk Factors - "Our liquidity, credit ratings, and ongoing access to capital could be materially and negatively affected by global financial conditions and events" in our Annual Report on Form 10-K for the year ended December 31, 2023. Our financial results and prospects are almost entirely dependent on facilitating the sale of travel-related services. Marketing expenses and personnel expenses are the most significant operating expenses for our business. We rely on marketing channels to generate traffic to our websites. See our Unaudited Consolidated Statements of Operations and "Trends" and "Results of Operations" above for additional information on marketing expenses and personnel expenses including stock-based compensation expenses.
At March 31, 2024, we had $16.4 billion in cash, cash equivalents, and investments, of which approximately $9.6 billion is held by our international subsidiaries. Cash, cash equivalents, and long-term investments held by our international subsidiaries are denominated primarily in Euros, U.S. Dollars, and Japanese Yen. See Notes 5 and 6 to our Unaudited Consolidated Financial Statements for additional information about our cash equivalents and investments. Our investment policy seeks to preserve capital and maintain sufficient liquidity to meet operational and other needs of the business.
Deferred merchant bookings of $5.3 billion at March 31, 2024 represents cash payments received from travelers in advance of us completing our performance obligations and are comprised principally of amounts estimated to be payable to travel service providers as well as our estimated future revenue for our commission or margin and fees. The amounts are mostly subject to refunds for cancellations.
At March 31, 2024, we had a remaining transition tax liability of $690 million as a result of the U.S. Tax Cuts and Jobs Act ("Tax Act"), which included $515 million reported as "Long-term U.S. transition tax liability" and $175 million included in "Accrued expenses and other current liabilities" in the Unaudited Consolidated Balance Sheet. This liability will be paid over the next three years. In accordance with the Tax Act, generally, future repatriation of our international cash will not be subject to a U.S. federal income tax liability as a dividend, but will be subject to U.S. state income taxes and international withholding taxes, which have been accrued by us.
Our revolving credit facility (see Note 9 to our Unaudited Consolidated Financial Statements) extends a revolving line of credit up to $2 billion to us and provides for the issuance of up to $80 million of letters of credit, as well as up to $100 million of borrowings on same-day notice. The revolving credit facility contains a maximum leverage ratio covenant, compliance with which is a condition to our ability to borrow. At March 31, 2024 there were no borrowings outstanding and $21 million of letters of credit issued under the revolving credit facility.
See Note 9 to our Unaudited Consolidated Financial Statements for additional information related to our debt arrangements, including principal amounts, interest rates, and maturity dates. In March 2024, we issued senior notes with varying maturities for an aggregate principal amount of 2.8 billion Euros ($3.0 billion). The proceeds from the issuance of these senior notes are available for general corporate purposes, including to repurchase shares of our common stock and to redeem or repay outstanding indebtedness. The convertible senior notes due in May 2025 are currently convertible at the option of the holder and have been classified as "Short-term debt" in the Unaudited Consolidated Balance Sheet as of March 31, 2024. If the note holders exercise their option to convert, we deliver cash to repay the principal amount of the notes and deliver shares of common stock or cash, at our option, to satisfy the conversion value in excess of the principal amount. The outstanding senior notes at March 31, 2024 had cumulative interest to maturity of $4.0 billion, with $551 million payable within the next twelve months.
35
See Note 10 to our Unaudited Consolidated Financial Statements for additional information related to our share repurchases and dividends declared and paid. During the three months ended March 31, 2024, we repurchased shares of our common stock for an aggregate cost of $1.9 billion, including $315 million to repurchase shares of our common stock withheld to satisfy employee withholding tax obligations related to stock-based compensation. At March 31, 2024, we had a total remaining authorization of $12.2 billion related to a program authorized by our Board of Directors ("the Board") in 2023 to repurchase up to $20 billion of our common stock. We expect to complete the share repurchases under the remaining authorization by the end of 2026, assuming no major downturn in the travel market. Excise tax obligations that result from our share repurchases are accounted for as a cost of the treasury stock transaction. As of March 31, 2024, we recorded an estimated excise tax liability of $108 million. During the three months ended March 31, 2024, we paid cash dividends of $299 million to stockholders of record as of the close of business on March 8, 2024. In May 2024, the Board declared a cash dividend of $8.75 per share of common stock, payable on June 28, 2024 to stockholders of record as of the close of business on June 7, 2024.
At March 31, 2024, we had lease obligations of $909 million, of which $221 million is payable within the next twelve months. Additionally, at March 31, 2024, we had, in the aggregate, $324 million of non-cancellable purchase obligations individually greater than $10 million, of which $182 million is payable within the next twelve months. Such purchase obligations relate to agreements to purchase goods and services that are enforceable and legally binding and that specify all significant terms, including the quantities to be purchased, price provisions, and the approximate timing of the transaction.
At March 31, 2024, there were $953 million of standby letters of credit and bank guarantees issued on our behalf. These are obtained primarily for regulatory purposes.
See Note 13 to our Unaudited Consolidated Financial Statements for additional information related to our commitments and contingencies.
We believe that our existing cash balances and liquid resources will be sufficient to fund our operating activities, capital expenditures, and other obligations through at least the next twelve months. However, if we are not successful in generating sufficient cash flow from operations or in raising additional capital when required in sufficient amounts and on terms acceptable to us, we may be required to reduce our planned capital expenditures and scale back the scope of our business plans, either of which could have a material adverse effect on our business, our ability to compete or our future growth prospects, financial condition, and results of operations. If additional funds were raised through the issuance of equity securities, the percentage ownership of our then current stockholders would be diluted. We may not generate sufficient cash flow from operations in the future, revenue growth or sustained profitability may not be realized, and future borrowings or equity sales may not be available in amounts sufficient to make anticipated capital expenditures, finance our strategies, or repay our indebtedness.
Cash Flow Analysis
Net cash provided by operating activities for the three months ended March 31, 2024 was $2.7 billion, resulting from net income of $776 million, a favorable net impact from adjustments for non-cash and other items of $224 million, and a favorable net change in working capital and other assets and liabilities of $1.7 billion. Non-cash and other items were principally associated with unrealized foreign currency transaction gains related to Euro-denominated debt, stock-based compensation expense, depreciation and amortization, provision for expected credit losses and chargebacks, operating lease amortization, and deferred income tax benefit. For the three months ended March 31, 2024, deferred merchant bookings and other current liabilities increased by $2.1 billion primarily due to higher gross bookings, accounts receivable increased by $185 million primarily due to the timing of settlements from payment processors and networks, and prepaid expenses increased by $98 million due to higher prepayment of certain expenses and advances to suppliers.
Net cash provided by operating activities for the three months ended March 31, 2023 was $2.9 billion, resulting from net income of $266 million, a favorable net impact from adjustments for non-cash and other items of $147 million, and a favorable net change in working capital and other assets and liabilities of $2.5 billion. Non-cash items were principally associated with deferred income tax benefit, net losses on equity securities, depreciation and amortization, stock-based compensation expense, provision for expected credit losses and chargebacks, and operating lease amortization. For the three months ended March 31, 2023, deferred merchant bookings and other current liabilities increased by $2.0 billion, primarily due to increases in business volumes, and accounts receivable decreased by $158 million.
36
Net cash provided by investing activities for the three months ended March 31, 2024 was $69 million, principally resulting from proceeds from the maturity of investments of $218 million, partially offset by additions to property and equipment of $130 million. Net cash provided by investing activities for the three months ended March 31, 2023 was $1.6 billion, principally resulting from proceeds from the sale and maturity of investments of $1.7 billion, partially offset by additions to property and equipment of $88 million.
Net cash provided by financing activities for the three months ended March 31, 2024 was $784 million, resulting from proceeds from the issuance of long-term debt of $3.0 billion, partially offset by payments for the repurchase of common stock of $1.9 billion and dividends of $299 million. Net cash used in financing activities for the three months ended March 31, 2023 was $2.6 billion, almost entirely resulting from payments for the repurchase of common stock of $2.2 billion and payments on the maturity of debt of $500 million, partially offset by proceeds from the exercise of stock options of $105 million.
Contingencies
For information related to tax matters, see Note 13 to our Unaudited Consolidated Financial Statements and Part I, Item IA, Risk Factors - "We may have exposure to additional tax liabilities" in our Annual Report on Form 10-K for the year ended December 31, 2023.
For information related to the Dutch pension matter, the Spanish competition matter, and our other contingent liabilities, see Note 13 to our Unaudited Consolidated Financial Statements.
SPECIAL NOTE REGARDING FORWARD-LOOKING STATEMENTS
This Form 10-Q, including "Management's Discussion and Analysis of Financial Condition and Results of Operation" in Part I, Item 2, and the documents incorporated by reference contain forward-looking statements. These statements reflect our views regarding current expectations and projections about future events and conditions and are based on currently available information. They are not guarantees of future performance and are subject to risks, uncertainties, and assumptions that are difficult to predict including the Risk Factors identified in Part I, Item 1A of our Annual Report on Form 10-K for the year ended December 31, 2023; therefore, our actual results could differ materially from those expressed or described in the forward-looking statements.
Expressions of future goals and expectations and similar expressions, including "may," "will," "should," "could," "aims," "seeks," "expects," "plans," "anticipates," "intends," "believes," "estimates," "predicts," "potential," "targets," and "continue," reflecting something other than historical fact are intended to identify forward-looking statements. Unless required by law, we undertake no obligation to update publicly any forward-looking statements, whether as a result of new information, future events, or otherwise. However, readers should carefully review the reports and documents we file or furnish from time to time with the Securities and Exchange Commission, particularly our Annual Report on Form 10-K for the year ended December 31, 2023, our subsequent Quarterly Reports on Form 10-Q, and our Current Reports on Form 8-K.
Item 3. Quantitative and Qualitative Disclosures About Market Risk
We have exposure to several types of market risk, including changes in interest rates, foreign currency exchange rates, and equity prices. See Part II, Item 7A, "Quantitative and Qualitative Disclosures About Market Risk" in our Annual Report on Form 10-K for the year ended December 31, 2023 for additional information on our policies and how we manage our exposure to such risks.
See Note 9 to our Unaudited Consolidated Financial Statements for information about our convertible senior notes and other debt. Excluding the effect on the fair value of our convertible senior notes, a hypothetical 100 basis point (1.0%) decrease in interest rates would have resulted in an increase in the estimated fair value of our other debt of approximately $846 million at March 31, 2024. Our convertible senior notes are more sensitive to the equity market price volatility of our shares than changes in interest rates. The fair value of the convertible senior notes will likely increase as the market price of our shares increases and will likely decrease as the market price of our shares falls. Our convertible senior notes due in May 2025 are currently convertible at the option of the holder. If the note holders exercise their option to convert, we deliver cash to repay the principal amount of the notes and deliver shares of common stock or cash, at our option, to satisfy the conversion value in excess of the principal amount.
37
We face exposure to movements in foreign currency exchange rates as the financial results and the financial condition of our businesses outside of the U.S., which represent a substantial majority of our financial results, are translated from local currencies (principally Euros and British Pounds Sterling) into U.S. Dollars. For example, our total gross bookings increased by 44% for the three months ended March 31, 2023 as compared to the three months ended March 31, 2022, but without the impact of changes in foreign currency exchange rates our total gross bookings increased year-over-year on a constant-currency basis by approximately 51%. Our total revenues increased by 40% for the three months ended March 31, 2023 as compared to the three months ended March 31, 2022, but without the impact of changes in foreign currency exchange rates, our total revenues increased year-over-year on a constant-currency basis by approximately 46%. See Notes 9 and 14 to our Unaudited Consolidated Financial Statements and Item 2. Management's Discussion and Analysis of Financial Condition and Results of Operations for additional information about foreign currency transaction gains and losses, changes in foreign currency exchange rates, the impact of such changes on the increase in our revenues and operating margins, and our designation of certain portions of our Euro-denominated debt as a hedge of the foreign currency exposure of the net investment in certain Euro functional currency subsidiaries.
See Notes 5 and 6 to our Unaudited Consolidated Financial Statements for information about our investments in equity securities of publicly-traded companies and private entities. A hypothetical 10% decrease in the fair values at March 31, 2024 of our investments in equity securities of publicly-traded companies and private entities would have resulted in a loss, before tax, of approximately $45 million being recognized in net income.
Item 4. Controls and Procedures
Under the supervision and with the participation of management, including our principal executive officer and our principal financial officer, we conducted an evaluation of our disclosure controls and procedures, as such a term is defined under Exchange Act Rule 13a-15(e). Based on this evaluation, our principal executive officer and our principal financial officer concluded that our disclosure controls and procedures were effective as of the end of the period covered by this report.
In 2022, we began a multi-year implementation to integrate and upgrade certain financial systems and processes, including but not limited to SAP S4 HANA ("SAP"). As a result of these improvements, there were changes to our internal control over financial reporting processes and procedures. However, there were no changes in our internal control over financial reporting (as such term is defined in Exchange Act Rule 13a-15(f)) that occurred during the three months ended March 31, 2024 that materially affected, or are reasonably likely to materially affect, our internal control over financial reporting. Further, as the phased implementation of SAP continues, there will be additional changes to our processes and procedures that are likely to impact our internal control over financial reporting.
We believe we are taking the necessary steps to monitor and maintain appropriate internal control over financial reporting during this period of change.
While we expect this implementation to strengthen our internal financial controls by automating certain manual processes and standardizing business processes and reporting across our organization, management will continue to evaluate and monitor our internal controls as the implementation continues.
38
PART II - OTHER INFORMATION
Item 1. Legal Proceedings
A description of any material legal proceedings to which we are a party, and updates thereto, is included in Note 13 to our Unaudited Consolidated Financial Statements included in this Quarterly Report on Form 10-Q for the three months ended March 31, 2024, and is incorporated into this Part II, Item 1 by reference thereto.
Item 1A. Risk Factors
Our operations and financial results are subject to various risks and uncertainties which could adversely affect our business, financial condition, results of operations, cash flows, and the trading price of our common stock. For a discussion of such risks, please refer to Part I, Item 1A, "Risk Factors" in our Annual Report on Form 10-K for the year ended December 31, 2023.
Item 2. Unregistered Sales of Equity Securities and Use of Proceeds
The following table sets forth information relating to repurchases of our equity securities during the three months ended March 31, 2024 (in billions, except share and per share data).
ISSUER PURCHASES OF EQUITY SECURITIES
| Period | Total Number of Shares (or Units) Purchased | Average Price Paid per Share (or Unit) (1) | Total Number of Shares (or Units) Purchased as Part of Publicly Announced Plans or Programs | Maximum Number (or Approximate Dollar Value) of Shares (or Units) that May Yet Be Purchased Under the Plans or Programs | ||||||||||||||||||||||||||||
| January 1, 2024 – | 167,031 | (2) | $ | 3,489 | 167,031 | $ | 13.2 | (2) | ||||||||||||||||||||||||
| January 31, 2024 | 55 | (3) | $ | 3,528 | N/A | N/A | ||||||||||||||||||||||||||
| February 1, 2024 – | 125,040 | (2) | $ | 3,632 | 125,040 | $ | 12.7 | (2) | ||||||||||||||||||||||||
| February 29, 2024 | 624 | (3) | $ | 3,506 | N/A | N/A | ||||||||||||||||||||||||||
| March 1, 2024 – | 153,444 | (2) | $ | 3,523 | 153,444 | $ | 12.2 | (2) | ||||||||||||||||||||||||
| March 31, 2024 | 89,245 | (3) | $ | 3,500 | N/A | N/A | ||||||||||||||||||||||||||
| Total | 535,439 | 445,515 | $ | 12.2 | ||||||||||||||||||||||||||||
(1) These amounts exclude the 1% excise tax mandated by the Inflation Reduction Act on share repurchases.
(2) Pursuant to a stock repurchase program announced on February 23, 2023, whereby we were authorized to repurchase up to $20 billion of our common stock.
(3) Pursuant to a general authorization, not publicly announced, whereby we are authorized to repurchase shares of our common stock to satisfy employee withholding tax obligations related to stock-based compensation. The table above does not include adjustments during the three months ended March 31, 2024 to previously withheld share amounts that reflect changes to the estimates of employee tax withholding obligations.
39
Item 6. Exhibits
The exhibits listed below are filed as part of this Quarterly Report on Form 10-Q.
| Exhibit Number | Description | ||||
3.1(a) | Restated Certificate of Incorporation. | ||||
3.2(b) | Certificate of Amendment of the Restated Certificate of Incorporation, dated as of June 4, 2021. | ||||
3.3(c) | Amended and Restated By-Laws of Booking Holdings Inc., dated as of April 18, 2024. | ||||
4.1(d) | Indenture, dated August 8, 2017, between the Company and U.S. Bank Trust Company, National Association (as successor in interest to U.S. Bank National Association), as trustee. | ||||
4.2(e) | Form of 3.500% Senior Note due 2029. | ||||
4.3(e) | Form of 3.625% Senior Note due 2032. | ||||
4.4(e) | Form of 3.750% Senior Note due 2036. | ||||
4.5(e) | Form of 4.000% Senior Note due 2044. | ||||
| Officers’ Certificate, dated March 1, 2024, with respect to the 3.500% Senior Note due 2029 issued pursuant to the Base Indenture. | |||||
| Officers’ Certificate, dated March 1, 2024, with respect to the 3.625% Senior Note due 2032 issued pursuant to the Base Indenture. | |||||
| Officers’ Certificate, dated March 1, 2024, with respect to the 3.750% Senior Note due 2036 issued pursuant to the Base Indenture. | |||||
| Officers’ Certificate, dated March 1, 2024, with respect to the 4.000% Senior Note due 2044 issued pursuant to the Base Indenture. | |||||
4.10(e) | Agency Agreement, dated as of March 1, 2024, by and between Booking Holdings Inc., as issuer, Elavon Financial Services DAC, UK Branch, as paying agent, and U.S. Bank Trust Company, National Association, as transfer agent, registrar and trustee. | ||||
10.1(f) | Letter Agreement Amendment, dated January 18, 2024 by and between the Company and David I. Goulden. | ||||
10.2(g) | Letter Agreement Amendment, dated April 4, 2024 by and between the Company and David I. Goulden. | ||||
| Certification of Glenn D. Fogel, the Chief Executive Officer and President, pursuant to Section 302 of the Sarbanes-Oxley Act of 2002. | |||||
| Certification of Ewout L. Steenbergen, the Executive Vice President and Chief Financial Officer, pursuant to Section 302 of the Sarbanes-Oxley Act of 2002. | |||||
| Certification of Glenn D. Fogel, the Chief Executive Officer and President, pursuant to Section 906 of the Sarbanes-Oxley Act of 2002. | |||||
| Certification of Ewout L. Steenbergen, the Executive Vice President and Chief Financial Officer, pursuant to Section 906 of the Sarbanes-Oxley Act of 2002. | |||||
| 101.INS | XBRL Instance Document - the instance document does not appear in the Interactive Data File because its XBRL tags are embedded within the Inline XBRL document. | ||||
| 104 | Cover Page Interactive Data File - the cover page from this Quarterly Report on Form 10-Q for the quarter ended March 31, 2024, formatted in Inline XBRL (included in Exhibit 101). | ||||
*Schedules or similar attachments have been omitted pursuant to Item 601(a)(5) of Regulation S-K. The Company undertakes to furnish copies of any of the omitted schedules or similar attachments upon request by the Securities and Exchange Commission.
(a) Previously filed as an exhibit to the Current Report on Form 8-K filed on February 21, 2018 and incorporated herein by reference.
(b) Previously filed as an exhibit to the Current Report on Form 8-K filed on June 4, 2021 and incorporated herein by reference.
(c) Previously filed as an exhibit to the Current Report on Form 8-K filed on April 22, 2024 and incorporated herein by reference.
(d) Previously filed as an exhibit to the Registration Statement on Form S-3ASR filed on August 8, 2017 and incorporated herein by reference.
(e) Previously filed as an exhibit to the Current Report on Form 8-K filed on March 1, 2024 and incorporated herein by reference.
(f) Previously filed as an exhibit to the Current Report on Form 8-K filed on January 19, 2024 and incorporated herein by reference.
(g) Previously filed as an exhibit to the Current Report on Form 8-K filed on April 5, 2024 and incorporated herein by reference.
40
SIGNATURES
Pursuant to the requirements of the Securities Exchange Act of 1934, the Registrant has duly caused this report to be signed on its behalf by the undersigned thereunto duly authorized.
| BOOKING HOLDINGS INC. | |||||||||||
| (Registrant) | |||||||||||
| Date: | May 2, 2024 | By: | /s/ Ewout L. Steenbergen | ||||||||
| Name: Ewout L. Steenbergen Title: Executive Vice President and Chief Financial Officer | |||||||||||
(On behalf of the Registrant and as principal financial officer) | |||||||||||
41