UNITED STATES
SECURITIES AND EXCHANGE COMMISSION
Washington, D.C. 20549
FORM 10-K
ANNUAL REPORT PURSUANT TO SECTION 13 OR 15(d) OF THE SECURITIES EXCHANGE ACT OF 1934 | |||||
OR
TRANSITION REPORT PURSUANT TO SECTION 13 OR 15(d) OF THE SECURITIES EXCHANGE ACT OF 1934 | |||||
For the fiscal year ended December 31 , 2023
Commission File Number: 001-35039
(Exact name of registrant as specified in its charter)
| (State or other jurisdiction of incorporation or organization) | (I.R.S. Employer Identification No.) | |||||||
| (Address of principal executive offices) | (Zip Code) | ||||||||||
Registrant’s telephone number, including area code: (305 ) 569-2000
Securities registered pursuant to Section 12(b) of the Act:
| Class | Trading Symbol | Name of Exchange on Which Registered | ||||||||||||
Securities registered pursuant to Section 12(g) of the Act: None
Indicate by check mark if the registrant is a well-known seasoned issuer, as defined in Rule 405 of the Securities Act. Yes ☒ No ☐
Indicate by check mark if the registrant is not required to file reports pursuant to Section 13 or Section 15(d) of the Act. Yes ☐ No ☒
Indicate by check mark whether the registrant (1) has filed all reports required to be filed by Section 13 or 15(d) of the Securities Exchange Act of 1934 during the preceding 12 months (or for such shorter period that the registrant was required to file such reports), and (2) has been subject to such filing requirements for the past 90 days. Yes ☒ No ☐
Indicate by check mark whether the registrant has submitted electronically and posted on its corporate Web site, if any, every Interactive Data File required to be submitted and posted pursuant to Rule 405 of Regulation S-T (§232.405 of this chapter) during the preceding 12 months (or for such shorter period that the registrant was required to submit and post such files). Yes ☒ No ☐
Indicate by check mark whether the registrant is a large accelerated filer, an accelerated filer, a non-accelerated filer, a smaller reporting company, or an emerging growth company. See the definitions of “large accelerated filer,” “accelerated filer,” “smaller reporting company,” and "emerging growth company" in Rule 12b-2 of the Exchange Act.
☒ | Accelerated filer | ☐ | Emerging growth company | ||||||||||||||
| Non-accelerated filer | ☐ | Smaller reporting company | |||||||||||||||
If an emerging growth company, indicate by check mark if the registrant has elected not to use the extended transition period for complying with any new or revised financial accounting standards provided pursuant to Section 13(a) of the Exchange Act o
Indicate by check mark whether the registrant has filed a report on and attestation to its management's assessment of the effectiveness of its internal control over financial reporting under Section 404(b) of the Sarbanes-Oxley Act (15 U.S.C. 7262(b)) by the registered public accounting firm that prepared or issued its audit report. ☒
If securities are registered pursuant to Section 12(b) of the Act, indicate by check mark whether the financial statements of the registrant included in the filing reflect the correction of an error to previously issued financial statements. ☐
Indicate by check mark whether any of those error corrections are restatements that required a recovery analysis of incentive-based compensation received by any of the registrant's executive officers during the relevant recovery period pursuant to Section 240.10D-1(b). ☐
Indicate by check mark whether the registrant is a shell company (as defined in Rule 12b-2 of the Exchange Act). Yes ☐ No ☒
The aggregate market value of the voting and non-voting common stock held by non-affiliates of the registrant on June 30, 2023 was $1,582,728,768 .
The number of outstanding shares of the registrant common stock, $0.01 par value, as of February 16, 2024 was 74,371,130 .
DOCUMENTS INCORPORATED BY REFERENCE:
Portions of the registrant's definitive proxy statement for the 2024 annual meeting of stockholders are incorporated by reference in this Annual Report on Form 10-K in response to Part II. Item 5 and Part III. Items 10, 11, 12, 13 and 14.
BANKUNITED, INC.
Form 10-K
For the Year Ended December 31, 2023
TABLE OF CONTENTS
| Page | ||||||||
i
GLOSSARY OF DEFINED TERMS
The following acronyms and terms may be used throughout this Form 10-K, including the consolidated financial statements and related notes.
| ACL | Allowance for credit losses | |||||||
| AFS | Available for sale | |||||||
| ALCO | Asset Liability Committee | |||||||
| ALM | Asset Liability Management | |||||||
| AOCI | Accumulated other comprehensive income | |||||||
| APY | Annual Percentage Yield | |||||||
| ARM | Adjustable rate mortgage | |||||||
| ASC | Accounting Standards Codification | |||||||
| ASU | Accounting Standards Update | |||||||
| Basel Committee | International Basel Committee on Banking Supervision | |||||||
| BHC Act | Bank Holding Company Act of 1956 | |||||||
| BHC | Bank Holding company | |||||||
| BKU | BankUnited, Inc. | |||||||
| BOLI | Bank Owned Life Insurance | |||||||
| BankUnited | BankUnited, National Association | |||||||
| The Bank | BankUnited, National Association | |||||||
| Bridge | Bridge Funding Group, Inc. | |||||||
| Buyout loans | FHA and VA insured mortgages from third party servicers who have exercised their right to purchase these loans out of GNMA securitizations | |||||||
CAO | Chief Accounting Officer | |||||||
| CARES Act | Coronavirus Aid, Relief, and Economic Security Act | |||||||
| CCA | Cloud Computing Arrangements | |||||||
| CCAR | Comprehensive Capital Analysis and Review | |||||||
CDARS | Certificate of Deposit Account Registry Service | |||||||
| CD | Certificate of Deposit | |||||||
| CECL | Current expected credit losses | |||||||
| CET1 | Common Equity Tier 1 capital | |||||||
| CFPB | Consumer Financial Protection Bureau | |||||||
| C&I | Commercial and Industrial loans, including owner-occupied commercial real estate | |||||||
CFO | Chief Financial Officer | |||||||
CIO | Chief Information Officer | |||||||
CISO | Chief Information Security Officer | |||||||
| CLO | Collateralized loan obligations | |||||||
| CMBS | Commercial mortgage-backed securities | |||||||
| CME | Chicago Mercantile Exchange | |||||||
| CMOs | Collateralized mortgage obligations | |||||||
| COVID-19 | Coronavirus disease of 2019 | |||||||
| CRA | Community Reinvestment Act | |||||||
| CRE | Commercial real estate loans, including non-owner occupied commercial real estate and construction and land | |||||||
CRO | Chief Risk Officer | |||||||
CVA | Credit Valuation Adjustment | |||||||
| DIF | Deposit insurance fund | |||||||
| DSCR | Debt Service Coverage Ratio | |||||||
| ESG | Environmental, social and governance | |||||||
ii
| EVE | Economic value of equity | |||||||
| FASB | Financial Accounting Standards Board | |||||||
| FCA | The Financial Conduct Authority | |||||||
| FDIA | Federal Deposit Insurance Act | |||||||
| FDIC | Federal Deposit Insurance Corporation | |||||||
| FHA | Federal Housing Administration | |||||||
FHFA | Federal Housing Finance Agency | |||||||
| FHLB | Federal Home Loan Bank | |||||||
| FICO | Fair Isaac Corporation (credit score) | |||||||
FinTech | Financial Technology | |||||||
| FRB | Federal Reserve Bank | |||||||
| GAAP | U.S. generally accepted accounting principles | |||||||
| GDP | Gross Domestic Product | |||||||
| GLB Act | The Gramm-Leach-Bliley Financial Modernization Act of 1999 | |||||||
| GNMA | Government National Mortgage Association | |||||||
| HPI | Home price indices | |||||||
| HTM | Held to maturity | |||||||
| ISDA | International Swaps and Derivatives Association | |||||||
| LGD | Loss Given Default | |||||||
| LIBOR | London InterBank Offered Rate | |||||||
| LIHTC | Low Income Housing Tax Credits | |||||||
| LTV | Loan-to-value | |||||||
MAT | Materiality Assessment Team | |||||||
| MBS | Mortgage-backed securities | |||||||
| MSA | Metropolitan Statistical Area | |||||||
| MWL | Mortgage warehouse lending | |||||||
| NRSRO | Nationally recognized statistical rating organization | |||||||
| NSF | Non-sufficient funds | |||||||
| NYSE | New York Stock Exchange | |||||||
| OCC | Office of the Comptroller of the Currency | |||||||
| OFAC | U.S. Department of the Treasury's Office of Foreign Assets Control | |||||||
| OREO | Other real estate owned | |||||||
| PCAOB | Public Company Accounting Oversight Board | |||||||
| PCD | Purchased credit-deteriorated | |||||||
| PD | Probability of default | |||||||
| Pinnacle | Pinnacle Public Finance, Inc. | |||||||
| Proxy Statement | Definitive proxy statement for the Company's 2023 annual meeting of stockholders | |||||||
| PSU | Performance Share Unit | |||||||
| REIT | Real Estate Investment Trust | |||||||
| ROU Asset | Right-of-use Asset | |||||||
RPA | Risk Participation Agreement | |||||||
| RSA | Restricted Share Award | |||||||
| RSU | Restricted Share Unit | |||||||
RWA | Risk-weighted Assets | |||||||
| SAR | Share Appreciation Right | |||||||
| SBA | U.S. Small Business Administration | |||||||
| SEC | Securities and Exchange Commission | |||||||
| SOFR | Secured Overnight Financing Rate | |||||||
| S&P 500 | Standard & Poor's 500 Index | |||||||
iii
| TDR | Troubled-debt restructuring | |||||||
| Tri-State | New York, New Jersey and Connecticut | |||||||
| UPB | Unpaid principal balance | |||||||
| USDA | U.S. Department of Agriculture | |||||||
| VA loan | Loan guaranteed by the U.S. Department of Veterans Affairs | |||||||
| VIEs | Variable interest entities | |||||||
| WARM | Weighted-average remaining maturity | |||||||
| 2010 Plan | 2010 Omnibus Equity Incentive Plan | |||||||
| 2014 Plan | 2014 Omnibus Equity Incentive Plan | |||||||
| 401(k) Plan | BankUnited 401(k) Plan | |||||||
iv
Forward-Looking Statements
This Annual Report on Form 10-K contains forward-looking statements within the meaning of the Private Securities Litigation Reform Act of 1995. Words such as "anticipate," "expect," "intend," "plan," "believe," "seek," "estimate," "project," "predict," "will" and similar expressions identify forward-looking statements.
These forward-looking statements are based on management's current views with respect to future results, and are subject to risks and uncertainties. Forward-looking statements are based on beliefs and assumptions made by management using currently available information, such as market and industry data, historical performance and current financial trends. These statements are only predictions and are not guarantees of future performance. The inclusion of forward-looking statements should not be regarded as a representation by the Company that the future plans, estimates or expectations contemplated by a forward-looking statement will be achieved. Forward-looking statements are subject to various risks and uncertainties and assumptions, including those relating to the Company's operations, financial results, financial condition, business prospects, growth strategy and liquidity. If one or more of these or other risks or uncertainties materialize, or if the Company's underlying assumptions prove to be incorrect, the Company's actual results could differ materially from those contemplated by a forward-looking statement. These risks and uncertainties include, without limitation:
•strategic risk:
◦an inability to successfully execute our core business strategy;
◦competition;
◦natural or man-made disasters, social or health care crises or political unrest;
◦loss of executive officers or key personnel;
◦climate change or societal responses thereto;
•credit risk inherent in the business of making loans and embedded in our securities portfolio:
◦inadequate allowance for credit losses:
◦the accuracy and completeness of information about counterparties and borrowers;
◦real estate market conditions, real estate valuations and other risks related to holding loans secured by real estate or real estate received in satisfaction of loans;
◦geographic concentration of the Company's markets in Florida and the New York tri-state area;
◦fluctuations in demand for and valuation of operating lease equipment;
•interest rate risk, including risks related to reference rate reform;
•liquidity risk:
◦an inability to maintain adequate liquidity;
◦restrictions on the ability of BankUnited, N.A. to pay dividends to BankUnited, Inc.;
•risks related to the regulation of our industry;
•operational risk:
◦inadequate or inaccurate forecasting tools and models;
◦inability to successfully launch new products, services, or business initiatives;
◦susceptibility to fraud, risk or errors;
◦dependence on information technology and third party service providers and the risk of systems failures, interruptions or breaches of security or inability to keep pace with technological change;
•reputational risk;
•a variety of regulatory, legal and compliance;
•the impact of conditions in the financial markets and economic conditions generally;
v
•ineffective risk management or internal controls; and
•the selection and application of accounting policies and methods and related assumptions and estimates.
Additional factors are set forth in the Company's filings with the SEC, including this Annual Report on Form 10-K.
Forward-looking statements speak only as of the date on which they are made. The Company expressly disclaims any obligation to update or revise any forward-looking statement, whether as a result of new information, future events or otherwise, except as required by law.
As used herein, the terms the "Company," "we," "us," and "our" refer to BankUnited, Inc. and its subsidiaries unless the context otherwise requires.
vi
PART I
Item 1. Business
Overview
BankUnited, Inc., with total consolidated assets of $35.8 billion at December 31, 2023, is a bank holding company with one direct wholly-owned subsidiary, BankUnited, collectively, the Company. BankUnited, a national banking association headquartered in Miami Lakes, Florida, provides a full range of commercial lending and both commercial and consumer deposit services through banking centers located in Florida, the New York metropolitan area and Dallas, Texas, and a comprehensive suite of wholesale products to customers through an Atlanta office focused on the Southeast region. The Bank provides certain commercial lending and deposit products through national platforms and certain consumer deposit products through an online channel. Our core business strategy is to build a leading regional commercial and small business bank with a distinctive value proposition based on strong service-oriented relationships, robust digital enabled customer experiences and operational excellence, and with an entrepreneurial work environment that empowers employees to deliver their best. To date, we have executed our strategy primarily through organic growth and anticipate that we will most likely continue to do so.
Our Products and Services
Lending and Leasing
General—Our primary lending focus is to serve small and middle-market and larger corporate businesses with a variety of financial products and services, while maintaining a disciplined credit culture. We offer a full array of lending products that cater to our customers' needs and have attracted and invested in experienced relationship management teams in our primary lending markets.
Commercial loans—Our commercial loans, which are generally made to growing small business, middle-market and larger corporate entities and non-profit organizations, include secured and unsecured lines of credit, formula-based lines of credit, equipment loans, owner-occupied commercial real estate term loans and lines of credit, mortgage warehouse lines, subscription finance facilities, letters of credit, commercial credit cards, SBA and USDA product offerings, Export-Import Bank financing products, trade finance and business acquisition finance credit facilities.
Through the Bank's two commercial lending subsidiaries, Pinnacle and Bridge, we provide municipal, equipment and franchise financing on a national basis. Pinnacle, headquartered in Scottsdale, Arizona, provides financing to state and local governmental entities directly and through vendor programs and alliances. Pinnacle offers a full array of financing structures including essential use equipment lease purchase and loan agreements and direct (private placement) bond refundings. Bridge, headquartered in Baltimore, Maryland, offers large corporate and middle-market businesses equipment loans and leases including finance lease and operating lease structures through its equipment finance division. Bridge offers franchise equipment, acquisition and expansion financing through its franchise finance division. These lines of business have been de-emphasized due to their risk/return and liquidity profiles in the current environment. We expect that related balances will continue to decline in the near term.
Commercial real estate loans—We offer term financing for the acquisition or refinancing of properties, primarily rental apartments, mixed-use commercial properties, industrial properties, warehouses, retail shopping centers, free-standing single-tenant buildings, office buildings and hotels. Other products that we provide include real estate secured lines of credit, lending to REITs and institutional asset owners, subscription lines of credit to real estate funds, and, to a lesser extent, acquisition, development and construction loan facilities and construction financing. In the current environment, we have de-emphasized lending in the office sector and been more focused on warehouse/industrial, multi-family and selectively, the retail sectors.
Residential mortgages—We do not originate residential mortgages, but do invest in residential loans originated through correspondent channels and community partners. Our residential loan portfolio is primarily comprised of loans purchased on a national basis through select correspondent channels. This national purchase program allows us to diversify our loan portfolio, both by product type and geography. Residential loans purchased are primarily closed-end, first lien jumbo mortgages for the purchase or re-finance of owner-occupied property. A limited portion of the portfolio is secured by investor-owned properties. We do not originate or purchase negatively amortizing or sub-prime residential loans. We also acquire non-performing FHA and VA insured mortgages from third party servicers who have exercised their right to purchase these loans out of GNMA securitizations. Such loans that re-perform, either through modification or self-cure, may be eligible for re-securitization. The Company and the servicer share in the economics of the sale of these loans into new securitizations.
1
Other consumer loans—We do not originate, or currently intend to originate a significant amount of consumer loans. Home equity loans and lines of credit and other consumer loans are not significant components of our loan portfolio or of our lending strategy.
Credit risk management—Credit is managed through our three lines of defense framework as prescribed in our credit policies and procedures.
•First Line of Defense - Credit opportunities are sourced, analyzed, recommended and managed by our lines of business in accordance with established credit procedures.
•Second Line of Defense - Our credit administration division, reporting to the Chief Risk Officer, is responsible for the evaluation and approval of recommended credit opportunities. Approval of credit and confirmation of risk ratings is performed within a risk-based delegated credit approval framework. The credit administration division also provides governance and oversight of our credit policies and procedures.
•Third Line of Defense - Credit Review, reporting directly to the Risk Committee of the Board of Directors, provides an independent assessment of credit risk and the effectiveness of credit risk management processes across the organization. Credit Review performs risk-based testing through both examinations and ongoing monitoring.
Asset oversight committees meet at least quarterly and provide oversight of key credit governance, transactional and credit management functions. These committees include:
•Credit Risk Management Committee with responsibilities including credit governance policies and procedures and changes thereto and establishing and maintaining the delegated credit approval framework;
•Executive Credit Committee with responsibilities including transactional credit approval for large and/or complex credit exposures as well as the approval of periodic asset monitoring reports for large and/or complex credit exposures;
•Criticized Asset Committee with responsibilities including the evaluation and oversight of higher risk assets and oversight of workout and recovery functions; and
•Residential Credit Risk Management Committee with responsibilities including residential portfolio performance monitoring and certain bulk purchase transactional authorities.
Our In-house Lending Limits, ranging from $125 million to $150 million, are based upon loan type and are further limited by risk-based Hold Limits that incorporate our assessment of the borrower’s financial condition and industry exposure. These limits are significantly below our legal lending limit and are reviewed periodically by the Credit Risk Management Committee and approved annually by the Board of Directors.
Deposit and Treasury Solutions Products
We offer traditional deposit products including commercial and consumer checking accounts, money market deposit accounts, savings accounts and certificates of deposit with a variety of terms and rates, as well as a robust suite of treasury, commercial payments and cash management services. We offer commercial and retail deposit products across our primary geographic footprint and certain commercial deposit, payments and treasury management products and services nationally. We offer the CDARS program, providing additional FDIC insurance to our customers. We also offer other insured cash sweep programs allowing customers the ability to insure deposits above standard FDIC deposit insurance limits by distributing funds among banks that participate in the network while providing competitive rates and easy access to funds. For our consumers, we offer competitive money market and time deposit products through our online channel as well as through our retail branch network. Demand deposit balances are concentrated in commercial and small business accounts and our deposit growth strategy is focused on small business and middle market companies generally, as well as select industry verticals. Our service fee schedule and rates are competitive with other financial institutions in our markets. We do not charge consumer overdraft or NSF fees.
Our Markets
Our primary banking markets are Florida and the Tri-State market of New York, New Jersey and Connecticut, concentrated in the New York Metropolitan area. We believe both represent long-term attractive banking markets. In Florida, our focus is on urban markets including the Miami-Dade, Broward, Palm Beach, Tampa, Orlando and Jacksonville markets. We have more recently entered the Atlanta and Dallas markets, in Atlanta with a wholesale banking office focused on the Southeastern United States, and in Dallas with a retail branch as well as full-service wholesale banking capabilities. Our future strategy may include organic expansion into other markets, but no specific additional markets have been identified at this time.
2
Pinnacle and Bridge offer lending products and the Bank provides mortgage warehouse financing on a national basis. We also offer a suite of commercial deposit, treasury solutions and cash management products nationally, primarily focused on select industry verticals.
Competition
Our primary markets are highly competitive, containing not only a large number of community and regional banks, but also a significant presence of the country's largest commercial banks. We compete with other state, national and international banks as well as savings associations, savings banks and credit unions with physical presence in our market areas or targeting our market areas digitally for deposits and loans. In addition, we compete with financial intermediaries, such as FinTech companies, consumer finance companies, mortgage banking companies, insurance companies, securities firms, mutual funds and several government agencies as well as major retailers, all actively engaged in providing various types of loans and other financial services. Our largest banking competitors in Florida and the Southeast include Truist, JPMorgan Chase, PNC, Regions Bank, TD Bank, Wells Fargo, Bank of America, First Horizon, Synovus, and a number of community banks. In the Tri-State market, we also compete with, in addition to the national and international financial institutions listed above, Capital One, Valley National Bank, M&T Bank and numerous community banks.
Interest rates on both loans and deposits and prices of fee-based services are significant competitive factors among financial institutions generally. Other important competitive factors include convenience, quality of customer service, availability and quality of digital offerings, community reputation, continuity of personnel and services, and, in the case of larger commercial customers, relative lending limits and ability to offer sophisticated cash management and other commercial banking services. While we continue to provide competitive interest rates on both depository and lending products, we believe that we can compete most successfully by focusing on the financial needs of growing companies and small and middle-market businesses, offering them a broad range of personalized services, digital platforms and sophisticated cash management tools tailored to their businesses.
Regulation and Supervision
The U.S. banking industry is highly regulated under federal and state law. These regulations have a material effect on the operations of BankUnited, Inc. and its direct and indirect subsidiaries.
Statutes, regulations and policies limit the activities in which we may engage and the conduct of our permitted activities and establish capital requirements with which we must comply. The regulatory framework is intended primarily for the protection of depositors, borrowers, customers and clients, the FDIC deposit insurance fund and the banking system as a whole, and not for the protection of our stockholders or creditors. In many cases, the applicable regulatory authorities have broad enforcement power over BHCs, banks and their subsidiaries, including the power to impose substantial monetary fines and other penalties for violations of laws and regulations or engaging in unsafe and unsound banking practices. Further, the regulatory system imposes reporting and information collection obligations. We incur significant costs related to compliance with these laws and regulations.
The material statutory and regulatory requirements that are applicable to us are summarized below. The description below is not intended to summarize all laws and regulations applicable to us and is qualified in its entirety by reference to the full text of the statutes, regulations, policies and other written guidance that are described.
Bank and Bank Holding Company Regulation
BankUnited is a national bank. As a national bank organized under the National Bank Act, BankUnited is subject to ongoing and comprehensive supervision, regulation, examination and enforcement by the OCC.
Any entity that directly or indirectly controls a national bank must be approved by the Federal Reserve Board under the BHC Act to become a BHC. BHCs are subject to regulation, inspection, supervision and enforcement by the Federal Reserve Board under the BHC Act. The Federal Reserve Board's jurisdiction also extends to any company that is directly or indirectly controlled by a BHC.
BankUnited, Inc., which controls BankUnited, is a BHC and, as such, is subject to ongoing and comprehensive supervision, regulation, inspection and enforcement by the Federal Reserve Board.
Broad Supervision, Examination and Enforcement Powers
A principal objective of the U.S. bank regulatory system is to protect depositors by ensuring the financial safety and soundness of banking organizations. To that end, the banking regulators have broad regulatory, examination and enforcement
3
authority. The regulators regularly examine the operations of banking organizations. In addition, banking organizations are subject to periodic reporting requirements.
The regulators have various remedies available if they determine that the financial condition, capital resources, asset quality, earnings prospects, management, liquidity, sensitivity to market risk, compliance or other aspects of a banking organization's operations are less than satisfactory, or that the banking organization is operating in an unsafe or unsound manner. The regulators may also take action if they determine that the banking organization or its management is violating or has violated any law or regulation. The regulators have the power to, among other things:
•enjoin "unsafe or unsound" practices;
•require affirmative actions to correct any violation or practice;
•issue administrative orders that can be judicially enforced;
•refer significant compliance violations to the U.S. Justice Department;
•direct increases in capital;
•direct the sale of subsidiaries or other assets;
•limit dividends and distributions;
•restrict growth;
•assess civil monetary penalties;
•remove officers and directors;
•terminate deposit insurance; and
•appoint a conservator or receiver.
Engaging in unsafe or unsound practices or failing to comply with applicable laws, regulations and supervisory agreements could subject BankUnited, Inc., the Bank and their subsidiaries or their officers, directors and institution-affiliated parties to the remedies described above and other sanctions. In addition, the FDIC may terminate a depository institution's deposit insurance upon a finding that the institution's financial condition is unsafe or unsound or that the institution has engaged in unsafe or unsound practices or has violated any applicable rule, regulation, order or condition enacted or imposed by the institution's regulatory agency.
Notice and Approval Requirements Related to Control
BankUnited, Inc. must generally receive bank regulatory approval before it can acquire a financial institution. Specifically, as a BHC, BankUnited, Inc. must obtain prior approval of the Federal Reserve in connection with any acquisition that would result in BankUnited, Inc. acquiring substantially all the assets, or owning or controlling 5% or more of any class of voting securities, of a bank or another BHC. The statutory factors that the Federal Reserve is required to consider in considering an application include the financial and managerial resources of the parties and the future prospects of the combined organization, the effects of the transaction on competition, the convenience and needs of the community, including the record of performance of the parties under the CRA, the effectiveness of the acquiring company in combating money-laundering activities and the impact of the transaction on the financial stability of the U.S. banking or financial system.
In addition, federal and state banking laws impose notice, approval, and ongoing regulatory requirements on any stockholder or other party that seeks to acquire direct or indirect "control" of an FDIC-insured depository institution or BHC. These laws include the BHC Act and the Change in Bank Control Act. Among other things, these laws require regulatory filings by individuals or companies that seek to acquire direct or indirect "control" of an FDIC-insured depository institution. The determination of whether an investor "controls" a depository institution is based on all of the facts and circumstances surrounding the investment. As a general matter, a party is deemed to control a depository institution or other company if the party owns or controls 25% or more of any class of voting stock. Subject to rebuttal, a party may be presumed to control a depository institution or other company if the investor owns or controls 10% or more of any class of voting stock.
The BHC Act prohibits any entity from acquiring 25% (as noted above, the BHC Act has a lower limit for acquirers that are existing BHCs) or more of a BHC’s or bank’s voting securities, or otherwise obtaining control or a controlling influence over a BHC or bank without the approval of the Federal Reserve. The Federal Reserve has rule-based standards for determining whether one company has control over another. These rules established four categories of tiered presumptions of non-control
4
that are based on the percentage of voting shares held by the investor (less than 5%, 5-9.9%, 10-14.9% and 15-24.9%) and the presence of other indicia of control. As the percentage of ownership increases, fewer indicia of control are permitted without falling outside of the presumption of non-control. These indicia of control include nonvoting equity ownership, director representation, management interlocks, business relationships and restrictive contractual covenants. Investors can hold up to 24.9% of the voting securities and 33% of the total equity of a company without necessarily having a controlling influence.
Permissible Activities and Investments
Banking laws generally restrict the ability of BankUnited, Inc. to engage in activities other than those determined by the Federal Reserve Board to be so closely related to banking or managing or controlling banks as to be a proper incident thereto. The GLB Act expanded the scope of permissible activities for a BHC that qualifies as a financial holding company. Under the regulations implementing the GLB Act, a financial holding company may engage in additional activities that are financial in nature or incidental or complementary to a financial activity. BankUnited, Inc. is not a financial holding company.
In addition, as a general matter, the establishment or acquisition by BankUnited, Inc. of a non-bank entity, or the initiation of a non-banking activity, requires prior regulatory approval. In approving acquisitions or the addition of activities, the Federal Reserve Board considers, among other things, whether the acquisition or the additional activities can reasonably be expected to produce benefits to the public, such as greater convenience, increased competition or gains in efficiency, that outweigh such possible adverse effects as undue concentration of resources, decreased or unfair competition, conflicts of interest or unsound banking practices.
Regulatory Capital Requirements and Capital Adequacy
The federal bank regulators view capital levels as important indicators of an institution's financial soundness. As a general matter, FDIC-insured depository institutions and their holding companies are required to maintain minimum capital relative to the amount and types of assets they hold. The final supervisory determination on an institution's capital adequacy is based on the regulator's assessment of numerous factors. Both BankUnited, Inc. and BankUnited are subject to regulatory capital requirements.
The Federal Reserve Board has established risk-based and leverage capital guidelines for BHCs, including BankUnited, Inc. The OCC has established substantially similar risk-based and leverage capital guidelines applicable to national banks, including BankUnited. BankUnited, Inc. and BankUnited are subject to capital rules implemented under the framework promulgated by the International Basel Committee on Banking Supervision (the "Basel III Capital Rules"). While some provisions of the rules are tailored to larger institutions, the Basel III Capital Rules generally apply to all U.S. banking organizations, including BankUnited, Inc. and BankUnited.
The Basel III Capital Rules provide for the following minimum capital to risk-weighted assets ratios to be considered adequately capitalized:
(i)4.5% based upon CET1;
(ii)6.0% based upon tier 1 capital; and
(iii)8.0% based upon total regulatory capital.
The Basel III Capital Rules require institutions to retain a capital conservation buffer of 2.5% above these required minimum capital ratio levels. A minimum leverage ratio (tier 1 capital as a percentage of average total assets) of 4.0% is also required under the Basel III Capital Rules.
Banking organizations that fail to maintain the minimum required capital conservation buffer could face restrictions on capital distributions or discretionary bonus payments to executive officers, with distributions and discretionary bonus payments being completely prohibited if no capital conservation buffer exists, or in the event of the following: (i) the banking organization's capital conservation buffer was below 2.5% at the beginning of a quarter; and (ii) its cumulative net income for the most recent quarterly period plus the preceding four calendar quarters is less than its cumulative capital distributions (as well as associated tax effects not already reflected in net income) during the same measurement period. Further, the federal bank regulatory agencies may set higher capital requirements for an individual BHC or bank when circumstances warrant it.
The Federal Reserve, OCC and FDIC have issued a proposed rule to implement wide-ranging and significant changes to the current U.S. Basel III capital rules. Generally, the proposed rules would increase capital requirements and risk-weighted assets for Category I - IV banking organizations (generally banking organizations with $100 billion or more in total assets). The proposed rules include, among other provisions, changes to the calculation of RWA that would replace the current Advanced Approaches with an Expanded Risk-based Approach with respect to credit, market, operational and CVA risk, apply a new
5
Output Floor, and extend the countercyclical capital buffer and Supplementary Leverage Ratio to Category IV banking organizations. The proposed rules would also lower the threshold for recognition of AOCI in CET1 capital, lower limits on recognition of minority interests and lower capital deduction thresholds for Category III and IV banking organizations. Generally, these rules, if enacted as proposed, are not expected to apply directly to the Company, whose total assets are less than $100 billion; however, the impact of the proposed rules, if enacted, on the banking system and regulatory environment more broadly could indirectly impact the Company.
Prompt Corrective Action
Under the FDIA, the federal bank regulatory agencies must take "prompt corrective action" against undercapitalized U.S. depository institutions. U.S. depository institutions are assigned one of five capital categories: "well capitalized," "adequately capitalized," "undercapitalized," "significantly undercapitalized," and "critically undercapitalized," and are subjected to differential regulation corresponding to the capital category within which the institution falls. A depository institution is deemed to be "well capitalized" if the banking institution has a total risk-based capital ratio of 10.0% or greater, a tier 1 risk-based capital ratio of 8.0% or greater, a CET1 risk-based capital ratio of 6.5% and a leverage ratio of 5.0% or greater, and the institution is not subject to an order, written agreement, capital directive or prompt corrective action directive to meet and maintain a specific level for any capital measure. Under certain circumstances, a well-capitalized, adequately capitalized or undercapitalized institution may be treated as if the institution were in the next lower capital category. A banking institution that is undercapitalized is required to submit a capital restoration plan. Failure to meet capital guidelines could subject the institution to a variety of enforcement remedies by federal bank regulatory agencies, including termination of deposit insurance by the FDIC, restrictions on certain business activities, and appointment of the FDIC as conservator or receiver. As of December 31, 2023, BankUnited, Inc. and BankUnited were well-capitalized.
Source of strength
All companies, including BHCs, that directly or indirectly control an insured depository institution, are required to serve as a source of financial and managerial strength for the depository institution. Under this requirement, BankUnited, Inc. in the future could be required to provide financial assistance to BankUnited should it experience financial distress. Such support may be required at times when, absent this statutory and Federal Reserve requirement, a BHC may not be inclined to provide it.
Under the prompt corrective action provisions, if a controlled bank is undercapitalized, then the regulators could require its BHC to guarantee a capital restoration plan. In addition, if the Federal Reserve believes that a BHC’s activities, assets or affiliates represent a significant risk to the financial safety, soundness or stability of a controlled bank, then the Federal Reserve could require the BHC to terminate the activities, liquidate the assets or divest the affiliates. Currently, the Company has no material activities, assets or affiliates other than those attributable to its ownership of the Bank.
Regulatory Limits on Dividends and Distributions
Federal law currently imposes limitations upon certain capital distributions by national banks, such as certain cash dividends, payments to repurchase or otherwise acquire its shares, payments to stockholders of another institution in a cash-out merger and other distributions charged against capital. The Federal Reserve Board and OCC regulate all capital distributions by BankUnited directly or indirectly to BankUnited, Inc., including dividend payments.
BankUnited may not pay dividends to BankUnited, Inc. if, after paying those dividends, it would fail to meet the required minimum levels under risk-based capital guidelines and the minimum leverage capital ratio requirements, or in the event the OCC notified BankUnited that it was in need of more than normal supervision. Under the FDIA, an insured depository institution such as BankUnited is prohibited from making capital distributions, including the payment of dividends, if, after making such distribution, the institution would become "undercapitalized." Payment of dividends by BankUnited also may be restricted at any time at the discretion of the appropriate regulator if it deems the payment to constitute an unsafe and unsound banking practice.
BankUnited is subject to supervisory limits on its ability to declare or pay a dividend or reduce its capital unless certain conditions are satisfied.
In addition, it is the policy of the Federal Reserve Board that BHCs should pay cash dividends on common stock only out of income available over the past year and only if prospective earnings retention is consistent with the organization’s expected future needs and financial condition. The policy provides that BHCs should not maintain a level of cash dividends that undermines the BHC’s ability to serve as a source of strength to its banking subsidiaries. As a Delaware corporation, BankUnited, Inc. is also subject to certain limitations and restrictions under Delaware corporate law with respect to payment of dividends and other distributions.
6
Limits on Transactions with Affiliates and Insiders
Insured depository institutions are subject to restrictions on their ability to conduct transactions with affiliates and other related parties. Section 23A of the Federal Reserve Act imposes quantitative limits, qualitative requirements, and collateral requirements on certain transactions by an insured depository institution with, or for the benefit of, its affiliates. Transactions covered by Section 23A include loans, extensions of credit, investment in securities issued by an affiliate, and acquisitions of assets from an affiliate. Section 23B of the Federal Reserve Act requires that most types of transactions by an insured depository institution with, or for the benefit of, an affiliate be on terms at least as favorable to the insured depository institution as if the transaction were conducted with an unaffiliated third party. The Dodd-Frank Act generally enhances the restrictions on transactions with affiliates, including an expansion of what types of transactions are covered to include credit exposures related to derivatives, repurchase agreements and securities lending arrangements.
The Federal Reserve Board's Regulation O and OCC regulations impose restrictions and procedural requirements in connection with the extension of credit by an insured depository institution to directors, executive officers, principal stockholders and their related interests.
Examination Fees
The OCC charges fees to recover the costs of examining national banks, processing applications and other filings, and covering direct and indirect expenses in regulating national banks. Various regulatory agencies have the authority to assess additional supervision fees.
FDIC Deposit Insurance
The FDIC is an independent federal agency that insures the deposits of federally insured depository institutions up to applicable limits. The FDIC also has certain regulatory, examination and enforcement powers with respect to FDIC-insured institutions. The deposits of BankUnited are insured by the FDIC up to applicable limits. As a general matter, the maximum deposit insurance amount is $250,000 per depositor.
Additionally, FDIC-insured depository institutions are required to pay deposit insurance assessments to the FDIC deposit insurance fund. The amount of a particular institution's deposit insurance assessment is based on that institution's risk classification under an FDIC risk-based assessment system. An institution's risk classification is assigned based on its capital levels and the level of supervisory concern the institution poses to the regulators.
The FDIC has authority to raise or lower assessment rates on insured deposits in order to achieve statutorily required reserve ratios in the DIF and to impose special additional assessments.
In November 2023, in the aftermath of certain bank failures earlier in 2023, the FDIC approved a final rule to implement a special assessment based on the amount of uninsured deposits reported in the banks' December 31, 2022 Call Reports. The special assessment will be collected for an anticipated eight quarterly assessment periods beginning in 2024. During the fourth quarter of 2023, the Bank recorded the entire special assessment levied of $35.4 million. There is a risk that BankUnited’s deposit insurance premiums will further increase if additional failures of insured depository institutions further deplete the DIF or if the FDIC changes its view of the risk BankUnited poses to the DIF or otherwise increases the assessment rate adjustment applicable to BankUnited’s deposits.
Depositor Preference
The FDIA provides that, in the event of the "liquidation or other resolution" of an insured depository institution, the claims of depositors of the institution (including the claims of the FDIC as subrogee of insured depositors) and certain claims for administrative expenses of the FDIC as a receiver will have priority over other general unsecured claims against the institution. Insured and uninsured depositors, along with the FDIC, will have priority in payment ahead of unsecured, non-deposit creditors, including BankUnited, Inc., with respect to any extensions of credit they have made to such insured depository institution.
Federal Reserve System and Federal Home Loan Bank System
As a national bank, BankUnited is required to hold shares of capital stock in a Federal Reserve Bank. BankUnited holds capital stock in the Federal Reserve Bank of Atlanta. As a member of the Federal Reserve System, BankUnited has access to the Federal Reserve discount window lending and payment clearing systems. Pursuant to the regulations of the Federal Reserve, all banks, including BankUnited, are required to maintain average daily reserves at mandated ratios against their transaction accounts. In addition, reserves must be maintained on certain non-personal time deposits. This reserve requirement may be met by holding cash in banking offices or on deposit at a Federal Reserve Bank.
7
BankUnited is a member of the Federal Home Loan Bank of Atlanta. Each FHLB provides a central credit facility primarily for its member institutions, as well as other entities involved in home mortgage lending. Any advances from an FHLB must be secured by specified types of collateral. As a member of the FHLB, BankUnited is required to acquire and hold shares of capital stock in the FHLB of Atlanta. BankUnited is in compliance with this requirement.
Anti-Money Laundering and OFAC
Under federal law, financial institutions must maintain anti-money laundering programs that include established internal policies, procedures and controls; a designated compliance officer; an ongoing employee training program; a risk-based customer due diligence program; and testing of the program by an independent audit function. Financial institutions are also prohibited from entering into specified financial transactions and account relationships and must meet enhanced standards for due diligence, customer identification and recordkeeping, including in their dealings with non-U.S. financial institutions and non-U.S. customers. Financial institutions must take reasonable steps to conduct enhanced scrutiny of account relationships to guard against money laundering and to report any suspicious transactions, and law enforcement authorities have been granted increased access to financial information maintained by financial institutions. Bank regulators routinely examine institutions for compliance with these obligations and they must consider an institution's compliance in connection with the regulatory review of applications, including applications for banking mergers and acquisitions. The regulatory authorities have imposed "cease and desist" orders and civil money penalty sanctions against institutions found to be violating these obligations.
The U.S. Department of the Treasury's OFAC is responsible for helping to ensure that U.S. entities do not engage in transactions with certain prohibited parties, as defined by various Executive Orders and Acts of Congress. The OFAC publishes lists of persons, organizations, and countries suspected of money laundering or aiding, harboring or engaging in terrorist acts, known as Specially Designated Nationals and Blocked Persons. If BankUnited, Inc. or BankUnited finds a name on any transaction, account or wire transfer that is an affirmative match to one on an OFAC list, BankUnited, Inc. or BankUnited must freeze or block such account or transaction, file a suspicious activity report and notify the appropriate authorities.
Consumer Laws and Regulations
Banking organizations are subject to numerous laws and regulations intended to protect consumers. These laws include, among others:
•Truth in Lending Act;
•Truth in Savings Act;
•Electronic Funds Transfer Act;
•Expedited Funds Availability Act;
•Equal Credit Opportunity Act;
•Fair and Accurate Credit Transactions Act;
•Fair Housing Act;
•Fair Credit Reporting Act;
•Gramm-Leach-Bliley Act;
•Home Mortgage Disclosure Act;
•Right to Financial Privacy Act;
•Real Estate Settlement Procedures Act;
•laws regarding unfair and deceptive acts and practices; and
•usury laws.
Many states and local jurisdictions have consumer protection laws analogous to, and in addition to, those listed above. These federal, state and local laws regulate the manner in which financial institutions deal with customers when taking deposits, making loans, or conducting other types of transactions. Failure to comply with these laws and regulations could give rise to regulatory sanctions, customer rescission rights, action by state and local attorneys general, and civil or criminal liability.
8
Privacy and Information Security
Banking organizations are subject to many federal and state laws and regulations governing the collection, use and protection of customer information. For example, the Gramm-Leach-Bliley Act requires BankUnited to disclose its privacy policies and practices relating to sharing nonpublic customer information and enables retail customers to opt out of our ability to share information with unaffiliated third parties under certain circumstances. Other federal and state laws and regulations impact our ability to share certain information with affiliates and non-affiliates for marketing and/or non-marketing purposes, or to contact customers with marketing offers. The Gramm-Leach-Bliley Act also requires BankUnited to implement a comprehensive information security program that includes administrative, technical and physical safeguards to ensure the security and confidentiality of customer records and information.
CFPB
The CFPB is tasked with establishing and implementing rules and regulations under certain federal consumer protection laws with respect to the conduct of providers of certain consumer financial products and services. The CFPB has rulemaking authority over many of the statutes governing products and services offered to bank and thrift consumers. For banking organizations with assets of $10 billion or more, such as BankUnited, Inc. and the Bank, the CFPB has exclusive rule making and examination, and primary enforcement authority under certain federal consumer protection financial laws. In addition, states are permitted to adopt consumer protection laws and regulations that are stricter than those regulations promulgated by the CFPB.
The Community Reinvestment Act
The CRA is intended to encourage banks to help meet the credit needs of their service areas, including low and moderate-income neighborhoods, consistent with safe and sound operations. The federal bank regulators examine and assign each bank a public CRA rating.
The CRA requires federal bank regulators to take into account the bank's record in meeting the needs of its service area when considering an application by a bank to establish or relocate a branch or to conduct certain mergers or acquisitions. The Federal Reserve Board is required to consider the CRA performance of a BHC's controlled banks when considering an application by the BHC to acquire a banking organization or to merge with another BHC. If BankUnited, Inc. or BankUnited applies for regulatory approval to make certain investments, the regulators will consider the CRA record of target institutions and BankUnited, Inc.'s depository institution subsidiaries. A less than satisfactory CRA rating could substantially delay approval or result in denial of an application. The regulatory agency's assessment of the institution's CRA performance is made available to the public. Following its most recent CRA performance evaluation in October 2021, BankUnited received an overall rating of "Satisfactory."
Human Capital Resources
At December 31, 2023, we had 1,588 full-time employees and 28 part-time employees. None of our employees are parties to a collective bargaining agreement. We believe that our employees are our greatest asset and vital to our success. As such, we seek to hire and retain the best candidate for each position, without regard to age, gender, ethnicity, or other protected trait, but with an appreciation for a diversity of perspectives and experience. We have designed a compensation structure including an array of benefit plans and programs that we believe is attractive to our current and prospective employees. We have a Company sponsored 401(k) Retirement Savings Program, a tuition reimbursement program, flexible spending accounts and health savings accounts with Company contributions. BankUnited offers paid time off, paid parental leave for male and female employees, paid holidays, flexible work schedules and hybrid and remote job opportunities for some positions.
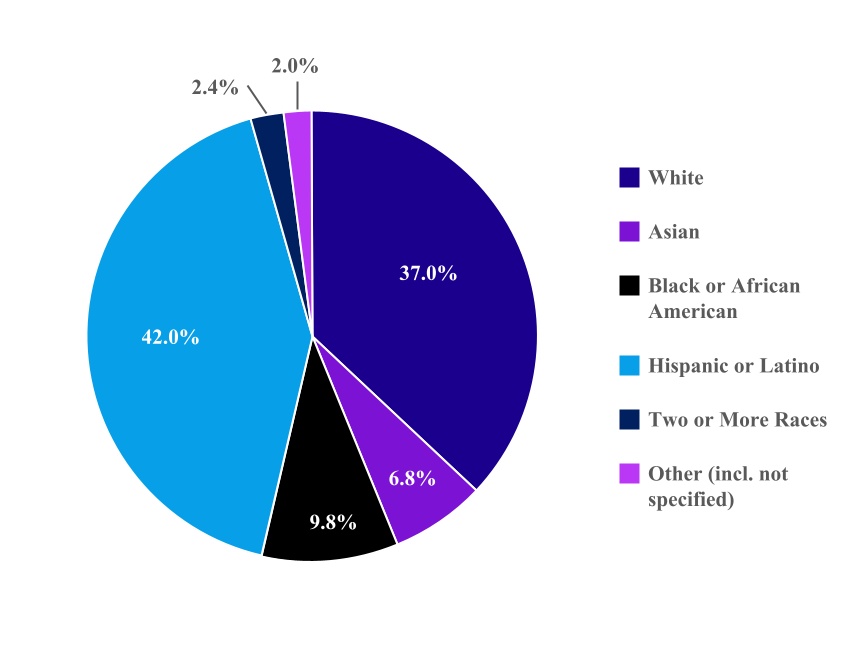
Diversity, Equity and Inclusion
Our goal is to create a safe, diverse and inclusive workplace where individuals are valued, feel free to express themselves, are empowered to succeed and are able to grow both personally and professionally. At December 31, 2023, 40% of the members of our Board of Directors were female and 40% were of diverse nationality or ethnicity. Approximately 56% of our workforce was female. We offer diversity and inclusion training to all of our employees.
9
The following chart illustrates the diversity of our workforce at December 31, 2023:
| Diverse Workforce | ||
iCARE™
Under the umbrella of our iCARE™ ("Inclusive Community of Advocacy, Respect and Equality") initiative, we have a number of programs intended to foster a culture that promotes employee engagement in social justice, equal access, community development and opportunity. Our iCARE™ Council, consisting of 15 employees with diverse backgrounds and perspectives across different divisions in our organization, oversees the continued evolution of iCARE™ and 17 employees serving as iCARE™ ambassadors promote engagement in iCARE™ programs across the organization. Employees are encouraged to participate in interactive events, cultural celebrations, an enterprise-wide mentorship program and volunteer opportunities. In 2023, our employees reported a total of 3,501 volunteer hours, up 32% from 2022, serving 128 community organizations. Our employees are given paid time to participate in community volunteer opportunities.
BankUnited has partnered with six universities in our local markets to provide scholarships, internship, and other educational programs, with a primary focus on minority high school and college students. Since the inception of these initiatives in 2020, 109 college and high school students have participated and 36 of them have been hired for full time roles at the Bank. Through BankUnited's exclusive partnership with Florida International University, the ATOM Pink Tank program, a six-month leadership, mentorship, and research development program was created to empower female students pursuing STEM careers. The Pink Tank participants receive weekly guidance and mentorship by BankUnited employees throughout the ten-week research and competition stage. The students connect with BankUnited professionals of all levels and disciplines. Since the inception of this initiative, 46 students have completed the program and 20 new students have been selected for the 2023-2024 cohort. To date, BankUnited has hired seven female students and garnered participation of over 55 BankUnited employees representing 20 departments across the Bank.
Through iCARE™ we engage and encourage our employees to participate in various Bank sponsored community programs and events. These community programs include BankUnited's "Adopt A Neighborhood" in Florida focused on providing support to under-served predominantly minority communities, the "Entrepreneurship Program" in New York where we provide workforce development in partnership with a local university, and the "Heir’s Program" where we brought together a consortium of expertise to provide legal services and education to predominantly minority families seeking to maintain property in family lineage. The Bank also launched the iCARE™ Ventures program to support, promote and strengthen local entrepreneurship and small business growth to minority owned businesses in our community.
10
Health, Wellness and Safety
Our award-winning Wellness Program incorporates initiatives that address the mental, physical, intellectual, occupational, social, emotional, financial and spiritual components of wellness. The BankUnited Corporate Center has an on-site fitness facility and we provide our employees with on-site health screenings, eye exams, dental exams, mammograms, and vaccine clinics. Employees can choose to participate in nutrition counseling, music and art therapy, live and streaming fitness classes, meditation sessions, live and virtual learning opportunities with area wellness experts. We offer safety programs including first aid and CPR courses. For participation in our Wellness Program, we offer our employees a reduced premium rate for medical insurance coverage.
In recognition of our employee wellness programs, BankUnited received the Healthiest Employer Award from the South Florida Business Journal in 2021 and 2022. In 2023, BankUnited was listed as number one among America's Top 100 Healthiest Employers by Springbuk HR Technology, and was awarded the Worksite Wellness Award by the Florida Department of Health in 2021.
Career Growth and Development
Our Go for More™ Academy provides an extensive menu of training and resources that enable employees to develop their skills and that promote collaboration and career development. Our Rising Leaders, Situational Leadership and EXCELerate programs provide our employees with career development opportunities. Through our Discover Coaching program, we offer a personalized approach where employees meet one-on-one with an internal coach to promote individual growth, skill development, leadership development, and problem solving. A total of 204 employees participated and completed these programs in 2023. We believe mentoring is key to career growth and development. In 2023 280 employees enrolled in our mentoring programs and a total of 1,247 mentoring hours were reported. Our employees rated their overall mentorship program satisfaction with a score of 4.7 stars out of 5 stars.
Communication & Engagement
Employee engagement is a key contributor to our success. The Company solicits employee feedback through periodic employee engagement surveys conducted by an outside firm. 81% of employees participated in our last engagement survey and 81% of participants responded favorably to questions designed to gauge the level of overall engagement. The 81% overall engagement score favorably compared to an industry benchmark of 76%. The Company schedules regular CEO update video calls, town hall meetings and other engagement programs. In 2023, we launched the Leadership Chat Series, a live and interactive webinar with BankUnited executives and our employees. Our Kudos Employee Recognition platform encourages employees to recognize one another's contributions and accomplishments.
Available Information
Our website address is www.bankunited.com. Our electronic filings with the SEC (including all Annual Reports on Form 10-K, Quarterly Reports on Form 10-Q, Current Reports on Form 8-K, and if applicable, amendments to those reports) are available free of charge on the website as soon as reasonably practicable after they are electronically filed with, or furnished to, the SEC. The information posted on our website is not incorporated into this Annual Report. In addition, the SEC maintains a website that contains reports and other information filed with the SEC. The website can be accessed at http://www.sec.gov.
Item 1A. Risk Factors
An investment in our common stock is subject to risks inherent in our business. The material risks and uncertainties that management believes affect us are described below. Before making an investment decision, you should carefully consider the risks and uncertainties described below, together with all of the other information included or incorporated by reference herein. The risks and uncertainties described below are not the only ones facing us. Additional risks and uncertainties that management is not aware of or focused on or that management currently deems immaterial may also impair our business operations. If any of the events described in the risk factors should actually occur, our financial condition, results of operations and the value of our securities could be materially and adversely affected.
Strategic Risk
We may not realize the expected benefits of our business strategy.
Our fundamental business strategy is centered on building a leading regional commercial and small business bank, focused on relationship-based granular and diversified business on both sides of the balance sheet. Our near-term strategic priorities include (i) improving the funding mix, primarily by growing core deposits, while maintaining ample liquidity; (ii) improving risk adjusted returns by re-positioning the balance sheet away from typically lower yielding transactional business such as
11
residential mortgages and securities and organically growing core commercial loans, which are generally higher-yielding, as a percentage of the portfolio; (iii) managing credit quality; (iv) managing the rate of increase in expenses; and (v) maintaining robust capital levels. Our ability to execute on these strategic priorities depends on a number of factors, many of which are outside of our direct control. Some of the factors that will impact our ability to execute on our strategic priorities are (i) our ability to attract and retain talent; (ii) competition in our markets; (iii) fiscal and monetary policy and the macro-economic environment; (iv) the health of our primary markets; and (v) the availability and cost of capital. There is no guarantee that we will be able to successfully execute our strategic plans and fundamental business strategy.
While acquisitions have not historically been a primary component of our business strategy, we may opportunistically consider potential acquisitions of financial institutions and complementary non-bank businesses. There are risks that may inhibit our ability to successfully execute such acquisitions, such as competition with other potential acquirers, the ability to obtain the required regulatory approvals in a timely matter or at all, the availability of capital and the successful integration of a consummated acquisition and realization of the expected benefits.
We face significant competition from other financial institutions and financial services providers, which may adversely impact our ability to execute on strategic objectives, our growth or profitability.
Although our geographic presence is expanding, our business is currently concentrated in Florida and the New York tri-state area. Commercial and consumer banking in these markets is highly competitive. Our markets contain not only a large number of community and regional banks, but also a significant presence of the country's largest commercial banks. We compete with other state and national banks as well as savings and loan associations, savings banks and credit unions located in our markets as well as those targeting our markets digitally for deposits and loans. In addition, we compete with financial intermediaries, such as FinTech companies, consumer finance companies, marketplace lenders, mortgage banking companies, insurance companies, securities firms, mutual funds and several government agencies as well as major retailers, all actively engaged in providing various types of financial services. The variety of entities providing financial services to businesses and consumers, as well as the technologies and delivery channels through which those services are provided are rapidly evolving.
The financial services industry is likely to become even more competitive as a result of legislative, regulatory and technological changes and continued consolidation. Increased competition among financial services companies may adversely affect our ability to market our products and services. Technology has lowered barriers to entry and made it possible for financial services providers to compete in our markets without a physical footprint and enabled non-bank providers to offer products and services traditionally provided by banks. Many of our competitors have fewer regulatory constraints and may have lower cost structures. Additionally, due to their size or particular technology capabilities, many competitors may offer a broader range of products and services or may be able to offer better pricing for certain products and services than we can.
Our ability to compete successfully depends on a number of factors, including but not limited to (i) the ability to develop, maintain and build upon long-term customer relationships; (ii) our ability to pro-actively and quickly respond to technological change and emerging or unanticipated innovations in financial services; (iii) our ability to attract and retain talent; (iv) our ability to expand our market position or successfully enter new markets; (v) the scope, relevance and pricing of our products and services and our ability to respond quickly to changing customer preferences; (vi) the rate at which we introduce new products and services relative to our competitors; (vii) customer satisfaction with our level of service; and (viii) industry and general economic trends.
Failure to perform well in any of these areas or in general to successfully respond to the competitive pressures we face could make it harder for us to attract and retain customers and significantly weaken our competitive position, which could adversely affect our ability to achieve strategic objectives, our growth and profitability, which, in turn, could harm our business, financial condition and results of operations.
Hurricanes and other weather-related events, social or health-care crises such as pandemics, political or social unrest, geopolitical conflict, terrorist activity, or other natural or man-made disasters could cause a disruption in our operations or otherwise have an adverse impact on our customers, our business and results of operations.
Our geographic markets in Florida and other coastal areas are particularly susceptible to severe weather, including hurricanes, flooding and damaging winds. The occurrence of a hurricane or other natural disaster, a man-made catastrophe such as terrorist activity, pandemic outbreaks and other global health emergencies, political or social unrest, government shutdowns, geopolitical conflicts such as those currently occurring in the middle east or Ukraine or other man-made or natural disasters could disrupt our operations or those of our clients or our work-force, result in damage to our facilities, jeopardize our ability to continue to provide essential services to our customers and negatively affect our customers and the local economies in which we operate. These events may lead to a decline in loan originations, an increase in deposit outflows, strain our liquidity position, reduce or destroy the value of collateral for our loans, particularly real estate, negatively impact the business
12
operations of our customers, and cause an increase in delinquencies, foreclosures and loan losses. Our business, financial condition and results of operations may be materially, adversely impacted by these and other negative effects of such events.
Both physical and transitional risks related to climate change or societal and governmental responses to climate change could adversely affect our business and performance, including indirectly through impacts on our customers.
Concerns over the long-term impacts of climate change have led and will continue to lead to governmental efforts to mitigate those impacts. Consumers and businesses may change their behavior as a result of these concerns. We and our customers may need to respond to new laws and regulations as well as consumer and business preferences resulting from climate change concerns. We and our customers may face cost increases, asset value reductions and operating process changes. The impact on our customers will likely vary depending on their specific attributes, including reliance on or role in carbon intensive activities. Among the impacts to us could be a drop in demand for our products and services, particularly in certain sectors. In addition, we could face reductions in creditworthiness on the part of some customers or in the value of assets securing loans. In particular, our clients' operations may be adversely impacted by the rising cost of property and casualty insurance related to physical risks brought on by climate change. Our efforts to take these risks into account in making lending and other decisions, including by increasing our business with climate-friendly companies and reducing our exposure to the fossil fuel sector, may not be effective in protecting us from the negative impact of new laws and regulations or changes in consumer or business behavior. One of our primary market areas is the state of Florida, particularly in coastal areas; as such, we may have an increased vulnerability to the ultimate impacts of climate change as compared to some of our competitors.
We depend on our executive officers and other key personnel to execute our long-term business strategy and could be harmed by the loss of their services or the inability to attract new talent.
We believe that our continued growth and future success will depend in large part on the skills of our senior management team and other key personnel. We believe our senior management team possesses valuable knowledge about and experience in the banking industry that could be challenging to replicate. The composition of our senior management team and our other key personnel may change over time. Although our Chairman, President and Chief Executive Officer has entered into an employment agreement with us, he may not complete the term of his employment agreement or renew upon expiration. Other members of our senior management team are not subject to employment agreements. Our Board of Directors and senior management team are actively engaged in ongoing succession planning, however, our succession planning efforts may not be adequate to ensure continuity of qualified senior management. Our success also depends on the experience of other key personnel and on their relationships with the customers and communities they serve. The loss of service of one or more of our executive officers or key personnel, or the inability to recruit and retain qualified personnel in the future, could have an adverse effect on our business, financial condition or operating results.
Evolving expectations of investors, customers, regulators and employees with respect to our ESG practices and those of our customers may impose additional costs on us, impact our reputation in the market or expose us to emerging risks.
There is an evolving focus, including from some governmental organizations and agencies, investors, customers and employees on ESG issues such as environmental stewardship, climate change, diversity and inclusion, racial justice and workplace culture and conduct. We have expended and may further expend resources to monitor, adopt and report on policies and practices that we believe will improve execution of our evolving ESG objectives, and compliance with third party imposed ESG-related requirements and expectations, including potential new SEC disclosure requirements. If our ESG practices do not meet evolving rules and regulations or investor or other stakeholder expectations, then our reputation or our ability to attract or retain employees, customers and investors could be negatively impacted. Similarly, our failure or perceived failure to pursue or fulfill our current or future objectives or to satisfy various reporting standards within acceptable timelines, or at all, could have similar negative impacts.
In addition, organizations that provide information to investors on corporate governance and related matters have developed ratings processes for evaluating companies on their approach to ESG matters; if the Company were to receive unfavorable ratings, negative investor sentiment, stock price fluctuations and the diversion of investment to other companies could result.
The high profile 2023 failures of several regional banks and attendant events impacting the banking industry along with resulting media coverage eroded customer confidence in the banking system, particularly in regional and mid-size banks. We are subject to the risk of similar future events adversely impacting the banking industry broadly, and our Company.
The bank failures of 2023, surrounding events and related media coverage created significant market volatility and adversely impacted stock prices among publicly traded bank holding companies and, in particular, regional institutions like the Company. These developments negatively impacted customer confidence in the safety and soundness of regional banks and led some depositors to transfer deposits to the largest financial institutions. Many regional banks, including BankUnited, experienced higher than normal deposit outflows immediately following the first regional bank failures in March 2023. Future
13
unanticipated deposit outflows or erosion of customer or investor confidence brought on by external events could materially adversely impact the Company’s liquidity, net interest margin, business strategy, market valuation, capital and results of operations.
Future material adverse events, not necessarily limited to the circumstances leading to the 2023 bank failures, that impact other financial institutions could, as a result of rapid and broad public exposure, have a direct and material adverse impact on the Company's business, market valuation and results of operations.
A downgrade of our credit rating could increase our cost of capital or place limitations on business activities.
The major ratings agencies regularly evaluate us, and their ratings are based on a number of factors, including our financial strength and conditions affecting the financial services industry generally. In general, ratings agencies base their ratings on many quantitative and qualitative factors, including capital adequacy, liquidity, asset quality, business mix and level and quality of earnings, and we may not be able to maintain our current credit ratings. The ratings assigned to the Bank and the Company remain subject to change at any time, and it is possible that any ratings agency will take action to downgrade the Bank and the Company in the future. Additionally, ratings agencies may also make substantial changes to their ratings policies and practices, which may affect our credit ratings. A downgrade of our credit rating, particularly to a level below investment grade, could adversely impact the liquidity or value of our rated securities, our ability to access the capital or certain short-term funding markets, and our cost of capital. Additionally, certain commercial customers could be prohibited from placing deposits with us, impacting our liquidity position.
Credit Risk
As a lender, our business is highly susceptible to credit risk.
As a lender, we are exposed to the risk that our customers will be unable to repay their loans according to their terms and that the collateral securing the payment of their loans, if any, may be insufficient to ensure repayment. Credit losses are inherent in the business of making loans. We are also subject to credit risk that is embedded in our securities portfolio. Our credit risk management framework inclusive of our underwriting standards, procedures and policies may not prevent us from incurring substantial credit losses, particularly if economic or market conditions deteriorate. It is difficult to determine or forecast the many ways in which a decline in economic or market conditions may impact the credit quality of our assets.
Our ACL may not be adequate to cover actual credit losses.
We maintain an ACL that represents management's estimate of current expected credit losses, or the amount of amortized cost basis not expected to be collected, on our loan portfolio and the amount of credit loss impairment on our available for sale securities portfolio. Determining the amount of the ACL is complex and requires extensive judgment by management about matters that are inherently subjective and uncertain. The measurement of expected credit losses encompasses information about historical events, current conditions and reasonable and supportable economic forecasts. Factors that may be considered in determining the amount of the ACL include, but are not necessarily limited to, product or collateral type, industry, geography, internal risk rating, credit characteristics such as credit scores or collateral values, delinquency rates, historical or expected credit loss patterns and other quantitative and qualitative factors considered by management to have an impact on the adequacy of the ACL and the ability of borrowers to repay their loans. The adequacy of the ACL is also dependent on the effectiveness of the underlying models used in determining the estimate.
If management's assumptions and judgments prove to be incorrect, our credit loss models prove to be inaccurate or our processes and controls governing the determination of the amount of the ACL prove ineffective, our ACL may be insufficient and we may be required to increase our ACL. In addition, regulatory authorities periodically review our ACL and may require us to increase our provision for credit losses or recognize further loan charge-offs, based on judgments different from those of our management. Adverse economic conditions could make management's estimate even more complex and difficult to determine. Any increase in our ACL will result in a decrease in net income and capital and could have a material adverse effect on our financial condition and results of operations. See Item 7 "Management's Discussion and Analysis of Financial Condition and Results of Operations—Analysis of the Allowance for Credit Losses" and "Management's Discussion and Analysis of Financial Condition and Results of Operations—Critical Accounting Policies and Estimates—Allowance for Credit Losses."
We depend on the accuracy and completeness of information about clients and counterparties in making credit decisions.
In deciding whether to extend credit or enter into other transactions with clients and counterparties, we may rely on information furnished by or on behalf of clients and counterparties, including financial statements and other financial
14
information. We also may rely on representations of clients and counterparties as to the accuracy and completeness of that information and, with respect to financial statements, on reports of independent auditors.
The credit quality of our loan portfolio and results of operations are affected by residential and commercial real estate values and the level of residential and commercial real estate sales and rental activity.
A material portion of our loans are secured by residential or commercial real estate. The ability of our borrowers to repay their obligations and our financial results may therefore be adversely affected by changes in real estate values or in real estate market dynamics. Commercial real estate valuations in particular are highly subjective, as they are based on many assumptions. Such valuations can be significantly affected over relatively short periods of time by changes in business climate, economic conditions, demographic and market trends such as the impact of the ongoing shift to online shopping on retail properties or the trend toward remote and hybrid work on office properties. The value of commercial real estate and ability of commercial real estate borrowers to service debt is also sensitive to occupancy rates, the level of rents, regulatory changes, interest rates, other operating costs and, in many cases, the results of operations of businesses and other occupants of the real property. The properties securing income-producing investor real estate loans may not be fully leased at the origination of the loans or vacancies may arise during the terms of the loans. A borrower's ability to repay these loans is dependent upon stabilization of the properties and additional leasing through the life of the loan or the borrower's successful operation of a business. Weak economic conditions or demographic and market trends may impair a borrower's business operations, lead to elevated vacancy rates or lease turnover, slow the execution of new leases or result in falling rents. In particular, the office segment continues to be impacted by the evolving trend toward remote or hybrid work. The ultimate outcome of this trend and, as a result, the level of future demand for office space, remains uncertain. Lease turnover may increase, and tenants may reduce the amount of space leased when existing leases expire. Lower occupancy rates may lead to lower rents and lower valuations of office buildings. These factors could lead to deterioration in fundamentals underlying some of our commercial real estate loans. Recent increases in interest rates as well as rising property and casualty insurance and other operating costs have negatively impacted and may continue to negatively impact operating cash flows for some borrowers and the ability of those borrowers to service or refinance outstanding debt. These factors could result in further deterioration in the fundamentals underlying the commercial real estate market and the deterioration in value of some of our loans or the underlying collateral and ultimately to higher loan losses.
Similarly, residential real estate valuations can be impacted by housing trends, demographic trends, the availability of financing at reasonable interest rates, the level of supply of available housing, governmental policy regarding housing and housing finance and general economic conditions affecting consumers. Real estate values may also be impacted by weather-related events and other man-made or natural disasters, or ultimately, by the impact of climate change.
We make credit and reserve decisions based on current and projected real estate values, the current conditions of borrowers, properties or projects and our expectations for the future. If real estate values or fundamentals underlying commercial or residential real estate decline, we could experience higher delinquencies and charge-offs beyond that provided for in the ACL.
Since we engage in lending secured by real estate, we may be forced to foreclose on the collateral property and thereby be subject to risks associated with the ownership of commercial or residential real property, which could have an adverse effect on our business, financial condition or results of operations.
A significant portion of our loan portfolio is secured by residential or commercial real property. During the ordinary course of business, we may foreclose on and take title to properties securing certain loans, in which case, we are exposed to the risks and costs inherent in the ownership of real estate. The amount that we, as a mortgagee, may realize after a default is dependent upon factors outside of our control, including: (i) general or local economic conditions; (ii) sub-market property values and supply/demand dynamics; (iii) interest rates; (iv) costs of ownership such as real estate taxes, insurance, maintenance; (v) governmental rules and regulations such as but not limited to zoning laws; (vi) natural or man-made disasters such as hurricanes or healthcare crises; (vii) political or social unrest, crime levels and other conditions in sub-markets or neighborhoods where property is located; and (viii) the ability to maintain occupancy particularly of commercial properties. Additionally, bank-owned properties obtained in foreclosure often sell at a discount to the price that might otherwise be obtained in the market.
The geographic concentration of our markets in Florida and the New York Tri-State area makes our business highly susceptible to local economic conditions in those markets.
While we are expanding our geographic footprint, our operations remain concentrated in Florida and the New York Tri-State area. Additionally, a significant portion of our loans secured by real estate are secured by commercial and residential properties in these geographic regions. Accordingly, the ability of our borrowers to repay their loans, and the value of the collateral securing such loans, may be significantly affected by economic conditions in these regions or by changes in the local
15
real estate markets. Disruption or deterioration in those economic conditions or real estate markets could result in increased delinquencies, problem assets or foreclosures, a decline in demand for our loan products, deterioration in the ability of borrowers to repay their debt, lower collateral values and ultimately higher credit losses.
Our portfolio of operating lease equipment is exposed to fluctuations in the demand for and valuation of the underlying assets. Many of these assets are in service to the fossil fuel industry, and subject to transition risks related to climate change.
Although we have been reducing our exposure to this business, our equipment leasing business is exposed to asset risk resulting from ownership of the equipment on operating lease. Asset risk arises from fluctuations in supply and demand for the underlying leased equipment. We are exposed to the risk that, at the end of the lease term or in the event of early termination, the value of the asset will be lower than expected, resulting in reduced future lease income over the remaining life of the asset or a lower sale value, which could lead to impairment charges or operating losses. A significant portion of our equipment under operating lease consists of railcars and other equipment used directly or indirectly by the fossil fuel industry. Demand for this equipment, rental rates and its valuation are heavily influenced by conditions in the energy industry and the impact of transition to a lower-carbon economy including related regulation and societal norms.
Interest Rate Risk
Our business is inherently highly susceptible to interest rate risk.
Our business and financial performance are materially impacted by market interest rates and movements in those rates. Since a high percentage of our assets and liabilities are interest bearing or otherwise sensitive in value to changes in interest rates, changes in rates, in the shape of the yield curve or in spreads between different types of rates can have a material impact on our financial condition and results of operations and the values of our assets and liabilities. Changes in the value of investment securities available for sale and certain derivatives directly impact equity through adjustments of accumulated other comprehensive income and changes in the values of certain other assets and liabilities may directly or indirectly impact earnings. Changes in the values of assets and liabilities brought about by changes in interest rates, even those that do not directly impact reported GAAP or regulatory capital levels, may impact investors' perceptions of the value of the Company, rating agency opinions, or customers' perceptions of the stability of the Company leading to unanticipated deposit outflows. Interest rates are highly sensitive to many factors over which we have no control and which we may not be able to anticipate, including general economic conditions and the monetary and fiscal policies of various governmental bodies, particularly the Federal Reserve Board. The impact of changes in interest rates on our business and financial performance may be exacerbated if the extent or pace of those changes are beyond historical norms.
Our earnings and cash flows depend to a great extent upon the level of our net interest income. Net interest income is the difference between the interest income we earn on loans, investments and other interest earning assets, and the interest we pay on interest bearing liabilities, such as deposits and borrowings. A flat or inverted yield curve or tightening credit spreads may limit our ability to add higher yielding assets to the balance sheet and reduce the spread between rates paid on deposits and those earned on interest-earning assets, placing downward pressure on our net interest margin and net interest income. Our deposit costs tend to be correlated with short-term rates; increases in short-term interest rates or generally tightening liquidity conditions may exert upward pressure on our cost of deposits. Changes in interest rates can increase or decrease our net interest income, because different types of assets and liabilities may react differently, and at different times, to market interest rate changes. If interest bearing liabilities mature or reprice more quickly than interest earning assets in a period of rising rates, net interest income will be reduced. If interest earning assets mature or reprice more quickly than interest bearing liabilities, falling interest rates could reduce net interest income. An increase in interest rates may also reduce the demand for loans and lower-priced deposit products, decrease loan repayment rates and negatively affect borrowers' ability to meet their obligations. A decrease in the general level of interest rates may affect us through, among other things, increased prepayments on higher-yielding fixed rate loans and mortgage-backed securities. Competitive conditions may also impact the interest rates we are able to earn on new loans or are required to pay on deposits, negatively impacting both our ability to grow loans and deposits and our net interest income. Our ability to manage interest rate risk could be negatively impacted by unpredictable behavior of depositors in various interest rate environments. A rapid or unanticipated increase or decrease in interest rates, changes in the shape of the yield curve or in spreads between rates could have an adverse effect on our net interest margin and results of operations.
We attempt to manage interest rate risk by monitoring and managing the rates, maturity, repricing, mix and balances of the different types of interest-earning assets and interest bearing liabilities and through the use of hedging instruments; however, interest rate risk management techniques are not precise, and we may not be able to successfully manage our interest rate risk. The modeling techniques we use to manage interest rate risk are based on a wide variety of assumptions generally derived from historical data and patterns, and may fail to accurately predict the impact of future movements in interest rates on our financial performance. Assumptions about depositor behavior are integral to interest rate risk modeling and management; technological
16
advances enabling depositors to move money more quickly and to do business with a wide variety of financial services providers not in physical proximity to those depositors as well as the evolving landscape of the financial services industry has made predictive modeling of depositor behavior increasingly difficult.
Liquidity Risk
A failure to maintain adequate liquidity could adversely affect our ability to sustain normal operations, our financial condition and results of operations.
Effective liquidity management is essential for the operation of our business. We require sufficient liquidity to meet customer loan requests, customer deposit maturities and withdrawals and other cash commitments under both normal operating conditions and under extraordinary or unpredictable circumstances. Our access to funding sources in amounts adequate to finance our activities on terms that are acceptable to us could be impaired by factors or events that affect us specifically or the financial services industry or economy generally. Factors that could detrimentally impact our access to liquidity at an acceptable price, or at all include, but are not limited to: (i) national, to a lesser extent global, and regional economic and market conditions; (ii) interest rates; (iii) competition for depositor funds from banks and other investment alternatives; (iv) the availability of sufficient collateral that is acceptable to the FHLB and the Federal Reserve Bank, both of which are significant sources of contingent liquidity for us; (v) fiscal and monetary policy including the continuing restrictive monetary policy of the Federal Reserve which is negatively impacting systemic liquidity; (vi) public and market perception of BankUnited specifically and the banking sector more broadly; (vii) our ability to access the capital markets as a potential liquidity source; and (viii) regulatory requirements or changes. Our access to liquidity in the form of deposits may also be affected by the liquidity needs of our depositors. A substantial portion of our liabilities consist of deposit accounts that are payable on demand or upon several days' notice, while by comparison, the majority of our assets are loans, which cannot be called or sold in the same time frame. Although we have historically been able to replace maturing deposits and borrowings as necessary, we might not be able to replace such funds in the future. A failure to maintain adequate liquidity could materially and adversely affect our ability to sustain business operations, our financial condition or results of operations.
We may be subject to material unanticipated outflows of deposits, jeopardizing our ability to maintain sufficient liquidity to conduct normal business operations.
The failure of several regional banks during 2023, characterized by unprecedented levels of deposit outflows, led to an erosion of confidence in the regional banking sector among deposit customers, investors, and other counterparties. In these cases, deposit outflows were exacerbated by the ability of customers to move money quickly and easily using digital channels as well as widespread media coverage and social media exposure. Following the bank failures, many regional banks, including BankUnited, experienced higher than normal deposit outflows. Across the industry, a significant amount of deposits migrated from regional banks to the nation's largest banks. While deposit flows at BankUnited appear to have stabilized since the 2023 bank failures, we remain susceptible to internal or external circumstances, perceptions or events, some of which we may be unable to anticipate or control or may be of an unprecedented nature, that could lead to material unexpected deposit outflows. Depositors increasingly have the ability to move funds quickly and easily. If a significant portion of our deposits were to be withdrawn within a short period of time, the Company’s liquidity, financial condition, results of operations and ability to sustain normal operations could be materially, adversely affected.
The Federal Reserve Bank and the FHLB are important sources of both operating and contingent liquidity. If the availability of those liquidity sources were compromised, our business, financial condition or results of operations could be materially adversely affected.
The Federal Reserve Bank and FHLB provide important sources of stable, reliable and specifically with respect to the Federal Reserve Bank, emergency liquidity to banks including BankUnited. Should the availability, nature, design or provisions of the various liquidity facilities provided by these entities change materially, BankUnited's ability to access operating or contingent liquidity as needed could be adversely impacted. The availability of liquidity from these sources is also dependent on the nature and value, which could be negatively impacted by changes in interest rates, of collateral BankUnited is able to provide and on their evaluation of the Bank's creditworthiness. In 2023, the FHFA, the primary regulator of the FHLB system, completed a comprehensive review of the FHLB system which may result in future changes in the regulatory or statutory framework governing the FHLB system. Such changes, if and when enacted, could impact the future amount, terms and availability of liquidity provided by the FHLBs to their members, including BankUnited. Our ability to access funds in a timely basis from the Federal Reserve Bank and FHLB also depends on our operational readiness; while we test operational readiness
17
regularly and believe our processes and procedures are adequate in this regard, a failure of those processes and procedures could compromise our ability to access needed liquidity.
A significant percentage of our deposits are commercial deposits, many of which are uninsured.
Our business strategy is heavily focused on commercial customers, and as such, a large percentage of our deposits are commercial deposits. Inherently, due to the design and purpose of FDIC deposit insurance, across the U.S. banking system and at BankUnited a significant portion of commercial deposits are uninsured. While we offer programs and products to our commercial customers that allow them to increase the amount of their deposits that are insured, not all depositors choose to take advantage of these programs and products. Uninsured deposits may be more subject than insured deposits to unanticipated outflows, particularly during times of systemic or institution-specific stress.
Loss of deposits or a change in deposit mix could increase our funding costs.
Deposits are typically a relatively low cost and stable source of funding. We compete with banks and other financial service providers for customer funds; as a result, we could lose deposits in the future, clients may shift their deposits into higher cost products, or we may need to raise interest rates to avoid deposit attrition. Funding costs may also increase if deposits are replaced with wholesale funding. Higher funding costs reduce our net interest margin, net interest income, and net income. A portion of our deposit base consists of companies serving the residential real estate eco-system and is exposed to the overall health and level of activity in that eco-system. Particularly in a high or rising interest rate environment, the level of residential real estate activity would be expected to decline, which has led and may in the future lead to reduced deposit balances in this vertical, considerably.
The inability of BankUnited, Inc. to receive dividends from its subsidiary bank could have a material adverse effect on the ability of BankUnited, Inc. to make payments on its debt, pay cash dividends to its shareholders or execute share repurchases.
BankUnited, Inc. is a separate and distinct legal entity from the Bank, and the substantial majority of its revenue consists of dividends from the Bank. These dividends are the primary funding source for the dividends paid by BankUnited, Inc. on its common stock, the interest and principal payments on its debt and any repurchases of outstanding common stock. Various federal and state laws and regulations limit the amount of dividends that a bank may pay to its parent company. In addition, our right to participate in a distribution of assets upon the liquidation or reorganization of a subsidiary may be subject to the prior claims of the subsidiary’s depositors and other creditors. If the Bank is unable to pay dividends, BankUnited, Inc. might not be able to service its debt, pay its obligations, pay dividends on its common stock or make share repurchases.
Operational Risk
We rely on analytical and forecasting models and tools that may prove to be inadequate or inaccurate, which could adversely impact the effectiveness of our strategic planning, the quality of certain accounting estimates including the ACL, the effectiveness of our risk management framework including but not limited to credit, interest rate and liquidity risk monitoring and management and thereby our results of operations.
The processes we use to forecast future performance and estimate expected credit losses, including in hypothetical periods of stress, the effects of changing interest rates, sources and uses of liquidity, real estate values, and economic trends and indicators on our financial condition and results of operations depend upon the use of analytical and forecasting tools and models. These tools and models reflect assumptions that may not be accurate, particularly in times of market stress or other unforeseen or unprecedented circumstances. Furthermore, even if our assumptions are accurate predictors of future performance, the tools and models that utilize them may prove to be inadequate or inaccurate because of other flaws in their design or implementation. If these tools prove to be inadequate or inaccurate, our strategic planning processes, risk management and monitoring framework, earnings and capital may be adversely impacted.
New lines of business, new products and services or strategic project initiatives may subject us to additional operational risks, and the failure to successfully implement these initiatives could affect our results of operations.
From time to time, we may launch new lines of business, expand into new geographies or offer new banking products and services, which offerings may significantly increase operational, credit or reputational risks. Significant effort and resources may be required to manage and oversee the successful development, implementation, risk assessment, launch or scaling of new initiatives, which effort and resources may be diverted from other of our products or services. While we invest significant time and resources in developing, marketing and managing new products and services, there are material uncertainties that could adversely impact estimated implementation and operational costs or projected adoption, sales, revenues or profits, and no
18
assurance can be given that any new offerings will be successfully developed, implemented, launched or scaled. New products and services may require startup and ongoing marketing costs and operational changes. The inability to successfully roll out new products and services may result in unmet profitability targets, increased costs, loss of customers or competitive advantage or other adverse impacts on our results of operations.
We are subject to the risk of fraud, theft or errors by employees or outsiders and to the impact of ineffective processes and controls, which may adversely affect our business, financial condition and results of operations.
We are exposed to the risk of fraud or theft by employees or outsiders and to operational errors, including clerical or record-keeping errors, the impact of ineffective processes and controls or faulty or disabled technology. Events such as these could cause us to suffer financial loss, the loss of customers, regulatory action and damage to our reputation.
Because the nature of the financial services business involves a high volume of transactions, certain errors may be repeated or compounded before they are discovered and successfully rectified. Our necessary dependence upon automated systems to record and process transactions and our large transaction volume may further increase the risk that technical flaws or employee tampering or manipulation of those systems will result in losses that are difficult to detect. The occurrence of any of these events could result in a diminished ability to operate our business as well as potential liability to customers and counterparties, reputational damage and regulatory intervention, which could adversely affect our business, financial condition or results of operations.
While we regularly monitor, evaluate and update our internal control framework including controls over financial reporting and corporate governance policies and procedures, any system of controls, however well designed and operated, can provide only reasonable, not absolute, assurances that the objectives of the controls are met. Failure of our system of controls and procedures could have a material adverse effect on our financial condition and results of operations.
We are dependent on our information technology and telecommunications systems. System failures or interruptions could have an adverse effect on our business, financial condition and results of operations.
Our business is highly dependent on the successful and uninterrupted functioning of our information technology, internet and network connectivity and telecommunications systems. We rely on these systems and connectivity to process new and renewed loans, gather deposits, process customer and other transactions, provide customer service, facilitate collections, facilitate remote work and share data across our organization. The failure of these systems and technologies could interrupt our operations. We may be subject to disruptions of our information technology and telecommunications systems arising from events that are wholly or partially beyond our control which may give rise to disruption of service to customers and of our employees' ability to perform their jobs. Because our information technology and telecommunications systems interface with and depend on third-party systems, we could experience service denials if demand for such services exceeds capacity or such third-party systems fail or experience interruptions. If sustained or repeated, a system failure or service denial could result in a deterioration of our ability to process new and renewed loans, gather deposits, process customer transactions, provide customer service, compromise our ability to operate effectively, damage our reputation, result in a loss of customer business, and/or subject us to additional regulatory scrutiny and possible financial liability, any of which could have a material adverse effect on our financial condition and results of operations.
We are dependent on third-party service providers for significant aspects of our business infrastructure, information technology, and telecommunications systems.
We rely on third parties to provide key components of our business infrastructure and major systems including, but not limited to, core banking systems such as loan servicing and deposit transaction processing systems, cloud-based data storage, our electronic funds transfer transaction processing, cash management, online banking services, ERP systems and computer and networking infrastructure. We have migrated a significant portion of our core information technology systems, data storage and customer-facing applications to private and public cloud infrastructure platforms. If we fail to administer these environments in a well-managed, secure and effective manner, or if these platforms become unavailable or do not meet their service level agreements for any reason, we may experience unplanned service disruption or unforeseen costs which could result in material harm to our business, reputation, financial condition and results of operations. We must successfully develop and maintain information, financial reporting, disclosure, data-protection and other controls adapted to our reliance on outside platforms and providers. In addition, service providers could experience system breakdowns or failures, outages, downtime, cyber-attacks, adverse changes to financial condition, bankruptcy, or other adverse conditions, which could have a material adverse effect on our business and reputation. While we have an established third-party risk management framework and select and monitor the performance of third-party vendors carefully, we do not control their actions. Any problems caused by these third parties, including those resulting from disruptions in communication services provided by a third party, failure of a third party to handle current or higher volumes, failure of a third party to provide services for any reason or poor performance of services, or the termination of a third-party software license or service agreement on which any of these systems is based, could adversely
19
affect our ability to deliver products and services to our customers and otherwise conduct our business. In many cases, our operations rely heavily on the secure processing, storage and transmission of information and the monitoring of a large number of transactions on a minute-by-minute basis, and even a short interruption in service could have significant consequences. Financial or operational difficulties of a third-party service provider could adversely affect our operations if those difficulties interfere with the service provider's ability to serve us effectively or at all. Replacing these third-party service providers could create significant delays and expense. Accordingly, use of such third party service providers creates an unavoidable material inherent risk to our business operations.
A cybersecurity incident, which is any unauthorized occurrence, or series of related unauthorized occurrences, on or conducted through our information systems, including those of third-party service providers that we rely on, that jeopardizes the confidentiality, integrity or availability of those information systems or information residing therein.
In the normal course of business, we collect, process, and retain sensitive and confidential client and customer information. Despite the security measures we and our third party service providers have in place, information systems may be vulnerable to cybersecurity incidents. Cybersecurity incidents can take many forms including cyber-attacks, security breaches, acts of vandalism, computer viruses, misplaced or lost data, programming and/or human errors, or other similar events, especially because, in the case of any intentional breaches, the techniques used change frequently or may not be recognized until launched, and cyber-attacks can originate from a wide variety of sources.
We provide our customers the ability to bank remotely, including online, via mobile devices and over the telephone. The secure transmission of confidential information over the internet and other remote channels is a critical element of remote banking. Our network could be vulnerable to unauthorized access, computer viruses, phishing schemes and other security breaches. In addition to cybersecurity incidents involving the theft of sensitive and confidential information, hackers have engaged in attacks against financial institutions, particularly denial of service attacks, designed to disrupt key business services such as customer-facing websites. We may be required to spend significant capital and other resources to protect against the threat of cybersecurity incidents, or to alleviate problems caused by cybersecurity incidents. Any cybersecurity incident involving the misappropriation, loss or other unauthorized disclosure of confidential customer information could severely damage our reputation, erode confidence in the security of our systems, products and services, expose us to the risk of litigation and liability, disrupt our operations and have a material adverse effect on our business.
In addition, we interact with and rely on financial counterparties for whom we process transactions and who process transactions for us and rely on other third-party service providers, as discussed above. Each of these third parties may be targets of the same types of cybersecurity incidents described above. The measures that they maintain to mitigate the risk of such activity may be different from our own and, in many cases, we do not have any control over the types of security measures they may choose to implement. We may incur costs as a result of data or security breaches of third parties with whom we do not have a significant direct relationship. As a result of financial entities and technology systems becoming more interdependent and complex, a cybersecurity incident, information breach or loss, or technology failure that compromises the systems or data of one or more financial entities could have a material impact on counterparties or other market participants, including us.
Concerns regarding the effectiveness of our measures to safeguard personal information, or even the perception that such measures are inadequate, could cause us to lose customers or potential customers and thereby reduce our revenues. If another financial institution experiences a material cybersecurity incident, even if we are not directly impacted in any way, negative publicity about the incident could impact confidence in the banking system generally, including in BankUnited.
We have taken measures to implement safeguards to support our operations, but our ability to conduct business may be adversely affected by any significant disruptions to us or to third parties with whom we interact. We have a comprehensive cybersecurity program, supported by written policies and procedures and a dedicated Chief Information Security Officer and information security division. The Risk Committee of the Board of Directors has oversight responsibility for our cybersecurity program. Also see "Item 1C - Cybersecurity."
Failure to keep pace with technological changes could have a material adverse impact on our ability to compete for loans and deposits, and therefore on our financial condition and results of operations.
Financial products and services have become increasingly technology driven. Our ability to meet the needs of our customers competitively, and in a cost-efficient manner, is dependent on our ability to keep pace with and pro-actively and quickly respond to technological advances and to invest in relevant new technology as it becomes available. Many of our larger competitors have greater resources to invest in technology than we do and may be better equipped to market new technology-driven products and services. The widespread adoption of new technologies, including, but not limited to, digitally enabled products and delivery channels and payment systems, could require us to incur substantial expenditures to modify or adapt our existing products and services. Our failure to respond to the impact of technological change could have a material adverse impact on our business, financial condition and results of operations.
20
The soundness of other financial institutions, particularly our financial institution counterparties, could adversely affect us.
Our ability to engage in routine funding and other transactions could be adversely affected by the stability and actions of other financial services institutions. Financial services institutions are interrelated as a result of trading, clearing, servicing, counterparty, and other relationships. We have exposure to an increasing number of financial institutions and counterparties. These counterparties include institutions that may be exposed to various risks over which we have little or no control.
Adverse developments affecting the overall strength and soundness of the financial services industry as a whole and third parties with whom we have important relationships could have a negative impact on our business even if we are not directly subject to the same adverse developments.
Regulatory, Legal and Compliance Risk
As a BHC, we and BankUnited operate in a highly regulated environment and the laws and regulations that apply to us, changes in them, or our failure to comply with them, may adversely affect us.
We operate in a highly regulated environment, and are subject to comprehensive statutory, legal and regulatory regimes, see Item 1 "Business—Regulation and Supervision." Intended to protect customers, depositors, the DIF, and the overall financial stability of the United States, these laws and regulations, among other matters, prescribe capital and liquidity requirements, impose limitations on the business activities in which we can engage, limit the dividend or distributions that BankUnited can pay to BankUnited, Inc., restrict the ability of institutions to guarantee our debt, and impose specific accounting requirements on us. Banking regulators may also from time to time focus on issues that may impact the pace of growth of our business, our ability to execute our business strategy and our operations. Compliance with laws and regulations can be difficult and costly, and changes to laws and regulations often impose additional costs. In addition, federal banking agencies including the OCC, Federal Reserve Board and CFPB periodically conduct examinations of our business, including compliance with laws and regulations. Our failure to comply with these laws and regulations, even if the failure follows good faith effort or reflects a difference in interpretation, could subject us to restrictions on our business activities, fines, remedial actions, administrative orders and other penalties, any of which could adversely affect our reputation, results of operations and capital base.
Further, federal, state and local legislators and regulators regularly introduce measures or take actions that would modify the regulatory requirements applicable to banks, their holding companies and other financial institutions. Changes in laws, regulations or regulatory policies could adversely affect the operating environment for the Company in substantial and unpredictable ways, increase our cost of doing business, impose new restrictions on the way in which we conduct our operations or add significant operational constraints that might impair our profitability. We cannot predict whether new legislation will be enacted and, if enacted, the effect that it, or any implementing regulations, would have on our business, financial condition or results of operations.
Changes in political administrations are likely to introduce new or modified regulations and related regulatory guidance and supervisory oversight. Newly enacted laws may significantly impact the regulatory framework in which we operate and may require material changes to our business processes in short time frames. Inability to meet new statutory requirements within the prescribed periods could adversely affect our business, financial condition and results of operations, as well as impact our reputation.
We expect the failures of several regional banks in 2023 and related events to lead to changes in laws or regulations governing financial institutions or in the imposition of restrictions through supervisory or enforcement activities. Proposed rules increasing capital requirements for banks with more than $100 billion in assets have been issued; if these or similar rules are enacted, there may be indirect effects on our company. We also expect additional laws or regulations to be issued related to liquidity and bank mergers and acquisitions. These new laws and regulations, if enacted, could have a material impact on our business including but not limited to increased costs and lower profitability.
Our ability to expand through acquisition or de novo branching requires regulatory approvals, and failure to obtain them may restrict our growth.
Although acquisitions have not historically been a material part of our growth strategy, we may identify opportunities to complement and expand our business by pursuing strategic acquisitions of financial institutions and other complementary businesses. We must generally receive federal regulatory approval before we can acquire an institution or business. In determining whether to approve a proposed acquisition, federal banking regulators will consider, among a number of other qualitative and quantitative factors, the effect of the acquisition on competition, the impact on communities served by the acquiring and target institution, the impact on compliance with the CRA and BSA/AML laws and regulations, our financial
21
condition, our future prospects, and the impact of the proposal on U.S. financial stability. Regulatory approvals may not be granted on terms that are acceptable to us, or at all. We may also be required to sell or close branches, or precluded from doing so, as a condition to receiving regulatory approval, which condition may not be acceptable to us or, if acceptable to us, may reduce the benefit of any acquisition. We may continue de novo branching as a part of our organic growth strategy and possibly enter into new markets through de novo branching. The failure to obtain regulatory approvals for potential future strategic acquisitions and de novo branches may impact our business plans and restrict our growth.
In January 2024, the OCC published for public comment a proposal to amend its rules for business combinations involving national banks and federal savings associations and add, as an appendix, a policy statement that summarizes the principles the OCC uses when it reviews proposed bank merger transactions under the BMA. The proposed policy statement provides, among other things, that a bank merger where the resulting institution would have more than $50 billion in assets or where the acquiring institution was not at least twice as large as the target institution would receive enhanced regulatory scrutiny.
Financial institutions, such as BankUnited, face a risk of noncompliance and enforcement action with the Bank Secrecy Act and other anti-money laundering statutes and regulations.
The Bank Secrecy Act, the USA PATRIOT Act, and other laws and regulations require financial institutions, among other duties, to institute and maintain an effective anti-money laundering program and file suspicious activity and currency transaction reports as appropriate. Financial institutions are also required to comply with sanctions and programs administered by the Office of Foreign Assets Control. Numerous regulatory agencies and other governmental departments are involved in enforcement and administration of these provisions.
We dedicate significant resources to ongoing compliance with these laws and regulations, continuously monitor and enhance as necessary related policies and procedures and maintain a robust automated anti-money laundering software solution. If our policies, procedures and systems are deemed deficient, we could be subject to liability, including significant civil monetary fines and to various regulatory actions such as restrictions on our ability to pay dividends, the inability to obtain approval of any contemplated acquisitions and restrictions on our ability to execute certain aspects of our business and expansion plans.
We are subject to the CRA and fair lending laws, and failure to comply with these laws could lead to material penalties.
The CRA, the Equal Credit Opportunity Act, the Fair Housing Act and other fair lending laws and regulations impose nondiscriminatory lending requirements on financial institutions. The Department of Justice and other federal agencies are responsible for enforcing these laws and regulations. A successful challenge to an institution's performance under the CRA or fair lending laws and regulations could result in a wide variety of sanctions, including the required payment of damages and civil money penalties, injunctive relief, imposition of restrictions on mergers and acquisitions activity, and restrictions on expansion activity. Private parties may also have the ability to challenge an institution's performance under fair lending laws in private class action litigation.
The FDIC's restoration plan and any future related increased assessments could adversely affect our earnings.
Insured depository institutions such as BankUnited are required to pay deposit insurance premiums to the FDIC, which maintains a DIF. If the current level of deposit premiums is insufficient for the DIF to meet its funding requirements in the future, special assessments or increases in deposit insurance premiums may be required. A change in BankUnited's risk classification within the FDIC's risk-based assessment framework could also result in increased deposit insurance premiums.
In November 2023, in the aftermath of certain bank failures earlier in 2023, the FDIC approved a final rule to implement a special assessment based on the amount of uninsured deposits reported in the banks' December 31, 2022 Call Reports. The special assessment will be collected for an anticipated eight quarterly assessment periods beginning in 2024. During the fourth quarter of 2023, the Bank recorded the entire special assessment levied of $35.4 million.
We are generally unable to control the amount of premiums that we are required to pay for FDIC insurance. There is also a risk that BankUnited’s deposit insurance premiums will further increase if additional failures of insured depository institutions further deplete the DIF or if the FDIC changes its view of the risk BankUnited poses to the DIF or otherwise increases the assessment rate adjustment applicable to BankUnited’s deposits. Any future additional assessments or increases in FDIC insurance premiums may adversely affect our financial condition or results of operations.
We are generally unable to control the amount of premiums that we are required to pay for FDIC insurance. If there are additional bank or financial institution failures in the future, we may be required to pay FDIC premiums higher than current levels. Any future additional assessments or increases in FDIC insurance premiums may adversely affect our financial condition or results of operations.
22
We are subject to laws regarding the privacy, information security and protection of personal information and any violation of these laws or another incident involving personal, confidential or proprietary information of individuals could damage our reputation, lead to monetary settlements or penalties and otherwise adversely affect our operations and financial condition.
Our business requires the collection and retention of large volumes of customer data, including personally identifiable information in various information systems that we maintain and in those maintained by third party service providers. We are subject to complex and evolving laws and regulations governing the privacy and protection of personal information of individuals (including customers, employees, suppliers and other third parties). For example, our business is subject to the Gramm-Leach-Bliley Act which, among other things: (i) imposes certain limitations on our ability to share nonpublic personal information about our customers with non-affiliated third parties; (ii) requires that we provide certain disclosures to customers about our information collection, sharing and security practices and afford customers the right to “opt out” of any information sharing by us with non-affiliated third parties (with certain exceptions); and (iii) requires that we develop, implement and maintain a written comprehensive information security program containing appropriate safeguards based on our size and complexity, the nature and scope of our activities, and the sensitivity of customer information we process, as well as plans for responding to data security breaches. Various state and federal banking regulators and states have also enacted data security breach notification requirements with varying levels of individual, consumer, regulatory or law enforcement notification in certain circumstances in the event of a security breach. Ensuring that our collection, use, transfer and storage of personal information complies with all applicable laws and regulations increases our costs. Furthermore, we may not be able to ensure that all of our customers, suppliers, counterparties and other third parties have appropriate controls in place to protect the confidentiality of the information that they exchange with us, particularly where such information is transmitted by electronic means. If personal, confidential or proprietary information of customers or others were to be mishandled or misused, we could be exposed to litigation or regulatory sanctions under personal information laws and regulations. Laws and regulations in this area are evolving, and there is a reasonable possibility that additional or modified laws or regulations applicable to us will be enacted. We may incur significant costs to comply with any such new or modified laws or regulations, or our efforts to do so may not be effective. Any failure or perceived failure to comply with applicable privacy or data protection laws and regulations may subject us to inquiries, examinations and investigations that could result in requirements to modify or cease certain operations or practices or in significant liabilities, fines or penalties, and could damage our reputation and otherwise adversely affect our operations and financial condition.
General Risk Factors
Damage to our reputation could adversely affect our operating results.
Our ability to originate new business and maintain existing customer relationships is highly dependent upon customer and other external perceptions of our business practices. Adverse perceptions regarding our business practices, or those of other regional banks, could damage our reputation in the customer, funding and capital markets, leading to difficulties in generating and maintaining business as well as obtaining financing. Negative public opinion can result from our actual or alleged conduct in any number of activities, including lending practices, employee relations, corporate governance and acquisitions and from actions taken by government regulators and community organizations in response to those activities. Adverse developments with respect to external perceptions regarding the practices of our competitors, or our industry as a whole, or the general economic climate may also adversely impact our reputation. These perceptions about us could cause our business to be negatively affected and exacerbate the other risks that we face. In addition, adverse reputational impacts on third parties with whom we have important relationships may adversely impact our reputation. Adverse reputational impacts or events may also increase our litigation risk.
Our enterprise risk management framework may not be effective in mitigating the risks to which we are subject, or in reducing the potential for losses in connection with such risks.
Our enterprise risk management framework is designed to identify, measure, mitigate and manage the risks to which we are subject, as well as any losses stemming from such risks. Although we seek to identify, measure, monitor, report, and control our exposure to such risks, and employ a broad and diversified set of risk monitoring and mitigation techniques in the process, those techniques are inherently limited in their ability to anticipate the existence or development of risks that are currently unknown and unanticipated. The ineffectiveness of our enterprise risk management framework in mitigating the impact of known risks or the emergence of previously unknown or unanticipated risks may result in our incurring losses in the future that could adversely impact our financial condition and results of operations.
23
Our business may be adversely affected by conditions in the financial markets and economic conditions generally.
Deterioration in business or economic conditions generally, or more specifically in the principal markets in which we do business, or the onset of a recession could have adverse effects on our business, financial condition and results of operations including but not necessarily limited to: (i) a decrease in demand for our products and services; (ii) an increase in delinquencies and defaults by borrowers or counterparties leading to increased credit losses; (iii) a decline in the value of our assets; (iv) a decrease in earnings; (v) a decline in liquidity and (vi) a decrease in our ability to access the capital markets. Inflationary trends and higher interest rates may lead to an increase in our operating expenses or those of our clients in turn impacting their ability to repay their obligations to us.
Our reported financial results depend on management's selection and application of accounting policies and methods and related assumptions and estimates.
Our accounting policies and estimates are fundamental to our reported financial condition and results of operations. Management is required to make difficult, complex or subjective judgments in selecting and applying many of these accounting policies. In some cases, management must select an accounting policy or method from two or more alternatives, any of which may be reasonable under the circumstances, yet may result in us reporting materially different results than would have been reported under a different alternative.
From time to time, the FASB and SEC may change the financial accounting and reporting standards that govern the preparation of our financial statements. These changes can be difficult to predict and can materially impact our reported financial condition and results of operations. In some cases, we could be required to apply a new or revised standard retrospectively, resulting in a restatement of prior period financial statements. See Note 1 to the consolidated financial statements for more information about recent accounting pronouncements that may have a material impact on our reported financial results.
Changes in taxes and other assessments may adversely affect us.
The legislatures and taxing authorities in the tax jurisdictions in which we operate regularly enact reforms to the tax and other assessment regimes to which we and our customers are subject. The effects of these changes and any other changes that result from interpreting and implementing regulations or enactment of additional tax reforms cannot be quantified and there can be no assurance that any such reforms would not have an adverse effect upon our business.
Tax laws are complex and subject to different interpretations by the taxpayer and relevant governmental taxing authorities, which are sometimes subject to prolonged evaluation periods until a final resolution is reached. In establishing a provision for income tax expense, filing returns and establishing the value of deferred tax assets and liabilities for purposes of its financial statements, the Company must make judgments and interpretations about the application of these inherently complex tax laws. If the judgments, estimates and assumptions the Company uses in establishing provisions, preparing its tax returns or establishing the value of deferred tax assets and liabilities for purposes of its financial statements are subsequently found to be incorrect, there could be a material effect on our financial condition and results of operations.
The price of our common stock may be volatile or may decline.
The price of our common stock may be volatile or may decline. The price of our common stock may fluctuate as a result of a number of factors, many of which are external events outside of management's control. In addition, the stock market is subject to broad or systemic fluctuations in share prices and trading volumes that affect the market prices of the shares of many companies, including BankUnited, Inc. Factors that could affect our stock price include but are not limited to: (i) actual or anticipated changes in the Company's operating results or financial condition; (ii) performance of the regional banking sector; (iii) failure to meet analysts' estimates; (iv) actual or forecasted macro-economic conditions; (v) rating agency actions; (vi) changes in the competitive or regulatory environment; (vii) actions by large institutional shareholders or other market participants; (viii) events, circumstances or perceptions impacting the financial services sector broadly and (ix) negative publicity about us or other regional banks.
We may not be able to attract and retain skilled employees.
Our success depends, in large part, on our ability to attract and retain key people. Due to competition, general labor market dynamics, the ongoing transition to more remote and hybrid work and other factors, we may have difficulty recruiting or retaining qualified personnel. The unexpected loss of the services of one or more of our key personnel could have an adverse impact on our business.
24
Further downgrades of the U.S. credit rating or a government shutdown could negatively impact economic conditions generally and as a result, our business, results of operation and financial condition.
The U.S. Government's sovereign credit rating was recently downgraded by a NRSRO. The impact of future downgrades of the U.S. sovereign credit rating or deterioration in its perceived creditworthiness could adversely affect the U.S. and global financial markets and economic conditions. In addition, disagreement over the federal budget has caused and may cause the U.S. federal government to essentially shut down for periods of time. Future events of this nature could have an adverse effect on our business, results of operations and financial condition.
Item 1B. Unresolved Staff Comments
None.
Item 1C. Cybersecurity
Cybersecurity Risk Management and Strategy
We are committed to maintaining robust governance, oversight and management of cybersecurity risks. We have established and implemented processes, supported by written policies and procedures, to detect, assess, classify, respond to, report, track, and resolve cybersecurity threats or incidents. We have implemented systems and controls to address the information technology risks to our organization, our business partners and our customers. We employ a layered security approach leveraging diverse strategies including data loss prevention, access and identity management, network security, vulnerability management, end-point security and information security education and awareness, among others. As a federally regulated institution, the Company strongly supports an environment that facilitates and abides by the Confidentiality, Integrity, and Availability security principles.
Our risk-based policies, procedures, and practices are integrated into our overall risk management program and have been implemented across the organization to manage and mitigate risks from cybersecurity threats. We continuously assess risks from cybersecurity threats and monitor our information systems for potential vulnerabilities. We conduct regular reviews and tests of our information security program including penetration and vulnerability testing, and other exercises to evaluate the effectiveness of our program and improve our cybersecurity posture. These evaluations provide the Company with an unbiased view of its environment and controls. All identified cybersecurity incidents or technology outages or failures and vulnerabilities identified during these assessments are inventoried in a centralized tracking system and reported to impacted users and to management on a regular basis. A multi-step approach is applied to identify, prioritize, report, and remediate these vulnerabilities. SLAs are established for remediation of any incidents or outages detected, depending on their nature and potential impact. Our cybersecurity policies, procedures and practices are integrated with our overall risk management program by inclusion of cybersecurity and information systems KRIs in our enterprise-wide comprehensive risk assessment process and risk appetite statement, the involvement of our Chief Risk Officer in the MAT and oversight of cybersecurity risk by our Enterprise Risk Management Committee and the Risk Committee of the Board of Directors.
We have engaged cybersecurity service provider experts and maintain an industry-leading incident response retainer to further enhance our cybersecurity safeguards and support our processes for assessing, identifying, and managing material risks from cybersecurity threats. Our third-party experts perform assessments that aid us in effectively detecting and responding to evolving cybersecurity attacks and, in the event of a cybersecurity incident, our experts will assist us with incident response support, digital forensics and incident remediation.
The Company’s third-party risk management framework and processes have been aligned with regulatory requirements and we believe with industry best practices to oversee and identify risks from cybersecurity threats associated with use of third-party service providers. We take a risk-based approach in performing cybersecurity assessments of third-party service providers at the time of onboarding, as part of regular ongoing monitoring, at the time of contract renewal, and upon detection of any increase in risk profile. Our information security division collaborates with our third-party risk management unit to evaluate the information technology and security programs of significant third party service providers. As applicable, these reviews evaluate the design and operational effectiveness of information technology and security related controls employed by service providers. In addition, the third party’s information technology and security policies and procedures are evaluated to form an overall opinion of the third party service provider's technology and information security posture.
The Company has developed a training program to educate employees about its cybersecurity policies and standards, best practices, and potential threats to instill a culture of cybersecurity awareness and compliance throughout the organization. The training program includes, but is not limited to, ongoing and targeted training on topics such as social engineering, mobile security, data handling and protection, password security and incident reporting. All employees are required to participate in the training.
25
In 2022, Clarium Managed Services, LLC (“Clarium”) conducted a Cybersecurity Assessment for the Bank. The assessment gauged the overall Cybersecurity Risk Posture of the Bank and resulted in a score of 4.8 on a scale of 0 to 5. In the last three fiscal years, the Company has not experienced any material cybersecurity incidents. No specific cybersecurity threats or incidents, including those resulting from any previous cybersecurity incidents, have materially affected, or are reasonably likely to materially affect, the Company, including its business strategy, results of operations or financial condition. See Item 1A "Risk Factors" for a discussion of our cybersecurity risks.
Cybersecurity Governance
The Risk Committee of the Board of Directors is ultimately responsible for oversight of risks from cybersecurity threats, the Company's information risk management function, and the effective implementation of its cybersecurity program. The CISO reports routinely, typically at each of its regularly scheduled meetings, to the Risk Committee on matters including the Company's cybersecurity program, cybersecurity threats and the cybersecurity threat environment. The Risk Committee formally approves the Company's cybersecurity policy and program annually, and more frequently if material changes are adopted.
At the management level, the CISO leads the ongoing technical and business functions that include cybersecurity, information assurance, network security, systems engineering, and information security management. A dedicated information security division reports to the CISO. The CISO has over 30 years of experience in information systems security including physical, cyber, and IT, disaster recovery, business continuity planning, secure software development, and cloud services and security, among others. The CISO holds multiple designations from the International Information System Security Certification Consortium, including Certified Information Systems Security Professional and has been a member of various boards including IT, Cybersecurity and Enterprise Risk Committees. Organizationally, the CISO reports to the CIO, but also provides reporting directly to and has access to the Risk Committee of the Board of Directors. The CIO has over 30 years of experience in financial services information technology.
The Company has designated the MAT to assess and oversee the management and reporting of identified potentially material cybersecurity threats or incidents. The MAT convenes when a qualifying cybersecurity threat is identified by the CIO, the CISO, or their designees in accordance with established processes and procedures. The MAT has the responsibility to determine whether a cybersecurity threat or incident is material and oversee appropriate reporting. The MAT is also responsible for communicating to the Risk Committee any material cybersecurity threats or incidents.
The CISO, CIO, CRO, CFO, CAO, and General Counsel comprise the MAT. Other SMEs or technical experts may advise, consult with and provide information to the MAT as needed. In addition to the specific subject matter expertise and experience of the CISO and CIO, these executives have broad financial, legal, risk management, industry, regulatory and SEC compliance, and general leadership experience, which enable the MAT to effectively carry out its responsibilities.
Item 2. Properties
BankUnited's corporate headquarters is located in leased office space in Miami Lakes, Florida. We also lease office space in New York, certain other areas in Florida and Atlanta. Our subsidiaries lease office space in Baltimore, Maryland and Scottsdale, Arizona. At December 31, 2023, we provided banking services at 53 banking centers located in Florida, New York and Texas. We believe that our facilities are in good condition and are adequate to meet our operating needs for the foreseeable future.
Item 3. Legal Proceedings
The Company is involved as plaintiff or defendant in various legal actions arising in the normal course of business. In the opinion of management, based upon advice of legal counsel, the likelihood is remote that the impact of these proceedings, either individually or in the aggregate, would be material to the Company’s consolidated financial position, results of operations or cash flows.
Item 4. Mine Safety Disclosures
None.
26
PART II
Item 5. Market for Registrant's Common Equity, Related Stockholder Matters and Issuer Purchases of Equity Securities
Market Information and Holders of Record
Shares of our common stock trade on the NYSE under the symbol "BKU". The last sale price of our common stock on the NYSE on February 16, 2024 was $27.27 per share. As of February 16, 2024, there were 573 stockholders of record of our common stock.
Equity Compensation Plan Information
The information set forth under the caption "Equity Compensation Plan Information" in our definitive proxy statement for the Company's 2024 annual meeting of stockholders (the "Proxy Statement") is incorporated herein by reference.
Dividend Policy
The Company declared a quarterly dividend of $0.27 and $0.25 per share on its common stock for each of the four quarters in the years ended December 31, 2023 and 2022, respectively, resulting in total dividends for the years ended December 31, 2023 and 2022, of $80.5 million and $78.9 million, or $1.08 and $1.00 per common share, respectively. Dividends from the Bank are the principal source of funds for the payment of dividends on our common stock. The Bank is subject to certain restrictions that may limit its ability to pay dividends to us. See "Business—Regulation and Supervision—Regulatory Limits on Dividends and Distributions". The quarterly dividends on our common stock are subject to the discretion of our Board of Directors and dependent on, among other things, our financial condition, results of operations, capital requirements and other factors that our board of directors may deem relevant. The Company expects to continue its policy of paying regular cash dividends on a quarterly basis.
27
Stock Performance Graph
The graph set forth below compares the cumulative total stockholder return on an initial investment of $100 in our common stock between December 31, 2018 and December 31, 2023, with the comparative cumulative total return of such amount on the S&P 500 Index and the KBW Nasdaq Regional Bank Index over the same period. Reinvestment of all dividends is assumed to have been made in our common stock.
The comparisons shown in the graph below are based upon historical data. We caution that the stock price performance shown in the graph below is not necessarily indicative of, nor is it intended to forecast, the potential future performance of our common stock.
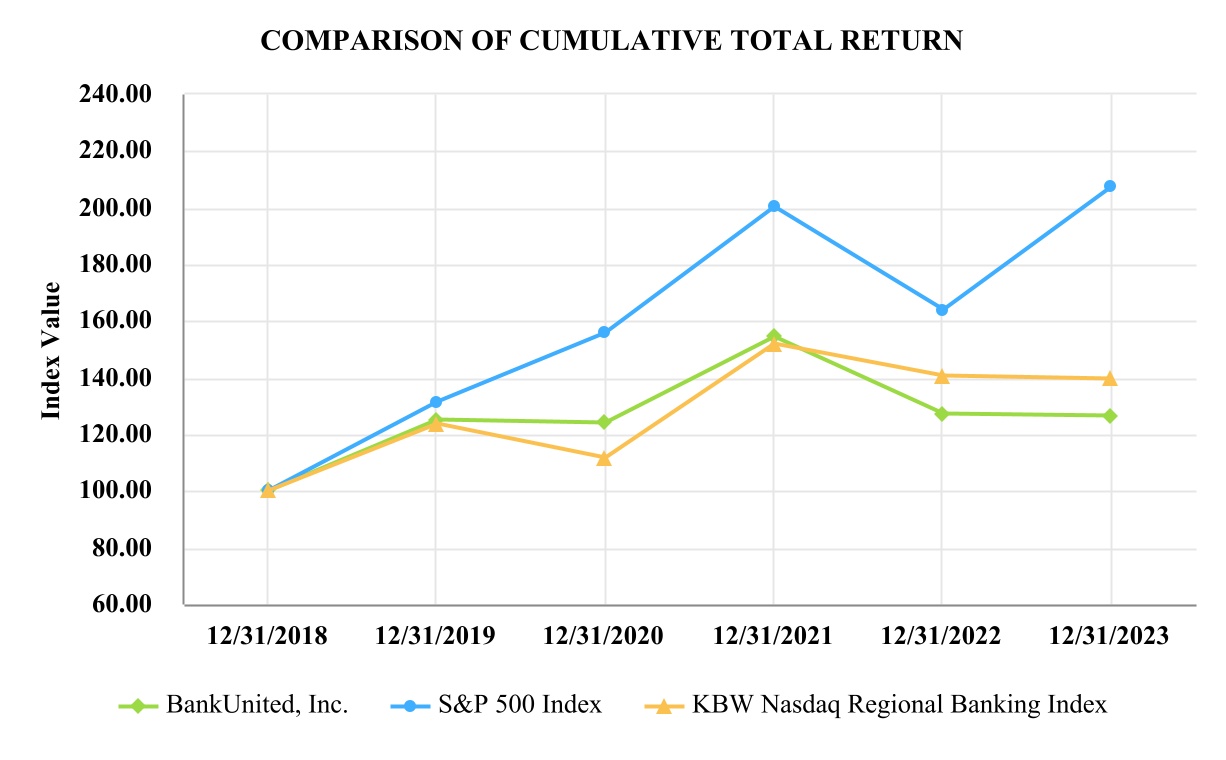
| Index | 12/31/2018 | 12/31/2019 | 12/31/2020 | 12/31/2021 | 12/31/2022 | 12/31/2023 | ||||||||||||||
| BankUnited, Inc. | 100.00 | 125.24 | 124.10 | 154.37 | 127.06 | 126.65 | ||||||||||||||
| S&P 500 Index | 100.00 | 131.49 | 155.68 | 200.37 | 164.08 | 207.21 | ||||||||||||||
| KBW Nasdaq Regional Banking Index | 100.00 | 123.57 | 111.56 | 151.82 | 140.82 | 139.66 | ||||||||||||||
Recent Sales of Unregistered Securities
None.
Purchases of Equity Securities by the Issuer and Affiliated Purchasers
None.
28
Item 6. Reserved
Item 7. Management's Discussion and Analysis of Financial Condition and Results of Operations
The following discussion and analysis is intended to assist readers in understanding the consolidated financial condition and results of operations of BankUnited, Inc. and its subsidiary (the "Company", "we", "us" and "our") and should be read in conjunction with the consolidated financial statements, accompanying footnotes and supplemental financial data included herein. In addition to historical information, this discussion contains forward-looking statements that involve risks, uncertainties and assumptions that could cause actual results to differ materially from management's expectations. Factors that could cause such differences are discussed in the sections entitled "Forward-looking Statements" and "Risk Factors." We assume no obligation to update any of these forward-looking statements.
Management's discussion and analysis presents the more significant factors that affected our financial condition as of December 31, 2023, and results of operations for the year then ended, including in comparison to the prior year ended December 31, 2022. Refer to Item 7 "Management’s Discussion and Analysis of Financial Condition and Results of Operations" included in our Annual Report on Form 10-K filed with the SEC on February 22, 2023, for a discussion and analysis of the more significant factors that affected the year ended December 31, 2022, including in comparison to the year ended December 31, 2021.
Our Vision and Long term- Strategic Priorities
Our vision is to build a leading regional commercial and small business bank, with a distinctive value proposition based on strong service-oriented relationships, robust digital enabled customer experiences, and operational excellence with an entrepreneurial work environment that empowers employees to deliver their best. Our strategic priorities include:
•Growing core customer relationships on both sides of the balance sheet, building a scalable small business and middle-market franchise for the long-term;
•Transitioning the left side of the balance sheet to a mix of assets with higher risk-adjusted returns;
•Deposit growth is paramount, with particular emphasis on new non-interest bearing deposit relationships;
•Playing where we can win - focusing on sectors where our delivery model is a differentiator;
•Investing in organic growth capabilities - people, processes, products and technology;
•Using technology to enable success by investing in digital capabilities, nimble technology architecture and data;
•Retaining the ability to pivot nimbly when opportunities arise;
•Maintaining an efficient, effective and scalable support model through operational excellence.
•While our primary growth strategy is organic, we will continue to monitor the M&A landscape.
Impact of Macro-Environmental Factors and Near-term Strategic Priorities
Macro-Environmental Factors:
During early 2023, three highly publicized regional bank closures created a crisis of confidence in the banking system, specifically with respect to regional and mid-size banks. This led to outflows of deposits from regional and mid-size banks, including BankUnited, to the largest money-center banks and to volatility in bank valuations. Deposit flows, liquidity and market perceptions have stabilized considerably since those events, however, pressure on bank margins and valuations, in part influenced by those events remains, as does a level of market uncertainty. The FRB has maintained its restrictive monetary policy stance, and a level of uncertainty remains about the overall trajectory of the economy. Despite these circumstances, loan and deposit pipelines are healthy, deposit flows are generally stable, our margin expanded during the second half of 2023, and non-performing asset and net charge-off ratios remain at what we consider to be low levels. We believe our liquidity position is strong and our capital levels robust.
To provide context, over the course of 2020 and 2021, the COVID-19 pandemic, along with the response of the Federal government in the form of quantitative easing, low interest rates and fiscal stimulus had material, lingering impacts on the U.S. economy, the banking system and our Company. Systemic liquidity and levels of deposits in the banking system increased significantly while a high level of uncertainty remained about the overall trajectory of the U.S. economy, leading to muted demand and risk appetite for commercial lending. Subsequently, as the social health impacts of the pandemic waned, 2022
29
brought rising inflation; monetary policy response included quantitative tightening and an unprecedented and rapid rise in the Fed's benchmark interest rate, leading to an outflow of deposits and liquidity from the banking system.
In summary, for BankUnited, the impact of the pandemic, accompanying economic uncertainty and the government response led to a balance sheet with a high level of lower-rate assets, particularly in the form of residential mortgages and securities. The subsequent rapid increase in interest rates and quantitative tightening led to deposit outflows, consistent with systemic trends, and an elevated level of more expensive wholesale funding. The events of early 2023 served to exacerbate the impact of deposit outflows and the increase in wholesale funding. A heightened level of focus on liquidity at regional and mid-size banks, while lessening considerably since the events of early 2023, remains.
Near-Term Strategic Priorities:
In response to the factors discussed above, we have established the following near-term strategic priorities:
•Improve the Bank's funding profile by maintaining or growing non-interest bearing and other core deposits and paying down higher cost wholesale funding;
•Improve the asset mix by re-positioning the balance sheet away from typically lower yielding transactional business such as residential mortgages and organically growing core commercial loans, which are generally higher-yielding, as a percent of total earning assets;
•Improve the net interest margin, largely a function of improved balance sheet composition;
•Maintain robust liquidity and capital;
•Continue to manage credit;
•Manage the rate of growth in operating expenses.
We have made progress executing on these near term strategic priorities:
•Since March 31, 2023, following the market reaction to the high profile closures of Silicon Valley Bank and Signature Bank, total non-brokered deposits have grown by $703 million and we have paid down FHLB advances by $2.4 billion.
•Since December 31, 2022, core commercial loan portfolio sub-segments have grown by $719 million while residential loans declined by $692 million and the amortized cost of investment securities declined by $959 million.
•The net interest margin, after declining from 2.62% for the first quarter of 2023 to 2.47% for the quarter ended June 30, 2023, increased to 2.56% for the quarter ended September 30, 2023, and again to 2.60% for the quarter ended December 31, 2023.
•Total same day available liquidity was $13.6 billion, the available liquidity to uninsured, uncollateralized deposits ratio was 152% and an estimated 66% of our deposits were insured or collateralized at December 31, 2023.
•Consolidated CET1 capital was 11.4% and pro-forma CET1, including accumulated other comprehensive income, was 10.0% at December 31, 2023.
•The ratio of non-performing assets to total assets was 0.37% at December 31, 2023, well below pre-pandemic levels. The net charge-off ratio for the year ended December 31, 2023, was 0.09%.
Some of the challenges we face in executing on both our near-term and longer-term strategic priorities, some of which may impact the banking industry more broadly, include:
•Execution of our strategic objectives is highly dependent on our ability to grow core client relationships. Competition for deposits and loans in our markets is intense with respect to the variety and quality of products and services offered, delivery channels, service levels and pricing. The economic health of our primary markets, monetary and fiscal policy, our ability to attract and retain talent and our ability to deliver technology and product solutions will impact execution of these objectives.
•The future trajectories of the macro-economy, interest rates, and monetary and fiscal policy are uncertain. The impact of these macro factors on our customers and prospective customers also impacts us. If macro conditions are less supportive than we currently anticipate, we may be less successful in executing our strategic priorities.
30
•We anticipate there will be changes to the regulatory framework governing the banking industry, in part in response to the events of early 2023. Some proposed rules have been issued, and more may be forthcoming. It is difficult to predict the nature or impact of future regulatory changes on our ability to achieve our strategic priorities.
See "Item 1A - Risk Factors" for additional discussion of risks to the execution of our strategic priorities.
2023 Performance Highlights:
In evaluating our financial performance, we consider the level of and trends in net interest income, the net interest margin, the cost of deposits, trends in non-interest income and non-interest expense, performance ratios such as the return on average equity and return on average assets and asset quality ratios, including the ratio of non-performing loans to total loans, non-performing assets to total assets, trends in criticized and classified assets and portfolio delinquency and charge-off trends. We consider the composition of earning assets and the funding mix, the composition and level of available liquidity and our interest rate risk profile. We analyze these ratios and trends against our own historical performance, our expected performance, our risk appetite and the financial condition and performance of comparable financial institutions.
Highlights include:
•Net income for the year ended December 31, 2023, was $178.7 million, or $2.38 per diluted share, compared to $285.0 million, or $3.54 per diluted share for the year ended December 31, 2022. For the year ended December 31, 2023, the return on average stockholders' equity was 7.01% and the return on average assets was 0.49%. Income before income taxes for the year ended December 31, 2023, was negatively impacted by margin pressure and an FDIC special assessment of $35.4 million.
•The net interest margin, calculated on a tax-equivalent basis was 2.56% for the year ended December 31, 2023, compared to 2.68% for the year ended December 31, 2022. An unfavorable shift in funding mix was the primary driver of a lower net interest margin. A sustained higher rate environment and quantitative tightening as well as events impacting the regional banking sector in early 2023 contributed to this shift. While lower year-over-year, the net interest margin expanded over the second half of 2023. The following chart provides a comparison of net interest margin, the interest rate spread, the average yield on interest earning assets and the average rate paid on interest bearing liabilities for the years ended December 31, 2023 and 2022 (on a tax equivalent basis):
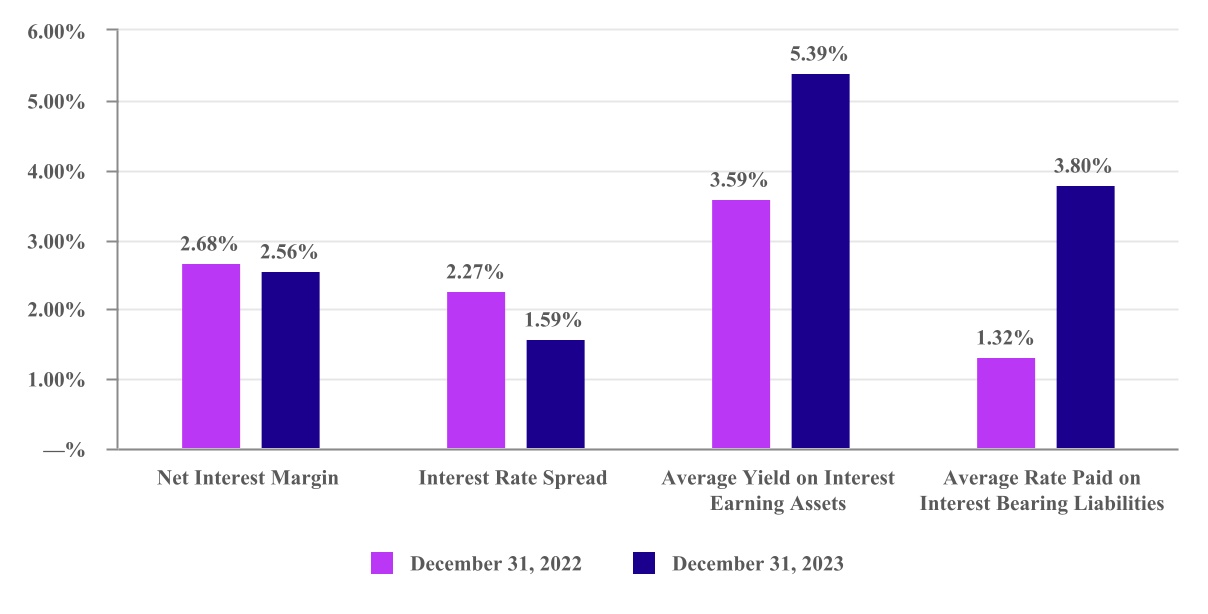
•The yield on average interest earning assets increased to 5.39% for the year ended December 31, 2023, from 3.59% for the year ended December 31, 2022, due to re-pricing of floating rate assets and the addition of new assets at higher rates and wider spreads.
•Consistent with industry trends, higher interest rates and restrictive monetary policy, the average cost of total deposits increased to 2.55% for the year ended December 31, 2023, from 0.65% for the year ended December 31, 2022, although the rate of increase declined over the latter half of the year.
31
•Loan portfolio composition shifted from residential to core commercial categories during the year ended December 31, 2023. Residential loans declined from 36% to 33% of the loan portfolio, while the core C&I and CRE categories grew from 56% to 60% of the portfolio.
•The following charts illustrate the composition of deposits at the dates indicated:
| December 31, 2023 | December 31, 2022 | |||||||
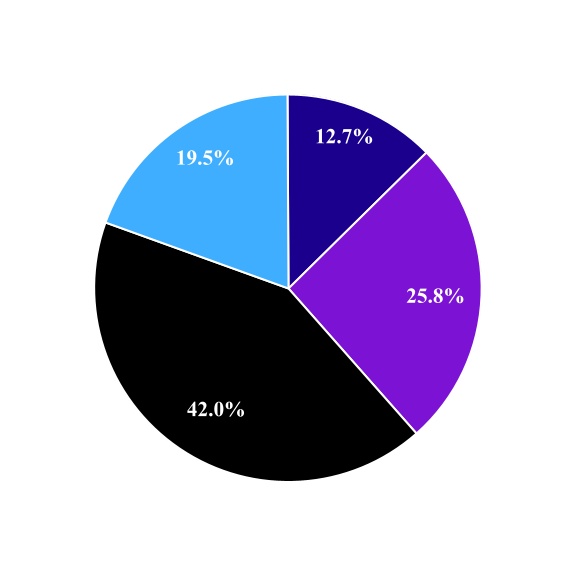
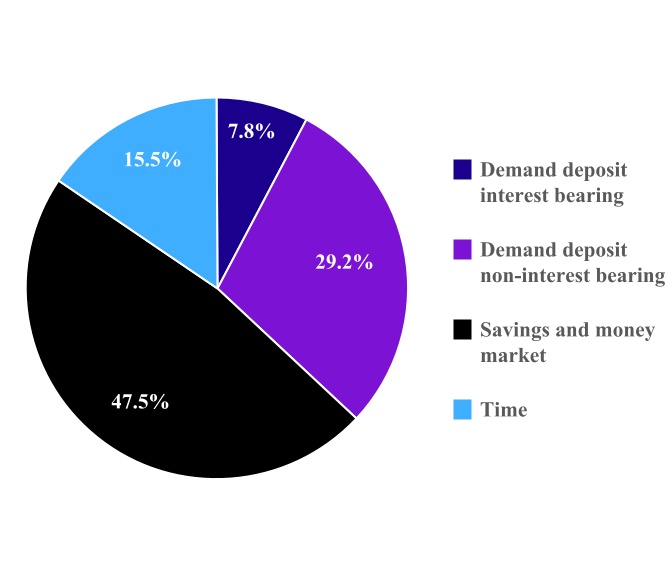
Total deposits declined by $971 million during the year ended December 31, 2023, consistent with industry trends brought on by tighter liquidity conditions and the liquidity events of early 2023. Non-interest bearing demand deposits declined by $1.2 billion; this decline reflected the impact of higher interest rates on title industry balances and depositors generally seeking yield in a sustained higher rate environment. The shift from money market deposits to time deposits reflected deposit outflows immediately following the bank closures in March 2023 and our response.
•The ratio of the ACL to total loans increased to 0.82% at December 31, 2023, from 0.59% at December 31, 2022. For the year ended December 31, 2023, the provision for credit losses was $87.6 million compared to a provision of $75.2 million for the year ended December 31, 2022. The most significant factors affecting the provision for credit losses and increase in the ACL for the year ended December 31, 2023 were changes in the economic forecast, risk rating migration, and increases in certain specific reserves. The increase in the ACL coverage ratio is consistent with the increase in criticized and classified assets, evolving commercial real estate market dynamics and shifts in portfolio composition.
•The net charge-off ratio for the year ended December 31, 2023 was 0.09% compared to 0.22% for the year ended December 31, 2022. NPAs remained low, totaling $130.6 million at December 31, 2023, compared to $107.0 million at December 31, 2022. The NPA ratio at December 31, 2023 was 0.37%, including 0.12% related to the guaranteed portion of non-performing SBA loans. At December 31, 2022, the NPA ratio was 0.29%, including 0.11% related to the guaranteed portion of non-performing SBA loans.
•Commercial real estate exposure is modest. Commercial real estate loans totaled 23.6% of loans at December 31, 2023, representing 169% of the Bank's total risk-based capital. At December 31, 2023, the weighted average LTV of the CRE portfolio was 56.0% and the weighted average DSCR was 1.80. 58% of the portfolio was secured by collateral properties located in Florida and 25% was secured by properties located in the New York tri-state area.
32
•Our capital position is robust. At December 31, 2023, CET1 was 11.4% at a consolidated level and pro-forma CET1, including accumulated other comprehensive income, was 10.0%. The ratio of tangible common equity/tangible assets had increased to 7.0%. The charts below present the Company's and the Bank's regulatory capital ratios at the dates indicated:
BankUnited, Inc.
| December 31, 2023 | December 31, 2022 | |||||||
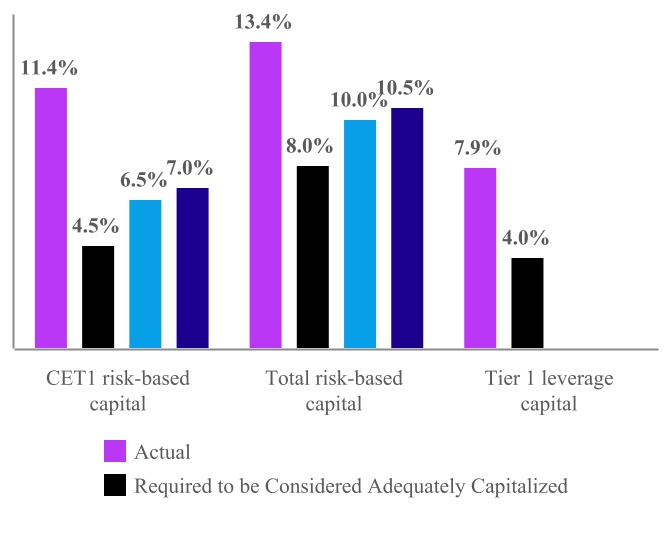
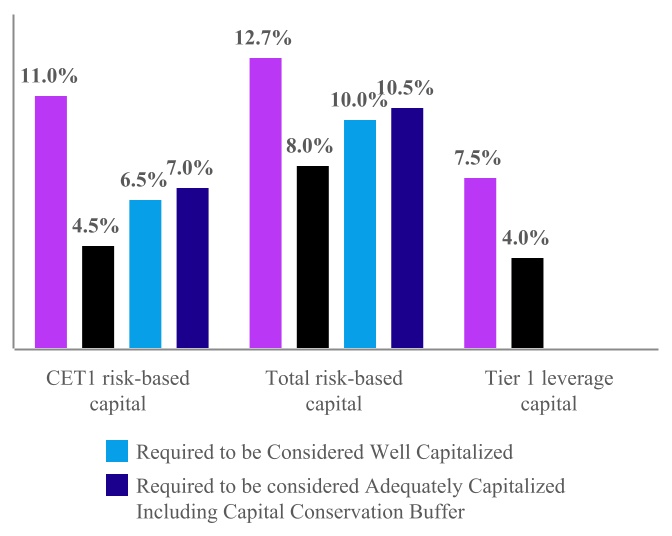
BankUnited, N.A
| December 31, 2023 | December 31, 2022 | |||||||
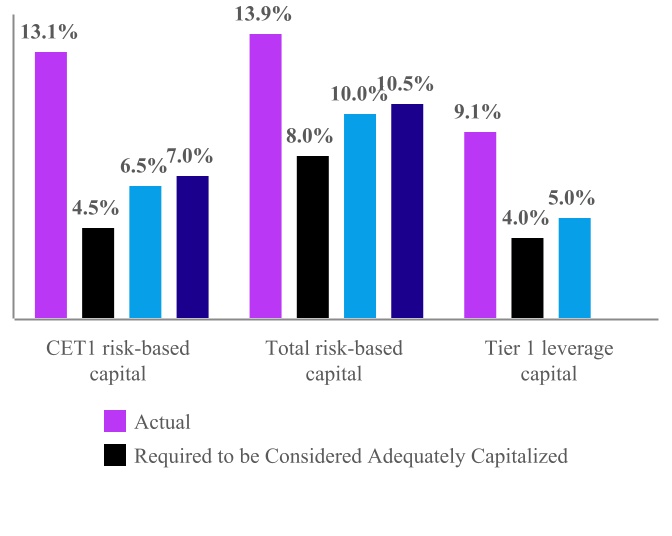
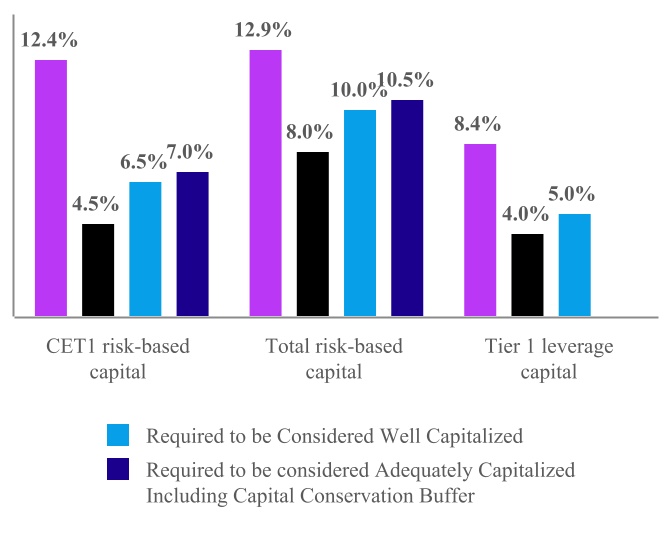
•The net unrealized pre-tax loss on the securities portfolio improved by $141 million for the year ended December 31, 2023, now representing 6% of amortized cost. AOCI, net of tax, improved by $50 million. The duration of our AFS securities portfolio is short at 1.96 at December 31, 2023, HTM securities are not significant.
•Book value and tangible book value per common share grew to $34.66 and $33.62, respectively, at December 31, 2023, from $32.19 and $31.16, respectively, at December 31, 2022.
•In the first quarter of 2023, the Company increased its quarterly cash dividend by $0.02, to $0.27 per share, reflecting an 8% increase from the previous quarterly cash dividend of $0.25 per share and maintained that quarterly dividend level through 2023.
33
•During the year ended December 31, 2023, the Company repurchased approximately 1.6 million shares of its common stock for an aggregate purchase price of $55.0 million.
•Liquidity is ample. Total same day available liquidity was $13.6 billion, the available liquidity to uninsured, uncollateralized deposits ratio was 152% and an estimated 66% of our deposits were insured or collateralized at December 31, 2023.
Critical Accounting Policies and Estimates
Our consolidated financial statements are prepared in accordance with GAAP and follow general practices within the banking industry. Application of these principles requires management to make complex and subjective estimates and judgments that affect the amounts reported in the consolidated financial statements and accompanying notes. We base our estimates on historical experience and on various other assumptions that we believe to be reasonable and appropriate under current circumstances. These assumptions form the basis for our judgments about the carrying values of assets and liabilities that are not readily available from independent, objective sources. We evaluate our estimates on an ongoing basis. Use of alternative assumptions may have resulted in significantly different estimates. Actual results may differ from these estimates. The most significant estimate impacting the Company's financial statements is the ACL.
Accounting policies are an integral part of our financial statements. A thorough understanding of these accounting policies is essential when reviewing our reported results of operations and our financial position. We believe that the critical accounting policies and estimates discussed below involve a heightened level of management judgment due to the complexity, subjectivity and sensitivity involved in their application.
Note 1 to the consolidated financial statements contains a further discussion of our significant accounting policies.
ACL
The ACL represents management's estimate of current expected credit losses, or the amount of amortized cost basis not expected to be collected, on our loan portfolio and the amount of credit loss impairment on our AFS securities portfolio. Determining the amount of the ACL is considered a critical accounting estimate because of its complexity and because it requires extensive judgment and estimation. Estimates that are particularly susceptible to change that may have a material impact on the amount of the ACL include:
•our evaluation of current conditions;
•our determination of a reasonable and supportable economic forecast or weighting of various forecast paths and selection of the reasonable and supportable forecast period;
•our evaluation of historical loss experience and selection of historical loss data used in formulating our ACL estimate; since we have limited company specific historical loss data, our modeling techniques also leverage broad external data sets for this purpose;
•our evaluation of changes in composition and characteristics of the loan portfolio, including internal risk ratings;
•our estimate of expected prepayments;
•the value of underlying collateral, which may impact loss severity and certain cash flow assumptions for collateral-dependent, criticized and classified loans; in the current environment, especially with respect to certain commercial real estate sectors like office, current and projected collateral values may be particularly challenging to estimate;
•our selection and evaluation of qualitative factors; and
•our estimate of expected cash flows on AFS debt securities in unrealized loss positions.
Our selection of models and modeling techniques may also have a material impact on the estimate.
Note 1 to the consolidated financial statements describes the methodology used to determine the ACL.
Recent Accounting Pronouncements
See Note 1 to the consolidated financial statements for a discussion of recent accounting pronouncements.
34
Results of Operations
Net Interest Income
Net interest income is the difference between interest earned on interest earning assets and interest incurred on interest bearing liabilities and is the primary driver of core earnings. Net interest income is impacted by the mix of interest earning assets and interest bearing liabilities, the ratio of interest earning assets to total assets and of interest bearing liabilities to total funding sources, movements in market interest rates and monetary policy, the shape of the yield curve, levels of non-performing assets and pricing pressure from competitors.
The mix of interest earning assets is influenced by loan demand, market and competitive conditions in our primary lending markets, by management's continual assessment of the rate of return and relative risk associated with various classes of earning assets and liquidity considerations. The mix of funding sources is influenced by the Company's liquidity profile, management's assessment of the desire for lower cost funding sources weighed against relationships with customers and growth expectations, our ability to attract and retain core deposit relationships, competition for deposits in the Company's markets and the availability and pricing of other sources of funds. For the year ended December 31, 2023, the funding mix and net interest margin were negatively impacted by the higher interest rate environment and restrictive monetary policy stance of the FRB which have led to a decline in deposit levels across the banking system, increased competition for deposits and higher deposit costs. Deposit outflows related to events that impacted the banking sector in March 2023 also negatively impacted the cost of funds and net interest margin. These factors contributed to declines in average non-interest bearing demand deposits and to an increase in higher cost funding sources, including higher cost time deposits and wholesale funding such as FHLB advances. Over the latter half of 2023, however, we have seen margin expansion as wholesale funding levels have declined and yields on interest earning assets have increased.
35
The following table presents, for the periods indicated, information about (i) average balances, the total dollar amount of taxable equivalent interest income from earning assets and the resultant average yields; (ii) average balances, the total dollar amount of interest expense on interest bearing liabilities and the resultant average rates; (iii) net interest income; (iv) the interest rate spread; and (v) the net interest margin. Non-accrual loans are included in the average balances presented in this table; however, interest income foregone on non-accrual loans is not included. Interest income, yields, spread and margin have been calculated on a tax-equivalent basis for loans and investment securities that are exempt from federal income taxes, at a federal tax rate of 21% (dollars in thousands):
| Years Ended December 31, | |||||||||||||||||||||||||||||||||||||||||||||||||||||
| 2023 | 2022 | 2021 | |||||||||||||||||||||||||||||||||||||||||||||||||||
| Average Balance | Interest (1) | Yield/ Rate (1) | Average Balance | Interest (1) | Yield/ Rate (1) | Average Balance | Interest (1) | Yield/ Rate (1) | |||||||||||||||||||||||||||||||||||||||||||||
| Loans | $ | 24,558,430 | $ | 1,331,578 | 5.42 | % | $ | 23,937,857 | $ | 947,386 | 3.96% | $ | 23,083,973 | $ | 814,101 | 3.53 | % | ||||||||||||||||||||||||||||||||||||
Investment securities (2) | 9,228,718 | 491,851 | 5.33 | % | 10,081,701 | 283,081 | 2.81% | 9,873,178 | 155,353 | 1.57 | % | ||||||||||||||||||||||||||||||||||||||||||
| Other interest earning assets | 986,186 | 51,152 | 5.19 | % | 675,068 | 15,709 | 2.33% | 1,093,869 | 6,010 | 0.55 | % | ||||||||||||||||||||||||||||||||||||||||||
| Total interest earning assets | 34,773,334 | 1,874,581 | 5.39 | % | 34,694,626 | 1,246,176 | 3.59% | 34,051,020 | 975,464 | 2.86 | % | ||||||||||||||||||||||||||||||||||||||||||
| Allowance for credit losses | (171,618) | (132,033) | (197,212) | ||||||||||||||||||||||||||||||||||||||||||||||||||
| Non-interest earning assets | 1,749,981 | 1,721,570 | 1,770,685 | ||||||||||||||||||||||||||||||||||||||||||||||||||
| Total assets | $ | 36,351,697 | $ | 36,284,163 | $ | 35,624,493 | |||||||||||||||||||||||||||||||||||||||||||||||
| Liabilities and Stockholders' Equity: | |||||||||||||||||||||||||||||||||||||||||||||||||||||
| Interest bearing liabilities: | |||||||||||||||||||||||||||||||||||||||||||||||||||||
| Interest bearing demand deposits | $ | 2,905,968 | $ | 86,759 | 2.99 | % | $ | 2,538,906 | $ | 13,919 | 0.55 | % | $ | 3,027,649 | $ | 8,550 | 0.28 | % | |||||||||||||||||||||||||||||||||||
| Savings and money market deposits | 10,704,470 | 382,432 | 3.57 | % | 12,874,240 | 130,705 | 1.02 | % | 13,339,651 | 43,082 | 0.32 | % | |||||||||||||||||||||||||||||||||||||||||
| Time deposits | 5,169,458 | 191,114 | 3.70 | % | 3,338,671 | 35,348 | 1.06 | % | 3,490,082 | 15,964 | 0.46 | % | |||||||||||||||||||||||||||||||||||||||||
| Total interest bearing deposits | 18,779,896 | 660,305 | 3.52 | % | 18,751,817 | 179,972 | 0.96 | % | 19,857,382 | 67,596 | 0.34 | % | |||||||||||||||||||||||||||||||||||||||||
| Federal funds purchased | 35,403 | 1,611 | 4.55 | % | 157,979 | 2,723 | 1.72 | % | 33,945 | 30 | 0.09 | % | |||||||||||||||||||||||||||||||||||||||||
| FHLB advances | 6,331,685 | 285,026 | 4.50 | % | 4,383,507 | 97,763 | 2.23 | % | 2,622,723 | 59,116 | 2.25 | % | |||||||||||||||||||||||||||||||||||||||||
| Notes and other borrowings | 716,633 | 36,835 | 5.14 | % | 721,223 | 37,033 | 5.13 | % | 721,803 | 37,018 | 5.13 | % | |||||||||||||||||||||||||||||||||||||||||
| Total interest bearing liabilities | 25,863,617 | 983,777 | 3.80 | % | 24,014,526 | 317,491 | 1.32 | % | 23,235,853 | 163,760 | 0.70 | % | |||||||||||||||||||||||||||||||||||||||||
| Non-interest bearing demand deposits | 7,091,029 | 8,861,111 | 8,480,964 | ||||||||||||||||||||||||||||||||||||||||||||||||||
| Other non-interest bearing liabilities | 848,023 | 708,473 | 784,031 | ||||||||||||||||||||||||||||||||||||||||||||||||||
| Total liabilities | 33,802,669 | 33,584,110 | 32,500,848 | ||||||||||||||||||||||||||||||||||||||||||||||||||
| Stockholders' equity | 2,549,028 | 2,700,053 | 3,123,645 | ||||||||||||||||||||||||||||||||||||||||||||||||||
| Total liabilities and stockholders' equity | $ | 36,351,697 | $ | 36,284,163 | $ | 35,624,493 | |||||||||||||||||||||||||||||||||||||||||||||||
| Net interest income | $ | 890,804 | $ | 928,685 | $ | 811,704 | |||||||||||||||||||||||||||||||||||||||||||||||
| Interest rate spread | 1.59 | % | 2.27 | % | 2.16 | % | |||||||||||||||||||||||||||||||||||||||||||||||
| Net interest margin | 2.56 | % | 2.68 | % | 2.38 | % | |||||||||||||||||||||||||||||||||||||||||||||||
(1)On a tax-equivalent basis where applicable. The tax-equivalent adjustment for tax-exempt loans was $13.4 million, $12.7 million and $13.3 million for the years ended December 31, 2023, 2022 and 2021, respectively. The tax-equivalent adjustment for tax-exempt investment securities was $3.6 million, $3.0 million and $2.7 million for the years ended December 31, 2023, 2022 and 2021, respectively.
(2)At fair value except for securities held to maturity.
36
Increases and decreases in interest income, calculated on a tax-equivalent basis, and interest expense result from changes in average balances (volume) of interest earning assets and liabilities, as well as changes in average interest rates. The following table shows the effect that these factors had on the interest earned on our interest earning assets and the interest incurred on our interest bearing liabilities for the years indicated. The effect of changes in volume is determined by multiplying the change in volume by the previous year's average rate. Similarly, the effect of rate changes is calculated by multiplying the change in average rate by the previous year's volume. Changes applicable to both volume and rate have been allocated to volume (in thousands):
2023 Compared to 2022 | 2022 Compared to 2021 | ||||||||||||||||||||||||||||||||||
| Change Due to Volume | Change Due to Rate | Increase (Decrease) | Change Due to Volume | Change Due to Rate | Increase (Decrease) | ||||||||||||||||||||||||||||||
| Interest Income Attributable to: | |||||||||||||||||||||||||||||||||||
| Loans | $ | 34,699 | $ | 349,493 | $ | 384,192 | $ | 34,024 | $ | 99,261 | $ | 133,285 | |||||||||||||||||||||||
| Investment securities | (45,289) | 254,059 | 208,770 | 5,301 | 122,427 | 127,728 | |||||||||||||||||||||||||||||
| Other interest earning assets | 16,136 | 19,307 | 35,443 | (9,772) | 19,471 | 9,699 | |||||||||||||||||||||||||||||
| Total interest earning assets | 5,546 | 622,859 | 628,405 | 29,553 | 241,159 | 270,712 | |||||||||||||||||||||||||||||
| Interest Expense Attributable to: | |||||||||||||||||||||||||||||||||||
| Interest bearing demand deposits | 10,891 | 61,949 | 72,840 | (2,806) | 8,175 | 5,369 | |||||||||||||||||||||||||||||
| Savings and money market deposits | (76,566) | 328,293 | 251,727 | (5,755) | 93,378 | 87,623 | |||||||||||||||||||||||||||||
| Time deposits | 67,625 | 88,141 | 155,766 | (1,556) | 20,940 | 19,384 | |||||||||||||||||||||||||||||
| Total interest bearing deposits | 1,950 | 478,383 | 480,333 | (10,117) | 122,493 | 112,376 | |||||||||||||||||||||||||||||
| Federal funds purchased | (5,583) | 4,471 | (1,112) | 2,140 | 553 | 2,693 | |||||||||||||||||||||||||||||
| FHLB advances | 87,757 | 99,506 | 187,263 | 39,172 | (525) | 38,647 | |||||||||||||||||||||||||||||
| Notes and other borrowings | (270) | 72 | (198) | 15 | — | 15 | |||||||||||||||||||||||||||||
| Total interest expense | 83,854 | 582,432 | 666,286 | 31,210 | 122,521 | 153,731 | |||||||||||||||||||||||||||||
Increase (decrease) in tax-equivalent net interest income | $ | (78,308) | $ | 40,427 | $ | (37,881) | $ | (1,657) | $ | 118,638 | $ | 116,981 | |||||||||||||||||||||||
Net interest income, calculated on a tax-equivalent basis, was $890.8 million for the year ended December 31, 2023, compared to $928.7 million for the year ended December 31, 2022, a decrease of $37.9 million, comprised of increases in tax-equivalent interest income and interest expense of $628.4 million and $666.3 million, respectively.
The increase in interest income for the year ended December 31, 2023, compared to the year ended December 31, 2022, reflected (i) an increase in both the average balances of and yields on loans; (ii) rising yields on investment securities that more than offset declines in average balances; and (iii) to a lesser extent, higher yields on and average balances of other interest earning assets. Increased yields on average interest earning assets were mainly reflective of the increase in market interest rates, which impacted both coupon rate resets on existing floating rate assets and the rates on new assets added to the balance sheet. The increase in interest expense for the year ended December 31, 2023, compared to the year ended December 31, 2022, reflected primarily (i) an increase in the cost of interest-bearing deposits and (ii) increases in both the cost and average balance of FHLB advances.
The net interest margin, calculated on a tax-equivalent basis, was 2.56% for the year ended December 31, 2023, compared to 2.68% for the year ended December 31, 2022. Offsetting factors impacting the net interest margin for the year ended December 31, 2023, compared to the year ended December 31, 2022, included:
•The most significant factor leading to the year-over-year decline in the net interest margin was an unfavorable shift in the funding mix for the year ended December 31, 2023, as compared to the year ended December 31, 2022. Average non-interest bearing demand deposits declined, both in absolute terms and as a percentage of average total liabilities, while FHLB advances grew, both in absolute terms and as a percentage of average total liabilities. Within interest-bearing deposits, there was a shift toward higher cost time deposits, largely in response to the events of March 2023. Two significant factors impacting the decline in average non-interest bearing deposits were (i) the impact of rising residential mortgage rates on levels of activity in the residential real estate sector leading to a decline in balances in the title insurance industry vertical and (ii) depositors seeking yield in a higher rate environment. In part, the increase in average FHLB advances reflected the impact of deposit outflows immediately following the events of March 2023.
•The tax-equivalent yield on loans expanded to 5.42% for the year ended December 31, 2023, from 3.96% for the year ended December 31, 2022. Factors contributing to this increase were the resetting of variable rate loans at higher coupon rates and originations of new loans at higher prevailing rates and wider spreads.
37
•The tax-equivalent yield on investment securities increased to 5.33% for the year ended December 31, 2023, from 2.81% for the year ended December 31, 2022. This increase resulted primarily from the reset of coupon rates on variable rate securities and to a lesser extent, purchases of higher-yielding securities, and paydowns and sales of lower-yielding securities.
•The average rate paid on interest bearing deposits increased to 3.52% for the year ended December 31, 2023, from 0.96% for the year ended December 31, 2022, in response to the higher rate environment, tighter liquidity conditions and resulting competition for deposits.
•The average rate paid on FHLB advances increased to 4.50% for the year ended December 31, 2023, from 2.23% for the year ended December 31, 2022, primarily due to rising rates.
Provision for Credit Losses
The provision for credit losses is a charge or credit to earnings required to maintain the ACL at a level consistent with management’s estimate of expected credit losses on financial assets carried at amortized cost at the balance sheet date. The amount of the provision is impacted by changes in current economic conditions as well as in management's reasonable and supportable economic forecast, loan originations and runoff, changes in portfolio mix, risk rating migration and portfolio seasoning, changes in specific reserves, changes in expected prepayment speeds and other assumptions. The provision for credit losses also includes amounts related to off-balance sheet credit exposures and may include amounts related to accrued interest receivable and AFS debt securities.
The following table presents the components of the provision for (recovery of) credit losses for the periods indicated (in thousands):
| Years Ended December 31, | |||||||||||||||||
| 2023 | 2022 | 2021 | |||||||||||||||
| Amount related to funded portion of loans | $ | 78,924 | $ | 73,814 | $ | (64,456) | |||||||||||
| Amount related to off-balance sheet credit exposures | 8,683 | 1,467 | (1,235) | ||||||||||||||
Other | — | (127) | (1,428) | ||||||||||||||
Total provision for (recovery of) credit losses | $ | 87,607 | $ | 75,154 | $ | (67,119) | |||||||||||
The most significant factors impacting the provision for credit losses for the year ended December 31, 2023, included changes in the economic forecast, new commercial loan production, risk rating migration and an increase in certain specific reserves.
The provision for credit losses may be volatile and the level of the ACL may change materially from current levels. Future levels of the ACL could be significantly impacted, in either direction, by changes in factors such as, but not limited to, economic conditions or the economic outlook, the composition of the loan portfolio, the financial condition of our borrowers and collateral values.
The determination of the amount of the ACL is complex and involves a high degree of judgment and subjectivity. See “Analysis of the Allowance for Credit Losses” below for more information about how we determine the appropriate level of the ACL and about factors that impacted the ACL and provision for credit losses.
38
Non-Interest Income
The following table presents a comparison of the categories of non-interest income for the periods indicated (in thousands):
| Years Ended December 31, | |||||||||||||||||
| 2023 | 2022 | 2021 | |||||||||||||||
| Deposit service charges and fees | $ | 21,682 | $ | 23,402 | $ | 21,685 | |||||||||||
| Gain (loss) on sale of loans, net | (3,711) | (2,570) | 24,394 | ||||||||||||||
| Gain (loss) on investment securities: | |||||||||||||||||
| Net realized gain on sale of securities AFS | 1,815 | 3,927 | 9,010 | ||||||||||||||
Net loss on marketable equity securities recognized in earnings | (11,867) | (19,732) | (2,564) | ||||||||||||||
| Gain (loss) on investment securities, net | (10,052) | (15,805) | 6,446 | ||||||||||||||
| Lease financing | 45,882 | 54,111 | 53,263 | ||||||||||||||
| Other non-interest income | 33,037 | 18,498 | 28,365 | ||||||||||||||
| $ | 86,838 | $ | 77,636 | $ | 134,153 | ||||||||||||
The losses on marketable equity securities during the years ended December 31, 2023 and 2022, were attributable to losses related to certain preferred equity investments.
The decrease in lease financing revenue for the year ended December 31, 2023, compared to the year ended December 31, 2022, was attributable to (i) a net loss of $2.0 million on sale of operating lease equipment recognized during the year ended December 31, 2023, compared to a net gain of $2.3 million recognized during the year ended December 31, 2022, a variance of $4.3 million; and (ii) the impact of the sale of some operating lease equipment, reducing the size of the portfolio.
The most significant factors leading to the increase in other non-interest income for the year ended December 31, 2023, compared to the year ended December 31, 2022, were increases in BOLI income, particularly as related to the BOLI assets supporting our deferred compensation plan, lending related fees and revenue from our customer derivative program.
Non-Interest Expense
The following table presents the components of non-interest expense for the periods indicated (in thousands):
| Years Ended December 31, | |||||||||||||||||
| 2023 | 2022 | 2021 | |||||||||||||||
| Employee compensation and benefits | $ | 280,744 | $ | 265,548 | $ | 243,532 | |||||||||||
| Occupancy and equipment | 43,345 | 45,400 | 47,944 | ||||||||||||||
| Deposit insurance expense | 66,747 | 17,999 | 18,695 | ||||||||||||||
| Professional fees | 14,184 | 11,730 | 14,386 | ||||||||||||||
| Technology | 79,984 | 77,103 | 67,500 | ||||||||||||||
| Discontinuance of cash flow hedges | — | — | 44,833 | ||||||||||||||
Depreciation and impairment of operating lease equipment | 44,446 | 50,388 | 53,764 | ||||||||||||||
| Other non-interest expense | 106,501 | 72,142 | 56,921 | ||||||||||||||
| Total non-interest expense | $ | 635,951 | $ | 540,310 | $ | 547,575 | |||||||||||
Year-over-year increases in employee compensation and benefits reflected labor market dynamics.
Increases in deposit insurance expense were primarily attributable to an increase in the assessment rate and a $35.4 million special assessment during the year ended December 31, 2023.
The decline in depreciation and impairment of operating lease equipment for the year ended December 31, 2023, compared to the year ended December 31, 2022, is primarily attributed to the decline in operating lease equipment.
The most significant factor impacting the increase in other non-interest expense for the year ended December 31, 2023, compared to the year ended December 31, 2022, was costs related to certain depositor rebate and commission programs, some of which are correlated with changes in interest rates. See Note 6 to the consolidated financial statements for more information about these costs.
39
Income Taxes
The provision for income taxes for the years ended December 31, 2023, 2022 and 2021 was $58.4 million, $90.2 million and $34.4 million, respectively. The Company's effective income tax rate was 24.64%, 24.03% and 7.66% for the years ended 2023, 2022 and 2021, respectively. The effective income tax rate for the year ended December 31, 2021 was impacted by a settlement with the Florida Department of Revenue related to certain tax matters for the 2009-2019 tax years and a reduction in the liability for unrecognized tax benefits arising primarily from expiration of statues of limitations in federal and certain state jurisdictions.
See Note 9 to the consolidated financial statements for more information about income taxes including a reconciliation of the Company's effective income tax rate to the statutory federal rate.
Analysis of Financial Condition
For the year ended December 31, 2023, compared to the year ended December 31, 2022, average non-interest bearing demand deposits declined by $1.8 billion, while average interest bearing deposits remained relatively flat, increasing by $28 million. Correspondingly, average FHLB advances grew by $1.9 billion. The year-over-year decline in average non-interest bearing demand deposits reflected the impact on the title insurance industry vertical of lower levels of activity in the residential mortgage sector brought on by rising mortgage rates, and was consistent with broader industry deposit trends evidencing restrictive monetary policy as customers sought higher yields on their cash balances. Within the interest-bearing categories, average interest bearing non-maturity deposits declined by $1.8 billion, while average time deposits increased by $1.8 billion. This shift reflected deposit outflows from a relatively small number of larger money-market relationships immediately after the initial regional bank closures in March 2023, followed by a strategic shift toward less volatile time deposits in a challenging liquidity environment. While average interest-earning assets remained relatively flat, increasing by $79 million for the year ended December 31, 2023, compared to the year ended December 31, 2022, average loans grew by $621 million and average investment securities declined by $853 million. This shift reflected our near-term strategic priorities with respect to improving the asset mix. The increase of $311 million in other interest earning assets was due to higher levels of cash held at the FRB in response to the events of March 2023.
Investment Securities
The following table shows the amortized cost and carrying value, which, with the exception of investment securities held to maturity, is fair value, of investment securities at the dates indicated (in thousands):
| December 31, 2023 | December 31, 2022 | ||||||||||||||||||||||
| Amortized Cost | Carrying Value | Amortized Cost | Carrying Value | ||||||||||||||||||||
| U.S. Treasury securities | $ | 139,858 | $ | 130,592 | $ | 148,956 | $ | 135,841 | |||||||||||||||
| U.S. Government agency and sponsored enterprise residential MBS | 1,962,658 | 1,924,207 | 2,036,693 | 1,983,168 | |||||||||||||||||||
| U.S. Government agency and sponsored enterprise commercial MBS | 561,557 | 497,859 | 600,517 | 525,094 | |||||||||||||||||||
Private label residential MBS and CMOs | 2,596,231 | 2,295,730 | 2,864,589 | 2,530,663 | |||||||||||||||||||
Private label commercial MBS | 2,282,833 | 2,198,743 | 2,645,168 | 2,524,354 | |||||||||||||||||||
| Single family real estate-backed securities | 383,984 | 366,255 | 502,194 | 470,441 | |||||||||||||||||||
| Collateralized loan obligations | 1,122,799 | 1,112,824 | 1,166,838 | 1,136,463 | |||||||||||||||||||
| Non-mortgage asset-backed securities | 106,095 | 102,780 | 102,194 | 95,976 | |||||||||||||||||||
| State and municipal obligations | 107,176 | 102,618 | 122,181 | 116,661 | |||||||||||||||||||
| SBA securities | 106,237 | 103,024 | 139,320 | 135,782 | |||||||||||||||||||
| Investment securities held to maturity | 10,000 | 10,000 | 10,000 | 10,000 | |||||||||||||||||||
| $ | 9,379,428 | 8,844,632 | $ | 10,338,650 | 9,664,443 | ||||||||||||||||||
| Marketable equity securities | 32,722 | 90,884 | |||||||||||||||||||||
| $ | 8,877,354 | $ | 9,755,327 | ||||||||||||||||||||
40
Our investment strategy is focused on ensuring adequate liquidity, maintaining a suitable balance of high credit quality, diverse assets, managing interest rate risk, and generating acceptable returns given our established risk parameters. We have sought to maintain liquidity by investing a significant portion of the portfolio in high quality liquid securities including U.S. Treasury and U.S. Government Agency and sponsored enterprise securities. Investment grade municipal securities provide liquidity and attractive tax-equivalent yields. We have also invested in highly-rated structured products, including private-label commercial and residential MBS, collateralized loan obligations, single family real estate-backed securities and non-mortgage asset-backed securities that, while somewhat less liquid, are generally pledgeable at either the FHLB or the FRB and provide us with attractive yields. We remain committed to keeping the duration of our securities portfolio short; relatively short effective portfolio duration helps mitigate interest rate risk. Based on the Company’s assumptions, the estimated weighted average life of the investment portfolio as of December 31, 2023 was 5.6 years and the effective duration of the investment portfolio was 1.97 years.
The investment securities AFS portfolio was in a net unrealized loss position of $534.8 million at December 31, 2023, compared to a net unrealized loss position of $674.2 million at December 31, 2022, improving by $139.4 million during the year ended December 31, 2023. Net unrealized losses at December 31, 2023 included $5.0 million of gross unrealized gains and $539.8 million of gross unrealized losses. Investment securities available for sale in unrealized loss positions at December 31, 2023 had an aggregate fair value of $8.4 billion. The unrealized losses resulted primarily from a sustained period of higher interest rates, and in some cases, wider spreads compared to the levels at which securities were purchased. Market volatility and yield curve dislocations have also contributed to unrealized losses. None of the unrealized losses were attributable to credit loss impairments.
The ratings distribution of our AFS securities portfolio at the dates indicated are depicted in the charts below:
| December 31, 2023 | December 31, 2022 | |||||||
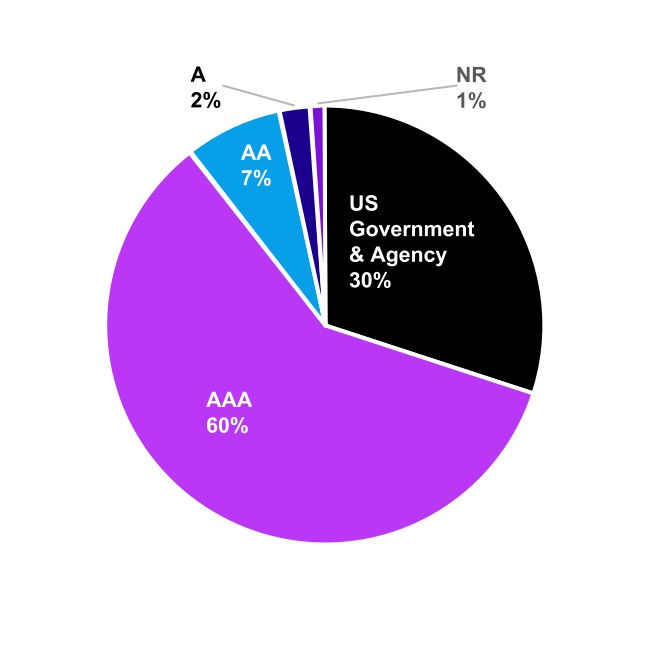
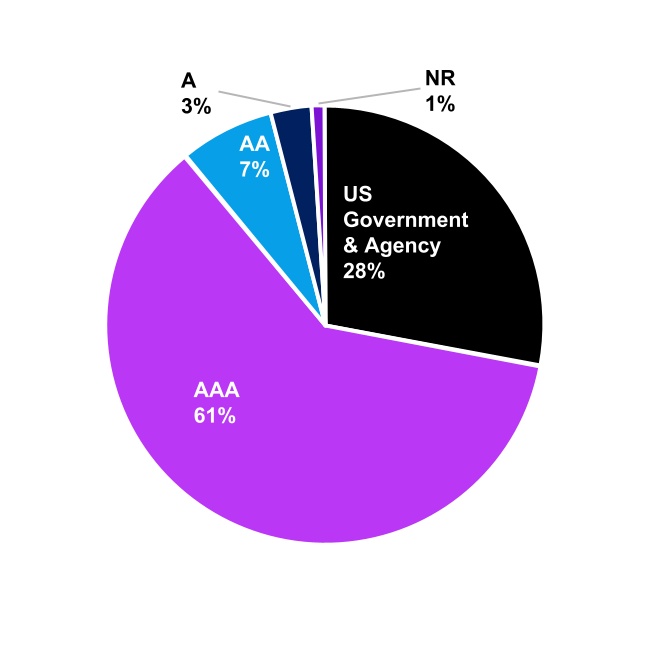
We evaluate the credit quality of individual securities in the portfolio quarterly to determine whether we expect to recover the amortized cost basis of the investments in unrealized loss positions. This evaluation considers, but is not necessarily limited to, the following factors, the relative significance of which varies depending on the circumstances pertinent to each individual security:
•Whether we intend to sell the security prior to recovery of its amortized cost basis;
•Whether it is more likely than not that we will be required to sell the security prior to recovery of its amortized cost basis;
•The extent to which fair value is less than amortized cost;
•Adverse conditions specifically related to the security, a sector, an industry or geographic area;
41
•Changes in the financial condition of the issuer or underlying loan obligors;
•The payment structure and remaining payment terms of the security, including levels of subordination or over-collateralization;
•Failure of the issuer to make scheduled payments;
•Changes in credit ratings;
•Relevant market data; and
•Estimated prepayments, defaults, and the value and performance of underlying collateral at the individual security level.
We regularly engage with bond managers to monitor trends in underlying collateral, including potential downgrades and subsequent cash flow diversions, liquidity, ratings migration, and any other relevant developments.
We do not intend to sell securities in significant unrealized loss positions at December 31, 2023. Based on an assessment of our liquidity position and internal and regulatory guidelines for permissible investments and concentrations, it is not more likely than not that we will be required to sell securities in significant unrealized loss positions prior to recovery of amortized cost basis, which may be at maturity. While the events of early 2023 impacting the banking sector have impacted the liquidity profile of many banks, including BankUnited, the substantial majority of our investment securities are pledgeable at either the FHLB or FRB. We have not sold, and do not anticipate the need to sell, securities in unrealized loss positions to generate liquidity.
We have implemented a robust credit stress testing framework with respect to our non-agency securities. The following table presents subordination levels and average internal stress scenario losses for select non-agency portfolio segments at December 31, 2023:
| Subordination | Weighted Average Stress Scenario Loss | ||||||||||||||||||||||||||||||||||
| Rating | Percent of Total | Minimum | Maximum | Average | |||||||||||||||||||||||||||||||
| Private label CMBS | AAA | 85.8 | % | 30.2 | 99.9 | 43.9 | 7.1 | ||||||||||||||||||||||||||||
| AA | 10.6 | % | 29.5 | 74.4 | 37.0 | 7.7 | |||||||||||||||||||||||||||||
| A | 3.6 | % | 25.1 | 51.5 | 37.3 | 9.1 | |||||||||||||||||||||||||||||
| Weighted average | 100.0 | % | 29.9 | 95.5 | 43.0 | 7.2 | |||||||||||||||||||||||||||||
| CLOs | AAA | 80.2 | % | 40.2 | 74.2 | 47.1 | 15.7 | ||||||||||||||||||||||||||||
| AA | 16.2 | % | 30.8 | 47.0 | 37.3 | 13.0 | |||||||||||||||||||||||||||||
| A | 3.6 | % | 31.5 | 33.2 | 32.2 | 14.4 | |||||||||||||||||||||||||||||
| Weighted average | 100.0 | % | 38.4 | 68.3 | 45.0 | 15.2 | |||||||||||||||||||||||||||||
Private label residential MBS and CMOs | AAA | 94.0 | % | 3.0 | 92.0 | 17.7 | 2.2 | ||||||||||||||||||||||||||||
| AA | 4.2 | % | 20.2 | 34.2 | 24.8 | 5.3 | |||||||||||||||||||||||||||||
| A | 1.8 | % | 27.3 | 28.2 | 27.7 | 5.7 | |||||||||||||||||||||||||||||
| Weighted average | 100.0 | % | 4.2 | 88.4 | 18.2 | 2.4 | |||||||||||||||||||||||||||||
While for certain portfolio segments, we have seen an increase in stress scenario losses over the last year, the level of subordination continues to provide more than sufficient coverage of stress scenario collateral losses, further supporting our determination that none of our securities are credit loss impaired. The scenario used to project stress scenario losses is generally calibrated to the level of stress experienced in the Great Financial Crisis. For further discussion of our analysis of impaired investment securities AFS for credit loss impairment, see Note 3 to the consolidated financial statements.
We use third-party pricing services to assist us in estimating the fair value of investment securities. We perform a variety of procedures to ensure that we have a thorough understanding of the methodologies and assumptions used by the pricing services including obtaining and reviewing written documentation of the methods and assumptions employed, conducting interviews with valuation desk personnel and reviewing model results and detailed assumptions used to value selected securities as considered necessary. Our classification of prices within the fair value hierarchy is based on an evaluation of the nature of the
42
significant assumptions impacting the valuation of each type of security in the portfolio. We have established a robust price challenge process that includes a review by our treasury front office of all prices provided on a quarterly basis. Any price evidencing unexpected quarter over quarter fluctuations or deviations from our expectations based on recent observed trading activity and other information available in the marketplace that would impact the value of the security is challenged. Responses to the price challenges, which generally include specific information about inputs and assumptions incorporated in the valuation and their sources, are reviewed in detail. If considered necessary to resolve any discrepancies, a price will be obtained from additional independent valuation sources. We do not typically adjust the prices provided, other than through this established challenge process. Our primary pricing services utilize observable inputs when available, and employ unobservable inputs and proprietary models only when observable inputs are not available. As a matter of course, the services validate prices by comparison to recent trading activity whenever such activity exists. Quotes obtained from the pricing services are typically non-binding.
The majority of our investment securities are classified within level 2 of the fair value hierarchy. U.S. Treasury securities and marketable equity securities are classified within level 1 of the hierarchy.
For additional disclosure related to the fair values of investment securities, see Note 14 to the consolidated financial statements.
The following table shows the weighted average prospective yields, categorized by scheduled maturity, for AFS investment securities as of December 31, 2023. Scheduled maturities have been adjusted for anticipated prepayments when applicable. Yields on tax-exempt securities have been calculated on a tax-equivalent basis, based on a federal income tax rate of 21%:
| Within One Year | After One Year Through Five Years | After Five Years Through Ten Years | After Ten Years | Total | |||||||||||||||||||||||||
| U.S. Treasury securities | 0.52 | % | 4.45 | % | 0.89 | % | — | % | 1.57 | % | |||||||||||||||||||
| U.S. Government agency and sponsored enterprise residential MBS | 5.53 | % | 5.73 | % | 5.94 | % | 5.79 | % | 5.77 | % | |||||||||||||||||||
| U.S. Government agency and sponsored enterprise commercial MBS | 3.64 | % | 6.03 | % | 3.38 | % | 2.59 | % | 3.87 | % | |||||||||||||||||||
| Private label residential MBS and CMOs | 3.93 | % | 3.88 | % | 3.77 | % | 3.95 | % | 3.88 | % | |||||||||||||||||||
| Private label commercial MBS | 6.41 | % | 7.01 | % | 2.17 | % | 3.30 | % | 6.67 | % | |||||||||||||||||||
| Single family real estate-backed securities | 4.46 | % | 3.36 | % | 1.36 | % | — | % | 3.72 | % | |||||||||||||||||||
| Collateralized loan obligations | 7.19 | % | 7.49 | % | 7.86 | % | — | % | 7.48 | % | |||||||||||||||||||
| Non-mortgage asset-backed securities | 3.04 | % | 6.01 | % | 4.96 | % | — | % | 5.70 | % | |||||||||||||||||||
| State and municipal obligations | 2.59 | % | 4.18 | % | 4.29 | % | — | % | 4.21 | % | |||||||||||||||||||
| SBA securities | 6.19 | % | 6.18 | % | 6.13 | % | 5.94 | % | 6.16 | % | |||||||||||||||||||
| 5.10 | % | 6.16 | % | 4.36 | % | 4.06 | % | 5.45 | % | ||||||||||||||||||||
43
Loans
The loan portfolio comprises the Company’s primary interest-earning asset. The following table shows the composition of the loan portfolio at the dates indicated (dollars in thousands):
| December 31, 2023 | December 31, 2022 | ||||||||||||||||||||||
| Total | Percent of Total | Total | Percent of Total | ||||||||||||||||||||
| 1-4 single family residential | $ | 6,903,013 | 28.0 | % | $ | 7,128,834 | 28.6 | % | |||||||||||||||
| Government insured residential | 1,306,014 | 5.3 | % | 1,771,880 | 7.1 | % | |||||||||||||||||
Total residential | 8,209,027 | 33.3 | % | 8,900,714 | 35.7 | % | |||||||||||||||||
| Non-owner occupied commercial real estate | 5,323,241 | 21.6 | % | 5,405,597 | 21.7 | % | |||||||||||||||||
| Construction and land | 495,992 | 2.0 | % | 294,360 | 1.2 | % | |||||||||||||||||
| Owner occupied commercial real estate | 1,935,743 | 7.9 | % | 1,890,813 | 7.6 | % | |||||||||||||||||
| Commercial and industrial | 6,971,981 | 28.3 | % | 6,417,721 | 25.9 | % | |||||||||||||||||
Total "Core" C&I and CRE | 14,726,957 | 59.8 | % | 14,008,491 | 56.4 | % | |||||||||||||||||
| Pinnacle - municipal finance | 884,690 | 3.6 | % | 912,122 | 3.7 | % | |||||||||||||||||
| Franchise finance | 182,408 | 0.7 | % | 253,774 | 1.0 | % | |||||||||||||||||
| Equipment finance | 197,939 | 0.8 | % | 286,147 | 1.1 | % | |||||||||||||||||
| Mortgage warehouse lending | 432,663 | 1.8 | % | 524,740 | 2.1 | % | |||||||||||||||||
Total commercial | 16,424,657 | 66.7 | % | 15,985,274 | 64.3 | % | |||||||||||||||||
| Total loans | 24,633,684 | 100.0 | % | 24,885,988 | 100.0 | % | |||||||||||||||||
| Allowance for credit losses | (202,689) | (147,946) | |||||||||||||||||||||
| Loans, net | $ | 24,430,995 | $ | 24,738,042 | |||||||||||||||||||
Consistent with our near-term strategic objectives related to improving the asset mix, for the year ended December 31, 2023, the core C&I and CRE portfolio segments grew by $719 million, while residential loans declined by $692 million. In the aggregate, municipal, franchise and equipment finance declined by $187 million; growth in these segments has been de-emphasized due to their current risk/return profile. These trends are expected to continue over the course of 2024. Mortgage warehouse balances declined by $92 million over the course of 2023, mainly because of the sustained higher interest rate environment. If mortgage rates moderate over the course of 2024, we may see growth in this portfolio segment. Overall, we intend to strategically emphasize the origination of relationship-based loans that are accompanied by deposit business.
Commercial loans and leases
Commercial loans include a diverse portfolio of commercial and industrial loans and lines of credit, loans secured by owner-occupied commercial real-estate, income-producing non-owner occupied commercial real estate, a smaller amount of construction and land loans, SBA loans, mortgage warehouse lines of credit, municipal loans and leases originated by Pinnacle and franchise and equipment finance loans and leases originated by Bridge.
44
The following charts present the distribution of the commercial loan portfolio at the dates indicated (dollars in millions):
| December 31, 2023 | December 31, 2022 | |||||||
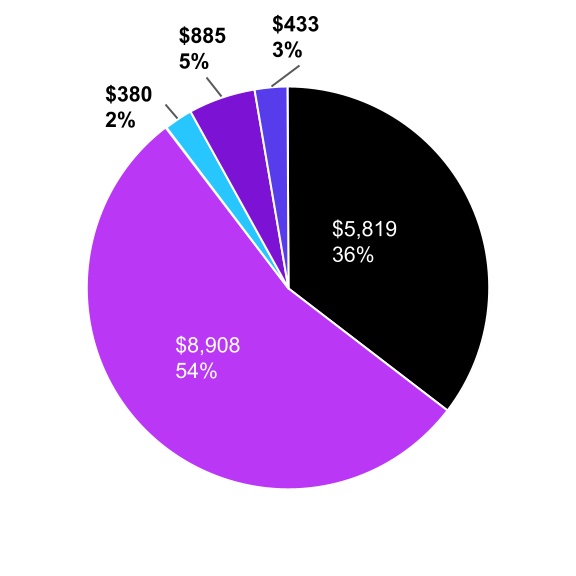
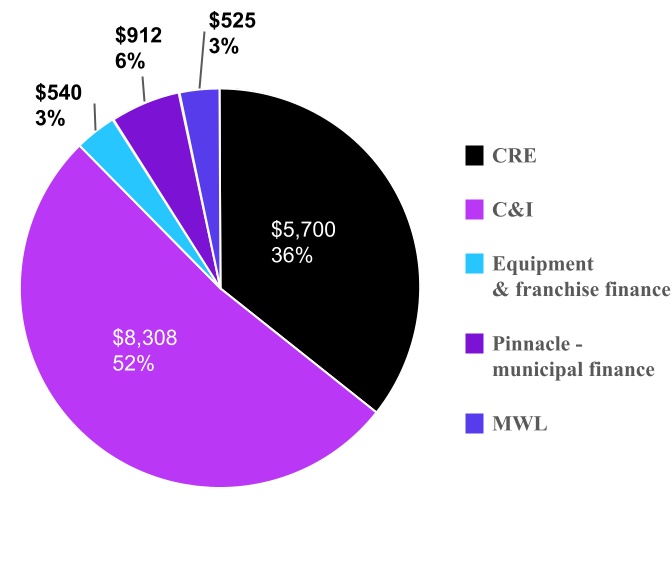
Commercial Real Estate:
Commercial real estate loans include term loans secured by non-owner occupied income producing properties including rental apartments, industrial properties, retail shopping centers, free-standing single-tenant buildings, medical and other office buildings, warehouse facilities, hotels and real estate secured lines of credit. The Company’s commercial real estate underwriting standards most often provide for loan terms of five to seven years, with amortization schedules of no more than thirty years.
The following tables present the distribution of commercial real estate loans by property type, along with weighted average DSCRs and LTVs at December 31, 2023 and 2022 (dollars in thousands):
| December 31, 2023 | |||||||||||||||||||||||||||||||||||||||||
| Amortized Cost | Percent of Total | FL | New York Tri-State | Other | Weighted Average DSCR | Weighted Average LTV | |||||||||||||||||||||||||||||||||||
| Office | $ | 1,752,801 | 30 | % | 60 | % | 24 | % | 16 | % | 1.67 | 65.0 | % | ||||||||||||||||||||||||||||
| Warehouse/Industrial | 1,341,229 | 24 | % | 56 | % | 8 | % | 36 | % | 2.04 | 52.0 | % | |||||||||||||||||||||||||||||
| Multifamily | 838,692 | 14 | % | 50 | % | 50 | % | — | % | 1.98 | 45.5 | % | |||||||||||||||||||||||||||||
| Retail | 818,409 | 14 | % | 54 | % | 29 | % | 17 | % | 1.67 | 58.8 | % | |||||||||||||||||||||||||||||
| Hotel | 491,853 | 8 | % | 78 | % | 3 | % | 19 | % | 1.89 | 49.0 | % | |||||||||||||||||||||||||||||
| Construction and Land | 495,992 | 9 | % | 56 | % | 42 | % | 2 | % | N/A | N/A | ||||||||||||||||||||||||||||||
| Other | 80,257 | 1 | % | 71 | % | 13 | % | 16 | % | 1.94 | 47.4 | % | |||||||||||||||||||||||||||||
| $ | 5,819,233 | 100 | % | 58 | % | 25 | % | 17 | % | 1.80 | 56.0 | % | |||||||||||||||||||||||||||||
| December 31, 2022 | |||||||||||||||||||||||||||||||||||||||||
| Amortized Cost | Percent of Total | FL | New York Tri-State | Other | Weighted Average DSCR | Weighted Average LTV | |||||||||||||||||||||||||||||||||||
| Office | $ | 1,874,614 | 33 | % | 59 | % | 22 | % | 19 | % | 1.75 | 64.3 | % | ||||||||||||||||||||||||||||
| Warehouse/Industrial | 1,216,506 | 21 | % | 62 | % | 18 | % | 20 | % | 2.05 | 52.6 | % | |||||||||||||||||||||||||||||
| Multifamily | 945,404 | 17 | % | 48 | % | 52 | % | — | % | 2.13 | 45.9 | % | |||||||||||||||||||||||||||||
| Retail | 869,922 | 15 | % | 64 | % | 27 | % | 9 | % | 1.88 | 61.7 | % | |||||||||||||||||||||||||||||
| Hotel | 407,462 | 7 | % | 86 | % | 6 | % | 8 | % | 2.13 | 55.1 | % | |||||||||||||||||||||||||||||
| Construction and Land | 294,360 | 5 | % | 49 | % | 49 | % | 2 | % | N/A | N/A | ||||||||||||||||||||||||||||||
| Other | 91,689 | 2 | % | 75 | % | 9 | % | 16 | % | 2.45 | 47.7 | % | |||||||||||||||||||||||||||||
| $ | 5,699,957 | 100 | % | 61 | % | 26 | % | 13 | % | 1.95 | 57.0 | % | |||||||||||||||||||||||||||||
45
The geographic mix of the portfolio has remained relatively consistent year-over-year, with the majority in Florida. Office exposure has declined, both in total and as a percentage of the CRE portfolio. Weighted average LTVs have remained largely consistent year-over-year, while we have seen some decline in weighted average DSCRs, largely due to increasing costs, including higher interest rates. Both weighted average DSCRs and weighted average LTVs remain favorable.
The following table presents weighted average DSCR and weighted average LTV for the Florida and New York tri-state CRE portfolios, by property type, at December 31, 2023:
| Florida | NY Tri-State | ||||||||||||||||||||||
| Weighted Average DSCR | Weighted Average LTV | Weighted Average DSCR | Weighted Average LTV | ||||||||||||||||||||
| Office | 1.68 | 64.5 | % | 1.62 | 62.9 | % | |||||||||||||||||
| Warehouse/Industrial | 2.19 | 50.5 | % | 1.91 | 37.0 | % | |||||||||||||||||
| Multifamily | 2.68 | 42.1 | % | 1.36 | 48.5 | % | |||||||||||||||||
| Retail | 1.86 | 56.2 | % | 1.26 | 63.6 | % | |||||||||||||||||
| Hotel | 1.95 | 46.9 | % | 1.83 | 20.2 | % | |||||||||||||||||
| Other | 2.17 | 44.3 | % | 1.24 | 66.3 | % | |||||||||||||||||
| 1.96 | 55.0 | % | 1.46 | 54.1 | % | ||||||||||||||||||
Geographic distribution in the tables above is based on location of the underlying collateral property. LTVs and DSCRs are based on the most recent available information; if current appraisals are not available, LTVs are adjusted by our models based on current and forecasted sub-market dynamics. DSCRs are calculated based on current contractually required payments, which in some cases may be interest only.
Included in New York tri-state multifamily loans in the tables above is approximately $121 million of rent regulated exposure as of December 31, 2023. The office portfolio outside of Florida and the New York tri-state area exhibits no particular geographic concentration.
The following table presents the maturity profile of the CRE portfolio over the next 12 months by property type at December 31, 2023 (dollars in thousands):
| Maturing in the Next 12 Months | % Maturing in the Next 12 Months | Fixed Rate or Swapped Maturing Next 12 Months | Fixed Rate to Borrower as a % of Total Portfolio | ||||||||||||||||||||
| Office | $ | 314,485 | 18 | % | $ | 187,162 | 11 | % | |||||||||||||||
| Warehouse/Industrial | 170,547 | 13 | % | 81,405 | 6 | % | |||||||||||||||||
| Multifamily | 111,023 | 13 | % | 64,208 | 8 | % | |||||||||||||||||
| Retail | 121,309 | 15 | % | 64,066 | 8 | % | |||||||||||||||||
| Hotel | 43,209 | 9 | % | 43,209 | 9 | % | |||||||||||||||||
| Construction and Land | 179,844 | 36 | % | 503 | — | % | |||||||||||||||||
| Other | 12,765 | 16 | % | 12,765 | 16 | % | |||||||||||||||||
| $ | 953,182 | 16 | % | $ | 453,318 | 8 | % | ||||||||||||||||
46
The following table present scheduled maturities of the CRE portfolio by property type at December 31, 2023 (in thousands):
| 2024 | 2025 | 2026 | 2027 | 2028 | Thereafter | Total | |||||||||||||||||||||||||||||||||||
| Office | $ | 314,485 | $ | 400,230 | $ | 358,476 | $ | 224,122 | $ | 145,001 | $ | 310,487 | $ | 1,752,801 | |||||||||||||||||||||||||||
| Warehouse/Industrial | 170,547 | 155,441 | 382,337 | 261,630 | 160,358 | 210,916 | 1,341,229 | ||||||||||||||||||||||||||||||||||
| Multifamily | 111,023 | 79,492 | 165,016 | 133,925 | 128,393 | 220,843 | 838,692 | ||||||||||||||||||||||||||||||||||
| Retail | 121,309 | 136,037 | 232,272 | 67,381 | 186,864 | 74,546 | 818,409 | ||||||||||||||||||||||||||||||||||
| Hotel | 43,209 | 44,355 | 217,334 | 30,142 | 54,971 | 101,842 | 491,853 | ||||||||||||||||||||||||||||||||||
| Construction and Land | 179,844 | 115,151 | 66,371 | 33,932 | — | 100,694 | 495,992 | ||||||||||||||||||||||||||||||||||
| Other | 12,765 | 7,052 | 27,188 | 9,595 | 1,421 | 22,236 | 80,257 | ||||||||||||||||||||||||||||||||||
| $ | 953,182 | $ | 937,758 | $ | 1,448,994 | $ | 760,727 | $ | 677,008 | $ | 1,041,564 | $ | 5,819,233 | ||||||||||||||||||||||||||||
The office segment totaled $1.8 billion at December 31, 2023. The following charts present the sub-market geographic distribution of the Florida and NY tri-state office portfolios at December 31, 2023:
| NY Tri-State by Sub-Market | Florida by Sub-Market | |||||||
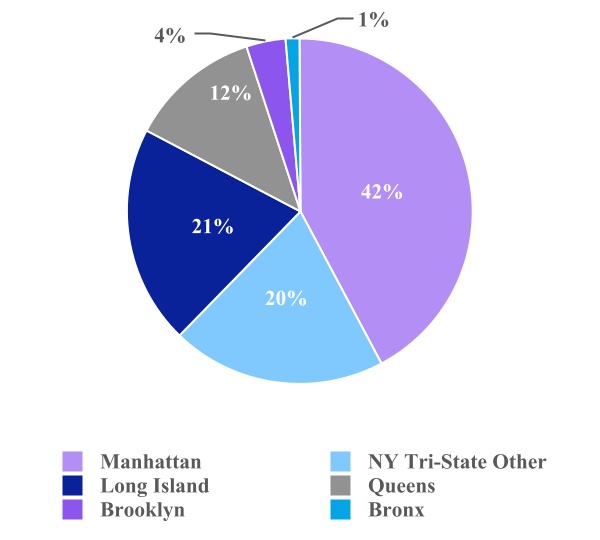
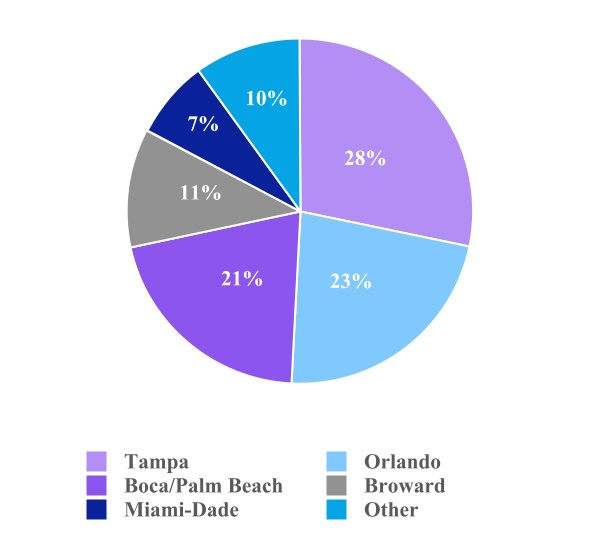
The New York tri-state market encompasses approximately 24% of the office segment, with $180 million of exposure in Manhattan. As of December 31, 2023, the Manhattan office portfolio was approximately 96% occupied with 3% rent rollover expected in the next twelve months. Substantially all of the Florida office portfolio is suburban.
Office loans not secured by properties in Florida or the New York tri-state area comprised 16% of the segment and exhibit no particular geographic concentration. Some of these loans were made to high quality sponsors in our FL or NY tri-state customer base. Estimated rent rollover of the total office portfolio in the next 12 months is approximately 11%. Approximately 18% is secured by medical office buildings. Non-performing office loans were insignificant at December 31, 2023, totaling approximately $300 thousand. Office loans rated below pass at December 31, 2023, totaled $146 million. Also see the section entitled "Asset Quality" below.
Commercial and Industrial
Commercial and industrial loans are typically made to small, middle market and larger corporate businesses and not-for-profit entities and include equipment loans, secured and unsecured working capital facilities, formula-based loans, subscription finance lines of credit, trade finance, SBA product offerings, business acquisition finance credit facilities, credit facilities to institutional real estate entities such as REITs and commercial real estate investment funds, and a small amount of commercial credit cards. These loans may be structured as term loans, typically with maturities of five to seven years, or revolving lines of credit which may have multi-year maturities. In addition to financing provided by Pinnacle, the Bank provides financing to state
47
and local governmental entities generally within our primary geographic markets. The Bank makes loans secured by owner-occupied commercial real estate that typically have risk profiles more closely aligned with that of commercial and industrial loans than with other types of commercial real estate loans.
The following table presents the exposure in the C&I portfolio by industry, at December 31, 2023 (dollars in thousands):
Amortized Cost(1) | Percent of Total | ||||||||||
| Finance and Insurance | $ | 1,695,374 | 19.0 | % | |||||||
| Manufacturing | 874,583 | 9.8 | % | ||||||||
| Educational Services | 753,427 | 8.5 | % | ||||||||
| Wholesale Trade | 693,724 | 7.8 | % | ||||||||
| Utilities | 653,901 | 7.3 | % | ||||||||
| Health Care and Social Assistance | 605,445 | 6.8 | % | ||||||||
| Information | 590,143 | 6.6 | % | ||||||||
| Real Estate and Rental and Leasing | 538,824 | 6.0 | % | ||||||||
| Transportation and Warehousing | 420,411 | 4.7 | % | ||||||||
| Construction | 381,641 | 4.3 | % | ||||||||
| Retail Trade | 319,890 | 3.6 | % | ||||||||
| Professional, Scientific, and Technical Services | 300,201 | 3.4 | % | ||||||||
| Public Administration | 245,441 | 2.8 | % | ||||||||
| Other Services (except Public Administration) | 230,691 | 2.6 | % | ||||||||
| Administrative and Support and Waste Management | 194,089 | 2.2 | % | ||||||||
| Arts, Entertainment, and Recreation | 187,689 | 2.1 | % | ||||||||
| Accommodation and Food Services | 155,066 | 1.7 | % | ||||||||
| Other | 67,184 | 0.8 | % | ||||||||
| $ | 8,907,724 | 100.0 | % | ||||||||
(1) Includes $1.9 billion of owner occupied real estate.
Through its commercial lending subsidiaries, Pinnacle and Bridge, the Bank provides equipment and franchise financing on a national basis using both loan and lease structures. Pinnacle provides essential-use equipment financing to state and local governmental entities directly and through vendor programs and alliances. Pinnacle offers a full array of financing structures including equipment lease purchase agreements and direct (private placement) bond re-fundings and loan agreements. Bridge has two operating divisions. The franchise finance division offers franchise acquisition, expansion and equipment financing, typically to experienced operators in well-established concepts. The franchise finance portfolio is made up primarily of quick service restaurant and fitness concepts comprising 43% and 53% of the portfolio, respectively. The equipment finance division provides primarily transportation equipment financing through a variety of loan and lease structures. Franchise and equipment finance have been de-emphasized due to their current risk/return profile, including the lack of significant deposit business with these customers. We do not expect significant new loan originations in these segments. Commercial loans included loans meeting the regulatory definition of shared national credits totaling $4.8 billion at December 31, 2023.
Residential mortgages
The following table shows the composition of residential loans at the dates indicated (in thousands):
| December 31, 2023 | December 31, 2022 | ||||||||||
| 1-4 single family residential | $ | 6,903,013 | $ | 7,128,834 | |||||||
| Government insured residential | 1,306,014 | 1,771,880 | |||||||||
| $ | 8,209,027 | $ | 8,900,714 | ||||||||
The 1-4 single family residential loan portfolio, excluding government insured residential loans, is primarily comprised of prime jumbo loans purchased through established correspondent channels. 1-4 single family residential mortgage loans are primarily closed-end, first lien jumbo mortgages for the purchase or re-finance of owner occupied property. The loans have
48
terms ranging from 10 to 30 years, with either fixed or adjustable interest rates. At December 31, 2023, $1.1 billion or 15% were secured by investor-owned properties.
The Company acquires non-performing FHA and VA insured mortgages from third party servicers who have exercised their right to purchase these loans out of GNMA securitizations upon default (collectively, "government insured pool buyout loans" or "buyout loans"). Buyout loans that re-perform, either through modification or self-cure, may be eligible for re-securitization. The Company and the servicer share in the economics of the sale of these loans into new securitizations. The balance of buyout loans totaled $1.3 billion at December 31, 2023. The Company is not the servicer of these loans.
The following charts present the distribution of the 1-4 single family residential mortgage portfolio by product type at the dates indicated:
| December 31, 2023 | December 31, 2022 | |||||||
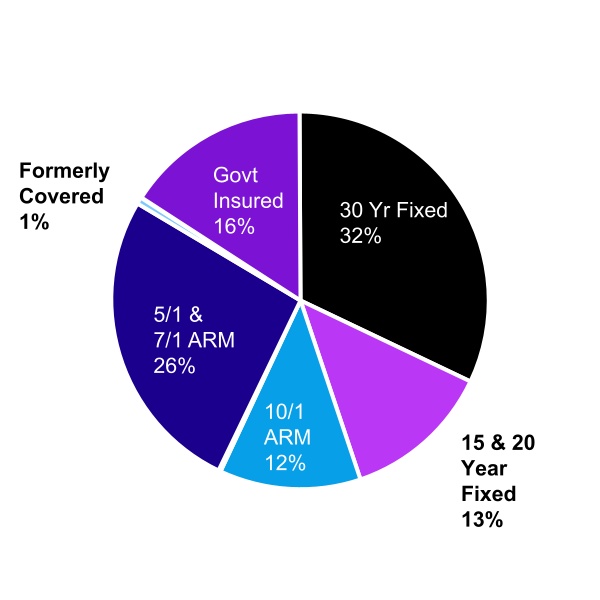
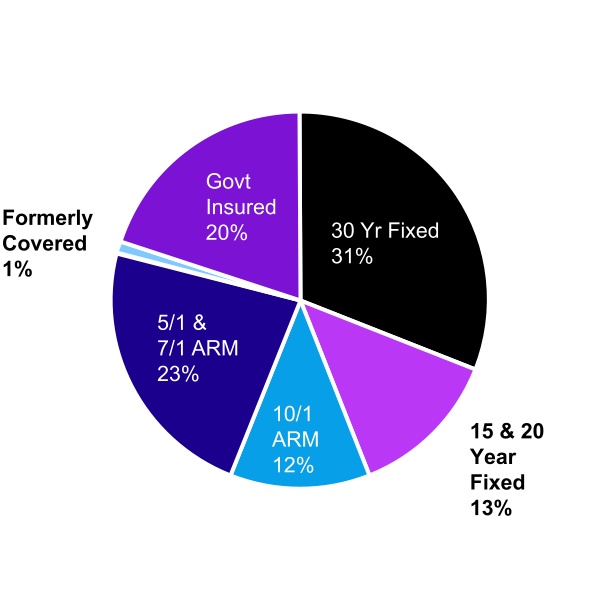
See Note 4 to the consolidated financial statements for information about the geographic distribution of the 1-4 single family residential portfolio.
The following table presents a breakdown of the 1-4 single family residential mortgage portfolio, excluding government insured residential loans, categorized between fixed rate loans and ARMs at the dates indicated (dollars in thousands):
| December 31, 2023 | December 31, 2022 | ||||||||||||||||||||||
| Total | Percent of Total | Total | Percent of Total | ||||||||||||||||||||
| Fixed rate loans | $ | 3,757,442 | 54 | % | $ | 3,995,298 | 56 | % | |||||||||||||||
| ARM loans | 3,145,571 | 46 | % | 3,133,536 | 44 | % | |||||||||||||||||
| $ | 6,903,013 | 100 | % | $ | 7,128,834 | 100 | % | ||||||||||||||||
49
Loan Maturities
The following table sets forth, as of December 31, 2023, the maturity distribution of our loan portfolio by category, excluding government insured residential loans. Commercial loans are presented by contractual maturity, including scheduled payments for amortizing loans. Contractual maturities of residential loans have been adjusted for an estimated rate of voluntary prepayments, based on historical trends, current interest rates, types of loans and refinance patterns (in thousands):
| One Year or Less | After One Through Five Years | After Five Years Through Fifteen Years | After Fifteen Years | Total | |||||||||||||||||||||||||
Residential | $ | 725,770 | $ | 2,639,694 | $ | 2,612,246 | $ | 925,303 | $ | 6,903,013 | |||||||||||||||||||
| Commercial: | |||||||||||||||||||||||||||||
| Non-owner occupied commercial real estate | 875,526 | 3,622,376 | 818,365 | 6,974 | 5,323,241 | ||||||||||||||||||||||||
| Construction and land | 179,588 | 219,476 | 94,648 | 2,280 | 495,992 | ||||||||||||||||||||||||
| Owner occupied commercial real estate | 231,979 | 768,877 | 877,384 | 57,503 | 1,935,743 | ||||||||||||||||||||||||
Commercial and industrial | 1,725,045 | 4,539,480 | 703,015 | 4,441 | 6,971,981 | ||||||||||||||||||||||||
| Pinnacle | 206,588 | 373,175 | 295,986 | 8,941 | 884,690 | ||||||||||||||||||||||||
Franchise finance | 60,584 | 75,644 | 46,180 | — | 182,408 | ||||||||||||||||||||||||
Equipment finance | 13,059 | 173,126 | 11,754 | — | 197,939 | ||||||||||||||||||||||||
| Mortgage warehouse lending | 427,521 | 5,142 | — | — | 432,663 | ||||||||||||||||||||||||
| 3,719,890 | 9,777,296 | 2,847,332 | 80,139 | 16,424,657 | |||||||||||||||||||||||||
| $ | 4,445,660 | $ | 12,416,990 | $ | 5,459,578 | $ | 1,005,442 | $ | 23,327,670 | ||||||||||||||||||||
The following table shows the distribution of those loans that mature in more than one year between fixed and adjustable interest rate loans as of December 31, 2023 (in thousands):
| Interest Rate Type | |||||||||||||||||
| Fixed | Adjustable | Total | |||||||||||||||
Residential | $ | 3,603,716 | $ | 2,573,527 | $ | 6,177,243 | |||||||||||
| Commercial: | |||||||||||||||||
| Non-owner occupied commercial real estate | 1,802,723 | 2,644,992 | 4,447,715 | ||||||||||||||
| Construction and land | 16,071 | 300,333 | 316,404 | ||||||||||||||
| Owner occupied commercial real estate | 1,026,297 | 677,467 | 1,703,764 | ||||||||||||||
Commercial and industrial | 611,771 | 4,635,165 | 5,246,936 | ||||||||||||||
| Pinnacle | 678,102 | — | 678,102 | ||||||||||||||
Franchise finance | 40,343 | 81,481 | 121,824 | ||||||||||||||
Equipment finance | 171,585 | 13,295 | 184,880 | ||||||||||||||
| Mortgage warehouse lending | — | 5,142 | 5,142 | ||||||||||||||
| 4,346,892 | 8,357,875 | 12,704,767 | |||||||||||||||
| $ | 7,950,608 | $ | 10,931,402 | $ | 18,882,010 | ||||||||||||
Excluded from the tables above are government insured residential loans. Resolution of these loans is generally accomplished through the re-securitization and sale of the loans after they re-perform, either through modification or self-cure, or through pursuit of the applicable guarantee.
Operating lease equipment, net
The following table presents the components of operating lease equipment at the dates indicated (in thousands):
| December 31, 2023 | December 31, 2022 | ||||||||||
| Operating lease equipment | $ | 582,147 | $ | 772,267 | |||||||
| Less: accumulated depreciation | (210,238) | (232,468) | |||||||||
| Operating lease equipment, net | $ | 371,909 | $ | 539,799 | |||||||
50
The table above includes off-lease equipment, net of accumulated depreciation, totaling $48 million and $63 million at December 31, 2023 and 2022, respectively. During the year ended December 31, 2023, $97 million of certain operating lease equipment was sold and $26 million was transferred into equipment held for sale. We expect the balance of operating lease equipment to continue to decline as this product offering is no longer considered core to our business strategy.
The chart below presents operating lease equipment by type at the dates indicated:
| December 31, 2023 | December 31, 2022 | |||||||
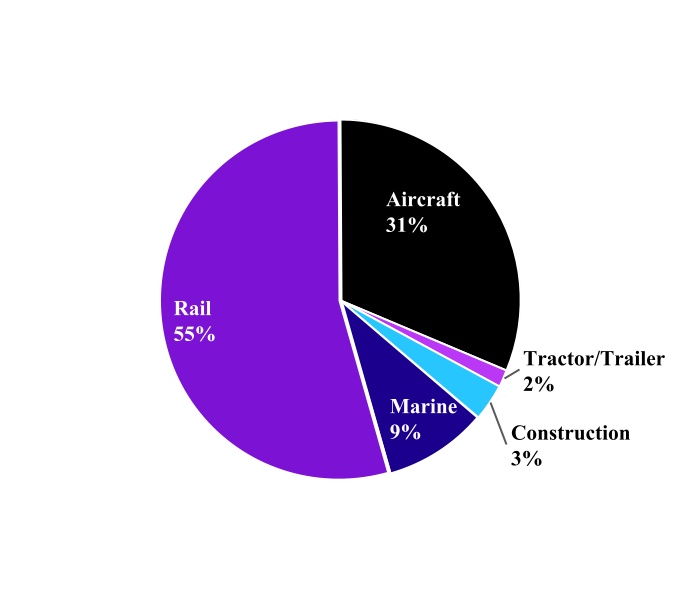
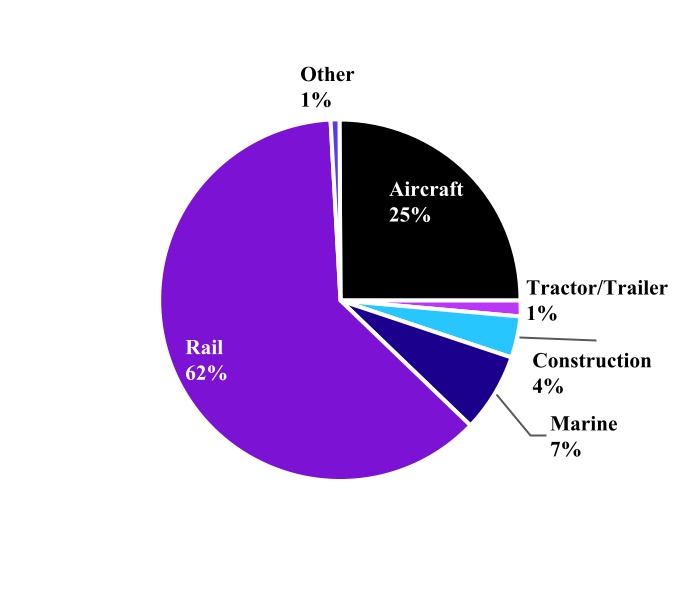
Bridge had exposure to the energy industry of $154 million at December 31, 2023. The majority of the energy exposure was in the operating lease equipment portfolio where energy exposure totaled $146 million, consisting primarily of railcars serving the petroleum industry.
Asset Quality
Commercial Loans
We have a robust credit risk management framework, an experienced team to lead the workout and recovery process for the commercial and commercial real estate portfolios and a dedicated internal credit review function. Loan performance is monitored by our credit administration, portfolio management and workout and recovery departments. Risk ratings are updated continuously; generally, commercial relationships with balances in excess of defined thresholds are re-evaluated at least annually and more frequently if circumstances indicate that a change in risk rating may be warranted. The defined thresholds range from $1 million to $3 million. Homogenous groups of smaller balance commercial loans may be monitored collectively. The credit quality and risk rating of commercial loans as well as our underwriting and portfolio management practices are regularly reviewed by our internal independent credit review department.
We believe internal risk rating is the best indicator of the credit quality of commercial loans. The Company utilizes a 16-grade internal asset risk classification system as part of its efforts to monitor and maintain commercial asset quality. The special mention rating is considered a transitional rating for loans exhibiting potential credit weaknesses that could result in deterioration of repayment prospects at some future date if not checked or corrected and that deserve management’s close attention. These borrowers may exhibit declining cash flows or revenues or increasing leverage. Loans with well-defined credit weaknesses that may result in a loss if the deficiencies are not corrected are assigned a risk rating of substandard. These borrowers may exhibit payment defaults, inadequate cash flows from current operations, operating losses, increasing balance sheet leverage, project cost overruns, unreasonable construction delays, exhausted interest reserves, declining collateral values, frequent overdrafts or past due real estate taxes. Loans with weaknesses so severe that collection in full is highly questionable or improbable, but because of certain reasonably specific pending factors have not been charged off, are assigned an internal risk rating of doubtful.
51
The following table summarizes the Company's commercial credit exposure, based on internal risk rating, at the dates indicated (dollars in thousands):
| December 31, 2023 | December 31, 2022 | ||||||||||||||||||||||
| Amortized Cost | Percent of Commercial Loans | Amortized Cost | Percent of Commercial Loans | ||||||||||||||||||||
| Pass | $ | 15,287,548 | 93.2 | % | $ | 15,244,761 | 95.4 | % | |||||||||||||||
| Special mention | 319,905 | 1.9 | % | 51,433 | 0.3 | % | |||||||||||||||||
| Substandard accruing | 711,266 | 4.3 | % | 605,965 | 3.8 | % | |||||||||||||||||
| Substandard non-accruing | 86,903 | 0.5 | % | 75,125 | 0.5 | % | |||||||||||||||||
| Doubtful | 19,035 | 0.1 | % | 7,990 | — | % | |||||||||||||||||
| $ | 16,424,657 | 100.0 | % | $ | 15,985,274 | 100.0 | % | ||||||||||||||||
The increase in criticized and classified assets compared to the prior year-end was driven primarily by higher operating costs, including insurance and interest, and for some CRE office loans, higher vacancy rates. Evolving dynamics in certain real estate sectors and markets, particularly the office sector, could lead to future increases in criticized/classified and non-performing loans.
The following table provides additional information about special mention and substandard accruing loans, at the dates indicated (dollars in thousands). All of these loans are performing. Non-performing loans are discussed further in the section entitled "Non-performing Assets" below.
| December 31, 2023 | December 31, 2022 | ||||||||||||||||||||||
| Amortized Cost | % of Loan Segment | Amortized Cost | % of Loan Segment | ||||||||||||||||||||
| Special mention: | |||||||||||||||||||||||
| CRE | |||||||||||||||||||||||
| Hotel | $ | 15,712 | 3.2 | % | $ | 709 | 0.2 | % | |||||||||||||||
| Retail | 36,000 | 4.4 | % | — | — | % | |||||||||||||||||
| Office | 45,840 | 2.6 | % | 18,006 | 1.0 | % | |||||||||||||||||
| 97,552 | 18,715 | ||||||||||||||||||||||
| Owner occupied commercial real estate | 22,150 | 1.1 | % | 24,101 | 1.3 | % | |||||||||||||||||
| Commercial and industrial | 197,924 | 2.8 | % | 1,017 | — | % | |||||||||||||||||
| Franchise finance | 2,279 | 1.2 | % | 7,600 | 3.0 | % | |||||||||||||||||
| $ | 319,905 | $ | 51,433 | ||||||||||||||||||||
| Substandard accruing: | |||||||||||||||||||||||
| CRE | |||||||||||||||||||||||
| Hotel | $ | 41,805 | 8.5 | % | $ | 14,538 | 3.6 | % | |||||||||||||||
| Retail | 53,205 | 6.5 | % | 72,421 | 8.4 | % | |||||||||||||||||
| Multi-family | 115,755 | 13.8 | % | 146,235 | 15.5 | % | |||||||||||||||||
| Office | 100,307 | 5.7 | % | 73,042 | 3.9 | % | |||||||||||||||||
Construction and land | 76,883 | 15.5 | % | 8,872 | 3.0 | % | |||||||||||||||||
| Other | 2,769 | 3.4 | % | 93 | 0.1 | % | |||||||||||||||||
| 390,724 | 315,201 | ||||||||||||||||||||||
| Owner occupied commercial real estate | 71,908 | 3.7 | % | 73,501 | 3.9 | % | |||||||||||||||||
| Commercial and industrial | 208,984 | 3.0 | % | 171,613 | 2.7 | % | |||||||||||||||||
| Franchise finance | 16,864 | 9.2 | % | 44,295 | 17.5 | % | |||||||||||||||||
| Equipment finance | 22,786 | 11.5 | % | 1,355 | 0.5 | % | |||||||||||||||||
| $ | 711,266 | $ | 605,965 | ||||||||||||||||||||
52
The following graphs present trends in criticized and classified loans by segment over the periods indicated (in millions):
| Commercial Real Estate(1) | Commercial(1)(2) | |||||||
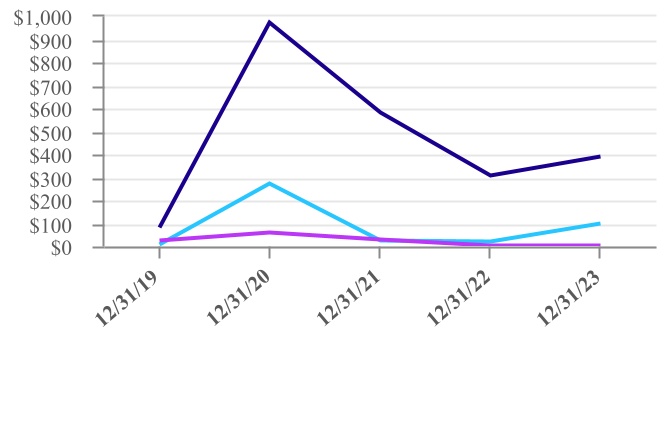
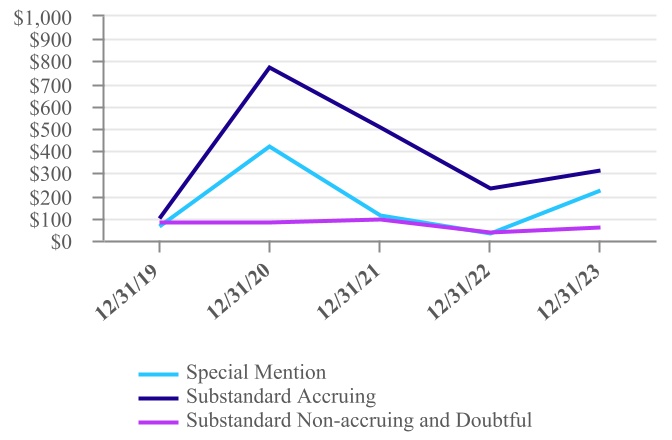
(1)Excludes SBA
(2)Includes Pinnacle, franchise finance and equipment finance
The following charts present criticized and classified CRE loans by property type at the dates indicated (in millions):
| December 31, 2023 | December 31, 2022 | |||||||
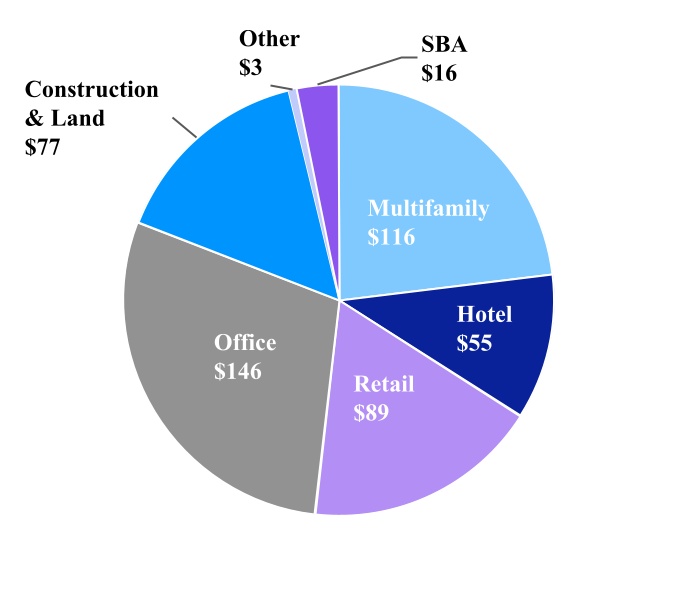
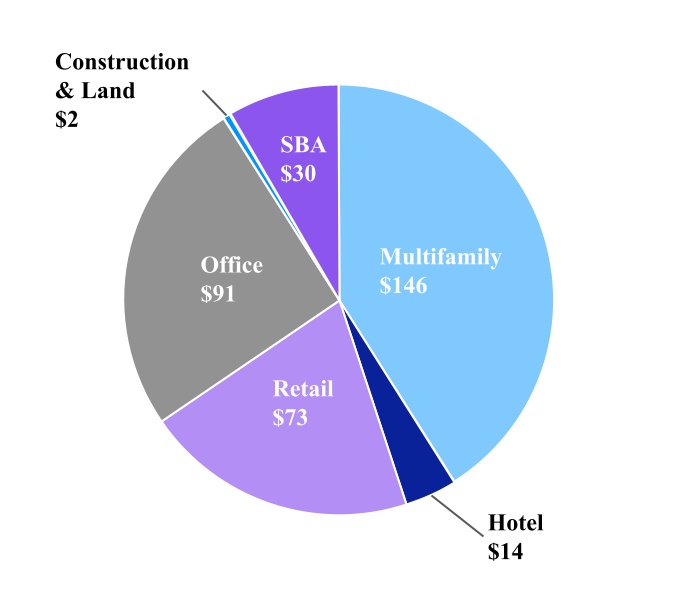
53
The following graphs present delinquency trends by segment over the periods indicated (in millions):
| Commercial Real Estate | Commercial(1) | |||||||
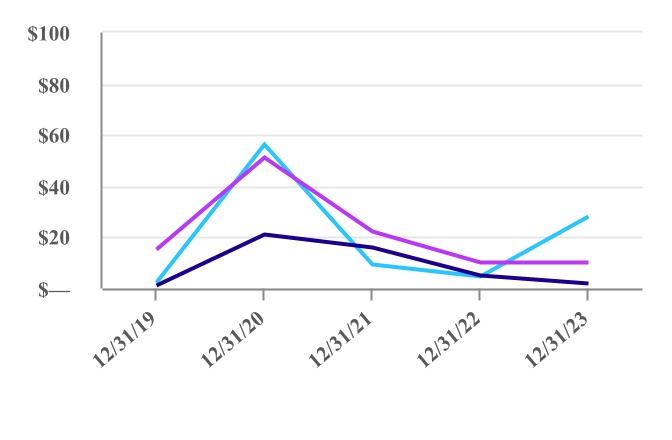
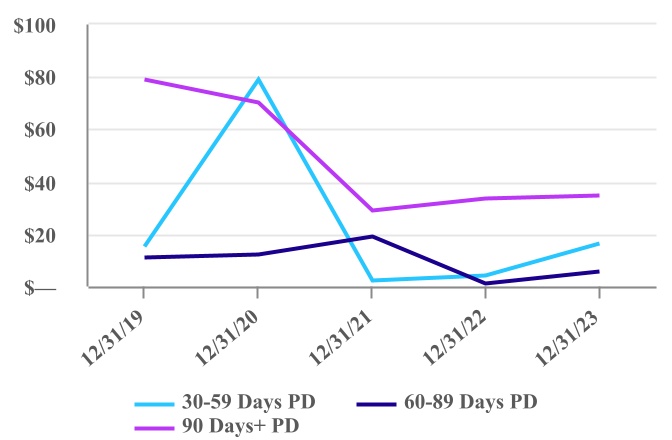
(1)Includes Pinnacle, franchise finance and equipment finance
Operating Lease Equipment, net
Operating leases with a carrying value of assets under lease totaling $24 million were internally risk rated substandard at December 31, 2023. On a quarterly basis, management performs an impairment analysis on assets with indicators of potential impairment. Potential impairment indicators include evidence of changes in residual value, macro-economic conditions, an extended period of time off-lease, criticized or classified status, or management's intention to sell the asset at an amount potentially below its carrying value. During the years ended December 31, 2023, 2022 and 2021, impairment charges recognized related to operating lease equipment were immaterial.
Residential Loans
Excluding government insured loans, our residential portfolio consists largely of performing jumbo mortgage loans with FICO scores above 700, primarily owner-occupied and full documentation, with current LTV's of 80% or less. Loans with LTVs higher than 80% may be extended to selected credit-worthy borrowers. We perform due diligence on the purchased loans for credit, compliance, counterparty, payment history and property valuation.
We have a dedicated residential credit risk management function, and the residential portfolio is monitored by our internal credit review function. Residential mortgage loans are not individually risk rated. Delinquency status is the primary measure we use to monitor the credit quality of these loans. We also consider original LTV and most recently available FICO score to be significant indicators of credit quality for the 1-4 single family residential portfolio, excluding government insured residential loans.
54
The following charts present information about the 1-4 single family residential portfolio, excluding government insured loans, by FICO distribution, LTV distribution and vintage at December 31, 2023:
| FICO Distribution | LTV Distribution | Vintage | ||||||||||||
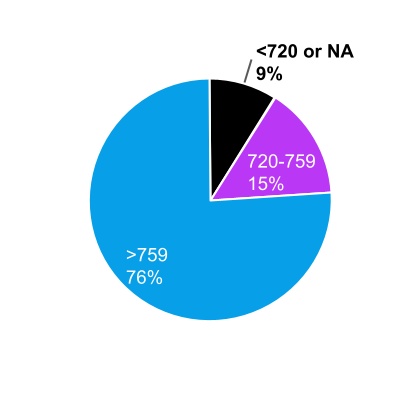
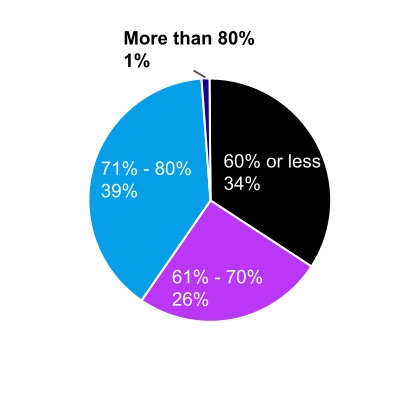
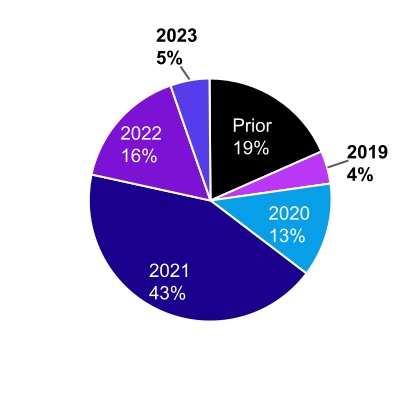
FICO scores are generally updated semi-annually and were most recently updated in the third quarter of 2023. LTVs are typically based on valuation at origination since we do not routinely update residential appraisals.
At December 31, 2023, the majority of the 1-4 single family residential loan portfolio, excluding government insured residential loans, was owner-occupied, with 80% primary residence, 5% second homes and 15% investment properties.
The following graph presents trends in residential delinquencies, excluding government insured residential loans, over the periods indicated (in millions):
| 1-4 Single Family Residential | |||||
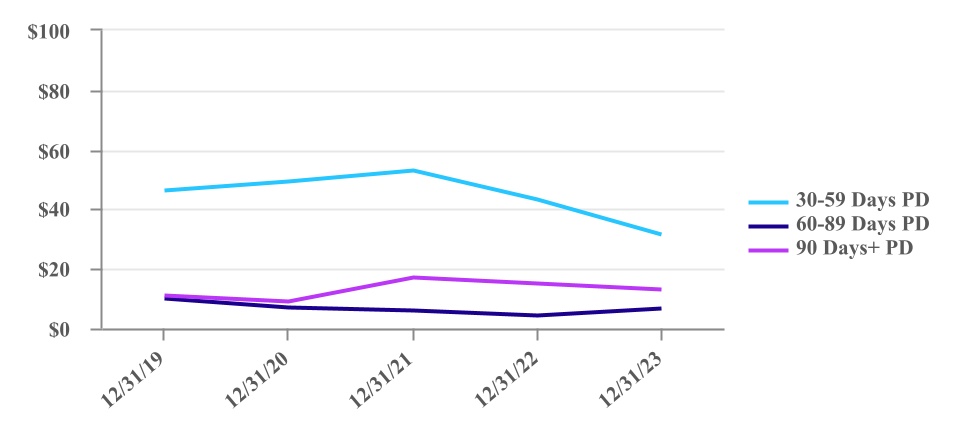
Delinquent residential loans, excluding government insured residential loans, are not and have not historically been material. Delinquency status is not particularly relevant to the credit quality of government insured residential loans considering the guaranteed nature of the loans and underlying business model.
Note 4 to the consolidated financial statements presents additional information about key credit quality indicators and delinquency status of the loan portfolio.
Stress Testing Results
The majority of our commercial portfolio is subject to quarterly stress test analysis. We continually re-evaluate our stress testing framework and adapt it to evolving macro-economic conditions, as necessary. On an annual basis, we also run a rigorous stress test of our entire balance sheet incorporating the FRB's severely adverse CCAR scenario as well as additional idiosyncratic scenarios reflective of evolving macro-economic themes. The 2023 stress test incorporating the FRB's CCAR severely adverse scenario was performed during the second quarter of 2023, based on the December 31, 2022 balance sheet.
55
The following charts summarize the results of this stress test. Additionally, we present stress results for the CRE portfolio based on the Moody's S4 recessionary scenario (dollars in millions):
Total Loan Portfolio Stress Test Results(1) | ||||||||||||||
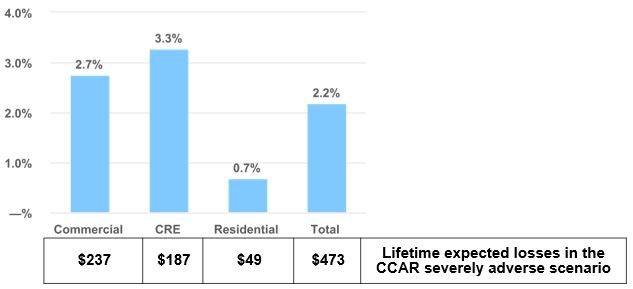
CRE Portfolio Stress Test Results(2) | ||||||||||||||
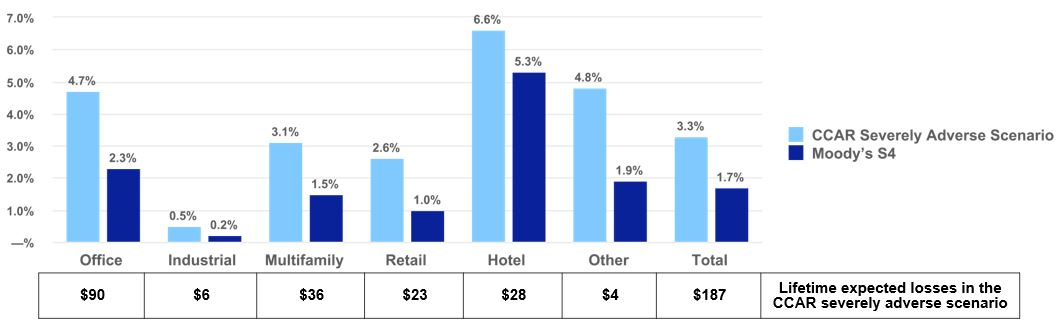
(1)Excludes Pinnacle municipal finance and mortgage warehouse lending.
(2)Construction loans are included in the chart based on their applicable property type.
Non-Performing Assets
Non-performing assets generally consist of (i) non-accrual loans, (ii) accruing loans that are more than 90 days contractually past due as to interest or principal, excluding PCD loans for which management has a reasonable basis for an expectation about future cash flows and government insured residential loans, and (iii) OREO and other non-performing assets.
The following table present information about the Company's non-performing loans and non-performing assets at the dates indicated (dollars in thousands):
| December 31, 2023 | December 31, 2022 | ||||||||||
| Non-accrual loans: | |||||||||||
| Residential | $ | 20,513 | $ | 21,311 | |||||||
| Commercial: | |||||||||||
| Non-owner occupied commercial real estate | 13,727 | 16,657 | |||||||||
| Construction and land | — | 5,695 | |||||||||
| Owner occupied commercial real estate | 13,626 | 17,751 | |||||||||
| Commercial and industrial | 54,907 | 29,722 | |||||||||
| Franchise finance | 16,858 | 13,290 | |||||||||
Equipment finance | 6,820 | — | |||||||||
| Total commercial loans | 105,938 | 83,115 | |||||||||
| Total non-accrual loans | 126,451 | 104,426 | |||||||||
Loans past due 90 days and still accruing | 593 | 593 | |||||||||
| Total non-performing loans | 127,044 | 105,019 | |||||||||
| OREO and other non-performing assets | 3,536 | 1,932 | |||||||||
| Total non-performing assets | $ | 130,580 | $ | 106,951 | |||||||
Non-performing loans to total loans (1) | 0.52 | % | 0.42 | % | |||||||
Non-performing assets to total assets (1) | 0.37 | % | 0.29 | % | |||||||
| ACL to total loans | 0.82 | % | 0.59 | % | |||||||
| ACL to non-performing loans | 159.54 | % | 140.88 | % | |||||||
Net charge-offs to average loans | 0.09 | % | 0.22 | % | |||||||
(1) Non-performing loans and assets include the guaranteed portion of non-accrual SBA loans totaling $41.8 million or 0.17% of total loans and 0.12% of total assets, at December 31, 2023, and $40.3 million or 0.16% of total loans and 0.11% of total assets, at December 31, 2022.
Contractually delinquent government insured residential loans are typically GNMA early buyout loans and are excluded from non-performing loans as defined in the table above due to their government guarantee. The carrying value of such loans contractually delinquent by 90 days or more was $277 million and $493 million at December 31, 2023 and 2022, respectively.
The following graphs present trends in non-performing loans to total loans and non-performing assets to total assets over the periods indicated, as well as trends in net charge-offs. Levels of non-performing loans to total loans and non-performing assets to total assets remain below pre-pandemic levels.
| Non-Performing Loans to Total Loans | Non-Performing Assets to Total Assets | |||||||
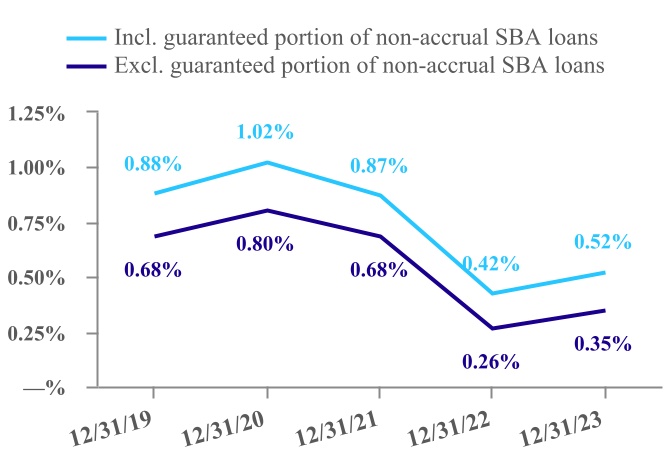
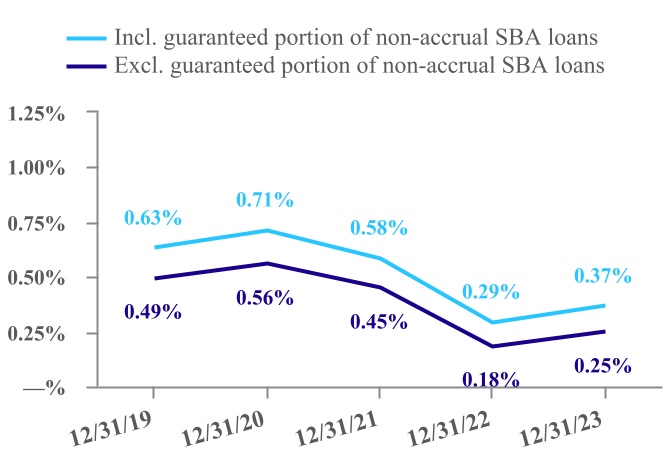
| Net Charges-Offs to Average Loans | ||
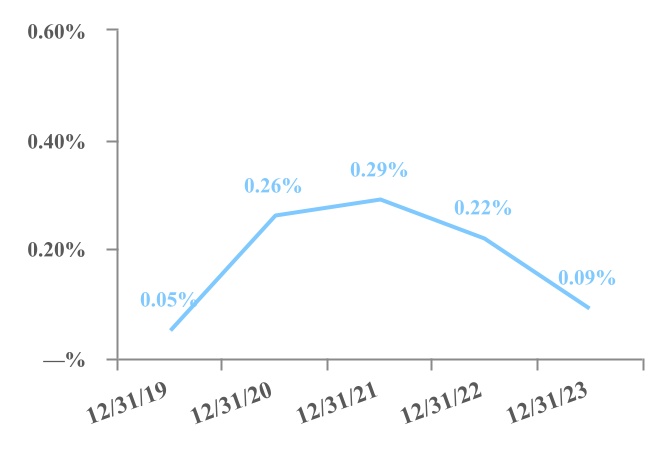
The following graph presents the trend in non-performing loans by portfolio segment over the periods indicated (in millions):
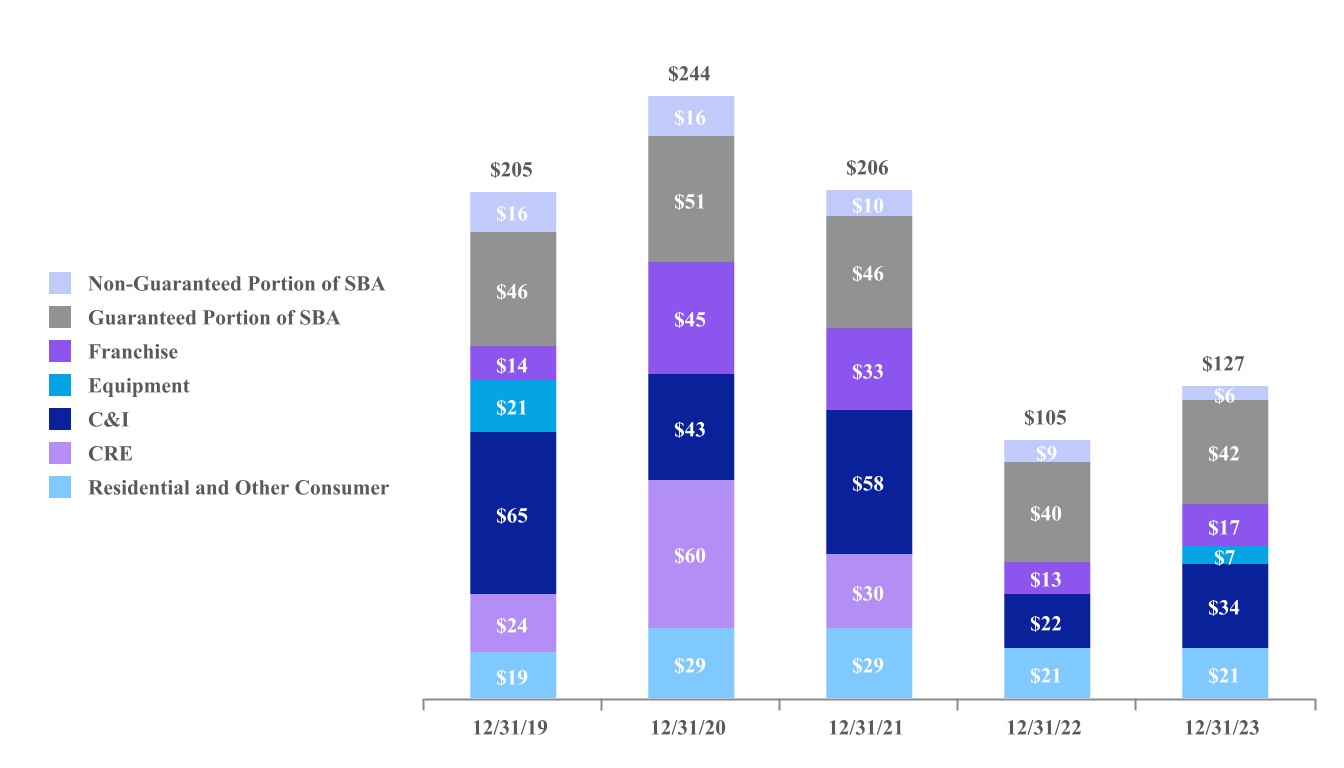
Commercial loans are placed on non-accrual status when (i) management has determined that full repayment of all contractual principal and interest is in doubt, or (ii) the loan is past due 90 days or more as to principal or interest unless the loan is well secured and in the process of collection. Residential loans, other than government insured pool buyout loans, are generally placed on non-accrual status when they are 60 days past due. Additionally, certain residential loans not contractually delinquent but in forbearance may be placed on non-accrual status at management's discretion. When a loan is placed on non-accrual status, uncollected interest accrued is reversed and charged to interest income. Commercial loans are returned to accrual status only after all past due principal and interest has been collected and full repayment of remaining contractual principal and interest is reasonably assured. Residential loans are generally returned to accrual status when less than 60 days past due. Past due status of loans is determined based on the contractual next payment due date. Loans less than 30 days past due are reported as current.
Loss Mitigation Strategies
Criticized or classified commercial loans in excess of certain thresholds are reviewed quarterly by the Criticized Asset Committee, which evaluates the appropriate strategy for collection to mitigate the amount of credit losses and considers the appropriate risk rating for these loans. Criticized asset reports for each relationship are presented by the assigned relationship manager and credit officer to the Criticized Asset Committee until such time as the relationships are returned to a satisfactory credit risk rating or otherwise resolved. The Criticized Asset Committee may require the transfer of a loan to our workout and recovery department, which is tasked to effectively manage the loan with the goal of minimizing losses and expenses associated with restructure, collection and/or liquidation of collateral. Commercial loans with a risk rating of substandard, loans on non-accrual status, and assets classified as OREO or repossessed assets are usually transferred to workout and recovery. Oversight of the workout and recovery department is provided by the Criticized Asset Committee.
Our servicers evaluate each residential loan in default to determine the most effective loss mitigation strategy, which may be modification, short sale, or foreclosure, and pursue the alternative most suitable to the consumer and to mitigate losses to the Bank.
Analysis of the Allowance for Credit Losses
The ACL is management's estimate of the amount of expected credit losses over the life of the loan portfolio, or the amount of amortized cost basis not expected to be collected, at the balance sheet date. This estimate encompasses information about historical events, current conditions and reasonable and supportable economic forecasts. Determining the amount of the ACL is
56
complex and requires extensive judgment by management about matters that are inherently uncertain. Given a level of continued uncertainty about the general economy, evolving dynamics in some segments of the commercial real estate market, particularly the office sector, the complexity of the ACL estimate and level of management judgment required, we believe it is possible that the ACL estimate could change, potentially materially, in future periods. If commercial real estate market dynamics in our primary markets worsen beyond our current expectations, the ACL and the provision for credit losses will increase in the future. Changes in the ACL may result from changes in current economic conditions including but not limited to unanticipated increases in interest rates or inflationary pressures, changes in our economic forecast, loan portfolio composition, commercial and residential real estate market dynamics and other circumstances not currently known to us that may impact the financial condition and operations of our borrowers, among other factors.
Expected credit losses are estimated on a collective basis for groups of loans that share similar risk characteristics. For loans that do not share similar risk characteristics with other loans such as collateral dependent loans, expected credit losses are estimated on an individual basis. Expected credit losses are estimated over the contractual terms of the loans, adjusted for expected prepayments, generally excluding expected extensions, renewals, and modifications.
For the substantial majority of portfolio segments and subsegments, including residential loans other than government insured loans, and most commercial and commercial real estate loans, expected losses are estimated using econometric models.
A single economic scenario or a probability weighted blend of economic scenarios may be used. The models ingest numerous national, regional and MSA level variables and data points. At December 31, 2023, we used a combination of weighted third-party provided economic scenarios in calculating the quantitative portion of the ACL, and at December 31, 2022, we used a single externally provided baseline scenario, with a downside scenario informing a qualitative overlay. Each of these externally provided scenarios in fact represent the result of a probability weighting of thousands of individual scenario paths.
See Note 1 to the consolidated financial statements for more detailed information about our ACL methodology and related accounting policies.
The following table provides an analysis of the ACL, provision for (recovery of) credit losses related to the funded portion of loans and net charge-offs by loan segment for the periods indicated (dollars in thousands):
| Residential | Non-Owner Occupied Commercial Real Estate | Construction and Land | Owner Occupied Commercial Real Estate | Commercial and Industrial | Pinnacle - municipal Finance | Franchise Finance | Equipment Finance | Total | |||||||||||||||||||||||||||||||||||||||||||||
| Balance at December 31, 2020 | $ | 18,719 | $ | 101,334 | $ | 3,284 | $ | 28,797 | $ | 62,197 | $ | 304 | $ | 36,331 | $ | 6,357 | $ | 257,323 | |||||||||||||||||||||||||||||||||||
| Provision for (recovery of) credit losses | (9,241) | (65,543) | (2,253) | (6,844) | 31,180 | (134) | (8,857) | (2,764) | (64,456) | ||||||||||||||||||||||||||||||||||||||||||||
| Charge-offs | (304) | (9,167) | — | (471) | (50,563) | — | (10,745) | — | (71,250) | ||||||||||||||||||||||||||||||||||||||||||||
| Recoveries | 13 | 1,156 | — | 156 | 3,498 | — | 17 | — | 4,840 | ||||||||||||||||||||||||||||||||||||||||||||
| Balance at December 31, 2021 | 9,187 | 27,780 | 1,031 | 21,638 | 46,312 | 170 | 16,746 | 3,593 | 126,457 | ||||||||||||||||||||||||||||||||||||||||||||
| Provision for (recovery of) credit losses | 2,858 | 635 | 1,736 | 952 | 61,337 | 3 | 7,542 | (1,249) | 73,814 | ||||||||||||||||||||||||||||||||||||||||||||
| Charge-offs | (412) | (9,188) | (343) | (2,870) | (36,051) | — | (13,191) | — | (62,055) | ||||||||||||||||||||||||||||||||||||||||||||
| Recoveries | 108 | 3,100 | — | 823 | 5,049 | — | 650 | — | 9,730 | ||||||||||||||||||||||||||||||||||||||||||||
| Balance at December 31, 2022 | 11,741 | 22,327 | 2,424 | 20,543 | 76,647 | 173 | 11,747 | 2,344 | 147,946 | ||||||||||||||||||||||||||||||||||||||||||||
| Impact of adoption of ASU 2022-02 | (117) | — | — | 5 | (1,676) | — | (6) | — | (1,794) | ||||||||||||||||||||||||||||||||||||||||||||
| Balance at January 1, 2023 | 11,624 | 22,327 | 2,424 | 20,548 | 74,971 | 173 | 11,741 | 2,344 | 146,152 | ||||||||||||||||||||||||||||||||||||||||||||
| Provision for (recovery of) credit losses | (4,002) | 11,088 | 6,104 | (5,546) | 67,816 | 70 | 2,738 | 656 | 78,924 | ||||||||||||||||||||||||||||||||||||||||||||
| Charge-offs | — | (1,228) | — | (447) | (26,092) | — | (7,247) | — | (35,014) | ||||||||||||||||||||||||||||||||||||||||||||
| Recoveries | 9 | 623 | — | 3,087 | 8,285 | — | 623 | — | 12,627 | ||||||||||||||||||||||||||||||||||||||||||||
| Balance at December 31, 2023 | $ | 7,631 | $ | 32,810 | $ | 8,528 | $ | 17,642 | $ | 124,980 | $ | 243 | $ | 7,855 | $ | 3,000 | $ | 202,689 | |||||||||||||||||||||||||||||||||||
Net Charge-offs to Average Loans | |||||||||||||||||||||||||||||||||||||||||||||||||||||
Years Ended December 31, 2021 | — | % | 0.13 | % | — | % | 0.02 | % | 0.82 | % | — | % | 2.34 | % | — | % | 0.29 | % | |||||||||||||||||||||||||||||||||||
| Years Ended December 31, 2022 | — | % | 0.11 | % | 0.16 | % | 0.11 | % | 0.50 | % | — | % | 4.49 | % | — | % | 0.22 | % | |||||||||||||||||||||||||||||||||||
| Years Ended December 31, 2023 | — | % | 0.01 | % | — | % | (0.14) | % | 0.25 | % | — | % | 3.48 | % | — | % | 0.09 | % | |||||||||||||||||||||||||||||||||||
57
The following table shows the distribution of the ACL at the dates indicated (dollars in thousands):
| December 31, 2023 | December 31, 2022 | ||||||||||||||||||||||
| Total | %(1) | Total | %(1) | ||||||||||||||||||||
| Residential | $ | 7,631 | 33.3 | % | $ | 11,741 | 35.7 | % | |||||||||||||||
| Non-owner occupied commercial real estate | 32,810 | 21.6 | % | 22,327 | 21.7 | % | |||||||||||||||||
| Construction and land | 8,528 | 2.0 | % | 2,424 | 1.2 | % | |||||||||||||||||
| CRE | 41,338 | 24,751 | |||||||||||||||||||||
| Owner occupied commercial real estate | 17,642 | 7.9 | % | 20,543 | 7.6 | % | |||||||||||||||||
Commercial and industrial(2) | 124,980 | 30.1 | % | 76,647 | 28.0 | % | |||||||||||||||||
| Pinnacle - municipal finance | 243 | 3.6 | % | 173 | 3.7 | % | |||||||||||||||||
| Franchise finance | 7,855 | 0.7 | % | 11,747 | 1.0 | % | |||||||||||||||||
| Equipment finance | 3,000 | 0.8 | % | 2,344 | 1.1 | % | |||||||||||||||||
| 153,720 | 111,454 | ||||||||||||||||||||||
| $ | 202,689 | 100.0 | % | $ | 147,946 | 100.0 | % | ||||||||||||||||
(1)Represents percentage of loans receivable in each category to total loans receivable.
(2)Includes mortgage warehouse lending.
The following table presents the allocation of the ACL as a percentage of loans at the dates indicated:
| December 31, 2023 | December 31, 2022 | ||||||||||
| Residential | 0.09 | % | 0.13 | % | |||||||
| Commercial: | |||||||||||
| CRE | 0.71 | % | 0.43 | % | |||||||
| Commercial and industrial | 1.53 | % | 1.10 | % | |||||||
| Pinnacle - municipal finance | 0.03 | % | 0.02 | % | |||||||
| Franchise finance | 4.31 | % | 4.63 | % | |||||||
| Equipment finance | 1.52 | % | 0.82 | % | |||||||
| Total commercial | 1.19 | % | 0.85 | % | |||||||
| 0.82 | % | 0.59 | % | ||||||||
| ACL to non-performing loans | 159.54 | % | 140.88 | % | |||||||
58
Factors contributing to the change in the ACL during the year ended December 31, 2023, are depicted in the chart below (dollars in millions):
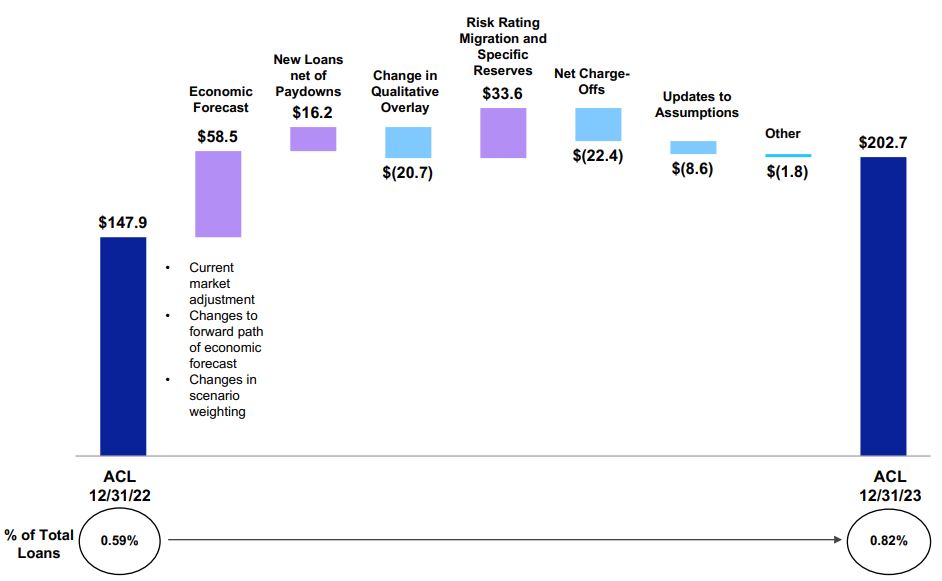
Changes in the ACL during the year ended December 31, 2023
As depicted in the chart above, the most significant drivers of the increase in the ACL from December 31, 2022, to December 31, 2023, were the impact of changes in the economic forecast, risk rating migration and an increase in certain specific reserves. These factors were partially offset by net charge-offs and a reduction in the qualitative overlay as, in management's judgment, certain factors previously captured qualitatively are now being addressed in the quantitative modeling. The ACL as a percentage of loans increased to 0.82% at December 31, 2023, from 0.59% at December 31, 2022. This is consistent with the increase in criticized and classified assets, evolving commercial real estate market dynamics and shifts in portfolio composition. Further discussion of changes in the ACL for select portfolio sub-segments follows:
•The ACL for the residential segment decreased by $4.1 million during the year ended December 31, 2023, from 0.13% to 0.09% of loans primarily due to reduction in the size of the portfolio and changes in certain assumptions.
•The ACL for the CRE portfolio sub-segment, including non-owner occupied CRE and construction and land, increased by $16.6 million during the year ended December 31, 2023, from 0.43% to 0.71% of loans. The increase in the ACL for this segment was primarily driven by changes in the economic forecast, including changes in commercial property forecasts, and risk rating migration. At December 31, 2023, the ACL for the CRE office portfolio totaled $19.3 million, or 1.10% of loans, an increase from 0.45% of loans at December 31, 2022.
•The ACL for the commercial and industrial sub-segment, including owner-occupied commercial real estate, increased by $45.4 million during the year ended December 31, 2023, from 1.10% to 1.53% of loans. The increase in the ACL for this segment was primarily driven by (i) changes in the economic forecast; (ii) an increase in certain specific reserves; (iii) risk rating migration; and (iv) loan growth, partially offset by net charge-offs.
•The ACL for the franchise finance portfolio segment decreased by $3.9 million during the year ended December 31, 2023, from 4.63% to 4.31% of loans primarily due to net charge-offs, partially offset by an increase in specific reserves related to one relationship.
59
•The ACL for the equipment finance portfolio segment increased by $0.7 million during the year ended December 31, 2023, from 0.82% to 1.52% of loans primarily due to risk rating migration.
The estimate of the ACL at December 31, 2023, was informed by forecasted economic scenarios published in December 2023, a wide variety of additional economic data, information about borrower financial condition and collateral values and other relevant information. The quantitative portion of the ACL at December 31, 2023, was modeled using a weighting of baseline, downside and upside third-party economic scenarios, with the highest weighting ascribed to the baseline scenario and the lowest weighting ascribed to the upside scenario. The economic variables that were most impactful to the increase in the ACL for the year ended December 31, 2023, included assumptions about interest rates and spreads, commercial property forecasts and the forecasted trajectory of regional unemployment.
Some of the high level data points informing the scenarios used in estimating the quantitative portion of the ACL at December 31, 2023, included:
•Labor market assumptions, which reflected national unemployment peaking at 4.1% in the baseline scenario and 7.7% in the downside scenario; and
•Annualized growth in national GDP troughing at 1.1% in the baseline and (3.5)% in the downside scenario.
The above unemployment and GDP growth assumptions are provided to give a high level overview of the nature and severity of the economic forecast scenarios used in estimating the ACL. Numerous additional variables and assumptions not explicitly stated, including but not limited to detailed commercial property forecasts, projected stock market volatility indices and a variety of assumptions about market interest rates and spreads also contributed to the overall impact economic conditions and the economic forecast had on the ACL estimate. Furthermore, while the variables presented above are at the national level, most of the economic variables are regionalized at the market and submarket level in the models.
For additional information about the ACL, see Note 4 to the consolidated financial statements.
Deposits
A further breakdown of deposits at the dates indicated is shown below:
| December 31, 2023 | December 31, 2022 | |||||||
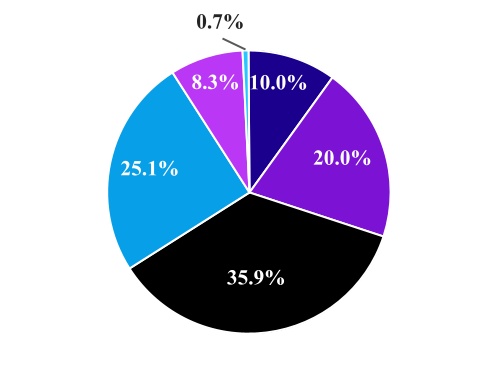
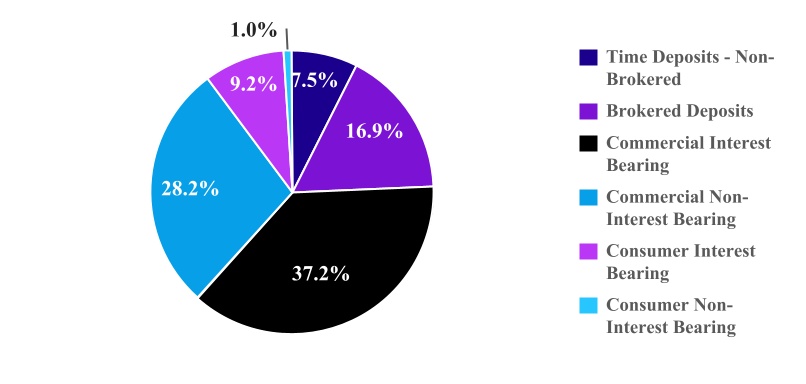
The Company has a diverse deposit book by industry sector. Our largest industry vertical at December 31, 2023, was the title insurance vertical, with approximately $2.5 billion in total deposits. Over 75% of title sector deposits were in operating accounts. Approximately 61% of our total deposits were commercial or municipal deposits at December 31, 2023.
60
The following graph presents trends in the deposit mix and cost of deposits (in millions):
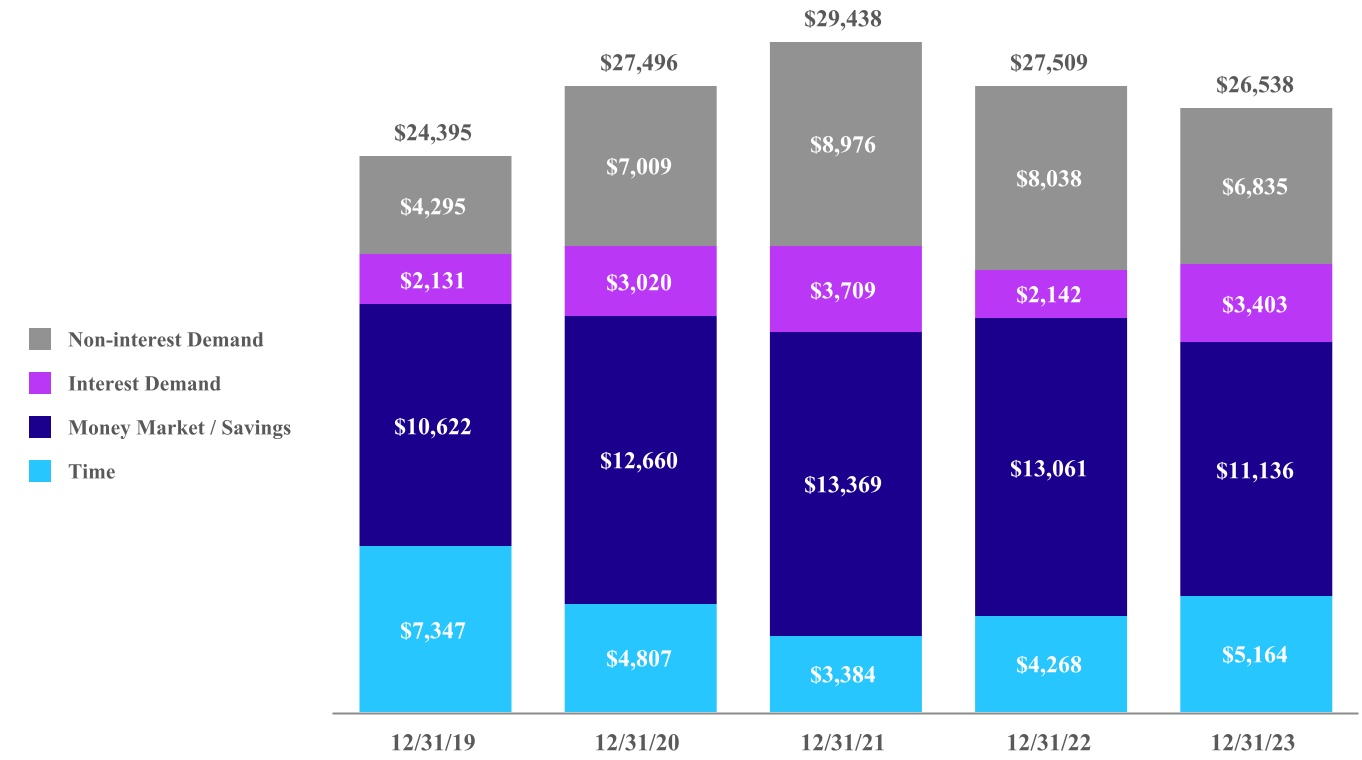
Cost of deposits | 1.48% | 0.43% | 0.19% | 1.42% | 2.96% | ||||||||||||
Non-interest bearing as a % of total deposits | 17.6% | 25.5% | 30.5% | 29.2% | 25.8% | ||||||||||||
The events surrounding the bank closures in early 2023, as well as a higher rate environment and tight liquidity conditions leading to increased competition for deposits, contributed to the shift in deposit mix for the year ended December 31, 2023. Total deposits declined by $971 million; non-interest bearing demand deposits declined by $1.2 billion. The decline in non-interest bearing demand deposits reflected the impact of a higher rate environment on the title industry vertical as well as depositors moving their cash to higher yielding alternatives. We did not experience a material decline in non-interest bearing demand deposits immediately following the bank closures early in 2023. Non-maturity interest-bearing deposits declined by $664 million during the year ended December 31, 2023, while time deposits grew by $896 million; these shifts within interest-bearing deposit categories were in part related to the bank failures of early 2023. Deposit outflows immediately following those events were concentrated in a few larger money market relationships; our near-term deposit gathering strategy then shifted toward time deposits.
61
Consistent with industry trends, the cost of deposits increased for the year ended December 31, 2023, as depositors were seeking yield in a higher rate environment. The following graph presents trends in the spot APY of total deposits compared to the upper bound of the federal funds target range:
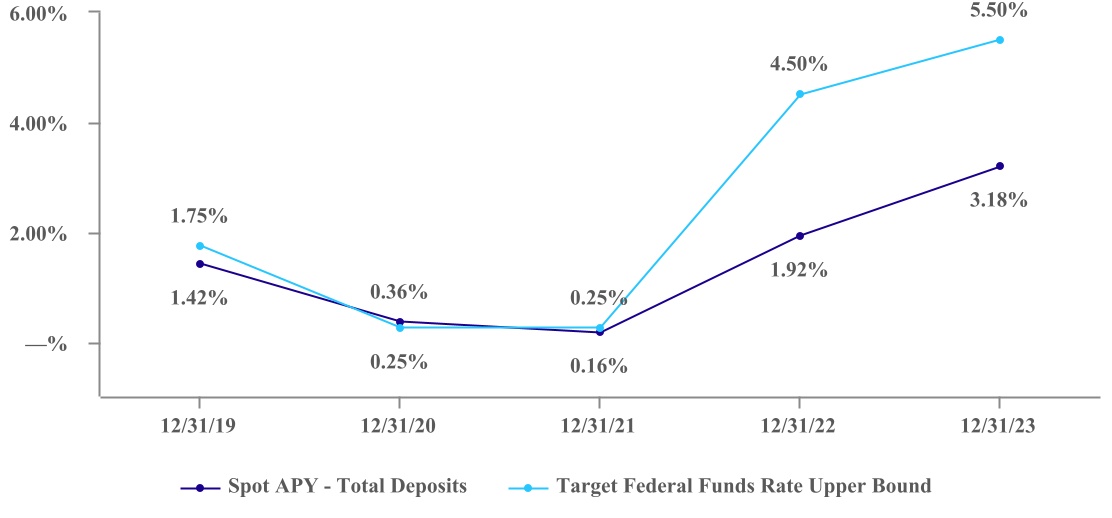
The following table presents information about the Company's insured and collateralized deposits as of December 31, 2023 (dollars in thousands):
| Total deposits | $ | 26,538,478 | ||||||
Estimated amount of uninsured deposits | $ | 12,360,020 | ||||||
| Less: collateralized deposits | (3,047,517) | |||||||
| Less: affiliate deposits | (317,858) | |||||||
| Adjusted uninsured deposits | $ | 8,994,645 | ||||||
| Estimated insured and collateralized deposits | $ | 17,543,833 | ||||||
| Insured and collateralized deposits to total deposits | 66 | % | ||||||
The estimated amount of uninsured deposits at December 31, 2023 and 2022, was $12.4 billion and $18.2 billion, respectively. Collateralized and affiliate deposits are included in these amounts.
Time deposit accounts with balances of $250,000 or more totaled $941 million and $730 million at December 31, 2023 and 2022, respectively. The following table shows scheduled maturities of uninsured time deposits as of December 31, 2023 (in thousands):
| Three months or less | $ | 332,424 | |||
| Over three through six months | 124,006 | ||||
| Over six through twelve months | 383,853 | ||||
| Over twelve months | 3,985 | ||||
| $ | 844,268 | ||||
For additional information about Deposits, see Note 6 to the consolidated financial statements.
62
Borrowings
In addition to deposits, we utilize FHLB advances as a funding source; the advances provide us with additional flexibility in managing both term and cost of funding and in managing interest rate risk. FHLB advances are secured by qualifying residential first mortgage and commercial real estate loans and MBS. The following table presents information about the contractual balance of outstanding FHLB advances, as of December 31, 2023 (dollars in thousands):
| Amount | Weighted Average Rate | ||||||||||
| Maturing in: | |||||||||||
2024 - One month or less | $ | 4,220,000 | 5.47 | % | |||||||
2024 - Over one month | 895,000 | 5.56 | % | ||||||||
| Total contractual balance outstanding | $ | 5,115,000 | |||||||||
The table above reflects contractual maturities of outstanding advances and does not incorporate the impact that interest rate swaps designated as cash flow hedges have on the duration or cost of borrowings.
The table below presents information about outstanding interest rate swaps hedging the variability of interest cash flows on the FHLB advances included in the table above, as of December 31, 2023 (dollars in thousands):
| Notional Amount | Weighted Average Rate | ||||||||||
| Cash flow hedges maturing in: | |||||||||||
| 2024 | $ | 535,000 | 2.40 | % | |||||||
| 2025 | 625,000 | 2.74 | % | ||||||||
| 2026 | 1,430,000 | 3.50 | % | ||||||||
| Thereafter | 25,000 | 2.50 | % | ||||||||
| $ | 2,615,000 | 3.08 | % | ||||||||
See Note 10 to the consolidated financial statements and "Interest Rate Risk" below for more information about derivative instruments.
Outstanding notes payable and other borrowings consisted of the following at the dates indicated (in thousands):
| December 31, 2023 | December 31, 2022 | ||||||||||
| Senior notes: | |||||||||||
Principal amount of 4.875% senior notes maturing on November 17, 2025 | $ | 388,479 | $ | 400,000 | |||||||
| Unamortized discount and debt issuance costs | (1,676) | (2,586) | |||||||||
| 386,803 | 397,414 | ||||||||||
| Subordinated notes: | |||||||||||
Principal amount of 5.125% subordinated notes maturing on June 11, 2030 | 300,000 | 300,000 | |||||||||
| Unamortized discount and debt issuance costs | (4,331) | (4,880) | |||||||||
| 295,669 | 295,120 | ||||||||||
| Total notes | 682,472 | 692,534 | |||||||||
| Finance leases | 26,501 | 28,389 | |||||||||
| Notes and other borrowings | $ | 708,973 | $ | 720,923 | |||||||
During the year ended December 31, 2023, the Bank purchased $11.5 million of outstanding senior notes in the open market at a price of $10.6 million, an implied yield of approximately 9%.
63
Liquidity and Capital Resources
Liquidity
Liquidity involves our ability to generate adequate funds to support planned interest earning asset growth, meet deposit withdrawal and credit line usage requests in both normal operating and stressed environments, maintain reserve requirements, conduct routine operations, pay dividends, service outstanding debt and meet other contractual obligations.
BankUnited's ongoing liquidity needs have historically been met primarily by cash flows from operations, deposit growth, the investment portfolio, its amortizing loan portfolio and FHLB advances. FRB discount window borrowings, repurchase agreement capacity and a letter of credit with the FHLB provide additional sources of contingent liquidity. For the years ended December 31, 2023, 2022 and 2021, net cash provided by operating activities was $657 million, $1.3 billion, and $1.2 billion, respectively. The decline in cash flows from operating activities for the year ended December 31, 2023, was primarily related to fluctuations in the daily cash settlement of derivative positions centrally cleared through the CME, a lower volume of re-securitization of early buyout loans and the fluctuation in income taxes paid (refunded).
Available liquidity sources include cash; secured funding, such as borrowing capacity at the Federal Home Loan Bank of Atlanta and the Federal Reserve; and unencumbered securities. Additional sources of liquidity include cash flows from operations, wholesale deposits, cash flow from the Bank's amortizing securities and loan portfolios, and the sale of investment securities. Management also has the ability to exert substantial control over the rate and timing of loan production, and resultant requirements for liquidity to fund new loans.
Systemic events of March 2023 impacted liquidity in the banking system, particularly for mid-size and regional banks, including BankUnited. Immediately following those events, management took a number of prudent actions to maximize BankUnited's same day available liquidity levels and enhance liquidity management. We activated our contingency funding plan, enhanced daily and intra-day deposit monitoring and reporting, pledged additional securities and loan collateral to the FHLB and FRB, temporarily increased the amount of cash held on balance sheet and enhanced communications with funding sources, customers, counterparties and other stakeholders. While deposit flows and liquidity conditions stabilized relatively quickly, we have kept in place enhanced monitoring and reporting of liquidity levels and deposit flows and have maintained higher levels of assets pledged at the FHLB and FRB. We executed strategies to grow our retail time deposit portfolio and enhanced monitoring and management at the executive level of our treasury management deposit pipeline.
The following chart presents the components of same day available liquidity at December 31, 2023 and 2022 (in millions):
| Same Day Available Liquidity | ||
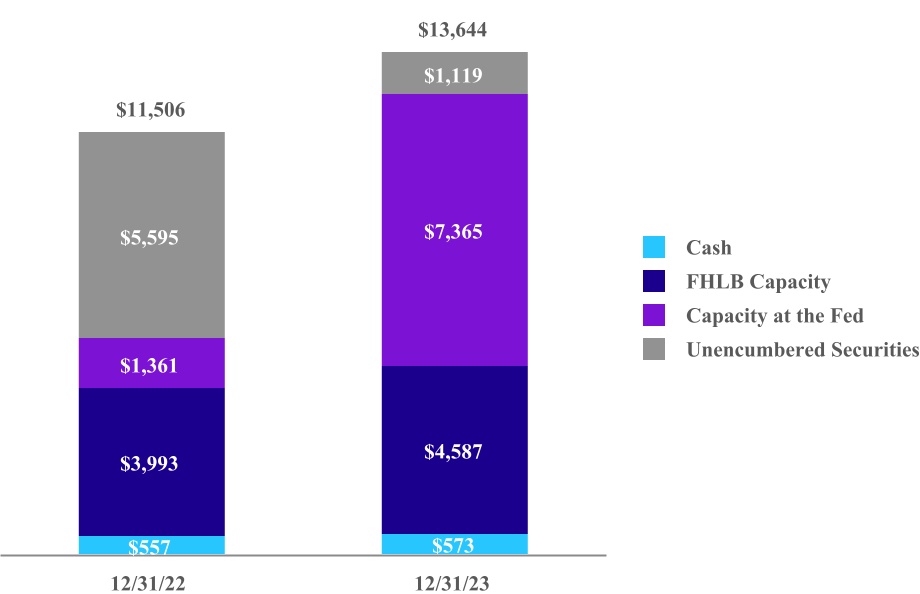
At December 31, 2023, the Bank had total same day available liquidity of approximately $13.6 billion, consisting of cash of $573 million, borrowing capacity at the Federal Home Loan Bank of $4.6 billion, borrowing capacity at the FRB of $7.4 billion and unencumbered securities of $1.1 billion. At December 31, 2023, the ratio of estimated insured and collateralized deposits to total deposits was 66%, up from 55% at December 31, 2022, and the ratio of available liquidity to estimated uninsured, uncollateralized deposits was 152% compared to 93% at December 31, 2022. As a commercially focused bank, due
64
to the inherent nature of commercial deposits, a significant portion of our deposits are uninsured. We have increased marketing and educational efforts around products that enable customers to obtain FDIC insurance on certain deposits exceeding the standard single depositor insurance limit, implemented single depositor concentration limits and reduced or eliminated exposure to sectors or depositors that evidenced higher volatility following the events of early 2023.
The ALM policy establishes limits or operating risk thresholds for a number of measures of liquidity which are monitored at least monthly by the ALCO and quarterly by the Board of Directors. In the current environment, many of these metrics are being monitored more frequently. Following the events of March 2023, management re-evaluated and refined these measures, and continues to evaluate further refinements as new data becomes available. Some of the measures currently used to dimension liquidity risk and manage liquidity are the ratio of available liquidity to uninsured/non-collateralized deposits, the ratio of wholesale funding to total assets, the ratio of available operational liquidity (which excludes availability at the FRB) to volatile liabilities, a liquidity stress test coverage ratio, the loan to deposit ratio, a one-year liquidity ratio a measure of available on-balance sheet liquidity, the ratio of FHLB advances to total assets, large depositor concentrations and the ratio of non-interest bearing deposits to total deposits, which is reflective of the quality and cost, rather than the quantity, of available liquidity. We also have single depositor relationship limits.
The following tables presents some of the Company's liquidity measures, where applicable, their related policy limits and operating risk thresholds at the dates indicated:
December 31, 2023 | Policy Limit | ||||||||||
Available liquidity to uninsured/non-collateralized deposits | 152% | <100% | |||||||||
Wholesale funding/total assets | 31.7% | <37.5% | |||||||||
| December 31, 2023 | Low or Moderate Risk Operating Threshold | ||||||||||
Available operational liquidity/volatile liabilities | 1.56x | ≥1.30x | |||||||||
Liquidity stress test coverage ratio | 1.77x | ≥1.50x | |||||||||
FHLB advances/total assets | 16.8% | ≤20% | |||||||||
One year liquidity ratio | 1.58x | ≥1.00x | |||||||||
Loan to deposit ratio | 92.1% | ≤100% | |||||||||
Top 20 uninsured depositors to total deposits (excluding brokered & municipal deposits) | 14.1% | ≤15% | |||||||||
Non interest-bearing demand deposits/total deposits | 25.8% | ≥20% | |||||||||
Available on-balance sheet liquidity | 7.1% | ≥5% | |||||||||
Although within policy limits, wholesale funding levels currently remain elevated at December 31, 2023; a near-term strategic priority of the Company is reducing wholesale funding.
As a holding company, BankUnited, Inc. is a corporation separate and apart from its banking subsidiary, and therefore, provides for its own liquidity. BankUnited, Inc.’s main sources of funds include management fees and dividends from the Bank, access to capital markets and, to a lesser extent, its own securities portfolio. There are regulatory limitations that may affect the ability of the Bank to pay dividends to BankUnited, Inc. Management believes that such limitations will not impact our ability to meet our ongoing near-term cash obligations.
65
The following table presents the Company's material contractual cash requirements for the following twelve months, as of December 31, 2023 (in thousands):
Term deposits(1) | $ | 4,770,722 | |||
FHLB advances(1) | 5,127,959 | ||||
Notes and other borrowings(1) | 37,741 | ||||
Operating lease obligations | 19,280 | ||||
| $ | 9,955,702 | ||||
(1)Includes interest to be paid on the outstanding contractual obligations.
At December 31, 2023, the Company had $4.7 billion in term deposits with a contractual maturity of twelve months or less. The majority of term deposits and FHLB advances are expected to roll over into new instruments; this amount therefore does not represent future anticipated cash requirements. Additionally, as discussed in Note 15 to the consolidated financial statements, the Bank had $257 million in outstanding commitments to fund loans and $4.7 billion in unfunded commitments under existing lines of credit at December 31, 2023. Many of these commitments are expected to expire without being fully funded and, therefore, also do not necessarily represent future cash requirements.
Capital
Pursuant to the FDIA, the federal banking agencies have adopted regulations setting forth a five-tier system for measuring the capital adequacy of the financial institutions they supervise. At December 31, 2023 and 2022, the Company and the Bank had capital levels that exceeded both the regulatory well-capitalized guidelines and all internal capital ratio targets. Upon adoption of ASU 2016-13 on January 1, 2020, the Company elected the option to temporarily delay the effects of CECL on regulatory capital for two years, followed by a three-year transition period. See Note 13 to the consolidated financial statements for more information about the Company's and the Bank's regulatory capital ratios.
We have an active shelf registration statement on file with the SEC that allows the Company to periodically offer and sell in one or more offerings, individually or in any combination, our common stock, preferred stock and other non-equity securities. The shelf registration provides us with flexibility in issuing capital instruments and enables us to more readily access the capital markets as needed to pursue future growth opportunities and to ensure continued compliance with regulatory capital requirements. Our ability to issue securities pursuant to the shelf registration is subject to market conditions.
Interest Rate Risk
A principal component of the Company’s risk of loss arising from adverse changes in the fair value of financial instruments, or market risk, is interest rate risk, including the risk that assets and liabilities with similar re-pricing characteristics may not reprice at the same time or to the same degree. A primary objective of the Company’s asset/liability management activities is to maximize net interest income, while maintaining acceptable levels of interest rate risk. The ALCO is responsible for establishing policies to manage exposure to interest rate risk, and to ensure procedures are established to monitor compliance with these policies. The policies established by the ALCO are approved at least annually by the Board of Directors or its Risk Committee.
Management believes that the simulation of net interest income in different interest rate environments provides the most meaningful measure of interest rate risk. Income simulation analysis is designed to capture not only the potential of all assets and liabilities to mature or reprice, but also the probability that they will do so. Income simulation also attends to the relative interest rate sensitivities of these items, and projects their behavior over an extended period of time. Finally, income simulation permits management to assess the probable effects on the balance sheet not only of changes in interest rates, but also of proposed strategies for responding to them. Simulation of changes in EVE in various interest rate environments is also a meaningful measure of interest rate risk.
The income simulation model analyzes interest rate sensitivity by projecting net interest income over twelve and twenty-four month periods in a most likely rate scenario based on a consensus forward curve versus net interest income in alternative rate scenarios. Management continually reviews and refines its interest rate risk management process in response to changes in the interest rate environment, the economic climate and observed customer behavior. Currently, our interest rate risk management framework is based on modeling instantaneous rate shocks to a static balance sheet, assuming that maturing instruments are replaced with like instruments at forward rates, of plus and minus 100, 200, 300 and 400 basis point parallel shifts. In lower interest rate environments, we may not model more extreme declining rate scenarios and in certain macro-environments, we may model shocks of more than 400 basis points. Our ALM policy has established limits for the plus and minus 100 and 200 basis points shock scenarios. We also model a variety of dynamic balance sheet scenarios, various yield
66
curve slopes, non-parallel shifts and alternative depositor behavior, beta and decay assumptions. We continually evaluate the scenarios being modeled with a view toward adapting them to changing economic conditions, expectations and trends. For example, following the events of early 2023 we modeled a variety of alternative non-maturity deposit runoff scenarios.
The following table presents the impact on forecasted net interest income compared to a "most likely" scenario, based on the consensus forward curve, in static balance sheet, parallel rate shock scenarios of plus and minus 100 and 200 basis points at December 31, 2023 and 2022:
| Down 200 | Down 100 | Plus 100 | Plus 200 | ||||||||||||||||||||
Policy Limits: | |||||||||||||||||||||||
| In year 1 | (12) | % | (8) | % | (8) | % | (12) | % | |||||||||||||||
| In year 2 | (15) | % | (11) | % | (11) | % | (15) | % | |||||||||||||||
Model Results at December 31, 2023 - increase (decrease) | |||||||||||||||||||||||
| In year 1 | (4.7) | % | (1.6) | % | 1.0 | % | 2.1 | % | |||||||||||||||
| In year 2 | (6.0) | % | (2.3) | % | 1.5 | % | 2.0 | % | |||||||||||||||
Model Results at December 31, 2022 - increase (decrease) | |||||||||||||||||||||||
| In year 1 | (5.1) | % | (1.7) | % | 0.1 | % | (0.6) | % | |||||||||||||||
| In year 2 | (8.4) | % | (3.5) | % | 1.8 | % | 2.3 | % | |||||||||||||||
The following table illustrates the modeled change in EVE in the indicated scenarios at December 31, 2023 and 2022:
| Down 200 | Down 100 | Plus 100 | Plus 200 | ||||||||||||||||||||
Policy Limits | (20.0) | % | (10.0) | % | (10.0) | % | (20.0) | % | |||||||||||||||
Model Results at December 31, 2023 - increase (decrease): | 15.2 | % | 9.5 | % | (8.8) | % | (17.4) | % | |||||||||||||||
Model Results at December 31, 2022 - increase (decrease): | 4.5 | % | 3.8 | % | (5.5) | % | (11.3) | % | |||||||||||||||
All of the modeled results at December 31, 2023, are within ALM policy limits. Modeled results at December 31, 2023, may not be fully comparable to modeled results at December 31, 2022. While changes in modeled results do reflect shifts in balance sheet composition, they also incorporate changes made to assumptions about depositor behavior, in response to the liquidity events of March and April.
Many assumptions were used by the Company to calculate the impact of changes in interest rates on forecasted net interest income and EVE, including the change in rates. Actual results may not be similar to the Company’s projections due to several factors including the timing and frequency of rate changes, market conditions, unanticipated changes in depositor behavior and loan prepayment speeds and the shape of the yield curve. Actual results may also differ due to the Company’s actions, if any, in response to changing rates and conditions or changes in balance sheet composition.
As a result of the liquidity events of early 2023, we performed a comprehensive updated deposit decay and beta study and revised our standard decay and beta assumptions accordingly. Along with this exercise, we benchmarked our weighted average life and beta assumptions against information provided in the OCC's Fall 2023 Publication of Interest Rate Risk Statistics. Generally, our assumptions were conservative when compared to peer medians, as we would expect given the commercial nature and relative immaturity of our deposit base. We regularly run sensitivity analysis on our beta and decay assumptions and back-test all of the significant assumptions underlying our ALM modeling.
Following the completion of the recent deposit study, we are modeling average betas of 50% for interest bearing checking and 69% for money market deposits. We are modeling weighted average lives of 5.2 years for non-interest bearing checking, 4.1 years for interest-bearing checking and 4.0 years for money market deposits.
67
Derivative Financial Instruments and Hedging Activities
Management continually evaluates a variety of hedging strategies that are available to manage interest rate risk. In the current environment, we continue to evaluate potential hedging strategies to mitigate risk from a period of rapid or extreme declines in rates.
Interest rate derivatives designated as cash flow or fair value hedging instruments are tools we use to manage interest rate risk. These derivative instruments are used to mitigate exposure to changes in interest cash flows on variable rate liabilities and to changes in the fair value of fixed rate financial instruments, in each case caused by fluctuations in benchmark interest rates, as well as to manage duration of liabilities.
The following table provides information about the Company's derivatives designated as hedging instruments as of December 31, 2023 (dollars in thousands):
| Weighted Average Pay Rate / Strike Price | Weighted Average Receive Rate / Strike Price | Weighted Average Remaining Life in Years | |||||||||||||||||||||||||||
| Notional Amount | |||||||||||||||||||||||||||||
| Hedged Item | |||||||||||||||||||||||||||||
| Derivatives designated as cash flow hedges: | |||||||||||||||||||||||||||||
| Pay-fixed interest rate swaps | Variability of interest cash flows on variable rate borrowings | $ | 2,615,000 | 3.08% | Daily SOFR | 1.9 | |||||||||||||||||||||||
| Pay-fixed interest rate swaps | Variability of interest cash flows on variable rate liabilities | 400,000 | 1.22% | Fed Funds Effective Rate | 0.7 | ||||||||||||||||||||||||
| Pay-variable interest rate swaps | Variability of interest cash flows on variable rate loans | 200,000 | Term SOFR | 3.72% | 2.3 | ||||||||||||||||||||||||
| Interest rate caps purchased, indexed to Fed Funds effective rate | Variability of interest cash flows on variable rate liabilities | 200,000 | 0.88% | 1.5 | |||||||||||||||||||||||||
Interest rate collar, indexed to 1-month SOFR(1) | Variability of interest cash flows on variable rate loans | 125,000 | 5.58% | 1.50% | 2.7 | ||||||||||||||||||||||||
| Derivatives designated as fair value hedges: | |||||||||||||||||||||||||||||
| Pay-fixed interest rate swaps | Variability of fair value of fixed rate loans | 100,000 | 1.94% | Daily SOFR | 0.6 | ||||||||||||||||||||||||
| $ | 3,640,000 | ||||||||||||||||||||||||||||
(1) The interest rate collar consists of a combination of zero-premium interest rate options. The Company sold a pay-variable cap with a strike price of 5.58%; sold a 0% floor; and purchased a receive-variable floor with a strike price of 1.50%.
In addition to derivative instruments, the Company has issued callable CDs to hedge interest rate risk in a falling rate environment; the amount of such instruments outstanding at December 31, 2023, was $711 million. The short duration of our AFS investment portfolio (1.96 at December 31, 2023) also provides a natural offset from an interest rate risk perspective to the longer duration of the residential mortgage portfolio.
See Note 10 to the consolidated financial statements for additional information about derivative financial instruments.
LIBOR Transition
The FCA, which regulated USD LIBOR, discontinued the one-week and two-month LIBOR tenors effective December 31, 2021 and remaining tenors were discontinued effective June 30, 2023. The Company executed a comprehensive roadmap to amend the terms of LIBOR-based financial instruments, generally replacing LIBOR with SOFR as the preferred alternative reference rate. As of December 31, 2023, all LIBOR-based instruments have been converted to an alternative reference rate, generally SOFR, based on their contractual provisions.
68
Non-GAAP Financial Measures
Tangible book value per common share is a non-GAAP financial measure. Management believes this measure is relevant to understanding the capital position and performance of the Company. Disclosure of this non-GAAP financial measure also provides a meaningful basis for comparison to other financial institutions as it is a metric commonly used in the banking industry. The following table reconciles the non-GAAP financial measurement of tangible book value per common share to the comparable GAAP financial measurement of book value per common share at the dates indicated (in thousands, except share and per share data):
| December 31, 2023 | December 31, 2022 | ||||||||||
| Total stockholders’ equity | $ | 2,577,921 | $ | 2,435,981 | |||||||
| Less: goodwill and other intangible assets | 77,637 | 77,637 | |||||||||
| Tangible stockholders’ equity | $ | 2,500,284 | $ | 2,358,344 | |||||||
| Common shares issued and outstanding | 74,372,505 | 75,674,587 | |||||||||
| Book value per common share | $ | 34.66 | $ | 32.19 | |||||||
| Tangible book value per common share | $ | 33.62 | $ | 31.16 | |||||||
69
Item 7A. Quantitative and Qualitative Disclosures About Market Risk
See the section entitled “Interest Rate Risk” included in Item 7. “Management’s Discussion and Analysis of Financial Condition and Results of Operations.”
Item 8. Financial Statements and Supplementary Data
INDEX TO CONSOLIDATED FINANCIAL STATEMENTS
| Page | |||||
BankUnited, Inc. Consolidated Financial Statements for the Years ended December 31, 2023, 2022 and 2021 | |||||
Reports of Independent Registered Public Accounting Firm ( | |||||
70
MANAGEMENT'S REPORT ON INTERNAL CONTROL OVER FINANCIAL REPORTING
Management is responsible for establishing and maintaining adequate internal control over financial reporting, as such term is defined in the Securities Exchange Act of 1934 Rule 13a-15(f). The Company's internal control over financial reporting includes those policies and procedures that (i) pertain to the maintenance of records that, in reasonable detail, accurately and fairly reflect the transactions and dispositions of the assets of the Company; (ii) provide reasonable assurance that transactions are recorded as necessary to permit preparation of financial statements in accordance with generally accepted accounting principles, and that receipts and expenditures of the Company are being made only in accordance with authorizations of management and directors of the Company; and (iii) provide reasonable assurance regarding prevention or timely detection of unauthorized acquisition, use, or disposition of the Company's assets that could have a material effect on the financial statements.
Internal control over financial reporting is designed to provide reasonable assurance regarding the reliability of financial reporting and the preparation of financial statements prepared for external purposes in accordance with generally accepted accounting principles. Because of its inherent limitations, internal control over financial reporting may not prevent or detect misstatements. Also, projections of any evaluation of effectiveness to future periods are subject to the risk that controls may become inadequate because of changes in conditions, or that the degree of compliance with the policies or procedures may deteriorate.
Under the supervision and with the participation of management, including the Company's principal executive officer and principal financial officer, the Company conducted an evaluation of the effectiveness of the Company's internal control over financial reporting based on the framework in Internal Control—Integrated Framework (2013) issued by the Committee of Sponsoring Organizations of the Treadway Commission. Based on the Company's evaluation under the framework in Internal Control—Integrated Framework, management concluded that the Company's internal control over financial reporting was effective as of December 31, 2023.
The effectiveness of the Company's internal control over financial reporting as of December 31, 2023, has been audited by Deloitte and Touche LLP, an independent registered public accounting firm, as stated in their report which is included herein.
71
Report of Independent Registered Public Accounting Firm
To the stockholders and Board of Directors of BankUnited, Inc.:
Opinion on the Financial Statements
We have audited the accompanying consolidated balance sheets of BankUnited, Inc. and subsidiaries (the "Company") as of December 31, 2023 and 2022, the related consolidated statements of income, comprehensive income, cash flows, and stockholders' equity for each of the three years in the period ended December 31, 2023, and the related notes (collectively referred to as the "financial statements"). In our opinion, the financial statements present fairly, in all material respects, the financial position of the Company as of December 31, 2023 and 2022, and the results of its operations and its cash flows for each of the three years in the period ended December 31, 2023, in conformity with accounting principles generally accepted in the United States of America.
We have also audited, in accordance with the standards of the Public Company Accounting Oversight Board (United States) (PCAOB), the Company's internal control over financial reporting as of December 31, 2023, based on criteria established in Internal Control — Integrated Framework (2013) issued by the Committee of Sponsoring Organizations of the Treadway Commission and our report dated February 20, 2024, expressed an unqualified opinion on the Company's internal control over financial reporting.
Basis for Opinion
These financial statements are the responsibility of the Company's management. Our responsibility is to express an opinion on the Company's financial statements based on our audits. We are a public accounting firm registered with the PCAOB and are required to be independent with respect to the Company in accordance with the U.S. federal securities laws and the applicable rules and regulations of the Securities and Exchange Commission and the PCAOB.
We conducted our audits in accordance with the standards of the PCAOB. Those standards require that we plan and perform the audit to obtain reasonable assurance about whether the financial statements are free of material misstatement, whether due to error or fraud. Our audits included performing procedures to assess the risks of material misstatement of the financial statements, whether due to error or fraud, and performing procedures that respond to those risks. Such procedures included examining, on a test basis, evidence regarding the amounts and disclosures in the financial statements. Our audits also included evaluating the accounting principles used and significant estimates made by management, as well as evaluating the overall presentation of the financial statements. We believe that our audits provide a reasonable basis for our opinion.
Critical Audit Matter
The critical audit matter communicated below is a matter arising from the current-period audit of the financial statements that was communicated or required to be communicated to the audit committee and that (1) relates to accounts or disclosures that are material to the financial statements and (2) involved our especially challenging, subjective, or complex judgments. The communication of critical audit matters does not alter in any way our opinion on the financial statements, taken as a whole, and we are not, by communicating the critical audit matter below, providing a separate opinion on the critical audit matter or on the accounts or disclosures to which it relates.
Allowance for Credit Losses — Refer to Notes 1 and 4 to the financial statements
The allowance for credit losses (“ACL”) is management's estimate of the current amount of expected credit losses over the life of the loan portfolio, or the amount of amortized cost basis not expected to be collected, at the balance sheet date. Determining the amount of the ACL is complex and requires extensive judgment by management about matters that are inherently subjective and uncertain. The measurement of expected credit losses encompasses information about historical events, current conditions and reasonable and supportable economic forecasts. Factors that may be considered in determining the amount of the ACL include but are not limited to, product or collateral type, industry, geography, internal risk rating, credit characteristics such as credit scores or collateral values, delinquency rates, historical or expected credit loss patterns and other quantitative and qualitative factors considered to have an impact on the adequacy of the ACL and the ability of borrowers to repay their loans. The adequacy of the ACL is also dependent on the effectiveness of the underlying models used in determining the estimate.
Expected credit losses are estimated over the contractual terms of the loans using econometric models, adjusted for expected prepayments. The models employ a factor-based methodology, leveraging data sets containing extensive historical loss and recovery information by industry, geography, product type, collateral type and obligor characteristics, to estimate probability of default (“PD”) and loss given default (“LGD”). Projected PDs and LGDs, determined based on pool level characteristics, are applied to estimated exposure at default. Measures of PD incorporate current conditions through market cycle or credit cycle
72
adjustments. PDs and LGDs are then conditioned on the reasonable and supportable economic forecast. For criticized or classified loans, PDs are adjusted to benchmark PDs established for each risk rating if the most current financial information available is deemed not to be reflective of the borrowers' current financial condition. For non-accrual or doubtful rated distressed loans above a certain threshold, an individual assessment is performed to determine expected credit losses.
Given the complex nature of estimating the ACL, performing audit procedures to evaluate whether the ACL was appropriately recorded as of December 31, 2023 required a high degree of auditor judgment and an increased extent of effort.
How the Critical Audit Matter Was Addressed in the Audit
Our audit procedures to test the ACL for the loan portfolio included the following, among others:
•We tested the effectiveness of controls over the ACL including management’s controls over data transfers into and out of the models, final quantitative model results, and application of any qualitative adjustments.
•We tested the completeness and accuracy of the data used in the models.
•We evaluated the reasonableness of the qualitative adjustments within the ACL estimate.
•We evaluated a sample of non-pass loans by assessing the factors utilized during the Bank’s assessment of the reserves associated with the loans, assessed the appropriateness of risk ratings, and evaluated the financial performance of the borrowers as well as the associated collateral, and the timeliness of the associated reserve.
/s/ Deloitte & Touche LLP
Miami, Florida
February 20, 2024
We have served as the Company's auditor since 2021.
73
Report of Independent Registered Public Accounting Firm
To the stockholders and the Board of Directors of BankUnited, Inc.
Opinion on Internal Control over Financial Reporting
We have audited the internal control over financial reporting of BankUnited Inc. and subsidiaries (the “Company”) as of December 31, 2023, based on criteria established in Internal Control — Integrated Framework (2013) issued by the Committee of Sponsoring Organizations of the Treadway Commission (COSO). In our opinion, the Company maintained, in all material respects, effective internal control over financial reporting as of December 31, 2023, based on criteria established in Internal Control — Integrated Framework (2013) issued by COSO.
We have also audited, in accordance with the standards of the Public Company Accounting Oversight Board (United States) (PCAOB), the consolidated financial statements as of and for the year ended December 31, 2023, of the Company and our report dated February 20, 2024, expressed an unqualified opinion on those financial statements.
Basis for Opinion
The Company’s management is responsible for maintaining effective internal control over financial reporting and for its assessment of the effectiveness of internal control over financial reporting, included in the accompanying Management’s Report on Internal Control Over Financial Reporting. Our responsibility is to express an opinion on the Company’s internal control over financial reporting based on our audit. We are a public accounting firm registered with the PCAOB and are required to be independent with respect to the Company in accordance with the U.S. federal securities laws and the applicable rules and regulations of the Securities and Exchange Commission and the PCAOB.
We conducted our audit in accordance with the standards of the PCAOB. Those standards require that we plan and perform the audit to obtain reasonable assurance about whether effective internal control over financial reporting was maintained in all material respects. Our audit included obtaining an understanding of internal control over financial reporting, assessing the risk that a material weakness exists, testing and evaluating the design and operating effectiveness of internal control based on the assessed risk, and performing such other procedures as we considered necessary in the circumstances. We believe that our audit provides a reasonable basis for our opinion.
Definition and Limitations of Internal Control over Financial Reporting
A company’s internal control over financial reporting is a process designed to provide reasonable assurance regarding the reliability of financial reporting and the preparation of financial statements for external purposes in accordance with generally accepted accounting principles. A company’s internal control over financial reporting includes those policies and procedures that (1) pertain to the maintenance of records that, in reasonable detail, accurately and fairly reflect the transactions and dispositions of the assets of the company; (2) provide reasonable assurance that transactions are recorded as necessary to permit preparation of financial statements in accordance with generally accepted accounting principles, and that receipts and expenditures of the company are being made only in accordance with authorizations of management and directors of the company; and (3) provide reasonable assurance regarding prevention or timely detection of unauthorized acquisition, use, or disposition of the company’s assets that could have a material effect on the financial statements.
Because of its inherent limitations, internal control over financial reporting may not prevent or detect misstatements. Also, projections of any evaluation of effectiveness to future periods are subject to the risk that controls may become inadequate because of changes in conditions, or that the degree of compliance with the policies or procedures may deteriorate.
/s/Deloitte & Touche LLP
Miami, Florida
February 20, 2024
74
BANKUNITED, INC. AND SUBSIDIARIES
CONSOLIDATED BALANCE SHEETS
(In thousands, except share and per share data)
| December 31, 2023 | December 31, 2022 | ||||||||||
| ASSETS | |||||||||||
| Cash and due from banks: | |||||||||||
| Non-interest bearing | $ | $ | |||||||||
| Interest bearing | |||||||||||
| Cash and cash equivalents | |||||||||||
Investment securities (including securities reported at fair value of $ | |||||||||||
| Non-marketable equity securities | |||||||||||
| Loans | |||||||||||
| Allowance for credit losses | ( | ( | |||||||||
| Loans, net | |||||||||||
| Bank owned life insurance | |||||||||||
| Operating lease equipment, net | |||||||||||
| Goodwill | |||||||||||
| Other assets | |||||||||||
| Total assets | $ | $ | |||||||||
| LIABILITIES AND STOCKHOLDERS’ EQUITY | |||||||||||
| Liabilities: | |||||||||||
| Demand deposits: | |||||||||||
| Non-interest bearing | $ | $ | |||||||||
| Interest bearing | |||||||||||
| Savings and money market | |||||||||||
| Time | |||||||||||
| Total deposits | |||||||||||
| Federal funds purchased | |||||||||||
| FHLB advances | |||||||||||
| Notes and other borrowings | |||||||||||
| Other liabilities | |||||||||||
| Total liabilities | |||||||||||
| Commitments and contingencies | |||||||||||
| Stockholders' equity: | |||||||||||
Common stock, par value $ | |||||||||||
| Paid-in capital | |||||||||||
| Retained earnings | |||||||||||
| Accumulated other comprehensive loss | ( | ( | |||||||||
| Total stockholders' equity | |||||||||||
| Total liabilities and stockholders' equity | $ | $ | |||||||||
BANKUNITED, INC. AND SUBSIDIARIES
CONSOLIDATED STATEMENTS OF INCOME
(In thousands, except per share data)
| Years Ended December 31, | |||||||||||||||||
| 2023 | 2022 | 2021 | |||||||||||||||
| Interest income: | |||||||||||||||||
| Loans | $ | $ | $ | ||||||||||||||
| Investment securities | |||||||||||||||||
| Other | |||||||||||||||||
| Total interest income | |||||||||||||||||
| Interest expense: | |||||||||||||||||
| Deposits | |||||||||||||||||
| Borrowings | |||||||||||||||||
| Total interest expense | |||||||||||||||||
| Net interest income before provision for credit losses | |||||||||||||||||
Provision for (recovery of) credit losses | ( | ||||||||||||||||
| Net interest income after provision for credit losses | |||||||||||||||||
| Non-interest income: | |||||||||||||||||
| Deposit service charges and fees | |||||||||||||||||
| Gain (loss) on sale of loans, net | ( | ( | |||||||||||||||
Gain (loss) on investment securities, net | ( | ( | |||||||||||||||
| Lease financing | |||||||||||||||||
| Other non-interest income | |||||||||||||||||
| Total non-interest income | |||||||||||||||||
| Non-interest expense: | |||||||||||||||||
| Employee compensation and benefits | |||||||||||||||||
| Occupancy and equipment | |||||||||||||||||
| Deposit insurance expense | |||||||||||||||||
| Professional fees | |||||||||||||||||
| Technology | |||||||||||||||||
| Discontinuance of cash flow hedges | |||||||||||||||||
Depreciation and impairment of operating lease equipment | |||||||||||||||||
| Other non-interest expense | |||||||||||||||||
| Total non-interest expense | |||||||||||||||||
Income before income taxes | |||||||||||||||||
| Provision for income taxes | |||||||||||||||||
Net income | $ | $ | $ | ||||||||||||||
| Earnings per common share, basic | $ | $ | $ | ||||||||||||||
| Earnings per common share, diluted | $ | $ | $ | ||||||||||||||
76
The accompanying notes are an integral part of these consolidated financial statements
BANKUNITED, INC. AND SUBSIDIARIES
CONSOLIDATED STATEMENTS OF COMPREHENSIVE INCOME
(In thousands)
| Years Ended December 31, | |||||||||||||||||
| 2023 | 2022 | 2021 | |||||||||||||||
Net income | $ | $ | $ | ||||||||||||||
| Other comprehensive income (loss), net of tax: | |||||||||||||||||
| Unrealized gains (losses) on investment securities available for sale: | |||||||||||||||||
| Net unrealized holding gain (loss) arising during the period | ( | ( | |||||||||||||||
| Reclassification adjustment for net securities gains realized in income | ( | ( | ( | ||||||||||||||
| Net change in unrealized gains (losses) on securities available for sale | ( | ( | |||||||||||||||
| Unrealized gains (losses) on derivative instruments: | |||||||||||||||||
| Net unrealized holding gains arising during the period | |||||||||||||||||
| Reclassification adjustment for net (gains) losses realized in income | ( | ( | |||||||||||||||
| Reclassification adjustment for discontinuance of cash flow hedges | |||||||||||||||||
| Net change in unrealized gains (losses) on derivative instruments | ( | ||||||||||||||||
| Other comprehensive income (loss) | ( | ||||||||||||||||
| Comprehensive income (loss) | $ | $ | ( | $ | |||||||||||||
77
The accompanying notes are an integral part of these consolidated financial statements
BANKUNITED, INC. AND SUBSIDIARIES
CONSOLIDATED STATEMENTS OF CASH FLOWS
(In thousands)
| Years Ended December 31, | |||||||||||||||||
| 2023 | 2022 | 2021 | |||||||||||||||
| Cash flows from operating activities: | |||||||||||||||||
Net income | $ | $ | $ | ||||||||||||||
| Adjustments to reconcile net income to net cash provided by operating activities: | |||||||||||||||||
| Amortization and accretion, net | ( | ( | ( | ||||||||||||||
Provision for (recovery of) credit losses | ( | ||||||||||||||||
(Gain) loss on sale of loans, net | ( | ||||||||||||||||
(Gain) loss on investment securities, net | ( | ||||||||||||||||
Share based compensation | |||||||||||||||||
| Depreciation and amortization | |||||||||||||||||
| Deferred income taxes | ( | ( | |||||||||||||||
| Proceeds from sale of loans held for sale, net | |||||||||||||||||
| Other: | |||||||||||||||||
(Increase) decrease in other assets | ( | ( | |||||||||||||||
Increase in other liabilities | |||||||||||||||||
Net cash provided by operating activities | |||||||||||||||||
| Cash flows from investing activities: | |||||||||||||||||
| Purchases of investment securities | ( | ( | ( | ||||||||||||||
| Proceeds from repayments and calls of investment securities | |||||||||||||||||
| Proceeds from sale of investment securities | |||||||||||||||||
| Purchases of non-marketable equity securities | ( | ( | ( | ||||||||||||||
| Proceeds from redemption of non-marketable equity securities | |||||||||||||||||
| Purchases of loans | ( | ( | ( | ||||||||||||||
| Loan originations and repayments, net | |||||||||||||||||
| Proceeds from sale of loans, net | |||||||||||||||||
Disposition (acquisition) of operating lease equipment, net | ( | ||||||||||||||||
| Other investing activities | ( | ( | ( | ||||||||||||||
Net cash provided by (used in) investing activities | ( | ( | |||||||||||||||
| (Continued) | |||||||||||||||||
78
The accompanying notes are an integral part of these consolidated financial statements
BANKUNITED, INC. AND SUBSIDIARIES
CONSOLIDATED STATEMENTS OF CASH FLOWS (Continued)
(In thousands)
| Years Ended December 31, | |||||||||||||||||
| 2023 | 2022 | 2021 | |||||||||||||||
| Cash flows from financing activities: | |||||||||||||||||
Net increase (decrease) in deposits | ( | ( | |||||||||||||||
Net increase (decrease) in federal funds purchased | ( | ( | |||||||||||||||
| Additions to FHLB borrowings | |||||||||||||||||
| Repayments of FHLB borrowings | ( | ( | ( | ||||||||||||||
| Dividends paid | ( | ( | ( | ||||||||||||||
| Repurchase of common stock | ( | ( | ( | ||||||||||||||
| Other financing activities | ( | ( | ( | ||||||||||||||
Net cash provided by (used in) financing activities | ( | ||||||||||||||||
Net increase (decrease) in cash and cash equivalents | ( | ||||||||||||||||
| Cash and cash equivalents, beginning of period | |||||||||||||||||
| Cash and cash equivalents, end of period | $ | $ | $ | ||||||||||||||
| Supplemental disclosure of cash flow information: | |||||||||||||||||
| Interest paid | $ | $ | $ | ||||||||||||||
Income taxes paid (refunded), net | $ | $ | ( | $ | |||||||||||||
| Supplemental schedule of non-cash investing and financing activities: | |||||||||||||||||
| Transfers from loans to loans held for sale | $ | $ | $ | ||||||||||||||
Transfers from operating lease equipment to equipment held for sale | $ | $ | $ | ||||||||||||||
| Dividends declared, not paid | $ | $ | $ | ||||||||||||||
| Unsettled securities trades, net | $ | $ | $ | ||||||||||||||
| Obligations incurred in acquisition of affordable housing limited partnerships | $ | $ | $ | ||||||||||||||
BANKUNITED, INC. AND SUBSIDIARIES
CONSOLIDATED STATEMENTS OF STOCKHOLDERS’ EQUITY
(In thousands, except share data)
| Common Shares Outstanding | Common Stock | Paid-in Capital | Retained Earnings | Accumulated Other Comprehensive Loss | Total Stockholders’ Equity | ||||||||||||||||||||||||||||||
| Balance at December 31, 2020 | $ | $ | $ | $ | ( | $ | |||||||||||||||||||||||||||||
| Comprehensive income | |||||||||||||||||||||||||||||||||||
Dividends ($ | ( | ( | |||||||||||||||||||||||||||||||||
Equity based compensation and exercise of stock options, net of shares forfeited and surrendered | |||||||||||||||||||||||||||||||||||
| Repurchase of common stock | ( | ( | ( | ( | |||||||||||||||||||||||||||||||
| Balance at December 31, 2021 | ( | ||||||||||||||||||||||||||||||||||
Comprehensive loss | ( | ( | |||||||||||||||||||||||||||||||||
Dividends ($ | ( | ( | |||||||||||||||||||||||||||||||||
Equity based compensation, net of shares forfeited and surrendered | |||||||||||||||||||||||||||||||||||
| Repurchase of common stock | ( | ( | ( | ( | |||||||||||||||||||||||||||||||
| Balance at December 31, 2022 | ( | ||||||||||||||||||||||||||||||||||
| Impact of adoption of ASU 2022-02 | — | — | — | — | |||||||||||||||||||||||||||||||
Balance at January 1, 2023 | ( | ||||||||||||||||||||||||||||||||||
| Comprehensive income | |||||||||||||||||||||||||||||||||||
Dividends ($ | ( | ( | |||||||||||||||||||||||||||||||||
Equity based compensation, net of shares forfeited and surrendered | |||||||||||||||||||||||||||||||||||
| Repurchase of common stock | ( | ( | ( | ( | |||||||||||||||||||||||||||||||
| Balance at December 31, 2023 | $ | $ | $ | $ | ( | $ | |||||||||||||||||||||||||||||
80
The accompanying notes are an integral part of these consolidated financial statements
Table of Contents
BANKUNITED, INC. AND SUBSIDIARIES
NOTES TO CONSOLIDATED FINANCIAL STATEMENTS
December 31, 2023
Note 1 Basis of Presentation and Summary of Significant Accounting Policies
BankUnited, Inc. is a bank holding company with one wholly-owned subsidiary, BankUnited, collectively, the Company. BankUnited, a national banking association headquartered in Miami Lakes, Florida, provides a full range of commercial lending and both commercial and consumer deposit services through 53 banking centers located in 12 Florida counties, four banking centers in the New York metropolitan area, and one banking center in Dallas, Texas. The Bank offers a comprehensive suite of commercial lending and deposit products through an Atlanta office focused on the Southeast region, certain commercial lending and deposit products through national platforms and certain consumer deposit products through an online channel.
The consolidated financial statements have been prepared in accordance with GAAP and prevailing practices in the banking industry.
The Company has a single operating segment and thus a single reportable segment. While management monitors the revenue streams of its various business units, the business units serve a similar base of primarily commercial clients, providing a similar range of products and services, managed through similar processes and platforms. The Company’s chief operating decision maker makes company-wide resource allocation decisions and assessments of performance based on a collective assessment of the Company’s operations.
Accounting Estimates
In preparing the consolidated financial statements, management is required to make estimates and assumptions that affect the reported amounts of assets, liabilities, revenues, expenses and disclosures of contingent assets and liabilities. Actual results could differ significantly from these estimates.
Principles of Consolidation
The consolidated financial statements include the accounts of BankUnited, Inc. and its wholly-owned subsidiary. All significant intercompany balances and transactions have been eliminated in consolidation. VIEs are consolidated if the Company is the primary beneficiary; i.e., has (i) the power to direct the activities of the VIE that most significantly impact the VIE's economic performance and (ii) the obligation to absorb losses or the right to receive benefits that could potentially be significant to the VIE. The Company has variable interests in affordable housing limited partnerships that are not required to be consolidated because the Company is not the primary beneficiary.
Fair Value Measurements
Certain of the Company's assets and liabilities are reflected in the consolidated financial statements at fair value on either a recurring or non-recurring basis. Investment securities available for sale, marketable equity securities and derivative instruments are measured at fair value on a recurring basis. Assets measured at fair value or fair value less cost to sell on a non-recurring basis may include collateral dependent loans, OREO and other repossessed assets, loans held for sale, goodwill and impaired long-lived assets. These non-recurring fair value measurements typically involve lower-of-cost-or-market accounting or the measurement of impairment of certain assets.
Fair value is defined as the exchange price that would be received for an asset or paid to transfer a liability in the principal or most advantageous market for the asset or liability in an orderly transaction between market participants at the measurement date. GAAP establishes a hierarchy that prioritizes inputs used to determine fair value measurements into three levels based on the observability and transparency of the inputs:
•Level 1 inputs are unadjusted quoted prices in active markets that are accessible at the measurement date for identical assets or liabilities.
•Level 2 inputs are observable inputs other than level 1 inputs, including quoted prices for similar assets and liabilities, quoted prices for identical assets and liabilities in less active markets and other inputs that can be corroborated by observable market data.
81
Table of Contents
BANKUNITED, INC. AND SUBSIDIARIES
NOTES TO CONSOLIDATED FINANCIAL STATEMENTS
December 31, 2023
•Level 3 inputs are unobservable inputs supported by limited or no market activity or data and inputs requiring significant management judgment or estimation.
The fair value hierarchy requires the Company to maximize the use of observable inputs and minimize the use of unobservable inputs in estimating fair value. Unobservable inputs are utilized in determining fair value measurements only to the extent that observable inputs are unavailable. The need to use unobservable inputs generally results from a lack of market liquidity and diminished observability of actual trades or assumptions that would otherwise be available to value a particular asset or liability.
Cash and Cash Equivalents
Cash and cash equivalents include cash and due from banks, both interest bearing and non-interest bearing, including amounts on deposit at the Federal Reserve Bank. Cash equivalents have original maturities of three months or less. For purposes of reporting cash flows, cash receipts and payments pertaining to FHLB advances with original maturities of three months or less are reported net.
Investment Securities
Debt securities that the Company has the positive intent and ability to hold to maturity are classified as held to maturity and reported at amortized cost. Debt securities that the Company may not have the intent to hold to maturity are classified as available-for-sale at the time of acquisition and carried at fair value with unrealized gains and losses, net of tax, excluded from earnings and reported in AOCI, a separate component of stockholders' equity. Securities classified as available-for-sale may be used as part of the Company's asset/liability management strategy and may be sold in response to liquidity needs, regulatory changes, changes in interest rates, prepayment risk or other market factors. The Company does not maintain a trading portfolio. Purchase premiums and discounts on debt securities are amortized as adjustments to yield over the expected lives of the securities, using the interest method which results in a constant effective yield. Premiums are amortized to the call date for callable securities. Realized gains and losses from sales of securities are recorded on the trade date and are determined using the specific identification method. The Company's policy on the ACL related to debt securities is discussed below in the section entitled "ACL".
Non-marketable Equity Securities
The Bank, as a member of the FRB system and the FHLB, is required to maintain investments in the stock of the FRB and FHLB. No market exists for this stock, and the investment can be liquidated only through redemption by the respective institutions, at the discretion of and subject to conditions imposed by those institutions. The stock has no readily determinable fair value and is carried at cost. Historically, stock redemptions have been at par value, which equals the Company's carrying value. The Company monitors its investment in FRB and FHLB stock for impairment through review of recent financial results of the FHLB, including capital adequacy and liquidity position, dividend payment history, redemption history and information from credit agencies. The Company has not identified any indicators of impairment of the FRB or FHLB stock.
Loans Held for Sale
Loans originated or purchased with the intent to sell are carried at the lower of cost or fair value, determined in the aggregate for buyout loans. A valuation allowance is established through a charge to earnings if the aggregate fair value of such loans is lower than their cost. Gains or losses recognized upon sale are determined on the specific identification basis.
Loans not originated or otherwise acquired with the intent to sell, or loans which have been originated by the Company and subsequently held for sale, are transferred into the held for sale classification at the lower of carrying amount or fair value when they are specifically identified for sale and a formal plan exists to sell them.
Loans
Loans are reported at amortized cost, net of the ACL. Interest income is accrued based on the principal amount outstanding. Non-refundable loan origination fees, net of direct costs of originating or acquiring loans, as well as purchase premiums and
82
Table of Contents
BANKUNITED, INC. AND SUBSIDIARIES
NOTES TO CONSOLIDATED FINANCIAL STATEMENTS
December 31, 2023
discounts, are deferred and recognized as adjustments to yield over the contractual lives of the related loans using the interest method which results in a constant effective yield.
Non-accrual loans
Commercial loans are placed on non-accrual status when (i) management has determined that full repayment of all contractual principal and interest is in doubt, or (ii) the loan is past due 90 days or more as to principal or interest unless the loan is well secured and in the process of collection. Residential loans, other than government insured residential loans, are generally placed on non-accrual status when they are 60 days past due. Additionally, certain residential loans not contractually delinquent but in forbearance may be placed on non-accrual status at management's discretion. When a loan is placed on non-accrual status, uncollected interest accrued is reversed and charged to interest income. Payments received on non-accrual commercial loans are applied as a reduction of principal. Interest payments are recognized as income on a cash basis on non-accrual residential loans. Commercial loans are returned to accrual status only after all past due principal and interest has been collected and full repayment of remaining contractual principal and interest is reasonably assured. Residential loans are generally returned to accrual status when less than 60 days past due. Past due status of loans is determined based on the contractual next payment due date. Loans less than 30 days past due are reported as current.
Contractually delinquent government insured residential loans are not classified as non-accrual due to the nature of the guarantee. Contractually delinquent PCD loans are not classified as non-accrual, as long as the Company has a reasonable expectation about amounts expected to be collected.
Troubled Debt Restructurings
Prior to the adoption of ASU 2022-02 on January 1, 2023, in certain situations, due to economic or legal reasons related to a borrower's financial difficulties, the Company may have granted a concession to the borrower for other than an insignificant period of time that it would not otherwise have considered. At that time, the related loan was classified as a TDR. The concessions granted may have included rate reductions, principal forgiveness, payment forbearance, extensions of maturity at rates of interest below that commensurate with the risk profile of the loans, modification of payment terms and other actions intended to minimize economic loss. A TDR was generally placed on non-accrual status at the time of the modification unless the borrower was performing prior to the restructuring.
PCD assets
PCD assets are acquired financial assets that, as of the date of acquisition, have experienced a more than insignificant deterioration in credit quality since origination. An assessment is conducted at acquisition to determine whether acquired financial assets meet the criteria to be classified as PCD assets. That assessment may be conducted at the individual asset level, or for a group of assets acquired together that have similar risk characteristics. At acquisition, the ACL related to PCD assets, representing the estimated amount of the UPB of the assets not expected to be collected, is added to the purchase price to determine the amortized cost basis and any non-credit related discount or premium is allocated to the individual assets acquired. The non-credit related discount or premium is accreted or amortized to interest income over the life of the related assets using the level yield method, as long as there is a reasonable expectation about amounts expected to be collected. Subsequent changes in the amount of expected credit losses are recognized immediately by adjusting the ACL and reflecting the periodic changes as credit loss expense or reversal of credit loss expense.
Sales-type and Direct Financing Leases
Sales-type and direct financing leases are carried at the aggregate of lease payments receivable and estimated residual value of the leased property, if applicable, less unearned income. Interest income is recognized over the term of the leases to achieve a constant periodic rate of return on the outstanding investment.
83
Table of Contents
BANKUNITED, INC. AND SUBSIDIARIES
NOTES TO CONSOLIDATED FINANCIAL STATEMENTS
December 31, 2023
ACL
AFS Debt Securities
The Company reviews its AFS debt securities for credit loss impairment at the individual security level at least quarterly. A security is impaired if its fair value is less than its amortized cost basis. A decline in fair value below amortized cost basis represents a credit loss impairment to the extent the Company does not expect to recover the amortized cost basis of the security. Impairment related to credit losses is recorded through the ACL to the extent fair value is less than the amortized cost basis. Declines in fair value that have not been recorded through the ACL are recorded through other comprehensive income, net of tax.
In assessing whether an impairment is credit loss related, the Company compares the present value of cash flows expected to be collected to the security's amortized cost basis. If the present value of cash flows expected to be collected is less than the amortized cost basis of the security, a credit loss exists, and an ACL is recorded. The Company discounts expected cash flows at the effective interest rate implicit in the security at the purchase date, adjusted for expected prepayments. For floating rate securities, the Company uses the floating rate as it changes over the life of the security. In developing estimates about cash flows expected to be collected and determining whether a credit loss exists, the Company considers information about past events, current conditions and reasonable and supportable forecasts. Factors and information that the Company uses in making its assessments include, but are not necessarily limited to, the following:
•The extent to which fair value is less than amortized cost;
•Adverse conditions specifically related to the security, an industry or sector or geographic area;
•Changes in the financial condition of the issuer or underlying loan obligors;
•The payment structure and remaining payment terms of the security, including levels of subordination or over-collateralization;
•Failure of the issuer to make scheduled payments;
•Changes in credit ratings;
•Relevant market data;
•Estimated prepayments, defaults, and the value and performance of underlying collateral at the individual security level.
The relative importance assigned to each of these factors varies depending on the facts and circumstances pertinent to the individual security being evaluated.
Timely payment of principal and interest on securities issued by the U.S. government, U.S. government agencies and U.S. government sponsored entities is explicitly or implicitly guaranteed by the U.S. government. Therefore, the Company expects to recover the amortized cost basis of these securities.
If the Company intends to sell a security in an unrealized loss position, or it is more likely than not that the Company will be required to sell the security before recovery of its amortized cost basis, any allowance for credit losses will be written off and the amortized cost basis will be written down to the debt security’s fair value at the reporting date with any incremental impairment reported in earnings.
AFS securities will be charged off to the extent that there is no reasonable expectation of recovery of amortized cost basis. AFS securities will be placed on non-accrual status if the Company does not reasonably expect to receive interest payments in the future and interest accrued will be reversed against interest income. Securities will be returned to accrual status only when collection of interest is reasonably assured.
Loans
The ACL is a valuation account that is deducted from the amortized cost basis of loans to present the net amount expected to be collected. The ACL is adjusted through the provision for credit losses to the amount of amortized cost basis not expected to be collected, or in the case of PCD loans, the amount of UPB not expected to be collected, at the balance sheet date.
84
Table of Contents
BANKUNITED, INC. AND SUBSIDIARIES
NOTES TO CONSOLIDATED FINANCIAL STATEMENTS
December 31, 2023
Amortized cost basis includes UPB, unamortized premiums or discounts and deferred fees and costs, net of amounts previously charged off.
The measurement of expected credit losses encompasses information about historical events, current conditions and reasonable and supportable forecasts. Determining the amount of the ACL is complex and requires extensive judgment by management about matters that are inherently uncertain. Re-evaluation of the ACL estimate in future periods, in light of changes in composition and characteristics of the loan portfolio, changes in the reasonable and supportable forecast and other factors then prevailing may result in material changes in the amount of the ACL and credit loss expense in those future periods.
Loans are charged off against the ACL in the period in which they are deemed uncollectible, and recoveries are credited to the ACL when received. Expected recoveries on loans previously charged off and expected to be charged-off, not to exceed the aggregate of amounts previously charged-off and expected to be charged-off, are included in the ACL estimate. For loans secured by residential real estate, an assessment of collateral value is made at no later than 120 days delinquency; any outstanding loan balance in excess of fair value less cost to sell is charged off at no later than 180 days delinquency. Additionally, any outstanding balance in excess of fair value of collateral less cost to sell is charged off (i) within 60 days of receipt of notification of filing from the bankruptcy court, (ii) within 60 days of determination of loss if all borrowers are deceased or (iii) within 90 days of discovery of fraudulent activity. Other consumer loans, which are not significant in the aggregate, are typically charged off at 120 days delinquency. Commercial loans are charged off when, in management's judgment, they are considered to be uncollectible.
Expected credit losses are estimated on a collective basis for groups of loans that share similar risk characteristics. Factors that may be considered in aggregating loans for this purpose include but are not necessarily limited to, product or collateral type, industry, geography, internal risk rating, credit characteristics such as credit scores or collateral values, and historical or expected credit loss patterns. For loans that do not share similar risk characteristics with other loans such as collateral dependent loans, expected credit losses are estimated on an individual basis.
Expected credit losses are estimated over the contractual terms of the loans, adjusted for expected prepayments. Expected prepayments for commercial loans are generally estimated based on the Company's historical experience. For residential loans, expected prepayments are estimated using a model that incorporates industry prepayment data, calibrated to reflect the Company's experience. The contractual term excludes expected extensions, renewals, and modifications unless the extension or renewal options are included in the original or modified contract at the reporting date and are not unconditionally cancellable by the Company.
For the substantial majority of portfolio segments and subsegments, including residential loans other than government insured loans, and most commercial and commercial real estate loans, expected losses are estimated using econometric models. The models employ a factor based methodology, leveraging data sets containing extensive historical loss and recovery information by industry, geography, product type, collateral type and obligor characteristics, to estimate PD and LGD. Measures of PD for commercial loans incorporate current conditions through market cycle or credit cycle adjustments. For residential loans, the models consider FICO, adjusted LTVs and delinquency rates. PDs and LGDs are then conditioned on the reasonable and supportable economic forecast. Projected PDs and LGDs, determined based on pool level characteristics, are applied to estimated exposure at default, considering the contractual term and payment structure of loans, adjusted for expected prepayments, to generate estimates of expected loss. For criticized or classified loans, PDs are adjusted to benchmark PDs established for each risk rating given that the most current financial information available is often not reflective of the borrowers' current financial condition. The ACL estimate incorporates a reasonable and supportable economic forecast through the use of externally developed macroeconomic scenarios applied in the models.
A single economic scenario or a probability weighted blend of economic scenarios may be used. The models ingest numerous national, regional and MSA level variables and data points.
Commercial Real Estate Model
Variables with the most significant impact on the commercial real estate model include unemployment at both national and regional levels, the CRE property forecast by property type and sub-market, 10 year treasury yield, Baa corporate yield and real GDP growth, at the national level. Increases in unemployment and yields within the commercial real estate model result in increases in the ACL. Increases in real GDP growth and improvements in the CRE property forecasts reduce the reserve.
85
Table of Contents
BANKUNITED, INC. AND SUBSIDIARIES
NOTES TO CONSOLIDATED FINANCIAL STATEMENTS
December 31, 2023
Commercial Model
Variables with the most significant impact on the commercial model include a stock market volatility index, the S&P 500 index, unemployment at both national and regional levels, and a variety of interest rates and spreads. Increases in the unemployment rate, the stock market volatility index, and the Baa corporate yield increase the reserve, while increases in real GDP growth reduce the reserve.
Residential Model
Variables with the most significant impact on the residential model include HPI and unemployment at regional levels, real GDP growth, and a 30 year mortgage rate. Increases in the unemployment rate and the 30-year mortgage rate increase the reserve, while increases in real GDP growth and HPI reduce the reserve.
The length of the reasonable and supportable forecast period is evaluated at each reporting period and adjusted if deemed necessary. Currently, the Company uses a 2-year reasonable and supportable forecast period in estimating the ACL. After the reasonable and supportable forecast period, the models effectively revert to long-term mean losses on a straight-line basis over 12 months.
For certain less material portfolios including loans and leases to state and local government entities originated by Pinnacle, small balance commercial loans and consumer loans, the WARM method is used to estimate expected credit losses. Loss rates are applied to the exposure at default, after factoring in amortization and expected prepayments. For the Pinnacle portfolio, historical loss information is based on municipal historical default and recovery data, segmented by credit rating. For small balance commercial loans, historical loss information is based on the Company's historical loss experience over a five year period. For consumer loans, historical loss information is based on peer data; this portfolio subsegment is not significant. All loss estimates are conditioned as applicable on changes in current conditions and the reasonable and supportable economic forecast. Expected credit losses for the funded portion of mortgage warehouse lines of credit are estimated based primarily on the Company's historical loss experience, conditioned as applicable on changes in current conditions and the reasonable and supportable economic forecast. Generally, given the nature of these loans, losses would be expected to manifest within a very short time period after origination.
The Company expects to collect the amortized cost basis of government insured residential loans due to the nature of the government guarantee, so the ACL is zero for these loans.
Qualitative factors
Quantitative models have certain inherent limitations with respect to estimating expected losses. These limitations may be more prevalent in times of rapidly changing or unprecedented economic conditions and forecasts. Qualitative adjustments are made to the ACL when, based on management’s judgment, there are factors impacting expected credit losses not taken into account by the quantitative calculations. Potential qualitative adjustments are categorized as follows:
•Economic factors, including material uncertainties, trends and developments that, in management's judgment, may not have been considered in the reasonable and supportable economic forecast;
•Credit policy and staffing, including the nature and level of policy and procedural exceptions or changes in credit policy not reflected in quantitative results, changes in the quality of underwriting and portfolio management and staff and issues identified by credit review, internal audit or regulators that may not be reflected in quantitative results;
•Concentrations, considering whether the quantitative estimate adequately accounts for concentration risk in the portfolio;
•Model imprecision and model validation findings; and
•Other factors not adequately considered in the quantitative estimate or other qualitative categories identified by management that may materially impact the amount of expected credit losses.
Collateral dependent loans
Collateral dependent loans are those for which the borrower is experiencing financial difficulty and repayment is expected to be provided substantially through the operation or sale of the collateral. These loans do not typically share similar risk characteristics with other loans and expected credit losses are evaluated on an individual basis. Loans evaluated individually are
86
Table of Contents
BANKUNITED, INC. AND SUBSIDIARIES
NOTES TO CONSOLIDATED FINANCIAL STATEMENTS
December 31, 2023
not included in the collective evaluation. Estimates of expected credit losses for collateral dependent loans, whether or not foreclosure is probable, are based on the fair value of the collateral, adjusted for selling costs when repayment depends on sale of the collateral. Due to immateriality, expected credit losses for collateral dependent commercial relationships with committed balances less than $1.0 million may be estimated collectively.
Off-balance sheet credit exposures
Expected credit losses related to off-balance sheet credit exposures are estimated over the contractual period for which the Company is exposed to credit risk via a contractual obligation to extend credit, unless that obligation is unconditionally cancellable by the Company. Expected credit losses are estimated using essentially the same methodologies employed to estimate expected credit losses on the amortized cost basis of loans, taking into consideration the likelihood and amount of additional amounts expected to be funded over the terms of the commitments. The liability for credit losses on off-balance sheet credit exposures is presented within other liabilities on the consolidated balance sheets, distinct from the ACL. Adjustments to the liability are included in the provision for credit losses.
Prior to the adoption of ASU 2022-02 on January 1, 2023
For TDRs or loans for which there was a reasonable expectation that a TDR would be executed that were not collateral dependent, the credit loss estimate was determined by comparing the net present value of expected cash flows to the amortized cost basis of the loans. Expected cash flows were discounted at the loans' original effective interest rate for fixed rate loans and at the rate as it changed over the life of the loans for variable rate loans.
Accrued Interest Receivable
The Company has elected to present accrued interest receivable separate from the amortized cost basis of financial assets carried at amortized cost. The Company excludes accrued interest receivable balances from tabular disclosures about financial assets carried at amortized cost. The Company generally does not estimate an ACL on accrued interest receivable balances since uncollectible accrued interest is timely written off in accordance with the Company's accounting policies for non-accrual loans. Under unusual circumstances, the Company evaluates whether its non-accrual policies continue to consistently provide for timely reversal of accrued interest receivable. If considered necessary, the Company records an allowance for uncollectible accrued interest receivable, determined using essentially the same methodologies used to estimate the ACL on the amortized cost basis of the related loans. The allowance is deducted from accrued interest receivable and presented within other assets on the consolidated balance sheets, distinct from the ACL. Changes in the ACL related to accrued interest receivable are included in the provision for credit losses.
Leases
The Company determines whether a contract is or contains a lease at inception. For leases with terms greater than twelve months under which the Company is lessee, ROU assets and lease liabilities are recorded at the commencement date. Lease liabilities are initially recorded based on the present value of future lease payments over the lease term. ROU assets are initially recorded at the amount of the associated lease liabilities plus prepaid lease payments and initial direct costs, less any lease incentives received. The cost of short term leases is recognized on a straight line basis over the lease term. The lease term includes options to extend if the exercise of those options is reasonably certain and includes termination options if there is reasonable certainty the options will not be exercised. Lease payments are discounted using the Company's FHLB borrowing rate for borrowings of a similar term unless an implicit rate is defined in the contract or is determinable, which is generally not the case. Leases are classified as financing or operating leases at commencement; generally, leases are classified as finance leases when effective control of the underlying asset is transferred. The substantial majority of leases under which the Company is lessee are classified as operating leases. For operating leases, lease cost is recognized in the consolidated statements of income on a straight line basis over the lease terms. For finance leases, interest expense on lease liabilities is recognized on the effective interest method and amortization of ROU assets is recognized on a straight line basis over the lease terms. Variable lease costs are recognized in the period in which the obligation for those costs is incurred. The Company has elected not to separate lease from non-lease components of its lease contracts.
Bank Owned Life Insurance
Bank owned life insurance is carried at cash surrender value. Changes in cash surrender value are recorded in non-interest income.
87
Table of Contents
BANKUNITED, INC. AND SUBSIDIARIES
NOTES TO CONSOLIDATED FINANCIAL STATEMENTS
December 31, 2023
Operating Lease Equipment
Operating lease equipment is carried at cost less accumulated depreciation and is depreciated to estimated residual value using the straight-line method over the lease term. Estimated residual values are re-evaluated at least annually, based primarily on current residual value appraisals. Equipment held for sale is carried at the lower of carrying amount or estimated fair value less costs to sell and is included in other assets in the accompanying consolidated balance sheets. Rental revenue is recognized on a straight-line basis over the contractual term of the lease.
A review for impairment of equipment under operating lease is performed at least annually or when events or changes in circumstances indicate that the carrying amount of long-lived assets may not be recoverable. Impairment of assets is determined by comparing the carrying amount to future undiscounted net cash flows expected to be generated. If an asset is impaired, the measure of impairment is the amount by which the carrying amount exceeds the fair value of the asset.
Goodwill
Goodwill represents the excess of consideration transferred in business combinations over the fair value of net tangible and identifiable intangible assets acquired. Goodwill is not amortized, but is tested for impairment annually or more frequently if events or circumstances indicate that impairment may have occurred. The Company typically performs its annual goodwill impairment test in the third fiscal quarter. The Company has a single reporting unit.
When assessing goodwill for impairment, the Company may elect to perform a qualitative assessment to determine if a quantitative impairment test is necessary. If a qualitative assessment is not performed, or if the qualitative assessment indicates it is likely that the fair value of a reporting unit is less than its carrying amount, a quantitative test is performed. The quantitative impairment test compares the estimated fair value of the reporting unit to its carrying amount. If the fair value of the reporting unit exceeds its carrying amount, no impairment is indicated. If the fair value of the reporting unit is less than its carrying amount, impairment of goodwill is measured as the excess of the carrying amount over fair value.
OREO and Repossessed Assets
OREO and repossessed assets consists of real estate assets acquired through, or in lieu of, loan foreclosure and personal property acquired through repossession. Such assets are included in other assets in the accompanying consolidated balance sheets. These assets are held for sale and are initially recorded at estimated fair value less costs to sell, establishing a new cost basis. Subsequent to acquisition, periodic valuations are performed, and the assets are carried at the lower of the carrying amount at the date of acquisition or estimated fair value less cost to sell. Significant property improvements are capitalized to the extent that the resulting carrying value does not exceed fair value less cost to sell. Legal fees, maintenance, taxes, insurance and other direct costs of holding and maintaining these assets are expensed as incurred.
Premises and Equipment
Premises and equipment are carried at cost less accumulated depreciation and amortization and are included in other assets in the accompanying consolidated balance sheets. The Company measures assets held for sale at the lower of carrying amount or estimated fair value. Depreciation is calculated using the straight-line method over the estimated useful lives of the assets. The lives of improvements to existing buildings are based on the lesser of the estimated remaining lives of the buildings or the estimated useful lives of the improvements. Leasehold improvements are amortized over the shorter of the expected terms of the leases at inception, considering options to extend that are reasonably assured, or their useful lives. The estimated useful lives of premises and equipment are as follows:
•buildings and improvements - 10 to 30 years;
•leasehold improvements - 3 to 20 years;
•aircraft and automobiles - 5 to 15 years;
•furniture, fixtures and equipment - 5 to 7 years; and
•computer equipment - 3 to 5 years.
88
Table of Contents
BANKUNITED, INC. AND SUBSIDIARIES
NOTES TO CONSOLIDATED FINANCIAL STATEMENTS
December 31, 2023
Software
Capitalized software, stated at cost less accumulated depreciation and amortization, includes CCA and capitalizable implementation costs associated with hosting arrangements. Capitalized software is included in other assets in the accompanying consolidated balance sheets. Depreciation and amortization are calculated using the straight-line method over the estimated useful lives of the assets, which for CCA is based on the term of the associated hosting arrangements plus any reasonably certain renewals. Direct costs associated with developing or obtaining and implementing internal use software and hosting arrangements that are service contracts incurred during the application development stage are capitalized. The estimated useful lives of software, software licensing rights and CCA implementation costs range from 3 to 5 years.
Investments in Affordable Housing Limited Partnerships
Income Taxes
The Company accounts for income taxes using the asset and liability method. Deferred tax assets and liabilities are determined based on differences between the financial reporting and tax bases of assets and liabilities using enacted tax rates in effect for periods in which the differences are expected to reverse. The effect of changes in tax rates on deferred tax assets and liabilities are recognized in income in the period that includes the enactment date. A valuation allowance is established for deferred tax assets when management determines that it is more likely than not that some portion or all of a deferred tax asset will not be realized. In making such determinations, the Company considers all available positive and negative evidence that may impact the realization of deferred tax assets. These considerations include the amount of taxable income generated in statutory carryback periods, future reversals of existing taxable temporary differences, projected future taxable income and available tax planning strategies.
The Company recognizes tax benefits from uncertain tax positions when it is more likely than not that the related tax positions will be sustained upon examination, including resolutions of any related appeals or litigation processes, based on the technical merits of the tax positions. An uncertain tax position is a position taken in a previously filed tax return or a position expected to be taken in a future tax return that is not based on clear and unambiguous tax law. The Company measures tax benefits related to uncertain tax positions based on the largest benefit that has a greater than 50% likelihood of being realized upon settlement. If the initial assessment fails to result in recognition of a tax benefit, the Company subsequently recognizes a tax benefit if: (i) there are changes in tax law or case law that raise the likelihood of prevailing on the technical merits of the position to more-likely-than-not, (ii) the statute of limitations expires, or (iii) there is a completion of an examination resulting in a settlement of that tax year or position with the appropriate agency. The Company recognizes interest and penalties related to uncertain tax positions, as well as interest income or expense related to tax settlements, in the provision for income taxes.
Equity Based Compensation
The Company periodically grants unvested or restricted shares of common stock and other share-based awards to key employees. For equity classified awards, compensation cost is measured based on the estimated fair value of the awards at the grant date and is recognized in earnings on a straight-line basis over the requisite service period for each award. Liability-classified awards are remeasured each reporting period at fair value until the award is settled, and compensation cost is recognized in earnings on a straight-line basis over the requisite service period for each award, adjusted for changes in fair value each reporting period. Compensation cost related to awards that embody performance conditions is recognized when it is probable that the performance conditions will be achieved. The number of awards expected to vest is estimated in determining the amount of compensation cost to be recognized related to share-based payment transactions.
89
Table of Contents
BANKUNITED, INC. AND SUBSIDIARIES
NOTES TO CONSOLIDATED FINANCIAL STATEMENTS
December 31, 2023
Derivative Financial Instruments and Hedging Activities
Interest rate derivative contracts
The Company uses interest rate derivative contracts, such as swaps, caps, floors and collars, in the normal course of business to meet the financial needs of its customers and to manage exposure to changes in interest rates. Interest rate contracts are recorded as assets or liabilities in the consolidated balance sheets at fair value. Interest rate derivatives that are used as a risk management tool to hedge the Company's exposure to changes in interest rates have been designated as cash flow or fair value hedging instruments. The gain or loss resulting from changes in the fair value of interest rate derivatives designated and qualifying as cash flow hedging instruments is initially reported as a component of other comprehensive income and subsequently reclassified into earnings in the same period in which the hedged transaction affects earnings. Changes in the fair value of interest rate derivatives designated as fair value hedging instruments as well as the offsetting changes in the fair value of the hedged items caused by fluctuations in the designated benchmark interest rates are recognized in earnings.
The Company discontinues hedge accounting prospectively when it is determined that the derivative is no longer effective in offsetting changes in the cash flows or fair value of the hedged item, the derivative expires or is sold, terminated, or exercised, management determines that the designation of the derivative as a hedging instrument is no longer appropriate or, for a cash flow hedge, the occurrence of the forecasted transaction is no longer probable. When hedge accounting on a cash flow hedge is discontinued, any subsequent changes in fair value of the derivative are recognized in earnings. The cumulative unrealized gain or loss related to a discontinued cash flow hedge continues to be reported in AOCI and is subsequently reclassified into earnings in the same period in which the hedged transaction affects earnings, unless it is probable that the forecasted transaction will not occur by the end of the originally specified time period, in which case the cumulative unrealized gain or loss reported in AOCI is reclassified into earnings immediately. When hedge accounting on a fair value hedge is discontinued, adjustments to the carrying amount of the hedged item due to changes in fair value are also discontinued.
Cash flows from derivative financial instruments that are accounted for as hedges, including daily settlements of centrally cleared derivatives with the CME, are classified as operating cash flows.
Changes in the fair value of interest rate contracts not designated as, or not qualifying as, hedging instruments are recognized currently in earnings.
Transfers of Financial Assets
Transfers of financial assets are accounted for as sales when control over the assets has been surrendered. A gain or loss is recognized in earnings upon completion of the sale based on the difference between the sales proceeds and the carrying value of the assets. Control over the transferred assets is deemed to have been surrendered when: (i) the assets have been legally isolated from the Company, (ii) the transferee obtains the right (free of conditions that constrain it from taking advantage of that right) to pledge or exchange the transferred assets, and (iii) the Company does not maintain effective control over the transferred assets through an agreement to repurchase them before their maturity or the ability to unilaterally cause the holder to return specific assets.
Earnings per Common Share
Basic earnings per common share is calculated by dividing income allocated to common stockholders for basic earnings per common share by the weighted average number of common shares outstanding for the period, reduced by average unvested stock awards. Unvested stock awards with non-forfeitable rights to dividends, whether paid or unpaid, are considered participating securities and are included in the computation of basic earnings per common share using the two class method whereby net income is allocated between common stock and participating securities. In periods of a net loss, no allocation is made to participating securities as they are not contractually required to fund net losses. Diluted earnings per common share is computed by dividing income allocated to common stockholders for basic earnings per common share, adjusted for earnings reallocated from participating securities, by the weighted average number of common shares outstanding for the period increased for the dilutive effect of unexercised stock options and unvested stock awards using the treasury stock method. Contingently issuable shares are included in the calculation of earnings per common share beginning on the date the contingency was resolved.
90
Table of Contents
BANKUNITED, INC. AND SUBSIDIARIES
NOTES TO CONSOLIDATED FINANCIAL STATEMENTS
December 31, 2023
Revenue From Contracts with Customers
Revenue from contracts with customers within the scope of Topic 606 "Revenue from Contracts with Customers", is recognized in an amount that reflects the consideration the Company expects to be entitled to receive in exchange for those goods or services as the related performance obligations are satisfied. The majority of our revenues, including revenues from loans, leases, investment securities, derivative instruments and letters of credit and from transfers and servicing of financial assets, are excluded from the scope of Topic 606. Deposit service charges and fees is the most significant category of revenue within the scope of the standard. These service charges and fees consist primarily of monthly maintenance fees and other transaction based fees. Revenue is recognized when our performance obligations are complete, generally monthly for account maintenance fees or when a transaction, such as a wire transfer, is completed. Payment is typically received at the time the performance obligation is satisfied. The aggregate amount of revenue that is within the scope of Topic 606 from sources other than deposit service charges and fees is not material.
Reclassifications
Certain amounts presented for prior periods have been reclassified to conform to the current period presented.
New Accounting Pronouncements Adopted in 2023
ASU No. 2022-02—Financial Instruments—Credit Losses (Topic 326). This ASU eliminated the accounting guidance for TDRs by creditors in Subtopic 310-40, Receivables - Troubled Debt Restructurings by Creditors. The ASU enhanced disclosure requirements for certain loan refinancings and restructurings by creditors when a borrower is experiencing financial difficulty in the form of an interest rate reduction, an other-than-insignificant payment delay, a term extension, principal forgiveness or a combination thereof. The ASU also updated certain requirements related to accounting for credit losses under ASC 326 and required disclosure of current-period gross charge-offs of financing receivables by year of origination. The Company adopted this ASU in the first quarter of 2023, prospectively, except with respect to the recognition and measurement of TDRs, for which the modified retrospective transition method was applied. The Company recorded a reduction to the ACL of $1.8 million and a cumulative-effect adjustment, net of tax, to retained earnings of $1.3 million on January 1, 2023. Additional and modified disclosures required by this ASU are included in the Notes to these Consolidated Financial Statements.
Accounting Pronouncements Not Yet Adopted
ASU No. 2023-02—Investments - Equity Method and Joint Ventures (Topic 323): Accounting for Investments in Tax Credit Structures using the Proportional Amortization Method (A Consensus of the Emerging Issues Task Force). This ASU was issued to expand use of the proportional amortization method of accounting to equity investments in tax credit programs beyond those in LIHTC programs. The ASU allows entities to elect the proportional amortization method, on a tax-credit-program-by-tax-credit-program basis, for all equity investments in tax credit programs meeting the eligibility criteria established. This ASU is effective for the Company for interim and annual periods in fiscal years beginning after December 15, 2023. The Company will adopt this ASU during the first quarter of 2024 and expects no material impact on the Company's consolidated financial position, results of operations, and cash flows. Currently, all of the Company's equity investments in tax credit programs are in LIHTC programs accounted for using the proportional amortization method.
ASU No. 2023-07—Segment Reporting (Topic 280): Improvements to Reportable Segment Disclosures. This ASU augments reportable segment disclosure requirements, primarily through enhanced disclosures about significant segment expenses. In addition, the amendments enhance interim disclosure requirements, clarify circumstances in which an entity can disclose multiple segment measures of profit or loss, provide new segment disclosure requirements for entities with a single reportable segment, and contains other disclosure requirements. This ASU is effective for the Company for fiscal years beginning after December 15, 2023, and interim periods within fiscal years beginning after December 15, 2024. This ASU will have no impact on the Company's consolidated financial position, results of operations, and cash flows. Adoption may lead to additional and revised disclosures in the Company's financial statements starting in the quarter of adoption.
ASU No. 2023-09—Income Taxes (Topic 740): Improvements to Income Tax Disclosures. This ASU requires entities to provide more information in the annual and interim income tax disclosures, primarily related to the income tax rate reconciliation and income taxes paid. The guidance also eliminates certain existing disclosure requirements related to uncertain tax positions and unrecognized deferred tax liabilities. This ASU is effective for the Company for fiscal years beginning after December 15, 2024, and interim periods within fiscal years beginning after December 15, 2025. The impact of adoption of this
91
Table of Contents
BANKUNITED, INC. AND SUBSIDIARIES
NOTES TO CONSOLIDATED FINANCIAL STATEMENTS
December 31, 2023
ASU on the Company's consolidated financial position, results of operations, and cash flows is not expected to be material. Adoption will lead to additional and revised disclosures in the Company's financial statements starting in the quarter of adoption.
Note 2 Earnings Per Common Share
The computation of basic and diluted earnings per common share is presented below for the periods indicated (in thousands, except share and per share data):
| Years Ended December 31, | |||||||||||||||||
| c | 2023 | 2022 | 2021 | ||||||||||||||
| Basic earnings per common share: | |||||||||||||||||
| Numerator: | |||||||||||||||||
Net income | $ | $ | $ | ||||||||||||||
Distributed and undistributed earnings allocated to participating securities | ( | ( | ( | ||||||||||||||
| Income allocated to common stockholders for basic earnings per common share | $ | $ | $ | ||||||||||||||
| Denominator: | |||||||||||||||||
| Weighted average common shares outstanding | |||||||||||||||||
| Less average unvested stock awards | ( | ( | ( | ||||||||||||||
| Weighted average shares for basic earnings per common share | |||||||||||||||||
| Basic earnings per common share | $ | $ | $ | ||||||||||||||
| Diluted earnings per common share: | |||||||||||||||||
| Numerator: | |||||||||||||||||
| Income allocated to common stockholders for basic earnings per common share | $ | $ | $ | ||||||||||||||
Adjustment for earnings reallocated from participating securities | ( | ( | ( | ||||||||||||||
| Income used in calculating diluted earnings per common share | $ | $ | $ | ||||||||||||||
| Denominator: | |||||||||||||||||
| Weighted average shares for basic earnings per common share | |||||||||||||||||
| Dilutive effect of certain share-based awards | |||||||||||||||||
Weighted average shares for diluted earnings per common share | |||||||||||||||||
| Diluted earnings per common share | $ | $ | $ | ||||||||||||||
Potentially dilutive unvested shares totaling 1,738,534 , 2,034,960 and 1,804,973 were outstanding at December 31, 2023, 2022 and 2021, respectively, but excluded from the calculation of diluted earnings per common share because their inclusion would have been anti-dilutive.
92
Table of Contents
BANKUNITED, INC. AND SUBSIDIARIES
NOTES TO CONSOLIDATED FINANCIAL STATEMENTS
December 31, 2023
Note 3 Investment Securities
Investment securities include investment securities available for sale, marketable equity securities, and investment securities held to maturity. The investment securities portfolio consisted of the following at the dates indicated (in thousands):
| December 31, 2023 | |||||||||||||||||||||||
| Amortized Cost | Gross Unrealized | Carrying Value (1) | |||||||||||||||||||||
| Gains | Losses | ||||||||||||||||||||||
| Investment securities available for sale: | |||||||||||||||||||||||
| U.S. Treasury securities | $ | $ | $ | ( | $ | ||||||||||||||||||
U.S. Government agency and sponsored enterprise residential MBS | ( | ||||||||||||||||||||||
U.S. Government agency and sponsored enterprise commercial MBS | ( | ||||||||||||||||||||||
Private label residential MBS and CMOs | ( | ||||||||||||||||||||||
Private label commercial MBS | ( | ||||||||||||||||||||||
| Single family real estate-backed securities | ( | ||||||||||||||||||||||
| Collateralized loan obligations | ( | ||||||||||||||||||||||
| Non-mortgage asset-backed securities | ( | ||||||||||||||||||||||
| State and municipal obligations | ( | ||||||||||||||||||||||
| SBA securities | ( | ||||||||||||||||||||||
| $ | $ | ( | |||||||||||||||||||||
| Investment securities held to maturity | |||||||||||||||||||||||
| $ | |||||||||||||||||||||||
| Marketable equity securities | |||||||||||||||||||||||
| $ | |||||||||||||||||||||||
93
Table of Contents
BANKUNITED, INC. AND SUBSIDIARIES
NOTES TO CONSOLIDATED FINANCIAL STATEMENTS
December 31, 2023
| December 31, 2022 | |||||||||||||||||||||||
| Amortized Cost | Gross Unrealized | Carrying Value (1) | |||||||||||||||||||||
| Gains | Losses | ||||||||||||||||||||||
| Investment securities available for sale: | |||||||||||||||||||||||
| U.S. Treasury securities | $ | $ | $ | ( | $ | ||||||||||||||||||
U.S. Government agency and sponsored enterprise residential MBS | ( | ||||||||||||||||||||||
U.S. Government agency and sponsored enterprise commercial MBS | ( | ||||||||||||||||||||||
Private label residential MBS and CMOs | ( | ||||||||||||||||||||||
Private label commercial MBS | ( | ||||||||||||||||||||||
| Single family real estate-backed securities | ( | ||||||||||||||||||||||
| Collateralized loan obligations | ( | ||||||||||||||||||||||
| Non-mortgage asset-backed securities | ( | ||||||||||||||||||||||
| State and municipal obligations | ( | ||||||||||||||||||||||
| SBA securities | ( | ||||||||||||||||||||||
| $ | $ | ( | |||||||||||||||||||||
| Investment securities held to maturity | |||||||||||||||||||||||
| $ | |||||||||||||||||||||||
| Marketable equity securities | |||||||||||||||||||||||
| $ | |||||||||||||||||||||||
(1)At fair value except for securities held to maturity.
Investment securities held to maturity at December 31, 2023 and 2022, consisted of one 37 million and $34 million at December 31, 2023 and 2022, respectively, and is included in other assets in the accompanying consolidated balance sheets.
At December 31, 2023, contractual maturities of investment securities available for sale, adjusted for anticipated prepayments when applicable, were as follows (in thousands):
| Amortized Cost | Fair Value | ||||||||||
| Due in one year or less | $ | $ | |||||||||
| Due after one year through five years | |||||||||||
| Due after five years through ten years | |||||||||||
| Due after ten years | |||||||||||
| $ | $ | ||||||||||
The carrying value of securities pledged as collateral for FHLB advances, public deposits, interest rate swaps and to secure borrowing capacity at the FRB totaled $7.7 billion and $4.1 billion at December 31, 2023 and 2022, respectively.
94
Table of Contents
BANKUNITED, INC. AND SUBSIDIARIES
NOTES TO CONSOLIDATED FINANCIAL STATEMENTS
December 31, 2023
The following table provides information about gains and losses on investment securities for the periods indicated (in thousands):
| Years Ended December 31, | |||||||||||||||||
| 2023 | 2022 | 2021 | |||||||||||||||
| Gross realized gains on investment securities AFS | $ | $ | $ | ||||||||||||||
| Gross realized losses on investment securities AFS | ( | ( | ( | ||||||||||||||
| Net realized gain | |||||||||||||||||
Net losses on marketable equity securities recognized in earnings | ( | ( | ( | ||||||||||||||
| Gain (loss) on investment securities, net | $ | ( | $ | ( | $ | ||||||||||||
The following tables present the aggregate fair value and the aggregate amount by which amortized cost exceeded fair value for investment securities available for sale in unrealized loss positions aggregated by investment category and length of time that individual securities had been in continuous unrealized loss positions at the dates indicated (in thousands):
| December 31, 2023 | |||||||||||||||||||||||||||||||||||
| Less than 12 Months | 12 Months or Greater | Total | |||||||||||||||||||||||||||||||||
| Fair Value | Unrealized Losses | Fair Value | Unrealized Losses | Fair Value | Unrealized Losses | ||||||||||||||||||||||||||||||
U.S. Treasury securities | $ | $ | ( | $ | $ | ( | $ | $ | ( | ||||||||||||||||||||||||||
U.S. Government agency and sponsored enterprise residential MBS | ( | ( | ( | ||||||||||||||||||||||||||||||||
U.S. Government agency and sponsored enterprise commercial MBS | ( | ( | ( | ||||||||||||||||||||||||||||||||
Private label residential MBS and CMOs | ( | ( | |||||||||||||||||||||||||||||||||
Private label commercial MBS | ( | ( | ( | ||||||||||||||||||||||||||||||||
| Single family real estate-backed securities | ( | ( | |||||||||||||||||||||||||||||||||
| Collateralized loan obligations | ( | ( | ( | ||||||||||||||||||||||||||||||||
Non-mortgage asset-backed securities | ( | ( | |||||||||||||||||||||||||||||||||
| State and municipal obligations | ( | ( | ( | ||||||||||||||||||||||||||||||||
| SBA securities | ( | ( | ( | ||||||||||||||||||||||||||||||||
| $ | $ | ( | $ | $ | ( | $ | $ | ( | |||||||||||||||||||||||||||
95
Table of Contents
BANKUNITED, INC. AND SUBSIDIARIES
NOTES TO CONSOLIDATED FINANCIAL STATEMENTS
December 31, 2023
| December 31, 2022 | |||||||||||||||||||||||||||||||||||
| Less than 12 Months | 12 Months or Greater | Total | |||||||||||||||||||||||||||||||||
| Fair Value | Unrealized Losses | Fair Value | Unrealized Losses | Fair Value | Unrealized Losses | ||||||||||||||||||||||||||||||
U.S. Treasury securities | $ | $ | ( | $ | $ | ( | $ | $ | ( | ||||||||||||||||||||||||||
U.S. Government agency and sponsored enterprise residential MBS | ( | ( | ( | ||||||||||||||||||||||||||||||||
U.S. Government agency and sponsored enterprise commercial MBS | ( | ( | ( | ||||||||||||||||||||||||||||||||
Private label residential MBS and CMOs | ( | ( | ( | ||||||||||||||||||||||||||||||||
Private label commercial MBS | ( | ( | ( | ||||||||||||||||||||||||||||||||
| Single family real estate-backed securities | ( | ( | ( | ||||||||||||||||||||||||||||||||
| Collateralized loan obligations | ( | ( | ( | ||||||||||||||||||||||||||||||||
Non-mortgage asset-backed securities | ( | ( | |||||||||||||||||||||||||||||||||
| State and municipal obligations | ( | ( | ( | ||||||||||||||||||||||||||||||||
| SBA securities | ( | ( | ( | ||||||||||||||||||||||||||||||||
| $ | $ | ( | $ | $ | ( | $ | $ | ( | |||||||||||||||||||||||||||
The Company monitors its investment securities available for sale for credit loss impairment on an individual security basis. No securities were determined to be credit loss impaired during the years ended December 31, 2023, 2022 and 2021. At December 31, 2023, the Company did not have an intent to sell securities that were in unrealized loss positions, and it was not more likely than not that the Company would be required to sell these securities before recovery of the amortized cost basis, which may be at maturity. In making this determination, the Company considered its current and projected liquidity position including its ability to pledge securities to generate liquidity, its investment policy as to permissible holdings and concentration limits, regulatory requirements and other relevant factors. While events of early 2023 impacting the banking sector impacted the liquidity profile of many banks, including BankUnited, the substantial majority of our investment securities are pledgeable at either the FHLB or FRB. We have not sold, and do not anticipate the need to sell, securities in unrealized loss positions to generate liquidity.
At December 31, 2023, 558 securities available for sale were in unrealized loss positions. The amount of impairment related to 114 of these securities was considered insignificant both individually and in the aggregate, totaling approximately $1.1 million and no further analysis with respect to these securities was considered necessary.
The basis for concluding that AFS securities were not credit loss impaired and no ACL was considered necessary at December 31, 2023, is further discussed below.
Unrealized losses were primarily attributable to a sustained higher interest rate environment. In some cases, wider spreads compared to levels at which securities were purchased. market volatility and yield curve dislocations also contributed to unrealized losses, particularly in the CLO segment. The investment securities AFS portfolio was in a net unrealized loss position of $534.8 million at December 31, 2023, compared to $674.2 million at December 31, 2022, improving by $139.4 million during the year ended December 31, 2023. While the majority of securities in the portfolio were floating rate at December 31, 2023, fixed rate securities accounted for the majority of unrealized losses.
U.S. Government, U.S. Government Agency and Government Sponsored Enterprise Securities
At December 31, 2023, six U.S. treasury, 130 U.S. Government agency and sponsored enterprise residential MBS, 26 U.S. Government agency and sponsored enterprise commercial MBS, and 22 SBA securities were in unrealized loss positions. The timely payment of principal and interest on these securities is explicitly or implicitly guaranteed by the U.S. Government. As such, there is an assumption of zero credit loss and the Company expects to recover the amortized cost basis of these securities.
96
Table of Contents
BANKUNITED, INC. AND SUBSIDIARIES
NOTES TO CONSOLIDATED FINANCIAL STATEMENTS
December 31, 2023
Private Label Securities:
None of the impaired private label securities had missed principal or interest payments or had been downgraded by a NRSRO at December 31, 2023. The Company performed an analysis comparing the present value of cash flows expected to be collected to the amortized cost basis of impaired securities. This analysis was based on a scenario that we believe to be generally more conservative than our reasonable and supportable economic forecast at December 31, 2023, and incorporated assumptions about voluntary prepayment rates, collateral defaults, delinquencies, severity and other relevant factors as described further below. Our analysis also considered the structural characteristics of each security and the level of credit enhancement provided by that structure.
Private label residential MBS and CMOs
At December 31, 2023, 114 private label residential MBS and CMOs were in unrealized loss positions. Our analysis of cash flows expected to be collected on these securities incorporated assumptions about collateral default rates, voluntary prepayment rates, loss severity, delinquencies and recovery lag. In developing those assumptions, we took into account collateral quality measures such as FICO, LTV, documentation, loan type, property type, agency availability criteria and performing status. We also regularly monitor sector data including home price appreciation, forbearance, delinquency, special servicing and prepay trends as well as other economic data that could be indicative of stress in the sector. Underlying delinquencies in this sector remain low. Our December 31, 2023 analysis projected weighted average collateral losses for impaired securities in this category of 2 % compared to weighted average credit support of 18 %. As of December 31, 2023, 95 % of impaired securities in this category, based on carrying value, were externally rated AAA, 4 % were rated AA and 1 % were rated A.
Private label commercial MBS
At December 31, 2023, 95 private label commercial MBS were in unrealized loss positions. Our analysis of cash flows expected to be collected on these securities incorporated assumptions about collateral default rates, voluntary prepayment rates, loss severity, delinquencies and recovery lag. In developing those assumptions, we took into account collateral quality and type, loan size, loan purpose and other qualitative factors. We also regularly monitor collateral concentrations, collateral watch lists, bankruptcy data, defeasance data, special servicing trends, delinquency and other economic data that could be indicative of stress in the sector. We consider collateral, deal, sector and tranche level performance as well as maturity and refinance risk. While we have observed some deterioration in collateral performance in this segment, particularly in the office, retail and hospitality sectors, the high credit quality of these securities and adequacy of subordination to cover projected collateral losses supports the conclusion that there is no credit loss impairment. Our December 31, 2023 analysis projected weighted average collateral losses for impaired securities in this category of 7 % compared to weighted average credit support of 43 %. As of December 31, 2023, 85 % of impaired securities in this category, based on carrying value, were externally rated AAA, 11 % were rated AA and 4 % were rated A.
Single family real estate-backed securities
At December 31, 2023, 13 single family rental real estate-backed securities were in unrealized loss positions. Our analysis of cash flows expected to be collected on these securities incorporated assumptions about collateral default rates, loss severity, delinquencies and recovery lag. We regularly monitor sector data including home price appreciation, forbearance, delinquency and prepay trends as well as other economic data that could be indicative of stress in the sector. We consider collateral, deal, sector and tranche level performance as well as maturity and refinance risk. Our December 31, 2023 analysis projected weighted average collateral losses for this category of 8 % compared to weighted average credit support of 53 %. As of December 31, 2023, 57 % of impaired securities in this category, based on carrying value, were externally rated AAA, 17 % were rated AA and one security was not externally rated.
Collateralized loan obligations
At December 31, 2023, 28 collateralized loan obligations were in unrealized loss positions. Unrealized losses totaled less than 1% of total amortized cost of this segment at December 31, 2023. Our analysis of cash flows expected to be collected on these securities incorporated assumptions about collateral default rates, loss severity, and delinquencies, calibrated to take into account idiosyncratic risks associated with the underlying collateral. In developing those assumptions, we took into account each sector’s performance pre-, during and post the 2008 financial crisis. We regularly engage with bond managers to monitor
97
Table of Contents
BANKUNITED, INC. AND SUBSIDIARIES
NOTES TO CONSOLIDATED FINANCIAL STATEMENTS
December 31, 2023
trends in underlying collateral including potential downgrades and subsequent cash flow diversions, liquidity, ratings migration, and any other relevant developments. While we have observed some deterioration in underlying collateral performance due in large part to rising costs, the high credit quality of these securities and adequacy of subordination to cover projected collateral losses supports the conclusion that there is no credit loss impairment. Our December 31, 2023 analysis projected weighted average collateral losses for impaired securities in this category of 15 % compared to weighted average credit support of 45 %. As of December 31, 2023, 81 % of the impaired securities in this category, based on carrying value, were externally rated AAA, 15 % were rated AA and 4 % were rated A.
Non-mortgage asset-backed securities
At December 31, 2023, six non-mortgage asset-backed securities were in unrealized loss positions. These securities are backed by student loan collateral. Our analysis of cash flows expected to be collected on these securities incorporated assumptions about collateral default rates, loss severity, delinquencies, voluntary prepayment rates and recovery lag. In developing assumptions, we took into account collateral type, delineated by whether collateral consisted of loans to borrowers in school, refinancing, or a mixture. Our December 31, 2023 analysis projected weighted average collateral losses for impaired securities in this category of 4 % compared to weighted average credit support of 24 %. As of December 31, 2023, 38 % of the impaired securities in this category, based on carrying value, were externally rated AAA, and 62 % were rated AA.
State and Municipal Obligations
At December 31, 2023, four state and municipal obligations were in unrealized loss positions. Our analysis of potential credit loss impairment for these securities incorporates a quantitative measure of the underlying obligor's credit worthiness provided by a third-party vendor as well as other relevant qualitative considerations. As of December 31, 2023, 98 % of the impaired securities in this category, based on carrying value, were externally rated AAA and 2 % were rated AA.
Note 4 Loans and Allowance for Credit Losses
Loans consisted of the following at the dates indicated (dollars in thousands):
| December 31, 2023 | December 31, 2022 | ||||||||||||||||||||||
| Total | Percent of Total | Total | Percent of Total | ||||||||||||||||||||
| Residential: | |||||||||||||||||||||||
| 1-4 single family residential | $ | % | $ | % | |||||||||||||||||||
| Government insured residential | % | % | |||||||||||||||||||||
| % | % | ||||||||||||||||||||||
| Commercial: | |||||||||||||||||||||||
| Non-owner occupied commercial real estate | % | % | |||||||||||||||||||||
| Construction and land | % | % | |||||||||||||||||||||
| Owner occupied commercial real estate | % | % | |||||||||||||||||||||
| Commercial and industrial | % | % | |||||||||||||||||||||
| Pinnacle - municipal finance | % | % | |||||||||||||||||||||
| Franchise finance | % | % | |||||||||||||||||||||
| Equipment finance | % | % | |||||||||||||||||||||
| Mortgage warehouse lending | % | % | |||||||||||||||||||||
| % | % | ||||||||||||||||||||||
| Total loans | % | % | |||||||||||||||||||||
| Allowance for credit losses | ( | ( | |||||||||||||||||||||
| Loans, net | $ | $ | |||||||||||||||||||||
Premiums, discounts and deferred fees and costs, excluding the non-credit related discount on PCD loans, totaled $45 million and $61 million at December 31, 2023 and 2022, respectively.
98
Table of Contents
BANKUNITED, INC. AND SUBSIDIARIES
NOTES TO CONSOLIDATED FINANCIAL STATEMENTS
December 31, 2023
The following table presents the amortized cost basis of residential PCD loans and the related amount of non-credit discount, net of the related ACL, at the dates indicated (in thousands):
| December 31, 2023 | December 31, 2022 | ||||||||||
| UPB | $ | $ | |||||||||
| Non-credit discount | ( | ( | |||||||||
| Total amortized cost of PCD loans | |||||||||||
| ACL related to PCD loans | ( | ( | |||||||||
| PCD loans, net | $ | $ | |||||||||
During the years ended December 31, 2023, 2022 and 2021, the Company purchased residential loans totaling $493 million, $2.3 billion and $4.8 billion, respectively.
At December 31, 2023 and 2022, the Company had pledged loans with a carrying value of approximately $16.5 billion and $12.4 billion, respectively, as security for FHLB advances and Federal Reserve discount window capacity.
At December 31, 2023 and 2022, accrued interest receivable on loans totaled $138 million and $129 million, respectively, and is included in other assets in the accompanying consolidated balance sheets. The amount of interest income reversed on non-accrual loans was not material for the years ended December 31, 2023, 2022 and 2021.
Allowance for credit losses
The ACL was determined utilizing a 2-year reasonable and supportable forecast period. The quantitative portion of the ACL at December 31, 2023, was determined using three weighted third-party provided economic scenarios. The quantitative portion of the ACL at December 31, 2022 and 2021 was determined using a single third-party provided economic scenario. Activity in the ACL is summarized below for the periods indicated (in thousands):
| Years Ended December 31, | |||||||||||||||||||||||||||||||||||||||||||||||||||||
| 2023 | 2022 | 2021 | |||||||||||||||||||||||||||||||||||||||||||||||||||
| Residential | Commercial | Total | Residential | Commercial | Total | Residential | Commercial | Total | |||||||||||||||||||||||||||||||||||||||||||||
| Beginning balance | $ | $ | $ | $ | $ | $ | $ | $ | $ | ||||||||||||||||||||||||||||||||||||||||||||
Impact of adoption of ASU 2022-02 | ( | ( | ( | N/A | N/A | N/A | N/A | N/A | N/A | ||||||||||||||||||||||||||||||||||||||||||||
Balance after adoption of ASU 2022-02 | |||||||||||||||||||||||||||||||||||||||||||||||||||||
| Provision (recovery) | ( | ( | ( | ( | |||||||||||||||||||||||||||||||||||||||||||||||||
| Charge-offs | ( | ( | ( | ( | ( | ( | ( | ( | |||||||||||||||||||||||||||||||||||||||||||||
| Recoveries | |||||||||||||||||||||||||||||||||||||||||||||||||||||
| Ending balance | $ | $ | $ | $ | $ | $ | $ | $ | $ | ||||||||||||||||||||||||||||||||||||||||||||
99
Table of Contents
BANKUNITED, INC. AND SUBSIDIARIES
NOTES TO CONSOLIDATED FINANCIAL STATEMENTS
December 31, 2023
The ACL increased by $54.7 million, from 0.59 % to 0.82 % of total loans, at December 31, 2023, compared to December 31, 2022. The more significant factors impacting the provision for credit losses and increase in the ACL for the year ended December 31, 2023, included changes in the economic forecast, new commercial loan production, risk rating migration and an increase in certain specific reserves.
The following table presents gross charge-offs during the year ended December 31, 2023, by year of origination (in thousands):
| 2023 | 2022 | 2021 | 2020 | 2019 | Prior to 2019 | Revolving Loans | Total | ||||||||||||||||||||||||||||||||||||||||
| CRE | $ | $ | $ | $ | $ | $ | $ | $ | |||||||||||||||||||||||||||||||||||||||
| C&I | |||||||||||||||||||||||||||||||||||||||||||||||
| Franchise finance | |||||||||||||||||||||||||||||||||||||||||||||||
| $ | $ | $ | $ | $ | $ | $ | $ | ||||||||||||||||||||||||||||||||||||||||
The following table presents the components of the provision for (recovery of) credit losses for the periods indicated (in thousands):
| Years Ended December 31, | |||||||||||||||||
| 2023 | 2022 | 2021 | |||||||||||||||
| Amount related to funded portion of loans | $ | $ | $ | ( | |||||||||||||
| Amount related to off-balance sheet credit exposures | ( | ||||||||||||||||
| Other | ( | ( | |||||||||||||||
Total provision for (recovery of) credit losses | $ | $ | $ | ( | |||||||||||||
Credit quality information
Credit quality of loans held for investment is continuously monitored by dedicated residential credit risk management and commercial portfolio management functions. The Company also has a workout and recovery department that monitors the credit quality of criticized and classified loans and an independent internal credit review function.
Credit quality indicators for residential loans
Management considers delinquency status to be the most meaningful indicator of the credit quality of residential loans, other than government insured residential loans. Delinquency statistics are updated at least monthly. LTV and FICO scores are also important indicators of credit quality for 1-4 single family residential loans other than government insured loans. FICO scores are generally updated semi-annually, and were most recently updated in the third quarter of 2023. LTVs are typically at origination since we do not routinely update residential appraisals. Substantially all of the government insured residential loans are government insured buyout loans, which the Company buys out of GNMA securitizations upon default. For these loans, traditional measures of credit quality are not particularly relevant considering the guaranteed nature of the loans and the underlying business model. Factors that impact risk inherent in the residential portfolio segment include national and regional economic conditions such as levels of unemployment, wages and interest rates, as well as residential property values.
100
Table of Contents
BANKUNITED, INC. AND SUBSIDIARIES
NOTES TO CONSOLIDATED FINANCIAL STATEMENTS
December 31, 2023
1-4 Single Family Residential credit exposure, excluding government insured residential loans, based on delinquency status (in thousands):
| December 31, 2023 | |||||||||||||||||||||||||||||||||||||||||
| Amortized Cost By Origination Year | |||||||||||||||||||||||||||||||||||||||||
| 2023 | 2022 | 2021 | 2020 | 2019 | Prior | Total | |||||||||||||||||||||||||||||||||||
| Current | $ | $ | $ | $ | $ | $ | $ | ||||||||||||||||||||||||||||||||||
| 30 - 59 Days Past Due | |||||||||||||||||||||||||||||||||||||||||
| 60 - 89 Days Past Due | |||||||||||||||||||||||||||||||||||||||||
| 90 Days or More Past Due | |||||||||||||||||||||||||||||||||||||||||
| $ | $ | $ | $ | $ | $ | $ | |||||||||||||||||||||||||||||||||||
| December 31, 2022 | |||||||||||||||||||||||||||||||||||||||||
| Amortized Cost By Origination Year | |||||||||||||||||||||||||||||||||||||||||
| 2022 | 2021 | 2020 | 2019 | 2018 | Prior | Total | |||||||||||||||||||||||||||||||||||
| Current | $ | $ | $ | $ | $ | $ | $ | ||||||||||||||||||||||||||||||||||
| 30 - 59 Days Past Due | |||||||||||||||||||||||||||||||||||||||||
| 60 - 89 Days Past Due | |||||||||||||||||||||||||||||||||||||||||
| 90 Days or More Past Due | |||||||||||||||||||||||||||||||||||||||||
| $ | $ | $ | $ | $ | $ | $ | |||||||||||||||||||||||||||||||||||
1-4 Single Family Residential credit exposure, excluding government insured residential loans, based on LTV (in thousands):
| December 31, 2023 | |||||||||||||||||||||||||||||||||||||||||
| Amortized Cost By Origination Year | |||||||||||||||||||||||||||||||||||||||||
| LTV | 2023 | 2022 | 2021 | 2020 | 2019 | Prior | Total | ||||||||||||||||||||||||||||||||||
| Less than 61% | $ | $ | $ | $ | $ | $ | $ | ||||||||||||||||||||||||||||||||||
| 61% - 70% | |||||||||||||||||||||||||||||||||||||||||
| 71% - 80% | |||||||||||||||||||||||||||||||||||||||||
| More than 80% | |||||||||||||||||||||||||||||||||||||||||
| $ | $ | $ | $ | $ | $ | $ | |||||||||||||||||||||||||||||||||||
| December 31, 2022 | |||||||||||||||||||||||||||||||||||||||||
| Amortized Cost By Origination Year | |||||||||||||||||||||||||||||||||||||||||
| LTV | 2022 | 2021 | 2020 | 2019 | 2018 | Prior | Total | ||||||||||||||||||||||||||||||||||
| Less than 61% | $ | $ | $ | $ | $ | $ | $ | ||||||||||||||||||||||||||||||||||
| 61% - 70% | |||||||||||||||||||||||||||||||||||||||||
| 71% - 80% | |||||||||||||||||||||||||||||||||||||||||
| More than 80% | |||||||||||||||||||||||||||||||||||||||||
| $ | $ | $ | $ | $ | $ | $ | |||||||||||||||||||||||||||||||||||
101
Table of Contents
BANKUNITED, INC. AND SUBSIDIARIES
NOTES TO CONSOLIDATED FINANCIAL STATEMENTS
December 31, 2023
1-4 Single Family Residential credit exposure, excluding government insured residential loans, based on FICO score (in thousands):
| December 31, 2023 | |||||||||||||||||||||||||||||||||||||||||
| Amortized Cost By Origination Year | |||||||||||||||||||||||||||||||||||||||||
| FICO | 2023 | 2022 | 2021 | 2020 | 2019 | Prior | Total | ||||||||||||||||||||||||||||||||||
| 760 or greater | $ | $ | $ | $ | $ | $ | $ | ||||||||||||||||||||||||||||||||||
| 720 - 759 | |||||||||||||||||||||||||||||||||||||||||
719 or less or not available | |||||||||||||||||||||||||||||||||||||||||
| $ | $ | $ | $ | $ | $ | $ | |||||||||||||||||||||||||||||||||||
| December 31, 2022 | |||||||||||||||||||||||||||||||||||||||||
| Amortized Cost By Origination Year | |||||||||||||||||||||||||||||||||||||||||
| FICO | 2022 | 2021 | 2020 | 2019 | 2018 | Prior | Total | ||||||||||||||||||||||||||||||||||
| 760 or greater | $ | $ | $ | $ | $ | $ | $ | ||||||||||||||||||||||||||||||||||
| 720 - 759 | |||||||||||||||||||||||||||||||||||||||||
719 or less or not available | |||||||||||||||||||||||||||||||||||||||||
| $ | $ | $ | $ | $ | $ | $ | |||||||||||||||||||||||||||||||||||
Credit quality indicators for commercial loans
Factors that impact risk inherent in commercial portfolio segments include but are not limited to levels of economic activity or potential disruptions in economic activity, health of the national, regional and to a lesser extent global economy, interest rates, industry trends, demographic trends, inflationary trends, including particularly for commercial real estate loans the cost of insurance, patterns of and trends in customer behavior that influence demand for our borrowers' products and services, and commercial real estate values and related market dynamics. Particularly for the office sector, the evolving impact of hybrid and remote work on vacancies and valuations is a factor. Internal risk ratings are considered the most meaningful indicator of credit quality for commercial loans. Internal risk ratings are generally indicative of the likelihood that a borrower will default, are a key factor influencing the level and nature of ongoing monitoring of loans and may impact the estimation of the ACL. Internal risk ratings are updated on a continuous basis. Generally, relationships with balances in excess of defined thresholds, ranging from $1 million to $3 million, are re-evaluated at least annually and more frequently if circumstances indicate that a change in risk rating may be warranted. The special mention rating is considered a transitional rating for loans exhibiting potential credit weaknesses that could result in deterioration of repayment prospects at some future date if not checked or corrected and that deserve management’s close attention. These borrowers may exhibit declining cash flows or revenues or increasing leverage. Loans with well-defined credit weaknesses that may result in a loss if the deficiencies are not corrected are assigned a risk rating of substandard. These borrowers may exhibit payment defaults, inadequate cash flows from current operations, operating losses, increasing balance sheet leverage, project cost overruns, unreasonable construction delays, exhausted interest reserves, declining collateral values, frequent overdrafts or past due real estate taxes. Loans with weaknesses so severe that collection in full is highly questionable or improbable, but because of certain reasonably specific pending factors have not been charged off, are assigned an internal risk rating of doubtful.
102
Table of Contents
BANKUNITED, INC. AND SUBSIDIARIES
NOTES TO CONSOLIDATED FINANCIAL STATEMENTS
December 31, 2023
Commercial credit exposure based on internal risk rating (in thousands):
| December 31, 2023 | |||||||||||||||||||||||||||||||||||||||||||||||
| Amortized Cost By Origination Year | Revolving Loans | ||||||||||||||||||||||||||||||||||||||||||||||
| 2023 | 2022 | 2021 | 2020 | 2019 | Prior | Total | |||||||||||||||||||||||||||||||||||||||||
| CRE | |||||||||||||||||||||||||||||||||||||||||||||||
| Pass | $ | $ | $ | $ | $ | $ | $ | $ | |||||||||||||||||||||||||||||||||||||||
| Special mention | |||||||||||||||||||||||||||||||||||||||||||||||
| Substandard | |||||||||||||||||||||||||||||||||||||||||||||||
| Total CRE | $ | $ | $ | $ | $ | $ | $ | $ | |||||||||||||||||||||||||||||||||||||||
C&I | |||||||||||||||||||||||||||||||||||||||||||||||
| Pass | $ | $ | $ | $ | $ | $ | $ | $ | |||||||||||||||||||||||||||||||||||||||
| Special mention | |||||||||||||||||||||||||||||||||||||||||||||||
| Substandard | |||||||||||||||||||||||||||||||||||||||||||||||
| Doubtful | |||||||||||||||||||||||||||||||||||||||||||||||
| Total C&I | $ | $ | $ | $ | $ | $ | $ | $ | |||||||||||||||||||||||||||||||||||||||
| Pinnacle - municipal finance | |||||||||||||||||||||||||||||||||||||||||||||||
| Pass | $ | $ | $ | $ | $ | $ | $ | $ | |||||||||||||||||||||||||||||||||||||||
| Total Pinnacle - municipal finance | $ | $ | $ | $ | $ | $ | $ | $ | |||||||||||||||||||||||||||||||||||||||
| Franchise finance | |||||||||||||||||||||||||||||||||||||||||||||||
| Pass | $ | $ | $ | $ | $ | $ | $ | $ | |||||||||||||||||||||||||||||||||||||||
| Special mention | |||||||||||||||||||||||||||||||||||||||||||||||
| Substandard | |||||||||||||||||||||||||||||||||||||||||||||||
| Doubtful | |||||||||||||||||||||||||||||||||||||||||||||||
| Total Franchise finance | $ | $ | $ | $ | $ | $ | $ | $ | |||||||||||||||||||||||||||||||||||||||
| Equipment Finance | |||||||||||||||||||||||||||||||||||||||||||||||
| Pass | $ | $ | $ | $ | $ | $ | $ | $ | |||||||||||||||||||||||||||||||||||||||
| Substandard | |||||||||||||||||||||||||||||||||||||||||||||||
| Total Equipment finance | $ | $ | $ | $ | $ | $ | $ | $ | |||||||||||||||||||||||||||||||||||||||
| Mortgage warehouse lending | |||||||||||||||||||||||||||||||||||||||||||||||
| Pass | $ | $ | $ | $ | $ | $ | $ | $ | |||||||||||||||||||||||||||||||||||||||
| Total Mortgage warehouse lending | $ | $ | $ | $ | $ | $ | $ | $ | |||||||||||||||||||||||||||||||||||||||
103
Table of Contents
BANKUNITED, INC. AND SUBSIDIARIES
NOTES TO CONSOLIDATED FINANCIAL STATEMENTS
December 31, 2023
| December 31, 2022 | |||||||||||||||||||||||||||||||||||||||||||||||
| Amortized Cost By Origination Year | Revolving Loans | ||||||||||||||||||||||||||||||||||||||||||||||
| 2022 | 2021 | 2020 | 2019 | 2018 | Prior | Total | |||||||||||||||||||||||||||||||||||||||||
| CRE | |||||||||||||||||||||||||||||||||||||||||||||||
| Pass | $ | $ | $ | $ | $ | $ | $ | $ | |||||||||||||||||||||||||||||||||||||||
| Special mention | |||||||||||||||||||||||||||||||||||||||||||||||
| Substandard | |||||||||||||||||||||||||||||||||||||||||||||||
| Total CRE | $ | $ | $ | $ | $ | $ | $ | $ | |||||||||||||||||||||||||||||||||||||||
| C&I | |||||||||||||||||||||||||||||||||||||||||||||||
| Pass | $ | $ | $ | $ | $ | $ | $ | $ | |||||||||||||||||||||||||||||||||||||||
| Special mention | |||||||||||||||||||||||||||||||||||||||||||||||
| Substandard | |||||||||||||||||||||||||||||||||||||||||||||||
| Doubtful | |||||||||||||||||||||||||||||||||||||||||||||||
| Total C&I | $ | $ | $ | $ | $ | $ | $ | $ | |||||||||||||||||||||||||||||||||||||||
| Pinnacle - municipal finance | |||||||||||||||||||||||||||||||||||||||||||||||
| Pass | $ | $ | $ | $ | $ | $ | $ | $ | |||||||||||||||||||||||||||||||||||||||
| Total Pinnacle - municipal finance | $ | $ | $ | $ | $ | $ | $ | $ | |||||||||||||||||||||||||||||||||||||||
| Franchise finance | |||||||||||||||||||||||||||||||||||||||||||||||
| Pass | $ | $ | $ | $ | $ | $ | $ | $ | |||||||||||||||||||||||||||||||||||||||
| Special mention | |||||||||||||||||||||||||||||||||||||||||||||||
| Substandard | |||||||||||||||||||||||||||||||||||||||||||||||
| Doubtful | |||||||||||||||||||||||||||||||||||||||||||||||
| Total franchise finance | $ | $ | $ | $ | $ | $ | $ | $ | |||||||||||||||||||||||||||||||||||||||
| Equipment finance | |||||||||||||||||||||||||||||||||||||||||||||||
| Pass | $ | $ | $ | $ | $ | $ | $ | $ | |||||||||||||||||||||||||||||||||||||||
| Substandard | |||||||||||||||||||||||||||||||||||||||||||||||
| Equipment finance | $ | $ | $ | $ | $ | $ | $ | $ | |||||||||||||||||||||||||||||||||||||||
| Mortgage warehouse lending | |||||||||||||||||||||||||||||||||||||||||||||||
| Pass | $ | $ | $ | $ | $ | $ | $ | $ | |||||||||||||||||||||||||||||||||||||||
| Total Mortgage warehouse lending | $ | $ | $ | $ | $ | $ | $ | $ | |||||||||||||||||||||||||||||||||||||||
At December 31, 2023 and 2022, the balance of revolving loans converted to term loans was immaterial.
The following table presents criticized and classified commercial loans, in aggregate by risk rating category, at the dates indicated (in thousands):
| December 31, 2023 | December 31, 2022 | ||||||||||
| Special mention | $ | $ | |||||||||
| Substandard - accruing | |||||||||||
| Substandard - non-accruing | |||||||||||
| Doubtful | |||||||||||
| Total | $ | $ | |||||||||
104
Table of Contents
BANKUNITED, INC. AND SUBSIDIARIES
NOTES TO CONSOLIDATED FINANCIAL STATEMENTS
December 31, 2023
Past Due and Non-Accrual Loans:
The following table presents an aging of loans at the dates indicated (in thousands):
| December 31, 2023 | December 31, 2022 | ||||||||||||||||||||||||||||||||||||||||||||||||||||||||||
| Current | 30 - 59 Days Past Due | 60 - 89 Days Past Due | 90 Days or More Past Due | Total | Current | 30 - 59 Days Past Due | 60 - 89 Days Past Due | 90 Days or More Past Due | Total | ||||||||||||||||||||||||||||||||||||||||||||||||||
| 1-4 single family residential | $ | $ | $ | $ | $ | $ | $ | $ | $ | $ | |||||||||||||||||||||||||||||||||||||||||||||||||
| Government insured residential | |||||||||||||||||||||||||||||||||||||||||||||||||||||||||||
| CRE | |||||||||||||||||||||||||||||||||||||||||||||||||||||||||||
| C&I | |||||||||||||||||||||||||||||||||||||||||||||||||||||||||||
| Pinnacle - municipal finance | |||||||||||||||||||||||||||||||||||||||||||||||||||||||||||
| Franchise finance | |||||||||||||||||||||||||||||||||||||||||||||||||||||||||||
| Equipment finance | |||||||||||||||||||||||||||||||||||||||||||||||||||||||||||
| Mortgage warehouse lending | |||||||||||||||||||||||||||||||||||||||||||||||||||||||||||
| $ | $ | $ | $ | $ | $ | $ | $ | $ | $ | ||||||||||||||||||||||||||||||||||||||||||||||||||
Included in the table above is the guaranteed portion of SBA loans past due by 90 days or more totaling $39.7 million and $30.8 million at December 31, 2023 and 2022, respectively.
Loans contractually delinquent by 90 days or more and still accruing totaled $278 million and $494 million at December 31, 2023 and 2022, respectively, substantially all of which were government insured residential loans. These loans are government insured pool buyout loans, which the Company buys out of GNMA securitizations upon default.
The following table presents information about loans on non-accrual status at the dates indicated (in thousands):
| December 31, 2023 | December 31, 2022 | ||||||||||||||||||||||
| Amortized Cost | Amortized Cost With No Related Allowance | Amortized Cost | Amortized Cost With No Related Allowance | ||||||||||||||||||||
| 1-4 single family residential | $ | $ | $ | $ | |||||||||||||||||||
| CRE | |||||||||||||||||||||||
| C&I | |||||||||||||||||||||||
| Franchise finance | |||||||||||||||||||||||
Equipment finance | |||||||||||||||||||||||
| $ | $ | $ | $ | ||||||||||||||||||||
Included in the table above is the guaranteed portion of non-accrual SBA loans totaling $41.8 million and $40.3 million at December 31, 2023 and 2022, respectively. The amount of interest income recognized on non-accrual loans was insignificant for the years ended December 31, 2023, 2022 and 2021. The amount of additional interest income that would have been recognized on non-accrual loans had they performed in accordance with their contractual terms was approximately $7.7 million, $5.9 million and $8.0 million for the years ended December 31, 2023, 2022 and 2021, respectively.
105
Table of Contents
BANKUNITED, INC. AND SUBSIDIARIES
NOTES TO CONSOLIDATED FINANCIAL STATEMENTS
December 31, 2023
Collateral dependent loans:
The following table presents the amortized cost basis of collateral dependent loans at the dates indicated (in thousands):
| December 31, 2023 | December 31, 2022 | ||||||||||||||||||||||
| Amortized Cost | Extent to Which Secured by Collateral | Amortized Cost | Extent to Which Secured by Collateral | ||||||||||||||||||||
| 1-4 single family residential | $ | $ | $ | $ | |||||||||||||||||||
| Commercial: | |||||||||||||||||||||||
| CRE | |||||||||||||||||||||||
| C&I | |||||||||||||||||||||||
| Franchise finance | |||||||||||||||||||||||
| Equipment finance | |||||||||||||||||||||||
| Total commercial | |||||||||||||||||||||||
| $ | $ | $ | $ | ||||||||||||||||||||
Collateral for the CRE loan class generally consists of commercial real estate, or for certain construction loans, residential real estate. Collateral for C&I loans generally consists of equipment, accounts receivable, inventory and other business assets and for owner-occupied commercial real estate loans, may also include commercial real estate. Franchise finance loans may be collateralized by franchise value or by equipment. Residential loans are collateralized by residential real estate. There were no significant changes to the extent to which collateral secured collateral dependent loans during the years ended December 31, 2023 and 2022.
Foreclosure of residential real estate
The recorded investment in residential loans in the process of foreclosure was $262 million, of which $250 million was government insured at December 31, 2023, and $413 million, of which $400 million was government insured at December 31, 2022. The carrying amount of foreclosed residential real estate included in other assets in the accompanying consolidated balance sheet was insignificant at December 31, 2023 and 2022.
Loan Modifications
The following tables summarize loans that were modified for borrowers experiencing financial difficulty, by type of modification, during the periods indicated (dollars in thousands):
| Year Ended December 31, 2023 | |||||||||||||||||||||||||||||||||||||||||
| Interest Rate Reduction | Term Extension | Combination - Interest Rate Reduction and Term Extension | |||||||||||||||||||||||||||||||||||||||
| Total | % (1) | Total | % (1) | Total | % (1) | Total | |||||||||||||||||||||||||||||||||||
| 1-4 single family residential | $ | % | $ | % | $ | % | $ | ||||||||||||||||||||||||||||||||||
| Government insured residential | % | % | % | ||||||||||||||||||||||||||||||||||||||
| C&I | % | % | % | ||||||||||||||||||||||||||||||||||||||
| Franchise finance | % | % | % | ||||||||||||||||||||||||||||||||||||||
| $ | $ | $ | $ | ||||||||||||||||||||||||||||||||||||||
(1)Represents percentage of loans receivable in each category.
106
Table of Contents
BANKUNITED, INC. AND SUBSIDIARIES
NOTES TO CONSOLIDATED FINANCIAL STATEMENTS
December 31, 2023
The following tables summarize the financial effect of the modifications made to borrowers experiencing difficulty, during the periods indicated:
| Year Ended December 31, 2023 | ||||||||
| Financial Effect | ||||||||
| Interest Rate Reduction: | ||||||||
| 1-4 single family residential | Reduced weighted average contractual interest rate from | |||||||
| Government insured residential | Reduced weighted average contractual interest rate from | |||||||
| Term Extension: | ||||||||
| Government insured residential | Added a weighted average | |||||||
| C&I | Added a weighted average | |||||||
| Franchise finance | Added a weighted average | |||||||
| Combination - Interest Rate Reduction and Term Extension: | ||||||||
| Government insured residential | Reduced weighted average contractual interest rate from | |||||||
The following table presents the aging at December 31, 2023, of loans that were modified since January 1, 2023, the date of adoption of ASU 2022-02 (in thousands):
| Current | 30-59 Days Past Due | 60-89 Days Past Due | 90 Days or More Past Due | Total | |||||||||||||||||||||||||
| 1-4 single family residential | $ | $ | $ | $ | $ | ||||||||||||||||||||||||
| Government insured residential | |||||||||||||||||||||||||||||
| C&I | |||||||||||||||||||||||||||||
| Franchise finance | |||||||||||||||||||||||||||||
| $ | $ | $ | $ | $ | |||||||||||||||||||||||||
The following tables summarizes loans that were modified since January 1, 2023, the date of adoption of ASU 2022-02, and subsequently defaulted, during the periods indicated (in thousands):
| Year Ended December 31, 2023 | |||||||||||||||||||||||
| Interest Rate Reduction | Term Extension | Combination - Interest Rate Reduction and Term Extension | Total | ||||||||||||||||||||
| 1-4 single family residential | $ | $ | $ | $ | |||||||||||||||||||
| Government insured residential | |||||||||||||||||||||||
| $ | $ | $ | $ | ||||||||||||||||||||
107
Table of Contents
BANKUNITED, INC. AND SUBSIDIARIES
NOTES TO CONSOLIDATED FINANCIAL STATEMENTS
December 31, 2023
Geographic Concentrations
The following table presents the five states with the largest geographic concentrations of 1-4 single family residential loans, excluding government insured residential loans, at the dates indicated (dollars in thousands):
| December 31, 2023 | December 31, 2022 | ||||||||||||||||||||||
| Total | Percent of Total | Total | Percent of Total | ||||||||||||||||||||
| California | $ | % | $ | % | |||||||||||||||||||
| New York | % | % | |||||||||||||||||||||
| Florida | % | % | |||||||||||||||||||||
| Illinois | % | % | |||||||||||||||||||||
| Virginia | % | % | |||||||||||||||||||||
| Others | % | % | |||||||||||||||||||||
| $ | % | $ | % | ||||||||||||||||||||
The following table presents the largest geographic concentrations of commercial loans at the dates indicated. Commercial real estate loans are categorized based on the location of the underlying collateral, while all other commercial loans are generally categorized based on the location of the borrowers' businesses (dollars in thousands):
| December 31, 2023 | December 31, 2022 | ||||||||||||||||||||||||||||||||||||||||||||||
| Commercial Real Estate | Percent of Total | All Other Commercial | Percent of Total | Commercial Real Estate | Percent of Total | All Other Commercial | Percent of Total | ||||||||||||||||||||||||||||||||||||||||
| Florida | $ | % | $ | % | $ | % | $ | % | |||||||||||||||||||||||||||||||||||||||
| New York Tri-state | % | % | % | % | |||||||||||||||||||||||||||||||||||||||||||
California | % | % | |||||||||||||||||||||||||||||||||||||||||||||
Other | % | % | % | % | |||||||||||||||||||||||||||||||||||||||||||
| $ | % | $ | % | $ | % | $ | % | ||||||||||||||||||||||||||||||||||||||||
No state other than those detailed in the table represented more than 5% of either commercial real estate or other commercial loans at either date presented.
Disclosures Prescribed by Legacy GAAP (Before Adoption of ASU 2022-02) for Prior Periods
The following table summarizes loans that were modified in TDRs during the periods indicated, as well as loans modified during the twelve months preceding December 31, 2022 and 2021 that experienced payment defaults during the periods indicated (dollars in thousands):
| Year Ended December 31, 2022 | Year Ended December 31, 2021 | ||||||||||||||||||||||||||||||||||||||||||||||
| Loans Modified in TDRs During the Period | TDRs Experiencing Payment Defaults During the Period | Loans Modified in TDRs During the Period | TDRs Experiencing Payment Defaults During the Period | ||||||||||||||||||||||||||||||||||||||||||||
| Number of TDRs | Amortized Cost | Number of TDRs | Amortized Cost | Number of TDRs | Amortized Cost | Number of TDRs | Amortized Cost | ||||||||||||||||||||||||||||||||||||||||
| 1-4 single family residential | $ | $ | $ | $ | |||||||||||||||||||||||||||||||||||||||||||
| Government insured residential | |||||||||||||||||||||||||||||||||||||||||||||||
CRE | |||||||||||||||||||||||||||||||||||||||||||||||
| C&I | |||||||||||||||||||||||||||||||||||||||||||||||
Franchise finance | |||||||||||||||||||||||||||||||||||||||||||||||
| $ | $ | $ | $ | ||||||||||||||||||||||||||||||||||||||||||||
108
Table of Contents
BANKUNITED, INC. AND SUBSIDIARIES
NOTES TO CONSOLIDATED FINANCIAL STATEMENTS
December 31, 2023
TDRs during the years ended December 31, 2022 and 2021 generally included interest rate reductions and extensions of maturity. Included in TDRs are residential loans to borrowers who have not reaffirmed their debt discharged in Chapter 7 bankruptcy. The total amount of such loans is not material.
For the year ended December 31, 2021, certain loan modifications that otherwise may have been reported as TDRs and that were within the scope of the CARES Act and interagency regulatory guidance issued in response to the COVID-19 pandemic were not reported as TDRs.
Note 5 Leases
Leases under which the Company is the lessee
The Company leases branches, office space and a small amount of equipment under either operating or finance leases with remaining terms ranging from one to 12 years, some of which include extension options.
The following table presents ROU assets and lease liabilities at the dates indicated (in thousands):
| December 31, 2023 | December 31, 2022 | ||||||||||
| ROU assets: | |||||||||||
| Operating leases | $ | $ | |||||||||
| Finance leases | |||||||||||
| $ | $ | ||||||||||
| Lease liabilities: | |||||||||||
| Operating leases | $ | $ | |||||||||
| Finance leases | |||||||||||
| $ | $ | ||||||||||
ROU assets and lease liabilities for operating leases are included in "" and "", respectively, in the accompanying consolidated balance sheets. ROU assets and lease liabilities for finance leases are included in "" and "", respectively.
The weighted average remaining lease term and weighted average discount rate at the dates indicated were:
| December 31, 2023 | December 31, 2022 | ||||||||||
| Weighted average remaining lease term: | |||||||||||
| Operating leases | |||||||||||
| Finance leases | |||||||||||
| Weighted average discount rate: | |||||||||||
| Operating leases | % | % | |||||||||
| Finance leases | % | % | |||||||||
109
Table of Contents
BANKUNITED, INC. AND SUBSIDIARIES
NOTES TO CONSOLIDATED FINANCIAL STATEMENTS
December 31, 2023
The following table presents the components of lease expense for the periods indicated (in thousands):
| Years Ended December 31, | |||||||||||||||||
| 2023 | 2022 | 2021 | |||||||||||||||
| Operating lease cost: | |||||||||||||||||
| Fixed costs | $ | $ | $ | ||||||||||||||
| Impairment of ROU assets | |||||||||||||||||
| Total operating lease cost | $ | $ | $ | ||||||||||||||
| Finance lease cost: | |||||||||||||||||
| Amortization of ROU assets | $ | $ | $ | ||||||||||||||
| Interest on lease liabilities | |||||||||||||||||
| Total finance lease cost | $ | $ | $ | ||||||||||||||
| Variable lease cost | $ | $ | $ | ||||||||||||||
Short-term lease costs were immaterial for the years ended December 31, 2023, 2022 and 2021.
The following table presents additional information related to operating and finance leases for the dates and periods indicated (in thousands):
| Years Ended December 31, | |||||||||||||||||
| 2023 | 2022 | 2021 | |||||||||||||||
| Cash paid for amounts included in the measurement of lease liabilities: | |||||||||||||||||
| Operating cash flows from finance leases | $ | $ | $ | ||||||||||||||
| Operating cash flows from operating leases | |||||||||||||||||
| Financing cash flows from finance leases | |||||||||||||||||
| $ | $ | $ | |||||||||||||||
| Lease liabilities recognized from obtaining ROU assets: | |||||||||||||||||
| Operating leases | $ | $ | $ | ||||||||||||||
Future lease payment obligations under leases with terms in excess of one year and a reconciliation to lease liabilities as of December 31, 2023 were as follows (in thousands):
| Operating Leases | Finance Leases | Total | |||||||||||||||
| Years ending December 31: | |||||||||||||||||
| 2024 | $ | $ | $ | ||||||||||||||
| 2025 | |||||||||||||||||
| 2026 | |||||||||||||||||
| 2027 | |||||||||||||||||
| 2028 | |||||||||||||||||
| Thereafter | |||||||||||||||||
| Total future minimum lease payments | |||||||||||||||||
| Less: interest component | ( | ( | ( | ||||||||||||||
| Lease liabilities | $ | $ | $ | ||||||||||||||
110
Table of Contents
BANKUNITED, INC. AND SUBSIDIARIES
NOTES TO CONSOLIDATED FINANCIAL STATEMENTS
December 31, 2023
Leases under which the Company is the lessor
Direct or Sales Type Financing Leases
The following table presents the components of the investment in direct or sales type financing leases, included in loans in the consolidated balance sheets at the dates indicated (in thousands):
| December 31, 2023 | December 31, 2022 | ||||||||||
| Total minimum lease payments to be received | $ | $ | |||||||||
| Estimated unguaranteed residual value of leased assets | |||||||||||
| Gross investment in direct or sales type financing leases | |||||||||||
| Unearned income | ( | ( | |||||||||
| Initial direct costs | |||||||||||
| $ | $ | ||||||||||
At December 31, 2023, future minimum lease payments to be received under direct or sales type financing leases were as follows (in thousands):
| Years Ending December 31: | |||||
| 2024 | $ | ||||
| 2025 | |||||
| 2026 | |||||
| 2027 | |||||
| 2028 | |||||
| Thereafter | |||||
| $ | |||||
Operating Lease Equipment
Operating lease equipment consists primarily of railcars, non-commercial aircraft and other transportation equipment leased to commercial end users. Original lease terms generally range from three to fifteen years. Asset risk is evaluated and managed by a dedicated internal staff of seasoned equipment finance professionals with a broad depth and breadth of experience in the leasing business. The Company has partnered with an industry leading, experienced service provider who provides fleet management and servicing relating to the railcar fleet. Residual risk is managed by setting appropriate residual values at inception and systematic reviews of residual values based on independent appraisals, performed at least annually.
The following table presents the components of operating lease equipment at the dates indicated (in thousands):
| December 31, 2023 | December 31, 2022 | ||||||||||
| Operating lease equipment | $ | $ | |||||||||
| Less: accumulated depreciation | ( | ( | |||||||||
| Operating lease equipment, net | $ | $ | |||||||||
The Company did not recognize any impairment during the years ended December 31, 2023 and 2022. Impairment was recognized in the amount of $2.8 million during the year ended December 31, 2021. These impairment charges are included in "depreciation and impairment of operating lease equipment" in the accompanying consolidated statements of income.
111
Table of Contents
BANKUNITED, INC. AND SUBSIDIARIES
NOTES TO CONSOLIDATED FINANCIAL STATEMENTS
December 31, 2023
At December 31, 2023, scheduled minimum rental payments under operating leases were as follows (in thousands):
| Years Ending December 31: | |||||
| 2024 | $ | ||||
| 2025 | |||||
| 2026 | |||||
| 2027 | |||||
| 2028 | |||||
| Thereafter | |||||
| $ | |||||
The following table summarizes income recognized for operating and direct or sales type finance leases for the periods indicated (in thousands):
| Years Ended December 31, | |||||||||||||||||||||||
| 2023 | 2022 | 2021 | Location of Lease Income on Consolidated Statements of Income | ||||||||||||||||||||
| Operating leases | $ | $ | $ | ||||||||||||||||||||
| Direct or sales type finance leases | |||||||||||||||||||||||
| $ | $ | $ | |||||||||||||||||||||
Note 6 Deposits
The following table presents average balances and weighted average rates paid on deposits for the periods indicated (dollars in thousands):
| Years Ended December 31, | |||||||||||||||||||||||||||||||||||
| 2023 | 2022 | 2021 | |||||||||||||||||||||||||||||||||
| Average Balance | Average Rate Paid | Average Balance | Average Rate Paid | Average Balance | Average Rate Paid | ||||||||||||||||||||||||||||||
| Demand deposits: | |||||||||||||||||||||||||||||||||||
| Non-interest bearing | $ | % | $ | % | $ | % | |||||||||||||||||||||||||||||
| Interest bearing | % | % | % | ||||||||||||||||||||||||||||||||
| Savings and money market | % | % | % | ||||||||||||||||||||||||||||||||
| Time | % | % | % | ||||||||||||||||||||||||||||||||
| $ | % | $ | % | $ | % | ||||||||||||||||||||||||||||||
Time deposit accounts with balances greater than $250,000 totaled $941 million and $730 million at December 31, 2023 and 2022, respectively.
112
Table of Contents
BANKUNITED, INC. AND SUBSIDIARIES
NOTES TO CONSOLIDATED FINANCIAL STATEMENTS
December 31, 2023
The following table presents maturities of time deposits as of December 31, 2023 (in thousands):
| Maturing in: | |||||
| 2024 | $ | ||||
| 2025 | |||||
| 2026 | |||||
| 2027 | |||||
| 2028 | |||||
| $ | |||||
Included in deposits at December 31, 2023, are public funds deposits of $3.1 billion and brokered deposits of $5.3 billion. Investment securities AFS with a carrying value of $794 million and a FHLB letter of credit in the amount of $900 million, were pledged as security for public funds deposits at December 31, 2023.
Interest expense on deposits for the periods indicated was as follows (in thousands):
| Years Ended December 31, | |||||||||||||||||
| 2023 | 2022 | 2021 | |||||||||||||||
| Interest bearing demand | $ | $ | $ | ||||||||||||||
| Savings and money market | |||||||||||||||||
| Time | |||||||||||||||||
| $ | $ | $ | |||||||||||||||
Certain of our depositors participate in various customer rebate programs. During the years ended December 31, 2023, 2022 and 2021, deposit costs related to these programs totaled $44.2 million, $15.4 million and $8.1 million, respectively. These expenses are included in "other non-interest expense" in the accompanying consolidated statements of income.
Note 7 Borrowings
The following table presents information about outstanding FHLB advances as of December 31, 2023 (dollars in thousands):
| Range of Interest Rates | |||||||||||||||||||||||
| Amount | Minimum | Maximum | Weighted Average Rate | ||||||||||||||||||||
| Maturing in: | |||||||||||||||||||||||
| 2023 - One month or less | $ | % | % | % | |||||||||||||||||||
| 2023 - Over one month | % | % | % | ||||||||||||||||||||
| Total contractual balance outstanding | $ | ||||||||||||||||||||||
The table above reflects contractual maturities and rates of outstanding advances and does not incorporate the impact that interest rate derivatives have on the duration or cost of borrowings.
The terms of the Company's security agreement with the FHLB require a specific assignment of collateral consisting of qualifying first mortgage loans, commercial real estate loans and mortgage-backed securities with unpaid principal amounts discounted at various stipulated percentages at least equal to 100% of outstanding FHLB advances. As of December 31, 2023, the Company had pledged investment securities and real estate loans with an aggregate carrying amount of approximately $14.6 billion as collateral for advances and letters of credit from the FHLB.
113
Table of Contents
BANKUNITED, INC. AND SUBSIDIARIES
NOTES TO CONSOLIDATED FINANCIAL STATEMENTS
December 31, 2023
Notes and other borrowings consisted of the following at the dates indicated (dollars in thousands):
| December 31, 2023 | December 31, 2022 | ||||||||||
| Senior notes: | |||||||||||
Principal amount of | $ | $ | |||||||||
| Unamortized discount and debt issuance costs | ( | ( | |||||||||
| Subordinated notes: | |||||||||||
Principal amount of | |||||||||||
| Unamortized discount and debt issuance costs | ( | ( | |||||||||
| Total notes | |||||||||||
| Finance leases | |||||||||||
| Notes and other borrowings | $ | $ | |||||||||
The senior notes pay interest semiannually and have an effective interest rate of 5.12 %, after consideration of issuance discount and costs. The notes may be redeemed by the Company, in whole or in part, at any time prior to August 17, 2025 at the greater of a) 100% of the principal balance or b) the sum of the present values of the remaining scheduled payments of principal and interest on the securities discounted to the redemption date at i) the rate on a United States Treasury security with a maturity comparable to the remaining maturity of the senior notes that would be used to price new issues of corporate debt securities with a maturity comparable to the remaining maturity of the senior notes plus ii) 40 basis points. The senior notes may be redeemed at any time after August 17, 2025 at 100% of principal plus accrued and unpaid interest.
The subordinated notes pay interest semiannually and have an effective interest rate of 5.39 %, after consideration of issuance discount and costs. The notes may be redeemed by the Company, in whole or in part, on or after March 11, 2030 at a redemption price equal to 100% of the principal amount being redeemed plus accrued and unpaid interest, subject to the approval of the Federal Reserve. The notes qualify as Tier 2 capital for regulatory capital purposes, subject to applicable limitations.
At December 31, 2023, BankUnited had available borrowing capacity at the FHLB of approximately $4.6 billion and unused borrowing capacity at the FRB of approximately $7.4 billion.
Note 8 Premises, Equipment and Software
Premises and equipment and capitalized software costs are included in other assets in the accompanying consolidated balance sheets and are summarized as follows at the dates indicated (in thousands):
| December 31, 2023 | December 31, 2022 | ||||||||||
| Buildings and improvements | $ | $ | |||||||||
| Leasehold improvements | |||||||||||
| Furniture, fixtures and equipment | |||||||||||
| Computer equipment | |||||||||||
Software | |||||||||||
| Aircraft and automobiles | |||||||||||
| Less: accumulated depreciation | ( | ( | |||||||||
| Premises, equipment and software, net | $ | $ | |||||||||
114
Table of Contents
BANKUNITED, INC. AND SUBSIDIARIES
NOTES TO CONSOLIDATED FINANCIAL STATEMENTS
December 31, 2023
Depreciation and amortization expense related to premises, equipment and software was $18.7 million, $17.5 million and $16.7 million for the years ended December 31, 2023, 2022 and 2021, respectively.
Note 9 Income Taxes
The components of the provision for income taxes were as follows for the periods indicated (in thousands):
| Years Ended December 31, | |||||||||||||||||
| 2023 | 2022 | 2021 | |||||||||||||||
| Current: | |||||||||||||||||
| Federal | $ | $ | $ | ||||||||||||||
| State | ( | ||||||||||||||||
| Deferred: | |||||||||||||||||
| Federal | ( | ( | |||||||||||||||
| State | ( | ( | |||||||||||||||
| ( | ( | ||||||||||||||||
| $ | $ | $ | |||||||||||||||
A reconciliation of expected income tax expense at the statutory federal income tax rate of 21% to the Company's effective income tax rate for the periods indicated follows (dollars in thousands):
| Years Ended December 31, | |||||||||||||||||||||||||||||||||||
| 2023 | 2022 | 2021 | |||||||||||||||||||||||||||||||||
| Amount | Percent | Amount | Percent | Amount | Percent | ||||||||||||||||||||||||||||||
Tax expense calculated at the statutory federal income tax rate | $ | % | $ | % | $ | % | |||||||||||||||||||||||||||||
| Increases (decreases) resulting from: | |||||||||||||||||||||||||||||||||||
| Income not subject to tax | ( | ( | % | ( | ( | % | ( | ( | % | ||||||||||||||||||||||||||
| State income taxes, net of federal tax benefit | % | % | % | ||||||||||||||||||||||||||||||||
Uncertain tax positions - lapse of statute of limitations | ( | ( | % | ( | ( | % | ( | ( | % | ||||||||||||||||||||||||||
Uncertain tax positions - interest | % | % | % | ||||||||||||||||||||||||||||||||
| Discrete income tax benefit | % | % | ( | ( | % | ||||||||||||||||||||||||||||||
| Other, net | % | ( | ( | % | ( | ( | % | ||||||||||||||||||||||||||||
| $ | % | $ | % | $ | % | ||||||||||||||||||||||||||||||
115
Table of Contents
BANKUNITED, INC. AND SUBSIDIARIES
NOTES TO CONSOLIDATED FINANCIAL STATEMENTS
December 31, 2023
During the year ended December 31, 2021, the Bank reached a settlement with the Florida Department of Revenue related to certain tax matters for the 2009-2019 tax years and recorded a tax benefit of $43.9 million, net of federal impact.
The components of deferred tax assets and liabilities were as follows at the dates indicated (in thousands):
| December 31, 2023 | December 31, 2022 | ||||||||||
| Deferred tax assets: | |||||||||||
Excess of tax basis over carrying value of loans | $ | $ | |||||||||
| Allowance for credit losses | |||||||||||
| Net unrealized loss on investment securities available for sale and cash flow hedges | |||||||||||
| Capitalized costs | |||||||||||
| Lease liability | |||||||||||
| Deferred compensation | |||||||||||
| Accrued expenses | |||||||||||
| Other | |||||||||||
| Gross deferred tax assets | |||||||||||
| Deferred tax liabilities: | |||||||||||
| Lease financing, due to differences in depreciation | |||||||||||
| ROU asset | |||||||||||
| Other | |||||||||||
| Gross deferred tax liabilities | |||||||||||
Net deferred tax asset | $ | $ | |||||||||
Based on the evaluation of available evidence, the Company has concluded that it is more likely than not that the existing deferred tax assets will be realized. The primary factors supporting this conclusion are the Company's history of reported pre-tax income and the amount of future taxable income that will result from the scheduled reversal of existing deferred tax liabilities.
At December 31, 2023, remaining net operating loss and tax credit carryforwards included Florida net operating loss carryforwards in the amount of $108.6 million. Florida net operating loss carryforwards consisted of $90.9 million expiring from 2030 through 2037 and $17.7 million that can be carried forward indefinitely.
The Company has investments in affordable housing limited partnerships which generate federal Low Income Housing Tax Credits and other tax benefits. The balance of these investments, included in other assets in the accompanying consolidated balance sheet, was $111 million and $100 million at December 31, 2023 and 2022, respectively. Unfunded commitments for affordable housing investments, included in other liabilities in the accompanying consolidated balance sheet, were $77 million and $62 million at December 31, 2023 and 2022, respectively. The maximum exposure to loss as a result of the Company's involvement with these limited partnerships at December 31, 2023, was approximately $164 million. While the Company believes the likelihood of potential losses from these investments is remote, the maximum exposure was determined by assuming a scenario where the projects completely fail and do not meet certain government compliance requirements resulting in recapture of the related tax credits and full impairment of the remaining unamortized investment. These investments did not have a material impact on income tax expense for the years ended December 31, 2023, 2022 and 2021.
116
Table of Contents
BANKUNITED, INC. AND SUBSIDIARIES
NOTES TO CONSOLIDATED FINANCIAL STATEMENTS
December 31, 2023
The Company has a liability for unrecognized tax benefits relating to uncertain federal and state tax positions in several jurisdictions. A reconciliation of the beginning and ending amount of gross unrecognized tax benefits at the dates indicated follows (in thousands):
| December 31, 2023 | December 31, 2022 | December 31, 2021 | |||||||||||||||
| Balance, beginning of period | $ | $ | $ | ||||||||||||||
| Additions for tax positions related to the current year | |||||||||||||||||
| Additions for tax positions related to prior periods | |||||||||||||||||
| Reductions due to settlements with taxing authorities | ( | ( | |||||||||||||||
| Reductions due to lapse of the statute of limitations | ( | ( | ( | ||||||||||||||
| Interest and penalties | ( | ||||||||||||||||
| Balance, end of period | $ | $ | $ | ||||||||||||||
As of December 31, 2023, 2022 and 2021, the Company had $343.8 million, $342.6 million and $329.3 million, respectively, of unrecognized federal and state tax benefits, net of federal tax benefits, that if recognized would have impacted the effective tax rate. Unrecognized tax benefits related to federal and state income tax contingencies that may decrease during the 12 months subsequent to December 31, 2023, as a result of settlements with taxing authorities range from zero to $334.7 million.
Interest and penalties related to unrecognized tax benefits are included in the provision for income taxes in the consolidated statements of income. At December 31, 2023 and 2022, accrued interest and penalties included in the consolidated balance sheets, net of federal tax benefits, were $26.4 million and $16.5 million, respectively. The total amount of interest and penalties, net of federal tax benefits, recognized through income tax expense was $10.0 million, $5.9 million and $(5.7 ) million during the years ended December 31, 2023, 2022 and 2021, respectively.
The Company and its subsidiaries file a consolidated federal income tax return as well as combined state income tax returns where combined filings are required. The federal tax returns for years 2018 through 2022, remain subject to examination in the U.S. Federal jurisdiction. State tax returns for years 2018 through 2022, remain subject to examination by certain states.
Note 10 Derivative Financial Instruments
Derivatives designated as hedging instruments
The Company has entered into interest rate swaps, caps and collars designated as cash flow hedges with the objective of limiting the variability of interest payment cash flows. The Company has also entered into interest rate swaps designated as fair value hedges designed to hedge changes in the fair value of outstanding fixed rate instruments caused by fluctuations in the benchmark interest rate. Changes in fair value of derivative instruments designated as cash flow hedges are reported in accumulated other comprehensive income. Changes in the fair value of derivative instruments designated as fair value hedges are recognized in earnings, as is the offsetting gain or loss on the hedged item.
117
Table of Contents
BANKUNITED, INC. AND SUBSIDIARIES
NOTES TO CONSOLIDATED FINANCIAL STATEMENTS
December 31, 2023
The following table summarizes the Company's derivatives designated as hedging instruments as of the dates indicated (in thousands):
| December 31, 2023 | December 31, 2022 | ||||||||||||||||||||||||||||||||||
| Notional Amount | Fair Value(1) | Notional Amount | Fair Value(1) | ||||||||||||||||||||||||||||||||
| Asset | Liability | Asset | Liability | ||||||||||||||||||||||||||||||||
| Derivatives designated as cash flow hedges: | |||||||||||||||||||||||||||||||||||
| Interest rate swaps | $ | $ | $ | ( | $ | $ | $ | ( | |||||||||||||||||||||||||||
| Interest rate caps purchased | |||||||||||||||||||||||||||||||||||
Interest rate collar | ( | ||||||||||||||||||||||||||||||||||
| Derivatives designated as fair value hedges: | |||||||||||||||||||||||||||||||||||
| Pay-fixed interest rate swaps | |||||||||||||||||||||||||||||||||||
| $ | $ | $ | ( | $ | $ | $ | ( | ||||||||||||||||||||||||||||
(1) The fair values of derivatives are included in other assets or other liabilities in the consolidated balance sheets.
Derivatives designated as cash flow hedges
The following table provides information about the amount of gain (loss) related to derivatives designated as cash flow hedges reclassified from AOCI into interest income or expense for the periods indicated (in thousands):
| Years Ended December 31, | |||||||||||||||||
| 2023 | 2022 | 2021 | |||||||||||||||
| Location of gain (loss) reclassified from AOCI into income: | |||||||||||||||||
| $ | $ | ( | $ | ( | |||||||||||||
| ( | ( | ||||||||||||||||
| $ | $ | $ | ( | ||||||||||||||
During the years ended December 31, 2023 and 2022, no derivative positions designated as cash flow hedges were discontinued and none of the gains and losses reported in AOCI were reclassified into earnings as a result of the discontinuance of cash flow hedges or because of the early extinguishment of debt. During the year ended December 31, 2021, derivative positions designated as cash flow hedges with a notional amount totaling $401 million were discontinued following the Company's determination that the hedged forecasted transactions were not probable of occurring. A loss of $33.4 million, net of tax, was reclassified from AOCI into earnings as a result of the discontinuance of the cash flow hedges.
As of December 31, 2023, the amount of net gain expected to be reclassified from AOCI into earnings during the next twelve months was $38.4 million, based on the forward curve. See Note 11 to the consolidated financial statements for additional information about the reclassification adjustments from AOCI into earnings.
Derivatives designated as fair value hedges
The amount of gain (loss) related to derivatives designated as fair value hedges recognized in earnings was insignificant for all applicable periods. The following table provides information about the hedged items related to derivatives designated as fair value hedges at the date indicated (in thousands):
| December 31, 2023 | December 31, 2022 | Location in Consolidated Balance Sheets | |||||||||||||||
| $ | $ | Loans | |||||||||||||||
| $ | ( | $ | ( | Loans | |||||||||||||
(1)This amount is included in the amortized cost basis of a closed portfolio of loans used to designate hedging relationships in a portfolio layer method hedge in which the hedged item is anticipated to be outstanding for the designated hedge period. The amortized cost basis of the closed portfolio used in this hedging relationship was $992 million and $1 billion, respectively, at December 31, 2023 and 2022.
118
Table of Contents
BANKUNITED, INC. AND SUBSIDIARIES
NOTES TO CONSOLIDATED FINANCIAL STATEMENTS
December 31, 2023
Derivatives not designated as hedging instruments
The Company enters into interest rate derivative contracts with certain of its commercial borrowers to enable those borrowers to manage their exposure to interest rate fluctuations. To mitigate interest rate risk associated with these derivative contracts, the Company enters into offsetting derivative contract positions with primary dealers. These interest rate derivative contracts are not designated as hedging instruments; therefore, changes in the fair value of these derivatives are recognized immediately in earnings. The impact on earnings related to changes in fair value of these derivatives was $8.7 million, $4.7 million, and $6.6 million for the years ended December 31, 2023, 2022 and 2021, respectively.
The Company may be exposed to credit risk in the event of non-performance by the counterparties to its interest rate derivative agreements. The Company assesses the credit risk of its financial institution counterparties by monitoring publicly available credit rating and financial information. The Company manages dealer credit risk by entering into interest rate derivatives only with primary and highly rated counterparties, the use of ISDA master agreements, central clearing mechanisms and counterparty limits. The agreements contain bilateral collateral arrangements with the amount of collateral to be posted generally governed by the settlement value of outstanding swaps. The Company manages the risk of default by its commercial borrower counterparties through its normal loan underwriting and credit monitoring policies and procedures. The Company does not currently anticipate any significant losses from failure of interest rate derivative counterparties to honor their obligations.
The following table summarizes the Company's derivatives not designated as hedging instruments as of the dates indicated (in thousands):
| December 31, 2023 | December 31, 2022 | ||||||||||||||||||||||||||||||||||
| Notional Amount | Fair Value(1) | Notional Amount | Fair Value(1) | ||||||||||||||||||||||||||||||||
| Asset | Liability | Asset | Liability | ||||||||||||||||||||||||||||||||
| Derivatives not designated as hedges: | |||||||||||||||||||||||||||||||||||
| Pay-fixed interest rate swaps | $ | $ | $ | ( | $ | $ | $ | ( | |||||||||||||||||||||||||||
| Pay-variable interest rate swaps | ( | ( | |||||||||||||||||||||||||||||||||
| Interest rate caps purchased | |||||||||||||||||||||||||||||||||||
| Interest rate caps sold | ( | ( | |||||||||||||||||||||||||||||||||
| $ | $ | $ | ( | $ | $ | $ | ( | ||||||||||||||||||||||||||||
(1) Fair values of these derivatives are included in other assets and other liabilities in the consolidated balance sheets.
Some of the Company’s ISDA master agreements with financial institution counterparties contain provisions that permit either counterparty to terminate the agreements and require settlement in the event that regulatory capital ratios fall below certain designated thresholds, upon the initiation of other defined regulatory actions or upon suspension or withdrawal of the Bank’s credit rating. Currently, there are no circumstances that would trigger these provisions of the agreements.
Master netting agreements
The Company does not offset assets and liabilities under master netting agreements for financial reporting purposes. Information on interest rate swaps and caps subject to these agreements is as follows at the dates indicated (in thousands):
| December 31, 2023 | |||||||||||||||||||||||||||||||||||
| Gross Amounts Offset in Balance Sheet | Net Amounts Presented in Balance Sheet | Gross Amounts Not Offset in Balance Sheet | |||||||||||||||||||||||||||||||||
| Gross Amounts Recognized | Derivative Instruments | Collateral Pledged | Net Amount | ||||||||||||||||||||||||||||||||
| Derivative assets | $ | $ | $ | $ | ( | $ | ( | $ | |||||||||||||||||||||||||||
| Derivative liabilities | ( | ( | |||||||||||||||||||||||||||||||||
| $ | $ | $ | $ | $ | ( | $ | |||||||||||||||||||||||||||||
119
Table of Contents
BANKUNITED, INC. AND SUBSIDIARIES
NOTES TO CONSOLIDATED FINANCIAL STATEMENTS
December 31, 2023
| December 31, 2022 | |||||||||||||||||||||||||||||||||||
| Gross Amounts Offset in Balance Sheet | Net Amounts Presented in Balance Sheet | Gross Amounts Not Offset in Balance Sheet | |||||||||||||||||||||||||||||||||
| Gross Amounts Recognized | Derivative Instruments | Collateral Pledged | Net Amount | ||||||||||||||||||||||||||||||||
| Derivative assets | $ | $ | $ | $ | ( | $ | ( | $ | |||||||||||||||||||||||||||
| Derivative liabilities | ( | ( | |||||||||||||||||||||||||||||||||
| $ | $ | $ | $ | $ | ( | $ | |||||||||||||||||||||||||||||
The difference between the amounts reported for interest rate swaps subject to master netting agreements and the total fair value of interest rate contract derivative financial instruments reported in the consolidated balance sheets is related to interest rate derivative contracts not subject to master netting agreements.
Risk Participation Agreements
The Company purchases and sells credit protection under RPAs with the objective of sharing with financial institution counterparties some of the credit exposure related to interest rate derivative contracts entered into with commercial borrowers related to participations purchased or sold. The Company will make or receive payments under these agreements if a customer defaults on an obligation to perform under certain interest rate derivative contracts. At December 31, 2023 and 2022, the notional amount of the RPAs was $363 million and $202 million, respectively. The fair value of these derivatives was not material at December 31, 2023 and 2022.
Note 11 Stockholders’ Equity
Accumulated Other Comprehensive Income
Changes in accumulated other comprehensive income are summarized as follows for the periods indicated (in thousands):
| Year Ended December 31, 2023 | |||||||||||||||||
| Before Tax | Tax Effect | Net of Tax | |||||||||||||||
Change in net unrealized losses on investment securities available for sale: | |||||||||||||||||
Net unrealized holding gain (loss) arising during the period | $ | $ | ( | $ | |||||||||||||
Amounts reclassified to gain on investment securities available for sale, net | ( | ( | |||||||||||||||
Net change in unrealized losses on investment securities available for sale | ( | ||||||||||||||||
Change in net unrealized gain on derivative instruments: | |||||||||||||||||
Net unrealized holding gain (loss) arising during the period | ( | ||||||||||||||||
| Amounts reclassified to interest expense on deposits | ( | ( | |||||||||||||||
Amounts reclassified to interest expense on borrowings | ( | ( | |||||||||||||||
| Amounts reclassified to interest income on loans | ( | ||||||||||||||||
Net change in unrealized gains on derivative instruments | ( | ( | |||||||||||||||
Other comprehensive income | $ | $ | ( | $ | |||||||||||||
120
Table of Contents
BANKUNITED, INC. AND SUBSIDIARIES
NOTES TO CONSOLIDATED FINANCIAL STATEMENTS
December 31, 2023
| Year Ended December 31, 2022 | |||||||||||||||||
| Before Tax | Tax Effect | Net of Tax | |||||||||||||||
Change in net unrealized losses on investment securities available for sale: | |||||||||||||||||
Net unrealized holding loss arising during the period | $ | ( | $ | $ | ( | ||||||||||||
Amounts reclassified to gain on investment securities available for sale, net | ( | ( | |||||||||||||||
| Net change in unrealized losses on investment securities available for sale | ( | ( | |||||||||||||||
Change in net unrealized gains on derivative instruments: | |||||||||||||||||
Net unrealized holding gain arising during the period | ( | ||||||||||||||||
| Amounts reclassified to interest expense on deposits | ( | ( | |||||||||||||||
| Amounts reclassified to interest expense on borrowings | ( | ||||||||||||||||
| Amounts reclassified to interest income on loans | ( | ||||||||||||||||
Net change in unrealized gains on derivative instruments | ( | ||||||||||||||||
Other comprehensive loss | $ | ( | $ | $ | ( | ||||||||||||
Year Ended December 31, 2021 | |||||||||||||||||
| Before Tax | Tax Effect | Net of Tax | |||||||||||||||
Change in net unrealized gains on investment securities available for sale: | |||||||||||||||||
Net unrealized holding loss arising during the period | $ | ( | $ | $ | ( | ||||||||||||
Amounts reclassified to gain on investment securities available for sale, net | ( | ( | |||||||||||||||
Net change in unrealized gains on investment securities available for sale | ( | ( | |||||||||||||||
Change in net unrealized losses on derivative instruments: | |||||||||||||||||
Net unrealized holding gain arising during the period | ( | ||||||||||||||||
| Amounts reclassified to interest expense on borrowings | ( | ||||||||||||||||
| Reclassification adjustment for discontinuance of cash flow hedges | ( | ||||||||||||||||
Net change in unrealized losses on derivative instruments | ( | ||||||||||||||||
| Other comprehensive income | $ | $ | ( | $ | |||||||||||||
The categories of AOCI and changes therein are presented below for the periods indicated (in thousands):
| Unrealized Gain (Loss) on Investment Securities Available for Sale | Unrealized Gain (Loss) on Derivative Instruments | Total | |||||||||||||||
| Balance at December 31, 2020 | $ | $ | ( | $ | ( | ||||||||||||
Other comprehensive income | ( | ||||||||||||||||
| Balance at December 31, 2021 | ( | ( | |||||||||||||||
Other comprehensive loss | ( | ( | |||||||||||||||
| Balance at December 31, 2022 | ( | ( | |||||||||||||||
Other comprehensive income | ( | ||||||||||||||||
| Balance at December 31, 2023 | $ | ( | $ | $ | ( | ||||||||||||
Note 12 Equity Based and Other Compensation Plans
Description of Equity Based Compensation Plans
In 2023, the Board of Directors and the Company's stockholders approved the 2023 Plan. The number of shares initially authorized for grant under the 2023 Plan was 1,900,000 shares. Shares remaining under the 2014 Plan as of the effective date of the 2023 Plan were transferred to the 2023 Plan, and are also available for issuance under the 2023 Plan. Previously, awards were administered under the 2014 Plan or the 2010 Plan. The Plans are administered by the Board of Directors or a committee
121
Table of Contents
BANKUNITED, INC. AND SUBSIDIARIES
NOTES TO CONSOLIDATED FINANCIAL STATEMENTS
December 31, 2023
thereof and provide for the grant of non-qualified stock options, SARs, restricted shares, deferred shares, performance shares, unrestricted shares and other share-based awards to selected employees, directors or independent contractors of the Company and its affiliates. As of December 31, 2023, no further awards are available for issuance under the 2010 and 2014 plans although unvested awards issued under these Plans are still outstanding. The number of shares of common stock authorized for award under the 2023 Plan, including those transferred from the 2014 Plan, is 3,766,764 , of which 2,472,999 shares remain available for issuance as of December 31, 2023. Shares of common stock delivered under the plans may consist of authorized but unissued shares or previously issued shares reacquired by the Company. Unvested awards become fully vested in the event of a change in control, subject to a double trigger, as defined.
Compensation Expense Related to Equity Based Awards
The following table summarizes compensation cost related to equity based awards for the periods indicated (in thousands):
| Years Ended December 31, | |||||||||||||||||
| 2023 | 2022 | 2021 | |||||||||||||||
| Compensation cost of equity based awards: | |||||||||||||||||
| RSAs | $ | $ | $ | ||||||||||||||
| Executive share-based awards | |||||||||||||||||
| Non-executive RSUs | |||||||||||||||||
| Total compensation cost of equity based awards | |||||||||||||||||
| Related tax benefits | ( | ( | ( | ||||||||||||||
| Compensation cost of equity based awards, net of tax | $ | $ | $ | ||||||||||||||
Non-Executive Share-Based Awards
RSAs
RSAs are generally valued at the closing price of the Company's common stock on the date of grant. All awards vest in equal annual installments over a period of four years from the date of grant except awards granted to the Company's Board of Directors, which vest over a period of one year.
Non-executive RSUs
The Company issues RSUs based on results of the Company's annual incentive compensation arrangements for certain employees other than those eligible for the executive share-based awards discussed below. These incentive compensation plans provide for a combination of cash payments and RSUs following the end of each annual performance period. The dollar value of share awards to be granted is based on the achievement of performance criteria established in the incentive arrangements. The number of shares of common stock to be awarded is variable, typically based on the closing price of the Company's stock on the date of grant; therefore, these awards are initially classified as liability instruments, with compensation cost recognized from the beginning of the performance period. Awards vest in equal installments over a period of four years from the date of grant. Non-executive RSUs may be settled in shares or cash at the Company's option. To date, all such awards have been settled in shares. The non-executive RSUs do not accumulate dividends prior to vesting.
122
Table of Contents
BANKUNITED, INC. AND SUBSIDIARIES
NOTES TO CONSOLIDATED FINANCIAL STATEMENTS
December 31, 2023
A summary of activity related to non-executive share-based awards for the periods indicated follows:
| RSA | Non-Executive RSU | ||||||||||||||||||||||
| Number of Share Awards | Weighted Average Grant Date Fair Value | Number of Share Awards | Weighted Average Grant Date Fair Value | ||||||||||||||||||||
Unvested share awards outstanding, December 31, 2020 | $ | $ | |||||||||||||||||||||
| Granted | |||||||||||||||||||||||
| Vested | ( | ||||||||||||||||||||||
| Canceled or forfeited | ( | ||||||||||||||||||||||
Unvested share awards outstanding, December 31, 2021 | |||||||||||||||||||||||
| Granted | |||||||||||||||||||||||
| Vested | ( | ||||||||||||||||||||||
| Canceled or forfeited | ( | ( | |||||||||||||||||||||
Unvested share awards outstanding, December 31, 2022 | |||||||||||||||||||||||
| Granted | |||||||||||||||||||||||
| Vested | ( | ||||||||||||||||||||||
| Canceled or forfeited | ( | ( | |||||||||||||||||||||
Unvested share awards outstanding, December 31, 2023 | $ | $ | |||||||||||||||||||||
The following table summarizes the closing price of the Company's stock on the date of grant for shares granted and the aggregate grant date fair value of shares vesting for the periods indicated (in thousands, except per share data):
| Years Ended December 31, | |||||||||||||||||
| 2023 | 2022 | 2021 | |||||||||||||||
| Range of the closing price on date of grant | $ | $ | $ | ||||||||||||||
| Aggregate grant date fair value of shares vesting | $ | $ | $ | ||||||||||||||
The total unrecognized compensation cost of $36.2 million for all RSAs and non-executive RSUs outstanding at December 31, 2023, will be recognized over a weighted average remaining period of 2.5 years.
Executive share-based awards
Certain of the Company's executives are eligible to receive annual awards of RSUs and PSUs (collectively, the "share units"). Annual awards of RSUs represent a fixed number of shares and vest on December 31st in equal tranches over four years for grant periods prior to 2023, and over three years for awards issued in 2023. PSUs are initially granted based on a target value. The number of PSUs that ultimately vest at the end of the performance measurement period will be based on the achievement of performance criteria pre-established by the Compensation Committee of the Board of Directors. Upon vesting, the share units will be converted to common stock on a one-for-one basis, or may be settled in cash at the Company's option. The share units will accumulate dividends declared on the Company's common stock from the date of grant to be paid subsequent to vesting.
As a result of the majority of previous settlements being in cash, all executive RSUs and PSUs have been determined to be liability instruments and are remeasured at fair value each reporting period until the awards are settled. The RSUs are valued based on the closing price of the Company's common stock at the reporting date. The PSUs are valued based on the closing price of the Company's common stock at the reporting date net of a discount related to any applicable market conditions, considering the probability of meeting the defined performance conditions. Compensation cost related to PSUs is recognized during the performance period based on the probable outcome of the respective performance conditions.
123
Table of Contents
BANKUNITED, INC. AND SUBSIDIARIES
NOTES TO CONSOLIDATED FINANCIAL STATEMENTS
December 31, 2023
| RSU | PSU | ||||||||||
Unvested executive share-based awards outstanding, December 31, 2020 | |||||||||||
| Granted | |||||||||||
| Vested | ( | ||||||||||
Unvested executive share-based awards outstanding, December 31, 2021 | |||||||||||
| Granted | |||||||||||
| Vested | ( | ( | |||||||||
Unvested executive share-based awards outstanding, December 31, 2022 | |||||||||||
| Granted | |||||||||||
| Vested | ( | ( | |||||||||
Unvested executive share-based awards outstanding, December 31, 2023 | |||||||||||
The total liability for these executive share-based awards was $11.0 million at December 31, 2023. The total unrecognized compensation cost of $9.1 million for unvested executive share-based awards at December 31, 2023 will be recognized over a weighted average remaining period of 1.7 years.
Option Awards
The Company had no option awards outstanding at December 31, 2021 or subsequent thereto. During the year ended December 31, 2021, 1,569 option awards with a weighted average exercised price of $15.94 , were exercised with immaterial intrinsic value and related tax benefits.
Deferred Compensation Plan
The Company has a non-qualified deferred compensation plan for a group of key management or highly compensated employees whereby a participant, upon election, may defer a portion of eligible compensation. The deferred compensation plan provides for discretionary Company contributions. Generally, the Company has elected not to make contributions. The Company credits each participant's account with income based on either an annual interest rate determined by the Company's Compensation Committee or returns of selected investment portfolios, as elected by the participant. A participant's elective deferrals and interest thereon are at all times 100% vested. Company contributions and interest thereon will become 100% vested upon the earlier of a change in control, as defined, or the participant's death, disability, attainment of normal retirement age or the completion of two years of service. Participant deferrals and any associated earnings will be paid upon separation from service or based on a specified distribution schedule, as elected by the participant. Deferred compensation expense was $2.9 million, $1.4 million and $2.2 million for the years ended December 31, 2023, 2022 and 2021, respectively. Deferred compensation liabilities of $43 million and $37 million were included in other liabilities in the accompanying consolidated balance sheets at December 31, 2023 and 2022, respectively.
BankUnited 401(k) Plan
Note 13 Regulatory Requirements and Restrictions
The Company and the Bank are subject to various regulatory capital requirements administered by Federal banking agencies. Failure to meet minimum capital requirements can initiate certain mandatory and possibly additional discretionary actions by regulators that, if undertaken, could have a direct material effect on the Company's financial statements. Under
124
Table of Contents
BANKUNITED, INC. AND SUBSIDIARIES
NOTES TO CONSOLIDATED FINANCIAL STATEMENTS
December 31, 2023
capital adequacy guidelines and the regulatory framework for prompt corrective action, the Company and the Bank must meet specific capital guidelines that involve quantitative measures of assets, liabilities and certain off-balance-sheet items calculated pursuant to regulation. The capital amounts and classification also are subject to qualitative judgments by the regulators about components, risk weightings and other factors. Banking regulations identify five capital categories for insured depository institutions: well-capitalized, adequately capitalized, undercapitalized, significantly undercapitalized and critically undercapitalized. As of December 31, 2023 and 2022, all capital ratios of the Company and the Bank exceeded the "well capitalized" levels under the regulatory framework for prompt corrective action. Quantitative measures established by regulation to ensure capital adequacy require the Company and the Bank to maintain minimum amounts and ratios of total, common equity tier 1 and tier 1 capital (as defined in the regulations) to risk-weighted assets (as defined), and of tier 1 capital to average tangible assets (leverage ratio).
The following tables provide information regarding regulatory capital for the Company at the dates indicated (dollars in thousands):
| December 31, 2023 | |||||||||||||||||||||||||||||||||||||||||||||||
| Actual | Required to be Considered Well Capitalized | Required to be Considered Adequately Capitalized | Required to be Considered Adequately Capitalized Including Capital Conservation Buffer | ||||||||||||||||||||||||||||||||||||||||||||
| Amount | Ratio | Amount | Ratio | Amount | Ratio | Amount | Ratio | ||||||||||||||||||||||||||||||||||||||||
| BankUnited, Inc.: | |||||||||||||||||||||||||||||||||||||||||||||||
| Tier 1 leverage | $ | % | N/A (1) | N/A (1) | $ | % | N/A (1) | N/A (1) | |||||||||||||||||||||||||||||||||||||||
| CET1 risk-based capital | $ | % | $ | % | $ | % | $ | % | |||||||||||||||||||||||||||||||||||||||
| Tier 1 risk-based capital | $ | % | $ | % | $ | % | $ | % | |||||||||||||||||||||||||||||||||||||||
| Total risk-based capital | $ | % | $ | % | $ | % | $ | % | |||||||||||||||||||||||||||||||||||||||
| BankUnited: | |||||||||||||||||||||||||||||||||||||||||||||||
| Tier 1 leverage | $ | % | $ | % | $ | % | N/A | N/A | |||||||||||||||||||||||||||||||||||||||
| CET1 risk-based capital | $ | % | $ | % | $ | % | $ | % | |||||||||||||||||||||||||||||||||||||||
| Tier 1 risk-based capital | $ | % | $ | % | $ | % | $ | % | |||||||||||||||||||||||||||||||||||||||
| Total risk-based capital | $ | % | $ | % | $ | % | $ | % | |||||||||||||||||||||||||||||||||||||||
| December 31, 2022 | |||||||||||||||||||||||||||||||||||||||||||||||
| Actual | Required to be Considered Well Capitalized | Required to be Considered Adequately Capitalized | Required to be Considered Adequately Capitalized Including Capital Conservation Buffer | ||||||||||||||||||||||||||||||||||||||||||||
| Amount | Ratio | Amount | Ratio | Amount | Ratio | Amount | Ratio | ||||||||||||||||||||||||||||||||||||||||
| BankUnited, Inc.: | |||||||||||||||||||||||||||||||||||||||||||||||
| Tier 1 leverage | $ | % | N/A (1) | N/A (1) | $ | % | N/A (1) | N/A (1) | |||||||||||||||||||||||||||||||||||||||
| CET1 risk-based capital | $ | % | $ | % | $ | % | $ | % | |||||||||||||||||||||||||||||||||||||||
| Tier 1 risk-based capital | $ | % | $ | % | $ | % | $ | % | |||||||||||||||||||||||||||||||||||||||
| Total risk-based capital | $ | % | $ | % | $ | % | $ | % | |||||||||||||||||||||||||||||||||||||||
| BankUnited: | |||||||||||||||||||||||||||||||||||||||||||||||
| Tier 1 leverage | $ | % | $ | % | $ | % | N/A | N/A | |||||||||||||||||||||||||||||||||||||||
| CET1 risk-based capital | $ | % | $ | % | $ | % | $ | % | |||||||||||||||||||||||||||||||||||||||
| Tier 1 risk-based capital | $ | % | $ | % | $ | % | $ | % | |||||||||||||||||||||||||||||||||||||||
| Total risk-based capital | $ | % | $ | % | $ | % | $ | % | |||||||||||||||||||||||||||||||||||||||
(1)There is no Tier 1 leverage ratio component in the definition of a well-capitalized bank holding company.
125
Table of Contents
BANKUNITED, INC. AND SUBSIDIARIES
NOTES TO CONSOLIDATED FINANCIAL STATEMENTS
December 31, 2023
Upon the adoption of ASU 2016-13 effective January 1, 2020, the Company elected the option to temporarily delay the effects of CECL on regulatory capital for two years, followed by a three-year transition period.
BankUnited is subject to various regulatory restrictions relating to the payment of dividends, including requirements to maintain capital at or above certain minimums, and to remain "well-capitalized" under the prompt corrective action regulations. The Company does not expect that any of these laws, regulations or policies will materially affect the ability of BankUnited to pay dividends in the foreseeable future.
Note 14 Fair Value Measurements
Assets and liabilities measured at fair value on a recurring basis
The following is a description of the methodologies used to estimate the fair values of assets and liabilities measured at fair value on a recurring basis and the level within the fair value hierarchy in which those measurements are typically classified.
Investment securities available for sale and marketable equity securities—Fair value measurements are based on quoted prices in active markets when available; these measurements are classified within level 1 of the fair value hierarchy. These securities typically include U.S. Treasury securities and certain preferred stocks. If quoted prices in active markets are not available, fair values are estimated using quoted prices of securities with similar characteristics, quoted prices of identical securities in less active markets, discounted cash flow techniques, or matrix pricing models. These securities are generally classified within level 2 of the fair value hierarchy and include U.S. Government agency securities, U.S. Government agency and sponsored enterprise MBS, preferred stock investments for which level 1 valuations are not available, non-mortgage asset-backed securities, single family real estate-backed securities, private label residential MBS and CMOs, private label commercial MBS, collateralized loan obligations and state and municipal obligations. Pricing of these securities is generally primarily spread driven. Observable inputs that may impact the valuation of these securities include benchmark yield curves, credit spreads, reported trades, dealer quotes, bids, issuer spreads, current rating, historical constant prepayment rates, historical voluntary prepayment rates, structural and waterfall features of individual securities, published collateral data, and for certain securities, historical constant default rates and default severities.
The Company uses third-party pricing services in determining fair value measurements for investment securities. To obtain an understanding of the methodologies and assumptions used, management reviews written documentation provided by the pricing services, conducts interviews with valuation desk personnel and reviews model results and detailed assumptions used to value selected securities as considered necessary. Management has established a robust price challenge process that includes a review by the treasury front office of all prices provided on a quarterly basis. Any price evidencing unexpected quarter over quarter fluctuations or deviations from expectations is challenged. If considered necessary to resolve any discrepancies, a price will be obtained from an additional independent valuation source. The Company does not typically adjust the prices provided, other than through this established challenge process. The results of price challenges are subject to review by executive management. Any price discrepancies are resolved based on careful consideration of the assumptions and inputs employed by each of the pricing sources.
Derivative financial instruments—Fair values of interest rate derivatives are determined using widely accepted discounted cash flow modeling techniques. These discounted cash flow models use projections of future cash payments and receipts that are discounted at mid-market rates. Observable inputs that may impact the valuation of these instruments include benchmark swap rates and benchmark forward yield curves. These fair value measurements are generally classified within level 2 of the fair value hierarchy.
126
Table of Contents
BANKUNITED, INC. AND SUBSIDIARIES
NOTES TO CONSOLIDATED FINANCIAL STATEMENTS
December 31, 2023
The following tables present assets and liabilities measured at fair value on a recurring basis at the dates indicated (in thousands):
| December 31, 2023 | |||||||||||||||||
| Level 1 | Level 2 | Total | |||||||||||||||
| Investment securities available for sale: | |||||||||||||||||
| U.S. Treasury securities | $ | $ | $ | ||||||||||||||
| U.S. Government agency and sponsored enterprise residential MBS | |||||||||||||||||
| U.S. Government agency and sponsored enterprise commercial MBS | |||||||||||||||||
| Private label residential MBS and CMOs | |||||||||||||||||
| Private label commercial MBS | |||||||||||||||||
| Single family real estate-backed securities | |||||||||||||||||
| Collateralized loan obligations | |||||||||||||||||
| Non-mortgage asset-backed securities | |||||||||||||||||
| State and municipal obligations | |||||||||||||||||
| SBA securities | |||||||||||||||||
| Marketable equity securities | |||||||||||||||||
| Derivative assets | |||||||||||||||||
| Total assets at fair value | $ | $ | $ | ||||||||||||||
| Derivative liabilities | $ | $ | ( | $ | ( | ||||||||||||
| Total liabilities at fair value | $ | $ | ( | $ | ( | ||||||||||||
| December 31, 2022 | |||||||||||||||||
| Level 1 | Level 2 | Total | |||||||||||||||
| Investment securities available for sale: | |||||||||||||||||
U.S. Treasury securities | $ | $ | $ | ||||||||||||||
| U.S. Government agency and sponsored enterprise residential MBS | |||||||||||||||||
| U.S. Government agency and sponsored enterprise commercial MBS | |||||||||||||||||
| Private label residential MBS and CMOs | |||||||||||||||||
| Private label commercial MBS | |||||||||||||||||
| Single family real estate-backed securities | |||||||||||||||||
| Collateralized loan obligations | |||||||||||||||||
| Non-mortgage asset-backed securities | |||||||||||||||||
| State and municipal obligations | |||||||||||||||||
| SBA securities | |||||||||||||||||
| Marketable equity securities | |||||||||||||||||
| Derivative assets | |||||||||||||||||
| Total assets at fair value | $ | $ | $ | ||||||||||||||
| Derivative liabilities | $ | $ | ( | $ | ( | ||||||||||||
| Total liabilities at fair value | $ | $ | ( | $ | ( | ||||||||||||
127
Table of Contents
BANKUNITED, INC. AND SUBSIDIARIES
NOTES TO CONSOLIDATED FINANCIAL STATEMENTS
December 31, 2023
Assets and liabilities measured at fair value on a non-recurring basis
Following is a description of the methodologies used to estimate the fair values of assets and liabilities that may be measured at fair value on a non-recurring basis, and the level within the fair value hierarchy in which those measurements are typically classified:
Collateral dependent loans and OREO—The carrying amount of collateral dependent loans is typically based on the fair value of the underlying collateral, which may be real estate, enterprise value or other business assets, less estimated costs to sell when repayment is expected to come from the sale of the collateral. The carrying value of OREO is initially measured based on the fair value of the real estate acquired in foreclosure and subsequently adjusted to the lower of cost or estimated fair value, less estimated cost to sell. Fair values of real estate collateral and OREO are typically based on third-party real estate appraisals which utilize market and income approaches to valuation incorporating both observable and unobservable inputs.
Fair value measurements related to collateral dependent loans and OREO are generally classified within level 3 of the fair value hierarchy.
The following table presents the net carrying value of assets classified within level 3 of the fair value hierarchy at the dates indicated, for which non-recurring changes in fair value were recorded during the period then ended (in thousands):
| December 31, 2023 | December 31, 2022 | ||||||||||
| Collateral dependent loans | $ | $ | |||||||||
| OREO | |||||||||||
| $ | $ | ||||||||||
The following table presents the carrying value and fair value of financial instruments and the level within the fair value hierarchy in which those measurements are classified at the dates indicated (dollars in thousands):
| December 31, 2023 | December 31, 2022 | ||||||||||||||||||||||||||||
| Level | Carrying Value | Fair Value | Carrying Value | Fair Value | |||||||||||||||||||||||||
| Assets: | |||||||||||||||||||||||||||||
| Cash and cash equivalents | 1 | $ | $ | $ | $ | ||||||||||||||||||||||||
| Investment securities | 1/2 | $ | $ | $ | $ | ||||||||||||||||||||||||
| Non-marketable equity securities | 2 | $ | $ | $ | $ | ||||||||||||||||||||||||
| Loans, net | 3 | $ | $ | $ | $ | ||||||||||||||||||||||||
| Derivative assets | 2 | $ | $ | $ | $ | ||||||||||||||||||||||||
| Liabilities: | |||||||||||||||||||||||||||||
| Demand, savings and money market deposits | 2 | $ | $ | $ | $ | ||||||||||||||||||||||||
| Time deposits | 2 | $ | $ | $ | $ | ||||||||||||||||||||||||
| Federal funds purchased | 2 | $ | $ | $ | $ | ||||||||||||||||||||||||
| FHLB advances | 2 | $ | $ | $ | $ | ||||||||||||||||||||||||
| Notes and other borrowings | 2 | $ | $ | $ | $ | ||||||||||||||||||||||||
| Derivative liabilities | 2 | $ | $ | $ | $ | ||||||||||||||||||||||||
Note 15 Commitments and Contingencies
The Company issues off-balance sheet financial instruments to meet the financing needs of its customers. These financial instruments include commitments to fund loans, unfunded commitments under existing lines of credit, and commercial and standby letters of credit. These commitments expose the Company to varying degrees of credit and market risk which are essentially the same as those involved in extending loans to customers, and are subject to the same credit policies used in underwriting loans. Collateral may be obtained based on the Company’s credit evaluation of the counterparty. The Company’s maximum exposure to credit loss is represented by the contractual amount of these commitments.
128
Table of Contents
BANKUNITED, INC. AND SUBSIDIARIES
NOTES TO CONSOLIDATED FINANCIAL STATEMENTS
December 31, 2023
Commitments to fund loans
These are agreements to lend funds to customers as long as there is no violation of any condition established in the contract. Commitments to fund loans generally have fixed expiration dates or other termination clauses and may require payment of a fee. Many of these commitments are expected to expire without being funded and, therefore, the total commitment amounts do not necessarily represent future liquidity requirements.
Unfunded commitments under lines of credit
Unfunded commitments under lines of credit include commercial and commercial real estate lines of credit to existing customers, for many of which additional extensions of credit are subject to borrowing base requirements. Some of these commitments may mature without being fully funded, so may not necessarily represent future liquidity requirements.
Commercial and standby letters of credit
Letters of credit are conditional commitments issued by the Company to guarantee the performance of a customer to a third party. These letters of credit are primarily issued to support trade transactions or guarantee arrangements. The credit risk involved in issuing letters of credit is essentially the same as that involved in extending loan facilities to customers.
Total lending related commitments outstanding at December 31, 2023 were as follows (in thousands):
| Commitments to fund loans | $ | ||||
| Unfunded commitments under lines of credit | |||||
| Commercial and standby letters of credit | |||||
| $ | |||||
Legal Proceedings
The Company is involved in various legal actions arising in the normal course of business. In the opinion of management, based upon advice of legal counsel, the likelihood is remote that the adverse impact of these proceedings, either individually or in the aggregate, would be material to the Company’s consolidated financial position, results of operations or cash flows.
Note 16 Condensed Financial Statements of BankUnited, Inc.
Condensed financial statements of BankUnited, Inc. are presented below (in thousands):
Condensed Balance Sheets
| December 31, 2023 | December 31, 2022 | ||||||||||
| Assets: | |||||||||||
| Cash and cash equivalents | $ | $ | |||||||||
| Marketable equity securities, at fair value | |||||||||||
| Investment in BankUnited, N.A. | |||||||||||
| Other assets | |||||||||||
| Total assets | $ | $ | |||||||||
| Liabilities and Stockholders' Equity: | |||||||||||
| Notes payable | $ | $ | |||||||||
| Other liabilities | |||||||||||
| Stockholders' equity | |||||||||||
| Total liabilities and stockholders' equity | $ | $ | |||||||||
129
Table of Contents
BANKUNITED, INC. AND SUBSIDIARIES
NOTES TO CONSOLIDATED FINANCIAL STATEMENTS
December 31, 2023
Condensed Statements of Income
| Years Ended December 31, | |||||||||||||||||
| 2023 | 2022 | 2021 | |||||||||||||||
| Income: | |||||||||||||||||
| Interest and dividends on investment securities | $ | $ | $ | ||||||||||||||
| Service fees from subsidiary | |||||||||||||||||
| Equity in earnings of subsidiary | |||||||||||||||||
Loss on investment securities | ( | ( | ( | ||||||||||||||
| Gain on extinguishment of debt | |||||||||||||||||
| Total | |||||||||||||||||
| Expense: | |||||||||||||||||
| Interest on borrowings | |||||||||||||||||
| Employee compensation and benefits | |||||||||||||||||
| Other | |||||||||||||||||
| Total | |||||||||||||||||
| Income before income taxes | |||||||||||||||||
| Benefit for income taxes | ( | ( | ( | ||||||||||||||
| Net income | $ | $ | $ | ||||||||||||||
130
Table of Contents
BANKUNITED, INC. AND SUBSIDIARIES
NOTES TO CONSOLIDATED FINANCIAL STATEMENTS
December 31, 2023
Condensed Statements of Cash Flows
| Years Ended December 31, | |||||||||||||||||
| 2023 | 2022 | 2021 | |||||||||||||||
| Cash flows from operating activities: | |||||||||||||||||
| Net income | $ | $ | $ | ||||||||||||||
| Adjustments to reconcile net income to net cash provided by operating activities: | |||||||||||||||||
| Equity in undistributed earnings of subsidiaries | ( | ( | |||||||||||||||
| Equity based compensation | |||||||||||||||||
| Other | |||||||||||||||||
| Net cash provided by operating activities | |||||||||||||||||
| Cash flows from investing activities: | |||||||||||||||||
| Purchase of marketable equity securities | ( | ||||||||||||||||
| Proceeds from repayments, sale, maturities and calls of investment securities | |||||||||||||||||
| Other | ( | ( | |||||||||||||||
| Net cash provided by (used in) investing activities | ( | ||||||||||||||||
| Cash flows from financing activities: | |||||||||||||||||
| Dividends paid | ( | ( | ( | ||||||||||||||
| Repurchase of common stock | ( | ( | ( | ||||||||||||||
Repurchase of senior notes | ( | ||||||||||||||||
| Other | ( | ( | ( | ||||||||||||||
Net cash used in financing activities | ( | ( | ( | ||||||||||||||
| Net increase (decrease) in cash and cash equivalents | ( | ( | |||||||||||||||
| Cash and cash equivalents, beginning of period | |||||||||||||||||
| Cash and cash equivalents, end of period | $ | $ | $ | ||||||||||||||
| Supplemental schedule of non-cash investing and financing activities: | |||||||||||||||||
| Dividends declared, not paid | $ | $ | $ | ||||||||||||||
Dividends received by BankUnited, Inc. from the Bank totaled $85 million, $605 million and $312 million for the years ended December 31, 2023, 2022 and 2021, respectively.
131
Table of Contents
BANKUNITED, INC. AND SUBSIDIARIES
NOTES TO CONSOLIDATED FINANCIAL STATEMENTS
December 31, 2023
Note 17 Quarterly Financial Information (Unaudited)
Financial information by quarter for the periods indicated follows (in thousands, except per share data):
| 2023 | |||||||||||||||||||||||||||||
| Fourth Quarter | Third Quarter | Second Quarter | First Quarter | Total | |||||||||||||||||||||||||
| Interest income | $ | $ | $ | $ | $ | ||||||||||||||||||||||||
| Interest expense | |||||||||||||||||||||||||||||
| Net interest income before provision for credit losses | |||||||||||||||||||||||||||||
| Provision for credit losses | |||||||||||||||||||||||||||||
| Net interest income after provision for credit losses | |||||||||||||||||||||||||||||
| Non-interest income | |||||||||||||||||||||||||||||
| Non-interest expense | |||||||||||||||||||||||||||||
| Income before income taxes | |||||||||||||||||||||||||||||
| Provision for income taxes | |||||||||||||||||||||||||||||
| Net income | $ | $ | $ | $ | $ | ||||||||||||||||||||||||
| Earnings per common share, basic | $ | $ | $ | $ | $ | ||||||||||||||||||||||||
| Earnings per common share, diluted | $ | $ | $ | $ | $ | ||||||||||||||||||||||||
| 2022 | |||||||||||||||||||||||||||||
| Fourth Quarter | Third Quarter | Second Quarter | First Quarter | Total | |||||||||||||||||||||||||
| Interest income | $ | $ | $ | $ | $ | ||||||||||||||||||||||||
| Interest expense | |||||||||||||||||||||||||||||
| Net interest income before provision for credit losses | |||||||||||||||||||||||||||||
Provision for credit losses | |||||||||||||||||||||||||||||
| Net interest income after provision for credit losses | |||||||||||||||||||||||||||||
| Non-interest income | |||||||||||||||||||||||||||||
| Non-interest expense | |||||||||||||||||||||||||||||
| Income before income taxes | |||||||||||||||||||||||||||||
Provision for income taxes | |||||||||||||||||||||||||||||
| Net income | $ | $ | $ | $ | $ | ||||||||||||||||||||||||
| Earnings per common share, basic | $ | $ | $ | $ | $ | ||||||||||||||||||||||||
| Earnings per common share, diluted | $ | $ | $ | $ | $ | ||||||||||||||||||||||||
132
Item 9. Changes in and Disagreements with Accountants on Accounting and Financial Disclosure
None.
Item 9A. Controls and Procedures
Evaluation of Disclosure Controls and Procedures
As of the end of the period covered by this Annual Report on Form 10-K, we carried out an evaluation under the supervision and with the participation of our management, including the Chief Executive Officer and Chief Financial Officer, of the effectiveness of the design and operation of our disclosure controls and procedures as defined in Exchange Act Rules 13a-15(e) and 15d-15(e). Based upon that evaluation, the Chief Executive Officer and the Chief Financial Officer concluded that our disclosure controls and procedures were effective as of December 31, 2023.
Changes in Internal Control over Financial Reporting
None.
Management's Report on Internal Control Over Financial Reporting
Management's report, which is included in Part II, Item 8 of this Form 10-K, is incorporated herein by reference.
Attestation Report of the Registered Public Accounting Firm
The effectiveness of the Company's internal control over financial reporting as of December 31, 2023, has been audited by Deloitte and Touche LLP, an independent registered public accounting firm, as stated in their report, which is included in Part II, Item 8 of this Form 10-K.
Item 9B. Other Information
During the three months ended December 31, 2023, no director or officer (as defined in Exchange Act Rule 16a-1(f)) of the Company adopted terminated
Item 9C. Disclosure Regarding Foreign Jurisdictions that Prevent Inspections
Not applicable.
133
PART III
Item 10. Directors, Executive Officers and Corporate Governance
Information regarding the directors and executive officers of BankUnited, Inc. and information regarding Section 16(a) compliance, the Audit and Risk Committees, the Company's code of ethics, background of the directors and director nominations appearing under the captions "Section 16(a) Beneficial Ownership Reporting Compliance," "Committees of the Board of Directors," "Corporate Governance Guidelines, Code of Conduct and Code of Ethics," "Director Nominating Process and Diversity" and "Election of Directors" in the Company's Proxy Statement for the 2024 Annual Meeting of Stockholders (the "2024 Proxy Statement") is hereby incorporated by reference.
Item 11. Executive Compensation
Information appearing under the captions "Director Compensation" and "Compensation of our Named Executive Officers" in the 2024 Proxy Statement (other than the "Compensation Committee Report," which is deemed furnished herein by reference) is hereby incorporated by reference.
Item 12. Security Ownership of Certain Beneficial Owners and Management and Related Stockholder Matters
Information setting forth the security ownership of certain beneficial owners and management appearing under the caption "Beneficial Ownership of the Company's Common Stock" and information in the "Equity Compensation Plans" table appearing under the caption "Equity Compensation Plan Information" in the 2024 Proxy Statement is hereby incorporated by reference.
Item 13. Certain Relationships and Related Transactions, and Director Independence
Information regarding certain related transactions appearing under the captions "Certain Related Party Relationships" and information regarding director independence appearing under the caption "Director Independence" in the 2024 Proxy Statement is hereby incorporated by reference.
Item 14. Principal Accountant Fees and Services
Information appearing under the captions "Auditor Fees and Services" and "Policy on Audit Committee Pre-Approval of Audit and Permissible Non-Audit Services of Independent Auditors" in the 2024 Proxy Statement is hereby incorporated by reference.
134
PART IV
Item 15. Exhibits, Financial Statement Schedules
(a)List of documents filed as part of this report:
1) Financial Statements:
Management's Report on Internal Control Over Financial Reporting
Reports of Independent Registered Public Accounting Firms
Consolidated Balance Sheets as of December 31, 2023 and 2022
Consolidated Statements of Income for the years ended December 31, 2023, 2022 and 2021
Consolidated Statements of Comprehensive Income for the years ended December 31, 2023, 2022 and 2021
Consolidated Statements of Cash Flows for the years ended December 31, 2023, 2022 and 2021
Consolidated Statements of Stockholders' Equity for the years ended December 31, 2023, 2022 and 2021
2) Financial Statement Schedules:
Financial statement schedules are omitted as not required or not applicable or because the information is included in the Consolidated Financial Statements or notes thereto.
3) List of Exhibits:
The exhibit list in the Exhibit Index is incorporated herein by reference as the list of exhibits required as part of this report.
135
EXHIBIT INDEX
| Exhibit Number | Description | Location | ||||||||||||
136
| Exhibit Number | Description | Location | ||||||||||||
137
| Exhibit Number | Description | Location | ||||||||||||
| 101.INS | XBRL Instance Document | Filed herewith | ||||||||||||
| 101.SCH | XBRL Taxonomy Extension Schema | Filed herewith | ||||||||||||
| 101.CAL | XBRL Taxonomy Extension Calculation Linkbase | Filed herewith | ||||||||||||
| 101.DEF | XBRL Taxonomy Extension Definition Linkbase | Filed herewith | ||||||||||||
| 101.LAB | XBRL Taxonomy Extension Label Linkbase | Filed herewith | ||||||||||||
| 101.PRE | XBRL Taxonomy Extension Presentation Linkbase | Filed herewith | ||||||||||||
| 104 | Cover Page Interactive Data File (embedded within the Inline XBRL document and included in Exhibit 101) | Filed herewith | ||||||||||||
____________________________________
† Schedules and similar attachments to the Purchase and Assumption Agreement have been omitted pursuant to Item 601(b)(2) of Regulation S-K. The registrant will furnish supplementally a copy of any omitted schedules or similar attachment to the SEC upon request.
138
SIGNATURES
Pursuant to the requirements of Section 13 or 15(d) of the Securities Exchange Act of 1934, the registrant has duly caused the report to be signed on its behalf by the undersigned, thereunto duly authorized.
| BANKUNITED, INC. | |||||||||||||||||||||||
| Date: | February 20, 2024 | By: | /s/ RAJINDER P. SINGH | ||||||||||||||||||||
| Name: | Rajinder P. Singh | ||||||||||||||||||||||
| Title: | Chairman, President and Chief Executive Officer | ||||||||||||||||||||||
Pursuant to the requirements of the Securities Exchange Act of 1934, this report has been signed by the following persons in the capacities and on the dates indicated.
| Signature | Title | Date | ||||||||||||
| /s/ RAJINDER P. SINGH | Chairman, President and Chief Executive Officer (Principal Executive Officer) | February 20, 2024 | ||||||||||||
| Rajinder P. Singh | ||||||||||||||
| /s/ LESLIE N. LUNAK | Chief Financial Officer (Principal Financial and Accounting Officer) | February 20, 2024 | ||||||||||||
Leslie N. Lunak | ||||||||||||||
| /s/ TERE BLANCA | Director | February 20, 2024 | ||||||||||||
| Tere Blanca | ||||||||||||||
| /s/ JOHN N. DIGIACOMO | Director | February 20, 2024 | ||||||||||||
| John N. DiGiacomo | ||||||||||||||
| /s/ MICHAEL J. DOWLING | Director | February 20, 2024 | ||||||||||||
| Michael J. Dowling | ||||||||||||||
| /s/ DOUGLAS J. PAULS | Director | February 20, 2024 | ||||||||||||
| Douglas J. Pauls | ||||||||||||||
| /s/ A. GAIL PRUDENTI | Director | February 20, 2024 | ||||||||||||
| A. Gail Prudenti | ||||||||||||||
| /s/ WILLIAM S. RUBENSTEIN | Director | February 20, 2024 | ||||||||||||
| William S. Rubenstein | ||||||||||||||
| /s/ SANJIV SOBTI | Director | February 20, 2024 | ||||||||||||
| Sanjiv Sobti | ||||||||||||||
/s/ GERMAINE SMITH-BAUGH | Director | February 20, 2024 | ||||||||||||
Germaine Smith-Baugh | ||||||||||||||
| /s/ LYNNE WINES | Director | February 20, 2024 | ||||||||||||
| Lynne Wines | ||||||||||||||
139